genie user manual volume 2
TRANSCRIPT

8/14/2019 Genie User Manual Volume 2
http://slidepdf.com/reader/full/genie-user-manual-volume-2 1/121
SESAMTM
USER MANUAL
DET NORSKE VERITAS
GENIE VOL. IIGENIE FOR WAVE AND STRUCTURE-PILE-SOIL
A NALYSIS

8/14/2019 Genie User Manual Volume 2
http://slidepdf.com/reader/full/genie-user-manual-volume-2 2/121

8/14/2019 Genie User Manual Volume 2
http://slidepdf.com/reader/full/genie-user-manual-volume-2 3/121
SesamTM
User Manual
GeniE Vol. II
GeniE for Wave and Structure-Pile-Soil Analysis
Concept design and analysisof offshore & maritime structures
29 January 2013
Revised with V6.4-07
Developed and Marketed by
DET NORSKE VERITAS

8/14/2019 Genie User Manual Volume 2
http://slidepdf.com/reader/full/genie-user-manual-volume-2 4/121
If any person suffers loss or damage which is proved to have been caused by any negligent act or omission of Det Norske Veritas, then Det Norske Veritas
shall pay compensation to such person for his proved direct loss or damage. However, the compensation shall not exceed an amount equal to ten times the fee
charged for the service in question, provided that the maximum compensation shall never exceed USD 2 millions. In this provis ion “Det Norske Veritas” shall
mean the Foundation Det Norske Veritas as well as all its subsidiaries, directors, officers, employees, agents and any other acting on behalf of Det Norske
Veritas.
DNV Software Report No.: 00-000 / Revision 0, 29 January 2013
Copyright 2013 Det Norske Veritas Software
All rights reserved. No part of this book may be reproduced, in any form or by any means, without
permission in writing from the publisher.
Published by:
Det Norske Veritas Software
Veritasveien 1
N-1322 HØVIK
Norway
Telephone: +47 67 57 99 00
Facsimile: +47 67 57 72 72
E-mail, sales: [email protected]
E-mail, support: [email protected]
Website: www.dnvsoftware.com

8/14/2019 Genie User Manual Volume 2
http://slidepdf.com/reader/full/genie-user-manual-volume-2 5/121
DET NORSKE VERITAS SOFTWARE GeniE User Manual Vol. II
Version 6.4 1 29 Jan 2013
Table of Contents
Contents
TABLE OF CONTENTS ................................................................................................................................................. 1 INTRODUCTION ............................................................................................................................................................ 4 1.1 GENIE VOL. 2: WAVE AND STRUCTURE-PILE-SOIL A NALYSIS ..................................................................................................... 4 1.2 HOW TO READ THE MANUAL ....................................................................................................................................................... 4
1.2.1 Terminology ...................................................................................................................................................... 4 1.3 R ELEASE NOTES AND STATUS LIST ............................................................................................................................................. 5 2. FEATURES OF GENIE: WAVE AND STRUCTURE-PILE-SOIL ANALYSIS .............................................. 6 2.1 BASIC FEATURES ........................................................................................................................................................................ 6 2.2 WIND, WAVE AND CURRENT MODELLING AND A NALYSIS ........................................................................................................... 6 2.3 PILED FOUNDATION MODELLING AND A NALYSIS......................................................................................................................... 6 3. USER’S GUIDE TO GENIE: WAVE AND STRUCTURE-PILE-SOIL ANALYSIS ....................................... 7 3.1 I NTRODUCTION TO WIND, WAVE AND CURRENT LOAD A NALYSIS ............................................................................................... 8 3.2 GETTING STARTED DOING DESIGN WAVE A NALYSIS ................................................................................................................... 8
3.2.1 Environment Data .......................................................... .............................................................. ..................... 9 3.2.2 Hydro Properties ............................................................ .............................................................. ................... 14 3.2.3 Define the Design Wave Analysis ........................................................ ............................................................ 17 3.2.4 Load Case names, Description, FEM Loadcase numbers and FEM LC Rule ................................................ 22 3.2.5 Execution of the Design Wave Analysis ......................................................... ................................................. 24 3.2.6 Execution of the Design Wave Analysis with Modified Input ....................................................... ................... 27
3.3 GETTING STARTED DOING DETERMINISTIC FATIGUE WAVE A NALYSIS ....................................................................................... 28 3.3.1 Environment Data .......................................................... .............................................................. ................... 28 3.3.2 Hydro Properties ............................................................ .............................................................. ................... 31 3.3.3 Define the Deterministic Fatigue Wave Analysis ................................................................ ............................ 32 3.3.4 Execution of Deterministic Fatigue Wave Analysis ........................................................................................ 34
3.4 GETTING STARTED DOING STOCHASTIC (SPECTRAL) FATIGUE WAVE A NALYSIS......................................................................... 35 3.5 I NTRODUCTION TO STRUCTURE-PILE-SOIL A NALYSIS ................................................................................................................ 35
3.5.1 Concepts in a Structure-Pile-Soil Analysis ..................................................................................................... 35 3.5.2 Modelling ............................................................ .............................................................. .............................. 37 3.5.3 Analysis ............................................................... ................................................................. ........................... 40 3.5.4 Results ...................................................... ................................................................. ...................................... 40
3.6 GETTING STARTED DOING STRUCTURE-PILE-SOIL A NALYSIS WITH DESIGN WAVE LOADS ......................................................... 41 3.6.1 Environment ........................................................ .............................................................. .............................. 41 3.6.2 Scour ............................................................................................................................................................... 42 3.6.3 Soil Properties ..................................................... .............................................................. .............................. 42 3.6.4 Pile Modelling ..................................................... .............................................................. .............................. 46 3.6.5 Define the Pile-Soil Analysis ............................................................... ............................................................ 50 3.6.6 Executing the Pile-Soil Analysis ................................................................. .................................................... 52 3.6.7 Reviewing Analysis Results ................................................................. ............................................................ 53 3.6.8 Execution of the Pile-Soil Analysis with Modified Input .............................................................. ................... 54
3.7 DOING THE A NALYSIS OUTSIDE GENIE ..................................................................................................................................... 55 4. EXECUTION OF GENIE: WAVE AND STRUCTURE-PILE-SOIL ANALYSIS ......................................... 56 4.1 PROGRAM E NVIRONMENT ......................................................................................................................................................... 56 4.2 FILES USED BY GENIE ............................................................................................................................................................... 56 5. DIALOG DESCRIPTION ............................................................... .............................................................. ........ 57 5.1 DIALOG FEATURES ................................................................................................................................................................... 57

8/14/2019 Genie User Manual Volume 2
http://slidepdf.com/reader/full/genie-user-manual-volume-2 6/121
DET NORSKE VERITAS SOFTWARE GeniE User Manual Vol. II
Version 6.4 2 29 Jan 2013
5.1.1 Dialog Help ......................................................... .............................................................. .............................. 57 5.1.2 Dialog New/Edit Functionality ............................................................................................................... ........ 58 5.1.3 Late Definition Functionality .............................................................. ............................................................ 58 5.1.4 Table Functionality ......................................................................................................................................... 59
5.2 THE E NVIRONMENT .................................................................................................................................................................. 61 5.2.1 Location ................................................................................... ............................................................... ........ 61 5.2.2 Directions ............................................................ .............................................................. .............................. 63 5.2.3 Air ............................................................ ................................................................. ...................................... 64 5.2.4 Water ............................................................................................................................................................... 65 5.2.5 Soil .................................................................................................................................................................. 74
5.3 THE HYDRO PROPERTIES .......................................................................................................................................................... 79 5.4 THE WAVE LOAD A NALYSIS ..................................................................................................................................................... 95
5.4.1 The Analysis Activity ....................................................................................................................................... 95 5.4.2 The Wave Load Run ........................................................................................................................................ 96
5.5 EXECUTION OF A WAVE LOAD A NALYSIS ................................................................................................................................ 106 5.6 EXECUTION OF A STRUCTURE-PILE-SOIL A NALYSIS ................................................................................................................ 108 6. APPENDIX A TUTORIAL EXAMPLES ........................................................... ............................................... 115 6.1 A 1 FIXED 4-LEGGED JACKET I NPUT FOR DESIGN WAVE A NALYSIS ......................................................................................... 115 6.2 A 2 FIXED 4-LEGGED JACKET I NPUT FOR DETERMINISTIC FATIGUE WAVE A NALYSIS .............................................................. 116 6.3 A 3 4-LEGGED JACKET I NPUT FOR STRUCTURE-PILE-SOIL A NALYSIS....................................................................................... 117

8/14/2019 Genie User Manual Volume 2
http://slidepdf.com/reader/full/genie-user-manual-volume-2 7/121
DET NORSKE VERITAS SOFTWARE GeniE User Manual Vol. II
Version 6.4 3 29 Jan 2013

8/14/2019 Genie User Manual Volume 2
http://slidepdf.com/reader/full/genie-user-manual-volume-2 8/121
DET NORSKE VERITAS SOFTWARE GeniE User Manual Vol. II
Version 6.4 4 29 Jan 2013
INTRODUCTION
1.1 GeniE Vol. 2: Wave and Structure-Pile-Soil Analysis
This is the user manual for the part of GeniE dedicated to wind, wave and current load analysis as well as
structure-pile-soil analysis of offshore jackets.
This user manual assumes that the user has knowledge in the use of GeniE as covered by the GeniE User
Manual Vol. 1 (the main user manual of GeniE). Furthermore, knowledge in the use of Wajac for wave load
analysis and Sestra and Splice for structure-pile-soil interaction analysis is also required.
The manual covers two main areas of use of which the latter is normally in combination with the former:
Wind, wave and current load analysis: modelling for and execution of Wajac
Structure-pile-soil analysis: modelling for and execution of a Sestra-Splice interaction analysis
Wind, wave and current load and structure-pile-soil analysis in GeniE is performed by defining the model at
a conceptual level and then letting the program derive an analysis representation. The analysis
representation will consist of a FE model (beam elements and optionally plate elements for the topside
structure), wave load conditions, piles, soil data, etc.
1.2 How to read the Manual
If you are a new user then read Chapter 2 to learn about basic features and principles of GeniE for wind,
wave and current load and structure-pile-soil analysis.
If you already have a basic understanding of GeniE for wind, wave and current load and structure-pile-soilanalysis then go to the appropriate ‘Getting Started doing …’ section of Chapter 3:
Section 3.2 Getting Started doing Design Wave Analysis
Section 3.3 Getting Started doing Deterministic Fatigue Wave Analysis
Section 3.4 Getting Started doing Stochastic (Spectral) Fatigue Wave Analysis
Section 3.6 Getting Started doing Structure-Pile-Soil Analysis with Design Wave Loads
Chapter 4 EXECUTION OF GENIE: WAVE AND STRUCTURE-PILE-SOIL ANALYSIS explains which
files are used by GeniE and possible limitations.
Chapter 5 DIALOG DESCRIPTION explains in detail all dialogs of GeniE for wind, wave and current loadand structure-pile-soil analysis.
1.2.1 Terminology
This document uses some terms, acronyms and abbreviations that are explained below.
SWL = Still water level
Seabed = Seafloor, mudline
Hydro property data = Hydrostatic and hydrodynamic property data

8/14/2019 Genie User Manual Volume 2
http://slidepdf.com/reader/full/genie-user-manual-volume-2 9/121
DET NORSKE VERITAS SOFTWARE GeniE User Manual Vol. II
Version 6.4 5 29 Jan 2013
1.3 Release Notes and Status List
There exists for GeniE (as for all other SESAM programs) information additional to this user manual. This
may be:
Reasons for update (new version)
New features
Errors found and corrected (bug fixes)
Etc.
The main source for information on new features and bug fixes for GeniE is the Release Notes available
through Help > Help Topics (F1) in GeniE.
Additionally, there is a Status List for GeniE found on our website that is continuously updated with
information about recently discovered errors and limitations, plus capabilities of new versions,

8/14/2019 Genie User Manual Volume 2
http://slidepdf.com/reader/full/genie-user-manual-volume-2 10/121
DET NORSKE VERITAS SOFTWARE GeniE User Manual Vol. II
Version 6.4 6 29 Jan 2013
2. FEATURES OF GENIE: WAVE AND STRUCTURE-PILE-SOIL
ANALYSIS
2.1 Basic Features
GeniE for wind, wave and current load and structure-pile-soil analysis allows you to model and describe the
environment (water and air) as well as the piled foundation of an offshore jacket structure. This includes:
Wind modeling
- Wind speed
- Air drag coefficients
Hydrodynamic modeling
- Waves
- Current
- Hydrodynamic (Morison) coefficients
- Marine growth
- Flooding
- Etc.
Piled foundation modeling
- Piles
- Soil
GeniE also controls the execution of Wajac (wind, wave and current load analysis), Sestra (linear structural
analysis) and Splice (non-linear pile-soil analysis).
2.2 Wind, Wave and Current Modelling and Analysis
Three types of wave load analysis are available:
Design wave
Deterministic time domain
Frequency domain
2.3 Piled Foundation Modelling and Analysis
The soil with sand and clay layers may be modelled together with the piles. GeniE supports the execution of
all programs involved in an integrated structure-pile-soil analysis.

8/14/2019 Genie User Manual Volume 2
http://slidepdf.com/reader/full/genie-user-manual-volume-2 11/121
DET NORSKE VERITAS SOFTWARE GeniE User Manual Vol. II
Version 6.4 7 29 Jan 2013
3. USER’S GUIDE TO GENIE: WAVE AND STRUCTURE-PILE-
SOIL ANALYSIS
This chapter describes how to use GeniE for:
Wind, wave and current load analysis
Structure-pile-soil analysis
For both of these two main areas of use there is an introductory section, Section 3.1 and Section 3.5,
respectively. The introductory sections are followed by sections of type ‘Getting Started …’ that explain by
way of examples how to use GeniE for the various tasks.
8/14/2019 Genie User Manual Volume 2
http://slidepdf.com/reader/full/genie-user-manual-volume-2 12/121
DET NORSKE VERITAS SOFTWARE GeniE User Manual Vol. II
Version 6.4 8 29 Jan 2013
3.1 Introduction to Wind, Wave and Current Load Analysis
A wind, wave and current load analysis requires different types of data to be entered. These are environment
data, ‘hydro’ (hydrostatic and hydrodynamic) property data and run data. In the following the basic input is
explained for three different types of analysis. All dialogs and commands are described in detail in Chapter
5 DIALOG DESCRIPTION.
The following three sections describe by way of examples one type of analysis each.
Section 3.2 Getting Started doing Design Wave Analysis
Section 3.3 Getting Started doing Deterministic Fatigue Wave Analysis
Section 3.4 Getting Started doing Stochastic (Spectral) Fatigue Wave Analysis
The examples show that sets are useful when assigning hydro properties to the structure. Hence, you will
benefit by initially creating named sets corresponding to the various sets of properties. For example, if the
structure is to be assigned different Constant Marine Growth properties in different depth intervals then
create a set for each depth interval.
All analysis types make use of the same jacket model including a topside structure with Z-coordinate
ranging from 0 m to 160 m. The seabed (mudline) is at 0 m and the sea surface at 124 m.
The wave load analysis will be performed by the hydrodynamic analysis program Wajac. Wajac calculates
wind, wave and current loads on fixed and rigid frame structures. The frame structure model is transferred to
Wajac through the Input Interface File (FEM-file). The hydro properties Constant Morison coefficients and
Flooding are also transferred via this file. All other input to Wajac comes from the Wajac.inp file created by
GeniE. The Wajac.inp file is open for modification by the user though. See Section 4.2 about files used by
GeniE.
3.2 Getting Started doing Design Wave Analysis
This is a description of how to do a design wave analysis by way of a simplified example. The input of
environment, hydro property and wave load run data is described. All other necessary data is assumed to
exist, i.e. jacket structural data with properties and loads other than hydro properties and wave loads.
If you want to perform the operations described below then go to Section A 1 for the input of the structural
data. (The input may be copied from an electronic version of the manual.)
This design wave analysis consists of five seastates: four waves including current and wind plus a buoyancy
calculation. Current and wind are in the same direction as the wave.
Wave load data is defined in the order:
Environment data – Section 3.2.1
Hydro properties – Section 3.2.2
Analysis activity – Section 3.2.3

8/14/2019 Genie User Manual Volume 2
http://slidepdf.com/reader/full/genie-user-manual-volume-2 13/121
DET NORSKE VERITAS SOFTWARE GeniE User Manual Vol. II
Version 6.4 9 29 Jan 2013
3.2.1 Environment Data
These data describe the environmental part of a wave load analysis, e.g. wind, current, waves and water
depth in addition to constants like gravity and water density. The following environment data are defined:
Location
Current profile
Wind profile
Regular wave set
Wave load condition
The wave load condition defines how the environment data will be used in the analysis.
Define the Location
It is natural to start by defining the location. Right-click (click right
mouse button on) the Environment folder in the browser and select New Location (or Insert > Environment > Location). The Location
dialog (Figure 5.6) appears with modifiable default values. Let the
values in the Air tab be as is. In the Water tab set Waterline Z to 124
m and in the Soil tab set Seabed Z (mudline) to 0 m.
Note: The Waterline Z and Seabed Z values are
given in the model (global) coordinate system.
Click OK to create the Location and see a Location icon appearing in the Environment folder as shown in
Figure 3.1. Also, the seabed and SWL (still water level or waterline) appear in the display as shown in
Figure 3.2.
Colours, transparencies and whether an object is visible or not are easily modified by right-clicking
the Location selection button in the toolbar and selecting the appropriate item. If, for example, the air
layer is visible it will normally extend far above the structure and you may want to remove it. Right-click theLocation selection button to turn on/off the
visibility of air. Clicking (with the left
mouse button) the Location selection button
enables (when depressed) and disables
(when lifted) selection of environment items
in the same way as the other selection
buttons.
Figure 3.1 The location icon in the Environment folder

8/14/2019 Genie User Manual Volume 2
http://slidepdf.com/reader/full/genie-user-manual-volume-2 14/121
DET NORSKE VERITAS SOFTWARE GeniE User Manual Vol. II
Version 6.4 10 29 Jan 2013
Figure 3.2 The location displayed with water surface and seabed (water made invisible)

8/14/2019 Genie User Manual Volume 2
http://slidepdf.com/reader/full/genie-user-manual-volume-2 15/121
DET NORSKE VERITAS SOFTWARE GeniE User Manual Vol. II
Version 6.4 11 29 Jan 2013
Define the Current Profile
Define a current profile by right-clicking the Environment > Water folder and selecting New Current
Profile; see Figure 3.3. Note that information on how to enter data is provided by positioning the cursor over
the light bulb icon; see Figure 3.4. In the Create/Edit Current Profile dialog the Direction along wave
heading option is used, therefore, only one current profile is needed. This option disables the Directioncolumn. The current must be defined for the wet part, i.e. above maximum wave height which in this case is
28 m. The elevations must be given in sequence of decreasing Z-values and the Z-value is always 0 at sea
surface (SWL) and decreasing downwards. The current profile to enter is as shown in Figure 3.3. Click
Apply and then Cancel and find the Current Profile in the Environment > Water folder.
Figure 3.3 The Create/Edit Current Profile dialog
Figure 3.4 The cursor over the light bulb icon provides information on how to enter a current profile

8/14/2019 Genie User Manual Volume 2
http://slidepdf.com/reader/full/genie-user-manual-volume-2 16/121
DET NORSKE VERITAS SOFTWARE GeniE User Manual Vol. II
Version 6.4 12 29 Jan 2013
Define the Waves
A Regular Wave Set constituted by wave components is defined. Each component consists of period, height,
phase angle and direction data. The phase angles will serve as initial phase angles in the seastates defined in
the Edit Wave Load Run dialog (Figure 5.41).
Right-click the Environment > Water folder and select New Regular Wave Set; see Figure 3.5. Note that
general information on the dialog is provided by positioning the cursor over the book icon as shown to the
right in Figure 3.5. Select the Wave Set Type Period radio button. The Fill tools are for filling in data for
Period, Height, Phase and Direction. See the description accompanying Figure 5.15 for how to use this tool.
In this example there are only four wave components so the data are entered directly into the table as shown
in Figure 3.5.
Click OK and see that the Regular Wave Set appears in the Environment > Water folder.
Note: Defining a Regular Wave Set does not involve creation of any load cases, i.e. no wave loads
will appear in the Analysis > Load Cases folder. Wave load cases are not created until defining
or editing the wave load run, see Section 3.2.3.
Figure 3.5 The Regular Wave Set dialog, general information provided by the book icon

8/14/2019 Genie User Manual Volume 2
http://slidepdf.com/reader/full/genie-user-manual-volume-2 17/121
DET NORSKE VERITAS SOFTWARE GeniE User Manual Vol. II
Version 6.4 13 29 Jan 2013
Define the Wave Load Condition
The Wave Load Condition defines how the basic environmental data will be used in the analysis. A
Condition of type Deterministic Time is created. Right-click the Environment > Location1 icon and select
New Wave Load Condition; see Figure 3.6. The Deterministic Time radio button is currently the only
option. First tick the Regular wave set check box and select the previously defined WaveSet1 from thecombobox in the Wave components area. The wave components appear in the table. In this example we have
only four components and will, therefore, not use the Assign wave component properties tool (this tool will
be used in Section 3.3 Getting Started doing Deterministic Fatigue Wave Analysis). For each wave
component select current profile (the only one defined), wind profile (none in this example) and wave model
(Stokes5, i.e. Stokes 5th order wave theory) by combobox menus in the table (when clicking a cell a
combobox appears). You may need to stretch the dialog somewhat. Add a fifth component containing no
wave data and with wave model CalmSea. This last row of the table will be a separate buoyancy calculation.
Click OK and see that the Wave Load Condition (Condition1) appears in the Environment > Location1
folder.
Figure 3.6 The New Wave Load Condition dialog

8/14/2019 Genie User Manual Volume 2
http://slidepdf.com/reader/full/genie-user-manual-volume-2 18/121
DET NORSKE VERITAS SOFTWARE GeniE User Manual Vol. II
Version 6.4 14 29 Jan 2013
Dialogs for defining waveset, current and wind profile objects may be activated directly from the New Wave
Load Condition dialog. For example, the Regular Wave Set dialog is activated from the Regular wave set
combobox in the Wave components area by selecting <Create new RegularWaveset>. See Figure 3.7.
Thus, no data need to be defined up front. This may be the preferred way to work when you are familiar
with the functionality. Several dialogs offer such functionality.
Figure 3.7 Go to Regular Wave Set dialog from the New Wave Load Condition dialog
Note: Defining the Wave Load Condition does not involve creation of any load cases, i.e. no wave
loads will appear in the Analysis > Load Cases folder. Wave load cases are not created until
defining or editing the wave load run, see Section 3.2.3.
3.2.2 Hydro Properties
Several types of hydro properties may be defined but only two are mandatory, i.e. assuming that both wind
and wave loads are to be computed:
Morison coefficients for the wet part, i.e. up to maximum wave height
Air drag coefficients for the dry part, i.e. down to still water level
In this example we do not have any wind profile so air drag coefficients are not required.
When a property is defined it appears in the Properties > Hydro folder. It has to be connected to the
structure. The hydro properties that will be specified in this example are Morison Coefficients, MarineGrowth and Flooding. A more detailed description of the hydro properties is found in Section 5.3.

8/14/2019 Genie User Manual Volume 2
http://slidepdf.com/reader/full/genie-user-manual-volume-2 19/121
DET NORSKE VERITAS SOFTWARE GeniE User Manual Vol. II
Version 6.4 15 29 Jan 2013
Define and assign Morison Coefficients
A Morison Constant property is defined and assigned to the structure. In this example only one property
using the default values is defined. For simplicity it is assigned to the complete structure even though it is
relevant only on the wet part.
Right-click the Properties > Hydro folder and select Morison > New Morison Constant to open the Create/
Edit Hydro Property dialog; see Figure 3.8. (You can also access this feature through Edit > Properties >
Hydro Property tab > Create/Edit Hydro Property > Morison tab.) The Constant tab appears with default
values. Click Apply (and Cancel) and the hydro property MorisonConstant1 appears in the browser.
The property MorisonConstant1 is then assigned to the structure. As previously mentioned it is convenient
to have named sets comprising different parts of the structure for the purpose of assigning properties. Select
previously defined sets in the Utilities > Sets folder. Alternatively, select the appropriate part of the
structure by clicking/rubberband in the display area or by selecting in the browser. The selected part of the
structure is highlighted; see Figure 3.8. In the Properties > Hydro folder right-click the MorisonConstant1
object and select Apply Morison coefficients to selection. Morison coefficients are now assigned to the
structure.
Figure 3.8 The Create/Edit Hydro Property > Morison dialog – assign coefficients to the structure
Note: If no Morison Coefficient property is assigned, the wave load analysis will fail.

8/14/2019 Genie User Manual Volume 2
http://slidepdf.com/reader/full/genie-user-manual-volume-2 20/121
DET NORSKE VERITAS SOFTWARE GeniE User Manual Vol. II
Version 6.4 16 29 Jan 2013
Define and assign Marine Growth
Marine Growth as Function of Z level is defined and assigned to the structure.
Right-click the Properties > Hydro folder and select New Marine Growth Z-level. (You may also do this by
Edit > Properties > Hydro Property tab > Create/Edit Hydro Property > Marine Growth > Function of Zleveltab.) The Function of Z-level tab appears; see Figure 3.9. You may need to stretch the dialog somewhat to
see the graph at the right properly. Tick Use marine growth when calculating inertia force as we want the
marine growth to contribute to not only the drag force but also the inertia force. After entering the values
shown in the figure notice that the graph may show all and any of the three parameters Thickness,
Roughness height and Density factor.
Note: Z-levels should be given in sequence of decreasing Z-values. Z-value at the still water level is
always 0 and Z-axis is pointing upwards.
Click Apply and Cancel.
Conclude by assigning the property to the whole jacket structure shown in Figure 3.8 in the same way as
described for the Morison coefficient above.
Figure 3.9 The Create/Edit Hydro Property > Marine Growth dialog

8/14/2019 Genie User Manual Volume 2
http://slidepdf.com/reader/full/genie-user-manual-volume-2 21/121
DET NORSKE VERITAS SOFTWARE GeniE User Manual Vol. II
Version 6.4 17 29 Jan 2013
Define and assign Flooding
A Flooding property with Flooding value = 1, i.e. member is flooded, is defined and assigned to the part of
the structure being flooded tubes.
Right-click the Properties > Hydro folder and select New Flooding. The Flooding tab appears in which thevalue 1 is entered; see Figure 3.10.
Click Apply and Cancel.
Only the legs are flooded which means that the Flooding property should be assigned to the legs only. If a
set containing the legs exists use this to assign the property in the same way as described for the Morison
coefficient above. The View Options dialog (Alt+O) > Model tab allows colour coding the Flooding
property for verification purposes; see Figure 3.10.
Figure 3.10 The Create/Edit Hydro Property > Flooding dialog
Note: In Wajac only completely flooded (value 1) or non-flooded (value 0) is possible. Wajac selects
the nearest integer to the value specified, i.e. 1 or 0.
Note: By default all beams are non-flooded in Wajac, i.e. only flooded beams need to be specified.
3.2.3 Define the Design Wave Analysis
To perform a Design Wave Analysis an activity must be created. Right-click the Analysis > Activities folder
and select New Analysis.In the dialog appearing the Linear Structural Analysis option is already selected.
Tick the Wave Load Activity. In the Wave Load Condition combobox choose the wave load condition
Condition1; see Figure 3.11. Click OK to define the analysis activity and the Activity Monitor appears; see
Figure 3.12. Close the Activity Monitor dialog (it is reopened by Alt+D) and find Analysis1 in the Analysis
> Activities folder. Click Analysis1 in the left pane of the browser (or double-click Analysis1 in the right
pane) to see the four activity steps: Meshing, Wave Load Analysis, Linear Structural Analysis and Load
Results as shown in Figure 3.11.

8/14/2019 Genie User Manual Volume 2
http://slidepdf.com/reader/full/genie-user-manual-volume-2 22/121
DET NORSKE VERITAS SOFTWARE GeniE User Manual Vol. II
Version 6.4 18 29 Jan 2013
Figure 3.11 Analysis activities
Note: If you only want to run a wave load analysis (Wajac) then deselect Linear Structural Analysis in the
dialog shown in Figure 3.11.
The Activity Monitor
The next step is to open the Activity Monitor dialog. Right-click the Analysis > Activities > Analysis1
object and select Activity Monitor. You can also do this by Tools > Analysis > Activity Monitor or simply
by Alt+D. The Activity Monitor dialog, see Figure 3.12, appears with the same 4 steps as shown in Figure
3.11.
Features of the Activity Monitor dialog are:
Activities may be selected and deselected.
Right-click an activity to edit the activity.
Right-click an activity to access result files
and other relevant actions.
The Start button starts the execution.
Figure 3.12 The Activity Monitor dialog before execution
Note: Before starting the execution the definition of the Wave Load Analysis activity need to be
completed. The Edit command must be applied to the Wave Load Analysis activity, and remaining
input must be submitted.
Note: In order to omit the execution of the linear analysis, you may deselect activities 1.3 and 1.4 in the
Activity Monitor, see Figure 3.12.

8/14/2019 Genie User Manual Volume 2
http://slidepdf.com/reader/full/genie-user-manual-volume-2 23/121
DET NORSKE VERITAS SOFTWARE GeniE User Manual Vol. II
Version 6.4 19 29 Jan 2013

8/14/2019 Genie User Manual Volume 2
http://slidepdf.com/reader/full/genie-user-manual-volume-2 24/121
DET NORSKE VERITAS SOFTWARE GeniE User Manual Vol. II
Version 6.4 20 29 Jan 2013
Edit Wave Load Run – complete the Wave Load Analysis activity
Open the Edit Wave Load Run dialog by right-clicking activity 1.2 - Wave Load Analysis, Condition1 and
select Edit activity. The Edit Wave Load Run dialog appears; see Figure 3.13. The Run and Wave load
condition combo boxes at top of the dialog are automatically filled in with appropriate data. We want to do a
load calculation and not a data check only. Also, we want automatic generation of input files (for Wajac).Make sure these choices are made by the appropriate radio buttons and check boxes of the dialog.
All necessary run data is specified via the different tabs of the Edit Wave Load Run dialog. A more detailed
description of the wave load analysis data is found in Section 5.4.
Note: The Automatic generation of input files check box, see Figure 3.13, is by default checked. This
involves that the input to the wave load run, i.e. Wajac, is generated every time you run the analysis.
Uncheck this box if you want to modify the input. Read more about this in Section 3.2.6.
Figure 3.13 The Edit Wave Load Run dialog – upper part
Deterministic seastates tab
The Phase step radio button is the default option and implies that phase stepping will be used for all waves;
see Figure 3.14. The seastate table has five rows filled with values from the selected Wave Load Condition.The first four have wave and current specifications while the fifth is calm sea.
Now the empty cells in the table need to be filled in. For the first four rows, the waves, all parameters to
enter will be the same. We want to store results for the load steps giving maximum base shear and maximum
overturning moment; hence both Maximum base shear and Maximum overturning moment in the Design
load calculation area are selected (see A in Figure 3.14). Other relevant data is specified in the fields of the
Seastates table parameters area (B). Then the first four rows are selected by pressing and dragging the
mouse over the rows (C). Conclude by clicking the Fill selected button (D). The empty cells of the first four
rows are then filled. We want to compute wave loads without buoyancy, the Buoyancy column therefore
need to be set to Off (E). The fifth row is for buoyancy calculation only, the Buoyancy column for this row
therefore needs to be set to On (F).

8/14/2019 Genie User Manual Volume 2
http://slidepdf.com/reader/full/genie-user-manual-volume-2 25/121
DET NORSKE VERITAS SOFTWARE GeniE User Manual Vol. II
Version 6.4 21 29 Jan 2013
Figure 3.14 The Edit Wave Load Run > Deterministic seastates dialog
A B
D
E
F
C

8/14/2019 Genie User Manual Volume 2
http://slidepdf.com/reader/full/genie-user-manual-volume-2 26/121
DET NORSKE VERITAS SOFTWARE GeniE User Manual Vol. II
Version 6.4 22 29 Jan 2013
Added mass and damping tab
See Figure 5.44. This is irrelevant for a static analysis.
Rules tab
See Figure 5.45. Default values are used.
Buoyancy tab
See Figure 5.46. Default values are used.
Morison tab
See Figure 5.47. Default values are used.
Output > Global results tab
See Figure 5.48. Default values are used.
Output > Print file tab
See Figure 5.49. No extra print is specified.
Output > Loads interface file tab
See Figure 5.50. Default values are used.
Special options tab
See Figure 5.51. Default values are used.
Complete Edit Wave Load Run dialog
Having completed all tabs of the Edit Wave Load Run dialog click OK and the wave load cases appear
under Analysis1 in the Analysis > Activities folder.
3.2.4 Load Case names, Description, FEM Loadcase numbers and FEM LC Rule
The hydrodynamic load case names are named <analysis activity name>.WLC(#) as shown in Figure 3.15.
Note: In Framework the hydrodynamic load case names appear as WLC(#).
Now create the eight load combinations of Table 3.1. Alternatively to Insert > Load Combination select the
appropriate load cases under Analysis1 in the Analysis > Activities folder and right-click one of them to
open the Insert Load Combination dialog. That way only the selected load cases appear in the dialog.
Table 3.1 Load combinations
Load combination Gravity
FEM LC 1
Wind
FEM LC 2-5
Wave
FEM LC 6-13
Buoyancy
FEM LC 14 NorMaxSh factor 1.2 WindN x 1.6 WLC(1) x 1.6 WLC(9) x 1
NorMaxMo factor 1.2 WindN x 1.6 WLC(2) x 1.6 WLC(9) x 1
EasMaxSh factor 1.2 WindE x 1.6 WLC(3) x 1.6 WLC(9) x 1
EasMaxMo factor 1.2 WindE x 1.6 WLC(4) x 1.6 WLC(9) x 1
SouMaxSh factor 1.2 WindS x 1.6 WLC(5) x 1.6 WLC(9) x 1
SouMaxMo factor 1.2 WindS x 1.6 WLC(6) x 1.6 WLC(9) x 1
WesMaxSh factor 1.2 WindW x 1.6 WLC(7) x 1.6 WLC(9) x 1
WesMaxMo factor 1.2 WindW x 1.6 WLC(8) x 1.6 WLC(9) x 1

8/14/2019 Genie User Manual Volume 2
http://slidepdf.com/reader/full/genie-user-manual-volume-2 27/121
DET NORSKE VERITAS SOFTWARE GeniE User Manual Vol. II
Version 6.4 23 29 Jan 2013
The combinations appear under Analysis1 in the Analysis > Activities folder.
To the right of the load case names and descriptions there are two columns: FEM Loadcase and FEM LC
Rule. The former identifies the load case number that will appear in the Sestra listing (print file). The latter
identifies the method or rule by which the load case number was assigned.
This works as follows:
Basic load cases (created by Insert > Load Case) appear with FEM LC Rule set to Manual.
- Basic load cases are by default numbered from 1 and up.
- However, right-click > Properties on a basic load case may set its number to any free (high)
number thereby leaving a gap in the numbering.
- A new basic load case will be given the lowest free FEM Loadcase number. Unless there are
gaps in the numbering this will be the highest basic load case number plus 1.
Hydrodynamic load cases (wave loads) appear with FEM LC Rule set to Variable.
- Hydrodynamic load cases are always numbered sequentially after the highest basic loadcase number. Creating a new highest basic load case number will therefore shift the
hydrodynamic load case numbers correspondingly.
- Hydrodynamic load cases are numbered in a sequence determined by the Edit Wave Load
Run dialog.
- Hydrodynamic load case numbers cannot be set by the user.
Load combinations (created by Insert > Load Combination) appear by default with FEM LC Rule
set to Automatic.
- Load combinations are always numbered sequentially after the highest hydrodynamic load
case number or, if there are no hydrodynamic load cases, after the highest basic load case
number.
- Load combinations are numbered according to an alphabetic sorting of their names. The
sequence in which the load combinations were created is of no consequence.
- Contrary to a hydrodynamic load case the number of a load combination may be set by the
user. It can be set to any number higher than the highest hydrodynamic and basic load case
number. Such setting changes its FEM LC Rule from Automatic to Manual. This in turn
causes the remaining Automatic load combinations to be renumbered so as to follow
sequentially this new highest numbered Manual load combination.
Figure 3.15 illustrates how an initial numbering of load cases is changed by (1) introducing a new load case
(NewLoad) and (2) by setting the number of the first load combination to 21.

8/14/2019 Genie User Manual Volume 2
http://slidepdf.com/reader/full/genie-user-manual-volume-2 28/121

8/14/2019 Genie User Manual Volume 2
http://slidepdf.com/reader/full/genie-user-manual-volume-2 29/121
DET NORSKE VERITAS SOFTWARE GeniE User Manual Vol. II
Version 6.4 25 29 Jan 2013
After the execution inspect the hydrodynamic results found on the LIS-file (print file) of Wajac (see Section
4.2 about files used by GeniE) by right-clicking the Wave Load Analysis activity and selecting wajac.lis; see
Figure 3.17. Also the Wajac input file may be inspected in the same way. The files appear in the text editor
associated with the file type. Read more about this in Section 5.5.
Figure 3.17 Inspect the Wajac LIS-file via right-click in the Activity Monitor dialog
When the analysis has successfully been completed the results may be graphically inspected.
First switch the display to Results - All and then use Tools > Analysis > Presentation (or Alt+D) to present
for example Beam Forces - NXX for load combination SouMaxMo as shown in Figure 3.18.

8/14/2019 Genie User Manual Volume 2
http://slidepdf.com/reader/full/genie-user-manual-volume-2 30/121
DET NORSKE VERITAS SOFTWARE GeniE User Manual Vol. II
Version 6.4 26 29 Jan 2013
Figure 3.18 Axial beam force results from a static analysis

8/14/2019 Genie User Manual Volume 2
http://slidepdf.com/reader/full/genie-user-manual-volume-2 31/121
DET NORSKE VERITAS SOFTWARE GeniE User Manual Vol. II
Version 6.4 27 29 Jan 2013
3.2.6 Execution of the Design Wave Analysis with Modified Input
You may want to modify the wave analysis (Wajac) input. This may be required in order to give input
outside the capabilities of GeniE.
Do so by opening the Activity Monitor (Alt+D), right-clicking activity ‘1.2 - Wave Load Analysis,Condition1’, selecting Edit activity, unchecking Automatic generation of input files (see Figure 3.19) and
closing the dialog by OK. Thereafter, right-click the activity again and select wajac.inp – the input file to
Wajac. The file appears in the text editor associated with the file type. Edit the input as required and save
the new version of the file using the same file name.
Click the Start button in the Activity monitor to start the revised execution.
Figure 3.19 Uncheck Automatic generation of input files in order to manually edit input
Note: As long as Automatic generation of input files is unchecked changes to hydro property data
and other data controlled by GeniE will not take effect in an analysis. When such changes are
made in GeniE remember to check Automatic generation of input files. In turn, you may then
need to uncheck it again and redo the manual changes to the Wajac input file.

8/14/2019 Genie User Manual Volume 2
http://slidepdf.com/reader/full/genie-user-manual-volume-2 32/121
DET NORSKE VERITAS SOFTWARE GeniE User Manual Vol. II
Version 6.4 28 29 Jan 2013
3.3 Getting Started doing Deterministic Fatigue Wave Analysis
This is a description of how a deterministic fatigue wave analysis is performed. Input of environment, hydro
properties and wave load run data is described. Much of the input is similar to the input in Section 3.2
Getting Started doing Design Wave Analysis. Focus is therefore put on what is different from the design
wave analysis.
If you want to perform the operations described below then go to Section A 2 for the input of the structural
data. (The input may be copied from an electronic version of the manual.)
Normally, a deterministic wave load analysis consists of a number of wave components. In this simplified
example, however, there are only a few.
Four wave headings will be analysed. For each wave heading there are four waves with different pairs of
wave periods and wave heights. The set of periods and heights are the same for all wave directions. We then
have a total of 4x4=16 number of seastates. Linear waves (Airy) will be used and we have no current and no
wind.
3.3.1 Environment Data
The following environment data are defined: a location (similar to the design wave analysis in Section 3.2),
a regular wave set and a wave load condition.
Define the Location
See Define the Location in Section 3.2.1.
Define the Waves
A Regular Wave Set constituted by wave components is defined. Each component consists of period, height,
phase angle and direction data. The phase angles will serve as initial phase angles in the seastates defined in
the Edit Wave Load Run dialog (Figure 5.41).
Right-click the Environment > Water folder and select New Regular Wave Set (Figure 5.15). Select the
Wave Set Type Period radio button. Values for periods and heights are entered directly into the table.
Note: Values may also be copied from a spreadsheet, e.g. Excel.
To fill the rest of the table the Fill tools area is used. The initial phase angle is 0 for all wave components so
the Phase radio button is selected and the value 0.0 is entered into the Value edit box in the Single value
area; see Figure 3.20. The Fill all button is clicked.

8/14/2019 Genie User Manual Volume 2
http://slidepdf.com/reader/full/genie-user-manual-volume-2 33/121
DET NORSKE VERITAS SOFTWARE GeniE User Manual Vol. II
Version 6.4 29 29 Jan 2013
Figure 3.20 Define wave set – wave periods, heights and phases
To complete the wave components table the directions must be filled in. The directions are 0, 45, 90 and
135. Select the Direction radio button and in the Sequence area enter the first, last and step values. Tick the
Combine all with all check box. Click the Fill table button and a total of 16 wave components appear in the
wave components table as shown in Figure 3.21. Click OK to accept the data and close the dialog.
Figure 3.21 Define wave set – wave directions and resulting components

8/14/2019 Genie User Manual Volume 2
http://slidepdf.com/reader/full/genie-user-manual-volume-2 34/121
DET NORSKE VERITAS SOFTWARE GeniE User Manual Vol. II
Version 6.4 30 29 Jan 2013
Define the Wave Load Condition
The Wave Load Condition defines how the basic environmental data will be used in the analysis. A
Condition of type Deterministic Time is created. Right-click the Environment > Location1 icon and select
New Wave Load Condition. The Deterministic Time radio button is currently the only option.
Tick the Regular wave set check box and select the previously defined WaveSet1 from the combobox in the
Wave components area. The wave components appear in the table as shown in Figure 3.22.
Use the Assign wave component properties area to complete the table. Select Airy as Wave model and click
the Fill All button. The table is now complete. Click OK.
Figure 3.22 The New Wave Load Condition dialog

8/14/2019 Genie User Manual Volume 2
http://slidepdf.com/reader/full/genie-user-manual-volume-2 35/121
DET NORSKE VERITAS SOFTWARE GeniE User Manual Vol. II
Version 6.4 31 29 Jan 2013
3.3.2 Hydro Properties
The hydro properties to be specified are Morison coefficients, Marine Growth, Flooding and Element
refinement.
Define and assign Morison Coefficients
See Define and assign Morison Coefficients in Section 3.2.2.
Define and assign Marine Growth
See Define and assign Marine Growth in Section 3.2.2.
Define and assign Flooding
See Define and assign Flooding in Section 3.2.2.
Define and assign Element Refinement
An Element Refinement property is defined and assigned to the structure. In this example two properties are
defined. ElementRefinement1 is assigned to the bracing in the interval from the seabed and up to Z=105 as
well as to the whole length of the legs. ElementRefinement2 is assigned to the bracing in the interval from
(and including) Z=105 to the water surface. For a detailed description of this property see text related to
Figure 5.36.
Right-click the Properties > Hydro folder and select New Element Refinement. The Element Refinement tab
appears; see Figure 3.23. (You may also do this by Edit > Properties > Hydro Property tab > Create/Edit
Hydro Property > Element Refinement.) Enter Refinement coefficient = 5, Maximum Subelement length = 2and Minimum Subelement length = 1. Connect the ElementRefinement1 property to the relevant parts of the
structure.
Repeat the process by defining ElementRefinement2 with Refinement coefficient = 15, Maximum
Subelement length = 2 and Minimum Subelement length = 1. Connect the ElementRefinement2 property to
the relevant parts of the structure.
Normally, high refinement is preferred close to the water surface where the variation in wave loads is high
and low refinement is preferred close to seabed. Ensure that you have previously defined named sets of
relevant parts of the structure. The refinement property may optionally be skipped since Wajac handles the
refinement by default.

8/14/2019 Genie User Manual Volume 2
http://slidepdf.com/reader/full/genie-user-manual-volume-2 36/121
DET NORSKE VERITAS SOFTWARE GeniE User Manual Vol. II
Version 6.4 32 29 Jan 2013
Figure 3.23 The Create/Edit Hydro Property > Element Refinement dialog
3.3.3 Define the Deterministic Fatigue Wave Analysis
The comments in Section 3.2.3 for how to create a Wave Load Analysis are also relevant here.
The Activity MonitorSee Section 3.2.3 about the Activity Monitor. Before starting the execution complete the definition of the
Wave Load Analysis activity. Open the Edit Wave Load Run dialog by right-clicking activity 1.2 and
selecting Edit activity.
Edit Wave Load Run – complete the Wave Load Analysis activity
All necessary run data are specified through the choices at top and the various tabs of the Edit Wave Load
Run dialog. A more detailed description of the wave load analysis data is found in Figure 5.4.
Deterministic seastates tab (Figure 5.43)
As in the design wave analysis in Section 3.2 the Phase step option is used. The seastates table has 16 rows
filled with values from the selected Wave load condition Condition1. To fill the empty cells of the table the
Seastates table parameters area is used. In this example the step length is 30 degrees and number of steps is
12. The factors for current blockage and wave kinematics are both 1.0. The wave theory used is linear (Airy)
with Wheeler stretching of the fluid kinematics. No Buoyancy calculation is wanted. Since all states shall
have the same values the Fill all button is clicked. The white cells are then filled with values. The last
column shows the loadcase number for the first loadcase for each wave component.

8/14/2019 Genie User Manual Volume 2
http://slidepdf.com/reader/full/genie-user-manual-volume-2 37/121
DET NORSKE VERITAS SOFTWARE GeniE User Manual Vol. II
Version 6.4 33 29 Jan 2013
Figure 3.24 Edit wave load activity – Deterministic seastates tab
Added mass and damping tab
See Figure 5.44. This is irrelevant for a static analysis
Rules tab
See Figure 5.45. Default values are used.
Buoyancy tab
See Figure 5.46. Default values are used.
Morison tab
See Figure 5.47. Default values are used.
Output > Global results tab
See Figure 5.48. Default values are used.

8/14/2019 Genie User Manual Volume 2
http://slidepdf.com/reader/full/genie-user-manual-volume-2 38/121
DET NORSKE VERITAS SOFTWARE GeniE User Manual Vol. II
Version 6.4 34 29 Jan 2013
Output > Print file tab
See Figure 5.49. No extra print is specified.
Output > Loads interface file tab
See Figure 5.50. Default values are used.
Special options tab
See Figure 5.51. Default values are used.
When the Wave Load Analysis definition is complete the wave loads appear under Analysis1 in the
Analysis > Activities folder.
Note: The waves may be visualised in the graphical view when a wave load case is selected by the
set- Current command. Currently only Airy type waves have this feature. An example is
shown in Figure 3.25.
Figure 3.25 Airy wave displayed with model
3.3.4 Execution of Deterministic Fatigue Wave Analysis
The comments in Section 3.2.5 for how to execute a wave load analysis are also relevant here.

8/14/2019 Genie User Manual Volume 2
http://slidepdf.com/reader/full/genie-user-manual-volume-2 39/121

8/14/2019 Genie User Manual Volume 2
http://slidepdf.com/reader/full/genie-user-manual-volume-2 40/121
DET NORSKE VERITAS SOFTWARE GeniE User Manual Vol. II
Version 6.4 36 29 Jan 2013
Figure 3.26 Location in air, water and soil
Structure Model
The structure model can be any type of model but usually it is a jacket model consisting of beams with pipe
cross sections, optionally including a topside structure with stiffened plates.
Piles
In a structure-pile-soil analysis the structure is supported by piles that interact non-linearly with the soil.
GeniE provides specific pile concepts for this purpose. A pile is similar to a beam but it has special
additional properties such as pile tip information. A pile also relates directly to soil layers and sublayers in
such a way that the division of the pile into nodes and elements is a direct function of the soil layer
description.

8/14/2019 Genie User Manual Volume 2
http://slidepdf.com/reader/full/genie-user-manual-volume-2 41/121
DET NORSKE VERITAS SOFTWARE GeniE User Manual Vol. II
Version 6.4 37 29 Jan 2013
Structure-Pile-Soil Analysis
A complete structure-pile-soil analysis in GeniE consists of several steps:
Meshing of structure and piles
Execution of wave load analysis, creating the wave loads
Combination of static loads and wave loads into load combinations representing complete loading
conditions
Linear reduction of structure stiffness model
Non-linear solution of pile-soil interaction
Retracking of forces and moments in structure and pile model
This process is automated as a Pile-Soil activity. An activity involves use of several externally controlled
applications including Wajac, Gensod and Splice. The activity is retained in the GeniE database and can be
executed many times. It is possible to edit and modify input to the externally controlled applications via the
activity.
3.5.2 Modelling
In a structure-pile-soil analysis the task of modelling consists of two main parts: modelling the environment
and modelling the piles and structure.
Since the piles relate to and depend on the soil layers it is natural to start modelling the environment and the
soil layers. The soil layers (and sublayers) are directly used in the pile meshing to control the position of pile
nodes.
Soil Modelling
Start by creating a new location object containing soil, water and air zones. Essential parts of the soil data
include the seabed Z-coordinate (mudline) and the bottom soil layer Z-coordinate.
For the seabed, one may e.g. enter data about general and local scour; see Figure 3.27. For the soil layers,
one may choose between clay and sand followed by entering soil data and soil curve properties; see Figure
3.28. These data control the generation of P-Y, T-Z and Q-Z curves.

8/14/2019 Genie User Manual Volume 2
http://slidepdf.com/reader/full/genie-user-manual-volume-2 42/121
DET NORSKE VERITAS SOFTWARE GeniE User Manual Vol. II
Version 6.4 38 29 Jan 2013
Figure 3.27 General and local scour
Figure 3.28 Soil layers

8/14/2019 Genie User Manual Volume 2
http://slidepdf.com/reader/full/genie-user-manual-volume-2 43/121
DET NORSKE VERITAS SOFTWARE GeniE User Manual Vol. II
Version 6.4 39 29 Jan 2013
It is also possible to specify sublayers within each soil layer. The purpose of the sublayers is to control the
discretisation of the piles, i.e. the number of nodes and elements along the piles when meshed. Typically,
one may want to use more sublayers near the seabed.
Pile Modelling
After modelling the location it is natural to model the structure and piles (it is of course possible to model
the structure first).
The bottom part of the structure, not including the piles, is typically at or near the seabed Z-coordinate.
Below the seabed piles should be modelled using the special pile concept provided. Only piles modelled this
way will be subject to non-linear pile-soil analysis in Gensod and Splice.
It is possible for piles to overlap beams in the jacket structure in order to represent pile-in-sleeve and pile-
inleg designs. The pile sleeve or leg is modelled as an ordinary beam with pipe cross section overlapping the
pile. In Splice only the lower non-overlapping part of the pile is considered. The ‘Splice pile head’ is located
at the bottom of the pile sleeve or at the top of the pile if there is no pile sleeve; see Figure 3.29.
Figure 3.29 Pile in pile sleeve
Analysis Parameters
Once the modelling is complete a structure-pile-soil analysis Activity can be created in which control
information for the analysis can be accessed and modified.

8/14/2019 Genie User Manual Volume 2
http://slidepdf.com/reader/full/genie-user-manual-volume-2 44/121
DET NORSKE VERITAS SOFTWARE GeniE User Manual Vol. II
Version 6.4 40 29 Jan 2013
3.5.3 Analysis
The structure-pile-soil analysis activity controls everything from creating a finite element model to the
equation solving and results retrieval.
Representation
The structure, modelled by beams, is meshed as two node beam elements in the finite element model. The
piles are also meshed as two node beams thereby enabling presentation of bending moment diagrams for the
piles after the analysis.
The structure and piles belong to the same 1st level superelement. All nodes along the piles are
automatically defined as supernodes. There is also a supernode-coupling between the pile heads and the
bottom of the structure (bottom of leg or pile sleeve). GeniE automatically creates a 2nd level superelement
and ‘lifts’ (‘combines’ in Presel terminology) all loadcases and load combinations to the 2nd level
superelement. When the analysis has been completed the results are presented for the 1st level superelement,
i.e. the structure model. This way, a seamless structure-pile-soil analysis is enabled without the user being
concerned with superelement modelling, assembling and analysis. A superelement analysis is performed in
the background hidden for the user.
Execution
The structure-pile-soil analysis is completely integrated. There is no need for leaving GeniE.
3.5.4 Results
For Pile-Soil analyses the following results may be presented in GeniE:
The deformed shape of structure and piles
Bending moment, shear force and axial force diagrams
More specialised results are available in the Gensod and Splice listing files that are easily accessed from
the GeniE Activity Monitor.

8/14/2019 Genie User Manual Volume 2
http://slidepdf.com/reader/full/genie-user-manual-volume-2 45/121
DET NORSKE VERITAS SOFTWARE GeniE User Manual Vol. II
Version 6.4 41 29 Jan 2013
3.6 Getting Started doing Structure-Pile-Soil Analysis with Design Wave
Loads
A four legged jacket with a pile in the extension of each leg is used as an example. The soil is divided into 7
layers with different properties. The wave loads consist of 4 design waves with different directions, periodsand wave heights.
If you want to perform the operations described below then go to Section A 3 for the input of the structural
data. (The input may be copied from an electronic version of the manual.)
3.6.1 Environment
Start by creating a new location. Right-click the Environment folder and select New Location. (You may
also do this by Insert > Environment > Location.) The Create/Edit Location dialog appears with default
values. Set Waterline Z found in the Water tab to 124 m and Seabed Z found in the Soil tab to 0 m; see
Figure 3.30. Click OK in the dialog.Note: These values are given in the model (global) coordinate system.
Figure 3.30 Create a new location and edit it
When the location is created a Location icon appears in the Environment folder (see Figure 3.31) and the
water and soil layers are displayed. The visibility and layout is modifiable using the Location selection
button in the toolbar.
Figure 3.31 Location in Environment folder

8/14/2019 Genie User Manual Volume 2
http://slidepdf.com/reader/full/genie-user-manual-volume-2 46/121
DET NORSKE VERITAS SOFTWARE GeniE User Manual Vol. II
Version 6.4 42 29 Jan 2013
3.6.2 Scour
First define the scour by right-clicking the Environment > Soil folder and selecting New Scour. Fill in data
for general and local scour as shown in Figure 3.32. Click Apply (and Cancel).
Figure 3.32 The Create/Edit Seabed delta dialog defines scour
3.6.3 Soil Properties
In order to create the soil there are four types of property that need to be defined:
Soil Type is a property with soil type and principal characteristics.
Soil Curves is a property that controls the generation of P-Y, T-Z and Q-Z curves.
Soil Data is a property with additional soil characteristics.
Soil layers and their properties.
Reopen the Create/Edit Location dialog for editing by right-clicking Location1 in the browser and go to the
Soil tab. In the Seabed delta field specify the seabed delta type Scour1; see Figure 3.33.
Define new soil types via the option <Create new Soil> as shown in Figure 3.33 or by right-clicking the
Environment > Soil folder as shown for scour in Figure 3.32. Figure 3.34 shows the dialogs for creating soil
of types Sand and Clay. Figure 3.35 provides all necessary soil data. First create soil types Soil1 through
Soil5 with data provided by the two tables in the upper left of Figure 3.35. Thereafter, fill in the table in the
Create/Edit Location dialog with soil layer Z bottom and soil type.
Use a similar approach for soil curves and soil data. A single soil curve is defined and used for all layers;
see the dialog to the left in Figure 3.36. The soil data to enter in the dialog shown to the right in Figure 3.36
is provided by the table at the bottom of Figure 3.35. Having created the soil curve and soil data fill in the
Create/Edit Location dialog as shown in Figure 3.36 and click OK to accept the data.

8/14/2019 Genie User Manual Volume 2
http://slidepdf.com/reader/full/genie-user-manual-volume-2 47/121
DET NORSKE VERITAS SOFTWARE GeniE User Manual Vol. II
Version 6.4 43 29 Jan 2013
Figure 3.33 The Create/Edit Location dialog
Figure 3.33 The Create/Edit Location dialog

8/14/2019 Genie User Manual Volume 2
http://slidepdf.com/reader/full/genie-user-manual-volume-2 48/121
DET NORSKE VERITAS SOFTWARE GeniE User Manual Vol. II
Version 6.4 44 29 Jan 2013
Figure 3.35 Sand and Clay data

8/14/2019 Genie User Manual Volume 2
http://slidepdf.com/reader/full/genie-user-manual-volume-2 49/121
DET NORSKE VERITAS SOFTWARE GeniE User Manual Vol. II
Version 6.4 45 29 Jan 2013
Figure 3.36 The Create/Edit Soil Properties dialog for soil curves and soil data
Figure 3.37 Fill in the Create/Edit Location dialog
The number of sublayers in the Create/Edit Location dialog controls the meshing of the piles, i.e. one node
per sublayer. Each node is located in the middle of the sublayer.
Figure 3.38 shows the result of modelling the location with soil layers.

8/14/2019 Genie User Manual Volume 2
http://slidepdf.com/reader/full/genie-user-manual-volume-2 50/121
DET NORSKE VERITAS SOFTWARE GeniE User Manual Vol. II
Version 6.4 46 29 Jan 2013
Figure 3.38 Location with soil layers (no piles yet)
3.6.4 Pile Modelling
First switch the Straight Beam button into a Pile button by clicking the down arrow next to the button. Whenthe Pile button is pressed you are ready to insert piles. See Figure 3.39.
Figure 3.39 Create pile
8/14/2019 Genie User Manual Volume 2
http://slidepdf.com/reader/full/genie-user-manual-volume-2 51/121
DET NORSKE VERITAS SOFTWARE GeniE User Manual Vol. II
Version 6.4 47 29 Jan 2013
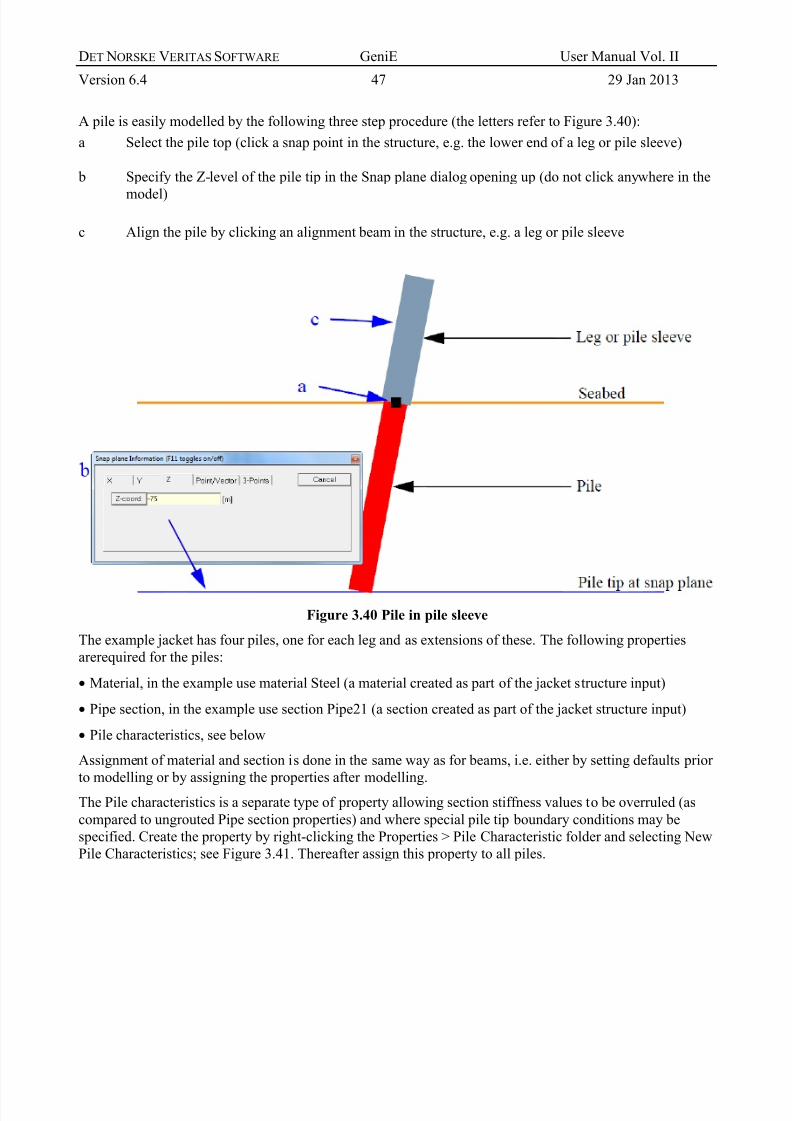
A pile is easily modelled by the following three step procedure (the letters refer to Figure 3.40):
a Select the pile top (click a snap point in the structure, e.g. the lower end of a leg or pile sleeve)
b Specify the Z-level of the pile tip in the Snap plane dialog opening up (do not click anywhere in the
model)
c Align the pile by clicking an alignment beam in the structure, e.g. a leg or pile sleeve
Figure 3.40 Pile in pile sleeve
The example jacket has four piles, one for each leg and as extensions of these. The following properties
arerequired for the piles:
Material, in the example use material Steel (a material created as part of the jacket structure input)
Pipe section, in the example use section Pipe21 (a section created as part of the jacket structure input)
Pile characteristics, see below
Assignment of material and section is done in the same way as for beams, i.e. either by setting defaults prior
to modelling or by assigning the properties after modelling.
The Pile characteristics is a separate type of property allowing section stiffness values to be overruled (as
compared to ungrouted Pipe section properties) and where special pile tip boundary conditions may be
specified. Create the property by right-clicking the Properties > Pile Characteristic folder and selecting New
Pile Characteristics; see Figure 3.41. Thereafter assign this property to all piles.

8/14/2019 Genie User Manual Volume 2
http://slidepdf.com/reader/full/genie-user-manual-volume-2 52/121
DET NORSKE VERITAS SOFTWARE GeniE User Manual Vol. II
Version 6.4 48 29 Jan 2013
Figure 3.41 The Create/Edit Pile Characteristics dialog
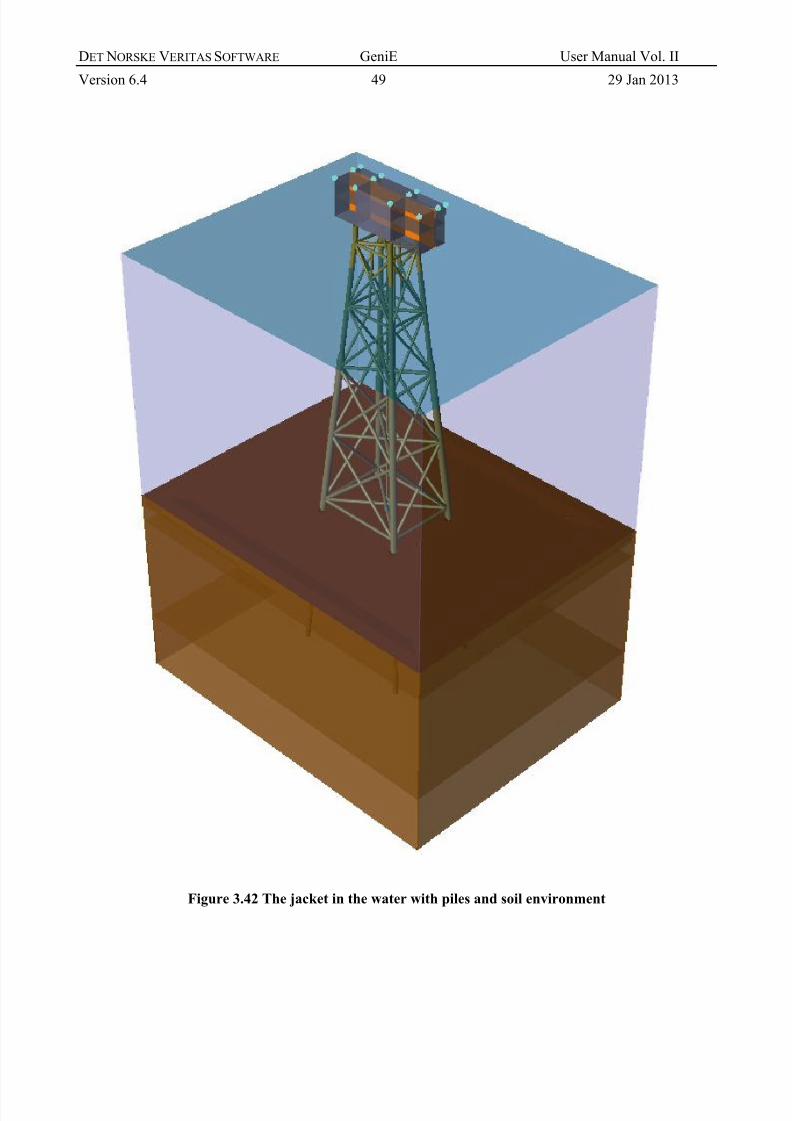
The complete jacket structure in the water with piles and soil environment is shown in Figure 3.42.
8/14/2019 Genie User Manual Volume 2
http://slidepdf.com/reader/full/genie-user-manual-volume-2 53/121
DET NORSKE VERITAS SOFTWARE GeniE User Manual Vol. II
Version 6.4 49 29 Jan 2013
Figure 3.42 The jacket in the water with piles and soil environment

8/14/2019 Genie User Manual Volume 2
http://slidepdf.com/reader/full/genie-user-manual-volume-2 54/121
DET NORSKE VERITAS SOFTWARE GeniE User Manual Vol. II
Version 6.4 50 29 Jan 2013
3.6.5 Define the Pile-Soil Analysis
Do an integrated wave load and structure-pile-soil analysis by defining a wave load condition. See Section
3.2 for details on how to work with wave load conditions and wave load analyses. In this example a regular
wave set named WaveSet1 has already been defined. This regular wave set is selected in the New Wave
Load Condition dialog. Figure 3.43 shows the table in the New Wave Load Condition dialog after selectingthe regular wave set and adding current profile and wave model. A calm sea condition has also been added.
Figure 3.43 Wave set from New Wave Load Condition dialog
Having defined the wave loads the next step is to set up the analysis activity. This is done by right-clicking
the Analysis > Activities folder and selecting New Analysis (or Alt+D). For a structure-pile-soil analysis
including wave load calculation check the options shown in Figure 3.44 and specify a wave load condition.
Figure 3.44 New analysis activity
The activity is shown in the browser. Right-click the activity (or Alt+D) to open the Activity Monitor and
view activity details; see Figure 3.45. This dialog is also used for activity execution.

8/14/2019 Genie User Manual Volume 2
http://slidepdf.com/reader/full/genie-user-manual-volume-2 55/121
DET NORSKE VERITAS SOFTWARE GeniE User Manual Vol. II
Version 6.4 51 29 Jan 2013
Figure 3.45 The Activity Monitor dialog
Note: Right-click > Edit activity on the Meshing activity allows switching on ‘Smart load
combinations’ (see the GeniE User Manual Vol. 1 about this). For a structure-pile-soil analysis
Smart load combinations is irrelevant, i.e. this setting has no effect. (This is due to use of the
superelement technique for such an analysis.)
Using The Activity Monitor to Modify Analysis Control Parameters
Before executing the analysis by the Start button of the Activity Monitor parameters required by the solver
programs must be set. These include:
Meshing: To control whether and how piles are to be meshed and to set superelement numbers, in this case
only set the top superelement number:
o Right click > Edit activity to open the Meshing activity dialog and set top superelement
number to 21; see Figure 3.46.
Figure 3.46 The Mesh activity dialog for setting superelement number
8/14/2019 Genie User Manual Volume 2
http://slidepdf.com/reader/full/genie-user-manual-volume-2 56/121
DET NORSKE VERITAS SOFTWARE GeniE User Manual Vol. II
Version 6.4 52 29 Jan 2013
Wave load analysis: Control parameters for Wajac including defining the wave load cases and
combinations:
o Edit the wave load analysis as described in general in Section 3.2.3 and specifically in
Figure 3.14.
o Create load combinations as described in Section 3.2.4.
Structure-pile-soil analysis: Control parameters for Sestra, Gensod and Splice, no action is required
For more details see the dialog reference in Section 5.6 and the Splice documentation.
Scaling down Basic Load Cases
GeniE always analyses all loads, basic load cases as well as load combinations. However, in a non-linear
pile-soil analysis only results for the load combinations are normally of interest as the non-linearity prevents
results for the basic load cases to be combined.
The basic load cases are not only of little interest, in certain cases they may even cause the whole analysis tostop. For example, a wave load case alone (not combined with gravity) may cause tension in a pile.
Depending on the pile and soil data such tension may cause the iteration of the non-linear analysis of Splice
to fail and stop the complete analysis.
To circumvent this problem a feature involving scaling down the basic load cases is available in the form of
a command. Click the Command Line area and type the command:
GenieRules.Meshing.basicLCfactor = 0.01;
3.6.6 Executing the Pile-Soil Analysis
Once the model has been created and analysis control parameters have been modified the complete analysis
is run via the Activity Monitor. This includes the sub-activities:
Meshing – creating a finite element representation
o Delete loads
o Generate loads
o Delete mesh
o Generate mesh
Wave Load Analysis
Pile Soil Analysis – the structure-pile-soil analysis that includes sub-sub-activities:
o Soil (Gensod) calculation
o Sestra, Reduction
o Splice – the non-linear pile-soil interaction analysis
o Sestra, Retracking
Load Results back into GeniE for graphical presentation and reporting
Start the analysis by clicking Start and abort it at any time by clicking Abort; see Figure 3.47.

8/14/2019 Genie User Manual Volume 2
http://slidepdf.com/reader/full/genie-user-manual-volume-2 57/121
DET NORSKE VERITAS SOFTWARE GeniE User Manual Vol. II
Version 6.4 53 29 Jan 2013
Figure 3.47 Execution via the Activity Monitor dialog
3.6.7 Reviewing Analysis Results
During execution the analysis programs Wajac, Sestra, Gensod, Splice or GeniE itself may report warnings
or errors.
The Activity Monitor will indicate the status of each sub-activity in the Status column. Investigate details of
a sub-activity by opening its listing file. This is done by right-clicking the sub-activity in the activity
monitor; see Figure 3.48. The file selected will be opened using the editor associated with the particular file
type. Search for the words ‘error’ and ‘warning’ in the listing file to get more information on the execution
status.
Figure 3.48 Opening listing file in an editor
After a successful execution the analysis results may be presented using standard results presentation
features like deformed shape, bending moment diagrams, etc. Such result presentation may also be done for
the piles.

8/14/2019 Genie User Manual Volume 2
http://slidepdf.com/reader/full/genie-user-manual-volume-2 58/121
DET NORSKE VERITAS SOFTWARE GeniE User Manual Vol. II
Version 6.4 54 29 Jan 2013
Figure 3.49 Axial beam force results for a piled jacket analysis
You may then modify the model or analysis control parameters and re-run the analysis.
3.6.8
Execution of the Pile-Soil Analysis with Modified InputYou may want to modify the pile-soil analysis (Gensod/Splice) input. This may be required in order to give
input outside the capabilities of GeniE.
Do this by first right-clicking the activity ‘1.3 - Pile Soil Analysis, Condition1’, selecting Edit activity,
unchecking the Automatic generation of input files check box and clicking OK in the dialog; see Figure
3.50.

8/14/2019 Genie User Manual Volume 2
http://slidepdf.com/reader/full/genie-user-manual-volume-2 59/121
DET NORSKE VERITAS SOFTWARE GeniE User Manual Vol. II
Version 6.4 55 29 Jan 2013
Figure 3.50 Uncheck Automatic generation of input files in order to manually edit input
Thereafter, right-click the appropriate activity, ‘1.3.1 - Soil (Gensod)’ or ‘1.3.3 - Splice’, and select gensod.
inp/splice.inp – the input files to Gensod/Splice. The file appears in the text editor associated with the file
type ‘inp’. Edit the input as required and save the new version of the file using the same file name.
Click the Start button in the Activity monitor to start the revised execution.
Note: As long as the Automatic generation of input files box is unchecked changes to soil, pile and
other data controlled by GeniE will not take effect in an analysis. When such changes are
made in GeniE remember to check the Automatic generation of input files box. In turn, you
may then need to uncheck the Automatic generation of input files box and redo the manualchanges to the Gensod/Splice input file.
3.7 Doing the Analysis Outside GeniE
There may be cases when doing the wave load and structural analyses outside GeniE is required. Such cases
are:
When doing a superelement analysis
To circumvent limitations in GeniE
In either case you need to export the FEM-file from GeniE by Tools > Analysis > Export FEM File. Theexported file includes the whole model including piles, if present, and is identical to the FEM file
automatically created during a wave load calculation or structure-pile-soil analysis controlled by GeniE.
This FEMfile plus the input files to Wajac (wajac.inp), Gensod (gensod.inp) and Splice (splice.inp), if
relevant, need to be copied to the project folder created by SESAM Manager.
Having exported the FEM-file and performed analyses controlled by Manager you cannot revert to GeniE
for results presentation. In such cases use Xtract for general postprocessing and Framework for frame
postprocessing, both controlled by Manager.

8/14/2019 Genie User Manual Volume 2
http://slidepdf.com/reader/full/genie-user-manual-volume-2 60/121
DET NORSKE VERITAS SOFTWARE GeniE User Manual Vol. II
Version 6.4 56 29 Jan 2013
4. EXECUTION OF GENIE: WAVE AND STRUCTURE-PILE-
SOIL ANALYSIS
4.1 Program Environment
See the GeniE User Manual Vol. 1 for information on the hardware environment of GeniE and how to
execute the program.
4.2 Files used by GeniE
GeniE (and Sestra, Wajac and Splice when started from GeniE) produces and uses the following files:
GeniE journal file in Java script format – *.jsIn addition to journalling (command logging) this file format is used for:
o Reading a command file
o Exporting a ‘clean’ js-file (File > Export > Genie journal file)
GeniE database – *.gni
GeniE saved report in alternative formats – *.lis, *.html, *.xml
GeniE saved graphics in alternative formats – *.gif, *.eps, *.bmp, *.tga, *.tif, *.ps, *.vrml, *.dfile
Genie_log.txt file in case of model errors and/or warnings
SESAM Input Interface File (neutral model file), also termed T-file – T*.FEM
SESAM Loads Interface File (produced by Wajac and a subset of the Input Interface File) – L*.FEM
SESAM Matrix Interface File (data exchange file between Sestra and Splice) – M*.SIF
SESAM Results Interface File (neutral model plus results file) – R*.SIN (or R*.SIF or R*.SIU)
Batch program input (input to Wajac, Gensod, Splice, Sestra) – *.inp
Batch program listing (print) file (from Wajac, Sestra, Gensod, Splice) – *.lis
Simulation Result File (from Wajac) – *.ser (See the Wajac User Manual, the LOASIM command, for
details.)
Batch program message file – *.mlg
Sestra maintenance file – *.mnt

8/14/2019 Genie User Manual Volume 2
http://slidepdf.com/reader/full/genie-user-manual-volume-2 61/121
DET NORSKE VERITAS SOFTWARE GeniE User Manual Vol. II
Version 6.4 57 29 Jan 2013
5. DIALOG DESCRIPTION
5.1 Dialog Features
This section describes useful features common for several of the dialogs explained below. The subsequent
three sections (Section 5.2, Section 5.3 and Section 5.4) present all dialogs relevant when doing a wave load
analysis. Additional information on data and special features for each dialog is given. The descriptions are
grouped in separate chapters for the Environment, the Hydro Properties and the Wave Load Analysis.
5.1.1 Dialog Help
Help information is available in the dialogs and is activated by positioning the cursor over the help
icons: A dialog contains at the most one such book icon. It normally gives a general description ofthe dialog and its purpose; see Figure 5.1.
Figure 5.1 Example of use of book icon
A dialog contains any number of such icons. Normally, each is positioned nearby a data field or a
feature for which it gives an explanation; see Figure 5.2.

8/14/2019 Genie User Manual Volume 2
http://slidepdf.com/reader/full/genie-user-manual-volume-2 62/121
DET NORSKE VERITAS SOFTWARE GeniE User Manual Vol. II
Version 6.4 58 29 Jan 2013
Figure 5.2 Example of use of light bulb icon
5.1.2 Dialog New/Edit Functionality
Many dialogs have a special functionality for handling both creation of a new data object and editing an
existing. When the dialog is opened in new-mode the New and Allow edit options are automatically
ticked and the dialog is ready to accept data. When opened in edit-mode the Edit existing option is
ticked. All data fields are disabled and the dialog is in a read-only state. To open for editing the Allow edit
option must be ticked.
Figure 5.3 New/edit functionality in dialogs
5.1.3 Late Definition Functionality
Some dialogs offer what may be called late definition functionality . Such functionality is found in
dialogs that include other data objects. An example is the Wave Load Condition dialog (Figure 5.36) where
dialogs for defining waveset, current and wind profile objects may be activated directly from this dialog. For
example, the regular waveset dialog is activated from the Regular waveset combobox in the Wave
components area by selecting <Create new RegularWaveset>. Thus, no data need to be defined up front.
Figure 5.4 Late definition functionality

8/14/2019 Genie User Manual Volume 2
http://slidepdf.com/reader/full/genie-user-manual-volume-2 63/121
DET NORSKE VERITAS SOFTWARE GeniE User Manual Vol. II
Version 6.4 59 29 Jan 2013
5.1.4 Table Functionality
Dialogs that contain a table will often have the functionality described below. This functionality makes it
easier to enter and modify table value. In addition to writing values directly into the table the following
options exist:
Copy from a spreadsheet
Values in a spreadsheet, e.g. Excel, may be copied and pasted into the dialog provided that the number of
columns is the same. The number of rows in the table of the dialog must, if necessary, be increased
(position the cursor in the last row and click the down arrow) to allow the rows of the spreadsheet to be
copied.
If the values have a systematic variation Fill table may be used. Enter first, last and step values and click
the Fill table button. Values are automatically filled in the table.
The Insert button is used to insert one or more values. Number of values inserted equals number of rows
selected. Values are inserted before first selected row and are calculated based on linear interpolation.
The Remove button removes all selected rows.
The Clear table button clears the table.
Some common table features:
To select a row click to the left of the row. The complete row is highlighted.
Add more rows by positioning the cursor in the last row and clicking the down arrow.
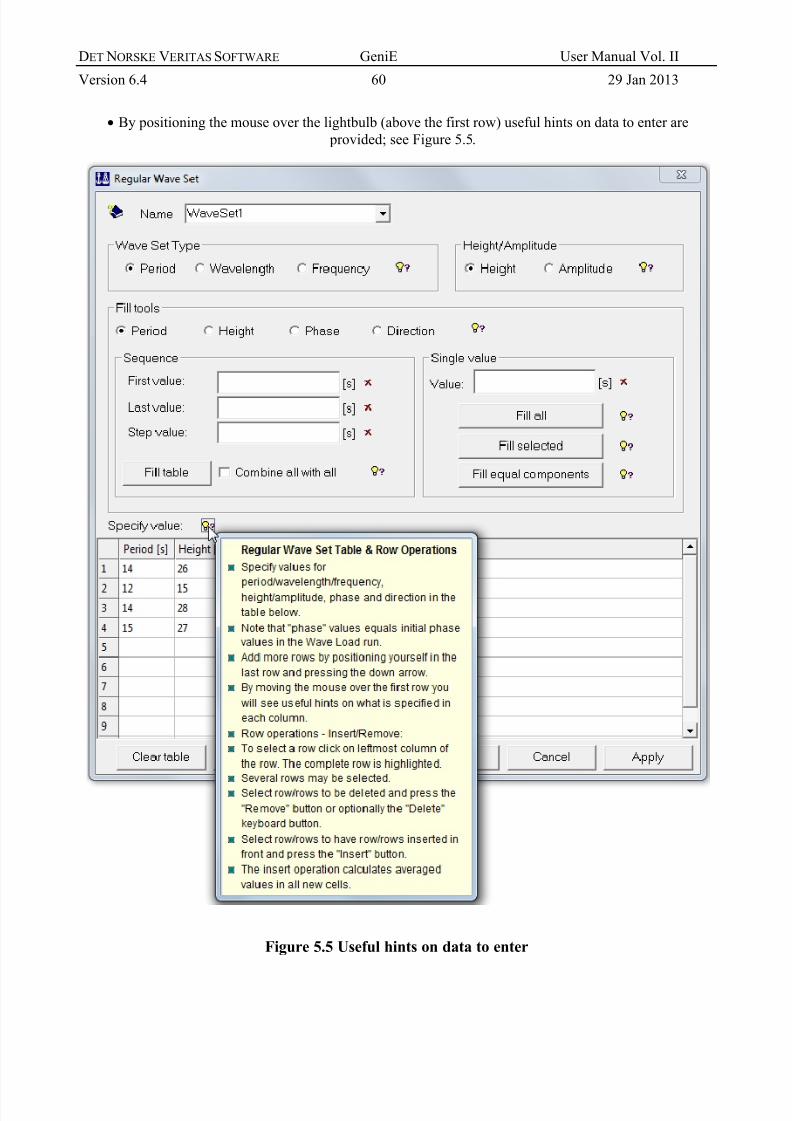
8/14/2019 Genie User Manual Volume 2
http://slidepdf.com/reader/full/genie-user-manual-volume-2 64/121
DET NORSKE VERITAS SOFTWARE GeniE User Manual Vol. II
Version 6.4 60 29 Jan 2013
By positioning the mouse over the lightbulb (above the first row) useful hints on data to enter are
provided; see Figure 5.5.
Figure 5.5 Useful hints on data to enter

8/14/2019 Genie User Manual Volume 2
http://slidepdf.com/reader/full/genie-user-manual-volume-2 65/121
DET NORSKE VERITAS SOFTWARE GeniE User Manual Vol. II
Version 6.4 61 29 Jan 2013
5.2 The Environment
The environment data describes the environmental part of an analysis, e.g. wind, current, waves andsea depth in addition to constants like gravity and water density. The data consists of the following
main data types: Location, Directions, Air, Water and Soil. Soil is, however, not relevant for wave
load analysis.
5.2.1 Location
A location defines the environmental features at the site of the structure. It is natural to define a
location as the first task when building the environment model.
The Location dialog appears with modifiable default values. It includes three tabs: Air, Water and
Soil. Values in the Air tab normally remain unchanged. The Waterline Z value in the Water tab andthe Seabed Z value in the Soil tabs normally need to be modified. These values are given in the
model (global) coordinate system.
When the location is created the layers and borders appear in the graphical window, as shown in
Figure 3.2. Colours, transparencies and whether an object is visible or not are easily modified by the
Location selection button . By default the air layer is invisible as this often extends far above the
structure.
By using the Location selection button functionality the visibility is easily turned off.
When selecting parts of the structure the water layer might also be removed. Note,
however, that the ‘Modelling - Structure’ and ‘Modelling - Transparent’ display
configurations by default do not include the Location (air, water and soil). Read about changing and
making new display configurations (model views) through the View Options dialog in the GeniE
User Manual Vol. 1, Section 3.1.
Figure 5.6 The Create/Edit Location > Air dialog

8/14/2019 Genie User Manual Volume 2
http://slidepdf.com/reader/full/genie-user-manual-volume-2 66/121
DET NORSKE VERITAS SOFTWARE GeniE User Manual Vol. II
Version 6.4 62 29 Jan 2013
Soil
Seabed Z is the unscoured mudline given in the global coordinate system.
Seabed delta is a property used for defining scour.
Z Bottom of each layer is given in the global coordinate system (NOT as distance to mudline). The layersmust be entered in order of decreasing Z.
Soil Type is a property with soil type and principal characteristics.
Soil Curves is a property which controls the generation of P-Y/T-Z/Q-Z curves
Soil Data is property with additional soil characteristics.
Sublayers is the number of subdivisions of each layer. The number of sublayers controls the number of
nodes along the pile. Enter values so that you get a fine mesh near the soil surface.
Figure 5.7 The Create/Edit Location > Soil dialog

8/14/2019 Genie User Manual Volume 2
http://slidepdf.com/reader/full/genie-user-manual-volume-2 67/121
DET NORSKE VERITAS SOFTWARE GeniE User Manual Vol. II
Version 6.4 63 29 Jan 2013
5.2.2 Directions
There are two types of direction data: a single direction and a set of directions. Only the set is relevant for
wave load analysis.
Direction sets are used for defining a range of wave propagation directions. Specify angles between positivex-axis and direction of wave propagation.
In a wave load analysis it is optional. It may be used for defining a Wave Load Condition either of type
Deterministic Time (Figure 5.17) . Frequency Domain analysis is not available in this version of GeniE.
Figure 5.8 The Create/Edit Direction > Direction Set dialog

8/14/2019 Genie User Manual Volume 2
http://slidepdf.com/reader/full/genie-user-manual-volume-2 68/121
DET NORSKE VERITAS SOFTWARE GeniE User Manual Vol. II
Version 6.4 64 29 Jan 2013
5.2.3 Air
Wind profile is the only air data type. It must be defined if wind loads are to be calculated.
Three different wind profile formulae may be selected: General, Normal, Extreme and Extreme API 21.
They correspond to equations 2.28-2.31 in the Wajac User Manual.The Direction relative to x-axis option is default. However, by using the Direction relative to wave heading
option and setting Wind direction to 0 degrees the wind is aligned with the wave heading. In many cases it
will then be sufficient to define a single wind profile.
In a wave load analysis it may be used when defining a Wave Load Condition of type Deterministic Time
(Figure 5.17).
Figure 5.9 The Create/Edit Wind Profile dialog

8/14/2019 Genie User Manual Volume 2
http://slidepdf.com/reader/full/genie-user-manual-volume-2 69/121
DET NORSKE VERITAS SOFTWARE GeniE User Manual Vol. II
Version 6.4 65 29 Jan 2013
5.2.4 Water
The following types of water data are relevant for wave load analysis: current profile, frequency (period)
set, phase set, wave height set, wave height function, regular wave set and wave spectra (Jonswap 3
parameter, Jonswap 5 parameter, Bretschneider and Pierson-Moskowitz).
Current Profile
In the dialog the Direction along wave heading option is default. However, by using the Direction along
wave heading option the current is aligned with the wave heading. In many cases it will then be sufficient to
define a single current profile.
The elevations must be given in sequence of decreasing Z-values and the Z-value is always 0 at the sea
surface and decreasing downwards.
In a wave load analysis a current profile may be used when defining a Wave Load Condition (Figure 5.17).
Figure 5.10 The Create/Edit Current Profile dialog

8/14/2019 Genie User Manual Volume 2
http://slidepdf.com/reader/full/genie-user-manual-volume-2 70/121
DET NORSKE VERITAS SOFTWARE GeniE User Manual Vol. II
Version 6.4 66 29 Jan 2013
Frequency Set
The dialog has three options: Period, Wavelength and Frequency. The Wavelength option is illegal in this
context. For a wave load analysis Period is the normal choice. However, if Frequency data is used it will be
converted to Period in the Edit Wave Load Run dialog (Figure 5.17).
In a wave load analysis a frequency set may be used when defining a Wave Load Condition (Figure 5.17).
Figure 5.11 The Frequency Set dialog

8/14/2019 Genie User Manual Volume 2
http://slidepdf.com/reader/full/genie-user-manual-volume-2 71/121
DET NORSKE VERITAS SOFTWARE GeniE User Manual Vol. II
Version 6.4 67 29 Jan 2013
Phase Angles Set
The phase angles will serve as initial phase angles in the seastates defined in the Edit Wave Load Run dialog
(Figure 5.43).
In the Wave Load Condition dialog (Figure 5.17) the default behaviour is that no phase angle set is selectedin which case the initial phase angle is 0.0 degrees. If the initial phase angle should have another value or
more values then a set must be defined and selected.
In a wave load analysis a phase angle set may be used when defining a Wave Load Condition.
Figure 5.12 The Phase Angles Set dialog

8/14/2019 Genie User Manual Volume 2
http://slidepdf.com/reader/full/genie-user-manual-volume-2 72/121
DET NORSKE VERITAS SOFTWARE GeniE User Manual Vol. II
Version 6.4 68 29 Jan 2013
Wave Height Set
In a wave load analysis a wave height set may be used when defining a Wave Load Condition (Figure 5.17).
Figure 5.13 The Create/Edit Wave Height > Wave Height Set dialog

8/14/2019 Genie User Manual Volume 2
http://slidepdf.com/reader/full/genie-user-manual-volume-2 73/121
DET NORSKE VERITAS SOFTWARE GeniE User Manual Vol. II
Version 6.4 69 29 Jan 2013
Wave Height Function
In a wave load analysis a wave height function may be used when defining a Wave Load Condition (Figure
5.17).
Figure 5.14 The Create/Edit Wave Height > Wave Height Function dialog

8/14/2019 Genie User Manual Volume 2
http://slidepdf.com/reader/full/genie-user-manual-volume-2 74/121

8/14/2019 Genie User Manual Volume 2
http://slidepdf.com/reader/full/genie-user-manual-volume-2 75/121
DET NORSKE VERITAS SOFTWARE GeniE User Manual Vol. II
Version 6.4 71 29 Jan 2013
For each time a Fill button is clicked the table is updated.
Phase values equals initial phase values in the wave load run.
Sequence area:
Each time the Fill table button is clicked the sequence of values specified will be appended to the values
already existing in the selected column.
If Combine all with all is ticked then N times M rows are generated, N is the number of rows before the
fill and M is the number of values in the sequence.
Single value area:
All rows will be filled with the single value when the Fill all button is clicked.
Selected rows will be filled with the single value when the Fill selected button is clicked.
To use the Fill equal components button it is necessary to select a cell that contains a value that will be
used for selecting relevant rows.
For more information use the icons.
A regular wave set may be used when defining a Wave Load Condition (Figure 5.17).

8/14/2019 Genie User Manual Volume 2
http://slidepdf.com/reader/full/genie-user-manual-volume-2 76/121
DET NORSKE VERITAS SOFTWARE GeniE User Manual Vol. II
Version 6.4 72 29 Jan 2013
Wave Load Condition
The Wave Load Condition dialog has two modes: Deterministic Time and Frequency Domain. This reflects
what type of wave load calculation the condition will be used for: Deterministic time means that the data set will be used in a deterministic load calculation.
Frequency domain means that the data set will be used to calculate transfer functions
Note: Frequency domain is not available in this version of GeniE.
A Wave Load Condition will be used in the Edit Wave Load Run dialog (Figure 5.43).
Deterministic time mode
The dialog offers a flexible way to define wave components with additional properties, i.e. environmental
properties necessary for doing a Wave Load deterministic time run. Initially, the wave components are
defined by using the Wave Components area. Thereafter, properties are added to each component either by
using functions in the Assign wave component properties area or by manually entering properties by using
comboboxes inside the table. The Period, Height, Phase and Direction columns are locked. This is done to
force the user to update the original data objects and thus secure data consistency throughout the model.
The Wave components area is for defining wave component data. The relevant comboboxes will contain all
existing objects of that type plus an option to define new objects.
Either use a Regular Wave Set or a combination of Direction Set, Frequency (Period) Set, Phase Angle Set
(optional) and Wave Height Set/Function.
The values of the phase set are the initial phase values in the wave load run.
If a phase set is not selected the phase values are 0.0.
The size of the table will be the product of the size of each of the sets.
If a Wave Height Function is selected this will not contribute to the table size. The actual wave periods are
calculated by interpolation of the wave height function.
The Wave components with properties area is for properties that may be assigned to a wave component.
Such properties are current profile, wind profile and wave model. The only mandatory property is wave
model. The wave model combobox has the following options: Airy, CalmSea, Cnoidal, Stokes’ 5th and
Dean’s stream function. In the last case the order must be given as an integer between 1 and 24.
Properties may be assigned in several ways, and several properties can be filled at the same time.
What properties to fill, current profile/wind profile/wave model, are controlled by the respective check
boxes.
If Stream function is selected for Wave model the order must be given as well.
Each time a Fill button is clicked the table in the Wave components with properties area is updated.
Calm sea is specified by appending a row with no values for period, height, phase and direction. The
Wave model is specified as CalmSea.
The calm sea row(s) must follow after the rows containing wave data.
For an explanation of how the Fill all, Fill selected and Fill equal buttons function see the Regular Wave
Set dialog (Figure 5.17).

8/14/2019 Genie User Manual Volume 2
http://slidepdf.com/reader/full/genie-user-manual-volume-2 77/121

8/14/2019 Genie User Manual Volume 2
http://slidepdf.com/reader/full/genie-user-manual-volume-2 78/121

8/14/2019 Genie User Manual Volume 2
http://slidepdf.com/reader/full/genie-user-manual-volume-2 79/121
DET NORSKE VERITAS SOFTWARE GeniE User Manual Vol. II
Version 6.4 75 29 Jan 2013
Create Soil - Sand
Figure 5.20 The Create/Edit Soil > Sand dialog
Angle of internal friction given in degrees
Mass density corresponding to the total unit weight
Code for open gap (if checked, otherwise closed gap is assumed) behaviour for cases where either
reversed loading takes place or where an open hole is specified
Over-consolidation ratio, i.e. ratio of maximum previous vertical stress to present vertical stress. The value
is used by the DNV code to distinguish normally and overly consolidated clays.
Skin friction:
The two values are used to describe a reduction in skin friction against the pile after the peak value has been reached. The values are used in connection with T-Z codes 103, 200 and 293 only.
Residual/peak skin friction ratio is the ratio between residual skin friction (at large strains) and peak skin
friction.
T-Z curve Z displacement from peak (skin friction) to residual skin friction.

8/14/2019 Genie User Manual Volume 2
http://slidepdf.com/reader/full/genie-user-manual-volume-2 80/121
DET NORSKE VERITAS SOFTWARE GeniE User Manual Vol. II
Version 6.4 76 29 Jan 2013
Create Soil – Clay
Figure 5.21 The Create/Edit Soil > Clay dialog
Undrained shear strength at Z1 = 0 and at Z2 = −100 valid for the present soil type. At elevation Z the su
value is given by:
su(Z) = su(Z1) + (su(Z2) – su(Z1)) *Z /(Z2-Z1)
Mass density corresponding to the total unit weight
Strain at half of max stress for laboratory undrained compression tests carried out on undisturbed soil
samples. This value is required both by the API and the DNV codes.
J factor for API – J factor required by the API code to find the depth of the reduced resistance zone. API
recommends a value of 0.25 to 0.50.
Code for open gap (if checked, otherwise closed gap is assumed) behaviour for cases where either
reversed loading takes place or where an open hole is specified
Over-consolidation ratio, i.e. ratio of maximum previous vertical stress to present vertical stress. The value
is used by the DNV code to distinguish normally and overly consolidated clays.

8/14/2019 Genie User Manual Volume 2
http://slidepdf.com/reader/full/genie-user-manual-volume-2 81/121
DET NORSKE VERITAS SOFTWARE GeniE User Manual Vol. II
Version 6.4 77 29 Jan 2013
Skin friction:
The two values are used to describe a reduction in skin friction against the pile after the peak value has been
reached. The values are used in connection with T-Z codes 103, 200 and 293 only.
Residual/peak skin friction ratio i.e. Ratio between residual skin friction (at large strains) and peak skinfriction.
T-Z curve Z displacement from peak (skin friction) to residual skin friction
Soil Curves
Figure 5.22 The Create/Edit Soil Properties > Soil curves dialog
P-Y curve types
o pyManual – Manual input of p and y values for each layer and pile diameter (p-y code 0).
o pyAutoLinear Automatic generation – linear (p-y code 100).

8/14/2019 Genie User Manual Volume 2
http://slidepdf.com/reader/full/genie-user-manual-volume-2 82/121
DET NORSKE VERITAS SOFTWARE GeniE User Manual Vol. II
Version 6.4 78 29 Jan 2013
o pyAutoBilinear Automatic generation – bilinear (p-y code 101).
o pyAutoTrilinear Automatic generation – trilinear (p-y code 102).
o Automatic generation using a set of simple rules. The p max value is calculated from J.
Brinch Hansen (1961) earth pressure theory, displacement y to reach p max is set to 0.1times pile diameter. All p y curves pass through this point, the value of N determines curve
shape.
o pyAPI1984 – p-y data will be generated by the API 1984 edition rules (p-y code: 284).
o pyAPI1987 – p-y data will be generated by the API 1987 edition rules (p-y code: 287).
o pyDNV1980 – p-y data will be generated by the DNV 1980 edition rules (p-y code: 380).
o pyISO2004 – p-y data will be generated by the ISO2004 draft rules (p-y code: 404).
T-Z curve types
o tzManual – Manual input of t and z values for each layer and pile diameter (t-z code 0).
o tzAutoLinear Automatic generation – linear (t-z code 100).
o tzAutoBilinear Automatic generation – bilinear (t-z code 101).
o tzAutoTrilinear Automatic generation – trilinear (t-z code 102).
o tzKraft – t-z data will be generated by the Kraft et al. (1981) procedures. Required soil
parameters were given in the soil type and skin friction tables (t-z code 100).
o tzAPI1993 – t-z data will be generated by API-1993 procedures (t-z code 293).
Q-Z curve types
o qzManual – Manual input of q and z values for each layer and pile diameter (q-z code 0).
o qzAutoLinear Automatic generation – linear (q-z code 100).
o qzAutoBilinear Automatic generation – bilinear (q-z code 101).
o qzAutoTrilinear Automatic generation – trilinear (q-z code 102).
o Automatic generation as for p-y and t-z above. The q max value was given as SIG-TIP and
the required displacement as DSPQZ/DIAM.
o qzElasticTheory – A bilinear q-z curve is generated. Maximum tip stress is taken as SIG-
TIP. Required displacement to develop SIG-TIP is calculated from elastic half space theory
using the GOSOIL and POIS values given (q-z code 200).
o qzAPI1993 – q-z data will be generated by API-1993 procedures (q-z code 293)

8/14/2019 Genie User Manual Volume 2
http://slidepdf.com/reader/full/genie-user-manual-volume-2 83/121
DET NORSKE VERITAS SOFTWARE GeniE User Manual Vol. II
Version 6.4 79 29 Jan 2013
Soil Data
Figure 5.23 The Create/Edit Soil Properties > Soil Data dialog
Initial value of soil shear modulus – Used to calculate the initial slope of the t-z curves and the q-z curves
for the case of codes 200.
Soil Poisson’s ratio – Used together with GO-SOIL to determine a modulus of elasticity for the calculation
of initial slope of q-z curves for codes 200.
Skin friction.
Peak skin friction in compression.
Peak skin friction in tension
Ratio between displacement to reach peak skin friction and pile diameter – Used to find initial t-z slopesfor codes 100.
Tip resistance
Peak tip stress acting at pile tip. This value may be governed either by soil strength or by the capacity of
the internal soil plug in the case of an open ended pile.
Ratio between displacement to reach peak tip stress and pile diameter – Used to find initial slope of q-z
curves for codes 100.
5.3 The Hydro PropertiesThe hydro properties are listed in Table 5.1. To take effect in a wave load analysis a property must be
assigned to a part of or the complete structure.

8/14/2019 Genie User Manual Volume 2
http://slidepdf.com/reader/full/genie-user-manual-volume-2 84/121
DET NORSKE VERITAS SOFTWARE GeniE User Manual Vol. II
Version 6.4 80 29 Jan 2013
The properties Morison, Air Drag and Marine Growth may be functions of one or more of the variables
Reynolds number, KC number, roughness, diameter and Z level. These methods of definition are
categorized as A or B as shown by Table 5.1. Either one or both of these categories may be used for a
certain property. However, you are not allowed to use two different methods of definition of the same
category. For example, you may define the Morison property both as a constant and as a function ofdiameter but you cannot define it as function of both Rn and diameter.
For some of the properties only one property of that type can be defined and assigned to the structure, e.g.
Morison coefficients as a function of the diameter. This means that it is not possible to define for instance
two different functions describing the Morison coefficient as a function of the diameter and then assign
them to different parts of the structure.
Table 5.1 Hydro properties
Type of property Category Mandatory / Optional Number of properties
Morison, constant value
Morison, f(Rn,Rough)
Morison, f(KC,Rough)
Morison, f(Diameter)
Morison by rule
A
B
B
B
B
Mandatory for the wet part
Arbitrary
1
1
1
1
Air Drag, constant value
Air Drag, f(Rn)
A
B
Mandatory for the dry part
when calculating wind loads
Arbitrary
1
Hydrodynamic Diameter Optional Arbitrary
Flooding Optional Arbitrary
Marine Growth, constant
Marine Growth, f(Z)
A
B Optional
Arbitrary
Arbitrary
Element Refinement Optional Arbitrary
Conductor Shielding Optional Arbitrary

8/14/2019 Genie User Manual Volume 2
http://slidepdf.com/reader/full/genie-user-manual-volume-2 85/121
DET NORSKE VERITAS SOFTWARE GeniE User Manual Vol. II
Version 6.4 81 29 Jan 2013
The optional properties Flooding and Element Refinement will be set by Wajac even if they are not
explicitly assigned in GeniE. If no flooding property is assigned then Wajac will consider the structure to be
nonflooded. If no refinement property is assigned Wajac will use a refinement factor of 1.0. How to apply a
property to the structure is described in the GeniE User Manual Vol. 1.
Note: In Wajac it is possible to specify a Constant Morison Coefficients value between two Z levelsby using the COEF command. In GeniE this will be handled by assigning the constant
Morison coefficient property (Figure 5.25) to the part of the structure between these two Z
levels. The COEF command will, therefore, never be generated by GeniE. This way of
assigning a property is also valid for all ‘constant value’ hydro properties.
Note: Relevant parts of the structure must be selectable either as a predefined set or by rubberband
selection. This in turn implies that the user must have the wave load analysis in mind in the
modelling process, e.g. by splitting the structure at relevant Z-levels. Below is an example of
how two marine growth properties are assigned to different levels. There is also an example
showing a flooding property assigned to the flooded members.
Figure 5.24 Examples of assignment of hydro properties
Define Constant Morison Coefficients
The drag and inertia values are given in the element local system. Any number of this property may be
defined and assigned to different parts of the structure. If some other Morison property than Constant is
defined and assigned an overlapping part of the structure then the constant property will take precedence.

8/14/2019 Genie User Manual Volume 2
http://slidepdf.com/reader/full/genie-user-manual-volume-2 86/121
DET NORSKE VERITAS SOFTWARE GeniE User Manual Vol. II
Version 6.4 82 29 Jan 2013
Note: Wajac will not use a Morison property that is assigned to the dry part of the structure.
Morison Coefficients properties may, therefore, be assigned to the complete structure.
Note: The longitudinal coefficients Cdx and Cmx will only be used when calculating total structuralloads as reported on the Wajac print file. No longitudinal force components will be written to
the Loads Interface Files.
Figure 5.25 The Create/Edit Hydro Property > Morison > Constant dialog
Define Morison coefficients by Rule
If this type of Morison coefficient property is assigned then the Rule tab of the Edit Wave Load Run dialog
(Figure 5.45) must be set to API rules. Only one such property may be assigned.
Figure 5.26 The Create/Edit Hydro Property > Morison > By Rule dialog

8/14/2019 Genie User Manual Volume 2
http://slidepdf.com/reader/full/genie-user-manual-volume-2 87/121
DET NORSKE VERITAS SOFTWARE GeniE User Manual Vol. II
Version 6.4 83 29 Jan 2013
Define Morison coefficients as function of diameter
Specify member diameter and corresponding normal component of hydrodynamic drag and inertia.
Note: The member diameter should include specified marine growth and member diameters should
be specified in increasing order.Note: The user should specify the entire range of diameters in the given structure. If a member
diameter is outside the specified range the value closest to the diameter under consideration
will be used. Wajac can handle a maximum of 12 diameter values. Only one such property
may be assigned to the structure.
Figure 5.27 The Create/Edit Hydro Property > Morison > Function of Diameter dialog

8/14/2019 Genie User Manual Volume 2
http://slidepdf.com/reader/full/genie-user-manual-volume-2 88/121
DET NORSKE VERITAS SOFTWARE GeniE User Manual Vol. II
Version 6.4 84 29 Jan 2013
Define Morison coefficients as function of roughness and Reynolds number
The dialog has a Fill tool area. This will help the user define this property that is characterised by a number
of roughness-value graphs consisting of KC/ Reynolds numbers as illustrated in Figure 5.28.
Figure 5.28 Morison Coefficients as function of roughness and KC number
This property is not applicable for seastate simulations or for calculation of transfer functions using
equivalent linearisation. The command should not be used together with the API command.Fill tool area:
The number of rows for each roughness number must be given in the Repetitions column.
When the Fill table button is clicked roughness numbers are automatically filled in the Morison
Coefficient Function Table.
Wajac can handle a maximum of 5 different roughness numbers.
Morison Coefficient Function Table:
Specify Reynolds number and corresponding normal component of hydrodynamic drag and inertia.
Reynolds numbers within one roughness number should be specified in increasing order.
Wajac can handle a maximum of 9 Reynolds numbers for each roughness property.
Only one such property may be assigned to the structure.
The user should specify the entire range of Reynolds- and/or Keulegan-Carpenter numbers that will apply to
the analysis. If the value at a load calculation point is outside the specified range the coefficient specified for
the closest number will be used.

8/14/2019 Genie User Manual Volume 2
http://slidepdf.com/reader/full/genie-user-manual-volume-2 89/121
DET NORSKE VERITAS SOFTWARE GeniE User Manual Vol. II
Version 6.4 85 29 Jan 2013
Figure 5.29 The Create/Edit Hydro Property > Morison >
Function of Roughness/Reynoldsnumber dialog

8/14/2019 Genie User Manual Volume 2
http://slidepdf.com/reader/full/genie-user-manual-volume-2 90/121
DET NORSKE VERITAS SOFTWARE GeniE User Manual Vol. II
Version 6.4 86 29 Jan 2013
Define Morison coefficients as function of roughness and Keulegan-Carpenter (KC) number
This property is defined in a way as explained above in Define Morison coefficients as function of
roughness and Reynolds number.
Figure 5.30 The Create/Edit Hydro Property > Morison > Function of Roughness/KC number dialog

8/14/2019 Genie User Manual Volume 2
http://slidepdf.com/reader/full/genie-user-manual-volume-2 91/121
DET NORSKE VERITAS SOFTWARE GeniE User Manual Vol. II
Version 6.4 87 29 Jan 2013
Define Flooding
Any number of this property may be assigned. It should be assigned to the wet and flooded part of the
structure.
Note: If no flooding property is assigned Wajac assumes the structure to be non-flooded.Wajac accepts only completely flooded (Flooding = 1) or non-flooded (Flooding = 0). Any other value will
be converted to the nearest of the two. For a beam defined as flooded only the steel volume will contribute
to the buoyancy.
Figure 5.31 The Create/Edit Hydro Property > Flooding dialog

8/14/2019 Genie User Manual Volume 2
http://slidepdf.com/reader/full/genie-user-manual-volume-2 92/121
DET NORSKE VERITAS SOFTWARE GeniE User Manual Vol. II
Version 6.4 88 29 Jan 2013
Define Constant Air Drag Coefficients
The air drag values are given in the element local system. Any number of this property may be defined and
assigned to different parts of the structure. If the Air Drag as function of Reynolds number property is
defined and assigned to an overlapping part of the structure then the constant property will take precedence.
Note: Wajac will not use an Air Drag property that is assigned to the part of the structure below the
SWL (still water level). Air Drag Coefficients properties may, therefore, be assigned to the
complete structure.
Note: If the Prepare for gust wind induced fatigue option is selected in the Edit Wave Load Run
dialog (Figure 5.43) then Cdx must be equal to Cdz.
Figure 5.32 The Create/Edit Hydro Property > Air Drag > Constant dialog

8/14/2019 Genie User Manual Volume 2
http://slidepdf.com/reader/full/genie-user-manual-volume-2 93/121
DET NORSKE VERITAS SOFTWARE GeniE User Manual Vol. II
Version 6.4 89 29 Jan 2013
Define Air Drag coefficients as function of Reynolds number
Specify air drag coefficients as a function of Reynolds number in the element local coordinate system.
Reynolds numbers should be specified in increasing order.
The user should specify the entire range of Reynolds numbers that will apply to the analysis. If the value at aload calculation point is outside the specified range the coefficient specified for the closest number will be
used.
Note: Wajac can handle a maximum of 21 Reynolds numbers.
Note: If the Prepare for gust wind induced fatigue option is selected in the Edit Wave Load Run
dialog (Figure 5.43) then each Cdx must be equal to the corresponding Cdz.
Only one such property may be assigned. It may be assigned to the complete structure but preferably only to
the dry part.
Figure 5.33 The Create/Edit Hydro Property > Air Drag > Function of Reynolds number dialog

8/14/2019 Genie User Manual Volume 2
http://slidepdf.com/reader/full/genie-user-manual-volume-2 94/121
DET NORSKE VERITAS SOFTWARE GeniE User Manual Vol. II
Version 6.4 90 29 Jan 2013
Define Constant Marine Growth
Any number of this property may be defined and assigned to the wet part of the structure. If the Marine
Growth as function of Z-level property is defined and assigned to an overlapping part of the structure then
the constant property will take precedence.
Note: Wajac will not use a Marine Growth property that is assigned to the dry part of the structure.
Marine Growth properties may, therefore, be assigned to the complete structure.
Marine growth thickness is specified as an additional thickness. The marine growth times two will be added
to the beam cross sectional diameter (equivalent diameter for non-pipe sections) before calculating the drag
forces and, optionally, the inertia forces and added mass at load calculation points within the specified
range. The roughness height is used to determine the roughness number (= roughness height / diameter)
which in turn is used to specify varying hydrodynamic coefficients. The density factor contributes to the
marine growth density (MGD) as MGD = ‘density factor’*RHO, where RHO is the water density. An
increase in the marine growth density will reduce the buoyancy and increase the added mass (used in
structural dynamics).
Figure 5.34 The Create/Edit Hydro Property > Marine Growth > Constant dialog

8/14/2019 Genie User Manual Volume 2
http://slidepdf.com/reader/full/genie-user-manual-volume-2 95/121
DET NORSKE VERITAS SOFTWARE GeniE User Manual Vol. II
Version 6.4 91 29 Jan 2013
Define Marine Growth coefficients as function of Z-level
Specify Z level and corresponding thickness, roughness height and density factor. The Z-coordinates
are zero at the still water level and the Z-axis points upwards.
Note: The elevations must be given in sequence of decreasing Z-values.
The thickness, roughness height and density factor values are explained above in Define Constant
Marine Growth. An arbitrary number of such properties may be assigned. It may be assigned to the
complete structure but the Z-levels should be restricted to the wet part.
Figure 5.35 The Create/Edit Hydro Property > Marine Growth > Function of Z-level dialog
Define Element Refinement
The following information is needed when defining this property.
Refinement coefficient:
The default value is 1.0 and equals the default value of Wajac. The default value involves that only
members longer than three times the wave length will be split into three or more segments.
Irrespective of the refinement coefficient value the number of subelements will be minimum 2 and
maximum 20.
Value 0.0 is illegal. However, by letting the refinement coefficient be close to zero, the number of
subelements will most likely be equal to the minimum value.

8/14/2019 Genie User Manual Volume 2
http://slidepdf.com/reader/full/genie-user-manual-volume-2 96/121
DET NORSKE VERITAS SOFTWARE GeniE User Manual Vol. II
Version 6.4 92 29 Jan 2013
Maximum/Minimum subelement length:
The default value is 0.0. Wajac will ignore this value.
The maximum subelement length is 1/2 of the element length.
The minimum subelement length is 1/20 of the element length.
The number of segments in each member is controlled by
Number of segments =SEG · Member length
Wave length
Number of segments
where SEG is the refinement coefficient.
Normally, high refinement is preferred close to the water surface where the variation in wave loads is high
and low refinement is preferred close to seabed. The refinement property may be skipped since Wajac
handles the refinement by default. Only in special cases demanding a high accuracy of the wave loads an
element refinement higher than default need to be defined.
Note: An increased element refinement increases the size of the Loads Interface File and the Results
Interface File.
An arbitrary number of such properties may be assigned. The Element Refinement property should be
assigned in the same way as Constant Morison coefficients, i.e. between two Z-levels.
Figure 5.36 The Create/Edit Hydro Property > Element Refinement dialog

8/14/2019 Genie User Manual Volume 2
http://slidepdf.com/reader/full/genie-user-manual-volume-2 97/121
DET NORSKE VERITAS SOFTWARE GeniE User Manual Vol. II
Version 6.4 93 29 Jan 2013
Define Hydrodynamic Diameter
An arbitrary number of such properties may be assigned. These properties may be assigned to the complete
structure.
The hydrodynamic diameter will be used for the structural parts it is assigned to as a replacement for thedefault value.
For a pipe cross section the default value is the outer diameter.
For non-circular cross sections the default value is the largest cross sectional dimension termed the
‘equivalent diameter’.
Diameters defined by this command have no effect on the buoyancy calculations.
Figure 5.37 The Create/Edit Hydro Property > Hydrodynamic Diameter dialog

8/14/2019 Genie User Manual Volume 2
http://slidepdf.com/reader/full/genie-user-manual-volume-2 98/121
DET NORSKE VERITAS SOFTWARE GeniE User Manual Vol. II
Version 6.4 94 29 Jan 2013
Define Conductor Shielding
An arbitrary number of such properties may be assigned. These properties may be assigned to the complete
structure.
The averaged centre to centre distance between conductors is given in global X- and Y-directions.
The distances are used to calculate shielding factors (by Wajac).
It will take effect on specified and calculated drag and inertia coefficients for all elements for which this
property has been assigned.
Figure 5.38 The Create/Edit Hydro Property > Conductor Shielding dialog

8/14/2019 Genie User Manual Volume 2
http://slidepdf.com/reader/full/genie-user-manual-volume-2 99/121
DET NORSKE VERITAS SOFTWARE GeniE User Manual Vol. II
Version 6.4 95 29 Jan 2013
5.4 The Wave Load Analysis
A wave load analysis may either be a stand-alone activity or combined with a linear structural analysis or a
structure-pile-soil analysis. An activity consists of several steps of which one is the Wave Load Analysis.
5.4.1 The Analysis Activity
The activity defines the relevant steps of which one is the Wave Load Analysis.
To perform a Design Wave Analysis an activity must first be created. There are three wave load related
activities available: Wave Load, Wave Load + Linear Sestra Analysis and Wave Load + Pile Soil Analysis.
To create an activity right-click the Analysis > Activities folder and select New Analysis. In the dialog that
appears the Linear Structural Analysis option is already selected. Tick the wanted analysis and select an
existing wave load condition in the Wave Load Condition combobox.
Figure 5.39 The Create Analysis dialog
When the Edit Wave Load Run is complete the Activity Monitor is used to determine analysis steps to be
executed. Right-click the Analysis > Activities > Analysis1 object and select Activity Monitor. The Activity
Monitor dialog (Figure 5.40) appears.
Features of the Activity Monitor dialog are:
All activities selected in the list will be executed when the Start button is clicked.
Right-click an activity to edit the activity.
Right-click an activity to access result files and other relevant actions.
The Start button starts the execution.
Before starting the execution complete the definition of the Wave Load Analysis activity. Open the Edit
Wave Load Run dialog by right-clicking activity 1.2 and selecting Edit activity.
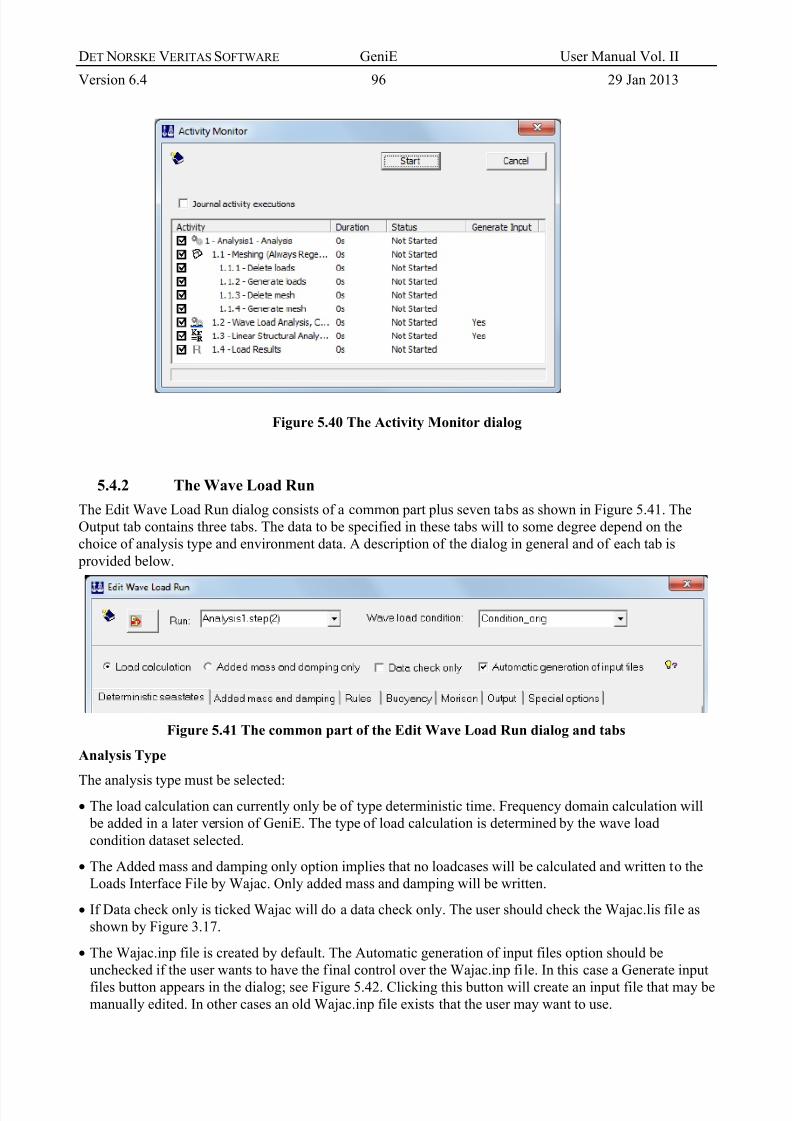
8/14/2019 Genie User Manual Volume 2
http://slidepdf.com/reader/full/genie-user-manual-volume-2 100/121
DET NORSKE VERITAS SOFTWARE GeniE User Manual Vol. II
Version 6.4 96 29 Jan 2013
Figure 5.40 The Activity Monitor dialog
5.4.2 The Wave Load Run
The Edit Wave Load Run dialog consists of a common part plus seven tabs as shown in Figure 5.41. The
Output tab contains three tabs. The data to be specified in these tabs will to some degree depend on the
choice of analysis type and environment data. A description of the dialog in general and of each tab is
provided below.
Figure 5.41 The common part of the Edit Wave Load Run dialog and tabs
Analysis Type
The analysis type must be selected: The load calculation can currently only be of type deterministic time. Frequency domain calculation will
be added in a later version of GeniE. The type of load calculation is determined by the wave load
condition dataset selected.
The Added mass and damping only option implies that no loadcases will be calculated and written to the
Loads Interface File by Wajac. Only added mass and damping will be written.
If Data check only is ticked Wajac will do a data check only. The user should check the Wajac.lis file as
shown by Figure 3.17.
The Wajac.inp file is created by default. The Automatic generation of input files option should be
unchecked if the user wants to have the final control over the Wajac.inp file. In this case a Generate input
files button appears in the dialog; see Figure 5.42. Clicking this button will create an input file that may bemanually edited. In other cases an old Wajac.inp file exists that the user may want to use.

8/14/2019 Genie User Manual Volume 2
http://slidepdf.com/reader/full/genie-user-manual-volume-2 101/121
DET NORSKE VERITAS SOFTWARE GeniE User Manual Vol. II
Version 6.4 97 29 Jan 2013
Figure 5.42 The common part of the Edit Wave Load Run dialog, plus all tabs
The Deterministic seastates tab
This tab is only relevant when doing a Deterministic Time analysis. The seastate table is automatically filled
with wave, current and wind data from the wave load condition selected. These values are not modifiable.
The user must specify whether time, phase or single step should be used. This will apply to all seastates of a
run. The Phase step option is default. If Time step option is selected then the Phase column of the seastate
table changes to a Time column. If Single step is ticked the following happens:
Irrelevant options in the Seastates table parameters area are disabled.
Three columns of the seastate table are disabled: Step length, Num. steps and Design load.
Default values are filled into disabled cells.
The Prepare for gust wind induced fatigue checkbox is enabled.
Note: If a seastate has a CalmSea wave model the following columns are disabled: Stretching, Step
length, Num. steps, Design load and Wave k. fac. They are all given default values.

8/14/2019 Genie User Manual Volume 2
http://slidepdf.com/reader/full/genie-user-manual-volume-2 102/121

8/14/2019 Genie User Manual Volume 2
http://slidepdf.com/reader/full/genie-user-manual-volume-2 103/121
DET NORSKE VERITAS SOFTWARE GeniE User Manual Vol. II
Version 6.4 99 29 Jan 2013
Figure 5.43 Deterministic seastates tab
The Added mass and damping tab
Added mass and damping are calculated and written to the Loads Interface File independently of the choice
of load calculation type. The default value is not to calculate added mass and damping.
Include internal water option involves that added mass is written to the Loads Interface File including
internal water in flooded members.
The Use C_m=2.0 option involves that C_m = 2.0 (added mass coefficient = 1.0) is used for all elements
irrespective of the Cm values used in the force calculation.
Figure 5.44 Added mass and damping tab

8/14/2019 Genie User Manual Volume 2
http://slidepdf.com/reader/full/genie-user-manual-volume-2 104/121
DET NORSKE VERITAS SOFTWARE GeniE User Manual Vol. II
Version 6.4 100 29 Jan 2013
The Rules tab
None is the default option. If API is selected the following options are available:
Include Doppler effect involves that the Doppler effect may be accounted for by using apparent wave (API
2.3.1b1). Include effect of wake encounter involves that the effect of wake encounter may be included. There are
two options:
o The dependency of wake encounter will be applied to all members within 15 degrees of the
vertical (API 2.3.1b7) as specified by API.
o The dependency of wake encounter will be applied to all members within 15 degrees of the
orbital plane of the wave kinematics.
o If a maximum angle is given this value will substitute 15 degrees.
o The effect of wake encounter may be adjusted for current (API C2.3.1b7).
Figure 5.45 Rules tab

8/14/2019 Genie User Manual Volume 2
http://slidepdf.com/reader/full/genie-user-manual-volume-2 105/121
DET NORSKE VERITAS SOFTWARE GeniE User Manual Vol. II
Version 6.4 101 29 Jan 2013
The Buoyancy tab
Assuming horizontal free surface:
Buoyancy is calculated assuming a horizontal surface above each member.
The largest of the surface elevations above the member ends is used at both ends.
This option is default and is only available in time domain.
Figure 5.46 Buoyancy tab
Using actual free surface:
Buoyancy forces are calculated using the actual, i.e. a non-horizontal waterplane that gives small
buoyancy components in the horizontal plane.
By default the Include Buoyancy due to steel area option is on meaning that buoyancy of the steel is
included.The Morison tab
Define the velocity decomposition used when calculating the normal components of the drag forces, i.e.
handling of the v2 term in the Morison equation.
Normal to element involves that abs(vn) is used.
Total involves that abs(v) is used.
Figure 5.47 Morison tab

8/14/2019 Genie User Manual Volume 2
http://slidepdf.com/reader/full/genie-user-manual-volume-2 106/121

8/14/2019 Genie User Manual Volume 2
http://slidepdf.com/reader/full/genie-user-manual-volume-2 107/121

8/14/2019 Genie User Manual Volume 2
http://slidepdf.com/reader/full/genie-user-manual-volume-2 108/121
DET NORSKE VERITAS SOFTWARE GeniE User Manual Vol. II
Version 6.4 104 29 Jan 2013
The Special options tab
The Use MacCamy-Fuchs’ formula option is only available when calculating transfer functions.
When In phase is selected the inertia forces from the solution are applied using a phase lag compared to
the wave as given by the potential solution. When Phase lag is selected the inertia forces from the solution are applied in phase with the horizontal
wave particle acceleration at the point in question.
A On structure set may be selected and the solution will only be applied to this part of the structure. If no
set is selected then solution is applied to the complete structure.
Eliminated structure:
An Eliminated structure set may be selected. This part of the structure is eliminated from hydrodynamic
load calculations. Default value is None.
Additional still water level:
This option allows calculations to be performed for additional still water levels.
The water levels must be relative to the still water level specified in the environment data.
The table may for instance be used to include high and low tide.
The Exclude eccentricities in calculations option is by default off. If switched on the effect of
member/element end eccentricities will be neglected.
Ignore breaking wave height limit:
When this option is selected the Wajac analysis will proceed even if the estimated breaking wave height is
exceeded.
Note that, for these waves, results must be evaluated with great care, and the wave load analysis program
may fail.
Figure 5.51 Special options tab

8/14/2019 Genie User Manual Volume 2
http://slidepdf.com/reader/full/genie-user-manual-volume-2 109/121
DET NORSKE VERITAS SOFTWARE GeniE User Manual Vol. II
Version 6.4 105 29 Jan 2013

8/14/2019 Genie User Manual Volume 2
http://slidepdf.com/reader/full/genie-user-manual-volume-2 110/121
DET NORSKE VERITAS SOFTWARE GeniE User Manual Vol. II
Version 6.4 106 29 Jan 2013
5.5 Execution of a Wave Load Analysis
The aim of this section is to give some advice concerning execution of an analysis.
When a wave load analysis is executed the FEM-file (Input Interface File, see Section 4.2 about files used by GeniE) and Wajac.inp file are automatically generated. Global transfer functions calculated by Wajac
may be written to the Results Interface File for statistical postprocessing in Postresp. Detailed loads are
stored on the Loads Interface File for transfer to subsequent structural analysis in Sestra.
Error and warning messages are written to the Messages tab of GeniE and to the Wajac.lis and/or Wajac.inp
files.
A mistake that may be done is to forget to complete the wave load run definition. The Activity Monitor will
then display the text Error in the Status field and give an indication of what the error is through a text as
shown in Figure 5.52. To solve this problem open the Edit Wave Load Run dialog and complete the
definition.
Figure 5.52 The Activity Monitor dialog with error message
Note: The Command Line view of GeniE refers to more information on errors in the Messages view
as shown in Figure 5.53.

8/14/2019 Genie User Manual Volume 2
http://slidepdf.com/reader/full/genie-user-manual-volume-2 111/121
DET NORSKE VERITAS SOFTWARE GeniE User Manual Vol. II
Version 6.4 107 29 Jan 2013
Figure 5.53 Information on errors in the Command Line and Messages view
Even when an execution has been completed there may be warnings. You should check these warnings.Right-click the Wave Load Analysis activity and select wajac.lis. The file appears in the text editor
associated with the file type.
Figure 5.54 The Activity Monitor dialog after a successful analysis

8/14/2019 Genie User Manual Volume 2
http://slidepdf.com/reader/full/genie-user-manual-volume-2 112/121
DET NORSKE VERITAS SOFTWARE GeniE User Manual Vol. II
Version 6.4 108 29 Jan 2013
5.6 Execution of a Structure-Pile-Soil Analysis
Figure 5.55 The Create Wave Load + Pile Soil Analysis dialog
Figure 5.56 The Edit Pile Soil Analysis > Soil > Material coeffs dialog
These coefficients can be used to modify the soil properties given below without changing the actual values
given.
The values given are divided by the coefficients, i.e. a coefficient greater than one reduces the capacity.
The material coefficient for the friction angle applies to Tan(phi).

8/14/2019 Genie User Manual Volume 2
http://slidepdf.com/reader/full/genie-user-manual-volume-2 113/121
DET NORSKE VERITAS SOFTWARE GeniE User Manual Vol. II
Version 6.4 109 29 Jan 2013
Figure 5.57 The Edit Pile Soil Analysis > Soil > Curve generation dialog
Lowest level with cyclic PY curve generation
Cyclic p-y data will be generated for all layers below the specified limit.
Lowest undrained shear stiff(ness) with stiff clay procedures
The API code distinguishes between ‘soft clay’ and ‘stiff clay’. Procedures for calculating p-y data are,
however, only given for soft clay. Gensod takes a clay layer to be ‘stiff’ when the undrained strength value
given is higher than the limit specified. In that case the Reese et al. (1975) recommendations are used
rather than the API ‘soft’ clay procedures.
The two values below are needed for the Kraft et al. (1981) procedures to generate t-z data, t-z code = 200.
Zone of influence ratio to pile radius
Outside the zone of influence the shear displacements due to pile axial loading are neglected. Typical
values may be 10 to 30.
Curve shape factor TZ
Dimensionless factor that governs the shape of the t-z curve up to the peak resistance. Zero gives a linear
curve. Typical values may be 0.8 to 0.99.

8/14/2019 Genie User Manual Volume 2
http://slidepdf.com/reader/full/genie-user-manual-volume-2 114/121

8/14/2019 Genie User Manual Volume 2
http://slidepdf.com/reader/full/genie-user-manual-volume-2 115/121
DET NORSKE VERITAS SOFTWARE GeniE User Manual Vol. II
Version 6.4 111 29 Jan 2013
Different types of vertical loading may exist at the soil surface in the vicinity of the pile. Such loading will
influence the vertical stress down along the pile and hence the lateral resistance. Gensod approximately
account for:
A uniform Vertical stress at soil surface
An embankment type loading
A circular loaded area with the pile at its centre
The positions of the different types of surface loads are therefore given relative to a hypothetical average
pile. Vertical loads are assumed to act at a Z level corresponding to the general scoured soil surface. The
required inputs for each of the 3 options are:
Vertical stress at soil surface:
o Uniform vertical stress acting over a large area
Embankment loads are defined by:
o Vertical stress under the flat part of the embankment loading
o Width of the sloping part of the embankment loading
o Horizontal distance from the pile axis to the toe of the embankment. Positive if the pile is
located outside the embankment, negative if the pile is inside.
Circular loaded area is defined by:
o Vertical stress under the circular loaded area
o Radius of the circular loaded area

8/14/2019 Genie User Manual Volume 2
http://slidepdf.com/reader/full/genie-user-manual-volume-2 116/121
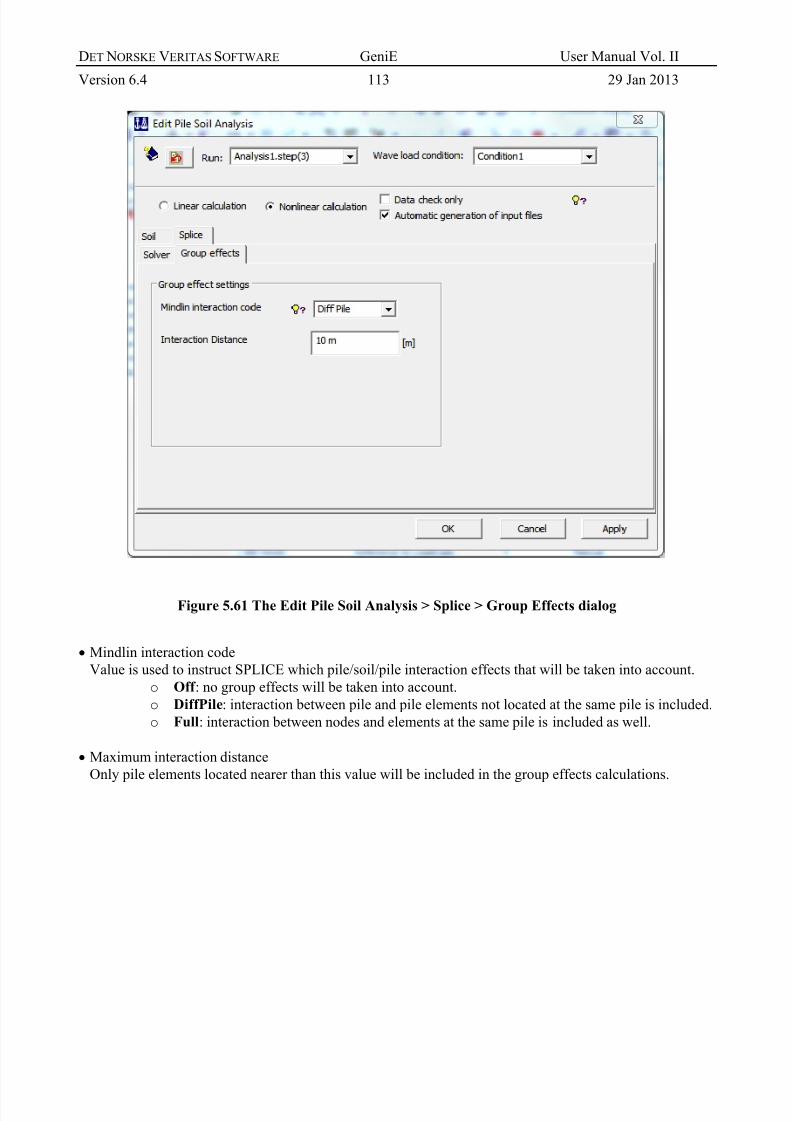
8/14/2019 Genie User Manual Volume 2
http://slidepdf.com/reader/full/genie-user-manual-volume-2 117/121
DET NORSKE VERITAS SOFTWARE GeniE User Manual Vol. II
Version 6.4 113 29 Jan 2013
Figure 5.61 The Edit Pile Soil Analysis > Splice > Group Effects dialog
Mindlin interaction code
Value is used to instruct SPLICE which pile/soil/pile interaction effects that will be taken into account.
o Off : no group effects will be taken into account.
o DiffPile: interaction between pile and pile elements not located at the same pile is included.
o Full: interaction between nodes and elements at the same pile is included as well.
Maximum interaction distance
Only pile elements located nearer than this value will be included in the group effects calculations.

8/14/2019 Genie User Manual Volume 2
http://slidepdf.com/reader/full/genie-user-manual-volume-2 118/121
DET NORSKE VERITAS SOFTWARE GeniE User Manual Vol. II
Version 6.4 114 29 Jan 2013

8/14/2019 Genie User Manual Volume 2
http://slidepdf.com/reader/full/genie-user-manual-volume-2 119/121
DET NORSKE VERITAS SOFTWARE GeniE User Manual Vol. II
Version 6.4 115 29 Jan 2013
6. APPENDIX A TUTORIAL EXAMPLES
6.1 A 1 Fixed 4-Legged Jacket Input for Design Wave Analysis
The input below creates the 4-legged jacket shown in Figure A.1. The model is used in the tutorial example
of Section 3.2. Note that the part of the input defining wave load data has been commented out (all lines
between the line starting with ‘/*’ and the last line ‘*/’). Remove these two lines if you want to run through
the complete example rather than working through the tutorial.
The input file is found on the GeniE installation, example B7 - Genie_UM_Vol2_App1.js
Figure A.1 4-legged jacket

8/14/2019 Genie User Manual Volume 2
http://slidepdf.com/reader/full/genie-user-manual-volume-2 120/121
DET NORSKE VERITAS SOFTWARE GeniE User Manual Vol. II
Version 6.4 116 29 Jan 2013
6.2 A 2 Fixed 4-Legged Jacket Input for Deterministic Fatigue Wave Analysis
The input below creates the 4-legged jacket shown in Figure A.1. The model is used in the tutorial example
of Section 3.3. Note that the part of the input defining wave load data has been commented out (all lines between the line starting with ‘/*’ and the last line ‘*/’). Remove these two lines if you want to run through
the complete example rather than working through the tutorial.
The input file is found on the GeniE installation, example B7 - Genie_UM_Vol2_App2.js

8/14/2019 Genie User Manual Volume 2
http://slidepdf.com/reader/full/genie-user-manual-volume-2 121/121