geni program overview - arpa-e overview...business model canvas “business model generation” by...
TRANSCRIPT

Technology-to-Market Overview
Carlton Reeves, Ph.D.Technology to Market AdvisorAdvanced Research Projects Agency – EnergyU.S. Department of EnergyWashington, DC
NEXTCAR T2M Briefing – April 7, 2017

Outline
02 T2M Methodology
04 Transportation Disruption
03Focal Areas
01T2M Overview
05Conclusions

ARPA-E Mission: American Competitiveness
3
Catalyze the development & deployment of transformational, high-impact energy technologies
Ensure America’s Economic Security, Energy Security, & Technological Lead in Advanced Energy Technologies

Technology Transfer and Outreach
5
‣ From the America COMPETES Reauthorization Act of 2010:
“IN GENERAL- The goals of ARPA-E shall be--(A) to enhance the economic and energy security of the United States through the development of energy technologies that result in--
(i) reductions of imports of energy from foreign sources;(ii) reductions of energy-related emissions, including greenhouse gases; and(iii) improvement in the energy efficiency of all economic sectors; and
(B) to ensure that the United States maintains a technological lead in developing and deploying advanced energy technologies.”
“ALLOCATION.—Of the amounts appropriated for a fiscal year under paragraph (2)—(A) not more than 50 percent of the amount shall be used to carry out subsection (e)(3)(D);(B) at least 5 percent of the amount shall be used for technology transfer and outreach activities; and(C) no funds may be used for construction of new buildings or facilities during the 5-year period beginning on the date of enactment of this Act.”

Inve
stm
ent
TimeConcept
$1M
ARPA-E now
ARPA-E Future?
Private Sector
6
$10M
$100M
Energy Technology “Mountains of Opportunity”
Commercialization
TechnologyDe-Risk
CommercializationDe-Risk
Manufacturing/MarketDe-Risk
Demonstration
Prototype
Research

ARPA-E’s HistoryIn 2007, The National Academies recommended Congress establish an Advanced Research Projects Agency within the U.S. Department of Energy*
7
…“The new agency proposed herein [ARPA-E] is patterned after that model [of DARPA] and would sponsor creative, out-of-the-box, transformational, generic energy research in those areas where industry by itself cannot or will not undertake such sponsorship, where risks and potential payoffs are high, and where success could provide dramatic benefits for the nation.”…
2007Rising Above the Gathering Storm Published
America COMPETES Act Signed
2009American Recovery & Reinvestment Act Signed
2011 2012 2013 20142010
1
37
712
1620
23
ProgramsTo Date
Awards Announced
2015
32
America COMPETES Reauthorization Signed
$400 Million(Recovery Act)
$180 Million(FY2011)
$275 Million(FY2012)
$251 Million(FY2013)
$280 Million(FY2014)
$280 Million(FY2015)
580+
2017
36
$291 Million(FY2016)
1st T2M Hires
1st Deputy Director for Commercialization
1st Programs with T2M from Inception

Measuring ARPA-E’s Success
MOVING TECHNOLOGY TOWARD MARKET‣ Private-Sector Funding‣ Partnerships with Other Government Agencies‣ Licensing/Acquisition by an Established Firm‣ Licensing/Acquisition Resulting in a Spinoff‣ Growth of Existing Company (e.g., Organic Growth)
BREAKTHROUGH ACHIEVEMENTS‣ Patents‣ Publications
OPERATIONAL EXCELLENCE‣ Expedited program development and project selection‣ Aggressive performance metrics
8

Commercialization MetricsSince 2009 ARPA-E has supported more than 580 projects
with approximately $1.5 billion of R&D funding
9
0
10
20
30
40
50
60
70
80
End 2012 End 2013 End 2014 End 2015 End 2016
Cum
ulat
ive
Num
ber
Commercialization Metrics
Private SectorFunding
New CompaniesFormed
Further Gov'tFunding
Cumulative number of projects that have:

T2M Key Performance Indicators
New Companies Formed (Public, Private, or Acquired)
10
Projects have received $1.5 Billion from ARPA-E
Projects Received Follow-on Funding from Other Government Agencies
Projects Received Over $1.80 Billion in Private Sector Funding
https://arpa-e.energy.gov/?q=news-item/arpa-e-projects-receive-more-18-billion-private-follow-funding-transformational-energy

Establish a Business
Misinformation of Commercialization
StrategicPartnersPatent
Good ScienceIdea
Secure Funding Deploy New
ProductsGain Fame & Fortune
Grow Business

Commercialization Can Be Long & Hard
13
Technology Market DisruptedIntermediate MarketsFirst market
Li-Io
n B
atte
ries
Long Lived, Energy Dense Cells
Long Lived, Energy Dense, Rechargeable, Cost-Effective
Long Lived, Energy Dense, Rechargeable
Pho
tovo
ltaic
s
Decreasing Cost
Alg
ae F
uels
Commodity Fuels?
Nutrition Supplements & Pharmaceuticals

Techno-economic Analysis
Intellectual Property
Plan
Value Chain
Analysis
Customer Discovery
T2M Plan
Follow on Funding
Product Hypothesis
Scaling Up
Market Analysis
Evidence-based T2M Methodology

Initial TechnologyDevelopment & Identify
Product-Market Fit
Program Development by Year
ff
Y1 Y2 Y3
Hardware-in-the-Loop Testing & Market
Analysis with Cost Modeling
Hardware-in-the-Loop Validation, Refine Go-to-
Market Strategy, & Follow-on Funding Plan

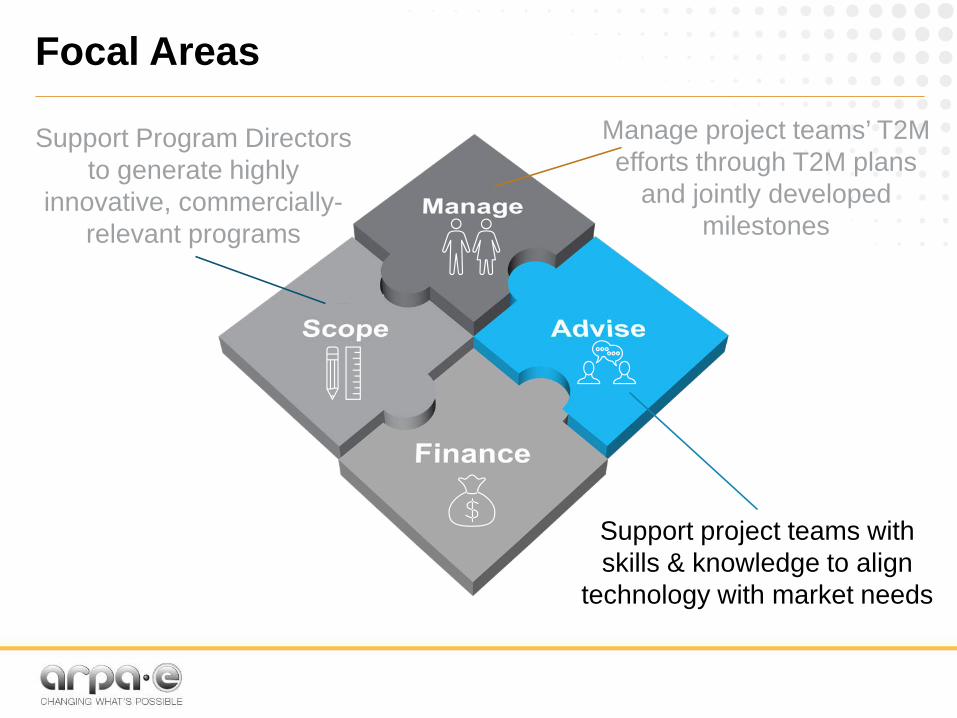
Focal Areas

Focal Areas
Support Program Directors to generate highly
innovative, commercially-relevant programs

Scope: Market CharacteristicsDistributed Energy Resources
C
B
A
Com
plex
ity o
f Sys
tem
Ease of Integration
Males Will Use DERs6 of 10
Females Will Use DERs9 of 10
Trusting Local Manufacturers
Accessibility
Resources Needed
InstallTime
Reliability
Factors Influencing DER Utilization
Example

17%Brazil
9%Asia
93% United States 46%
Europe
Scope: Market Characteristics% of Forecasted DER Users Worldwide
Example

Focal Areas
Manage project teams’ T2M efforts through T2M plans
and jointly developed milestones
Support Program Directors to generate highly
innovative, commercially-relevant programs

Manage: T2M Milestone Negotiations
24
8 Layers to Unpack
T2M Negotiations

Product Definition Intellectual
Property Plan Cost-Performance
Model
Customer Discovery &
Market Analysis
Competitive Analysis & Regulatory
Analysis
Manage: Approach to Tech-to-Market
Technology-to-Market Plan
Focal Areas
Manage project teams’ T2M efforts through T2M plans
and jointly developed milestones
Support project teams with skills & knowledge to align
technology with market needs
Support Program Directors to generate highly
innovative, commercially-relevant programs

Advise: Product-Market Hypothesis
Value Proposition
Customers
Relationships
ChannelsResources
Partners
Activities
Cost Revenue
30
Business Model Canvas
“Business Model Generation” by Alexander Osterwalder

Advise: Minimum Viable Product
31
Control
Data Analytics Communication
Hardware
I’ll usefeature B.I’ll pay for
feature A.I want
features A & C.
Customer Data
Market Data
CA
B
Technology
What is the business model of the future?How does your technology fit in?

Advise: Techno-Economic Analysis
32

Focal Areas
Manage project teams’ T2M efforts through T2M plans
and jointly developed milestones
Support project teams with skills & knowledge to align
technology with market needs
Support Program Directors to generate highly
innovative, commercially-relevant programs
Engage third-party financiers to support continuity of
technology development towards the market

Technical, Financial Risk
Fina
ncia
l Ret
urn
Private Investment Threshold
Private Sector Invests
Government Invests
Hig
h Im
pact
Te
chno
logy
Hig
h Im
pact
Te
chno
logy
ARPA-E
Finance: Investment Threshold

Finance: Follow On Funding
GovernmentDOE,DOD, State & Regional Agencies
Private CapitalVenture Capital, Family Offices, High Net Worth People, Impact Investors
Corporate StrategiesAcquisition, Licensing, Joint Venture
Accelerators/IncubatorsStartup, Team Formation, Quick Growth
Strategize & Think Through Sources of Funding

CAVS Disrupting Transportation
GPS provides accuratelocation. Computer analyzes data and
cross-checks systems before maneuvering.
LIDAR uses spinning lasers to construct a virtual 3D map
of the surrounding environment.
Radio signals between vehicles—and from stop lights and otherinfrastructure —further augment safety and efficiency.
Platoons ofautomated trucks
and cars will reduce congestion and
save on fuel.
Short-distance radar measures proximity of nearby surroundings.
Long-distance radar monitors the location
of vehicles well ahead of the car.
Ultrasound aids with parking maneuvers and objectdetection.
COORDINATING TECHNOLOGIESFor a fully automated vehicle to navigatethrough a complex and dynamic system ofroadways, it must rely on a wide range of sensing, orienting and processing systems.
Cameras create a 360-degree image for analysis, revealing stop lights, pedestrians, crosswalks and other features. Forward-mounted stereo cameras see the road ahead in 3D. Infrared lights and cameras penetrate reflective surfaces.
Wheel sensors track distance and velocity.

Disrupting Transportation
Business ModelsOwnership vs. Control
Mobility AccessibilityUnderserved Populations & Older Americans
Commuter Expectations Shaped by Technology
Connected & Automated
Vehicles
Shifting Demographics
(Millennials)
Urbanization: Shifts to
Megaregions
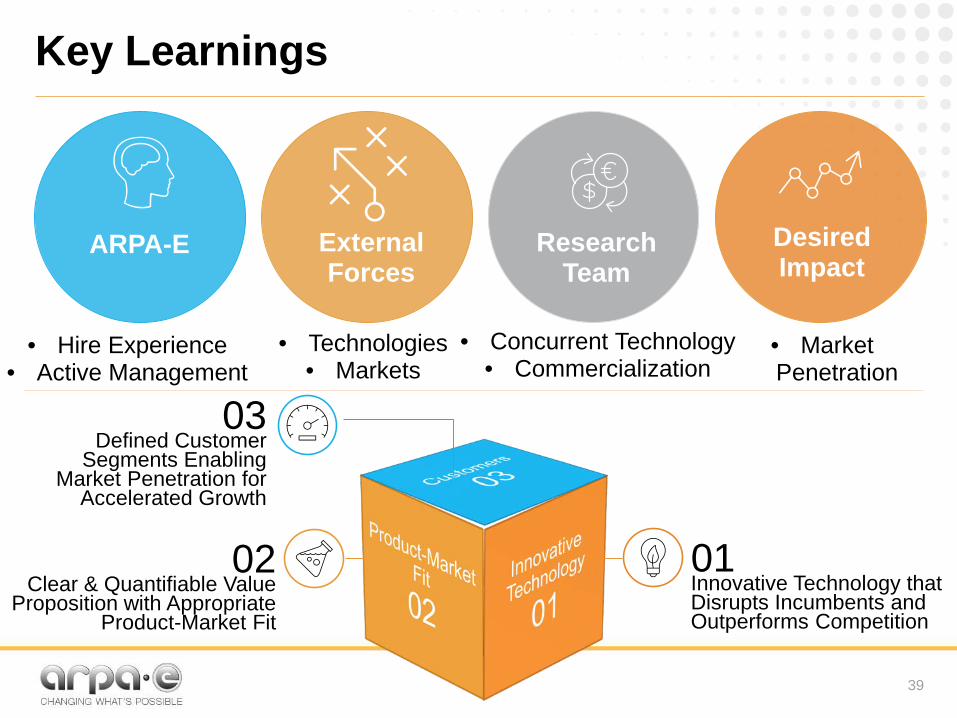
Key Learnings
39
01Innovative Technology that Disrupts Incumbents and Outperforms Competition
02Clear & Quantifiable Value
Proposition with Appropriate Product-Market Fit
03Defined Customer
Segments Enabling Market Penetration for
Accelerated Growth
ARPA-E External Forces
Research Team
Desired Impact
• Hire Experience• Active Management
• Technologies• Markets
• Concurrent Technology• Commercialization
• Market Penetration

Next Steps
Perform Customer Discovery & Market Analysis
01
Develop & Test Technology, Align T2M Plan with Partners
02
Validate Solutions in HIL & Large Scale Simulation
03
Execute Technology to Market Plan & Deployment Strategies
04
Engage Industry & Customers
Address Technology
Needs
Demonstrate Capabilities
Commercialize Technology

41
www.arpa-e.energy.gov
41
Thank You
Carlton Reeves, Ph.D.Technology-to-Market [email protected]
Office: 202-287-5470