genetics for epidemiologists lecture 2: measurement of genetic exposures national human genome...
TRANSCRIPT
Genetics for Epidemiologists
Lecture 2: Measurement of Genetic Exposures
National Human Genome Research
Institute
National Institutes of
Health
U.S. Department of Health and
Human Services
U.S. Department of Health and Human Services
National Institutes of HealthNational Human Genome Research
InstituteTeri A. Manolio, M.D., Ph.D.
Director, Office of Population Genomics andSenior Advisor to the Director, NHGRI,
for Population Genomics

Topics to be Covered
• Measuring genetic variation
– Blood group markers
– Restriction-fragment length polymorphisms
– Variable number of tandem repeats (VNTRs, minisatellites and microsatellites)
– Single nucleotide polymorphisms (SNPs)
• Linkage disequilibrium (LD)
• Familial resemblance and family history

Larson, G. The Complete Far Side. 2003.

Measuring Genetic Variation: Blood Group and Enzymatic Markers
Am J Med Genet 1984; 19:525-32.
• RBC COMT activity measured in 5 large families with hypertension (total 518 individuals)
• Associations tested with 25 genetic markers: ABO, Rh, K, MNS, P, Fy, Jk, PGD, ADA, ACP1, PGM1, HBB, GPT, C3, HPA, TF, GC, OR, GM, KM, BF, ESD, GLO1, Le
• Lod score of 1.27 and estimated recombination fraction of 0.1 found for phosphogluconate dehydrogenase (PGD)
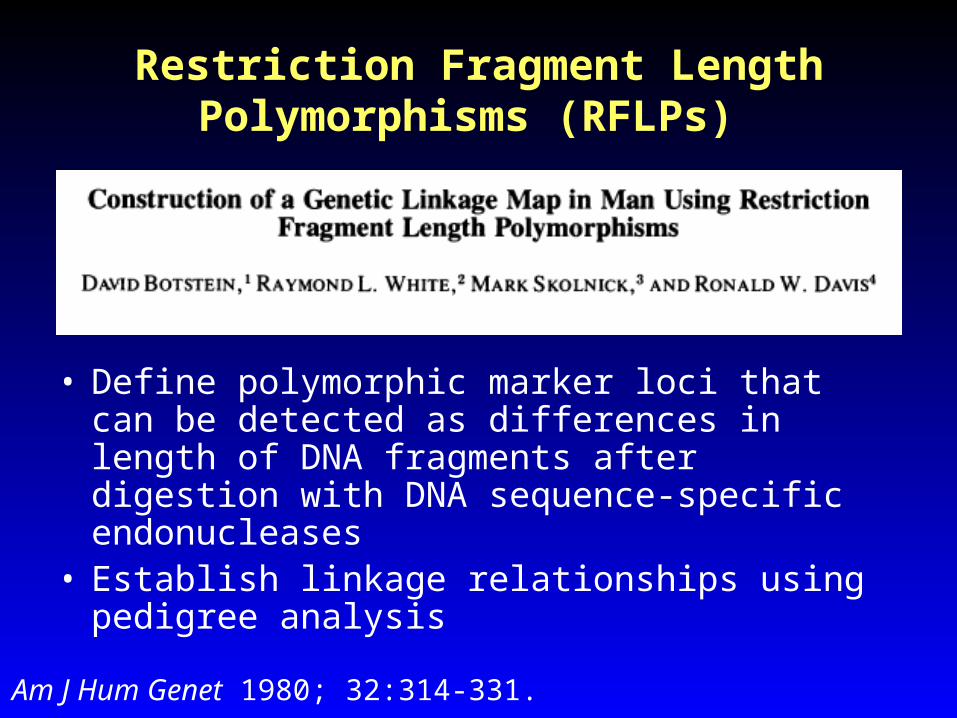
Restriction Fragment Length Polymorphisms (RFLPs)
Am J Hum Genet 1980; 32:314-331.
• Define polymorphic marker loci that can be detected as differences in length of DNA fragments after digestion with DNA sequence-specific endonucleases
• Establish linkage relationships using pedigree analysis
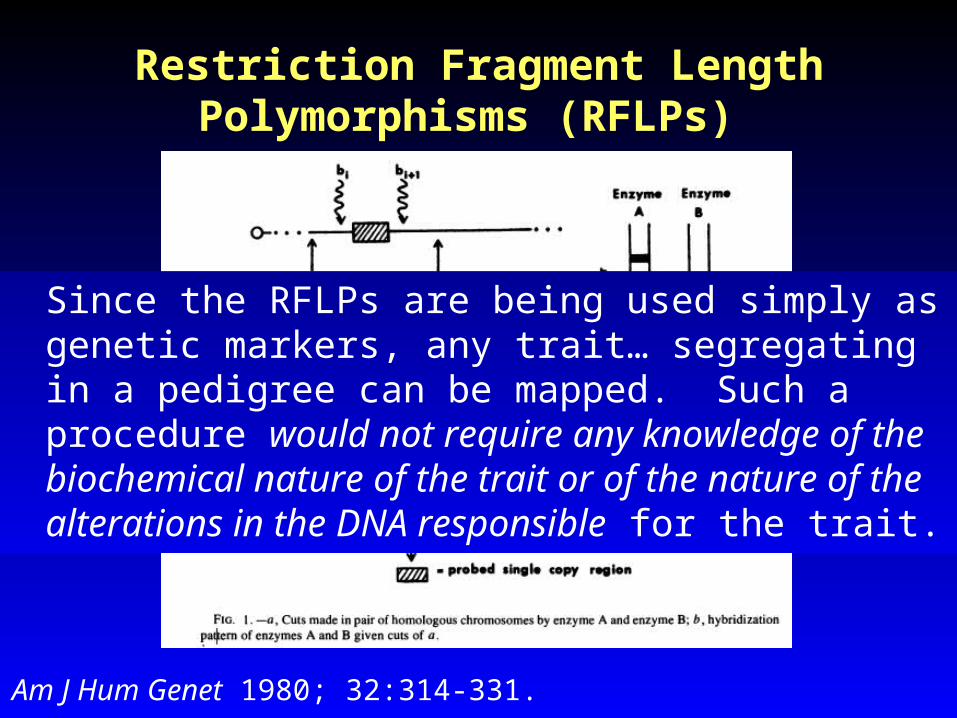
Restriction Fragment Length Polymorphisms (RFLPs)
Am J Hum Genet 1980; 32:314-331.
Since the RFLPs are being used simply as genetic markers, any trait… segregating in a pedigree can be mapped. Such a procedure would not require any knowledge of the biochemical nature of the trait or of the nature of the alterations in the DNA responsible for the trait.
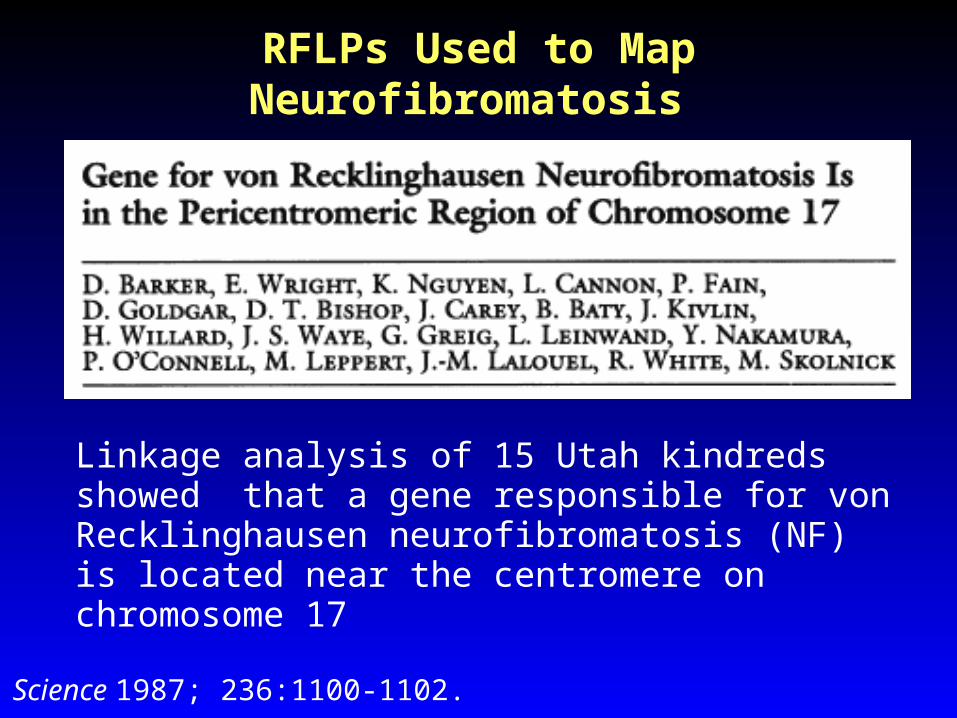
RFLPs Used to Map Neurofibromatosis
Science 1987; 236:1100-1102.
Linkage analysis of 15 Utah kindreds showed that a gene responsible for von Recklinghausen neurofibromatosis (NF) is located near the centromere on chromosome 17

RFLPs Used to Map Neurofibromatosis
Science 1987; 236:1100-1102.
Cosegration of NF with the A2 (1.9 kb) allele and not A1 (2.4kb) in each of four affected offspring.

Variable Numbers of Tandem Repeats (VNTRs): Minisatellites
• Repetition in tandem of a short (6- to 100-bp) motif spanning 0.5 kb to several kb– Opened the way to DNA fingerprinting for
individual identification – Provided the first highly polymorphic,
multiallelic markers for linkage studies – Associated with many interesting features
of human genome biology and evolution • Well-known minisatellite is 5.5kb, kringle IV
repeat in apolipoprotein(a) and plasminogen
Vernaud G and Denoued F, Genome Res 2000; 10:899-907.

Kringle-IV Encoding Sequences of Human apo(a) cDNA ApoA1 Alleles
Lackner et al, Hum Mol Genet 1993; 2:933-40.
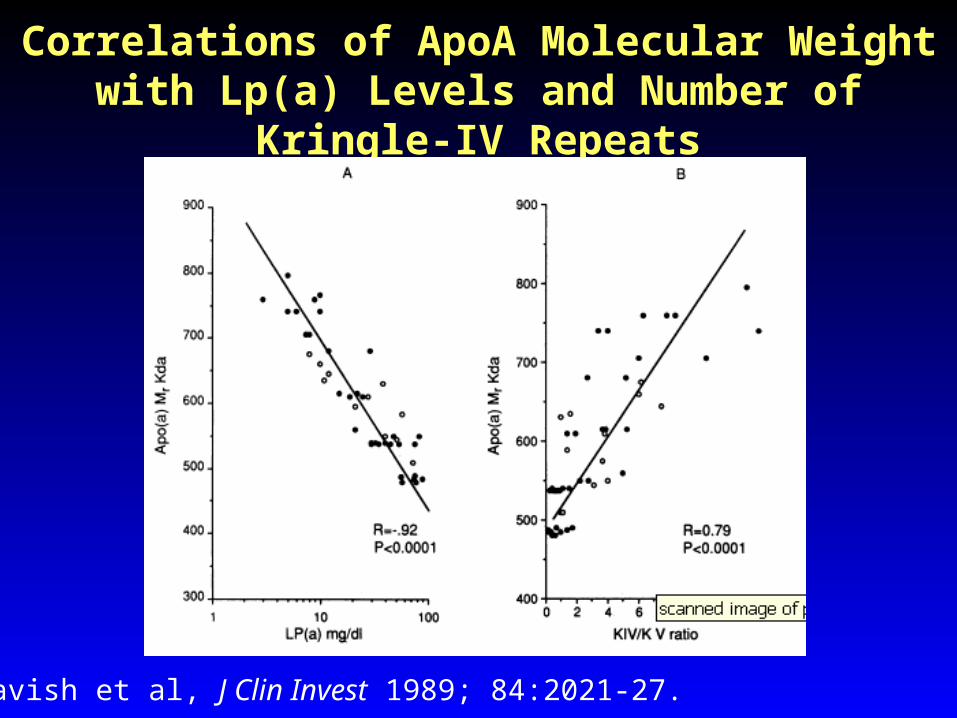
Correlations of ApoA Molecular Weight with Lp(a) Levels and Number of
Kringle-IV Repeats
Gavish et al, J Clin Invest 1989; 84:2021-27.

Simple Sequence Repeats (also “VNTRs”): Microsatellites
• Most are di-, tri-, and tetra-nucleotide repeats repeated 20-50 times
• Most are highly polymorphic making them enormously useful for mapping and linkage
• Marshfield and similar maps placed ~400 microsatellites across genome, provided primers for analysis
• Could be highly automated: NHLBI and CIDR large-scale genotyping services
Repetition in tandem of a short (2- to 6-bp) motif from 5-5,000 times

Multipoint LOD Scores for Long-term SBP and DBP on
Chromosome 17
Levy et al, Hypertension 2000;36:477-483.

Larson, G. The Complete Far Side. 2003.
GAAATAATTAATGTTTTCCTTCCTTCTCCTATTTTGTCCTTTACTTCAATTTATTTATTTATTATTAATATTATTATTTTTTG
AGACGGAGTTTC/ACTCTTGTTGCCAACCTGGAGTGCAGTGGCGTGATCTCAGCTCACTGCACACTCCGCTTTCCTGGTTTCAAGCGATTCTCCTGCCTCAGCCTCCTGAGTAGCTGGGACTACAGTCACACACCACCACGCCCGGCTAATTTTTGTATTTTTAGTAGAGTTGGGGTTTCACCATGTTGGCCAGACTGGTCTCGAACTCCTGACCTTGTGATCCGCCAGCCTCTGCCTCCCAAAGAGCTGGGATTACAGGCGTGAGCCACCGCGCTCGGCCCTTTGCATCAATTTCTACAGCTTGTTTTCTTTGCCTGGACTTT
ACAAGTCTTACCTTGTTCTGCC/TTCAGATATTTGTGTGGTCTCATTCTGGTGTGCCAGTAGCTAAAAATCCATGATTTGCTCTCATCCCACTCCTGTTGTT
CATCTCCTCTTATCTGGGGTCACA/CTATCTCTTCGTGATTGCATTCTGATCCCCAGTACTTAGCATGTGCGTAACAACTCTGCCTCTGCTTTCCCAGGCTGTTGATGGGGTGCTGTTCATGCCTCAGAAAAATGCATTGTAAGTTAAATTATTAAAGATTTTAAATATAGGAAAAAAGTAAGCAAACATAAGGAACAAAAAGGAAAGAACATGTATTCTAATCCATTATTTATTATACAATTAAGAAATTTGGAAACTTTAGATTACACTGCTTTTAGAGATGGAGATGTAGTAAGTCTTTTACTCTTTACAAAATACATGTGTTAGCAATTTTGGGAA
GAATAGTAACTCACCCGAACAGTG/TAATGTGAATATGTCACTTACTAGAGGAAAGAAGGCACTTGAAAAACATCTCTAAACCGTATAAAAACAATTACATCATAATGATGAAAACCCAAGGAATTTTTTTAGAAAACATTACCAGGGCTAATAACAAAGTAGAGCCACATGTCATTTATCTTCCCTTTGTGTCTGTGTGAGAATTCTAGAGTTATATTTGTACATAGCATGGAAAAATGAGAGGCTAGTTTATCAACTAGTTCATTTTTAAAAGTCTAACACATCCTAGGTATAGGTGAACTGTCCTCCTGCCAATGTATTGCACATTTGTGCCCAGATCCAGCATAGGGTATGTTTGCCATTTACAAACGTTTATGTCTTAAGAGAGGAAATATGAAGAGCAAAACAGTGCATGC
TGGAGAGAGAAAGCTGATACAAATATAAAT/GAAACAATAATTGGAAAAATTGAGAAACTACTCATTTTCTAAATTACTCATGTATTTTCCTAGAATTTAAGTCTTTTAATTTTTGATAAATCCCAATGTGAGACAAGATAAGTATTAGTGATGGTATGAGTAATTAATATCTGTTATATAATATTCATTTTCATAGTGGAAGAAATAAAATAAAGGTTGTGATGATTGTTGATTATTTTTTCTAGAGGGGTTGTCAGGGAAAGAAATTGCTTTTT
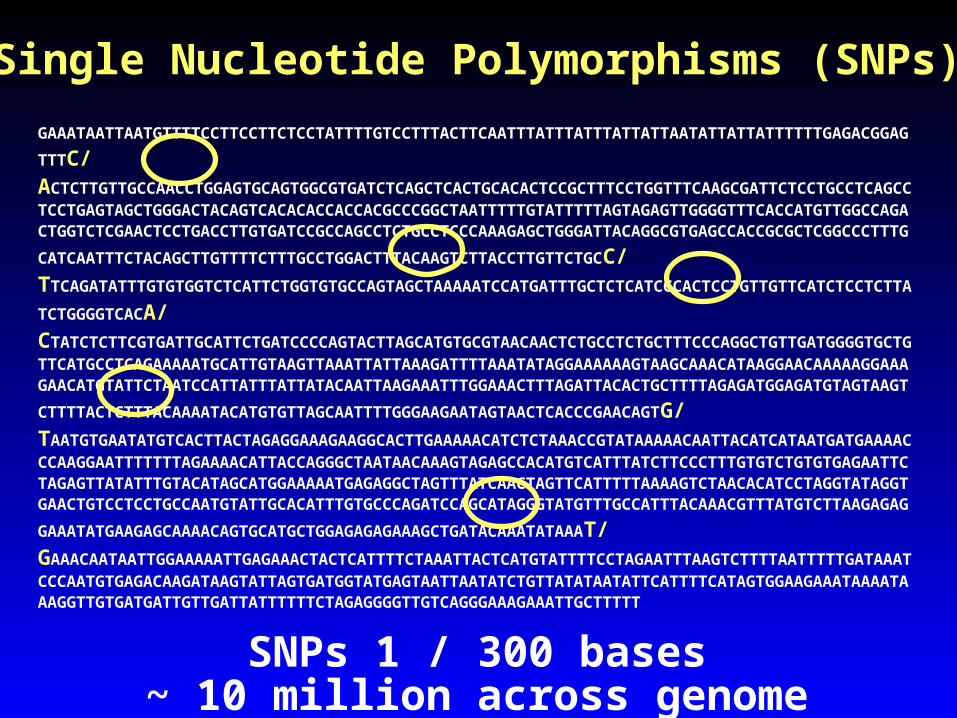
SNPs 1 / 300 bases~ 10 million across genome
Single Nucleotide Polymorphisms (SNPs)

Christensen and Murray, N Engl J Med 2007; 356:1094-1097.
Mapping the Relationships Among SNPs

Chromosome 9p21 Region Associated with MI
Samani N et al, N Engl J Med 2007; 357:443-453.

BostonProvi-dence
New York
Phila-delphi
a
Balti-more
Providence 59
New York 210 152Philadelphia 320 237 86
Baltimore 430 325 173 87Washington 450 358 206 120 34
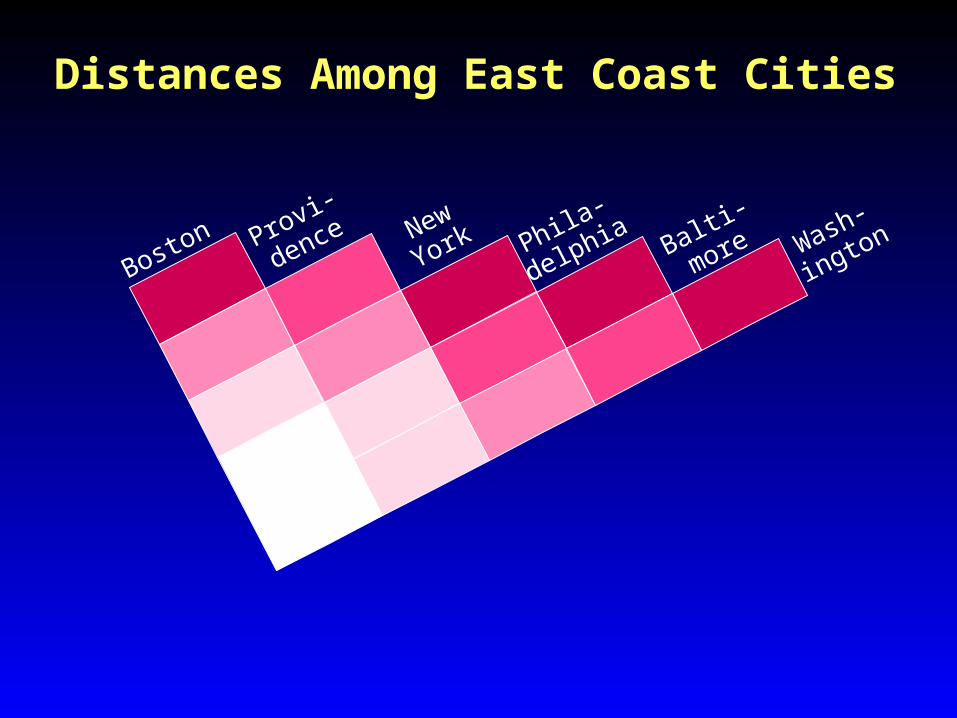
Distances Among East Coast Cities

BostonProvi-dence
New York
Phila-delphi
a
Balti-more
Providence 59
New York 210 152Philadelphia 320 237 86
Baltimore 430 325 173 87Washington 450 358 206 120 34
Distances Among East Coast Cities
< 100 101-200
201-300
301-400
> 400

BostonProvi-dence
New York
Phila-delphi
a
Balti-more
Providence 59
New York 210 152Philadelphia 320 237 86
Baltimore 430 325 173 87Washington 450 358 206 120 34
Distances Among East Coast Cities
< 100 101-200
201-300
301-400
> 400
Distances Among East Coast Cities
Boston Provi-
dence New
York Phila-
delphia Balti-
more Wash-
ington

Distances Among East Coast Cities
Boston
Provi-
dence
New York
Phila-delph
ia
Balti-more
Wash-
ington

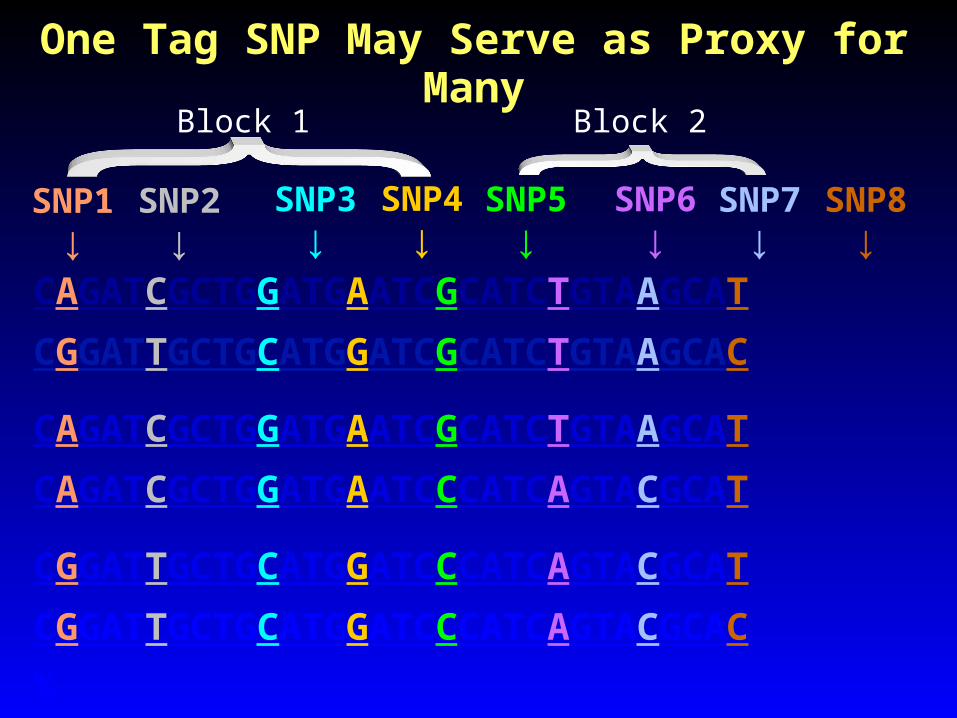
One Tag SNP May Serve as Proxy for Many
CAGATCGCTGGATGAATCGCATCTGTAAGCAT
CGGATTGCTGCATGGATCGCATCTGTAAGCAC
CAGATCGCTGGATGAATCGCATCTGTAAGCAT
CAGATCGCTGGATGAATCCCATCAGTACGCAT
CGGATTGCTGCATGGATCCCATCAGTACGCAT
CGGATTGCTGCATGGATCCCATCAGTACGCAC
SNP2↓
SNP3↓
SNP4↓
SNP5↓
SNP6↓
SNP1↓
Block 1 Block 2
SNP7↓
SNP8↓
One Tag SNP May Serve as Proxy for Many
CAGATCGCTGGATGAATCGCATCTGTAAGCAT
CGGATTGCTGCATGGATCGCATCTGTAAGCAC
CAGATCGCTGGATGAATCGCATCTGTAAGCAT
CAGATCGCTGGATGAATCCCATCAGTACGCAT
CGGATTGCTGCATGGATCCCATCAGTACGCAT
CGGATTGCTGCATGGATCCCATCAGTACGCAC
%
SNP2↓
SNP3↓
SNP4↓
SNP5↓
SNP6↓
SNP1↓
Block 1 Block 2
SNP7↓
SNP8↓

One Tag SNP May Serve as Proxy for Many
CAGATCGCTGGATGAATCGCATCTGTAAGCAT
CGGATTGCTGCATGGATCGCATCTGTAAGCAC
CAGATCGCTGGATGAATCGCATCTGTAAGCAT
CAGATCGCTGGATGAATCCCATCAGTACGCAT
CGGATTGCTGCATGGATCCCATCAGTACGCAT
CGGATTGCTGCATGGATCCCATCAGTACGCAC
%
SNP3↓
SNP5↓
SNP6↓
Block 1 Block 2
SNP7↓
SNP8↓

One Tag SNP May Serve as Proxy for Many
CAGATCGCTGGATGAATCGCATCTGTAAGCAT
CGGATTGCTGCATGGATCGCATCTGTAAGCAC
CAGATCGCTGGATGAATCGCATCTGTAAGCAT
CAGATCGCTGGATGAATCCCATCAGTACGCAT
CGGATTGCTGCATGGATCCCATCAGTACGCAT
CGGATTGCTGCATGGATCCCATCAGTACGCAC
%
SNP3↓
SNP6↓
Block 1 Block 2
SNP8↓

One Tag SNP May Serve as Proxy for Many
GTT 35%
CTC 30%
GTT 10%
GAT 8%
CAT 7%
CAC 6%
other haplotypes 4%
Block 1 Block 2 FrequencySingleton

Pair-Wise Linkage Disequilibrium (LD) Measures
For a discussion and comparison of these LD measures, see Devlin B, Risch N, Genomics 1995; 29:311-22.
Name Symbol Definition
"Lewontin's D"
D pABpab – pAbpaB
"D prime" D' D / max (D)
Correlation("r-squared")
r2 D2 / pApapBpb
Courtesy K. Jacobs, NCI

Two Measures of LD: D' and r2
• D' varies from 0 (complete equilibrium) to 1 (complete disequilibrium)
• When D' = 0, typing one SNP provides no information on the other SNP
• D' does not adequately account for allele frequencies; r2 is correlation between SNPs, is preferred measure
• When r2 = 1, two SNPs are in perfect LD; allele frequencies are identical for both SNPs, and typing one SNP provides complete information on the other

What can LD do for me?
• Knowledge of patterns of LD can be quite useful in the design and analysis of genetic data
• Design:– Estimation of theoretical power to detect
associations– Evaluation of degree of completeness of
sampling of genetic variants– Choice of most informative genetic variants to
genotype• Sample size increases by ~1/r2 to achieve same
power to detect association with SNP2 as SNP1
Courtesy K. Jacobs, NCI
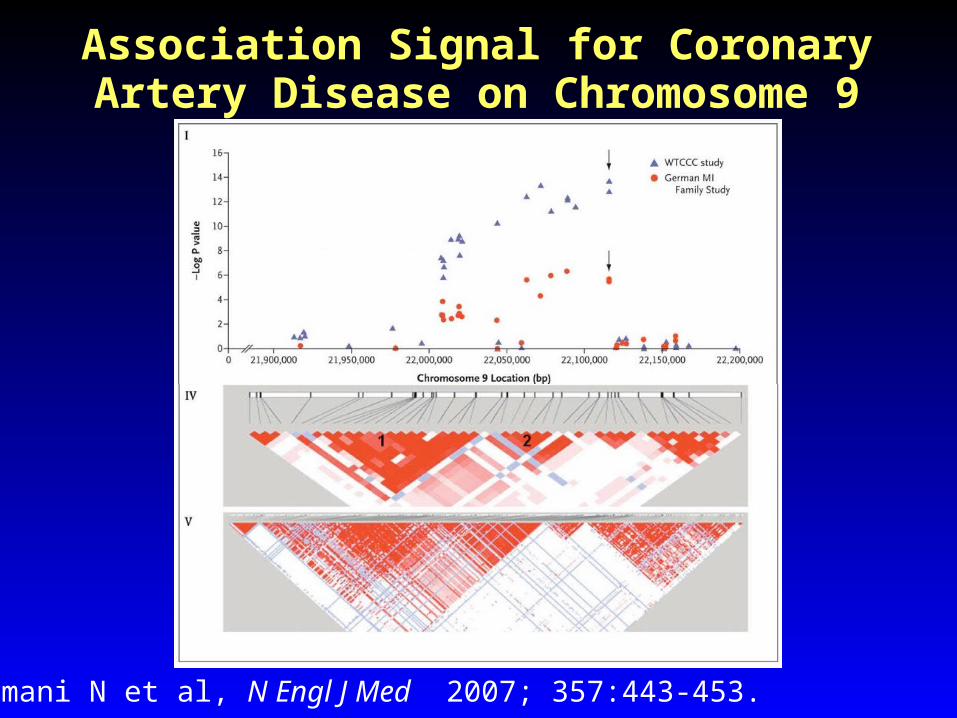
Association Signal for Coronary Artery Disease on Chromosome 9
Samani N et al, N Engl J Med 2007; 357:443-453.
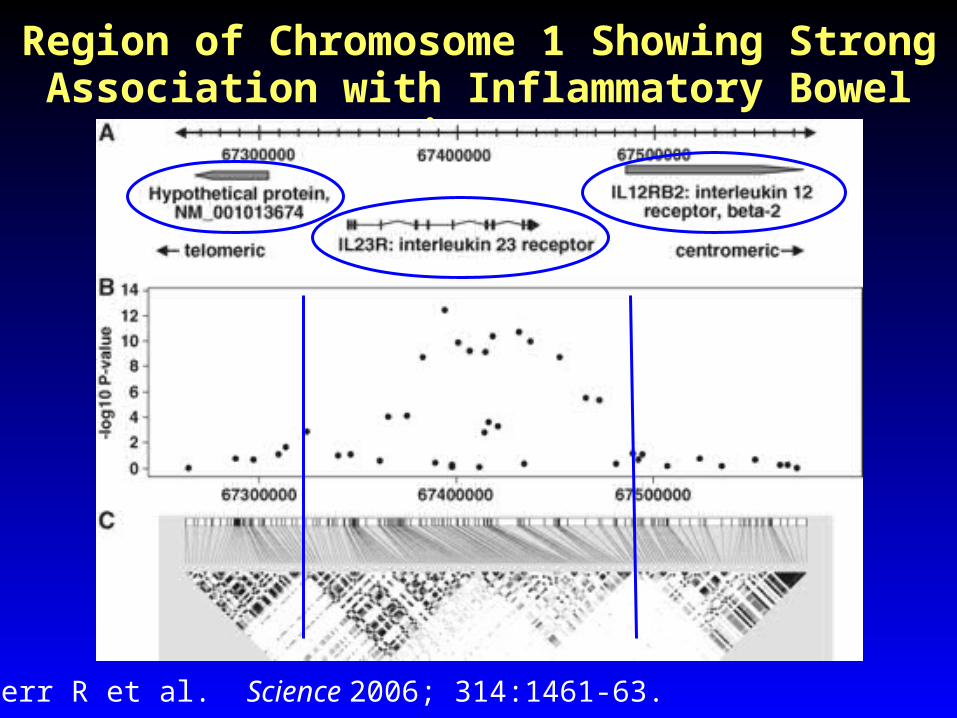
Region of Chromosome 1 Showing Strong Association with Inflammatory
Bowel Disease
Duerr R et al. Science 2006; 314:1461-63.

Grant et al, Nat Genet 2006; 38:320-23.
LD Patterns in TCF7L2 Association Region

International HapMap Consortium, Nature 2005; 437:1299-1320.
LD in Three HapMap Populations

A HapMap for More Efficient Association Studies: Goals
• Use just the density of SNPs needed to find associations between SNPs and diseases
• Do not miss chromosomal regions with disease association
• Produce a tool to assist in finding genes affecting health and disease
• Ancestral populations differ in their degree of LD; recent African ancestry populations are older and have shorter stretches of LD, need more SNPs for complete genome coverage
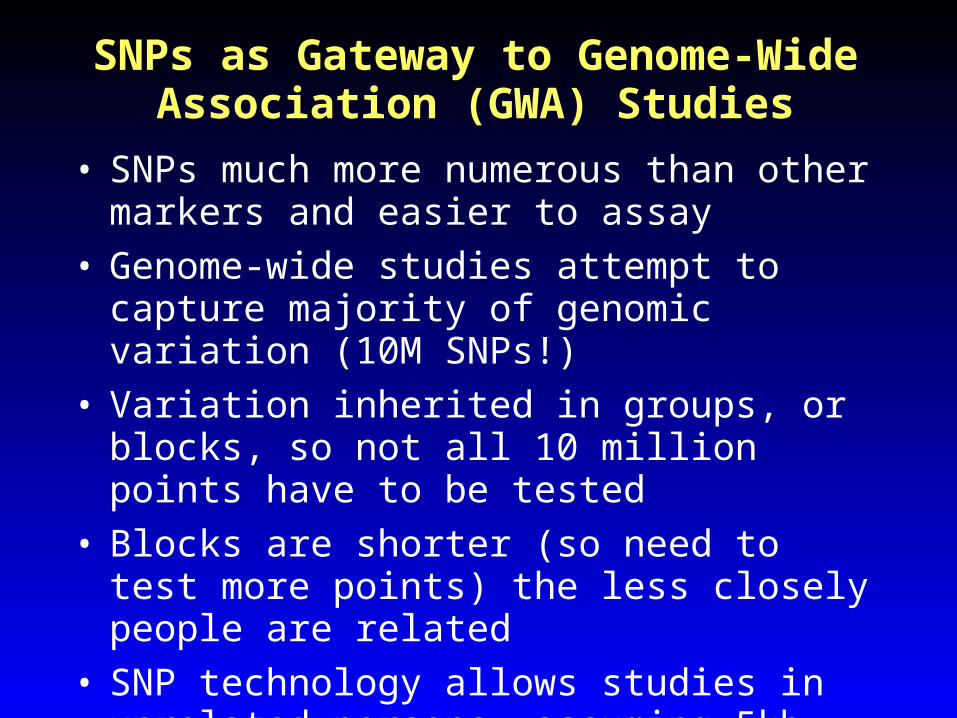
SNPs as Gateway to Genome-Wide Association (GWA) Studies
• SNPs much more numerous than other markers and easier to assay
• Genome-wide studies attempt to capture majority of genomic variation (10M SNPs!)
• Variation inherited in groups, or blocks, so not all 10 million points have to be tested
• Blocks are shorter (so need to test more points) the less closely people are related
• SNP technology allows studies in unrelated persons, assuming 5kb – 10kb lengths in common (300,000 – 1,000,000 markers)

International HapMap Consortium, Nature 2005; 437:1299-1320.
www.hapmap.org

International HapMap Consortium, Nature 2007; 449:851-861.
www.hapmap.org

Progress in Genotyping Technology
1 10 102 103 104 105 106
Nb of SNPs
Cost
per
gen
oty
pe
(Cen
ts,
US
D)10
1
102
ABITaqMan
ABISNPlex
IlluminaGolden
Gate
IlluminaInfinium/
Sentrix Affymetrix
100K/500K
Perlegen
Affymetrix
MegAllele
2001 2005
Affymetrix
10K
Courtesy S. Chanock, NCI

0
300
600
900
1200
1500
1800
Jul-05 Oct-05 Jan-06 Apr-06 Jul-06 Oct-06
Affymetrix 500K
Illumina 317K
Illumina 550K
Illumina 650Y
Continued Progress in Genotyping Technology
Courtesy S. Gabriel, Broad/MIT
July 2005 Oct 2006
Cost
per
pers
on
(U
SD
)

YearNumber of
SNPsCost/SNP
Cost/Study
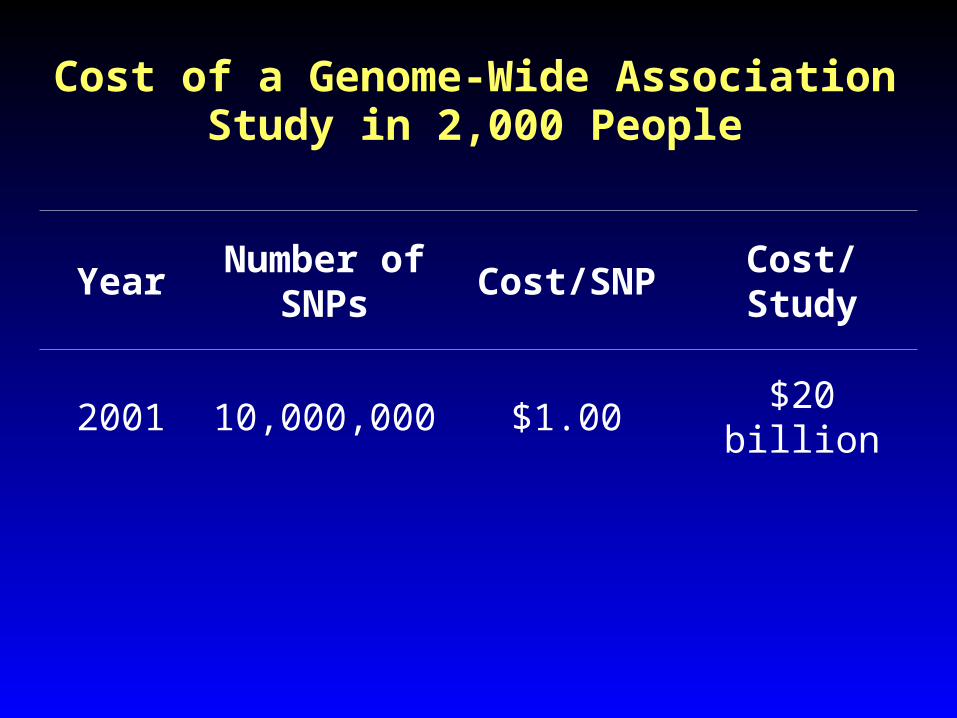
Cost of a Genome-Wide Association Study in 2,000 People

YearNumber of
SNPsCost/SNP
Cost/Study
2001
Cost of a Genome-Wide Association Study in 2,000 People

YearNumber of
SNPsCost/SNP
Cost/Study
2001 10,000,000
Cost of a Genome-Wide Association Study in 2,000 People

YearNumber of
SNPsCost/SNP
Cost/Study
2001 10,000,000 $1.00
Cost of a Genome-Wide Association Study in 2,000 People
YearNumber of
SNPsCost/SNP
Cost/Study
2001 10,000,000 $1.00 $20 billion
Cost of a Genome-Wide Association Study in 2,000 People

YearNumber of
SNPsCost/SNP
Cost/Study
2001 10,000,000 $1.00 $20 billion
2008
Cost of a Genome-Wide Association Study in 2,000 People

YearNumber of
SNPsCost/SNP
Cost/Study
2001 10,000,000 $1.00 $20 billion
2008 1,000,000
Cost of a Genome-Wide Association Study in 2,000 People

YearNumber of
SNPsCost/SNP
Cost/Study
2001 10,000,000 $1.00 $20 billion
2008 1,000,000 0.05¢
Cost of a Genome-Wide Association Study in 2,000 People

YearNumber of
SNPsCost/SNP
Cost/Study
2001 10,000,000 $1.00 $20 billion
2008 1,000,000 0.05¢ $1 million
Cost of a Genome-Wide Association Study in 2,000 People

Coverage (% SNPs tagged at r2 > 0.8) of Commercial Genotyping
Platforms
Manolio et al, J Clin Invest 2008; 118:1590-605.
HapMap population sample
Platform YRI CEUCHB+JP
T
Affymetrix GeneChip 500K
46 68 67
Affymetrix SNP Array 6.0
66 82 81
Illumina HumanHap300 33 77 63
Illumina HumanHap550 55 88 83
Illumina HumanHap650Y
66 89 84
Perlegen 600K 47 92 84

Following the Polymorphism Literature
• Sometimes named for: – amino acid change (AGT M235T)– nucleotide sequence (AGTR1 A1166C) – promoter (AGT -6 G/A)– restriction enzyme site (XbaI, PvuII, HindIII)– gene product (APOE*e2)– legacy system (DRB1*0104)– reference SNP (rs709932) or submitted SNP
(ss1487247)• Good sources for information: OMIM, HUGO,
dbSNP, UCSC Genome Browser
Courtesy S. Chanock, NCI

Other Genomic Technologies
• Sequencing: measure variation at every point in gene or candidate region in dozens to hundreds of people to find functional variants
• Gene expression: measure changes in mRNA (transcribed) in cases and controls or in response to stimulation
• Epigenetics: measure DNA methylation or histone deacetylation that turns genes on and off

Sidney Harris, http://www.sciencecartoonsplus.com/gallery.htm.

Summary Points: Genotyping Methods
• Unbelievably rapid progress from small number of blood group markers to >10M SNPs, CNVs, structural variants, sequence variants
• Technology will continue to change and will be challenge to keep up with; difficult to know when ready to apply to population studies
• SNPs are currently the dominant technology (more to come in Lecture 4)
• Quality control is a major issue

Familial Resemblance?
http://en.wikipedia.org/wiki/Image:Kennedy_bros.jpg#file

Evidence for Genetic Influence on Disease or Trait from Family Data
• Familial resemblance: trait more similar among related than unrelated persons
• Familial clustering: risk of disease in relative of case > risk in relative of non-case or of general population; (sibling relative risk, Risch's λS)
• Distributions of continuous trait: mixtures of distributions or commingling analysis

Sibling Relative Risk of Living to Age 90
Centenarians vs. Those Dying at Age 73
Perls TT et al, Lancet 1998; 351:1560.

Large Representative Pedigree Showing 69 Patients with Atrial
Fibrillation
Arnar et al, Europ Heart J 2006; 27:708-12.

Strength of Extensive Genealogies• Common diseases do not show Mendelian inheritance patterns• Affected siblings infrequent in common diseases, but many
patients may have more distant relatives with same disease
Degree of Relatives
Risk Ratio [95% CI]
P-Value
1 1.77 [1.67,1.88] < 0.001
2 1.36 [1.27,1.44] < 0.001
3 1.18 [1.14,1.23] < 0.001
4 1.10 [1.06,1.13] < 0.001
5 1.05 [1.02,1.07] < 0.001
Arnar et al, Europ Heart J 2006; 27:708-12.
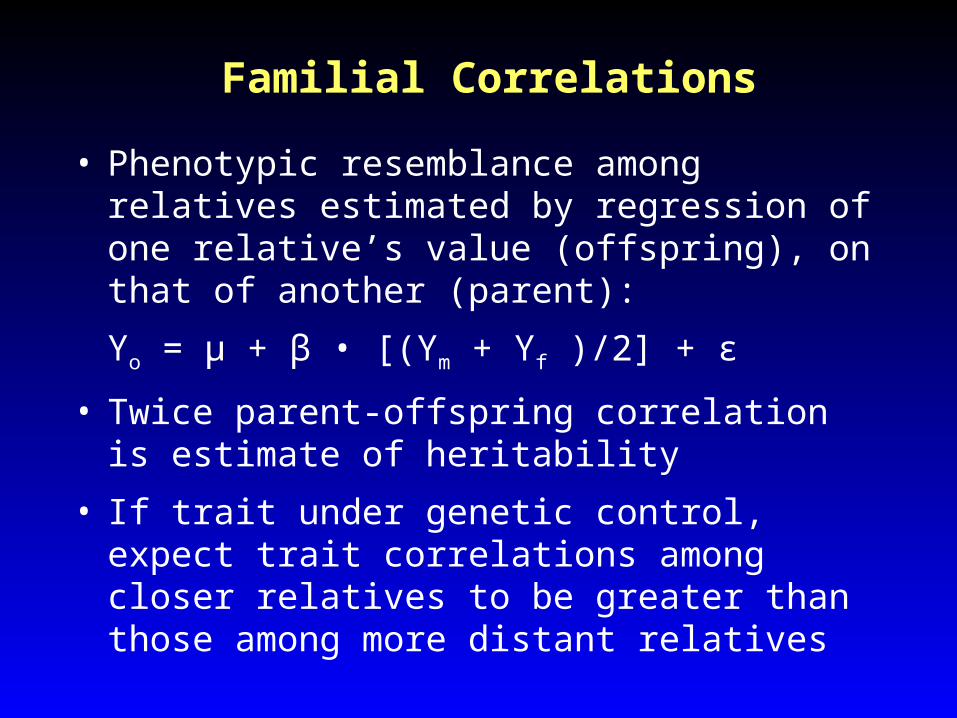
Familial Correlations
• Phenotypic resemblance among relatives estimated by regression of one relative’s value (offspring), on that of another (parent):
Yo = μ + β • [(Ym + Yf )/2] + ε
• Twice parent-offspring correlation is estimate of heritability
• If trait under genetic control, expect trait correlations among closer relatives to be greater than those among more distant relatives

Familial Correlations of Sex-Specific LV Mass, Multiply-
Adjusted
Relative PairPairs (n)
Correlation
Expected
Spouse 855 0.05 0
Parent-offspring
662 0.15 0.5
Sibling 1,486 0.16 0.5
Avuncular 369 0.06 0.25
after Post W et al, Hypertension 1997; 30:1025-1028.
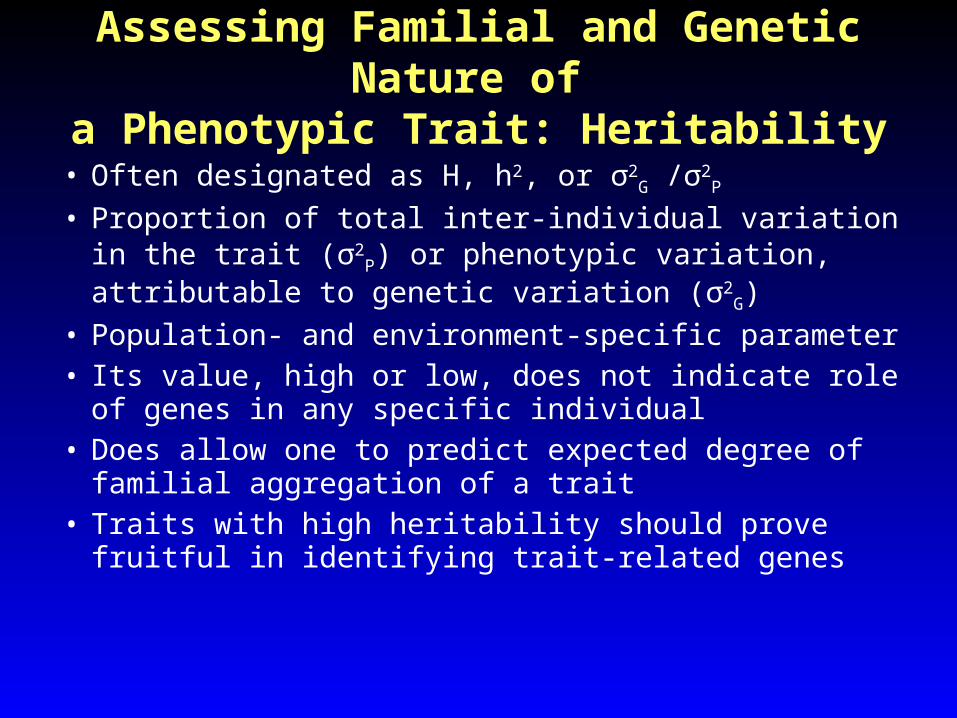
Assessing Familial and Genetic Nature of
a Phenotypic Trait: Heritability• Often designated as H, h2, or σ2
G /σ2P
• Proportion of total inter-individual variation in the trait (σ2
P) or phenotypic variation, attributable to genetic variation (σ2
G)• Population- and environment-specific parameter• Its value, high or low, does not indicate role of
genes in any specific individual• Does allow one to predict expected degree of
familial aggregation of a trait • Traits with high heritability should prove fruitful
in identifying trait-related genes
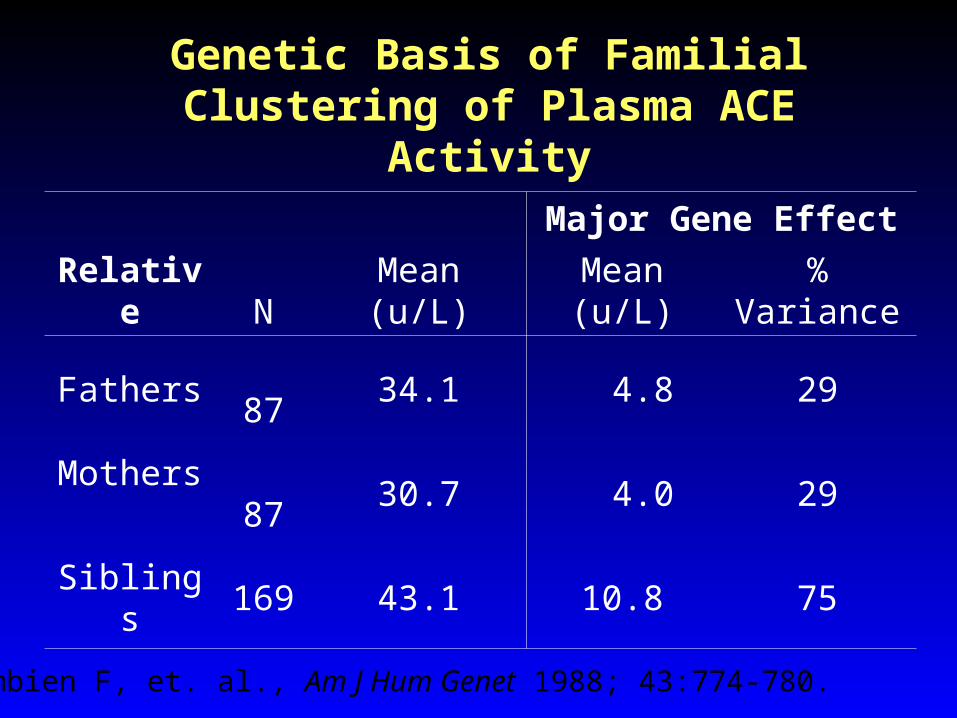
Genetic Basis of Familial Clustering of Plasma ACE Activity
Relative N Mean (u/L)
Major Gene Effect
Mean (u/L)
% Variance
Fathers 87 34.1 4.8 29
Mothers 87 30.7 4.0 29
Siblings 169 43.1 10.8 75
Cambien F, et. al., Am J Hum Genet 1988; 43:774-780.

Estimated Heritability Explained by GWA Findings to Date
Estimated GWA σ2
G
Estimated Total σ2
G Reference
Height 3% 90% Weedon Nat Genet 2008
T2DM λs = 1.07 λs = 3.5 Zeggini/ScottScience 2007
CRP ? 10.5% 30-50% Reiner/Ridker Nat Genet 2008
Psoriasis
9 @ ~1.3 OR
λs = 4-11Liu
PLoS Genet 2008
NHGRI GWA Catalog, www.genome.gov/GWAstudies
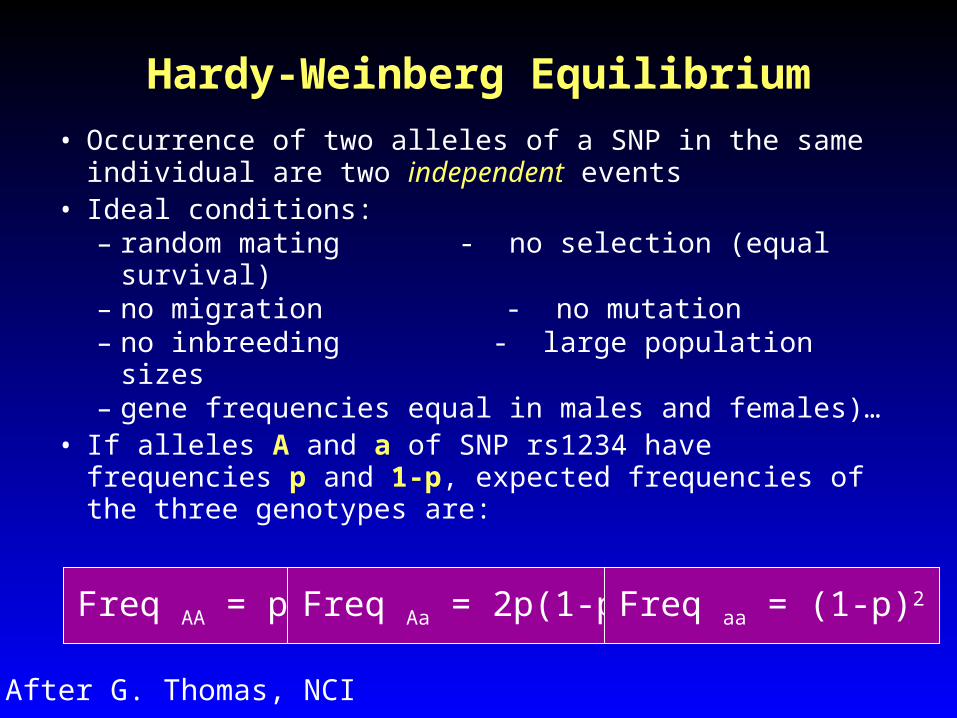
Hardy-Weinberg Equilibrium
• Occurrence of two alleles of a SNP in the same individual are two independent events
• Ideal conditions:– random mating - no selection (equal
survival)– no migration - no mutation– no inbreeding - large population sizes– gene frequencies equal in males and females)…
• If alleles A and a of SNP rs1234 have frequencies p and 1-p, expected frequencies of the three genotypes are:
After G. Thomas, NCI
Freq AA = p2 Freq Aa = 2p(1-p) Freq aa = (1-p)2
Summary Points: Familial Clustering
• Indicator of possible genetic influence
• May over-estimate genetic component due to poor assessment and adjustment for shared environment
• Methods include twin studies, parent-offspring correlation, “relative” relative risk, % variance explained
• Current genes for complex disease explain only tiny fraction of total heritability

Larson, G. The Complete Far Side. 2003.

Basic Definitions: Loci, Genes, Alleles
Locus: Place on a chromosome where a specific gene or set of markers resides
Quantitative trait locus (QTL): a genetic factor believed to influence a quantitative trait such as blood pressure, lipoprotein levels, etc.
Gene: Contiguous piece of DNA that can contain information to make or modify ‘expression’ of specific protein(s)
Allele: A variant form of a DNA sequence at a particular locus on a chromosome
Candidate gene: Gene believed to influence expression of complex phenotypes due to known biologic properties of their products
After S. Chanock, NCI

Basic Definitions: Parts of a Gene
Exon: a DNA sequence that usually specifies the sequence of amino acids in translation
Intron: an intervening DNA sequence removed from mRNA after transcription and thus does not encode protein in translation
Splice site: Junction of intron and exonPromoter: region of DNA to which an RNA
polymerase binds and initiates transcription - the promoter regulates gene expression by controlling the amount of mRNA transcribed
Polymorphism: Variation in the sequence of DNA among individuals
After S. Chanock, NCI

SNPs and Function: We know so little…
• Majority are “silent”– No known functional change
• Some alter gene expression/regulation– Promoter/enhancer/silencer– mRNA stability– Small RNAs
• Some alter function of gene product– Change sequence of protein
Courtesy S. Chanock, NCI

SNPs within Genes
Coding SNPs (cSNPs)• Synonymous: no change in amino acid
previously termed “silent” but…..Can alter mRNA stability
DRD2 (Duan et al 2002)Can alter speed of translation and protein folding
MDR1 (Gottesman et al 2007)• Nonsynonymous: changes amino acid (codon)
conservative and radical• Nonsense: insertion of stop codonFrameshift (insertion/deletion): Disrupts codon
sequence, rare but disruptive
After S. Chanock, NCI

SNPs Outside Genes
• Majority distributed throughout genome are “silent” (excellent as markers)
• Alter transcription– Promoter, enhancer, silencer
• Regulate expression– Locus control region, mRNA stability
• Most are assumed to be ‘silent hitchhikers’– No function by predictive models or
analysis
Courtesy S. Chanock, NCI

Sample Collection and Processing
• Obtaining samples for DNA preparation– whole blood, buffy coat– sputum– buccal cells– serum, urine– pathology specimens– placenta, excreta, other
• Purifying and quantifying DNA• Transformed lymphocytes• Whole genome amplification (WGA)• ‘Barcode’ individual DNAs (QC)
After S. Chanock, NCI