genetic variation and parentage in the ethiopian wolf ...usir.salford.ac.uk/36905/1/samantha a hook...
TRANSCRIPT

Genetic Variation and Parentage in the Ethiopian
Wolf Canis simensis
Samantha Alison Hook
Masters of Science by Research Thesis
University of Salford
School of Environment and Life Sciences
Submitted in Partial Fulfillment of the Requirements of the
Degree of Masters of Science by Research, October 2015

1
Contents
Contents ................................................................................................................................................1
List of Tables .........................................................................................................................................4
List of Figures ........................................................................................................................................5
Acknowledgments ................................................................................................................................6
Declaration............................................................................................................................................7
Abstract.................................................................................................................................................8
Chapter One: Introduction ...................................................................................................................9
1.1. The Ethiopian Wolf ......................................................................................................................10
1.1.1. Biology and Behaviour of Ethiopian Wolves .................................................................... 10
1.1.2. Geographical Range of Ethiopian Wolves........................................................................ 11
1.1.3. Bale Mountains National Park ......................................................................................... 14
1.2. Decline of the Ethiopian Wolf......................................................................................................15
1.2.1. Rabies and the Impact of Human Activity ....................................................................... 15
1.3. Population Genetic Bottlenecks and Conservation .....................................................................18
1.3.1. Inbreeding in Small Populations ...................................................................................... 19
1.4. Conservation Genetics and Genetic Markers ..............................................................................21
1.4.1. Microsatellites in Conservation Genetics ........................................................................ 22
1.4.2. Methods for Sampling in Conservation Genetics ............................................................ 22
1.5. Contributions of Molecular Techniques to Elucidate the Biology of Ethiopian Wolves .............25

2
1.6. Aims and Objectives ....................................................................................................................27
Chapter Two: Methods .......................................................................................................................29
2.1. Sampling Techniques ...................................................................................................................30
2.2. Selecting Microsatellite Markers .................................................................................................31
2.3. DNA Extractions ...........................................................................................................................34
2.4. Amplification................................................................................................................................34
2.5. Amplification Tests ......................................................................................................................35
2.6. Genotyping...................................................................................................................................36
2.7. Statistical Analysis........................................................................................................................37
2.7.1. Allele Scoring and Filtering the Data................................................................................ 37
2.7.2. Formatting for Software Analysis .................................................................................... 37
2.7.3. Scoring Errors and Deviations .......................................................................................... 37
2.7.4. Inbreeding Coefficient and Kinship.................................................................................. 38
2.7.5. Population Bottlenecks .................................................................................................... 38
2.7.6. Pack and Parentage Analysis............................................................................................ 38
Chapter Three: Results .......................................................................................................................41
3.1. Amplification Tests through Electrophoresis ..............................................................................42
3.2. Analysis of genotypes ..................................................................................................................43
3.2.1. Genotyping and Loci Removal ......................................................................................... 43
3.2.2. Scoring Errors and Null Alleles ......................................................................................... 43

3
3.3. Population Analysis......................................................................................................................47
3.3.1. Descriptive Population Overview .................................................................................... 47
3.3.2. Inbreeding Coefficients and Kinship ................................................................................ 48
3.4. Population Dynamics and Genetic Structures .............................................................................52
3.4.1. Pack Genetic Structure and Diversity .............................................................................. 52
Chapter Four: Discussion ....................................................................................................................57
4.1. Genotyping from Non-invasive Samples .....................................................................................58
4.2. Levels of Genetic Variation, Population Structure and Population History ................................60
4.3. Parentage and Exchange of Individuals between Packs..............................................................63
5. Conclusions .....................................................................................................................................67
5. References ......................................................................................................................................68
6. Appendix .........................................................................................................................................84
4
List of Tables
TABLE 1. An outline of the 51 individuals………………………………………………………………………30
TABLE 2: Characteristics of the 9 markers selected for this study………………………………… 33
TABLE 3. Homozygosity, scoring error and allele drop out…………………………………………… 44
TABLE 4. Estimated null allele frequencies…………………………………………………………………… 46
TABLE 5. Pack outline………………………………………………………………………………………………….. 47
TABLE 6. Observed and expected heterozygozities and fixation indices……………….………..48
Table 7. Results from Wilcoxon tests (Bottleneck)………………………………………………………. 50
TABLE 8. Pack allele diversity observed from the genotyped data……………………………….. 51
TABLE 9. Colony and coancestry analysis………………………………………………………………………55
5
List of Figures
FIGURE 1. Wolf Habitat………………………………………………………………………………………………….13
FIGURE 2. Agarose Gel Image………………………………………………………………………………………..42
FIGURE 3. Allele Frequency Histograms…………………………………………………………………………49
FIGURE 4. The Bayesian Clustering Method…………………………………………………………………..52
FIGURE 5. Box Plot Diagram of Pairwise Relatedness Coefficients…………………………………53
FIGURE 6. Infographic Design of Parental Analysis…………………………………………………………56

6
Acknowledgments
I am grateful to the University of Salford for accepting my application to conduct a
Masters by Research and providing the facilities in which I was able to conduct my work.
My special thanks go to Dr. Belgees Boufana for her assistance and direction which
maintained a good working environment within Cockcroft Laboratories.
I am enormously grateful to Dr. Freya van Kesteren for collecting the samples from the
Ethiopian wolves. Her precise detail, hard dedication, long hours and multiple years in the
field has provided me with a further opportunity in my field of work. Without her this
Masters by Research could not exist.
My greatest gratitude goes to my supervisor, Dr. Robert Jehle, who provided this amazing
opportunity in which I was able to study further. His guidance, breadth of knowledge and
dedication to conservation and genetics has been an inspiration to my career path and
without his teaching I could not be where I am today. His patience and understanding
have helped my progression immensely, especially under certain difficulties and times of
hardship in which I have had to face over the past two years.
Lastly I would like to thank my family and friends, with a particular mention to Thomas
Pinder. They have all provided a huge amount of support, which I am eternally grateful
for.

7
Declaration
I declare that, with the exception of any statements to the contrary, the contents of this
thesis are my own work, that the data presented herein has been obtained by
experimentation and that no part of the report has been copied from previous thesis’,
book, manuscripts, research papers or the internet.
Signed……………………………………………………………………………………………………………………………….
Print name…………………………………………Samantha Alison Hook…………………………………………..
Date………………………………………………………………………………………………………………………………….
8
Abstract
The Ethiopian wolf (Canis simensis) is among the most endangered canids in the world,
with only 300-500 individuals left in the wild. The most severe threats for the remaining
populations are habitat fragmentation, hybridisation with domestic dogs, and diseases
(rabies and canine distemper virus). The present MSc by Research applies DNA
fingerprinting (microsatellite genotyping) based on existing faecal samples collected
between 2007 and 2010 to (i) determine the standing amount of genetic variation after
recent rabies outbreaks, (ii) reveal the family structure within and between packs using
genetic parentage analysis, comparing the obtained results with existing data from field
observations and (iii) investigate the effects of recent rabies outbreaks on the genetics of
the population. In total, 43 individuals were successfully characterised based on seven
microsatellite loci, demonstrating that faecal samples collected several years before
analysis are a valuable source for DNA. This is approximately between 10% and 20% of
the total population of Ethiopian wolves. Parentage through software analysis in Colony
found posterior probabilities of no less than 1.00 for all six offspring individuals analysed.
The parentage assignments revealed that offspring regularly moved between packs,
which may be attributed to the loss of individuals through rabies during the period of
investigation. Analysis found through Coancestry determined that four out of six pairs of
parents were above the mean pair-wise relatedness coefficient. It was found that
inbreeding avoidance was not a contributing factor to producing offspring in the
population. The results of this study contribute to our understanding of the social system
of the Ethiopian wolf, document the consequence of disease outbreaks to pack structure,
and should be useful to devise future in-situ management plans towards stabilising the
existing amount of genetic variation.

9
Chapter One: Introduction
10
1.1. The Ethiopian Wolf
Endemic to the highlands of Ethiopia, the Ethiopian wolf Canis simensis is Africa’s rarest
and most endangered canid (Gottelli and Sillero-Zubiri 1994; Marino 2003; Marine and
Sillero-Zubiri 2011; EWCP 2013). The Bale Mountains contain the larges t number of
individuals, with approximately half of the estimated population size (Marino 2003;
Gottelli et al. 2004; Marino & Sillero-Zubiri 2011). Ethiopian wolves were classified as
Endangered in 2004 under the IUCN Red List, as the population is affected by habitat
fragmentation combined with a continuing decline in numbers of mature individuals
(Marino and Sillero-Zubiri 2011). he species as rst described b ppell in 1 35
ppell 1835; EWCP 2013; Marino & Sillero-Zubiri 2011). It did not receive full protection
from Ethiopia’s Wildlife Conservation egulations until 1974 Marino & Sillero-Zubiri
2011). Ethiopian wolves are one of four species of Canis within Africa, and were originally
thought to be closely related to African jackals (C. aureus, C. mesomelas, and C. adustus).
Phylogenetic analyses, however, revealed that Ethiopian wolves are more closely related
to the grey wolf (C. lupus) and the coyote (C. latrans, Gottelli et al. 1992). This charismatic
species has captured the attention of many organisations across the globe, encouraging
numerous studies and leading to large media attention. As there are no animals in
captivity, the only opportunity to document and study the wolves is in their natural
environment (Marino and Sillero-Zubiri 2011; EWCP 2013).
1.1.1. Biology and Behaviour of Ethiopian Wolves
Ethiopian wolves are found in packs of between 2 and 18 adult individuals, with well -
defined hierarchies (Randall et al. 2004). Each pack is a cohesive social family, with
communal territories averaging 6 km² in size (Sillero-Zubiri and Gottelli 1995; EWCP
2013). Its morphology is very distinct, with long legs and muzzle. The main pelage of adult

11
wolves is bright rufous with a white underbelly. Males are on average 20% larger than
females; males weigh up to 20 kg, while females reach no more than 16 kg (Sillero-Zubiri
and Macdonald 1994). Typically one pack comprises one dominant male and female, with
subordinate wolves who all cooperatively share roles in territory defence and nurturing
offspring (Sillero-Zubiri et al. 1996). Females become receptive to mating between August
and November (Sillero-Zubiri et al. 1998), with a gestation period that lasts between 60
and 62 days (Sillero-Zubiri et al. 1996). The dominant male and female are the only pair in
a pack to copulate and produce young, although dominant females are receptive to
visiting males from neighbouring packs if the opportunity arises (Sillero-Zubiri et al.
1996). During the mating season, levels of testosterone and glucocorticoid are higher in
dominant males than their subordinates (van Kesteren et al. 2012). Similarly, dominant
females’ estradiol concentrations increase above that of their subordinate females during
the mating season (van Kesteren et al. 2013). Dominant females are typically replaced
after death by a subdominant resident daughter, resulting in a high risk of inbreeding
(Randall et al. 2007). Dominant females usually produce litter sizes of up to six pups, and
all group members participate in parental care (Sillero-Zubiri et al. 2004). Studies in the
Bale Mountains have shown that the distribution and abundance of the Ethiopian wolves
follows that of its main prey, afroalpine rodents such as the giant molerat Tachyoryctes
macrocephalus (Sillero-Zubiri et al. 1994; Sillero-Zubiri & Gottelli 1995; van Kesteren et al.
2012; van Kesteren et al. 2013; EWCP 2013).
1.1.2. Geographical Range of Ethiopian Wolves
Ethiopian wolves currently exist in six extant populations at altitudes of 3,000–4,500 m:
Simien Mountains, North Wollo and South Wollo highlands, Guassa-Menz, Arsi
Mountains and the Bale Mountains (Figure 1, Sillero-Zubiri and Gottelli 1995; Marino

12
2003; Marino and Sillero-Zubiri 2011). They are endemic to the Ethiopian highlands North
and South of the Great Rift Valley. Across their range, rainfall varies between 1,000 and
2,000 mm/year, and the high altitude undergoes one pronounced dry period annually
from December to March (EWCP 2013). Due to the greater agricultural pressure in the
Northern highlands, wolves are becoming increasingly restricted to elevations above
3,500 m (Yalden et al. 1980; Marino 2003; Haydon et al. 2006). Previous habitat ranges
where Ethiopian wolves have recently become extinct include the Gosh Meda (North
Shoa) and Mount Guna, while in Mount Choke Ethiopian wolves have been extinct for
several decades (Figure 1, Marino 2003; EWCP 2014).

13
FIGURE 1. Wolf habitat still existing within the Ethiopian Highlands. The Bale Mountains is
extended to display the different regions found within the area. Adapted from Marino
(2003).
14
1.1.3. Bale Mountains National Park
The Bale Mountains National Park (BMNP) was proposed in 1960 in order to conserve the
largest tract of afroalpine habitat on the continent, together ith Ethiopia’s t o most
charismatic mammalian endemics (the mountain nyala Tragelaphus buxtoni and the
Ethiopian wolf; Hillman 1986; Refera and Bekele 2004). A project to formulate
management plans for future conservation efforts did not occur until 1983, funded by
Wildlife Conservation Society under the auspices of the Ethiopian Wildlife Conservation
Organisation (Hillman 1986; Hillman 1988; Sillero-Zubiri et al. 1994; Marino 2003). This
plan enabled the establishment of the BMNP, and today the park conserves 2,200 km² of
highlands, mountains and lowland forests (located in the eastern portion of the
mountains, Hillman 1988). The BMNP is located in the south-east of the Ethiopian
highlands, south of the Great Rift Valley (Figure 1). The park lies 400 km south-east of the
capital Addis Ababa, and due to its extreme altitudinal range is characterised by a wide
array of different habitat types (Hillman 1986; Hillman 1988; BMNP 2015). These include
northern grasslands (located at Gaysay, Figure 1), juniper woodlands (located at the parks
headquarters), afroalpine habitats (located at the Sanetti Plateau and Web Valley, Figure
1), the Erica belt of moorlands, forests and the Harenna Forest (located across the BMNP,
BMNP 2015). The close proximity of these rich habitats to the capital has resulted in
significant human impacts. A government changeover in 1991 created civil unrest which
disrupted the management of the BMNP, leading to an increase in encroachment of
human settlements and livestock densities within the park boundaries (Stephens et al.
2001; Vial et al. 2010). The expansion and intrusion of the human population into remote
areas such as the Bale Mountains often generates pronounced peaks in the threats to, or
extinction of, native fauna and flora (Vial et al. 2010).

15
1.2. Decline of the Ethiopian Wolf
The total number of Ethiopian wolves in the wild is currently estimated at around 300 to
500 individuals (Haydon et al. 2006; Randall et al. 2007; Marino 2003). There are no
reliable population estimates prior to 1986, and it is therefore impossible to determine
the extent of recent declines (Marino and Sillero-Zubiri 2011). Nevertheless it seems
reasonable to assume that current the number of Ethiopian wolves is a small fraction of
that which existed before the impact of human activity. Recent declines are the result of
direct human-wolf interactions, but perhaps more importantly, due to the effects of
rabies which may be caused by a local increase in the number of domestic dogs.
1.2.1. Rabies and the Impact of Human Activity
Rabies is one of the oldest recorded zoonotic infectious diseases and is enzootic for a
broad range of mammalian hosts (Tabel et al, 1974, Adamovich 1985; Butzeck 1987;
Theberge et al. 1998). Without correct management, rabies can contribute to the decline
and even extinction of wild species. Rabies is now the most common disease occurring in
wild canids (Cleaveland et al. 2002; Funk et al. 2003; Randall et al. 2004; Woodroffe et al.
2004). The Ethiopian wolf is a prime example of how outbreaks in rabies can dramatically
affect a population (Randall et al. 2004). Outbreaks within Ethiopian wolf populations
have only been published for the previous 25 years; however, the disease has likely been
a threat for centuries (Randall et al. 2004).
Rabies is an acute encephalomyelitis virus that is part of the genus Lyssavirus ‘l ssa’ from
the Greek meaning ‘rage’, Jackson & Wunner 2007). he rabies virus ABV) is one of
fourteen defined strains of the Lyssavirus that are zoonotic, causing progressive
encephalomyelitis in humans (Linscott 2012; Jackson 2013). RABV can be found on every
continent (with the exception of the Antarctic) due to the large distribution of

16
mammalian reservoir hosts, consisting of various carnivore and bat species (Jackson
2013). Although it is one of the oldest recorded infectious diseases on the planet, there is
still no effective vaccination and treatment which could potentially eradicate the virus
(Butzek, 1987; Theberge et al. 1998). It is typically transmitted to humans through bites
containing RABV-infected saliva (Jackson & Wunner 2007; Linscott 2012; Jackson 2013).
RABV enters the peripheral nerves and travels to the brain for replication. RABV then
spreads via the nervous system to tissues, concentrating largely in the saliva glands
(Linscott 2012). Once symptoms are present in an individual, the disease is nearly always
fatal (World Health Organisation 2013). More than 55,000 people die annually from
rabies, 90% of which in Asia and Africa (World Health Organisation 2013) where there is a
lack of effective health systems and domestic animal vaccination programs (Sterner &
Smith 2006). In Ethiopia approximately 10,000 human deaths per year are caused by
rabies (Fekadu 2007; Jemberu et al. 2013). This high mortality rate has made Ethiopia one
of the worst affected countries in the world (Jemberu et al. 2013). Unvaccinated
domestic dogs have been found to be the main reservoir of RABV, with more than 90% of
rabies in humans originating from a domestic dog. However, little research has been
done to identify other possible wildlife reservoirs (Randall et al. 2004; Haydon et al. 2006;
Sterner & Smith 2006; Jemberu et al. 2013).
Between 35,000 and 40,000 people live within the Bale Mountains National Park
boundaries (FZS 2007; Vial et al. 2010; Randall et al. 2011). The large number of
settlements within the park boundaries also leads to an increase in the local abundance
of livestock and in particular domesticated dogs (Stephens et al. 2001; Atickem et al.
2009). It has been estimated that, in Ethiopia, one in every five households owns a dog
(Deressa et al. 2010). Within the Web Valley of the Bale Mountains , domestic dog
17
densities range from 4 dogs/km² in the dry season to 10 dogs/km² in the wet season
(Atickem et al. 2009). The sympatric relationship between domestic dogs and humans has
altered the dynamics of infectious diseases and increased the disease susceptibility for
Ethiopian wolves. Serious impacts of rabies on susceptible host populations occur when
RABV is maintained within populations of abundant reservoir hosts (Haydon et al. 2002;
Randall et al. 2004; Woodroffe et al. 2012). Transmission is due to close contact between
wolves and dogs, which can cause major outbreaks within susceptible populations
(Haydon et al. 2002; EWCP 2014). In the case of Ethiopian wolves, future outbreaks of
rabies could have devastating effects. Since 1995, efforts have been made to control the
spread of infectious diseases within the Ethiopian wolf population of the Bale Mountains
(EWCP 2014). The transmission of rabies is currently being tackled through vaccinations
of the domestic dog population (Haydon et al. 2002; FZS 2007; Randall et al. 2011; EWCP
2014).
In Ethiopia, rabies has been recognised for many centuries. The first recordings of rabies
within Ethiopian wolves were published by Sillero-Zubiri et al. (1996). The outbreak began
in 1988 and ended in 1992. Sillero-Zubiri et al. (1996) studied C. simensis in the Bale
Mountains, specifically the Web Valley and Sanetti Plateau (all separated by only 15km),
from October 1991 to February 1992. Out of the 53 individuals observed, 41 died or
disappeared (Sillero-Zubiri et al. 1996). In 2003 and 2004, a further 38 carcasses were
recovered in the Web Valley after another outbreak emerged, and 36 individuals were
reported to have disappeared (Randall et al. 2004). Recovery of all wolf carcasses is
unfeasible in the vast area of the Bale Mountains and therefore it is impossible to
determine how many of these disappearances are due to rabies (Randall et al. 2004;
Sillero-Zubiri et al. 2006). However, rabies has been identified as the prime candidate for
18
sudden drop in numbers through death and disappearance (Randall et al. 2004). A further
outbreak of rabies was confirmed between October 2008 and May 2009, when five brain
samples were recovered from wolf carcasses (Johnson et al. 2010).
Mass reductions from outbreaks of disease in any endangered species can have dramatic
effects on the future of a population. Genetic variation is critical for levels of fitness and
survival for future generations of a given species. In order to record the effects of RABV
outbreaks on the genetic structure of Ethiopian wolves, genetic monitoring from
individuals within the population before and after outbreaks is crucial.
1.3. Population Genetic Bottlenecks and Conservation
Genetic variation in a changing environment is a key factor for enabling adaptation and
therefore survival. Loss of genetic diversity can be caused by a number of events but
ultimately they have the same outcome: lower levels of fitness and higher risks of
extinction. A population bottleneck is defined as an event which dramatically reduces the
effective size of a population, leading to a sharp temporary increase in genetic drift
resulting in low levels of genetic variation (Nei et al. 1975; Wright 1986; Lacy 1987;
Nature Ed. 2014). Genetic variation is influenced largely by the number of individuals ,
which contributes to short and long-term persistence of a given population (England et al.
2003). Most allele frequencies are stable and bettermaintained in larger populations over
long periods of time (England et al. 2003). Genetic drift results in infrequently occurring
alleles and lower genetic diversity, and after a bottleneck event the small remaining
population faces a higher level of inbreeding (Nei et al. 1975; Chevolot et al. 2008; Cohen
et al. 2013). The resulting population is susceptible to fixation of mildly deleterious
mutations, further decreasing the given quality of a gene pool (Lande 1994; Luikart 2002).
19
Low genetic diversity can substantially contribute to the risk of extinction by reducing
fitness (Hedrick and Miller, 1992; Brakefield and Saccheri, 1994). It has also been
hypothesised that the loss of alleles can create populations containing individuals which
are genetically distinct from original populations (Avise et al. 1987). Ultimately, a
bottlenecked population is at higher risk of being unable to adapt to new selection
pressures within its niche environment, such as a shift in available resources or disease
(Nei et al. 1975; Lande 1994). A bottleneck event increases the probability that the
amount of genetic variation required during a selection process may have previous ly
drifted out of the population (England et al. 2003; Cohen et al. 2013).
Luikart et al. (2002) found that some bottlenecks can occur in a population that are
undetectable by traditional demographic monitoring approaches such as capture-mark-
recapture. hese t pes of bottlenecks are defined as ‘cr ptic bottlenecks’, and
demonstrate the importance of implementing genetic monitoring within management
programs for threatened or endangered species (Luikart et al. 2002). A bottleneck can
greatly reduce population genetic variation, even if it is short lived (less than two
generations long, Hongye and Roossinck 2004). On the other hand, if a bottleneck
population accepts immigrants from neighbouring populations, the loss of genetic
variation can be reduced or even reversed (Vilà et al. 2003). Many threatened and
managed species, such as Ethiopian wolves, are currently suffering from bottlenecks
(Randall et al. 2010).
1.3.1. Inbreeding in Small Populations
Inbreeding is defined as the mating of individuals related by ancestry for the production
of offspring (Marcovitch 2010). It is measured as the probability that two alleles on a
given locus are identical by descent, as measured through the inbreeding coefficient (F). F
20
ranges from outbreds at a value of 0 to completely inbred individuals at a value of 1. An
increased probability of homozygosity and exposure to recessive/rare deleterious alleles
is found within inbred offspring, reducing reproductive fitness (Frankham et al. 2010).
These factors are the primary cause of inbreeding depression (Hedrick and Fredrickson
2008). Genetic rescue via the introduction of unrelated individuals from alternative
populations (such as captive populations) is often advised to reduce inbreeding
depression (Hedrick and Fredrickson 2008). This eliminates deleterious alleles from the
population due to natural selection, known as purging (Boakes et al. 2007). Purging has
been seen as modest in experimental evidence, and inbreeding depression is likely to
continue if an inbred population is exposed to further inbreeding (Boakes et al. 2007).
Inbreeding is often an effect of isolation. It is important to test the levels of inbreeding in
isolated population fragments. The knowledge of genetic stability and viability through
monitoring the fragmented and isolated population is essential for a species future
existence.
Due to their low population size, Ethiopian wolves require a genetic monitoring
programme which also takes inbreeding into account. Inbreeding can be measured
through genetics by measuring the inbreeding coefficient. The inbreeding coefficient
determines the strength of inbreeding by using the fixation indices (FIS). FIS determines
the probability that two alleles within an individual are Identical By Descent (IBD). An
increase in homozygosity or fixation of alleles results from inbreeding. A higher FIS value
indicates a considerable degree of inbreeding. Numerous software applications have
been developed to calculate the inbreeding coefficient once individual alleles have been
detected. The inbreeding coefficient is becoming a more commonly used method in
conservation genetics.
21
1.4. Conservation Genetics and Genetic Markers
Conservation genetics has been defined as the application of evolutionary and molecular
genetics to biodiversity conservation (Frankham 2010). This science has undergone
exponential growth over the past 25 years, taking the theory-based concepts of
population genetics into an empirical discipline (Ouborg et al. 2010). The use of genetics
is now being actively applied to the field of conservation, ultimately improving the
genetic viability of wild and captive populations of endangered species (Frankham et al.
2010; Marucco et al. 2011). Conservation genetics is often overlooked in international
wildlife policies (Bouzat 2010; Laikre 2010), although molecular techniques could play a
vital role in the management of populations. Developments in technology for molecular
genetics have generally led to an extensive use of genetic markers in the last decades
(Ouborg et al. 2010; Gardner et al. 2011). Genetic markers such as allozymes,
microsatellites and mitochondrial and nuclear DNA sequences allow the study of
individual relatedness, population size and population dynamics. Molecular marke rs can
also be used to assess genealogical relationships, to determine fine scale genetic
structuring and to measure genetic differentiation and gene flow within and between
populations (Luikart et al. 1998; Marino et al. 2005; Waits and Paetkau 2005; Selk oe and
Toonen 2006; Schwartz et al. 2007; Randall et al. 2009; Munday and Knight 2010; Mullins
et al. 2010; Olsen et al. 2012). Recent developments in next generation sequencing,
whole genome scans and gene-expression pattern analysis have also begun to play an
important role in the growth of conservation genetics (Allendorf et al. 2010; Frankham et
al. 2010; Frankham 2010; Davey et al. 2011). Advancement of laboratory techniques has
generated more cost effective genetic marker methodologies that can analys e larger
numbers of individuals with multiple loci (Guichoux et al. 2011). Improvements in
22
computer technology have produced software packages that apply statistical approaches
to laboratory-generated datasets (Selkeo and Toonen 2006).
1.4.1. Microsatellites in Conservation Genetics
Microsatellites were first used in natural populations more than 20 years ago (Ellegren
1991; Schlotterer et al 1991), and since then they have become an increasingly important
part of population genetics and molecular ecology (Gardner et al. 2011). Microsatellite
markers can also be termed simple sequence repeats (SSR) or short tandem repeats
(STR), and are found in both prokaryotic and eukaryotic genomes (Zane et al. 2002;
Bhargave and Fuentes, 2010). They consist of between 1 and 6 nucleotides, which display
a high level of allelic polymorphism based on differences in numbers of repeat motifs
between individuals (Zane et al. 2002; Selkoe and Toonen, 2006). Although exact
mechanisms of polymorphism in microsatellites are unknown, the most likely cause is
due to slippage events during DNA replication (Schlötterer & Tautz, 1992). Typically
microsatellite loci are amplified by polymerase chain reactions (PCR), using fluorescently-
labelled primers for fragment detection. Applications of microsatellite markers include
quantifying genetic diversity, loss of heterozygosity, parentage analysis, linkage mapping,
and animal and plant species and individual identification.
1.4.2. Methods for Sampling in Conservation Genetics
The application of population genetic tools and theories to practical conservation can
ultimately reduce the risk of extinction in threatened species (Frankham et al. 2010). In
order to directly access information at DNA level, samples must be collected. There are
three different types of sampling methods; destructive, non-destructive and non-
invasive. Destructive sampling involves an animal ultimately being destroyed for the
collection of tissue for genetic analysis (Taberlet et al. 1999). Non-destructive sampling

23
requires capture of an animal for the removal of blood or tissue (such as a feather, toe or
ear clipping, Taberlet et al. 1999). Lastly, non-invasive sampling, which is becoming more
accessible with the improvement of genetic techniques, is restricted to situations
whereby DNA is collected from a source left by an animal (Waits and Paetkau 2005).
Examples include faeces and urine, shed or snagged fur, skin or feathers, egg shells or
skulls found in owl pellet remains (Poulakakis et al. 2005; Schmaltz et al. 2006; Brinkman
et al. 2010; Mullins et al. 2010; Olsen et al. 2012).
Non-invasive sampling is attractive for use in conservation genetics as it allows for the
genetic study of populations without ever having to observe, physically restrain or
capture the animal (Waits and Paetkau 2005; Schwartz et al. 2007). In cases where
species are endangered and/or elusive, this technique provides an excellent opportunity
to collect conservation-relevant data of individuals without disrupting to their natural
behaviour (Adams and Waits 2007; Broquet et al. 2007; Janečka et al. 2008; Pérez et al.
2009; Mondol et al. 2009). The large majority of studies using non-invasive sampling rely
on the use of samples collected from hair or faeces (Broquet et al. 2007). New
methodologies enable scientists to extract DNA non-invasively and more efficient
methods for genetic conservation are continually being developed, making the
techniques attractive to researchers (Waits and Paetkau 2005; Broquet et al. 2007).
Faecal samples produce a higher yield of DNA than from a single hair sample; however,
they contain large amounts of alien DNA from the digestive tracts and external
environment during decomposition (Taberlet et al. 1999; Taberlet and Luikart 1999;
Brinkman et al. 2010). Faecal samples have also been found to contain inhibitors that can
lead to unsuccessful PCR (Broquet et al. 2007; King et al. 2008; Shimatani et al. 2008;
Rivière‐Dobigny et al. 2009). These vary with diet, and most difficulties are found in
24
studies where faeces contain remnants of plants (Broquet et al. 2007). Broquet et al.
(2007) found that there is no difference between genotyping error rates of hair and
faecal samples.
Most studies using microsatellites with non-invasive sampling rely on individual
identification based on 5 to 10 hypervariable genotyped loci (Taberlet and Luikart 1999).
DNA genotyping must be free from error in order to properly assess the species
conservation genetics (Taberlet et al. 1999; Taberlet and Luikart 1999). Non-invasive
samples are usually taken from extracts of the individuals targeted, and therefore have a
high probability of DNA degradation and/or contamination from alien DNA (King et al.
2008; Shimatani et al. 2008; Rivière‐Dobigny et al. 2009). This can reduce the
amplification success and also increase genotyping errors; however, by using specific
primers, amplification of alien DNA can largely be avoided (Broquet et al. 2007).
The many benefits of combining non-invasive sampling and conservation genetics have
attracted an increase in recent research using the methodology. Most monitoring
programs researching anthropogenic changes to natural ecosystems have yet to take full
advantage of the potential of non-invasive sampling and conservation genetics (Schwartz
et al. 2007; Frankham et al. 2010; Marucco et al. 2011). These can provide relevant
ecological and evolutionary information, while costing less and maintaining a higher level
of accuracy and sensitivity than traditional monitoring approaches (Schwartz et al. 2007).
By understand the current level of genetic variation in rare, fragmented and/or
endangered populations; monitoring programs can contribute to our understanding on
how to further conserve a given species (Luikart et al. 2002; Boakes et al. 2007; Schwartz
et al. 2007).

25
1.5. Contributions of Molecular Techniques to Elucidate the Biology of
Ethiopian Wolves
In the last twenty years, DNA analysis has expanded the knowledge of Ethiopian wolf
biology (Gottelli et al. 1994; Marino et al. 2005; Marino 2003; Randall et al. 2007; EWCP
2013). Gottelli et al. (1994) determined the relationship of Ethiopian wolves to other
wolf-like canids through phylogenetic analysis of mitochondrial DNA (mtDNA sequences).
Ethiopian wolves were defined as a distinct species which is more closely related to
domestic dogs (C. lupus), coyotes (C. latrans) and grey wolves (C. lupus) than any other
African canid (Gottelli et al. 1992). The sympatric relationship that domestic dogs and
wolves share has proven to result in hybrids (Gottelli et al. 1992; Randall et al. 2007;
Sillero-Zubiri & Macdonald 1998). Gottelli et al. (2004) used mtDNA to study the genetic
diversity of the seven isolated populations of Ethiopian wolves. The partitioned mtDNA
haplotypes were most likely a result of Pleistocene global climatic changes that occurred
with the end of glaciation around 10,000-15,000 years ago, causing habitat reduction and
fragmentation (Gottelli et al. 2004).
Randall (2006) optimised microsatellites derived from domestic dogs for non-invasive
faecal samples of Ethiopian wolves, demonstrating that there is a 99% overlap in
genotypes created based on faecal and tissue samples. Randall et al. (2007) extended this
research to elucidate kinship between packs, parentage of pups and inbreeding. Breeding
pairs of Ethiopian wolves were often unrelated, although mean pair-wise relatedness
within packs was significantly higher than estimated from observations (Randall et al.
2007). This provided evidence for female-biased dispersal, which has resulted in
decreasing inbreeding (Randall et al. 2007). Randall et al. (2009) used microsatellite data
to assess the fine-scale genetic structure in Ethiopian wolves in the Bale Mountains. The

26
study evaluated the impact of historical versus recent demographic process on the
genetic variation on several small populations within this area. There was a higher genetic
variation in the Bale Mountains than previously reported by Gotelli et al. (2004). This was
influenced by geography and social structure, showing the importance of population
dynamics. Genetic similarity was found between neighbouring packs, indicating gene flow
between them (Randall et al. 2009).
Due to the small population sizes of the Ethiopian wolf, they are likely highly susceptible
to genetic drift and random fixation or loss of rare alleles (Lacy 1987). Genetic diversity is
therefore deemed to avert the negative effective of inbreeding (Randall et al. 2007;
Sillero-Zubiri et al. 1996; Loeschcke et al. 1994).
27
1.6. Aims and Objectives
This thesis sets out to investigate further the genetic variation and parentage analysis of
the Ethiopian wolf. As the rarest canid in Africa, with a total population of no more than
500 individuals, the Ethiopian wolf is an ideal species for testing theoretical predictions of
the role of genetics in conservation. The mechanisms that are shaping the genetic
variation of the species will be strongly influenced by the environmental factors such as
behaviour, population dynamics and disease. Multiple projects have been established
under the Ethiopian Wolf Conservation Programme (EWCP) which is a current
partnership between many research institutes and charities (EWCP 2013). The Ethiopian
wolf has become a special case for understanding genetic variation and parentage due to
its precarious conservation status. The only existing populations are small and isolated.
This may ultimately result in population extinction.
The main aims of this thesis are to:
(i) Document the standing amount of genetic variation of Ethiopian wolves from
the population existing between 2007 and 2010 in the Web Valley
(ii) Compare the allelic diversity with studies based on previously collected
samples
(iii) Clarify the genetic relatedness between the whole population and individuals
within each pack.
(iv) Investigate whether the previous rabies outbreak had putative effects on the
genetic structure of the Web Valley population of Ethiopian wolves.

28
The objective is to use faecal samples collected from the Web Valley region the Bale
Mountains to successfully extract and amplify DNA with multiple microsatellite loci.
Faecal samples were collected between 2007 and 2010 and stored at -20ºC; however, it is
recognised that a certain level of degradation may have occurred over time. Upon
successful DNA extractions, samples will be amplified with microsatellite loci originally
designed for the domestic dog by Breen et al. (2001) and optimised for Ethiopian wolf
DNA by Randall et al. (2006). Microsatellite data will be used to reveal the amount of
allelic diversity within the population using population genetics software. Individual
multilocus fingerprints from microsatellites will determine the population structure and
infer genealogical structure.
Despite the importance of studying genetics for the conservation of the Ethiopian wolf,
there has been no published study since 2007, highlighting the great importance of this
thesis for the future of the species.

29
Chapter Two: Methods
30
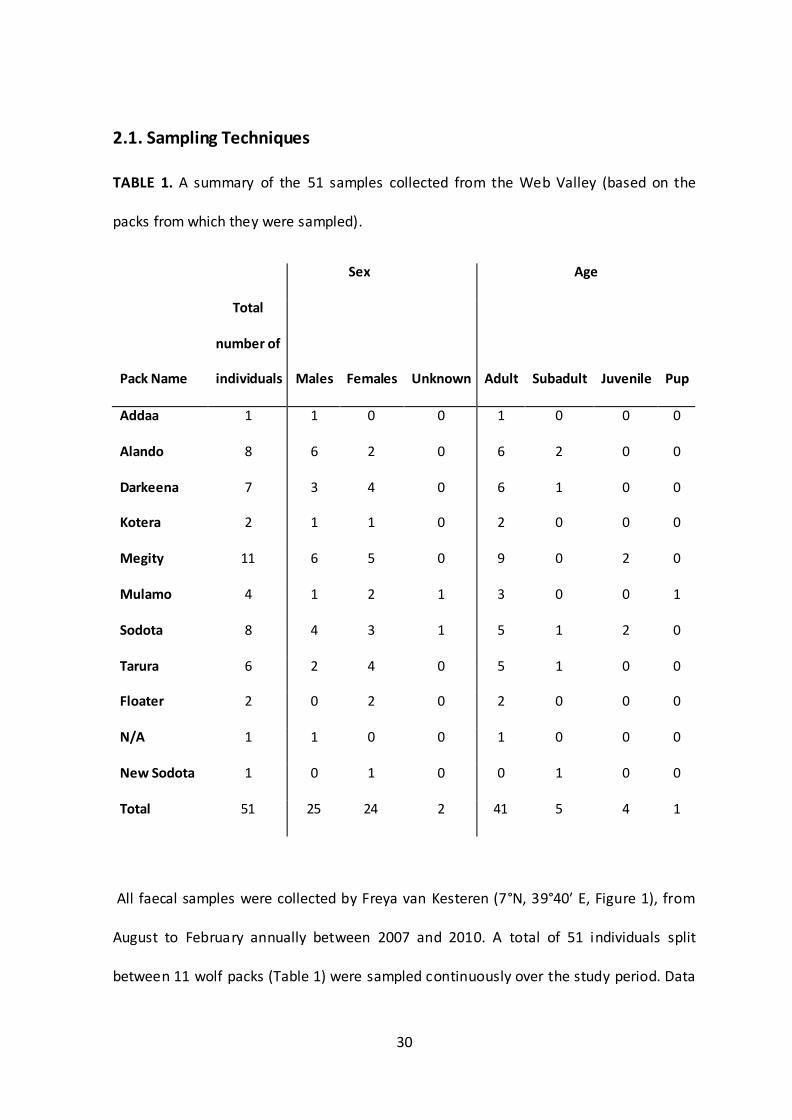
2.1. Sampling Techniques
TABLE 1. A summary of the 51 samples collected from the Web Valley (based on the
packs from which they were sampled).
Sex Age
Pack Name
Total
number of
individuals Males Females Unknown Adult Subadult Juvenile Pup
Addaa 1 1 0 0 1 0 0 0
Alando 8 6 2 0 6 2 0 0
Darkeena 7 3 4 0 6 1 0 0
Kotera 2 1 1 0 2 0 0 0
Megity 11 6 5 0 9 0 2 0
Mulamo 4 1 2 1 3 0 0 1
Sodota 8 4 3 1 5 1 2 0
Tarura 6 2 4 0 5 1 0 0
Floater 2 0 2 0 2 0 0 0
N/A 1 1 0 0 1 0 0 0
New Sodota 1 0 1 0 0 1 0 0
Total 51 25 24 2 41 5 4 1
All faecal samples ere collected b Fre a van Kesteren 7°N, 39°40′ E, Figure 1), from
August to February annually between 2007 and 2010. A total of 51 individuals split
between 11 wolf packs (Table 1) were sampled continuously over the study period. Data
31
including region, pack, age, sex and ID were recorded for each sample collected
whenever possible. Individuals were identified by ear tags or individual markings.
Individuals were previously tagged by the Ethiopian Wolf Conservation Programme
(EWCP 2013). All samples were stored at -20ºC before DNA extractions.
2.2. Selecting Microsatellite Markers
Breen et al. (2001) developed the first fully integrated canine genome map, defining a
total of 1800 microsatellite markers covering more than 90% of the dog genome. Based
on this source, 17 microsatellites (16 tetranucleotides and 1 dinucleotide) were identified
as polymorphic in Ethiopian wolves by Randall et al. (2006). To quantify the applicability
of these markers for parentage inferences and to quantify their amount of
polymorphism, Randall (2006) used the probability of identity among siblings (PIDsib)
based on the equation published by Evett and Weir (1998), and found that only 5 are
needed to distinguish between random pairs of individuals with 99.0% certainty (PIDsib =
0.01). By selecting 8 of the most informative markers, a 99.9% certainty (PIDsib = 0.001)
to determine between individuals was found (Randall, 2006). For the present study, 9 out
of these 17 markers were selected based on PIDsib, total error rate per reaction (Erxn),
allelic dropout rate (ADO), false allele rate (FA) and probability of false homozygote
(P(FH)), based on Randall (2006), and used here. Only tetranucleotide repeat loci markers
were chosen, as they have a tendency to be more polymorphic than dinucleotide repeat
markers (Mellersh et al. 2000), and lower incidence of stutter peaks and are easier to
score (Murray et al. 1993). A list of the markers chosen is shown in Table 2. Forward
primers were labelled with fluorescent dyes FAM, AT550 or HEX. All three dyes were

32
multiplexed, ensuring the expected allele size range did not overlap for loci with identical
dyes.

33
TABLE 2: Characteristics of the 9 markers selected for this study. Primer sequences 5’ to
3’, expected allele size ranges are taken from Randall et al. (2006).
Locus Primer sequence Length Dye Expected Allele Size
Range
FH2001
F: TCCTCCTCTTCTTTCCATTGG 21 FAM 129 - 149
R:TGAACAGAGTTAAGGATAGACACG 24
FH2054
F: GCCTTATTCATTGCAGTTAGGG 22 AT550 161 – 185
R: ATGCTGAGTTTTGAACTTTCCC 22
FH2137
F: GCAGTCCCTTATTCCAACATG 21 FAM 157 – 173
R: CCCCAAGTTTTGCATCTGTT 20
FH2138
F: AATGTGCCCAACATTCCACT 20 HEX 313 – 342
R: AAGTCCCATGTCAGGCTCC 19
FH2140
F: GGGGAAGCCATTTTTAAAGC 20 AT550 127 – 150
R: TGACCCTCTGGCATCTAGGA 20
FH2226
F: GGACTACCCCATTGCATTTG 20 AT550 190 – 211
R: GAATCGAGTCCCATATCGGG 20
FH2422
F: TTGCCCGTCCTATACTCCTG 20 FAM 205 – 220
R: CCACATGATTTCACTTGTATATGG 24
FH2472
F: ATTGTCTGTTAACCAAACCTGC 22 AT550 264 – 313
R: AGTCCTTCGAGTGAGTGAGGT 21
PEZ19
F: GACTCATGATGTTGTGTATC 20 HEX 186 – 202
R: TTTGCTCAGTGCTAAGTCTC 20

34
2.3. DNA Extractions
DNA extractions were carried out using a QIAamp® DNA Stool Mini Kits (Qiagen, 2010).
The procedure was conducted in a separate lab from that used for PCR reactions to
prevent cross contamination with post PCR products. Negative controls were included in
each set of extractions to monitor contamination. The manufacturer’s protocol was
followed except that 100 mg of faeces was used, compensated by increasing the amount
of ASL buffer. Pre-sterilized barrier-filter tips were used during the extractions. DNA was
stored at -20ºC.
2.4. Amplification
A Touchdown Polymerase Chain Reaction (TD-PCR) was used to amplify the chosen 9
microsatellites (Table 1), using a Veriti 96 Well Thermal Cycler (Applied Biosystems). Each
10 µl reaction volume contained 1 µl of genomic DNA, 0.1 µl dNTPs (2 mM), 0.1 µl of
forward and 0.1 µl of reverse primer (2 mM), 0.1 µl GoTaq® DNA Polymerase 5 u/µl
(Promega Ltd., USA), 0.6 µl MgCl2 (50 mM Stock concentration Bioline Ltd, UK), 1 µl of
10x Reaction Buffer (Bioline Ltd, UK, 160 mM (NH4)2SO4, 670 mM Tris-HCl (pH 8.8 at 25°
C, 0.1 % stabilizer) and 7 µl of PCR grade H2O. Negative controls containing 1 µl of PCR
grade H2O and master mix were included in each experiment. The optimised TD-PCR
cycling profile for the standard dye labelled primers included denaturing at 95 ºC for 15
minutes, followed by 12 cycles of 30 seconds of denaturing at 95 ºC, 90 seconds of
annealing at 60 ºC, dropping by 0.5 ºC per cycle, and 60 seconds of extension 72 ºC;
continued by 33 cycles for 30 seconds at 89 ºC, 90 seconds at 55 ºC and 60 seconds at 72
ºC. A final extension of 30 minutes at 60 ºC completed the TD-PCR.

35
2.5. Amplification Tests
Amplified TD-PCR products were detected visually by electrophoresis before genotyping.
This process was conducted in a different room from that of the PCRs to prevent cross-
contamination with post-PCR products and pre-PCR consumables. Gels of a 1.5% agarose
concentration were prepared in 100 ml-sized gel trays with 20 x 1.5 mm combs. Gel trays
were double taped at both ends and the appropriate number of combs was added to
define the gel structure. A solution of 1.5 g agarose (Bioline Ltd, UK) to 100 ml of 0.5x
Tris-borate-EDTA (TBE) buffer (89mM Tris-borate, 2mM EDTA, pH 8.3, Severn Biotech,
UK) was mixed in a conical flask and heated in a 750 Watt microwave until dissolved
(approximately 60 seconds). Precautionary measures were taken to ensure the solution
did not boil which would have increased concentration measures due to loss through
evaporation. Once cooled to roughly 50 ºC, 100 µl of Gel ed™ agent (Biotium, Hayward,
CA, USA) was mixed with the solution and poured evenly into the taped gel tray to set
over a 20 minute period. Gel ed™ is an intercalating agent hich binds to the DNA,
fluorescing under UV light for visualisation. Between 3 µl and 5 µl of TD-PCR products
were mixed within 4 µl of loading dye in separate PCR tubes, ensuring the original TD-PCR
products were kept for future genotyping. The comb was removed from the solidified gel
to create the defined wells, and the tape was removed from both ends of the tray. The
solidified gel and tray was fully submerged in an electrophoresis chamber containing
sufficient TBE buffer solution, keeping defined wells located nearest to the negative
electrode. A mix of 5 µl of Hyperladder II, 1 kb or 100 bp and 4 µl loading dye was loaded
consistently into the first well. The mixed TD-PCR products were then loaded in the
following wells in a systematic order. The electrophoresis lid was placed on top of the

36
chamber with power leads attached to a power supply. The program ran for 1 hour at
110 Volts, between 70 and 100 mA.
A transilluminator was used to view the electrophoretic movement of the DNA molecules
within the gels. Photographic evidence was taken using software Genesnap (Syngene)
and printed copies of pictures were created with a G-Box Syngene.
2.6. Genotyping
Due to the high sensitivity of the genetic analyser (Applied Biosystems Ltd.), TD-PCR
products were diluted using ddH₂O. Band strength and primer dye were used when
estimating dilution rates of each TD-PCR product. Bands defined as bright were diluted to
the rate of 1/25 (AT550), 1/50 (HEX) and 1/100 (FAM) (with dye AT550 being the weakest
dye and FAM dye being the strongest). The dyes defined as faint were diluted to the rate
of 1/5 (HEX) and 1/10 (FAM), without dilution for AT550 dye due to the generally poor
strength of the dye. Diluted TD-PCR products were then multiplexed in 96 well plates
with up to three different dyes (FAM, HEX or AT550). Genotype plate maps of 96 wells
were used to record the transfer of samples from labeled TD-PCR tubes. A master mix
volume of 9 µl containing 0.1 µl of size standard, 5 µl formamide and 3.9 µl of ddH₂O as
loaded into a new 96 well genotyping plate. A multichannel pipette was used to transfer
1 µl of the multiplexed diluted TD-PCR products into corresponding wells. A sterile septa
cover was placed over the plate and the products were denatured for 10 minutes at 95°C
before being put on ice. A further 10 minutes was used to cool the products. The plate
was then loaded into an ABI3130 Genetic Analyser for genotyping (Applied Biosciences
2014).

37
2.7. Statistical Analysis
2.7.1. Allele Scoring and Filtering the Data
Peak Scanner™ 2 Soft are Version 1.0 Applied Bios stems) as used to identif peaks
and the fragment sizes of all .fsa files produced by the ABI3130 genetic analyser. Integers
of measured fragment sizes based on allele peaks were transferred into Microsoft® Excel
format. Genetic markers which did not produce enough conclusive or sufficient data
were removed from the data set. Individuals that had failed, or produced little/no
conclusive allele peaks during genotyping, were also excluded from the data set.
2.7.2. Formatting for Software Analysis
Generally the genotypes were required in six integer formats to represent the two alleles
in their length in basepairs; missing alleles ere represented ith “000”. Each of the
software used had its own format requirement of how to identify each individual,
population and locus. Locus, population and individual-specific identifiers were generally
specified before presenting the allelic data.
2.7.3. Scoring Errors and Deviations
Micro-checker Version 2.2.3 was used to test for scoring errors and to assess the
frequencies of null alleles (van Oosterhout et al. 2004). Allele frequencies and observed
and expected heterozygozities (Ho and He) were calculated using Cervus 3.0.7. (Field
Genetics Ltd, Marshall 1998-2014, Kalinowski et al. 2007). To test for deviations from
Hardy-Weinberg equilibrium and to obtain basic information for each locus, Genepop on
the Web Version 4.2 was used (Raymond and Rousset 1995; Rousset 2008).

38
2.7.4. Inbreeding Coefficient and Kinship
FIS was calculated using F-statistics. F-statistics are a measure of genetic structure
developed by Sewall Wright (1969, 1978). FIS was determined using Genepop on the Web
Version 4.2(Raymond and Rousset 1995; Rousset 2008), implementing the methods
developed by Weir and Cockerham (1984).
2.7.5. Population Bottlenecks
Bottleneck version 1.2.02 (Piry et al. 1999) was used to test for significant heterozygosity
excess compare to the equilibrium expectations for a stable population. This method is
based on the assumption that population reductions cause rare alleles to be lost faster
than gene diversity, therefore resulting in a transient heterozygosity excess compared to
the observed number of alleles. The test uses either a two-phase mutation model
(T.P.M.) and a step-wise mutation model (S.M.M.). The T.P.M. is considered the most
appropriate for microsatellites (Di Rienzo et al. 1994). In total, 70%, 80%, and 90%
stepwise mutations were assumed in the TPM to compare the results with previous
findings by Randall et al. (2012). The programme was run for 1000 iterations and the
significance was tested with the Wilcoxon signed-rank test as recommended by Maudet
et al. (2002). The Wilcoxon signed-rank test assumed that all loci fit the T.P.M. and
S.M.M. and mutation-drift equilibrium.
2.7.6. Pack and Parentage Analysis
A Bayesian clustering method as implemented in Structure Version 2.3.4. (Pritchard et al.
2000) was used to compare the obtained genetic structure with the known number of
packs. Structure simultaneously estimates allele frequencies to assign individuals to
probable populations in order to minimise deviations from Hardy-Weinberg and linkage

39
disequilibrium. If packs represent family groups, they might represent genetic units
identifiable through Structure e.g. based on differential allele frequencies, despite
deviations from Hardy-Weinberg equilibrium due to high degrees of relatedness within
them. The software run parameters assumed 11 packs 1000000 Reps in total with 100000
Burn-in. Packs are outlined in Table 1. It can be argued that the packs named ‘Floater’ and
‘N/A’ can be grouped together. he t o individuals ithin ‘Floater’ are moving bet een
packs and therefore have unknown origins, which will is also the case of the ‘N/A’
individual. Secondly, it can be argued that the New Sodota individual female originated
from Sodota and had left the pack, but had not yet established a new pack, nor had been
seen to nurture young. Taking this into account, it is possible that the Bayesian clustering
method will find only 8 packs, rather than 11.
To analyse differences in the genetic structures of packs, private alleles were also visually
detected within the genotyped data set. Private alleles are defined as alleles which only
occur within a single population (or, in this case, pack) among a broader collection of
populations or packs (Szpiech and Rosenberg 2010). As a hypothesis, packs share
common alleles which derive from the same ancestry. Private alleles within packs can be
defined as rare alleles as they are not commonly found within all individuals within the
population. Rare recessive alleles are associated with inbreeding.
Cervus 3.0.7. (Field Genetics Ltd, Tristan Marshall 1998) was used for identity analysis
(maternity and paternity, Kalinowski et al. 2007). Identity analysis also can reveal any
repetitive genotypes to identify individuals which have been resampled. This is
particularly useful in Ethiopian wolves, as samples were collected through faecal matter
and a number of individuals were unmarked. The program Colony was used to perform

40
parentage analysis with the genotypic data (Jones and Wang 2010). Colony assigns
sibship and parentage jointly by applying a maximum likelihood method to the individual
genotypes at a number of codominant or dominant markers. A simulation of parentage
where the number of codominant alleles is used to find the number of potential
candidate parents for each offspring was carried out. The simulation took into account all
of the potential adult males and females, offspring and errors which may lie within the
genotyped data. This likelihood was calculated by Colony with indicating values ranging
between 0 to 1. Coancestry v1.0.1.5 was used to estimate pairwise relatedness point
estimates between individuals with respect to the entire adult samples (Wang 2011). It is
expected that genetically similar packs will have higher mean relatedness point estimates
between parental individuals, as they are thought to be closely related family structures.
Relatedness point estimate could only be applied on packs with three of more individuals.
Coancestry was also used to determine how two parents of one or more offspring as
identified by Colony were related to one another with regards to their relatedness point
estimate (Wang 2011). The pairwise relatedness coefficient (as calculated by Coancestry
pairwise relatedness coefficient) estimated the relatedness point between every possible
pair of individuals. These values ranged between -1 and 1; zero is the population mean
relatedness coefficient as expected by chance, negative values indicate a lower
relatedness coefficient and positive values indicate a higher relatedness coefficient.

41
Chapter Three: Results

42
3.1. Amplification Tests through Electrophoresis
A total of 51 individual samples were amplified using TD-PCRs across 9 microsatellites.
Not all samples were amplified in the first attempt. TD-PCRs were repeated up to three
times. Of the 51 samples, 48 successfully yielded in PCR products. Figure 2 shows an
example of a largely successful amplification (locus FH2422).
FIGURE 2. Agarose gel image of amplifications of locus FH2422 as an example. Sample
labels are displayed across the top of the image. The observed allele sizes are in line with
the allele size range of 205 – 220 base pairs as described by Randall (2006). Size variations
and homo- and heterozygote genotypes already become apparent. Bands at around 50 to
100 bp were considered primer dimer.
43
3.2. Analysis of genotypes
3.2.1. Genotyping and Loci Removal
Of the 9 originally chosen microsatellites, only 7 provided sufficient genotyped data. The
microsatellites FH2138 and FH2472 (Table 2), which were characterised based on a rather
large PCR product (above 300bp), had a lower probability of being scorable. On average,
each individual has been amplified with 6 microsatellites. Of the 48 individuals
genotyped, 43 successfully amplified for at least four loci and were used for further
analyses (Appendix 1.).
3.2.2. Scoring Errors and Null Alleles
Micro-checker did not identify significant evidence for scoring errors due to stuttering,
and there was no significant evidence supporting significant drop outs of large alleles.
However, low frequencies of null alleles and an excess of homozygotes were documented
for loci FH2137 and FH2422 (Table 3 and Table 4). There was no evidence suggesting
either scoring error due to stuttering in the alleles, or large allele dropout.

44
TABLE 3. An analysis produced by Micro-checker to describe homozygosity, scoring error and allele drop out.
Locus Allele size
range
Homozygotes Homozygote
excess
Scoring error due
to stuttering
Large allele
drop out
Notes
Expected Observed
FH2140 107 – 135 12.56 8 No No No No evidence for null alleles
FH2054 148 – 168 8.21 12 No No No No evidence for null alleles
FH2422 148 – 237 10.84 17 Yes No No Null alleles maybe present at
this locus, as is suggested by
the general excess of
homozygotes for most allele
size classes
FH2226 150 – 238 10.80 10 No No No No evidence for null alleles
FH2137 153 – 197 17.11 23 Yes No No Null alleles maybe present at
this locus, as is suggested by
the general excess of

45
homozygotes for most allele
size classes
FH2001 118 – 166 14.27 12 No No No No evidence for null alleles
PEZ19 182 – 202 9.14 11 No No No No evidence for null alleles

46
When four different algorithms implemented in Micro-checker were used to further
investigate the presence of null alleles, only FH2137 and FH2422 were consistently
characterised by varying degrees of null allele frequencies (Table 4).
TABLE 4. Comparison of the estimated null allele frequencies using the four algorithms
(Oosterhout, Chakraborty and Brookfield 1 and 2) implemented in the software Micro-
checker.
Locus Null Alleles Oosterhout Chakraborty Brookfield 1 Brookfield 2
FH2137 Yes 0.12 0.14 0.09 0.20
FH2226 No -0.01 -0.01 -0.01 0.11
FH2422 Yes 0.09 0.13 0.09 0.30
FH2054 No 0.08 0.09 0.07 0.46
FH2001 No -0.15 -0.07 -0.05 0.47
PEZ19 No 0.03 0.05 0.04 0.50
FH2140 No -0.13 -0.10 -0.08 0.30
47
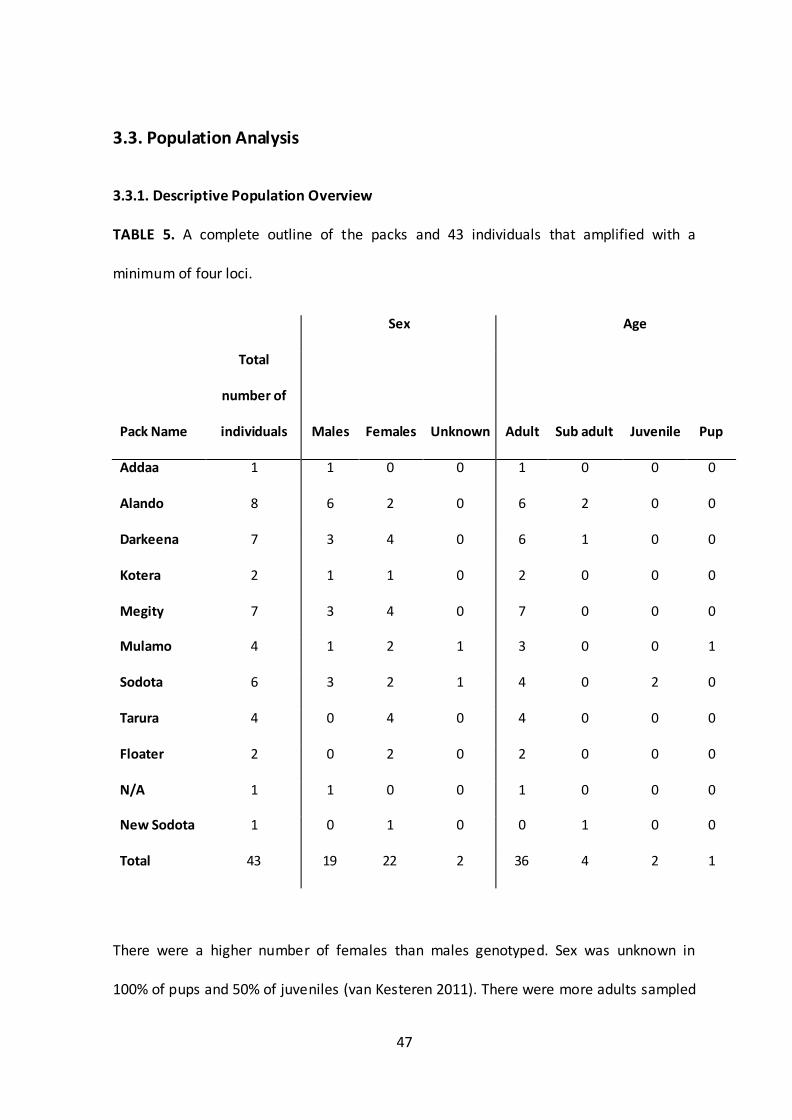
3.3. Population Analysis
3.3.1. Descriptive Population Overview
TABLE 5. A complete outline of the packs and 43 individuals that amplified with a
minimum of four loci.
Sex Age
Pack Name
Total
number of
individuals Males Females Unknown Adult Sub adult Juvenile Pup
Addaa 1 1 0 0 1 0 0 0
Alando 8 6 2 0 6 2 0 0
Darkeena 7 3 4 0 6 1 0 0
Kotera 2 1 1 0 2 0 0 0
Megity 7 3 4 0 7 0 0 0
Mulamo 4 1 2 1 3 0 0 1
Sodota 6 3 2 1 4 0 2 0
Tarura 4 0 4 0 4 0 0 0
Floater 2 0 2 0 2 0 0 0
N/A 1 1 0 0 1 0 0 0
New Sodota 1 0 1 0 0 1 0 0
Total 43 19 22 2 36 4 2 1
There were a higher number of females than males genotyped. Sex was unknown in
100% of pups and 50% of juveniles (van Kesteren 2011). There were more adults sampled
48
and genotyped than any other age group. Four individuals from Megity did not amplify
from the TD-PCRs; two adult males, one juvenile female and one juvenile male. Two
individuals from Tarura (one adult male and one sub adult male) and Sodota (one adult
female and one sub adult male) did not amplify.
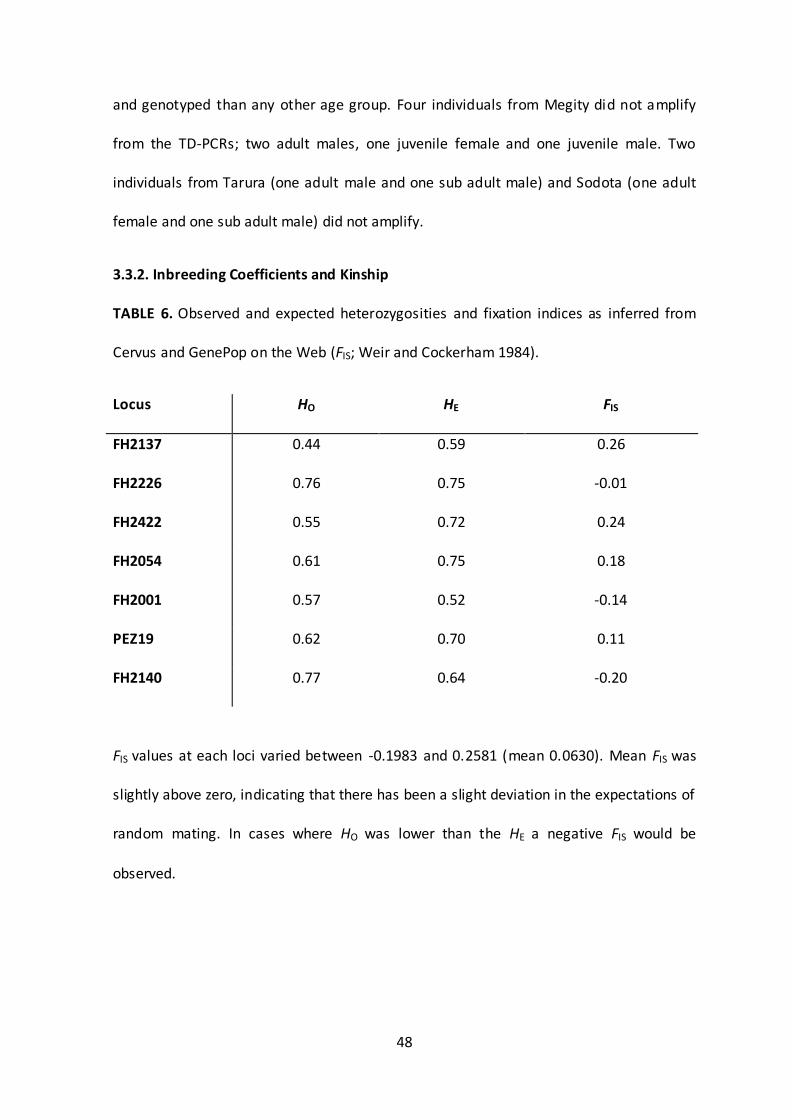
3.3.2. Inbreeding Coefficients and Kinship
TABLE 6. Observed and expected heterozygosities and fixation indices as inferred from
Cervus and GenePop on the Web (FIS; Weir and Cockerham 1984).
Locus HO HE FIS
FH2137 0.44 0.59 0.26
FH2226 0.76 0.75 -0.01
FH2422 0.55 0.72 0.24
FH2054 0.61 0.75 0.18
FH2001 0.57 0.52 -0.14
PEZ19 0.62 0.70 0.11
FH2140 0.77 0.64 -0.20
FIS values at each loci varied between -0.1983 and 0.2581 (mean 0.0630). Mean FIS was
slightly above zero, indicating that there has been a slight deviation in the expectations of
random mating. In cases where HO was lower than the HE a negative FIS would be
observed.
49
3.3.3. Population Bottlenecks
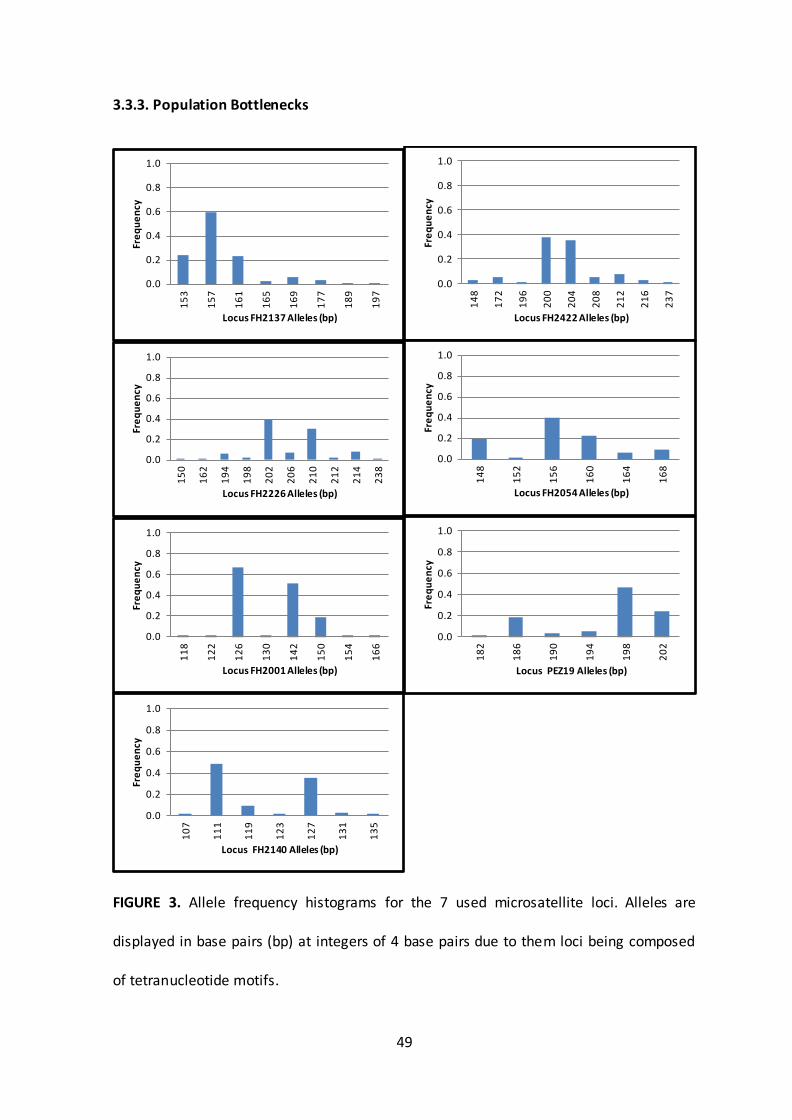
FIGURE 3. Allele frequency histograms for the 7 used microsatellite loci. Alleles are
displayed in base pairs (bp) at integers of 4 base pairs due to them loci being composed
of tetranucleotide motifs.
0.0
0.2
0.4
0.6
0.8
1.0
15
3
15
7
16
1
16
5
16
9
17
7
18
9
19
7
Fre
qu
en
cy
Locus FH2137 Alleles (bp)
0.0
0.2
0.4
0.6
0.8
1.0
14
8
17
2
19
6
20
0
20
4
20
8
21
2
21
6
23
7
Fre
qu
en
cy
Locus FH2422 Alleles (bp)
0.0
0.2
0.4
0.6
0.8
1.0
15
0
16
2
19
4
19
8
20
2
20
6
21
0
21
2
21
4
23
8
Fre
qu
en
cy
Locus FH2226 Alleles (bp)
0.0
0.2
0.4
0.6
0.8
1.0
14
8
15
2
15
6
16
0
16
4
16
8
Fre
qu
en
cy
Locus FH2054 Alleles (bp)
0.0
0.2
0.4
0.6
0.8
1.0
11
8
12
2
12
6
13
0
14
2
15
0
15
4
16
6
Fre
qu
en
cy
Locus FH2001 Alleles (bp)
0.0
0.2
0.4
0.6
0.8
1.0
18
2
18
6
19
0
19
4
19
8
20
2
Fre
qu
en
cy
Locus PEZ19 Alleles (bp)
0.0
0.2
0.4
0.6
0.8
1.0
10
7
11
1
11
9
12
3
12
7
13
1
13
5
Fre
qu
en
cy
Locus FH2140 Alleles (bp)
50
Under random mating in large populations and assuming a largely stepwise mutation
process of microsatellites, allele frequencies are expected to have a rather symmetric,
bell-shaped distribution. If uneven distributions and/or gaps in allelic distributions are
present there is an indication that there is high past genetic drift that may have been
caused by genetic bottlenecks. Most studied loci are characterised by 2 or 3 common
alleles in addition to several alleles at low frequencies (<0.1, Figure 3), with the
somewhat uneven distribution of common alleles providing evidence for population
processes deviating from idealised populations.
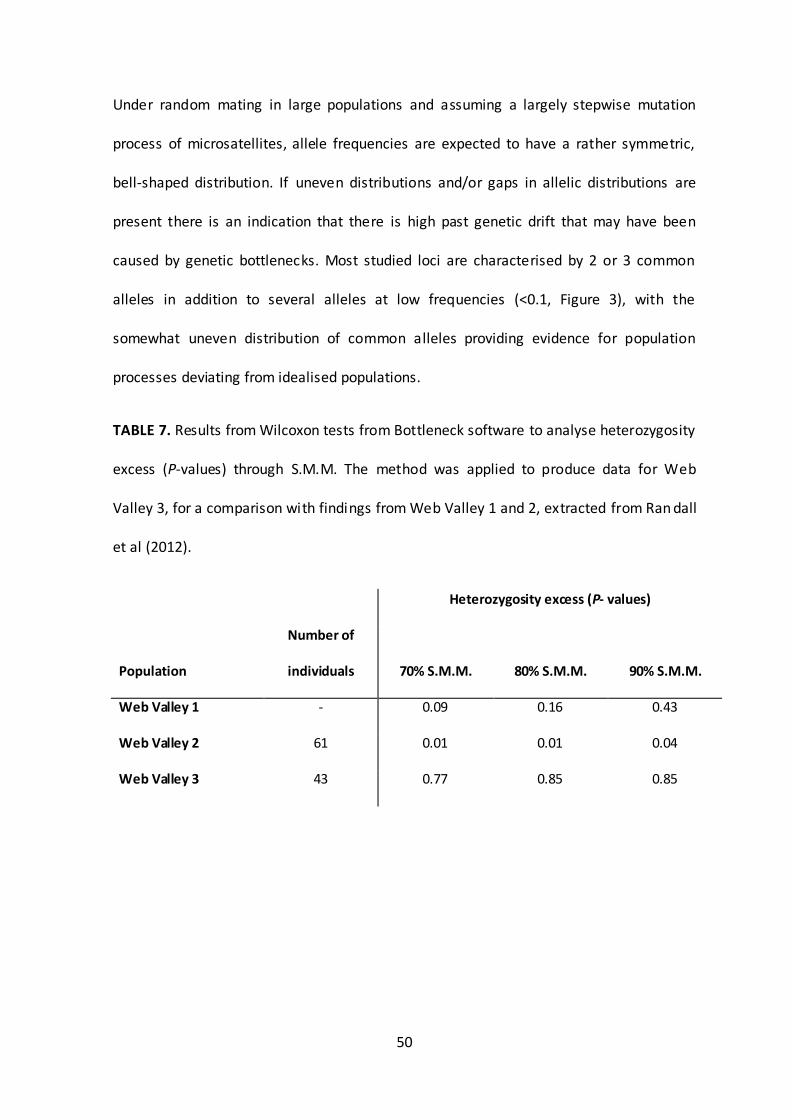
TABLE 7. Results from Wilcoxon tests from Bottleneck software to analyse heterozygosity
excess (P-values) through S.M.M. The method was applied to produce data for Web
Valley 3, for a comparison with findings from Web Valley 1 and 2, extracted from Ran dall
et al (2012).
Heterozygosity excess (P- values)
Population
Number of
individuals 70% S.M.M. 80% S.M.M. 90% S.M.M.
Web Valley 1 - 0.09 0.16 0.43
Web Valley 2 61 0.01 0.01 0.04
Web Valley 3 43 0.77 0.85 0.85

51
TABLE 8. An outline of the pack allele diversity observed from the genotyped data. Na: number of alleles present at each locus within a
pack, N: number of individuals. Missing data indicate amplification failure.
Na
Pack Private
Alleles
N FH2137 FH2226 FH2422 FH2054 FH2001 PEZ19 FH2140
Alando 5 8 5 4 5 4 3 4 3
Darkeena 0 7 3 3 2 3 3 4 2
Kotera 1 2 2 3 1 2 2 3 4
Megity 1 7 3 6 2 4 2 4 2
Addaa 0 1 2 - 1 - 1 - 2
Mulamo 3 4 2 2 3 2 2 2 2
Sodota 3 7 3 5 5 2 2 3 3
Tarura 5 4 3 5 4 5 2 4 2
Floater 1 2 2 3 2 3 2 2 2
N/A 0 1 1 2 1 2 1 1 2
Total 19 43

52
Private alleles were visually detected within the genotyped dataset. The total number of
private alleles across all packs was 19, averaging at roughly 2 per pack (Table 8). There is
no relation between the number of private alleles and number of individuals. For
example, Megity has seven individuals and only one private allele, while Sodota also has
seven individuals and three private alleles.
3.4. Population Dynamics and Genetic Structures
3.4.1. Pack Genetic Structure and Diversity
FIGURE 4. Bayesian posterior probabilities assuming between 1 and 11 clusters (K) for the
genotyped data of all individuals.
The Bayesian clustering method as implemented in the software Structure assigned the
highest posterior log likelihood to K=1, with a steady decrease in the likelihood with
increased K (Figure 4). Such a pattern is expected when the algorithm is unable to detect
any substructure in a given sample, and Structure is unable to distinguish between packs
-1200
-1000
-800
-600
-400
-200
0
1 2 3 4 5 6 7 8 9 10 11
Esti
mat
ed
Ln
of
Pro
b o
f D
ata
K

53
or for example clusters of packs based on their locations. This is in line with the
observation of regular exchange of individuals between packs, and might also be linked to
deviations from Hardy-Weinberg equilibrium within packs. As the number of packs could
not be identified the individual from New Sodota was then merged with Sodota. New
Sodota was collected at the end of the sampling time. For analysis through genetic
variation the individual was included with her original pack.
FIGURE 5. A box plot diagram describing the distribution of relatedness coefficients
(Wang 2011) within each pack that has more than one individual. Relatedness
coefficients vary between -1.0 and 1.0, with zero being the population mean and negative
and positive values indicating lower and higher relatedness as expected by chance,
respectively.

54
Relatedness point estimates were calculated separately between each pair of individuals
for each pack (Figure 5). The further the mean pairwise relatedness coefficients are from
1.00, the less related pairs of individual are to one another within the pack. Two and
three packs had mean coefficients above and below the pairwise population mean,
respectively, whereas one pack (Megity) had a mean pairwise relatedness coefficient very
close to zero (0.02). This suggests that individuals within packs are not more closely
related to each other than individuals between packs. Darkeena has the highest mean
relatedness point estimate of all possible pairs of individuals, indicating that all possible
pairs of individuals within the pack are closely related. However, Sodota has the largest
range of pairwise relatedness coefficients, with a mean relatedness point estimate below
0.
55
3.4.2. Parentage analysis
TABLE 9. A combination of the data collected in Colony and Coancestry to analyse the
parental analysis.
Colony Coancestry
Posterior
Probability Offspring ID
Father
ID Mother ID
Father ID to Mother ID
Pairwise Relatedness
Coefficient
1.00 54 23 14 0.53
1.00 56 F14 F8 0.27
1.00 68 53 99 0.51
1.00 46 55 9 0.70
1.00 17 F5 F6 -0.39
1.00 F1 F10 F7 -0.71
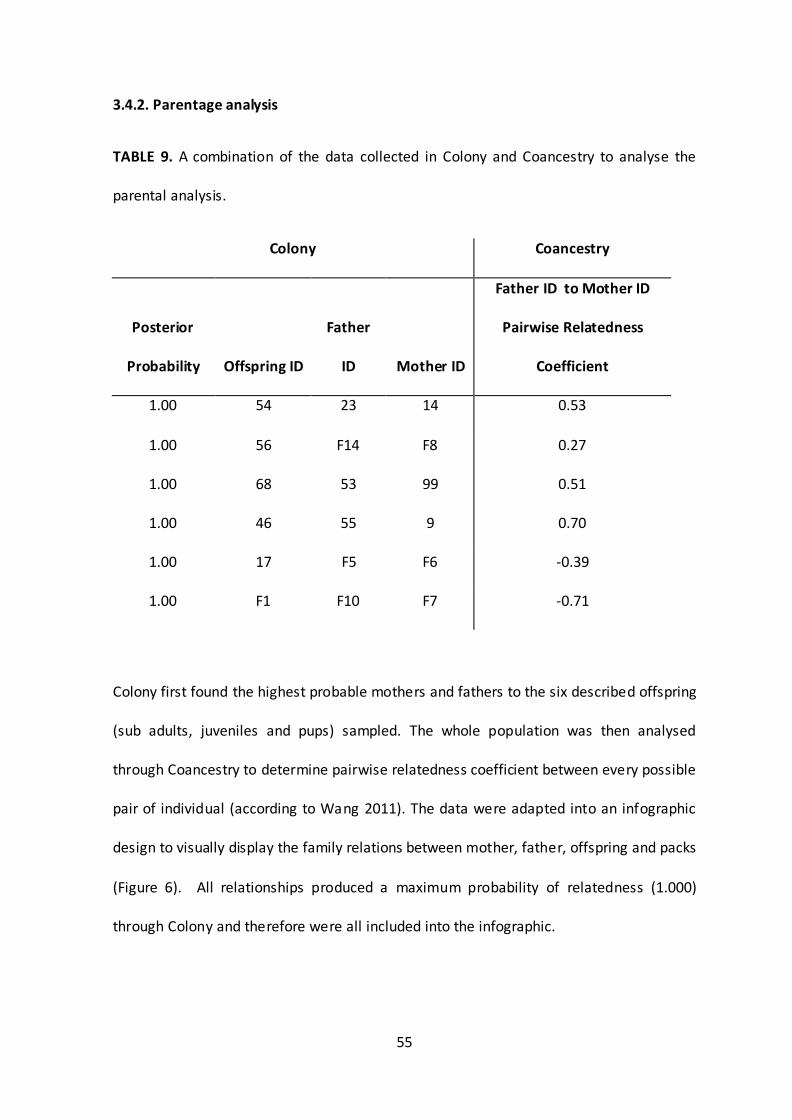
Colony first found the highest probable mothers and fathers to the six described offspring
(sub adults, juveniles and pups) sampled. The whole population was then analysed
through Coancestry to determine pairwise relatedness coefficient between every possible
pair of individual (according to Wang 2011). The data were adapted into an infographic
design to visually display the family relations between mother, father, offspring and packs
(Figure 6). All relationships produced a maximum probability of relatedness (1.000)
through Colony and therefore were all included into the infographic.
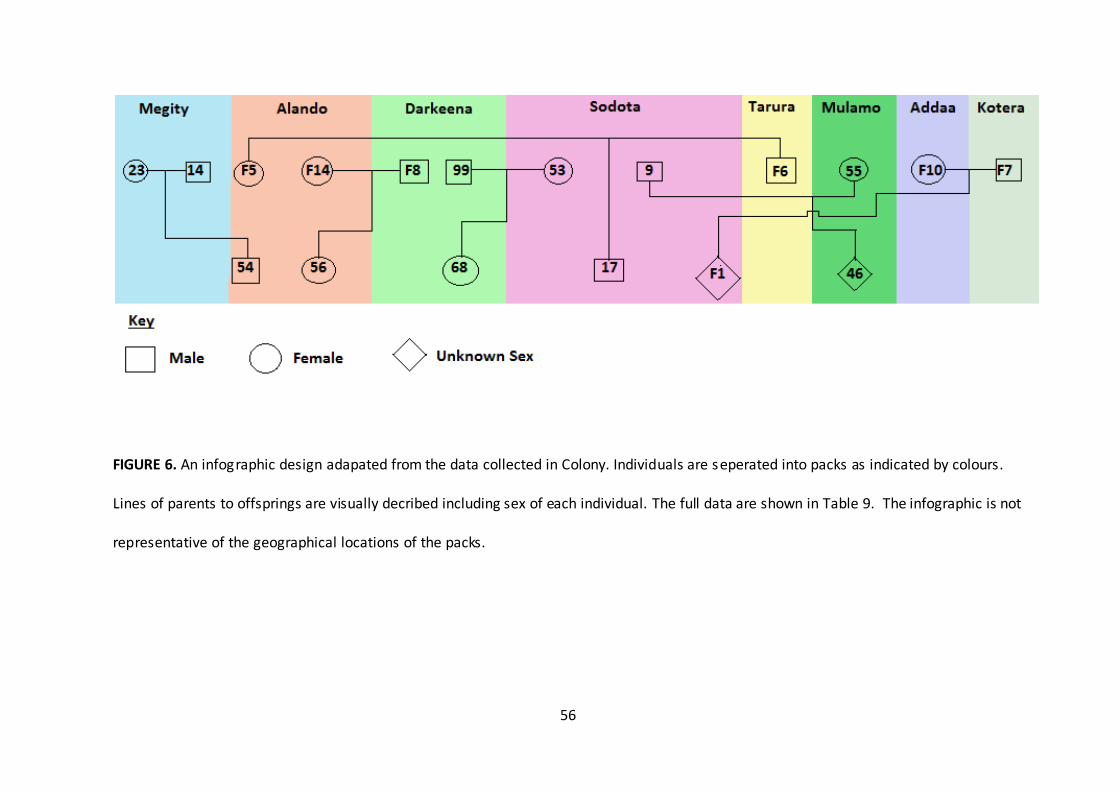
56
FIGURE 6. An infographic design adapated from the data collected in Colony. Individuals are seperated into packs as indicated by colours.
Lines of parents to offsprings are visually decribed including sex of each individual. The full data are shown in Table 9. The infographic is not
representative of the geographical locations of the packs.

57
Chapter Four: Discussion

58
The present study focuses on a further genetic characterisation of relict populations of
the Ethiopian wolf, one of the orld’s most endangered canids. he main results are
threefold. Firstly, the study showed that it was possible to amplify microsatellite DNA
from faecal samples collected for hormone analysis and stored for several years.
Secondly, the study provided further insights into the standing amount of genetic
variation of this charismatic wildlife species. Thirdly, the study used parentage infere nces
to show that extra-pack matings seem to be a common occurrence, possibly linked to a
loss of individuals in specific packs through disease (rabies) outbreaks.
4.1. Genotyping from Non-invasive Samples
Faecal samples were assumed to have been collected for all existing adult wolves in the
Web Valley, equal to an estimated total population size of 51 individuals between 2007
and 2010 (van Kesteren et al. 2012; 2013). Individuals were identified through ear tags or
individual markings, and any juveniles or pups were sampled once they began to leave
the den. However, faecal samples were originally collected for the purpose of testing
individual hormone levels, and sampling protocols were therefore not optimised for the
purpose of DNA extraction. All samples were stored at -20ºC at the earliest opportunity
after sampling, before DNA extractions were conducted. At the time of extraction,
samples were between three and seven years of age. Despite this, a high success rate for
PCR amplification was achieved: 83% of all faecal samples collected amplified with an
average of six out of nine initially tested microsatellite markers. The remaining 17% of
samples (nine individuals) did not yield in sufficient quality and quantity of DNA for
successful PCR amplification with microsatellite markers.
59
Nine microsatellites which had been previously found to anneal to Ethiopian wolf DNA
were selected based on Randall (2006). However, loci which amplified a product above
300 base pairs in length were unsuccessful in PCRs for more than half of the samples. As
samples were not collected through an optimised sampling method for DNA extraction
and kept for long periods in freezers, it is possible that degradation of DNA is responsible
for PCR failures. In other words, loci amplifying longer strands of DNA were less likely to
be successful in situations when template DNA was broken up into small fragments, in
addition to small amounts of template being available. This is a common observation
when analysing DNA based on degraded samples (e.g. Taberlet et al. 1991). The
optimising and genotyping of further loci documented in Randall (2006) was precluded by
logistic constraints.
Evidence for null alleles were found at two out of seven loci (FH2137 and FH2422 through
the algorithms Oosterhout, Chakraborty and Brookfield 1 and 2 as implemented in the
software Micro-checker). These were linked to an observed excess in homozygotes at
these two loci. Large amounts of homozygotes are often an indication of low genetic
diversity. However null alleles were caused by the absence of a PCR product (on a single
strand or on both strands). This was either because it did not amplify in the PCR reaction
for technical reasons, or because it can no longer be amplified due to mutations in the
primer binding site. Markers FH2422 and FH2137 had seven and six more observed
homozygotes than expected, respectively. There was a larger amount of homozygotes in
these two loci across most of the allele size classes, suggesting that amplification failure
was unrelated to template size without evidence for scoring error due to stuttering.
Sequencing of PCR products would reveal whether mutations and polymorphisms in the

60
primer flanking region have caused the observed allelic dropout, or whether DNA quality
and quantity combined with the used PCR conditions have caused the observed
homozygote excess. Time and cost constraints have restricted further analysis via
sequencing to determine the causes of null alleles. As other loci genotyped for identical
individuals were not characterised by an excess of homozygotes, it is unlikely that
population demographic processes and/or inbreeding have caused this observation.
4.2. Levels of Genetic Variation, Population Structure and Population
History
Observed heterozygotes and total number of alleles as derived in this study were not
markedly different from a previous data set produced by Randall et al. (2007; 2009). In
these studies, samples were derived from about one decade prior to the present thesis,
and collected in multiple regions of the Bale Mountains including the Web Valley (Randall
et al. 2007; 2009; Gottelli et al. 2013). While there was no apparent marked decreas e in
genetic variation over this relatively short time scale, a direct comparison was hampered
by different sampling methodologies and only partly overlapping study areas.
The Bayesian clustering method implemented in Structure could not map a signature of
genetic substructure to packs or groups of packs. This suggests that all packs descended
from one more or less panmictic population, although it is also well documented that for
example gradual isolation-by-distance scenarios are not well captured by the algorithm
implemented in Structure (Frantz et al. 2009). The lack of apparent population
substructure as determined by Structure could also be due the relatively small pack sizes,
as the power of the algorithm implemented in Structure decreases with the number of

61
assumed K (Evanno et al. 2005). It could also be a result of deviations from Hardy-
Weinberg equilibrium within packs, as they by-and-large represent extended families
(Randall et al. 2007). Although pack-specific private alleles were fairly common, they
were insufficient for Structure to detect any population subdivision. Gottelli et al . (2013),
however working across a larger area investigation, used Structure to successfully assign
populations of Ethiopian wolves to three clusters representing mountain ranges on both
sides of the Rift Valley. This analysis was also confirmed with sibship analyses to infer
recent gene flow, which assigned all putative sibs to the same population (Gottelli et al.
2013).
Genetic bottlenecks occur when populations experience severe, temporary reductions in
their effective size, and can dramatically reduce the genetic diversity of populations (Nei
et al. 1975; Wright 1986; Lacy 1987; Nature Ed. 2014). For example, a high degree of
inbreeding depression is often interpreted as the result of a past population bottleneck
(Hedrick & Kalinowski, 2000; Nature Ed. 2014). Traditional measures of genetic diversity
(such as heterozygosity and allelic diversity) can be used to infer a past bottleneck. It
requires a reference sample either from before the event or from another, non-
bottlenecked population. The approach employed in this study is the one implemented in
the software Bottleneck, and is based on the idea that bottlenecking gives rise to an
excess of heterozygotes compa red to the level of heterozygosity expected at mutation-
drift equilibrium, because under bottlenecks rare alleles have a higher risk of going
extinct than common alleles (Cornuet & Luikart, 1996; Luikart et al., 1998). Depending on
the sample size and marker variability, this method can detect heterozygote excess for up
to about ten generations after its occurrence (Luikart et al., 1998; 2002). In addition to
62
the approach implemented in Bottleneck, Garza & Williamson (2001) also develop an
approach based on the distribution of allele frequencies across the allelic spectrum.
Despite field observations of regular past rabies outbreaks reducing Ethiopian wolf
population sizes, the genetic measures applied in this study failed to detect a
demographic signature of such events. These findings are complementary to Randall et
al. (2010) who used the same approaches and found significant genetic signature of
bottlenecks in some but not all studied populations of Ethiopian wolves, and to Gottelli et
al (2012) who, however assuming a slightly different microsatellite mutation model, also
failed to detected any evidence for population genetic bottlenecks. Such analyses might
however be hampered by the pronounced social structure within Ethiopian wolf
populations, leading to deviations from idealised populations, as well as the rather
limited number of samples and loci analysed. It should be further noted that the
statistical models to detect past bottlenecks are based on the assumptions of
demographic recoveries after drastic declines in a population size. The Ethiopian wolf has
experienced a continuous decline which becomes intermitted by accelerated troughs as a
consequence of disease outbreaks such as rabies (Laurenson 2004; Deressa et al, 2010).
Bottlenecks are finally also expected to occur during extinction-recolonization processes
in metapopulations (Whitlock & Barton, 1997; Bouzat 2010; England et al., 2003). The
present analyses suggest that such dynamic processes appear to be rare or absent in the
Ethiopian wolf.

63
4.3. Parentage and Exchange of Individuals between Packs
The natural boundaries of the study area allowed us to treat the sampled individuals as a
confined reproductive community. This was corroborated by the lack of population
substructure as inferred through the Structure software. The moderate to high level of
genetic variation of the markers used and rather complete field sampling of adults made
the microsatellite loci sufficiently powerful for parentage assignments, despite a rather
low overall number of loci genotyped. The software Colony, which was employed for the
parentage analysis, is generally considered to generate fewer false assignments than
other methods that use pairwise relationships (Wang & Santure 2009), further
corroborating that the present parentage inferences represent true gene genealogies. For
all six sampled offspring for which sufficient genotypic information was available, both
parents could be identified within the sampled adults with high certainty (a posterior
probability of 1.000 according to the Colony software). This confirms the assumptions
that field sampling was exhaustive, and that the genotyping based on the faecal samples
yielded in accurate results.
Probably one of the most surprising results from the present study is the apparent high
exchange of individuals between packs. Randall et al. (2007) performed a similar analysis,
and concluded that about one in three (13/45) pups were sired by extra-pack fathers.
Two reasons can account for this difference between the two studies. Firstly, Randall et
al. (2007) also considered individual pups in their sample set for which only one parent
was known, leading to a proportion of pups which were not counted as being extra -pack
sired although they likely had an extra-pack father. Secondly, the studied population was
apparently generally characterised by rather unstable packs (see also below for

64
movements of offspring between packs). This is for example also evidenced by the field
observations which assigned a “floater” status to t o individuals van Kesteren et al.
2012; van Kesteren personal communication). While a direct link is difficult to
demonstrate, it is plausible to assume that the rabies outbreak shortly before the
collection of the samples markedly disturbed the social structure of the studied
population. It is possible that reduced pack size and the loss of dominant individuals from
given packs was compensated for by matings with extra-pack individuals as well as the
exchange of adults between packs. A similar observation of pack disturbance through
external factors was also made for European wolves C. lupus, when hunted and un-
hunted populations were compared (Jędrzeje ski et al. 2005) or when studying a rapidly
expanding populations after hunting ceased (Caniglia et al. 2014). Based on the existing
samples it was however impossible to infer whether multiple paternities occurred within
litters (which have previously been shown to be common, Randall et al. 2007), which
would provide further insight into mating systems within the studied population. High
levels of polygynous and polyandrous matings within and among social groups have also
been reported in other canids (for example red fox Vulpes vulpes, Baker et al. 2004),
although more coherent packs e.g. exist for the African wild dog Lycaon pictus (Girman et
al. 1997).
Another main result from the parentage inferences is that only two out of the six
offspring for which both parents were identified (individuals 46 and 56) were still
associated with the packs containing their biological mothers. While field errors cannot
be completely excluded, the high confidence of the parentage data makes it very unlikely
that genotyping errors have occurred. At the time of sampling, individual 46 was the only

65
analysed offspring classified as pup, and as expected was found in the same pack as its
biological mother. All other offspring was classified as subadults or juveniles (2 males, 2
females, 1 unknown sex). In agreement with relatedness coefficients between inferred
parents (see below), this finding suggests that between-pack movements of individuals
after weaning seems common (corroborated through field and genetic observations,
Sillero-Zubiri et al. 1996; Marino et al. 2006).
The infographic family tree of the data collected from Colony displays how packs are
interbreeding. Only half of the offspring sampled were located in the same pack of either
of their genetically identified mother or father identified parents. Identified parents male
14 and female 23 from pack Megity produced offspring male 54 in pack Alando. Male 14
and female 23 had a pairwise relatedness coefficient of 0.53, providing evidence for
inbreeding. The relocation of offspring from the original family pack to join another pack
has been previously observed in the field (Sillero-Zubiri et al. 1996; 1998), and in this case
could be adaptive to inbreeding avoidance. Individuals male 99 and female 53 produce
female 68 in pack Darkeena. There are two possible senerios in which this could have
arisen. The mother 53 may have left the pack to join Sodota while father and offspring
continue to reside in Darkeena. The other situation may be that father and offspring have
relocated to Darkeena from the Sodota pack, leaving the reproducing female mother.
This case provides evidence that more individuals of different ages and sexes are
relocating. Mulomo female 55 has been receptive to male 9 from pack Sodota producing
offspring 46. Van Kesteren (2012) found that subdomina nt females will breed out of
season with external males, as their receptive hormone levels inducing mating increase.
Environmental stresses of disease outbreak could have increased such matings. A further

66
notable case is that of Alando female F5 and Tarura male F6, who produced the Sodota
juvenile male 17. It could be possible that this female was receptive to external breeding
from F6, producing a male offspring which then relocated to Sodota. Such dynamic pack
structure could be an advantage under situations of declines and losses of indiviudals
through disease and habitat reduction.
Despite a limited sample size, this study is also able to draw some inferences on possible
overall inbreeding and its avoidance in the study population. Four out of six parental pairs
had a positive pairwise relatedness coefficient, suggesting they are outbred with respect
to the population average, whereas two parental pairs had a negative coefficient,
suggesting a certain degree of inbreeding. This limited evidence suggests that inbreeding
avoidance (through mate recognition and/or differential survival of zygotes based on
parental genotypes) is not acting as a major force to drive the genetic mating system of
the studied Ethiopian wolf population, confirming previous findings by Randall et al.
(2007). An increased number of samples and genetic markers would be necessary to draw
firm conclusions about inbreeding and its avoidance based on multi -locus genotypes (e.g.
Wang 2014).

67
5. Conclusions
The Ethiopian wolf is endemic to the highlands of Ethiopia, and so long term survival of
the species depends on careful management and protection of its habitat. The Web
Valley in the Bales Mountain National Park (BMNP) was home to around 51 individuals
between 2007 and 2010, from which samples were collected as the basis for this
research. This study has documented the consequence of disease outbreaks on pack
structure and improved our understanding of the social interaction of the Ethiopian wolf.
These findings should be used as the basis of a species management plan which should
aim to stabilise the amount of genetic variation in the population.
Designating protected areas such as the BMNP are one of conservation’s most basic
approaches of protecting wildlife. However such areas are continually being threatened
by the expansion of human activity, especially in developing countries such as Ethiopia.
To prevent further degradation of the BMNP environment and safeguard the Ethiopian
wolf, it has been advised that urgent action to reduce human impacts is needed
(Stephens et al. 2001). The rapid decline of individuals which has been shown in this
thesis to change social structures and breeding patterns could inadvertently be ensuring
the future survival of the species. If habitat fragmentation from human activity continues
this interaction between wolf packs may no longer be possible and may have serious
negative implications on the species.
68
5. References
Adams, J. R., and Waits, L. P. (2007). An efficient method for screening faecal DNA
genotypes and detecting new individuals and hybrids in the red wolf (Canis rufus)
experimental population area. Conservation Genetics, 8(1), 123-131.
Allendorf, F. W., Hohenlohe, P. A., and Luikart, G. (2010). Genomics and the future of
conservation genetics. Nature Reviews Genetics, 11(10), 697-709.
Applied Biosystems (2014). Applied Biosystems 3130/3130xl Genetic Analyzers: Quick
Reference Card: Rev A (English).
Atickem, A., Bekele, A. and Williams, S. D. (2009). Competition between domestic dogs
and Ethiopian wolf (Canis simensis) in the Bale Mountains National Park, Ethiopia.
African Journal of Ecology, 48(4), 401–407.
Avise, J. C., Arnold, J., Ball, R. M., Bermingham, E., Lamb, T., Neigel , J. E. and Saunders, N.
C. (1987). Intraspecific phylogeography: the mitochondrial DNA bridge between
population genetics and systematics. Annual Review of Ecology and Systematics,
27, 489-522.
Baker, P. J., Funk, S. M., Bruford, M. W. and Harris S. (2004). Polygynandry in a red fox
population: implications for the evolution of group living in canids? Behavioural
Ecology, 15(4), 766–778.
Bhargava, A., and Fuentes, F. F. (2010). Mutational dynamics of microsatellites. Molecular
Biotechnology, 44(3), 250-266.
69
BMNP (2015). Bale Mountains National Park Ethiopia©. Retrieved 1st of April 2014, from
http://balemountains.org/the-park/
Boakes, E.H., Wang, J. and Amos, W. (2007). An investigation of inbreeding and
depression and purging in captive pedigreed populations. Heredity 98(2), 172-182.
Bouzat, J. L. (2010). Conservation genetics of population bottlenecks: the role of chance,
selection, and history. Conservation Genetics, 11(2), 463-478.
Brakefield, P. M. and Saccheri. I. J. (1994). Guidelines in Conservation Genetics and the
use of Population Cage Experiments with Butterflies to Investigate the Effects of
Genetic Drift and Inbreeding. In: Conservation Genetics (Loeschcke V., Tomiuk J.,
and Jain S. K., eds). Berlin: Birkhauser; 165–179.
Brinkman, T. J., Schwartz, M. K., Person, D. K., Pilgrim, K. L., and Hundertmark, K. J.
(2010). Effects of time and rainfall on PCR success using DNA extracted from deer
faecal pellets. Conservation Genetics, 11(4), 1547-1552.
Broquet, T., Menard, N., and Petit, E. (2007). Noninvasive population genetics: a review of
sample source, diet, fragment length and microsatellite motif effects on
amplification success and genotyping error rates. Conservation Genetics, 8(2),
249-260.
Caniglia, R., Fabbri, E., Galaverni, M., Milanesi, P. and Randi, E. (2014). Noninvasive
sampling and genetic variability, pack structure, and dynamics in an expanding
wolf population. Journal of Mammalogy, 95(1), 41-59.

70
Chevolot M., Ellis J., Rijnsdorp A., Stam W., Olsen J. (2008). Temporal changes in allele
frequencies but stable genetic diversity over the past 40 years in the Irish Sea
population of thornback ray, Raja clavata. Heredity, 101(2), 120–126.
Cleaveland, S., Hess, G. R., Dobson, A. P., Laurenson, M. K., McCallum, H. I. and Roberts,
M. G. (2002). The Role of Pathogens in Biological Conservation. In The Ecology of
Wildlife Disease (Hudson, P. J. et al., eds). Oxford, Oxford University Press, 139–
50.
Cohen, T. M., King, R., Dolev, A., Boldo, A., Lichter-Peled, A., and Bar-Gal, G. K. (2013).
Genetic characterization of populations of the golden jackal and the red fox in
Israel. Conservation Genetics, 14(1), 55-63.
Colwell, R. K., Chao, A., Gotelli, N. J., Lin, S –Y., Mao, C. X., Chazdon, R. L. and Longino, J. T.
(2012). Models and estimators linking individual-based and sample-based
rarefaction, extrapolation, and comparison of assemblages. Journal of Plant
Ecology, 5(1), 3-21.
Davey, J. W., Hohenlohe, P. A., Etter, P. D., Boone, J. Q., Catchen, J. M., and Blaxter, M. L.
(2011). Genome-wide genetic marker discovery and genotyping using next-
generation sequencing. Nature Reviews Genetics, 12(7), 499-510.
Deressa, A. et al. (2010). The status of rabies in Ethiopia: A retrospective record review.
Ethiopian Journal of Health Development, 24(2), 127-132.
Ellegren, H. (1991). DNA typing of museum birds. Nature, 354, 113–113.

71
England, P. R., Osler, G. H. R., Woodworth, L. M. et al. (2003). Effects of intense versus
diffuse population bottlenecks on microsatellite genetic diversity and evolutionary
potential. Conservation Genetics, 4(3), 595-604.
Evanno, G., S. Regnaut, and J. Goudet (2005). Detecting the number of clusters of
individuals using the software STRUCTURE: A simulation study. Molecular Ecology,
14(13), 2611–2620.
EWCP (2013). Ethiopian Wolf Conservation Programme. Retrived on 24th of September
2013, from http://www.ethiopianwolf.org/wolves/DistributionandStatus.htm.
EWCP (2014). Disease control and prevention for Ethiopian Wolf populations. Retrieved
27th on February 2014, from
http://www.ethiopianwolf.org/Programme/disease.shtml.
Fekadu, M. (2007). Human rabies surveillance and control in Ethiopia. In Proceedings of
the Southern and Eastern African rabies group meeting 1997 March 4 -6. Nairobi,
Kenya.
Frankham, R. (2010). Where are we in conservation genetics and where do we need to
go? Conservation Genetics, 11(2), 661-663.
Frankham, R., Ballou, J.D. and Briscoe, D.A. (2010). Introduction to Conservation Genetics .
(2nd Edition). Cambridge University Press: New York, United States of America.
Frantz A. C., Cellina S., Krier A., Schley L. and Burke T. (2009). Using spatial Bayesian
methods to determine the genetic structure of a continuously distributed
72
population: clusters or isolation by distance? Journal of Applied Ecology, 46(3),
493–505.
Funk, S. M., Fiorello, C,V., Cleaveland, S. and Gompper. M. E. (2003). The Role of Disease
in Carnivore Ecology and Conservation. In: Gittleman J. L., Funk S. M., Macdonald
D., Wayne R. K., editors. Carnivore Conservation. Cambridge, U.K.: Cambridge
University Press. 445-467.
FZS (Frankfurt Zoological Society 2007). Bale Mountains National Park General
Management Plan. Frankfurt Zoological Society; Frankfurt, Germany.
Gardner, M.G., Fitch, A.J., Bertozzi, T. and Lowe, A.J. (2011). Rise of the machines –
recommendations for ecologists when using next generation sequencing for
microsatellite development. Molecular Ecology Resources, 11(6), 1093-1101.
Garza, J. C. and Williamson, E. G. (2001). Detection of reduction in population size using
data from microsatellite loci. Molecular Ecology, 10(2), 305-318.
Girman, D. J., Mills, M. G. L., Geffen, E. and Wayne, R. K. (1997). A molecular genetic
analysis of the social structure, dispersal, and interpack relationships of the
African wild dog (Lycaon pictus). Behavioural Ecology and Sociobiology, 40(2),
187–198.
Gottelli, D. and Sillero-Zubiri, C. (1994). The Ethiopian wolf – an endangered endemic
canid. Oryx, 26(4), 205.
Gottelli, D. et al. (1994). Molecular genetics of the most endangered canid: the Ethiopian
wolf Canis simensis. Molecular Ecology, 3(4), 301–312.
73
Gottelli, D. et al. (2004). The effect of the last glacial age on speciation and population
genetic structure of the endangered Ethiopian wolf ( Canis simensis). Molecular
Ecology, 13(8), 2275–86.
Gottelli D., Sillero-Zubiri C., Marino J., Funk S. M. and Wang, J. (2013) Genetic structure
and patterns of gene flow among populations of the endangered Ethiopian wolf.
Animal Conservation, 16(2), 234–247.
Guichoux, E., Lagache, L., Wagner, S., Chaumeil, P., Léger, P., Lepais, O. and Petit, R. J.
(2011). Current trends in microsatellite genotyping. Molecular Ecology Resources,
11(4), 591-611.
Haydon, D.T. et al. (2006). Low-coverage vaccination strategies for the conservation of
endangered species. Nature, 443(7112), 692–5.
Haydon, D.T. et al. (2002). Identifying reservoirs of infection: A conceptual and practical
challenge. Emerging Infectious Diseases, 8(12), 1468-173.
Haydon, D.T. et al. (2006). Low-coverage vaccination strategies for the conservation of
endangered species. Nature, 443(7112), 692–5.
Hedrick, P. W. and Miller, P. S. (1992) Techniques and fundamentals in Ecological
Applications. Conservation Genetics, 7(1), 30–46.
Hedrick P. W., and Kalinowski, S. T. (2000). Inbreeding depression and conservation.
Annual Review of Ecology and Systematics, 31, 139-162.
Hedrick, P. W., and Fredrickson, R. J. (2008). Captive breeding and the reintroduction of
Mexican and red wolves. Molecular Ecology, 17(1), 344-350.
74
Hillman, J. C. (1986). Conservation in Bale Mountains National Park, Ethiopia. Oryx, 20(2),
89-94.
Hillman, J. C. (1988). The Bale Mountains National Aark area, Southeast Ethiopia, and its
management. Mountain Research and Development, 8(2/3), 253-258.
Hongye, L. and Roossinck M. J. (2004). Genetic bottlenecks reduce population variation in
an experimental RNA virus population. Journal of Virology, 78(19), 10582-10587.
IUCN Red List (2014). Table 6a: Red List Category summary country totals (Animals) IUCN
Summaries. Retrieved on the 24th of July 2014, from
http://www.iucnredlist.org/about/summary-statistics.
Jackson, A. (2013). Rabies: Scientific Basis of the Disease and Its Management (3rd
Edition). Academic Press.
Jackson, A. C. and Wunner, W. H., (2007). Rabies (2nd edition). Academic Press.
Janečka, J. E., Jackson, ., Yuquang, Z., Diqiang, L., Munkhtsog, B., Buckley‐Beason, V.,
and Murphy, W. J. (2008). Population monitoring of snow leopards using
noninvasive collection of scat samples: a pilot study. Animal Conservation, 11(5),
401-411.
Jarne, P., and Lagoda, P. J. (1996). Microsatellites, from molecules to populations and
back. Trends in Ecology and Evolution, 11(10), 424-429.
Jędrzeje ski, W., Branicki, W., Veit, C., Meðugorac, I., Pilot, M., and Bunevich, A. N.
(2005). Genetic diversity and relatedness within packs in an intensely hunted
population of wolves Canis lupus. Acta Theriologica, 50(1), 3–22.
75
Jemberu, W.T. et al. (2013). Incidence of rabies in humans and domestic animals and
people’s a areness in North Gondar Zone, Ethiopia. PLoS Neglected Tropical
Diseases, 7(5), 2216.
Jones, O. R. and Wang, J. (2010), COLONY: a program for parentage and sibship inference
from multilocus genotype data. Molecular Ecology Resources, 10(2), 551–555.
Kalinowski, S. T., Taper, M. L. and Marshall, T. C. (2007). Revising how the computer
program CERVUS accommodates genotyping error increases success in paternity
assignment. Molecular Ecology, 16(4), 1099-1106.
King, R. A., Read, D. S., Traugott, M., and Symondson, W. O. C. (2008). Molecular analysis
of predation: a review of best practice for DNA‐based approaches. Molecular
Ecology, 17(4), 947-963.
Lacy, R.C. (1987). Loss of genetic diversity from managed populations: Interacting effects
of drift, mutation, immigration, selection, and population subdivision.
Conservation Biology, 1(2), 143–158.
Laikre, L. (2010). Genetic diversity is overlooked in international conservation policy
implementation. Conservation Genetics, 11(2), 349-354.
Lande, R. (1994). Risk of population extinction from fixation of new deleterious
mutations. Evolution, 7, 1460–1469.
Linscott, A. J. (2012). Rabies. Clinical Microbiology Newsletter, 34(22), 177–180.
Loeschcke, V., Tomiuk, J., and Jain, S. K. (Eds.). (1994). Conservation Genetics [symposium
on Conservation Genetics Held in May 1993, Aarhus, Denmark] (Vol. 68). Springer.

76
Luikart, G., Sherwin, W. B., Steele, B. M. and Allendorf, F. W. (1998). Usefulness of
molecular markers for detecting population bottlenecks via monitoring genetic
change. Molecular Ecology, 7, 963–974. doi: 10.1046/j.1365-294x.1998.00414.x.
Marcovitch, H. (2010). Black’s Medical Dictionary. 42nd edition. A and C Black Publishers
Ltd.: 36 Soho Square, London, W1D 3HB.
Marino, J. and Sillero-Zubiri, C. (2011). Canis simensis. In: IUCN (2013). IUCN Red List of
Threatened Species. Version 2013.1. Retrieved on the 24th of September 2013,
from www.iucnredlist.org.
Marino, J., (2003). Threatened Ethiopian wolves persist in small isolated afroalpine
enclaves. Oryx, 37(1), 62–71.
Marino, J., Sillero-Zubiri, C. and Macdonald, D. W. (2005). Trends, dynamics and resilience
of an Ethiopian wolf population. Animal Conservation, 9(1), 49–58.
Marucco, F., Boitani, L., Pletscher, D. H., and Schwartz, M. K. (2011). Bridging the gaps
between non-invasive genetic sampling and population parameter
estimation. European Journal of Wildlife Research, 57(1), 1-13.
Mondol, S., Karanth, K. U., Kumar, N. S., Gopalaswamy, A. M., Andheria, A., and
Ramakrishnan, U. (2009). Evaluation of non-invasive genetic sampling methods for
estimating tiger population size. Biological Conservation, 142(10), 2350-2360.
Mullins, J., Statham, M. J., oche, ., urner, P. D., and O’ eill , C. 2010). emotel
plucked hair genotyping: a reliable and non-invasive method for censusing pine

77
marten (Martes martes, L. 1758) populations. European Journal of Wildlife
Research, 56(3), 443-453.
Munda , J. S., and Knight, C. G. 2010). Amplification of feline sarcoid‐associated
papillomavirus DNA sequences from bovine skin. Veterinary Dermatology, 21(4),
341-344.
Nature Ed. (2014). Population Bottleneck. Retrieved 2nd of October 2014, from
http://www.nature.com/scitable/definition/population-bottleneck-300.
Nei, M. T. (1987). Molecular Evolutionary Genetics. Columbia University Press.
Nei, M. T., Maruyama, T. and Chakraborty, R. (1975). The bottleneck effect and genetic
variability in populations. Evolution, 29(1), 1-10.
Olsen, M. E., Bengtsson, C. F., Bertelsen, M. F., Willerslev, E., and Gilbert, M. T. P. (2012).
DNA from keratinous tissue: Part II: Feather. Annals of Anatomy-Anatomischer
Anzeiger, 194(1), 31-35.
Ouborg, N., Pertoldi, C., Loeschcke, V., Bijlsma, R. K., and Hedrick, P. W. (2010).
Conservation genetics in transition to conservation genomics. Trends in Genetics,
26(4), 177-187.
Pérez, T., Vázquez, F., Naves, J., Fernández, A., Corao, A., Albornoz, J., and Domínguez, A.
(2009). Non-invasive genetic study of the endangered Cantabrian brown bear
(Ursus arctos). Conservation Genetics, 10(2), 291-301.
Piry, S., Luikart, G. and Cornuet, J. M. (1999). Bottleneck Version 1.2.02: A Program for
Detecting Recent Effective Population Size Reductions from Allele Frequencies.

78
Available from the authors. Laboratoire de Modelisation et de Biologie Evolutive,
INRA-URLB, rue de la Croix-Lavit, 34090 Montpellier Cedex, France.
Poulakakis, N., Lymberakis, P., Paragamian, K., and Mylonas, M. (2005). Isolation and
amplification of shrew DNA from barn owl pellets. Biological Journal of the
Linnean Society, 85(3), 331-340.
Pritchard, J.K. (2010). Documentation for Structure Software. Version 2.3. Department of
Human Genetics, University of Chicago.
Pritchard, J.K., Stephens , M. and Donnelly, (2000). Inference of population structure
using multilocus genotype data. Genetics, 155, 945-959.
Randall, D. A. (2006). Determinants of genetic variation in the Ethiopian wolf, Canis
simensis. PhD thesis, University of Oxford.
Randall, D. A. et al., (2007). Inbreeding is reduced by female-biased dispersal and mating
behavior in Ethiopian wolves. Behavioral Ecology, 18(3), 579–589.
Randall, D. A. et al., (2009). Fine-scale genetic structure in Ethiopian wolves imposed by
sociality, migration, and population bottlenecks. Conservation Genetics, 11(1), 89–
101.
Randall, D. A., Thirgood, S. and Kinahan, A. (2011). Walia-Special Edition on the Bale
Mountains. Journal of the Ethiopian Wildlife and Natural History Society, 1 –350.
Randall, D. A., Williams, S. D., Kuzmin, I. V., Rupprecht, C. E., Tallents, L. A., Tefera, Z., and
Laurenson, M. K. (2004). Rabies in endangered Ethiopian wolves. Emerging
Infectious Diseases, 10(12), 2214-2217.

79
Raymond, M. and Rousset, F. (1995). GENEPOP (Version 1.2): population genetics
software for exact tests and ecumenicism. Journal of Heredity, 86(2), 248-249.
Refera, B. and Bekele, A. (2004). Population status and structure of mountain nyala in the
Bale Mountains National Park, Ethiopia. African Journal of Ecology, 42(1), 1-7.
Rivière‐Dobigny, T., Doan, L. P., Quang, N. L., Maillard, J. C., and Michaux, J. (2009).
Species identification, molecular sexing and genotyping using non‐invasive
approaches in two wild bovids species: Bos gaurus and Bos javanicus. Zoo
Biology, 28(2), 127-136.
Rousset, F. (2008). Genepop'007: a complete reimplementation of the Genepop software
for Windows and Linux. Molecular Ecology Resources, 8(1), 103-106.
ppell, E. (1835). Neue Wirbelthiere zu der Fauna von Abyssinien gehörig. Frankfurt am
Main: S. Schmerber.
Schlötterer, C. and Tautz, D. (1992). Slippage synthesis of simple sequence DNA. Nucleic
Acids Research, 20(2), 211-215.
Schlotterer, C., Amos, B. and Tautz, D. (1991). Conservation of polymorphic simple
sequence loci in cetacean species. Nature, 354, 63–65.
Schmaltz, G., Somers, C. M., Sharma, P., and Quinn, J. S. (2006). Non-destructive sampling
of maternal DNA from the external shell of bird eggs. Conservation Genetics, 7(4),
543-549.
Schuler, G.D., Boguski, M.S., Stewart, E.A. et al. (1996). A gene map of the human
genome. Science, 274, 540–546.
80
Schwartz, M. K., Luikart, G., and Waples, R. S. (2007). Genetic monitoring as a promising
tool for conservation and management. Trends in Ecology and Evolution, 22(1),
25-33.
Selkoe, K. A., and Toonen, R. J. (2006). Microsatellites for ecologists: a practical guide to
using and evaluating microsatellite markers. Ecology Letters, 9(5), 615-629.
Shimatani, Y., Takeshita, T., Tatsuzawa, S., Ikeda, T., and Masuda, R. (2008). Genetic
identification of mammalian carnivore species in the Kushiro wetland, eastern
Hokkaido, Japan, by analysis of faecal DNA. Zoological Science, 25(7), 714-720.
Sillero-Zubiri, C. and Gottelli, D., (1995). Diet and feeding behavior of Ethiopian wolves
(Canis simensis). Journal of Mammalogy, 76(2), 531–541.
Sillero-Zubiri, C. and Macdonald, D.W., (1998). Scent-marking and territorial behaviour of
Ethiopian wolves Canis simensis. Journal of Zoology, 245(3), 351–361.
Sillero-Zubiri, C. and Macdonald, D.W. (1997). The Ethiopian Wolf: Status Survey and
Conservation Action Plan. IUCN: Gland, Switzerland.
Sillero-Zubiri, C. et al., (1994). Mammalian Species. The American Society of
Mammalogists, 485, 1–6.
Sillero-Zubiri, C., Gottelli, D. and Macdonald, D. W. (1996). Male philopatry, extra-pack
copulations and inbreeding avoidance in Ethiopian wolves (Canis simensis).
Behavioral Ecology and Sociobiology, 38(5), 331–340.

81
Sillero-Zubiri, C., Johnson, P. J. and Macdonald, D. W. (1998). A hypothesis for breeding
synchrony in Ethiopian wolves (Canis simensis). Journal of Mammalogy, 79(3),
853–858.
Stephens, P. A., d'Sa, C. A., Sillero-Zubiri, C., and Leader-Williams, N. (2001). Impact of
livestock and settlement on the large mammalian wildlife of Bale Mountains
National Park, southern Ethiopia. Biological Conservation, 100(3), 307-322.
Sterner, R. T. and Smith, G. C. (2006). Modelling wildlife rabies: Transmission, economics,
and conservation. Biological Conservation, 131(2), 163–179.
Taberlet, P., Gielly, L., Pautou, G., and Bouvet, J. (1991). Universal primers for
amplification of three non-coding regions of chloroplast DNA. Plant Molecular
Biology, 17(5), 1105–1109.
Taberlet, P. and Luikart, G., (1999). Non-invasive genetic sampling and individual
identification. Biological Journal of the Linnean Society, 68(1-2), 41–55.
Taberlet, P., Waits, L. P. and Luikart, G. (1999). Non-invasive genetic sampling: look
before you leap. Trends in Ecology and Evolution, 14(8), 323-327.
van Kesteren, F. et al., (2012). Sex, stress and social status: patterns in fecal testosterone
and glucocorticoid metabolites in male Ethiopian wolves. General and
Comparative Endocrinology, 179(1), 30–7.
van Kesteren, F. et al., (2013). The physiology of cooperative breeding in a rare social
canid: sex, suppression and pseudopregnancy in female Ethiopian wolves.
Physiology and Behaviour, 122(1), 39-45.
82
van Oosterhout, C., Hutchinson, W.F., Wills, D.P.M. and Shipley, P. (2004). Micro-Checker:
software for identifying and correcting genotyping errors in microsatellite data.
Molecular Ecology Notes, 4(2), 535-538.
Whitlock, M. C. and Barton, N. H. (1997). The effective size of a subdivided population.
Genetics, 146(2), 427-441.
Vial, F. et al. (2010). An analysis of long-term trends in the abundance of domestic
livestock and free-roaming dogs in the Bale Mountains National Park, Ethiopia.
African Journal of Ecology, 49(1), 91–102.
Vila, C., Sundqvist, A-K., Flagstad, Ø. et al. (2003). Rescue of a severely bottlenecked wolf
(Canis lupus) population by a single immigrant. Proceedings of the Royal Society B,
270(1), 91-97.
Waits, L.P. and Paetkau, D. (2005). Noninvasive genetic sampling tools for wildlife
biologists: A review of application and recommendations for accurate data
collection. Journal of Wildlife Management, 69(4), 1419-1433.
Wang, J. (2011). COANCESTRY: a program for simulating, estimating and analysing
relatedness and inbreeding coefficients. Molecular Ecology Resources, 11(1), 141-
145.
Wang J. and Santure A. W. (2009). Parentage and sibship inference from multilocus
genotype data under polygamy. Genetics, 181(7), 1579–1594.
Wang, J. (2014). Marker-based estimates of relatedness and inbreeding coefficients: an
assessment of current methods. Journal of Evolutionary Biology, 27(4), 518–530.
83
Woodroffe, R. et al., (2012). Contact with domestic dogs increases pathogen exposure in
endangered African wild dogs (Lycaon pictus). PloS One, 7(1), p.e30099.
Woodroffe, R., Cleaveland, S., Courtenay, O., Laurenson, M, K. and Artois, M. (2004).
Infectious Diseases in the Management and Conservation of Wild Canids. In:
Macdonald DW, Sillero-Zubiri C, editors. The Biology and Conservation of Wild
Canids. Oxford: Oxford University Press; 123–142.
World Health Organisation (WHO 2013). Rabies. Media Centre, Fact Sheets . Retrieved on
the 27th of February 2014, from
http://www.who.int/mediacentre/factsheets/fs099/en/.
Wright, S. (1969). Evolution and the Genetics of Populations (Volume 2). The Theory of
Gene Frequencies. University of Chicago Press.
Yalden, D. W., Largen, M. J. and Kock, D. (1980). Catalogue of the mammals of Ethiopia. 4.
Carnivora. Monitore Zoologico Italiano/Italian Journal of Zoology, N.S.
Supplemento, 13(8), 169-272.

84
6. Appendix

85
Table A1: Genot ped allele sizes for each individual sample in ro s). Individuals are further subdivided into ‘Packs’, displa ing the estimated
age and sex of each individual provided by Freya van Kesteren. Those which failed to amplify are represented as a dash. N: total number of
individuals amplified, Na: the number of alleles observed
Information Genotypes
Pack Age Sex Sample ID FH2137 FH2226 FH2422 FH2054 FH2001 PEZ19 FH2140
Alando Adult Male F14 157 197 206 210 204 238 - - - - 186 198 111 127
Alando Adult Male 48 157 157 206 210 204 208 148 160 126 150 186 186 - -
Alando Adult Male 52 157 177 202 206 208 208 - - - - - - 111 127
Alando Subadult Male 54 157 157 202 210 200 204 - - 126 150 198 198 111 127
Alando Subadult Female 56 157 161 206 210 200 204 156 168 126 126 186 198 111 111
Alando Adult Male F5 161 165 210 210 204 204 - - 126 150 198 202 111 127
Alando Adult Male 85 157 157 202 202 200 204 - - - - 194 198 119 119

86
Alando Adult Female 98 157 161 150 202 208 212 - - 126 166 - - 111 127
Darkeena Adult Female F8 161 161 202 210 - - 156 164 126 154 186 198 111 127
Darkeena Adult Female 51 157 169 202 210 200 204 160 164 126 126 194 202 111 127
Darkeena Subadult Female 68 157 169 210 214 200 204 156 164 - - 198 202 111 111
Darkeena Adult Male 89 157 157 202 202 200 200 160 160 - - - - 111 127
Darkeena Adult Male 95 157 157 202 202 200 204 156 160 126 142 198 202 111 127
Darkeena Adult Male 96 157 157 202 210 200 200 156 160 126 126 202 202 111 111
Darkeena Adult Female 99 157 169 202 210 200 204 160 164 - - 198 202 111 127
Floater Adult Female 70 161 169 198 202 204 204 148 168 122 126 186 198 - -
Floater Adult Female 94 161 169 202 210 204 212 156 156 - - 198 198 111 127
Kotera Adult Female F7 157 161 202 206 - - - - 126 142 186 202 127 135
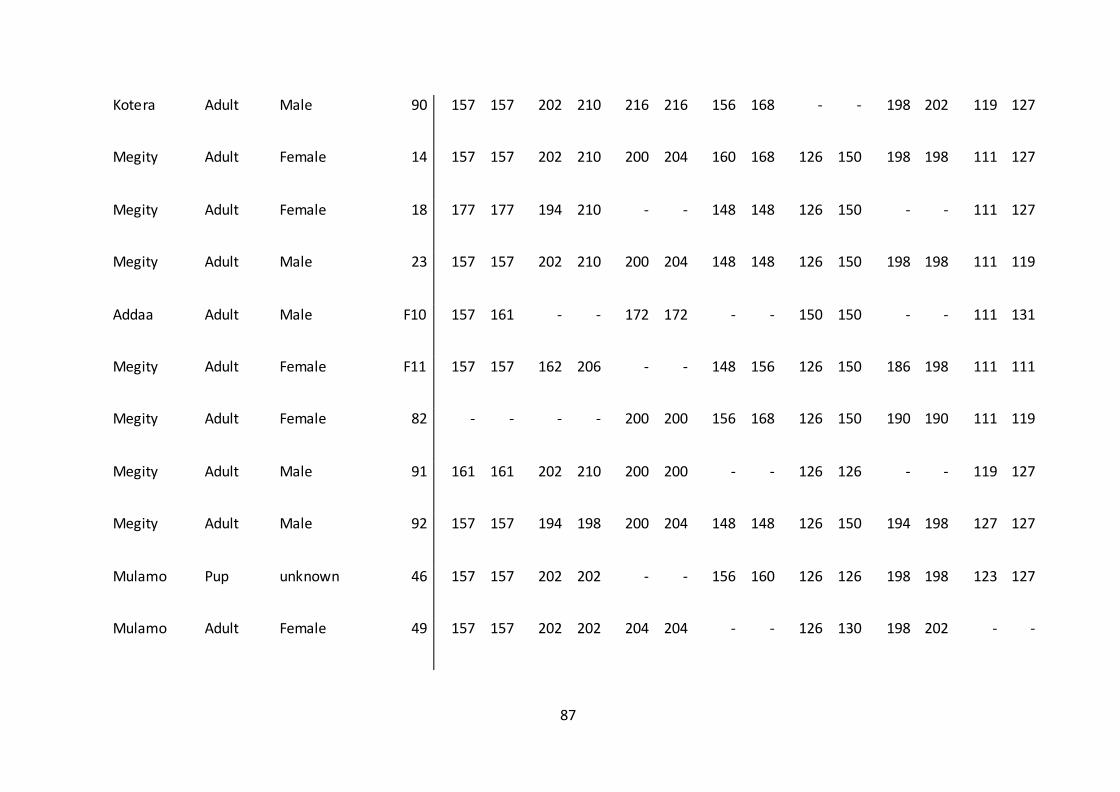
87
Kotera Adult Male 90 157 157 202 210 216 216 156 168 - - 198 202 119 127
Megity Adult Female 14 157 157 202 210 200 204 160 168 126 150 198 198 111 127
Megity Adult Female 18 177 177 194 210 - - 148 148 126 150 - - 111 127
Megity Adult Male 23 157 157 202 210 200 204 148 148 126 150 198 198 111 119
Addaa Adult Male F10 157 161 - - 172 172 - - 150 150 - - 111 131
Megity Adult Female F11 157 157 162 206 - - 148 156 126 150 186 198 111 111
Megity Adult Female 82 - - - - 200 200 156 168 126 150 190 190 111 119
Megity Adult Male 91 161 161 202 210 200 200 - - 126 126 - - 119 127
Megity Adult Male 92 157 157 194 198 200 204 148 148 126 150 194 198 127 127
Mulamo Pup unknown 46 157 157 202 202 - - 156 160 126 126 198 198 123 127
Mulamo Adult Female 49 157 157 202 202 204 204 - - 126 130 198 202 - -
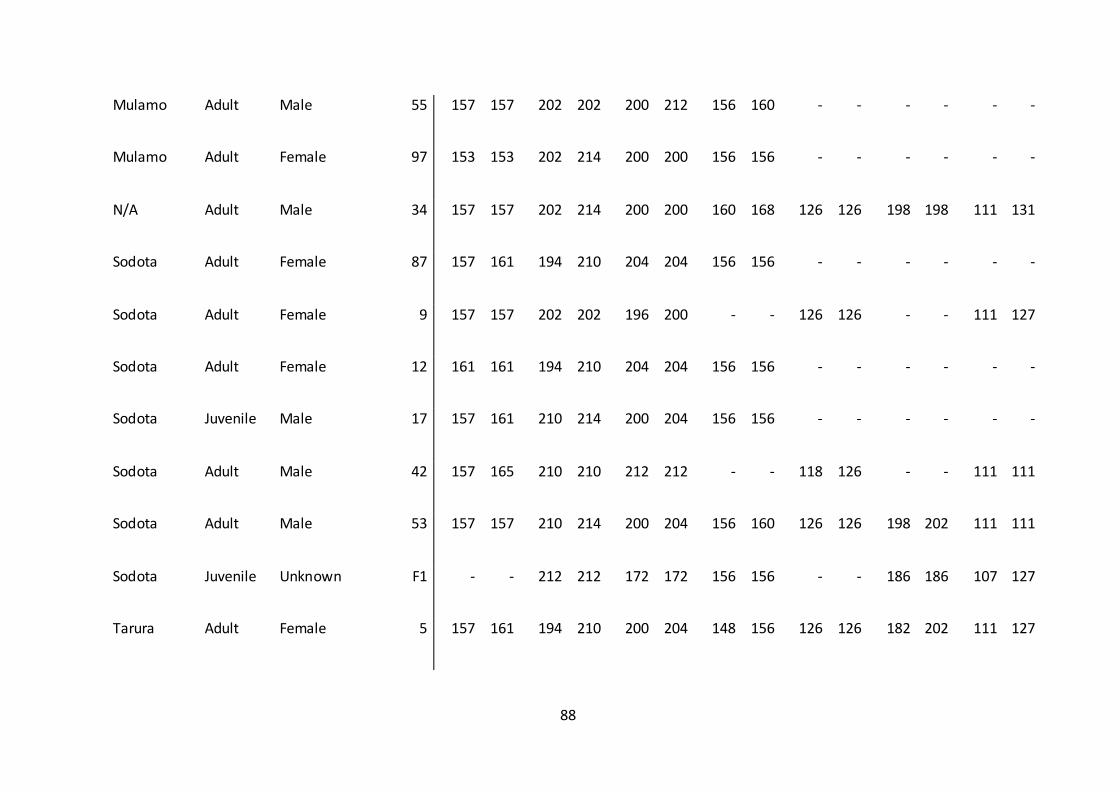
88
Mulamo Adult Male 55 157 157 202 202 200 212 156 160 - - - - - -
Mulamo Adult Female 97 153 153 202 214 200 200 156 156 - - - - - -
N/A Adult Male 34 157 157 202 214 200 200 160 168 126 126 198 198 111 131
Sodota Adult Female 87 157 161 194 210 204 204 156 156 - - - - - -
Sodota Adult Female 9 157 157 202 202 196 200 - - 126 126 - - 111 127
Sodota Adult Female 12 161 161 194 210 204 204 156 156 - - - - - -
Sodota Juvenile Male 17 157 161 210 214 200 204 156 156 - - - - - -
Sodota Adult Male 42 157 165 210 210 212 212 - - 118 126 - - 111 111
Sodota Adult Male 53 157 157 210 214 200 204 156 160 126 126 198 202 111 111
Sodota Juvenile Unknown F1 - - 212 212 172 172 156 156 - - 186 186 107 127
Tarura Adult Female 5 157 161 194 210 200 204 148 156 126 126 182 202 111 127
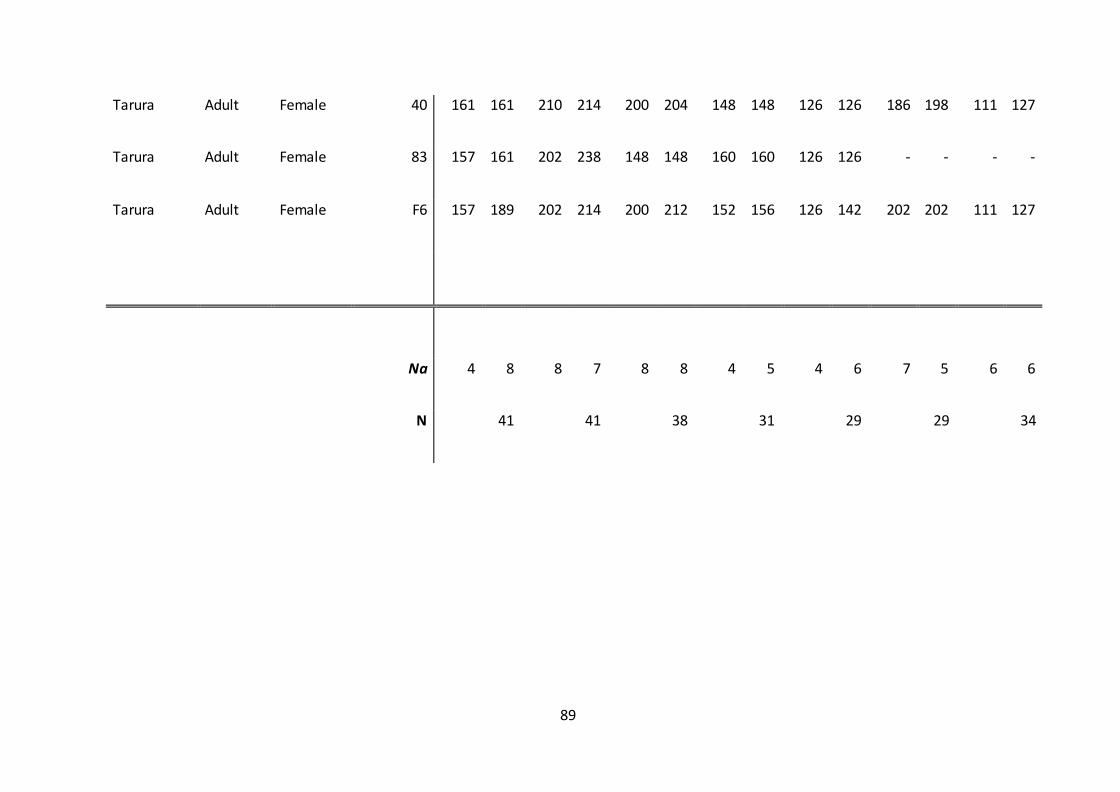
89
Tarura Adult Female 40 161 161 210 214 200 204 148 148 126 126 186 198 111 127
Tarura Adult Female 83 157 161 202 238 148 148 160 160 126 126 - - - -
Tarura Adult Female F6 157 189 202 214 200 212 152 156 126 142 202 202 111 127
Na 4 8 8 7 8 8 4 5 4 6 7 5 6 6
N 41 41 38 31 29 29 34