genetic diversity, linkage disequilibrium, population...
TRANSCRIPT
RESEARCH ARTICLE Open Access
Genetic diversity, linkage disequilibrium,population structure and construction of acore collection of Prunus avium L. landracesand bred cultivarsJosé Antonio Campoy1,2, Emilie Lerigoleur-Balsemin1,2,3, Hélène Christmann1,2, Rémi Beauvieux1,2, Nabil Girollet4,5,José Quero-García1,2, Elisabeth Dirlewanger1,2 and Teresa Barreneche1,2*
Abstract
Background: Depiction of the genetic diversity, linkage disequilibrium (LD) and population structure is essential forthe efficient organization and exploitation of genetic resources. The objectives of this study were to (i) to evaluate thegenetic diversity and to detect the patterns of LD, (ii) to estimate the levels of population structure and (iii) to identify a‘core collection’ suitable for association genetic studies in sweet cherry.
Results: A total of 210 genotypes including modern cultivars and landraces from 16 countries were genotypedusing the RosBREED cherry 6 K SNP array v1. Two groups, mainly bred cultivars and landraces, respectively, werefirst detected using STRUCTURE software and confirmed by Principal Coordinate Analysis (PCoA). Further analysesidentified nine subgroups using STRUCTURE and Discriminant Analysis of Principal Components (DAPC). Severalsub-groups correspond to different eco-geographic regions of landraces distribution. Linkage disequilibrium wasevaluated showing lower values than in peach, the reference Prunus species. A ‘core collection’ containing 156accessions was selected using the maximum length sub tree method.
Conclusion: The present study constitutes the first population genetics analysis in cultivated sweet cherry using amedium-density SNP (single nucleotide polymorphism) marker array. We provided estimations of linkage disequilibrium,genetic structure and the definition of a first INRA’s Sweet Cherry core collection useful for breeding programs,germplasm management and association genetics studies.
Keywords: Association genetics, Core collection, Discriminant analysis, Genetic diversity, Germplasm management,Linkage disequilibrium, Population structure, Prunus avium
BackgroundPrunus avium L. is an economically important temper-ate species exploited as timber, fruit or rootstock. InEurope, sweet cherry, the cultivated form of P. avium, isgrown in large areas. Cherries are very appreciated notonly for their taste and flavor but because they are thefirst stone fruits in the markets after the winter. In 2013,Western Europe sweet cherry production represented
the 4th one in the world (118,343 tons) according toFAO data (www.fao.org).Prunus avium originated likely in an area between the
Black and the Caspian Seas [1, 2]. Stones dated fromNeolithic or from Bronze Age found in Central Europe[3] suggested that wild cherry has spread until the ex-tremity of its present area of distribution very early andwell before its domestication [4]. Sweet cherry was prob-ably domesticated in the Prunus avium area of originbut the hypothesis of several different domesticationevents from different wild populations cannot be dis-carded [4]. First cultivated in Greece [5], sweet cherrywas later spread all over Europe. Its cultivation seems to
* Correspondence: [email protected], UMR 1332 de Biologie du Fruit et Pathologie, F-33140 Villenave d’Ornon,France2University Bordeaux, UMR 1332 de Biologie du Fruit et Pathologie,F-33140 Villenave d’Ornon, FranceFull list of author information is available at the end of the article
© 2016 Campoy et al. Open Access This article is distributed under the terms of the Creative Commons Attribution 4.0International License (http://creativecommons.org/licenses/by/4.0/), which permits unrestricted use, distribution, andreproduction in any medium, provided you give appropriate credit to the original author(s) and the source, provide a link tothe Creative Commons license, and indicate if changes were made. The Creative Commons Public Domain Dedication waiver(http://creativecommons.org/publicdomain/zero/1.0/) applies to the data made available in this article, unless otherwise stated.
Campoy et al. BMC Plant Biology (2016) 16:49 DOI 10.1186/s12870-016-0712-9
be very old, its grafting technique was already describedby the Roman writer Varo BC, and Pliny (23–79 AD) gaveinformation of eight distinct cultivars [6, 7]. As a result ofcenturies of natural and human selection a multitude ofcherry landraces were raised in Europe. The economicand social status of cherries has changed in European so-cieties between classical and medieval times [8]. Thesefruits played an important social role in the medieval elitediet regime [9] before becoming a more common fruitduring the later centuries [8, 10].Although many landraces have been lost, a large di-
versity still exists in Europe (i.e.: 900 cherry landracesare reported in the European Prunus database). Onthe contrary, a narrow genetic bottleneck is found inmodern cultivars [11]. Landraces are the heritage ofgenerations of farmers, reflecting not only the plurality ofthe landscapes but also of old farmer’s production sys-tems. Landraces were shaped both by edaphoclimatic andtraditional agrarian systems diversity and by plurality ofhuman customs. In the last decade, there has been a rapidevolution in cherry cultivation, which has fostered newinterest for this highly appreciated crop. New high-qualityvarieties with improved taste, fruit size, productivity, and,to a lesser extent, resistance to biotic and abiotic stresses,have been developed. For a long time, a small number ofsweet cherry varieties (such as ‘Burlat’, ‘Bing’ or ‘Summit’)dominated the market. However, a much wider range ofvarieties, spanning the whole range of maturity period,have been recently released. Nevertheless, molecular di-versity studies conducted with simple sequence repeats(SSR) have demonstrated the narrow genetic base that hasbeen used up to date for the breeding of modern cherryvarieties [11–13]. Moreover, the main production regionsbase their production on a very restricted number of var-ieties (i.e.: in Turkey, the main world producer, 90 % ofthe sweet cherry production is assured by ‘0900Ziraat’ cul-tivar [14]).In Europe, cherry producers face nowadays new chal-
lenges such as sustainable production of high qualityfruits, climate change or invasion of new pathogens (i.e.Drosophila suzukii). Hence, exploring cherry genetic di-versity is crucial in order to create new cultivars welladapted to these challenges. Ex situ genetic resources col-lections remain valuable reservoirs of allelic variability formany traits not yet exploited in current breeding pro-grams. Cherry collections characterization is therefore amajor step to facilitate the increased utilization of cherrygenetic resources and encourage the sharing of conserva-tion responsibilities between countries in Europe. INRA isthe leader of the Prunus genetic resources French nationalnetwork and it manages large cherry collections includ-ing the French National Sweet Cherry collection. Thepreservation, evaluation and management of large exsitu germplasm collections are expensive and time
consuming [15, 16]. Hence, identifying ‘core collections’that maximize cherry genetic diversity with minimum re-dundancy represents a suitable solution to reduce costs.In addition, ‘core-collections’ may be useful tools as a firststep in genetic association studies [17, 18]. Criteria basedon genetic distances between accessions have been shownto be ideal for evaluation and creation of ‘core collections’[19]. Knowledge of the genetic structure of heterogeneousgermplasm collections is essential when forming core col-lections [16] and is a prerequisite for deciphering complextraits in genetic resources using association mapping [20].Association mapping is based on the nonrandom associ-ation of alleles at two or more loci, named linkage disequi-librium (LD). Linkage disequilibrium has been estimatedin sweet cherry, using relatively few SSRs, showing amedium decay compared with self-compatible peach [21].To our knowledge, no previous study examined the ex-tent of LD in sweet cherry germplasm with a high num-ber of genome-wide distributed markers. In addition,medium-density SNP arrays have not previously beenevaluated for characterizing genetic diversity, popula-tion structure and construction of core collections insweet cherry.In the context of association mapping, the identification
of subgroups within a population or within germplasmcollections is a condition for the unbiased estimation ofassociation parameters [22]. In most instances, popula-tion’s heterogeneous structure reflects adaptation, domes-tication, and/or breeding effects. In Prunus avium,previous studies have shown a marked genetic bottleneckbetween wild and cultivated cherries [11, 23] as well as apopulation structure showing three clusters: wild cherry,landraces, and modern sweet cherry cultivars [11].Here, we investigated 210 accessions of the INRA’s
cherry genetic resources collection with the medium-density RosBREED 6 K SNP array [24]. The objectives ofthis study were: i) to evaluate the genetic diversity andto estimate the levels of population structure ii) to detectthe patterns of LD on cherry and iii) to identify a ‘corecollection’ suitable for association genetic studies.
MethodsPlant materialThe sweet cherry collection studied is maintained by theINRA’s Prunus Genetic Resources Center at Bourran(Lot & Garonne), near Bordeaux (France). A total of 210accessions were studied, 50 % of them are of French ori-gin, and belong for a large part to the French NationalSweet Cherry Genetic Resources Collection. The rest ofthe accessions are of 15 other countries of America,Asia and Europe, with a total number of accessions percountry ranging from one to twenty (Additional file 1:Table S1). The accessions can be divided into landraces(n = 99) and bred cultivars. Bred cultivars (n = 111)
Campoy et al. BMC Plant Biology (2016) 16:49 Page 2 of 15
result from selections made quite early (n = 27) andfrom modern breeding (n = 84). This classification wasmainly based either on information coming from litera-ture or, for the French National Sweet Cherry collec-tion, on information gathered in collaboration with the‘Centre National de Pomologie’ at Alès (Gard, France)(http://pomologie.ville-ales.fr/). Six Spanish landracesand one Hungarian modern variety, not included in theINRA’s Prunus Genetic Resources Center, were in-cluded in the study and were provided by PhD AngelFernandez i Marti (Additional file 1: Table S1). One ac-cession by cultivar was studied excepted for two culti-vars ‘Noir d’Ecully’, and ‘Giorgia’ for which twoaccessions of each were studied, corresponding to dif-ferent introduction periods.
DNA extractionLeaf material was frozen in liquid nitrogen and stored at−80 °C for later use. Genomic DNA was extracted fromthe frozen tissue using the DNeasy® plant kit (Qiagen,Hilden, Germany) according to the manufacturer’s in-structions. Genomic DNA was quantified using spectro-photometry Nanoview (GE Healthcare) and fluorimetryQuant-iT™ Picogreen® (Invitrogen) according to themanufacturer’s instructions. Fifteen μl of DNA with aconcentration between 50 ng/μl – 75 ng/μl were usedfor subsequent analyses.
SNPs genotypingAll accessions were genotyped using the RosBREEDcherry 6 K Illumina Infinium II® SNP array v1 [24]. Geno-type differences were recorded in the iSCAN platform andSNP genotypes were determined using Genome StudioGenotyping Module (Version 1.8.4, Illumina™) as de-scribed in [24]. The RosBREED cherry 6 K SNP array v1markers used in this work were deposited in NCBI’sdbSNP repository available at www.ncbi.nlm.nih.gov/pro-jects/SNP [25] and each SNP was given a unique acces-sion number that starts with the prefix ‘ss’ (SNPs NCBIss# database names). More information associated withthese SNPs is available at the Genome Database forRosaceae (GDR; www.rosaceae.org [26]). Physical posi-tions of the SNPs [24]were inferred from the peachgenome [27] and the macrosynteny of peach-sweet cherrygenomes [28]. SNP positions of the ROSBREED cherry6 K array v1.0 on the peach genome v2.0 were redefinedusing batch BLAST function available at the GDR’s website(GDR; www.rosaceae.org [26]) (Additional file 1: Table S2).Illumina’s GenCall software algorithms for clustering,
calling and scoring genotypes were first used to assureSNP quality. SNPs below 0.2 10 %-Gen-Call were re-moved. Initial clustering was done using Gentrain2, aGenomeStudio build-in clustering algorithm [29]. Fol-lowing the clustering by Gentrain2, all SNPs were
visually examined for appropriateness of clustering, clus-ter separation, number of clusters, presence of null al-leles and paralogs. A SNP was considered ‘failed’ if itshowed (1) overlapping clusters or ambiguous clusterswhich could not be improved by even manual cluster-ing (2) more than 3 clusters suggesting presence ofparalogs or (3) very low call frequency [29]. Thefailed SNPs were not used for further analysis. SNPmarkers with missing data above 5 % were also dis-carded for further analysis.
Analysis of genetic variationThe Hardy Weinberg equilibrium (HWE) and the minorallele frequency (MAF) were calculated for each SNPusing PLINK [30]. The SNPs showing severe distortionof the HWE (p < 10e-4), or MAF lower than 0.05, werediscarded from further analysis.The average number of alleles, the observed heterozy-
gosity (Ho), the expected heterozygosity (He) and the in-breeding coefficient (FIS) were calculated on landracesand bred cultivars using adegenet 2.0 R package [31, 32].
Bottleneck detectionWe tested for recent population bottlenecks in the threegroups of plant material (landraces and early and mod-ern breeding) using BOTTLENECK v1.2.02 program[33]. A Sign test and a Standardized differences testsunder a two-phase mutation (TPM) model [34] was usedto determine whether population clusters had undergonea recent bottleneck.
Linkage disequilibriumBecause LD can affect both Principal Coordinate Ana-lysis (PCoA) and STRUCTURE analysis, the marker setwas pruned by excluding SNPs in strong LD usingPLINK software [30]. SNPs were pruned with a windowof 50 SNPs and a step size of 5 makers. The r2 thresholdwas 0.5. Pairwise LD measures for multiple SNPs werecalculated using PLINK [30].Correlations based on genotype allele counts, i.e. not
phased genotypic data, were used to estimate the LDusing PLINK [30]. The squared correlation based ongenotypic allele counts is therefore not identical to ther2 as estimated from haplotype frequencies, although itwill typically be very similar. Because it is faster to calcu-late, it provides a good way to screen for strong LD [30].Total length of each chromosome was chosen as windowsize and all SNP pairs were reported within eachchromosome. The relationship between LD decay andgenetic distance was summarized by fitting a locally-weighted linear regression (loess) line to r2 data [35]using R function ‘loess’ [36]. r2 summarizes both recom-binational and mutational history [37].
Campoy et al. BMC Plant Biology (2016) 16:49 Page 3 of 15
Population structurePCoA (also referred to as Classical MultidimensionalScaling), Bayesian-based (STRUCTURE software [38])and Discriminant Analysis of Principal Components(DAPC) analysis were used to investigate the pattern ofpopulation structure.PCoA is a distance-based model which uses jointly a
dissimilarity matrix calculated with a simple-matchingindex, and a factorial analysis. PCoA was performed usingDARwin 6.0.010 software (Dissimilarity Analysis andRepresentation for Windows) [39, 40]. This softwareproduces graphical representations on Euclidean planswhich preserve at best the distances between units [39, 40].The model-based approach implemented in the soft-
ware package STRUCTURE [38] was also applied toinfer population structure. Structure software optionsoffers to split the Graphic User Interface from the mainalgorithm helping to set large numbers of runs on acomputing cluster (Additional file 2: Figure S1). Accord-ing to this useful scalability, this study supported morethan 10,000 CPU hours, tests and benchmarking opera-tions included. Computer time for this study was pro-vided by the computing facilities MCIA (Mésocentre deCalcul Intensif Aquitain) of the Universities of Bordeauxand Pau et des Pays de l'Adour. Twenty runs of STRUC-TURE were done by setting the number of clusters (K)from 1 to 16 (number of countries of origin of thesampled accessions). Each run consisted of a burn-inperiod of 10.000 steps followed by 100.000 Monte CarloMarkov Chain (MCMC) replicates, assuming an admix-ture model and uncorrelated allele frequencies. No priorinformation was used to define the clusters. For thechoice of the most likely number of clusters (K), theplateau criterion proposed by Pritchard et al. [38] andthe ΔK method, described by Evanno et al. [37] and im-plemented in Structure Harvester [41], were used. Inorder to assess assignment success, STRUCTURE wasrun by enforcing K to its true value. For a given K, weused the run that had the highest likelihood estimate toassign cluster proportions to individuals. Accessionswith estimated memberships above 0.8 were assigned tocorresponding groups whereas accessions with estimatedmemberships below 0.8 were assigned to a mixed group.We ran STRUCTURE on partitioned datasets in orderto investigate lower levels of structure, in relation to theresults obtained. For the partitioned datasets, K wasallowed to vary from one to four for the ‘Bred cultivars’subgroup and from one to 11 for the ‘Landraces’ sub-group, in agreement with the number of countries oforigin of the accessions in each subgroup. Pairwise Fst[42] among the subpopulations identified by STRUC-TURE were calculated using adegenet 2.0.The assumptions underlying the population genetics
model in STRUCTURE may limit its use in crops.
Unlike natural populations, crops are subjected to dis-placements, breeding, clonal propagation, absence ofpanmictic conditions. Thus, we complemented theSTRUCTURE analysis with the DAPC. The absence ofany assumption about the underlying population genet-ics model, in particular concerning Hardy-Weinbergequilibrium or linkage equilibrium, is one of the mainassets of DAPC analysis [43]. DAPC was used to identifyand describe clusters of genetically related individuals, asimplemented in the R’s package adegenet 2.0 [31, 32].DAPC transforms the data using PCA, and then per-forms a Discriminant Analysis on the principal compo-nents (PC) retained using a cross-validation method.This multivariate method is suitable for analyzing largenumbers of genome-wide SNPs, and it provides individ-uals’ assignment to groups as well as a visual assessmentof between-population differentiation.The number of PCs retained can have a substantial
impact on the results of the analysis. Indeed, retainingtoo many components with respect to the number of in-dividuals can lead to over-fitting and instability [31]. Weused the optimization procedure proposed by the R’spackage adegenet to assess the optimal number of PCsto be retained [32]. The cross-validation procedure im-plemented with the function xvalDapc performs strati-fied cross-validation of DAPC using varying numbers ofPCs (and keeping the number of discriminant functionsfixed) [31]. Pairwise Fst [42] among the DAPC clusterswere calculated using adegenet 2.0.
Core collection creationCore collections are subsamples of larger genetic re-sources collections which are created in order to includea minimum number of accessions representing the max-imum diversity of the original collection. DARwin6.0.010’s function ‘maximum length sub tree’ has beenused to select a reference set in chickpea [44], cowpea[45] and sorghum [46]. DARwin version 6.0.010 wasused to build the diversity trees [39, 40]. Dissimilaritieswere calculated with 10.000 bootstraps and transformedinto Euclidean distances. Un-Weighted Neighbor-Joining(N-J) method was applied to the Euclidean distances tobuild a tree with all genotypes. Then, ‘maximum lengthsub tree function’ was used to draw the core collection.Maximum length sub-tree implemented is a stepwiseprocedure that successively prunes redundant individ-uals. This procedure allows the choice of the sample sizewhich retains the largest diversity, and is visualized bythe tree as built on the initial set of accessions (210 ac-cessions in this case). Two accessions are redundant iftheir distance in the tree, as judged by the edges length,is small. The accessions with the longest edge have moreuncommon characters and are therefore genetically mostdiverse. Putative clusters of synonym accessions were
Campoy et al. BMC Plant Biology (2016) 16:49 Page 4 of 15
identified using ‘removed edge value’ provided by the NJtree. A threshold value of 0.0008 was chosen to identifyputative synonyms. Sphericity index and the length ofpruned edge of the initial tree length were used to choosethe final core collection accounting for maximum geneticdiversity [39, 40].
Availability of supporting dataThe genotyping data set supporting the results of thisarticle are available at https://www.rosaceae.org/ andat INRA’s GnpIS repositories {Steinbach, 2013 #3425}.
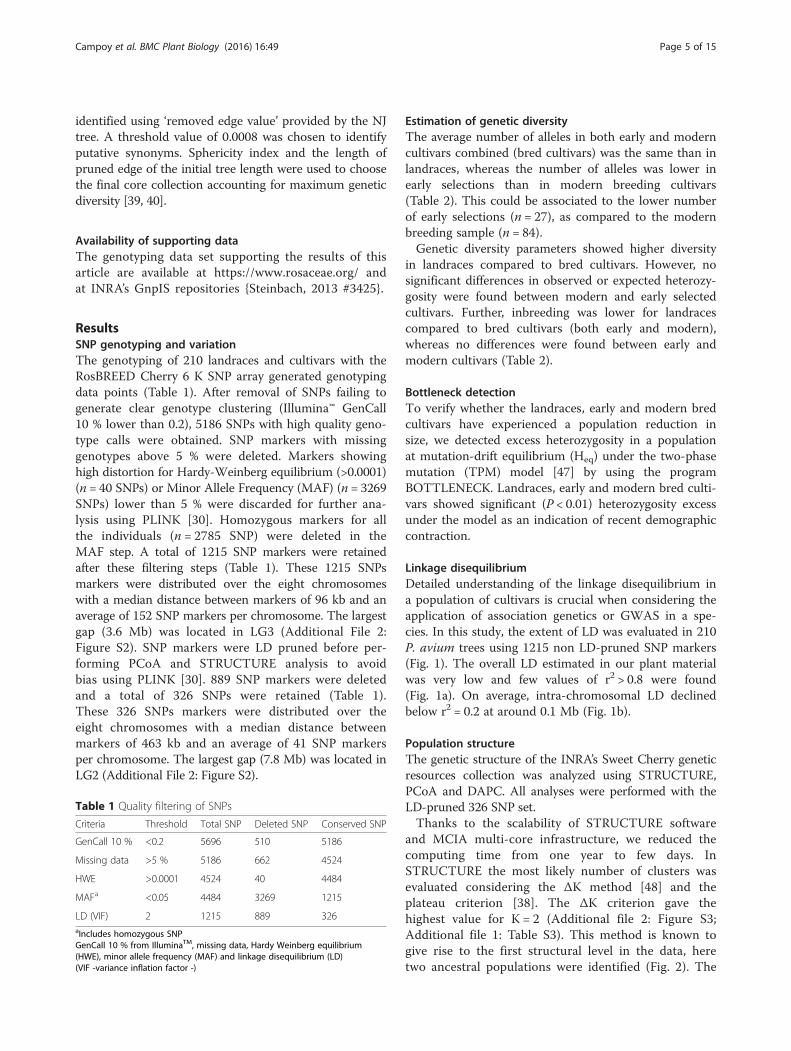
ResultsSNP genotyping and variationThe genotyping of 210 landraces and cultivars with theRosBREED Cherry 6 K SNP array generated genotypingdata points (Table 1). After removal of SNPs failing togenerate clear genotype clustering (Illumina™ GenCall10 % lower than 0.2), 5186 SNPs with high quality geno-type calls were obtained. SNP markers with missinggenotypes above 5 % were deleted. Markers showinghigh distortion for Hardy-Weinberg equilibrium (>0.0001)(n = 40 SNPs) or Minor Allele Frequency (MAF) (n = 3269SNPs) lower than 5 % were discarded for further ana-lysis using PLINK [30]. Homozygous markers for allthe individuals (n = 2785 SNP) were deleted in theMAF step. A total of 1215 SNP markers were retainedafter these filtering steps (Table 1). These 1215 SNPsmarkers were distributed over the eight chromosomeswith a median distance between markers of 96 kb and anaverage of 152 SNP markers per chromosome. The largestgap (3.6 Mb) was located in LG3 (Additional File 2:Figure S2). SNP markers were LD pruned before per-forming PCoA and STRUCTURE analysis to avoidbias using PLINK [30]. 889 SNP markers were deletedand a total of 326 SNPs were retained (Table 1).These 326 SNPs markers were distributed over theeight chromosomes with a median distance betweenmarkers of 463 kb and an average of 41 SNP markersper chromosome. The largest gap (7.8 Mb) was located inLG2 (Additional File 2: Figure S2).
Estimation of genetic diversityThe average number of alleles in both early and moderncultivars combined (bred cultivars) was the same than inlandraces, whereas the number of alleles was lower inearly selections than in modern breeding cultivars(Table 2). This could be associated to the lower numberof early selections (n = 27), as compared to the modernbreeding sample (n = 84).Genetic diversity parameters showed higher diversity
in landraces compared to bred cultivars. However, nosignificant differences in observed or expected heterozy-gosity were found between modern and early selectedcultivars. Further, inbreeding was lower for landracescompared to bred cultivars (both early and modern),whereas no differences were found between early andmodern cultivars (Table 2).
Bottleneck detectionTo verify whether the landraces, early and modern bredcultivars have experienced a population reduction insize, we detected excess heterozygosity in a populationat mutation-drift equilibrium (Heq) under the two-phasemutation (TPM) model [47] by using the programBOTTLENECK. Landraces, early and modern bred culti-vars showed significant (P < 0.01) heterozygosity excessunder the model as an indication of recent demographiccontraction.
Linkage disequilibriumDetailed understanding of the linkage disequilibrium ina population of cultivars is crucial when considering theapplication of association genetics or GWAS in a spe-cies. In this study, the extent of LD was evaluated in 210P. avium trees using 1215 non LD-pruned SNP markers(Fig. 1). The overall LD estimated in our plant materialwas very low and few values of r2 > 0.8 were found(Fig. 1a). On average, intra-chromosomal LD declinedbelow r2 = 0.2 at around 0.1 Mb (Fig. 1b).
Population structureThe genetic structure of the INRA’s Sweet Cherry geneticresources collection was analyzed using STRUCTURE,PCoA and DAPC. All analyses were performed with theLD-pruned 326 SNP set.Thanks to the scalability of STRUCTURE software
and MCIA multi-core infrastructure, we reduced thecomputing time from one year to few days. InSTRUCTURE the most likely number of clusters wasevaluated considering the ΔK method [48] and theplateau criterion [38]. The ΔK criterion gave thehighest value for K = 2 (Additional file 2: Figure S3;Additional file 1: Table S3). This method is known togive rise to the first structural level in the data, heretwo ancestral populations were identified (Fig. 2). The
Table 1 Quality filtering of SNPs
Criteria Threshold Total SNP Deleted SNP Conserved SNP
GenCall 10 % <0.2 5696 510 5186
Missing data >5 % 5186 662 4524
HWE >0.0001 4524 40 4484
MAFa <0.05 4484 3269 1215
LD (VIF) 2 1215 889 326aIncludes homozygous SNPGenCall 10 % from IlluminaTM, missing data, Hardy Weinberg equilibrium(HWE), minor allele frequency (MAF) and linkage disequilibrium (LD)(VIF -variance inflation factor -)
Campoy et al. BMC Plant Biology (2016) 16:49 Page 5 of 15
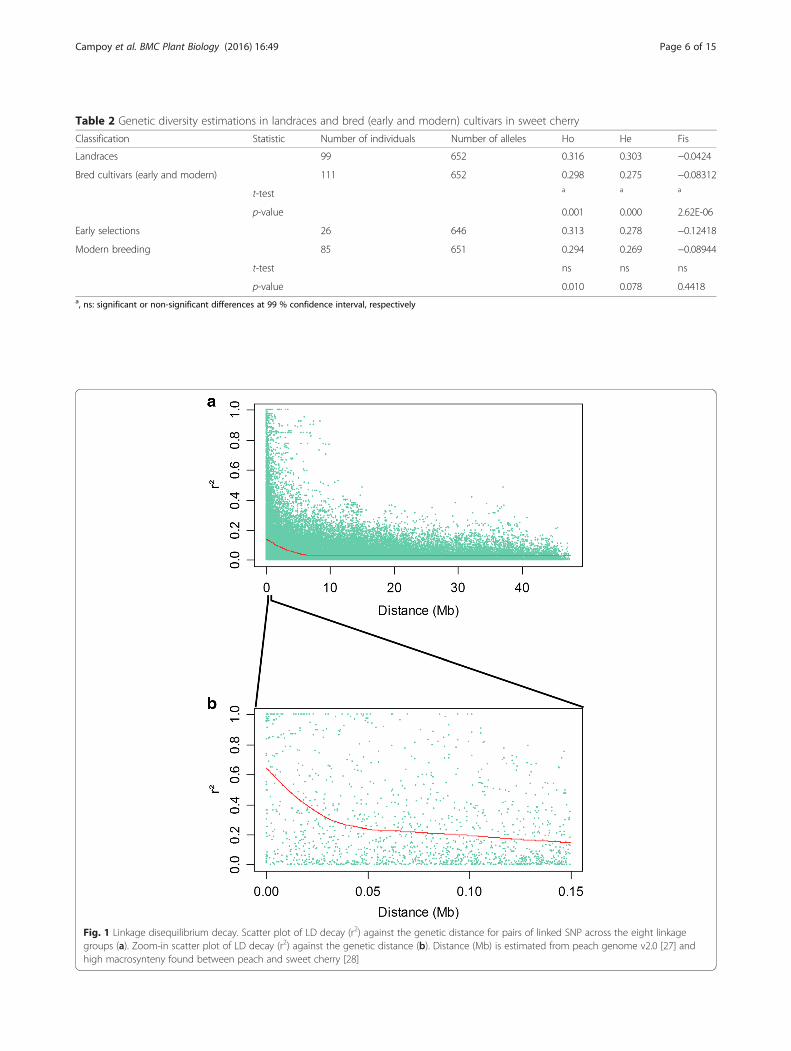
Table 2 Genetic diversity estimations in landraces and bred (early and modern) cultivars in sweet cherry
Classification Statistic Number of individuals Number of alleles Ho He Fis
Landraces 99 652 0.316 0.303 −0.0424
Bred cultivars (early and modern) 111 652 0.298 0.275 −0.08312
t-test a a a
p-value 0.001 0.000 2.62E-06
Early selections 26 646 0.313 0.278 −0.12418
Modern breeding 85 651 0.294 0.269 −0.08944
t-test ns ns ns
p-value 0.010 0.078 0.4418a, ns: significant or non-significant differences at 99 % confidence interval, respectively
Fig. 1 Linkage disequilibrium decay. Scatter plot of LD decay (r2) against the genetic distance for pairs of linked SNP across the eight linkagegroups (a). Zoom-in scatter plot of LD decay (r2) against the genetic distance (b). Distance (Mb) is estimated from peach genome v2.0 [27] andhigh macrosynteny found between peach and sweet cherry [28]
Campoy et al. BMC Plant Biology (2016) 16:49 Page 6 of 15
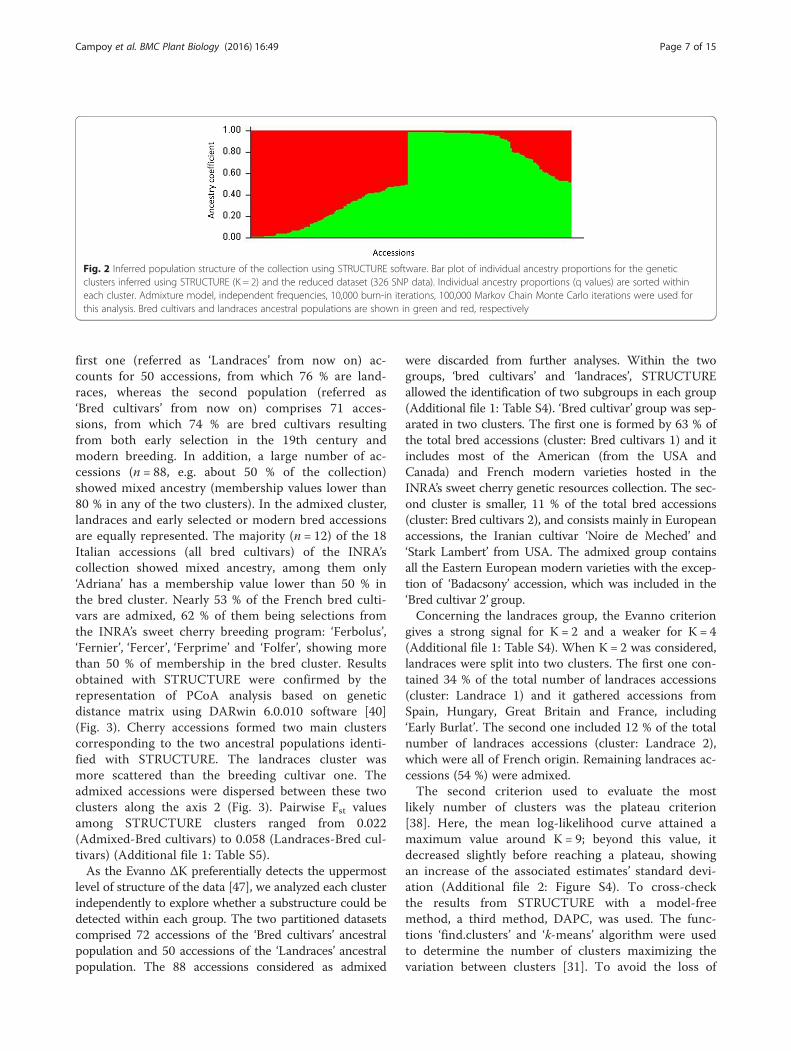
first one (referred as ‘Landraces’ from now on) ac-counts for 50 accessions, from which 76 % are land-races, whereas the second population (referred as‘Bred cultivars’ from now on) comprises 71 acces-sions, from which 74 % are bred cultivars resultingfrom both early selection in the 19th century andmodern breeding. In addition, a large number of ac-cessions (n = 88, e.g. about 50 % of the collection)showed mixed ancestry (membership values lower than80 % in any of the two clusters). In the admixed cluster,landraces and early selected or modern bred accessionsare equally represented. The majority (n = 12) of the 18Italian accessions (all bred cultivars) of the INRA’scollection showed mixed ancestry, among them only‘Adriana’ has a membership value lower than 50 % inthe bred cluster. Nearly 53 % of the French bred culti-vars are admixed, 62 % of them being selections fromthe INRA’s sweet cherry breeding program: ‘Ferbolus’,‘Fernier’, ‘Fercer’, ‘Ferprime’ and ‘Folfer’, showing morethan 50 % of membership in the bred cluster. Resultsobtained with STRUCTURE were confirmed by therepresentation of PCoA analysis based on geneticdistance matrix using DARwin 6.0.010 software [40](Fig. 3). Cherry accessions formed two main clusterscorresponding to the two ancestral populations identi-fied with STRUCTURE. The landraces cluster wasmore scattered than the breeding cultivar one. Theadmixed accessions were dispersed between these twoclusters along the axis 2 (Fig. 3). Pairwise Fst valuesamong STRUCTURE clusters ranged from 0.022(Admixed-Bred cultivars) to 0.058 (Landraces-Bred cul-tivars) (Additional file 1: Table S5).As the Evanno ΔK preferentially detects the uppermost
level of structure of the data [47], we analyzed each clusterindependently to explore whether a substructure could bedetected within each group. The two partitioned datasetscomprised 72 accessions of the ‘Bred cultivars’ ancestralpopulation and 50 accessions of the ‘Landraces’ ancestralpopulation. The 88 accessions considered as admixed
were discarded from further analyses. Within the twogroups, ‘bred cultivars’ and ‘landraces’, STRUCTUREallowed the identification of two subgroups in each group(Additional file 1: Table S4). ‘Bred cultivar’ group was sep-arated in two clusters. The first one is formed by 63 % ofthe total bred accessions (cluster: Bred cultivars 1) and itincludes most of the American (from the USA andCanada) and French modern varieties hosted in theINRA’s sweet cherry genetic resources collection. The sec-ond cluster is smaller, 11 % of the total bred accessions(cluster: Bred cultivars 2), and consists mainly in Europeanaccessions, the Iranian cultivar ‘Noire de Meched’ and‘Stark Lambert’ from USA. The admixed group containsall the Eastern European modern varieties with the excep-tion of ‘Badacsony’ accession, which was included in the‘Bred cultivar 2’ group.Concerning the landraces group, the Evanno criterion
gives a strong signal for K = 2 and a weaker for K = 4(Additional file 1: Table S4). When K = 2 was considered,landraces were split into two clusters. The first one con-tained 34 % of the total number of landraces accessions(cluster: Landrace 1) and it gathered accessions fromSpain, Hungary, Great Britain and France, including‘Early Burlat’. The second one included 12 % of the totalnumber of landraces accessions (cluster: Landrace 2),which were all of French origin. Remaining landraces ac-cessions (54 %) were admixed.The second criterion used to evaluate the most
likely number of clusters was the plateau criterion[38]. Here, the mean log-likelihood curve attained amaximum value around K = 9; beyond this value, itdecreased slightly before reaching a plateau, showingan increase of the associated estimates’ standard devi-ation (Additional file 2: Figure S4). To cross-checkthe results from STRUCTURE with a model-freemethod, a third method, DAPC, was used. The func-tions ‘find.clusters’ and ‘k-means’ algorithm were usedto determine the number of clusters maximizing thevariation between clusters [31]. To avoid the loss of
Fig. 2 Inferred population structure of the collection using STRUCTURE software. Bar plot of individual ancestry proportions for the geneticclusters inferred using STRUCTURE (K = 2) and the reduced dataset (326 SNP data). Individual ancestry proportions (q values) are sorted withineach cluster. Admixture model, independent frequencies, 10,000 burn-in iterations, 100,000 Markov Chain Monte Carlo iterations were used forthis analysis. Bred cultivars and landraces ancestral populations are shown in green and red, respectively
Campoy et al. BMC Plant Biology (2016) 16:49 Page 7 of 15
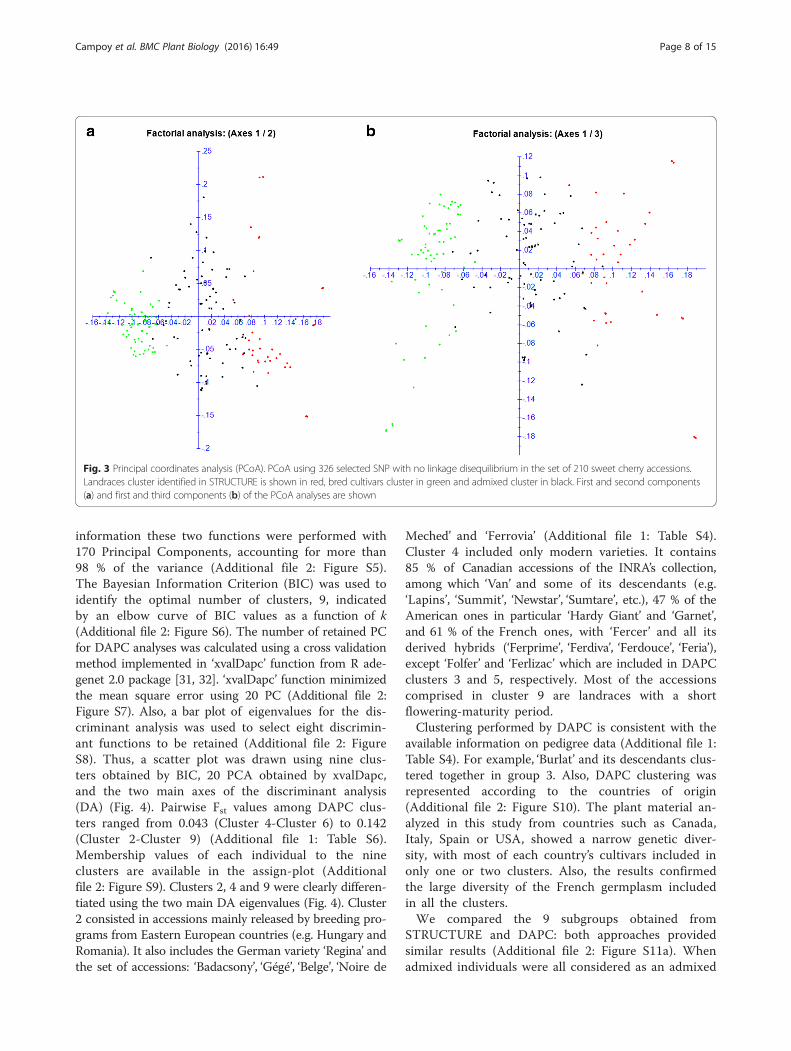
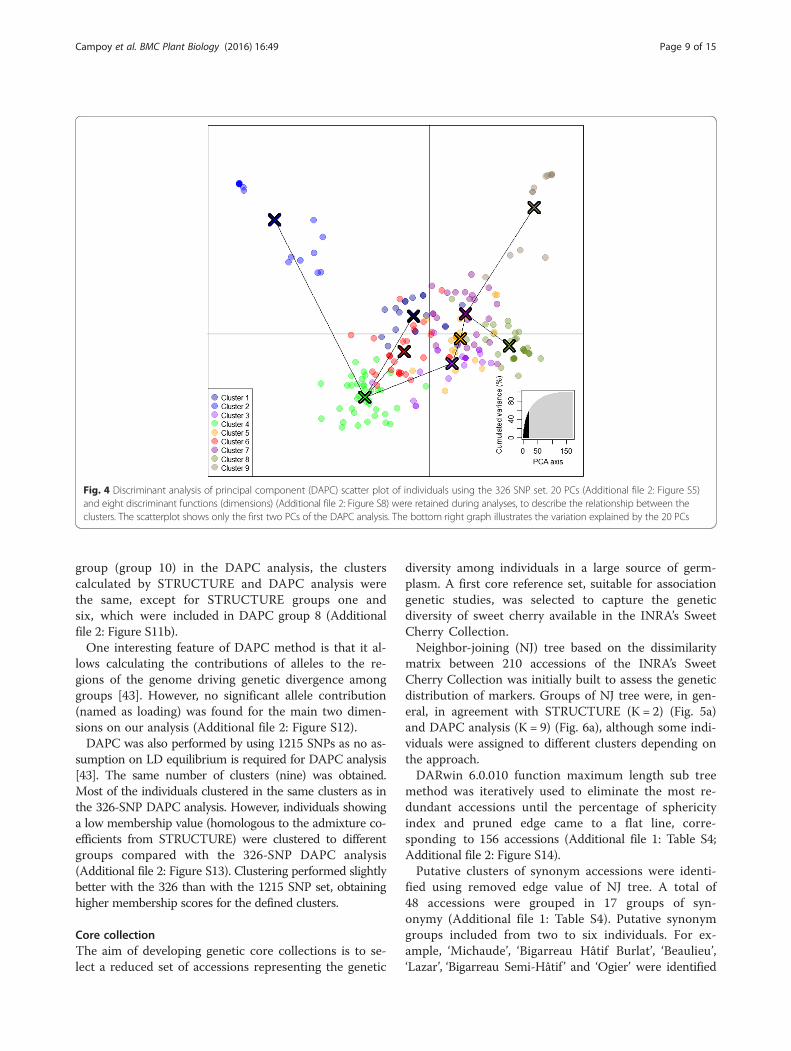
information these two functions were performed with170 Principal Components, accounting for more than98 % of the variance (Additional file 2: Figure S5).The Bayesian Information Criterion (BIC) was used toidentify the optimal number of clusters, 9, indicatedby an elbow curve of BIC values as a function of k(Additional file 2: Figure S6). The number of retained PCfor DAPC analyses was calculated using a cross validationmethod implemented in ‘xvalDapc’ function from R ade-genet 2.0 package [31, 32]. ‘xvalDapc’ function minimizedthe mean square error using 20 PC (Additional file 2:Figure S7). Also, a bar plot of eigenvalues for the dis-criminant analysis was used to select eight discrimin-ant functions to be retained (Additional file 2: FigureS8). Thus, a scatter plot was drawn using nine clus-ters obtained by BIC, 20 PCA obtained by xvalDapc,and the two main axes of the discriminant analysis(DA) (Fig. 4). Pairwise Fst values among DAPC clus-ters ranged from 0.043 (Cluster 4-Cluster 6) to 0.142(Cluster 2-Cluster 9) (Additional file 1: Table S6).Membership values of each individual to the nineclusters are available in the assign-plot (Additionalfile 2: Figure S9). Clusters 2, 4 and 9 were clearly differen-tiated using the two main DA eigenvalues (Fig. 4). Cluster2 consisted in accessions mainly released by breeding pro-grams from Eastern European countries (e.g. Hungary andRomania). It also includes the German variety ‘Regina’ andthe set of accessions: ‘Badacsony’, ‘Gégé’, ‘Belge’, ‘Noire de
Meched’ and ‘Ferrovia’ (Additional file 1: Table S4).Cluster 4 included only modern varieties. It contains85 % of Canadian accessions of the INRA’s collection,among which ‘Van’ and some of its descendants (e.g.‘Lapins’, ‘Summit’, ‘Newstar’, ‘Sumtare’, etc.), 47 % of theAmerican ones in particular ‘Hardy Giant’ and ‘Garnet’,and 61 % of the French ones, with ‘Fercer’ and all itsderived hybrids (‘Ferprime’, ‘Ferdiva’, ‘Ferdouce’, ‘Feria’),except ‘Folfer’ and ‘Ferlizac’ which are included in DAPCclusters 3 and 5, respectively. Most of the accessionscomprised in cluster 9 are landraces with a shortflowering-maturity period.Clustering performed by DAPC is consistent with the
available information on pedigree data (Additional file 1:Table S4). For example, ‘Burlat’ and its descendants clus-tered together in group 3. Also, DAPC clustering wasrepresented according to the countries of origin(Additional file 2: Figure S10). The plant material an-alyzed in this study from countries such as Canada,Italy, Spain or USA, showed a narrow genetic diver-sity, with most of each country’s cultivars included inonly one or two clusters. Also, the results confirmedthe large diversity of the French germplasm includedin all the clusters.We compared the 9 subgroups obtained from
STRUCTURE and DAPC: both approaches providedsimilar results (Additional file 2: Figure S11a). Whenadmixed individuals were all considered as an admixed
Fig. 3 Principal coordinates analysis (PCoA). PCoA using 326 selected SNP with no linkage disequilibrium in the set of 210 sweet cherry accessions.Landraces cluster identified in STRUCTURE is shown in red, bred cultivars cluster in green and admixed cluster in black. First and second components(a) and first and third components (b) of the PCoA analyses are shown
Campoy et al. BMC Plant Biology (2016) 16:49 Page 8 of 15
group (group 10) in the DAPC analysis, the clusterscalculated by STRUCTURE and DAPC analysis werethe same, except for STRUCTURE groups one andsix, which were included in DAPC group 8 (Additionalfile 2: Figure S11b).One interesting feature of DAPC method is that it al-
lows calculating the contributions of alleles to the re-gions of the genome driving genetic divergence amonggroups [43]. However, no significant allele contribution(named as loading) was found for the main two dimen-sions on our analysis (Additional file 2: Figure S12).DAPC was also performed by using 1215 SNPs as no as-
sumption on LD equilibrium is required for DAPC analysis[43]. The same number of clusters (nine) was obtained.Most of the individuals clustered in the same clusters as inthe 326-SNP DAPC analysis. However, individuals showinga low membership value (homologous to the admixture co-efficients from STRUCTURE) were clustered to differentgroups compared with the 326-SNP DAPC analysis(Additional file 2: Figure S13). Clustering performed slightlybetter with the 326 than with the 1215 SNP set, obtaininghigher membership scores for the defined clusters.
Core collectionThe aim of developing genetic core collections is to se-lect a reduced set of accessions representing the genetic
diversity among individuals in a large source of germ-plasm. A first core reference set, suitable for associationgenetic studies, was selected to capture the geneticdiversity of sweet cherry available in the INRA’s SweetCherry Collection.Neighbor-joining (NJ) tree based on the dissimilarity
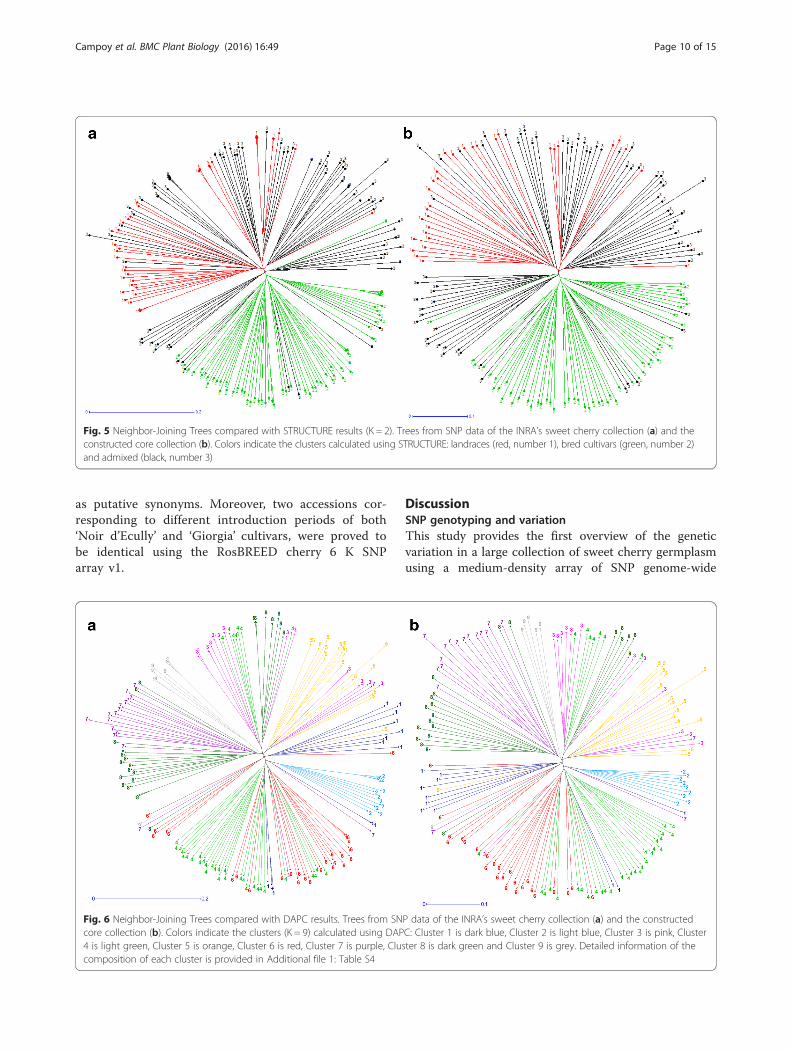
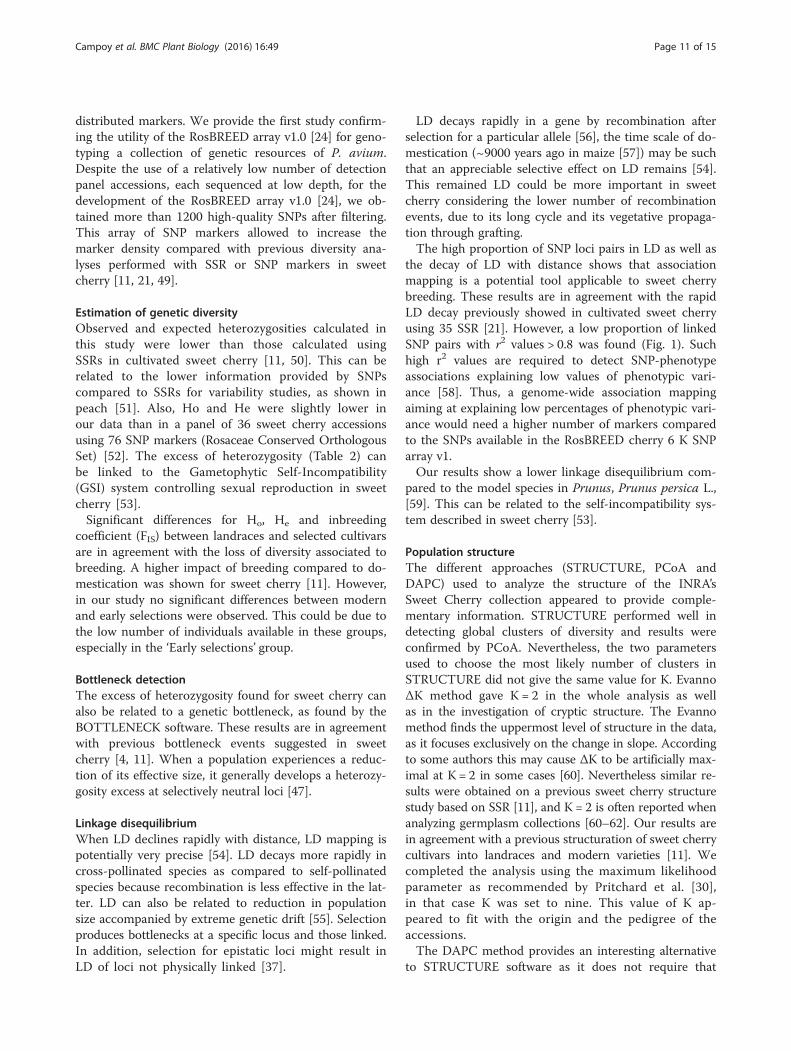
matrix between 210 accessions of the INRA’s SweetCherry Collection was initially built to assess the geneticdistribution of markers. Groups of NJ tree were, in gen-eral, in agreement with STRUCTURE (K = 2) (Fig. 5a)and DAPC analysis (K = 9) (Fig. 6a), although some indi-viduals were assigned to different clusters depending onthe approach.DARwin 6.0.010 function maximum length sub tree
method was iteratively used to eliminate the most re-dundant accessions until the percentage of sphericityindex and pruned edge came to a flat line, corre-sponding to 156 accessions (Additional file 1: Table S4;Additional file 2: Figure S14).Putative clusters of synonym accessions were identi-
fied using removed edge value of NJ tree. A total of48 accessions were grouped in 17 groups of syn-onymy (Additional file 1: Table S4). Putative synonymgroups included from two to six individuals. For ex-ample, ‘Michaude’, ‘Bigarreau Hâtif Burlat’, ‘Beaulieu’,‘Lazar’, ‘Bigarreau Semi-Hâtif ’ and ‘Ogier’ were identified
Fig. 4 Discriminant analysis of principal component (DAPC) scatter plot of individuals using the 326 SNP set. 20 PCs (Additional file 2: Figure S5)and eight discriminant functions (dimensions) (Additional file 2: Figure S8) were retained during analyses, to describe the relationship between theclusters. The scatterplot shows only the first two PCs of the DAPC analysis. The bottom right graph illustrates the variation explained by the 20 PCs
Campoy et al. BMC Plant Biology (2016) 16:49 Page 9 of 15
as putative synonyms. Moreover, two accessions cor-responding to different introduction periods of both‘Noir d’Ecully’ and ‘Giorgia’ cultivars, were proved tobe identical using the RosBREED cherry 6 K SNParray v1.
DiscussionSNP genotyping and variationThis study provides the first overview of the geneticvariation in a large collection of sweet cherry germplasmusing a medium-density array of SNP genome-wide
Fig. 5 Neighbor-Joining Trees compared with STRUCTURE results (K = 2). Trees from SNP data of the INRA’s sweet cherry collection (a) and theconstructed core collection (b). Colors indicate the clusters calculated using STRUCTURE: landraces (red, number 1), bred cultivars (green, number 2)and admixed (black, number 3)
Fig. 6 Neighbor-Joining Trees compared with DAPC results. Trees from SNP data of the INRA’s sweet cherry collection (a) and the constructedcore collection (b). Colors indicate the clusters (K = 9) calculated using DAPC: Cluster 1 is dark blue, Cluster 2 is light blue, Cluster 3 is pink, Cluster4 is light green, Cluster 5 is orange, Cluster 6 is red, Cluster 7 is purple, Cluster 8 is dark green and Cluster 9 is grey. Detailed information of thecomposition of each cluster is provided in Additional file 1: Table S4
Campoy et al. BMC Plant Biology (2016) 16:49 Page 10 of 15
distributed markers. We provide the first study confirm-ing the utility of the RosBREED array v1.0 [24] for geno-typing a collection of genetic resources of P. avium.Despite the use of a relatively low number of detectionpanel accessions, each sequenced at low depth, for thedevelopment of the RosBREED array v1.0 [24], we ob-tained more than 1200 high-quality SNPs after filtering.This array of SNP markers allowed to increase themarker density compared with previous diversity ana-lyses performed with SSR or SNP markers in sweetcherry [11, 21, 49].
Estimation of genetic diversityObserved and expected heterozygosities calculated inthis study were lower than those calculated usingSSRs in cultivated sweet cherry [11, 50]. This can berelated to the lower information provided by SNPscompared to SSRs for variability studies, as shown inpeach [51]. Also, Ho and He were slightly lower inour data than in a panel of 36 sweet cherry accessionsusing 76 SNP markers (Rosaceae Conserved OrthologousSet) [52]. The excess of heterozygosity (Table 2) canbe linked to the Gametophytic Self-Incompatibility(GSI) system controlling sexual reproduction in sweetcherry [53].Significant differences for Ho, He and inbreeding
coefficient (FIS) between landraces and selected cultivarsare in agreement with the loss of diversity associated tobreeding. A higher impact of breeding compared to do-mestication was shown for sweet cherry [11]. However,in our study no significant differences between modernand early selections were observed. This could be due tothe low number of individuals available in these groups,especially in the ‘Early selections’ group.
Bottleneck detectionThe excess of heterozygosity found for sweet cherry canalso be related to a genetic bottleneck, as found by theBOTTLENECK software. These results are in agreementwith previous bottleneck events suggested in sweetcherry [4, 11]. When a population experiences a reduc-tion of its effective size, it generally develops a heterozy-gosity excess at selectively neutral loci [47].
Linkage disequilibriumWhen LD declines rapidly with distance, LD mapping ispotentially very precise [54]. LD decays more rapidly incross-pollinated species as compared to self-pollinatedspecies because recombination is less effective in the lat-ter. LD can also be related to reduction in populationsize accompanied by extreme genetic drift [55]. Selectionproduces bottlenecks at a specific locus and those linked.In addition, selection for epistatic loci might result inLD of loci not physically linked [37].
LD decays rapidly in a gene by recombination afterselection for a particular allele [56], the time scale of do-mestication (~9000 years ago in maize [57]) may be suchthat an appreciable selective effect on LD remains [54].This remained LD could be more important in sweetcherry considering the lower number of recombinationevents, due to its long cycle and its vegetative propaga-tion through grafting.The high proportion of SNP loci pairs in LD as well as
the decay of LD with distance shows that associationmapping is a potential tool applicable to sweet cherrybreeding. These results are in agreement with the rapidLD decay previously showed in cultivated sweet cherryusing 35 SSR [21]. However, a low proportion of linkedSNP pairs with r2 values > 0.8 was found (Fig. 1). Suchhigh r2 values are required to detect SNP-phenotypeassociations explaining low values of phenotypic vari-ance [58]. Thus, a genome-wide association mappingaiming at explaining low percentages of phenotypic vari-ance would need a higher number of markers comparedto the SNPs available in the RosBREED cherry 6 K SNParray v1.Our results show a lower linkage disequilibrium com-
pared to the model species in Prunus, Prunus persica L.,[59]. This can be related to the self-incompatibility sys-tem described in sweet cherry [53].
Population structureThe different approaches (STRUCTURE, PCoA andDAPC) used to analyze the structure of the INRA’sSweet Cherry collection appeared to provide comple-mentary information. STRUCTURE performed well indetecting global clusters of diversity and results wereconfirmed by PCoA. Nevertheless, the two parametersused to choose the most likely number of clusters inSTRUCTURE did not give the same value for K. EvannoΔK method gave K = 2 in the whole analysis as wellas in the investigation of cryptic structure. The Evannomethod finds the uppermost level of structure in the data,as it focuses exclusively on the change in slope. Accordingto some authors this may cause ΔK to be artificially max-imal at K = 2 in some cases [60]. Nevertheless similar re-sults were obtained on a previous sweet cherry structurestudy based on SSR [11], and K = 2 is often reported whenanalyzing germplasm collections [60–62]. Our results arein agreement with a previous structuration of sweet cherrycultivars into landraces and modern varieties [11]. Wecompleted the analysis using the maximum likelihoodparameter as recommended by Pritchard et al. [30],in that case K was set to nine. This value of K ap-peared to fit with the origin and the pedigree of theaccessions.The DAPC method provides an interesting alternative
to STRUCTURE software as it does not require that
Campoy et al. BMC Plant Biology (2016) 16:49 Page 11 of 15
populations are in HW equilibrium and can handle largesets of data without using parallel processing software.However, as for other multivariate analyses, the reductionof genetic information to interindividual or interpopulationdistances may represent a substantial loss of information[63]. Nevertheless, our results showed a good consistencybetween STRUCTURE and DAPC analyses when noadmixed individuals were considered. Also DAPC analysisprovided a more detailed clustering within landraces andbred cultivars compared STRUCTURE analysis either inour study or in previous analysis using SSR [11].Regarding membership to clusters, DAPC provides
membership values that are different from admixture co-efficients from STRUCTURE, but they can still be inter-preted as proximities of individuals to the different clusters[32]. However, group membership provided by R’s ade-genet package is more useful for groups defined by externalcriteria (i.e. biologically) rather than by k-means, as k-means provides optimal groups for DAPC and thereforeboth classifications will be mostly consistent [31].Clustering of individuals presented in this study may
give interesting cues for increasing diversity in breedingprograms and germplasm collections. For example, land-races were included in all clusters except for cluster fourwhereas most of modern cultivars were included in onlythree clusters (four, five and six). This is especially clearfor the INRA’s cultivars released in the last two decades,as most of them (more than 60 %) are included in clus-ter four. Hence, the use of landraces different from theclusters four, five or six, as founding clones, would in-crease the genetic diversity of new cultivars. Also, mostNorth American cultivars (USA and Canada) are in-cluded in two close clusters (four and six). This is inagreement with the repeated use of five founding clonesand one genetic source for self-compatibility in sweetcherry breeding in North America [64] and with thelowest Fst value found in our study among clusters fourand six (Additional file 1: Table S6). This repeated use ofa few founding clones and their progeny as parents inbreeding programs may eventually result in loss of gen-etic variability and a concomitant increase in inbreedingdepression in future generations [65]. The inbreedingproblem and potential genetic limitations have beenraised for numerous fruit species modern breeding pro-grams, including sweet cherry [64–66]. A deep know-ledge of the structure of the germplasm and theidentification of clusters could assist the choice of geni-tors in current breeding programs, which may maximizegenetic diversity and enhance the potential gain from se-lection. This would help to increase the breeding pro-grams’ efficiency to face new demands from consumers(organoleptic traits) and industry (antioxidant content),as well as new ecological issues (i.e. adaptation to cli-mate change, pest resistances).
Core collectionCharacterization and maintenance of germplasm collec-tions is a laborious task. Genetic and phenotypic know-ledge is crucial for a better understanding and utilizationof the available genetic resources by breeders [46]. Inthis study, we propose the first core collection from theINRA’s Sweet Cherry collection, accounting for land-races and cultivars from 16 different countries.Some putative synonymous cultivars were probably
renamed when released in the same region but at differ-ent periods of time. For example, ‘Bigarreau Jaboulay’and ‘Guigne Ramon Oliva’ were released in SoutheasternFrance in 1822 in 1900, respectively. Other possibilitiescould be that those cultivars were released in differentregions or countries, or even commercialized with differ-ent names. Thus, ‘Lazar’, described as “a seedling of un-known parentage probably a selection from ‘Burlat’”(Jacques Claverie personal communication) was identi-fied in this study as a putative synonym of ‘Burlat’.In other context, the cluster of putative synonyms identi-
fied in this study: ‘Badacsony’, ‘Belge’ ‘Ferrovia’, ‘Gégé’,‘Noire de Meched’, and ‘Stark Lambert’; is in accordancewith previous fingerprinting analysis using AFLP and SSRmarkers [67]. However, this clustering is contradictory tothe country of origin and the period of release of these cul-tivars. A comparative study using accessions of these culti-vars conserved both in the region of origin (i.e.: BalatonLac region in Hungary for ‘Badacsony’) and in different in-stitutes is suggested. This recommended study would beessential to elucidate this possible incoherence. In addition,putative synonyms should be verified with a higher densitySNP assay or NGS technologies to avoid misassignment.For example, punctual mutation may have not been pickedup by the RosBREED sweet cherry array but severely affectthe phenotype of an individual. This is the case of two pu-tative synonyms identified; ‘Fougerouse’ and ‘FougerouseBlanc’ accessions; which show red and yellow fruit color,respectively. ‘Fougerouse’ and ‘Fougerouse Blanc’ representan excellent material for functional genomics studiesaimed at deciphering the fruit color in sweet cherry.The diversity of INRA’s Sweet Cherry core collection
could be maximized by introducing exotic plant materialunderrepresented so far, such as landraces and wildcherries. For example, the Spanish landraces ‘Punxeta’and ‘Tarrega’ are two good candidates to be included inthe INRA’s Sweet Cherry Collection. In additionINRA’s Sweet Cherry core collection represent a valu-
able tool for the development of genome-scale analysisaimed at deciphering the genetic determinism of traitsfor this species.
ConclusionsIn the present study, we show the first population-genetics analysis in cultivated sweet cherry using a
Campoy et al. BMC Plant Biology (2016) 16:49 Page 12 of 15
medium-density SNP marker array. We provide esti-mations of linkage disequilibrium, genetic structureusing different approaches and the definition of afirst INRA’s Sweet Cherry core collection. This infor-mation will be useful for parent selection in breedingprograms, germplasm management and associationgenetics studies. Thanks to the perennial nature ofsweet cherry and the ease of vegetative propagation,this core collection could be easily disseminated world-wide for further analyses.
Additional files
Additional file 1: Table S1. List of accessions including the origin, levelof breeding and pedigree. Table S2. RosBREED cherry 6 K SNP array 1.0position using peach genome v2.0 assembly. Table S3. Tablesummarizing the results using Evanno et al. (2005) method (output ofStructure Harvester). Table S4. List of accessions including membershipvalues to subgroups using STRUCTURE and DAPC analysis. Table S5.Pairwise Fst calculated among populations identified by STRUCTURE usingadegenet 2.0. Table S6. Pairwise Fst calculated among populationsidentified by DAPC using adegenet 2.0. (XLSX 341 kb)
Additional file 2: Figure S1. Workflow of STRUCTURE 2.3.4 softwareimplementation at MCIA cluster nodes. Figure S2. Genome coverage of1,215 and 326 SNP sets across the eight linkage groups of sweet cherry.Figure S3. Graphical method (as in Evanno et al. 2005) allowing thedetection of the number of groups K using ΔK. Figure S4. Graphicalmethod (as in Evanno et al., 2005) allowing the detection of the numberof groups K using the rate of change of the likelihood distribution (Meanlog-likelihood values). Figure S5. Cumulative variance explained by theprincipal component analysis (PCA) relative to the number of principalcomponents (PCs) retained in the analysis. Figure S6. Selection of theoptimal number of clusters in the DAPC using the lowest Bayesian Infor-mation Criterion (BIC). Figure S7. Cross-validation procedure to choosethe optimal number of Principal Components for the DAPC analysis. Fig-ure S8. Eigenvalues of retained discriminant functions in the DAPC ana-lysis. Figure S9. Assignment plots from DAPC for a K of nine populations.Figure S10. Comparison of clustering performed by DAPC (K=9) and ori-gin of cultivars and landraces. Figure S11. Comparison of clustering per-formed by STRUCTURE and DAPC analysis. Figure S12. DiscriminantAnalysis of Principal Components Loading Plot. Figure S13. Comparisonof clustering performed by DAPC using the whole (1,215 SNPs) and thelinkagedisequilibrium-pruned (326 SNPs) SNPs datasets. Figure S14.Sphericity index and the length of pruned values for the selected corecollection individuals. (PDF 1.72 MB)
AbbreviationsAFLP: Amplified fragment Length Polymorphism; BLAST: Basic LocalAlignment Search Tool; BIC: Bayesian Information Criterion; CPU: CentralProcessing Unit; DAPC: Discriminant Analysis of Principal Components;DNA: Deoxyribose Nucleic Acid; FAO: Food and Agriculture Organization ofthe United Nations; FIS: Inbreeding Coefficient; Fst: Fixation Index;GDR: Genome Database for Rosaceae; GnpIS: Genetic and GenomicInformation System; GSI: Gametophytic Self-Incompatibility; GUI: GraphicalUser Interface; He: Expected heterozygosity; Heq: Mutation-drift equilibrium;HWE: Hardy Weinberg equilibrium; Ho: Observed heterozygosity;INRA: French National Institute for Agricultural Research; LD: LinkageDisequilibrium; LG: Linkage Group; MAF: Minor Allele Frequency;Mb: Megabase; MCIA: Mésocentre de Calcul Intensif Aquitain; MCMC: MonteCarlo Markov Chain; NCBI: National Center for Biotechnology Information;NGS: Next Generation Sequencing; PC: Principal Component; PCA: PrincipalComponent Analysis; PCoA: Principal Coordinate Analysis; PGTB: BordeauxGenome-Transcriptome facility; SNP: Single Nucleotide Polymorphism;SSR: Simple Sequence Repeats; TORQUE: Terascale Open-source Resource
and QUEue Manager; TPM: Two-Phase Mutation; UEA: Fruit TreeExperimental Unit; USA: United States of America.
Competing interestsThe authors declare that they have no competing interests.
Authors’ contributionsTB and JAC conceived and supervised the study. ELB and HC performed theauthentication of the French National Sweet Cherry collection. HC and TBperformed the DNA extraction. JAC acquired and filtered the genotyping data.NG implemented the STRUCTURE analysis for multi-core computers. TB and JACanalyzed and interpreted the genetic diversity, linkage disequilibrium populationstructure and core collection analyses. TB and JAC wrote the manuscript. RBcontributed to R-based analyses and its interpretation. JQG, ED contributed in thediscussion of the results and reviewed the manuscript. All authors read andapproved the final version of the manuscript.
AcknowledgementsWe thank French ministry for agriculture and food (MAAP n° C-2011-05project) for financing part of this work. We thank INRA, Aquitaine Regionand CEP Innovation (AQUIPRU project 2014-1R20102-2971) for financingdoctoral and postdoctoral fellowships to RB and JAC, respectively. Wethank Dr Angel Fernandez from CITA (Zaragoza, Spain) and M. Jose LuisSegui from Almudaina (Alicante, Spain) for providing seven cherryaccessions, including six Spanish landraces from Sierra de Aitana (Alicante).We thank Sabine Rauzier from “Centre National de Pomologie” at Alès forfacilitating the access to the French national landraces historical information.We acknowledge Jean Claude Barbot for his help in sampling leaves of sweetcherry collection, Sandra Robert for preliminary analysis of data, the technicalstaff of the Genome-Transcriptome facility (PGTB) at INRA Pierroton for DNAquality assessment and RosBREED project and Michigan State University for thegenotyping facilities. We thank the INRA’s ‘Prunus Genetic Resources Center’ forpreserving and managing the sweet cherry collections and the Fruit TreeExperimental Unit of INRA-Bourran (UEA) for growing the trees. Weacknowledge the MCIA (Mésocentre de Calcul Intensif Aquitain) of theUniversities of Bordeaux and Pau et des Pays de l'Adour for providingcomputing facilities.
Author details1INRA, UMR 1332 de Biologie du Fruit et Pathologie, F-33140 Villenave d’Ornon,France. 2University Bordeaux, UMR 1332 de Biologie du Fruit et Pathologie,F-33140 Villenave d’Ornon, France. 3Current address: CNRS, UMR 5602GEODE, Géographie de l’environnement, F-31058 Toulouse, France. 4INRA,UAR 0415 SDAR, Services Déconcentrés d’Appui à la Recherche, F 33140Villenave d’Ornon, France. 5Current address: INRA, ISVV, UMREcophysiologie et Génomique Fonctionnelle de la Vigne, F 33140 Villenaved’Ornon, France.
Received: 22 October 2015 Accepted: 11 January 2016
References1. de Candolle A. L’Origine des plantes cultivées. éd. 3. Paris: Germer Baillière;
1886. p. VI-385.2. Vavilov NI. The origin, variation, immunity and breeding of cultivated plants.
Chronica Botanica. 1951;13:1–366.3. Zohary D, Hopf M. Domestication of plants in the old world. Oxford: Oxford
University Press; 2000.4. Tavaud M. Diversité génétique du cerisier doux (Prunus avium L.) sur son
aire de répartition : Comparaison avec ses espèces apparentées (P. cerasuset P. x gondouinii) et son compartiment sauvage. Montpellier: Thèse deDoctorat Ecole Nationale Supérieur Agronomique de Montpellier; 2000.
5. Hedrick UP. The history of cultivated cherries. In: Hedrick UP, Howe GH, TaylorOM, Tubergen CB, Wellington R, editors. The cherries of New York. Albany: JBLyon Company; 1915. p. 39–64.
6. Dahl C. Körsbärsträdens utbredning och botanik. In: Fernsqvist I, editor.Körsbär En Pomologi över i Sverige Prövade Körsbärssorter. Alnarp: TheSwedish University of Agricultural Sciences; 1988. p. 21–3.
7. Hjalmarsson I, Ortiz R. In situ and ex situ assessment of morphological and fruitvariation in Scandinavian sweet cherry. Scientia Horticulturae. 2000;85(1–2):37–49.
Campoy et al. BMC Plant Biology (2016) 16:49 Page 13 of 15
8. Burger P, Terral J-F, Ruas M-P, Ivorra S, Picq S. Assessing past agrobiodiversity ofPrunus avium L. (Rosaceae): a morphometric approach focussed on the stonesfrom the archaeological site Hôtel-Dieu (16th century, Tours, France).Vegetation History and Archaeobotany. 2011;20(5):447–58.
9. Grieco A. Alimentation et classes sociales à la fin du Moyen Age et à laRenaissance. In: Flandrin JL, Montanari M, editors. Histoire de l’alimentation.Paris: Fayard; 1996. p. 479–90.
10. Quellier F. Des fruits et des hommes. L’arboriculture fruitière en Île-de-France (vers 1600-vers 1800). Rennes: Presses Universitaires de Rennes; 2003.
11. Mariette S, Tavaud M, Arunyawat U, Capdeville G, Millan M, Salin F.Population structure and genetic bottleneck in sweet cherry estimatedwith SSRs and the gametophytic self-incompatibility locus. BmcGenetics. 2010;11.
12. Tavaud M, Zanetto A, David JL, Laigret F, Dirlewanger E. Geneticrelationships between diploid and allotetraploid cherry species (Prunusavium, Prunus x gondouinii and Prunus cerasus). Heredity. 2004;93(6):631–8.
13. Vieira J, Fonseca NA, Santos RAM, Habu T, Tao R, Vieira CP. The number,age, sharing and relatedness of S-locus specificities in Prunus. Genet Res.2008;90(1):17–26.
14. Ercisli S. Diversity studies on cherry germplasm in Turkey In: Working groupsmeeting, COST Action 1104: 13–15 October 2014; Bordeaux.
15. Grenier C, Deu M, Kresovich S, Bramel-Cox PJ, Hamon P. Assessment of geneticdiversity in three subsets constituted from the ICRISAT sorghum collectionusing random vs non-random sampling procedures B. Using molecularmarkers. Theoretical and Applied Genetics. 2000;101(1–2):197–202.
16. Hintum TJL, Brown AHD, Spillane C, Hodgkin T. Core collections of plantgenetic resources. IPGRI Technical Bulletin. 2000;3:48.
17. Le Cunff L, Fournier-Level A, Laucou V, Vezzulli S, Lacombe T, Adam-Blondon AF, et al. Construction of nested genetic core collections tooptimize the exploitation of natural diversity in Vitis vinifera L. subsp sativa.BMC Plant Biol. 2008;8:31.
18. Aranzana MJ, Abbassi EK, Howad W, Arus P. Genetic variation, populationstructure and linkage disequilibrium in peach commercial varieties. BMCGenetics. 2010;11:69.
19. Odong TL, Jansen J, van Eeuwijk FA, van Hintum TJL. Quality of corecollections for effective utilisation of genetic resources review, discussionand interpretation. Theoretical and Applied Genetics. 2013;126(2):289–305.
20. Shriner D, Vaughan LK, Padilla MA, Tiwari HK. Problems with genome-wideassociation studies. Science. 2007;316(5833):1840–1.
21. Arunyawat U, Capdeville G, Decroocq V, Mariette S. Linkage disequilibriumin French wild cherry germplasm and worldwide sweet cherry germplasm.Tree Genetics & Genomes. 2012;8(4):737–55.
22. Flint-Garcia SA, Thuillet AC, Yu JM, Pressoir G, Romero SM, Mitchell SE, et al.Maize association population: a high-resolution platform for quantitativetrait locus dissection. Plant Journal. 2005;44(6):1054–64.
23. Panda S, Martin JP, Aguinagalde I, Mohanty A. Chloroplast DNA variation incultivated and wild Prunus avium L: a comparative study. Plant Breeding.2003;122(1):92–4.
24. Peace C, Bassil N, Main D, Ficklin S, Rosyara UR, Stegmeir T, et al.Development and evaluation of a genome-wide 6K SNP array for diploidsweet cherry and tetraploid sour cherry. PLoS One. 2012;7(12):e48305.
25. Sherry ST, Ward MH, Kholodov M, Baker J, Phan L, Smigielski EM, et al.dbSNP: the NCBI database of genetic variation. Nucleic Acids Research.2001;29(1):308–11.
26. Jung S, Staton M, Lee T, Blenda A, Svancara R, Abbott A, et al. GDR(Genome Database for Rosaceae): integrated web-database for Rosaceaegenomics and genetics data. Nucleic Acids Research. 2008;36:D1034–40.
27. Verde I, Abbott AG, Scalabrin S, Jung S, Shu S, Marroni F, et al. The high-quality draft genome of peach (Prunus persica) identifies unique patterns ofgenetic diversity, domestication and genome evolution. Nature Genetics.2013;45(5):487–U447.
28. Klagges C, Campoy JA, Quero-García J, Guzman A, Mansur L, Gratacos E, etal. Construction and comparative analyses of highly dense linkage maps oftwo sweet cherry intra-specific progenies of commercial cultivars. PLoS One.2013;8(1):e54743. doi:10.1371/journal.pone.0054743.
29. Teo YY, Inouye M, Small KS, Gwilliam R, Deloukas P, Kwiatkowski DP, et al.A genotype calling algorithm for the Illumina BeadArray platform.Bioinformatics. 2007;23(20):2741–6.
30. Purcell S, Neale B, Todd-Brown K, Thomas L, Ferreira MAR, Bender D, et al.PLINK: A tool set for whole-genome association and population-basedlinkage analyses. American Journal of Human Genetics. 2007;81(3):559–75.
31. Jombart T, Ahmed I. adegenet 1.3-1: new tools for the analysis of genome-wide SNP data. Bioinformatics. 2011;27(21):3070–1.
32. Jombart T. adegenet: a R package for the multivariate analysis of geneticmarkers. Bioinformatics. 2008;24(11):1403–5.
33. Piry S, Luikart G, Cornuet JM. BOTTLENECK: A computer program fordetecting recent reductions in the effective population size using allelefrequency data. J Hered. 1999;90(4):502–3.
34. Dirienzo A, Peterson AC, Garza JC, Valdes AM, Slatkin M, Freimer NB.Mutational processes of simple-sequence repeat loci in human-populations.Proceedings of the National Academy of Sciences of the United States ofAmerica. 1994;91(8):3166–70.
35. Chao S, Dubcovsky J, Dvorak J, Luo MC, Baenziger SP, Matnyazov R, et al.Population- and genome-specific patterns of linkage disequilibrium andSNP variation in spring and winter wheat (Triticum aestivum L.). BMCGenomics. 2010;11:727.
36. R Development Core Team. R: A Language and Environment for StatisticalComputing. Vienna, Austria : the R Foundation for Statistical Computing;2011. ISBN: 3-900051-07-0. Available online at http://www.R-project.org/.
37. Flint-Garcia SA, Thornsberry JM, Buckler ES. Structure of linkagedisequilibrium in plants. Annual Review of Plant Biology. 2003;54:357–74.
38. Pritchard JK, Stephens M, Donnelly P. Inference of population structureusing multilocus genotype data. Genetics. 2000;155(2):945–59.
39. Perrier X, Flori A, Bonnot F. Data analysis methods. In: Hamon PSM, PerrierX, Glaszmann JC, editors. Genetic diversity of cultivated tropical plants.Montpellier: Enfield, Science Publishers; 2003. p. 43–76.
40. Perrier X, Jacquemoud-Collet JP. DARwin software http://darwin.cirad.fr/. In.,6.0.010 edn; 2006.
41. Earl DA, Vonholdt BM. STRUCTURE HARVESTER: a website and program forvisualizing STRUCTURE output and implementing the Evanno method.Conserv Genet Resour. 2012;4(2):359–61.
42. Nei M. Analysis of gene diversity in subdivided populations. Proc Natl AcadSci U S A. 1973;70(12):3321–3.
43. Jombart T, Devillard S, Balloux F. Discriminant analysis of principalcomponents: a new method for the analysis of genetically structuredpopulations. Bmc Genetics. 2010;11:94.
44. Upadhyaya HD, Dwivedi SL, Baum M, Varshney RK, Udupa SM, Gowda CL, etal. Genetic structure, diversity, and allelic richness in composite collectionand reference set in chickpea (Cicer arietinum L). BMC Plant Biol. 2008;8:106.
45. Egbadzor KF, Ofori K, Yeboah M, Aboagye LM, Opoku-Agyeman MO,Danquah EY, et al. Diversity in 113 cowpea Vigna unguiculata (L) Walpaccessions assessed with 458 SNP markers. SpringerPlus. 2014;3:541–1.
46. Billot C, Ramu P, Bouchet S, Chantereau J, Deu M, Gardes L, et al. MassiveSorghum Collection Genotyped with SSR Markers to Enhance Use of GlobalGenetic Resources. PLoS One. 2013:8(4):e59714.
47. Cornuet JM, Luikart G. Description and power analysis of two tests fordetecting recent population bottlenecks from allele frequency data.Genetics. 1996;144(4):2001–14.
48. Evanno G, Regnaut S, Goudet J. Detecting the number of clusters ofindividuals using the software STRUCTURE: a simulation study. MolecularEcology. 2005;14(8):2611–20.
49. Fernandez i Marti A, Athanson B, Koepke T, Font i Forcada C, Dhingra A,Oraguzie N. Genetic diversity and relatedness of sweet cherry (Prunusavium L.) cultivars based on single nucleotide polymorphic markers. FrontPlant Sci, 2012;3:116.
50. Wunsch A, Hormaza JI. Molecular characterisation of sweet cherry (Prunusavium L.) genotypes using peach Prunus persica (L.) Batsch SSR sequences.Heredity. 2002;89:56–63.
51. Aranzana MJ, Illa E, Howad W, Arus P. A first insight into peach Prunus persica(L.) Batsch SNP variability. Tree Genetics & Genomes. 2012;8(6):1359–69.
52. Cabrera A, Rosyara UR, De Franceschi P, Sebolt A, Sooriyapathirana SS,Dirlewanger E, et al. Rosaceae conserved orthologous sequences markerpolymorphism in sweet cherry germplasm and construction of a SNP-basedmap. Tree Genetics & Genomes. 2012;8(2):237–47.
53. Tao R, Iezzoni AF. The S-RNase-based gametophytic self-incompatibilitysystem in Prunus exhibits distinct genetic and molecular features. ScientiaHorticulturae. 2010;124(4):423–33.
54. Gaut BS, Long AD. The lowdown on linkage disequilibrium. Plant Cell.2003;15(7):1502–6.
55. Dunning AM, Durocher F, Healey CS, Teare MD, McBride SE, Carlomagno F, et al.The extent of linkage disequilibrium in four populations with distinctdemographic histories. American Journal of Human Genetics. 2000;67(6):1544–54.
Campoy et al. BMC Plant Biology (2016) 16:49 Page 14 of 15
56. Przeworski M. The signature of positive selection at randomly chosen loci.Genetics. 2002;160(3):1179–89.
57. Matsuoka Y, Vigouroux Y, Goodman MM, Sanchez GJ, Buckler E, Doebley J.A single domestication for maize shown by multilocus microsatellitegenotyping. Proceedings of the National Academy of Sciences of theUnited States of America. 2002;99(9):6080–4.
58. Ersoz ES, Yu J, Buckler ES. Applications of linkage disequilibrium andassociation mapping in maize. In: A.L K, Larkins BA, editors. Moleculargenetic approaches to maize improvement. Berlin: Springer; 2009.
59. Micheletti D, Dettori MT, Micali S, Aramini V, Pacheco I, Linge CDS, et al.Whole-Genome Analysis of Diversity and SNP-Major Gene Association inPeach Germplasm. PLoS One. 2015;10(9):e0136803.
60. Vigouroux Y, Glaubitz JC, Matsuoka Y, Goodman MM, Jesus Sanchez G,Doebley J. Population structure and genetic diversity of New World maizeraces assessed by DNA microsatellites. American Journal of Botany.2008;95(10):1240–53.
61. Liang W, Dondini L, De Franceschi P, Paris R, Sansavini S, Tartarini S. GeneticDiversity, Population Structure and Construction of a Core Collection ofApple Cultivars from Italian Germplasm. Plant Molecular Biology Reporter.2015;33(3):458–73.
62. Cubry P, De Bellis F, Pot D, Musoli P, Leroy T. Global analysis of Coffeacanephora Pierre ex Froehner (Rubiaceae) from the Guineo-Congoleseregion reveals impacts from climatic refuges and migration effects. GeneticResources and Crop Evolution. 2013;60(2):483–501.
63. Dufresne F, Stift M, Vergilino R, Mable BK. Recent progress and challenges inpopulation genetics of polyploid organisms: an overview of current state-of-the-art molecular and statistical tools. Molecular Ecology. 2014;23(1):40–69.
64. Choi C, Kappel F. Inbreeding, coancestry, and founding clones of sweetcherries from North America. Journal of the American Society forHorticultural Science. 2004;129(4):535–43.
65. Lansari A, Kester DE, Iezzoni AF. Inbreeding, coancestry, and foundingclones of almonds of California, Mediterranean shores, and Russia. Journalof the American Society for Horticultural Science. 1994;119(6):1279–85.
66. Noiton DAM, Alspach PA. Founding clones, inbreeding, coancestry, andstatus number of modern apple cultivars. Journal of the American Societyfor Horticultural Science. 1996;121(5):773–82.
67. Boritzki M, Plieske J, Struss D. Cultivar identification in sweet cherry (Prunusavium L.) using AFLP and microsatellite markers. In: Geibel M, Fischer M,Fischer C, editors. Proceedings of the Eucarpia Symposium on FruitBreeding and Genetics, Vols 1 and 2. 2000. p. 505–10.
• We accept pre-submission inquiries
• Our selector tool helps you to find the most relevant journal
• We provide round the clock customer support
• Convenient online submission
• Thorough peer review
• Inclusion in PubMed and all major indexing services
• Maximum visibility for your research
Submit your manuscript atwww.biomedcentral.com/submit
Submit your next manuscript to BioMed Central and we will help you at every step:
Campoy et al. BMC Plant Biology (2016) 16:49 Page 15 of 15