genetic dissection of compositional & anatomical characteristics associated with biofuel...
TRANSCRIPT

Genetic Dissection of Compositional &
Anatomical Characteristics Associated
with Biofuel Production in Maize
Natalia de Leon
Department of Agronomy – Univ. of Wisconsin, Madison

Collaborators and Sponsors
University of Wisconsin: Shawn Kaeppler
• Marlies Heckwolf• German Muttoni• Jillian Foerster• James Johnson
Edgar Spalding
• Svern Heckwolf
Michigan State University:
Robin Buell
Kevin Childs
Brieanne Vaillancourt
University of Minnesota:
Candy Hirsch
Nathan Springer
UW Graduate SchoolDupont-PioneerMonsanto

OverviewBiofuels and the Role of Maize
Cell Wall Composition and Stalk Anatomical Characteristics
Tackling the Complexity of the Maize Genome
Final Remarks
www.glbrc.org

Maize as a Model
Species
www.glbrc.org
Wheat
Brachypodium
Rice
Adapted from Hilu et al., 1999
SorghumMaize
Switchgrass
C4 photosynthesis

Maize54%
Soybean12%
Wheat10%
Hay23%
Sorghum1%
Percentage from total field crop area harvested (~300,000,000 acres)
Maize29%
Soybean25%
Wheat16%
Hay19%
Others10%
Sorghum1%
Field Crops Biomass Production in the US
www.glbrc.org
5
Field Crops Area Harvested 2011 (acres) Biomass Production Estimates 2011 (tons)
Percentage of biomass produced by these major field crops
Source: USDA - National Agricultural Statistics Service
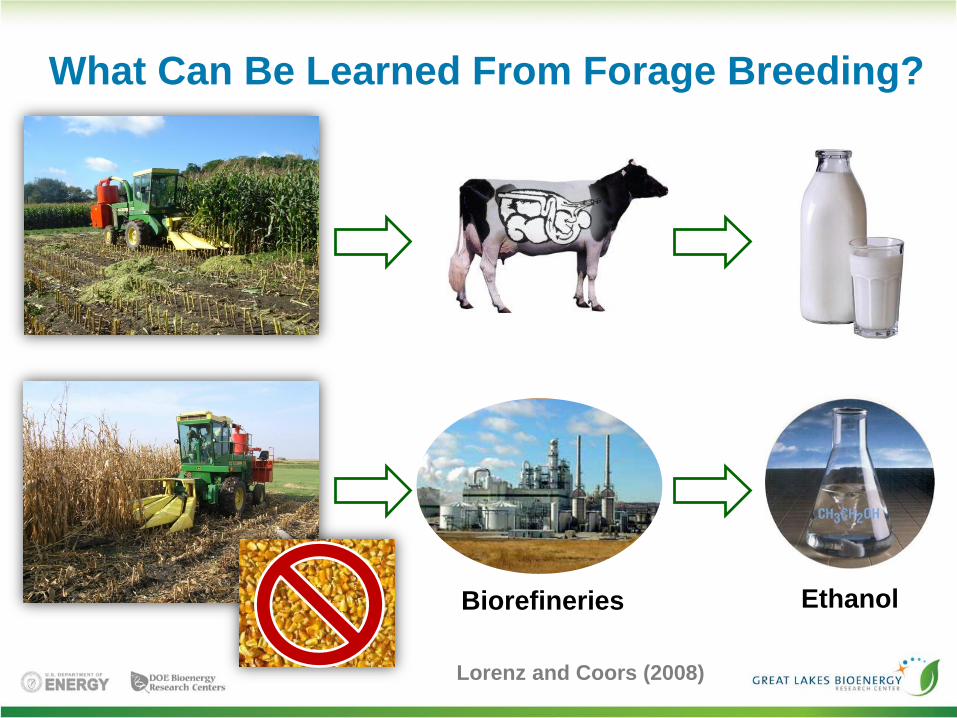
What Can Be Learned From Forage Breeding?
Biorefineries Ethanol
Lorenz and Coors (2008)

Maize Stover Composition
Component % dry basis
Cellulose [β-1,4-glucan] 34-37 %
Hemicellulose 22-28 %
Xylan 80%
Arabinan 12%
Galactan 8%
Lignin 17-18 %
p-hydroxyphenyl (H) 4%
guaiacyl (G) 35%
syringyl (S) 61%
Aden et al. 2002; Humbird et al. 2011;
Grabber et al. 2004

Biomass Distribution on a Corn Plant
Stalk46%
Cob13%
Leafblade12%
Leafsheath12%
Husk-shank10%
Midrib6%
Tassel1%
Hansey et al, 2010

Plant Compositional and
Anatomical Data CollectionMarlies Heckwolf
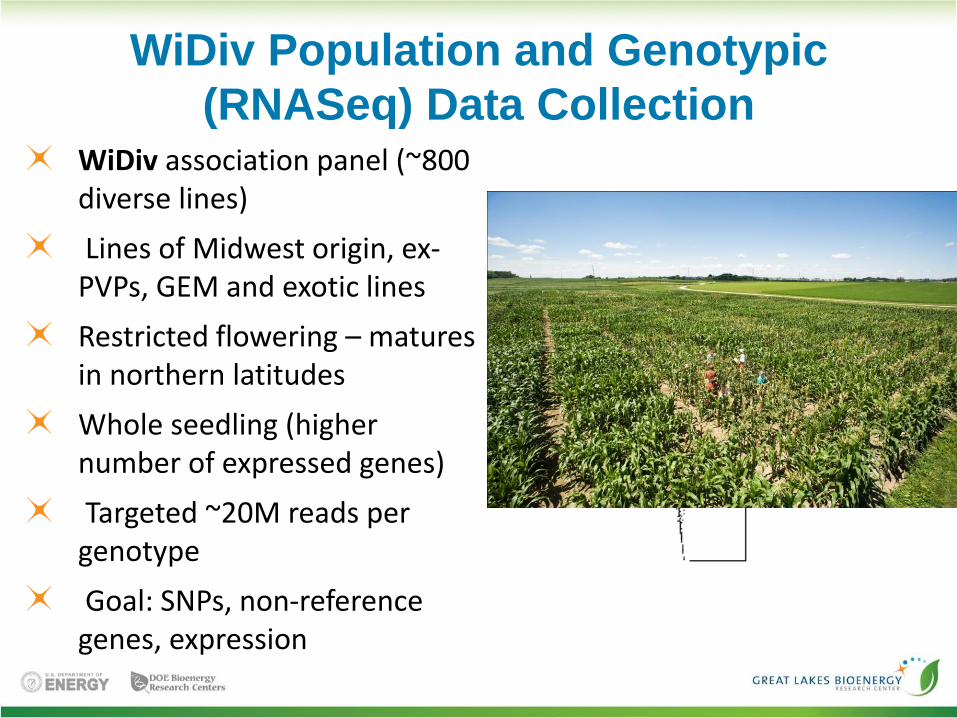
WiDiv Population and Genotypic
(RNASeq) Data CollectionWiDiv association panel (~800 diverse lines)
Lines of Midwest origin, ex-PVPs, GEM and exotic lines
Restricted flowering – matures in northern latitudes
Whole seedling (higher number of expressed genes)
Targeted ~20M reads per genotype
Goal: SNPs, non-reference genes, expression

Sugar Release - WiDiV
Population
Glucose Release
(%/mg of dry biomass)
Pentose Release
(%/mg of dry biomass)
Two years
Two field reps per year

GWAS Sugar Release WiDiv
Glucose
Pentose
CBS domain containing protein
Transcription Factor
Transcription Factor Not
annotatedCBS domain
containing protein
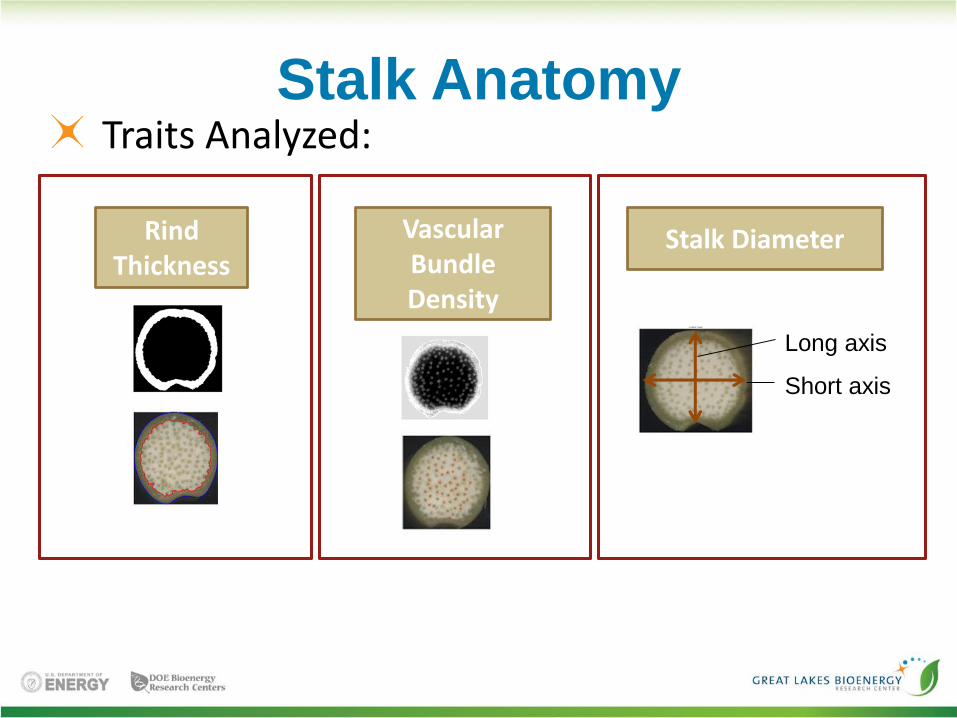
Stalk Anatomy
Rind Thickness
Vascular Bundle Density
Long axis
Short axis
Stalk Diameter
Traits Analyzed:
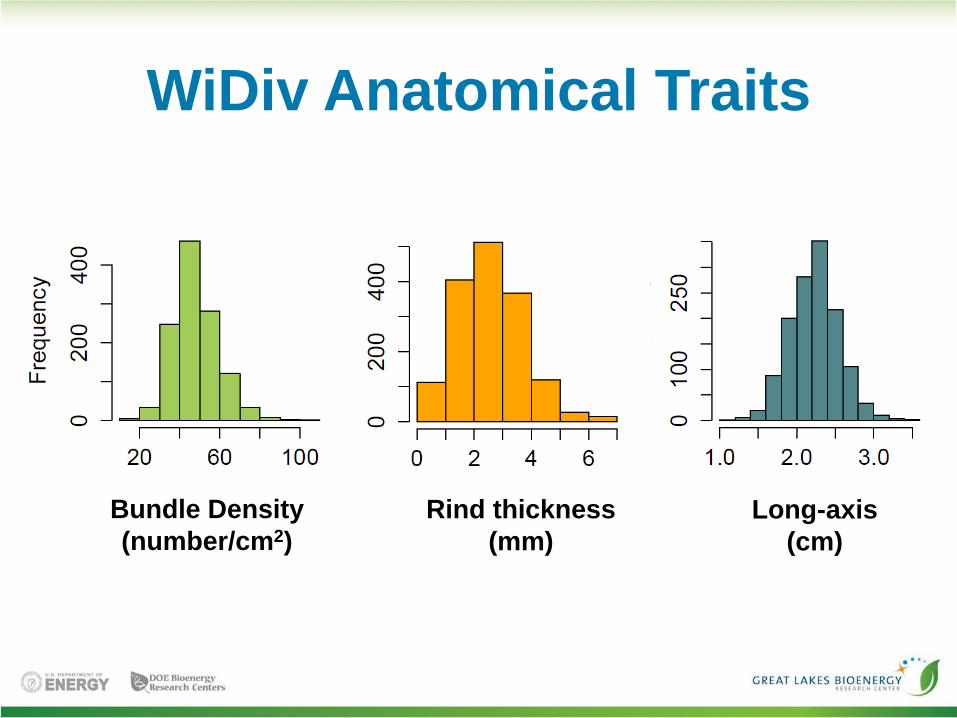
WiDiv Anatomical Traits
Bundle Density
(number/cm2)
Rind thickness
(mm)
Long-axis
(cm)

GWAS WiDiv Anatomical TraitsATP synthase
subunit
ABC Transporter
Metabolite Transporter
Vascular Bundle Density
Rind Thickness

Stalk Anatomy in Genotypes with
Extreme Sugar Yieldhighlow
Pentose Release (%/mg of dry biomass)
Glucose Release (%/mg of dry biomass)
highlow

Stalk Anatomy in Genotypes with
Extreme Sugar Yield

Glucose Release in Genotypes
with Extreme Anatomical Traits
n= 12-15 per groups
p= 1*10-8
p= 2.78*10-10
p= 5.88*10-8
p= 3.1*10-4
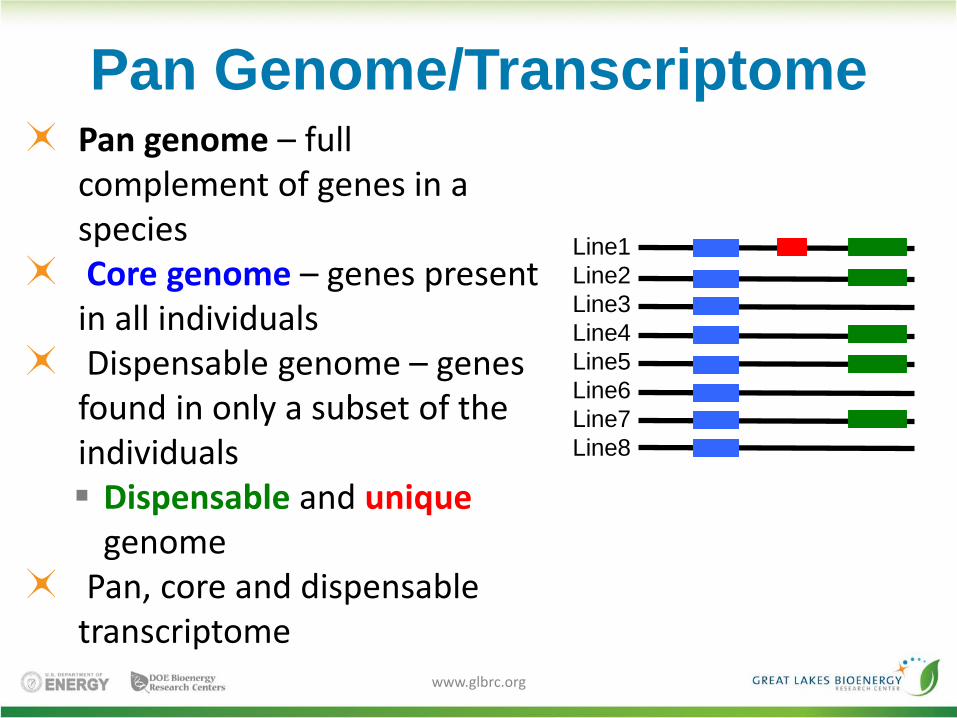
Pan Genome/Transcriptome
www.glbrc.org
Pan genome – full complement of genes in a speciesCore genome – genes present
in all individualsDispensable genome – genes
found in only a subset of the individuals Dispensable and unique
genomePan, core and dispensable
transcriptome
Line1
Line2
Line3
Line4
Line5
Line6
Line7
Line8

Understanding Phenotypic Diversity
Associate genetic factors with traits of interest
Need to characterize all forms of genetic diversity that can underlie phenotypic diversity
www.glbrc.org
Sequence Level Variation (SNPs,
small Insertions/Deletio
ns)
Structural Variation (Copy Number Variation
– CNV & Presence/Absence
Variation – PAV)
Gene Expression Variation –Gene and Isoform level variation (quantitative expression differences)
RNA allows the study of most of these forms of variation

Candice Hirsch
Novel Transcript Discovery
Line1
Line2
Line3
Map all reads from all lines to the reference
sequence
Identified 3.2 billion unmapped reads
B73 Reference Genome
Assemble 400k unmapped reads per inbred (201.2M total)
Assembled transcript 1Assembled transcript 2Assembled transcript 3
>60% of reads mapped for each line
(85% identify and coverage)
• 31,398 loci containing 102,017 transcripts• 884 bp average size• Used longest transcript within a loci
• representative transcript assembly (RTA)
12.5 billion reads
Hirsch et al., submitted
8,681 high confidence novel transcripts(about 50% of those supported by sequence alignments)

Karyotype of the maize
chromosomes with
3,396 placed joint RTAs
www.glbrc.org
= RTAs expressed in
every line
= RTAs not expressed
in every inbred line but
expressed in B73
= RTAs not expressed
in every inbred line and not
expressed in B73
~77% of the RTAs with at
least one SNP - placed to a
single place in the reference

Transcriptome PAV
www.glbrc.org
0
2000
4000
6000
8000
10000
12000
14000
16000
18000
0
1-10
11-5
0
51-1
00
101-
150
151-
200
201-
250
251-
300
301-
350
351-
400
401-
450
451-
490
491-
502
503
Nu
mb
er
of
Ge
ne
s
Number of Genotypes
Reference 5b Annotated Genes
Assembled Contigs
16,393
essential/cor
e transcripts
25,510 dispensable transcripts
Genotype-specific variants
Missing Heritability?

Juvenile to Adult Transition
www.glbrc.org
Poethig 2003. Phase Change and the Regulation
of Developmental Timing in Plants. Science
301:334-336
Phenotype: Last leaf with
juvenile (dull) wax -
TRANSITION
Jillian Foerster
Juvenility has been associated with lower recalcitrance & increased starch content
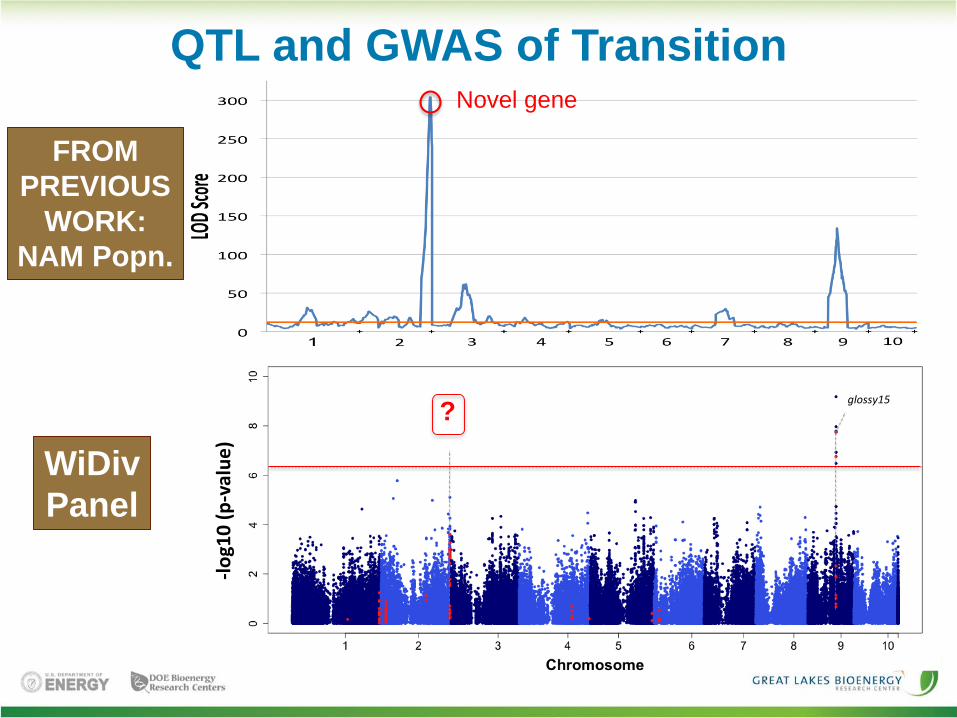
QTL and GWAS of Transition
www.glbrc.org
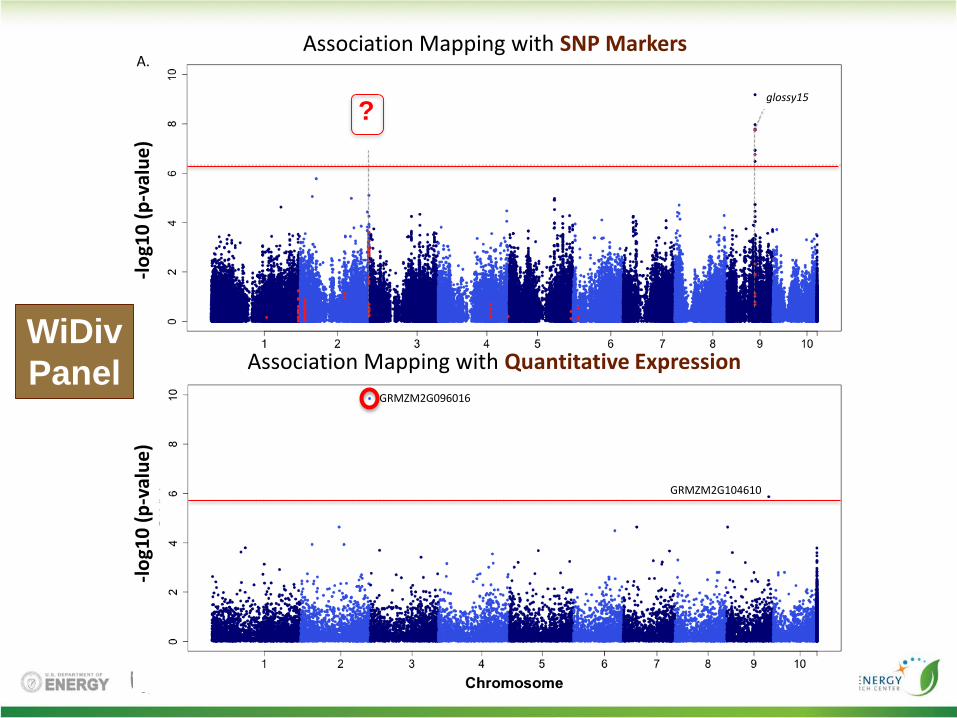
Novel gene
glossy15
A.
GRMZM2G362718
B.
GRMZM2G096016
GRMZM2G104610
C.Pairwise LD − Chr 2 Region
GRMZM2G362718
GRMZM2G362718.1
GRMZM2G362718.2
GRMZM2G362718.3
GRMZM2G362718.4
GRMZM2G362718.5
GRMZM2G362718.6
GRMZM2G362718.7
GRMZM2G362718.8
GRMZM2G362718.9
GRMZM2G362718.10
GRMZM2G362718.11
GRMZM2G362718.12
GRMZM2G362718.13
GRMZM2G362718.14
GRMZM2G362718.15
GRMZM2G362718.16
GRMZM2G362718.17
GRMZM2G362718.18
GRMZM2G362718.19
GRMZM2G362718.20
GRMZM2G362718.21
GRMZM2G362718.22
GRMZM2G362718.23
GRMZM2G362718.24
GRMZM2G362718.25
GRMZM2G362718.26
GRMZM2G362718.27
GRMZM2G362718.28
GRMZM5G851654
GRMZM5G851654.1
GRMZM5G851654.2
GRMZM5G851654.3
GRMZM5G851654.4
GRMZM5G851654.5
GRMZM5G851654.6
GRMZM5G851654.7
GRMZM5G851654.8
GRMZM5G851654.9
GRMZM5G851654.10
GRMZM5G851654.11
GRMZM5G851654.12
GRMZM5G851654.13
GRMZM5G851654.14
GRMZM5G851654.15
GRMZM2G095969
GRMZM2G095969.1
R2 Color Key
0 0.2 0.4 0.6 0.8 1
PhysicalDistance:36.5Kb
?
-lo
g10
(p
-val
ue
)
FROM
PREVIOUS
WORK:
NAM Popn.
WiDiv
Panel
glossy15
A.
GRMZM2G362718
B.
GRMZM2G096016
GRMZM2G104610
C.Pairwise LD − Chr 2 Region
GRMZM2G362718
GRMZM2G362718.1
GRMZM2G362718.2
GRMZM2G362718.3
GRMZM2G362718.4
GRMZM2G362718.5
GRMZM2G362718.6
GRMZM2G362718.7
GRMZM2G362718.8
GRMZM2G362718.9
GRMZM2G362718.10
GRMZM2G362718.11
GRMZM2G362718.12
GRMZM2G362718.13
GRMZM2G362718.14
GRMZM2G362718.15
GRMZM2G362718.16
GRMZM2G362718.17
GRMZM2G362718.18
GRMZM2G362718.19
GRMZM2G362718.20
GRMZM2G362718.21
GRMZM2G362718.22
GRMZM2G362718.23
GRMZM2G362718.24
GRMZM2G362718.25
GRMZM2G362718.26
GRMZM2G362718.27
GRMZM2G362718.28
GRMZM5G851654
GRMZM5G851654.1
GRMZM5G851654.2
GRMZM5G851654.3
GRMZM5G851654.4
GRMZM5G851654.5
GRMZM5G851654.6
GRMZM5G851654.7
GRMZM5G851654.8
GRMZM5G851654.9
GRMZM5G851654.10
GRMZM5G851654.11
GRMZM5G851654.12
GRMZM5G851654.13
GRMZM5G851654.14
GRMZM5G851654.15
GRMZM2G095969
GRMZM2G095969.1
R2 Color Key
0 0.2 0.4 0.6 0.8 1
PhysicalDistance:36.5Kb
Association Mapping with SNP Markers
glossy15
A.
GRMZM2G362718
B.
GRMZM2G096016
GRMZM2G104610
C.Pairwise LD − Chr 2 Region
GRMZM2G362718
GRMZM2G362718.1
GRMZM2G362718.2
GRMZM2G362718.3
GRMZM2G362718.4
GRMZM2G362718.5
GRMZM2G362718.6
GRMZM2G362718.7
GRMZM2G362718.8
GRMZM2G362718.9
GRMZM2G362718.10
GRMZM2G362718.11
GRMZM2G362718.12
GRMZM2G362718.13
GRMZM2G362718.14
GRMZM2G362718.15
GRMZM2G362718.16
GRMZM2G362718.17
GRMZM2G362718.18
GRMZM2G362718.19
GRMZM2G362718.20
GRMZM2G362718.21
GRMZM2G362718.22
GRMZM2G362718.23
GRMZM2G362718.24
GRMZM2G362718.25
GRMZM2G362718.26
GRMZM2G362718.27
GRMZM2G362718.28
GRMZM5G851654
GRMZM5G851654.1
GRMZM5G851654.2
GRMZM5G851654.3
GRMZM5G851654.4
GRMZM5G851654.5
GRMZM5G851654.6
GRMZM5G851654.7
GRMZM5G851654.8
GRMZM5G851654.9
GRMZM5G851654.10
GRMZM5G851654.11
GRMZM5G851654.12
GRMZM5G851654.13
GRMZM5G851654.14
GRMZM5G851654.15
GRMZM2G095969
GRMZM2G095969.1
R2 Color Key
0 0.2 0.4 0.6 0.8 1
PhysicalDistance:36.5Kb
Association Mapping with Quantitative Expression
?-l
og1
0 (
p-v
alu
e)
-lo
g10
(p
-val
ue
)
WiDiv
Panel

Final RemarksConsiderable natural variation observed for sugar release and anatomical traits
Genotypes with low sugar yields have wider stalks, a thicker rind & less bundles
Ability to characterize different source of genetic diversity is critical to explain the observed phenotypic diversity
RTA are not represented in the reference and therefore appropriate sampling of those variants is missed in QTL and association analysis
Transcriptome level PAV is extensive and can predict genomic level PAV, in the case of maize
www.glbrc.org

Thank you
Questions?