genetic determinants of hair, eye and skin pigmentation in europeans
TRANSCRIPT

Genetic determinants of hair, eye and skin pigmentationin EuropeansPatrick Sulem1, Daniel F Gudbjartsson1, Simon N Stacey1, Agnar Helgason1, Thorunn Rafnar1,Kristinn P Magnusson1, Andrei Manolescu1, Ari Karason1, Arnar Palsson1, Gudmar Thorleifsson1,Margret Jakobsdottir1, Stacy Steinberg1, Snæbjorn Palsson1, Fridbert Jonasson2, Bardur Sigurgeirsson3,Kristin Thorisdottir3,4, Rafn Ragnarsson4, Kristrun R Benediktsdottir5, Katja K Aben6,Lambertus A Kiemeney7,8, Jon H Olafsson3, Jeffrey Gulcher1, Augie Kong1, Unnur Thorsteinsdottir1 &Kari Stefansson1
Hair, skin and eye colors are highly heritable and visible traits in humans. We carried out a genome-wide association scanfor variants associated with hair and eye pigmentation, skin sensitivity to sun and freckling among 2,986 Icelanders. We thentested the most closely associated SNPs from six regions—four not previously implicated in the normal variation of humanpigmentation—and replicated their association in a second sample of 2,718 Icelanders and a sample of 1,214 Dutch. The SNPsfrom all six regions met the criteria for genome-wide significance. A variant in SLC24A4 is associated with eye and hair color, avariant near KITLG is associated with hair color, two coding variants in TYR are associated with eye color and freckles, and avariant on 6p25.3 is associated with freckles. The fifth region provided refinements to a previously reported association in OCA2,and the sixth encompasses previously described variants in MC1R.
Hair, eye and skin pigmentation are among the most visible examplesof human phenotypic variation, with a broad normal range that issubject to substantial geographic stratification. In the case of skin,individuals tend to have lighter pigmentation with increasing distancefrom the equator1. By contrast, the majority of variation in human eyeand hair color is found among individuals of European ancestry, withmost other human populations fixed for brown eyes and black hair.
Pigmentation in human tissue is attributable to the number, typeand cellular distribution of melanosomes (subcellular compartmentsproduced by melanocytes that synthesize and store the light-absorbingpolymer melanin)2–4. Variation in pigmentation among individuals isthought to be caused by biochemical differences that affect thenumber of melanosomes produced, the type of melanin synthesized(either the black-brown colored eumelanin or the red-yellow coloredpheomelanin) and the size and shape of the melanosomes.
The key physiological role of skin pigmentation seems to be toabsorb ultraviolet radiation (UVR). Dark pigmentation reducesUVR-induced photolysis of folate and protects skin cells fromexposure to UVR, which can cause sunburn and increase the riskof skin cancer3. However, this protective role must be weightedagainst the reduced amount of UVR available for the synthesis ofvitamin D3. It is generally believed that the geographic distribution
of human skin pigmentation today reflects a history of adaptationto latitude-dependent levels of UVR. Notably, there is no knownphysiological role for hair and eye color.
It has long been recognized that pigmentation differences betweenindividuals are due to inherited traits5–10. According to the list ofmouse coat color genes produced by the International AlbinismCenter (see URL listed in Methods below), mutations in 127 genesare known to affect pigmentation in mice, among which 68 genes havehuman homologs and thus represent promising candidates for thegenes that account for differences in human pigmentation11. Of these68 genes, 29 have been associated with rare pigmentation anomaliesand syndromes, such as albinism and Hermansky-Pudlak syndrome.Common variants that are associated with normal pigmentationvariation in humans have only been identified in six genes. Severalcoding variants in MC1R (which encodes the melanocortin 1 receptor)are associated with red hair, fair skin, freckles, poor tanning responseand higher risk of skin cancer12–14. Analyses of hair and eye color haverevealed strong linkage of brown eye and hair color to a region onchromosome 15 that encompasses the gene OCA2 (encoding thepink-eye dilution, or oculocutaneous albinism II, protein)6,10,15,which had previously been linked to albinism. Coding and non-coding variants in OCA2 have since been associated with blue versus
Received 13 June; accepted 13 September; published online 21 October 2007; doi:10.1038/ng.2007.13
1deCODE genetics, Sturlugata 8, 101 Reykjavik, Iceland. 2Department of Ophthalmology, 3Department of Dermatology, 4Department of Plastic Surgery and5Department of Anatomopathology, Landspitali–University Hospital, Reykjavik, Iceland. 6Comprehensive Cancer Center East and Department of Epidemiology andBiostatistics, 7Department of Epidemiology and Biostatistics and 8Department of Urology, Radboud University Nijmegen Medical Center, Nijmegen, The Netherlands.Correspondence should be addressed to D.F.G. ([email protected]) or K.S. ([email protected]).
NATURE GENETICS VOLUME 39 [ NUMBER 12 [ DECEMBER 2007 1 44 3
ART I C LES©
2007
Nat
ure
Pub
lishi
ng G
roup
ht
tp://
ww
w.n
atur
e.co
m/n
atur
egen
etic
s
brown eye color, dark versus light hair and fair skin16–18. Expandingon a discovery initially made in zebrafish, a coding SNP inthe SLC24A5 gene (encoding solute carrier family 24, member 5)was recently found to be associated with skin pigmentation inadmixed African-American and African-Caribbean populations19.Similar gene-association approaches have been used to relate variantsin MATP (encoding membrane-associated transporter protein, alsoknown as SLC45A2)20, ASIP (encoding agouti signaling protein, non-agouti homolog (mouse))21 and TYR (encoding tyrosinase)22 todifferences in skin pigmentation among populations of mixed Africanand European ancestry.
Several recent evolutionary analyses have yielded signals of positiveselection in different sets of pigmentation candidate genes in popula-tions of European and East Asian ancestry, but there is little evidencefor selection in populations of African ancestry23–26. This supportsthe idea that dark pigmentation represents the ancestral state inhumans and that the lighter pigmentation of European and EastAsian groups can be traced to convergent selective sweeps of muta-tions in different genes.
With the aim of identifying variants that affect the variability ofnormal pigmentation in humans, we carried out a genome-wideassociation scan for sequence variants that influence hair color, eyecolor, freckles and skin sensitivity to sun using a set of 317,511 SNPsgenotyped in 2,986 Icelanders. Promising SNPs were tested in replica-tion samples of 2,718 Icelanders and 1,214 Dutch.
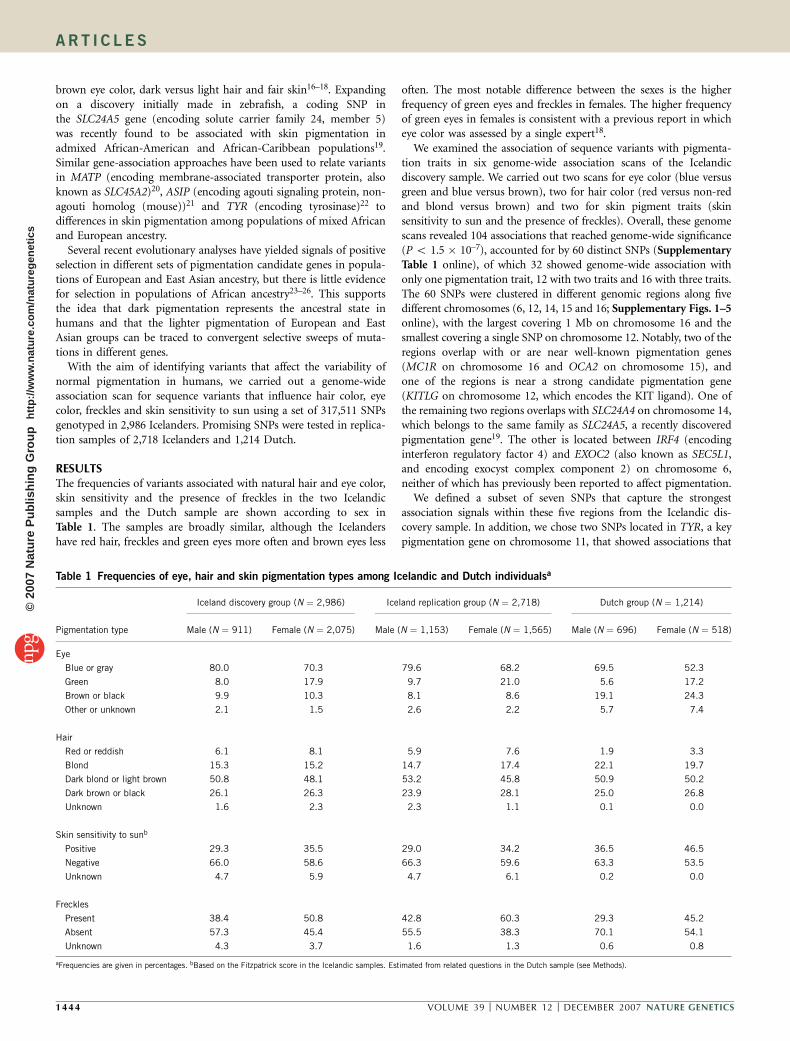
RESULTSThe frequencies of variants associated with natural hair and eye color,skin sensitivity and the presence of freckles in the two Icelandicsamples and the Dutch sample are shown according to sex inTable 1. The samples are broadly similar, although the Icelandershave red hair, freckles and green eyes more often and brown eyes less
often. The most notable difference between the sexes is the higherfrequency of green eyes and freckles in females. The higher frequencyof green eyes in females is consistent with a previous report in whicheye color was assessed by a single expert18.
We examined the association of sequence variants with pigmenta-tion traits in six genome-wide association scans of the Icelandicdiscovery sample. We carried out two scans for eye color (blue versusgreen and blue versus brown), two for hair color (red versus non-redand blond versus brown) and two for skin pigment traits (skinsensitivity to sun and the presence of freckles). Overall, these genomescans revealed 104 associations that reached genome-wide significance(P o 1.5 � 10–7), accounted for by 60 distinct SNPs (SupplementaryTable 1 online), of which 32 showed genome-wide association withonly one pigmentation trait, 12 with two traits and 16 with three traits.The 60 SNPs were clustered in different genomic regions along fivedifferent chromosomes (6, 12, 14, 15 and 16; Supplementary Figs. 1–5online), with the largest covering 1 Mb on chromosome 16 and thesmallest covering a single SNP on chromosome 12. Notably, two of theregions overlap with or are near well-known pigmentation genes(MC1R on chromosome 16 and OCA2 on chromosome 15), andone of the regions is near a strong candidate pigmentation gene(KITLG on chromosome 12, which encodes the KIT ligand). One ofthe remaining two regions overlaps with SLC24A4 on chromosome 14,which belongs to the same family as SLC24A5, a recently discoveredpigmentation gene19. The other is located between IRF4 (encodinginterferon regulatory factor 4) and EXOC2 (also known as SEC5L1,and encoding exocyst complex component 2) on chromosome 6,neither of which has previously been reported to affect pigmentation.
We defined a subset of seven SNPs that capture the strongestassociation signals within these five regions from the Icelandic dis-covery sample. In addition, we chose two SNPs located in TYR, a keypigmentation gene on chromosome 11, that showed associations that
Table 1 Frequencies of eye, hair and skin pigmentation types among Icelandic and Dutch individualsa
Iceland discovery group (N ¼ 2,986) Iceland replication group (N ¼ 2,718) Dutch group (N ¼ 1,214)
Pigmentation type Male (N ¼ 911) Female (N ¼ 2,075) Male (N ¼ 1,153) Female (N ¼ 1,565) Male (N ¼ 696) Female (N ¼ 518)
Eye
Blue or gray 80.0 70.3 79.6 68.2 69.5 52.3
Green 8.0 17.9 9.7 21.0 5.6 17.2
Brown or black 9.9 10.3 8.1 8.6 19.1 24.3
Other or unknown 2.1 1.5 2.6 2.2 5.7 7.4
Hair
Red or reddish 6.1 8.1 5.9 7.6 1.9 3.3
Blond 15.3 15.2 14.7 17.4 22.1 19.7
Dark blond or light brown 50.8 48.1 53.2 45.8 50.9 50.2
Dark brown or black 26.1 26.3 23.9 28.1 25.0 26.8
Unknown 1.6 2.3 2.3 1.1 0.1 0.0
Skin sensitivity to sunb
Positive 29.3 35.5 29.0 34.2 36.5 46.5
Negative 66.0 58.6 66.3 59.6 63.3 53.5
Unknown 4.7 5.9 4.7 6.1 0.2 0.0
Freckles
Present 38.4 50.8 42.8 60.3 29.3 45.2
Absent 57.3 45.4 55.5 38.3 70.1 54.1
Unknown 4.3 3.7 1.6 1.3 0.6 0.8
aFrequencies are given in percentages. bBased on the Fitzpatrick score in the Icelandic samples. Estimated from related questions in the Dutch sample (see Methods).
1 44 4 VOLUME 39 [ NUMBER 12 [ DECEMBER 2007 NATURE GENETICS
ART I C LES©
2007
Nat
ure
Pub
lishi
ng G
roup
ht
tp://
ww
w.n
atur
e.co
m/n
atur
egen
etic
s

were near genome-wide significance in two of the scans (Po 6 � 10–6;Supplementary Fig. 6 online). No SNPs in the other candidate genesremained significant after correcting for the number of SNPs in thesecandidate genes, possibly owing to the lack of power. All nine SNPsshowed similar strength of association with the same pigmentationtraits in the Icelandic and Dutch replication samples (Tables 2–4and Supplementary Table 2 online). They were also all significant in
the combined discovery and replication samples, after correction forthe 317,511 SNPs tested and the six genome-wide scans carried out(P o 2.6 � 10–8). We summarize the primary and secondarypigmentation traits that are associated with the SNPs in these sixgenomic regions (Fig. 1) in separate sections below and discusswhether they have been subject to positive selection (SupplementaryTable 3 online).
Table 2 Association of genetic variants with eye color in the two Icelandic and one Dutch samplea
Iceland
Locus Variant Discovery OR (95% CI) Replication OR (95% CI) Netherlands OR (95% CI) P
Blue versus brown eyes
SLC24A4 rs12896399 T 1.15 (0.95, 1.38) 1.29 (1.05, 1.59) 1.12 (0.91, 1.36) 0.032
KITLG rs12821256 C 1.13 (0.89, 1.42) 1.20 (0.92, 1.56) 0.96 (0.71, 1.30) 0.31
6p25.3 rs1540771 A 1.11 (0.93, 1.34) 1.18 (0.95, 1.46) 1.07 (0.87, 1.30) 0.10
TYR rs1393350 A 1.20 (0.98, 1.47) 1.27 (1.01, 1.60) 1.18 (0.94, 1.48) 0.0044
rs1042602 C 1.01 (0.83, 1.24) 0.99 (0.78, 1.25) 0.97 (0.79, 1.19) 1.00
OCA2 rs1667394 A 29.43 (21.47, 40.35) 18.46 (12.93, 26.35) 15.34 (10.75, 21.88) 1.3 � 10–241
rs7495174 A 6.90 (3.85, 12.39) 5.56 (3.02, 10.23) 4.87 (2.43, 9.74) 3.0 � 10–24
MC1R rs1805008 T 1.15 (0.87, 1.52) 1.02 (0.77, 1.35) 1.29 (0.88, 1.89) 0.20
rs1805007 T 1.37 (0.98, 1.93) 0.95 (0.70, 1.28) 0.90 (0.60, 1.36) 0.044
Blue versus green eyes
SLC24A4 rs12896399 T 2.06 (1.76, 2.42) 1.49 (1.27, 1.73) 2.08 (1.58, 2.74) 4.1 � 10–38
KITLG rs12821256 C 0.92 (0.76, 1.11) 1.09 (0.90, 1.33) 1.18 (0.78, 1.80) 0.34
6p25.3 rs1540771 A 0.99 (0.85, 1.16) 1.14 (0.98, 1.33) 0.88 (0.68, 1.15) 0.59
TYR rs1393350 A 1.52 (1.28, 1.81) 1.43 (1.21, 1.71) 1.38 (1.01, 1.89) 3.3 � 10–12
rs1042602 C 1.08 (0.91, 1.27) 0.88 (0.74, 1.05) 1.16 (0.88, 1.52) 0.11
OCA2 rs1667394 A 6.74 (4.61, 9.83) 5.83 (4.07, 8.36) 5.96 (3.48, 10.21) 1.5 � 10–53
rs7495174 A 1.41 (0.75, 2.62) 2.02 (1.12, 3.65) 1.45 (0.52, 4.01) 0.11
MC1R rs1805008 T 1.04 (0.83, 1.31) 0.85 (0.69, 1.04) 0.87 (0.55, 1.37) 0.92
rs1805007 T 0.94 (0.73, 1.22) 0.74 (0.59, 0.92) 1.12 (0.63, 1.98) 0.73
aThe three samples consisted of 2,986 Icelandic discovery individuals, 2,718 Icelandic replication individuals and 1,214 Dutch replication individuals.
Proteins encoded by each gene: KITLG, KIT ligand; MC1R, melanocortin 1 receptor; OCA2, oculocutaneous albinism II; SLC24A4, solute carrier family 24, member 4; TYR, tyrosine.
Table 3 Association of genetic variants with hair color in the two Icelandic and one Dutch samplea
Iceland
Locus Variant Discovery OR (95% CI) Replication OR (95% CI) Netherlands OR (95% CI) P
Red versus non-red hair
SLC24A4 rs12896399 T 1.06 (0.85, 1.31) 1.07 (0.85, 1.34) 0.88 (0.52, 1.49) 0.56
KITLG rs12821256 C 1.01 (0.78, 1.31) 0.88 (0.67, 1.17) 0.65 (0.27, 1.55) 0.84
6p25.3 rs1540771 A 1.01 (0.82, 1.24) 1.18 (0.94, 1.48) 1.05 (0.63, 1.76) 0.88
TYR rs1393350 A 1.04 (0.83, 1.30) 1.05 (0.82, 1.34) 0.79 (0.43, 1.45) 0.81
rs1042602 C 0.86 (0.69, 1.07) 0.98 (0.77, 1.27) 1.21 (0.71, 2.07) 0.14
OCA2 rs1667394 A 0.91 (0.58, 1.44) 0.81 (0.49, 1.33) 1.44 (0.53, 3.96) 0.83
rs7495174 A 1.49 (0.70, 3.18) 1.26 (0.58, 2.73) 1.15 (0.23, 5.73) 0.16
MC1R rs1805008 T 7.86 (5.96, 10.36) 4.53 (3.55, 5.77) 3.71 (1.85, 7.43) 4.2 � 10–95
rs1805007 T 12.47 (9.37, 16.60) 6.12 (4.78, 7.82) 13.02 (7.02, 24.16) 2.0 � 10–142
Blond versus brown hair
SLC24A4 rs12896399 T 2.56 (2.12, 3.09) 2.34 (1.94, 2.82) 1.86 (1.47, 2.36) 1.4 � 10–48
KITLG rs12821256 C 2.32 (1.86, 2.89) 1.90 (1.52, 2.38) 2.43 (1.67, 3.54) 3.8 � 10–30
6p25.3 rs1540771 A 0.69 (0.58, 0.82) 0.85 (0.71, 1.03) 0.92 (0.73, 1.17) 1.1 � 10–7
TYR rs1393350 A 1.29 (1.06, 1.56) 1.36 (1.12, 1.66) 1.22 (0.94, 1.59) 0.00011
rs1042602 C 0.85 (0.70, 1.03) 0.81 (0.66, 1.00) 0.94 (0.74, 1.20) 0.021
OCA2 rs1667394 A 4.94 (3.16, 7.71) 5.96 (3.73, 9.52) 5.51 (3.49, 8.69) 5.5 � 10–35
rs7495174 A 1.92 (0.95, 3.90) 1.84 (0.86, 3.95) 0.82 (0.40, 1.68) 0.070
MC1R rs1805008 T 1.88 (1.40, 2.51) 1.74 (1.33, 2.28) 1.93 (1.25, 2.96) 2.2 � 10–11
rs1805007 T 2.34 (1.69, 3.24) 2.00 (1.52, 2.64) 1.59 (0.95, 2.66) 1.9 � 10–13
aThe three samples consisted of 2,986 Icelandic discovery individuals, 2,718 Icelandic replication individuals and 1,214 Dutch replication individuals.
Proteins encoded by each gene: KITLG, KIT ligand; MC1R, melanocortin 1 receptor; OCA2, oculocutaneous albinism II; SLC24A4, solute carrier family 24, member 4; TYR, tyrosine.
NATURE GENETICS VOLUME 39 [ NUMBER 12 [ DECEMBER 2007 1 44 5
ART I C LES©
2007
Nat
ure
Pub
lishi
ng G
roup
ht
tp://
ww
w.n
atur
e.co
m/n
atur
egen
etic
s

MC1RA total of 38 SNPs spanning a 1-Mb region of strong linkagedisequilibrium (LD) on chromosome 16 showed an association withred hair, skin sensitivity to sun and freckles that reached genome-widesignificance, and they also showed a trend towards association withblond hair. The SNP rs4785763 most effectively captured the associa-tion (odds ratio (OR) ¼ 5.62, P¼ 3.2 � 10–56 for red hair, OR ¼ 2.03,P ¼ 1.2 � 10–33 for freckles). This region contains the well-documented MC1R gene. More than 30 non-synonymous mutationshave been described in populations of European ancestry that impairthe normal function of the MC1R gene product13,14, leading to thegeneration of melanosomes that contain red-yellow pheomelaninrather than brown-black eumelanin4,27 and resulting in pigmentationtraits such as red and blond hair, freckles, fair skin and sensitivity toUVR12,13. Two non-synonymous MC1R mutations are commonenough in European populations to have a major effect on normaldifferences in pigmentation: R151C (rs1805007) and R160W(rs1805008)14, neither of which is assayed on the Illumina 317KSNP chip. After genotyping these SNPs in the Icelandic and Dutchsamples, we found that their T alleles (that is, the mutated alleles) werecorrelated with the A allele of rs4785763 and that the strong associa-tion with rs4785763 disappeared in both samples when adjusted forrs1805007 and rs1805008. We therefore concluded that the associationsignal detected in the genome scan is due to the previously docu-mented non-synonymous mutations in MC1R.
The T alleles of rs1805007 and rs1805008 are found at a frequencyof 0.142 and 0.108, respectively, in the CEPH Utah (CEU) HapMapsample, but are not present in the East Asian (ASN) and NigerianYoruban (YRI) HapMap samples28. Although this represents only amoderate level of population divergence and is not consistent withstrong selective sweep on these variants in European populations, wenote that only 5.13% of HapMap SNPs that have the same overallfrequency in the CEU and ASN samples show a greater differencebetween these populations. Moreover, only 6.6% and 6.2% of the
alleles with equal frequencies in the CEU sample have greater extendedhaplotype homozygosity (based on the irEHH (integrated relativeextended haplotype homozygosity) statistic; see Methods) than thers1805007 and rs1805008 T alleles, respectively. These findings suggestthat both mutated alleles may have been at least weakly affected byrecent positive selection.
6p25.3Two SNPs that lie only 8 kb apart in region 6p25.3, rs4959270 andrs1540771, showed association with the presence of freckles in theIcelandic sample that reached genome-wide significance (Supplemen-tary Table 1). This small segment lies between two genes, SEC5L1 andIRF4, neither of which is an obvious pigmentation candidate gene; nosuch genes are found within the LD range of the two SNPs. Althoughstrongly correlated (r2 ¼ 0.77), the A allele of rs1540771 had thestronger association (OR ¼ 1.40, P ¼ 1.9 � 10–9) and remainedsignificant after adjusting for rs4959270 (P ¼ 0.043), whereas theassociation of rs495270, adjusted for rs1540771, did not remainsignificant (P ¼ 0.34). The association of rs1540771 with freckleswas confirmed in the Icelandic and Dutch replication samples(Table 4). Notably, the A allele of rs1540771 shows secondaryassociations with brown (rather than blond) hair and with skin thatis sensitive to UVR (Fig. 1 and Tables 3 and 4). Thus, like MC1R, thevariant on 6p25.3 that is associated with freckles is also associated withsun sensitivity, but unlike MC1R, it shows no association with red hair.
The frequency of the rs1540771 A allele is approximately 50% inEuropean populations, but 30% and 5% in the East Asian and YRIHapMap samples, respectively (6.3% of HapMap SNPs of a similarfrequency in the CEU and YRI HapMap samples differ more infrequency), and only 4.1% of alleles at the same frequency in theCEU HapMap data set have greater irEHH values. This suggests thatthe rs1540771 A allele has been subject to positive selection inEuropean populations, perhaps owing to its effect on reduced skinpigmentation. In addition, SNPs that are near rs1540771 were recently
Table 4 Association of genetic variants with skin sensitivity to sun and freckles in the two Icelandic and one Dutch samplea
Iceland
Locus Variant Discovery OR (95% CI) Replication OR (95% CI) Netherlands OR (95% CI) P
Skin sensitivity to sun
SLC24A4 rs12896399 T 1.21 (1.07, 1.36) 1.04 (0.92, 1.18) 0.98 (0.84, 1.16) 0.00035
KITLG rs12821256 C 1.07 (0.93, 1.24) 1.22 (1.05, 1.42) 0.84 (0.66, 1.08) 0.71
6p25.3 rs1540771 A 1.21 (1.08, 1.36) 1.12 (0.99, 1.26) 1.12 (0.95, 1.32) 4.0 � 10–6
TYR rs1393350 A 1.26 (1.11, 1.43) 1.49 (1.31, 1.70) 1.11 (0.92, 1.34) 1.6 � 10–6
rs1042602 C 0.96 (0.85, 1.09) 1.05 (0.91, 1.20) 0.87 (0.73, 1.02) 0.12
OCA2 rs1667394 A 1.24 (0.95, 1.62) 1.24 (0.93, 1.65) 1.34 (1.00, 1.81) 0.0034
rs7495174 A 1.30 (0.87, 1.96) 0.99 (0.64, 1.53) 1.65 (1.03, 2.63) 0.17
MC1R rs1805008 T 2.30 (1.94, 2.73) 2.07 (1.77, 2.43) 1.65 (1.23, 2.20) 1.8 � 10–43
rs1805007 T 2.94 (2.42, 3.58) 2.51 (2.11, 2.98) 2.01 (1.44, 2.81) 1.8 � 10–55
Freckles
SLC24A4 rs12896399 T 0.99 (0.88, 1.11) 1.04 (0.92, 1.16) 1.03 (0.87, 1.22) 1.00
KITLG rs12821256 C 0.89 (0.78, 1.02) 1.01 (0.88, 1.17) 0.96 (0.75, 1.24) 0.074
6p25.3 rs1540771 A 1.40 (1.26, 1.57) 1.25 (1.11, 1.40) 1.26 (1.06, 1.49) 3.7 � 10–18
TYR rs1393350 A 1.13 (1.00, 1.28) 1.13 (1.00, 1.28) 1.10 (0.91, 1.32) 0.0029
rs1042602 C 1.32 (1.17, 1.49) 1.39 (1.22, 1.58) 1.23 (1.04, 1.46) 1.5 � 10–11
OCA2 rs1667394 A 1.16 (0.90, 1.48) 1.09 (0.83, 1.41) 1.39 (1.02, 1.88) 0.026
rs7495174 A 0.84 (0.58, 1.21) 0.82 (0.55, 1.23) 1.04 (0.65, 1.66) 0.29
MC1R rs1805008 T 2.63 (2.21, 3.11) 2.49 (2.11, 2.93) 2.06 (1.54, 2.76) 2.8 � 10–60
rs1805007 T 4.37 (3.56, 5.37) 2.54 (2.13, 3.04) 3.96 (2.81, 5.58) 1.2 � 10–96
aThe three samples consisted of 2,986 Icelandic discovery individuals, 2,718 Icelandic replication individuals and 1,214 Dutch replication individuals.
Proteins encoded by each gene: KITLG, KIT ligand; MC1R, melanocortin 1 receptor; OCA2, oculocutaneous albinism II; SLC24A4, solute carrier family 24, member 4; TYR, tyrosine.
1 44 6 VOLUME 39 [ NUMBER 12 [ DECEMBER 2007 NATURE GENETICS
ART I C LES©
2007
Nat
ure
Pub
lishi
ng G
roup
ht
tp://
ww
w.n
atur
e.co
m/n
atur
egen
etic
s

shown to be among the SNPs most stronglyassociated with geographic location in aBritish population29.
TyrosinaseThe two SNPs in TYR chosen for replication,rs1042602 and rs1393350, are found in thesame block of LD (r2 ¼ 0.16 in the Icelandicsample), but their pigmentation associationeffects are essentially independent. The asso-ciation of rs1042602 (a non-synonymousS192Y mutation) with freckles in theIcelandic discovery sample was close toreaching genome-wide significance (OR ¼1.32, P ¼ 5.3 � 10–6), which was con-firmed in the replication samples (combinedP ¼ 1.5 � 10–11; Table 4). Although previousstudies have reported that this SNP may beassociated with skin22 and eye color17, we didnot detect an association with any of thepigmentation traits studied other thanfreckles. This sets rs1042602 apart from thevariants in MC1R and 6p25.3, where theassociation with freckles is accompanied byan association with sun sensitivity and haircolor (Fig. 1). The ancestral C allele ofrs1042602 is fixed in the East Asian andYRI HapMap samples, whereas the A alleleis found at a frequency of approximately 35%in European populations. There is strongevidence that the rs1042602 A allele (which is associated with theabsence of freckles) has been subject to positive selection in Europeanpopulations (Supplementary Table 3). Thus, only 1.7% of compar-able HapMap SNPs show greater frequency differences between theCEU and YRI samples and only 0.37% show greater frequencydifferences between the CEU and East Asian samples. Moreover,only 0.55% of alleles of the same frequency in the HapMap CEUsamples have greater or equal irEHH values.
The second SNP in TYR chosen for replication, rs1393350, isstrongly correlated with the rs1126809 SNP, which codes for anon-synonymous R402Q mutation (D¢ ¼ 1 and r2 ¼ 0.86). Theassociation of the A allele of rs1393350 with blue versus green eyecolor was close to reaching genome-wide significance (OR ¼ 1.52,P ¼ 2.0 � 10–6), which was confirmed in the replication samples(combined P ¼ 3.3 � 10–12; Table 2). For this SNP, the greatestdifference in allele frequency was between blue- and green-eyedindividuals, with brown-eyed individuals having an intermediatefrequency (Fig. 1). In addition to the primary association with eyecolor, possible secondary associations with blond versus brown hairand with skin sensitivity to sun were also detected (Tables 3 and 4).However, despite the pleiotropic effect of rs1393350 on pigmentationtraits, we found no evidence for the action of positive selection basedon population divergence or extended haplotype homozygosity.
SLC24A4Three SNPs (rs4904864, rs4904868 and rs2402130) in a 37-kb regionon chromosome 14 showed association with blond versus brown hairand blue versus green eyes in the Icelandic discovery sample thatreached genome-wide significance (all Po 1.9 � 10–8, SupplementaryTable 1). This region is located within a single block of LD thatcontains the first exons of SLC24A4. This is the first report of any link
between pigmentation and variants in SLC24A4, but the gene belongsto the same family as SLC24A5, which is a recently discoveredpigmentation gene19. No common SNPs at SLC24A5 are available inour data set; all SNPs in the region have a frequency of less than 1%.
Analysis of two SNP haplotypes from the Illumina 317K chip withinthe block of LD revealed that the haplotypic combination of thers4904868 C allele and the rs2402130 A allele had a stronger andmore significant association with pigmentation traits than any of thethree individual SNPs in the Icelandic discovery sample (OR ¼ 2.56,P ¼ 8.5 � 10–24 for blond versus brown hair and OR ¼ 2.06,P ¼ 2.0 � 10–18 for blue versus green eyes). This haplotype almostcompletely accounted for the association signal provided by the threeSNPs individually, with adjusted association P values that were greaterthan 0.25, except for the association of rs4904868 with blond versusbrown hair (P ¼ 0.032). An analysis of the HapMap data revealed thatthe haplotype tags (r2 ¼ 1) a group of equivalent SNP alleles(rs12896399 T allele, rs4904866 T allele, rs1885194 C allele andrs17184180 A allele) that have a frequency of 60% in the CEU samplebut less than 1% in the YRI sample. The T allele of rs12896399 showeda similarly strong association with blond versus brown hair and blueversus green eyes in the Icelandic and Dutch replication samples as inthe Icelandic discovery sample (Tables 2 and 3).
The high frequency of the rs12896399 T allele in the CEU HapMapsample relative to the frequency in the YRI HapMap sample (2.1% ofautosomal SNPs in HapMap show a greater difference in frequency)and the low diversity of CEU haplotypes that carry this allele (6.4% ofalleles found at 60% frequency in the CEU sample have greater irEHHvalues) suggest that it may have been influenced by positive selectionin European populations.
Note that in the Icelandic and Dutch samples, the greatestdifference in allele frequency for rs12896399 was between blue- and
KITLGrs12821256 C
OCA2rs1667394 A
SLC24A4rs12896399 T
TYR R402Qrs1393350 A
TYR S192Yrs1042602 C
CHR 6rs1540771 A
MC1Rrs1805008 T
GeneSNP
16
90
51
28
66
46
11
Frequency Blue Green Brown Red BlondDarkblond
BrownSensitive
to sunFreckles
Eye color Hair color Skin
* * * * *
*
*
* *
* * * *
* * * * *
* *
Frequency: Low High
Figure 1 A schematic representation of how different genetic variants are associated with pigmentation.
For eye and hair color, each cell shows how frequent the genetic variant is for each phenotype relative
to the population frequency of the variant. For sun sensitivity and freckles, each cell shows how
frequent the variant is in this group compared with people who are not sensitive to sun or have not had
freckles, respectively. The OR scale is used to compare frequencies. For simplicity, only cells that
correspond to characteristics with significant association (P o 0.001) are colored. Cells that
correspond to highly significant results from the six genome-wide scans are marked with an asterisk
(P o 1 � 10–8). For simplicity, only one variant is shown for each of the MC1R and OCA2 genes, as
the other variants have different association profiles for both genes. CHR, chromosome. Proteins
encoded by each gene: KITLG, KIT ligand; SLC24A4, solute carrier family 24, member 4; TYR, tyrosine.
NATURE GENETICS VOLUME 39 [ NUMBER 12 [ DECEMBER 2007 1 44 7
ART I C LES©
2007
Nat
ure
Pub
lishi
ng G
roup
ht
tp://
ww
w.n
atur
e.co
m/n
atur
egen
etic
s
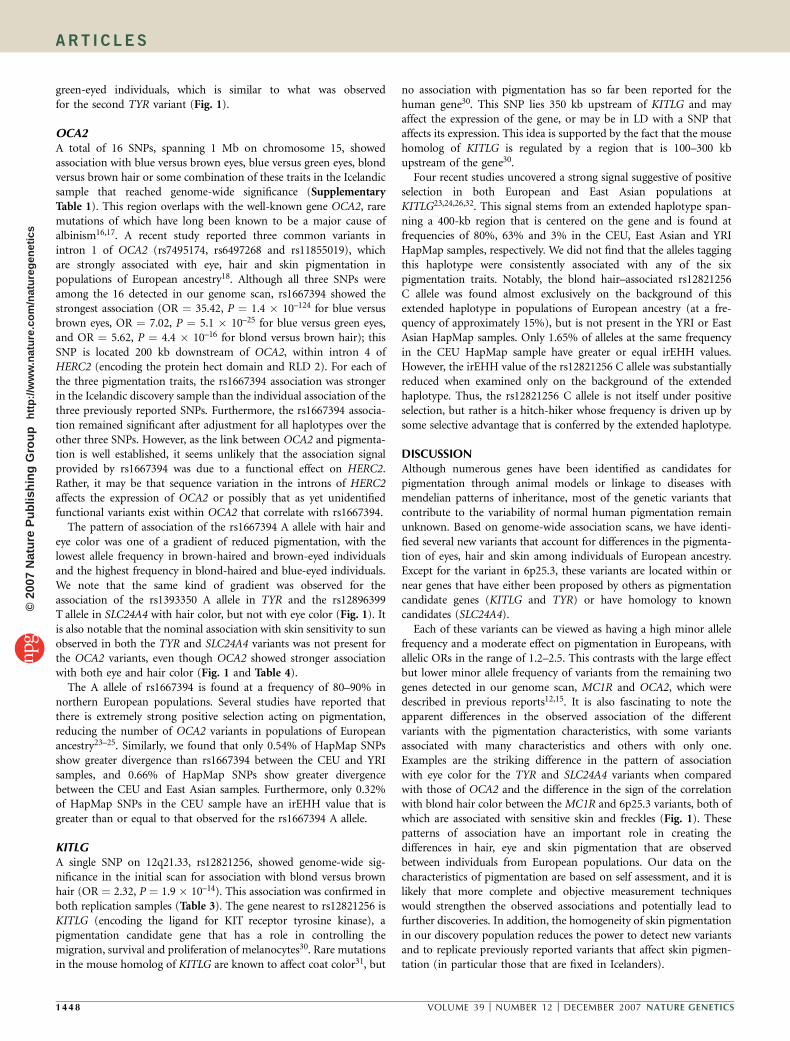
green-eyed individuals, which is similar to what was observedfor the second TYR variant (Fig. 1).
OCA2A total of 16 SNPs, spanning 1 Mb on chromosome 15, showedassociation with blue versus brown eyes, blue versus green eyes, blondversus brown hair or some combination of these traits in the Icelandicsample that reached genome-wide significance (SupplementaryTable 1). This region overlaps with the well-known gene OCA2, raremutations of which have long been known to be a major cause ofalbinism16,17. A recent study reported three common variants inintron 1 of OCA2 (rs7495174, rs6497268 and rs11855019), whichare strongly associated with eye, hair and skin pigmentation inpopulations of European ancestry18. Although all three SNPs wereamong the 16 detected in our genome scan, rs1667394 showed thestrongest association (OR ¼ 35.42, P ¼ 1.4 � 10–124 for blue versusbrown eyes, OR ¼ 7.02, P ¼ 5.1 � 10–25 for blue versus green eyes,and OR ¼ 5.62, P ¼ 4.4 � 10–16 for blond versus brown hair); thisSNP is located 200 kb downstream of OCA2, within intron 4 ofHERC2 (encoding the protein hect domain and RLD 2). For each ofthe three pigmentation traits, the rs1667394 association was strongerin the Icelandic discovery sample than the individual association of thethree previously reported SNPs. Furthermore, the rs1667394 associa-tion remained significant after adjustment for all haplotypes over theother three SNPs. However, as the link between OCA2 and pigmenta-tion is well established, it seems unlikely that the association signalprovided by rs1667394 was due to a functional effect on HERC2.Rather, it may be that sequence variation in the introns of HERC2affects the expression of OCA2 or possibly that as yet unidentifiedfunctional variants exist within OCA2 that correlate with rs1667394.
The pattern of association of the rs1667394 A allele with hair andeye color was one of a gradient of reduced pigmentation, with thelowest allele frequency in brown-haired and brown-eyed individualsand the highest frequency in blond-haired and blue-eyed individuals.We note that the same kind of gradient was observed for theassociation of the rs1393350 A allele in TYR and the rs12896399T allele in SLC24A4 with hair color, but not with eye color (Fig. 1). Itis also notable that the nominal association with skin sensitivity to sunobserved in both the TYR and SLC24A4 variants was not present forthe OCA2 variants, even though OCA2 showed stronger associationwith both eye and hair color (Fig. 1 and Table 4).
The A allele of rs1667394 is found at a frequency of 80–90% innorthern European populations. Several studies have reported thatthere is extremely strong positive selection acting on pigmentation,reducing the number of OCA2 variants in populations of Europeanancestry23–25. Similarly, we found that only 0.54% of HapMap SNPsshow greater divergence than rs1667394 between the CEU and YRIsamples, and 0.66% of HapMap SNPs show greater divergencebetween the CEU and East Asian samples. Furthermore, only 0.32%of HapMap SNPs in the CEU sample have an irEHH value that isgreater than or equal to that observed for the rs1667394 A allele.
KITLGA single SNP on 12q21.33, rs12821256, showed genome-wide sig-nificance in the initial scan for association with blond versus brownhair (OR ¼ 2.32, P ¼ 1.9 � 10–14). This association was confirmed inboth replication samples (Table 3). The gene nearest to rs12821256 isKITLG (encoding the ligand for KIT receptor tyrosine kinase), apigmentation candidate gene that has a role in controlling themigration, survival and proliferation of melanocytes30. Rare mutationsin the mouse homolog of KITLG are known to affect coat color31, but
no association with pigmentation has so far been reported for thehuman gene30. This SNP lies 350 kb upstream of KITLG and mayaffect the expression of the gene, or may be in LD with a SNP thataffects its expression. This idea is supported by the fact that the mousehomolog of KITLG is regulated by a region that is 100–300 kbupstream of the gene30.
Four recent studies uncovered a strong signal suggestive of positiveselection in both European and East Asian populations atKITLG23,24,26,32. This signal stems from an extended haplotype span-ning a 400-kb region that is centered on the gene and is found atfrequencies of 80%, 63% and 3% in the CEU, East Asian and YRIHapMap samples, respectively. We did not find that the alleles taggingthis haplotype were consistently associated with any of the sixpigmentation traits. Notably, the blond hair–associated rs12821256C allele was found almost exclusively on the background of thisextended haplotype in populations of European ancestry (at a fre-quency of approximately 15%), but is not present in the YRI or EastAsian HapMap samples. Only 1.65% of alleles at the same frequencyin the CEU HapMap sample have greater or equal irEHH values.However, the irEHH value of the rs12821256 C allele was substantiallyreduced when examined only on the background of the extendedhaplotype. Thus, the rs12821256 C allele is not itself under positiveselection, but rather is a hitch-hiker whose frequency is driven up bysome selective advantage that is conferred by the extended haplotype.
DISCUSSIONAlthough numerous genes have been identified as candidates forpigmentation through animal models or linkage to diseases withmendelian patterns of inheritance, most of the genetic variants thatcontribute to the variability of normal human pigmentation remainunknown. Based on genome-wide association scans, we have identi-fied several new variants that account for differences in the pigmenta-tion of eyes, hair and skin among individuals of European ancestry.Except for the variant in 6p25.3, these variants are located within ornear genes that have either been proposed by others as pigmentationcandidate genes (KITLG and TYR) or have homology to knowncandidates (SLC24A4).
Each of these variants can be viewed as having a high minor allelefrequency and a moderate effect on pigmentation in Europeans, withallelic ORs in the range of 1.2–2.5. This contrasts with the large effectbut lower minor allele frequency of variants from the remaining twogenes detected in our genome scan, MC1R and OCA2, which weredescribed in previous reports12,15. It is also fascinating to note theapparent differences in the observed association of the differentvariants with the pigmentation characteristics, with some variantsassociated with many characteristics and others with only one.Examples are the striking difference in the pattern of associationwith eye color for the TYR and SLC24A4 variants when comparedwith those of OCA2 and the difference in the sign of the correlationwith blond hair color between the MC1R and 6p25.3 variants, both ofwhich are associated with sensitive skin and freckles (Fig. 1). Thesepatterns of association have an important role in creating thedifferences in hair, eye and skin pigmentation that are observedbetween individuals from European populations. Our data on thecharacteristics of pigmentation are based on self assessment, and it islikely that more complete and objective measurement techniqueswould strengthen the observed associations and potentially lead tofurther discoveries. In addition, the homogeneity of skin pigmentationin our discovery population reduces the power to detect new variantsand to replicate previously reported variants that affect skin pigmen-tation (in particular those that are fixed in Icelanders).
1 44 8 VOLUME 39 [ NUMBER 12 [ DECEMBER 2007 NATURE GENETICS
ART I C LES©
2007
Nat
ure
Pub
lishi
ng G
roup
ht
tp://
ww
w.n
atur
e.co
m/n
atur
egen
etic
s

In spite of the observed frequency difference in some of thepigmentation characteristics, we did not find evidence for a differencebetween the sexes in the strength of association with any of thevariants (Supplementary Table 4 online).
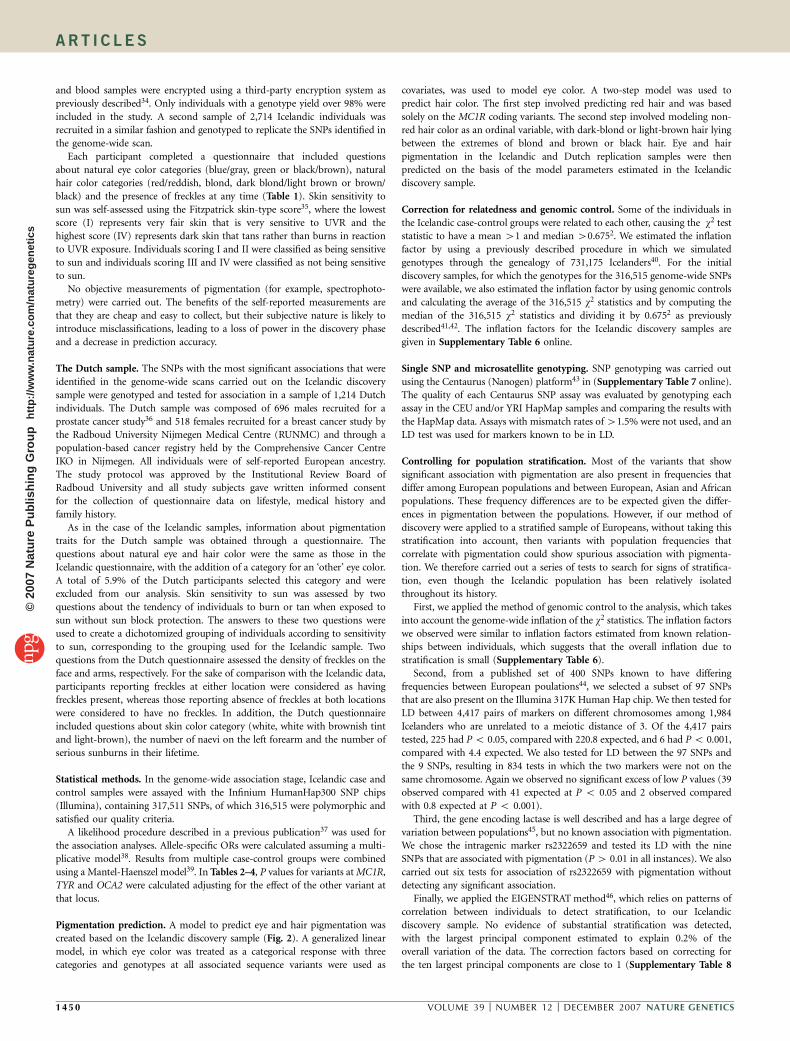
Given this new set of genetic determinants of pigmentation, we haveattempted to predict eye and hair pigmentation based on genotype(Fig. 2 and Supplementary Table 5 online). For eye color, theprediction of blue versus brown eye color is dominated by variantsin OCA2, and the discoveries described in this report add resolution tothe discrimination between blue and green eye color. For hair color,the contribution of the new variants is much more substantial.Although the prediction of red hair color is based solely on MC1Rvariants, the new variants add predictive power in distinguishing theshades of non-red hair. Red and either blond or brown hair color canbe excluded with a high degree of certainty for a substantial propor-tion of individuals.
It has long been thought that before themigrations that first brought our species outof Africa some 60,000 years ago, ancestralhuman populations had characteristicallydark skin, eyes and hair24. This idea is con-sistent with the positive correlation inhumans between the degree of skin pigmen-tation and proximity to the equator1,2 andwith the findings that some genes that areinvolved in the synthesis of eumelanin areunder strong purifying selection in popula-tions who are exposed to high levels ofUVR33. More recently, several studies haveprovided evidence in support of the idea thatpositive selection drove lighter skin pigmen-tation to near fixation in populations atnortherly latitudes, such as those of Europeanand East Asian ancestry19,23–25. Our resultssupport this conclusion, in that most of thepigmentation variants discovered in thisstudy show signals of positive selection inEuropean populations. In each case the var-iant that is likely to contribute to lighterpigmentation of the skin has been swept tohigh frequency, which is consistent with posi-tive selection on the sequence variants thatundermine the formation of pigments. Themost obvious functional advantage of lighterskin pigmentation in northerly latitudes isthat it facilitates the synthesis of vitamin D3in spite of low levels of UVR exposure3.However, other functional advantages or con-straints cannot be ruled out.
The growing number of known sequence variants that underlie thedifferences in normal human pigmentation within and betweenpopulations may provide new inroads into the molecular physiologyof these traits, which in turn could enhance our understanding of howthey evolved. At the very least, the newly discovered genetic determi-nants of human pigmentation provide promising candidates forforensic geneticists and for studies of diseases of the skin and eyesthat are known to be correlated with such traits.
METHODSThe Icelandic samples. A total of 2,986 Icelandic adults, recruited through
cardiovascular, neoplastic, neurological and metabolic studies, were genotyped
for 317,511 SNPs using the HumanHap300 BeadChip (Illumina). These studies
were approved by the Data Protection Commission of Iceland and the National
Bioethics Committee of Iceland. Written informed consent was obtained from
all participants. Personal identifiers associated with phenotypic information
Observed eye color
Blue eyesGreen eyes Brown eyes
Population distribution
Brown < 20%Green < 10% Green 10–30%
Brown < 20% Brown < 20%Brown 20–50%
Blond 30–40% Brown 30–50%
Green > 30% Brown > 50%
Eye color prediction
0.0
0.2
0.4
0.6
0.8
1.0
Fre
quen
cy
Icelandic discovery sampleN = 2,928 N = 955 N = 1,430 N = 122 N = 162 N = 259
0.0
0.2
0.4
0.6
0.8
1.0
Fre
quen
cy
Icelandic replication sample
N = 2,603 N = 1,080 N = 1,021 N = 118 N = 107 N = 277
0.0
0.2
0.4
0.6
0.8
1.0
Fre
quen
cy
Dutch replication sample
N = 1,140 N = 445 N = 375 N = 53 N = 57 N = 210
Observed hair colorRed hair
Blond hair
Dark-blond or light-brown hair
Brown or black hair
Populationdistribution Red > 50% Blond > 40%
Blond < 30%Brown < 30% Brown > 50%
Hair color prediction
0.0
0.2
0.4
0.6
0.8
Fre
quen
cy
Icelandic discovery sampleN = 2,903 N = 154 N = 61 N = 217 N = 1,559 N = 627 N = 285
0.0
0.2
0.4
0.6
0.8
Fre
quen
cy
Icelandic replication sampleN = 2,622 N = 140 N = 81 N = 215 N = 1,387 N = 571 N = 228
0.0
0.2
0.4
0.6
0.8
Fre
quen
cy
Dutch replication sample
N = 1,211 N = 19 N = 6 N = 46 N = 547 N = 377 N = 216
a
b
Figure 2 Overview of the accuracy of
pigmentation prediction based on genotype
status. (a) Eye pigmentation. (b) Hair
pigmentation. The prediction rules were created
from the Icelandic discovery sample and then
applied to the Icelandic and Dutch replication
samples. Only those individuals who were
genotyped for all necessary markers, or good
surrogates of these markers, were used.
Histograms show the distribution of pigmentation
within each sample and within groups of
individuals with similar predicted pigmentation.
NATURE GENETICS VOLUME 39 [ NUMBER 12 [ DECEMBER 2007 1 44 9
ART I C LES©
2007
Nat
ure
Pub
lishi
ng G
roup
ht
tp://
ww
w.n
atur
e.co
m/n
atur
egen
etic
s
and blood samples were encrypted using a third-party encryption system as
previously described34. Only individuals with a genotype yield over 98% were
included in the study. A second sample of 2,714 Icelandic individuals was
recruited in a similar fashion and genotyped to replicate the SNPs identified in
the genome-wide scan.
Each participant completed a questionnaire that included questions
about natural eye color categories (blue/gray, green or black/brown), natural
hair color categories (red/reddish, blond, dark blond/light brown or brown/
black) and the presence of freckles at any time (Table 1). Skin sensitivity to
sun was self-assessed using the Fitzpatrick skin-type score35, where the lowest
score (I) represents very fair skin that is very sensitive to UVR and the
highest score (IV) represents dark skin that tans rather than burns in reaction
to UVR exposure. Individuals scoring I and II were classified as being sensitive
to sun and individuals scoring III and IV were classified as not being sensitive
to sun.
No objective measurements of pigmentation (for example, spectrophoto-
metry) were carried out. The benefits of the self-reported measurements are
that they are cheap and easy to collect, but their subjective nature is likely to
introduce misclassifications, leading to a loss of power in the discovery phase
and a decrease in prediction accuracy.
The Dutch sample. The SNPs with the most significant associations that were
identified in the genome-wide scans carried out on the Icelandic discovery
sample were genotyped and tested for association in a sample of 1,214 Dutch
individuals. The Dutch sample was composed of 696 males recruited for a
prostate cancer study36 and 518 females recruited for a breast cancer study by
the Radboud University Nijmegen Medical Centre (RUNMC) and through a
population-based cancer registry held by the Comprehensive Cancer Centre
IKO in Nijmegen. All individuals were of self-reported European ancestry.
The study protocol was approved by the Institutional Review Board of
Radboud University and all study subjects gave written informed consent
for the collection of questionnaire data on lifestyle, medical history and
family history.
As in the case of the Icelandic samples, information about pigmentation
traits for the Dutch sample was obtained through a questionnaire. The
questions about natural eye and hair color were the same as those in the
Icelandic questionnaire, with the addition of a category for an ‘other’ eye color.
A total of 5.9% of the Dutch participants selected this category and were
excluded from our analysis. Skin sensitivity to sun was assessed by two
questions about the tendency of individuals to burn or tan when exposed to
sun without sun block protection. The answers to these two questions were
used to create a dichotomized grouping of individuals according to sensitivity
to sun, corresponding to the grouping used for the Icelandic sample. Two
questions from the Dutch questionnaire assessed the density of freckles on the
face and arms, respectively. For the sake of comparison with the Icelandic data,
participants reporting freckles at either location were considered as having
freckles present, whereas those reporting absence of freckles at both locations
were considered to have no freckles. In addition, the Dutch questionnaire
included questions about skin color category (white, white with brownish tint
and light-brown), the number of naevi on the left forearm and the number of
serious sunburns in their lifetime.
Statistical methods. In the genome-wide association stage, Icelandic case and
control samples were assayed with the Infinium HumanHap300 SNP chips
(Illumina), containing 317,511 SNPs, of which 316,515 were polymorphic and
satisfied our quality criteria.
A likelihood procedure described in a previous publication37 was used for
the association analyses. Allele-specific ORs were calculated assuming a multi-
plicative model38. Results from multiple case-control groups were combined
using a Mantel-Haenszel model39. In Tables 2–4, P values for variants at MC1R,
TYR and OCA2 were calculated adjusting for the effect of the other variant at
that locus.
Pigmentation prediction. A model to predict eye and hair pigmentation was
created based on the Icelandic discovery sample (Fig. 2). A generalized linear
model, in which eye color was treated as a categorical response with three
categories and genotypes at all associated sequence variants were used as
covariates, was used to model eye color. A two-step model was used to
predict hair color. The first step involved predicting red hair and was based
solely on the MC1R coding variants. The second step involved modeling non-
red hair color as an ordinal variable, with dark-blond or light-brown hair lying
between the extremes of blond and brown or black hair. Eye and hair
pigmentation in the Icelandic and Dutch replication samples were then
predicted on the basis of the model parameters estimated in the Icelandic
discovery sample.
Correction for relatedness and genomic control. Some of the individuals in
the Icelandic case-control groups were related to each other, causing the w2 test
statistic to have a mean 41 and median 40.6752. We estimated the inflation
factor by using a previously described procedure in which we simulated
genotypes through the genealogy of 731,175 Icelanders40. For the initial
discovery samples, for which the genotypes for the 316,515 genome-wide SNPs
were available, we also estimated the inflation factor by using genomic controls
and calculating the average of the 316,515 w2 statistics and by computing the
median of the 316,515 w2 statistics and dividing it by 0.6752 as previously
described41,42. The inflation factors for the Icelandic discovery samples are
given in Supplementary Table 6 online.
Single SNP and microsatellite genotyping. SNP genotyping was carried out
using the Centaurus (Nanogen) platform43 in (Supplementary Table 7 online).
The quality of each Centaurus SNP assay was evaluated by genotyping each
assay in the CEU and/or YRI HapMap samples and comparing the results with
the HapMap data. Assays with mismatch rates of 41.5% were not used, and an
LD test was used for markers known to be in LD.
Controlling for population stratification. Most of the variants that show
significant association with pigmentation are also present in frequencies that
differ among European populations and between European, Asian and African
populations. These frequency differences are to be expected given the differ-
ences in pigmentation between the populations. However, if our method of
discovery were applied to a stratified sample of Europeans, without taking this
stratification into account, then variants with population frequencies that
correlate with pigmentation could show spurious association with pigmenta-
tion. We therefore carried out a series of tests to search for signs of stratifica-
tion, even though the Icelandic population has been relatively isolated
throughout its history.
First, we applied the method of genomic control to the analysis, which takes
into account the genome-wide inflation of the w2 statistics. The inflation factors
we observed were similar to inflation factors estimated from known relation-
ships between individuals, which suggests that the overall inflation due to
stratification is small (Supplementary Table 6).
Second, from a published set of 400 SNPs known to have differing
frequencies between European poulations44, we selected a subset of 97 SNPs
that are also present on the Illumina 317K Human Hap chip. We then tested for
LD between 4,417 pairs of markers on different chromosomes among 1,984
Icelanders who are unrelated to a meiotic distance of 3. Of the 4,417 pairs
tested, 225 had Po 0.05, compared with 220.8 expected, and 6 had Po 0.001,
compared with 4.4 expected. We also tested for LD between the 97 SNPs and
the 9 SNPs, resulting in 834 tests in which the two markers were not on the
same chromosome. Again we observed no significant excess of low P values (39
observed compared with 41 expected at P o 0.05 and 2 observed compared
with 0.8 expected at P o 0.001).
Third, the gene encoding lactase is well described and has a large degree of
variation between populations45, but no known association with pigmentation.
We chose the intragenic marker rs2322659 and tested its LD with the nine
SNPs that are associated with pigmentation (P4 0.01 in all instances). We also
carried out six tests for association of rs2322659 with pigmentation without
detecting any significant association.
Finally, we applied the EIGENSTRAT method46, which relies on patterns of
correlation between individuals to detect stratification, to our Icelandic
discovery sample. No evidence of substantial stratification was detected,
with the largest principal component estimated to explain 0.2% of the
overall variation of the data. The correction factors based on correcting for
the ten largest principal components are close to 1 (Supplementary Table 8
1 45 0 VOLUME 39 [ NUMBER 12 [ DECEMBER 2007 NATURE GENETICS
ART I C LES©
2007
Nat
ure
Pub
lishi
ng G
roup
ht
tp://
ww
w.n
atur
e.co
m/n
atur
egen
etic
s
online) and do not have any effect on our conclusions. Inspection of the first
few principal components suggests that they correspond to small sets of close
relatives, whose relationship had not been properly accounted for.
Assessing signals of positive selection. Evidence for the effect of positive
selection on the SNPs that are associated with pigmentation traits was
examined by applying two methods to the data from the HapMap project
(release 21; Supplementary Table 9 online)28. First, we examined whether the
degree of population divergence in allele frequencies among the HapMap
groups exceeded the expectations from neutral evolution. Under neutrality, the
frequencies of any particular allele in a population set are shaped by the
counteracting forces of genetic drift, gene flow and mutation, which constrain
the expected range of allele frequency differences between populations. When
the observed divergence between populations is in the upper extreme of the
expected range, or outside it, the neutral model may be rejected in favor of one
in which allele frequencies have been shaped by population differences in the
intensity of selective forces47.
The Wahlund FST statistic
FST ¼ varðpÞ�pð1 � �pÞ
was used to measure allele frequency differences between populations, where
var(p) represents the variance of the frequencies of an allele from a biallelic
SNP, and �p represents the average frequency of the allele among the populations
under consideration. This statistic was calculated for all HapMap SNPs
genotyped in at least two HapMap samples, with 3,020,798 SNPs yielding
FST values based on all three HapMap samples (CEU, YRI and ASN), and
3,064,337, 3,118,875 and 3,094,443 for the population pairs CEU-YRI, CEU-
ASN and YRI-ASN, respectively. For each combination of HapMap samples,
the SNPs were grouped into 50 bins according to the overall frequency of the
more common allele and using an interval of 0.01. To assess whether a
particular SNP showed an unusual degree of population divergence, the
percentile rank of each SNP’s FST value was determined within each bin for
each combination of HapMap samples.
The second method used to detect signals of positive selection is based on an
examination of the pattern of diversity within populations. Under neutrality,
there is an expected positive relationship between the frequency of an allele, its
age, its variability at linked sites and the extent to which LD with other loci
decays at increasing physical distance. Common alleles with unusually low
diversity at linked sites and/or slow decay of LD with increasing physical
distance represent probable targets of recent positive selection. We used the
relative extended haplotype homozygosity (rEHH) statistic to assess the
fragmentation of haplotypes around putative selected variants48. To simplify
the comparisons between different genomic regions, we calculated a single
irEHH value for each allele, representing the area beneath the line defined
by the rEHH point estimates that are obtained as haplotypes, extended in
both directions from the allele being tested (until the EHH value in both
directions has fallen below 0.05)49,50. Calculations were carried out for all
HapMap SNPs in the CEU HapMap sample with a minor allele frequency
41%, yielding irEHH values for a total number of 4,906,866 alleles. To make
comparisons of irEHH values meaningful between regions with different rates
of recombination, the positions of SNPs were defined in centimorgans for these
calculations (using recombination rate maps for phase II of the HapMap, which
are available at the International HapMap website). To determine whether a
particular irEHH value could be considered unusually great, thereby indicating
the action of positive selection, we grouped all HapMap SNPs of the same
frequency in the CEU HapMap group into separate bins and calculated the
percentile rank for each irEHH value within each of the bins.
Accession codes. GenBank: ASIP, NM_001672; HERC2, NM_004667; IRF4,
NM_002460; KITLG, NM_000899; MATP (SLC45A2), NM_001012509; MC1R,
NM_002386; OCA2, NM_000275; EXOC2, NM_018303; SLC24A4,
NM_153647; SLC24A5, NM_205850; TYR, NM_000372.
URLs. International HapMap website: http://www.hapmap.org/. Mouse Coat
Color Genes website (maintained by W.S. Oetting and D.C. Bennett, Interna-
tional Albinism Center): http://albinismdb.med.umn.edu/genes.htm.
Note: Supplementary information is available on the Nature Genetics website.
ACKNOWLEDGMENTSWe thank the study participants from Iceland and Holland whose contributionsmade this work possible. We also thank the nurses at Noatun (deCODE’s samplerecruitment center) and the personnel at the deCODE core facilities for their hardwork and enthusiasm. This work was funded in part by contract number 018827(Polygene) from the 6th Framework Program of the European Union.
AUTHOR CONTRIBUTIONP.S., D.F.G., A.H. and K.S. wrote the first draft of the paper. S.N.S., T.R., K.P.M.,A.K., F.J., B.S., K.T., R.R., K.R.B. and J.H.O. collected the Icelandic samples andphenotypes. K.K.A. and L.A.K. collected the Dutch samples and phenotypes.S.N.S., T.R., M.J. and U.T. carried out the genotyping. P.S., D.F.G., A.H., A.M.,A.P., G.T., S.S., S.P. and A.K. analyzed the data. P.S., D.F.G., S.N.S., A.H., F.J.,L.A.K., J.H.O., J.G., U.T. and K.S. planned, supervised and coordinated the work.All authors contributed to the final version of the paper.
COMPETING INTERESTS STATEMENTThe authors declare competing financial interests: details accompany the full-textHTML version of the paper at http://www.nature.com/naturegenetics/.
Published online at http://www.nature.com/naturegenetics
Reprints and permissions information is available online at http://npg.nature.com/
reprintsandpermissions
1. Relethford, J.H. Hemispheric difference in human skin color. Am. J. Phys. Anthropol.104, 449–457 (1997).
2. Sturm, R.A. A golden age of human pigmentation genetics. Trends Genet. 22,464–468 (2006).
3. Jablonski, N.G. & Chaplin, G. The evolution of human skin coloration. J. Hum. Evol.39, 57–106 (2000).
4. Sturm, R.A., Box, N.F. & Ramsay, M. Human pigmentation genetics: the difference isonly skin deep. Bioessays 20, 712–721 (1998).
5. Galton, F. Family-likeness in eye-colour. Nature 34, 137 (1886).6. Posthuma, D. et al. Replicated linkage for eye color on 15q using comparative ratings
of sibling pairs. Behav. Genet. 36, 12–17 (2006).7. Barsh, G.S. What controls variation in human skin color? PLoS Biol. 1, E27 (2003).8. Brauer, G. & Chopra, V.P. [Estimation of the heritability of hair and eye color.]
Anthropol. Anz. 36, 109–120 (1978).9. Bataille, V., Snieder, H., MacGregor, A.J., Sasieni, P. & Spector, T.D. Genetics of risk
factors for melanoma: an adult twin study of nevi and freckles. J. Natl. Cancer Inst. 92,457–463 (2000).
10. Eiberg, H. & Mohr, J. Major locus for red hair color linked to MNS blood groups onchromosome 4. Clin. Genet. 32, 125–128 (1987).
11. Hoekstra, H.E. Genetics, development and evolution of adaptive pigmentation invertebrates. Heredity 97, 222–234 (2006).
12. Valverde, P., Healy, E., Jackson, I., Rees, J.L. & Thody, A.J. Variants of the melanocyte-stimulating hormone receptor gene are associated with red hair and fair skin inhumans. Nat. Genet. 11, 328–330 (1995).
13. Rees, J.L. The genetics of sun sensitivity in humans. Am. J. Hum. Genet. 75,739–751 (2004).
14. Makova, K. & Norton, H. Worldwide polymorphism at the MC1R locus and normalpigmentation variation in humans. Peptides 26, 1901–1908 (2005).
15. Eiberg, H. & Mohr, J. Assignment of genes coding for brown eye colour (BEY2) andbrown hair colour (HCL3) on chromosome 15q. Eur. J. Hum. Genet. 4, 237–241(1996).
16. Sturm, R.A. & Frudakis, T.N. Eye colour: portals into pigmentation genes and ancestry.Trends Genet. 20, 327–332 (2004).
17. Frudakis, T. et al. Sequences associated with human iris pigmentation. Genetics 165,2071–2083 (2003).
18. Duffy, D.L. et al. A three-single-nucleotide polymorphism haplotype in intron 1 ofOCA2 explains most human eye-color variation. Am. J. Hum. Genet. 80, 241–252(2007).
19. Lamason, R.L. et al. SLC24A5, a putative cation exchanger, affects pigmentation inzebrafish and humans. Science 310, 1782–1786 (2005).
20. Norton, H.L. et al. Genetic evidence for the convergent evolution of light skin inEuropeans and East Asians. Mol. Biol. Evol. 24, 710–722 (2007).
21. Bonilla, C. et al. The 8818G allele of the agouti signaling protein (ASIP) gene isancestral and is associated with darker skin color in African Americans. Hum. Genet.116, 402–406 (2005).
22. Shriver, M.D. et al. Skin pigmentation, biogeographical ancestry and admixturemapping. Hum. Genet. 112, 387–399 (2003).
23. Lao, O., de Gruijter, J.M., van Duijn, K., Navarro, A. & Kayser, M. Signatures of positiveselection in genes associated with human skin pigmentation as revealed from analysesof single nucleotide polymorphisms. Ann. Hum. Genet. 71, 354–369 (2007).
24. McEvoy, B., Beleza, S. & Shriver, M.D. The genetic architecture of normal variation inhuman pigmentation: an evolutionary perspective and model. Hum. Mol. Genet. 15,R176–R181 (2006).
NATURE GENETICS VOLUME 39 [ NUMBER 12 [ DECEMBER 2007 1 45 1
ART I C LES©
2007
Nat
ure
Pub
lishi
ng G
roup
ht
tp://
ww
w.n
atur
e.co
m/n
atur
egen
etic
s

25. Myles, S., Somel, M., Tang, K., Kelso, J. & Stoneking, M. Identifying genes underlyingskin pigmentation differences among human populations. Hum. Genet. 120, 613–621(2007).
26. Williamson, S.H. et al. Localizing recent adaptive evolution in the human genome.PLoS Genet. 3, e90 (2007).
27. Lin, J.Y. & Fisher, D.E. Melanocyte biology and skin pigmentation. Nature 445,843–850 (2007).
28. International HapMap Consortium. A haplotype map of the human genome. Nature437, 1299–1320 (2005).
29. Wellcome Trust Case Control Consortium. Genome-wide association study of 14,000cases of seven common diseases and 3,000 shared controls. Nature 447, 661–678(2007).
30. Wehrle-Haller, B. The role of Kit-ligand in melanocyte development and epidermalhomeostasis. Pigment Cell Res. 16, 287–296 (2003).
31. Seitz, J.J., Schmutz, S.M., Thue, T.D. & Buchanan, F.C. A missense mutation in thebovine MGF gene is associated with the roan phenotype in Belgian Blue and Shorthorncattle. Mamm. Genome 10, 710–712 (1999).
32. Izagirre, N., Garcia, I., Junquera, C., de la Rua, C. & Alonso, S. A scan for signatures ofpositive selection in candidate loci for skin pigmentation in humans. Mol. Biol. Evol.23, 1697–1706 (2006).
33. Harding, R.M. et al. Evidence for variable selective pressures at MC1R. Am. J. Hum.Genet. 66, 1351–1361 (2000).
34. Gulcher, J.R., Kristjansson, K., Gudbjartsson, H. & Stefansson, K. Protection of privacyby third-party encryption in genetic research in Iceland. Eur. J. Hum. Genet. 8,739–742 (2000).
35. Fitzpatrick, T.B. The validity and practicality of sun-reactive skin types I through VI.Arch. Dermatol. 124, 869–871 (1988).
36. Gudmundsson, J. et al. Genome-wide association study identifies a second prostatecancer susceptibility variant at 8q24. Nat. Genet. 39, 631–637 (2007).
37. Gretarsdottir, S. et al. The gene encoding phosphodiesterase 4D confers risk ofischemic stroke. Nat. Genet. 35, 131–138 (2003).
38. Falk, C.T. & Rubinstein, P. Haplotype relative risks: an easy reliable way to constructa proper control sample for risk calculations. Ann. Hum. Genet. 51, 227–233(1987).
39. Mantel, N. & Haenszel, W. Statistical aspects of the analysis of data from retrospectivestudies of disease. J. Natl. Cancer Inst. 22, 719–748 (1959).
40. Grant, S.F. et al. Variant of transcription factor 7-like 2 (TCF7L2) gene confers risk oftype 2 diabetes. Nat. Genet. 38, 320–323 (2006).
41. Devlin, B. & Roeder, K. Genomic control for association studies. Biometrics 55,997–1004 (1999).
42. Devlin, B., Bacanu, S.-A. & Roeder, K. Genomic control to the extreme. Nat. Genet. 36,1129–1130 (2004).
43. Kutyavin, I.V. et al. A novel endonuclease IV post-PCR genotyping system. NucleicAcids Res. 34, e128 (2006).
44. Seldin, M.F. et al. European population substructure: clustering of northern andsouthern populations. PLoS Genet. 2, e143 (2006).
45. Bersaglieri, T. et al. Genetic signatures of strong recent positive selection at the lactasegene. Am. J. Hum. Genet. 74, 1111–1120 (2004).
46. Price, A.L. et al. Principal components analysis corrects for stratification in genome-wide association studies. Nat. Genet. 38, 904–909 (2006).
47. Beaumont, M.A. & Nichols, R.A. Evaluating loci for use in the genetic analysis ofpopulation structure. Proc. R. Soc. Lond. B 263, 1619–1626 (1996).
48. Sabeti, P.C. et al. Detecting recent positive selection in the human genome fromhaplotype structure. Nature 419, 832–837 (2002).
49. Helgason, A. et al. Refining the impact of TCF7L2 gene variants on type 2 diabetes andadaptive evolution. Nat. Genet. 39, 218–225 (2007).
50. Voight, B.F., Kudaravalli, S., Wen, X. & Pritchard, J.K. A map of recent positiveselection in the human genome. PLoS Biol. 4, e72 (2006).
1 45 2 VOLUME 39 [ NUMBER 12 [ DECEMBER 2007 NATURE GENETICS
ART I C LES©
2007
Nat
ure
Pub
lishi
ng G
roup
ht
tp://
ww
w.n
atur
e.co
m/n
atur
egen
etic
s