genetic control of agronomically important traits of ... · genetics and molecular research 9 (1):...
TRANSCRIPT

©FUNPEC-RP www.funpecrp.com.brGenetics and Molecular Research 9 (1): 113-127 (2010)
Genetic control of agronomically important traits of pepper fruits analyzed by Hayman’s partial diallel cross scheme
A.R. Schuelter1, G.M. Pereira2, A.T. Amaral Júnior3, V.W.D. Casali4,C.A. Scapim5, W.S. Barros6 and F.L. Finger4
1Laboratório de Biotecnologia, Universidade Paranaense, Toledo, PR, Brasil2Instituto de Ciências Exatas e Tecnologia,Universidade Federal do Amazonas, Itacoatiara, AM, Brasil3Laboratório de Genética e Melhoramento Vegetal,Universidade Estadual do Norte Fluminense Darcy Ribeiro,Campos dos Goytacazes, RJ, Brasil4Departamento de Fitotecnia, Universidade Federal de Viçosa, Viçosa, MG, Brasil5Departamento de Agronomia, Universidade Estadual de Maringá,Maringá, PR, Brasil6Departamento de Matemática e Estatística,Universidade Federal de Pelotas, Pelotas, RS, Brasil
Corresponding author: A.R. SchuelterE-mail: [email protected]
Genet. Mol. Res. 9 (1): 113-127 (2010)Received September 16, 2009Accepted October 23, 2009Published January 19, 2010
ABSTRACT. Pepper species of the genus Capsicum have been cultivated over centuries, producing both pungent and sweet fruit; the pungency is caused by alkaloids called capsaicinoids. Among the five cultivated species, Capsicum chinense is one of the most popular, being native to the Amazon basin. This species is characterized by a wide variety of fruit sizes, shapes and colors, with different capsaicinoid content. In addition, fruits are rich in vitamins A and C. Despite the importance of this plant as a spice and its medicinal uses, research on its genetic variability and potential for breeding programs is still incipient. We investigated the genetic control of some traits through diallel analysis

114
©FUNPEC-RP www.funpecrp.com.brGenetics and Molecular Research 9 (1): 113-127 (2010)
A.R. Schuelter et al.
with the objective of introgressing these traits into cultivated varieties. For the diallel analysis, the progeny of crosses between peppers with pungent and sweet fruits, together with the parents, were grown in pots under greenhouse conditions. The fruits were harvested and analyzed for the traits total fresh fruit mass, total dry fruit mass, percentage dry matter, total soluble solids, vitamin C content, fruit pungency, and number of seeds per fruit. Genetic variability was detected for all traits. In the diallel analysis, the additive-dominant model was considered to be adequate for total fresh fruit mass, percentage dry matter, total soluble solids, and vitamin C content. Additive genetic effects and dominance were found for all traits; consequently, breeding for improvement of these fruit traits would be viable.
Key words: Partial diallel analysis; Hayman methodology; Inheritance; Gene effect; Capsicum chinense
INTRODUCTION
Among the cultivated species of peppers, Capsicum chinense, native to the Amazon basin, possesses important commercial traits, particularly the peculiar pungency, which makes it a promising spice or processed condiment (Reifschneider, 2000; Moscone et al., 2003; Lannes et al., 2007). This species includes some of the hottest peppers in the world, such as habanero or Scotch Bonnet (Sudré et al., 2007).
The capsaicinoids produced by cells of the fruit placenta are responsible for the pungency (Díaz et al., 2004). The fact that C. chinense has no reproductive barrier against C. annuum, C. frutescens and C. baccatum (Bosland and Votava, 2000) makes the iden-tification of genetic factors of economic importance, the study of genetic control and the subsequent introgression into cultivated varieties in the species highly important. A study by Lannes et al. (2007) evaluated the accessions of the horticultural crops gene bank of the Universidade Federal de Viçosa (UFV/Brazil) for fruit traits, and promising sweet or pungent C. chinense accessions were identified to become part of a breeding program to improve the species.
The study for genetic control of quantitative traits of importance for genetic im-provement has been based on the establishment of a generation and diallel analysis. These genetic-statistical methodologies allow the evaluation of the gene that determines the trait under study, leading to conclusions about the existing types of gene action. Among the methods of diallel analysis, Cruz and Regazzi (1994) mention the one proposed by Griffing (1956), by which the effects and sums of squares of the effects of general and specific combining abilities are estimated. The method of Gardner and Eberhart (1966), which assesses the effects of varieties and varietal heterosis, and the method proposed by Hayman (1954a,b), which evaluates the effects on the basic inheritance mechanism of the trait under study, establishing genetic values of the parents used and of the limit for selection can be assessed.
The method of Hayman (1954a,b) is not based on previously established statistical models, but based on the knowledge of the nature of environmental and genetic statistics, such

115
©FUNPEC-RP www.funpecrp.com.brGenetics and Molecular Research 9 (1): 113-127 (2010)
Hayman’s partial diallel in pepper
as means, variance and covariance, obtained from the diallel analysis. However, for an appli-cation of the method, certain assumptions must be met, such as diploid segregation, parental homozygosis, lack of maternal effect, absence of multiple alleles, gene distribution among parents, and absence of epistasis. Moreover, the methodology proposed by Hayman (1954a,b) is not valid for a partial diallel, which by definition, represents the cross of a sample from a set of all possible crosses among the available parents (Cruz and Regazzi, 1994). However, Viana et al. (1999) adapted the method described by Hayman (1954a,b) for partial diallel analysis.
As the knowledge of the type of gene effects involved for the control of a trait directly interferes with gain by selection, the purpose of this study was to investigate the genetic con-trol of fruit traits of C. chinense by the diallel analysis proposed by Viana et al. (1999). This is the first report in the world using Hayman’s methodology in C. chinense.
MATERIAL AND METHODS
Plant material and cultivation conditions
Ten accessions of C. chinense (Table 1), including five pungent and five sweet (Lannes et al., 2007), were intercrossed as proposed by Greenleaf (1986), in a greenhouse at the Uni-versidade Paranaense - Campus Toledo (Paraná State/Brazil) in a partial diallel cross scheme, establishing all possible hybrids between the groups, except the backcrosses.
Accession Parent Group Collection site
BGH1716-17 P1 Pungent Pindaré-Mirim/MABGH4289-44 P2 Pungent Rondonópolis/MTBGH4733-54 P3 Pungent Manaus/AMBGH5012-72 P4 Pungent Água Branca/ALBGH7295-101 P5 Pungent Viçosa/MGBGH1716-16 P6 Sweet Pindaré-Mirim/MABGH4201-32 P7 Sweet Belém/PABGH4223-39 P8 Sweet IAC/SPBGH6233-85 P9 Sweet Brasília/DFBGH6378-98 P10 Sweet Boca do Janacanam/AM
Table 1. Accessions of Capsicum chinense used in the genetic analyses.
The genotypes of the F1 generations and the parents were sown in trays with commer-cial substrate and transplanted to 10-L pots after 60 days in a greenhouse of the Universidade Federal de Viçosa (UFV). The experiment was arranged in a completely randomized design with four replicates, with three plants in each experimental unit.
Evaluation of postharvest traits
The following fruit traits were evaluated: fresh fruit mass (FFM), dried fruit mass (DFM), percentage of dry matter (%DM), total soluble solids of ripe fruits (TSS), and number of seeds per fruit (NSF). Vitamin C content (VIT C) was analyzed using 2,6-dichloroindophenol reagent (Instituto Adolfo Lutz, 1985) and total fruit pungency (CAP) by a method proposed by Maillard et al. (1996) in previously oven-dried fruits. A total of five fruits were used for each analysis.

116
©FUNPEC-RP www.funpecrp.com.brGenetics and Molecular Research 9 (1): 113-127 (2010)
A.R. Schuelter et al.
Statistical analysis
Analysis of variance and means
Analysis of variance was performed for each of the traits, using the statistical model Υij = μ + Gi + εij, where Yij = observation of the ith genotype in the jth replication; μ = overall mean of the experiment; Gi = effect of ith genotype, and εij = effect of the experimental error. The coef-ficient of variation was then estimated for each trait, by the expression , where QMR = mean square of error and m = general mean of the experiment. The means from the C. chinense accessions were grouped by the Scott and Knott test (1974) at a probability of 5%.
Diallel analysis by the method of Hayman (1954a,b) modified by Viana et al. (1999)
The following statistics were initially estimated for diallel analysis: Vp (variance of the parental lines), Vi (variance in the ith row or column), (mean of the variances in the rows or columns), Vm (variance of the average of the rows), WCI (covariance of the column average and the ith row), Wi (covariance of parents and the ith row), and M2 (square of the difference between the overall average (ML1) and the parent average (ML0)).
To use the methodology described by Hayman (1954a), modified by Viana et al. (1999), it was necessary to test whether all fruit traits met the following assumptions: Mendelian inheritance and homozygous parents, and absence of reciprocal effect, epistatic interactions and multiple allelism. In addition, the genes should be randomly distributed among the parents. Jointly, possible flaws in the assumptions were verified by adequacy testing of the additive-dominant model as follows. The values of Wi and Vi were used to test the data fitting the additive-dominant model by: a) the variation of Wi - Vi was assessed by analysis of variance, testing the occurrence of differences in the values of this expression between the rows of the cross matrix; b) linear regression analysis of Wi in Vi, testing the significance of the angular coefficient of the straight line (H0:b = 1 vs Ha:b ≠ 1); c) weighting of Wi and Vi by 45° rotation of the axes represented by these statistics, and with the new values of Wi and Vi, the angular coefficient of the straight line was tested after the rotation (H0:b = 0 vs Ha:b ≠ 0).
After verifying the data fitting to the additive-dominant model, the interpretation of analysis of variance and the statistics obtained from the diallel table were used to estimate the components of genetic variation D1, D2, D3, H1, H2, h2, and F, where: D1, D2 and D3 are measures of genetic variation due to additive genetic effects of pungent or sweet parents and jointly, respectively; H1 and H2 are measures of variation due to dominance deviations; h2 is the genotypic coefficient of deter-mination; F is the measure of the mean covariance between additive and dominant genetic effects.
The significance of the different components of variation was verified by the t-test, by the division of the estimates according to the respective standard deviations. Estimates of genetic components of variation were divided by standard deviations, and significance was determined by the t-test, considering values greater than 1.96, at a significant probability of 5% (Singh and Chaudhary 1979; Ferreira, 1985).
The components of genetic variation were also used to estimate parameters, to inter-pret different aspects regarding the genetic nature of pungent and non-pungent parent groups. In this context, the following genetic parameters were estimated: - represents a mea-sure of the mean degree of dominance at all loci for each parent group from the diallel; - stands for a measure of the mean value of the products of positive and negative allele frequen-
117
©FUNPEC-RP www.funpecrp.com.brGenetics and Molecular Research 9 (1): 113-127 (2010)
Hayman’s partial diallel in pepper
cies of the loci with dominance for each group of parents, with a maximum value of 0.25, i.e., the ratio determines how the parents are distributed; is a measure of the type of allele with highest frequency, where a ratio close to 1 indicates an equal number of dominant and recessive alleles in the parental genotypes; this ratio was estimated for each parent group; the measure of the genotypic coefficient of de-termination in the strict sense, for each group of parents; is a measure of the genotypic coefficient of determination in the broad sense for each parent group.
Based on the regression analysis of Wi, the mean degree of dominance and genetic constitution of the parents were estimated in Vi. Therefore, in case of complete dominance the straight line intercepts the Wi at the origin; if dominance is incomplete, interception is above the origin; in the absence of dominance, the line touches the parabola, and in case of over domi-nance, the line intercepts the ordinate Wi below the origin. With regard to the ranking of the genotypes along the regression line, the parents with greater number of dominant alleles remain near the point of origin, while the opposite is true in case of a higher number of recessive genes.
All statistical analyses were performed using the GENES software (Cruz, 2006a,b).
RESULTS AND DISCUSSION
Analysis of variance and means
Based on analysis of variance of the variables, FFM, DFM, %DM, TSS, VIT C, NSF, and CAP (Table 2), evaluated in parents of C. chinense (Table 1) and the respective F1 hybrids, showed the occurrence of significant differences at 1% probability. When partitioning these treatments, and analyzing only the parents, all variables studied were significant at 1% probabil-ity. For 25 F1, all seven variables were significant at 5% probability. By contrasting the parents vs F1, a significant difference was found for the traits NSF and CAP only (at 1% probability).
Source variation Mean squares
d.f. FFM DFM %DM TSS VIT C NSF CAP
Treatment 34 32.59** 0.32** 23.47** 4.64** 785.70** 541.61** 31.69** Parent (P) 9 70.78** 0.71** 463.65** 5.79** 700.04* 562.38** 47.65** F1 24 19.57** 0.18** 16.69** 4.354** 850.56** 412.53** 22.57** P vs F1 1 1.42ns 0.02ns 4.57ns 1.29ns 0.01ns 3452.58** 106.95**Error 105 1.01 0.01 1.37 0.80 315.79 180.66 1.25CV% 18.39 15.87 7.92 9.84 17.09 26.35 25.39General mean 5.45 0.74 14.78 9.10 10.39 59.99 4.39
d.f. = degrees of freedom; FFM: total fresh fruit mass (g); DFM: total dry fruit mass (g); %DM: percentage of dry matter; TSS: total soluble solids (°Brix); VIT C: vitamin C (mg/100 g fresh fruit pulp); NSF: number of seeds per fruit; CAP: total capsaicinoids (mg/g). CV = coefficient of variation. **Significant at 1% probability by the F-test.
Table 2. Summary of analysis of variance of fruit traits of Capsicum chinense.
For the variable FFM, the parent P9 (BGH6233-85) from the non-pungent group had a higher average (12.8 g) than the other accessions, at 5% probability by the Scott-Knott test. It was also observed that P10 (BGH6378-98) and P8 (BGH4223-39), both non-pungent as well, had the second highest value (11.1 and 9.8 g, respectively) and were statistically identical to each other at 5% probability. Furthermore, the pungent accessions P1 (BGH1716-17), P2 (BGH4289-44), P4 (BGH5012-72), and P5 (BGH7295-101) were statistically similar, having

118
©FUNPEC-RP www.funpecrp.com.brGenetics and Molecular Research 9 (1): 113-127 (2010)
A.R. Schuelter et al.
lower values (2.81, 1.68, 1.49, and 1.32 g, respectively). On the other hand, P3 (BGH4733-54) had a higher average compared to the other pungent peppers but was similar to that of P6 (BGH1716-16) and P7 (BGH4201-32). These results are consistent with the majority of pungent peppers, which in general terms indicate that they have less weight than the sweet ones. However, genetic variation was demonstrated for the trait, i.e., fruits differ in fresh mass.
For the trait DFM (Tables 2 and 3), the accessions P8 (BGH4223-39), P9 (BGH6233-85) and P10 (BGH6378-98) from the sweet pepper group had statistically the highest averages (1.16, 1.25 and 1.38 g, respectively). This result compared with FFM indicates that higher fresh fruit mass does not necessarily result in higher dry mass. Also, the parent P3 (BGH4733-54) (pun-gent), together with the parents P6 (BGH1716-16) and P7 (BGH4201-32) (non-pungent) had the second highest averages (0.75, 0.70 and 0.77 g, respectively). The parents P1 (BGH1716-17), P2 (BGH4289-44), P4 (BGH5012-72), and P5 (BGH7295-101), all pungent, had statistically the low-est means (0.42, 0.32, 0.26, and 0.24 g, respectively) and were equal to each other at 5% probability.
Parents Means
FFM DFM %DM TSS VIT C NSF CAP
P1 (BGH1716-17) 2.81d 0.42c 15.08c 10.02a 103.57b 39.10b 5.52bP2 (BGH4289-44 1.68d 0.32c 20.85a 10.46a 81.15b 34.99b 6.08bP3 (BGH4733-54) 5.47c 0.75b 13.73c 8.64b 123.33a 48.85a 4.86cP4 (BGH5012-72) 1.49d 0.26c 17.87b 10.00a 102.55b 34.15b 4.06cP5 (BGH7295-101) 1.32d 0.24c 18.35b 9.32a 120.40a 32.50b 9.51aP6 (BGH1716-16) 4.71c 0.70b 14.85c 9.50a 97.95b 60.95a 0.01dP7 (BGH4201-32) 4.94c 0.77b 15.67c 10.87a 117.65a 33.75b 0.03dP8 (BGH4223-39) 9.78b 1.16a 11.88d 7.95b 99.72b 63.75a 0.01dP9 (BGH6233-85) 12.83a 1.25a 9.80e 6.90c 101.76b 49.50a 0.02dP10 (BGH6378-98) 11.07b 1.38a 12.60d 8.85b 91.28b 33.90b 0.02d
Table 3. Summary of the Scott-Knott cluster analysis at 5% probability for the parents of the diallel.
FFM: total fresh fruit mass (g); DFM: total dry fruit mass (g); %DM: percentage of dry matter; TSS: total soluble solids (°Brix); VIT C: vitamin C (mg/100 g fresh fruit pulp); NSF: number of seeds per fruit; CAP: total capsaicinoids (mg/g). Same letters represent equal means at 5% probability by the Scott-Knott test.
For %DM (Tables 2 and 3), the pungent pepper P2 (BGH4289-44) had significantly higher level of dry matter (20.85%) than did the other parents, at 5% probability. It was also observed that the parents P4 (BGH5012-72) and P5 (BGH7295-101), both pungent, had the second highest percentage of dry matter content (17.87 and 18.35%, respectively), statistically equal to each other at 5% probability. Parent P9 (BGH6233-85), non-pungent, had a signifi-cantly lower percentage (9.80%) compared to all other parents in the study, at 5% probability. These results show that pungent accessions have lower water content than sweet peppers. In addition, they indicate the existence of genetic variability for this trait of economic interest.
A comparison of TSS (Tables 2 and 3) showed that the pungent accessions P1 (BGH1716-17), P2 (BGH4289-44), P4 (BGH5012-72), and P5 (BGH7295-101), and non-pungent peppers, P6 (BGH1716-16) and P7 (BGH4201-32), had higher °Brix values (10.02, 10.46, 10.00, 9.32, 9.50, and 10.87, respectively), compared to the other parents. Parent P3 (BGH4733-54), pungent, and parents P8 (BGH4223-39) and P10 (BGH6378-98), which are non-pungent, had the next highest mean (8.64, 7.95 and 8.85 °Brix, respectively), which were statistically equal to each other, at 5% probability. The lowest average of total soluble solids (6.90 °Brix) was observed for P9 (BGH6233-85) a non-pungent accession, at 5% probability.

119
©FUNPEC-RP www.funpecrp.com.brGenetics and Molecular Research 9 (1): 113-127 (2010)
Hayman’s partial diallel in pepper
The variable VIT C (Tables 2 and 3) as evident in the analysis of variance (Table 1) showed significant differences in the F-test, at 5% probability. VIT C content ranged from 81.15 to 123.33 mg/100 g fresh pulp. The pungent accessions P3 (BGH4733-54) and P5 (BGH7295-101) as well as P7 (BGH4201-32) contained the highest levels of this vitamin.
For the trait NSF (Tables 2 and 3), the pungent parent P3 (BGH4733-54) and sweet peppers P6 (BGH1716-16), P8 (BGH4223-39) and P9 (BGH6233-85) had the highest aver-ages (48.85, 60.95, 63.75, 49.50, respectively), being superior to the other parents, which were statistically equal to each other, at 5% probability. Also the pungent parents P1 (BGH1716-17), P2 (BGH4289-44), P4 (BGH5012-72), and P5 (BGH7295-101) and non-pungent acces-sions, the parents P7 (BGH4201-32) and P10 (BGH6378-98) had the lowest average number of seeds per fruit (39.10, 34.99, 34.15, and 32.50, respectively, for pungent) and (33.75 and 33.90, respectively, for non-pungent), which were statistically equal to each other, at 5% prob-ability. This result demonstrates the differential capacity of the accessions for production.
For the trait CAP (Tables 2 and 3), the group of pungent parents, P1 (BGH1716-17), P2 (BGH4289-44), P3 (BGH4733-54), P4 (BGH5012-72), and P5 (BGH7295-101), had a sta-tistically higher content of capsaicinoids (mg/g dry weight) than did the group of non-pungent parents P6 (BGH1716-16), P7 (BGH4201-32), P8 (BGH4223-39), P9 (BGH6233-85), and P10 (BGH6378-98). P5 (BGH7295-101) of the pungent group had statistically the highest mean of total capsaicinoids (9.51 mg/g dry weight) at 5% probability. However, when com-paring the traits of this parent to the others, it appears that the fruits that are in fact the most pungent, have the lowest FFM and DFM. In the case of pungent fruit with good dry matter yield, the accessions P1 (BGH1716-17) and P2 (BGH4289-44) are indicated.
The data of the fruit traits showed that genetic variability does exist among this group of C. chinense accessions. However, the nature of genetic variation must be verified by a dial-lel analysis before use of these accessions in a breeding program.
Hayman diallel analysis modified by Viana et al. (1999)
To use the diallel analysis by the method of Hayman (1954a,b) adapted by Viana et al. (1999), the fitting of the dominant model was tested for the traits FFM, DFM, %DM, TSS, VIT C, NSF, and CAP. The data fitting was tested by applying analysis of variance and regression analysis (Table 4). The results revealed that, except for DFM, NSF and CAP, the genetic model was achieved for the other traits in at least two tests.
Trait ANOVA (Wi - Vi)1 Regression [Wi = 1/4(D - H1) + bVi]
2
MS lines b t (Ho: b = 1) t2 (Ho: b’ = 0)
FFM 25.25** 0.65 ± 0.47 -2.29ns 1.35ns
DFM 0.001** 0.58 ± 0.38 -3.46* 2.25ns
%DM 10.48** 0.71 ± 0.16 -2.05ns 1.17ns
TSS 1.45** 0.66 ± 0.06 -4.29** 2.15ns
VIT C 36912.67** 0.58 ± 0.17 -2.45* 1.27ns
NSF 139.17ns -0.14 ± 0.31 -3.68** 0.34*
CAP 2.07ns -0.11 ± 0.08 -13.16** 5.52**
Table 4. Tests of adequacy of the additive dominant model based on analysis of variance of the values of Wi - Vi and on the linear regression analysis of Wi, as related to Vi, for the traits total fresh fruit mass (FFM), total dry fruit mass (DFM), percentage of dry matter (%DM), total soluble solids (TSS), vitamin C (VIT C), number of seeds per fruit (NSF), and total capsaicinoids (CAP).
** and *: significant at 1 and 5% probability, respectively, by the F-test. ns: not significant at 5% probability (1F-test; 2t-test); t2: t-test, weighting the mean values of Wi and Vi by a rotation of 45o.

120
©FUNPEC-RP www.funpecrp.com.brGenetics and Molecular Research 9 (1): 113-127 (2010)
A.R. Schuelter et al.
The components of genetic and non-genetic variation traits that fitted the additive-dominant model were estimated (Table 5). For the FFM trait, significance for component D1 was found, indicating the importance of additive genetic effects for pungent parents, which was not verified for accessions with sweet fruits. For the genetic components H1 and H2, there was lack of significance by the t-test at 5% probability, indicating the absence of dominance for FFM. This result was confirmed by the lack of significance for the F value of each group, i.e., F (pung) and F (sweet). However, the significant estimates of F value for each group revealed the existence of pungent accessions with greater predominance of dominant alleles (FP2, FP4 and FP5), while accession P3 (BGH4733-54) had a higher frequency of recessive alleles (FP3).
CGEV Traits
FFM DFM %DM TSS VIT C
D1 2.75 ± 1.48ns -0.21 ± 0.01* 7.65 ± 0.81* 0.26 ± 0.24ns 285.48 ± 73.46*
D2 13.20 ± 1.48* -0.16 ± 0.01* 5.30 ± 0.81* 2.02 ± 0.24* 94.97 ± 73.46ns
D3 26.91 ± 2.45* 0.04 ± 0.02ns 14.85 ± 1.35* 1.25 ± 0.40* 159.29 ± 121.82ns
F(P1) -5.32 ± 4.38ns -0.58 ± 0.04* -2.35 ± 2.41ns -0.84 ± 0.72ns 340.56 ± 217.92ns
F(P2) 8.90 ± 4.38* -0.46 ± 0.04* -14.83 ± 2.41* -6.14 ± 0.72* 230.64 ± 217.92ns
F(P3) -9.10 ± 4.38* -0.59 ± 0.04* -3.53 ± 2.41ns -0.45 ± 0.72ns -74.91 ± 217.92ns
F(P4) 9.20 ± 4.38* -0.45 ± 0.04* -6.98 ± 2.41* -0.62 ± 0.72ns 312.22 ± 217.92ns
F(P5) 17.85 ± 4.38* -0.39 ± 0.04* 6.05 ± 2.41* 0.90 ± 0.72ns 162.83 ± 217.92ns
F(P6) 4.65 ± 4.38ns -0.45 ± 0.04* 0.16 ± 2.41ns -0.97 ± 0.72ns 684.03 ± 217.92*
F(P7) 1.94 ± 4.38ns -0.48 ± 0.04* 1.26 ± 2.41ns -2.32 ± 0.72* 314.79 ± 217.92ns
F(P8) -9.79 ± 4.38* -0.61 ± 0.04* 5.06 ± 2.41* 0.82 ± 0.72ns -575.50 ± 217.92*
F(P9) -8.76 ± 4.38* -0.55 ± 0.04* 6.14 ± 2.41* 0.46 ± 0.72ns -258.22 ± 217.92ns
F(P10) -9.05 ± 4.38* -0.58 ± 0.04* 0.99 ± 2.41ns 0.61 ± 0.72ns -335.51 ± 217.92ns
H1(pung) 6.17 ± 5.95ns -1.19 ± 0.05* 3.18 ± 3.27ns 0.31 ± 0.98ns 491.20 ± 295.68*
H1(sweet) 3.54 ± 5.95ns -1.21 ± 0.05* 3.54 ± 3.27ns 0.29 ± 0.98 ns 689.54 ± 295.68*
H2(P1) 4.10 ± 5.83ns -0.76 ± 0.05* 2.13 ± 3.20ns 0.28 ± 0.96ns 280.93 ± 289.41ns
H2(P2) 2.41 ± 5.83ns -0.77 ± 0.05* 1.57 ± 3.20ns 0.37 ± 0.96 ns 548.98 ± 289.41*
H2(P3) 4.56 ± 5.83ns -0.76 ± 0.05* 1.99 ± 3.20ns 0.19 ± 0.96ns 527.78 ± 289.41*
H2(P4) 2.38 ± 5.83ns -0.77 ± 0.05* 1.79 ± 3.20ns 0.42 ± 0.96ns 241.57 ± 289.41ns
H2(P5) 2.98 ± 5.83ns -0.77 ± 0.05* 4.82 ± 3.20ns 0.25 ± 0.96ns 308.42 ± 289.41ns
H2(P6) 5.67 ± 8.83ns -0.74 ± 0.05* 3.32 ± 3.20ns 0.21 ± 0.96ns 438.03 ± 289.41*
H2(P7) 3.24 ± 5.83ns -0.77 ± 0.05* 2.44 ± 3.20ns 0.66 ± 0.96ns 315.74 ± 289.41ns
H2(P8) 2.27 ± 5.83ns -0.77 ± 0.05* 2.32 ± 3.20ns 0.13 ± 0.96ns 474.22 ± 289.41*
H2(P9) 3.09 ± 5.83ns -0.77 ± 0.05* 2.41 ± 3.20ns 0.44 ± 0.96ns 324.98 ± 289.41ns
H2(P10) 2.15 ± 5.83ns -0.77 ± 0.05* 1.81 ± 3.20ns 0.07 ± 0.96ns 354.72 ± 289.41ns
h2 0.06 ± 4.23ns -0.14 ± 0.04* 0.50 ± 2.32ns 0.04 ± 0.70ns -0.14 ± 209.81ns
E 0.25 ± 3.83ns 0.25 ± 0.01* 0.25 ± 0.57ns 0.25 ± 0.17ns 0.25 ± 51.94 ns
F (pung) 4.30 ± 3.50ns -0.49 ± 0.03* -4.32 ± 1.92* -1.43 ± 0.58* 194.27 ± 173.84ns
F (sweet) -4.20 ± 3.50ns -0.53 ± 0.03* 2.72 ± 1.92ns -0.28 ± 0.58ns -34.08 ± 173.84ns
H2 (médium) 3.28 ± 3.84ns -0.76 ± 0.03* 2.46 ± 2.10ns 0.30 ± 0.63ns 381.54 ± 190.43*
Table 5. Estimation of the component of genetic and environmental variations (CGEV) with the respective standard deviations of the traits total fresh fruit mass (FFM), percentage of dry matter (%DM), total soluble solids (TSS), and vitamin C (VIT C).
*Estimate of the components divided by the respective standard deviation; when >1.96, significant at 5% probability; ns = not significant.
By estimating degree of dominance (Table 6), the alleles that control DFM in the par-ents with pungent and sweet fruits had over dominance and partial dominance, respectively.

121
©FUNPEC-RP www.funpecrp.com.brGenetics and Molecular Research 9 (1): 113-127 (2010)
Hayman’s partial diallel in pepper
Figures 1 and 2 show that the line intersects the ordinate above the origin, suggesting the occurrence of partial dominance in both parent groups. Based on the KD/KR ratio (Table 6), we concluded that for the FFM trait the dominant alleles are present in greater frequency in the pungent parents, while the opposite is true for accessions with sweet fruits. This result can be confirmed with the estimation of the symmetry (S) of the parents, indicating the occurrence of asymmetry for accessions with sweet fruits (SD = 0.13) compared to those with pungent fruit (SP = 0.23). However, the genetic parameter that estimates the direction of dominance (DD) had a value close to zero, revealing the occurrence of bidirectional dominance. According to Viana et al. (1999), this value approaches zero when the number of dominant genes with positive effects is found at the same frequency as those that are also dominant, but have negative effects.
Trait Genetic parameters
FFM 1.50 0.52 0.23 0.13 1.92 0.32 0.001 0.96 0.68%DM 0.64 0.82 0.19 0.17 0.33 1.76 0.04 0.95 0.65TSS 1.07 0.38 0.26 0.24 0.52 0.34 0.04 0.80 0.45VIT C 1.31 2.69 0.14 0.19 2.22 0.912 0.01 0.99 0.37
Table 6. Estimates of genetic parameters for traits total mass of fresh fruit (FFM), total weight of dried fruit (DFM), percentage of dry matter (%DM), total soluble solids (TSS), and vitamin C (VIT C), according to the methodology described by Viana et al. (1999).
Figure 1. Regression of Wi in Vi for fresh fruit mass of Capsicum chinense accessions with pungent fruits [1 = P1 (BGH1716-17); 2 = P2 (BGH4289-44); 3 = P3 (BGH4733-54); 4 = P4 (BGH5012-72); 5 = P5 (BGH7295-101)].

122
©FUNPEC-RP www.funpecrp.com.brGenetics and Molecular Research 9 (1): 113-127 (2010)
A.R. Schuelter et al.
The C. chinense accessions P1 (BGH1716-17) and P3 (BGH4733-54) with the two highest values for fresh fruit weight (FFM) also had the highest number of recessive alleles, because they are farther away from the region of the regression graph of Wi in Vi (Figure 1 and Table 3). This result was also confirmed for the sweet peppers, where the accessions P8 (BGH4223-39), P9 (BGH6233-85) and P10 (BGH6378-98), which had the highest means, also had the same behavior. Therefore, the recessive alleles are important to increase fresh fruit weight, regardless of whether the fruit is pungent or non-pungent.
The genetic parameters, D1 and D2, were significant at 5% probability by the t-test for the %DM trait, indicating the importance of the additive component of genetic variance (Table 5). The occurrence of a positive value for the difference between D1 and D2 allowed the conclusion that the genes that determine %DM, in the pungent group, do not have the same frequency as in parents with sweet fruits. In addition to that, the genetic variability in pungent parents is higher than in the non-pungent group. Estimates of the mean values for the products of allele frequencies, in both groups of peppers, supported the above inference. In parents from both groups (Table 6), a tendency of asymmetry (SP = 0.19 and SD = 0.17) was observed. Since there is a significant difference between the means of pungent and non-pungent parents (data not shown), we can conclude that the genes that control the increase in the percentage of dry matter have a frequency of less than ½ in both groups. However, the pungent group has a higher number of favorable alleles that determine the increase in magnitude of this trait, therefore explaining their greater genetic variability.
The F values for the %DM trait (Table 5), considering the two parent groups, allowed the inference that on average, pungent peppers have a higher number of recessive than of domi-nant alleles. This result was corroborated by calculating the KD/KR = 0.33 ratio (Table 6). In rela-tion to the individual estimates, it appears that the parents P2 (BGH4289-44), P4 (BGH5012-72) and P5 (BGH7295-101) had the highest number of recessive alleles. On the other hand, despite the absence of a significant difference in F of the parents with non-pungent fruits, P8 (BGH4223-39) and P9 (BGH6233-85) had a higher proportion of dominant alleles that determine the %DM trait (Table 5). This result is in agreement with the estimate of the KD/KR = 1.76 ratio (Table 6).
Figure 2. Regression of Wi in Vi for fresh fruit mass of Capsicum chinense accessions with non-pungent fruits [1 = P6 (BGH1716-16); 2 = P7 (BGH4201-32); 3 = P8 (BGH4223-39); 4 = P9 (BGH6233-85); 5 = P10 (BGH6378-98)].
123
©FUNPEC-RP www.funpecrp.com.brGenetics and Molecular Research 9 (1): 113-127 (2010)
Hayman’s partial diallel in pepper
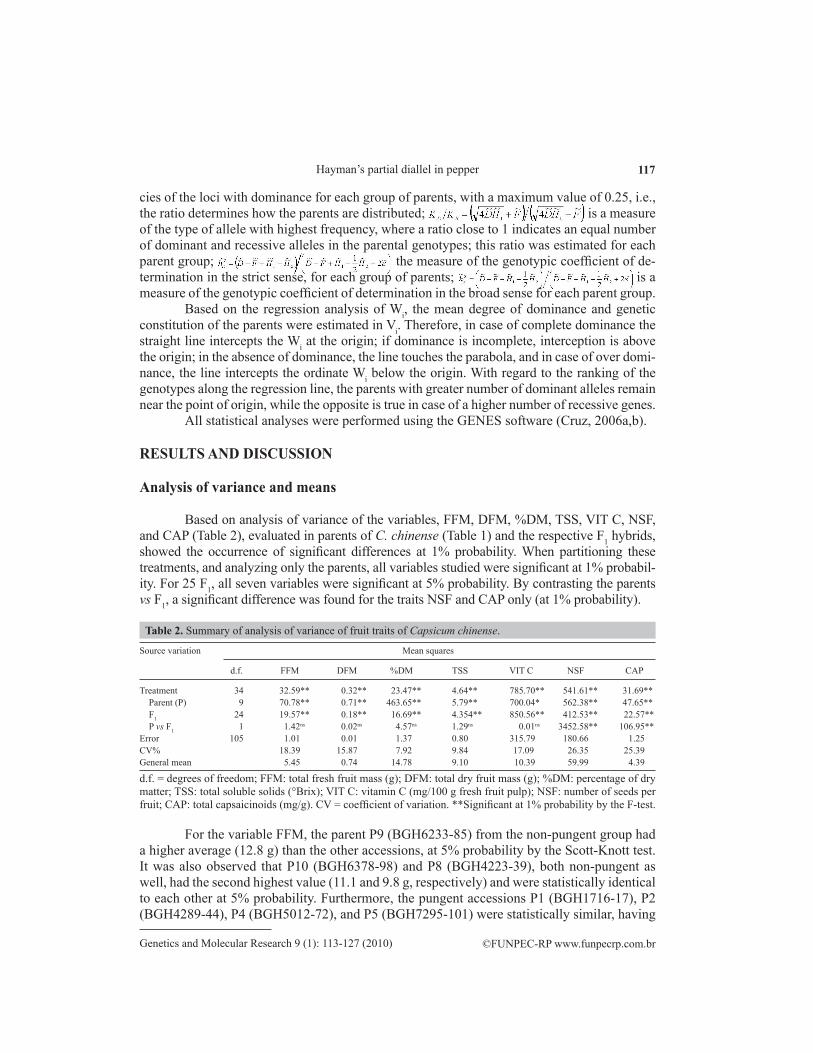
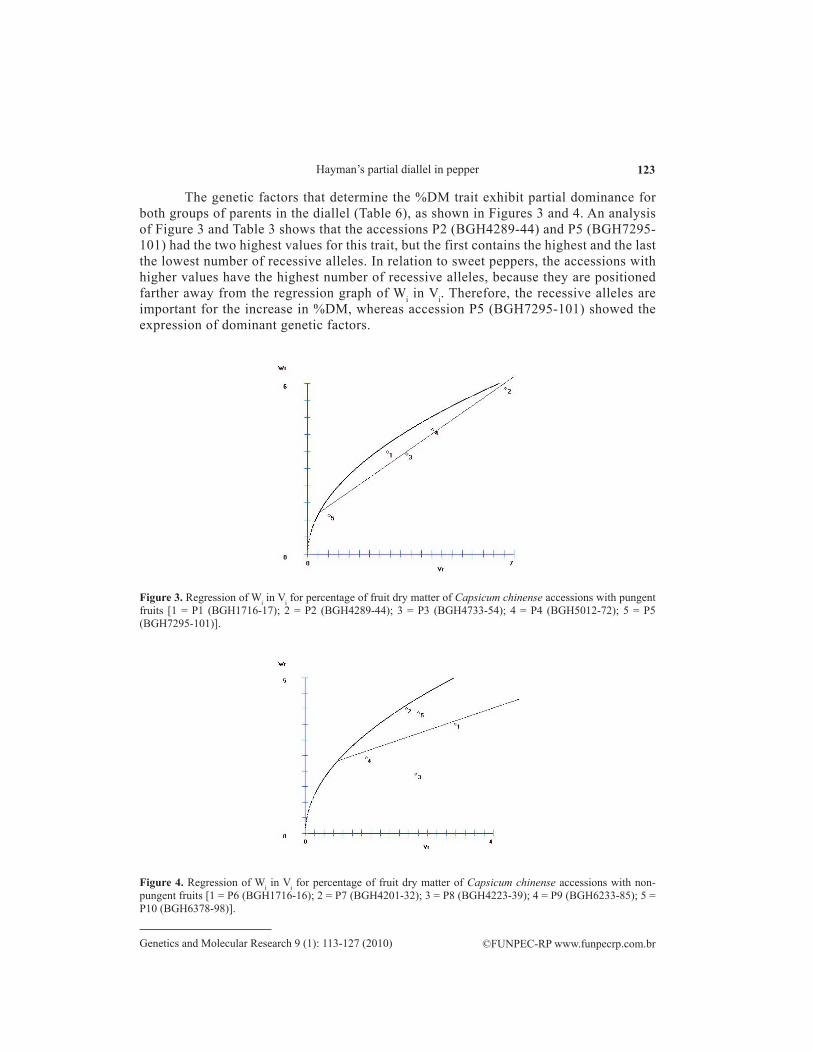
The genetic factors that determine the %DM trait exhibit partial dominance for both groups of parents in the diallel (Table 6), as shown in Figures 3 and 4. An analysis of Figure 3 and Table 3 shows that the accessions P2 (BGH4289-44) and P5 (BGH7295-101) had the two highest values for this trait, but the first contains the highest and the last the lowest number of recessive alleles. In relation to sweet peppers, the accessions with higher values have the highest number of recessive alleles, because they are positioned farther away from the regression graph of Wi in Vi. Therefore, the recessive alleles are important for the increase in %DM, whereas accession P5 (BGH7295-101) showed the expression of dominant genetic factors.
Figure 3. Regression of Wi in Vi for percentage of fruit dry matter of Capsicum chinense accessions with pungent fruits [1 = P1 (BGH1716-17); 2 = P2 (BGH4289-44); 3 = P3 (BGH4733-54); 4 = P4 (BGH5012-72); 5 = P5 (BGH7295-101)].
Figure 4. Regression of Wi in Vi for percentage of fruit dry matter of Capsicum chinense accessions with non-pungent fruits [1 = P6 (BGH1716-16); 2 = P7 (BGH4201-32); 3 = P8 (BGH4223-39); 4 = P9 (BGH6233-85); 5 = P10 (BGH6378-98)].

124
©FUNPEC-RP www.funpecrp.com.brGenetics and Molecular Research 9 (1): 113-127 (2010)
A.R. Schuelter et al.
The results for TSS (Table 5) show that the components associated with additive ef-fects (D1 and D3) were more relevant than those associated with the effects of dominance (h2, H1 and H2). In this context, despite the absence of a significant difference for the genetic parameter D1, which is associated with the variances and co-variances estimated in pungent parents, it should be noted that in the joint assessment (D3), the additive gene effects for this trait proved to be important. The average degree of dominance (Table 6) for the pungent and non-pungent parents was estimated at 1.07 and 0.38, respectively. This result shows the exis-tence of complete dominance among the alleles in the control of this trait in pungent parents, and dominance for the accessions with sweet fruits, which could also be verified by the fact that the regression line of Wi in Vi intercepts the ordinate above the origin (Figures 5 and 6). However, the DD values (in Table 6) show evidence of bidirectional dominance.
Figure 5. Regression of Wi in Vi for total soluble solids of Capsicum chinense accessions with pungent fruits [1 = P1 (BGH1716-17); 2 = P2 (BGH4289-44); 3 = P3 (BGH4733-54); 4 = P4 (BGH5012-72); 5 = P5 (BGH7295-101)].
Figure 6. Regression of Wi in Vi for total soluble solids of Capsicum chinense accessions with non-pungent fruits [1 = P6 (BGH1716-16); 2 = P7 (BGH4201-32); 3 = P8 (BGH4223-39); 4 = P9 (BGH6233-85); 5 - P10 (BGH6378-98)].

125
©FUNPEC-RP www.funpecrp.com.brGenetics and Molecular Research 9 (1): 113-127 (2010)
Hayman’s partial diallel in pepper
The estimates of the ratio for the TSS trait for both parent groups were approximately ½ (Table 6), indicating that the favorable or unfavorable alleles are symmetrically distributed in the par-ents generation. In addition, it is noteworthy, by the interpretation of the component of genetic varia-tion F (Table 5) that in the mean, for the group of pungent parents, there is a greater proportion of re-cessive than dominant alleles because the F (pung) estimate is negative. This result can be confirmed by the calculation of the KD/KR = 0.52 ratio. When the F values are compared for each parent, the accessions P2 (BGH4289-44) and P7 (BGH4201-32) have the highest number of recessive alleles.
In the analysis of the graphs generated by the regression analysis of Wi in Vi for the TSS trait (Figures 5 and 6), the accessions P2 (BGH4289-44) and P7 (BGH4201-32) had the highest number of recessive alleles of all pungent and non-pungent peppers. Moreover, the same accessions contained the highest contents of total soluble solids, indicating the impor-tance of recessive alleles in the expression of the trait.
The additive genetic (D1) and dominance effects [H1 (pung), H1 (sweet) and H2 (medium)] for the VIT C contents were significant in C. chinense fruits (Table 5). The difference between the values of additive genetic and the dominance components was below zero, indicating a greater im-portance of genetic effects due to dominance. Furthermore, the high values of H1 (pung) and H1 (sweet) showed a high contribution of dominance to expression of the trait. For the H2 component, significance was determined for P2 (BGH4289-44), P3 (BGH4733-54), P6 (BGH1716-16), and P8 (BGH4223-39), showing evidence of the significance of dominance for VIT C in these parents. The H2 values of the parents of the two groups did not have the same magnitude, which according to Viana et al. (1999) is due to the fact that the gene frequencies are not equally distributed within each group. It should be further mentioned that the allele frequency of P2 (BGH4289-44) and P6 (BGH1716-16) is lower than the mean of the group to which they belong. This can be verified by the calculation of the
ratio (Table 6), indicating the occurrence of asymmetry for both groups of parents. In terms of the mean degree of dominance (Table 6), over dominance was inferred for
the genes that govern VIT C content in C. chinense fruits, in both parent groups, for pungent and sweet fruits. The graph in Figure 7 confirms this result, where the straight line intersects the ordinate below the origin.
Figure 7. Regression of Wi in Vi for vitamin C of Capsicum chinense accessions with pungent fruits [1 = P1 (BGH1716-17); 2 = P2 (BGH4289-44); 3 = P3 (BGH4733-54); 4 = P4 (BGH5012-72); 5 = P5 (BGH7295-101)].

126
©FUNPEC-RP www.funpecrp.com.brGenetics and Molecular Research 9 (1): 113-127 (2010)
A.R. Schuelter et al.
The KD/KR ratio (Table 6) illustrates that the group of parents with sweet fruits had more dominant than recessive alleles. For pungent parents the recessive alleles were more abundant. By interpretation of the F values no predominance of one particular allele type was detected between mean of F (pung) and F (sweet). However, by individual analysis, P6 (BGH1716-16) and P8 (BGH4223-39) had the highest and lowest number of dominant alleles, respectively. This result can be seen in Figure 8. Furthermore, by the analysis of mean values, P8 (BGH4223-39) had the highest average among the parents with sweet fruits, while P6 (BGH1716-16) had the lowest mean. Similarly, in the group of pungent parents, the accessions with the highest means for VIT C were also found to have the highest number of recessive alleles.
Figure 8. Regression of Wi in Vi for vitamin C of Capsicum chinense accessions with non-pungent fruits [1 = P6 (BGH1716-16); 2 = P7 (BGH4201-32); 3 = P8 (BGH4223-39); 4 = P9 (BGH6233-85); 5 = P10 (BGH6378-98)].
The diallel analysis proposed by Viana et al. (1999) showed that the additive and dom-inance gene effects are important in the determination of the traits FFM, %FFM and TSS for Capsicum chinense. The increases in the magnitude for FFM, %DM and TSS are determined by recessive genetic factors. Besides, parents P5 (BGH7295-101) and P9 (BGH6233-85) had the highest number of dominant alleles among the pungent and non-pungent parents, respec-tively. The highest number of recessive alleles was found in the pungent P2 (BGH4289-44) and non-pungent parent P8 (BGH4223-39).
REFERENCES
Bosland PW and Votava E (2000). Peppers: Vegetable and Spice Capsicum. CABI Publishing, New York.Cruz CD (2006a). Programa Genes: Estatística Experimental e Matrizes. Editora UFV (Universidade Federal de Viçosa),
Viçosa.Cruz CD (2006b). Programa Genes: Biometria. Editora UFV (Universidade Federal de Viçosa), Viçosa.Cruz CD and Regazzi AJ (1994). Modelos Biométricos Aplicados ao Melhoramento Genético. Imprensa Universitária,
Viçosa.Díaz J, Pomar F, Bernal A and Merino F (2004). Peroxidases and the metabolism of capsaicin in Capsicum annuum L.
Phytochem. Rev. 3: 141-157.

127
©FUNPEC-RP www.funpecrp.com.brGenetics and Molecular Research 9 (1): 113-127 (2010)
Hayman’s partial diallel in pepper
Ferreira PE (1985). On Jinks-Hayman’s analysis of half diallels. Rev. Bras. Gen. 8: 149-155.Gardner CO and Eberhart AS (1966). Analysis and interpretation of the variety cross diallel and related populations.
Biometrics 22: 439-452.Greenleaf WH (1986). Pepper Breeding. In: Breeding Vegetable Crops (Basset MJ, ed.). AVI Publishing, Connecticut, 69-134.Griffing B (1956). Concept of general and specific combining ability in relation to diallel crossing system. Aust. J. Biol.
Sci. 9: 462-493. Hayman BI (1954a). The analysis of variance of diallel crosses tables. Biometrics 10: 235-244.Hayman BI (1954b). The theory and analysis of diallel crosses. Genetics 39: 789-809.Instituto Adolfo Lutz (1985). Normas Analíticas do Instituto Adolfo Lutz; Métodos Químicos e Físicos para Análises de
Alimentos. Instituto Adolfo Lutz, São Paulo.Lannes SD, Finger FL, Schuelter AR and Casali VWD (2007). Growth and quality of Brazilian accessions of Capsicum
chinense fruits. Sci. Horticult. 112: 266-270.Maillard MN, Giampaoli P and Richard HMJ (1996). Analysis of eleven capsaicinoids by reversed-phase high performance
liquid chromatography. Flavour Frag. J. 12: 409-413.Moscone EA, Baranyi M, Ebert I, Greilhuber J, et al. (2003). Analysis of nuclear DNA content in Capsicum (Solanaceae)
by flow cytometry and Feulgen densitometry. Ann. Bot. 92: 21-29.Reifschneider FJB (2000). Capsicum: Pimentas e Pimentões no Brasil. Embrapa Comunicação para Transferência de
Tecnologia: Embrapa Hortaliças, Brasília.Scott AJ and Knott M (1974). A cluster analysis method for grouping means in the analysis of variance. Biometrics 30:
507-512.Singh RK and Chaudhary BD (1979). Biometrical Methods in Quantitative Analysis. Kalyani Publishers, New Delhi.Sudré CP, Leonardecz E, Rodrigues R, Amaral Júnior AT, et al. (2007). Genetic resources of vegetable crops: a survey
in the Brazilian germplasm collections pictured through papers published in the journals of the Brazilian Society for Horticultural Science. Hortic. Bras. 25: 496-503.
Viana JMS, Cruz CD and Cardoso AA (1999). Theory and analysis of partial diallel crosses. Genet. Mol. Biol. 22: 591-599.