genetic architecture of fungal disease...
TRANSCRIPT

GENETIC ARCHITECTURE OF FUNGAL DISEASE TRAITS IN LOBLOLLY PINE
By
GOGCE CEREN KAYIHAN
A DISSERTATION PRESENTED TO THE GRADUATE SCHOOL OF THE UNIVERSITY OF FLORIDA IN PARTIAL FULFILLMENT
OF THE REQUIREMENTS FOR THE DEGREE OF DOCTOR OF PHILOSOPHY
UNIVERSITY OF FLORIDA
2006

Copyright 2006
by
Gogce Ceren Kayihan

Dedicated to my family and my cats

iv
ACKNOWLEDGMENTS
This study could not have become a reality without the hard work of many talented
and smart people who funded, designed the project and physically worked in the field, so
I would like to take this opportunity to thank them all. I would not be able to do any of
this work without the help from my advisors Dr. Timothy L. White, Dr. John M. Davis,
Dr. Dudley A. Huber, Dr. Dana Nelson and Dr. Rongling Wu who were extremely
patient, giving and kind. I would like to thank Davis lab members who worked with me
day/night and always kept their sense of humor to get all of us through very hot days in
the greenhouse.
My family, the Kayihans although thousands of miles away, had never left me
alone and endured all my frustration and depression with me, I can’t imagine going
through this without their support. I would also like to mention my lovely cats Kouketsu
and Suki who were my only family here for the last 5 years and Shinsetsu, Cakal, late
Takashi and Tsubasa who were always in my heart.
My friends, who laughed with me, cooked for me, watched weird TV shows with
me and made the PhD process much lighter on my shoulders. I also want to take this
opportunity to thank my therapists who helped me break a lot of waves.
Last but certainly not the least I would like to thank Stefan Crynen for all the
support he has given during the last very stressful months.
v
TABLE OF CONTENTS page
ACKNOWLEDGMENTS ................................................................................................. iv
LIST OF TABLES........................................................................................................... viii
LIST OF FIGURES ........................................................................................................... ix
ABSTRACT....................................................................................................................... xi
CHAPTER
1 INTRODUCTION ........................................................................................................1
2 GENETIC DISSECTION OF FUSIFORM RUST AND PITCH CANKER DISEASE TRAITS IN LOBLOLLY PINE..................................................................6
Introduction...................................................................................................................6 Materials and Methods .................................................................................................8
Genetic Material, Plant Propagation, and Experimental Design...........................8 Pitch Canker: Inoculations and Data Collection ...................................................9 Fusiform Rust: Inoculations and Data Collection ...............................................11 Estimation of Genetic Parameters .......................................................................12 Genetic Correlations............................................................................................14
Results.........................................................................................................................15 Pitch Canker Disease Resistance is Heritable .....................................................15 Two Distinct Inoculation Procedures Reveal Similar Heritabilities for Lesion
Length ..............................................................................................................17 Disease Traits Associated with Fusiform Rust are Independently Inherited ......17 Host Genes Underlying Resistance to Pitch Canker and Fusiform Rust are
Independent......................................................................................................22 Efficiency of Using Multiple Ramets per Genotype ...........................................22
Discussion...................................................................................................................24 Genetic variation for pitch canker resistance ......................................................24 Gall score and gall length are the most heritable fusiform rust traits..................26 Resistance to pitch canker and fusiform rust are under the control of two
different mechanisms .......................................................................................28 Phenotyping for disease trait dissection in loblolly pine.....................................29
vi
3 FUSIFORM RUST RESISTANCE COSEGREGATES WITH AN FR1-LINKED MARKER AND REVEALS VARIABLE PENETRANCE OF THE DISEASE PHENOTYPE.............................................................................................................30
Introduction.................................................................................................................30 Materials and Methods ...............................................................................................32
Genetic Material ..................................................................................................32 Genotyping Families 0 and 1 for Fr1 ..................................................................32 Greenhouse screen...............................................................................................33 Field.....................................................................................................................35 Data Analysis.......................................................................................................35 Genetic Correlations............................................................................................38 Asymptotic Z-test ................................................................................................39
Results.........................................................................................................................40 Inheritance of Fusiform Rust Resistance in the Greenhouse and Field...............40 Validation of Fr1 marker.....................................................................................41 The Genetic Basis for “Escape Rate”..................................................................44
Discussion...................................................................................................................47 Agreement Among Greenhouse and Field Screens.............................................47 Marker-trait Cosegregation for Fusiform Rust Disease Resistance ....................49 Penetrance of the Fusiform Rust Disease Phenotype ..........................................50 Pathogen Infection in an Ecologically Relevant Setting .....................................52
4 TRANSCRIPT PROFILING REVEALS POTENTIAL MECHANISMS OF FUSIFORM RUST DISEASE DEPENDENT SHIFTS IN PINE STEM DEVELOPMENT.......................................................................................................54
Introduction.................................................................................................................54 Materials and Methods ...............................................................................................55
Plant Material, Genotyping and Harvesting ........................................................55 Fungal Material and Inoculation .........................................................................56 Microarray ...........................................................................................................56 Statistical Analysis ..............................................................................................57
Results.........................................................................................................................60 Discussion...................................................................................................................66
Transcription Profiling Reveals Differential Gene Expression...........................67 Influences of Fusiform Rust Disease Development on Gene Profiles .........69
5 CONCLUSION...........................................................................................................73
APPENDIX
A SAS SCRIPTS FOR MICROARRAY ANALYSIS ..................................................75
B ASREML SCRIPT FOR ASYMTOTIC Z-TEST ......................................................78
C HEALTHY VS. DISEASED GENE LIST.................................................................79

vii
D GENES THAT ARE REGULATED ACROSS TIME ..............................................89
E MICROARRAY PROCEDURE ..............................................................................108
Indirect Incorporation of Cy Dyes............................................................................108 Hybridization ............................................................................................................112
LIST OF REFERENCES.................................................................................................116

viii
LIST OF TABLES
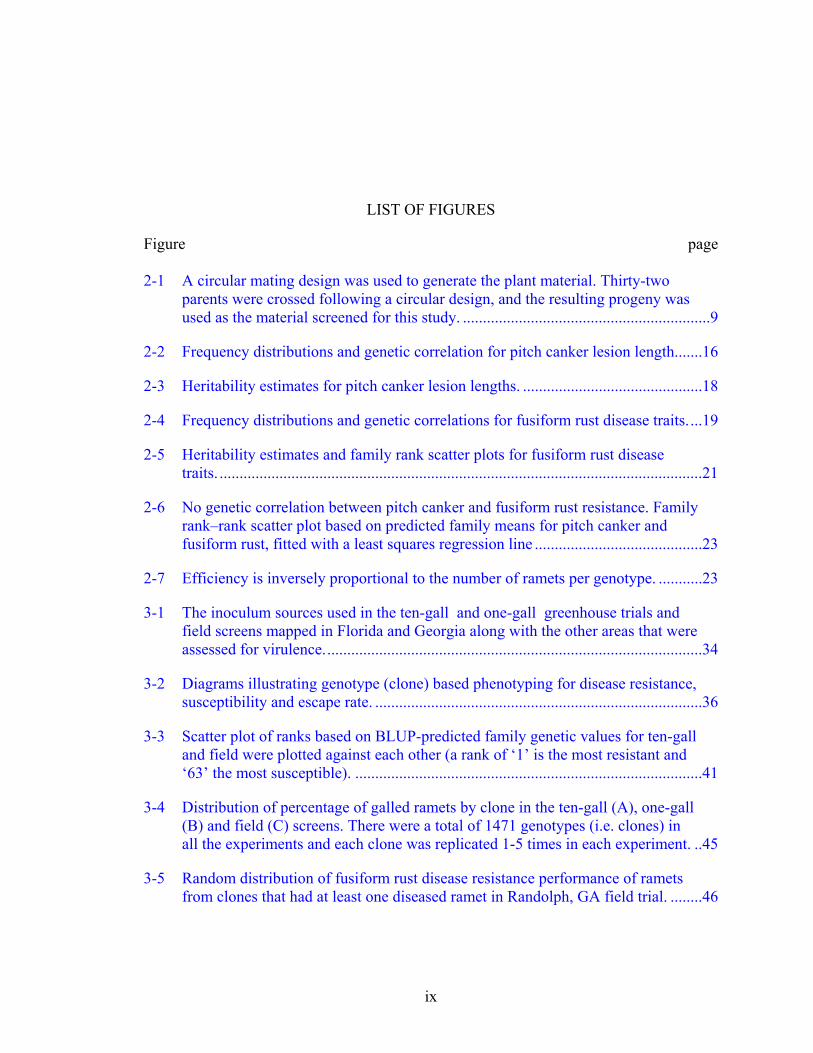
Table page 2-1 Summary of the four inoculation experiments reported in this study ......................10
3-1 Summary of the greenhouse and field screens reported in this study. The 63 families and most of the clones screened were the same across the ten gall, one gall and field screens. ...............................................................................................33
3-2 Summary of score (disease incidence) and escape rate datasets along with narrow sense heritabilities (h2) and broad sense heritability (H2) for escape rate and score in ten-gall, one-gall and field fusiform rust screens.................................40
3-3 Segregation of marker J7_485A linked to Fr1 gene in families 0 and 1 across ten-gall, one-gall and field screens (658 ramets combined) with disease phenotype. Parent number 17 is heterozygous for pathotype-specific resistance gene Fr1. ..................................................................................................................43
ix
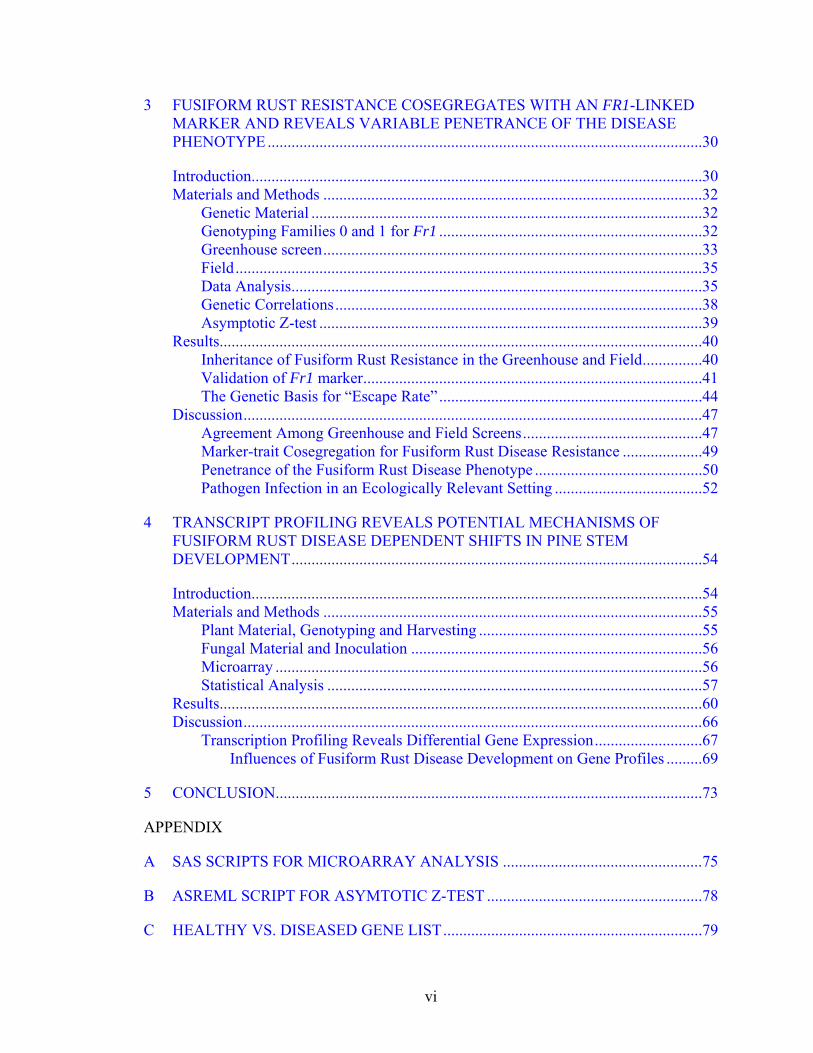
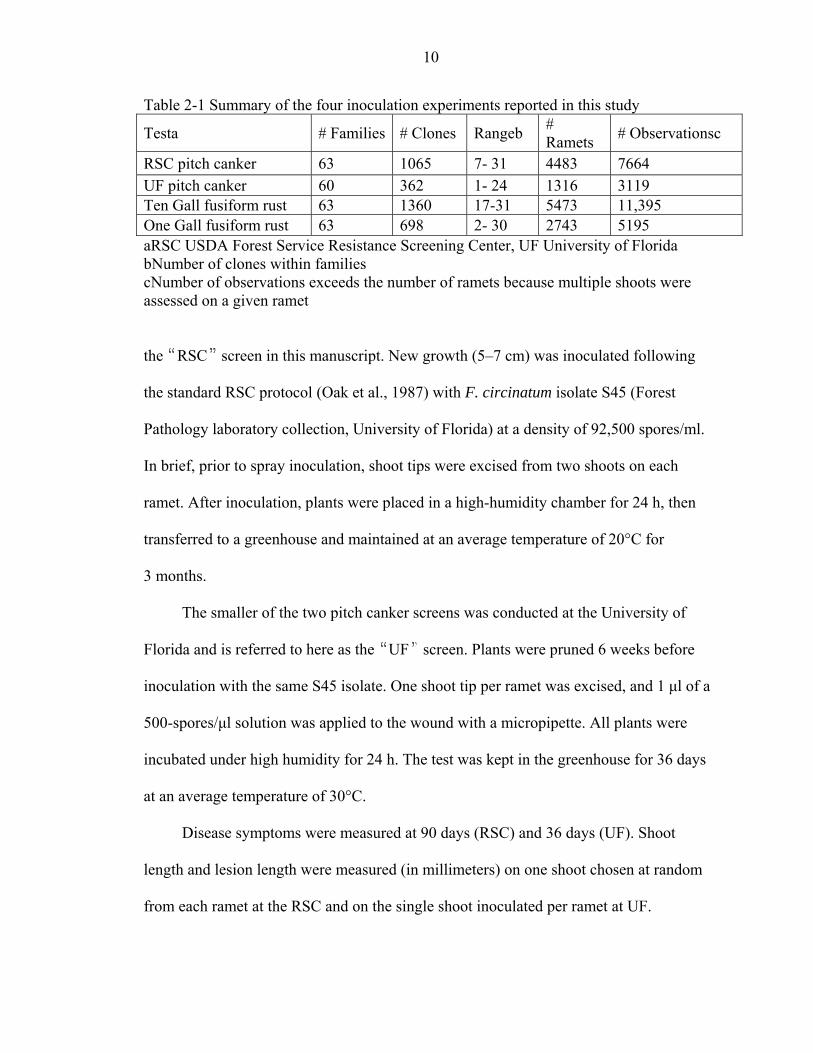
LIST OF FIGURES
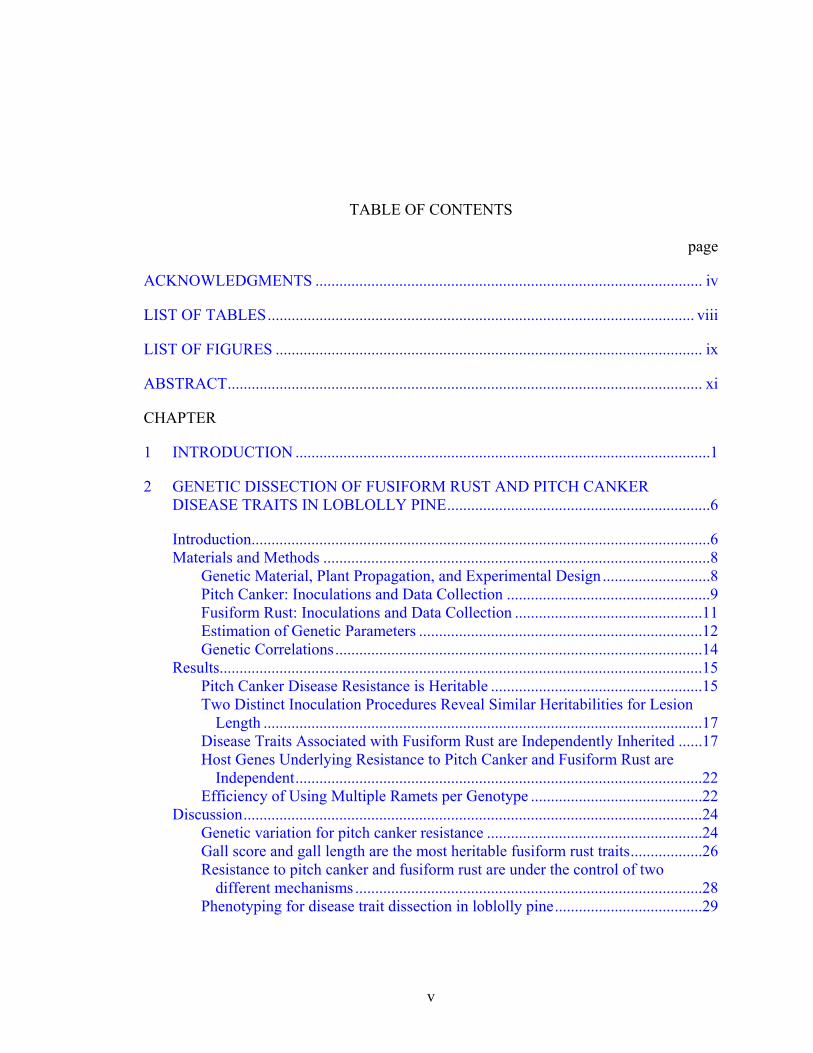
Figure page 2-1 A circular mating design was used to generate the plant material. Thirty-two
parents were crossed following a circular design, and the resulting progeny was used as the material screened for this study. ..............................................................9
2-2 Frequency distributions and genetic correlation for pitch canker lesion length.......16
2-3 Heritability estimates for pitch canker lesion lengths. .............................................18
2-4 Frequency distributions and genetic correlations for fusiform rust disease traits....19
2-5 Heritability estimates and family rank scatter plots for fusiform rust disease traits. .........................................................................................................................21
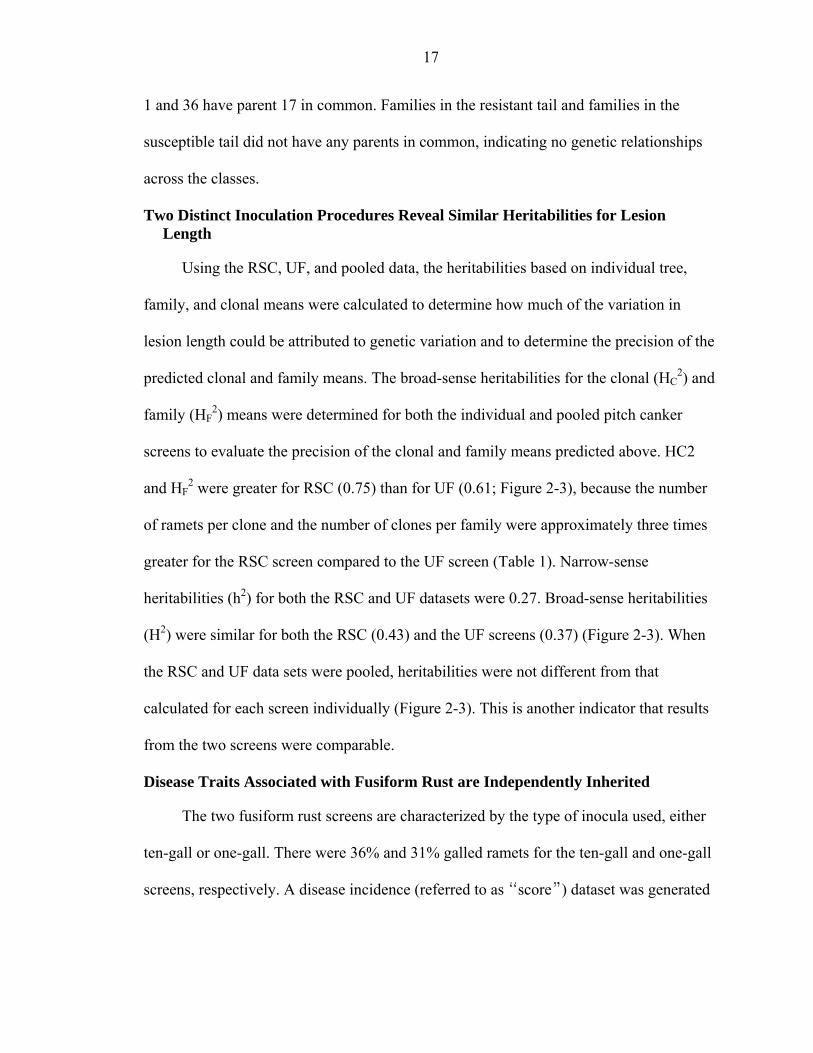
2-6 No genetic correlation between pitch canker and fusiform rust resistance. Family rank–rank scatter plot based on predicted family means for pitch canker and fusiform rust, fitted with a least squares regression line ..........................................23
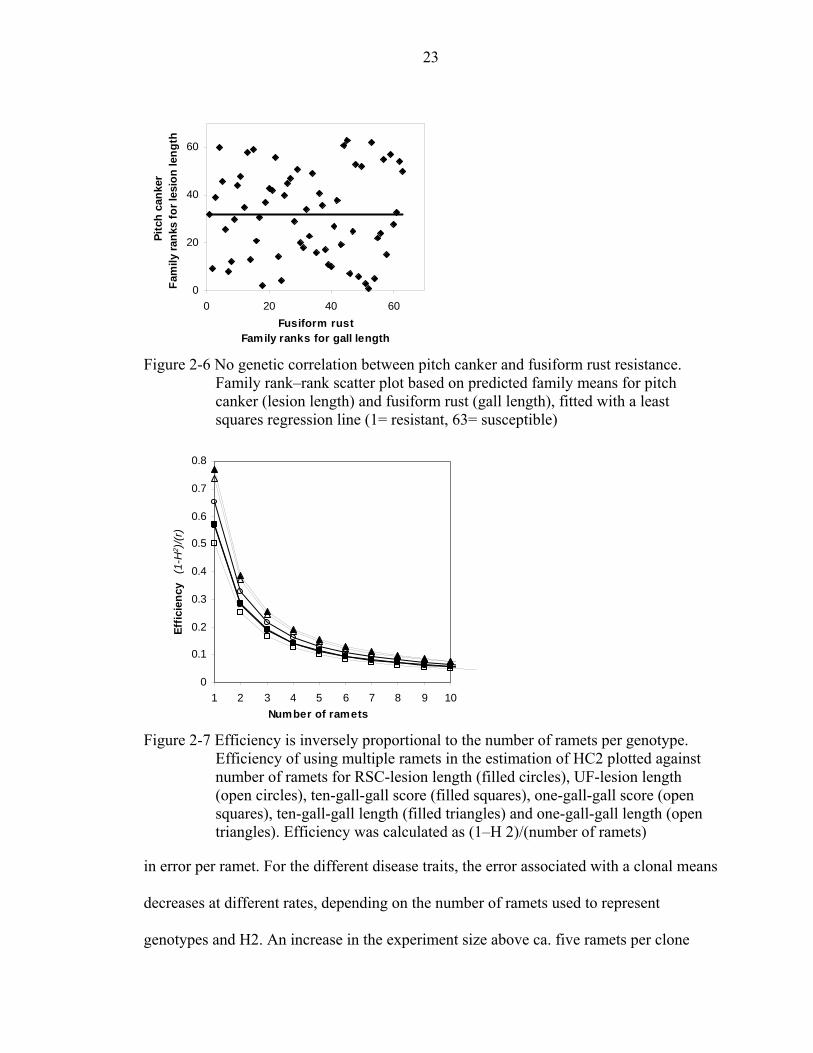
2-7 Efficiency is inversely proportional to the number of ramets per genotype. ...........23
3-1 The inoculum sources used in the ten-gall and one-gall greenhouse trials and field screens mapped in Florida and Georgia along with the other areas that were assessed for virulence...............................................................................................34
3-2 Diagrams illustrating genotype (clone) based phenotyping for disease resistance, susceptibility and escape rate. ..................................................................................36
3-3 Scatter plot of ranks based on BLUP-predicted family genetic values for ten-gall and field were plotted against each other (a rank of ‘1’ is the most resistant and ‘63’ the most susceptible). .......................................................................................41
3-4 Distribution of percentage of galled ramets by clone in the ten-gall (A), one-gall (B) and field (C) screens. There were a total of 1471 genotypes (i.e. clones) in all the experiments and each clone was replicated 1-5 times in each experiment. ..45
3-5 Random distribution of fusiform rust disease resistance performance of ramets from clones that had at least one diseased ramet in Randolph, GA field trial. ........46

x
4-1 Flow chart illustrating the procedure to identify significant and biologically interesting gene expression profiles. ANOVA was performed for each of the 3705 genes................................................................................................................59
4-2 Analyses of mean gene expression data support 27 distinct profile groups, “A” through “AA.” ..........................................................................................................61
4-3 Genes with the same expression profile in all treatment combinations were predominantly induced during the first time interval...............................................62
4-4 Profile groups can be categorized into biologically interesting clusters with distinct changes in gene expression patterns............................................................64
4-5 Clustergram of gene profile differences (or contrasts) between diseased and healthy treatments.. ..................................................................................................65

xi
Abstract of Dissertation Presented to the Graduate School of the University of Florida in Partial Fulfillment of the Requirements for the Degree of Doctor of Philosophy
GENETIC ARCHITECTURE OF FUNGAL DISEASE TRAITS IN LOBLOLLY PINE By
Gogce Ceren Kayihan
August 2006
Chair: Timothy L. White Cochair: John M. Davis Major Department: Forest Resources and Conservation
In the southeastern United States, loblolly pine (Pinus taeda L) is the most
common tree species covering nearly 13.4 hectares in southern United States with over 1
billion seedlings produced every year. This popular pine species bring $30 billion and
110,000 jobs to the region. However, two endemic fungal diseases are threatening this
productive view: fusiform rust incited by Cronartium quercuum Berk. Miyable ex Shirai
f. sp. fusiforme and pitch canker incited by Fusarium circinatum Nirenberg et O’Donnell.
Loblolly pine is not totally susceptible to these diseases and it has been shown by many
researchers, using natural and artificial inoculations, that loblolly pine families show
genetic variation in resistance to both fusiform rust and pitch canker diseases. Precision
was acquired by a combination of clonal propagation, which allows repeat observations
of the same genotypes and the use of a mixed linear model (GAREML) to adjust for
environmental effects. In the first part of this study, I identified traits, clones, families,
and parents that guide a genetic approach to dissecting disease traits in loblolly pine. I

xii
verified that pitch canker and fusiform rust traits are heritable and identified the disease
traits that are genetically distinct from one another. Second, I used DNA marker
information that was developed in previous mapping studies to distinguish host
genotypes that carry/lack the pathotype-specific Fr1 allele. I tested the hypothesis that the
Fr1 allele is predictive of resistance in greenhouse and field experiments. Because these
studies involved clonally propagated materials, I also quantified the extent to which
genetic and non-genetic factors influence disease expression levels and escape rate in
greenhouse and field trials. Finally, I used gene expression data obtained from a very
complex design of microarray experiments using diseased and healthy loblolly pine
clones from a family that is segregating for Fr1, to identify genes that are differentially
regulated in diseased and healthy individuals. I contrasted gene expression in diseased
and healthy individuals over a time frame of 4 months. Together, these studies revealed
the genetic architecture of fusiform rust disease resistance in scales ranging from the
population level to the molecular level.

1
CHAPTER 1 INTRODUCTION
Forests cover one-third of the earth’s terrestrial surface and provide social,
economical and environmental benefits (FAO, 2006). Pine is a dominant plant species in
Europe, Asia and America and has been used both as source for forest products and as a
model organism to study wood formation (Lev-Yadun and Sederoff, 2000). In the
southeastern United States, loblolly pine (Pinus taeda L) is the most common tree species
covering nearly 13.4 hectares in southern United States (Schultz, 1999) with over 1
billion seedlings planted every year (McKeand et al., 2003). This popular pine species
brings $30 billion and 110,000 jobs to the region (Schultz, 1999). In addition, loblolly
pine plantation and natural forests offer habitat for many diverse species, control erosion,
improve water quality, provide recreation and sustain rural communities.
As management of loblolly pine plantations intensive to maximize product yield,
new problems started to emerge in production of healthy loblolly pine. Among these
problems, two endemic fungal diseases attracted the attention of many researchers and
breeders: fusiform rust (incited by Cronartium quercuum Berk. Miyable ex Shirai f. sp.
fusiforme) (Burdsall and Snow, 1977) and pitch canker (incited by Fusarium circinatum
Nirenberg et O’Donnell) (Nirenberg and ODonnell, 1998). Loss of millions of dollars
(Cubbage et al., 2000) pushed breeders and researchers to investigate fusiform rust, one
of the most economically destructive diseases of the southeastern United States. It is
incited by Cronartium quercuum, a biotrophic pathogen that alternates its life cycle with
pine and oak as hosts.

2
Fusiform shaped galls on pine hosts are the major symptom of fusiform rust. As
disease progresses through the years these infections may take the form of sunken
cankers. Galls on stems decrease the wood quality and sometimes kill the plant (Schmidt,
1998). Both specific resistance, i.e., “gene-for-gene” interactions (Powers, 1980; Stelzer
et al., 1997; Wilcox et al., 1996), and partial resistance in the form of short galls (Schmidt
et al., 2000) have been demonstrated for the C. quercuum- pine pathosystem. Loblolly
pine is not totally susceptible to this disease and it has been shown by many researchers,
using natural and artificial inoculations, that loblolly pine families show genetic variation
in resistance to fusiform rust (Kuhlman and Powers, 1988; McKeand et al., 1999).
The pitch canker disease is not as economically important as fusiform rust in
southeastern United States although it can damage southern pine plantations sporadically
in the USA and it is an important problem for Pinus radiata in California (Storer et al.,
2002). In the southeastern United States seedling production can be severely hampered
by this disease (Dwinell et al., 1985). The pitch canker inciting agent, F. circinatum, is a
necrotrophic fungus that survives on dead tissues. A successful infection results in
symptoms like resinous lesions on stems and branches that cause seedling mortality and
decreased growth rates and crown die-back of plantation trees (Dwinell et al. 1985).
Although genetic variation among loblolly pine families (Kuhlman et al., 1982) and
clones (Dwinell and Barrowsbroaddus, 1982) has been detected, the genetic architecture
of resistance has not been thoroughly investigated.
Knowing that family level genetic variation for both diseases exists in the same
species, namely, loblolly pine, provided an opportunity to investigate and contrast the
nature and architecture of resistance to the diseases incited by the biotrophic and

3
necrotrophic fungi. The main difference between the two types of fungi is that
necrotrophs survive on the dead plant cells and biotrophs feed on living plant cells
(Lewis, 1973). Thus the damage they cause is significantly different and the host defense
mechanisms against them may also vary. For example, biotrophic fungi are typically
associated with gene-for gene systems (Glazebrook, 2005; Hammond-Kosack and Jones,
1997) and necrotrophs are often linked to quantitative disease resistance genes (Oliver
and Ipcho, 2004). Thus, I hypothesized that resistance and responses on the pathogen and
host sides would differ for the two distinct pathosystems.
Complex traits such as disease resistance can be dissected by two core activities,
genotyping and phenotyping. These two different sets of data can be analyzed in two
ways: by linkage, which uses QTL or linkage analysis approach; or by association, which
uses linkage disequilibrium to make genotype-phenotype association (Jannink et al.,
2001). Association genetics is gaining favor as an approach to identify genes that underlie
complex traits (Rafalski, 2002). The association approach relies on linkage
disequilibrium between marker loci and target trait loci, and because many unrelated
individuals are examined in a single association experiment, it is possible to evaluate the
effects of many alleles across a broad sample of the population (Flint-Garcia et al., 2003).
In contrast QTL approaches evaluate pairs of segregating alleles typically within single
families (Jannink et al., 2001). Loblolly pine is an ideal organism for association genetics
because loblolly pine has natural and outcrossing populations distributed across large
areas that have high gene-flow and little population substructure (Al-Rabab’ah and
Williams, 2002; Brown et al., 2004b; Schmidtling et al., 1999). Also with loblolly pine it
is possible to create large experimental populations and clonally propagate them to

4
detect, verify and evaluate phenotypes and genotypes. Loblolly pine also has desirable
levels of nucleotide diversity (Ө=0.005; Brown et al., 2004) and limited linkage
disequilibrium (<2500 bp on average, Brown et al., 2004).
As a first step toward dissecting complex disease traits in loblolly pine, I have
undertaken this study to evaluate a variety of disease phenotypes in a population of 32
unrelated parents mated to form approximately 63 full-sib families that were clonally
propagated to form hundreds or thousands of clones depending upon the experiment.
Although an ideal association population would contain hundreds of unrelated individuals
(McLeod and Long, 1999), this population is an excellent starting point to evaluate the
heritabilities and genetic relationships among the two sets of disease traits that can then
be dissected by association or QTL mapping.
An important aspect of experimental material is its clonal propagation to form a
hierarchy of genetic relationships (parent, full-sib family, and clone) that facilitate the
dissection of genetic architecture of diseases and their genetic relations. Since micro-
environmental variation for a given genotype can be calculated using its vegetative
propagules, I can obtain a more precise estimate of genetic components of disease
resistance. Given that I am using the same genotypes to predict breeding values for both
pitch canker and fusiform rust disease resistance, the values can be compared to look for
correlations that will be informative when I try to understand the underlying genetic
architecture.
The clonally propagated material of clones screened in the greenhouse conditions
was also planted in several field sites. The first year fusiform rust disease incidence data
from the naturally inoculated field site can be compared with the greenhouse screen to

5
confirm resistant and susceptible genotypes, since the ultimate goal of resistance
screening is to identify the resistant genotypes that will be disease free in the plantations.
Genomic mapping has identified the region containing Fr1 (fusiform resistance-1)
conferring pathotype-specific resistance to fusiform rust (Wilcox et al., 1996). RAPD
marker J7_485A was linked to the Fr1 locus in progeny of a single loblolly pine parent.
Thus, the progeny that have this marker were resistant whereas the ones without the
marker were susceptible to fusiform rust incited by C. quercuum with the avirulence gene
(Avr1). This genetic marker was consistently predictive of fusiform rust resistant trees in
greenhouse (Kubisiak et al., 2005; Kuhlman et al., 1997) and field screens (Wilcox et al.,
1996). Two families among 63 families that were screened for fusiform rust resistance in
the greenhouse and the field were genotyped for Fr1. Thus, clones belonging to the two
genotyped families can be used to verify the resistance prediction power of the genetic
marker.
The genotypic information on progeny of the families that are segregating for the
RAPD marker J7_485A can also be useful in molecular genetics studies. Microarray
technology which became available with the last decade (ref) can be used to identify
genes regulated in response to inoculation with C. quercuum. With the genetic marker
information genetically resistant and susceptible individuals can be isolated to be
challenged by Fr1 avirulent strains of C. quercuum. The host responses, disease
development and the interactions between the host and the pathogen can be revealed at
the molecular genetics level.

6
CHAPTER 2 GENETIC DISSECTION OF FUSIFORM RUST AND PITCH CANKER DISEASE
TRAITS IN LOBLOLLY PINE
Introduction
Pinus species are both economically and ecologically important. Pines grown in the
southeastern United States generate nearly half of the nation s pulpwood, with an annual
harvest value of approximately $19 billion (McKeever and Howard, 1996). Loblolly pine
(Pinus taeda L.) is the most widely planted Pinus species in this region, averaging 74%
of the annual seedling production (Carey and Kelley, 1993). In addition to plantations,
loblolly pine is the predominant species on 11.7 million ha of native forest (Baker and
Langdon, 1990), where it impacts the welfare of nearly 400 species of vertebrates
(Schultz, 1999).
Loblolly pine is a host for two endemic pathogens, Cronartium quercuum Berk.
Miyable ex Shirai f. sp. fusiforme (Burdsall and Snow, 1977), the inciting agent of
fusiform rust disease, and Fusarium circinatum Nirenberg et O Donnell (Nirenberg and
O Donnell, 1998), the inciting agent of pitch canker disease. Fusiform rust is one of the
most destructive fungal diseases in the southeastern United States, causing damage
ranging from $25–$135 million per year (Cubbage et al., 2000). The major symptom of
fusiform rust disease is the formation of stem galls that lead to decreases in survival,
wood quality, and growth. Genetic variation in resistance at the family level has been
demonstrated for fusiform rust (Kuhlman and Powers, 1988; McKeand et al., 1999).
Based on controlled inoculation studies carried out on specific loblolly and slash pine

7
Pinus elliottii Engelm. var. elliottii) families, specific resistance—i.e., gene-for-gene
interactions—has evolved (Powers, 1980; Stelzer et al., 1997; Wilcox et al., 1996), as
well as partial resistance in the form of short galls (Schmidt et al., 2000), which may be
genetically distinct from specific resistance.
Pitch canker is also a significant, although more episodic, disease problem (Dwinell
et al., 1985). Symptoms of pitch canker disease include resinous lesions on stems and
branches that cause seedling mortality, decreased growth rates, and crown dieback
(Dwinell et al., 1985). A considerable amount of genetic variation for pitch canker
resistance has been detected in loblolly pine families (Kuhlman et al., 1982) and clones
(Dwinell and Barrows-Broaddus, 1981); however, the genetic architecture of resistance is
not well understood.
Our goal in this work was to obtain precise estimates of pitch canker and fusiform
rust disease phenotypes expressed in loblolly pine. Precision was acquired by a
combination of clonal propagation, which allows repeat observations of the same
genotypes, and is now feasible in loblolly pine (Frampton et al., 2000), testing of over
one thousand pedigreed genotypes, and the use of a mixed linear model (GAREML) to
adjust for environmental effects (Huber, 1993). In this study, I identified traits, clones,
families, and parents that guide a genetic approach to dissecting disease traits in loblolly
pine. I verified that pitch canker and fusiform rust traits are heritable and identified the
disease traits that are genetically distinct from one another. This work creates the baseline
knowledge required for identifying genes that condition phenotypes of interest, either
through genetic linkage analysis within defined pedigrees, or by association in
populations of unrelated genotypes (Flint-Garcia et al., 2003; Jannink et al., 2001).

8
Materials and Methods
Genetic Material, Plant Propagation, and Experimental Design
The 63 loblolly pine families screened in this study were obtained from a circular
mating design with some off-diagonal crossing. Members of the Cooperative Forest
Genetics Research Program at the University of Florida and the North Carolina State
University–Industry Cooperative Tree Improvement Program (Figure 2-1) provided the
32 parents and generated the full-sib families and clones screened in this study. Forty-
nine seeds from each full-sib family were germinated and grown into hedges for clonal
propagation. Maintenance of hedges and propagation of cuttings is reported in Baltunis et
al. (2005). In brief, cuttings were set in July 2001, assessed for rooting after 9 weeks, and
clones with the highest rooting ability selected for this experiment. The number of clones
within families and the number of ramets (i.e., rooted cuttings) for each clone was not
equal, since families did not produce the same number of clones, and clones had different
rates of rooting. Cuttings assigned to a greenhouse screen were chosen at random from
the ramet pool of each available clone (Table 2-1). The screens were grouped according
to the disease (fusiform rust or pitch canker). The fusiform rust screens were conducted
using two types of inoculum (a one-gall mix or a ten-gall mix), whereas both pitch canker
screens used a single inoculum. The experimental design was a randomized complete
block with single-tree plots arranged in an alpha lattice with an incomplete block size of
20. The clones were replicated with a maximum number of five ramets per experiment.
Ramets were pruned twice to stimulate synchronous elongation of multiple succulent

9
ID 1 2 3 4 5 6 7 8 9 10 11 12 13 14 15 16 17 18 19 20 21 22 23 24 25 26 27 28 29 30 31 321 16 17 18 192 6 18 17 20 18 19 223 34 23 19 194 69 37 155 58 19 18 20 216 15 10 19 19 187 45 11 64 21 198 50 56 18 19 219 40 26 20
10 25 49 2111 39 44 18 2112 28 21 19 2113 35 41 19 19 2114 46 65 1815 7 68 20 2216 70 38 22 2117 16 36 42 30 3118 27 60 0 21 2219 1 22 22 1520 30 57 21 20 2121 13 29 1922 8 19 18 2023 48 67 20 18 2024 51 55 1725 66 43 62 21 1926 9 18 1927 54 31 32 2028 33 52 21 14 2229 3 230 12 5331 1932 61 4
Figure 2-1 A circular mating design was used to generate the plant material. Thirty-two parents were crossed following a circular design, and the resulting progeny was used as the material screened for this study. The numbers in the cells above the diagonal are the number of clones used from a given cross, and the numbers below the diagonal are the family identification numbers
shoots for inoculation. The initial pruning occurred in March 2002, 8 months after
setting, by cutting back the shoots from 10–15 cm to 3–4 cm each. The second pruning
occurred 6 weeks prior to inoculations for both pitch canker and fusiform rust screens;
shoots were succulent and 5–8 cm in length at the time of inoculation. After pruning, all
trees were fertilized weekly with Miracle-Gro 15-30-15 until inoculation.
Pitch Canker: Inoculations and Data Collection
The larger of the two pitch canker screens was conducted at the USDA Forest Service
Resistance Screening Center in Bent Creek, North Carolina, and is referred to as
10
Table 2-1 Summary of the four inoculation experiments reported in this study
Testa # Families # Clones Rangeb # Ramets # Observationsc
RSC pitch canker 63 1065 7- 31 4483 7664 UF pitch canker 60 362 1- 24 1316 3119 Ten Gall fusiform rust 63 1360 17-31 5473 11,395 One Gall fusiform rust 63 698 2- 30 2743 5195 aRSC USDA Forest Service Resistance Screening Center, UF University of Florida bNumber of clones within families cNumber of observations exceeds the number of ramets because multiple shoots were assessed on a given ramet
the RSC screen in this manuscript. New growth (5–7 cm) was inoculated following
the standard RSC protocol (Oak et al., 1987) with F. circinatum isolate S45 (Forest
Pathology laboratory collection, University of Florida) at a density of 92,500 spores/ml.
In brief, prior to spray inoculation, shoot tips were excised from two shoots on each
ramet. After inoculation, plants were placed in a high-humidity chamber for 24 h, then
transferred to a greenhouse and maintained at an average temperature of 20°C for
3 months.
The smaller of the two pitch canker screens was conducted at the University of
Florida and is referred to here as the UF screen. Plants were pruned 6 weeks before
inoculation with the same S45 isolate. One shoot tip per ramet was excised, and 1 μl of a
500-spores/μl solution was applied to the wound with a micropipette. All plants were
incubated under high humidity for 24 h. The test was kept in the greenhouse for 36 days
at an average temperature of 30°C.
Disease symptoms were measured at 90 days (RSC) and 36 days (UF). Shoot
length and lesion length were measured (in millimeters) on one shoot chosen at random
from each ramet at the RSC and on the single shoot inoculated per ramet at UF.

11
Both the RSC and UF pitch canker raw data sets included only one lesion-length
and shoot-length measurement for each ramet. Prior to analysis, the data were
standardized by experiment, using the phenotypic standard deviation calculated from the
appropriate linear model for the screen.
Fusiform Rust: Inoculations and Data Collection
Plants were pruned twice before inoculation to stimulate elongation of multiple
shoots per ramet. Both rust screens were inoculated at the RSC, following standard
protocols (Knighten, 1988). The ten-gall test was inoculated at a density of
52,000 spores/ml with aeciospores pooled from a ten-gall collection obtained from a 6-
year-old loblolly pine plantation near Lee, Florida (designated L-10-1-99, provided by
Dr. Henry Amerson, NC State University) The one-gall test was inoculated at a density of
50,700 spores/ml with aeciospores isolated from a single gall obtained from a branch of
slash pine family 84-57 near Callahan, Florida (designated #501, provided by Dr. Robert
Schmidt, University of Florida).
Data were collected from both rust screens 6 months after inoculation. For each
ramet with multiple shoots, the number of shoots with galls and the number of galls were
counted and recorded. In addition, two shoots with single galls were randomly chosen to
measure stem length, gall length, and gall width (in millimeters) for each ramet.
Data collected from both the ten-gall and one-gall screens were treated identically
for gall measurements. Gall measurement values were averaged by ramet if there was
more than one shoot with a single gall. Gall volume was calculated from gall length and
gall width data, assuming a fusiform shape:
2)()43( widthlengthVolume ×=

12
Ramets were scored as 0 (no gall) or 1 (at least one gall) for gall score. Ramets that
did not form galls were not included in the gall length, width, and volume data. Gall
length, width, and volume data sets were standardized using their respective phenotypic
standard deviations calculated from the linear model.
Estimation of Genetic Parameters
Variance components and genetic parameters were estimated by GAREML (Huber,
1993), which employs restricted maximum likelihood estimation (Patterson and
Thompson, 1971) and best linear unbiased prediction [(BLUP) Henderson, 1973]. The
same linear model was applied to the traits measured in all four disease screens, since the
experimental designs were identical. The linear model was:
ijklmiklklmklkijiijklm efrfamilycscagcagcartRyl
++++++++= *)()(μ
where:
yijklm is the mth observation of the klth cross in the jth tray of ith rep.
μ is the population mean.
Ri is the fixed resolvable replication, i=1–5.
t(r)ij is the random variable tray incomplete block ~NID(0,σ2t), j=1–21.
gcak is the random variable female general combining ability (GCA) ~NID(0, σ2gca) k=1–
32.
gcal is the random variable male general combining ability ~NID(0, σ2gca) l=1–32.
scakl is the random variable specific combining ability (SCA) ~NID(0, σ2sca).
c(family)klm is the random variable clone within a family ~NID(0, σ2c(family)).
r*fikl is the random variable replication by family interaction ~NID(0, σ2r*f)).
eijklm is the random variable error within the experiment ~NID(0, σ2e).

13
The narrow- (h2) and broad-sense (H2) heritabilities were calculated according to
Falconer and Mackay (1996):
)(ˆ))(ˆ)(ˆ)(ˆ(
ˆˆˆˆ2
)(ˆ)(ˆ
ˆˆ4
2
2)(
222
2
22
PVIVDVAVH
PVAVh
P
fcscagca
P
gca
++=
++=
==
σσσσ
σσ
where:
P2σ̂ is the phenotypic variance,
)(ˆ PV is the total phenotypic variance,
)(ˆ AV is the additive variance,
)(ˆ DV is the dominance variance,
)(ˆ IV is the epistasis variance.
To partition the broad sense heritability I calculated the ratio of dominance variance
to total phenotypic variance (2ˆ
Dh ) and the ratio of epistatic variance to total phenotypic
variance (2ˆ
Ih ), using the following formulas:
)(ˆ)(ˆ
ˆˆ4ˆ
2
22
PVDVh
P
scaD ==
σσ
)(ˆ)(ˆ
ˆ)ˆ75.0ˆ50.0(ˆˆ
2
222)(2
PVIVh
P
scagcafcI =
+−=
σσσσ
The broad sense heritability of clonal means (HC2) and family means (HF
2) were
calculated using the formulae below:
)/ˆ()/ˆ(ˆˆ)ˆ*2(ˆˆ)ˆ*2(ˆ
22*
2)(
22
2)(
222
rrH
efrfcscagca
fcscagcaC σσσσσ
σσσ++++
++=

14
)*/ˆ()/ˆ()/ˆ(ˆ)ˆ*2(
ˆ)ˆ*2(ˆ22
*2
)(22
222
crrcH
efrfCscagca
scagcaF σσσσσ
σσ
++++
+=
where r is the harmonic mean of ramets per clone and c is the harmonic mean of clones
per family.
Family deviations were predicted by summing the following BLUP estimates
produced by GAREML:
Family deviation = Predicted female value (gcak) + Predicted male value (gcal) +
Predicted specific combining ability (scakl)
Genetic Correlations
The genetic correlation between gall score and gall length at the parental, family,
and clonal levels, and the correlation among screens within and across diseases were
calculated on combined data sets by adding experiment × GCA (2geσ ), experiment by
family (2seσ ) and experiment by clone(family) (
2)( efcσ ) interaction factors to the linear
model and using the Type B genetic correlation formula (rB; Yamada, 1962):
)ˆˆ(ˆ
)(r 22
2
PARENTALBgegca
gca
σσσ+
=
2222
22
FAMILYB ˆˆ2ˆˆ2ˆˆ2)(r
segescagca
scagca
σσσσσσ
++++
=
2)(
222)(
22
2)(
22
C(F)B ˆˆˆ2ˆˆˆ2ˆˆˆ2
)(refcsegefcscagca
FCscagca
σσσσσσσσσ
+++++
++=
Efficiency of using multiple ramets per genotype was calculated according to Huber et al. (1992):
rHEfficiency /)1( 2−= where r is the number of ramets per clone.

15
Results
The mating design shown in Figure 1, coupled with clonal propagation, allowed
predictions of clonal, family, and parental genotypic values as well as population-wise
estimates of heritabilities and genetic correlations of disease traits for both pathosystems.
A total of 27,373 phenotypic data points were collected for lesion length (pitch canker),
gall score, gall length, and gall width (fusiform rust). I first present data on pitch canker
phenotypes, followed by fusiform rust, and finally a comparison of pitch canker and
fusiform rust resistance.
Pitch Canker Disease Resistance is Heritable
The pitch canker disease screens performed at UF and RSC resulted in 89% of the
ramets (i.e., rooted cuttings) showing measurable disease symptoms in each screen.
BLUP clonal values were predicted for each screen, and the resulting distributions are
shown in Figure 2a. The consistency of the disease rates and the shapes of the
distributions (i.e., skewed to the right) suggest that statistical comparisons between the
RSC and UF screens are appropriate. The genetic correlation between the RSC and UF
screens was 0.88 at the parental level, 0.76 at the family level, and 0.69 at the clonal
level. A scatter plot based on family ranks is presented in Figure 2b and reflects the
positive correlation between the two screens. Therefore, I conclude that parents, families,
and clones performed consistently across screens. After combining the data from the two
screens, the five most resistant and the five most susceptible full-sib families were
identified based on predicted family values and standard deviations for lesion length;
these are indicated in Figure 2- 2a by their ID number from Figure 2-1. The resistant tail
contains families 50 and 48, which have parent 8 in common. The resistant tail also
contains half-sib families 61 and 4, which share parent 32. Resistant family 44 is not
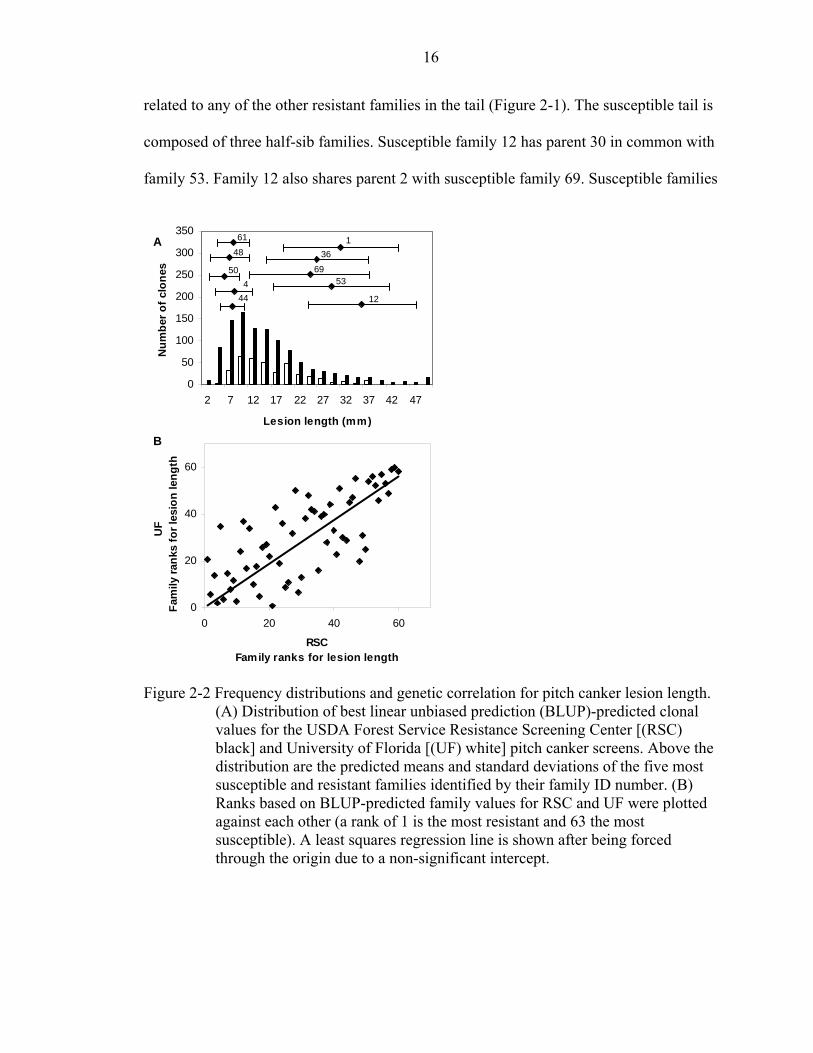
16
related to any of the other resistant families in the tail (Figure 2-1). The susceptible tail is
composed of three half-sib families. Susceptible family 12 has parent 30 in common with
family 53. Family 12 also shares parent 2 with susceptible family 69. Susceptible families
0
20
40
60
0 20 40 60
RSC Family ranks for lesion length
UF
Fam
ily ra
nks
for l
esio
n le
ngth
0
50
100
150
200
250
300
350
2 7 12 17 22 27 32 37 42 47
Lesion length (mm)
Num
ber o
f clo
nes
1
6953
3648
61
50
444
1 2
A
B
0
20
40
60
0 20 40 60
RSC Family ranks for lesion length
UF
Fam
ily ra
nks
for l
esio
n le
ngth
0
50
100
150
200
250
300
350
2 7 12 17 22 27 32 37 42 47
Lesion length (mm)
Num
ber o
f clo
nes
1
6953
3648
61
50
444
1 2
A
B
Figure 2-2 Frequency distributions and genetic correlation for pitch canker lesion length.
(A) Distribution of best linear unbiased prediction (BLUP)-predicted clonal values for the USDA Forest Service Resistance Screening Center [(RSC) black] and University of Florida [(UF) white] pitch canker screens. Above the distribution are the predicted means and standard deviations of the five most susceptible and resistant families identified by their family ID number. (B) Ranks based on BLUP-predicted family values for RSC and UF were plotted against each other (a rank of 1 is the most resistant and 63 the most susceptible). A least squares regression line is shown after being forced through the origin due to a non-significant intercept.
17
1 and 36 have parent 17 in common. Families in the resistant tail and families in the
susceptible tail did not have any parents in common, indicating no genetic relationships
across the classes.
Two Distinct Inoculation Procedures Reveal Similar Heritabilities for Lesion Length
Using the RSC, UF, and pooled data, the heritabilities based on individual tree,
family, and clonal means were calculated to determine how much of the variation in
lesion length could be attributed to genetic variation and to determine the precision of the
predicted clonal and family means. The broad-sense heritabilities for the clonal (HC2) and
family (HF2) means were determined for both the individual and pooled pitch canker
screens to evaluate the precision of the clonal and family means predicted above. HC2
and HF2 were greater for RSC (0.75) than for UF (0.61; Figure 2-3), because the number
of ramets per clone and the number of clones per family were approximately three times
greater for the RSC screen compared to the UF screen (Table 1). Narrow-sense
heritabilities (h2) for both the RSC and UF datasets were 0.27. Broad-sense heritabilities
(H2) were similar for both the RSC (0.43) and the UF screens (0.37) (Figure 2-3). When
the RSC and UF data sets were pooled, heritabilities were not different from that
calculated for each screen individually (Figure 2-3). This is another indicator that results
from the two screens were comparable.
Disease Traits Associated with Fusiform Rust are Independently Inherited
The two fusiform rust screens are characterized by the type of inocula used, either
ten-gall or one-gall. There were 36% and 31% galled ramets for the ten-gall and one-gall
screens, respectively. A disease incidence (referred to as score ) dataset was generated

18
Figure 2-3 Heritability estimates for pitch canker lesion lengths. The bar graph shows the
heritabilities for individual ramets (R=H2) and the broad-sense heritabilities for clonal (C=HC
2) and family (F=HF2) means for the RSC, UF, and pooled
data. Narrow-sense heritability [(h2) solid black], epistatic heritability [(hI2)
solid gray], and dominance heritability [(hD2) white] are stacked so that the y-
axis corresponding to the top of the bar is the broad-sense heritability.
by designating disease-free ramets as 0 and galled ramets as 1. Fusiform rust screens for
score are shown in Figure 2-4a. The distributions for score in both screens follow a
similar pattern, that is, there is a minor peak at a mean ~0.1, and the distribution is
skewed to the right. In addition to disease incidence, gall length, and gall width were
measured for ramets with galls. In contrast to score, the predicted clonal means for gall
length revealed a normal distribution for both fusiform rust screens (Figure 2-4b).
Because the distributions and overall disease incidences were similar, scaling prior to
comparing the data from the two screens was not necessary for either trait.
Genetic correlations between the two screens were calculated for score and gall length in
order to determine if inoculum type might impact trait expression. The genetic correlation
for score was 0.80 at the parental level, 0.83 at the family level, and 0.86 at the clonal
0.0
0.2
0.4
0.6
0.8
1.0
Her
itabi
lity
R C F R C F R C F RSC UF Pooled

19
0
20
40
60
0 20 40 60
Ten-gallFamily ranks for gall length
One
-gal
lFa
mily
rank
s fo
r gal
l len
gth
0
20
40
60
0 20 40 60
Ten-gall Family ranks for gall score
One
-gal
l F
amily
rank
s fo
r gal
l sco
re
0
40
80
120
160
200
0.0 0.1 0.2 0.3 0.4 0.5 0.6 0.7 0.8 1.0
Score (decimal)
Num
ber o
f clo
nes
5453
52
49
40
2651
2069
3
A
0
20
40
60
80
100
1 3 6 8 11 13 15 18 20 23
Gall length (mm)
Num
ber o
f clo
nes
29
1 3
1 5
3025
3134
36
57
62
B
C D
0
20
40
60
0 20 40 60
Ten-gall Family ranks for gall score
One
-gal
l F
amily
rank
s fo
r gal
l sco
re
0
40
80
120
160
200
0.0 0.1 0.2 0.3 0.4 0.5 0.6 0.7 0.8 1.0
Score (decimal)
Num
ber o
f clo
nes
5453
52
49
40
2651
2069
3
A
0
20
40
60
80
100
1 3 6 8 11 13 15 18 20 23
Gall length (mm)
Num
ber o
f clo
nes
29
1 3
1 5
3025
3134
36
57
62
B
C D
0
40
80
120
160
200
0.0 0.1 0.2 0.3 0.4 0.5 0.6 0.7 0.8 1.0
Score (decimal)
Num
ber o
f clo
nes
5453
52
49
40
2651
2069
3
A
0
20
40
60
80
100
1 3 6 8 11 13 15 18 20 23
Gall length (mm)
Num
ber o
f clo
nes
29
1 3
1 5
3025
3134
36
57
62
B
C D
Figure 2-4 Frequency distributions and genetic correlations for fusiform rust disease
traits. Distribution of BLUP-predicted clonal values for gall score (A) and gall length (B) in the ten-gall inoculum (black) and one-gall inoculum (white) screens are shown. Above the distribution are the predicted values and standard deviations of the five most susceptible and resistant families identified by their family ID number. Ranks based on predicted family values for gall score (C) and gall length (D) (1 = resistant, 63 = susceptible) are plotted against each other. A least squares regression line is shown after being forced through the origin due to a non-significant intercept
level, suggesting a general consistency in performance between the ten-gall and one-gall
mixes. For gall length, the genetic correlation between the two screens was 1.00 at the
parental level, 1.00 at the family level, and 0.76 at the clonal level, again indicating
general consistency in performance between the two fusiform rust screens. Despite the
high genetic correlations, I did observe outlier families that performed differently in

20
the two screens, suggesting some potentially significant genotype by inoculum
interactions (Figure 2-4c, d).
Relationships among families with extreme phenotypes can reveal information
regarding inheritance. For score, the predicted family values for the five most resistant
and five most susceptible families are plotted on the graph in Figure 4a, along with their
within-family standard deviations and family ID numbers. The resistant tail contains two
half-sib family groups, that is, families 26, 40, and 49 that have parent 9 in common, and
families 52 and 53 that have parent 28 in common. The susceptible tail is composed of
two families that are half-sibs, that is, families 3, 20, and 51 have parent 22 in common,
and families 54 and 69 have parent 2 in common. Similarly for gall length, the five
families with the shortest galls and the five families with the longest galls are shown
above the distribution in Figure 4b. The short gall-forming tail includes families 31 and
62 that have parent 25 in common. The remaining three families in this tail are unrelated.
The five families with the longest galls comprise three half-sib families (13 and 29; 29
and 30; and 57, 13, and 57) that are related to one another through parents 21, 20, and 19,
respectively. Family 15 is unrelated to the others. For both score and gall length, familial
relationships within a given tail were common, whereas no such genetic relationships
among families in opposing tails were observed. This is consistent with both score and
gall length being heritable traits.
To evaluate how much of the trait variation associated with fusiform rust can be
attributed to genetic effects, heritabilities were calculated. Since the genetic correlations
for score and gall length were high across inocula (Figure 2-4c, d), data were pooled and
used for heritability calculations. Gall score was consistently more heritable than gall

21
0.0
0.2
0.4
0.6
0.8
1.0
Her
itabi
lity-
Gal
l sco
re
R C F R C F R C F Ten-gall One-gall Pooled
A
0.0
0.2
0.4
0.6
0.8
1.0
Her
itabi
lity-
Gal
l len
gth
R C F R C F R C F Ten-gall One-gall Pooled
0
20
40
60
0 20 40 60
Family ranks for gall length
Fam
ily ra
nks
for g
all s
core
B
C
0.0
0.2
0.4
0.6
0.8
1.0
Her
itabi
lity-
Gal
l sco
re
R C F R C F R C F Ten-gall One-gall Pooled
A
0.0
0.2
0.4
0.6
0.8
1.0
Her
itabi
lity-
Gal
l len
gth
R C F R C F R C F Ten-gall One-gall Pooled
0
20
40
60
0 20 40 60
Family ranks for gall length
Fam
ily ra
nks
for g
all s
core
B
C
Figure 2-5 Heritability estimates and family rank scatter plots for fusiform rust disease
traits. Gall score (A) and gall length (B) heritabilities for R, and C and F means are shown. Heritability estimates for the ten-gall and one-gall pooled screens are given for both traits. h2 (solid black), hI
2 (solid gray), and hD2 are
stacked such that the y-axis corresponding to the top of the bar is the H2. (C) Scatter plot of family ranks illustrates a lack of correlation between gall score and gall length traits (1 = resistant, 63 = susceptible)

22
used for heritability calculations. Gall score was consistently more heritable than gall
length for the one-gall, ten-gall, and pooled datasets (Figure 2-5a, b).
Host Genes Underlying Resistance to Pitch Canker and Fusiform Rust are Independent
Necrotrophic (i.e., F. circinatum) and biotrophic (i.e., C. quercuum) pathogens
have distinct life history properties. This implies that host genes underlying resistance
may be different for diseases incited by necrotrophic and biotrophic pathogens. To
determine whether host responses to F. circinatum and C. quercuum are independent, I
computed the genetic correlations between lesion length (pitch canker) and the various
gall characteristics (fusiform rust). There were no significant correlations between lesion
length and gall length (Figure 2-6), or between lesion length and gall score (data not
shown). The estimated genetic correlation between lesion length and gall length were
0.00 at the parental level, 0.00 at the family level, and 0.02 at the clonal level. No genetic
correlations were found between lesion length and gall volume or gall width (0.00 for all,
data not shown). Together, these results imply that resistance to pitch canker and
resistance to fusiform rust are controlled by different host genes.
Efficiency of Using Multiple Ramets per Genotype
Theoretically, if the number of ramets per genotype is high enough, heritability
estimates based on clonal means will be 1. To describe the relationship between the
number of ramets and HC2 for disease traits investigated in this study, the efficiencies
(Huber et al., 1992) for increasing number of ramets per genotype were plotted against
the number of ramets (Figure 2-7), where efficiency is calculated as the average reduction
23
0
20
40
60
0 20 40 60Fusiform rust
Family ranks for gall length
Pitc
h ca
nker
Fam
ily ra
nks
for l
esio
n le
ngth
Figure 2-6 No genetic correlation between pitch canker and fusiform rust resistance.
Family rank–rank scatter plot based on predicted family means for pitch canker (lesion length) and fusiform rust (gall length), fitted with a least squares regression line (1= resistant, 63= susceptible)
0
0.1
0.2
0.3
0.4
0.5
0.6
0.7
0.8
1 2 3 4 5 6 7 8 9 10Number of ramets
Effic
ienc
y (
1-H
2 )/(r
)
Figure 2-7 Efficiency is inversely proportional to the number of ramets per genotype.
Efficiency of using multiple ramets in the estimation of HC2 plotted against number of ramets for RSC-lesion length (filled circles), UF-lesion length (open circles), ten-gall-gall score (filled squares), one-gall-gall score (open squares), ten-gall-gall length (filled triangles) and one-gall-gall length (open triangles). Efficiency was calculated as (1–H 2)/(number of ramets)
in error per ramet. For the different disease traits, the error associated with a clonal means
decreases at different rates, depending on the number of ramets used to represent
genotypes and H2. An increase in the experiment size above ca. five ramets per clone

24
does not appreciably increase the precision of heritability estimates, suggesting that
future experiments of this type should be replicated to approximately the same extent as
this study.
Discussion
Loblolly pine exhibits considerable variation in resistance to both fusiform rust
(Kuhlman and Powers, 1988; Powers and Zobel, 1978) and pitch canker diseases
(Dwinell and Barrows-Broaddus, 1981; Kuhlman and Cade, 1985). The pathogens that
incite these diseases, the biotrophic fungus C. quercuum and the necrotrophic fungus F.
circinatum, have distinct life history strategies, reflected in the contrasting disease
symptoms visible on susceptible hosts. This study allowed a direct comparison of the host
resistance mechanisms to these distinct pathogens in a common set of host genotypes.
Consequently, it was possible to compare and contrast the genetic architecture of host
responses to both pathogens.
Complex trait analysis requires a reliable estimation of phenotypic values for
subsequent correlations with genotype. As a first step toward dissecting complex disease
traits in loblolly pine, I undertook this study to evaluate a variety of disease phenotypes in
a clonally propagated population generated via a circular mating design. Complex
pedigree structures such as these can be useful for mapping QTL (Jannink et al., 2001).
Genetic variation for pitch canker resistance
Pitch canker resistance was continuously distributed across clones, suggesting that
resistance may behave as a complex trait. Resistance to fungal necrotrophs is often
inherited as a complex trait in crop species including maize (Bubeck et al., 1993) and rice
(Wang et al., 1994). Another explanation for this continuous distribution is Mendelian
inheritance of resistance within families that appears continuous when examined across

25
families. If resistance were monogenic, some families would be expected to show a
bimodal distribution for lesion length. To assess this possibility, I tested individual
families for bimodal distributions of resistance. None of the within-family distributions
was bimodal; all showed continuous distributions. Since lesion length showed a
continuous distribution within families across the entire study, I infer that pitch canker
resistance is appropriate to analyze as a complex trait.
The repeatability of the pitch canker resistance screens was high, indicated by the
high genetic correlation between the two screens, one of which was based on hand-
inoculation in a warm environment (UF screen) and the other using established spray
inoculation methods in a cooler environment (RSC screen). The stability of H2 in the
pooled dataset relative to the individual screens also supports this conclusion. I do not
expect pathogenic variation to significantly change the resistance rankings of these
genotypes, even though these experiments were performed by inoculating hosts with a
single clonal isolate of F. circinatum. This is because there is little evidence for specific
resistance in this pathosystem; families rank consistently when challenged with different
fungal isolates (G. Blakeslee, personal communication). The facultative nature of this
pathogen presumably creates little selection pressure for the evolution of gene-for-gene
specificity in this pathosystem. Consequently, these clonal rankings may be robust across
a broad range of pathogen isolates and predictive of rankings expected in the clonal field
trials established with these genotypes.
While narrow-sense heritability is an important metric for breeding applications,
our use of clonally replicated material allowed additional heritability calculations, H2,
HC2, and HF
2 values, which take advantage of the mating and propagation designs used in
26
this study. HC2 is an appropriate metric for association and quantitative trait loci studies,
because genotyping and phenotyping are both done at the clonal level. Accordingly, in
the RSC screen (which involved the most genotypes of the two pitch canker screens) ca.
75% of the variation in lesion length at the clonal mean level was due to genetic
variation. Therefore, I expect lesion length to be an appropriate phenotypic trait for future
QTL identification.
Gall score and gall length are the most heritable fusiform rust traits
Our analysis of gall score (i.e., disease incidence) revealed a non-normal, right-
skewed distribution with one major peak and several minor peaks. The major peak of
apparently resistant genotypes may reflect an overestimation of host resistance
because of the use of rooted cuttings. Studies comparing the responses of seedlings to
rooted cuttings have revealed that these two types of plant material behave differently in
response to pathogen challenge, with rooted cuttings showing enhanced resistance (Foster
and Anderson, 1989; Frampton et al., 2000). This enhanced resistance phenomenon has
been observed in other species and is often referred to as age-dependent resistance
because the developmental stage of the infected organ is the key driver of resistance, over
and above the action of specific resistance genes (Kus et al., 2002). As clonal host
materials become more widely used in research and plantation forestry, our
understanding of this phenomenon should improve.
Evidence for specific resistance in the loblolly pine–C. quercuum pathosystem has
been obtained using genomic mapping (Wilcox et al., 1996) and by inference based on
family rank changes in response to genetically distinct pathogen cultures (Kuhlman,
1992; Powers, 1980; Stelzer et al., 1997). Although the overall consistency among clonal
performances in our two screens was high, I observed a few family and clonal rank

27
changes for particular families and genotypes between the ten-gall and one-gall
inoculations (see outliers in Figure 2-4c), suggesting resistance genes in the host
population interacted with specific pathotypes in the inocula. The families showing rank
changes between the two inocula may provide a good starting point for identifying
additional resistance genes in loblolly pine.
Gall length was normally distributed and was heritable, although to a lesser extent
than gall score. Gall length could only be measured on a subset of the population (i.e., on
galled ramets), and this sampling effect may account in part for the reduced heritability
estimates. Our rationale for measuring gall size characteristics was based on work in
slash pine (Schmidt et al., 2000) suggesting that families exhibiting small (short) gall
phenotypes were expressing partial resistance to fusiform rust, based on their lack of
subsequent sporulation. Partial resistance may be a more durable form of resistance given
that it is often race nonspecific (Schmidt et al., 2000 and references therein). I observed
continuous variation in gall length in loblolly pine and found no changes in the relative
rankings of genotypes that formed galls in both screens as indicated by high genetic
correlations (Figure 2-4d). Thus, inoculum type did not appear to exert a major effect on
gall length. Studies involving a number of defined pathogen cultures will be required to
resolve the question of whether gall length is conditioned by (relatively late-acting)
specific resistance factors, or if gall length is a complex trait, potentially involving
multiple genes with small effects.
The relationship between gall score and gall length was of interest, because these
are distinct phenotypes whose genetic relationship is not well understood. The lack of
genetic correlation between gall score and gall length, and the lack of relatedness among

28
families in the tail distributions for gall score and gall length both suggest that distinct
gene systems condition these two traits. Previous studies have revealed that mean gall
length varies substantially in loblolly pine families phenotyped as resistant based on
score (Kuhlman, 1992), providing further support for the conclusion that gall score and
gall length are conditioned by distinct genetic mechanisms. Future identification of QTL
underlying gall length should help distinguish these loci from resistance genes known to
be associated with gall score in loblolly pine (Wilcox et al., 1996).
Resistance to pitch canker and fusiform rust are under the control of two different mechanisms
The lack of genetic correlation between pitch canker resistance and fusiform rust
resistance (as measured by gall score, or gall length) is consistent with distinct genetic
architectures underlying host resistance to these two diseases. Biotrophic pathogens
suppress host defenses because they require living host cells for survival and nutrient
uptake. Hosts resistant to biotrophic pathogens often activate a localized cell death
response to prevent spread of the pathogen (Thomma et al., 2001). In contrast,
necrotrophic pathogens actively destroy host cells and utilize the released nutrients for
survival. Therefore, a host-cell death-response effective against biotrophic pathogens is
postulated to benefit necrotrophic pathogens by increasing nutrient availability through
accelerated host tissue destruction. I propose that resistance to the necrotrophic pathogen
F. circinatum is mechanistically distinct from resistance to the biotrophic pathogen C.
quercuum due to the differing strategies employed by the two pathogens to incite disease
in the host. This is supported by gene-expression array data, which revealed a lack of
regulation of rust-associated genes after challenge by Fusarium (Morse et al., 2004).
Although I identified families with excellent resistance to both diseases (Figure 2-6),
29
disease resistance to the two pathogens should be regarded as independent traits by
breeders.
Phenotyping for disease trait dissection in loblolly pine
The work described in this manuscript has assigned specific phenotypic values to
more than 1,000 loblolly pine genotypes, enabling the identification of genes and alleles
that condition resistance through association studies. Genotyping and association studies
are currently underway (ADEPT project Web site, Allele Discovery of Economically-
important Pine Traits, http://dendrome.ucdavis.edu/ADEPT/) for candidate loci (Morse et
al., 2004) thought to be involved in disease resistance in loblolly pine.
In this study, I increased the precision of phenotyping by using clonally propagated
genotypes and mixed linear modeling to adjust for environmental effects. Increasing the
number of ramets for a given clone will increase the clonal mean based heritability for
use in linkage or association studies. However, there is a point of diminishing returns
beyond which adding more ramets does not increase precision of phenotyping. This
population was an excellent starting point to evaluate the heritabilities and relationships
among disease traits. Furthermore, it should afford an opportunity to identify QTL by
linkage and linkage disequilibrium (i.e., association) mapping, which has been proposed
(Wu et al., 2002) and applied with success (Farnir et al., 2002; Meuwissen et al., 2002).

30
CHAPTER 3 FUSIFORM RUST RESISTANCE COSEGREGATES WITH AN FR1-LINKED
MARKER AND REVEALS VARIABLE PENETRANCE OF THE DISEASE PHENOTYPE
Introduction
The economic value of pine in the southeastern United States exceeds $19 billion
annually with this region supplying more than half of the nation’s pulpwood (McKeever
and Howard, 1996). Loblolly pine (Pinus taeda L.) is the primary pine species in the
region, covering 45% of the commercial forest land (Schultz, 1999) with annual
production of over 1 billion seedlings for planted in reforestation programs (McKeand et
al., 2003).
Successful plantation establishment in the southeastern United States is highly
dependent on the resistance of the planting stock to fusiform rust disease, which is incited
by the endemic pathogen, Cronartium quercuum Berk. Miyable ex Shirai f. sp. fusiforme
(Burdsall and Snow, 1977). The major symptom of fusiform rust disease is the formation
of stem galls which decrease survival, wood quality, and growth, causing an annual loss
ranging from $25–$135 million (Cubbage et al., 2000). Loblolly pine families exhibit
substantial genetic variation in resistance to fusiform rust disease (Kuhlman and Powers,
1988; McKeand et al., 1999) both in greenhouse and the field.
Genomic mapping has identified the region containing Fr1 (fusiform resistance-1)
conferring pathotype-specific resistance to fusiform rust (Wilcox et al., 1996). RAPD
marker J7_485A was linked to the Fr1 locus in progeny of a single loblolly pine parent.
Thus, the progeny that have this marker were resistant whereas the ones without the

31
marker were susceptible to fusiform rust incited by C. quercuum with the corresponding
avirulence allele (Avr1). This genetic marker was consistently predictive of fusiform rust
resistant trees in greenhouse (Kubisiak et al., 2005; Kuhlman et al., 1997), and field
screens (Wilcox et al., 1996).
Screening of fusiform rust disease on clonally propagated loblolly pine has
revealed the existence of “escapes”; ramets that are genetically susceptible yet do not
show any disease symptoms (Foster and Anderson, 1989; Frampton et al., 2000). The
basis for an “escape” can be a passive form of resistance; a random phenomenon where
some cuttings harden off faster than others because of local environment within an
experimental block. Alternatively, there may be a genetic basis for disease resistance,
which may occur, for example if certain genotypes develop succulent shoots in response
to hedging and fertilization at different rates or to different extents than other genotypes.
A genetic analysis can answer this question.
Biologically a clone is susceptible if it has at least one diseased ramet. In this study
I used the same approach which led us to use a genotype based analysis rather than a
ramet based. I used some of the DNA markers developed in previous mapping studies to
distinguish host genotypes that carry/lack the pathotype-specific Fr1 allele. I tested the
hypothesis that the Fr1 allele is predictive of resistance in greenhouse and field
experiments. Because these studies involved clonally propagated materials, I also
quantified the extent to which genetic and non-genetic factors influence disease
expression levels and escape rate in greenhouse and field trials.
32
Materials and Methods
Genetic Material
All the clones that were screened in the greenhouse and the field came from 63 full-
sib loblolly pine families obtained from a circular mating design among 32 unrelated
parents with some off-diagonal crossing. The genetic material, the propagation methods,
the inoculations and the data collection were described in (Kayihan et al., 2005). The
parents were from the Atlantic Coastal Plain and Florida provenances of loblolly pine.
Briefly, there were 7-21 clones per full-sib family depending on the family and
experiment and approximately 4 ramets per clone.
Genotyping Families 0 and 1 for Fr1
Among 32 parents used in this study, parent number 17 was recognized as
heterozygous for pathotype-specific resistance gene Fr1 (Fr1/Fr1; (Wilcox et al., 1996)).
Full-sib families 0 and 1 were generated by crossing parent number 17 with parents 18
and 19 (Kayihan et al., 2005) which were known to be Fr1/Fr1 (unpublished data) and a
total of 61 clones from these families were genotyped using the protocols described in
Wilcox et al. (1996). The J7_470 RAPD marker is linked to the Fr1 locus and therefore
could be used to predict seedling genotypes (Fr1/Fr1 or Fr1/Fr1). The mating design
(Kayihan et al., 2005) coupled with clonal propagation allowed direct assessment of
marker-trait co-segregation. Because parents 18 and 19 are homozygous for the Fr1 allele
(recessive), families 0 and 1 are test-cross progeny and segregate 1:1 for resistance to Fr1
avirulent (Avr-Fr1) inoculum. Since the maternal parent is heterozygous,
megagametophyte samples were genotyped at the onset of the study to predict seedling
genotypes. At the conclusion of the greenhouse screen, foliage samples were collected

33
from galled ramets that had been initially genotyped as Fr1/Fr1, and the genotyping
reactions were repeated on the foliar DNA.
Greenhouse screen
The experimental design was a randomized complete block with single-tree plots
arranged in an alpha lattice with an incomplete block size of twenty. Propagation of
cuttings was described in Baltunis et al.(2005). A total of 63 families were used to
generate 1360 clones for the ten-gall screen and 699 clones for the one-gall screen (Table
3-1). The clones were replicated with a maximum number of five ramets per experiment
(Kayihan et al., 2005).
Table 3-1 Summary of the greenhouse and field screens reported in this study. The 63 families and most of the clones screened were the same across the ten gall, one gall and field screens. Percentage of diseased ramets and clones are reported as a measure of infection rate.
Screen # of families # of clones # of ramets % of clones galled % of ramets galled Ten gall 63 1360 5473 62 36One Gall 63 698 2743 49 31
Field 60 868 3362 51 26
The ten-gall test was inoculated with aeciospores pooled from a ten-gall collection
from Madison, FL (designated L-10-1-99) (Figure 3-1). The ten-gall inoculum was tested
for virulence against Fr1; I inoculated 100 open-pollinated seedlings derived from parent
17, using 50,000 basidiospores/ml and RSC standard methods (Knighten, 1988). Ninety-
four out of ninety-six seedlings that were chosen for DNA analysis were scorable for the
RAPD marker J7_470 and the marker data obtained from the megagametophytes of these
seedlings were used to detect virulence against Fr1. In order to choose an inoculum with
the least amount of genetic diversity for the one-gall screen, aeciospores collected from
single galls on slash pines in a field site (a generous gift from Dr. Robert Schmidt) were
assessed by Simple Sequence Repeat (SSR) markers using the methods described by
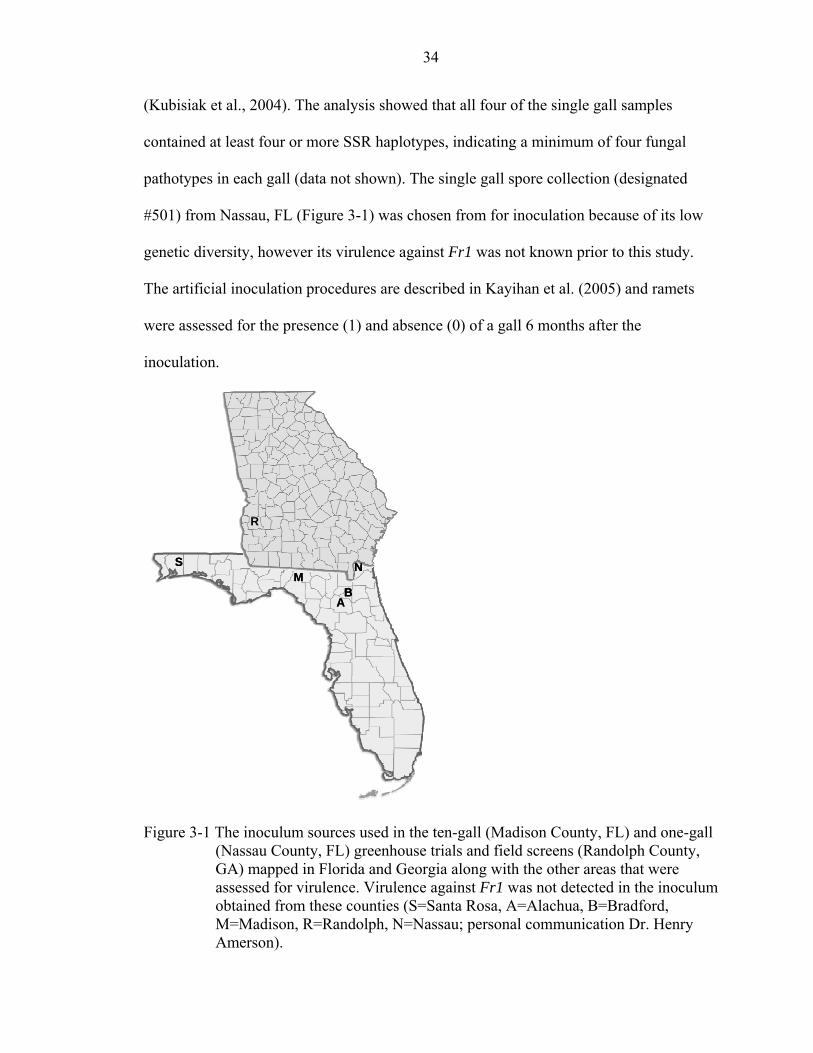
34
(Kubisiak et al., 2004). The analysis showed that all four of the single gall samples
contained at least four or more SSR haplotypes, indicating a minimum of four fungal
pathotypes in each gall (data not shown). The single gall spore collection (designated
#501) from Nassau, FL (Figure 3-1) was chosen from for inoculation because of its low
genetic diversity, however its virulence against Fr1 was not known prior to this study.
The artificial inoculation procedures are described in Kayihan et al. (2005) and ramets
were assessed for the presence (1) and absence (0) of a gall 6 months after the
inoculation.
R
S
A
MB
N
R
S
A
MB
N
R
S
A
MB
N
Figure 3-1 The inoculum sources used in the ten-gall (Madison County, FL) and one-gall (Nassau County, FL) greenhouse trials and field screens (Randolph County, GA) mapped in Florida and Georgia along with the other areas that were assessed for virulence. Virulence against Fr1 was not detected in the inoculum obtained from these counties (S=Santa Rosa, A=Alachua, B=Bradford, M=Madison, R=Randolph, N=Nassau; personal communication Dr. Henry Amerson).

35
Field
The experimental design was a randomized complete block, with single-tree plots
arranged in an alpha lattice with row/column family restrictions and an incomplete block
size of five. A total of 868 clones from 60 families shared with the greenhouse screens
were evaluated for fusiform rust disease resistance in the field (Table 3-1). The field
location was Randolph, GA at latitude 31.78N, longitude 84.8W (Figure 3-1). Trees
were planted in 4 replications each with 40 columns and 110 rows, inoculation was
allowed to occur naturally and the cuttings were phenotyped for presence (1) or absence
(0) of fusiform rust galls during the second growing season. This is an area classified as
“high hazard” for fusiform rust disease based on south wide classification of >30% of
stems in 5 to 15 years old stands that are likely to have galls on main stems or on live
limbs that are fairly close to the main stem (Anderson et al., 1988).
Data Analysis
Conceptually, all the ramets from a resistant clone should be disease free and all
ramets from a susceptible clone should be diseased. In this study, a clone was labeled as
“resistant” when all of the ramets from that particular clone were disease free. However,
there were a considerable number of cases where only some of the ramets from a
susceptible clone were galled. For the purposes of this study, a single ramet bearing one
or more galls was sufficient to identify a susceptible clone. I converted “ramet based
score” data to a “clone based” dataset by classifying all the genotypes (i.e. clones) with
one or more galls as susceptible (1) and the ones with no galls at all resistant (0).
I used families 0 and 1 as a measure of resistance, since both of these families
included clones that were Fr1/Fr1 or Fr1/Fr1. A few cases of no marker-trait co-
segregation could be explained by genetic recombination between the marker and Fr1.

36
To evaluate the probability of a crossover between the molecular marker J7_485A and
the Fr1 locus in a given family I used the formula;
xnx ppxn
xf −−⎟⎟⎠
⎞⎜⎜⎝
⎛= )1()(
where
n is the number of clones in the given family,
x is the number of clones that are putative recombinants in the given family,
p is the recombination fraction.
A
B
C
A
B
C
Figure 3-2 Diagrams illustrating genotype (clone) based phenotyping for disease resistance, susceptibility and escape rate. (A)A clone was declared resistant with five ramets were disease free. Resistant genotypes were not included in calculations of ‘escape rate’. (B) An illustration of a “susceptible” clone with five galled ramets (i.e., an escape rate of 0%). (C)An illustration of a susceptible clone with three galled and two disease free ramets (i.e., escape rate of 40%).
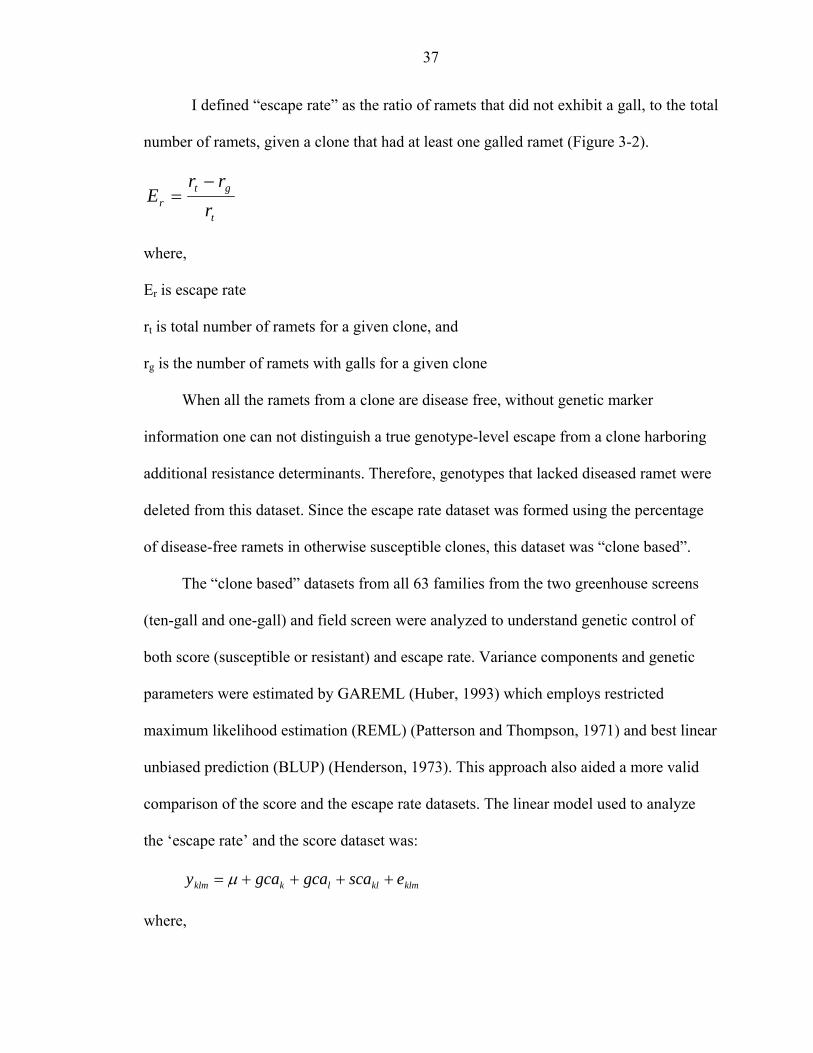
37
I defined “escape rate” as the ratio of ramets that did not exhibit a gall, to the total
number of ramets, given a clone that had at least one galled ramet (Figure 3-2).
t
gtr r
rrE
−=
where,
Er is escape rate
rt is total number of ramets for a given clone, and
rg is the number of ramets with galls for a given clone
When all the ramets from a clone are disease free, without genetic marker
information one can not distinguish a true genotype-level escape from a clone harboring
additional resistance determinants. Therefore, genotypes that lacked diseased ramet were
deleted from this dataset. Since the escape rate dataset was formed using the percentage
of disease-free ramets in otherwise susceptible clones, this dataset was “clone based”.
The “clone based” datasets from all 63 families from the two greenhouse screens
(ten-gall and one-gall) and field screen were analyzed to understand genetic control of
both score (susceptible or resistant) and escape rate. Variance components and genetic
parameters were estimated by GAREML (Huber, 1993) which employs restricted
maximum likelihood estimation (REML) (Patterson and Thompson, 1971) and best linear
unbiased prediction (BLUP) (Henderson, 1973). This approach also aided a more valid
comparison of the score and the escape rate datasets. The linear model used to analyze
the ‘escape rate’ and the score dataset was:
klmkllkklm escagcagcay ++++= μ
where,

38
klmy is the mth clone of the klth full-sib family,
µ is the population mean,
gcak is the random variable female general combining ability (GCA) ~NID(0,σ2gca) k=1
to 32,
gcal is the random variable male general combining ability ~NID(0,σ2gca) l=1 to 32,-
scakl is the random variable specific combining ability (SCA) ~NID(0,σ2sca),
eklm is the random variable error within the experiment ~NID(0,σ2e).
The narrow (h2) and broad (H2) sense heritabilities were calculated according to
(Falconer and Mackay, 1996) based on 0, 1 data for disease incidence (gall score) and
decimal equivalent for escape:
)(ˆ))(ˆ)(ˆ(
ˆˆ4ˆ4
)(ˆ)(ˆ
ˆˆ4
2
222
2
22
PVDVAVH
PVAVh
P
scagca
P
gca
+=
+=
==
σσσ
σσ
where:
P2σ̂ is the phenotypic variance,
)(ˆ PV is the total phenotypic variance,
)(ˆ AV is the additive variance,
)(ˆ DV is the dominance variance.
Genetic Correlations
The genetic correlation at the family level between the ten-gall and the field screens
was calculated on combined data sets by adding Experiment by GCA (2geσ ) and

39
Experiment by Family (2seσ )interaction factors to the linear model and using the Type B
genetic correlation formula (rB; Yamada 1962):
2222
22
FAMILYB ˆˆ2ˆˆ2ˆˆ2)(r
segescagca
scagca
σσσσσσ
++++
=
Asymptotic Z-test
In the field test, there was a possibility of uneven inoculation a result of natural
dispersion of inocula. With the purpose of investigating this possibility I run the
following model in ASREML(Gilmour et al., 2004);
( ) ( ) ( ) ijklmnilmlmnlmmlikijkjiklm escarfamilyclonescagcagcawrcrwcry +++++++++++= *)(**μ
µ is the population mean,
ri is the random replication ~NID(0,σ2r), i=1 to 4,
cj is the random variable column incomplete block ~NID(0,σ2c), j=1 to 40,
wk is the random variable row incomplete block ~NID(0,σ2w), j=1 to 110,
gcal is the random variable female general combining ability (GCA) ~NID(0,σ2gca) k=1
to 32,
gcam is the random variable male general combining ability ~NID(0,σ2gca) l=1 to 32,
scalm is the random variable specific combining ability (SCA) ~NID(0,σ2sca),
clone(family)lmn is the random variable clone within a family ~NID(0,σ2c(family)),
(r*sca) ilm is the random variable replication by family interaction ~NID(0,σ2r*sca)),
eijklmn is the random variable error within the experiment ~NID(0,σ2e).
Asymptotic Z-test for ri, cj, (r*c)ij, (r*w)ik and (r*sca)ilm were calculated by dividing
the variance of these components by corresponding standard deviation.
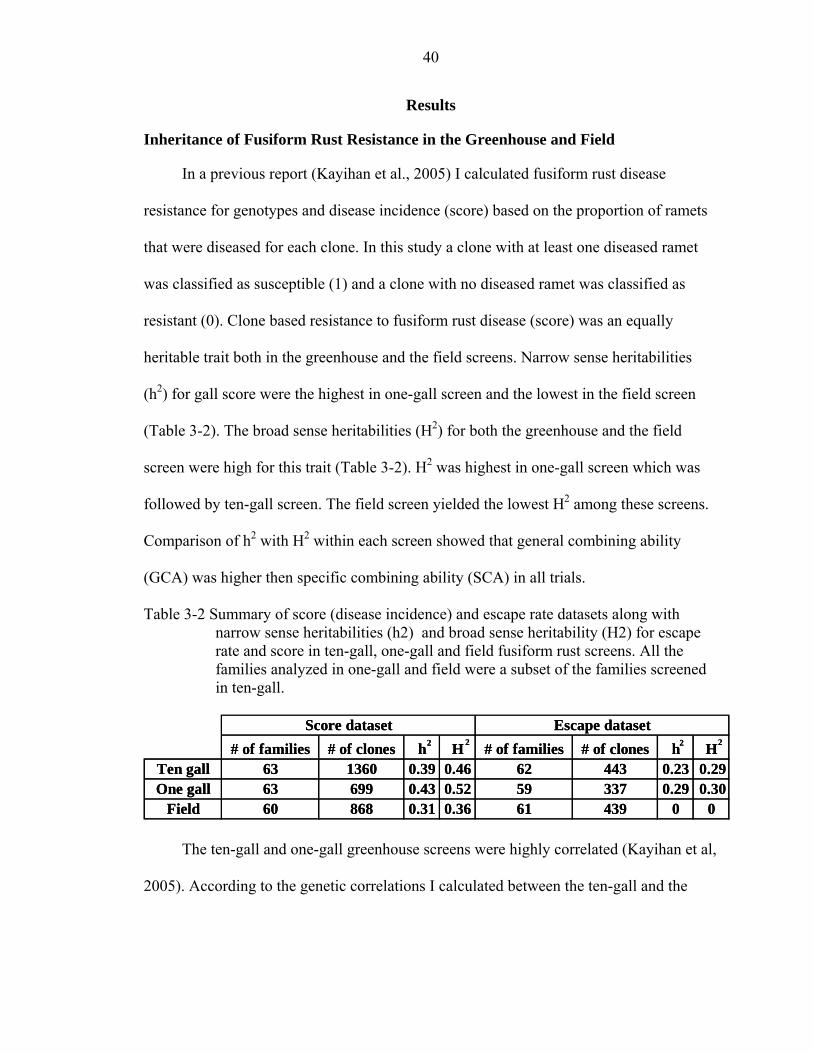
40
Results
Inheritance of Fusiform Rust Resistance in the Greenhouse and Field
In a previous report (Kayihan et al., 2005) I calculated fusiform rust disease
resistance for genotypes and disease incidence (score) based on the proportion of ramets
that were diseased for each clone. In this study a clone with at least one diseased ramet
was classified as susceptible (1) and a clone with no diseased ramet was classified as
resistant (0). Clone based resistance to fusiform rust disease (score) was an equally
heritable trait both in the greenhouse and the field screens. Narrow sense heritabilities
(h2) for gall score were the highest in one-gall screen and the lowest in the field screen
(Table 3-2). The broad sense heritabilities (H2) for both the greenhouse and the field
screen were high for this trait (Table 3-2). H2 was highest in one-gall screen which was
followed by ten-gall screen. The field screen yielded the lowest H2 among these screens.
Comparison of h2 with H2 within each screen showed that general combining ability
(GCA) was higher then specific combining ability (SCA) in all trials.
Table 3-2 Summary of score (disease incidence) and escape rate datasets along with narrow sense heritabilities (h2) and broad sense heritability (H2) for escape rate and score in ten-gall, one-gall and field fusiform rust screens. All the families analyzed in one-gall and field were a subset of the families screened in ten-gall.
2 2 2 2# of families # of clones h H # of families # of clones h HTen gall 63 1360 0.39 0.46 62 443 0.23 0.29One gall 63 699 0.43 0.52 59 337 0.29 0.30
Field 60 868 0.31 0.36 61 439 0 0
Escape datasetScore dataset2 2 2 2# of families # of clones h H # of families # of clones h H
Ten gall 63 1360 0.39 0.46 62 443 0.23 0.29One gall 63 699 0.43 0.52 59 337 0.29 0.30
Field 60 868 0.31 0.36 61 439 0 0
Escape datasetScore dataset
The ten-gall and one-gall greenhouse screens were highly correlated (Kayihan et al,
2005). According to the genetic correlations I calculated between the ten-gall and the

41
field screen for score (disease incidence), the families performed consistently, yielding
high genetic correlation (rf = 0.83) (Figure 3-3).
6
7
8
9
10
11
12
13
1619
20
21
22
23
25
26
27
28
29
30
31
32
34
35
3637
38
3941
42
43
44
46
48
50
51
52
55
56
57
58
60
61
62
64
66 67
68
69
54
0
7015
33
4049
53
0
10
20
30
40
50
60
0 10 20 30 40 50 60
Figure 3-3 Scatter plot of ranks based on BLUP-predicted family genetic values for ten-gall and field were plotted against each other (a rank of ‘1’ is the most resistant and ‘63’ the most susceptible). A least squares regression line is shown after being forced through the origin due to a not-significant intercept. The numbers shown are the family identification codes for the full-sib families.
Validation of Fr1 marker
Prior to the greenhouse screen using the rooted cuttings, the ten-gall inoculum was
tested for virulence against Fr1 with use of Fr1/Fr1 parent 17 seedling progeny in North
Carolina State University (personal communication Dr Henry Amerson). From the 94
seedlings that were inoculated with ten-gall inoculum, 47 were genotyped Fr1 (resistant)
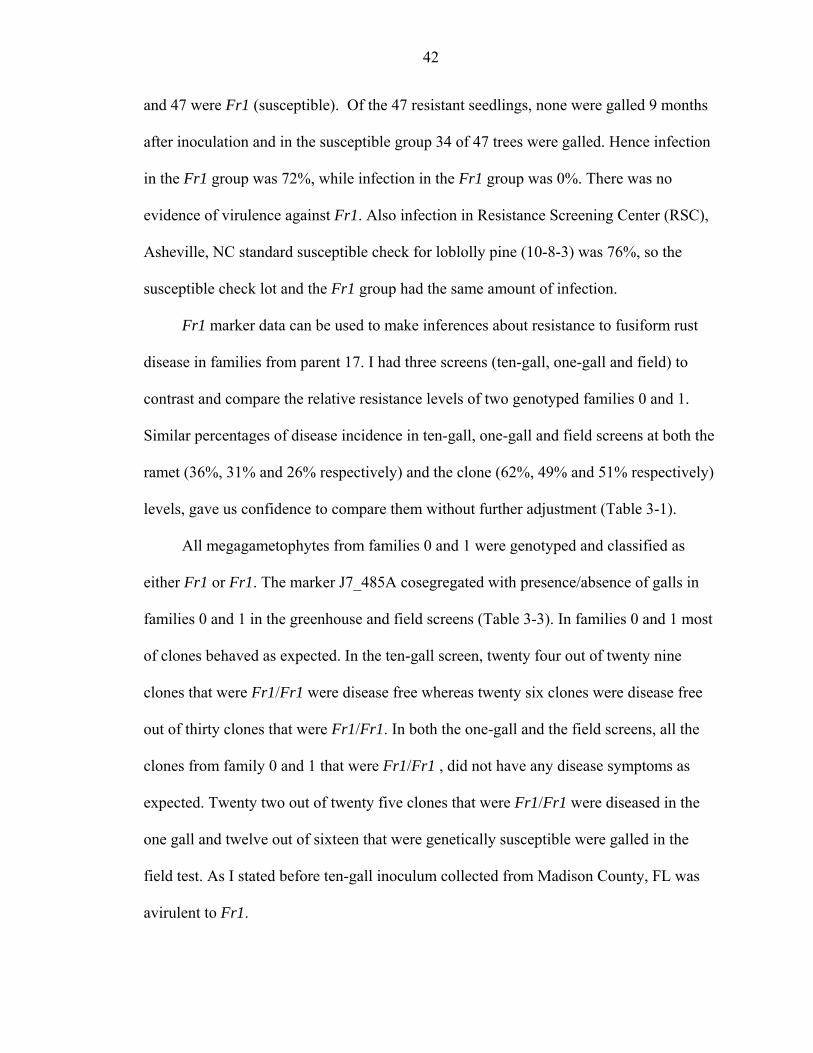
42
and 47 were Fr1 (susceptible). Of the 47 resistant seedlings, none were galled 9 months
after inoculation and in the susceptible group 34 of 47 trees were galled. Hence infection
in the Fr1 group was 72%, while infection in the Fr1 group was 0%. There was no
evidence of virulence against Fr1. Also infection in Resistance Screening Center (RSC),
Asheville, NC standard susceptible check for loblolly pine (10-8-3) was 76%, so the
susceptible check lot and the Fr1 group had the same amount of infection.
Fr1 marker data can be used to make inferences about resistance to fusiform rust
disease in families from parent 17. I had three screens (ten-gall, one-gall and field) to
contrast and compare the relative resistance levels of two genotyped families 0 and 1.
Similar percentages of disease incidence in ten-gall, one-gall and field screens at both the
ramet (36%, 31% and 26% respectively) and the clone (62%, 49% and 51% respectively)
levels, gave us confidence to compare them without further adjustment (Table 3-1).
All megagametophytes from families 0 and 1 were genotyped and classified as
either Fr1 or Fr1. The marker J7_485A cosegregated with presence/absence of galls in
families 0 and 1 in the greenhouse and field screens (Table 3-3). In families 0 and 1 most
of clones behaved as expected. In the ten-gall screen, twenty four out of twenty nine
clones that were Fr1/Fr1 were disease free whereas twenty six clones were disease free
out of thirty clones that were Fr1/Fr1. In both the one-gall and the field screens, all the
clones from family 0 and 1 that were Fr1/Fr1 , did not have any disease symptoms as
expected. Twenty two out of twenty five clones that were Fr1/Fr1 were diseased in the
one gall and twelve out of sixteen that were genetically susceptible were galled in the
field test. As I stated before ten-gall inoculum collected from Madison County, FL was
avirulent to Fr1.

43
Table 3-3 Segregation of marker J7_485A linked to Fr1 gene in families 0 and 1 across ten-gall, one-gall and field screens (658 ramets combined) with disease phenotype. Parent number 17 is heterozygous for pathotype-specific resistance gene Fr1. Family 0 is full sib test crosses between parent 17 (Fr1/Fr1) and 18 (Fr1/Fr1), whereas family 1 is test cross between 17 (Fr1/Fr1) and 19 (Fr1/Fr1). Gray cells highlight the clones that were not in the expected class. Inoculum
Genotype Fr1 (+) or fr1 (-)Gall + - + - + - + - + - + -
Family 0 2 13 11 3 0 14 10 0 0 9 7 1Family 1 2 13 13 2 0 15 12 3 0 9 5 3
Overall observed 4 26 24 5 0 29 22 3 0 18 12 4Overall expected 0 30 29 0 0 29 25 0 0 18 16 0
Ten gall One gall
+ - + -
Field
+ -
Inoculum
Genotype Fr1 (+) or fr1 (-)Gall + - + - + - + - + - + -
Family 0 2 13 11 3 0 14 10 0 0 9 7 1Family 1 2 13 13 2 0 15 12 3 0 9 5 3
Overall observed 4 26 24 5 0 29 22 3 0 18 12 4Overall expected 0 30 29 0 0 29 25 0 0 18 16 0
Ten gall One gall
+ - + -
Field
+ -
However neither the one gall inoculum (Nassau, FL), nor the naturally existing
inoculum in the field trial (Randolph, GA) was tested for avirulence. Yet, 0% of the Fr1/-
clones from genotyped families 0 and 1 were diseased in either the one-gall trial or the
field experiment, and 83% of the Fr1/Fr1 clones from these families were diseased in the
one-gall and field screens. This suggests that the inocula used in those screens were
avirulent to Fr1, too. Furthermore, in an unpublished study varying the numbers of galls
collected from counties; Santa Rosa, Madison, Alachua and Bradford, Florida virulence
against Fr1 was found to be very low in Florida (personal communication Dr Henry
Amerson) (Figure 3-1).
There were a few cases where clones did not perform as anticipated. Four out of
thirty clones in the ten-gall screen developed galls even though they were genotyped as
Fr1/Fr1 (Table 3-3). To investigate potential mislabeling problems needle samples from
all the ramets belonging to these four clones were re-genotyped with markers AJ4 420
and J7 470 to ensure their identity. Based on the marker information, all plants were
marker (-) for AJ4 420 and (+) for J7 470 confirming the genotypes previously assessed.

44
One possible explanation for the lack of marker-trait co-segregation in these cases was
genetic recombination between the marker and Fr1. To evaluate the likelihood of this
occurrence, I calculated the probability of recombination for both full sib families (0 and
1) and low values (9.3x10⁻⁶, 2.1x10⁻⁴ respectively) suggested that a recombination event
between the marker and Fr1 gene was extremely unlikely. On the other hand five out of
twenty nine clones in the ten-gall screen, three out of twenty five clones in the one-gall
screen and four out of sixteen clones in the field did not show disease although they were
genotyped as Fr1/Fr1 (Table 3-3). These were potentially examples of physiological
“escapes” that are described in more detail in the next paragraph.
The Genetic Basis for “Escape Rate”
Clonal replication provided multiple observations of individual host genotypes and
helped identify “escapes” (disease free ramets from a susceptible clone, Figure 3-2).
Because most clones that were susceptible had at least one ramet was diseased (83 % of
Fr1/Fr1 clones fit this category; Table 3-3), I used all of the families from greenhouse
and field screens in the analysis. In an idealized experiment in which the “escape rate”
(ER) was zero, all ramets from a given clone would be either gall-free or galled. If a
histogram is plotted illustrating the percentage of galled ramets for a given clone in an
experiment without any escapes I would have two bars; one at 0 percent (resistant); and a
second one at 100 percent (susceptible). To evaluate the distribution of percentage of
galled ramets per clone in each screen, I plotted histograms for the ten-gall, one-gall and
field tests (Figure 3-4). The existence of the bars at 20%-80% drew attention to the
significance of escapes in these screens. This suggested a role for one or more
environmental factors that prevented normal expression of the disease phenotype.

45
0
50
100
150
200
250
300
350
400
450
500
550
0% 20% 40% 60% 80% 100%
Percentage of galled ramets per clone in Ten-gall screen
Num
ber
of c
lone
s
0
50
100
150
200
250
300
350
400
0% 20% 40% 60% 80% 100%
Percentage of galled ramets per clone in One-gall screen
Num
ber
of c
lone
s
0
50
100
150
200
250
300
350
400
450
500
0% 20% 40% 60% 80% 100%
Percentage of galled ramets per clone in the Field
Num
ber
of c
lone
sN
umbe
r of
clo
nes
Num
ber
of c
lone
sN
umbe
r of
clo
nes
A
C
B
0
50
100
150
200
250
300
350
400
450
500
550
0% 20% 40% 60% 80% 100%
Percentage of galled ramets per clone in Ten-gall screen
Num
ber
of c
lone
s
0
50
100
150
200
250
300
350
400
0% 20% 40% 60% 80% 100%
Percentage of galled ramets per clone in One-gall screen
Num
ber
of c
lone
s
0
50
100
150
200
250
300
350
400
450
500
0% 20% 40% 60% 80% 100%
Percentage of galled ramets per clone in the Field
Num
ber
of c
lone
s
0
50
100
150
200
250
300
350
400
450
500
550
0% 20% 40% 60% 80% 100%
Percentage of galled ramets per clone in Ten-gall screen
Num
ber
of c
lone
s
0
50
100
150
200
250
300
350
400
0% 20% 40% 60% 80% 100%
Percentage of galled ramets per clone in One-gall screen
Num
ber
of c
lone
s
0
50
100
150
200
250
300
350
400
450
500
0% 20% 40% 60% 80% 100%
Percentage of galled ramets per clone in the Field
Num
ber
of c
lone
sN
umbe
r of
clo
nes
Num
ber
of c
lone
sN
umbe
r of
clo
nes
A
C
B
Figure 3-4 Distribution of percentage of galled ramets by clone in the ten-gall (A), one-gall (B) and field (C) screens. There were a total of 1471 genotypes (i.e. clones) in all the experiments and each clone was replicated 1-5 times in each experiment.
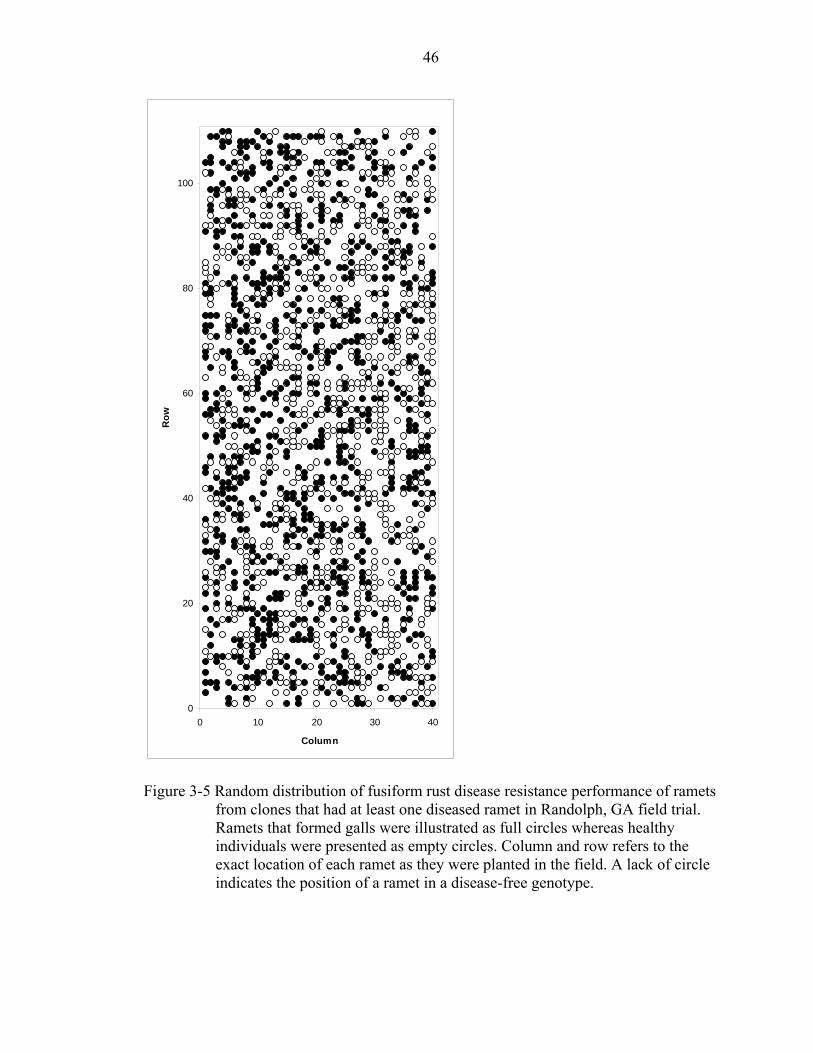
46
0
20
40
60
80
100
0 10 20 30 40
Column
Row
Figure 3-5 Random distribution of fusiform rust disease resistance performance of ramets from clones that had at least one diseased ramet in Randolph, GA field trial. Ramets that formed galls were illustrated as full circles whereas healthy individuals were presented as empty circles. Column and row refers to the exact location of each ramet as they were planted in the field. A lack of circle indicates the position of a ramet in a disease-free genotype.

47
ER might be an environmentally driven event or it might be under control of
genetic factors. Replication of the clones as ramets and placing them randomly in
different blocks enabled us to calculate escape rate for each clone and compute
heritability for this trait. Clones with no galled ramets were not included in the analysis
since genetic and physiological resistance cannot be distinguished in these cases.
According to our calculations, ER was nearly as heritable as score (disease incidence) in
both greenhouse screens (Table 3-2). This was consistent with the explanation that escape
rate in the greenhouse was controlled in part by genes. In contrast, when I ran the field
data for the same trait, the heritability was zero. Thus, ER was only heritable when the
cuttings were in the greenhouse and it was non-genetically controlled in the field. I ruled
out the possibility that infection occurred in a specific pattern (i.e. only on the north side)
and show that infection was spread uniform in the field; I graphed the distribution of
ramets from susceptible clones in the field (Figure 3-5). I also tested distribution of
resistant and susceptible clones in field to find out if there was any non-random pattern to
their placement in field area. Asymptotic Z-test results were not significant implying that
the resistant and susceptible clones and ramets were distributed in field in a random
fashion.
Discussion
In this study I utilized a large, structured population of loblolly pine that had been
phenotyped in the greenhouse and in the field for resistance to fusiform rust disease,
which is an endemic pathosystem in which specific resistance has evolved.
Agreement Among Greenhouse and Field Screens
Greenhouse disease screens are performed to predict resistance classes the
genotypes will fall into in the field. In the greenhouse I can control nearly all conditions

48
whereas our influence on conditions in the field is limited to experimental design. One of
the most important parameter in disease screen is the inoculum; C quercuum which has
varying pathogenicity in geographically different field sites (Kuhlman, 1990; Powers and
Langdon, 1977; Powers Jr, 1985; Snow et al., 1975; Snow and Kais, 1970; Walkinshaw
and Bey, 1981). An implication of genetic variation at the pathogen side is unpredictable
performance of elite crosses across field sites (McKeand et al., 2003). Furthermore, it
was discovered recently that in the field, a single gall is usually induced by a single C.
quercuum basidiospore (Kubisiak et al., 2004), whereas concentrated basidiospore spray
system (CBS) inoculation allows multiple haplotypes to infect and form a single gall
(Kubisiak et al., 2005). Thus, the host can be screened for resistance against different
genotypes of virulent pathogen in a single experiment and resistant genotypes would
perform more consistently across the sites. In this study I not only conservatively score a
clone as susceptible if it had at least one ramet diseased but I also screened both in the
greenhouse and the field. This cautious approach aided us in identification of resistant
individuals with complete penetrance of disease resistance trait. Thus, concentrated
basidiospore spray system I used to inoculate the clonally propagated material in RSC
and transformation of continuous data (clonal means) to binary scale (0< ramets diseased:
susceptible, 0=ramets diseased: resistant) conservatively predicted resistance/
susceptibility of the genotypes I was testing.
I found that greenhouse and field data showed high genetic correlation, presumably
due to genetic similarity of the inocula utilized in the greenhouse screen and the inoculum
in the natural ecosystem at the field site. These results support the earlier reports where
gall score in the field yielded similar heritabilities as greenhouse screens (de Souza et al.,
49
1990; Miller, 1983). Moreover the genetic correlation between greenhouse screens and
the field trial was very high suggesting greenhouse screens can be used to select elite
parents, to breed for fusiform rust resistance in the field. Fusiform rust rankings from the
Randolp, GA field site was obtained from 2nd year data which would be considered as
“preliminary” for this disease. Multiple field site data would be available in near future
and then I can compare the field fusiform rust rankings with the ones I calculated from
the greenhouse screens.
Marker-trait Cosegregation for Fusiform Rust Disease Resistance
Markers segregating with resistance genes have been used for selection purposes
over the last decade (Francia et al., 2005). This kind of information recently became
available for the fusiform rust-loblolly pine pathosystem (Wilcox et al., 1996). Host
genotyping with markers linked to the known pathotype-specific resistance gene Fr1
revealed marker-trait cosegregation in both greenhouse and field screens. I used this
RAPD marker data to predict performances of clones from the two families which were
segregating for Fr1 resistance gene. The ten-gall inoculum used in the greenhouse
experiment was tested for virulence towards Fr1 before this screen and found to be
avirulent (Avr) since after the challenge with this inoculum the clones with Fr1/-
(resistant) genotypes were gall-free and Fr1/Fr1(susceptible) genotypes were mostly
diseased (personal communication Dr Henry Amerson). In the ten-gall screen clones that
were genotyped for Fr1 performed as expected from their genotypes, confirming the
previous results. Cosegregation data in the one-gall screen showed that Fr1/- genotypes
were disease free and Fr1/Fr1 genotypes were mostly diseased, these results suggested
that the one-gall inoculum was also avirulent to Fr1 resistance gene. I did not have
control over inoculum in the field as I did in the greenhouse screens. However, the data

50
collected in Randolph, GA on families 0 and 1 indicated that the marker was holding up
quite well. Thus, all the inocula I used for these screens were avirulent to Fr1.
I identified some clones that were genotyped as Fr1/- but expressed a susceptible
phenotype. I initially considered that these may have been cases in which Fr1/Fr1
genotypes were mislabeled as Fr1/-. I repeated the genotyping reactions on diploid
tissues of diseased cuttings and verified that all of ramets for each of the ‘unexpected’
classes of genotypes (Table 3-3, grey boxes) gave rise to the same genotypic classes that
were assigned to them based on megagametophyte genotyping. Hence I favor the
explanation that these exceptions to marker-trait cosegregation are due to a low level of
virulence in the inoculum, i.e., a low frequency of basidiospores with virulence to Fr1.
Consistent with this view is the observation that all four cases of diseased Fr1 genotypes
in the ten-gall screen were due to single diseased ramets (data not shown). Moreover ten-
gall inoculum was a mixture of ten galls from a high hazard site; also the inoculation load
in greenhouse was much higher than in the field. Diseased Fr1/- clones could be the
result of a recombination event between the marker J7_485A and the actual resistance
gene Fr1; however, our calculations show that the likelihood of having a recombination
between the marker and the resistance gene in the families 0 and 1 was very low, thus
unlikely. Thus, a much more likely explanation for these cases of disease in the presence
of the DNA marker was that these four genotypes were infected with virulent C.
quercuum genotypes that were present at relatively low frequency in the ten-gall
inoculum.
Penetrance of the Fusiform Rust Disease Phenotype
Clonal propagation enabled us to quantify the penetrance of the fusiform rust
disease phenotype in genotyped and non-genotyped families within the structured

51
population. Although the disease phenotype was expressed at a similar frequency in both
greenhouse and field screens – as revealed by similar proportions of galled ramets and
clones – the penetrance of the disease phenotype was dramatically reduced in both
greenhouse screens relative to the field. The basis for this conclusion is that escape rate
(the lack of disease symptom development in a susceptible host genotype) was heritable
and similarly so in magnitude across both greenhouse screens, but not heritable in the
field. The biological explanation for the reduced penetrance of the disease phenotype in
the greenhouse could be driven by pathogenic variation; there may be a low level of
avirulence in the ten-gall and one-gall inocula that correspond to unmonitored host
resistance genes that are segregating in the structured population. If this explanation is
correct, then the ten-gall and one-gall inocula must harbor similarly low levels of
avirulent pathotypes such that equivalent heritability estimates are obtained, and the
heritability of escape rate (ER) is being driven by segregation of resistance genes in the
structured population. Alternatively, the biological explanation for the reduced
penetrance of the disease phenotype in the greenhouse could be driven by host
physiological genetics; there may be inconsistent growth (shoot flush) rhythms among
genotypes that lead to a lack of infection in some genotypes at the time of inoculation. If
this model is correct, then the heritability of ER is being driven by segregation of genes
that directly or indirectly regulate production of shoot tissues that are potential infection
courts. Distinguishing between these competing models should be feasible when
sufficient marker coverage allows association testing between candidate genes and
disease phenotypes (Brown et al., 2004).

52
Pathogen Infection in an Ecologically Relevant Setting
Certainly there were many differences in both host and the pathogen dynamics in
the greenhouse compared to the field. Because the artificial inoculation with rust spores
in a greenhouse screening trial normally occurs within a narrow window of time
(Knighten, 1988), all ramets may not have succulent shoots that are susceptible to the
pathogen at that time. This phenomenon might stem from the fact rooted cuttings harden
off faster than seedlings, preventing an otherwise successful infection. C. quercuum
prefers young actively growing plant tissue to infect (Griggs and Schmidt, 1977), so a
genetically susceptible ramet might not be convenient for infection if it already had
hardened off. In contrast, field-grown trees may be exposed to inoculum periodically over
a much longer time span of several weeks after spring (Schmidt, 1998), so it is much
more likely for the pathogen to find the host in a succulent state. Random distribution of
more favorable micro sites with more water, fertilizer and sunlight likely affected the
escapes in the field. This approach reinforced the conclusions of previous reports (Foster
and Anderson, 1989; Frampton et al., 2000; Stelzer et al., 1998) where rooted cuttings
became physiologically equivalent to the seedlings after several years in field and had
higher resistance to fusiform rust then the seedlings. It is very likely that these changes in
both host and the pathogen lead to loss of heritability of escape rate in the field.
I also investigated the possibility of a non-random dispersion of basidiospores on
field. However, I did not find any evidence to support uneven dispersion of inoculum
over the field which would result in spatial pattern of susceptible ramets suggesting a
driver of zero heritability. The diseased plants were scattered all over the field site in a
random fashion. Thus, the lack of ER heritability in the field was not a consequence of
53
spatially nonrandom infection. I surmise that extended periods of inoculation may occur
under natural conditions, obscuring genetic influences of host shoot phenology on ER.
In this study I examined the architecture of fusiform rust disease resistance in a
large structured population in which I considered resistance as a binomial trait (i.e.,
resistant or susceptible) for each host genotype. This is in contrast to other studies in
which disease resistance was scored on a continuous scale for each genotype, based upon
the proportion of ramets that exhibited disease symptoms (Frampton et al., 2002; Isik et
al., 2004; Kayihan et al., 2005). Both approaches have value, based on objectives;
evaluating resistance at clonal level might aid answering biologically important questions
about disease inheritance whereas the clonal mean for disease incidence approach might
reveal quantitative genetically important questions such as the amount of epistasis. Both
approaches have reduced amount of error with the use of clonal propagation. Moreover,
the existence of these clonally replicated field trials presents an opportunity to monitor
potential shifts in pathogen virulence that may occur in the C. quercuum population. Such
shifts may occur in part due to increased planting of resistant genotypes in the field, and
create potentially greater risks if planting stock is clonal.

54
CHAPTER 4 TRANSCRIPT PROFILING REVEALS POTENTIAL MECHANISMS OF FUSIFORM
RUST DISEASE DEPENDENT SHIFTS IN PINE STEM DEVELOPMENT
Introduction
Loblolly pine is one of the most economically important tree species in the
southeastern United States since loblolly pine plantations cover nearly 13.4 hectares
(Schultz, 1999) in this region and over 1 billion seedlings are planted annually (McKeand
et al., 2003). These plantations have been threatened by the endemic fungus Cronartium
quercuum Berk. Miyable ex Shirai f. sp. fusiforme (Cqf) (Burdsall and Snow, 1977)
which incites fusiform rust disease. Fusiform rust is one of the most destructive fungal
diseases in the South causing damage in millions of dollars every year (Cubbage et al.
2000).
Cqf is a biotrophic fungus that induces gall formation on susceptible trees. The
pathogen causes a number of abnormal changes in the stem – the galls themselves have
an organized cellular structure distinct from a normal stem when viewed using light
microscopy. The Cqf hyphae are intimately associated with cortical cells phloem and
xylem ray cells, and with cambial cells, with the hyperplasia (swelling) of the stem
apparently due to an increase in the number of xylem ray cells and vertical resin ducts in
the diseased stem relative to the healthy tissue (Jackson and Parker, 1958). There is
evidence that galls disrupt water transport in diseased trees based on nuclear magnetic
resonance imaging of galled and healthy stems (MacFall, 1994) and expression of
desiccation-associated genes in galled vs. healthy stems (Myburg et al., in press). Galls

55
weaken the structural integrity of stems such that diseased trees are more susceptible to
breakage by wind, resulting in reduced stocking in stands (Cubbage et al., 2000). Thus
the galls alter both structural and functional features of pine stems.
The interactions between the host and the pathogen during gall formation are far
from being completely understood in the loblolly pine-fusiform rust system. However
recently, transcript enrichment techniques (Warren and Covert, 2004) and microarray
analysis have begun to identify genes from both pine and Cqf that are differentially
expressed at infection, gall initiation and gall expansion stages (Myburg et al., in press).
The Myburg et al. (in press) study is of particular relevance to this chapter, in that I have
re-analyzed the data presented in Myburg et al. to extract information on the expression
profiles of differentially regulated genes. The Myburg et al. paper presented the overall
study design and the analysis focused on contrasts between selected time points to
identify genes with potential roles in specific stages of gall development (i.e., infection,
initiation and expansion). In this study, I focused on the actual expression profiles of
individual genes, which I define as the observed change in transcript abundance across
time intervals. This analysis allowed me to identify genes whose profiles differed by
treatment (pathogen vs. control), genotype (resistant vs. susceptible) and disease state
(diseased vs. healthy).
Materials and Methods
Plant Material, Genotyping and Harvesting
The genetic materials, fingerprinting and sample collection methods are described
in a previous study (Myburg et al. in press). Briefly, seedlings from the cross (10-5 ♀ ×
4666-4 ♂) segregate for Fr1 because it is a testcross between genotype 10-5, which is
heterozygous for the dominant resistance gene Fr1 (Wilcox et al., 1996), and 4666-4
56
(Fr1/Fr1). The megagametophytes were harvested from each germinating seedlings and
the haploid tissue was screened for RAPD markers J7_470 (Wilcox et al., 1996) and
AJ4_420 that define a ~1 cM interval containing Fr1. The RAPD markers identified 350
resistant (Fr1/Fr1; +J7_470, -AJ4_420) and 350 susceptible (Fr1/Fr1; -J7_470,
+AJ4_420) individuals.
Among the 350 individuals in each resistance class 210 individuals (15 seedlings x
2 biological reps x 7 time points) were challenged with Cqf and 140 individuals (10
seedlings x 2 biological reps x 7 time points) were inoculated with distilled water (as
control). Twenty additional seedlings were water inoculated and included in the study as
index plants. These index plants were marked with two black ink spots, one immediately
below the apical bud and the other approximately 1.5 cm below the first spot where the
potential gall formation with take place. Using the references from the index plants,
tissue from this region was harvested before the onset of visible disease symptom. The
first harvest time point was 90 min after inoculation followed by additional harvests at
6hrs, 24hrs, 7 days, 28 days, 56 days and 112 days post inoculation.
Fungal Material and Inoculation
A single aecisospore isolate of C. quercuum that was avirulent to Fr1 (SC 20-21,
obtained from E.G. Kuhlman, USDA-FS, retired) was used in the inoculations that were
performed at the Resistance Screening Center, Asheville, NC following their standard
inoculation protocol except inoculum was increased by 400% to minimize escapes.
Microarray
Experimental design, microarray preparation, target synthesis, microarray
hybridization and scanning were described in Myburg et al. (in press).

57
Statistical Analysis
The experiment was implemented in a balanced incomplete block design (Kerr and
Churchill, 2001) and analyzed using a mixed model approach (Wolfinger, 2001). In order
to compare the gene expression on several arrays treated with RNA from different
treatment X genotype combinations that were dyed with 2 different dyes I applied a
normalization data to the entire dataset. The normalization model was chosen with
respect to the significance of the effects that extracted from the full model where every
effect and the combinations of effects were tested. I assumed dye, genotype, time and
treatment did not change the overall level of gene expression in a single biological
sample. The resulting normalization model for the log2 transformed data (yijklm) was:
ijklmlmjlmlkjiijklm eTMMDMTGDay ++++++++= **μ
where:
μ is the population mean.
ai is the random variable array ~NID(0,σ2a), i=1–56
Dj is the fixed resolvable dye, j=1–2
Gk is the fixed resolvable genotype, k=1–2
Tl is the fixed resolvable treatment, l=1–2
Mm is the fixed resolvable time, m=1–6
D*Mjm is the fixed resolvable dye by time
T*Mlm is the fixed resolvable treatment by time
eijklm is the random variable error within the experiment ~NID(0, σ2e).
Before residual values derived from this model were incorporated into the gene-
specific model I deleted the two early time points (1.5 hrs and 6hrs) since any of the three

58
time points within a 24 hr time period should represent the stage of stem development at
the time of the inoculation. The multiple early sample times were initially chosen to try
and capture gene expression shifts associated with a rapid hypersensitive response;
however this was unsuccessful (Myburg et al., in press). I chose to retain the 24 hr time
point since the inoculation procedure involves incubation of trees in a humid chamber for
6-12 hr, whereas the 24 hr (hereafter referred to as “1day”), 7 day, 56 day and 112 day
samplings were all carried out in the greenhouse. The 1 day, 7 day, 56 day and 112 day
data were then analyzed using the gene model:
ijklmklmkllmklmlkijiijklm eMTGTGTMMGMTGasay ++++++++++= *****)(μ
where:
μ is the population mean.
ai is the random variable array ~NID(0, σ2a), i=1–56.
s(a)ij is the random variable spot number(array) ~NID(0, σ2s(a), j=1–4.
Gk is the fixed resolvable genotype, k=1–2.
Tl is the fixed resolvable treatment, l=1–2.
Mm is the fixed resolvable time, m=1–4.
G*Mkm is the fixed resolvable genotype by time.
T*Mlm is the fixed resolvable treatment by time.
T*Mklm is the fixed resolvable genotype by treatment by time
eijklm is the random variable error within the experiment ~NID(0, σ2e).
I used PROC MIXED in SAS (SAS Institute Inc. SAS/STAT Software version 9,
SAS Institute, Cary, NC) to run both the array and gene level models (Wolfinger et al.,
2001) (Figure 4-1). I identified genes that were significant for genotype, treatment, time,

59
genotype by time, genotype by treatment, time by treatment and genotype by time by
treatment using the ANOVA F-test combined with Bonferroni multiple testing correction
(p=0.01). Using this conservative criterion for significance, a total of 861 genes were
significant for one or more of these effects.
ANOVA F-test + Bonferroni multiple testing correction (p=0.01)
3,705 genes on 56 arrays
861 significant genes with 1 or more significant interactions
All of 27 possible gene*treatment profilesare occupied (Figure 4-2)
218 genes left
Same profile all treatments
72
R vs. S
29
C vs. I
20
H vs. D
97
4 treatments in a 2x2 factorial arrangement(C=water control, I=pathogen inoculated) x (R=Fr1/fr1, S=fr1/fr1)
4 time points (1day, 7days, 56day, and 112days)
Array-level adjustment for the entire experiment(Wolfinger et al., 2001)
Gene*treatment interactions each assigned a “profile” across the three time intervals based on increased (>+3SD), unchanged (+3SD>x>-3SD) or decreased (<-3SD) transcript abundance across adjacent time points
Identification of genes whose profiles vary by treatment
No. of genes:
ANOVA F-test + Bonferroni multiple testing correction (p=0.01)
3,705 genes on 56 arrays
861 significant genes with 1 or more significant interactions
All of 27 possible gene*treatment profilesare occupied (Figure 4-2)
218 genes left
Same profile all treatments
72
R vs. S
29
C vs. I
20
H vs. D
97
Same profile all treatments
72
R vs. S
29
C vs. I
20
H vs. D
97
4 treatments in a 2x2 factorial arrangement(C=water control, I=pathogen inoculated) x (R=Fr1/fr1, S=fr1/fr1)
4 time points (1day, 7days, 56day, and 112days)
Array-level adjustment for the entire experiment(Wolfinger et al., 2001)
Gene*treatment interactions each assigned a “profile” across the three time intervals based on increased (>+3SD), unchanged (+3SD>x>-3SD) or decreased (<-3SD) transcript abundance across adjacent time points
Identification of genes whose profiles vary by treatment
No. of genes:
Figure 4-1 Flow chart illustrating the procedure to identify significant and biologically interesting gene expression profiles. ANOVA was performed for each of the 3705 genes. After experimentwise correction for multiple testing, significant gene*treatment interactions were assigned “profiles” comprised of three time intervals (1d to 7d; 7d to 56d; 56d to 112d) based on shifts in the LS mean for transcript abundance at each adjacent time point. Biologically interesting profile contrasts are explored; “SI vs. rest” is equivalent to “diseased vs. healthy.”
60
I established profiles of transcript abundance that these 861 genes followed on the
four time points (i.e. three intervals) (Figure 4-1). To establish these profiles I began with
the least square mean for each significant gene in each treatment and time point. Using
the “pdiff” option I identified mean differences and standard deviations associated with
the mean differences, for each consecutive time point within each treatment. At any given
time increment (e.g between 1 day and 7 days), expression of a gene can increase,
decrease or not change. A decision rule was applied in which expression for a gene was
declared “not changed” if the absolute mean difference between the adjacent time points
was within 3 standard deviations. However if the absolute mean difference of gene
expression was greater than 3 standard deviations within a time increment it was declared
“increased” or “decreased.” I simply joined the three adjacent time intervals for a gene in
order to assign it a “gene profile.” A gene profile is thus comprised of three integers
representing the change in gene expression across the three adjacent time intervals in the
experiment. For example, a gene that increases in expression at each interval has a profile
1 1 1, whereas a gene that decreases during the first interval and does not change
thereafter has a profile -1 0 0.
Results
Among 3705 genes that were evaluated for gene expression, 861 genes were
significant for time, genotype, treatment, time*treatment, treatment*genotype,
time*genotype, or time*genotype*treatment with Bonferroni corrections for multiple
testing (p=0.01) (Figure 4-1). Since there were only 3 time intervals and 3 possible trends
within each interval, there can be only 27 distinct profiles. The diversity of profile types
among significant genes was sufficiently high to occupy all 27 possible profile groups. I
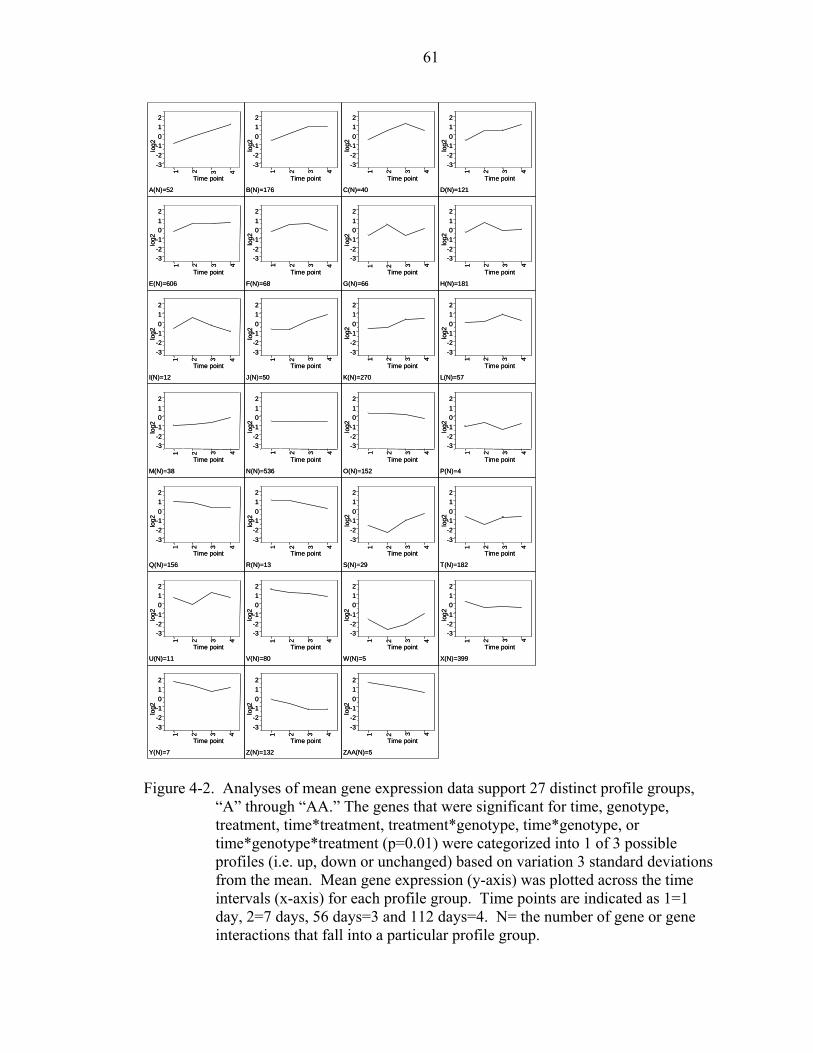
61
-3-2-1012
log2
1 2 3 4
Time point
A(N)=52
-3-2-1012
log2
1 2 3 4
Time point
B(N)=176
-3-2-1012
log2
1 2 3 4
Time point
C(N)=40
-3-2-1012
log2
1 2 3 4
Time point
D(N)=121
-3-2-1012
log2
1 2 3 4
Time point
E(N)=606
-3-2-1012
log2
1 2 3 4
Time point
F(N)=68
-3-2-1012
log2
1 2 3 4
Time point
G(N)=66
-3-2-1012
log2
1 2 3 4
Time point
H(N)=181
-3-2-1012
log2
1 2 3 4
Time point
I(N)=12
-3-2-1012
log2
1 2 3 4
Time point
J(N)=50
-3-2-1012
log2
1 2 3 4
Time point
K(N)=270
-3-2-1012
log2
1 2 3 4
Time point
L(N)=57
-3-2-1012
log2
1 2 3 4
Time point
M(N)=38
-3-2-1012
log2
1 2 3 4
Time point
N(N)=536
-3-2-1012
log2
1 2 3 4
Time point
O(N)=152
-3-2-1012
log2
1 2 3 4
Time point
P(N)=4
-3-2-1012
log2
1 2 3 4
Time point
Q(N)=156
-3-2-1012
log2
1 2 3 4
Time point
R(N)=13
-3-2-1012
log2
1 2 3 4
Time point
S(N)=29
-3-2-1012
log2
1 2 3 4
Time point
T(N)=182
-3-2-1012
log2
1 2 3 4
Time point
U(N)=11
-3-2-1012
log2
1 2 3 4
Time point
V(N)=80
-3-2-1012
log2
1 2 3 4
Time point
W(N)=5
-3-2-1012
log2
1 2 3 4
Time point
X(N)=399
-3-2-1012
log2
1 2 3 4
Time point
Y(N)=7
-3-2-1012
log2
1 2 3 4
Time point
Z(N)=132
-3-2-1012
log2
1 2 3 4
Time point
ZAA(N)=5
-3-2-1012
log2
1 2 3 4
Time point
A(N)=52
-3-2-1012
log2
1 2 3 4
Time point
B(N)=176
-3-2-1012
log2
1 2 3 4
Time point
C(N)=40
-3-2-1012
log2
1 2 3 4
Time point
D(N)=121
-3-2-1012
log2
1 2 3 4
Time point
E(N)=606
-3-2-1012
log2
1 2 3 4
Time point
F(N)=68
-3-2-1012
log2
1 2 3 4
Time point
G(N)=66
-3-2-1012
log2
1 2 3 4
Time point
H(N)=181
-3-2-1012
log2
1 2 3 4
Time point
I(N)=12
-3-2-1012
log2
1 2 3 4
Time point
J(N)=50
-3-2-1012
log2
1 2 3 4
Time point
K(N)=270
-3-2-1012
log2
1 2 3 4
Time point
L(N)=57
-3-2-1012
log2
1 2 3 4
Time point
M(N)=38
-3-2-1012
log2
1 2 3 4
Time point
N(N)=536
-3-2-1012
log2
1 2 3 4
Time point
O(N)=152
-3-2-1012
log2
1 2 3 4
Time point
P(N)=4
-3-2-1012
log2
1 2 3 4
Time point
Q(N)=156
-3-2-1012
log2
1 2 3 4
Time point
R(N)=13
-3-2-1012
log2
1 2 3 4
Time point
S(N)=29
-3-2-1012
log2
1 2 3 4
Time point
T(N)=182
-3-2-1012
log2
1 2 3 4
Time point
U(N)=11
-3-2-1012
log2
1 2 3 4
Time point
V(N)=80
-3-2-1012
log2
1 2 3 4
Time point
W(N)=5
-3-2-1012
log2
1 2 3 4
Time point
X(N)=399
-3-2-1012
log2
1 2 3 4
Time point
Y(N)=7
-3-2-1012
log2
1 2 3 4
Time point
Z(N)=132
-3-2-1012
log2
1 2 3 4
Time point
ZAA(N)=5
Figure 4-2. Analyses of mean gene expression data support 27 distinct profile groups, “A” through “AA.” The genes that were significant for time, genotype, treatment, time*treatment, treatment*genotype, time*genotype, or time*genotype*treatment (p=0.01) were categorized into 1 of 3 possible profiles (i.e. up, down or unchanged) based on variation 3 standard deviations from the mean. Mean gene expression (y-axis) was plotted across the time intervals (x-axis) for each profile group. Time points are indicated as 1=1 day, 2=7 days, 56 days=3 and 112 days=4. N= the number of gene or gene interactions that fall into a particular profile group.
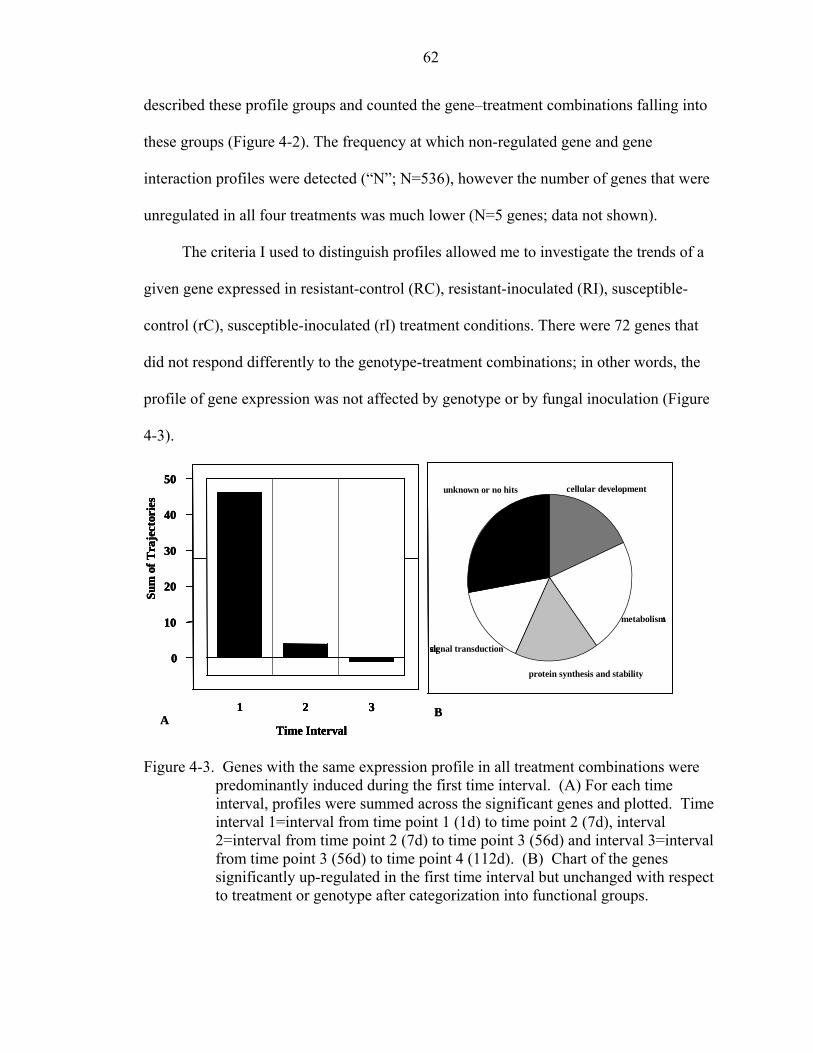
62
described these profile groups and counted the gene–treatment combinations falling into
these groups (Figure 4-2). The frequency at which non-regulated gene and gene
interaction profiles were detected (“N”; N=536), however the number of genes that were
unregulated in all four treatments was much lower (N=5 genes; data not shown).
The criteria I used to distinguish profiles allowed me to investigate the trends of a
given gene expressed in resistant-control (RC), resistant-inoculated (RI), susceptible-
control (rC), susceptible-inoculated (rI) treatment conditions. There were 72 genes that
did not respond differently to the genotype-treatment combinations; in other words, the
profile of gene expression was not affected by genotype or by fungal inoculation (Figure
4-3).
Sum
of T
raje
ctor
ies
0
10
20
30
40
50
1 2 3
Time IntervalA
B
cellular development
metabolism
protein synthesis and stability
signal transduction
unknown or no hits cellular development
metabolism
protein synthesis and stability
signal transduction
unknown or no hits
Sum
of T
raje
ctor
ies
0
10
20
30
40
50
1 2 3
Time Interval
Sum
of T
raje
ctor
ies
0
10
20
30
40
50
1 2 3
Time IntervalA
B
cellular development
metabolism
protein synthesis and stability
signal transduction
unknown or no hits cellular development
metabolism
protein synthesis and stability
signal transduction
unknown or no hits
Figure 4-3. Genes with the same expression profile in all treatment combinations were predominantly induced during the first time interval. (A) For each time interval, profiles were summed across the significant genes and plotted. Time interval 1=interval from time point 1 (1d) to time point 2 (7d), interval 2=interval from time point 2 (7d) to time point 3 (56d) and interval 3=interval from time point 3 (56d) to time point 4 (112d). (B) Chart of the genes significantly up-regulated in the first time interval but unchanged with respect to treatment or genotype after categorization into functional groups.

63
As stated before each gene was assigned a series of numbers (1, 0 or -1) to describe
the trend within a treatment. The sum of these numbers (across genes) for a given time
interval illustrates the profile of overall expression for those genes (Figure 4-3A).
According to this analysis the genes that had the same profiles in all treatment
combinations were predominantly up-regulated within the first time interval (1 day-7
days). For the rest of the time intervals the expressions of the 72 genes were nearly
equally up and down regulated. There were 41 genes with a profile in which expression
increased in interval 1 (Figure 4-3 B); these genes were in category “E” for all gene-
treatment combinations (Figure 4-2).
I extended this analysis to identify potentially interesting genes whose profiles
changed according to treatment (Figure 4-4). Genes significantly regulated between
“control” vs. “inoculated” treatment classes differed mainly in the 3rd interval (56-112
days) (Figure 4-4A). In contrast, genes regulated between “resistant” vs. “susceptible”
genotypic classes differed mainly in the 1st time interval (1-7 days) (Figure 4-4B). In the
comparison of “healthy” (resistant-inoculated, resistant-control, susceptible-control) vs.
“diseased” (susceptible-inoculated) classes (Figure 4-4C) the 2nd time interval (7-56
days) was the interval during which most genes were regulated. Among these
biologically interesting comparisons only the healthy vs. diseased contrast revealed genes
of fungal origin. There were 13 known fungal genes regulated in this category – most of
these occurring in the second time interval (7days-56 days) – with possible additional
fungal genes classified as “unknown” origin (Figure 4-4C).
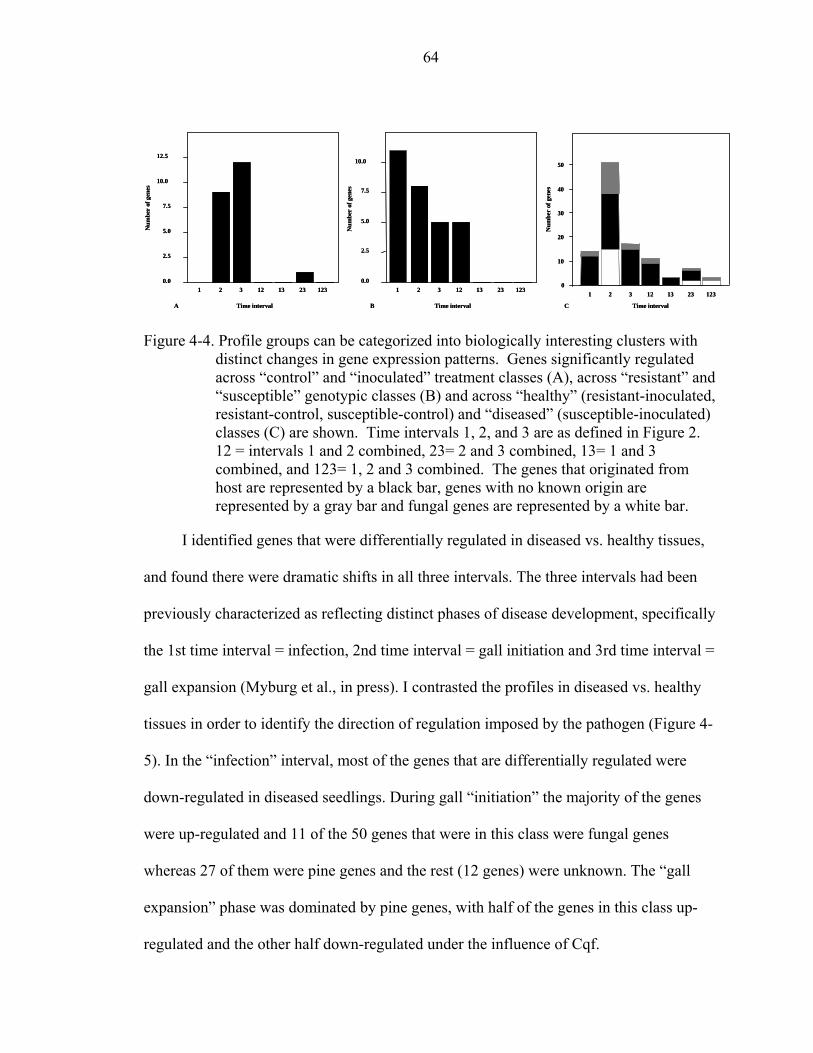
64
0
10
20
30
40
50
Num
ber
of g
enes
1 2 3 12 13 23 123
Time interval
0.0
2.5
5.0
7.5
10.0
1 2 3 12 13 23 123
Time interval
Num
ber
of g
enes
0.0
2.5
5.0
7.5
10.0
12.5
1 2 3 12 13 23 123
Time interval
Num
ber
of g
enes
A B C
0
10
20
30
40
50
Num
ber
of g
enes
1 2 3 12 13 23 123
Time interval
0.0
2.5
5.0
7.5
10.0
1 2 3 12 13 23 123
Time interval
Num
ber
of g
enes
0.0
2.5
5.0
7.5
10.0
12.5
1 2 3 12 13 23 123
Time interval
Num
ber
of g
enes
A B C
Figure 4-4. Profile groups can be categorized into biologically interesting clusters with distinct changes in gene expression patterns. Genes significantly regulated across “control” and “inoculated” treatment classes (A), across “resistant” and “susceptible” genotypic classes (B) and across “healthy” (resistant-inoculated, resistant-control, susceptible-control) and “diseased” (susceptible-inoculated) classes (C) are shown. Time intervals 1, 2, and 3 are as defined in Figure 2. 12 = intervals 1 and 2 combined, 23= 2 and 3 combined, 13= 1 and 3 combined, and 123= 1, 2 and 3 combined. The genes that originated from host are represented by a black bar, genes with no known origin are represented by a gray bar and fungal genes are represented by a white bar.
I identified genes that were differentially regulated in diseased vs. healthy tissues,
and found there were dramatic shifts in all three intervals. The three intervals had been
previously characterized as reflecting distinct phases of disease development, specifically
the 1st time interval = infection, 2nd time interval = gall initiation and 3rd time interval =
gall expansion (Myburg et al., in press). I contrasted the profiles in diseased vs. healthy
tissues in order to identify the direction of regulation imposed by the pathogen (Figure 4-
5). In the “infection” interval, most of the genes that are differentially regulated were
down-regulated in diseased seedlings. During gall “initiation” the majority of the genes
were up-regulated and 11 of the 50 genes that were in this class were fungal genes
whereas 27 of them were pine genes and the rest (12 genes) were unknown. The “gall
expansion” phase was dominated by pine genes, with half of the genes in this class up-
regulated and the other half down-regulated under the influence of Cqf.
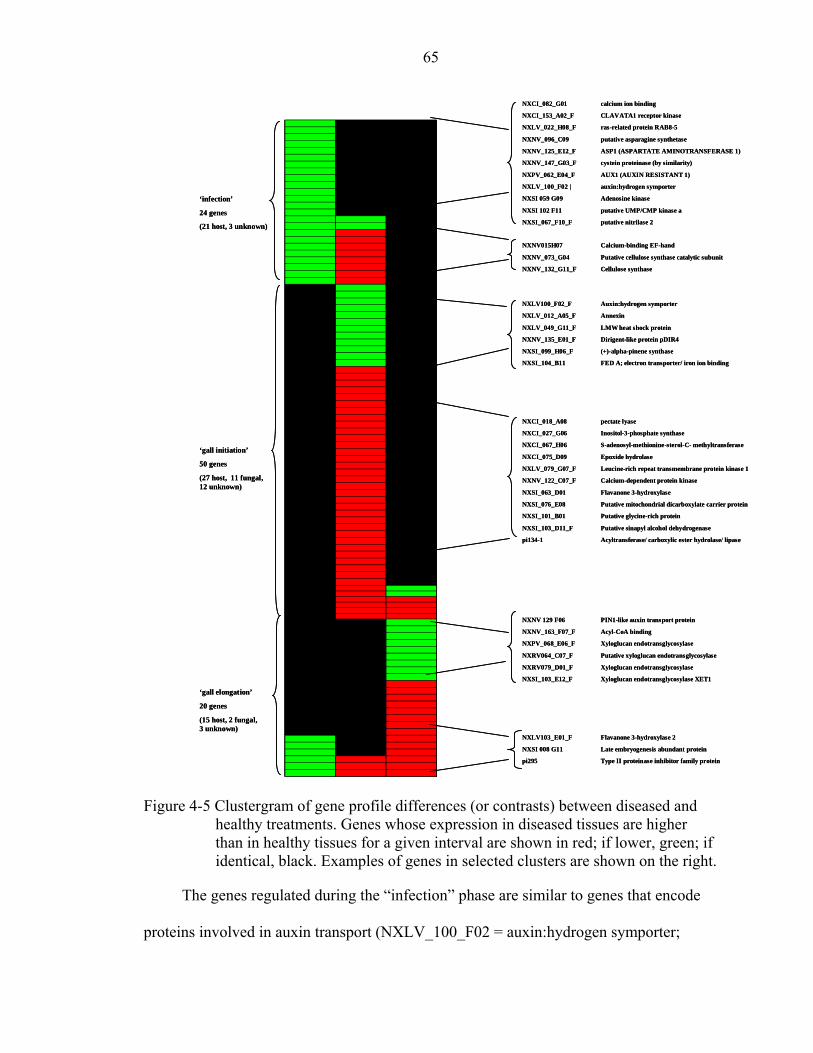
65
NXCI_082_G01 calcium ion binding
NXCI_153_A02_F CLAVATA1 receptor kinase
NXLV_022_H08_F ras-related protein RAB8-5
NXNV_096_C09 putative asparagine synthetase
NXNV_125_E12_F ASP1 (ASPARTATE AMINOTRANSFERASE 1)
NXNV_147_G03_F cystein proteinase (by similarity)
NXPV_062_E04_F AUX1 (AUXIN RESISTANT 1)
NXLV_100_F02 | auxin:hydrogen symporter
NXSI 059 G09 Adenosine kinase
NXSI 102 F11 putative UMP/CMP kinase a
NXSI_067_F10_F putative nitrilase 2
NXNV015H07 Calcium-binding EF-hand
NXNV_073_G04 Putative cellulose synthase catalytic subunit
NXNV_132_G11_F Cellulose synthase
NXLV100_F02_F Auxin:hydrogen symporter
NXLV_012_A05_F Annexin
NXLV_049_G11_F LMW heat shock protein
NXNV_135_E01_F Dirigent-like protein pDIR4
NXSI_099_H06_F (+)-alpha-pinene synthase
NXSI_104_B11 FED A; electron transporter/ iron ion binding
NXCI_018_A08 pectate lyase
NXCI_027_G06 Inositol-3-phosphate synthase
NXCI_067_H06 S-adenosyl-methionine-sterol-C- methyltransferase
NXCI_075_D09 Epoxide hydrolase
NXLV_079_G07_F Leucine-rich repeat transmembrane protein kinase 1
NXNV_122_C07_F Calcium-dependent protein kinase
NXSI_063_D01 Flavanone 3-hydroxylase
NXSI_076_E08 Putative mitochondrial dicarboxylate carrier protein
NXSI_101_B01 Putative glycine-rich protein
NXSI_103_D11_F Putative sinapyl alcohol dehydrogenase
pi134-1 Acyltransferase/ carboxylic ester hydrolase/ lipase
NXNV 129 F06 PIN1-like auxin transport protein
NXNV_163_F07_F Acyl-CoA binding
NXPV_068_E06_F Xyloglucan endotransglycosylase
NXRV064_C07_F Putative xyloglucan endotransglycosylase
NXRV079_D01_F Xyloglucan endotransglycosylase
NXSI_103_E12_F Xyloglucan endotransglycosylase XET1
NXLV103_E01_F Flavanone 3-hydroxylase 2
NXSI 008 G11 Late embryogenesis abundant protein
pi295 Type II proteinase inhibitor family protein
‘infection’
24 genes
(21 host, 3 unknown)
‘gall elongation’
20 genes
(15 host, 2 fungal, 3 unknown)
‘gall initiation’
50 genes
(27 host, 11 fungal, 12 unknown)
Figure 4-5 Clustergram of gene profile differences (or contrasts) between diseased and healthy treatments. Genes whose expression in diseased tissues are higher than in healthy tissues for a given interval are shown in red; if lower, green; if identical, black. Examples of genes in selected clusters are shown on the right.
The genes regulated during the “infection” phase are similar to genes that encode
proteins involved in auxin transport (NXLV_100_F02 = auxin:hydrogen symporter;

66
NXPV_062_E04 F = AUX1 auxin transporter) and auxin biosynthesis (NXSI_067_F10F
= nitrilase 2, an IAA biosynthetic gene). The “infection” phase also appears to involve
calcium fluxes as indicated by regulation of genes involved in calcium signaling
(NXCI_082_G01 = calcium ion binding protein). During gall “initiation” cell wall
modification enzymes appear to be induced under the influence of Cqf
(NXNV_132_G11F = cellulose synthase; NXCI_018_A08 = pectate lyase;
NXSI_101_B01 = putative glycine-rich protein; NXSI_103_D11F = putative sinapyl
alcohol dehydrogenase). During the gall “expansion” phase, four distinct members of the
xyloglucan endotransglycosylase family were down-regulated, potentially in association
with additional cell wall architecture modifications during gall growth (NXSI_103_E12F;
NXPV_068_E06F; NXRV064_C07_F; NXRV079_D01F = xyloglucan endotrans-
glycosylase).
Discussion
Cronartium quercuum is a biotrophic, macrocyclic, heteroecious fungus (Burdsall
and Snow, 1977) that incites abnormal changes in the fusiform rust susceptible pine stem
such as swollen phloem cells, and increase in the number of resin ducts and ray cells
(Jackson and Parker, 1958; Gray and Amerson, 1983, Jewell et al., 1962; Miller et al.,
1976). To identify genes and processes that may underlie the development of disease
symptoms, I used a microarray dataset derived from a time course analysis of fusiform
rust disease development. The genes on the microarray included ESTs and cDNAs
obtained from subtraction libraries and from genes that are expressed during the
interaction between the host and the pathogen, an approach that has been successful in
identifying genes that may condition disease phenotypes (Birch and Kamoun, 2000; Wan
et al., 2002). These powerful tools became available for the fusiform rust-loblolly pine
67
pathosystem recently (Warren and Cover, 2004; Myburg et al., in press). In this study I
investigated fungal and pine gene expression on the pine stems obtained from resistant
and susceptible seedlings that were inoculated with Cqf or water using an experimental
design that involved 4 time points. I captured a diverse array of expression profiles across
the genes that were significant for the main effects or interactions of the main effects I
was testing.
Transcription Profiling Reveals Differential Gene Expression
Diverse patterns of gene expression were observed in this study, such that all
possible combinations of 27 profiles were occupied by at least one gene or gene
interaction. The chip-level model that I used, effectively corrected for statistically
significant treatment and interaction effects at the chip level prior to the gene-level
analysis. This approach assumes that large-scale unidirectional shifts in gene expression
in any particular treatment or treatment combination are based on technical artifacts, not
biologically meaningful effects, in the microarray experiment. A chip-level adjustment
model with fewer terms may be more biologically appropriate for this study, in that it
may identify more genes whose expression is altered; on the other hand, such an
approach may lead to more false positives. The decision to use 3 SD as a criterion for
significance was based on striking a balance between identifying potentially interesting
biological mechanisms, while still being sufficiently conservative to exclude most false
positives. An indication that this criterion was reasonably conservative was the
observation that although all of the gene and gene interactions were highly significant
experimentwise (after Bonferroni correction), 648 profiles were declared biologically
non-significant based on the 3 SD criterion.

68
There were 72 genes that showed identical profiles regardless of treatment
(genotype or pathogen). The majority of the genes in this category belonged to group “E”
which is characterized by an increase in interval 1 and stable expression thereafter. The 1
day to 1 week period of pine seedling growth during this study is predicted to be a time of
active primary stem growth and development. The annotation of the genes in group “E”
for all treatments revealed that they belonged to functional groups such as metabolism,
protein stability, signal transduction and cellular development, which is consistent with
the kinds of functions expected in an actively growing seedling. Notably, these genes are
not affected by genotype or by pathogen challenge, so they are more relevant to stem
development in loblolly pine than to disease development per se. Such genes presumably
reflect the juvenile developmental state of the stem when the seedlings were harvested at
the earliest time point in the experiment.
When the transcriptomes of control and pathogen inoculated seedlings are
compared, one might expect that the difference in gene expression would be at the first
time interval since that would be the period during which pathogen spores are
germinating and contributing to the transcriptome (this might occur on both resistant and
susceptible seedlings). Interestingly, this analysis suggests otherwise, in that the effect of
Cqf inoculation is on the regulation of genes much later than the first time interval. In
fact, the effects of Cqf inoculation on gene expression profiles gradually increased
through the 3rd time interval. Thus, both resistant and susceptible plants gave the same
response to a fungal infection attempt that resulted in differences between the control and
the inoculated plants. It is intriguing to speculate that some kind of pathogen-induced
systemic response might be responsible for this observation. However, known examples
69
of long-term pathogen-induced responses (such as systemic acquired resistance and
induced systemic resistance) are typically incited by an incompatible interaction (resistant
host) distinct from the compatible interaction (susceptible host), which is not consistent
with my findings. In addition, the number of genes in this group was relatively small
(N=20), so further gene expression studies should be performed to confirm and resolve
this phenomenon.
The comparison of profiles in resistant vs. susceptible genotypes revealed
differential gene expression, regardless of whether the plants were inoculated with Cqf or
the water control. This is interesting in and of itself, since it suggests that allelic
differences at the Fr1 locus (and loci linked within 1 cM of Fr1) can be detected at the
level of gene expression. The level of genetic resolution in this study was reasonably
high, in that flanking markers were used for genotyping (thus only double recombinants
within a 1 cM interval would be misclassified), and a relatively large number of seedlings
was bulked for each time point (50 Fr1/Fr1 and 50 Fr1/Fr1 seedlings for each time
point). Therefore the gene expression comparisons at each time point are likely to reflect
allelic differences at or near Fr1 but mixtures of both alleles at unlinked loci. One would
expect that regulation could occur in cis- or in trans-. If cis-regulation is being observed
here, then markers within the regulated genes could be used to create a fine map of loci in
the Fr1 interval. If trans-regulation predominates (e.g., Kirst et al. 2005), then allelic
configuration at or near Fr1 may induce downstream signaling mechanisms that are
manifest on the microarrays.
Influences of Fusiform Rust Disease Development on Gene Profiles
The healthy vs. diseased comparison revealed over a hundred genes that were
differentially regulated across all time intervals. In this section, I elaborate on the types of

70
putative gene functions and physiological mechanisms that may be involved in the
development of the fusiform rust disease state.
In the first interval, a dramatic (down-) regulation of host regulatory genes and
auxin biosynthesis and transport genes, in the developing disease state. Nitrilase 2 is the
enzyme that catalyzes the conversion of indole-3-acetonitrile (IAN) to indole-3-acetic
acid (IAA) which is active auxin (Woodward and Bartel, 2005). The auxin:hydrogen
symporter is an efflux auxin carrier whereas AUX1 is an influx auxin carrier. Therefore,
in diseased seedlings it is feasible that auxin transport as well as biosynthesis is impaired
(or its transport is modified under the influence of the pathogen) within infected cells.
Ca+2 is a well-known second messenger acting downstream of many stimuli including
hormone signaling, and specifically in auxin signaling since calmodulin binding proteins
are encoded by members of the auxin response gene family (SAURs; Yang and Poovaiah,
2000). Interestingly, during gall expansion there is a similar, coordinated regulation of a
putative auxin transport protein-encoding gene (Pin1-like) and a gene encoding a protein
containing a putative calcium-binding EF-hand. This provides another potential
connection between auxin and calcium signaling in fusiform rust disease development. A
potentially fruitful area for future research would be to quantify hormones in developing
fusiform rust galls, since there is also evidence for a potential role of gibberellins in later
stages of gall development (Myburg et al., in press).
In the second interval, transcripts encoded by the fungal pathogen were detected.
The detection of fungal transcripts presumably reflects the establishment of a compatible
interaction with the host (Heath, 1997) whereby the pathogen has begun to disperse
within the host tissue (Walkinshaw, 1978) to manipulate the host sink to its needs. Since

71
Cronartium spp. are ecologically and economically important pathogens on pines (for
example, the white pine blister rust is incited by Cronartium ribicola J. C. Fisch; Jurgens
et al., 2003; Hudgins et al., 2005) there would be value in using transcript profiling
approaches to better understand gene expression shifts in the pathogen component of the
disease interaction in the future.
In the second interval I also observed disease-altered profiles of host genes
potentially involved in modifying cell wall architecture. Cellulose synthase and pectate
lyase were shown to be up-regulated in xylem (compared to leaves) (Paux et al., 2004),
and in Populus reaction wood (Andersson-Gunneras et al., 2006). Sinapyl alcohol
dehydrogenase is involved in the monolignol precursor pathway leading to lignin
biosynthesis (Anterola et al., 2002) and glycine-rich proteins are thought to be involved
in structural integrity and inducible reinforcement of plant cell walls (Ringli et al., 2001).
Thus, host genes related to cell wall synthesis may be induced as a suite of genes required
for rapid cell wall biosynthesis associated with the initiation of a gall.
In the third interval I observed regulation of a multigene family whose products are
involved in growth and cellular architecture (loosening and/or tightening of the cell wall).
Cellulose microfibrils are typically stabilized by xyloglucan moieties, which can be
cleaved via xyloglucan endotransglycosylase (XET) so that cell can alter its shape (Fry et
al., 1992). One of the family members is induced in the gall expansion phase, whereas
four members are repressed, suggesting the family members have non-redundant roles in
cell wall modification. It is interesting to note the rapid yet organized manner in which
specific cell types in fusiform rust galls develop – ray cells increase in size and number,
whereas resin ducts increase in number only (Jackson and Parker, 1958) - whereas the

72
attachments among parenchymal cells appear to loosen (Walkinshaw, 1978). Given the
complex dynamics of cell architecture changes, it is tempting to speculate that some of
the XETs may play roles in specific cell types and thus be performing distinct functions
accordingly.
These results validate the stages of disease development proposed by Myburg et al.
(in press) that seedlings can be analyzed according to the discrete disease phases of
infection (1-7days), gall initiation (7-56 days) and gall expansion (56-112 days).

73
CHAPTER 5 CONCLUSION
Throughout this study I investigated two fungal diseases that are threatening
loblolly pine plantations in southeastern US. The first disease is fusiform rust which is
incited by biotrophic fungus Cronartium quercuum (Burdsall and Snow, 1977), the
second one is pitch canker which is incited by the nectrorophic fungus Fusarium
circinatum (Nirenberg and ODonnell, 1998). Biotrophic and necrotrophic fungi have
different life cycles and infection mechanisms. Thus, a resistant host would respond
differently to these two fungal diseases. A fusiform rust resistant host would recognize C.
quercuum induce HR whereas F. circinatum, the pathogen can survive HR based
defense by detoxification which is a common protection for necrotrophic fungi (Mayer,
Staples, and Gil-ad 2001). Another major difference between C. quercuum and F.
circinatum is the fact that F. circinatum requires wound to enter the host (Kuhlman 1987)
while C. quercuum does not. Another host defense after the infection can be delimiting
fungal growth by forming cell appositions to stop the disease progression. It was
demonstrated that to C. quercuum triggers necrosis in resistant loblolly pine and forms
wall appositions that are partially composed of callose to prevent infection (Gray and
Amerson 1983). It was also reported that a distinct lesion formation is a type of resistance
which limits F. circinatum growth in loblolly pine (Barrows-Broaddus and Dwinell
1983). I propose C. quercuum and F. circinatum have very different life cycles and
infection styles as a result the way host responds to them should be distinct, too. Later in

74
the study I showed that in loblolly pine resistance to fusiform rust is not correlated to
resistance /susceptibility to pitch canker and vice versa.
I also investigated Fr1 marker co-segregation with the disease phenotype in two
families that were a result of a cross between Fr1/fr1 and fr1/fr1 parents. The offspring
from the crosses were genotyped for Fr1 locus. I showed that Fr1 marker information is
predictive of resistance in the both greenhouse and the field as long as the inoculum is
Avr to Fr1 locus. Using clonally propagated material I increased the precision and also
identified the ramets that escape. I showed that escape is a heritable trait in the
greenhouse whereas it becomes inheritable in the field due to inoculum source that is
presented for longer periods of time compared to a few minutes in the artificial
inoculations.
In the last part of this study I switched gears to investigate gene expression in
resistant (Fr1/fr1) and susceptible (fr1/fr1) individuals that were inoculated with water or
C. quercuum in a time frame of 112 days. I showed that there are genes that have unique
expression profiles across control vs. inoculated, resistant vs. susceptible and healthy vs.
diseased. These results would be helpful to parse the disease development in susceptible
loblolly pine seedlings.
Neither fusiform rust nor pitch canker disease resistance is far from being
completely understood. Although this study brings us closer to the answers scientists are
seeking, more research on biology of these fungal diseases is needed.
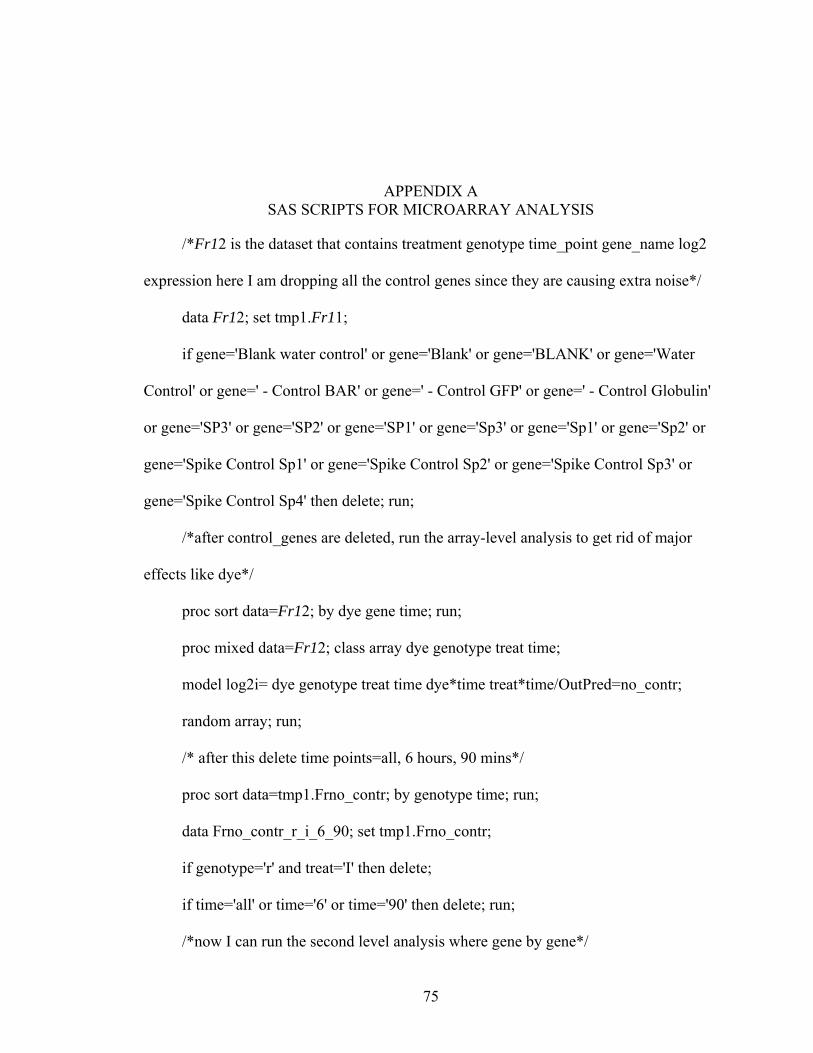
75
APPENDIX A SAS SCRIPTS FOR MICROARRAY ANALYSIS
/*Fr12 is the dataset that contains treatment genotype time_point gene_name log2
expression here I am dropping all the control genes since they are causing extra noise*/
data Fr12; set tmp1.Fr11;
if gene='Blank water control' or gene='Blank' or gene='BLANK' or gene='Water
Control' or gene=' - Control BAR' or gene=' - Control GFP' or gene=' - Control Globulin'
or gene='SP3' or gene='SP2' or gene='SP1' or gene='Sp3' or gene='Sp1' or gene='Sp2' or
gene='Spike Control Sp1' or gene='Spike Control Sp2' or gene='Spike Control Sp3' or
gene='Spike Control Sp4' then delete; run;
/*after control_genes are deleted, run the array-level analysis to get rid of major
effects like dye*/
proc sort data=Fr12; by dye gene time; run;
proc mixed data=Fr12; class array dye genotype treat time;
model log2i= dye genotype treat time dye*time treat*time/OutPred=no_contr;
random array; run;
/* after this delete time points=all, 6 hours, 90 mins*/
proc sort data=tmp1.Frno_contr; by genotype time; run;
data Frno_contr_r_i_6_90; set tmp1.Frno_contr;
if genotype='r' and treat='I' then delete;
if time='all' or time='6' or time='90' then delete; run;
/*now I can run the second level analysis where gene by gene*/

76
proc sort data=Frno_contr_r_i_6_90; by gene;
proc mixed; by gene; class array treat time2 dye spot_number genotype;
model resid=time2 treat genotype time2*treat treat*genotype time2*genotype
time2*genotype*treat;
random array spot_number(array); ods output Tests3=pvalno_c_r_i_6_90; run;
proc sort data=pvalno_c_r_i_6_90; by probf; run; data Gene_no_c_r_i_6_90;
set pvalno_c_r_i_6_90; proc sort; by ProbF;
where ProbF<3.85683E-07 ; run;
proc sort data=Gene_no_c_r_i_6_90; by gene; run;
/* get the significant genes , only one copy of gene should be in the list*/
data once_sig_gene_no_690ri; set Gene_no_c_r_i_6_90;
by gene; if first.gene; run;
/*here I merge the significant gene list with the residuals from the array level
analysis to get lsmeans and stdev associated with them*/
proc sort data=Frno_contr_r_i_6_90; by gene;run;
proc sort data=once_sig_gene_no_690ri; by gene;run; data res_no_690ri;
merge Frno_contr_r_i_6_90 once_sig_gene_no_690ri; by gene; run;
proc sort data=res_no_690ri; by ProbF;
data clean_res_no_690ri; set res_no_690ri; if ProbF<0 then delete; run;
proc sort data=clean_res_no_690ri; by gene; run;
/*it is to get lsmeans and stdev*/
proc mixed; by gene; class array treat time2 dye spot_number genotype;
model resid=time2 treat genotype treat*time2*genotype;
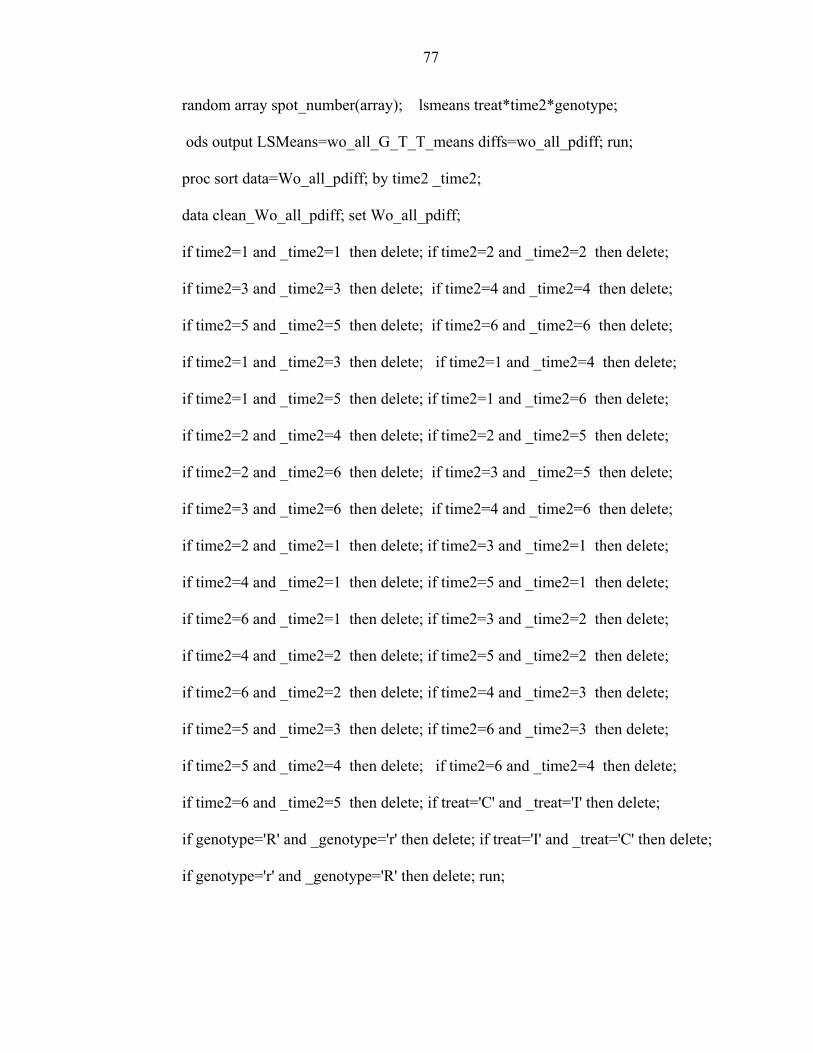
77
random array spot_number(array); lsmeans treat*time2*genotype;
ods output LSMeans=wo_all_G_T_T_means diffs=wo_all_pdiff; run;
proc sort data=Wo_all_pdiff; by time2 _time2;
data clean_Wo_all_pdiff; set Wo_all_pdiff;
if time2=1 and _time2=1 then delete; if time2=2 and _time2=2 then delete;
if time2=3 and _time2=3 then delete; if time2=4 and _time2=4 then delete;
if time2=5 and _time2=5 then delete; if time2=6 and _time2=6 then delete;
if time2=1 and _time2=3 then delete; if time2=1 and _time2=4 then delete;
if time2=1 and _time2=5 then delete; if time2=1 and _time2=6 then delete;
if time2=2 and _time2=4 then delete; if time2=2 and _time2=5 then delete;
if time2=2 and _time2=6 then delete; if time2=3 and _time2=5 then delete;
if time2=3 and _time2=6 then delete; if time2=4 and _time2=6 then delete;
if time2=2 and _time2=1 then delete; if time2=3 and _time2=1 then delete;
if time2=4 and _time2=1 then delete; if time2=5 and _time2=1 then delete;
if time2=6 and _time2=1 then delete; if time2=3 and _time2=2 then delete;
if time2=4 and _time2=2 then delete; if time2=5 and _time2=2 then delete;
if time2=6 and _time2=2 then delete; if time2=4 and _time2=3 then delete;
if time2=5 and _time2=3 then delete; if time2=6 and _time2=3 then delete;
if time2=5 and _time2=4 then delete; if time2=6 and _time2=4 then delete;
if time2=6 and _time2=5 then delete; if treat='C' and _treat='I' then delete;
if genotype='R' and _genotype='r' then delete; if treat='I' and _treat='C' then delete;
if genotype='r' and _genotype='R' then delete; run;

78
APPENDIX B ASREML SCRIPT FOR ASYMTOTIC Z-TEST
Test E fusiform rust only susceptible clones
clone 440 !A
family 61 !A
female 32 !P
male 32 !P
rep 4 !A
inc 110 !A
row 55 !A
col 20 !A
ncol 40 !A
nrow 110 !A
score
/gck/parped.txt !ALPHA
/gck/VINF.prn
score ~ mu !r rep female and(male) family clone
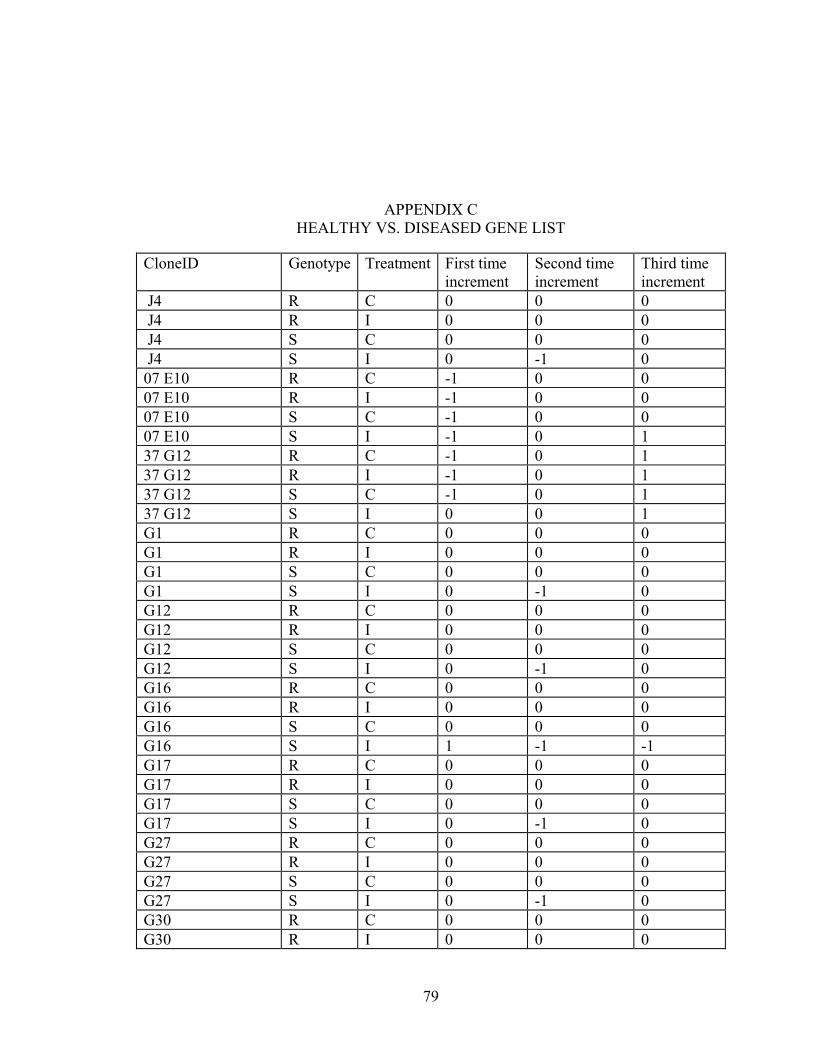
79
APPENDIX C HEALTHY VS. DISEASED GENE LIST
CloneID Genotype Treatment First time increment
Second time increment
Third time increment
J4 R C 0 0 0 J4 R I 0 0 0 J4 S C 0 0 0 J4 S I 0 -1 0 07 E10 R C -1 0 0 07 E10 R I -1 0 0 07 E10 S C -1 0 0 07 E10 S I -1 0 1 37 G12 R C -1 0 1 37 G12 R I -1 0 1 37 G12 S C -1 0 1 37 G12 S I 0 0 1 G1 R C 0 0 0 G1 R I 0 0 0 G1 S C 0 0 0 G1 S I 0 -1 0 G12 R C 0 0 0 G12 R I 0 0 0 G12 S C 0 0 0 G12 S I 0 -1 0 G16 R C 0 0 0 G16 R I 0 0 0 G16 S C 0 0 0 G16 S I 1 -1 -1 G17 R C 0 0 0 G17 R I 0 0 0 G17 S C 0 0 0 G17 S I 0 -1 0 G27 R C 0 0 0 G27 R I 0 0 0 G27 S C 0 0 0 G27 S I 0 -1 0 G30 R C 0 0 0 G30 R I 0 0 0
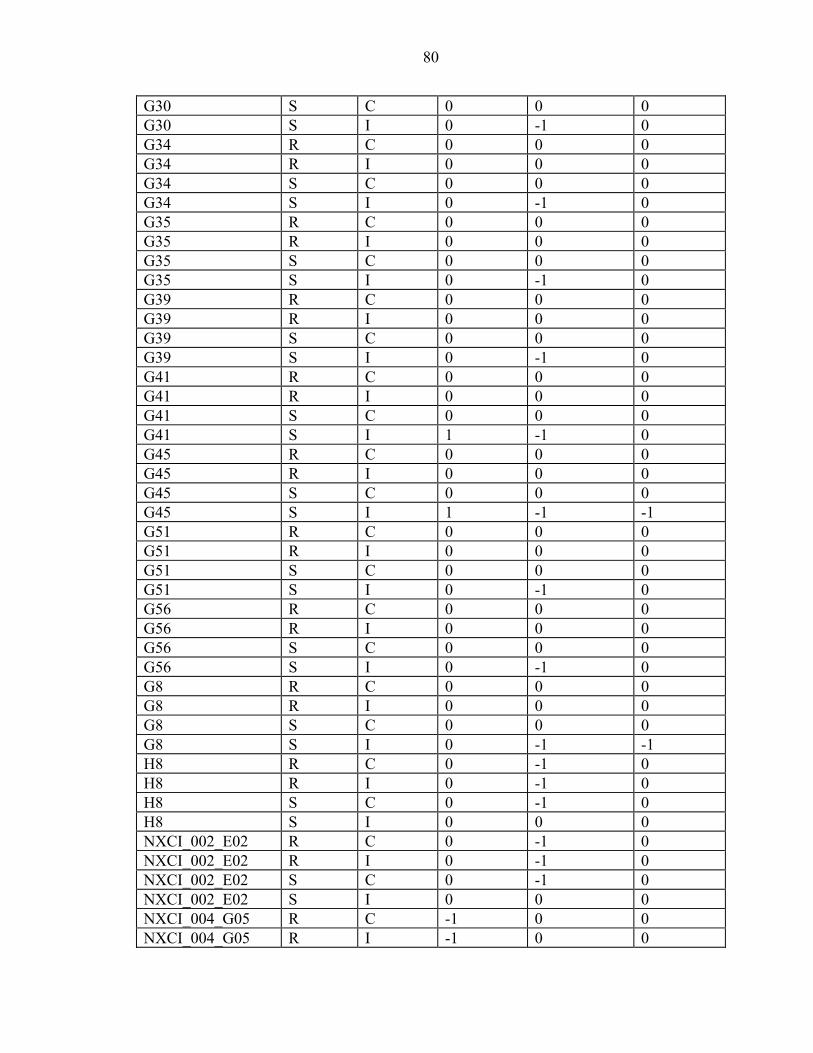
80
G30 S C 0 0 0 G30 S I 0 -1 0 G34 R C 0 0 0 G34 R I 0 0 0 G34 S C 0 0 0 G34 S I 0 -1 0 G35 R C 0 0 0 G35 R I 0 0 0 G35 S C 0 0 0 G35 S I 0 -1 0 G39 R C 0 0 0 G39 R I 0 0 0 G39 S C 0 0 0 G39 S I 0 -1 0 G41 R C 0 0 0 G41 R I 0 0 0 G41 S C 0 0 0 G41 S I 1 -1 0 G45 R C 0 0 0 G45 R I 0 0 0 G45 S C 0 0 0 G45 S I 1 -1 -1 G51 R C 0 0 0 G51 R I 0 0 0 G51 S C 0 0 0 G51 S I 0 -1 0 G56 R C 0 0 0 G56 R I 0 0 0 G56 S C 0 0 0 G56 S I 0 -1 0 G8 R C 0 0 0 G8 R I 0 0 0 G8 S C 0 0 0 G8 S I 0 -1 -1 H8 R C 0 -1 0 H8 R I 0 -1 0 H8 S C 0 -1 0 H8 S I 0 0 0 NXCI_002_E02 R C 0 -1 0 NXCI_002_E02 R I 0 -1 0 NXCI_002_E02 S C 0 -1 0 NXCI_002_E02 S I 0 0 0 NXCI_004_G05 R C -1 0 0 NXCI_004_G05 R I -1 0 0
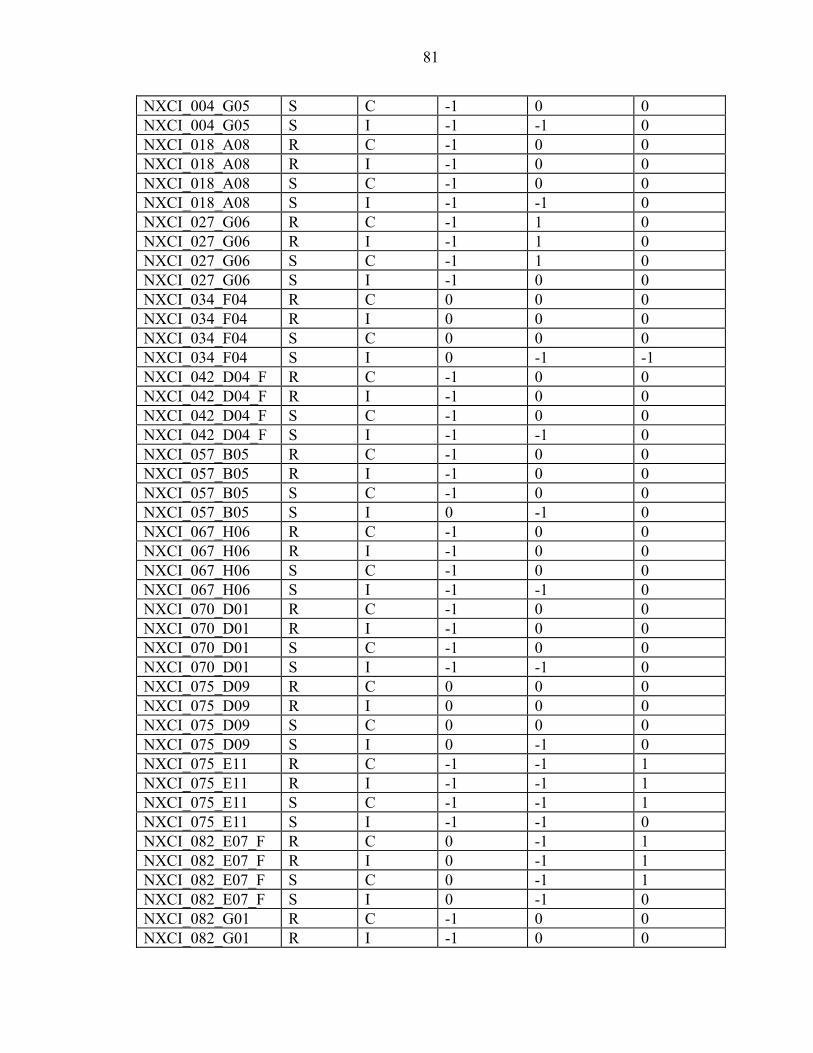
81
NXCI_004_G05 S C -1 0 0 NXCI_004_G05 S I -1 -1 0 NXCI_018_A08 R C -1 0 0 NXCI_018_A08 R I -1 0 0 NXCI_018_A08 S C -1 0 0 NXCI_018_A08 S I -1 -1 0 NXCI_027_G06 R C -1 1 0 NXCI_027_G06 R I -1 1 0 NXCI_027_G06 S C -1 1 0 NXCI_027_G06 S I -1 0 0 NXCI_034_F04 R C 0 0 0 NXCI_034_F04 R I 0 0 0 NXCI_034_F04 S C 0 0 0 NXCI_034_F04 S I 0 -1 -1 NXCI_042_D04_F R C -1 0 0 NXCI_042_D04_F R I -1 0 0 NXCI_042_D04_F S C -1 0 0 NXCI_042_D04_F S I -1 -1 0 NXCI_057_B05 R C -1 0 0 NXCI_057_B05 R I -1 0 0 NXCI_057_B05 S C -1 0 0 NXCI_057_B05 S I 0 -1 0 NXCI_067_H06 R C -1 0 0 NXCI_067_H06 R I -1 0 0 NXCI_067_H06 S C -1 0 0 NXCI_067_H06 S I -1 -1 0 NXCI_070_D01 R C -1 0 0 NXCI_070_D01 R I -1 0 0 NXCI_070_D01 S C -1 0 0 NXCI_070_D01 S I -1 -1 0 NXCI_075_D09 R C 0 0 0 NXCI_075_D09 R I 0 0 0 NXCI_075_D09 S C 0 0 0 NXCI_075_D09 S I 0 -1 0 NXCI_075_E11 R C -1 -1 1 NXCI_075_E11 R I -1 -1 1 NXCI_075_E11 S C -1 -1 1 NXCI_075_E11 S I -1 -1 0 NXCI_082_E07_F R C 0 -1 1 NXCI_082_E07_F R I 0 -1 1 NXCI_082_E07_F S C 0 -1 1 NXCI_082_E07_F S I 0 -1 0 NXCI_082_G01 R C -1 0 0 NXCI_082_G01 R I -1 0 0
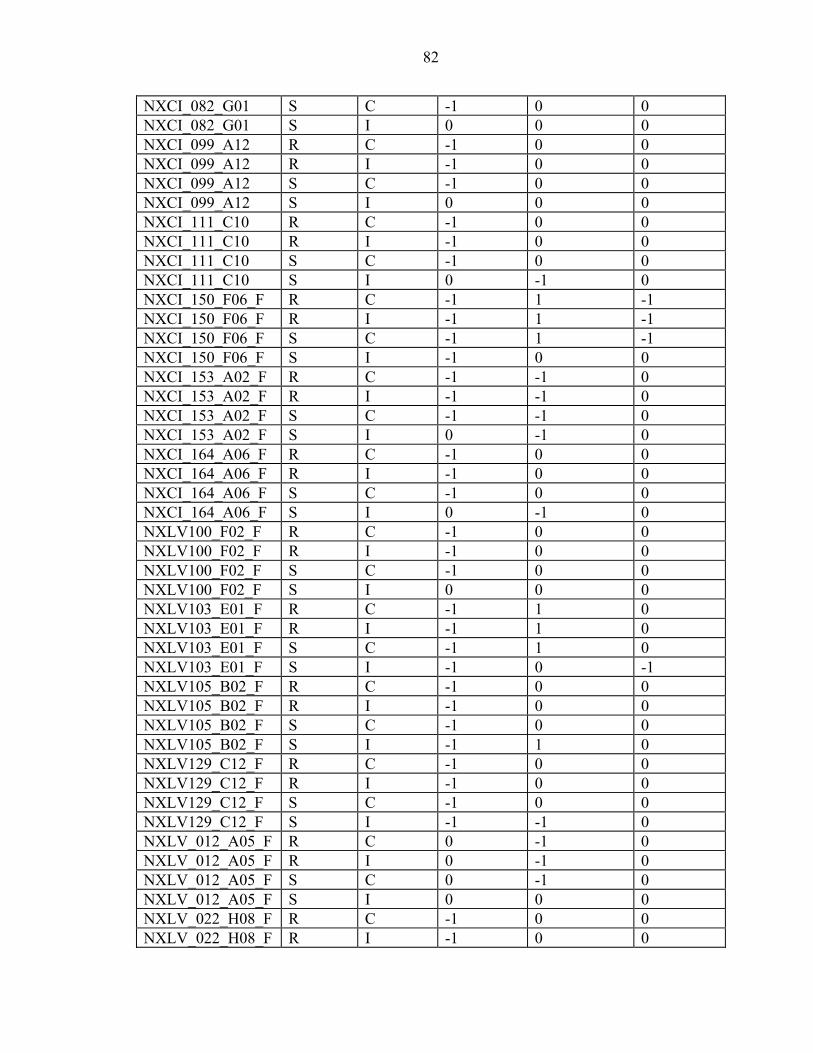
82
NXCI_082_G01 S C -1 0 0 NXCI_082_G01 S I 0 0 0 NXCI_099_A12 R C -1 0 0 NXCI_099_A12 R I -1 0 0 NXCI_099_A12 S C -1 0 0 NXCI_099_A12 S I 0 0 0 NXCI_111_C10 R C -1 0 0 NXCI_111_C10 R I -1 0 0 NXCI_111_C10 S C -1 0 0 NXCI_111_C10 S I 0 -1 0 NXCI_150_F06_F R C -1 1 -1 NXCI_150_F06_F R I -1 1 -1 NXCI_150_F06_F S C -1 1 -1 NXCI_150_F06_F S I -1 0 0 NXCI_153_A02_F R C -1 -1 0 NXCI_153_A02_F R I -1 -1 0 NXCI_153_A02_F S C -1 -1 0 NXCI_153_A02_F S I 0 -1 0 NXCI_164_A06_F R C -1 0 0 NXCI_164_A06_F R I -1 0 0 NXCI_164_A06_F S C -1 0 0 NXCI_164_A06_F S I 0 -1 0 NXLV100_F02_F R C -1 0 0 NXLV100_F02_F R I -1 0 0 NXLV100_F02_F S C -1 0 0 NXLV100_F02_F S I 0 0 0 NXLV103_E01_F R C -1 1 0 NXLV103_E01_F R I -1 1 0 NXLV103_E01_F S C -1 1 0 NXLV103_E01_F S I -1 0 -1 NXLV105_B02_F R C -1 0 0 NXLV105_B02_F R I -1 0 0 NXLV105_B02_F S C -1 0 0 NXLV105_B02_F S I -1 1 0 NXLV129_C12_F R C -1 0 0 NXLV129_C12_F R I -1 0 0 NXLV129_C12_F S C -1 0 0 NXLV129_C12_F S I -1 -1 0 NXLV_012_A05_F R C 0 -1 0 NXLV_012_A05_F R I 0 -1 0 NXLV_012_A05_F S C 0 -1 0 NXLV_012_A05_F S I 0 0 0 NXLV_022_H08_F R C -1 0 0 NXLV_022_H08_F R I -1 0 0

83
NXLV_022_H08_F S C -1 0 0 NXLV_022_H08_F S I 0 0 -1 NXLV_023_D12_F R C -1 -1 0 NXLV_023_D12_F R I -1 -1 0 NXLV_023_D12_F S C -1 -1 0 NXLV_023_D12_F S I 0 0 0 NXLV_049_G11_F R C -1 0 -1 NXLV_049_G11_F R I -1 0 -1 NXLV_049_G11_F S C -1 0 -1 NXLV_049_G11_F S I -1 0 0 NXLV_079_G07_F R C -1 0 0 NXLV_079_G07_F R I -1 0 0 NXLV_079_G07_F S C -1 0 0 NXLV_079_G07_F S I -1 1 0 NXNV 129 F06 R C 1 0 0 NXNV 129 F06 R I 1 0 0 NXNV 129 F06 S C 1 0 0 NXNV 129 F06 S I 1 0 1 NXNV015H07 R C -1 1 -1 NXNV015H07 R I -1 1 -1 NXNV015H07 S C -1 1 -1 NXNV015H07 S I -1 1 0 NXNV027F10 R C 0 1 0 NXNV027F10 R I 0 1 0 NXNV027F10 S C 0 1 0 NXNV027F10 S I 0 0 0 NXNV_073_G04 R C -1 1 0 NXNV_073_G04 R I -1 1 0 NXNV_073_G04 S C -1 1 0 NXNV_073_G04 S I 0 0 0 NXNV_096_C09 R C 0 0 0 NXNV_096_C09 R I 0 0 0 NXNV_096_C09 S C 0 0 0 NXNV_096_C09 S I 0 0 -1 NXNV_118_E06 R C -1 0 0 NXNV_118_E06 R I -1 0 0 NXNV_118_E06 S C -1 0 0 NXNV_118_E06 S I 0 -1 0 NXNV_122_C07_F R C -1 0 0 NXNV_122_C07_F R I -1 0 0 NXNV_122_C07_F S C -1 0 0 NXNV_122_C07_F S I 0 0 0 NXNV_125_E12_F R C -1 0 0 NXNV_125_E12_F R I -1 0 0
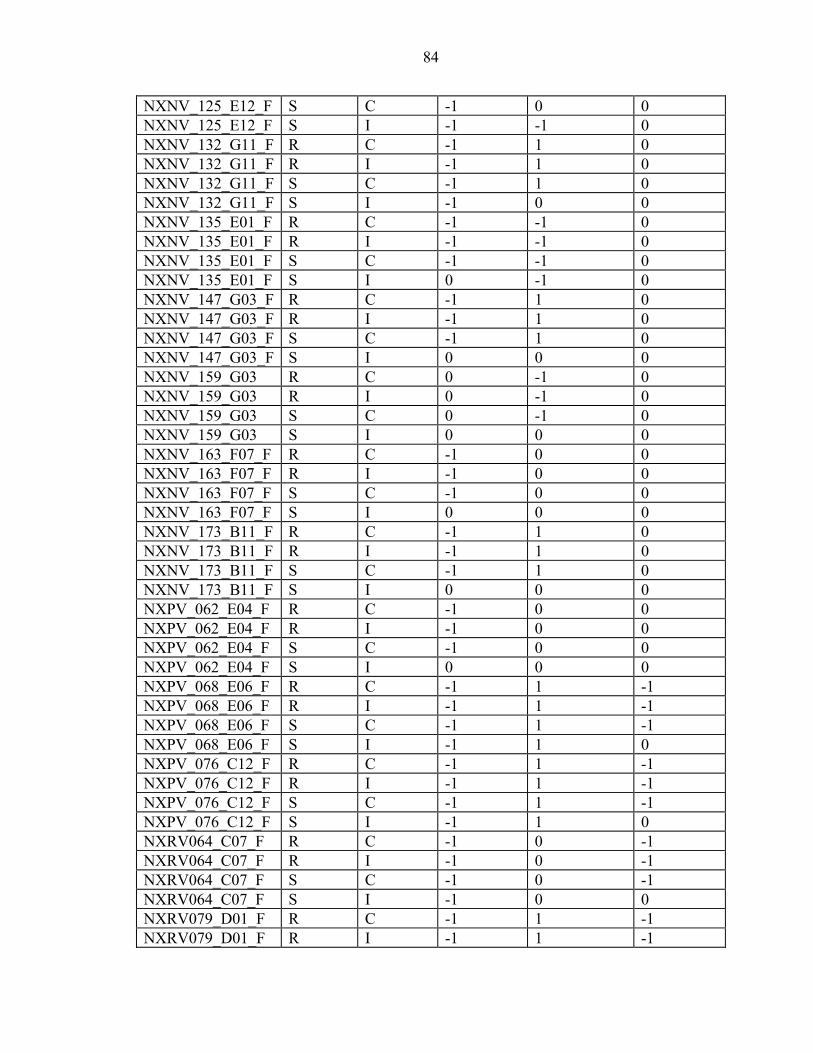
84
NXNV_125_E12_F S C -1 0 0 NXNV_125_E12_F S I -1 -1 0 NXNV_132_G11_F R C -1 1 0 NXNV_132_G11_F R I -1 1 0 NXNV_132_G11_F S C -1 1 0 NXNV_132_G11_F S I -1 0 0 NXNV_135_E01_F R C -1 -1 0 NXNV_135_E01_F R I -1 -1 0 NXNV_135_E01_F S C -1 -1 0 NXNV_135_E01_F S I 0 -1 0 NXNV_147_G03_F R C -1 1 0 NXNV_147_G03_F R I -1 1 0 NXNV_147_G03_F S C -1 1 0 NXNV_147_G03_F S I 0 0 0 NXNV_159_G03 R C 0 -1 0 NXNV_159_G03 R I 0 -1 0 NXNV_159_G03 S C 0 -1 0 NXNV_159_G03 S I 0 0 0 NXNV_163_F07_F R C -1 0 0 NXNV_163_F07_F R I -1 0 0 NXNV_163_F07_F S C -1 0 0 NXNV_163_F07_F S I 0 0 0 NXNV_173_B11_F R C -1 1 0 NXNV_173_B11_F R I -1 1 0 NXNV_173_B11_F S C -1 1 0 NXNV_173_B11_F S I 0 0 0 NXPV_062_E04_F R C -1 0 0 NXPV_062_E04_F R I -1 0 0 NXPV_062_E04_F S C -1 0 0 NXPV_062_E04_F S I 0 0 0 NXPV_068_E06_F R C -1 1 -1 NXPV_068_E06_F R I -1 1 -1 NXPV_068_E06_F S C -1 1 -1 NXPV_068_E06_F S I -1 1 0 NXPV_076_C12_F R C -1 1 -1 NXPV_076_C12_F R I -1 1 -1 NXPV_076_C12_F S C -1 1 -1 NXPV_076_C12_F S I -1 1 0 NXRV064_C07_F R C -1 0 -1 NXRV064_C07_F R I -1 0 -1 NXRV064_C07_F S C -1 0 -1 NXRV064_C07_F S I -1 0 0 NXRV079_D01_F R C -1 1 -1 NXRV079_D01_F R I -1 1 -1
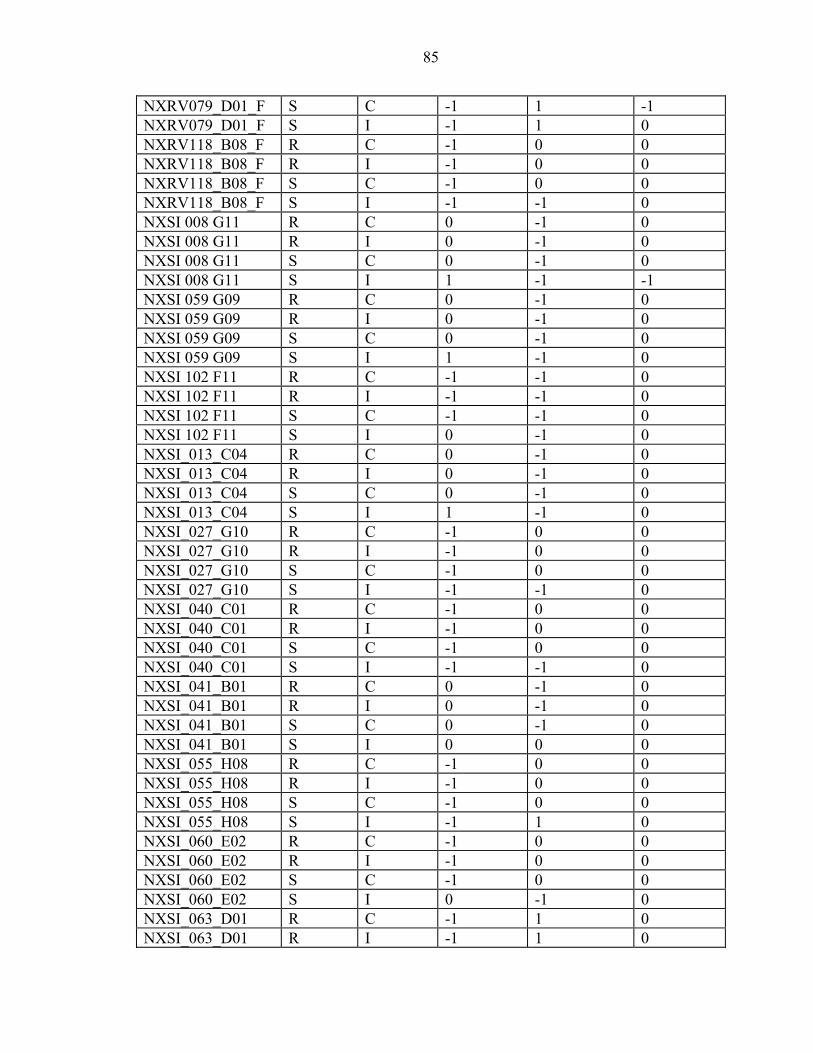
85
NXRV079_D01_F S C -1 1 -1 NXRV079_D01_F S I -1 1 0 NXRV118_B08_F R C -1 0 0 NXRV118_B08_F R I -1 0 0 NXRV118_B08_F S C -1 0 0 NXRV118_B08_F S I -1 -1 0 NXSI 008 G11 R C 0 -1 0 NXSI 008 G11 R I 0 -1 0 NXSI 008 G11 S C 0 -1 0 NXSI 008 G11 S I 1 -1 -1 NXSI 059 G09 R C 0 -1 0 NXSI 059 G09 R I 0 -1 0 NXSI 059 G09 S C 0 -1 0 NXSI 059 G09 S I 1 -1 0 NXSI 102 F11 R C -1 -1 0 NXSI 102 F11 R I -1 -1 0 NXSI 102 F11 S C -1 -1 0 NXSI 102 F11 S I 0 -1 0 NXSI_013_C04 R C 0 -1 0 NXSI_013_C04 R I 0 -1 0 NXSI_013_C04 S C 0 -1 0 NXSI_013_C04 S I 1 -1 0 NXSI_027_G10 R C -1 0 0 NXSI_027_G10 R I -1 0 0 NXSI_027_G10 S C -1 0 0 NXSI_027_G10 S I -1 -1 0 NXSI_040_C01 R C -1 0 0 NXSI_040_C01 R I -1 0 0 NXSI_040_C01 S C -1 0 0 NXSI_040_C01 S I -1 -1 0 NXSI_041_B01 R C 0 -1 0 NXSI_041_B01 R I 0 -1 0 NXSI_041_B01 S C 0 -1 0 NXSI_041_B01 S I 0 0 0 NXSI_055_H08 R C -1 0 0 NXSI_055_H08 R I -1 0 0 NXSI_055_H08 S C -1 0 0 NXSI_055_H08 S I -1 1 0 NXSI_060_E02 R C -1 0 0 NXSI_060_E02 R I -1 0 0 NXSI_060_E02 S C -1 0 0 NXSI_060_E02 S I 0 -1 0 NXSI_063_D01 R C -1 1 0 NXSI_063_D01 R I -1 1 0
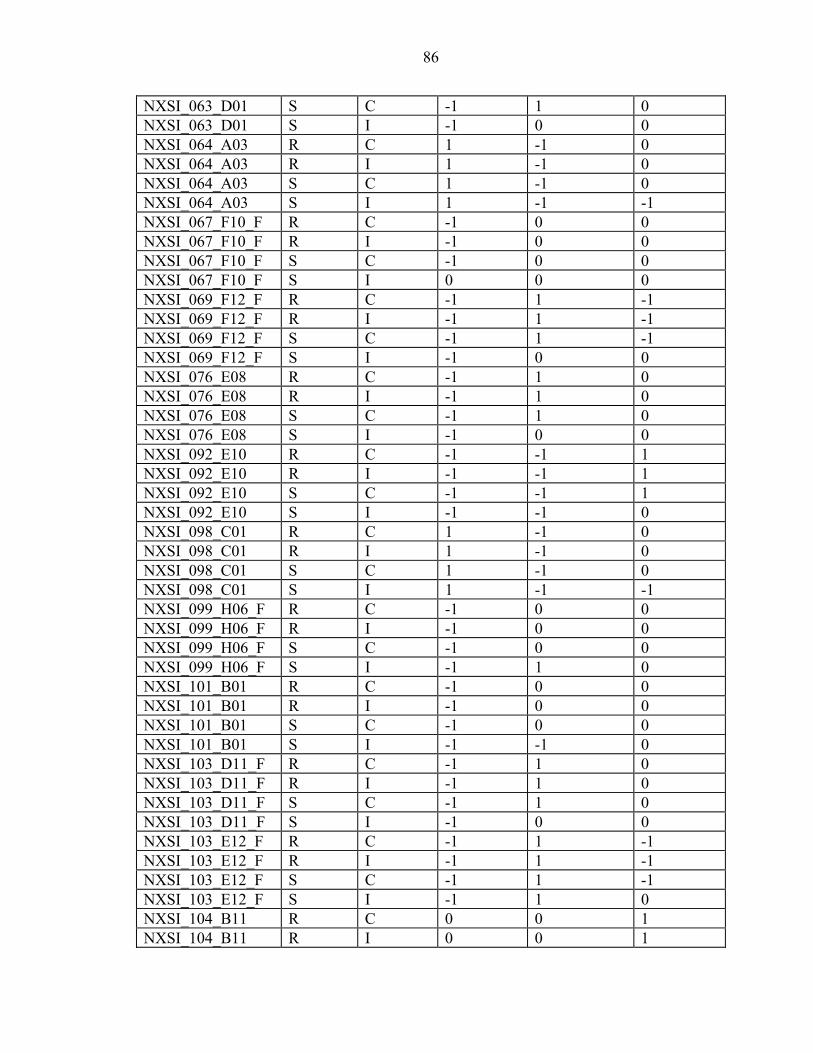
86
NXSI_063_D01 S C -1 1 0 NXSI_063_D01 S I -1 0 0 NXSI_064_A03 R C 1 -1 0 NXSI_064_A03 R I 1 -1 0 NXSI_064_A03 S C 1 -1 0 NXSI_064_A03 S I 1 -1 -1 NXSI_067_F10_F R C -1 0 0 NXSI_067_F10_F R I -1 0 0 NXSI_067_F10_F S C -1 0 0 NXSI_067_F10_F S I 0 0 0 NXSI_069_F12_F R C -1 1 -1 NXSI_069_F12_F R I -1 1 -1 NXSI_069_F12_F S C -1 1 -1 NXSI_069_F12_F S I -1 0 0 NXSI_076_E08 R C -1 1 0 NXSI_076_E08 R I -1 1 0 NXSI_076_E08 S C -1 1 0 NXSI_076_E08 S I -1 0 0 NXSI_092_E10 R C -1 -1 1 NXSI_092_E10 R I -1 -1 1 NXSI_092_E10 S C -1 -1 1 NXSI_092_E10 S I -1 -1 0 NXSI_098_C01 R C 1 -1 0 NXSI_098_C01 R I 1 -1 0 NXSI_098_C01 S C 1 -1 0 NXSI_098_C01 S I 1 -1 -1 NXSI_099_H06_F R C -1 0 0 NXSI_099_H06_F R I -1 0 0 NXSI_099_H06_F S C -1 0 0 NXSI_099_H06_F S I -1 1 0 NXSI_101_B01 R C -1 0 0 NXSI_101_B01 R I -1 0 0 NXSI_101_B01 S C -1 0 0 NXSI_101_B01 S I -1 -1 0 NXSI_103_D11_F R C -1 1 0 NXSI_103_D11_F R I -1 1 0 NXSI_103_D11_F S C -1 1 0 NXSI_103_D11_F S I -1 0 0 NXSI_103_E12_F R C -1 1 -1 NXSI_103_E12_F R I -1 1 -1 NXSI_103_E12_F S C -1 1 -1 NXSI_103_E12_F S I -1 1 0 NXSI_104_B11 R C 0 0 1 NXSI_104_B11 R I 0 0 1

87
NXSI_104_B11 S C 0 0 1 NXSI_104_B11 S I 0 1 1 NXSI_114_A04 R C 0 -1 1 NXSI_114_A04 R I 0 -1 1 NXSI_114_A04 S C 0 -1 1 NXSI_114_A04 S I 0 -1 0 NXSI_115_A12_F R C -1 0 0 NXSI_115_A12_F R I -1 0 0 NXSI_115_A12_F S C -1 0 0 NXSI_115_A12_F S I 0 0 0 NXSI_133_G11 R C 0 -1 0 NXSI_133_G11 R I 0 -1 0 NXSI_133_G11 S C 0 -1 0 NXSI_133_G11 S I 0 0 0 pi134-1 R C 0 1 0 pi134-1 R I 0 1 0 pi134-1 S C 0 1 0 pi134-1 S I 0 0 0 pi150-2 R C 0 -1 1 pi150-2 R I 0 -1 1 pi150-2 S C 0 -1 1 pi150-2 S I 0 -1 0 pi226 R C 0 0 0 pi226 R I 0 0 0 pi226 S C 0 0 0 pi226 S I 0 -1 0 pi243 R C 0 0 0 pi243 R I 0 0 0 pi243 S C 0 0 0 pi243 S I 1 -1 -1 pi266 R C 0 -1 1 pi266 R I 0 -1 1 pi266 S C 0 -1 1 pi266 S I 0 0 1 pi295 R C 0 0 0 pi295 R I 0 0 0 pi295 S C 0 0 0 pi295 S I 1 0 -1 pi310 R C 1 0 0 pi310 R I 1 0 0 pi310 S C 1 0 0 pi310 S I 1 -1 0 pi64-9 R C 0 0 0 pi64-9 R I 0 0 0

88
pi64-9 S C 0 0 0 pi64-9 S I 0 -1 -1
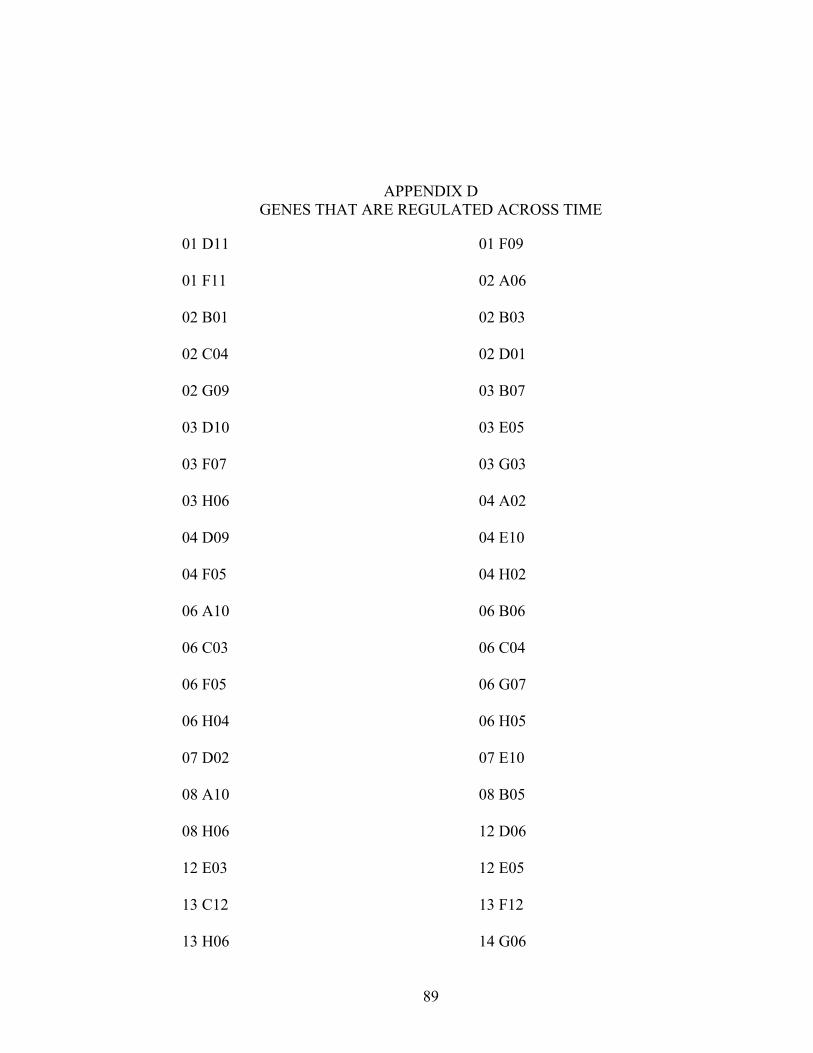
89
APPENDIX D GENES THAT ARE REGULATED ACROSS TIME
01 D11 01 F09
01 F11 02 A06
02 B01 02 B03
02 C04 02 D01
02 G09 03 B07
03 D10 03 E05
03 F07 03 G03
03 H06 04 A02
04 D09 04 E10
04 F05 04 H02
06 A10 06 B06
06 C03 06 C04
06 F05 06 G07
06 H04 06 H05
07 D02 07 E10
08 A10 08 B05
08 H06 12 D06
12 E03 12 E05
13 C12 13 F12
13 H06 14 G06
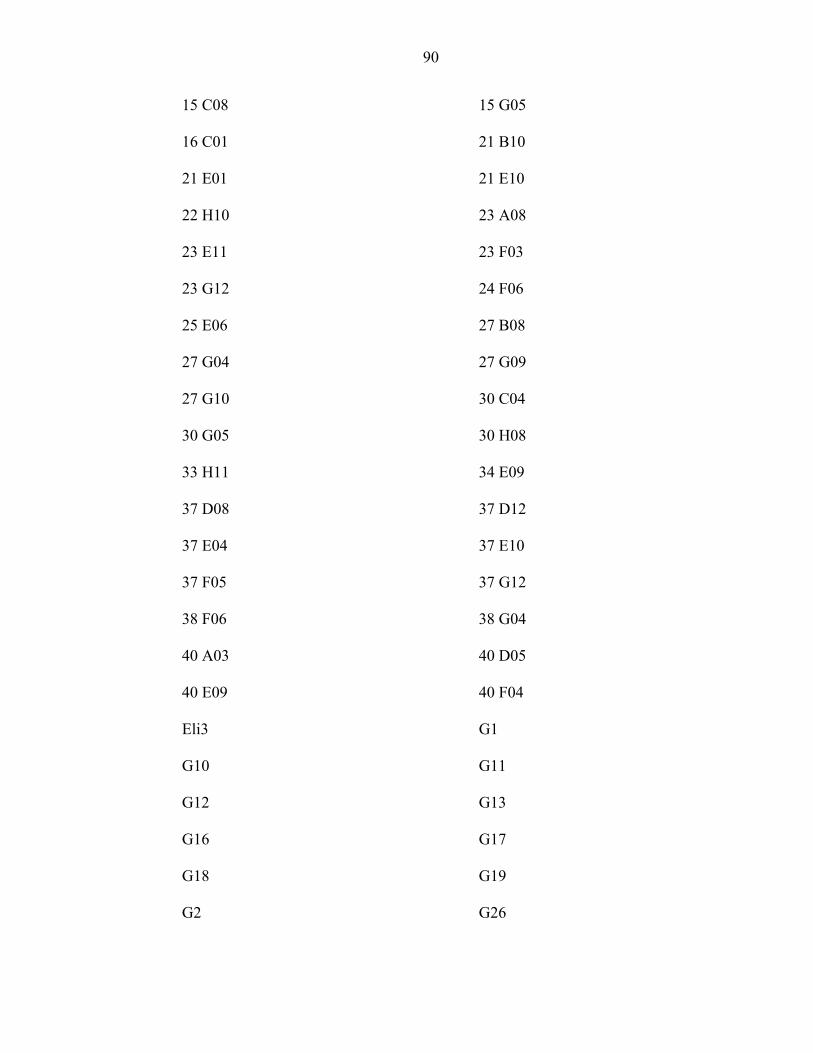
90
15 C08 15 G05
16 C01 21 B10
21 E01 21 E10
22 H10 23 A08
23 E11 23 F03
23 G12 24 F06
25 E06 27 B08
27 G04 27 G09
27 G10 30 C04
30 G05 30 H08
33 H11 34 E09
37 D08 37 D12
37 E04 37 E10
37 F05 37 G12
38 F06 38 G04
40 A03 40 D05
40 E09 40 F04
Eli3 G1
G10 G11
G12 G13
G16 G17
G18 G19
G2 G26
91
G27 G3
G30 G31
G32 G33
G34 G35
G36 G37
G38 G39
G41 G45
G46 G51
G55 G56
G57
G59 G6
G60 G63
G65 G66
G67 G68
G7 G72
G73 G75
G8 G9
H16 H17
H21 H24
H25 H27
H39 H5
H6 H7
H8 J10

92
J11 J16
J18 J19
J2 J4
NXCI 048 F02 NXCI 056 A03
NXCI 069 B02 NXCI 147 C04
NXCI_002_A12 NXCI_002_D01_F
NXCI_002_E02 NXCI_002_E07
NXCI_002_G10_F NXCI_002_G11_F
NXCI_002_H01_F NXCI_002_H03_F
NXCI_002_H04 NXCI_004_G05
NXCI_005_G03 NXCI_007_G08_F
NXCI_008_C01 NXCI_008_D06_F
NXCI_008_D12_F NXCI_008_F09_F
NXCI_008_G03_F NXCI_008_H07_F
NXCI_008_H10 NXCI_009_A10
NXCI_009_B05_F NXCI_009_B08_F
NXCI_018_A08 NXCI_018_D03
NXCI_018_H04 NXCI_019_E11
NXCI_020_A02 NXCI_020_G08_F
NXCI_021_D03 NXCI_022_E07
NXCI_022_G01_F NXCI_023_D01
NXCI_023_F12 NXCI_025_F02
NXCI_025_G06 NXCI_026_C06

93
NXCI_026_D09_F NXCI_026_F10
NXCI_027_E04 NXCI_027_F06_F
NXCI_027_F08_F NXCI_027_G06
NXCI_028_B02_F NXCI_029_G10_F
NXCI_029_H10_F NXCI_031_A08_F
NXCI_031_C04_F NXCI_031_E05
NXCI_033_C02 NXCI_033_F03
NXCI_034_B01 NXCI_034_F04
NXCI_037_B03_F NXCI_040_B11
NXCI_041_E04 NXCI_042_D04_F
NXCI_042_D08 NXCI_043_A11
NXCI_043_F09_F NXCI_044_A12
NXCI_044_F11_F NXCI_045_C01
NXCI_045_G05_F NXCI_046_E05
NXCI_047_A08_F NXCI_047_C05
NXCI_048_H04 NXCI_050_F08
NXCI_055_C01 NXCI_055_C06
NXCI_057_B05 NXCI_057_E03
NXCI_057_E05 NXCI_058_C02
NXCI_058_H01_F NXCI_060_A12_F
NXCI_061_B09 NXCI_061_F02_F
NXCI_062_H01_F NXCI_064_E04
NXCI_066_A11 NXCI_066_F01

94
NXCI_066_G08 NXCI_066_H04
NXCI_067_A10 NXCI_067_H06
NXCI_069_A02 NXCI_069_H11
NXCI_070_B10 NXCI_070_D01
NXCI_070_E11 NXCI_070_G08
NXCI_071_B03 NXCI_071_C01
NXCI_071_F03 NXCI_075_B02_F
NXCI_075_C07 NXCI_075_D09
NXCI_075_E11 NXCI_076_A09
NXCI_076_A10 NXCI_076_E05_F
NXCI_076_F07 NXCI_076_F09
NXCI_076_G08_F NXCI_082_E07
NXCI_082_E07_F NXCI_082_G01
NXCI_082_G01_F NXCI_083_A06
NXCI_083_D09_F NXCI_084_A07_F
NXCI_084_G02 NXCI_085_E04
NXCI_085_E12 NXCI_085_H12
NXCI_086_A09 NXCI_087_F06
NXCI_087_F07 NXCI_093_E01
NXCI_093_H05 NXCI_094_C09
NXCI_094_C11 NXCI_094_E12
NXCI_094_G11 NXCI_095_C01
NXCI_095_D10 NXCI_096_A07
95
NXCI_096_C05 NXCI_097_A07
NXCI_098_D10 NXCI_098_F10
NXCI_099_A12 NXCI_101_B10
NXCI_102_F06 NXCI_103_A12
NXCI_106_C10 NXCI_106_F03_F
NXCI_107_G09_F NXCI_107_H04_F
NXCI_108_E05 NXCI_109_F09
NXCI_111_C10 NXCI_114_B08
NXCI_115_C04 NXCI_116_C11_F
NXCI_116_D01 NXCI_118_F05
NXCI_122_H05 NXCI_124_C07
NXCI_125_D10_F NXCI_127_D04_F
NXCI_128_G07_F NXCI_130_C09
NXCI_131_H09 NXCI_132_B08_F
NXCI_132_B11 NXCI_132_E06
NXCI_132_G02_F NXCI_132_H04
NXCI_134_B04_F NXCI_134_H12
NXCI_136_A08 NXCI_144_F06
NXCI_149_E03 NXCI_149_F01
NXCI_149_F01_F NXCI_149_H12
NXCI_150_A07 NXCI_150_F06_F
NXCI_151_G03_F NXCI_153_A02_F
NXCI_153_F03_F NXCI_153_G06

96
NXCI_153_G06_F NXCI_153_H08_F
NXCI_155_E05_F NXCI_155_H03
NXCI_155_H06_F NXCI_157_D11_F
NXCI_162_A05_F NXCI_164_A06_F
NXCI_164_B04_F NXCI_164_C11_F
NXLV082_A10_F NXLV082_F03_F
NXLV085_B05_F NXLV088_B11_F
NXLV090_G07_F NXLV098_B10_F
NXLV098_E06_F NXLV100_B02_F
NXLV100_F02_F NXLV101_A05_F
NXLV101_G02_F NXLV103_E01_F
NXLV105_B02_F NXLV105_E07_F
NXLV106_G06_F NXLV106_G10_F
NXLV109_B02_F NXLV111_E05_F
NXLV112_B02_F NXLV112_H10_F
NXLV118_B08_F NXLV127_E02_F
NXLV129_C12_F NXLV133_D07_F
NXLV_007_D11_F NXLV_009_A11_F
NXLV_010_H05_F NXLV_012_A05_F
NXLV_014_C04_F NXLV_020_A08_F
NXLV_020_E04_F NXLV_022_E02_F
NXLV_022_H08_F NXLV_023_D12_F
NXLV_024_A02_F NXLV_024_G06_F

97
NXLV_029_D05_F NXLV_030_A06_F
NXLV_031_D02_F NXLV_037_E01_F
NXLV_039_H10_F NXLV_041_H10_F
NXLV_049_G11_F NXLV_065_A09_F
NXLV_070_F01_F NXLV_077_B11_F
NXLV_077_H10_F NXLV_079_G07_F
NXLV_080_H03_F NXNV 074 G09
NXNV 100 H01 NXNV 118 C02
NXNV 129 F06 NXNV002C02
NXNV003F06 NXNV005A03
NXNV005D01 NXNV005H04
NXNV006A11 NXNV015F05
NXNV015H07 NXNV018A10
NXNV019E06 NXNV021C03
NXNV027B07 NXNV027F10
NXNV028A02 NXNV047B02
NXNV047B05 NXNV047E10
NXNV_001_B08 NXNV_005_B04
NXNV_007_G05 NXNV_007_G06
NXNV_008_F05 NXNV_009_C04
NXNV_010_H01 NXNV_015_H07
NXNV_018_E08 NXNV_044_C04
NXNV_044_D09 NXNV_044_G02
98
NXNV_044_G05 NXNV_045_E12
NXNV_046_A05 NXNV_046_B04
NXNV_046_D01 NXNV_046_F03
NXNV_048_F06 NXNV_060_F07
NXNV_060_H10 NXNV_066_B07
NXNV_067_A11 NXNV_067_B01
NXNV_070_F06 NXNV_071_H03
NXNV_072_F02_F NXNV_072_G08_F
NXNV_073_G04 NXNV_074_G01
NXNV_074_G06 NXNV_074_H01_F
NXNV_078_B01_F NXNV_079_G02
NXNV_081_D10 NXNV_083_A10
NXNV_083_D09 NXNV_083_E04
NXNV_083_E11_F NXNV_086_B04
NXNV_086_C07 NXNV_089_A02
NXNV_089_B08 NXNV_089_B08_F
NXNV_089_C07_F NXNV_089_E08_F
NXNV_089_G04 NXNV_091_F02
NXNV_095_B07_F NXNV_095_C08_F
NXNV_095_F08_F NXNV_096_A01_F
NXNV_096_A04 NXNV_096_C09
NXNV_096_E01 NXNV_098_D05
NXNV_105_D01_F NXNV_106_A05
99
NXNV_106_A11_F NXNV_106_F12_F
NXNV_108_E11_F NXNV_108_G08_F
NXNV_117_G05_F NXNV_118_E06
NXNV_120_E10 NXNV_120_F03_F
NXNV_120_F05 NXNV_120_G04_F
NXNV_120_H02 NXNV_122_C07_F
NXNV_122_E06_F NXNV_123_B06
NXNV_124_H02_F NXNV_125_E12_F
NXNV_127_E04 NXNV_127_F09
NXNV_128_D06_F NXNV_129_G07
NXNV_130_G07 NXNV_131_F05
NXNV_131_F08 NXNV_132_B03
NXNV_132_G06_F NXNV_132_G11_F
NXNV_133_A09_F NXNV_133_G06
NXNV_133_H03_F NXNV_134_H10
NXNV_135_E01_F NXNV_136_C05_F
NXNV_136_C12_F NXNV_139_B12
NXNV_139_C09 NXNV_139_C11_F
NXNV_144_C01_F NXNV_145_F12
NXNV_147_G03_F NXNV_147_H08
NXNV_148_E12_F NXNV_148_G06_F
NXNV_149_B07 NXNV_149_E07
NXNV_150_D05_F NXNV_151_G10

100
NXNV_153_F09 NXNV_158_B06_F
NXNV_158_D09 NXNV_159_C03_F
NXNV_159_G03 NXNV_160_C09
NXNV_160_C10 NXNV_162_D12_F
NXNV_162_H07 NXNV_162_H07_F
NXNV_163_F07_F NXNV_163_G07
NXNV_163_G09 NXNV_163_G10_F
NXNV_164_H08 NXNV_173_B11_F
NXNV_173_C05_F NXNV_173_E07
NXNV_181_A11_F NXNV_181_B11_F
NXNV_181_F08_F NXNV_181_H08
NXNV_185_D06 NXNV_185_F02
NXNV_186_A10 NXNV_186_C11_F
NXNV_186_G05 NXPV_007_H07_F
NXPV_008_H09_F NXPV_010_A07_F
NXPV_010_B09_F NXPV_010_C08
NXPV_010_E07_F NXPV_010_H01_F
NXPV_011_F10_F NXPV_012_H12_F
NXPV_013_A04_F NXPV_013_C08_F
NXPV_020_G09_F NXPV_021_F10_F
NXPV_021_G10_F NXPV_025_E07_F
NXPV_028_D12_F NXPV_028_H06_F
NXPV_035_A07_F NXPV_037_C02_F
101
NXPV_041_A04_F NXPV_041_B08_F
NXPV_042_C11_F NXPV_044_F01_F
NXPV_048_C09_F NXPV_049_C03_F
NXPV_052_D04_F NXPV_055_C02_F
NXPV_056_F09_F NXPV_062_E04_F
NXPV_062_E05_F NXPV_063_A12_F
NXPV_066_B11_F NXPV_068_E06_F
NXPV_075_B11_F NXPV_076_A06_F
NXPV_076_C12_F NXPV_077_B05_F
NXPV_078_G08_F NXPV_079_D06_F
NXPV_088_C08_F NXPV_094_G04_F
NXPV_096_D02_F NXPV_097_B11_F
NXPV_108_B07_F NXPV_123_C07_F
NXPV_128_F03_F NXPV_133_B10_F
NXRV055_C03_F NXRV060_D09_F
NXRV060_D10_F NXRV061_G09_F
NXRV061_H10_F NXRV062_H08_F
NXRV064_C07_F NXRV064_G04_F
NXRV066_G02_F NXRV066_H10_F
NXRV072_A01_F NXRV075_C07_F
NXRV077_A04_F NXRV078_H08_F
NXRV079_D01_F NXRV084_E09_F
NXRV087_B06_F NXRV097_A07_F

102
NXRV100_H07_F NXRV101_H07_F
NXRV107_G02_F NXRV112_F01_F
NXRV112_F11_F NXRV114_B02_F
NXRV117_A05_F NXRV118_B08_F
NXRV118_E03_F NXRV120_F06_F
NXRV125_B10_F NXRV126_E10_F
NXRV128_D08_F NXRV130_E04_F
NXRV132_G06_F NXRV_003_A04_F
NXRV_003_H02_F NXRV_011_E07_F
NXRV_016_F09_F NXRV_017_A01_F
NXRV_022_D06_F NXRV_025_D11_F
NXRV_025_E11_F NXRV_025_E12_F
NXRV_037_H06_F NXS1_121_C05
NXSI 044 F04 NXSI 060 H06
NXSI 124 B08 NXSI 008 G11
NXSI 028 D09 NXSI 059 G09
NXSI 102 F11 NXSI 117 B05
NXSI 123 D02 NXSI_007_A07_F
NXSI_012_H11 NXSI_013_C04
NXSI_021_B12 NXSI_021_D01
NXSI_021_E09 NXSI_025_H02
NXSI_027_G10 NXSI_028_G05
NXSI_029_F11 NXSI_030_C06

103
NXSI_031_G08 NXSI_036_C05
NXSI_039_D01 NXSI_040_C01
NXSI_040_D02 NXSI_040_D03_F
NXSI_041_B01 NXSI_041_H12
NXSI_042_G07_F NXSI_042_H05
NXSI_043_C03 NXSI_043_H03
NXSI_044_C10 NXSI_045_A04
NXSI_045_B09 NXSI_045_G03
NXSI_046_B05 NXSI_047_A11_F
NXSI_049_A04_F NXSI_050_C07_F
NXSI_051_G07 NXSI_053_B02
NXSI_053_G04 NXSI_053_G05
NXSI_054_A01 NXSI_054_A09
NXSI_055_B06 NXSI_055_F11
NXSI_055_H08 NXSI_056_F07
NXSI_058_B04 NXSI_058_G02
NXSI_060_B07 NXSI_060_E02
NXSI_061_F04_F NXSI_062_E07
NXSI_063_D01 NXSI_063_E04
NXSI_064_A03 NXSI_064_H06
NXSI_065_C08 NXSI_067_C11
NXSI_067_F10_F NXSI_067_H09_F
NXSI_068_G09 NXSI_069_F12_F

104
NXSI_073_F05 NXSI_075_B04_F
NXSI_076_E08 NXSI_077_F09
NXSI_079_D06 NXSI_079_D09_F
NXSI_081_D01 NXSI_082_H01
NXSI_083_G10_F NXSI_088_C05_F
NXSI_089_E04 NXSI_089_H07
NXSI_090_C05 NXSI_092_E10
NXSI_092_H03_F NXSI_096_G02_F
NXSI_097_H07 NXSI_098_A04
NXSI_098_C01 NXSI_099_F06
NXSI_099_F10 NXSI_099_G06
NXSI_099_H06_F NXSI_100_A04
NXSI_100_C11 NXSI_100_D07
NXSI_100_F02 NXSI_100_F12
NXSI_101_B01 NXSI_101_E11
NXSI_101_H03_F NXSI_102_D03
NXSI_102_F12 NXSI_102_H05
NXSI_103_A08 NXSI_103_A10
NXSI_103_B01 NXSI_103_C04
NXSI_103_D11_F NXSI_103_E12_F
NXSI_103_F08 NXSI_103_H03
NXSI_104_B11 NXSI_104_E11
NXSI_104_H10 NXSI_105_G10
105
NXSI_107_C09 NXSI_108_D12
NXSI_108_H05 NXSI_112_B07
NXSI_112_D01 NXSI_112_D08
NXSI_112_G05_F NXSI_113_B09
NXSI_113_C10_F NXSI_113_D07
NXSI_113_E06_F NXSI_113_G11_F
NXSI_113_H02 NXSI_114_A04
NXSI_114_D12 NXSI_114_G07
NXSI_116_A11 NXSI_116_B04
NXSI_116_F02 NXSI_117_B05
NXSI_117_C06_F NXSI_118_A03
NXSI_118_B03 NXSI_118_F05_F
NXSI_119_D08 NXSI_119_F11
NXSI_120_D02_F NXSI_121_A05
NXSI_121_F04_F NXSI_122_H10
NXSI_124_C04 NXSI_127_E02
NXSI_131_C03 NXSI_132_F03
NXSI_132_H01 NXSI_115_A12_F
NXSI_133_B03_F NXSI_133_B05
NXSI_133_G06 NXSI_133_G11
NXSI_134_E02 NXSI_136_C07_F
NXSI_137_D09 NXSI_137_E06
NXSI_142_F05 NXSI_143_G11

106
NXSI_144_H01 NXSI_145_D04
NXSI_145_E11_F PC 03 F07
PC 04 B12 PC 05 A11
PC 07 F10 PC 18 B08
PC 19 E01 ST 32 C09
ST_02_E09 ST_06_F05
ST_15_G05 ST_19_A09
ST_20_B02 ST_21_E01
ST_22_F09 ST_23_F07
ST_24_H10 ST_25_C07
ST_29_A08 ST_35_A01
ST_35_B03 ST_35_D08
ST_36_C08 ST_37_B11
ST_40_A03 pi107-2
pi111-4 pi113-1
pi115-1 pi118-1
pi121-1 pi129-1
pi134-1 pi143-1
pi148-1 NXSI_136_H09_F
pi150-2 pi152-5
pi167-5 pi191-2
pi193-3 pi194-1
pi196-1 pi201-2
107
pi226 pi235
pi240 pi243
pi255 pi261
pi263 pi266
pi267 pi270
pi271 pi273
pi274 pi275
pi278 pi284
pi287 pi288
pi293 pi295
pi305 pi306
pi310 pi311b
pi315 pi46-1
pi54-5 pi59-1
pi64-9 pi70-2
pi73-1 pi76-1
pi78-1 pi79-2
pi90-2 pi97-3
pic56-12 pidd1

108
APPENDIX E MICROARRAY PROCEDURE
Indirect Incorporation of Cy Dyes
SuperScript Indirect cDNA Labeling from total RNA
First-Strand cDNA Synthesis using Invitrogen's SuperScript Indirect cDNA Labeling Kit
(Catalog numbers L1014-01 and L1014-02).
What follows is the protocol I use for cDNA synthesis from total RNA and indirect
cDNA labeling prior to microarray hybridizations. The protocol below is similar to that in
the instruction manual provided with this kit but has been modified previously by Dr.
Rob Alba. This is a copy of his procedure and I have added a couple of my own
modifications. His originals can be found at
http://ted.bti.cornell.edu/array/interface/protocol/protocol.html
First-Strand cDNA Synthesis Rxn.
Mix and briefly spin each kit component before use.
Prepare rxns as follows:
Xul DEPC-H2O
Xul Rnase free Dnase treated total RNA (15 to 20 ug/rxn)
2ul Anchored Oligo(dT)20 Primer (2.5ug/ul)
1ul Random Hexamer
Total Volume = 18ul
Incubate tubes at 70oC for 5 min, and then place on ice for at least 1 min.

109
Add the following to each rxn tube on ice:
6ul 5X First-Strand buffer
1.5ul 0.1 M DTT
1.5ul 10-mM dNTP mix
1ul RNaseOUT (40U/ul)
2ul SuperScript III RT (400U/ul)
Total Volume = 30ul
Mix gently and spin briefly. Incubate tube at 46oC Overnight
Add 15ul of 1N NaOH to each rxn tube and mix thoroughly.
Incubate tube at 70o C for 10 min.
Add 15ul of 1N HCl; mix gently.
Add 20ul 3M NaOAc (pH 5.2); mix gently.
Purifying First-Strand cDNA.
Add 500ul of Loading Buffer to the cDNA (from Step 9) and mix well.
Place a SNAP Column on a collection tube and load your cDNA on the column.
Spin at 14,000g at room temp for 1 min; discard the flow-through.
Place the SNAP Column onto the same collection tube and add 500ul of Wash Buffer.
Spin at 14,000g at room temp for 1 min; discard the flow-through.
Repeat Steps 4 and 5 twice more, for a total of three 500ul washes.
Spin one more time at 14,000g at room temp for 1 min; discard the flow-through.
Place the SNAP Column onto a new 1.5-ml tube.
Add 50ul of DEPC-treated water to the SNAP Column and incubate at room temp for 1
min. Elute the cDNA via spin at 14,000g at room temp for 1 min.

110
Repeat Step 9, using the same 1.5-ml tube.
Add 10ul of 3M sodium acetate (pH 5.2) to the eluent from steps 9 and 10.
Add 4ul of glycogen (20mg/ml) to the tube and mix.
Add 250ul of ice-cold 100% EtOH, and incubate the tube -80oC for 30 min.
Spin the tube at 14,000g at 4oC for 20 min. Carefully remove the supernatant.
Add 500ul of ice-cold 70% EtOH and spin the tube at 14,000g for 2 min. Carefully
remove the supernatant.
Air dry the sample for 5-10 min; ensure that all EtOH is removed. I can let it sit for a few
weeks in fridge.
Warm the 2X Coupling Buffer at 37oC for 5 min and re-suspend the cDNA sample in 5ul
of warm 2X Coupling Buffer. Heat the cDNA/Coupling buffer at 50oC for 10 min and
vortex well. Ensure that your cDNA pellet is fully re-suspended in the 2X Coupling
Buffer.
Labeling with Fluorescent Dye. When preparing the rxn, be careful to minimize
exposure of the dye solution to light. Also, DMSO is hygroscopic and will absorb
moisture from the air, which will react with the NHS ester of the dye and significantly
reduce the coupling rxn efficiency. Keep the DMSO supplied in the kit in an amber
screw-capped vial at -20oC, and let the vial warm to room temperature before opening to
prevent condensation. Use only the DMSO provided with this kit.
Open one packet of Cy3- or Cy5- dye and add 45ul of DMSO directly to the dye vial.
Add 5ul of the DMSO/dye solution to the tube from Step 17.
Mix well and incubate the tube at room temp in the dark for 1 hr.
Add 20ul of 3M Sodium Acetate (pH 5.2) to the dye-coupled cDNA solution.
111
Add 500ul of Loading Buffer to the cDNA solution. Mix well by vortexing.
Place a SNAP Column onto a clear collection tube and load the cDNA/buffer solution.
Spin at 14,000g at room temp for 1 min; discard the flow-through.
Place the SNAP Column on the same collection tube; add 500ul of Wash Buffer to
column.
Spin at 14,000g at room temp for 1 min; discard the flow-through.
Repeat Steps 8-9 three times, for a total of four 500ul washes.
Spin one more time at 14,000g at room temp for 1 min; discard the flow-through.
Place the SNAP Column onto a new amber collection tube.
Add 63ul of DEPC-water to the SNAP Column and incubate at room temp for 1 min.
Spin at 14,000g at room temp for 1 min and collect the flow-through. The flow-through
should contain 60ul of your purified dye-coupled cDNA.
Assessing the Labeling Procedure. Use UV/VIS spectroscopy to assess the labeling
procedure prior to microarray hybridization. This technique is described briefly in the
Appendix of the Instruction Manual for the Invitrogen cDNA labeling kit (page 8).
Additional information for assessing your labeling rxns can be obtained from the TIGR
website (TIGR Standard Operating Procedure #M004). Optimal labeling reactions have
the following characteristics: A260 > 0.5; A450 (for Cy3 labeling) < 0.2; A520 (for Cy5
labeling) < 0.2; pmols cDNA > 1000; pmols Cy > 100; nucleotides per Cy molecule < 50.
The Instruction Manual for Corning's Pronto!Plus kit suggests that Frequency of
Incorporation (FOI) and the FOI/Yield Ratio be determined as well. Preferably, FOI ≈ 20
to 50, and FOI/Yield Ratio ≈ 4 to 8.5%

112
Hybridization
What follows is the protocol I use for pre-hybridization, hybridization, washes, and
subsequent scanning of our Pine microarrays. These protocols were derived from similar
ones developed by Dr. Rob Alba at the Boyce Thompson Institute at Cornell University
http://ted.bti.cornell.edu/ The pre-hybridization and wash protocols derive from the lab
of John Quackenbush at TIGR (http://atarrays.tigr.org/PDF/Probehyb.pdf), with a few
modifications.
Reagents/Materials Required
Pre-hybridization ("block") solution, (5X SSC, 0.1% SDS, 1% BSA)
Filter pre-hyb solution using a 0.2um Corning filter unit
Wash Solution #1 (1X SSC, 0.2% SDS; pre-heat to 43oC)
Filter wash solution using a 0.2um Corning filter unit
Wash Solution #2 (0.1X SSC, 0.2% SDS; room temperature)
Filter wash solution using a 0.2um Corning filter unit
Wash Solution #3 (0.1X SSC; room temperature)
Filter wash solution using a 0.2um Corning filter unit
Isopropyl alcohol
0.1% SDS
Milli-Q® H20
Coplin staining jars
LifterSlipsTM(Erie Scientific Co.; catalog #22X50I-2-4711)
50mL FalconTM tubes (place the cap from a 14mL FalconTM culture tube at the bottom
of each 50mL FalconTM tube to elevate the arrays during centrifugation)
Genomic Solutions Hybridization Chambers (catalog # JHYB200003)

113
Hybridization Solution: 50% formamide, 5X SSC, 5X Denhardt's solution, 0.5% SDS,
5mM potassium phosphate monobasic. Filter hyb solution using a 0.2um Corning filter
unit.
Pre-hybridization/Blocking the Arrays
Pre-heat (to 43oC) �60mL of the filtered pre-hybridization solution in a Coplin jar.
Incubate arrays in warm pre-hybridization solution for 45min.
Rinse the "blocked" arrays via 5 dips in Milli-Q® H20, 5 more dips in fresh Milli-Q®
H20, and three dips in 100% isopropyl alcohol.
Quickly dry the rinsed arrays by centrifugation (1min; 1000–1500 × rpm) in a 50mL
FalconTM tube.
Do not let arrays dry out prior to centrifugation.
Excessive centrifugal force will crack array slides.
Inspect arrays carefully after centrifugation; if they are not clean, repeat steps 3 and 4.
Use arrays immediately after pre-hybridization.
Preparation of Cy-Labeled cDNA Targets
Conduct a spectrophotometric assay to asses the success of each labeling reaction using
the procedure described in TIGR's Standard Operating Procedure #M004.
Refer to: http://pga.tigr.org/sop/M004_1a.pdf).
Using the formulae presented in TIGR's SOP #M004, calculate the total pmol of
synthesized cDNA, the total pmol of incorporated Cy dye for each labeling reaction, and
the nucleotide/dye ratio for each reaction.
Optimal labeling reactions generate >2000 pmols of cDNA, >150 pmol of Cy dye, and a
nucleotide/dye ratio that is <50.

114
For each Cy-labeled cDNA sample that will be used in a two-color (competitive)
hybridization, calculate the volume of Cy5-labeled cDNA and Cy3-labeled cDNA that is
equivalent to 50 pmol of incorporated Cy5 and 50 pmol of incorporated Cy3.
Combine the volumes calculated in step 3 in a single microfuge tube and dry the
combined cDNA targets in a roto-evaporator (45oC).
Resuspend the combined and dried cDNA targets in 70ul of Corning Universal
Hybridization Solution.
Incubate re-suspended cDNA targets at 95oC for 5min
Centrifuge at max speed for 1 minute (room temperature).
Clean "blocked" slides by blowing compressed air passed through a 0.2 �m filter disk
and then place array in a Genomic Solutions (or similar, e.g. Corning) Hybridization
Chamber; fill humidity wells as per the instructions that come with the hybridization
chambers (I use 20 ul) .
Clean LifterSlipsTM by blowing compressed air passed through a 0.2 �m filter disk
Carefully cover the array with a clean dry LifterSlipTM.
Carefully pipette 65ul of re-suspended cDNA targets to the edge of the LifterSlipTM,
allowing the solution to cover the array by capillary action.
Seal the array chamber (without moving the LifterSlipTM) as per the instructions
that come with the hybridization chambers.
Incubate the sealed chamber containing array at 43oC for 12–16 hours.
Conduct the hybridization in the dark.
Washing Arrays after Hybridization
Fill two foil-covered Coplin jars with pre-heated Wash Solution #1.

115
Remove the LifterSlipTM from the array surface by dipping arrays in the first
Coplin jar containing Wash Solution #1; the LifterSlipTM should slide off the array
easily.
Place the array in the second Coplin jar containing pre-heated Wash Solution #1.
Incubate arrays in Wash Solution #1 for 10 minutes at 43oC.
Transfer arrays to a new foil-covered Coplin jar containing Wash Solution #2.
Incubate arrays in Wash Solution #2 for 10 minutes at room temperature
Agitate arrays gently during wash step.
Transfer arrays to a new foil-covered Coplin jar containing Wash Solution #3.
Incubate arrays in Wash Solution #3 for 10 minutes at room temperature
Agitate arrays gently during wash step.
Immediately dry the washed arrays via gentle centrifugation, as described above.
Do not let the arrays dry out prior to the centrifugation step.
1 minute at 1000-1500 × rpm
Place arrays in foil-covered slide tray until scanning.
Scanning Arrays We scan our arrays immediately after they are washed/dried using
a two-channel confocal microarray scanner (ScanArray5000; GSI Lumonics, MA) and
the associated ScanArray software (v3.1, Packard BioChip Technologies, MA). After
laser focusing and balancing of the two channels, scans are conducted at a resolution of
10 um with the laser power typically set between 90-100% of maximum and the
photomultiplier tube typically set at 65-75% of maximum. Excitation/emission settings
are 543 um/570 um and 633 um/670 um for the Cy3 and Cy5 fluors, respectively. Raw
fluorescence image data is saved as .tif files.
116
LIST OF REFERENCE Al-Rabab'ah MA, Williams CG. 2002. Population dynamics of Pinus taeda L. based on
nuclear microsatellites. Forest Ecology and Management 163:263-271.
Anderson RL, McCartney TC, Cost CD, Devine H, Botkin M. 1988. Fusiform rust hazard haps for loblolly and slash pine. USDA Forest Service Southeastern Forest Experiment Station Research Note SE-351:1-7.
Andersson-Gunner S, Mellerowicz EJ, Love J, Segerman B, Ohmiya Y, Coutinho PM, Nilsson P, Henrissat B, Moritz T, Sundberg B. 2006. Biosynthesis of cellulose enriched tension wood in Populus: global analysis of transcripts and metabolites identifies biochemical and developmental regulators in secondary wall biosynthesis. Plant Journal 45:144-165.
Anterola AM, Jeon JH, Davin LB, Lewis NG. 2002. Transcriptional control of monolignol biosynthesis in Pinus taeda - Factors affecting monolignol ratios and carbon allocation in phenylpropanoid metabolism. Journal of Biological Chemistry 277:18272-18280.
Baker JB, Langdon OG (1990) Pinus taeda L., Loblolly Pine. In: Burns, R.M. Honkala, B.H (eds) Silvics of North America. Handbook 654 ed. Washington, D.C, US Department of Agriculture, 497-512
Baltunis BS, Huber DA, White TL, Goldfarb B, Stelzer HE. 2005. Genetic effects of rooting loblolly pine stem cuttings from a partial diallel mating design. Canadian Journal of Forest Research-Revue Canadienne De Recherche Forestiere 35:1098-1108.
Barrows-Broaddus J, and Dwinell LD. 1983. Histopathology of Fusarium moniliforme var. subglutinans in four species of southern pines pitch canker, Pinus virginiana, virginia pine, Pinus elliotii var. elliotii, slash pine, Pinus taeda, loblolly pine, Pinus serotina, pond pine. Phytopathology. June:882-889.
Birch PRJ, Kamoun S. 2000. Studying interaction transcriptomes: coordinated analyses of gene expression during plant-microorganism interactions. New Technologies for Life Sciences: A Trends Guide:77:72.
Brown GR, Gill GP, Kuntz RJ, Langley CH, Neale DB. 2004. Nucleotide diversity and linkage disequilibrium in loblolly pine. Proceedings of the National Academy of Sciences of the United States of America 101:15255-15260.
Bubeck DM, Goodman MM, Beavis WD, Grant D. 1993. Quantitative trait loci controlling resistance to gray leaf-spot in maize. Crop Science 33:838-847
117
Burdsall HH, Snow GA. 1977. Taxonomy of Cronartium qercuum and Cronartium fusiforme. Mycologia 69:503-508.
Carey WA, Kelley WD. 1993. Seedling production trends and fusiform rust control practices at southern nurseries, 1981-1991. Southern Journal of Applied Forestry 17:207-211
Cubbage FW, Pye JM, Holmes TP, Wagner JE. 2000. An economic evaluation of fusiform rust protection research. Southern Journal of Applied Forestry. 24:77-85.
de Souza SM, White TL, Schmidt RA, Young CH, Anderson RL. 1990. Evaluating fusiform rust symptoms on greenhouse-grown slash pine seedlings to predict field resistance. Plant Disease 74:969-974.
Dwinell LD, Barrows-Broaddus JB. 1981. Pitch Canker in Seed Orchards. Proc 16th Southern Forest Tree Improvement Conference, Blacksburg, Virginia 234-240
Dwinell LD, Barrows-Broaddus JB, Kuhlman EG. 1985 Pitch canker: a disease complex of southern pines. Plant Disease 69:270-276
Dwinell LD, Barrowsbroaddus JB. 1982. Pitch Canker in Southern Pine Seed Orchards. Phytopathology 72:979-979.
Falconer DS, Mackay TFC. 1996. Introduction to quantitative genetics, 4th ed. New York: Longman and Co. 464.
Food and Agricultural Organization 2006. Global Forest Resources Assessment 2005. In: Organization FaA, editor.: FAO.
Farnir F, Grisart B, Coppieters W, Riquet J, Berzi P, Cambisano N, Karim L, Mni M, Moisio S, Simon P, Wagenaar D, Vilkki J, Georges M. 2002. Simultaneous mining of linkage and linkage disequilibrium to fine map quantitative trait loci in outbred half-sib pedigrees: Revisiting the location of a quantitative trait locus with major effect on milk production on bovine chromosome 14. Genetics 161:275-287
Flint-Garcia SA, Thornsberry JM, Buckler ES. 2003. Structure of linkage disequilibrium in plants. Annual Review of Plant Biology 54:357-374.
Foster GS, Anderson RL. 1989. Indirect selection and clonal propagation of loblolly pine seedlings enhance resistance to fusiform rust. Canadian Journal of Forest Research-Revue Canadienne De Recherche Forestiere 19:534-537.
Frampton J, Isik F, Goldfarb B. 2002. Effects of nursery characteristics on field survival and growth of loblolly pine rooted cuttings. Southern Journal of Applied Forestry 26:207-213.
Frampton J, Li B, Goldfarb B. 2000. Early field growth of loblolly pine rooted cuttings and seedlings. Southern Journal of Applied Forestry. 24:98-105.
118
Francia E, Tacconi G, Crosatti C, Barabaschi D, Bulgarelli D, Dall'Aglio E, Vale G. 2005. Marker assisted selection in crop plants. Plant Cell Tissue and Organ Culture 82:317-342.
Fry SC, Smith RC, Renwick KF, Martin DJ, Hodge SK, Matthews KJ. 1992. Xyloglucan endotransglycosylase, a new wall-loosening enzyme activity from plants. Biochemistry. J 282:821・828.
Gilmour AR, Cullis BR, Welham SJ, Thompson R. 2004. ASREML reference manual, Orange Agriculture Institute. New South Wales, Australia.
Glazebrook J. 2005. Contrasting mechanisms of defense against biotrophic and necrotrophic pathogens. Annual Reviews of Phytopathology 43:205・227.
Gray DJ, Amerson HV. 1983. Invitro resistance of embryos of Pinus taeda to Cronartium quercuum f sp fusiforme - ultrastructure and histology. Phytopathology 73:1492-1499.
Griggs MM, Schmidt RA. 1977. Increase and spread of fusiform rust. In: Management of Fusiform Rust in Southern Pines Symposium Proceedings. University of Florida, Gainesville. 32-38.
Hammond-Kosack KE, Jones JDG. 1997. Plant disease resistance genes. Annual Review of Plant Physiology and Plant Molecular Biology 48:575-607.
Heath MC. 1997. Signalling between pathogenic rust fungi and resistant or susceptible host plants. Annals of Botany 80:713-720.
Henderson CR. 1973. Sire evaluation and genetic trends. In: Proceedings Animal Breeding and Genetics Symposium in Honor of J. Lush, 3, Champaign, Illinois: American Society of Animal Science. p 10-41.
Huber DA, White TL, Hodge GR. 1992. The efficiency of half-sib, half-diallel and circular designs in the estimation of genetic parameters in forestry: a simulation. Forest Science 38:757-776
Huber DA. 1993. Optimal mating designs and optimal techniques for analysis of quantitative traits in forest genetics. In: Forest Resources and Conservation,. Gainesville, FL: University of Florida.
Hudgins JW, McDonald GI, Zambino PJ, Klopfenstein NB, Franceschi VR. 2005. Anatomical and cellular responses of Pinus monticola stem tissues to invasion by Cronartium ribicola. Forest Pathology 35:423-443.
Isik F, Li BL, Frampton J, Goldfarb B. 2004. Efficiency of seedlings and rooted cuttings for testing and selection in Pinus taeda. Forest Science 50:44-53.
119
Jackson LWR, Parker JN. 1958. Anatomy of fusiform rust galls on loblolly pine. Phytopathology 48:637-640.
Jannink JL, Bink M, Jansen RC. 2001. Using complex plant pedigrees to map valuable genes. Trends in Plant Science 6:337-342.
Jewell FF, Mallett SL, True RP. 1962. Histology of Cronartium fusiforme in Slash Pine Seedlings. Phytopathology 52:850-&.
Jurgens JA, Blanchette RA, Zambino PJ, David A. 2003. Histology of white pine blister rust in needles of resistant and susceptible eastern white pine. Plant Disease 87:1026-1030.
Kayihan GC, Huber DA, Morse AM, White TL, Davis JM. 2005. Genetic dissection of fusiform rust and pitch canker disease traits in loblolly pine. Theoretical and Applied Genetics 110:948-958.
Kerr MK, Churchill GA. 2001. Experimental design for gene expression microarrays. Biostatistics 2:183-201.
Kirst M, Basten CJ, Myburg AA, Zeng ZB, Sederoff RR. 2005 Genetic architecture of transcript-level variation in differentiating xylem of a eucalyptus hybrid. Genetics 169 (4): 2295-2303 APR 2005
Knighten JL. 1988. Resistance screening center procedures manual: a step by step guide used in the operational screening of southern pines for resistance to fusiform rust. Region 8, USDA Forest Service, Forest Pest Management, 62
Kubisiak TL, Amerson HV, Nelson CD. 2005. Genetic interaction of the fusiform rust fungus with resistance gene Fr1 in loblolly pine. Phytopathology 95:376-380.
Kubisiak TL, Roberds JH, Spaine PC, Doudrick RL. 2004. Microsatellite DNA suggests regional structure in the fusiform rust fungus Cronartium quercuum f. sp fusiforme. Heredity 92:41-50.
Kuhlman EG. 1992. Interaction of virulent single-gall rust isolates of Cronartium quercuum f sp fusiforme and resistant families of loblolly pine. Forest Science 38:641-651
Kuhlman EG. 1990. Frequency of single-gall isolates of Cronartium quercuum f. sp. fusiforme with virulence toward three resistant loblolly pine families. Phytopathology 80:614-617.
Kuhlman EG. 1987. Effects of inoculation treatment with Fusarium moniliforme var. subglutinans on dieback of loblolly and slash pine seedlings. Plant Disease 71:161-162.
120
Kuhlman EG, Amerson HV, Jordan AP, Pepper WD. 1997. Inoculum density and expression of major gene resistance to fusiform rust disease in loblolly pine. Plant Disease 81:597-600.
Kuhlman EG, Cade S. 1985. Pitch canker disease of loblolly and pond pines in North Carolina plantations. Plant Disease 69:175-176
Kuhlman EG, Dianis SD, Smith TK. 1982. Epidemiology of pitch canker disease in a loblolly pine seed orchard in North Carolina Fusarium moniliforme var. subglutinans, Pinus taeda. Phytopathology 72:1212-1216
Kuhlman EG, Powers HR. 1988. Resistance responses in half-sib loblolly pine progenies after inoculation with Cronartium quercuum f.sp fusiforme. Phytopathology 78:484-487.
Kus JV, Zaton K, Sarkar R, Cameron RK. 2002. Age related resistance in Arabidopsis is a developmentally regulated defense response to Pseudomonas syringae. Plant Cell 14:479-490
Lev-Yadun S, Sederoff R. 2000. Pines as model gymnosperms to study evolution, wood formation, and perennial growth. Journal of Plant Growth Regulation 19:290-305.
Lewis DH. 1973. Concepts in fungal nutrition and the origin of biotrophy. Biological Reviews 48:261-278.
MacFall JS, Spaine P, Doudrick R, Johnson GA. 1994. Alterations in growth and water-transport processes in fusiform rust galls of pine, determined by magnetic-resonance microscopy. Phytopathology 84:288-293.
Mayer AM, Staples RC and Gil-ad NL. 2001. Mechanism of survival of necrotrophic fungal plant pathogens in hosts expressing the hypersensitive response. Phytochemistry 58:33-41.
McKeand S, Mullin T, Byram T, White T. 2003. Deployment of genetically improved loblolly and slash pines in the south. Journal of Forestry 101:32-37.
McKeand SE, Li B, Amerson HV. 1999. Genetic variation in fusiform rust resistance in loblolly pine across a wide geographic range. Silvae Genetica 48:255-260.
McKeand SE, Mullin T, Byram T. 2003. Deployment of geneticaly improved loblolly and slash pines in the South. Journal of Forestry 101:32-37.
McKeever DB, Howard JL. 1996. Value of timber and agricultural products in the United States, 1991. Forest Products Journal 46:45-50.
McLeod AR, Long SP. 1999. Free-air carbon dioxide enrichment (FACE) in global change research: A review. Advances in Ecological Research, Vol 28 28:1-56.
121
Meuwissen THE, Karlsen A, Lien S, Olsaker I, Goddard ME. 2002. Fine mapping of a quantitative trait locus for twinning rate using combined linkage and linkage disequilibrium mapping. Genetics 161:373-379
Miller T, Cowling EB, Powers HR, Blalock TE. 1976. Types of resistance and compatibility in slash pine seedlings infected by Cronartium fusiforme. Phytopathology 66:1229-1235.
Miller T. 1983. Fusiform rust resistance in loblolly pine: artificial inoculation versus field performance. Plant Disease 67:33-34.
Morse A, Nelson CD, Covert SF, Holliday AG, Smith KE, Davis JM. 2004. Pine genes regulated by the necrotrophic pathogen Fusarium circinatum. Theoretical and Applied Genetics t 19 (5) 922-932
Myburg H, Morse AM, Kubisiak TL, Osborne JA, Garcia SA, Nelson CD, Davis JM, Covert SF, van Zyl LM. 2006 Differential gene expression in loblolly pine (Pinus taeda L.) challenged with the fusiform rust fungus, Cronartium quercuum f.sp. fusiforme. Physiological and Molecular Plant Pathology
Nirenberg HI, O'Donnell K. 1998. New Fusarium species and combinations within the Gibberella fujikuroi species complex. Mycologia 90:434-458
Oak SW, Blakeslee GM, Rockwood DL. 1987. Pitch canker resistant slash pine identified by greenhouse screening. Proceedings of 19th Southern Forest Tree Improvement Conference, College Station, Texas 132-139
Oliver RP, Ipcho SVS. 2004. Arabidopsis pathology breathes new life into the necrotrophs-vs.-biotrophs classification of fungal pathogens. Molecular Plant Pathology 5:347-352.
Patterson H, Thompson R. 1971. Recovery of inter-block information when block sizes are unequal. Biometrika 58:545-&.
Paux E, Tamasloukht MB, Ladouce N, Sivadon P, Grima-Pettenati J. 2004. Identification of genes preferentially expressed during wood formation in Eucalyptus. Plant Molecular Biology 55:263-280.
Powers HR, Langdon OG. 1977. Pond pine clones vary in resistance to Cronartium fusiforme. Plant Disease Reporter 61:916-918.
Powers HR,Jr, Zobel BJ. 1978 Progeny of specific loblolly pine (Pinus taeda) clones vary in fusiform rust (Cronartium fusiforme) resistance according to seed orchard of origin. For Sci 24:227-230
Powers HR. 1980. Pathogenic variation among single aeciospore isolates of Cronartium quercuum f sp fusiforme. Forest Science 26:280-282.
122
Powers Jr HR. 1985. Response of sixteen loblolly pine families to four isolates of Cronartium quercuum f. sp. fusiforme. IUFRO Proc., Rusts of Hard Pines Working Party Conf. J. Barrows-Broaddus and HR Powers, eds. Georgia Center for Continuing Education, University of Georgia, Athens:89-96.
Rafalski JA. 2002. Novel genetic mapping tools in plants: SNPs and LD-based approaches. Plant Science 162:329-333.
Ringli C, Keller B, Ryser U. 2001. Glycine-rich proteins as structural components of plant cell walls. Cellular and Molecular Life Sciences (CMLS) 58:1430-1441.
Schmidt RA, Gramacho KP, Miller T, Young CH. 2000. Components of partial resistance in the slash pine-fusiform rust pathosystem. Phytopathology 90:1005-1010
Schmidt RA. 1998. Fusiform rust disease of southern pines: Biology, ecology and management In. Agriculture Station Institute of Food Agriculture Science and Technology Bulletin, University of Florida.
Schmidtling RC, Carroll E, LaFarge T. 1999. Allozyme diversity of selected and natural loblolly pine populations. Silvae Genetica 48:35.
Schultz RP. 1999. Loblolly - the pine for the twenty-first century. New Forests 17:71-88.
Snow GA, Dinus RJ, Kais AG. 1975. Variation in pathogenicity of diverse sources of Cronartium fusiforme on selected slash pine families. Phytopathology 65:170-175.
Snow GA, Kais AG. 1970. Pathogenic variability in isolates of Cronartium fusiforme from five southern states. Phytopathology 60:1730-1731.
Stelzer HE, Doudrick RL, Kubisiak TL, Nelson CD. 1997. Deviation of host and pathogen genotypes in the fusiform rust pathosystem on slash pine using a complimentary genetic model and diallel data. Proceedings of 24th Southern Forest Tree Improvement Conference. Orlando, FL:320-330.
Stelzer HE, Foster GS, Shaw V, McRae JB. 1998. Ten year growth comparison between rooted cuttings and seedlings of loblolly pine. Canadian Journal of Forest Research-Revue Canadienne De Recherche Forestiere 28:69-73.
Storer AJ, Wood DL, Gordon TR. 2002. The epidemiology of pitch canker of Monterey pine in California. Forest Science 48:694-700.
Thomma BPHJ, Penninckx IAMA, Broekaert WF, Cammue BPA. 2001. The complexity of disease signaling in Arabidopsis. Current Opinion in Immunology 13:63-68
Walkinshaw CH, Bey CF. 1981. Reaction of field-resistant slash pines to selected isolates of Cronartium quercuum f. sp. fusiforme. Phytopathology 71:1090-1092.
123
Wan J, Dunning MF, Bent AF. 2002. Probing plant-pathogen interactions and downstream defense signaling using DNA microarrays. Functional & Integrative Genomics 2:259-273.
Wang GL, Mackill DJ, Bonman JM, Mccouch SR, Champoux MC, Nelson RJ. 1994. RFLP mapping of genes conferring complete and partial resistance to blast in a durably resistant rice cultivar. Genetics 136:1421-1434
Warren JA, Covert SF. 2004. Differential expression of pine and Cronartium quercuum f. sp fusiforme genes in fusiform rust galls. Applied and Environmental Microbiology 70:441-451.
Wilcox PL, Amerson HV, Kuhlman EG, Liu BH, OMalley DM, Sederoff RR. 1996. Detection of a major gene for resistance to fusiform rust disease in loblolly pine by genomic mapping. Proceedings of the National Academy of Sciences of the United States of America 93:3859-3864.
Wolfinger RD, Gibson G, Wolfinger ED, Bennett L, Hamadeh H, Bushel P, Afshari C, Paules RS. 2001. Assessing Gene Significance from cDNA Microarray Expression Data via Mixed Models. Journal of Computational Biology 8:625-637.
Woodward AW, Bartel B. 2005. Auxin: Regulation, Action, and Interaction. Annals of Botany 95:707-735.
Wu RL, Ma CX, Casella G. 2002. Joint linkage and linkage disequilibrium mapping of quantitative trait loci in natural populations. Genetics 160:779-792
Yamada Y (1962) Genotype by environment interaction and genetic correlation of the same trait under different environments. Japanese Journal of Genetics 37:498-509
Yang T, Poovaiah BW. 2000. Molecular and Biochemical Evidence for the Involvement of Calcium/Calmodulin in Auxin Action. Journal of Biological Chemistry 275:3137-3143
124
BIOGRAPHICAL SKETCH
Gogce Ceren Kayihan was born in Ankara, Turkey in 1975. She studied in Amasya
until the end of her high school education. In 1993, she entered Biological Sciences
Department in Middle East Technical University. Upon her graduation in 1997 she
started working on her master’s thesis in the same department with her advisor, Dr. Zeki
Kaya. Her love of plants and his research interest in conifers ended her up in a project
where she studied genetic variation of Cedrus libani populations in Turkey. In 2001 she
was accepted to the School of Forest Resources and Conservation at the University of
Florida as a PhD student and started to work with Dr. Timothy White and Dr. John Davis.