genetic analysis of the group iv rht loci in wheat
TRANSCRIPT

GENETIC ANALYSIS OF THE GROUP IV Rht LOCI IN WHEAT
Edward Paul Wilhelm
A thesis submitted for the degree of Doctor of Philosophy
University of East Anglia John Innes Centre
June 2011
© This copy of the thesis has been supplied on condition that anyone who
consults it is understood to recognise that its copyright rests with the author
and that no quotation from the thesis, nor any information derived there from,
may be published without the author‟s prior, written consent
ii
ABSTRACT
The introduction of the group IV semi-dwarf Rht alleles, Rht-B1b (formerly Rht1) and Rht-D1b (formerly Rht2) into bread wheat varieties from the donor line „Norin 10‟ that began in the 1960s was a major contributor to the „green revolution‟. Rht-B1b and Rht-D1b were characterised and cloned over a decade ago (Gale and Youssefian 1985; Peng et al. 1999), however the Rht-A1 locus has not been isolated and little is known regarding the genetic diversity of the group IV Rht loci or the genetic composition of the contiguous sequence surrounding Rht that was presumably introgressed into wheat varieties along with the dwarfing alleles. To investigate the contiguous region around Rht, a hexaploid wheat („Chinese Spring‟ (CS)) BAC library was screened using a PCR-based technique (Febrer et al. 2009). This identified several Rht-containing BAC clones, three of which (representing the A, B, and D genomes) were sequenced and found to contain one to two genes upstream of Rht in conserved order. Gene synteny was also highly conserved in rice, Brachypodium distachyon, sorghum, and maize. The previously unidentified Rht-A1 homoeologue was physically mapped to the long arm of chromosome 4A using aneuploid lines and mapped relative to genetic markers. To estimate genetic diversity, the entire coding regions of Rht-A1, Rht-B1, and Rht-D1 and the flanking regions (approximately 1800 bp 5‟ and 450 bp 3‟) were sequenced in 40 diverse wheat accessions. Little polymorphism and few haplotypes were identified on the A and D genomes, but on the B genome a relative abundance of haplotypes and polymorphism were present, including insertions (relative to CS) of 160 bp and 197 bp within 600 nucleotides of the ORF. The Rht-B1 insertions did not have a pronounced effect on RNA transcript level when assessed in seedlings. In an analysis of 368 lines from the INRA bread wheat core collection (BWCC) (Balfourier et al., 2007), lines with the Rht-B1 insertions were associated with reduced heights and reduced GA sensitivity relative to lines without an insertion, but only the height reductions associated with the 197 bp insertion were significant (p < 0.05). GA sensitivity tests of the INRA BWCC did not reveal any novel GA insensitive mutants. An investigation of the origin of the „Norin 10‟ alleles revealed potential discrepancies between the published pedigree and of „Norin 10‟ and the genotypes of seed stocks. Sequence, annotation, and comparative genomics of the Rht-containing BAC clones, the mapping of Rht-A1, and the discovery and investigation of novel genetic diversity provides greater insight into the Rht region and also provides tools for further analysis of this region and for the potential improvement of bread wheat.

iii
ACKNOWLEDGEMENTS
I am indebted to my supervisor Margaret Boulton for her generous help and fantastic support throughout the thesis. Special thanks also to my co-
supervisor Wayne Powell who made this thesis possible.
I gratefully acknowledge support from the NIAB trust and the BBSRC for a studentship for research funding.
Thank you to Andy Greenland and all my colleagues at NIAB for their technical help (especially Rhian Howells, bioinformatics) and for providing a wonderful
working environment.
Thanks also to the rest of my PhD committee: Nadia Al-Kaff, JIC, for her encouragement and help; Ian Mackay, NIAB, for statistical advice; Simon
Griffiths, JIC, and his lab (notably Michelle Leverington-Waite and Catherine Baker) for help with genetic mapping.
I‟d also like to thank the members of Margaret Boulton‟s lab (in particular Andrey Korolev) for their help in performing experiments and Robert Saville for
his help and fruitful discussions on Rht.
Thanks also to collaborators Francois Balfourier (Clermont-Ferrand, INRA) and Jizeng Jia (Chinese Academy of Agricultural Sciences, P.R. China)
Finally, I‟m indebted to my wife for not divorcing me during this process, and to my wife and son for reminding me that life existed outside of the PhD.

iv
TABLE OF CONTENTS 1. GENERAL INTRODUCTION 1
1.1. INTRODUCTION 1 1.2. DELLA PROTEINS IN PLANTS 1
1.2.1. DELLA loci in dicots and monocots 1 1.2.2. Conserved DELLA domains 3 1.2.3. DELLA protein characterisation 4 1.2.4. Regulation of DELLA protein levels 5 1.2.5. DELLA protein function 7 1.2.6. Role of DELLAs in response to plant stress 8
1.3. GROUP IV RHT-1 LOCI AND DWARFING ALLELES IN WHEAT 10 1.3.1. Rht-1 loci 10 1.3.2. Rht-B1b and Rht-D1b 11 1.3.3. Alternative Rht-B1 dwarfing alleles 13 1.3.4. Alternative Rht-D1 dwarfing alleles 14
1.4. ADDITIONAL RHT LOCI AFFECTING PLANT HEIGHT IN WHEAT 15 1.5. Physiological effects of Rht-B1b and Rht-D1b 17
1.5.1. Rht-B1b and Rht-D1b effects on wheat morphology and yield 17 1.5.2. Rht-B1b and Rht-D1b effects on wheat abiotic stress performance 18 1.5.3. Rht-B1b and Rht-D1b associations with Fusarium Head Blight 19
1.6. EVOLUTIONARY HISTORY AND GENETIC DIVERSITY OF WHEAT AND POACEAE SPECIES 21 1.7. Origin and distribution of Rht-B1b and Rht-D1b 25
1.7.1. Origin and spread of ‘Norin 10’ 25 1.7.2. Alternative sources of Rht-B1b and Rht-D1b 26 1.7.3. Rht-B1b and Rht-D1b prevalence in the world 27
1.8. LINKAGE DISEQUILIBRIUM AND SELECTIVE SWEEPS IN PLANTS 29 1.9. PHD OBJECTIVES 30
2. IDENTIFICATION AND CHARACTERISATION OF BAC CLONES CONTAINING RHT-1 32
2.1. INTRODUCTION 32 2.2. MATERIALS AND METHODS 33
2.2.1. The Triticum aestivum (cv Chinese Spring) BAC library 33 2.2.2. Screening of the French component of the CS BAC library by radioactive hybridization 34
2.2.2.1. Screening strategy and probe construction 34 2.2.2.2. Screening of BAC library filters using radioactive probes 36 2.2.2.3. Extraction of plasmid DNA 37 2.2.2.4. Gel analysis of BAC clones 37 2.2.2.5. PCR amplification and sequencing of Rht-1 38
2.2.3. Screening of the UK component of the CS BAC library by PCR 39 2.3. RESULTS 41
2.3.1. Identification and characterisation of Rht-1-containing BAC clones from the French component of the CS library 41 2.3.2. Identification and characterisation of Rht-1-containing BAC clones from the UK component of the CS library 47

v
2.3.3. Summary of Rht-1-containing BAC clones identified in the French and UK components of the CS library 53
2.4. DISCUSSION 54 3. GENETIC COMPOSITION AND COMPARATIVE ANALYSIS OF THE RHT-1 LOCI AND ADJOINING SEQUENCE 56
3.1. INTRODUCTION 56 3.2. MATERIALS AND METHODS 58
3.2.1. Sequencing of Rht-1-containing BAC clones 58 3.2.2. Annotation of the five Rht-1 containing wheat BAC sequences 58 3.2.3. Comparative analysis of BAC sequences 59
3.3. RESULTS 61 3.3.1. Genetic composition and comparative analysis of the Rht-1 containing wheat BACs 61 3.3.2. Comparative analyses of Rht-1 and the surrounding region in wheat and Poaceae 67
3.3.2.1. Comparative analysis of the Rht-1 ORF in wheat and Poaceae 69 3.3.2.2. Comparative analysis of the Rht-1 flanking region (10 kb 5’ and 10kb 3’) in wheat and Poaceae 74 3.3.2.3. Comparative analysis of ZnF in wheat and Poaceae 79 3.3.2.4. Comparative analysis of DUF6 among wheat BACs and Poaceae 84
3.3.3. Predicted genes on the CS wheat BAC sequences 90 3.4. DISCUSSION 90
4. PHYSICAL AND GENETIC MAPPING OF RHT-A1 97
4.1. INTRODUCTION 97 4.2. MATERIALS AND METHODS 100
4.2.1. Plant Materials 100 4.2.2. DNA extraction 102 4.2.3. PCR amplification 103 4.2.4. SSR linkage mapping 104
4.3. RESULTS 104 4.3.1 Physical mapping of Rht-1 loci using aneuploid lines 104 4.3.2 Rht-A1 mapping in the ‘SS7010073 × Paragon’ F5 population 108
4.4. DISCUSSION 113 5. GENETIC DIVERSITY AT THE RHT-1 LOCI IN WHEAT 117
5.1. INTRODUCTION 117 5.2. MATERIALS AND METHODS 119
5.2.1. Sources of accessions used for sequencing the Rht-1 region 119 5.2.2. Diversity sets 122
5.2.2.1. Bread Wheat 1 (BW1) set: Accessions and experimental design 122 5.2.2.2. Bread Wheat 2 (BW2) set: Accessions and experimental design 122 5.2.2.3. Tetraploid/Diploid Wheat (TDW) set: Accessions and experimental design 123
5.2.3. Rht-B1a/Rht-B1b and Rht-D1a/Rht-D1b PCR assays 124 5.2.4. PCR amplification and sequencing of Rht-1 and the flanking region 125 5.2.5. Assembly of Rht-1 contigs and bioinformatic analyses 127 5.2.6. Rht-1 Transcript analysis 128

vi
5.3. RESULTS 130 5.3.1. PCR amplification and sequencing 130 5.3.2. Genetic diversity of the Rht-1+flank region of the BW1 set 132
5.3.2.1. BW1 set: Genotypes and phenotypes 132 5.3.2.2. BW1 set: Rht-A1+flank diversity 133 5.3.2.3. BW1 set: Rht-B1+flank diversity 139 5.3.2.4. BW1 set: Rht-D1+flank diversity 143
5.3.3. Genetic diversity of the Rht-1+flank region of the BW2 set 144 5.3.3.1. BW2 set: Genotypes and phenotypes 144 5.3.3.2. BW2 set: Rht-A1+flank diversity 146 5.3.3.3. BW2 set: Rht-B1+flank diversity 147 5.3.3.4. BW2 set: Rht-D1+flank diversity 148
5.3.4. Genetic diversity of the Rht-1+flank region of the TDW set 149 5.3.4.1. TDW set: Genotypes and phenotypes 149 5.3.4.2. TDW set: Rht-A1+flank diversity 149 5.3.4.3. TDW set: Rht-B1+flank diversity 150 5.3.4.4. TDW set: Rht-D1+flank diversity 151
5.3.5. Comparisons of the Rht-1+flank regions among the A, B, and D genomes of the bread wheat sets 152 5.3.6. Predicted amino acid changes in Rht-1 154 5.3.7. Effect of the 160 bp and 197 bp Insertions on Rht-1 expression 155
5.4. DISCUSSION 156 6. RHT-1 AND PPD-D1 ASSOCIATIONS WITH HEIGHT, GA SENSITIVITY, AND HEADING DATE IN A WORLDWIDE BREAD WHEAT COLLECTION 166
6.1. INTRODUCTION 166 6.2. MATERIALS AND METHODS 168
6.2.1. Germplasm 168 6.2.2. DNA extraction and genotyping 169 6.2.3. INRA BWCC outdoor experiment 170 6.2.4. GA sensitivity experiments 174 6.2.5. Statistical analyses 176
6.3. RESULTS 178 6.3.1. Rht-1 and Ppd-D1 genotyping of control lines 178 6.3.2. Multiplex PCR identifies Rht-B1 insertion types 180 6.3.3. Frequency of Rht-1 and Ppd-D1 alleles in the INRA BWCC 181 6.3.4. Plant heights and heading dates of INRA BWCC accessions and controls in relation to genotype 185 6.3.5. GA sensitivities among INRA BWCC and control accessions 187
6.3.5.1 GA sensitivities of accessions in GA experiment 1 187 6.3.5.2 GA sensitivities of accessions in GA experiment 2 192 6.3.5.3 GA sensitivities of accessions in GA experiment 3 192
6.3.6. Phenotype-genotype associations of INRA BWCC accessions 194 6.3.6.1. Rht-B1*Rht-D1*Ppd-D1 REML analysis 194 6.3.6.2. Rht-B1 genotype REML and means analysis 196 6.3.6.3. RHT*Ppd-D1 REML and means analysis 198 6.3.6.4. Rht-B1 and Ppd-D1 association analysis with adjustment for population structure (AA-PS) 200
6.3.7. Phenotype and genotype analyses of INRA BWCC accession types 201

vii
6.3.8. Correlations among height, GA sensitivity, and ear emergences of the INRA BWCC 204
6.4. DISCUSSION 206 6.4.1. Rht-1 and Ppd-D1 allelic prevalence in the INRA BWCC 206 6.4.2. Genotype-Phenotype associations in the INRA BWCC 208 6.4.3. Correlations among phenotypes in the INRA BWCC 212 6.4.4. GA sensitivities among INRA BWCC accessions 213 6.4.5. Conclusions 215
7. ORIGINS OF THE RHT-B1B AND RHT-D1B ALLELES 216
7.1 INTRODUCTION 216 7.2. MATERIALS AND METHODS 219
7.2.1. Germplasm 219 7.2.2. Growth conditions of accessions 220 7.2.3. Genotyping and phenotyping of accessions 222
7.3. RESULTS 222 7.4. DISCUSSION 228
8. GENERAL DISCUSSION 233 REFERENCES 243 APPENDICES 262
I. Primer sequences 262 II. Nucleotide sequence of Chinese Spring BAC clones 0224_M10,
1417-F16, and 0155_I24 CD III. Annotation of CS BAC Clones 0224_M10, 1417-F16, and 0155_I24 264 IV. Poaceae orthologues in the Rht region 278 V. Marker scores of the 'SS7010073 x Paragon' F5 population 280 VI. Summary of INRA BWCC phenotype and genotype results 282
VII. Summary of GA sensitivity experiments 1, 2, and 3 for the INRA BWCC accessions and control lines 297
Publication from thesis: in thesis jacket Febrer M, Wilhelm E, Al-Kaff N, Wright J, Powell W, Bevan MW, Boulton MI (2009) Rapid identification of the three homoeologues of the wheat dwarfing gene Rht using a novel PCR-based screen of three-dimensional BAC pools. Genome 52: 993-1000

1
1. GENERAL INTRODUCTION
1.1. INTRODUCTION
Global food shortages prevalent in the 1960s were greatly abated by the
development of high-yielding wheat (Triticum aestivum) varieties, one of the
world‟s most important crops. The rapid and worldwide adoption of the new
varieties overcame major food shortages and was termed the „green
revolution‟. The utilisation of semi-dwarf wheat varieties was key to producing
high-yielding varieties that were more resistant to lodging, allowing for greater
agricultural inputs and more intense farming practices. The genetic basis of
the semi-dwarf varieties are the Reduced height (Rht) alleles Rht-B1b and
Rht-D1b, which are both derived from the Japanese variety „Norin 10‟. It is
estimated that over 70% of the wheat acreage planted in the developing world
contains at least one of these two alleles (Evans, 1998) and that 90% of the
semi-dwarf varieties contain Rht-B1b and/or Rht-D1b (Worland et al., 1998b).
The Rht-B1b and Rht-D1b alleles encode altered forms of the DELLA protein,
resulting in plants with reduced gibberellin (GA) sensitivity and reduced stalk
length while maintaining high yield. Although Rht-B1b and Rht-D1b have
been characterised (Gale and Youssefian, 1985) and cloned (Peng et al.,
1999), little is known regarding the allelic diversity at these loci. Less is
known about Rht-A1, which has not been fully sequenced or genetically
mapped and has not been associated with changes in plant height or GA
sensitivity. In addition, the genetic makeup of the surrounding region that was
presumably introgressed into modern wheat varieties along with the Rht-B1b
and Rht-D1b alleles is not known.
1.2. DELLA PROTEINS IN PLANTS
1.2.1. DELLA loci in dicots and monocots
In Arabidopsis, there are five DELLA genes, GAI (gibberellic acid insensitive),
RGA (repressor of ga1-3), RGL1 (RGA-like 1), RGL2, and RGL3. These
genes each encode proteins that have specific, but overlapping functions.

2
GAI and RGA reduce stem elongation (King et al., 2001), RGL2 inhibits seed
germination (Lee et al., 2002; Tyler et al., 2004), and RGA, RGL1, and RGL2
modulate floral development (Tyler et al., 2004). The function of RGL3 is not
specifically defined, although low temperature stress was found to increase
expression of this gene (Achard et al., 2008a). While Arabidopsis has five
DELLA genes, other plant species have only one or two DELLA genes (Table
1.1). In the dicots, a single DELLA-encoding gene is found in tomato
(Solanum lycopersicum), grape (Vitis vinifera), and Brassica rapa while two
genes are found in soybean (Glycine max) and pea (Pisum sativum).
Table 1.1 DELLA loci in dicot and monocot plant species
Most monocots have only a single gene encoding a DELLA protein, these are
SLN1 in barley, SLR1 in rice (Oryza sativa), SbD8 in sorghum bicolor, PgD8
in Pearl Millet (Pennisetum glaucum), and Bradi1g11090 in Brachypodium
distachyon. Wheat is an allohexaploid (2n = 6x =42) containing A, B, and D
genomes derived from three closely related ancestors (see section 1.6) and
for this reason has three Rht-1 homoeoloci, which are Rht-A1, Rht-B1, and
Type Common Name Latin Name DELLA loci Key Reference
GAI Pysh et al. (1999)
RGA Pysh et al. (1999)
RGL1 Dill and Sun (2001)
RGL2 Dill and Sun (2001)
RGL3 Dill and Sun (2001)
Grape Vitis vinifera VvGAI Boss and Thomas (2002)
Oilseed rape Brassica rapa BrRGA1 Muangprom et al ., 2005
GmGAI1 Bassel et al. (2004)
GmGAI2 Bassel et al . (2004)
Tomato Solanum lycopersicum LeGAI Bassel et al . (2004)
La Weston et al. (2008)
Cry Weston et al . (2008)
Barley Hordeum vulgare SLN1 Chandler et al. (2002)
Brachypodium Brachypodium distachyon Bradi1g11090
d8 Peng et al. (1999)
d9 Lawit et al. (2010)
Rice Oryza sativa SLR1 Ikeda et al. (2001)
Sorghum Sorghum bicolor SbD8 Li et al . (2010)
Pearl Millet Pennisetum glaucum PgD8 Li et al. (2010)
Rht-A1 Febrer et al. (2009)
Rht-B1 Peng et al . (1999)
Rht-D1 Peng et al . (1999)
Pisum sativumPea
Dicot
Monocot
Wheat
Arabidopsis
Maize
Soybean Glycine max
Zea mays
Triticum aestivum
Arabidopsis thaliana

3
Rht-D1. Maize (Zea mays), due to a recent whole-genome duplication
contains two DELLA genes, D8 (Dwarf8) and D9 (Dwarf9) (Lawit et al., 2010).
In a rice database search, two additional genes, SLRL-1 (SLR-like1) and
SLRL-2 (SLR-like2) that closely resembled SLR1 but lacked the DELLA motif
were identified (Itoh et al., 2005). The authors reported that plants over-
expressing SLRL-1 produced a dwarf phenotype and had other characteristics
that suggested that SLRL-1 represses GA signalling in the over-expressed
condition. However, SLRL-1 growth repression in this study was found to be
much weaker than in transgenic plants expressing a truncated SLR1 protein
lacking the DELLA domain. The role of the SLRL genes in rice is not clear,
but Itoh et al. (2005) suggested that these genes might function as a safety
mechanism preventing excessive GA-induced growth.
1.2.2. Conserved DELLA domains
DELLAs are members of the GRAS protein family, a diverse set of regulatory
proteins affecting plant growth and regulation including hormone signalling,
axillary meristem initiation, shoot meristem maintenance, root architecture,
light signalling, and male gametogenesis (Tian et al., 2004). The GRAS
family is named for the GAI, RGA, and SCR (SCARECROW) proteins, which
were the first members of this family to be characterised. GRAS proteins
contain several conserved domains including an LHR1 (leucine heptad repeat
1), NLS (nuclear localisation signal), VHIID, LHR2 (leucine heptad repeat 2),
PFYRE, and SAW domain (Pysh et al., 1999) (Figure 1.1). The VHIID,
PFYRE, and SAW domains (each named after conserved amino acids) act to
repress plant growth (see section 1.2.3). In the DELLA proteins, the GRAS
domain comprises the C-terminus, while the N-terminus contains the highly
conserved DELLA, TVHYNP, and poly S/T/V (rich in serine, threonine, and
valine) domains that distinguish these proteins from other members of the
GRAS family (Tian et al., 2004). The DELLA and TVHYNP domains (named
for highly conserved amino acid motifs) are important for GA signal perception
(see section 1.2.3).

4
Figure 1.1. Conserved regions of the DELLA protein. Conserved domains are shown as
blue rectangles. The N-terminus is unique to DELLA proteins and consists of the DELLA and
TVHYNP domains (both named after conserved amino acid motifs) that participate in GA
signalling and a poly S/T/V (Ser/Thr/Val rich) domain thought to regulate DELLA repression
activity. The C-terminus, or GRAS domain, consists of LHR1 (leucine heptad repeat 1), NLS
(nuclear localisation signal), LHR2, VHIID, PFYRE, and SAW domains (the latter three named
after conserved amino acids), and functions as a growth repressor.
1.2.3. DELLA protein characterisation
Studies of DELLA mutants in Arabidopsis and in cereal species have shown
how DELLA proteins affect plant phenotype and helped identify important
regions in the DELLA protein. The gai mutant in Arabidopsis is a semi-
dominant gain of function (GoF) mutant that encodes a DELLA protein lacking
17 amino acids in the DELLA domain (Peng et al., 1997). Plants with the gai
allele are characterised by greater GA insensitivity (GAI), reduced plant
height, and increased levels of endogenous GA (Koornneef et al., 1985).
These are the same characteristics identified in Rht GoF mutants in other
species, which also have N-terminal mutations. These mutant alleles include
Rht-B1b and Rht-D1b in wheat, which each have a predicted stop codon in
the DELLA domain (Gale and Youssefian, 1985); D8-1 in maize, which
contains a four amino acid deletion in the DELLA domain (Peng et al., 1999),
and Sln1d in barley, which has a G to A amino acid substitution in the DELLA
domain (Chandler et al., 2002). The role of the DELLA protein N-terminal
domains in GA signalling was further investigated by overexpression of rice
SLR1 cDNA-GFP fusion proteins that contained large deletions in specific N-
terminal domains (Itoh et al., 2002). Overexpression of DELLA proteins with
deletions in the DELLA or TVHYNP domain resulted in dwarfed plants with
DELLA TVHYNP poly S/T/V
LHR1 NLS VHIID LHR2 PFYRE SAW
N-terminus C-terminus

5
decreased GA sensitivity. GFP fluorescence in proteins with DELLA or
TVHYNP deletions was present in the nuclei even with the application of GA3,
indicating that these modified proteins are not degraded by GA whereas
plants containing constructs of fully intact SLR1 fused to GFP were degraded
in the presence of GA. A large deletion in the poly S/T/V also resulted in
dwarf plants, however plants remained responsive to GA and the DELLA
protein was degraded by GA. The Itoh et al. (2002) study indicates the
importance of the DELLA and TVHYNP domains in GA signalling and
suggests that the poly S/T/V domain serves a regulatory role in the repression
activity of DELLA proteins.
Recessive loss of function (LoF) mutants have also been identified in
Arabidopsis; however, due to the overlapping functions of the DELLA
proteins, this required LoF mutations in four of the five DELLA proteins (RGL3
maintained a functional copy). The “DELLA LoF quadruple mutant” (gai-
t6+rga-t2+rgl1-1+rgl2-1) has a phenotype closely resembling wild type plants
treated with exogenous GA, having reduced seed dormancy and early
flowering (Alvey and Harberd, 2008). A similar constitutive GA response was
found in LoF DELLA mutants in rice SLR1 and barley SLN1, which result in
plants with tall, slender stems and slender leaves despite having reduced
levels of GA. The rice SLR1 LoF mutants include slr1-1, which has a
frameshift in the NLS domain and slr1-2, slr1-3, and slr1-4, which each
contain a premature stop codon in the C terminus (Ikeda et al., 2001). The
barley mutant sln1c also has a premature stop codon in the C terminus of the
protein (Chandler et al., 2002). While most LoF mutants are characterised by
mutations in the C terminus of the DELLA protein, there are, as exceptions, C
terminus mutants that lead to GoF mutants and a dwarf phentoype. These
have been reported for the Brassica rapa BrRGA1 (Muangprom et al., 2005)
and maize D9 loci (Lawit et al., 2010). Overall, the C-terminal mutants
demonstrate the importance of this region in suppressing plant growth,
although mutations in this region may also affect DELLA stability.
1.2.4. Regulation of DELLA protein levels
6
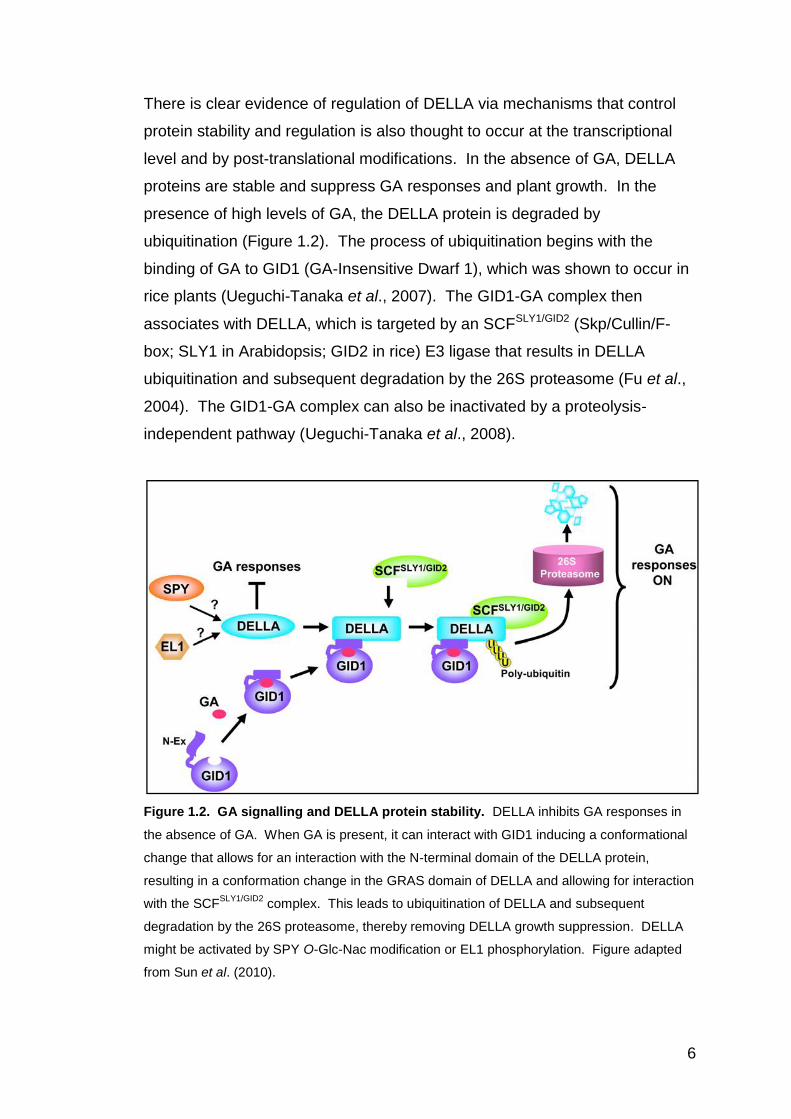
There is clear evidence of regulation of DELLA via mechanisms that control
protein stability and regulation is also thought to occur at the transcriptional
level and by post-translational modifications. In the absence of GA, DELLA
proteins are stable and suppress GA responses and plant growth. In the
presence of high levels of GA, the DELLA protein is degraded by
ubiquitination (Figure 1.2). The process of ubiquitination begins with the
binding of GA to GID1 (GA-Insensitive Dwarf 1), which was shown to occur in
rice plants (Ueguchi-Tanaka et al., 2007). The GID1-GA complex then
associates with DELLA, which is targeted by an SCFSLY1/GID2 (Skp/Cullin/F-
box; SLY1 in Arabidopsis; GID2 in rice) E3 ligase that results in DELLA
ubiquitination and subsequent degradation by the 26S proteasome (Fu et al.,
2004). The GID1-GA complex can also be inactivated by a proteolysis-
independent pathway (Ueguchi-Tanaka et al., 2008).
Figure 1.2. GA signalling and DELLA protein stability. DELLA inhibits GA responses in
the absence of GA. When GA is present, it can interact with GID1 inducing a conformational
change that allows for an interaction with the N-terminal domain of the DELLA protein,
resulting in a conformation change in the GRAS domain of DELLA and allowing for interaction
with the SCFSLY1/GID2
complex. This leads to ubiquitination of DELLA and subsequent
degradation by the 26S proteasome, thereby removing DELLA growth suppression. DELLA
might be activated by SPY O-Glc-Nac modification or EL1 phosphorylation. Figure adapted
from Sun et al. (2010).

7
Post-translational modifications of DELLA include phosphorylation and O-
linked N-acetylglucosamine (O-Glc-Nac) modification. Phosphorylated
DELLA proteins have been identified in Arabidopsis (Fu et al., 2004) and rice
(Sasaki et al., 2003) and phosphorylation of DELLA by EL1 (Earlier Flowering
1) is thought to be needed for DELLA stability and activity (Sun et al., 2010)
(Figure 1.2). SPY (Spindly), an O-Glc-Nac transferase was also proposed to
increase the activity of RGA in Arabidopsis via O-Glc-Nac modification
(Silverstone et al., 2007) (Figure 1.2)
Several studies also suggest that transcriptional control of DELLA is
important. Abundant levels of RGL1, RGL2, and RGL3 in Arabidopsis were
found only in germinating seeds and/or flowers and siliques, suggesting a
potential transcriptional control (Tyler et al., 2004). In another study, GAI and
RGA transcription in Arabidopsis was enhanced by direct binding of the
transcription factor PIL5 (phytochrome-interacting factor3-like5) to the
promoter regions of these genes (Oh et al., 2007). In rice, Ogawa et al.
(2000) found that SLR1 expression levels differed based on development
stage and tissue type. In wheat, transcriptional control of DELLA was found
to be an important regulatory mechanism that affects seed germination
(Saville, 2011), and DELLA expression levels were also found to vary
between tissue types collected following ear emergence (Pearce et al., 2011).
1.2.5. DELLA protein function
While DELLA proteins are known to restrict plant growth in the absence of
GA, the molecular mechanism is not well understood. As members of the
GRAS family, DELLAs are putative transcription factors and DELLA proteins
have been localised to the nucleus (Ogawa et al., 2000; Lawit et al., 2010).
However, the presence of a DNA binding domain on the DELLA protein has
not been shown (Achard and Genschik, 2009). In vivo association of DELLA
with promoter regions of GA biosynthetic genes (including GA20ox2 and
GA3ox1), GA receptor genes (including GID1), and other early GA-responsive
genes was detected using chromatin immunoprecipitation (ChIP) (Zentella et
al., 2007). Based on the ChIP results, the authors proposed that DELLA

8
proteins repress GA signalling by activation of downstream genes thought to
encode GA signalling repressors and that DELLA proteins modify GA
homoeostasis by increasing expression levels of genes involved in GA
biosynthesis and GA reception via a feedback mechanism (Zentella et al.,
2007). In a more recent study, DELLA proteins were found to interact with
PIF3 (phytochrome-interacting factor) (Feng et al., 2008) and PIF4 (De Lucas
et al., 2008), members of the basic helix-loop-helix (bHLH) transcription factor
family), reducing the ability of the PIFs to enhance expression of unidentified
target genes involved in growth promotion. DELLA proteins have been shown
to interact with three additional bHLH transcription factors (PIL2, PIL5, and
SPT) (Gallego-Bartoleme et al., 2010), indicating DELLAs likely can interact
with a broad class of bHLH proteins in planta.
1.2.6. Role of DELLAs in response to plant stress
Several studies in Arabidopsis indicate that DELLA proteins play a key role in
plant survival under abiotic and biotic stress. The involvement of DELLA
proteins in the regulation of salt-activated phytohormone signalling pathways
was recently demonstrated (Achard et al., 2006). The GA insensitive/GoF
Arabidopsis mutant, gai and the GA deficient mutant ga1-3 were both found to
be more tolerant of high salt than plants carrying the wild type allele at these
loci. In a high salt environment, wild type Arabidopsis plants had a survival
rate of 36% while the survival rate of the gai mutant was 82% and of ga1-3
was 93% (Achard et al., 2006). In contrast, the Arabidopsis “DELLA LoF
quadruple mutant” was less salt tolerant than the wild type with a survival rate
of 7% (Achard et al., 2006). Similarly, barley GoF mutants at the SLN locus
survive heat shock and salt stress better than wild type lines while LoF
mutants have reduced survival rates relative to the wild type lines (T. Moore,
JIC, pers. comm.). Under cold stress, increased DELLA protein accumulation
is also associated with higher freezing tolerance in Arabidopsis plants (Achard
et al., 2008a). Increased stress tolerance associated with DELLAs was
hypothesised to be caused by an increase in the stability of the DELLA
proteins, which restricts plant growth and thereby enhances plant survival
(Achard and Genschik, 2008a). One mechanism by which DELLAs may

9
restrain growth and increase survival is by reducing levels of reactive oxygen
species (ROS) (Achard et al., 2008b). ROS are small molecules created in
response to stress that result in cell death as part of the plant defence
response. DELLAs were found to reduce ROS accumulation and cell death
after biotic or abiotic stress by increasing expression of ROS detoxification
enzymes, thereby improving stress tolerance (Achard et al., 2008b).
In terms of biotic stress, DELLAs have been shown to promote increased
resistance to necrotrophs, but increased susceptibility to biotrophs. The GoF
(stabilised) DELLA protein found in the Arabidopsis gai mutant was found to
play a role in growth inhibition as part of a defence response when plants
perceived flg-22, a peptide signal associated with necrotrophs (Navarro et al.,
2008). The authors also found that the Arabidopsis “DELLA LoF quadruple
mutant” resulted in increased resistance to the biotroph Pseudomonas
syringae. The mechanism is thought to be partially related to the balance of
the jasmonic acid (JA)/salicylic acid (SA) defence pathways as high JA:SA
generally results in enhanced resistance to necrotrophs and high SA:JA in
enhanced resistance to biotrophs. Increased DELLA stability is thought to
enhance JA signalling, possibly at the expense of SA signalling (Navarro et
al., 2008). The barley (cv. „Himalaya‟) Sln1d GoF DELLA mutant shows a
significant increase in susceptibility to the biotroph Blumeria graminis (which
causes powdery mildew) relative to the wild type while resistance of the LoF
DELLA mutant sln1c was not significantly changed relative to the wild type
(Saville, 2011). In wheat (cv. „Mercia‟ and „Maris Huntsman‟) infected with B.
graminis, no change in resistance was evident between wild type plants and
near isogenic lines (NILs) containing a single GoF allele (Rht-B1c or Rht-D1c,
which each cause severe dwarfing), however, NILs containing two dwarfing
alleles (Rht-B1c+Rht-D1b) were more susceptible than wild type plants
(Saville, 2011). In addition, R. Saville also reported an increased resistance
to necrotrophs Oculimacula yallundae and O. acuformis (which both cause
eyespot disease) in wheat (cv. „Mercia‟) GoF Rht-B1c and Rht-D1c NILs
relative to the wild type and in the barley (cv. „Himalaya‟) Sln1d GoF mutant
relative to the wild type. These studies demonstrate not only the role of
DELLA in abiotic and biotic stress, but also its role as an integrator of

10
hormonal and environmental signals. Plant responses to auxin and ethylene
have also been attributed to DELLA function, suggesting that DELLA proteins
may serve as important integrators of multiple phytohormone signalling inputs
(Alvey and Harberd, 2005; Alvey and Boulton, 2008).
1.3. GROUP IV RHT-1 LOCI AND DWARFING ALLELES IN WHEAT
1.3.1. Rht-1 loci
The nomenclature of the Group IV Rht loci in wheat follows that of McIntosh
(1988) with Rht-1 serving as the generic locus name for the three homoeoloci.
The loci on chromosomes 4A, 4B, and 4D are referred to as Rht-A1, Rht-B1,
and Rht-D1, respectively. Rht-B1 and Rht-D1 have been mapped to the short
arms of chromosomes 4B and 4D, respectively (Gale and Youssefian, 1985).
Rht-B1 has consistently been located near the centromere with estimates
ranging from 10 to 22 cM distal (McVittie et al., 1978; Borner et al., 1997; Ellis
et al., 2002, Somers et al., 2004). The location of Rht-D1 is less clear with
locations ranging from 15 cM distal of the centromere (McVittie et al., 1978) to
having no linkage with the centromere (Izumi et al., 1983), and there is little
consensus among mapping studies. No attempt has been made to map the
Rht-A1 locus owing to the absence of any detectable height variation
associated with this locus and the lack of available sequence, which was only
recently published (Febrer et al., 2009; Pearce et al., 2011). The location of
the Rht-A1 locus may not be colinear with either Rht-B1 or Rht-D1 because of
multiple inversions and translocations on 4A that have resulted in the majority
of the native short (S) arm of chromosome 4A being located on the “modern”
long (L) arm of 4A (Miftahudin et al., 2004).
Wild type alleles at each Rht-1 locus, designated by an “a” (Rht-A1a; Rht-B1a;
Rht-D1a), confer plants with a “tall” height that are GA sensitive (Table 1.2).
The Rht-B1a and Rht-D1a genes (cv. Chinese Spring (CS)) consist of a single
exon approximately 1.87 kb in length containing the highly conserved N- and
C- terminal domains that are characteristic of DELLA proteins (Peng et al.,
1999). The Rht-D1a sequence shares 62% amino acid identity with

11
Arabidopsis GAI and 58% with RGA (Peng et al., 1999). The CS Rht-B1a and
CS Rht-D1a are the only Rht-1a alleles sequenced. The Rht-B1a and Rht-
D1a allelic designations are not sequence-specific and other varieties having
these designations may be polymorphic at these loci relative to CS. On the A
genome, the likely presence of an Rht-A1a allele was demonstrated by Peng
et al. (1999) using gel-blot hybridisation of the CS group 4 nullisomic-
tetrasomic (NT) lines with wheat cDNA (C15-1) serving as the probe. More
recently, an approximately 525 bp read from a putative Rht-A1a BAC clone
from CS was published that was similar to, yet distinct from, the CS Rht-B1a
and Rht-D1a sequences (Febrer et al., 2009 and Chapter 3).
Table 1.2. Summary of dwarfing alleles at the group IV Rht-1 homoeoloci
a The -a allele represents the wild type or tall alleles.
b Allelic source variety. NA = not applicable.
c Chromosomal location
d Gibberellic acid sensitivity, sensitive (sen.) or insensitive (ins.)
1.3.2. Rht-B1b and Rht-D1b
The Rht-B1 and Rht-D1 loci each contain a series of GAI alleles (Table 1.2)
that confer varying degrees of height reduction relative to the wild type alleles
(Figure 1.3). The five dwarfing alleles identified at the Rht-B1 locus are
designated by the lowercase letters b, c, d, e, and f following the locus name
and the three dwarfing alleles at the Rht-D1 locus are designated b, c, and d.
By far the most economically important and most commonly used height
reducing alleles in bread wheat are Rht-B1b and Rht-D1b, formerly known as
Allelea
Prior
Nomenclature Sourceb Phenotype
Chr.
Locc
GA
sens.d Key Reference
Rht-A1a NA tall 4A sen. Febrer et al . (2009)
Rht-B1a rht1 NA tall 4BS sen. Peng et a l. (1999)
Rht-B1b Rht1 Norin 10 semi-dwarf 4BS ins. Gale and Youssefian (1985)
Rht-B1c Rht3 Tom Thumb severe dwarf 4BS ins. Gale and Youssefian (1985)
Rht-B1d Rht1S Saitama 27 semi-dwarf 4BS ins. Worland and Petrovic (1988)
Rht-B1e Rht Krasnodari 1 Krasnodari 1
semi / severe
dwarf 4BS ins. Worland (1986)
Rht-B1f
Rht
T.aethiopicum
T.
aethiopicum 4BS ins. Borner et al . (1995)
Rht-D1a rht2 NA tall 4DS sen. Peng et al . (1999)
Rht-D1b Rht2 Norin 10 semi-dwarf 4DS ins. Gale and Youssefian (1985)
Rht-D1c Rht10 Ai-bian 1 severe dwarf 4DS ins. Borner and Mettin (1988)
Rht-D1d Rht Ai-bian 1a Ai-bian 1a semi-dwarf 4DS ins. Borner et al. (1991)

12
Rht1 and Rht2, respectively. These alleles are classified as semi-dwarf in
that they confer moderate reductions in plant height (Figure 1.3). In a series
of trials using four sets of NILs, Rht-B1b and Rht-D1b were 86% and 83% the
height of wild type plants (Flintham et al., 1997). Sequences of the Rht-B1b
and Rht-D1b semi-dwarf alleles reveal the presence of nucleotide
substitutions that result in premature stop codons in the DELLA domain (Peng
et al., 1999). In Rht-B1b, a C to T change converts amino acid 64 from
glutamine to a stop codon and in Rht-D1b, a G to T change converts amino
acid 61 from glutamic acid to a stop codon. The nucleotide sequences of the
coding regions are otherwise identical to the respective Rht-1a alleles. It is
thought that translation is reinitiated following the premature stop codons in
Rht-B1b and Rht-D1b, leading to the synthesis of functional truncated DELLA
proteins lacking the DELLA domain (Peng et al., 1999). The truncated protein
is predicted to lack GA signal perception while maintaining the repressor
function, which likely explains the reduced GA sensitivity of plants containing
these proteins. The similarity of the Rht-B1b and Rht-D1b mutations may
explain why both alleles confer a similar dwarfing phenotype.
Figure 1.3. Mature plants of near isogenic lines containing a single Rht-B1 or Rht-D1
dwarfing alleles in the Mercia background.
WT B1d B1b D1b D1d B1e B1c D1c

13
Individual dwarfing alleles at the Rht-B1 and Rht-D1 loci were backcrossed into the Mercia
wild type (WT). From left to right (with alternative nomenclature shown in parenthesis) are:
Mercia (WT); Rht-B1d (Saitama); Rht-B1b (Rht1); Rht-D1b (Rht2); Rht-D1d (Ai-bian 1a); Rht-
B1e (Bezostaya dwarf); Rht-B1c (Rht3); Rht-D1c (Rht10). Picture adapted from Pearce et al.
(2011).
1.3.3. Alternative Rht-B1 dwarfing alleles
Rht-B1c (previously Rht3) confers a greater degree of GA insensitivity than
Rht-B1b or Rht-D1b and results in severe dwarfism (Figure 1.3; Table 1.2).
The predominant source of the Rht-B1c allele is the American variety „Tom
Thumb‟. Flintham et al. (1997) reported that Rht-B1c NILs were
approximately 50% the height of wild type lines when averaged across four
genetic backgrounds tested in multiple trials. Along with extreme dwarfism
that is agronomically unfavourable, the Rht-B1c allele is also associated with
reduced male fertility (J Flintham, JIC, pers. comm.). However, this allele was
shown to reduce alpha-amylase activity in ripening grain (high alpha amylase
activity is associated with pre-harvest sprouting and reduced grain quality)
and may be of value to address this problem (Flintham and Gale, 1998).
Recent work suggests that dwarfism caused by the Rht-B1c allele is likely due
to a terminal repeat retro-transposons in miniature (TRIM) insertion of more
than 2 kb in size that occurs in the DELLA domain (Wu et al., 2011).
The Rht-B1d allele (previously Rht1S) reduces height to a lesser extent than
the other mutant alleles at the Rht-1 locus (Figure 1.3; Table 1.2). Based on
varietal comparisons, Rht-B1d was estimated to have an average plant height
that is 89% of varieties not containing this allele (Worland, 1986). In addition,
Rht-B1d is more sensitive to GA than Rht-B1b or Rht-D1b (GA-insensitivity of
Rht-B1d was estimated to be approximately half that of the Rht-B1b or Rht-
D1b alleles (Worland, 1986). Rht-B1d was first reported in the old Japanese
variety „Saitama 27‟, being introduced into European bread wheats in 1947,
and currently is present primarily in Southern European wheat lines (Worland
and Petrovic, 1988). The smaller decrease in height was suggested to have
potential agronomic advantage under some conditions (Worland and Petrovic,

14
1988). Rht-B1d carries the Rht-B1b point mutation that leads to the
premature stop codon in the DELLA domain (Pestsova et al., 2008). This
result was confirmed by sequencing the entire open reading frame (ORF) of
Rht-B1d, however no additional polymorphisms were found suggesting the
presence of an undetected mutation that confers increased height relative to
Rht-B1b (Pearce et al., 2011).
The semi-dwarf allele Rht-B1e (previously Rht Krasnodari 1 or Rht1(B.dw))
results in plant heights intermediate between those of severe and semi-dwarfs
(Figure 1.3; Table 1.2). Introduction of the Rht-B1e allele into four varietal
backgrounds resulted in plant heights that were approximately 75% of the wild
type, which is thought to be of potential commercial value (Worland and
Sayers, 1995). The Rht-B1e allele resulted from a spontaneous mutation in
the Russian line Bezostaya 1, with the mutant line named Krasnodari 1
(Worland, 1986). Sequencing of the ORF revealed the presence of a single
nucleotide polymorphism (SNP) that introduces a premature stop codon in the
DELLA domain (Pearce et al., 2011). The stop codon occurs at amino acid
61 (relative to Rht-B1a of CS), which is just three amino acids upstream of the
Rht-B1b premature stop codon (Pearce et al., 2011).
The allele Rht-B1f was identified in two tetraploid Ethiopian accessions
belonging to the subspecies Triticum aethiopicum JAKUBZ (Borner et al.,
1995) (Table 1.2). The relative GA sensitivity of the allele and its effect on
height has not yet been classified, nor has the genetic cause of dwarfism
been established.
1.3.4. Alternative Rht-D1 dwarfing alleles
The allele, Rht-D1c (previously Rht10) results in the greatest plant height
reduction among the Rht-1 GAI alleles (Figure 1.3; Table 1.2), limiting its
agronomic value. The original source of dwarfism is the Chinese variety „Ai-
bian 1‟ (Izumi et al., 1981). Rht-D1c was found to carry the Rht-D1b point
mutation leading to a predicted premature stop codon (Pestsova et al., 2008).
More recently, quantitative reverse transcriptase PCR (qRT-PCR) transcript

15
analysis revealed an approximately four-fold increase in Rht-D1c copy
number relative to lines with the Rht-D1a allele (Pearce et al., 2011). This
was also confirmed by southern hybridisation using probes specific to Rht-D1
and these results indicate that the severe dwarfism assocated with Rht-D1c is
likely the result of increased accumulation of the GAI DELLA protein (Pearce
et al., 2011).
The allele, Rht-D1d (previously Rht Ai-bian 1a) results in plants with a semi-
dwarf stature with height intermediate between plants containing Rht-D1b or
Rht-B1e (Figure 1.3; Table 1.2). This allele was derived from a spontaneous
mutation in Ai-bain 1, which carries the Rht-D1c allele (Borner et al., 1991).
Like Rht-D1c, Rht-D1d contains the Rht-D1b point mutation that leads to a
predicted premature stop codon (Pestsova et al., 2008). However, unlike Rht-
D1c, there does not appear to be an increase in Rht-D1 copy number, which
might explain the height relative Rht-D1c (Pearce et al., 2011). Taken
together, these data suggest that the spontaneous mutation in Rht-D1c that
produced Rht-D1d involved a reduction in gene copy number.
1.4. ADDITIONAL RHT LOCI AFFECTING PLANT HEIGHT IN WHEAT
According to the Catalogue of Gene Symbols
(http://www.shigen.nig.ac.jp/wheat/komugi/genes/symbolClassList.jsp), in
addition to the Rht-1 homoeoloci, there are a further 18 loci (Rht4 to Rht21)
that reduce height in wheat. These 18 additional loci are all classified as GA
sensitive and none have been cloned. The semi-dwarf allele Rht8 (the wild
type allele at this locus will be referred to as rht8, according to Gasperini,
2010), located on chromosome 2D, is one of the few GA sensitive Rht alleles
that reduce plant height without impacting grain yield (Worland and Law,
1986). Rht8 is the predominant allele conferring reduced height in Italian
wheat varieties and it is also commonly found in Southern and Eastern
Europe, and in lower frequencies in other parts of the world (Borojevic and
Borojevic, 2005). Relative to Rht-B1b and Rht-D1b, plants containing Rht8
have a longer coleoptile and greater seedling vigour (Rebetzke et al., 2001).
For these reasons, Rht8 is being incorporated into wheat varieties in arid

16
regions as a replacement for Rht-B1b or Rht-D1b (Rebetzke et al., 2007).
Rht8 and the photoperiod insensitive Ppd-D1a allele were both introduced into
Italian wheat via the Japanese variety „Akakomugi‟ in the early 20th century by
Nazareno Strampelli in an attempt to develop early maturing varieties with
resistance to lodging (Giorgi et al., 1982; Worland, 1999). The genetic
distance between Ppd-D1 and Rht8 is estimated at 21.7 cM (Gasperini,
2010). The Ppd-D1a allele contains a 2,089 bp deletion in its promoter
region, which is the likely cause of the insensitivity (Beales et al., 2007). Ppd-
D1a reduces the time to flowering by an average of six to eight days when
October sown in the UK (Norwich) and is also associated with a reduction in
plant height (Worland et al., 1998a).
To estimate the effects of Rht8 and Ppd-D1a on plant height, a substitution
line using Mara 2D was created in Cappelle Desprez (Cappelle Desprez/Mara
2D) by Korzun et al. (1998). Cappelle Desprez has the genotype rht8+Ppd-
D1b (photoperiod sensitive) and owing to the substitution Cappelle
Desprez/Mara 2D has the genotype Rht8+Ppd-D1a. Trial results showed that
Cappelle Desprez/Mara 2D was on average 18 cm shorter than Cappelle
Desprez with an estimated 10 cm of the height reduction attributable to Ppd-
D1a and 8 cm to Rht8 (Worland et al., 1998). Recently, Cappelle
Desprez/Mara 2D recombinant inbred lines (RILs) were grown and scored at
the Ppd-D1 and Rht8 loci (Gasperini, 2010). The data obtained by Gasperini
showed that Ppd-D1a+Rht8 RILs were 16 cm (15%) shorter than Cappelle
Desprez, which was in agreement with those obtained by Worland et al.
(1998b). However, in the Gasperini study, most of the height reduction was
associated with Rht8 as Rht8 RILs were 14 cm (13%) shorter and Ppd-D1a
RILs were 4 cm (3%) shorter than Cappelle Desprez. The reduced height in
Rht8 lines is due to a decrease in internode length throughout the stalk that is
likely caused by an altered sensitivity to brassinosteriods (Gasperini, 2010).
The GA sensitive allele, Rht9, is also present in „Akakomugi‟ and therefore is
likely present in many of the same varieties that carry Rht8 (Dalrymple, 1980;
Gale and Youssefian, 1985). Rht9 was originally thought to be located on
17
7BS (Worland et al., 1990), but more recently a quantitative trait locus (QTL)
for height related to Rht9 was found on 5AL (Ellis et al., 2005).
1.5. PHYSIOLOGICAL EFFECTS OF RHT-B1B AND RHT-D1B
1.5.1. Rht-B1b and Rht-D1b effects on wheat morphology and yield
In addition to reducing plant height, Rht-B1b and Rht-D1b have pleiotropic
effects on plant morphology and grain yield. The reduced height in lines with
the Rht-B1b or Rht-D1b alleles results from a reduced internode cell length,
while lines with the more severe Rht-B1c allele also have reduced cell number
(Flintham et al, 1997). Although stem length is reduced in Rht-B1b or Rht-
D1b semi-dwarf varieties, there is no change in spikelet number (Gale, 1979;
Brooking and Kirby, 1981; Youssefian et al., 1992). Rht-B1b and Rht-D1b
alleles are associated with an increase in the number of fertile florets (in
particular, distal florets) per ear, thereby increasing the total number of grains
per ear relative to the wild type (Flintham and Gale, 1983; Miralles and Slafer,
1995). Although grain size is generally reduced in the lines with the Rht-B1b
or Rht-D1b allele, the increase in grain number results in improved yield (Gale
and Youssefian, 1985). Reduced grain size is attributed to intra-floral
competition for assimilate rather than a direct effect of Rht-1 gene expression
in these tissues (Flintham et al., 1997). Hence, grain yield of Rht-B1b and
Rht-D1b semi dwarf plants is largely dependent on the supply of assimilates
and, under favourable conditions, semi-dwarf alleles are associated with
increased harvestable yield beyond that which can be accounted for by
reduced stalk lodging (Gale and Youssefian, 1985; Flintham et al., 1997;
Chapman et al., 2007). There is no clear difference between the effects of
Rht-B1b or Rht-D1b on yield (Gale and Youssefian, 1985), which may be due
to the close similarity of these two mutations (described in section 1.3.2).
Overall, for Rht-B1b or Rht-D1b semi-dwarf varieties, there is little or no
change in total above ground biomass, but a larger proportion of this biomass
is in the grain thereby increasing harvest index (Gale and Youssefian, 1985).

18
The effect of dwarfing alleles on root growth is not well understood. In some
studies, wheat plants with Rht-B1b or Rht-D1b have reduced root mass
(Subbiah et al., 1968; McKey, 1973; Siddique et al., 1990), while other studies
suggest an association with increased root mass (Bush and Evans, 1988;
Miralles et al., 1997). Several other studies showed no association between
dwarfing alleles and root growth (Lupton et al., 1974; Cholick et al., 1977;
Richards and Passioura, 1981; Wojciechowski et al., 2009; Saville, 2011).
Root growth studies have differed in methodology and growth conditions,
which have been shown to markedly affect the outcome (Wojciechowski et al.,
2009).
1.5.2. Rht-B1b and Rht-D1b effects on wheat abiotic stress performance
Under low production environments, the yield advantages normally associated
with Rht-B1b and Rht-D1b are often diminished or absent (Gale and
Youssefian, 1985). This is particularly true of spring-type wheats containing
semi-dwarfing alleles (Gale and Youssefian, 1985; Flintham et al., 1997).
Chapman et al. (2007) grew 16 pairs of spring wheat NILs containing Rht-B1b
or Rht-D1b and compared these to Rht-B1a+Rht-D1a NILs under differing
irrigation regimes in Mexico. Their results showed that in the high yield
(irrigated) environments, short-strawed varieties were higher yielding, but in
the lowest yielding (drought) environments, the benefit of the short-strawed
varieties disappeared. Loss of the yield benefit usually associated with Rht-
B1b and Rht-D1b under drought conditions was also reported by Sojka et al.
(1981), Richards (1992a), and Innes and Blackwell (1984). It was also
reported that drought stress at various stages throughout the growing period
reduces both grain number and grain weight to a greater extent in lines with
semi-dwarfing alleles than in wild type lines, which is thought to result from
decreased water use efficiency in the semi-dwarf lines (Nizam Uddin and
Marshall, 1989; Richards 1992b). Heat stress during various stages can also
be more detrimental to yield in lines with the Rht-B1b or Rht-D1b alleles than
wild type lines. Heat stress during ear initiation reduces competent floret
number, heat stress during meiosis reduces pollen viability, and post-anthesis

19
heat stress reduces grain size to a greater extent in semi-dwarfs than in wild
type lines (Hoogendoorn and Gale, 1988).
Rht-B1b and Rht-D1b alleles are associated with a shortened coleoptile and
reduced early seedling vigour (less leaf area) relative to GA sensitive alleles
(Rebetzke et al., 2001). Poor stand establishment may occur when semi-
dwarfs are planted at greater than 5 cm depth (Allan, 1989). This can be
problematic when planting in dry soils that require a greater planting depth to
reach moisture and can result in poor stand establishment if coleoptiles
cannot bring the shoot to the soil surface (Schillinger et al., 1998). In addition,
seedlings may emerge later and lack vigour needed for early leaf
development (Kirby, 1993). In arid wheat regions, such as parts of Australia,
wheat breeders have suggested that GA sensitive alleles such as Rht8 may
be more suitable than Rht-B1b and Rht-D1b (Ellis et al., 2004).
1.5.3. Rht-B1b and Rht-D1b associations with Fusarium Head Blight
Fusarium Head Blight (FHB) is an important fungal disease caused by F.
graminearum, which results in substantial wheat yield losses and reduced
grain quality due to increased concentrations of the mycotoxin deoxynivalenol
(DON). Several studies have demonstrated a negative correlation between
plant height and FHB severity (Mesterhazy, 1995; Miedaner 1997; Hilton et
al., 1999; Buerstmayr et al., 2000; Somers et al., 2003; Gervais et al., 2003;
Schmolke et al., 2005; McCartney et al., 2007; Miedaner & Voss, 2008;
Haberle et al., 2009). The cause of this correlation has either been attributed
directly to the height of the inflorescence above the soil surface (Yan et al.,
2011) or to linkage associated with Rht-D1b or Rht-B1b (Srinivasachary et al.,
2009).
Lines with the Rht-D1b allele are reported to have decreased Type 1
resistance (resistance to initial infection) with no change in Type 2 resistance
(resistance to spread in the ear) relative to lines containing Rht-D1a
(Srinivasachary et al., 2008; Srinivasachary et al., 2009). During initial
infection, the fungus is thought to be in a biotrophic stage (Brown et al., 2010)

20
and during growth in the ear is in a necrotrophic stage (Boddu et al., 2006).
Srinivasachary et al. (2008) showed that the greatest effect (51% increased
FHB susceptibility) was attributed to a QTL encompassing Rht-D1b in the
Spark (Rht-D1a, moderately FHB resistant) × Rialto (Rht-D1b, susceptible)
doubled haploid wheat population. Increased susceptibility to FHB associated
with Rht-D1b was also reported by Hilton et al. (1999), Draeger et al. (2007),
Holzapfel et al. (2008), Voss et al. (2008), and Meidaner and Voss (2008).
This association is also suggested by the finding that UK winter wheat
varieties, which predominantly carry the Rht-D1b allele, are generally
susceptible to FHB (Gosman et al., 2007). Lines containing Rht-B1b were
also associated with decreased Type 1 resistance, but were associated with
increased Type 2 resistance relative to lines containing Rht-B1a
(Srinivasachary et al., 2009). The association of Rht-B1b with the level of
plant FHB resistance in studies other than Srinivasachary (2009) is less clear.
Rht-B1b was associated with a 19% increased severity of FHB disease, but
this was not statistically significant (Medianer and Voss, 2008). Steiner et al.
(2004) reported that a QTL thought to correspond to Rht-B1b accounted for
just 7.4% of the phenotypic variance associated with FHB.
It was previously suggested that increased FHB susceptibility of semi-dwarf
wheat plants was related to increased humidity surrounding the ear (Klahr et
al., 2007; Somers et al., 2003a) or due to other microclimate effects directly
related to plant height. However, height was not correlated to FHB resistance
among plants when Draeger et al. (2007) compared Rht-D1a and Rht-D1b
doubled haploid subpopulations separately (thereby removing the
confounding effect of the Rht-D1b QTL). Hilton et al. (1999) also found no
difference in relative humidity between tall and short NILs and suggested that
microclimate did not explain the difference in FHB susceptibility between
semi-dwarf and wild type NILs. In a recent study, however, Yan et al. (2011)
attributed differences in FHB severity associated with Rht alleles to the direct
or indirect effects of height per se. In this study, ten Rht NIL pairs, each
consisting of an Rht line and a wild type line in an isogenic background, were
evaluated for FHB severity in a controlled environment facility. A wide range
of Rht alleles were evaluated that included alleles from Rht-B1 and Rht-D1
21
loci (Rht-B1b, Rht-D1b, and Rht-B1c) and alleles from GA sensitive Rht loci
(Rht4, Rht5, Rht8, Rht8+9, Rht11, and Rht13). In trial set 1, the wild type NIL
resulted in significantly (p < 0.05) better FHB type 1 resistance than the Rht
NIL in eight of the ten NIL pairs (Rht5 and Rht13 were not significantly better).
Increased FHB susceptibility associated with Rht loci other than Rht-B1 or
Rht-D1 indicates that susceptibility is not likely to be caused by genes linked
to Rht-D1b or Rht-B1b. In trial set 2, the pots containing Rht NIL plants were
physically raised so that ear height was the same as that of the wild type NIL.
With the difference in ear height removed, there was no longer a significant (p
< 0.05) difference in type 1 resistance between Rht and wild type plants in
nine of the ten NIL pairs (Rht8+9 was significantly different). However, in trail
set 2, while FHB infection levels in the Rht NILs were slightly reduced,
infection levels of the wild type NILs were nearly double that reported for trial
set 1. The authors suggest that the possible cause of increased susceptibility
in the Rht lines in sets 1 and 2 is related to microclimate differences (higher
humidity or increased temperature) that may be present at lower ear heights
or to morphological changes associated with ears of the Rht lines. The
increased wild type NIL susceptibility appears to be the primary reason that
differences in FHB susceptibility disappear in trial set 2. More work is
required to resolve the effect of plant height on FHB susceptibility.
1.6. EVOLUTIONARY HISTORY AND GENETIC DIVERSITY OF WHEAT
AND POACEAE SPECIES
The evolutionary history of wheat and related Poaceae (grass) species has
implications on wheat genetic diversity and is the basis for comparative
genomics. Determining genetic diversity among species at the genomic and
individual gene level is critical in searches for useful genetic variation.
Several genetic bottlenecks have occurred during wheat‟s evolutionary history
that resulted in the loss of diversity (Reif et al., 2005; Haudry et al., 2007) and
these were among the largest losses seen in crop species (Haudry et al.,
2007). Hence, ancestral wheat lines represent key sources of allelic variation
that could be used in future wheat breeding efforts. The radiation of the
Poaceae from a common ancestor is revealed in the syntenic relationships

22
among grass species (Gale and Devos, 1998). The large amount of
colinearity between genes of wheat and sequenced Poaceae species makes
comparative genomics possible, which is an important tool for understanding
the molecular genetics of wheat especially with the lack of a fully assembled
wheat genomic sequence.
Wheat and the Poaceae have a complex evolutionary history that includes
whole genome duplications and polyploidisation (Figure 1.4). The common
ancestor of the Poaceae is thought to have contained five chromosomes
(Salse et al., 2008). A whole genome duplication occurred in this ancestor
approximately 70 million years ago (MYA), followed by several million years
before divergence of the Panicoideae (sorghum and maize), Pooideae
(wheat, barley, and Brachypodium), and Oryzeae (rice) lineages (Paterson et
al., 2004). The divergence dates of the Panicoideae and Oryzeae lineages
from the Triticeae lineage are estimated at 60 MYA and 50 MYA, respectively
(Chalupska et al., 2008). Maize and sorghum did not diverge from each other
until as recently as 12 MYA (Swigonova et al., 2004). Following the split in
the maize and sorghum lineages, a whole genome duplication occurred in
maize at least 4.8 MYA (Swigonova et al., 2004). Maize currently contains
approximately 25% of its genes as duplicate homoeologues (Schnable et al.,
2009). Divergence of Brachypodium from the wheat ancestor occurred
approximately 32 to 40 MYA (Bossolini et al., 2007; Chalupska et al, 2008;
The International Brachypodium Initiative, 2010). Within the Triticeae, most
estimates of the divergence times of barley and wheat range from 10 to 15
MYA (Ramakrishna et al., 2002; Huang et al., 2002; Dvorak and Akhunov
2005; Chalupska et al., 2008).

23
Figure 1.4. Evolutionary history of wheat and selected Poaceae
Estimated time of divergence is shown at branch points (MYA = millions of years ago). Black
dots represent whole genome duplications (WGD). For wheat, genome designations are
shown below species name. BB/GG indicates that Aegilops speltoides gave rise to species
with BB or GG genomes. Dashed arrows indicate intermating and substantial gene flow
between species. The question mark indicates that the tetraploid progenitor of wheat is not
known, but is hypothesised to be T. dicoccum. Wheat divergences based on Charmet (2011).
Following separation from barley, the ancestral genomes that now compose
T. aestivum diverged from one another approximately 2-4 MYA to form the A,
B, and D genome lineages (Huang et al., 2002; Dvorak and Akhunov, 2005;
Chalupska et al., 2008). The D genome lineage gave rise to Aegilops (Ae.)
tauschii (DD genome), also known as Ae. squarrosa. The A genome lineages
further subdivided to include T. urartu (AA), T. boeoticum (AbAb genome;
common name: wild einkorn), and T. monococcum (AmAm, common name:
einkorn). The B genome lineage of wheat is derived from the Sitopsis section
of Aegilops, which have an SS genome designation. Several species make
Whole genome duplication of the Poaceae common ancestor (70 MYA)
Sorghum bicolor
Zea mays
Oryza sativa
Brachypodium
Hordeum vulgare
T. mono-
coccum
AmAm
T. urartu
AA
Ae. tauschii
DD
60 MYA12 MYA
WGD,
>5 MYA
50 MYA
35 MYA
12 MYA
Wheat ABD Divergence, 2-4 MYA
Sitopsis progenitor
Ae.
bicornis
SbSb
Ae.
searsii
SsSs
Ae.
longissima
SlSl
Ae.
sharonensis
ShSh
Ae.
speltoides
SS (BB/GG)
T. dicoccoides
AABB
T. dicoccum
AABB
T. aestivum
AABBDD(10,000 years ago)
T. durum
AABB
0.15 to 0.5 MYA
gene flow
gene flow
?

24
up the Sitopsis including, Ae. sharonensis (ShSh), Ae. longissima (SlSl), Ae.
searsii (SsSs), Ae. bicornis (SbSb), and Ae. speltoides (SS). The contributor of
the T. aestivum B genome is not fully established, but a recent publication
suggests that Ae speltoides is the likely progenitor (Kilian et al., 2007). Ae.
speltoides is a natural outcrosser and has the highest level of haplotype
diversity among the Sitopsis group (Kilian et al., 2007), which could have
implications regarding the B genome diversity of T. aestivum. The polyploid
T. dicoccoides (AABB genome, common name: wild emmer) is thought to
have originated approximately 150,000 to 500,000 years ago (Levy and
Feldman, 2002; Charmet, 2011) from the crossing and polyploidisation of T.
urartu (AA) with Ae. speltoides (SS). The domesticated form of T.
dicoccoides is known as T. dicoccum (AABB, common name: domesticated
emmer). Domesticated emmer is the progenitor of modern durum wheat (T.
durum, AABB). T. aestivum (AABBDD) arose from the interspecific cross and
subsequent polyploidisation of Ae. tauschii with either T. dicoccum as
suggested by Zohary and Hopf (2000) or T. dicoccoides approximately 8-
10,000 years ago (Levy and Feldman, 2002).
Sequence analysis has revealed genetic bottlenecks during the domestication
of wheat. A loss in genetic diversity was reported during the domestication of
tetraploid wheat, with a 70% loss between T. dicoccoides and T. dicoccum
and 69% loss between T. dicoccoides and T. aestivum when averaged across
21 loci (Haudry et al., 2007). An even greater loss (30-fold) in genetic
diversity was reported between the D genome of T. aestivum varieties and
Ae. tauschii at the GSS (Granule-bound Starch Synthase) locus (Caldwell et
al., 2004). This likely is the result of the origin of bread wheat from just a
small number of hexaploidisation events with the D genome donor Ae.
tauschii (Talbert et al., 1998; Caldwell et al., 2004) and little inter-mating
between bread wheat and Ae. tauschii (Dvorak et al., 1998), whereas a
substantial amount of inter-mating appears to have occurred between T.
aestivum and tetraploid wheat (Dvorak et al., 2006; Dubocovsky and Dvorak
2007; Luo et al., 2007). This may also explain why variation among D
genomes of bread wheat varieties tends to be less than that of the A and B
genomes (Caldwell et al., 2004; Dubcovsky and Dvorak, 2007; White et al.,

25
2008; Chao et al., 2009). In addition, further reductions in genetic diversity
are likely to have occurred during selection of beneficial agronomic traits
during domestication (Tanksley and McCouch, 1997).
1.7. ORIGIN AND DISTRIBUTION OF RHT-B1B AND RHT-D1B
1.7.1. Origin and spread of ‘Norin 10’
The Rht-B1b and Rht-D1b alleles in modern wheat varieties are
predominantly derived from the Japanese variety „Norin 10‟. By pedigree
history, the oldest known ancestor of „Norin 10‟ is the Japanese landrace
„Daruma‟, which is thought to be the source of both semi-dwarfing alleles
(Dalrymple, 1980; Kihara, 1983; Dalrymple, 1986). „Daruma‟ dates back to at
least the turn of the 20th century with records showing that in 1894 it was used
as a control in wheat trials in Japan (Kihara, 1983). According to Kihara
(1983), „Daruma‟ is short for „Bodhi Dharma‟, the founder of Zen Buddhism in
China, who is known for “sitting on the floor and facing to the wall in a cave for
nine years, which took away his ability to walk”. „Daruma‟ has come to mean
„no legs‟ and „do not tumble down‟ in Japan, which may be the reason
lodging-resistant wheat and rice was given this name (Kihara, 1983). It has
also been suggested that „Daruma‟ may have originated in the Korean wheat
population „Anzunbaengimil‟, which means “crippled wheat”, existing as early
as the 3rd or 4th century AD (Cho et al., 1980). The authors speculated that it
may have been introduced to Japan during the 16th century Korean-Japanese
War or by Japanese agronomists dispatched to Korea from 1901 to 1905,
although this latter date is subsequent to the date (1894) that „Daruma‟ was
used in Japanese wheat trials.
The Rht-B1b and Rht-D1b dwarfing alleles were introduced to the Western
World when S.C. Salmon, a United States Department of Agriculture (USDA)
advisor to the army in Japan, brought „Norin 10‟ to the US in 1946 (Reitz and
Salmon, 1968). „Norin 10‟ was not suitable for cultivation in the USA, but it
proved valuable in breeding. Orville Vogel, a USDA scientist at Washington
State University, was the first person to utilise „Norin 10‟ in the US,

26
incorporating it into his breeding programme beginning in 1949 (Reitz and
Salmon, 1968). In Vogel‟s breeding programme, the cross „Norin 10 x Brevor‟
was made and progeny of this cross became the predominant source of
dwarfism in wheat in the US and worldwide. Vogel‟s work on short-strawed
wheat coincided with the work of Norman Borlaug, then working at CIMMYT
(International Maize and Wheat Improvement Center) in Mexico to improve
wheat yields by the use of high levels of nitrogen fertilisation. Seed of a
selection of „Norin 10/Brevor‟ was sent to Borlaug in 1953 and the first
successful crosses made in 1955 (Dalrymple, 1986). Beginning in 1962, a
series of semi-dwarf bread wheat varieties was released from the CIMMYT
programme and distributed to many regions around the world including
Australia, the Middle East, Latin America, and Africa, representing the origin
of the „green revolution‟ in wheat. The end result was a rapid introgression of
Rht-B1b and/or Rht-D1b into most of the world‟s hexaploid wheat varieties.
For his contributions to the world food supply, Norman Borlaug was awarded
the Nobel Peace Prize in 1970.
1.7.2. Alternative sources of Rht-B1b and Rht-D1b
There are several alternative, albeit relatively minor sources of the Rht-B1b
and Rht-D1b alleles in addition to „Norin 10‟. Two alternative sources used in
US wheat varieties include „Suweon 92‟ (also referred to as „Suwon 92‟) and
„Seu Seun 27‟, which were both derived from „Daruma‟ (the putative source of
Rht-B1b and Rht-D1b) and developed in Korea (Dalrymple, 1986). At least
132 additional „Norin‟ lines exist in addition to „Norin 10‟ and 102 of these
were shown to contain Rht-B1b and/or Rht-D1b by test-crossing to Rht-B1b
and Rht-D1b and measuring and GA response in F2 seedlings (Yamada,
1990). The National Agricultural Experiment Stations in Japan used the
„Norin‟ numbering system in the early part of the 20th century (Nakamura et
al., 1999), hence the term „Norin‟ does not necessarily refer to plant height.
„Daruma‟ is shown in the parentage of only a small number of the „Norin‟ lines
examined by Yamada (1990), suggesting the possibility that non-„Daruma‟
sources of Rht-B1b and Rht-D1b may be present in the „Norin‟ lines. The
semi-dwarf lines „Norin 16‟, „Norin 26‟, and „Norin 33‟ have had limited use in

27
the US (Dalrymple, 1980). „Norin 16‟ contains „Daruma‟ in its parentage while
„Norin 26‟ and „Norin 33‟ have an unknown source of semi-dwarfism
(Dalrymple 1980; Yamada 1990). Yamada (1989) also identified four
Japanese landraces that contained the Rht-D1b allele that had an unidentified
source. In China, „Suwon 86‟, a Korean variety derived from „Daruma‟, is a
major souce of Rht-B1b and Rht-D1b (Zhang et al., 2006). The authors also
reported that two other major sources of Rht-D1b, accessions „Huixianhong‟,
and „Yaobaomai‟ have unknown sources of semi-dwarfism. „Huixianhong‟ is a
landrace that was a leading cultivar in the 1930s and „Yaobaomai‟ is a variety
released in 1964 (Zhang et al., 2006). Along with „Norin 10‟, the Italian
cultivar „St 2422/464‟ may be a major source of Rht-B1b in China (Zhang et
al., 2006), however „St2422/464‟ showed moderate response to GA and may
in fact contain the Rht-B1d allele (Jia et al., 1992). These reports indicate that
several sources of the Rht-B1b and Rht-D1b alleles not derived from „Norin
10‟ are found in modern wheat varieties and in addition, some of these
sources may not be derived from „Daruma‟.
1.7.3. Rht-B1b and Rht-D1b prevalence in the world
Several groups have estimated the prevalence of Rht-B1b and Rht-D1b in
specific countries either by pedigree analysis, crossing to semi-dwarf tester
lines and measuring GA response in F2 progeny, or more recently using the
Rht-B1b and Rht-D1b perfect markers developed by Ellis et al., (2002). As
discussed in section 1.7.1, most US semi-dwarf varieties are derived from
„Norin 10‟, but some are derived from other sources. The first semi-dwarf
variety released in the US was „Gaines‟ in 1961, which acquired its short
stature from „Norin 10/Brevor 14‟. In 1964, „Gaines‟ represented nearly all of
the US semi-dwarf wheat acreage and 3% (1.6 million acres) of the total US
wheat acreage (Dalrymple, 1980). By 1969, semi-dwarfs represented 7% of
the US wheat acreage with „Gaines‟ and its progeny „Nugaines‟ representing
over 70% of the semi-dwarf acreage (Dalrymple, 1980). By 1974 semi-dwarfs
represented 22% of U.S acreage with 19 varieties planted to more than
100,000 acres each (Dalrymple 1980). Progeny of the Korean varieties „Seu
Seun 27‟ and „Suweon 92‟, represented 3% (480,000 acres) and 12% (1.8
28
million acres), respectively, of the land planted to semi-dwarfs varieties in
1974 (Dalrymple, 1980). Most of the early US semi-dwarf lines are derived
from breeding material created in the US and to a lesser extent from CIMMYT
breeding lines (Dalrymple 1980).
Semi-dwarf wheat varieties currently used in the United Kingdom (UK) are
thought to be predominantly derived from „Vg9144‟ and „Vg8058‟, which are
two semi-dwarf varieties from Orville Vogel‟s breeding programme which have
a „Norin 10‟ ancestry (Gale and Youssefian, 1985). These lines were sent to
Chile where they were crossed with tall French varieties before being sent to
the Plant Breeding Institute (PBI), Cambridge, UK, in 1964 (Gale and
Youssefian, 1985). This germplasm was not directly suitable for use in the
UK, but was utilised as breeding material. In 1974, the first UK semi-dwarf
varieties „Fundin‟, „Bilbo‟, and „Durin‟ were released (Gale and Youssefian,
1985). Semi-dwarfs quickly dominated the market in the UK and by 1982
varieties carrying a „Norin 10‟ dwarfing allele (later discovered to be Rht-D1b)
represented over 75% of the winter wheat acreage (Gale and Youssefian,
1985). The PBI developed most of these varieties and eight of the nine semi-
dwarf varieties in the 1981 NIAB Recommended List came from this group
(Gale et al., 1982). The rapid adoption, limited sources of founding
germplasm, and use of just the Rht-D1b allele represents a potential genetic
bottleneck in UK wheat germplasm. A genome-wide screen of Diversity Array
Technology (DArT) markers applied to US, UK, and Australian commercial
bread wheat cultivars released between 1930-2005 indicates that the UK had
the least genetic diversity among these countries and that UK wheat diversity
reached a low-point during the period (1975-1985) that semi-dwarfs were
rapidly replacing tall varieties in the UK (White et al., 2008).
In Australia, Rht-B1b or Rht-D1b are reported to be present in the majority of
cultivars although a minority of other semi-dwarfing alleles exist (personal
communication, Daryl Mares, School of Agriculture and Wine, University of
Adelaide). The first semi-dwarf varieties in Australia were derived from
CIMMYT lines of „Norin 10‟ origin (Syme and Pugsley, 1974; Gale and King,
1988) and several hundred lines were imported from the CIMMYT breeding
29
programme in 1963 (Syme and Pugsley, 1974). In addition, Australian wheat
breeders have repeatedly acquired additional semi-dwarf varieties from
CIMMYT following the original introduction (Gale and King, 1988), which
represents a greater donor base than seen in the UK. The hard red spring
wheat „WW15‟, which contains Rht-B1b derived from „Norin 10‟ has been a
major source of semi-dwarfism in Australia giving rise to „Condor‟ and „Egret‟,
both released in 1973 (Gale and King, 1988). Rht-D1b was also present in
the founding CIMMYT material used in Australia, but in 1985 was represented
in only a minority of the varieties; however its prevalence is reported to be
increasing over time (Gale and King, 1988).
Two other studies to determine Rht-B1b and Rht-D1b prevalence were carried
out in Germany and China. In a survey of 94 German winter wheats, 6%
carried Rht-B1b, 38% carried Rht-D1b, and none carried Rht8 (Knopf et al.,
2008). The authors found that varieties with Rht-D1b were shorter and higher
yielding than varieties not carrying the allele, but were more susceptible to
FHB. In a study of Chinese wheats, Rht-B1b and Rht-D1d were present in
24.5% and 45.5% of the varieties, respectively (Zhang et al., 2006).
1.8. LINKAGE DISEQUILIBRIUM AND SELECTIVE SWEEPS IN PLANTS
The worldwide introgression of the semi-dwarfing alleles, Rht-B1b and Rht-
D1b, into most modern day wheat cultivars in less than 50 years represents
an intense genetic selection on a global scale. The intense selection pressure
over a short time frame likely means that extensive linkage disequilibrium (LD)
is associated with Rht-B1b and Rht-D1b. The region of reduced variation
associated with LD is often referred to as a “selective sweep” (Palaisa et al.,
2003). Selective sweeps are associated with genes under selection, including
crop domestication genes, and generally involve a loss in genetic diversity in
these regions (Wang et al., 1999; Palaisa et al., 2003; Doebley et al., 2006).
The size of the region in LD varies widely depending on factors such as
reproductive mode (outcrossing versus inbreeding), selection intensity, pre-
existing levels of genetic diversity, and chromosomal location of the gene.

30
Several studies that have looked at average levels of LD in species indicate
that self-pollinating or vegetatively propagated species tend to have a greater
selective sweep than outcrossing species. Nordberg et al. (2002) analyzed
163 genome-wide SNPs in 76 Arabidopsis (an inbreeding species)
accessions and found that average LD associated with the SNPs extended
approximately 250 kb. In contrast, LD decay is much more rapid in the
natural outcrosser maize with LD decaying within an estimated 1.5 kb when
six genes were examined in a diverse set of 102 maize inbred lines
(Remington et al., 2001). Genes under strong selection tend to have
extended LD. The selective sweep of the rice Waxy gene, selected for its
quality characteristics during domestication, was 250 kb and included six
other genes (Olsen et al., 2006). Palaisa et al. (2004) examined Y1, a
phytoene synthase gene that determines kernel colour in maize that was
under strong selection in the 1930‟s in the US. The region of LD around Y1
was large, especially considering the outcrossing nature of maize, extending
200 kb upstream and 700 kb downstream, and five linked genes in this region
showed a pattern of reduced diversity. Recombination rates vary across the
chromosome, thereby affecting LD across the genome (Flint-Garcia et al.,
2003). Maize, for instance, contains recombination hot spots within genes but
reduced levels of recombination in intergenic regions (Fu et al., 2002). Also,
in wheat it was found that gene density and recombination rate increased with
the relative distance from the centromere (Akhunov et al., 2003). In the case
of Rht-B1b, and Rht-D1b, these genes have only been selected recently and
with a high selection pressure suggesting that the region of LD surrounding
these loci is large, especially considering the inbreeding nature of wheat.
1.9. PHD OBJECTIVES
The Rht-B1b and Rht-D1b alleles were important contributors to the green
revolution in wheat and are the predominant height-reducing alleles used in
modern day bread wheat varieties. Although these genes have been
characterised and cloned, little is known regarding the genetic diversity of the
Rht-1 homeoloci or the genetic composition of the contiguous sequence that
was presumably introgressed along with the dwarfing alleles. At the Rht-A1

31
locus, map location and full-length sequence is not currently available and
genotypic and phenotypic variation at this locus has not been explored.
The first objective of this project is to determine the nucleotide sequences of
the three Rht-1 homoeologues along with that of the nearby genetic region in
a common genetic background. This will be accomplished by screening the
CS wheat BAC library to identify Rht-1-containing clones, which will be fully
sequenced and annotated. The genetic information will be useful in
identifying regions of high conservation, which will help identify key regulatory
sequences.
A second objective of the project is to determine the genetic location of the
Rht-A1 homoeologue by deletion bin mapping and genetic mapping.
Knowledge of the Rht-A1 genetic location and associated markers opens up
the possibility of exploring useful genetic variation in and around this locus.
A third objective is to explore the haplotype variation associated with the Rht-
1 homoeologues in ancestral wheat lines and in modern bread wheat varieties
from the UK and from a world-wide collection. This will be accomplished by
sequencing the ORF and flanking regions of all three Rht-1 homoeologues.
This information will be used to identify haplotypes and associated markers,
which represent a potential resource for understanding phenotypic
consequences of the genetic variation.
Lastly, this project will explore the origins of the „Norin 10‟ alleles by
determining the genotypes and phenotypes of „Norin 10‟ ancestors. This will
help identify the progenitor lines and should lead to a greater understanding of
the genetic history of these alleles and potential sources for novel variation in
and around the Rht-B1b and Rht-D1b alleles.
Determining variation at the Rht-1 loci and developing genetic markers
represents a key resource for identifying beneficial alleles at this locus and in
surrounding genes. This knowledge can aid in our understanding of DELLA
function and provides resources that be used to improve wheat.

32
2. IDENTIFICATION AND GENETIC ANALYSIS OF BAC CLONES
CONTAINING RHT-1
Results from this chapter were part of a publication in the journal Genome
(Febrer et al., 2009). Attached as a pdf and as a hard copy in thesis jacket)
2.1. INTRODUCTION
Due to their agronomic importance, Rht-B1 and Rht-D1 were among the first
loci to be mapped and cloned in wheat (Peng et al., 1999). However, over a
decade later, little is known regarding the immediate sequence surrounding
the Rht-1 loci and the presence of Rht-1 on the A genome has not been
established. Although wheat is the most important food crop worldwide after
rice and many cereal crop species have a fully assembled sequence (e.g.
rice, maize, sorghum), wheat still lacks an assembled sequence making
molecular studies difficult. The absence of assembled wheat sequence is
primarily due to the size and complexity of the genome. Bread wheat is an
allohexaploid that consists of three genomes (A, B, and D) that together
comprise >16 000 MB of sequence, 80% of which is repetitive (Gupta et al.,
2008). An effort is underway by the International Wheat Genome Sequencing
Consortium (IWGSC; http://www.wheatgenome.org) to provide high quality
reference sequence of Chinese Spring that is fully assembled into
chromosomes and annotated. As of March 2011, reference sequence from
the IWGSC is available for 25% of 3BS and 25% of 3BL. In addition, 5x
„shotgun‟ coverage of the CS genome is currently available from a separate
collaboration (http://www.cerealsdb.uk.net). However, other than selected
gene-rich regions this sequence is currently not assembled into contigs nor is
the sequence physically mapped or annotated.
To obtain wheat sequence for assembly of specific genes and genetic
regions, bacterial artificial chromosome (BAC) large-insert libraries have been
used (Shizuya et al, 1992). BACs have become the favoured method to clone
large genomic inserts (Xia et al., 2005) because of the high transformation
efficiency of Escherichia coli and the stability of inserts, coupled with the ease

33
of BAC DNA purification and its compatibility with sequence determination
protocols. Several BAC libraries useful to bread wheat studies have been
created including Aegilops tauschii (the D genome ancestor) (Moullet et al.,
1999; Xu et al., 2002, Akhunov et al., 2005), Triticum urartu (the A genome
ancestor) (Akhunov et al., 2005), Triticum monoccum (diploid; A genome)
(Lijavetzky et al., 1999), Aegilops speltoides (diploid; B genome) (Akhunov et
al., 2005), and Triticum turgidium (AB) (Cenci et al., 2003). For T. aestivum, a
bulked library was reported for genotype „Hartog‟ (Ma et al., 2000) and
gridded BAC libraries for genotypes „Renan‟ (Chalhoub et al., 2002), „Glenlea‟
(Nilmalgoda et al., 2003), „CS‟ (Allouis et al, 2003), and „Norstar‟ (Ratnayaka
et al., 2005).
A high redundancy of genome coverage in BAC libraries is important for
recovering a desired sequence, but high coverage along with the immense
size of the wheat genome results in large libraries that are laborious to
screen. Targeted BAC sequences can be identified by two methods:
radioactive hybridisation and, more recently, PCR screening (Klein et al.,
2000: Yim et al., 2007). Hybridisation relies on high-density filters that are
screened with radioactive probes, however probes may lack specificity and
the process can be cumbersome. PCR screening is relatively simple, fast,
and sensitive, but first relies on the pooling of BAC clones in three or more
dimensions. The 3-D pooling strategy was recently applied to a
Brachypodium distachyon BAC library to facilitate PCR screening (Farrar and
Donnison, 2007) and more recently to bread wheat (Febrer et al., 2009).
This chapter describes the identification and characterisation of BAC clones
containing Rht-1 from the CS wheat BAC library. The „French‟ and „UK‟
components of the library were screened using hybridisation and PCR,
respectively, to identify Rht-1-containing clones from the A, B, and D
genomes.
2.2. MATERIALS AND METHODS
2.2.1. The Triticum aestivum (cv Chinese Spring) BAC library
34
The CS bread wheat BAC library constructed by Allouis et al. (2003) as part of
a collaboration between the BBSRC (UK) and INRA (France) was used in this
study. The library coverage is 9.3 haploid genome equivalents and consists
of 1,200,000 clones (3125 384-well microtitre plates) with an average insert
size of 130 kb (ranging from 45 kb to 350 kb) (Allouis et al., 2003). After
construction of the library, it was subdivided into „French‟ and „UK‟
components. The French component contains approximately 3 haploid
equivalents of the hexaploid wheat genome and consists of 1332 384-well
plates. To facilitate screening, BAC clones were gridded onto high-density
colony filters in two dimensions as described by Allouis et al. (2003). A set of
the colony filters from the French component is held at the John Innes Centre
(JIC), Norwich, UK. The UK component is also held at the JIC Genome
Centre and contains 715,776 clones (1864 384-well microtitre plates) and
represents 5 haploid equivalents of the bread wheat genome. To facilitate
rapid PCR screening of the UK component, clones were recently pooled to
allow for a 3-D screening procedure (Febrer et al., 2009), although the pooled
library had not been tested prior to the current study.
2.2.2. Screening of the French component of the CS BAC library by
radioactive hybridisation
2.2.2.1. Screening strategy and probe construction
Filters containing the entire French component of the CS library held at the
JIC were screened using a 195 bp radiolabelled [32P] probe specific to Rht-1
(probe 1). Probe 1 is from the N-terminal region of Rht-1, which is specific to
this gene. Probe 1 was pooled with six additional probes from unrelated
projects and the probe pool was used to screen the BAC library. The probes
were pooled to reduce wear on the colony filters. BAC clones selected from
the initial screen comprised a BAC sub-library. The sub-library was screened
with probe 1 and also screened with a 202 bp (probe 2) and a 503 bp probe
(probe 3). Probes 2 and 3 are also part of the N-terminal region of Rht-1.
35
All three probes are PCR amplification products from the CS D genome.
Probe 1 (CS Rht-D1 bp 49 to 243) was amplified using primers Rht-16-F and
Rht-11-R and spans the highly conserved DELLA domain (Figure 2.1). Probe
2 (CS Rht-D1 bp 264 to 465) was amplified using primers Rht-ABD-F1 and
Rht-9-R and spans the highly conserved TVHYNP domain. The primer pair
Rht-22-F and Rht-9-R was used to amplify probe 3 (CS Rht-D1 bp -38
(upstream) to 465), which spans the DELLA and TVHYNP domains. Primer
sequences are shown in Appendix I.
Figure 2.1. Rht-D1a coding and upstream sequence in the CS background. Coding
sequence is from Genbank accession no. AJ242531 and upstream sequence is from N.
GRAS
N-terminus
-60 CAAAAGCTTC GCGCAATTAT TGGCCAGAGA TAGATAGAGA GGCGAGGTAG CTCGCGGATC
1 ATGAAGCGGG AGTACCAGGA CGCCGGAGGG AGCGGCGGCG GCGGTGGCGG CATGGGCTCG
61 TCCGAGGACA AGATGATGGT GTCGGCGGCG GCGGGGGAGG GGGAGGAGGT GGACGAGCTG
121 CTGGCGGCGC TCGGGTACAA GGTGCGCGCC TCCGACATGG CGGACGTGGC GCAGAAGCTG
181 GAGCAGCTCG AGATGGCCAT GGGGATGGGC GGCGTGGGCG CCGGCGCCGC CCCCGACGAC
241 AGCTTCGCCA CCCACCTCGC CACGGACACC GTGCACTACA ACCCCACCGA CCTGTCGTCT
301 TGGGTCGAGA GCATGCTGTC GGAGCTCAAC GCGCCGCCGC CGCCCCTCCC GCCCGCCCCG
361 CAGCTCAACG CCTCCACCTC CTCCACCGTC ACGGGCAGCG GCGGCTACTT CGATCTCCCG
421 CCCTCCGTCG ACTCCTCCAG CAGCATCTAC GCGCTGCGGC CGATCCCCTC CCCGGCCGGC
481 GCGACGGCGC CGGCCGACCT GTCCGCCGAC TCCGTGCGGG ATCCCAAGCG GATGCGCACT
541 GGCGGGAGCA GCACCTCGTC GTCATCCTCC TCCTCGTCGT CTCTCGGTGG GGGCGCCAGG
601 AGCTCTGTGG TGGAGGCTGC CCCGCCGGTC GCGGCCGCGG CCAACGCGAC GCCCGCGCTG
661 CCGGTCGTCG TGGTCGACAC GCAGGAGGCC GGGATTCGGC TGGTGCACGC GCTGCTGGCG
721 TGCGCGGAGG CCGTGCAGCA GGAGAACCTC TCCGCCGCGG AGGCGCTGGT GAAGCAGATA
781 CCCTTGCTGG CCGCGTCCCA GGGCGGCGCG ATGCGCAAGG TCGCCGCCTA CTTCGGCGAG
841 GCCCTCGCCC GCCGCGTCTT CCGCTTCCGC CCGCAGCCGG ACAGCTCCCT CCTCGACGCC
901 GCCTTCGCCG ACCTCCTCCA CGCGCACTTC TACGAGTCCT GCCCCTACCT CAAGTTCGCG
961 CACTTCACCG CCAACCAGGC CATCCTGGAG GCGTTCGCCG GCTGCCGCCG CGTGCACGTC
1021 GTCGACTTCG GCATCAAGCA GGGGATGCAG TGGCCCGCAC TTCTCCAGGC CCTCGCCCTC
1081 CGTCCCGGCG GCCCTCCCTC GTTCCGCCTC ACCGGCGTCG GCCCCCCGCA GCCGGACGAG
1141 ACCGACGCCC TGCAGCAGGT GGGCTGGAAG CTCGCCCAGT TCGCGCACAC CATCCGCGTC
1201 GACTTCCAGT ACCGCGGCCT CGTCGCCGCC ACGCTCGCGG ACCTGGAGCC GTTCATGCTG
1261 CAGCCGGAGG GCGAGGAGGA CCCGAACGAG GAGCCCGAGG TAATCGCCGT CAACTCAGTC
1321 TTCGAGATGC ACCGGCTGCT CGCGCAGCCC GGCGCCCTGG AGAAGGTCCT GGGCACCGTG
1381 CGCGCCGTGC GGCCCAGGAT CGTCACCGTG GTGGAGCAGG AGGCGAATCA CAACTCCGGC
1441 ACATTCCTGG ACCGCTTCAC CGAGTCTCTG CACTACTACT CCACCATGTT CGATTCCCTC
1501 GAGGGCGGCA GCTCCGGCGG CGGCCCATCC GAAGTCTCAT CGGGGGCTGC TGCTGCTCCT
1561 GCCGCCGCCG GCACGGACCA GGTCATGTCC GAGGTGTACC TCGGCCGGCA GATCTGCAAC
1621 GTGGTGGCCT GCGAGGGGGC GGAGCGCACA GAGCGCCACG AGACGCTGGG CCAGTGGCGG
1681 AACCGGCTGG GCAACGCCGG GTTCGAGACC GTCCACCTGG GCTCCAATGC CTACAAGCAG
1741 GCGAGCACGC TGCTGGCGCT CTTCGCCGGC GGCGACGGCT ACAAGGTGGA GGAGAAGGAA
1801 GGCTGCCTGA CGCTGGGGTG GCACACGCGC CCGCTGATCG CCACCTCGGC ATGGCGCCTG
1861 GCCGGGCCGT GA

36
Harberd, Oxford University, unpublished data. Location (in basepairs (bp)) relative to the start
of the Rht-D1a coding sequence is shown to the left of the first nucleotide in each row with
negative numbers indicating 5‟ sequence. The Rht-D1a start and end codons are underlined.
Sequence encoding the N-terminus and the GRAS functional protein domains are indicated.
Conserved domains of the N-terminus shown in bold are: DELLA (bp 112 to 198) and
TVHYNP (bp 268 to 339).
Probes were radiolabelled with the Rediprime II DNA labelling system (GE
Healthcare Life Sciences). Purified PCR-amplified DNA (20 ng in 45 µl sterile
distilled water) was denatured by heating to 95°C for 5 min. After cooling it
was added to the Rediprime reaction tube, which contains dATP, dGTP,
dTTP, Klenow enzyme and random primers. A 3 µl quantity of [32P] dCTP
was added to the tube and incubated at 37°C for 1 hr. The reaction was
stopped and DNA denatured by adding 2.5 µl of 4N NaOH.
2.2.2.2. Screening of BAC library filters using radioactive probes
Southern hybridisation was carried out essentially as described by Sambrook
et al., 1989). Colony filters were wetted in 2 × sodium chloride-sodium citrate
(SSC) buffer in a 20 cm2 plastic box after which they were equilibrated in
Church & Gilbert pre-hybridisation buffer (Church and Gilbert, 1984) for two
hours at 65°C with gentle shaking. Probe 1 was added and the hybridisation
carried out for 16 hr at 65°C, with gentle agitation. The filters were placed in a
clean box before immersion in Wash 1 (2 × SSC, 0.5% sodium dodecyl
sulfate (SDS)). Next, filters were washed twice in 1 l of Wash 2 (0.5 × SSC,
0.5% SDS) with gentle shaking at 65°C. If filters still had high radioactivity,
then Wash 2 was repeated. Wet filters were then wrapped in plastic wrap and
exposed on Phosphor Image screens overnight. Exposed screens were
visualised using a Typhoon phosphor imager (Amersham Biosciences).
BAC clones selected for repeated screening were grown overnight with
shaking in 96-well plates containing Luria broth (LB) media with
chloramphenicol (CAM) (12.5 µg/ml). A 5 µl quantity of culture was then
spotted onto Hybond-N+ membrane (Amersham Biosciences), which was
placed on LB agar and incubated overnight at 37°C. The membrane was

37
dried and DNA bound to the membrane by transferring the membrane (cell-
side up) sequentially onto blotting paper soaked in 10% SDS (3 min); 0.5N
NaOH, 1.5 mM NaCl (5 min), 0.5M Tris-Cl, 1.5M NaCl, pH 7.4 (5 min), and 2
× SSC (5 min). The membrane was air-dried for 30 min before washing in 0.5
× SSC, 0.1% SDS until no longer sticky (generally 4 to 5 washes). Replicate
membranes were prepared for each probe. Radioactive [32P] hybridisation
was carried out with individual probes as described above except Wash 1
solution was 0.5 × SSC, 0.1% SDS and Wash 2 solution was 0.2 × SSC,
0.1% SDS.
2.2.2.3. Extraction of plasmid DNA
Selected BAC clones were streaked onto LB agar plates containing CAM
(12.5 µg/ml) and incubated at 37°C for approximately 16 hr. Single colonies
were then used to inoculate 15 ml of LB containing 12.5 µg/ml CAM and
grown overnight at 37°C with shaking at 200 rpm. BAC plasmid DNA was
extracted from bacterial pellets of BAC clones using the alkaline-lysis method
(Sambrook et al., 1989) with buffers P1, P2, and P3 (QIAGEN Ltd) as follows.
Cell cultures were centrifuged (3000 rpm, 20 min, 4°C) and the pellet
resuspended in 200 µl P1 buffer. After adding 400 µl P2 buffer, samples were
mixed by inversion and incubated for 5 min at room temperature. Buffer P3
(300 µl) was added and samples mixed before centrifuging (13 000 rpm, 15
min). A 600 µl volume of cold absolute ethanol was added to the supernatant
and the DNA pelleted by centrifugation at 13 000 rpm for 10 min. After
washing the pellet in 70% ethanol, it was air-dried, and the DNA resuspended
in 50 µl 10mM Tris-HCl, pH 8.0.
2.2.2.4. Gel analysis of BAC clones
To determine if clones were unique and to estimate insert size and overlap
between clones, DNA from each of the likely Rht-1-containing BAC clones
was subjected to fingerprint analysis. BAC DNA (5 µl) was digested with 6 U
Hind III and 2 µg RNase (DNase-free, Promega) to release the insert. A 16 µl
volume of the digest was subjected to electrophoresis (100 V, 10 min then

38
75V, 27.5 hrs) on a 1% agarose gel at 4°C in 1 × TBE (Tris-Borate-EDTA)
buffer. The DNA was visualised with CyberGold (Molecular Probes). Insert
size was estimated by comparison with molecular weight markers
HyperLadder IV (Bioline) and kb ladder (BRL).
The sizes of the likely Rht-1-containing clones were also estimated using
Pulsed Field Gel Electrophoresis (PFGE). DNA (5 µl) was digested overnight
with 6 U NotI (New England Biolabs) in the presence of RNase before 20 µl
were loaded onto a 1% agarose gel. Samples were sealed into wells using
1% low melting point agarose and the gel immersed in 1 × TBE buffer.
Electrophoresis was conducted at 165 V / 400mA / 40W with buffer kept at
13°C by circulation to a cooling tank. Pulsing consisted of alternating currents
of North/South (5 s) and East/West (5 s) for 16 h followed by North/South (15
s) and East/West (15 s) for 1 min. DNA was stained with ethidium bromide
and visualised under UV light. Insert size was estimated by comparison with
molecular weight markers (Midrange II PFG, NEB Biolabs).
2.2.2.5. PCR amplification and sequencing of Rht-1
Selected BAC clones were screened using PCR amplification with primers
Rht-ABD-F1 and Rht-ABD-R1, which amplifies a 489 bp product from the N-
terminus of Rht-1 (bp 264 to 752 in reference to CS Rht-D1a, Figure 2.1).
Both primers completely matched the CS Rht-D1a sequence. Rht-ABD-F1
also completely matched the CS Rht-B1a sequence (N. Harberd, unpublished
data) while Rht-ABD-R1 contained one mismatch (G/T at bp 5) with CS Rht-
B1a. DNA of BAC clones was PCR-amplified using a 20 µl PCR mix
containing 1 × Green GoTaq Reaction Buffer (Promega), 3% glycerol, 0.2 mM
of each dNTP, 2 mM MgCl2, 1 µM Rht-ABD-F1, 1 µM Rht-ABD-R1, 0.25 µl
Taq polymerase, and approximately 100 ng BAC DNA. Glycerol was added
to facilitate amplification of the G-C rich Rht-1 sequence. The PCR profile
consisted of initial denaturation of 5 min at 95°C, followed by 30 cycles of
95°C for 30 s, 50°C for 30 s, and 72°C for 45 s. Amplification products were
separated on a 1.5% agarose gel in 1 × Tris-acetic acid-EDTA (TAE) buffer
and visualised under UV light with ethidium bromide.

39
To estimate the position of Rht-1 on BAC clones, sequence of a pre-existing
Rht-D1-containing BAC (BAC 1J9, J. Jia, CAAS, unpublished data) was
utilised to create five primer pairs (D-BAC_F1/R1; D-BAC_F2/R2; D-
BAC_F3/R3; D-BAC_F4/R4; D-BAC_F5/R5; Appendix I). Primer pairs were
created at wide intervals along the length of the 1J9 BAC sequence. PCR
reaction mixes and profiles were carried out as described above except
substituting these primer pairs in the reaction mix.
BAC DNA was amplified with the Rht-ABD-F1 / Rht-ABD-R1 primer pair as
described above and 1 µl used in a 10 µl BigDye (Applied Biosystems)
sequencing mix, which also contained 1 × BigDye Sequence Buffer, 1 µl
BigDye (ver. 3.1), and 1 µM Rht-ABD-F1 or 1 µM Rht-ABD-R1 primer. The
PCR profile consisted of 96°C for 1 min, followed by 25 cycles of 96°C for 10
s, 50°C for 5 s, and 60°C for 4 min. A forward and reverse read of each
amplified product was performed to minimise potential PCR-induced errors.
Sequencing was performed by the JIC Genome Sequencing Facility.
Sequences were aligned using ContigExpress software of VectorNTI.
2.2.3. Screening of the UK component of the CS BAC library by PCR
To facilitate screening of the library, 384-well plate pools (PPs) were formed
and organised in three dimensions (X, Y, Z) to form superpools (SPs) so that
each PP is represented in three different SPs (Febrer et al., 2009) (Figure
2.2). A total of four cubes (one 9 × 9 × 9, two 8 × 8 × 8, and one 4 × 4 × 4)
were created covering 1817 plates of the library and giving a total of 675 SPs.
SP DNA was screened with the PCR primer pair Rht-ABD-F1/ Rht-ABD-R1a,
which perfectly matched the sequences of Rht-B1a and Rht-D1a in the CS
background. The primer pair was designed to the N-terminal region of Rht-1
(bp 264 to 790 in reference to CS Rht-D1a, Figure 2.1). SPs were screened
using the reaction mix and conditions described in section 2.2.2.5 except Rht-
ABD-F1 and Rht-ABD-R1a were used as primers in a 10 µl volume mix with
an annealing temperature of 58°C.

40
Figure 2.2. Overview of the screening strategy to identify and characterise Rht-1-
containing BAC clones from the UK BAC library. (a) Representation of the 3-D pooling
strategy for PCR screening of the UK BAC library (adapted from Febrer et al., 2009). A virtual
4 × 4 × 4 cube is depicted, which is sufficient for assessing the contents of 64 384-well plates
in the library. Each plate was replicated and all 384 clones combined to form a plate pool
(PP). Each PP is pooled in each of three dimensions (X, Y, Z) so that for a 4 × 4 × 4 cube,
four PPs are present in each superpool (SP). For the 8 × 8 × 8 and 9 × 9 × 9 cubes, eight
and nine PPs are present in each SP, respectively. The red squares depict a plate that is
represented in SPs X, Y, and Z. (b) Summary of steps used to identify and characterise Rht-
1-containing BACs.
To monitor the reliability of the PCR amplifications the following negative
controls (NCs) and positive controls (PCs) were established in which BAC
DNA was replaced with the following templates: NC1, water; NC2, DNA of
BAC clones known not to contain Rht-1; PC1, DNA of BAC clones known to
contain Rht-1; PC2, genomic DNA isolated from leaves of CS; PC3, a 1:3072
(v/v) dilution of PC1:NC2. The purpose of PC3 was to determine if a single
BAC clone containing Rht-1 could be identified in a SP from an 8 × 8 × 8
cube. A DNA concentration of 90 ngs per reaction was used for NC2 and
PC3 and 20 ngs per reaction for PC1 and PC2.
B)A) 1. PCR screen superpooled (SP) DNA
- Use primer pair specific to Rht-1
- Score amplified products
- Determine candidate 384-well plates
2. Rescreen selected SPs
- Rescreen the 3 SPs corresponding to
candidate 384-well plates
- Select 384-well plates to screen
3. PCR screen 384-well plates
Regrow BAC colonies and PCR screen
with Rht-1 primer pair
Select individual colonies
4. Confirm presence of Rht-1a in
selected clones
Sequence PCR products obtained from
clones
5. Characterise selected clones
Align BAC sequences to determine Rht-1
homoeologue
Determine size and overlap of BACs using
fingerprint analysis

41
The SP DNA samples were scored for the presence and intensity (strong (++)
or weak (+)) of the approximately 525 bp amplification product. As DNA from
each PP is represented in each of three SPs, identification of candidate plates
likely to contain an Rht-1-containing clone was originally performed with a
tabulated reference as described in Farrar and Donnison (2007). Later, a
custom Perl script was written (Jon Wright, JIC) to facilitate 384-well plate
identification. Once the candidate plates were selected, the corresponding
SP DNAs were subjected to a second round of amplification to validate the
original PCR screen. Individual BAC colonies in the candidate 384-well plates
were screened by colony PCR using primers Rht-ABD-F1 and Rht-ABD-R1a
as described above except that 1 µl of cells was collected directly from the
plates to serve as template and initial denaturation time was 10 min.
For further characterisation, DNA was extracted from selected BAC clones
using the method in section 2.2.2.3. Extracted DNA was used for fingerprint
analysis (see section 2.2.2.4) except Hyperladder IV was used in place of
Hyperladder I as a molecular marker. BAC DNA was also used in PCR
reactions as specified above and sequenced as described in section 2.2.2.5
except that primers used in sequencing were Rht-ABD-F1 or Rht-ABD-R1a.
2.3. RESULTS
2.3.1. Identification and characterisation of Rht-1-containing BAC clones
from the French component of the CS library
High-density colony filters containing the French component of the „Chinese
Spring‟ BAC library were screened by hybridisation using the Rht-1-specific
probe 1 (described in section 2.2.2.1). A hybridisation signal was obtained for
267 clones (data not shown). The hybridisation contained six probes
unrelated to Rht-1 and therefore a BAC sub library, composed of the 267
clones was screened with Rht-1-specific probes 1 and 2 (Section 2.2.2.2).
Screening of the BAC sub library with probe 1 resulted in a total of 42 clones
that produced a positive signal, six of which were visually scored as strong

42
(++) and 36 as weak (+) (Table 2.1). The BAC sub library was then screened
with probe 2, which hybridised with 46 clones (9 scored as ++ and 37 as +),
15 of which had also hybridised with probe 1.
DNA from 26 randomly selected positive BAC clones was extracted and
digested with Hind III for fingerprinting. In addition, four randomly selected
clones from the BAC sub library that did not hybridise to probe 1 or 2 were
included as negative controls. In the fingerprint gel, none of the four negative
control BAC clones produced a hybridisation signal. Of the 26 candidate Rht-
1 containing BAC clones, 17 hybridised with probe 1, including eight that gave
a strong signal, but there was relatively little overlap of bands between the
DNA of the different BAC clones (Figure 2.2). In several of the BAC clones,
the probe also hybridised to more than one band. Hybridisation to multiple
bands also occurred using probe 3 (figure not shown).

43
Table 2.1. Rht-1 screening summary of the BAC sub library.
a Plate number_address of BAC clones that hybridised to a Rht-1 specific probe
b The presence and intensity of the hybridisation was scored visually: ++, strong; +, weak; -,
no hybridisation; NT, not tested. 26 clones that hybridised to probe 1 or probe 2 were
randomly selected for fingerprint analysis along with the 4 negative control clones (marked
with an *).
c The 48 clones that were either ++ for probe 1, ++ for probe 2, or + for both probes were
PCR-screened with a Rht-1 specific primer pair and visually scored for the presence of the
corresponding 490 bp band (+, present; -, absent; NT, not tested).
Clonea Probe 1 Probe 2 Fingerprint PCRc Clonea Probe 1 Probe 2 Fingerprint PCRc
0027_A23 + + NT - 0631_D08 + - NT NT
0035_J15 - + NT NT 0642_O12 - + + -
0043_F20 ++ - - - 0648_M12 - + NT NT
0153_M04 - ++ NT - 0651_A09 + - + -
0155_I24 ++ ++ ++ + 0651_J20 - + NT NT
0235_E17 + - - - 0661_F13 + - + -
0255_N19 ++ - + - 0661_P14 - + NT NT
0256_N08 - + NT - 0667_N04 - + NT NT
0273_G23 - + NT NT 0668_J16 + - NT -
0273_N11 * - - - - 0678_C21 - + NT -
0299_K18 + + NT - 0682_L19 + - - -
0308_F10 - + NT NT 0706_G15 - + NT -
0326_C07 + - - - 0706_H06 * - - - -
0330_K20 - ++ NT - 0731_N07 + + - -
0398_C20 + - ++ - 0735_I16 + + NT -
0402_E05 * - - - - 0833_B18 + - ++ -
0434_O09 - + NT NT 0852_O17 - + NT NT
0440_L09 - ++ NT - 0855_G01 ++ - ++ -
0445_E11 + + + - 0900_P10 - + NT NT
0445_I22 + + - - 0933_I04 ++ - + -
0449_C19 + - NT NT 0946_F05 - ++ NT -
0461_E17 + ++ NT - 0951_K01 + ++ NT -
0467_L13 - + NT NT 0959_D17 - + NT NT
0476_I01 ++ ++ NT + 0968_J11 - + NT NT
0477_J17 - + NT NT 0990_A10 - + NT NT
0477_K17 * - - - - 1023_E02 + - NT NT
0514_P03 - + - - 1028_C14 + + ++ -
0517_F21 - + NT NT 1083_O15 + + ++ -
0525_L01 + - + - 1153_H16 + - ++ -
0528_K10 + - + - 1202_I11 + - NT NT
0529_O05 + - - - 1221_H08 - + NT -
0537_P07 - ++ NT - 1223_O22 + + NT -
0563_P19 - + NT NT 1229_N11 + - NT -
0583_D03 + - NT NT 1233_N01 + - NT -
0583_F03 + + + - 1249_I15 - + NT NT
0609_F07 + + ++ - 1250_G16 + - NT NT
0616_M13 + - - - 1253_G17 - + NT NT
0625_L09 - + NT - 1253_P02 + - NT -
0628_H12 + - NT -
Hybridisation signalb Hybridisation signalb

44
Figure 2.3. Fingerprint gel analysis and hybridisation pattern of candidate Rht-1-
containing BAC clones and negative control clones. (a) DNA from clones was digested
with Hind III, separated by electrophoresis, and visualised by staining. Molecular weight
0155_I2
4
1083_O
15
0402_E
05*
0445_I2
2
0855_G
01
0642_O
12
0933_I0
4
1028_C
14
0255_N
19
0043_F
20
1153_H
16
0235_E
17
0326_C
07
0398_C
20
0445_E
11
0477_K
17*
0514_P
03
0525_L
01
0528_K
10
0529_O
05
0583_F
03
0609_F
07
0616_M
13
0651_A
09
0661_F
13
0682_L
19
0706_H
06*
0731_N
07
0833_B
18
0273_N
11*
M1
M2
(a)
06.108
04.072
05.090
03.054
02.036
01.635
01.018
07.12608.144
09.162
12.216
KbKb
00.516
1.000
00.900
00.800
00.700
00.600
00.500
0155_I2
4
1083_O
15
0402_E
05*
0445_I2
2
0855_G
01
0642_O
12
0933_I0
4
1028_C
14
0255_N
19
0043_F
20
1153_H
16
0235_E
17
0326_C
07
0398_C
20
0445_E
11
0477_K
17*
0514_P
03
0525_L
01
0528_K
10
0529_O
05
0583_F
03
0609_F
07
0616_M
13
0651_A
09
0661_F
13
0682_L
19
0706_H
06*
0731_N
07
0833_B
18
0273_N
11*
M1
M2
(b)

45
marker M1 and M2 were Kb ladder (BRL) and Hyperladder IV (Bioline), respectively. M1 and
M2 band sizes shown to the left and right of the gel, respectively. (b) DNA from (a) was
transferred to a nylon membrane by Southern blotting and hybridised with the Rht-1-specific
probe 1. Hybridisation signals were scored (absent, weak (+), or strong (++)) as shown in
Table 2.1 (Fingerprint hybridisation). Negative control clones are marked with an (*).
Because the fingerprinting and hybridisation analysis did not clearly identify
BAC clones that contained the Rht-1 gene, PCR was used for clarification.
The Rht-1 specific primer pair Rht-ABD-F1 / Rht-ABD-R1 was used to assay
the 30 BAC clones that had been fingerprinted. Only one BAC clone,
0155_I24, produced the approximately 490 bp product expected for Rht-1
(Table 2.1). The primer pair was then used to screen 18 additional BAC
clones from the BAC sub library. The total set of 48 included all 13 clones
that produced a strong hybridisation signal with probe 1 or with probe 2 and
the 11 clones that produced a signal (++ or +) with both probes. The
approximately 490 bp product was amplified in a second BAC clone,
0476_I01 (Table 2.1).
The two Rht-1-containing BAC clones identified in the library were further
characterised to determine the contributing genome, estimate the size of the
insert, and locate Rht-1 within the insert. To determine the contributing
genome, the sequence of the PCR products amplified from each BAC clone
using the Rht-ABD-F1 / Rht-ABD-R1 primer pair (bp 264 to 752 in reference
to CS Rht-D1a) were compared with the sequences of Rht-B1a and Rht-D1a.
The sequences of the amplified products were identical to that of Rht-D1a
(accession AJ242531) and had several mismatches with Rht-B1a, indicating
that both BAC clones were from the D genome (data not shown). The insert
sizes of the Rht-1 containing clones were estimated by PFGE and summed to
be at least 175 kb for 0155_I24 and 105 kb for 0476_I01 (Figure 2.4). The
location of Rht-D1a on the BAC clones was estimated using five PCR primer
pairs designed at intervals based on sequence from BAC clone 1J9 (Table
2.2). Based on the absence or production of amplification products, the 5‟
end of insert of BAC 0155_I24 was predicted to be between 80 kb and 135 kb
upstream of Rht-D1a and the 3‟ end was at least 8.5 kb downstream. The 5‟

46
end of the insert in BAC 0476_I01 was estimated to be between 40 kb and 80
kb upstream and the 3‟ end was at least 8.5 kb downstream. Based on these
data and the estimated length of the BAC inserts, Rht-D1a is likely to be near
the middle of each insert.
Figure 2.4. Sizing of the two Rht-1-containing BAC clones using pulsed field gel
electrophoresis (PFGE). BAC DNA was digested overnight with NotI, separated with PFGE,
and stained with ethidium bromide. BAC sizes were estimated by visual comparison with
molecular marker Midrange II PFG (NEB Biolabs) denoted as „M‟.
Table 2.2. Estimated locations of Rht-D1a on BAC clones 0155_I24 and 0476_I01.
a Approximate location of primer pairs is shown relative to the start nucleotide of Rht-D1a of
BAC 1J9. Negative numbers refer to sequence 5‟ or Rht-D1a.
b Presence of the expected PCR product is labelled as (√) and absence as (x) when using
DNA of the indicated BAC clones as template.
M 04
76
_I0
1
01
55
_I2
4
M
24
4873
97 121
145170
Kb
Pair
No.Name
Location relative
Rht-D1 (kb)a0155_I24 0476_I01
Rht_D-BAC_F1
Rht_D-BAC_R1
Rht_D-BAC_F2
Rht_D-BAC_R2
Rht_D-BAC_F3
Rht_D-BAC_R3
Rht_D-BAC_F4
Rht_D-BAC_R4
Rht_D-BAC_F5
Rht_D-BAC_R5x
√
√
√
x
x
√
PCR amplificationb
√
√
4
1
2
3
√
-10
8.5
Primers
5 -135
-80
-40

47
2.3.2. Identification and characterisation of Rht-1-containing BAC clones
from the UK component of the CS library
As only two Rht-1-containing clones were obtained by Southern hybridisation
screening, an alternative approach, based on PCR amplification of Rht-1, was
taken. Two primers, Rht-ABD-F1 and Rht-ABD-R1a, which both completely
match Rht-B1a and Rht-D1a in the Rht-1-specific N-terminal region, were
used to screen the library. Prior to screening the BAC library, the specificity of
the primer pair for Rht-1 was determined. The expected approximately 525
bp product was amplified from DNA extracted from leaf tissue of „CS‟ (PC2,
Figure 2.5). The primers were also shown to be capable of amplifying a
single BAC clone containing Rht-1 in a SP from an 8 × 8 × 8 cube as product
was amplified in PC3, which is a 1:3072 (v/v) dilution of BAC DNA containing
Rht-1:BAC DNA not containing Rht-1 (PC3, Figure 2.5). The primers did not
amplify a product from DNA of an Rht-1 negative clone (NC2, Figure 2.5).
The initial PCR screen identified 49 SPs in which a single band of
approximately 525 bp was amplified. A representative gel showing the
screening results from SPs 385 to 675 is shown in Figure 2.5. Of the 49 SPs
from which a PCR product was obtained, 26 were scored as strong
amplifications and 23 as weak amplifications (Table 2.3). The SP data was
de-convoluted to determine the corresponding 384-well plates that potentially
held an Rht-1-containing BAC clone. Corresponding 384-well plates were
selected for a second screening if two or three of the SPs resulted in a ~525
bp amplification product (weak or strong). A Perl script was used to identify
the thirty-five 384-well plates in which at least two of the three corresponding
SPs gave an amplification product (Table 2.4). To reduce the number of false
positives, all of the SPs (except five that were inadvertently missed)
associated with the 35 plates were re-screened with the same primer pair and
the presence and intensity of the ~525 bp band scored (Table 2.4).

48
Figure 2.5. PCR screening results of BAC superpools (SPs) 385 to 675 using Rht-1
specific primers. The SP number is indicated above any lanes in which the Rht-1 (~525 bp)
product was scored as present. Controls used to confirm the specificity of the PCR
amplification are listed above the respective lane: NC1, water used in place of BAC DNA;
NC2, DNA of BAC clones known not to contain Rht-1; PC1, DNA of BAC clones known to
contain Rht-1; PC2, genomic DNA of „Chinese Spring‟; PC3, a 1:3072 (v/v) dilution of
PC1:NC2 designed to mimic a SP that contained one Rht-1-containing clone. M, molecular
weight marker (Bioline, Hyperladder I)
600 bp
400 bp
525 bp
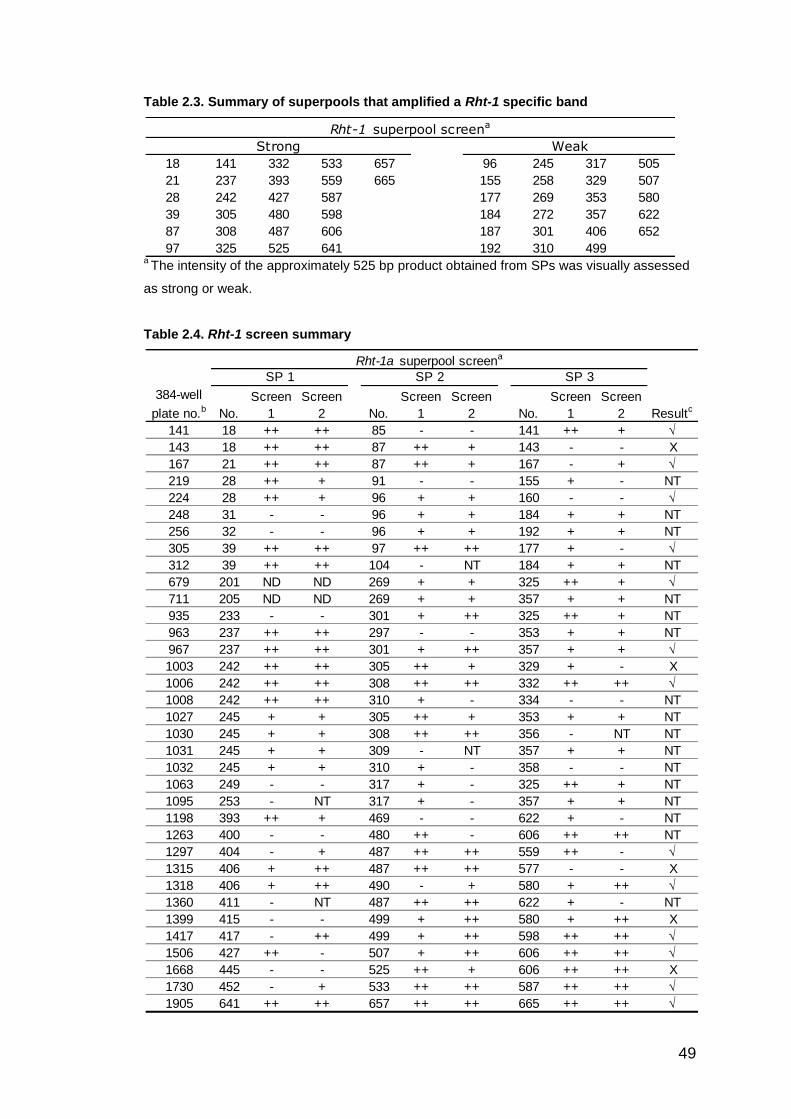
49
Table 2.3. Summary of superpools that amplified a Rht-1 specific band
a The intensity of the approximately 525 bp product obtained from SPs was visually assessed
as strong or weak.
Table 2.4. Rht-1 screen summary
18 141 332 533 657 96 245 317 505
21 237 393 559 665 155 258 329 507
28 242 427 587 177 269 353 580
39 305 480 598 184 272 357 622
87 308 487 606 187 301 406 652
97 325 525 641 192 310 499
WeakStrong
Rht-1 superpool screena
384-well
plate no.b No.
Screen
1
Screen
2 No.
Screen
1
Screen
2 No.
Screen
1
Screen
2 Resultc
141 18 ++ ++ 85 - - 141 ++ + √
143 18 ++ ++ 87 ++ + 143 - - X
167 21 ++ ++ 87 ++ + 167 - + √
219 28 ++ + 91 - - 155 + - NT
224 28 ++ + 96 + + 160 - - √
248 31 - - 96 + + 184 + + NT
256 32 - - 96 + + 192 + + NT
305 39 ++ ++ 97 ++ ++ 177 + - √
312 39 ++ ++ 104 - NT 184 + + NT
679 201 ND ND 269 + + 325 ++ + √
711 205 ND ND 269 + + 357 + + NT
935 233 - - 301 + ++ 325 ++ + NT
963 237 ++ ++ 297 - - 353 + + NT
967 237 ++ ++ 301 + ++ 357 + + √
1003 242 ++ ++ 305 ++ + 329 + - X
1006 242 ++ ++ 308 ++ ++ 332 ++ ++ √
1008 242 ++ ++ 310 + - 334 - - NT
1027 245 + + 305 ++ + 353 + + NT
1030 245 + + 308 ++ ++ 356 - NT NT
1031 245 + + 309 - NT 357 + + NT
1032 245 + + 310 + - 358 - - NT
1063 249 - - 317 + - 325 ++ + NT
1095 253 - NT 317 + - 357 + + NT
1198 393 ++ + 469 - - 622 + - NT
1263 400 - - 480 ++ - 606 ++ ++ NT
1297 404 - + 487 ++ ++ 559 ++ - √
1315 406 + ++ 487 ++ ++ 577 - - X
1318 406 + ++ 490 - + 580 + ++ √
1360 411 - NT 487 ++ ++ 622 + - NT
1399 415 - - 499 + ++ 580 + ++ X
1417 417 - ++ 499 + ++ 598 ++ ++ √
1506 427 ++ - 507 + ++ 606 ++ ++ √
1668 445 - - 525 ++ + 606 ++ ++ X
1730 452 - + 533 ++ ++ 587 ++ ++ √
1905 641 ++ ++ 657 ++ ++ 665 ++ ++ √
SP 1 SP 2 SP 3
Rht-1a superpool screena

50
a The presence and intensity of the approximately 525 bp product obtained from SPs was
scored visually: ++, strong band; +, weak band; -, no band; ND, no DNA available; NT, not
tested.
b 384-well plates were selected for further screening in which at least two of the three SPs
scored + or ++ in the initial screen (screen 1) or re-screen (screen 2).
c The 384-well plates are marked as “positive” (√) if one or more clones amplified a Rht-1-
specific PCR product. Plates in which no clones gave a product are designated (X) and
plates that were not tested are marked NT.
To reduce the number of 384-well plates to be screened, „best candidate‟
plates were chosen based on the following precepts: (1) At least two SPs
were amplified in the original and repeat screens - with preference for those
with strong amplifications, and (2) in cases where positive SPs were
represented in more than one plate, the plate(s) most likely to have accounted
for the positive SP result (based on amplification presence and intensity of the
other two SPs) were chosen. The intention of the second precept was to
eliminate plates most likely to have two positive SP results by chance. A total
of 18 „best candidate‟ plates for containing an Rht-1 BAC clone were selected.
PCR-screening of the BAC colonies from the 18 „best candidate‟ 384-well
plates revealed that 13 BAC clones contained the Rht-1 gene (Table 2.4).
Figure 2.6 illustrates the identification of BAC clone 305_B11 (plate 305,
address B11) as containing Rht-1. Sequence analysis of the amplified
products of the 13 selected clones showed that seven were identical to Rht-
D1a and four were identical to Rht-B1a (Figure 2.7). The remaining two
sequences showed high homology to both Rht-1 homoeologues, but
contained several polymorphisms and were most likely the Rht-A1a
homoeologue.

51
Figure 2.6. Colony PCR screening results of 384-well plate number 305 using Rht-1
specific primers. The contents of each PCR were loaded into separate wells of an agarose
gel and products identified by staining with ethidium bromide. A single clone (plate address
B11) amplified the approximately 525 bp product specific to Rht-1. M, molecular weight
marker (Bioline hyperladder I) with size in bp shown to the left.
MB11
600 bp 400 bp

52
Figure 2.7. Nucleotide sequence alignment of the region amplified by the Rht-1 specific
primers in the 13 BAC clones. Homoeologue designation was determined from sequence
of Rht-D1a (GenBank accession No. AJ242531) and Rht-B1a (N. Harberd, Oxford University,
unpublished data). The designation of Rht-A1a is inferred. Primer sequences are shown in
red font and polymorphisms are highlighted in yellow. Coordinates at the beginning and end
of the sequence are relative to the start nucleotide of CS Rht-D1a.
The BAC clones were subjected to fingerprint analysis to determine the
uniqueness of clones and which overlapping bands were shared by clones,
and to estimate the size of the insert. Fingerprint analysis of DNA from the 13
BACs following Hind III digestion showed that although there was some
overlap in the bands, the BACs were distinctive from each other (Figure 2.8).
Estimates of the relative sizes of the BACs based on comparison of the
fingerprint bands with the molecular marker ranged from 70 kb to 200 kb.

53
Figure 2.8. Fingerprint analysis of DNA extracted from BAC clones from which Rht-1
sequence was obtained. DNA from clones was digested with HindIII and the gel stained with
CyberGold. Molecular weight markers (M1 and M2) were Kb ladder (BRL) and Hyperladder I
(Bioline), respectively. The genome derivation (A, B, or D) of the clones is also shown above
their designations.
2.3.3. Summary of Rht-1-containing BAC clones identified in the French
and UK components of the CS library
In total, 15 clones containing Rht-1 were identified in the CS library with each
of the three wheat genomes represented by at least two clones (Table 2.5).
15
09
-A1
5

54
Three clones were selected for full-length sequencing based on estimations of
clone length and, where possible, Rht-1 location within the insert.
Table 2.5. Rht-1-containing clones identified in the Chinese Spring (‘CS’) BAC library
a Clones are named according to their position in the 384-well plate.
b BAC clones were identified in either the UK or French component of the CS library.
c BAC clones selected for full-length sequencing are marked with a (√)
2.4. DISCUSSION
A total of 13 clones were identified in the UK component before screening of
the 384-well plates was discontinued. Based on the estimated 5 × haploid
coverage of the UK component of the library (Febrer et al., 2009), 15 Rht-1
clones would be predicted to be represented therein. Additional screening of
the 384-well plates identified as candidates for containing Rht-1 based on SP
screening results (Table 2.4) is likely to uncover additional Rht-1 containing
clones. For example, plate 1027, has three corresponding SPs that score +
or ++ that are not matched with an Rht-1 containing clone. Our identification
of 13 BAC clones containing Rht-1 and the existence of additional 384-well
plate candidates indicate that rigorous use of our screening procedure would
identify all or most of the Rht-1 clones in the UK library.
The French component of the CS BAC library consists of 3 haploid
equivalents, yet only two Rht-1 containing clones were identified compared
Clonea Libraryb Genome Sequencingc
0224_M10 'CS' (UK) A √
0167_D3 'CS' (UK) A
1318_C20 'CS' (UK) B
1417_F16 'CS' (UK) B √
1730_H1 'CS' (UK) B
0305_B11 'CS' (UK) B
0679_I12 'CS' (UK) D
1509_A15 'CS' (UK) D
0141_L6 'CS' (UK) D
0967_I6 'CS' (UK) D
1006_M22 'CS' (UK) D
1297_A8 'CS' (UK) D
1506_M17 'CS' (UK) D
0155_I24 'CS' (French) D √
0476_I01 'CS' (French) D

55
with the expected nine clones. Thus, it is likely that the Southern hybridisation
screening method did not clearly identify all of the Rht-1-containing clones.
The use of seven probes in the first screening could have decreased the
efficiency of detection, especially if the hybridisation conditions were less
favourable for the Rht-1-derived probe. Additionally, the Rht-1 derived probes
were not specific for Rht-1 sequences even under the hybridisation conditions
used for screening of the sub-library. This was made clear when Rht-1
specific primers known to be suitable for amplification of all three Rht-1
homoeologues identified only the two Rht-1 containing clones out of 48
candidates identified by probes 1 and/or 2 (Table 2.1). Non-specific
hybridisation was also evident when Hind III digested DNA of clones from the
BAC sub-library were hybridised with probe 1 (Figure 2.3) or probe 3. In
these cases, several BAC clones have multiple bands that hybridise to the
probe even though there is no Hind III site within any of the Rht-1
homoeologues and only a single band should be present. The apparent non-
specificity of the hybridisation may be related to the high GC content (> 70%)
of each the three probes used.
Both BAC clones identified by hybridisation were derived from the D genome
and seven of the 13 clones identified by PCR screening were also derived
from this genome. Since this bias was seen using two screening methods this
may be a true representation of the composition of Rht-1-containing clones in
the library. However, additional clones may also have been present in the two
parts of the library, and especially in the French component, making it difficult
to accurately define the relative proportions of the three homoeologues in this
library.
This study shows that PCR-based screening was more efficient in discovering
Rht-1-containing clones than Southern hybridisation but it depends upon the
availability of appropriate primers, which ideally should be capable of
amplifying all three homoeologues of the target gene. Screening using PCR
also has the advantage that it does not require the use of radioactivity.
However, although the PCR screening technique was rapid, this is only true if
the SPs are already available.

56
3. GENETIC COMPOSITION AND COMPARATIVE ANALYSIS OF THE
RHT-1 LOCI AND ADJOINING SEQUENCE
3.1. INTRODUCTION
The Rht-1 semi-dwarf alleles, Rht-B1b and Rht-D1b, were introduced into
wheat varieties in the Western world as part of the green revolution beginning
in the 1960s. These alleles were rapidly incorporated into wheat varieties
worldwide and within 40 years, an estimated 70% of planted wheat acreage
thought to contain Rht-B1b or Rht-D1b (Evans, 1998). While these two alleles
along with the wild type alleles Rht-B1a and Rht-D1a in the CS background
have been cloned and sequenced (Peng et al., 1999), little is known regarding
the composition of the adjoining genetic region at these loci. The genetic
regions tightly linked to Rht-B1b and Rht-D1b presumably were integrated into
most wheat varieties. On the third homoeolocus, Rht-A1, the sequence of the
open reading frame (ORF) and adjoining region remain unknown.
Understanding the genetic composition of the Rht-1 homoeoloci and the
surrounding region is critical because alleles at these loci are associated with
changes in the level of resistance to biotic and abiotic stress. Rht-B1b and
Rht-D1b have both been associated with changes in the level of resistance to
Fusarium Head Blight (FHB), a major disease in wheat. A quantitative trait
locus (QTL) containing Rht-D1b was associated with increased susceptibility
to initial infection (Type I resistance) of FHB (Srinivasachary et al., 2008;
Srinivasachary et al., 2009). Increased susceptibility to FHB associated with
Rht-D1b was also reported by Hilton et al. (1999) and Draeger et al. (2007).
The association of Rht-D1b with increased FHB susceptibility is thought to
result from a linked gene (Paul Nicholson, Project Leader, Disease and Stress
Biology, JIC, personal communication). Similarly, a QTL encompassing Rht-
B1b was associated with increased Type I susceptibility to FHB and,
conversely, increased Type II resistance (resistance to fungal growth within
the spike) to FHB was also associated with a QTL that contained Rht-B1b
(Srinivasachary et al., 2009). In Arabidopsis thaliana, the GA insensitive gai
mutant in Arabidopsis and the GA deficient mutant ga1-3 were both found to

57
be more tolerant of salinity than plants carrying the wild type alleles (Achard et
al., 2006). When Arabidopsis is exposed to cold stress, increased DELLA
protein accumulation is also associated with greater tolerance (Achard et al.,
2008a). In relation to biotic stress in Arabidopsis, stabilised DELLA proteins
have been shown to promote increased resistance to necrotrophs and
increased susceptibility to biotrophs (Navarro et al., 2008). A similar finding
was also reported in wheat where the stabilised DELLA proteins encoded by
Rht-B1b and Rht-D1b were more resistant to necrotrophs and more
susceptible to biotrophs than plants with wild type DELLA proteins (R. Saville,
2011). Functionally, the DELLA proteins are thought to integrate hormonal
and environmental signals and play a key role in plant growth and survival
(Alvey and Boulton, 2008), hence knowledge of the Rht-1 loci and the
surrounding region is important.
It is well established that gene synteny of the three wheat genomes is well
conserved and that this colinearity extends to other members of the grass
(Poaceae) family (Moore et al., 1995; Gale and Devos, 1998; Kumar et al.,
2009), while transposable elements (TEs) are generally not conserved among
Poaceae species (Devos et al., 2008). Fully assembled and annotated
sequences of the Poaceae family currently include rice (Oryza sativa),
Brachypodium distachyon, maize (Zea mays), and sorghum (Sorghum
bicolor). For barley (Hordeum vulgare), one of wheat‟s closest relatives,
assembled sequence is not yet available; however a large collection of barley
expressed sequence tags (ESTs) exists. These genomic resources enable
comparative analysis between genomes, which facilitates identification of
important functional and regulatory sequences associated with genes and
aids in determining the genetic relatedness of species. The majority
(approximately 80%) of the wheat sequence, however, is made up of TEs
(Gupta et al., 2008), which are rapidly evolving relative to genes (Devos et al.,
2008). TEs can play an important role in plant genomes by reshaping overall
genome structure and by altering gene function and regulation (Bennetzen
2000).

58
The aim of this chapter is to determine the genetic composition of the Rht-1
ORF and flanking regions of the wheat homoeologues within a common
genetic background. To accomplish this, three Rht-1-containing BAC clones
(one from each homoeologue) identified in the CS BAC library (Chapter 2)
were sequenced, assembled, and annotated. Comparative analysis of the
genic and TE composition among the three BAC sequences is performed. In
addition, the CS wheat BAC sequences are compared to Rht-1 containing
BAC sequences derived from T. urartu (the A genome ancestor of wheat) and
from the D genome of „Aibai/10*CS‟. The level of sequence conservation and
phylogenetic relationships of the genes found on the CS wheat BACs are
determined in relation to orthologues in rice, Brachypodium, maize, sorghum,
and barley.
3.2. MATERIALS AND METHODS
3.2.1. Sequencing of Rht-1-containing BAC clones
Rht-1a containing clones 0224_M10 (A genome), 1417_F16 (B genome), and
0155_I24 (D genome) identified in the CS BAC library (Chapter 3) were
sequenced to 8 × coverage by shotgun sequencing at the Genome Center,
Washington University, St. Louis, USA (Appendix II). The CS-A, CS-B, and
CS-D genome BACs were assembled into 3, 3, and 4 contigs, respectively,
with estimated gaps between contigs of no more than 500 bp (personal
communication, William Courtney, Washington University Genome Center).
The Rht-1-containing BAC sequences derived from Triticum urartu and from
the D genome of „Aibai/10*CS‟ (BAC 1J9; Wu et al., 2004) were provided by
Jizeng Jia (Chinese Academy of Agricultural Sciences, P.R. China).
3.2.2. Annotation of Rht-1 containing wheat BAC sequences
Location and identity of repeat elements was determined by blastn and tblastx
searches of the TREP cereal repeat database
(http://wheat.pw.usda.gov/ITMI/Repeats). Retrotransposon LTRs (long
terminal repeats) and TSDs (target site duplications) were identified using the

59
default settings of LTR Finder (http://tlife.fudan.edu.cn/ltr_finder; Zhao and
Wang, 2007). Gene predictions were made across entire BAC inserts using
Softberry FgeneSH software (http://linux1.softberry.com/berry.phtml).
Nucleotide sequences of predicted genes were queried against the TREP
cereals repeated database, the NCBI nucleotide collection (nr/nt)
(http://blast.ncbi.nlm.nih.gov/Blast.cgi), the TIGR plant transcript assemblies
(TAs) monocot collection (http://plantta.jcvi.org), and the KOME rice cDNA
collection (http://cdna01.dna.affrc.go.jp/cDNA) to identify regions of homology.
Predicted genes were considered true „genes‟ if a known orthologue was
identified, not considered a gene if sequence overlapped a repeat element, or
remained „predicted genes‟ if no significant similarity was found in the
database searches. Intron-exon boundaries of genes were determined by
alignment with TIGR wheat and barley TAs, and annotated orthologues in
rice, Brachypodium, sorghum, and maize (B73 inbred) where sequence was
available. The remaining BAC sequence that did not correspond to a TE,
gene, or predicted gene was blast searched against the NCBI database
nucleotide collection (nr/nt) to determine if any similarity existed. Annotation
of BAC sequences was facilitated with Invitrogen Vector NTI v10.1.1 software.
3.2.3. Comparative analysis of BAC sequences
Poaceae orthologues of genes identified on the wheat BAC clones were
identified by querying the wheat ORF sequences in BLAST searches of the
fully assembled genomes of rice (http://rice.plantbiology.msu.edu),
Brachypodium (http://www.modelcrop.org), sorghum
(http://www.phytozome.net/sorghum), and maize B73 inbred
(http://www.maizegdb.org). To identify orthologues in the barley genome,
wheat gene ORFs were used in a BLAST search of the NCBI nucleotide
(nr/nt) collection, the NCBI Hordeum vulgare EST collections, and the TIGR
Hordeum vulgare TA collection. For the Rht-1 orthologue in barley, the SLN1
full-length coding sequence was utilised (GenBank accession no. AF460219;
Chandler et al., 2002). To construct the barley zinc finger (ZnF) and DUF6
orthologous sequences, matching ESTs and TAs were identified and aligned
with the ORFs of the wheat, rice, Brachypodium, sorghum, and maize

60
orthologues. The barley ZnF orthologue ORF sequence was assembled by
combining TA38367_4513 (bp 34-640), TA38365_4513 (bp 487-504), and
TA38366_4513 (bp 11-807), which together cover the entire length of the
wheat ORF. The barley DUF6 orthologue was assembled using EST
GH226632 (bp 71-428) (Close et al., 2008) and TA54310_4513 (1-785).
Alignment with the Poaceae consensus DUF6 revealed that the barley TA and
EST sequences did not cover an estimated 165 bp region in the middle of the
gene presumably due to the unavailability of barley sequence. To maximise
alignment with the Poaceae consensus DUF6 sequence, the code „N‟ (IUPAC
[International Union of Pure and Applied Chemistry;
http://www.chem.qmul.ac.uk/iupac/] convention for „unknown nucleotide‟), is
used to designate each of the estimated 165 missing nucleotides. In the
translated barley DUF6 amino acid sequence, the code „X‟ (IUPAC convention
for „any amino acid‟) is used whenever a codon contained an „N‟ nucleotide
designation.
Nucleotide and amino acid identities were calculated with the AlignX
application of VectorNTI (v10.1.1) following alignment of sequence pairs.
Alignments of multiple orthologues were made using ClustalX v2.0.12 (Larkin
et al., 2007) and manually adjusted where necessary to improve alignments
using GeneDoc v2.6.002 software (Nicholas and Nicholas, 1997). Locations
of protein motifs in the Rht-1 genes were based on Tian et al. (2004).
Locations of protein motifs on the DUF6 and ZnF amino acid sequences were
determined using the European Bioinformatics Institute (EBI) InterPro scan
(http://www.ebi.ac.uk/Tools/InterProScan/) with amino acid sequences serving
as query. Phylogenetic relationships among orthologous genes was
determined using the following applications of PHYLIP v3.6 software
(Felsenstein, 2004): „Seqboot‟ was used to calculated bootstrap values (1000
replicates); genetic distance between species was calculated using „Dnadist‟
(1000 multiple data set values); „Neighbor‟, which employs the neighbor-
joining method, was used to construct trees; „Consense‟ was used to
determine the consensus tree.

61
Alignment of the 10 kb of sequence 5‟ and 3‟ of Rht-1 was performed using an
on-line version of ACT: the Artemis Comparison Tool (Carver et al., 2005).
Comparison files were created using Double ACT v2 (http://www.hpa-
bioinfotools.org.uk/pise/double_act.html). Identification of homologous
regions among wheat BACs, rice, and Brachypodium was performed with the
NCBI multiple sequence alignment tool.
3.3. RESULTS
3.3.1. Genetic composition and comparative analysis of the Rht-1
containing wheat BACs
Sequence analysis revealed that the inserts in the three „CS‟ BAC clones
ranged from 164 kb to 213 kb in length with Rht-1 located near the middle of
each clone (Table 3.1; Appendix III). The T. urartu BAC clone contains a 100
kb insert in which Rht-1 is positioned near the middle. The D genome-derived
BAC from „Aibai/10*CS‟ contains a 207 kb insert in which Rht-1 is located
near the 3‟ end. Transposable elements (TEs) constitute 47% to 66% of each
BAC insert while gene content accounts for 1.7% to 4.6% of any BAC
sequence. Between 32% and 48% of each BAC sequence did not have
homology to annotated genes or to TEs.
Table 3.1. Summary of Rht-1-containing wheat BAC sequences.
a Ta 'CS' (A), Ta 'CS' (B), and Ta 'CS' (D) are the Triticum aestivum BAC sequences from the
A, B, and D genomes, respectively, of Chinese Spring. T.urartu (A genome) and Ta
'Aibai/10*CS' (D genome) sequences were received from Jizeng Jia, CAAS.
b NA = not available.
c Location of the most 5' nucleotide of the Zinc finger family (ZnF), Domain of Unknown
function family (DUF6), and Reduced height (Rht-1) genes relative to the first nucleotide of
Insert compostiond
Genetic
backgrounda Addressb
Length
(bp) ZnF DUF6 Rht-1 TE ORF Other
Ta 'CS' (A) 0224-M10 164257 24659 48779 79748 56% 2.8% 41%
Ta 'CS' (B) 1417-F16 187310 NA 53952 77662 63% 1.7% 35%
Ta 'CS' (D) 0155-I24 213794 6381 40731 96445 66% 2.2% 32%
T. urartu (A) NA 100141 19834 42927 59411 47% 4.6% 48%
Ta „Aibai/10*CS‟ (D) 1J9 207533 108486 142474 198722 59% 2.2% 39%
Gene coordinatesc

62
the insert (coordinate 1). DUF6 and Rht-1 are on the plus stand of each BAC and
coordinates match the start nucleotide. ZnF is not present of the B genome BAC and is on
the minus strand of the remaining BACs with coordinates matching the end nucleotide.
d TE = transposable element; ORF = open reading frame of genes. Other = sequence without
homology to TEs or known genes.
Along with Rht-1, each „CS‟ BAC sequence also contained one to two
additional genes, which were in synteny among BAC clones (Table 3.1). CS-
A and CS-D contain the same three genes in conserved order and orientation,
which from 5‟ to 3‟ are: a zinc finger family protein (TIGR rice locus
Loc_Os03g49900; herein referred to as ZnF), a domain of unknown function
family protein (TIGR rice locus Loc_Os03g49940; herein referred to as
DUF6), and Rht-1 (TIGR rice locus Loc_Os03g49990). In this text, references
to the A, B, and D genome homoeologues of the three genes will be indicated
by attaching the suffixes -A1, -B1, and -D1, respectively, to the end of the
gene names. The ZnF gene is named for a C3HC4 type zinc-finger (RING
finger) domain, which is a cysteine-rich domain of 40 to 60 residues that
coordinates two zinc ions
(http://www.ebi.ac.uk/interpro/IEntry?ac=IPR018957). The DUF6 family, also
known as the EamA-like transporter family are predicted integral membrane
proteins that are part of the drug/metabolite transporter super-family, but have
no known function (http://www.ebi.ac.uk/interpro/IEntry?ac=IPR000620).
Each DUF6 gene contains two regions that encode for the DUF6-type
domains. The CS-B BAC contains DUF6 and Rht-1, but sufficient sequence
is not available to determine if ZnF is present even though approximately 54
kb of sequence exists upstream of DUF6. In addition to these three genes, a
predicted gene also exists 3‟ of Rht-A1 on the CS-A BAC and is described in
section 3.3.3. Although gene synteny is conserved among the CS BAC
clones, the physical distance encompassing the three genes varies widely
from 42 kb in CS-A to 92 kb in CS-D.
Comparison of the three CS BACs containing Rht-1 revealed that although
gene synteny is highly conserved, there is no apparent conservation of repeat
elements or nesting structure in the intergenic regions (Figure 3.1b, c, d). The

63
region between the ZnF and DUF6 genes contains a single LTR
retrotransposon on CS-A (Figure 3.1b), whereas five LTR retrotransposons
and a DNA transposon were identified on CS-D (Figure 3.1d). In this region
of the CS-B BAC (upstream of DUF6; Figure 3.1c), there are three insertions
of the WHAM LTR retrotransposon (TREP no. 3269) comprising 23 kb of
sequence that is distinct from the equivalent regions on the A and D
genomes. Analysis of the region between the DUF6 and Rht-1 genes shows
no conservation of TE sequence among the CS homoeologues. In this
region, CS-D contains sequence of five TEs, including a 9.6 kb Romani LTR
retrotransposon and an 8.6 kb WIS LTR retrotransposon while CS-A contains
only three TE sequences and CS-B contains just two short TE sequences. 3‟
of Rht-1, each of the CS BAC sequences contain large numbers of
transposons, with no similarity among BACs. Similar to the other regions, the
region upstream of ZnF (only available on the A and D genomes) has no
conservation of TE sequence.
Fati
ma
31
98
WIS
31
60
Sab
rin
a 3
23
9
Bar
bar
a 3
45
6
Gu
jog
32
76
WIS
31
60
WIS
31
60
Car
mill
a3
16
9B
ian
ca 2
37
6
Sab
rin
a 3
25
0
ZnF-A1 DUF6-A1 Rht-A1
10 kb
An
gela
35
30
An
gela
35
30
BAC T.urartu-A
(a)

64
Fati
ma
31
98
WIS
31
60
Sab
rin
a 3
23
9
Bar
bar
a 3
45
6
Gu
jog
32
76
Oliv
ia3
15
4
Un
kno
wn
24
0
An
gela
35
30
Clif
ford
34
14
WIS
31
60
Car
mill
a3
16
9
Bia
nca
23
76
WIS
31
61
WIS
31
61
An
gela
32
59
Sab
rin
a 3
25
1
An
gela
35
29
Jeil
34
58
Sab
rin
a 3
24
5
ZnF-A1 DUF6-A1 Rht-A1
10 kbBAC 0224-M10_CS-A
(b)
predicted gene
WH
AM
32
69
Sab
rin
a 3
23
9A
nge
la 3
53
0
De
ram
i31
73
DUF6-B1 Rht-B110 kb
BA
GY2
31
62
Inga
15
27
Fati
ma
31
89
hA
T1
16
9
EGU
G 3
17
4
CA
CTA
12
41
Gu
jog
32
76
WH
AM
32
69
WH
AM
32
69
Fati
ma
31
89
An
gela
35
29
Fati
ma
31
98
Fati
ma
31
98
Ifis
32
02
Jorg
e 3
02
6
TAR
2 2
09
2
Saku
ra 3
25
4
WIS
31
61
Ifis
14
18
Car
mill
a3
16
9Sa
kura
32
54
An
gela
35
29
Wilm
a 1
43
8
BAC_1417-F16_CS-B
(c)H
arb
inge
r 3
44
5

65
Figure 3.1. Gene and transposable element (TE) nesting structure of the five Rht-1
wheat BAC sequences. (A) T. urartu, A genome BAC; (B) Chinese Spring (CS) A genome
BAC 0224-M10; (C) CS B genome BAC 1417-F16; (D) CS D genome BAC 0155-I24, (E) BAC
1J9, a D genome-derived BAC from Aibai/10*CS, and. In each figure, the thick black line
denotes intergenic sequence that does not correspond to TEs or genes. On this line, orange
arrows indicate genes and blue arrows indicated predicted genes. TEs are shown in boxes
and identified by common name and Triticeae Repeat (TREP) number. The lengths of the
BACs, genes, repeat elements, and the position of the insertions, are approximately to scale.
An
gela
35
30
Re
mu
s3
06
7
Bar
bar
a 3
45
6
CA
CTA
13
18
ZnF-D1 DUF6-D1 Rht-D110 kb
Isab
elle
23
8
Erik
a 3
17
8
Saku
ra 3
25
4
Sab
rin
a 3
24
6
An
gela
35
30
WH
AM
32
69
LIN
E 3
32
2
LIN
E 3
45
4C
AC
TA 1
24
1
WIS
31
60
Ro
man
i 32
23
BAC 0155-I24_CS-D
(d)
Saku
ra 3
25
4
De
ram
i31
73
An
gela
35
30
CA
CTA
30
26
Sab
rin
a 3
24
5
CA
CTA
76
6
Car
mill
a3
16
9
Mu
tato
r2
32
Saku
ra 3
25
4
An
gela
35
29
Nu
sif
23
18
Fati
ma
31
89
An
gela
35
30
Sab
rin
a 3
25
0
An
gela
35
30
Sab
rin
a 3
23
9
WH
AM
32
69
Saku
ra 3
25
4
Bar
bar
a 3
45
6
Ath
os
30
81
Thal
os
31
07
An
gela
35
29
Re
mu
s3
06
7
Bar
bar
a 3
45
6
CA
CTA
13
18
ZnF-D1 DUF6-D1 Rht-D110 kb
Isab
elle
23
8
Erik
a 3
17
8
Saku
ra 3
25
4
Sab
rin
a 3
24
6
An
gela
35
30
WH
AM
32
69
LIN
E 3
32
2
LIN
E 3
45
4C
AC
TA 1
24
1
WIS
31
60
Ro
man
i 32
23
Saku
ra 3
25
4
De
ram
i31
73
WH
AM
32
69
Saku
ra 3
33
9Sa
bri
na
32
50
Vin
cen
t 15
65
Sab
rin
a 3
24
8
WIS
31
61
Bia
nca
23
76
An
gela
35
30
An
gela
35
30
TAR
1 1
31
6
WIS
31
60
An
gela
35
30
Jorg
e 3
02
6
BAC_1J9-D
(e)
Thal
os
31
07
Ath
os
30
81
Thal
os
31
07

66
Arrows indicate orientation of transcription. LTR retrotransposons are shown in black font,
DNA transposons are shown in red font, non-LTR retrotransposons are shown in blue font,
and intergenic MITES (Miniature Inverted-repeat TEs) in green font. Intronic MITEs are shown
in Figures 3.7 and 3.10.
Approximately 35.6% (201 kb) of the sequences from the CS BACs have low
homology (Expectation (E) < 1 × 10⁻¹⁰) to known genes or to TEs (Table 3.1).
There are several blocks of low homology sequence greater than 5 kb in size.
On all three CS BACs, the region between DUF6 and Rht-1 contains large
stretches of low homology sequence and each homoeologue has at least 8 kb
of low homology sequence that is upstream of and adjoining Rht-1 (Figure
3.1b, c, d). This low homology region is also present on the BACs derived
from T. urartu and „Aibai/10*CS‟ (Figure 3.1a, e). Other blocks of low
homology include 14 kb of sequence located between 37.2 and 51.6 kb
downstream of Rht-A1, which extends to and includes the predicted gene
(Figure 3.1b) (Appendix IIIA, bp 117038 to 131305). In addition, on the CS-A
genome BAC (and on the T. urartu BAC) is a low homology region of nearly
11 kb that is upstream of and adjoining DUF6-A1 (Figure 3.1b) (Appendix IIIA,
bp 37820 to 48778).
Gene order and orientation is very highly conserved between the CS-A and T.
urartu BAC inserts whereas TE composition is only generally conserved and
there are several large differences (Figure 3.1a, b). In the region between
ZnF-A1 and DUF6-A1, TE composition is nearly identical as both BACs each
contain just 400 bp of the TE Gujog (TREP no. 3276), which has 98%
nucleotide identity between the two sequences. In the region between DUF6-
A1 and Rht-A1, the most striking difference in TE composition between the
two A genome BACs exists as T. urartu is devoid of TEs in this region, but
three TEs totaling 13 kb are present on CS-A. Upstream of ZnF-A1, the
overlapping regions of the two BACs have similar TE content with the
exception of an 8.7 kb WIS LTR retrotransposon (TREP no. 3161) that is only
present on CS-A. Downstream of Rht-A1, the TE content is again similar in
the overlapping regions of the BAC sequences, except for the presence of

67
sequences of WIS (TREP no. 3160) and Sabrina (TREP no. 3250) in T.
urartu, but not CS-A.
The CS-D and „Aibai/10*CS‟ BACs have 105 kb of overlapping sequence in
common that is nearly identical, having 99.83% of the nucleotides conserved.
The ZnF-D1, DUF6-D1, and Rht-D1 genes are contained in the overlapping
regions and are conserved in synteny and orientation of transcription. The
ZnF-D1 and DUF-D1 ORFs are identical on the two BACs. The Rht-D1 ORFs
differ by a single base substitution as Aibai/10*CS contains the SNP
associated with the Rht-D1b allele whereas CS contains the SNP associated
with the Rht-D1a allele. The intergenic sequences of the overlapping regions
have the same TE composition and nesting structure is completely conserved.
3.3.2. Comparative analyses of Rht-1 and the surrounding region in
wheat and Poaceae
Comparisons of the wheat BAC sequences to fully-assembled and annotated
members of the Poaceae family (rice, Brachypodium, sorghum, and maize)
resulted in identification of orthologous regions in each species. A summary
of the orthologous regions in the Poaceae is contained in Appendix IV and
shown in Figure 3.2. In maize, the region was found to be present in
duplicate, on chromosomes 1 (Zm-1) and 5 (Zm-5), while only a single copy
was present in the other Poaceae. In the text, orthologues will be referenced
by the wheat locus name preceded by the first letters of the genus and
species they are derived from (e.g. OsRht-1 refers to the rice orthologue of
Rht-1 and Zm-1ZnF refers to the maize orthologue of ZnF found on
chromosome 1). The ZnF-DUF6-Rht-1 synteny was retained in all
orthologues, with the exception of Zm-1, in which DUF6 is absent. In rice, an
expressed hypothetical gene (TIGR rice locus LOC_Os03g49960) is located
between OsDUF6 and OsRht-1 on the reverse strand. The distance
encompassing the ZnF-DUF6-Rht-1 linkage group varies widely among these
species. In Brachypodium, the genes are contained within 38 kb of sequence,
while on Zm-1 the genes exist in a space of 191 kb, with most of this

68
difference due to a vast increase in the amount of intergenic sequence
between Zm-1ZnF and Zm-1DUF6 relative to the other species.
Figure 3.2. Summary of microsynteny in the Rht-1 region. The five Rht-1-containing
wheat BACs are shown in alignment with orthologous regions of four additional species of the
Poaceae family. The species and genome derivation are indicated to the left of the panel. For
wheat, the entire BAC insert sequences are depicted. For the remaining Poaceae species,
the orthologous region is shown and extended to include the genes adjacent to the ZnF and
Rht-1 orthologues. The solid lines denote the sequence lengths, the presence of // within
these lines denotes a foreshortened depiction of the sequence length relative to the scale in
kb. The length preceding (-kb) and following (+kb) Rht-1 is indicated at the beginning and
end of each sequence. Genes are depicted as solid arrows that are oriented according to
DNA strand (forward or reverse). Orthologous genes are colour-coded across species with
the abbreviated wheat locus name beneath. For rice orthologues, the locus names (LOC_Os)
are shown in parentheses. Loci without an orthologue in this region are named according to
species convention. Nucleotide coordinates (NCs) and additional details of the genes are
provided in Appendix IV.
0 kb-50 kb-100kb +50kb
O. sativa
B. distachyon
S. bicolor
T. aestivum'CS’- A
+84 kb-80 kbZnF DUF6 Rht-1
DUF6+110 kb-78 kb
Rht-1
+117 kb-96 kbZnF DUF6 Rht-1
T. urartu - A +40 kb-59 kbZnF DUF6 Rht-1
T. aestivumBAC 1J9 - D
+8 kb-198 kbZnF DUF6 Rht-1
Rht-1 (03g49990)
DUF6(03g49940)
ZnF(03g49900)
Tb1 (03g49880)
Toc64(03g50010)
(03g49960)
-84 kb +28 kb
Bradi1g11100
DUF6Tb1 Toc64ZnF Rht-1
-56 kb +40 kb
DUF6 Rht-1 Toc64ZnFTb1
-87 kb +31 kb
Z. maysChr.1
Z. maysChr.5
-66 kbGRMZM2G063355
+56 kbRht-1ZnFTb1
T. aestivum‘CS’- B
T. aestivum‘CS’- D
-351 kb-185 kb
+203 kbGRMZM2G086003
Rht-1ZnFTb1 DUF6

69
To determine which loci in wheat are most likely 5‟ of ZnF and 3‟ of Rht-1, co-
linear regions of the sequenced genomes of the Poaceae family were
examined. The next gene upstream of ZnF in all species is a Tb1 orthologue.
The Tb1 orthologues are all a single exon consisting of 1080 to 1167 bp and
are oriented in the same direction as Rht-1, except the Zm-1 orthologue,
which is on the opposite strand. The distance between Tb1 and Rht-1 is less
than 90 kb in all orthologous regions, except for Zm-1, where the intergenic
space in substantially expanded to 350 kb. A Tb1 orthologue is not present
on any of the wheat BAC inserts even though one of the sequences (BAC
1J9) extends 198 kb upstream of Rht-1 and 108 kb upstream of ZnF.
In rice and sorghum the nearest gene downstream from Rht-1 is a Toc64-like
gene. In Brachypodium, Toc64 also exists downstream of Rht-1, but the two
genes are separated by a predicted gene, Bradi1g11100. In maize, no
similarity was found to Toc64 or to Bradi1g11000 in the region near Rht-1. In
rice, Brachypodium, and sorghum, Toc64 is composed of 13 exons with ORFs
containing between 1761 and 1767 nucleotides. In these three species,
Toc64 is within 40 kb of Rht-1, but is located on the opposite strand. The
Toc64 and Bradi1g11000 genes are not present on the CS wheat BAC clones
even though the BAC inserts each have at least 84 and up to 117 kb of
sequence downstream of Rht-1.
3.3.2.1. Comparative analysis of the Rht-1 ORF in wheat and Poaceae
Rht-1 in CS is composed of a single exon with lengths of 1863 (620 residues)
in Rht-A1, 1866 (621 residues) in Rht-B1, and 1872 bp (623 residues) in Rht-
D1 (Table 3.2). The coding sequences of Rht-A1, Rht-B1, and Rht-D1 in the
CS background are highly conserved with 94.1% of the nucleotide identities
and 96.8% of the amino acid identities shared among the three
homoeologues. Of the three CS Rht-1 homoeologous nucleotide sequences,
the Rht-A1a and Rht-D1a sequences are the most similar, having 96.4%
identity (differing by 40 SNPs and the need to insert 27 gaps for alignment
over 1875 sites), followed by Rht-A1a and Rht-B1a (96.0% identity; differing
by 61 SNPs and 15 gaps over 1878 sites), and Rht-B1a and Rht-D1a are the

70
most dissimilar (95.6% identity; differing by 56 SNPs and 26 gaps over 1882
sites). Among the homoeologous peptide sequences, Rht-B1a and Rht-D1a
have the most residue differences at 16 (8 amino acid changes and 8 gaps;
97.4% identity) while Rht-B1a and Rht-A1a differ by 12 residues (5 amino acid
changes and 7 gaps; 98.1% identity) and Rht-A1a and Rht-D1a differ by 12
residues (7 amino acid changes and 5 gaps; 98.1% identity). Only one amino
acid substitution among the homoeologues (Figure 3.3, coord. 273) was found
in the conserved domains described by Tian et al. (2004), with the substitution
occurring in the Leucine Heptad Repeat I (LHR I) domain of the DELLA-
specific N-terminal region. Of the remaining amino acid polymorphisms, 17
occur outside of the defined domains of the N-terminal region and two occur
outside of the defined domains of the GRAS C-terminal region. Alignment of
the Rht-A1 ORF nucleotide and amino acid sequences from CS and T. urartu
revealed a total of five SNPs (99.7% similarity) and no predicted amino acid
changes (Table 3.2).
Table 3.2. Relatedness of Rht-1 orthologues in wheat and Poaceae species.
a Percentage of nucleotide and amino acid identities shared between orthologues is shown
below and above the slash in the grid, respectively. Background colour of cells in the grid is
based on % identity: red (≥95%); blue (90-94.9%); yellow (85-89.9%); white (≤85%).
b CS = Chinese Spring; Locus pseudonyms: Os03g49990 = SLR1; GRMZM2G144744 = D8;
GRMZM2G024973 = D9.
c Species names are shown below and to the right of the header. Ta-A, Ta-B, and Ta-D = the
A, B, and D genomes of Triticum aestivum, respectively; Tu = Triticum urartu; Hv = Hordeum
vulgare; Bd = Brachypodium distachyon; Os = Oryza sativa; Sb = Sorghum bicolor; Zm-1 =
Zea mays chromosome 1 (B73 inbred); Zm-5 = Zea mays chromosome 5 (B73 inbred).
Locus Nameb
Speciesc
Ta -A Ta -B Ta -D Tu Hv Bd Os Sb Zm- 1 Zm- 5
Rht-A1 (CS) Ta -A 98.1 98.1 100.0 94.9 89.1 85.1 83.5 84.9 83.7
Rht-B1 (CS) Ta -B 96.0 97.4 98.1 95.5 88.5 85.3 82.9 84.0 82.4
Rht-D1 (CS) Ta -D 96.4 95.6 98.1 93.9 88.5 84.7 82.7 84.2 82.9
Rht-A1 Tu 99.7 95.8 96.7 94.9 89.1 85.1 83.5 84.9 83.7
SLN1 Hv 93.2 93.4 92.6 93.1 88.1 85.6 82.7 84.5 83.6
Bradi1g11090 Bd 88.0 87.7 87.5 88.0 87.0 86.5 85.9 87.5 83.6
Os03g49990 Os 86.2 85.8 85.5 86.1 85.4 85.7 84.3 85.2 83.5
Sb01g010660 Sb 84.7 84.5 84.6 84.8 84.2 85.1 85.1 93.8 90.4
GRMZM2G144744 Zm- 1 84.9 84.5 84.6 85.0 84.1 85.2 85.2 93.6 92.2
GRMZM2G024973 Zm- 5 85.2 84.7 84.9 85.2 84.5 84.2 84.7 90.6 92.0
1863 1866 1872 1863 1857 1872 1878 1884 1893 1878
620 621 623 620 618 623 625 627 630 625
Nucleotides (no.)
Amino Acids (no.)
Nucleotide \ Amino acid identitities (%)a

71
Nucleotide and amino acid sequences of the Rht-1 orthologues from barley
(HvRht-1), Brachypodium (BdRht-1), rice (OsRht-1), sorghum (SbRht-1),
maize chromosome 1 (Zm-1Rht-1), and maize chromosome 5 (Zm-5Rht-1)
were compared to the wheat Rht-1 loci from Chinese Spring and T. urartu
(Table 3.2; Figure 3.3). The ORFs of all Rht-1 orthologues are composed of a
single exon with lengths ranging from 1857 to 1893 nucleotides (618 to 630
amino acids). Among the Rht-1 ORFs, 68.5% of the nucleotides and 70.9%
of the amino acid residues are shared among all of the orthologues with
greater conservation occurring in the GRAS carboxyl termini than in the
DELLA-specific N-terminal regions. There are no frameshifts or large indels
in any of the Rht-1 proteins and the amino acids encoding the defined protein
domains (Tian et al., 2004) are highly conserved. The majority of the Rht-1
amino acid sequence divergences occur in three locations: (1) a 32 bp region
upstream of the DELLA domain (Figure 3.3, coords. 14-45), (2) a 112 bp
region (coords. 129-240), in-between the TVHYNP and LHR I domains, and
(3) a 25 bp region between the FY and RE domains (coords. 526-550).
Relative to the three CS Rht-1 homoeologues, HvRht-1 was the most similar
of the non-wheat sequences with 93.1% nucleotide and 94.8% amino acid
identity when averaged over homoeologue comparisons (Table 3.2). The
rank of nucleotide similarity among Rht-1 orthologues when averaged over
the three CS homoeologues is Hv > Bd > Os > Zm-5 > Zm-1 > Sb and amino
acid similarity rank is Hv > Bd > Os > Zm-1 > Sb = Zm-5. A phylogenetic
comparison of nucleotide sequences depicts this ranking and also show that
the wheat Rht-1 sequences are more closely related to HvRht-1 than any
other orthologue (Figure 3.4).

72
Figure 3.3. Peptide sequences of Rht-1 from wheat and Poaceae orthologues. Amino
acid sequences of three Chinese Spring wheat homoelogues of Rht-1 (CS-D, CS-B, and CS-
A), and orthologues in T. urartu (Tu), Hordeum vulgare (Hv), Brachypodium distachyon (Bd),
Oryza sativa (Os), Sorghum bicolor (Sb), chromosome 1 of Zea mays (Zm_1), and
chromosome 5 of Zea mays (Zm_5) were aligned using ClustalX and adjusted manually to
minimise mismatches. Gaps inserted to allow for alignment are indicated by a (-). Residue
conservation levels among the 10 sequences is shown by the following shading and font
colours: Absolute sequence identity = white font with black background; Identity shared by 8
CS-D :
CS-B :
CS-A :
T.urartu :
barley :
Brachypod. :
rice :
sorghum :
maize_chr1 :
maize_chr5 :
10 20 30 40 50 60 70 80 90 100 110
MKREYQDAGGSGGGGGG--MGSSEDKMMVS--AAAG--E-GEE-VDELLAALGYKVRASDMADVAQKLEQLEMAMGMGGV-GAGAAPDDSFATHLATDTVHYNPTDLSSW
MKREYQDAGGSGGGGGG--MGSSEDKMMVSGSAAAG--E-GEE-VDELLAALGYKVRASDMADVAQKLEQLEMAMGMGGV-GAGAAPDDSFATHLATDTVHYNPTDLSSW
MKREYQDAGGSGGGGG---MGSSEDKMMVS--AAAG--E-GEE-VDELLAALGYKVRASDMADVAQKLEQLEMAMGMGGV-GAGAAPDDSFATHLATDTVHYNPTDLSSW
MKREYQDAGGSGGGGG---MGSSEDKMMVS--AAAG--E-GEE-VDELLAALGYKVRASDMADVAQKLEQLEMAMGMGGV-GAGAAPDDSFATHLATDTVHYNPTDLSSW
MKREYQDGGGSGGGG--DEMGSSRDKMMVSSS-EAG--E-GEE-VDELLAALGYKVRASDMADVAQKLEQLEMAMGMGG-----PAPDDGFATHLATDTVHYNPTDLSSW
MKREYQDGGGSRGGG---DMGSSKDKMMV----AAPA---EEEDMDELLAALGYKVRASDMADVAQKLEQLEMAMGMGGV-GAGAAPDDSFVAHLATDTVHSNPSDLSSW
MKREYQEAGGSSGGGSSADMGSCKDKVMA---GAAG----EEEDVDELLAALGYKVRSSDMADVAQKLEQLEMAMGMGGV-SAPGAADDGFVSHLATDTVHYNPSDLSSW
MKREYQDAGGSGG-----DMGSSKDKMMV---AAAGAGEQEEE-LDEMLASLGYKVRSSDMADVAQKLEQLEMAMGMGGVGGAGATADDGFISHLATDTVHYNPSDLSSW
MKREYQDAGGSGG-----DMGSSKDKMMA---AAAGAGEQEEEDVDELLAALGYKVRSSDMADVAQKLEQLEMAMGMGGVGGAGATADDGFVSHLATDTVHYNPSDLSSW
MKREYQNAGGNDG-----YRGSSKDKSMA---AAAGAGEQEEE-VDELLAALGYKVRSSDMADVAQKLEQLEMAMGMGG---ACPTADDGFVSHLATDTVHYNPSDLSSW
: 101
: 103
: 100
: 100
: 98
: 99
: 102
: 101
: 102
: 98
CS-D :
CS-B :
CS-A :
T.urartu :
barley :
Brachypod. :
rice :
sorghum :
maize_chr1 :
maize_chr5 :
120 130 140 150 160 170 180 190 200 210 220
VESMLSELNAPPPPLPPA--P-QLNAST-SSTVTG---S-GGYFD-LPPSVDSSSSIYALRPIPSPAGATAPADLSA-DS-VRDPKRMRTGGSSTSSSSSSSSSLGGG-A
VESMLSELNAPPPPLPPA--P-QLNAST-SSTVTG-----GGYFD-LPPSVDSSCSTYALRPIPSPA--VAPADLSA-DSVVRDPKRMRTGGSSTSSSSSSSS-LGGGGA
VESMLSELNAPPPPLPPA--PQQLNAST-SSTVTG-----GGYFD-LPPSVDSSCSTYALRPIPSPAGAVGPADLSA-DS-VRDPKRMRTGGSSTSSSSSSSSSLGGG-A
VESMLSELNAPPPPLPPA--PQQLNAST-SSTVTG-----GGYFD-LPPSVDSSCSTYALRPIPSPAGAVGPADLSA-DS-VRDPKRMRTGGSSTSSSSSSSSSLGGG-A
VESMLSELNAPPPPLPPA--PPQLNAST-SSTVTGG----GGYFD-LPPSVDSSSSTYALRPIISPP--VAPADLSA-DS-VRDPKRMRTGGSSTSSSSSSSSSLGGGAA
VESMLSELNAPPPPLPPA--PQAPRLSSNSSTVTGGGGSGGGYFDGLPPSVDSSSSTYALRPIPSPV--VTPAEPSA-DP-AREPKRMRTGGGSTSSSSSSSSSLGGGGT
VESMLSELNAPLPPIPPA--PPAARHASTSSTVTGGGGS--GFFE-LPAAADSSSSTYALRPISLPV--VATADPSAADS-ARDTKRMRTGGGSTSSSSSSSSSLGGGAS
LESMLSELNAPPPPLPPATTPPAPRLASTSSTVTSGAAAGAGYFD-LPPAVDSSSSTYALKPIPSPV-AVASADPSSTDS-TREPKRMRTGGGSTSSSSSSSSSMDGGRT
VESMLSELNAPPAPLPPAT-P-APRLASTSSTVTSGAAAGAGYFD-LPPAVDSSSSTYALKPIPSPV-AAPSADPST-DS-AREPKRMRTGGGSTSSSSSSSSSMDGGRT
VESMLSELNAPPPPLPPAT-P-APRLASTSSTVTSGAAAGAGYFD-LPPAVDSSSSTYALKPIPSPV-AAASADPSP-DS-AREPKRMRTGGGSTSSSSSSSSSMDGGRT
: 199
: 199
: 198
: 198
: 196
: 203
: 204
: 208
: 206
: 202
CS-D :
CS-B :
CS-A :
T.urartu :
barley :
Brachypod. :
rice :
sorghum :
maize_chr1 :
maize_chr5 :
230 240 250 260 270 280 290 300 310 320 330
RSSVVEAAPPVAAAANAT--PALPVVVVDTQEAGIRLVHALLACAEAVQQENLSAAEALVKQIPLLAASQGGAMRKVAAYFGEALARRVFRFRPQPDSSLLDAAFADLLH
RSSVVEAAPPVAAAAGA---PALPVVVVDTQEAGIRLVHALLACAEAVQQENFSAAEALVKQIPLLAASQGGAMRKVAAYFGEALARRVFRFRPQPDSSLLDAAFADLLH
RSSVVEAAPPVAAGANA---PALPVVVVDTQEAGIRLVHALLACAEAVQQENFSAAEALVKQIPLLAASQGGAMRKVAAYFGEALARRVFRFRPQPDSSLLDAAFADLLH
RSSVVEAAPPVAAGANA---PALPVVVVDTQEAGIRLVHALLACAEAVQQENFSAAEALVKQIPLLAASQGGAMRKVAAYFGEALARRVFRFRPQPDSSLLDAAFADLLH
RSSVVEAAPPVAAAAAA---PALPVVVVDTQEAGIRLVHALLACAEAVQQENLSAAEALVKQIPLLAASQGGAMRKVAAYFGEALARRVFRFRPQPDSSLLDAAFADLLH
MSSVVEAAPPAAPASAAANAPALPVVVVDTQEAGIRLVHALLACAEAVQQENLSAAEALVKQIPLLAASQGGAMRKVAAYFGEALARRVFRFRPQPDSSLLDAAFADLLH
RGSVVEAAPPATQGAAAANAPAVPVVVVDTQEAGIRLVHALLACAEAVQQENFAAAEALVKQIPTLAASQGGAMRKVAAYFGEALARRVYRFRP-ADSTLLDAAFADLLH
RSSVVEAAPPATQAPAAANGPAVPVVVMDTQEAGIRLVHALLACAEAVQQENFSAADALVKQIPMLASSQGGAMRKVAAYFGEALARRVYRFRPTPDTSLLDAAVADFLH
RSSVVEAAPPATQASAAANGPAVPVVVVDTQEAGIRLVHALLACAEAVQQENFSAAEALVKQIPMLASSQGGAMRKVAAYFGEALARRVYRFRPPPDSSLLDAAFADLLH
RSSVVEAAPPATQA---ANGPAVPVVVVDTQEAGIRLVHALLACAEAVQQENFSAADALVKQIPVLASSQGGAMRKVAAYFGEALARRVYRLRPAPDGSLLDAAFADLLH
: 307
: 306
: 305
: 305
: 303
: 313
: 313
: 318
: 316
: 309
CS-D :
CS-B :
CS-A :
T.urartu :
barley :
Brachypod. :
rice :
sorghum :
maize_chr1 :
maize_chr5 :
340 350 360 370 380 390 400 410 420 430 440
AHFYESCPYLKFAHFTANQAILEAFAGCRRVHVVDFGIKQGMQWPALLQALALRPGGPPSFRLTGVGPPQPDETDALQQVGWKLAQFAHTIRVDFQYRGLVAATLADLEP
AHFYESCPYLKFAHFTANQAILEAFAGCRRVHVVDFGIKQGMQWPALLQALALRPGGPPSFRLTGVGPPQPDETDALQQVGWKLAQFAHTIRVDFQYRGLVAATLADLEP
AHFYESCPYLKFAHFTANQAILEAFAGCRRVHVVDFGIKQGMQWPALLQALALRPGGPPSFRLTGVGPPQPDETDALQQVGWKLAQFAHTIRVDFQYRGLVAATLADLEP
AHFYESCPYLKFAHFTANQAILEAFAGCRRVHVVDFGIKQGMQWPALLQALALRPGGPPSFRLTGVGPPQPDETDALQQVGWKLAQFAHTIRVDFQYRGLVAATLADLEP
AHFYESCPYLKFAHFTANQAILEAFAGCRRVHVVDFGIKQGMQWPALLQALALRPGGPPSFRLTGVGPPQPDETDALQQVGWKLAQFAHTIRVDFQYRGLVAATLADLEP
AHFYESCPYLKFAHFTANQAILEAFAGCRRVHVVDFGIKQGMQWPALLQALALRPGGPPSFRLTGVGPPQPDETDALQQVGWKLAQFAHTIRVDFQYRGLVAATLADLEP
AHFYESCPYLKFAHFTANQAILEAFAGCHRVHVVDFGIKQGMQWPALLQALALRPGGPPSFRLTGVGPPQPDETDALQQVGWKLAQFAHTIRVDFQYRGLVAATLADLEP
AHFYESCPYLKFAHFTANQAILEAFAGCRRVHVVDFGIKQGLQWPALLQALALRPGGPPSFRLTGVGPPQHDETDALQQVGWKLAQFAHTIRVDFQYRGLVAATLADLEP
AHFYESCPYLKFAHFTANQAILEAFAGCRRVHVVDFGIKQGMQWPALLQALALRPGGPPSFRLTGVGPPQPDETDALQQVGWKLAQFAHTIRVDFQYRGLVAATLADLEP
AHFYESCPYLKFAHFTANQAILEAFAGCRRVHVVDFGIKQGMQWPALLQALALRPGGPPSFRLTGVGPPQPDETDALQQVGWKLAQFAHTIRVDFQYRGLVAATLADLEP
: 417
: 416
: 415
: 415
: 413
: 423
: 423
: 428
: 426
: 419
CS-D :
CS-B :
CS-A :
T.urartu :
barley :
Brachypod. :
rice :
sorghum :
maize_chr1 :
maize_chr5 :
450 460 470 480 490 500 510 520 530 540 550
FMLQPEGEEDPNEEPEVIAVNSVFEMHRLLAQPGALEKVLGTVRAVRPRIVTVVEQEANHNSGTFLDRFTESLHYYSTMFDSLEGGSSGGG--PSEVSSGAAAAP-AAAG
FMLQPEGEEDPNEEPEVIAVNSVFEMHRLLAQPGALEKVLGTVRAVRPRIVTVVEQEANHNSGTFLDRFTESLHYYSTMFDSLEGGSSGG---PSEVSSGAAAAP-AAAG
FMLQPEGEEDPNEEPEVIAVNSVFEMHRLLAQPGALEKVLGTVRAVRPRIVTVVEQEANHNSGTFLDRFTESLHYYSTMFDSLEGGSSGG---PSEVSSGAAAAP-AAAG
FMLQPEGEEDPNEEPEVIAVNSVFEMHRLLAQPGALEKVLGTVRAVRPRIVTVVEQEANHNSGTFLDRFTESLHYYSTMFDSLEGGSSGG---PSEVSSGAAAAP-AAAG
FMLQPEGEEDPNEEPEVIAVNSVFEMHRLLAQPGALEKVLGTVRAVRPRIVTVVEQEANHNSGSFLDRFTESLHYYSTMFDSLEGGSSGG---PSEVSSGGAA-PAAAAG
FMLQPEGEEDPNEEPEVIAVNSVFEMHRLLSQPGALEKVLGTVRAVRPRIVTVVEQEANHNSGSFLDRFTESLHYYSTMFDSLEGAGSGQ----SEISPGAAA-----GA
FMLQPEGEADANEEPEVIAVNSVFELHRLLAQPGALEKVLGTVHAVRPRIVTVVEQEANHNSGSFLDRFTESLHYYSTMFDSLEGGSSGQAELS----PPAA---GGGGG
FMLQPEGD-DKDEEPEVIAVNSVFELHRLLAQPGALEKVLGTVRAVRPRIVTVVEQEANHNSGTFLDRFTESLHYYSTMFDSLEGAGS--------GQSTDAS-PAAAGG
FMLQPEGD-DTDDEPEVIAVNSVFELHRLLAQPGALEKVLGTVRAVRPRIVTVVEQEANHNSGTFLDRFTESLHYYSTMFDSLEGAGAGS------GQSTDAS-PAAAGG
FMLRPEGGGDTDDEPEVIAVNSVCELHRLLAQPGTLDKVLGTVRAVRPRIVTVVEQEANHNSGTFLDRFTESLHYYSTMFDSLEGAGSGSGSGSGSGQPTDASPP---AG
: 524
: 522
: 521
: 521
: 519
: 524
: 526
: 528
: 528
: 526
CS-D :
CS-B :
CS-A :
T.urartu :
barley :
Brachypod. :
rice :
sorghum :
maize_chr1 :
maize_chr5 :
560 570 580 590 600 610 620 630 640 650
TDQVMSEVYLGRQICNVVACEGAERTERHETLGQWRNRLGNAGFETVHLGSNAYKQASTLLALFAGGDGYKVEEKEGCLTLGWHTRPLIATSAWRLAG---P-
TDQVMSEVYLGRQICNVVACEGAERTERHETLGQWRNRLGNAGFETVHLGSNAYKQASTLLALFAGGDGYKVEEKEGCLTLGWHTRPLIATSAWRLAA---P-
TDQVMSEVYLGRQICNVVACEGAERTERHETLGQWRNRLGNAGFETVHLGSNAYKQASTLLALFAGGDGYKVEEKEGCLTLGWHTRPLIATSAWRLAA---P-
TDQVMSEVYLGRQICNVVACEGAERTERHETLGQWRNRLGNAGFETVHLGSNAYKQASTLLALFAGGDGYKVEEKEGCLTLGWHTRPLIATSAWRLAA---P-
TDQVMSEVYLGRQICNVVACEGTERTERHETLGQWRNRLGNAGFETVHLGSNAYKQASTLLALFAGGDGYKVEEKEGCLTLGWHTRPLIATSAWRLAA---P-
TDQVMSEVYLGRQICNVVACEGPERTERHETLGQWRGRLGQAGFETVHLGSNAYKQASTLLALFAGGDGYKVEEKDGCLTLGWHTRPLIATSAWRMAA---P-
TDQVMSEVYLGRQICNVVACEGAERTERHETLGQWRNRLGRAGFEPVHLGSNAYKQASTLLALFAGGDGYRVEEKEGCLTLGWHTRPLIATSAWRVAAA----
TDQVMSEVYLGRQICNVVACEGAERTERHETLSQWRGRLVGSGFEPVHLGSNAYKQASTLLALFNGGDGYRVEEKDGCLTLGWHTRPLIATSAWRLAA---P-
TDQVMSEVYLGRQICNVVACEGAERTERHETLGQWRSRLGGSGFAPVHLGSNAYKQASTLLALFAGGDGYRVEEKDGCLTLGWHTRPLIATSAWRVAAAAAP-
TDQVMSEVYLGRQICNIVACEGAERTERHETLVQWRGRLGGSGFEPVHLGSNAYKQASTLLALFAGGDGYRVEEKDGCLTLGWHTRPLIATSAWRVAA---P-
: 623
: 621
: 620
: 620
: 618
: 623
: 625
: 627
: 630
: 625
DELLA TVHYNP
TVHYNP
NLSLHR I
VHIID
VHIID
LHR II
LHR II P FY
RE RVER SAWL-WW-G
CS-D:CS-B:CS-A:Tu:Hv:Bd:Os:Sb:
Zm_1:Zm_5:
CS-D:CS-B:CS-A:Tu:Hv:Bd:Os:Sb:
Zm_1:Zm_5:
CS-D:CS-B:CS-A:Tu:Hv:Bd:Os:Sb:
Zm_1:Zm_5:
CS-D:CS-B:CS-A:Tu:Hv:Bd:Os:Sb:
Zm_1:Zm_5:
CS-D:CS-B:CS-A:Tu:Hv:Bd:Os:Sb:
Zm_1:Zm_5:
CS-D:CS-B:CS-A:Tu:Hv:Bd:Os:Sb:
Zm_1:Zm_5:

73
to 9 orthologues = white font with dark grey background; Identity shared by 6 to 7 orthologues
= black font with light grey background; Identity shared by 5 or less orthologues = black font
with white background. Coordinates are shown above the sequence for referral in the text,
but because of the introduction of gaps to facilitate alignment they do not correspond to any
one sequence. Total peptide length is shown following the last residue in each sequence.
Arrows indicate differences among the three CS homoeologues. Previously established
protein motifs (Tian et al., 2004) are underlined in blue and with names below. The DELLA-
specific N-terminal region includes coords. 1 to 320 and the GRAS carboxyl terminus includes
coords. 321 to 652. Accessions used for each Rht-1 orthologue are shown in Appendix IV.
Figure 3.4. Unrooted neighbor-joining tree of wheat Rht-1 and Poaceae orthologues.
Nucleotide sequences of the Rht-1 ORFs were aligned with ClustalX and bootstrap values
and genetic distances determined using the seqboot application and neighbour joining
method of PHYLIP (v3.6). Ta „CS‟ Rht-A1, Ta „CS‟ Rht-B1, and Ta „CS‟ Rht-D1 are,
respectively, the A, B, and D homoeologues of the Rht-1 gene identified in the Chinese
Spring wheat BAC library. T. urartu Rht-A1 sequence is also from a BAC clone. The
remaining sequences are shown by species name with locus or genbank accession number
below. If a species-specific Rht-1 pseudonym exists, it is shown in parenthesis.
Chromosome number containing the Rht-1 orthologue is also given for maize. Branch
lengths indicate relative genetic distance. Bootstrap values per 100 trees are given at each
node if available.
H. vulgareAF460219 (SLN1)O. sativa
Os03g49990 (SLR1)
Z. mays chr.1GRMZM2G144744 (D8)
Z. mays chr.5GRMZM2G024973 (D9)
S. bicolorSb01g010680
B. distachyonBradi1g11070
Ta 'CS' Rht-B1
T. urartu Rht-A1
Ta 'CS' Rht-A1
Ta 'CS' Rht-D1
10073
99.9
100
100
10063

74
3.3.2.2. Comparative analysis of the Rht-1 flanking region (10 kb 5’ and
10kb 3’) in wheat and Poaceae
Sequence 5‟ and 3‟ of Rht-1 was examined to determine the degree of
similarity among the three CS wheat genomes. It was hypothesised that
regions of high conservation close to the ORF could reflect regulatory regions
for expression of Rht-1. Comparison of the Rht-1 regions of the three CS
genomes showed that the 5‟ region beyond approximately 10 kb upstream of
the ORF (9.6 kb 5‟ of Rht-A1, 8 kb 5‟ of Rht-B1, and 11.1 kb 5‟ of Rht-D1) had
high similarity to TEs. TE sequences are unlikely to be regulatory regions for
Rht-1 function, and therefore comparative analysis was restricted to the
region from 0 to 10 kb upstream of the ORF. CS BAC sequences from 0 to
10 kb upstream of Rht-A1, Rht-B1, and Rht-D1 were compared using the
NCBI BLAST alignment tool and regions of similarity were defined as those
with hits ≥ 100 and nucleotide identity greater than 80% (Figure 3.5). The CS-
A and CS-D regions 5‟ of Rht-1 were the most alike, with 61% of the
sequences defined as similar in the 10 kb interval. In contrast, the percentage
of the 5‟ region defined as similar between CS-B and CS-D is 25% and
between CS-B and CS-A is 22%. Sequence similarity shared among all three
CS genomes was 21% from ten hits ranging from 69 to 651 bp in length
(Table 3.3). Two-thirds of the sequence conserved among the three
homoeologues is located between 793 and 2251 bp upstream of Rht-B1.

75
Figure 3.5. Sequence similarity 5’ of Rht-1 on the Chinese Spring (CS) A, B, and D
genomes. Sequences from 0 kb to 10 kb upstream of Rht-1 from each genome were
compared using ACT (Artemis Comparison Tool) software (Carver et al., 2005) and
comparison files created with Double ACT v2 (http://www.hpa-
bioinfotools.org.uk/pise/double_act.html). Genomic regions from 10,000 bp upstream (-
10,000) up to the first nucleotide of the translational start codon (0) of Rht-1a are shown as
grey bars. Regions with BLAST scores ≥100 and similarity > 80% are connected by red
rectangles; the width of the rectangle represents the length of the hit and colour intensity is
correlated to percent sequence similarity, with darker red corresponding to higher percentage
similarity.
Table 3.3. Summary of 5’ regions within 10 kb of Rht-1 that are conserved among the
Chinese Spring (CS) A, B and D genomes.
a Sequences from 0 kb to 10 kb upstream of Rht-1 from each genome were compared using
the NCBI BLAST alignment tool to identify regions of similarity shared among the three
homoeologues. BLAST hits and lengths of conserved regions are listed from 5‟ to 3‟.
-10000 -9200 -8400 -7600 -6800 -6000 -5200 -4400 -3600 -2800 -2000 -1200 -400 0
CS-B
CS-D
CS-A
CS-A
BLAST hita Length (bp) Start Finish Start Finish Start Finish
1 156 -6083 -5931 -4991 -4844 -6280 -6124
2 101 -5854 -5767 -4785 -4687 -6058 -5957
3 100 -4907 -4807 -4123 -4015 -5581 -5481
4 69 -4736 -4667 -3931 -3862 -5423 -5354
5 651 -3412 -2770 -2251 -1619 -4442 -3791
6 283 -2772 -2482 -1608 -1320 -3780 -3497
7 509 -1618 -1092 -1318 -793 -1592 -1083
8 70 -694 -623 -593 -524 -676 -607
9 152 -450 -298 -400 -249 -431 -279
CS-A CS-B CS-D

76
Conserved regions were designated as having BLAST scores ≥100 and sequence similarity >
80%. The coordinates of the hits are shown for each of the genomes relative to the start
nucleotide of Rht-1. Negative numbers refer to the distance upstream of Rht-1.
Nucleotide sequence comparison of the region from 0 to 10 kb 3‟ of Rht-1
among the three CS BACs (using the same BLAST score criteria as for the 5‟
region) revealed high sequence similarity up to 4.5 kb downstream of the stop
codon of Rht-1 (Figure 3.6). Beyond this, similarity breaks down between any
two genomes, with the exception of approximately 500 bp of similarity
between the A and D genomes. Beyond roughly 6 kb 3‟ of Rht-1 (7.4 kb, 6.1
kb, and 5.9 kb in the A, B, and D genomes, respectively), the majority of
sequence has high similarity to known TEs. Among the three genomes, 27%
of the 0 to 10 kb downstream sequence is defined as similar and all this
occurs with 4 kb of the end of Rht-1 (Table 3.4).
Figure 3.6. Sequence similarity 3’ of Rht-1 on the Chinese Spring (CS) A, B, and D
genomes. Sequences from 0 kb to 10 kb downstream of Rht-1 from each genome were
compared using ACT (Artemis Comparison Tool) software (Carver et al., 2005) and
comparison files created with Double ACT v2 (http://www.hpa-
bioinfotools.org.uk/pise/double_act.html). Genomic regions from the end nucleotide of the
Rht-1 ORF (0) to 10,000 bp downstream (10,000) are shown as grey bars. Regions with
BLAST scores ≥100 and similarity > 80% are connected by red rectangles; the width of the
RHT 3’ REGION BAC COMPARISONS1 to 10 000 bp downstream RhtMin BLAST score of 100Min identity of 80% (darker red = higher % identity)
0 800 1600 2400 3200 4000 4800 5600 6400 7200 8000 8800 9600 10000
CS-A
CS-B
CS-D
CS-A

77
rectangle represents the length of the hit and colour intensity is correlated to percent
sequence similarity, with darker red corresponding to higher percentage similarity.
Table 3.4. Summary of 3’ regions within 10 kb of Rht-1 that are conserved among the
Chinese Spring (CS) A, B and D genomes.
a Sequences from within 10 kb downstream of Rht-1 from each genome were compared using
the NCBI BLAST tool to identify regions of similarity shared among all three genomes. BLAST
hits and lengths of conserved regions are listed from 5‟ to 3‟. Conserved regions were
designated as having BLAST scores ≥100 and sequence similarity >80%. Coordinates of the
hits are shown for each of the genomes relative to the last nucleotide of Rht-1.
To determine whether regions upstream or downstream of Rht-1 are
conserved between the three CS wheat BAC sequences and the orthologous
regions in rice and Brachypodium, comparisons were made using the NCBI
BLAST alignment tool with conservation defined as BLAST hits ≥ 100 and
nucleotide similarity ≥ 70. For each sequence the regions up to 10 kb
upstream and up to 10 kb downstream of Rht-1 (not including the ORF) were
compared. Upstream of Rht-1, only one conserved region (Region 1, table
3.5) was identified among the five genomes. This region is approximately 120
bp in length and in each genome is located in the interval between 300 and
500 bp upstream of Rht-1. Using CS-D BAC sequence as a reference
(arbitrarily chosen), nucleotide similarity of this upstream region with rice and
Brachypodium was 84% and 92%, respectively. Downstream, two conserved
regions (Regions 2 and 3, table 3.5) were identified among the five genomes.
Region 2, the nearest downstream region, was approximately 100 bp in length
and located between 300 and 450 bp 3‟ of the Rht-1 stop codon in each
sequence. Nucleotide similarities of region 2 relative to the CS-D reference
sequence were 81% with rice and 84% with Brachypodium. Region 3 was
BLAST hita Length (bp) Start Finish Start Finish Start Finish
1 481 1 483 2 483 3 484
2 289 623 895 515 789 616 905
3 298 1161 1455 1247 1538 1192 1490
4 135 1495 1631 1581 1717 1513 1648
5 416 1649 2057 1739 2165 1664 2080
6 120 2194 2314 2307 2424 2267 2387
7 174 2440 2620 2537 2712 2496 2670
8 492 2978 3468 2965 3451 2905 3397
9 293 3563 3856 3567 3861 3521 3814
CS-A CS-B CS-D

78
approximately 250 bp in size and located between 1.5 and 2 kb downstream
of Rht-1 in each genome. Nucleotide similarities for this region relative to the
CS-D reference sequence were 70% for rice and 75% for Brachypodium.
Table 3.5. Sequence similarities among the CS wheat genomes, rice, and
Brachypodium for the 5’ and 3’ regions within 10 kb of Rht-1.
a Sequences from 0 kb to 10 kb upstream of Rht-1 and from 0 to 10 kb downstream of Rht-1
from each genome were compared using the NCBI BLAST tool to identify regions of similarity.
Lengths of conserved regions are listed from 5‟ to 3‟. Conserved regions were designated as
having BLAST scores ≥100 and sequence similarity ≥70%.
b Coordinates of 5‟ hits are shown for each of the genomes relative to the start nucleotide of
Rht-1 with negative numbers referring to sequence upstream of Rht-1. Coordinates of 3‟ hits
are shown relative to the end nucleotide of Rht-1.
c BLAST scores, expectation (E) values, and percentage of shared nucleotides (similarity)
relative to CS-D are given. BLASTs of CS-D to itself are included for comparative purposes.
Regiona
Genome Start End Score E-value Similarity
CS-D -435 -314 244 3 x 10-63
100%
CS-A -452 -333 230 2 x 10-57
98%
CS-B -400 -283 206 5 x 10-51
94%
Brachypodium -430 -310 194 3 x 10-47
92%
rice -474 -349 156 2 x 10-36
84%
CS-D 328 428 202 5 x 10-52
100%
CS-A 327 432 172 7 x 10-42
92%
CS-B 327 427 176 6 x 10-43
95%
Brachypodium 238 305 108 5 x 10-24
84%
rice 256 353 100 3 x 10-21
81%
CS-D 1627 1901 550 1 x 10-145
100%
CS-A 1610 1879 432 6 x 10-112
91%
CS-B 1696 1973 416 1 x 10-107
89%
Brachypodium 1612 1885 202 5 x 10-49
75%
rice 1456 1759 126 8 x 10-28
70%
Coordinatesb
1
2
3
BLAST Comparisonc

79
3.3.2.3. Comparative analysis of ZnF in wheat and Poaceae
A comparison of the ZnF genes present on the CS-A, CS-D, and T. urartu (A
genome) BAC inserts reveals that the intron-exon structure is highly
conserved among all four BACs with each ZnF gene occurring on the minus
strand and consisting of 14 exons and 13 introns (Figure 3.7). The CS and
„Aibai/10*CS‟ ZnF-D1 exon sequences are identical and the intron sequences
differ by only 4 polymorphisms (3 SNPs and 1 bp deletion), so only CS ZnF-
D1 will be used in comparisons. The gene lengths (introns + exons) of the
wheat ZnF genes vary widely with a 9032 bp size in T. urartu, a 9894 bp size
in CS-A, and a 8298 bp size in CS-D,. All of the ZnF indels occur in the
introns and the four largest indels, which range from 85 to 800 bp, account for
almost all of the size differences found among the ZnF loci. The first indel
(relative to the ZnF start codon) occurs in intron 4 and involves an 800 bp
insertion on the two ZnF-A1 sequences relative to ZnF-D1. A BLAST search
of the inserted sequence against the NCBI nucleotide collection (nr/nt) and
the TREP cereals repeat database revealed no matches with significant
similarity. Also in intron 4 is a partial sequence (91 bp) of a Tantalos MITE
(Miniature Inverted-repeat Transposable Element) on ZnF-D1. The second
indel is an 87 bp insertion on CS ZnF-A1 intron 5 of a Hades MITE (87 bp),
which is degenerate. The third ZnF indel occurs in intron 6 where a full-length
copy of the Thalos MITE (165bp) is present on the two ZnF-A1 genes but
absent on ZnF-D1. In the same region of intron 6, the ZnF-D1 contains a full-
length copy of the Athos MITE (85 bp). The fourth ZnF indel is a 770 bp
insertion on ZnF-A1 of CS that occurs between the Thalos MITE and exon 7.
No matches were found to the 770bp sequence in the NCBI nucleotide
collection (nr/nt) or TREP cereals repeat database. In contrast to the intronic
Tantalos, Hades, and Thalos MITEs which differ between ZnF-A1 and ZnF-
D1, the Icarus MITE is conserved between these two homoeologues. The
conservation of the intronic Icarus MITE also contrasts with the transposon
composition among the intergenic regions of the CS Rht-containing BACs, in
which no transposons were discovered that were conserved between any two
homoeologues.

80
Figure 3.7. Diagrammatic representation of the wheat zinc-finger (ZnF) gene structure
and intronic MITES. The genes (outlined in orange) from T. urartu and the A and D
genomes of Chinese Spring (CS) are each located on the minus strand and are shown
oriented from 5‟ to 3‟ in scale to one another with total length shown in basepairs (bp) at the
end of each gene. Filled orange rectangles correspond to the 14 exons and unshaded
regions represent the 13 introns present in each copy. MITES (Miniature Inverted-repeat
Transposable Elements) are indicated by green arrows pointing in the direction of
transcription relative to ZnF with names shown above. The locations of 770 bp and 800 bp
insertions (ins) are also indicated.
The nucleotide and amino acid sequences of the ORFs of the ZnF wheat
genes found on the four BAC sequences are also highly conserved and all
ORFs are 1422 nucleotides (473 amino acids) in length (Table 3.6). The ZnF
ORFs of the CS-A and CS-D homoeologues have 98.5% nucleotide identity
(differing by only 21 SNPs) and 99.8% amino acid similarity (1 residue
difference). The only predicted amino acid change between the CS-A and
CS-D ZnF ORFs is a valine (ZnF-A1) to leucine (ZnF-D1) change (Figure 3.8,
coord. 315) that occurs outside of the C3HC4 (RING) zinc finger type domain.
The CS-A and T. urartu ZnF-A1 sequences differ by 5 SNPs (99.6% identity)
and the amino acid sequences are identical.
T. urartu
ZnF-A1
CS
ZnF-A1
CS
ZnF-D1
AthosTantalos Icarus
8298 bp
ThalosIcarus
9032 bp
800 bp ins
ThalosIcarusHades
9894 bp
800 bp ins 770 bp ins
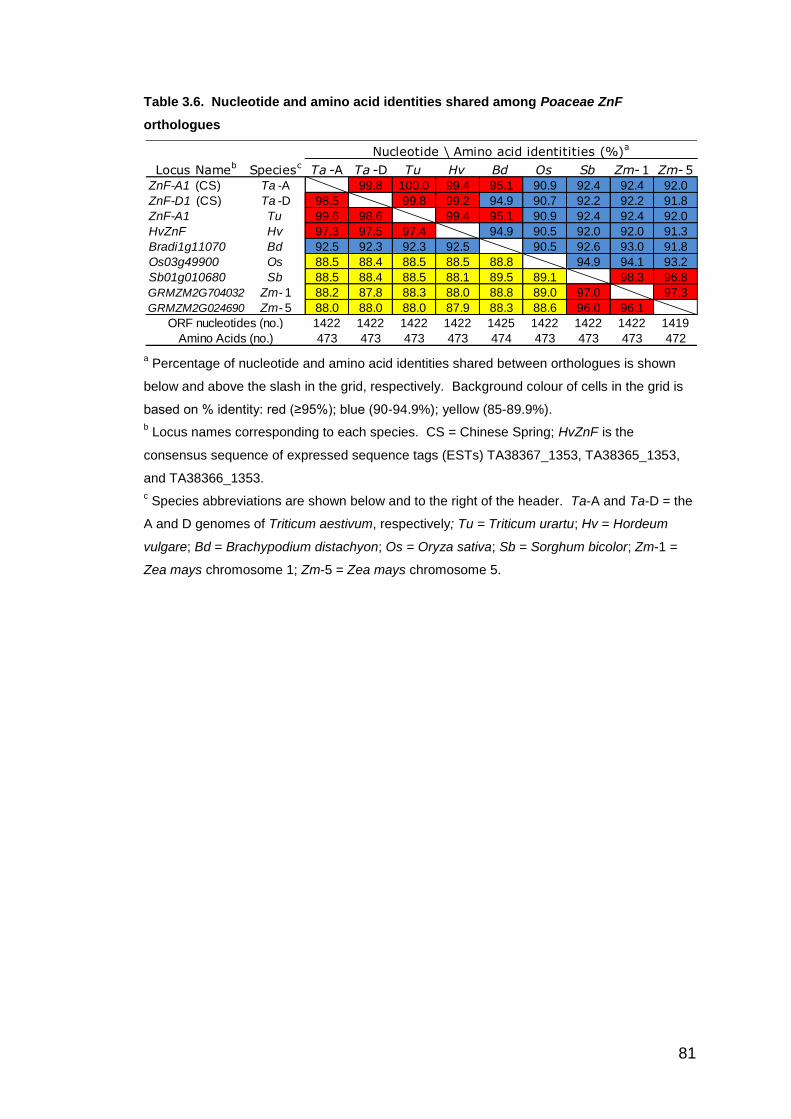
81
Table 3.6. Nucleotide and amino acid identities shared among Poaceae ZnF
orthologues
a Percentage of nucleotide and amino acid identities shared between orthologues is shown
below and above the slash in the grid, respectively. Background colour of cells in the grid is
based on % identity: red (≥95%); blue (90-94.9%); yellow (85-89.9%).
b Locus names corresponding to each species. CS = Chinese Spring; HvZnF is the
consensus sequence of expressed sequence tags (ESTs) TA38367_1353, TA38365_1353,
and TA38366_1353.
c Species abbreviations are shown below and to the right of the header. Ta-A and Ta-D = the
A and D genomes of Triticum aestivum, respectively; Tu = Triticum urartu; Hv = Hordeum
vulgare; Bd = Brachypodium distachyon; Os = Oryza sativa; Sb = Sorghum bicolor; Zm-1 =
Zea mays chromosome 1; Zm-5 = Zea mays chromosome 5.
Locus Nameb
Speciesc
Ta -A Ta -D Tu Hv Bd Os Sb Zm-1 Zm-5
ZnF-A1 (CS) Ta -A 99.8 100.0 99.4 95.1 90.9 92.4 92.4 92.0
ZnF-D1 (CS) Ta -D 98.5 99.8 99.2 94.9 90.7 92.2 92.2 91.8
ZnF-A1 Tu 99.6 98.6 99.4 95.1 90.9 92.4 92.4 92.0
HvZnF Hv 97.3 97.5 97.4 94.9 90.5 92.0 92.0 91.3
Bradi1g11070 Bd 92.5 92.3 92.3 92.5 90.5 92.6 93.0 91.8
Os03g49900 Os 88.5 88.4 88.5 88.5 88.8 94.9 94.1 93.2
Sb01g010680 Sb 88.5 88.4 88.5 88.1 89.5 89.1 98.3 96.8
GRMZM2G704032 Zm- 1 88.2 87.8 88.3 88.0 88.8 89.0 97.0 97.3
GRMZM2G024690 Zm- 5 88.0 88.0 88.0 87.9 88.3 88.6 96.0 96.1
1422 1422 1422 1422 1425 1422 1422 1422 1419
473 473 473 473 474 473 473 473 472
Nucleotide \ Amino acid identitities (%)a
ORF nucleotides (no.)
Amino Acids (no.)

82
Figure 3.8. Peptide sequences of ZnF from wheat and Poaceae orthologues. Amino acid
sequences of two Chinese Spring (CS) wheat homoelogues of ZnF (CS-D and CS-A) and
orthologues in T. urartu (Tu), Hordeum vulgare (Hv), Brachypodium distachyon (Bd), Oryza
sativa (Os), Sorghum bicolor (Sb), chromosome 1 of Zea mays (Zm_1), and chromosome 5 of
Zea mays (Zm_5) were aligned using ClustalX and adjusted manually to minimise
mismatches. Gaps inserted to allow for alignment are indicated by a (-). Residue
conservation of the nine sequences is shown by the following shading and font colours:
Absolute sequence identity = white font with black background; Identity shared by 7 to 8
orthologues = white font with dark grey background; Identity shared by 5 to 6 orthologues =
black font with light grey background; Identity shared by 4 or less orthologues = black font
with white background. Coordinates are shown above the sequence. Total peptide length is
shown after each sequence.
CS-D :
CS-A :
T.urartu :
barley :
Brachypod. :
rice :
sorghum :
maize_chr1 :
maize_chr5 :
10 20 30 40 50 60 70 80 90 100
M-QRRRAQTWAGVGKTAQAAAAHAALFCFTLLLALRVDGRTDSSWWIIFIPLWLFHGVAARGRFSMPAPSLPHGRHWAPCHSVVAAPLLIAFELLLCIYL
M-QRRRAQTWAGVGKTAQAAAAHAALFCFTLLLALRVDGRTDSSWWIIFIPLWLFHGVAARGRFSMPAPSLPHGRHWAPCHSVVAAPLLIAFELLLCIYL
M-QRRRAQTWAGVGKTAQAAAAHAALFCFTLLLALRVDGRTDSSWWIIFIPLWLFHGVAARGRFSMPAPSLPHGRHWAPCHSVVAAPLLIAFELLLCIYL
M-QRRRAQTWAGVGKTAQAAAAHAALFCFTLLLALRVDGRTDSSWWVIFIPLWLFHGVAARGRFSMPAPSLPHGRHWAPCHSVVAAPLLIAFELLLCIYL
MQQRRRAQTWAGAGKTAQAAAAHLALFCFTLLLALRVDGRTAYSWWIIFIPIWLFHGVAARGRFSMPAPSLPHGRHWAPCHSVVAAPLLIAFELLLCIYL
M-QRRRAQTWAGVGKTAQAAAAHAALFCFTLLLALKVDGRTAYSWWIIFIPLWLFHGIVARGRFSMPAPSLPHGRHWAPCHSIVAAPLLIAFELLLCIYL
M-QRRRAHTWAGVGKTAQAAAAHAALFCFTLLLALMVDGRTTYSWWIIFIPLWLFHGIVARGRFSMPAPSLPHGRHWAPCHSIVAAPLLIAFELLLCIYL
M-QRRRGHTWAGVGKTAQAASAHAALFCFTLLLALRVDGRTTYSWWIIFIPLWLFHGIVARGRFSMPAPSLPHGRHWAPCHSIVAAPLLIAFELLLCIYL
M-QRRRGHTWAGVGKTAQAAAAHAALFCFTLLLALRVDGRTAYSWWIIFSPLWLFHGIVARGRFSMPAPSLPHGRHWAPCHSIVAAPLLIAFELLLCIYL
: 99
: 99
: 99
: 99
: 100
: 99
: 99
: 99
: 99
CS-D :
CS-A :
T.urartu :
barley :
Brachypod. :
rice :
sorghum :
maize_chr1 :
maize_chr5 :
110 120 130 140 150 160 170 180 190 200
ESLRVKNHPAVDMKIVFLPLLTFEVIILVDNFRMCKALMPGDEESMSDEAIWETLPHFWVAISMVFLIAATTFTLLKLSGDVGALGWWDLFINYGIAECF
ESLRVKNHPAVDMKIVFLPLLTFEVIILVDNFRMCKALMPGDEESMSDEAIWETLPHFWVAISMVFLIAATTFTLLKLSGDVGALGWWDLFINYGIAECF
ESLRVKNHPAVDMKIVFLPLLTFEVIILVDNFRMCKALMPGDEESMSDEAIWETLPHFWVAISMVFLIAATTFTLLKLSGDVGALGWWDLFINYGIAECF
ESLRVKNHPAVDMKIVFLPLLTFEVIILVDNFRMCKALMPGDEESMSDEAIWETLPHFWVAISMVFLIAATTFTLLKLSGDVGALGWWDLFINYGIAECF
ESLRVRNHPAVDLKIVFLPLLTFEVIILIDNFRMCKALMPGDEESMSDEAIWETLPHFWVAISMVFLIAATTFTLLKLSGDVGALGWWDLFINYGIAECF
ESLRVKSKPTVDLKIVFLPLLAFEVIILADNFRMCRALMPGDEESMSDEAIWETLPHFWVAISMVFLIAATTFTLLKLSGDVGALGWWDLFINYGIAECF
ESIRVRNHPSVDLKIVFLPLLAFEAIILIDNFRMCRALMPGDEESMSDEAIWETLPHFWVAISMVFLIAATTFTLLKLSGDVGALGWWDLFINYGIAECF
ESIRVRNHPSFDLKIVFLPLLAFEAIILIDNFRMCRALMPGDEESMSDEAIWETLPHFWVAISMVFLIAATTFTLLKLSGDVGALGWWDLFINYGIAECF
ESIRVRNHPSVDLKIVFLPLLAFEAIILIDNFRMCRALMPGDEESMSDEAIWETLPHFWVSISMVFLIAATTFTLLKLSGDVGALGWWDLFINYGIAECF
: 199
: 199
: 199
: 199
: 200
: 199
: 199
: 199
: 199
CS-D :
CS-A :
T.urartu :
barley :
Brachypod. :
rice :
sorghum :
maize_chr1 :
maize_chr5 :
210 220 230 240 250 260 270 280 290 300
AFLVCTRWFNPMIHRPPTHGEASSSSSAIRYRDWESGLVLPSLEDHEQERICGLPDIGGHLMKIPLVVFQVLLCMRLEGTPPSARYIPIFALFSPLFILQ
AFLVCTRWFNPMIHRPPTHGEASSSSSAIRYRDWESGLVLPSLEDHEQERICGLPDIGGHLMKIPLVVFQVLLCMRLEGTPPSARYIPIFALFSPLFILQ
AFLVCTRWFNPMIHRPPTHGEASSSSSAIRYRDWESGLVLPSLEDHEQERICGLPDIGGHLMKIPLVVFQVLLCMRLEGTPPSARYIPIFALFSPLFILQ
AFLVCTTWFNPMIHRPPTHGEASSSSTAIRYRDWESGLVLPSLEDHEQERICGLPDIGGHLMKIPLVVFQVLLCMRLEGTPPSARYIPIFALFSPLFILQ
AFLVCTRWFNPMIHRPPTHGEASSSSTAIRYRDWDSGLVLPSLEDHEQEKLCGLPDIGGHVMKIPLVVFQVLLCMRLEGTPPSARYIPIFALFSPLFILQ
AFLVCTRWFNPMIHKSPNPGEASSSSAAIRYRDWESGLLLPSLEDHEQERLCGLPDIGGHVMKIPLVIFQVLLCMRLEGTPPSAQYIPIFALFSPLFILQ
AFLVCTRWFNPMIHKSPTHGEASSSSAAIRYRDWESGLVLPSLEDHEQERLCGLPDIGGHVMKIPLVAFQVLLCMRLEGTPASARYIPIFALFSPLFILQ
AFLVCTRWFNPMIHKSPTHGEASSSSAAIRYRDWESGLVLPSLEDHEQEKLCGLPDIGGHVMKIPLVAFQVLLCMRLEGTPPSARYIPIFALFSPLFILQ
AFLVCTRWFNPMIHKSPTHGEASSSS-AIRYRDWESGLVLPSLEDHEQERLCGLPDIGGHVMKIPLVAFQVLLCMRLEGTPPSARNIPIFALFSPLFILQ
: 299
: 299
: 299
: 299
: 300
: 299
: 299
: 299
: 298
CS-D :
CS-A :
T.urartu :
barley :
Brachypod. :
rice :
sorghum :
maize_chr1 :
maize_chr5 :
310 320 330 340 350 360 370 380 390 400
GAGVLFSIGRLVEKLVLLLRNGPVSPNYLTVSSKVRDCFAFLHHGSRLLGWWSIDEGSKEEQARLFYTESNGYNTFSGYPPEVVKKMPKKDLAEEVWRLQ
GAGVLFSIGRLVEKVVLLLRNGPVSPNYLTVSSKVRDCFAFLHHGSRLLGWWSIDEGSKEEQARLFYTESNGYNTFSGYPPEVVKKMPKKDLAEEVWRLQ
GAGVLFSIGRLVEKVVLLLRNGPVSPNYLTVSSKVRDCFAFLHHGSRLLGWWSIDEGSKEEQARLFYTESNGYNTFSGYPPEVVKKMPKKDLAEEVWRLQ
GAGVLFSIGRLVEKVVLLLRNGPVSPNYLTVSSKVRDCFAFLHHGSRLLGWWSIDEGSKEEQARLFYTESNGYNTFSGYPPEVVKKMPKKDLAEEVWRLQ
GAGVLFSLARLVEKVVLLLRNGPVSPNYLTASSKVRDCFAFLHHGSRLLGWWSIDEGSKEEQARLFYTEANGYNTFSGYPPEVVRKMPKKDLAEEVWRLQ
GAGVLFSLARLLEKVVLLLRNGPVSPNYLTISSKVRDCFAFLHRGSRLLGWWSIDEGSKEEQARLFYTESTGYNTFCGYPPEVVRKMPKRDLAEEVWRLQ
GAGVLFSLARLVEKVVLLLRNGPVSPNYLTASSKVRDCFAFLHRGSRLLGWWSIDEGSKEEQARLFYTESTGYNTFCGYPPEVVRKMPKKDLAEEVWRLQ
GAGVLFSLARLVEKVVLLLRNGPVSPNYLTASSKVRDCFAFLHHGSRLLGWWSIDEGSKEEQARLFYTESTGYNTFCGYPPEVVRKMPKKDLAEEVWRLQ
GAGAFFSLARLVEKVVLLLRNGPVSPNYLTVSSKVRDCFAFLHHGSRLLGWWSIDEGSKEEQARLFYTESTGYNTFCGYPPEVVRKMPKKDLAEEVWRLQ
: 399
: 399
: 399
: 399
: 400
: 399
: 399
: 399
: 398
CS-D :
CS-A :
T.urartu :
barley :
Brachypod. :
rice :
sorghum :
maize_chr1 :
maize_chr5 :
410 420 430 440 450 460 470
AALGEQSEITKSTQQEYERLQNEKVLCRICYEGEICMVILPCRHRTLCKSCAEKCKRCPICRNPIEERMAVYDV-
AALGEQSEITKSTQQEYERLQNEKVLCRICYEGEICMVILPCRHRTLCKSCAEKCKRCPICRNPIEERMAVYDV-
AALGEQSEITKSTQQEYERLQNEKVLCRICYEGEICMVILPCRHRTLCKSCAEKCKRCPICRNPIEERMAVYDV-
AALGEQSEITKSTQQEYERLQNEKVLCRICYEGEICMVILPCRHRTLCKSCAEKCKRCPICRNPIEERMAVYDV-
AALGEQSEITKSTQQEYERLQNEKVLCRICYEGEICMVLIPCRHRTLCKSCAEKCKRCPICRNPIDERMAVYDV-
AALGEQSEITKCTKQEFERLQNEKVLCRICYEGEICMVLLPCRHRTLCKTCSDKCKKCPICRVPIEERMPVYDV-
AALGEQSEITKCTKQEYERLQNEKVLCRICYEGEICMVLLPCRHRTLCKSCAEKCKKCPICRVPIEERMPVYDV-
AALGEQSEITKCTKQEYERLQNEKVLCRICYEGEICMVLLPCRHRTLCKSCAEKCKKCPICRVPIEERMPVYDV-
AALGEQSEITKCTKQEYERLQNEKVLCRVCYEGEICMVLLPCRHRTLCKSCAEKCKKCPICRVPIEERMPVYDV-
: 473
: 473
: 473
: 473
: 474
: 473
: 473
: 473
: 472
CS-D:CS-A:Tu:Hv:Bd:Os:Sb:
Zm_1:Zm_5:
CS-D:CS-A:Tu:Hv:Bd:Os:Sb:
Zm_1:Zm_5:
CS-D:CS-A:Tu:Hv:Bd:Os:Sb:
Zm_1:Zm_5:
CS-D:CS-A:Tu:Hv:Bd:Os:Sb:
Zm_1:Zm_5:
CS-D:CS-A:Tu:Hv:Bd:Os:Sb:
Zm_1:Zm_5:
C3HC4 (RING) zinc finger type domain
83
The blue line indicates amino acids that encode the C3HC4 (RING) zinc finger type domain
based on an InterProScan (http://www.ebi.ac.uk/Tools/InterProScan/) of the amino acid
sequences. The red arrow at coordinate 315 indicates the lone amino acid substitution
identified among the CS-A, CS-D, and T.urartu sequences. Accessions used for each
orthologue are shown in Appendix IV.
Nucleotide and amino acid sequences of the ZnF orthologues from barley
(HvZnF), Brachypodium (BdZnF), rice (OsZnF), sorghum (SbZnF), maize
chromosome 1 (Zm-1ZnF), and maize chromosome 5 (Zm-1ZnF) were
compared to the CS ZnF-A1, CS ZnF-D1 and T. urartu ZnF-A1 sequences to
determine the level of conservation (Table 3.6). All nine of the ZnF genes
have 14 exons and 13 introns and the nucleotide lengths are in a narrow
range of 1419 to 1425 bp (472 to 474 amino acids). The nine sequences
share 78.0% nucleotide identity and 85.1% amino acid identity. Seven of the
amino acids contained in the C3HC4 (RING) zinc finger domain are not wholly
conserved across the species including three amino acid changes that only
occur in rice (Figure 3.8, coords. 450, 452, and 453). Only the HvZnF amino
acid sequence completely matches the three wheat sequences in the RING
domain. Over the entire ORF, the HvZnF sequence is the most similar to the
T. aestivum sequences, having 97.4% nucleotide identity and 99.3% amino
acid identity when percent identities are averaged across the CS ZnF
sequences. In relation to the wheat ZnF ORF nucleotide sequence, the order
of similarity among the non-wheat species is Hv > Bd > Os = Sb > Zm-1 =
Zm-5 and for the amino acid sequence the similarity to wheat ranking is Hv >
Bd > Sb = Zm-1 > Zm-5 > Os. Phylogenetic analyses of the ZnF sequences
showed a similar ranking of similarity with the HvZnF sequence being closest
to the wheat sequences (Figure 3.9).

84
Figure 3.9. Unrooted neighbor-joining tree of wheat ZnF and Poaceae orthologues.
Nucleotide sequences of the ZnF ORFs were aligned with ClustalX and bootstrap values and
genetic distances determined using the seqboot application and neighbour joining method of
PHYLIP (v3.6). Ta „CS‟ ZnF-A1 and Ta „CS‟ ZnF-D1 are, respectively, the A and D
homoeologues of the ZnF gene identified from the wheat BAC library derived from Chinese
Spring. T. urartu ZnF-A1 is ZnF sequence from a BAC clone. H. vulgare sequence was
assembled from TA38367_4513, TA38365_4513, and TA38366_4513. The remaining
sequences are shown by species name with locus number below. The chromosome carrying
the ZnF orthologue is indicated for maize. Branch lengths indicate relative genetic distance.
Bootstrap values of 100 trees are given at each node if available.
3.3.2.4. Comparative analysis of DUF6 among wheat BACs and Poaceae
The DUF6 genes found upstream of Rht-1 are present on the CS-A, CS-B,
CS-D, and T. urartu (A genome derived) BAC sequences. On all the wheat
BAC inserts, DUF6 is on the plus strand and has 8 exons and 7 introns
(Figure 3.10). The CS-D and „Aibai/10*CS‟ DUF6 intron and exon sequences
are completely identical, so only CS-D is included in the comparative analysis.
H. vulgare
B. distachyonBradi1g11070
S. bicolorSb01g010680
Z. mays chr.1GRMZM2G704032
Z. mays chr.5GRMZM2G024690
O. sativaOs03g49900
Ta 'CS‘ ZnF-A1T. urartu ZnF-A1
Ta 'CS' ZnF-D1
9998
62
100
100
100

85
The gene length (exons + introns) of CS DUF6-B1 is 2382 bp, which is 192 bp
shorter than both DUF6-A1 genes and 181 bp shorter than CS DUF6-D1.
The difference is primarily due to the presence of a 162 bp Thalos MITE in the
first intron of DUF6-A1 and DUF6-D1 that is not present in DUF6-B1. Of the
three CS homoeologues, DUF6-A1 and DUF6-D1 are the most similar having
96.9% nucleotide identity (41 SNPs) and 96.8% amino acid identity (14
substitutions) (Table 3.7). DUF6-B1 and DUF6-A1 have 95.9% nucleotide
identity (42 SNPs and a 12 bp indel) and 95.2% amino acid identity (17
substitutions and a 4 amino acid indel). DUF6-B1 and DUF6-D1 have 96.5%
nucleotide identity (34 SNPs and a 12 bp indel) and 94.8% amino acid identity
(19 substitutions and a 4 amino acid indel). Among the three CS DUF6
homoeologues, 94.7% of the nucleotide identities and 93.6% of the amino
acid identities are conserved (Table 3.7). The most striking polymorphism
between the CS DUF6 ORFs is the 12 bp (4 amino acid) deletion that occurs
in exon 1 of DUF6-B1 (Figure 3.11, coords. 19 to 22), which results in DUF6-
B1 having a reduced gene length (1311 bp; 436 residues) relative to DUF6-A1
or DUF6-D1 (1323bp; 440 residues). The DUF6-A1 genes from CS-A and T.
urartu differ by 6 SNPs (99.5% nucleotide identity), which result in 3 amino
acid substitutions (99.3% amino acid identity).
CS DUF6-D1
CS DUF6-B1
Thalos
Thalos
Thalos
CSDUF6-A1
T. urartuDUF6-A1
2563 bp
2574 bp
2574 bp
2382 bp

86
Figure 3.10. Diagrammatic representation of the wheat DUF6 gene structure and
intronic MITES. The genes (outlined in orange) from T. urartu and the A, B, and D genomes
of Chinese Spring (CS) are in scale to one another with total length shown in basepairs (bp)
at the end of each gene. Filled orange rectangles correspond to the 8 exons and unshaded
regions represent the 7 introns present in each copy. MITES are shown as green arrows
depicting their orientation with names above.
Table 3.7. Nucleotide and amino acid identities shared among Poaceae DUF6
orthologues.
a Percentage of nucleotide and amino acid identities shared between orthologues is shown
below and above the slash, respectively. Background colour of cells in the grid is based on %
identity: red (≥95%); blue (90-94.9%); yellow (85-89.9%); white (≤85%).
b Locus names corresponding to each species. CS = Chinese Spring. The barley sequence
is composed of two non-overlapping ESTs with an estimated gap of 165 bp. The predicted
length of the barley coding sequence and the peptide residue number include the envisaged
165 bp, but these were excluded from identity calculations. Z. mays sequence is from
chromosome 1 of inbred B73.
c Species abbreviations are shown below and to the right of the header. Ta-A, Ta-B and Ta-D
= the A, B, and D genomes of Triticum aestivum, respectively; Tu = Triticum urartu; Hv =
Hordeum vulgare; Bd = Brachypodium distachyon; Os = Oryza sativa; Sb = Sorghum bicolor;
Zm-1 = Zea mays chromosome 1
The wheat BAC DUF6 exon and intron sequences were also compared with
orthologues in barley (HvDUF6), Brachypodium (BdDUF6), rice (OsDUF6),
sorghum (SbDUF6), and maize chromosome 1 (Zm-1DUF6) (Table 3.7).
Unlike Rht-1 and ZnF, no DUF6 orthologue is present on maize chromosome
5. In barley, a consensus of EST sequences was made, but relative to the
other alignments, there was a gap of an estimated 165 bp (approximately
13% of the HvDUF6 sequence) that likely results from the absence of EST
Locus Nameb
Speciesc
Ta -A Ta -B Ta -D Tu Hv Bd Os Sb Zm-1
DUF6-A1 (CS) Ta -A 95.2 96.8 99.3 91.1 85.2 75.4 73.4 73.3
DUF6-B1 (CS) Ta -B 95.9 94.8 94.5 92.3 85.2 75.8 74.4 74.0
DUF6-D1 (CS) Ta -D 96.9 96.5 96.4 92.4 85.5 76.0 74.0 73.9
DUF6-A1 Tu 99.5 95.8 96.7 90.6 84.8 74.7 73.1 73.1
HvDUF6 Hv 92.5 94.0 93.6 92.4 83.8 74.2 73.6 71.9
Bradi1g11080 Bd 87.5 88.0 88.0 87.5 86.3 76.0 73.8 74.6
Os03g49940 Os 77.7 77.9 78.1 77.5 77.2 76.8 74.5 73.4
Sb01g010670 Sb 78.4 78.9 78.8 78.3 78.8 79.0 79.3 85.3
GRMZM2G093849 Zm- 1 77.1 77.8 77.6 77.0 77.6 77.5 78.3 90.2
1323 1311 1323 1323 1308 1320 1365 1326 1344
440 436 440 440 435 439 454 441 447
Nucleotide \ Amino acid identitities (%)a
ORF nucleotides (no.)
Amino Acids (no.)

87
sequence in the databases searched. The missing 165 nucleotides, along
with three other missing nucleotides, (one in exon 2 and two in exon 4) were
designated „N‟ for „unknown nucleotide‟ (IUPAC nomenclature) and the
corresponding 59 ambiguous amino acids were designated „X‟, for „any amino
acid‟ according to IUPAC nomenclature (Figure 3.11, coords. 144-199, 205,
256-257). Regions containing nucleotides designated „N‟ or amino acids
designated „X‟ were not used in identity comparisons that included HvDUF6.
Identity analysis that excluded HvDUF6 showed that nucleotide and amino
acid identities in this region are 4.6 and 7.8 percentage points higher,
respectively, than in the overall sequence. Each of the Poaceae DUF6
orthologues has 8 exons and 7 introns. The coding sequences range from
1308 nucleotides (the estimated number in HvDUF6) to 1365 nucleotides in
OsDUF6 (Table 3.7). The nine Poaceae sequences have 58.4% of the
nucleotides and 56.5% of the amino acid identities in common. Among the
non-wheat orthologues, HvDUF6 is the most similar to the CS wheat DUF6
sequences having 93.4% nucleotide and 91.9% amino acid similarity when
averaged across the barley-CS DUF6 homoeologue comparisons. The
nucleotide similarity ranking of the Poaceae DUF6 orthologues relative to the
CS DUF6 homoeoloci is Hv > Bd > Sb > Os > Zm-1 and the amino acid
ranking is Hv > Bd > Os > Sb > Zm-1. The majority of the residue changes
occur near the 5‟ end of the gene (Figure 3.11, coords. 10-100). In this
divergent region, among all the DUF6 sequences, nucleotide identity is only
30% and residue identity is only 12.1% (11 of 91 amino acids conserved)
relative to the remainder of the sequence in which nucleotide identity is 65.7%
and amino acid identity is 67.4%. A phylogenetic tree of the DUF6
orthologues shows wheat to be most closely related to barley (Figure 3.12).
The phylogenetic tree also indicates that BdDUF6 is the next closest
sequence to wheat and barley.

88
CS-D :
CS-B :
CS-A :
T.urartu :
barley :
Brachypod. :
rice :
sorghum :
maize_chr1 :
10 20 30 40 50 60 70 80
MASSLAPASCALPLHPRVATAAAAAAGPS-CRVLL-AFTAP--RSAASVRRAGILAP--LRCSPLEDPGATGREEGG---
MASSVAPSSCALPLHPRV----AAAAGPS-CRVLL-AFTAP--RSAASVRRAGILAP--LRCSPLEDPGATGREEGR---
MASSVAPASCALPLHPRVATAAAAAAGPS-CRVLL-AFTAP--RSAASVRRAGILAP--LRCSPLEDPGATGRDEGG---
MASSVAPASCALPLHPRVATAAAAAAGPS-CHVLL-AFTAP--RSAASVRRAGILAP--LRCSPLEDPGATGRDEGG---
MASSLAPASCALPLHPR----AAAAAGPS-CRVLLLAVAAP--RSAASVRRAGILAP--VRCSPLEDP---GREEGR---
MASSLASASCALPLHPRVATAAAAAAGPS-CRMLF-AVTPP--RSTASMRRVGILPP--LRCSALEDPG-AGGKEGR---
MASSLASASWVVLPPVQARVAAAVAVGPT-CRVLLAY-TPLLSGSARRRVVGRPLAP--PRCSALEDPGPSDGGEGNGRV
MASSLAPASWVLLL--QTGGAGAAAAGPSSCR-LMLAVAEPRCRWAASPRRARVLVA--PRCAALDWPGGS-GEEEA-KI
MASSLAPASWALPL--QMVGAGAAAAGPS-CRATLAVVTEP--RWAASLRRARVLVALAPRCVALDGPGAS-GEEEAPKI
: 71
: 67
: 71
: 71
: 65
: 70
: 76
: 73
: 74
CS-D :
CS-B :
CS-A :
T.urartu :
barley :
Brachypod. :
rice :
sorghum :
maize_chr1 :
90 100 110 120 130 140 150 160
---------KEKG-GVSKRVHGRPMWRRILFASKKTRSIMILNALTVIYASDIPVLKEVEALTEPAVFNMVRFVIAAIPF
---------KEEG-DASKRVRGRPMWRRILFASKKTRSIMILNALTVIYASDIPVLKEVEALTEPAVFNMVRFVIAAIPF
---------KEKG-GVSKRVRGRPMWRRILFASKKTRSIMILNALTVIYASDIPVLKEVEALTEPAVFNMVRFVIAAIPF
---------KEKG-GVSKRVRGRPMWRRILFASKKTRSIMILNALTVIYASDIPVLKEVEALTEPAVFNMVRFVIAAIPF
---------KEKGRDVGKRVRGRPMWRRILFASKKTRSIMILNALTVIYASDIPVLKEVEALTXXXXXXXXXXXXXXXXX
---------KEKG-DSRKRVRGRPVWRRILFASKKTRSIMILNALTVIYASDIPVLKEVEALTEPAVFNMVRFVVAAIPF
VEEGEEEVVRRKE-QPRRRQRRRPVWRRILFASKKTRSIIILNALTVIYASDIPVLKEVEALTDPAVFNMVRFVVSAIPF
EDE------RKK-----KPARGRPVWRRILFASKKTRSIIILNALTVIYASDIPVLKEVEALTEPAVFNMVRFVVAAIPF
EDE------RKKSGETKKPARGRPVWSRILFASKKTRSIIILNALTVIYASDIPVLKEVEALTEPAVFNMVRFVVAAIPF
: 141
: 137
: 141
: 141
: 136
: 140
: 155
: 142
: 148
CS-D :
CS-B :
CS-A :
T.urartu :
barley :
Brachypod. :
rice :
sorghum :
maize_chr1 :
170 180 190 200 210 220 230 240
IPFVIRAFGDRRTRNGGLELGVWVSLAYLAQAIGLITSEAGRASFIAAFTVIVVPLIDGIFGASIPMLTWFGAIVSVIGV
IPFVIRAFGDRRTRNGGLELGLWVSLAYLAQAIGLITSEAGRASFIAAFTVIVVPLIDGIFGASIPMLTWFGAIVSIIGV
LPFVIRAFGDRRTRNGGLELGVWVSLAYLAQAIGLITSEAGRASFIAAFTVIVVPLIDGIFGASIPMLTWFGAIVSIIGV
LPFVIRAFGDRRTRNGGLELGVWVSLAYLAQAIGLITSEAGRASFIAAFTVIVVPLIDGIFGASIPMLTWFGAIVSIIGV
XXXXXXXXXXXXXXXXXXXXXXXXXXXXXXXXXXXXXXXAGRASXIAAFTVIVVPLIDGFFGASIPMLTWFGAIVSIIGV
LPFVIHSLGDHRIRNGGLELGFWVSLAYLAQAIGLITSDAGRASFITAFTVIVVPLIDGISGSSIPKLTWFGAIVSIIGV
IPFAIRAIGDRHVRNSGLELGLWVSLAYLCQAIGLISSDAGRASFLTAFTVIVVPLIDGIFGATIPKLTWFGAIVSLLGI
VPFAVRAFGDRRVRYAGLELGVWVSLGYLSQAIGLLSSDAGRASFITAITVIVVPLIDGLLGASIPKLTWFGAIMSLFGI
VPFALRSFGDRSVRYAGLELGVWVSLAYLSQAIGLLSSDAGRASFITAFTVVVVPLIDGLLGASIPRLTWFGAIMSLFGI
: 221
: 217
: 221
: 221
: 216
: 220
: 235
: 222
: 228
CS-D :
CS-B :
CS-A :
T.urartu :
barley :
Brachypod. :
rice :
sorghum :
maize_chr1 :
250 260 270 280 290 300 310 320
GLLECGGSPPCVGDVLNFLSAVFFGIHMLRTEQISRSTDKKKFMALLSFEVLVVALTSIIWFLLKDAFVEVHDSSFESWT
GLLECGGSPPCVGDVLNFLSAVFFGIHMLRTEQISRSTDKKKFMALLSFEVLVVAFTSILWFLLKDVFAEVHDSSFESWT
GLLECGGSPPCIGDVLNFLSAVFFGIHMLRTEQISRSTDKKKFMALLSFEVLVVAFTSIVWFLLKDVFAEVHDSSFESLT
GLLECGGSPPCIGDLLNFLSAVFFGIHMLRTEQISRSTDKKKFMALLSFEVLVVAFTSIVWFLLKDVFTEVHDSSFESLT
GLLECGGSPPCVGDVXXFLSAVFFGIHMLRTEQISRSTDKKKFMALLSFEVLVVAFTSILWFLLKDAFVEVQDSGFEAWT
GLLECGGSPPCVGDVLNFFSAVFFGIHMLRTEQISRITDKKKFMALLSFEVLVVAFSSILWFLFKDGFVDVHDSSFESWT
GLLECGGSPPCVGDVLNFLAAVFFGIHMLRTEQISRSTDKKKFLALLSFEVLVVAFSSVLWFLFKDSYVDVNDTSFESWT
GLLECGGSPPCVGDILNFFSAVFFGIHMLRTEQISRSTDKKKFLALLSFEVLVVAFSSVLWCMFKDGYVDTSESSFDSWT
GLLECGGSPPSVGDILNFFSAVFFGIHMLRTEQISRSTDKKKFLALLGFEVLVVAFSSVLWFMFKDGYVDTSGSSFESWT
: 301
: 297
: 301
: 301
: 296
: 300
: 315
: 302
: 308
CS-D :
CS-B :
CS-A :
T.urartu :
barley :
Brachypod. :
rice :
sorghum :
maize_chr1 :
330 340 350 360 370 380 390 400
FGTLWDSAASFPWIPALYTGVFSTGLCMWAEMVAMAHVSATETAIVYGLEPVWGATFAWFLLGERWDNAAWIGAALVLCG
FGALWDSAASFPWIPALYTGVFSTGLCMWAEMVAMAHVSATETAIVYGLEPVWGAAFAWFLLGERWDNAAWIGAALVLCG
FGTLWDSAASFPWIPALYTGVFSTGLCMWAEMVAMAHVSATETAIVYGLEPVWGAAFAWFLLGERWDNAAWIGAALVLCG
FGTLWDSAASFPWIPALYTGVFSTGLCMWAEMVAMAHVSATETAIVYGLEPVWGAAFAWFLLGERWDNAAWIGAALVLCG
FGTLWDSAASFPWIPALYTGVFSTGLCMWAEMVAMAHVSATETAIVYGLEPVWGAGFAWFLLGERWDNAAWIGAALVLCG
FGMLWDSAASFPWIPALYTGVFSTVLCMWAEMVAMTHVSATETAIVYGLEPVWGAALAWFLLGERWDTAAWIGAALVLCG
FGMFLDTATSFPWIPALYTGVFSTVLCMWAEMVAMGDVSATETAIVYGLEPVWGAAFAWFLLGERWDNAAWVGAALVLCG
FGMLWDTAASFPWIPALYTGVLSTVLCMWAELVAMGDVSATETAIVYGLEPVWGAAFAWFLLGERWDNTTCIGAALVLCG
FGMLWDTTVSFPWIPALYTGVLSTVLCMWAEMVAMGDVSATETAVVYGLEPVWGAAFAWFLLGERWDDAAWTGAALVLCG
: 381
: 377
: 381
: 381
: 376
: 380
: 395
: 382
: 388
CS-D :
CS-B :
CS-A :
T.urartu :
barley :
Brachypod. :
rice :
sorghum :
maize_chr1 :
410 420 430 440 450 460
SLTVQLFGSAPEKSQKVESRSGNTFESPLKRQERLSLSAIPVDSRKNIGSQLERKDKTL-
SLTVQLFGSAPEKSQKVESCSGNTFESPLKRQDHLSLSAIPVDSSKNIGSQLERKDKTL-
SLTVQLFGSAPEKSQKVESRSGNTFESPLERQNRLSLSAIPVDSRKNIGSQLERKDKTL-
SLTVQLFGSAPEKSQKVESRSGNTFESPLERQNRLSLSAIPVDSRKNIGSQLERKDKTL-
SLTVQLFGTAPEKSQKVESHSRNTFESPLKRQERLSLSAIPVDSRKNIGSQLERKDKTL-
SLTVQLFGSSPEKSKNVEPSNRNTLDTQLKRQDNFSLSVIPVDSRKNLGSQFERKDKTL-
SLTVQLFGSAPEKSKKVKTRSCNTLETPLKRQDYLSLSAIPVDSRKNIGSRLERKDKTL-
SLTVQLFGSAPKKYKKVKKRSSNALETPVKQQDYLSLSPIPVDSGKFIGRQLERRNKTL-
SLTVQLFGSAPEKSKKVKKRSSNALETPVKRRDYLSLSPIPVDSGKIIGRQLERKNKAV-
: 440
: 436
: 440
: 440
: 435
: 439
: 454
: 441
: 447
CS-D:CS-B:CS-A:Tu:Hv:Bd:Os:Sb:
Zm_1:
CS-D:CS-B:CS-A:Tu:Hv:Bd:Os:Sb:
Zm_1:
CS-D:CS-B:CS-A:Tu:Hv:Bd:Os:Sb:
Zm_1:
CS-D:CS-B:CS-A:Tu:Hv:Bd:Os:Sb:
Zm_1:
CS-D:CS-B:CS-A:Tu:Hv:Bd:Os:Sb:
Zm_1:
CS-D:CS-B:CS-A:Tu:Hv:Bd:Os:Sb:
Zm_1:
DUF6-type domain (II)
DUF6-type domain (I)

89
Figure 3.11. Alignment of predicted amino acid sequences of the CS DUF6
homoeologues and Poaceae orthologues. Amino acid sequences of the three Chinese
Spring wheat homoelogues of DUF6 (CS-A, CS-B, and CS-D), and orthologues in T. urartu
(Tu), Hordeum vulgare (Hv), Brachypodium distachyon (Bd), Oryza sativa (Os), Sorghum
bicolor (Sb) and Zea mays from chromosome 1 (Zm_1) were aligned using ClustalX and
adjusted manually to minimise mismatches. Gaps inserted to allow for alignment are
indicated by a (-), or in the case of undetermined sequence in Hv, by (X). Residue
conservation of the nine sequences is shown by the following shading and font colours:
Absolute sequence identity = white font with black background; Identity shared by 7 to 8
orthologues = white font with dark grey background; Identity shared by 5 to 6 orthologues =
black font with light grey background; Identity shared by 4 or less orthologues = black font
with white background. However, this cannot be accurately assessed for coordinates 144-
199, 205, 256, and 257 because of a lack of sequence information. Coordinates relative to
the start of the ORF are shown above the sequence. The total number of residues per
sequence is shown following the last residue. For Hv, residue number is estimated. The blue
lines represents the amino acids that encode for the two DUF6-type domains (I and II) found
in the gene as identified in an InterProScan (http://www.ebi.ac.uk/Tools/InterProScan/) of the
amino acid sequences. Arrows above the sequences indicate residue differences between
CS-A, CS-B, and CS-D homoeologues, Black dots show residue differences between CS-A
and Tu. Accessions used for each DUF6 orthologue are shown in Appendix IV.
Ta 'CS' DUF6-B1H. vulgare
O. sativaOs03g49940
Z. mays chr.1GRMZM2G093849
S. bicolorSb01g010670
B. distachyonBradi1g11080
T. urartu DUF6-A1
Ta 'CS' DUF6-A1
Ta 'CS' DUF6-D1
62100
100
100
100
98

90
Figure 3.12. Unrooted neighbor-joining tree of wheat DUF6 and Poaceae orthologues.
Nucleotide sequences of the DUF6 ORFs were aligned with ClustalX and bootstrap values
and genetic distances determined using the seqboot application and neighbour joining
method of PHYLIP (v3.6). Ta „CS‟ DUF6-A1, Ta „CS‟ DUF6-B1 and Ta „CS‟ DUF6-D1 are,
respectively, the A, B and D homoeologues of the DUF6 gene identified from the wheat BAC
library derived from Chinese Spring. T. urartu DUF6-A1 sequence is from a BAC clone. The
H. vulgare sequence is composed of two non-overlapping ESTs with an estimated gap of 165
bp, which were excluded when determining the genetic distance of H. vulgare. The
remaining sequences are shown by species name with locus number below. The
chromosome carrying the DUF6 orthologue is indicated for maize. Branch lengths indicate
relative genetic distance. Bootstrap values of 100 trees are given at each node if available.
3.3.3. Predicted genes on the CS wheat BAC sequences
In additon to the ZnF, DUF6, and Rht-1 genes, one predicted gene was
identified that could not be discounted due to homology with TEs. The
predicted gene (a single exon) is located only on the CS-A BAC on the plus
strand near the 3‟ end of a 14 kb stretch of low homology sequence (Figure
3.1b; Appendix IIIA, bp 129602 to 130183). Two nucleotide matches with E
values more significant than 1 × 10⁻¹⁰ were found when the predicted ORF
was queried to the sequence databases. The highest match (E = 5 × 10-26) is
with wheat EST (wEST) CK209908 and the match extends over the full length
of the predicted gene. CK209908 is annotated as a homeobox protein DLX-2
related cluster. Another full-length match (E = 9 × 10-23) is with wEST
CK209889, which is a predicted signal transduction protein containing EAL
and modified HD-GYP domains. No sequence with significant similarity to this
predicted gene was found on any of the other BAC sequences.
3.4. DISCUSSION
Genetic analysis of Rht-1-containing wheat BAC sequences from the A, B,
and D homoeologues of CS revealed a well-conserved gene synteny among
the BAC inserts and little conservation of TEs (Figure 3.1b, c, d). A similar
pattern of conservation was reported for the bread wheat acetyl-CoA
carboxylase (Acc) homoeoloci (Chalupska et al., 2008), the bread wheat

91
Hardness (Ha) homoeoloci (Ragupathy and Cloutier, 2008), and the high
molecular weight glutenin (Glu-1) loci from Triticum durum (A and B genomes)
and Ae tauschii (D genome) (Gu et al., 2004). Combined, the Rht-1-
containing CS BAC sequences were composed of approximately 62.2% TE,
2.2% ORF, and 35.6% unknown sequence (Table 3.1). The percentage of
sequence that encodes genes is similar to previous reports for bread wheat
chromosome 3B (1.2%; Paux et al., 2006) and for Ae. tauschii (2.5%; Li et al.,
2004). Over the three CS BAC sequences, there is an average of 1 gene per
71 kb of sequence, which closely resembles the density of 1 gene per 75 kb
estimated by Devos et al. (2005) in an analysis of four randomly chosen CS
wheat BACs. The percentage of TE sequence on the CS-B BAC (63%) is
lower than was calculated for known TEs on chromosome 3B (76%) by Paux
et al. (2006) while the TE percentage of the CS-D BAC (66%) is similar to that
calculated for Ae. tauschii (68%) by Li et al. (2004).
The CS-A and CS-D genome BAC inserts each contain (from 5‟ to 3‟) a zinc
finger (ZnF) family gene, a domain of unknown function (DUF6) family gene,
and Rht-1 (Figure 3.1b, d). An additional predicted gene also exists on the
CS-A genome, but no known Poaceae orthologues were found in the
databases searched. The CS-B BAC insert contains the DUF6-B1 and Rht-
B1 genes, but the ZnF-B1 homoeologue was not present in the 54 kb of
sequence upstream of DUF6-B1 (Figure 3.1c). In contrast, the ZnF-A1 gene
is only 14 kb upstream of DUF6-A1 and ZnF-D1 gene is only 26 kb upstream
of DUF6-D1 in CS. The proliferation of TEs (most notably the WHAM LTR
retrotransposon) in this region of the B genome relative to intergenic collinear
regions on the A and D genomes appears to have expanded the region
upstream of DUF6-B1, which provides the most likely explanation for the
absence of ZnF-B1 on the BAC insert. As an example of this expansion
between genes, DUF6-D1 and Rht-D1 are separated by 53 kb while the A and
B genome homoeologues of these two genes are only separated by 28 kb
and 21 kb, respectively. Alternatively, it is also possible that synteny breaks
down among the wheat homoeologues and ZnF-B1 is not the next gene
upstream on CS-B. Synteny of the genes in the Rht-1 region is also

92
completely conserved in T. urartu and on the D genome of Aibai/10*CS
(Figure 3.1a, e).
The Rht-1 region is more conserved between the CS-A and T. urartu
genomes than between CS-A and the CS-B or CS-D bread wheat
homoeologues. The CS-A and T. urartu amino acid sequences of Rht-A1
(Figure 3.3) and ZnF-A1 (Figure 3.8) are identical while the DUF6-A1
sequences (Figure 3.11) differ by only 3 residues. Most of the TEs are
conserved between the two wheat A genome BACs (Figure 3.1a, b), which is
in contrast to the lack of conservation amongst A, B, and D genome
homoeologues. Similarly, Glu-1 was more highly conserved between bread
wheat genomes and the corresponding ancestral lines than amongst the three
bread wheat genomes (Gu et al., 2006). These results reflect the closer
relationship of the A genomes with divergence dated to less than 0.5 million
years ago while the A, B, and D genomes of wheat diverged 2-4 million years
ago (Huang et al., 2002; Dvorak and Akhunov, 2005; Chalupska et al., 2008).
To determine if the micro-synteny of genes around Rht-1 is conserved in other
Poaceae species, orthologous regions were identified in Brachypodium, rice,
sorghum, and maize (Figure 3.2). In maize, this region is in duplicate on
chromosomes 1 and 5, and is in single copy in the other species. Gene order
and orientation is conserved in all orthologous regions except on maize chr. 5
where DUF6 is absent, and in rice where an additional gene is present
between DUF6 and Rht-1. The next gene 5‟ of the ZnF gene in all five
orthologous regions is Teosinte Branched 1 (Tb1), which in maize is an
important domestication gene that controls branch number (Doebley et al.,
2004). Downstream of Rht-1, synteny among the Poaceae is not as highly
conserved. Toc64 is the next gene 3‟ of Rht-1 in rice and sorghum while in
Brachypodium, Toc64 is downstream of Rht-1, but proceeded by the
predicted gene Bradi1g11100. The Toc64 protein is a subunit of the pre-
protein translocon of the outer envelope of chloroplasts (Toc complex; Sohrt
and Soll, 2000). In maize, neither Toc64 nor Bradi1g11100 are in the vicinity
of Rht-1 in either orthologous region from chromosome 1 or 5. While synteny
in general is well-conserved near Rht-1 in the Poaceae, gene densities vary

93
widely. The region that includes the ZnF-DUF6-Rht-1 linkage group and the
flanking intergenic sequences leading up to the nearest adjacent genes has a
density of 1 gene / 28 kb in Brachypodium, 1 gene / 34 kb in rice and
sorghum, 1 gene / 59 kb on maize chr.5, and 1 gene / 183 kb on maize chr. 1.
In bread wheat, based on the BAC sequences, the density of this region is
estimated at 1 gene / 55 kb on the A genome, 1 gene / 94 kb on the B
genome, and 1 gene / 105 kb on the D genome; however, the BAC
sequences almost certainly do not include all of the intergenic sequence
adjacent to the ZnF-DUF6-Rht-1 block meaning that the wheat gene densities
are likely to be lower than these estimates. The low gene densities in this
region of wheat and maize relative to Brachypodium, rice, and sorghum are
the result of a higher TE content. TE content of the Rht-1 region is reflective
of the overall genome contents of these species as high TE content in wheat
relative to Brachypodium, rice, and sorghum was previously reported when
analyzing whole genomes (The International Brachypodium Initiative, 2010).
A comparison of the ZnF, DUF6, and Rht-1 genes among the CS wheat and
Poaceae species reveals no large indels, stop codons, or frame-shift
mutations in any of the ORFs and no changes in the number of introns or
exons. For Rht-1, the CS wheat homoeologues share 94.1% of the
nucleotide identities and 96.8% of the amino acid identities. Most nucleotide
differences between any two homoeologues are SNPs, but 30% of the
polymorphisms are indels that translate into 1 to 2 amino residue indels
causing overall peptide lengths among wheat homoeologues to vary from 620
to 623 residues (most clearly depicted in Figure 5.3). The amino acid
sequences of Rht-1 were particularly well conserved in the protein motifs
previously identified by Tian et al. (2004). Of the three Rht-1 homoeologues,
Rht-A1 and Rht-D1 have ORFs slightly more similar to each other than to Rht-
B1, and in the adjoining 10 kb upstream of Rht-1, the differences are very
marked with the A and D genomes having 61% of the sequence defined as
similar whereas less than 26% of the B genome sequence is defined as being
similar to the A or D genomes. Analysis of the flanking 5‟ and 3‟ regions
within 10 kb of Rht-1 also revealed several regions conserved among the Rht-
1 homeologues (Figures 3.5 and 3.6; Tables 3.3 and 3.4) that may represent
94
important regulatory regions in wheat. Three regions within 10 kb of Rht-1
were conserved in the three CS homoeologues, Brachypodium, and rice
(Table 3.5). Among all the Poaceae Rht-1 ORF sequences (wheat included),
amino acid lengths vary from 618 to 630 residues and 68.5% of nucleotide
identities and 70.9% of amino acid residues are shared.
The ZnF nucleotide and amino acid sequences are the most conserved of the
three genes among the Poaceae species. The two available CS orthologues
(ZnF-A1 and ZnF-D1) do not vary in sequence length and share 98.5%
nucleotide identity and 99.8% residue identity (caused by a single amino acid
substitution). Among all ZnF Poaceae sequences, the amino acids lengths
vary by no more than 2 residues (472 to 474 residues) and 78.0% of
nucleotide and 85.1% of amino acid identities are in common. Between any
two orthologues, at least 90.5% amino acid identity is maintained (Table 3.6)
whereas in Rht-1 identities are frequently lower than 90% and as low as
82.4% (Table 3.2). The high level of conservation and the presence of a
C3HC4 zinc finger domain normally associated with modulating protein levels
via the ubiquitination pathway (Lorick et al., 1999) indicate this gene likely
performs a critical function in the Poaceae family.
Of the three genes, DUF6 has the least conserved ORFs among the CS
wheat homoeologues (nucleotides shared = 94.7%; amino acids shared =
93.6%; residue number ranging from 436 to 440) and among the Poaceae
(nucleotides shared = 58.4%; amino acids shared = 54.2%; residue number
ranging from 436 to 454). Similar to Rht-1, the DUF6-A1 and DUF6-D1 ORF
nucleotide and amino acid sequences are the most similar of the three
homoeologues. The most notable differences in DUF6-B1 relative to the A
and D homoeologues are: (1) a 12 bp deletion in the first exon, which reduces
overall protein length from 440 amino acids to 436 amino acids, and (2) the
absence of a 162 bp MITE in intron 1. Conservation of amino acids between
orthologues was in most cases less than 80% and as low as 71.9%. The
least conserved region of DUF6 is in the 5‟ end of the gene (Figure 3.11,
coords. 10 to 100, which are in the first exon).

95
The genetic relatedness of the Poaceae species is similar in the ZnF, DUF6
and Rht-1 ORFs for each of the measures used: nucleotide identity and amino
acid identity (Tables 3.2, 3.6, and 3.7) and phylogeny based on nucleotide
sequence (Figures 3.4, 3.9, and 3.11). In each gene comparison, the ORFs
of the T. urartu and CS A genome sequences are the most similar (99.5% to
99.7% nucleotide identity) and the CS A, B, and D ORF sequences also have
high similarity, but are clearly distinct from each other having nucleotide
identities ranging from 95.9% to 98.5% between any two homoeologues. For
each of the three genes, the barley orthologue is the most closely related to
wheat among the Poaceae followed by Brachypodium. For each gene, the
rankings of relatedness based on the average number of shared nucleotides
averaged across the three CS homoeologues (shown in parenthesis) are:
Rht-1 = Hv (93.5%) > Bd (87.7%) > Os (85.8%) > Zm-5 (84.9%) > Zm-1
(84.7%) > Sb (84.6%); ZnF = Hv (97.4%) > Bd (92.4%) > Sb (88.5%) = Os
(88.5%) > Zm-1 (88.0%) = Zm-5 (88.0%); DUF6 = Hv (93.4%) > Bd (87.8%) >
Sb (78.7%) > Os (77.9%) > Zm-1 (77.5%). In all three locus comparisons, the
wheat nucleotide identities shared with rice, sorghum, or maize never differ by
more than 1.2 percentage points indicating these three species are
approximately equally genetically distant to wheat. The phylogenetic
relationships among the Poaceae Rht-1 (Figure 3.4), ZnF (Figure 3.9), and
DUF6 (Figure 3.12) closely resemble the phylogenetic relationships among
Poaceae depicted by Paterson et al (2009) (Figure 3.13), which is based on
morphological and DNA sequence data from the Angiosperm Phylogeny
Website (v9) (http://www.mobot.org/MOBOT/Research/APweb) (Stevens
2008). Among the Poaceae species with a fully-assembled genome
sequence, the three genes described here are most genetically similar to
Brachypodium. In addition, Brachypodium genes are syntenic with the
Poaceae species examined here and Brachypodium has the highest gene
density. These features indicate that in this genetic region, Brachypodium is
the best model species for wheat among the Poaceae that are fully
sequenced and assembled.

96
Figure 3.13. Phylogenetic relationship between members of the Poaceae family and
two outgroup species. Species used in the text for orthologous comparisons of Rht-1 (Fig.
3.4), ZnF (Fig. 3.9), and DUF6 (Fig. 3.12) are indicated with a red star. Branch lengths of
outgroups have been shortened. Figure adapted from Paterson et al. (2009) using data
originally obtained from (http://www.mobot.org/MOBOT/Research/APweb).

97
4. PHYSICAL AND GENETIC MAPPING OF RHT-A1
4.1. INTRODUCTION
The Rht-B1b and Rht-D1b alleles located on wheat chromosomes 4B and 4D,
respectively, are gibberellin (GA) insensitive. These alleles were utilised in
breeding programmes beginning in the 1960s to produce semi-dwarf wheat
varieties that helped alleviate a major worldwide food shortage (Hedden,
2003). The Rht-B1 and Rht-D1 loci have been mapped (Gale et al., 1975;
Gale and Marshall, 1976; McVittie et al, 1978) and cloned (Peng et al., 1999).
Due to the hexaploid nature of wheat, a third Rht-1 homoeologue on 4A was
long ago postulated to exist (McVittie et al., 1978). Several years later, the
presence of an Rht-1 locus on chromosome 4A in bread wheat was
demonstrated by hybridisation of an Rht-B1a-containing clone (C15-1) in
nullisomic lines (Peng et al., 1999). Recently, an Rht-1 containing clone was
isolated from a T. urartu (the A genome ancestor of bread and pasta wheat)
BAC library (Jizeng Jia, unpublished data). As described in chapter 2, an Rht-
containing clone (0224_M10) was identified in a CS hexaploid wheat BAC
library with sequence similar to, but distinct from Rht-B1 and Rht-D1,
indicating this is likely the Rht-A1 homoeologue. The Rht ORF sequence of
clone 0224_M10 was nearly identical to the T. urartu Rht-1 sequence
(Chapter 3) further indicating that this clone contains Rht-A1.
Loci in wheat can be physically mapped using CS aneuploid lines and CS
deletion lines or genetically mapped relative to genetic markers. Genetic
markers are also useful for physical mapping if these have a known physical
location or are linked to physically mapped markers. A large collection of
wheat genetic maps can be found on the Graingenes website
(http://wheat.pw.usda.gov) and several marker types are available. Of these,
SSR (Simple Sequence Repeat) markers are widely used in wheat because
they are publicly accessible, co-dominant, and often contain a large numbers
of marker variants. For physical mapping, publicly available aneuploid stocks
(described in Sears, 1954) consist of nullisomics (2n - 2; entire chromosome
pair is absent), monosomics (2n -1; a single chromosome is absent), and

98
ditelosomics (either both short or both long arms missing from a chromosome
pair). Deletion lines have terminal deletions of a particular chromosome arm
from one or both chromosomes of a pair (described in Endo and Gill, 1996).
The physical locations of Rht-B1 and Rht-D1 on 4BS and 4DS were
established several decades ago using monosomic analyses (Morris et al.,
1972; Gale et al., 1975; Gale and Marshall, 1976). In addition, several groups
have genetically mapped Rht-B1 and/or Rht-D1 (Borner et al., 1997; Peng et
al., 1999; Ellis et al., 2002; Somers et al., 2004; Quarrie et al., 2005; Draeger
et al., 2007; Cuthbert et al., 2008; Srinivasachary et al., 2008; 2009; Cao et
al., 2009; Raquin et al., 2009). The Rht-B1 locus has been consistently
mapped to a region near the centromere on 4BS. Telocentric F2 mapping
analysis by McVittie et al. (1978) placed Rht-B1b and Rht-B1c (both Rht-B1
alleles) 13 cM from the centromere. Using genetic markers, Borner et al.
(1997) estimated the location of Rht-B1c to be 17 to 22 cM from the
centromere. This estimation was based on linkage to an RFLP previously
mapped by Gale et al. (1995). Ellis et al. (2002), developed diagnostic
markers for Rht-B1b and Rht-D1b and placed Rht-B1b approximately 10 cM
from the centromere based on linked SSR markers. In a consensus map of
SSR markers, Somers et al. (2004) placed Rht-B1 an estimated 11 cM from
the centromere.
Unlike Rht-B1, the position of Rht-D1 relative to the 4D centromere is less
clear. The Rht-D1b (semi-dwarf phenotype) and Rht-D1c (severe dwarf
phenotype) alleles at the Rht-D1 locus have been used in mapping studies.
Rht-D1b was estimated to be 15 cM from the centromere by McVittie et al.
(1978) using telocentric F2 mapping. In contrast, Izumi et al. (1983) found no
linkage between Rht-D1c and the centromere using telocentric mapping.
Borner et al. (1997) found Rht-D1c to be linked by less than 1 cM to an RFLP
(Xpsr 921) that was mapped 45 cM from the centromere by Gale et al. (1995).
Borner et al. (1997) also reported that Rht-D1c and Rht-D1b were 28.0 cM
and 41.1 cM, respectively, distal to the SSR Xgwm165, which maps near the
centromere. Ellis et al. (2002) placed Rht-D1b approximately 30 cM distal of
the centromere. Somers et al (2004) mapped Rht-D1b approximately 18 cM

99
from the centromere and in a subsequent publication (Cao et al., 2009) found
Rht-D1c to map near the Ms2 male sterility gene at approximately 31 cM from
the centromere. These studies indicate that the location of the Rht-D1 locus
relative to the centromere is not precisely known.
Chromosome 4A has a complex rearrangement history, having undergone at
least two reciprocal translocations and three inversions (Figure 4.1). A 4AS-
4AL pericentric inversion that likely occurred in tetraploid wheat (Devos et al.,
1995) resulted in the re-location of the majority of the native short arm of 4A to
the long arm of 4A (Mickelson-Young et al., 1995; Devos et al., 1995; Nelson
et al., 1995). Only a small segment near the telomere of the native 4AS still
appears to be present in the modern 4AS arm (Miftahudin et al., 2004).
Hence, in hexaploid wheats, the majority of loci on 4AS are homologous to
4BL and 4DL. Following this inversion on 4A, a smaller pericentric inversion
near the centromere is thought to have occurred within the initial pericentric
inversion in tetraploid wheat (Miftahudin et al., 2004). Reciprocal
translocations have occurred between 4AL/5AL and 4AL/7BS and a
paracentric inversion has occurred on 4AL (Naranjo et al., 1987; Mickelson-
Young et al., 1995; Devos et al., 1995; Nelson et al., 1995; Miftahudin et al.,
2004). The 4AL/5AL translocation is thought to have occurred in diploid
wheat while the paracentric inversion and the 4AL/7BS translocation is
thought to have occurred in tetraploid wheat (Miftahudin et al., 2004). Major
chromosomal re-arrangements following the delineation of the A, B, and D
genomes of wheat have not been detected on 4D while a pericentric inversion
has been detected on 4B. The 4B pericentric inversion likely involves a short
region near the centromere as evidenced by the map locations of the
genome-generic marker Xwg212 in the proximal 37% of 4BS and in the
proximal 9% of 4DL, whereas markers outside of these boundaries had co-
linear positions on 4B and 4D (Mickelson-Young et al., 1995).
For Rht-A1, the absence of sequence information or of any alleles that alter
phenotype have precluded its identification. However, with the identification
(Chapter 2) and characterisation (Chapter 3) of a third homoeologue of Rht-1,
mapping of this locus is now possible. In this chapter, Rht-A1 is genetically

100
mapped alongside SSR markers and physically mapped with CS aneuploid
and deletion stocks. In addition, the bin map location of Rht-D1 is estimated
using the CS aneuploid and deletion stocks.
Figure 4.1. Rearrangement history of wheat chromosome 4A. Chromosomes segments
native to chromosomes 4AL, 4AS, 5AL, and 7BS are colour-coded based on EST bin-
mapping as shown by Miftahudin et al. (2004). On the left side of the rightmost chromosome,
deletion line breakpoints are indicated by arrows labeled with the name of the breakpoint
followed by the proportion of chromosome arm remaining. On the right side of the rightmost
chromosome, bin-map locations are shown for wheat ESTs. Where greater than ten ESTs
are mapped to a particular segment, the total number is shown with “+” referring to ESTs
mapped to each bin in a segment when more than one deletion breakpoint is present.
4.2. MATERIALS AND METHODS
4.2.1. Plant Materials
Adapted from Miftahudin et al. (2004)

101
Aneuploid and deletion line stocks were all in the CS background. Aneuploid
stocks consisted of the nullisomic-tetrasomic (NT) lines N4AT4D and N4DT4B
and the ditelosomic (Dt) lines Dt4AS (containing two 4AS arms and no 4AL
arms), Dt4AL, Dt4BL, and Dt4DL. These lines were supplied by S.Reader,
JIC. All aneuploid lines received were homozygous except Dt4BL, which due
to the presence of a male sterility gene on 4BS is maintained in the
heteromorphic condition with one complete 4B chromosome and one
chromosome missing 4BS. Deletion stocks used were obtained from the
Wheat Genetics Resource Center (WGRC), Kansas State University, USA
and shown in Figure 4.2. Homozygous deletion stocks on 4BS were not
available due to male sterility.
Figure 4.2. Wheat group IV deletion lines. Chromosomes are oriented with the short arm
at the top and long arm at the bottom. The centromere is designated by a constriction.
Deletion line breakpoints are indicated by arrows with the proportion of arm remaining shown
in parentheses. Black and white rectangles show the C-banding pattern. Figure adapted
from http://www.k-state.edu/wgrc.
4AS-4 (0.63)
4AS-1 (0.20)
4AL-5 (0.66)
4AL-4 (0.80)
4AL-13 (0.59)
4AL-12 (0.43)
4AS-3 (0.76)
4BL-5 (0.86)
4BL-2 (0.47)
4BL-8 (0.78)
4BL-10 (0.95)
4BL-4 (0.55)
4BL-12 (0.41)
4DS-2 (0.82)4DS-3 (0.67)4DS-1 (0.53)
4DL-5 (0.09)
4DL-9 (0.31)4DL-6 (0.38)
4DL-13 (0.56)4DL-11 (0.61)4DL-2 (0.70)
4DL-14 (0.86)

102
The biparental F5 population „Sears Synthetic 7010073 × Paragon‟
(„SS7010073 × Paragon‟) was utilised for the genetic mapping of Rht-A1.
This population was developed by the Department for Environment Food and
Rural Affairs (DEFRA) and funded by the Wheat Genetic Improvement
Network (WGIN). „SS7010073‟ is a synthetic hexaploid of T. dicoccum × Ae.
tauschii created by Ernie Sears, University of Missouri, USA (S. Reader, JIC
pers. comm.). „Paragon‟ is an elite UK spring wheat. Seed of „SS7010073‟
was received from the JIC and seed of „Paragon‟ was received from NIAB.
4.2.2. DNA extraction
Genomic DNA (gDNA) of aneuploid stocks, deletion lines, „SS7010073‟, and
„Paragon‟ was extracted using a modification of the method described by
Fulton et al. (1995) and described as follows. gDNA was extracted from leaf
tissue collected from 2-4 week old seedlings. Leaf tissue was placed in 96-
well deep-well plates along with a steel ball bearing and frozen at -80°C.
Frozen tissue was disrupted by shaking on a SPEX 2000 Geno Grinder ® mill
until tissue was powdery (20 s at 500 strokes per min). A 500 µl quantity of
extraction buffer was added to each sample and tissue disrupted again (20 s,
500 strokes per min). The extraction buffer was made fresh and for a 96-well
plate required 25 ml sorbitol extraction buffer (0.35 M sorbitol; 0.1 M Trizma
base; 5 mM ethylenediaminetetraacetic acid (EDTA)); 25 ml nuclei lysis buffer
(0.2 M Trizma base; 50 mM EDTA; 2 M NaCl; 2% Cetyl trimethylammonium
bromide (CTAB); 10 ml 5% N-lauroylsarcosine sodium salt; 0.2 g sodium
bisulfite; and 840 U RNAse A (Qiagen). Following tissue disruption, samples
were incubated 30-60 min at 65°C. Samples were cooled to room
temperature and 300 µl of 24:1 chloroform:isoamylalcohol added to each
sample. Samples were mixed and centrifuged at 1500 × g for 5 min. The
aqueous phase (approximately 400 µl) was recovered and an equal volume of
ice cold isopropanol was mixed with the sample before centrifuging at 6000 ×
g for 5 min. After tipping off the isopropanol, pellets were washed by adding
500 µl of 70% ethanol, vortexing briefly, and centrifuging at 6000 × g for 5
mins. The ethanol was tipped off and pellets air dried. DNA was eluted in a

103
final volume of 100 µl TE elution buffer (10 mM Tris-Cl, pH 7.5; 1 mM EDTA).
gDNA of „SS7010073 × Paragon‟ was extracted using the DNeasy kit
(Qiagen) and was supplied by M. Leverington-Waite (Crop Genetics, JIC).
DNA from BAC clones was extracted as described in section 2.2.2.3.
4.2.3. PCR amplification
For the physical mapping of Rht-1, gDNA extracts from aneuploid and
deletion lines were used as templates in PCR reactions containing two
primers in which one primer was designed to be genome specific (Table 4.1).
Primers were designed with primer3 software (http://frodo.wi.mit.edu/primer3).
PCR reactions were performed in 10 µl volumes containing 1 × Green GoTaq
Reaction Buffer (Promega), 3% glycerol, 0.2 mM of each dNTP, 2 mM MgCl2,
1 µM forward primer, 1 µM reverse primer, 0.25 µl Taq polymerase, and 20 ng
DNA. The PCR profile consisted of 5 min at 95°C, followed by 40 cycles of
[95°C for 30 s, a primer pair-dependent annealing temperature (shown in
Table 4.1) for 30 s, and 72°C for 1:30 min], and concluded with 72°C for 5
min. Amplified products were separated in a 1.5% agarose gel in 1 × TBE
buffer and visualised under UV light with ethidium bromide.
Table 4.1. Summary of primers used for physical mapping of Rht-1.
a the (*) indicates genome specific primers. Primer sequences are provided in Appendix I.
For mapping Rht-A1, a genetic marker was created based on a 3 bp
nucleotide deletion (TTC) in SS7010073 relative to the intact Paragon allele.
The indel occurs 156 bp upstream of the Rht-1 start codon in CS (Table 5.6,
coord -156; Paragon is haplotype A2 and SS7010073 is haplotype A10) and
Primer
Pair
Genome
Specificity Forward Primera Reverse Primer
Anneal
Temp
Product
(bp)
1 A Rht-A-F2* Rht-ABD-R5 60oC 674
2 A Rht-A-F3* Rht-ABD-R6 64oC 1304
3 A Rht-ABD-F3 Rht-A-R1* 64oC 1236
4 A Rht-ABD-F9 Rht-A-R2* 66oC 1041
5 B Rht-B-F2* Rht-ABD-R5 60oC 694
6 B Rht-B-F1* Rht-ABD-R6 64oC 1105
7 B Rht-ABD-F3 Rht-B-R1* 62oC 1472
8 D Rht-D-F1* Rht-ABD-R6 64oC 1118
9 D Rht-ABD-F3 Rht-D-R1* 60oC 1495

104
reverse primers were designed based on this indel. The reverse primer PS-
Rht-R2 (primer sequences shown in Appendix I) in conjunction with the
genome-specific Rht-A-F3 primer was designed to amplify a 120 bp product in
the Paragon sequence. The reverse primer PS-Rht-R4 in conjunction with the
genome-specific Rht-A-F3 primer was designed to amplify a 120 bp product in
the SS7010073 sequence. Both reverse primers match their target
sequences except for the introduction of a „strong‟ (T/C) penultimate
mismatch that was introduced into each primer according to Ye et al. (2001).
Reaction mixtures and conditions were as described above with an annealing
temperature of 60°C and a 30 s extension time for both primer pair mixes.
4.2.4. SSR linkage mapping
SSR primer sequences were acquired from the Graingenes database
(http://wheat.pw.usda.gov). Forward primers were labeled with the dyes FAM,
VIC, NED, or PET (Applied Biosystems [ABI]) according to Schuelke (2000).
PCR mixes were in 6.25 µl volumes that consisted of 3.125 µl HotstarTaq
Master Mix (Qiagen), 0.75 µM of each primer, and 12.5 ng gDNA. The PCR
profile consisted of 15 min at 95°C, followed by 35 cycles of [95°C for 1 min, a
primer pair-dependent annealing temperature according to Graingenes for
1min, and 72°C for 1 min], and concluded with 72°C for 10 min. Products
were measured on an ABI 3730 DNA Analyzer with a POP-7™ polymer
column. Linkage maps were created using JoinMap® with an LOD score of 5.
SSR marker amplifications and linkage mapping was funded by WGIN and
carried out by C. Baker and M. Leverington-Waite (JIC).
4.3. RESULTS
4.3.1 Physical mapping of Rht-1 loci using aneuploid lines
Prior to determining the physical location of the Rht-1 loci, locus specificity of
each of the nine primer pairs listed in Table 4.1 was tested using DNA
extracted from CS BAC clones 0224-M10, 1417-F16, and 0155-I24, which
contain Rht-A1, Rht-B1, and Rht-D1, respectively (Chapter 2). Reactions

105
were carried out for all primer pair/BAC DNA combinations and each primer
pair amplified a product only from the BAC DNA it was designed to amplify,
thereby validating the specificity of the primers.
To determine Rht-A1 chromosomal location, gDNA of CS and N4AT4D were
used in separate PCR reaction mixes along with an Rht-A1 specific primer
pair. All four Rht-A1 specific primer pairs shown in Table 4.1 amplified the
expected product in gCS, but not in N4AT4D or a water control, implying the
location of Rht-A1 on chromosome 4A. To determine which 4A chromosome
arm contains Rht-A1, gDNA of Dt4AS and Dt4AL were used in PCR reactions
containing primer pair 1. The amplification of the Rht-A1 specific product in
the reaction containing gDNA of Dt4AL and not in the reaction containing
gDNA of Dt4AS indicated that Rht-A1 is located on chromosome 4AL.
Amplification products obtained with the chromosome 4A aneuploid lines
using primer pair 1 are shown in Figure 4.3.
Figure 4.3. Products obtained following PCR amplification of aneuploid and control
lines using Rht-A-F2/Rht-ABD-R5 (primer pair 1). Rht-A-F2/Rht-ABD-R5 was used in PCR
reactions containing either water (reaction 1) or genomic DNA extracted from CS (2),
N4AT4D (3), N4DT4B (4), Dt4AS (5), or Dt4AL (6). Products were separated on an agarose
gel and visualised under UV light with ethidium bromide. M = molecular weight marker
Hyperladder IV (Bioline) with size in basepairs (bp) as indicated.
To further delineate the location of Rht-A1 on 4AL, gDNA extracts of the
chromosome 4A deletion lines shown in Figure 4.2 were used in PCR mixes
containing A-genome specific primer pairs 2, 3, or 4. gDNA of three to five
plants per deletion line was initially assayed with each primer pair. The short
bp
1000
700600500
bp
1000
700600500
1 2 3 4 5 6M M

106
arm deletion lines 4AS-3 (0.76), 4AS-4 (0.63), and 4AS-1 (0.20) produced the
Rht-A1 specific product with all primer pairs (Table 4.2, chromosome arm
4AS). This indicates that Rht-A1 is not between the telomere and breakpoint
0.20 on 4AS, which partially supports the earlier finding that Rht-A1 is not on
4AS. When the long arm deletion lines 4AL-4 (0.80), 4AL-5 (0.66), 4AL-13
(0.59), and 4AL-12 (0.43) were tested for the presence of Rht-A1 with the
same primer pairs, a product was amplified from the 4AL-12, 4AL-5 and 4AL-
4 lines (Table 4.2, 4AL), but not from 4AL-13. These results are seemingly
contradictory because 4AL-12 has a larger deletion than line 4AL-13. To help
determine whether the 4AL results were due to a mislabeling, the four 4AL
deletion lines were ordered a second time from WGRC and gDNA of 2-3
plants per line was assayed with primer pair 1. All plants gave results
consistent with those previously obtained (Table 4.2, 4AL).
Table 4.2. Summary of deletion line PCR amplifications.
a The values represent the proportion of the original chromosome arm remaining.
b Amplification of the Rht-1 product pertaining to a particular chromosome is indicated by a (√)
and absence of a product is marked (x).
Chromosome
Arm
Accession
_Line Deletion
Deletion
Breakpointa Productb
TA4528_3 4AS-3 0.76 √
TA4528_4 4AS-4 0.63 √
TA4528_1 4AS-1 0.20 √
TA4529_12 4AL-12 0.43 √
TA4529_13 4AL-13 0.59 x
TA4529_5 4AL-5 0.66 √
TA4529_4 4AL-4 0.80 √
TA4531_12 4BL-12 0.41 √
TA4531_2 4BL-2 0.47 √
TA4531_4 4BL-4 0.55 √
TA4531_8 4BL-8 0.78 √
TA4531_5 4BL-5 0.86 √
TA4531_10 4BL-10 0.95 √
TA4532_2 4DS-2 0.82 x
TA4532_3 4DS-3 0.67 x
TA4532_1 4DS-1 0.53 x
TA4533_5 4DL-5 0.09 √
TA4533_9 4DL-9 0.31 √
TA4533_6 4DL-6 0.38 √
TA4533_13 4DL-13 0.56 √
TA4533_11 4DL-11 0.61 √
TA4533_2 4DL-2 0.70 √
TA4533_14 4DL-14 0.86 √
4BL
4AS
4AL
4DS
4DL
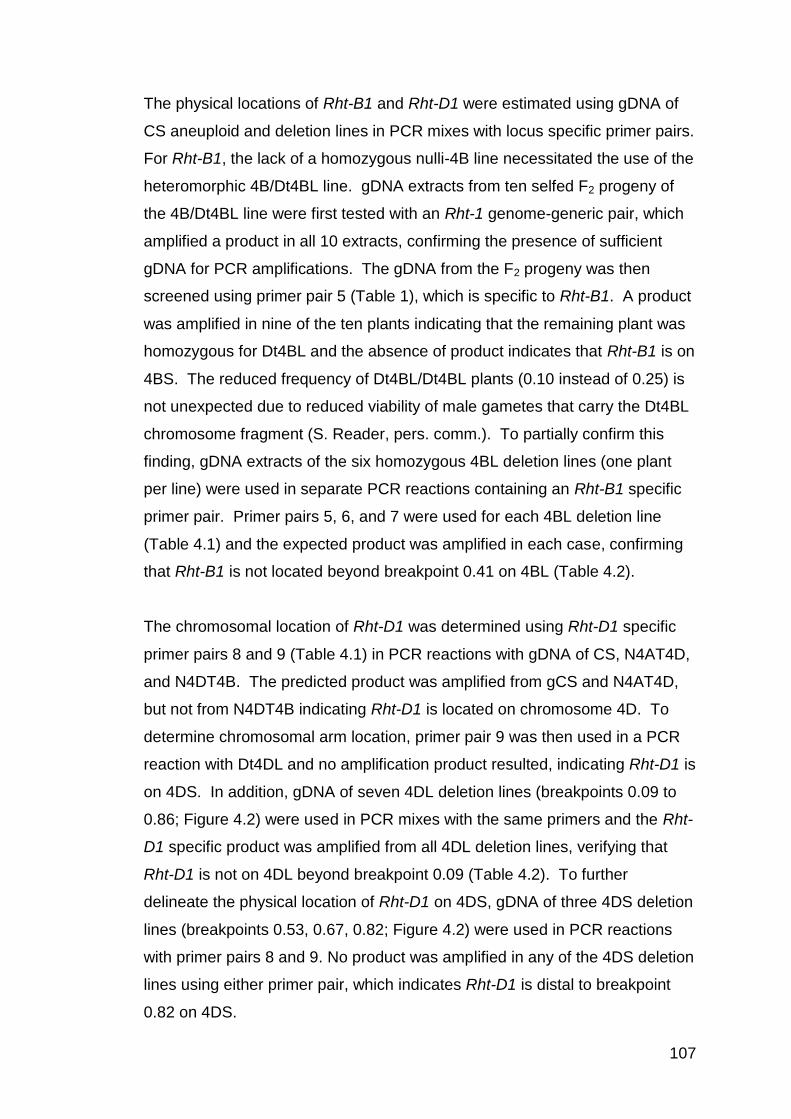
107
The physical locations of Rht-B1 and Rht-D1 were estimated using gDNA of
CS aneuploid and deletion lines in PCR mixes with locus specific primer pairs.
For Rht-B1, the lack of a homozygous nulli-4B line necessitated the use of the
heteromorphic 4B/Dt4BL line. gDNA extracts from ten selfed F2 progeny of
the 4B/Dt4BL line were first tested with an Rht-1 genome-generic pair, which
amplified a product in all 10 extracts, confirming the presence of sufficient
gDNA for PCR amplifications. The gDNA from the F2 progeny was then
screened using primer pair 5 (Table 1), which is specific to Rht-B1. A product
was amplified in nine of the ten plants indicating that the remaining plant was
homozygous for Dt4BL and the absence of product indicates that Rht-B1 is on
4BS. The reduced frequency of Dt4BL/Dt4BL plants (0.10 instead of 0.25) is
not unexpected due to reduced viability of male gametes that carry the Dt4BL
chromosome fragment (S. Reader, pers. comm.). To partially confirm this
finding, gDNA extracts of the six homozygous 4BL deletion lines (one plant
per line) were used in separate PCR reactions containing an Rht-B1 specific
primer pair. Primer pairs 5, 6, and 7 were used for each 4BL deletion line
(Table 4.1) and the expected product was amplified in each case, confirming
that Rht-B1 is not located beyond breakpoint 0.41 on 4BL (Table 4.2).
The chromosomal location of Rht-D1 was determined using Rht-D1 specific
primer pairs 8 and 9 (Table 4.1) in PCR reactions with gDNA of CS, N4AT4D,
and N4DT4B. The predicted product was amplified from gCS and N4AT4D,
but not from N4DT4B indicating Rht-D1 is located on chromosome 4D. To
determine chromosomal arm location, primer pair 9 was then used in a PCR
reaction with Dt4DL and no amplification product resulted, indicating Rht-D1 is
on 4DS. In addition, gDNA of seven 4DL deletion lines (breakpoints 0.09 to
0.86; Figure 4.2) were used in PCR mixes with the same primers and the Rht-
D1 specific product was amplified from all 4DL deletion lines, verifying that
Rht-D1 is not on 4DL beyond breakpoint 0.09 (Table 4.2). To further
delineate the physical location of Rht-D1 on 4DS, gDNA of three 4DS deletion
lines (breakpoints 0.53, 0.67, 0.82; Figure 4.2) were used in PCR reactions
with primer pairs 8 and 9. No product was amplified in any of the 4DS deletion
lines using either primer pair, which indicates Rht-D1 is distal to breakpoint
0.82 on 4DS.

108
4.3.2 Rht-A1 mapping in the ‘SS7010073 × Paragon’ F5 population
To clarify the physical location of Rht-A1 on chromosome 4A and to determine
linked markers, Rht-A1 was mapped in the „SS7010073 × Paragon‟ F5
population. Markers based on DNA polymorphisms present between the
parental lines were designed (see section 4.2.3.) and tested to determine if
the SS7010073 and Paragon Rht-A1 sequences could be distinguished. The
Paragon Rht-A1 specific primer pair Rht-A-F3/PS-Rht-R2 amplified the
expected ~120 bp product using gDNA from Paragon, CS-Dt4BL, and CS-
N4DT4A and did not amplify a product using water or gDNA from SS7010073
or N4AT4B (Figure 4.4), demonstrating specificity for the Paragon Rht-A1
sequence, which is also shared by CS. The SS7010073 Rht-A1 specific Rht-
A-F3/PS-Rht-R4 primers amplified the expected ~120 bp product in reactions
using SS7010073 gDNA as a template and did not amplify a product when
water or gDNA of Paragon or CS-N4AT4D served as templates. These
results confirm that the primer pairs distinguish the Paragon and SS7010073
Rht-A1 sequences and can be used for screening the bi-parental population.
Figure 4.4. Validation of Rht-A1 haplotype-specific primers used to screen the
‘SS7010073 × Paragon’ F5 population. The primer pairs Rht-A-F3/PS-Rht-R2 and Rht-A-
F3/PS-Rht-R4, designed to specifically amplify the Rht-A1 sequences of Paragon and
SS7010073, respectively, were used in PCR reactions containing the following templates:
water (1) or gDNA extracted from Paragon (2), SS7010073 (3), CS-N4AT4D (4) CS-Dt4BL
(5), and CS-N4DT4B (6). Amplification products were run out on a 1% gel stained with
ethidium bromide and visualised under UV light. M = Molecular marker Hyperladder I
(Bioline) with weights shown in basepairs (bp).
1 2 3 4 5 6 1 2 3 4
100
bp
200
500
1000
Rht-A-F3/PS-Rht-R2
M
Rht-A-F3/PS-Rht-R4

109
A total of 288 individuals from the „SS7010073 × Paragon‟ population were
screened by PCR with the Paragon Rht-A1 specific primers and then
separately with SS7010073 Rht-A1 specific primers. Of the 278 individuals
that amplified a product, 139 were homozygous for the Paragon allele, 126
were homozygous for the SS7010073 allele, and 13 were heterozygous
(Table 4.3). The observed chi square value of the segregation classes fits the
expected chi distribution for an F5 population (p =.40) (Table 4.3).
Table 4.3. Summary of the results for Rht-A1 genotyping of the ‘SS7010073 × Paragon’
F5 population
a Expected values based for 278 F5 individuals in Hardy-Weinberg equilibrium.
b Chi distribution p (1.82, 2 df) = 0.40
Due to the absence of pre-existing markers on the „SS7010073 × Paragon‟
population, SSR markers mapped in other bi-parental populations were
selected for screening. A set of 28 SSR markers that spanned chromosome
4A were genotyped in both parents (Table 4.4). For ten of the markers, no
polymorphism existed between the parental lines. Of the 18 polymorphic
markers, 12 markers that were the most easily scored and/or widely spaced
across the chromosome were selected for screening a set of 94 individuals
from the „SS7010073 × Paragon‟ population.
Rht-A1 haplootype Observed ExpectedaChi square
Homozygous Paragon 139 130.3 0.58
Homozygous Synthetic 126 130.3 0.14
Heterozygous 13 17.4 1.10
No Product 10
Sum 288 278.0 1.82b
Individual Plants
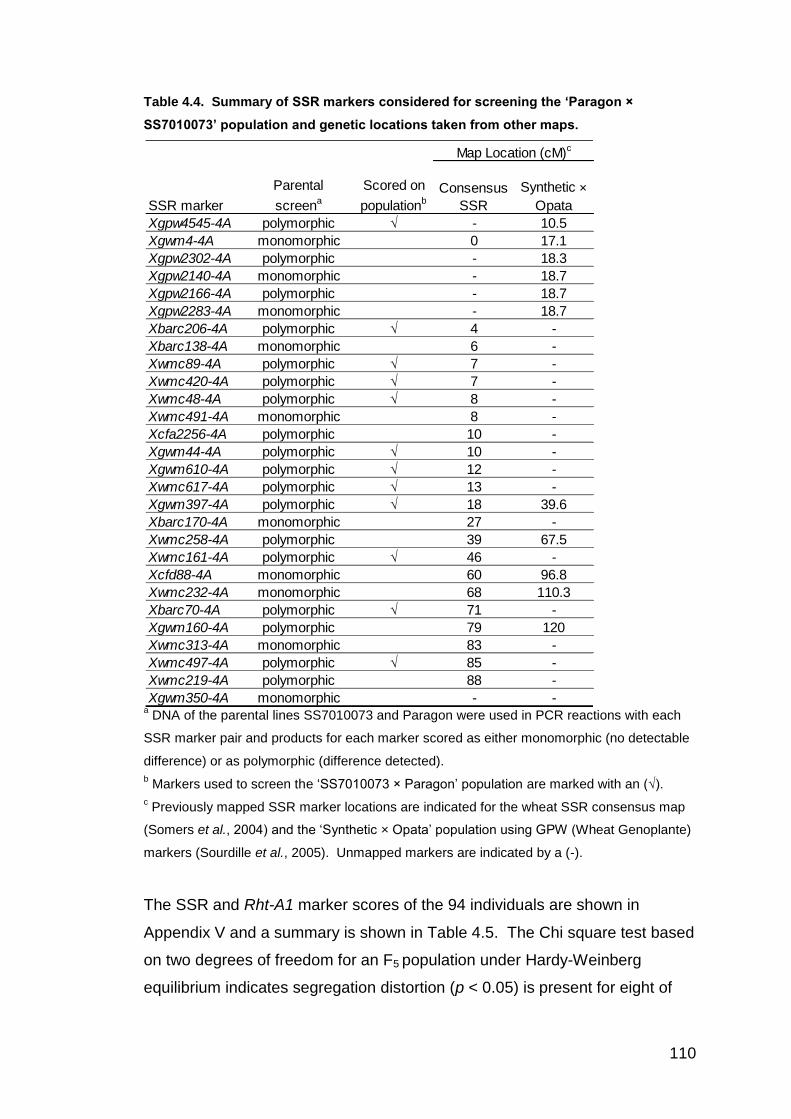
110
Table 4.4. Summary of SSR markers considered for screening the ‘Paragon ×
SS7010073’ population and genetic locations taken from other maps.
a DNA of the parental lines SS7010073 and Paragon were used in PCR reactions with each
SSR marker pair and products for each marker scored as either monomorphic (no detectable
difference) or as polymorphic (difference detected).
b Markers used to screen the „SS7010073 × Paragon‟ population are marked with an (√).
c Previously mapped SSR marker locations are indicated for the wheat SSR consensus map
(Somers et al., 2004) and the „Synthetic × Opata‟ population using GPW (Wheat Genoplante)
markers (Sourdille et al., 2005). Unmapped markers are indicated by a (-).
The SSR and Rht-A1 marker scores of the 94 individuals are shown in
Appendix V and a summary is shown in Table 4.5. The Chi square test based
on two degrees of freedom for an F5 population under Hardy-Weinberg
equilibrium indicates segregation distortion (p < 0.05) is present for eight of
SSR marker
Parental
screena
Scored on
populationb
Consensus
SSR
Synthetic ×
Opata
Xgpw4545-4A polymorphic √ - 10.5
Xgwm4-4A monomorphic 0 17.1
Xgpw2302-4A polymorphic - 18.3
Xgpw2140-4A monomorphic - 18.7
Xgpw2166-4A polymorphic - 18.7
Xgpw2283-4A monomorphic - 18.7
Xbarc206-4A polymorphic √ 4 -
Xbarc138-4A monomorphic 6 -
Xwmc89-4A polymorphic √ 7 -
Xwmc420-4A polymorphic √ 7 -
Xwmc48-4A polymorphic √ 8 -
Xwmc491-4A monomorphic 8 -
Xcfa2256-4A polymorphic 10 -
Xgwm44-4A polymorphic √ 10 -
Xgwm610-4A polymorphic √ 12 -
Xwmc617-4A polymorphic √ 13 -
Xgwm397-4A polymorphic √ 18 39.6
Xbarc170-4A monomorphic 27 -
Xwmc258-4A polymorphic 39 67.5
Xwmc161-4A polymorphic √ 46 -
Xcfd88-4A monomorphic 60 96.8
Xwmc232-4A monomorphic 68 110.3
Xbarc70-4A polymorphic √ 71 -
Xgwm160-4A polymorphic 79 120
Xwmc313-4A monomorphic 83 -
Xwmc497-4A polymorphic √ 85 -
Xwmc219-4A polymorphic 88 -
Xgwm350-4A monomorphic - -
Map Location (cM)c

111
the 12 markers. The segregation distortion in Xwmc161-4A and Xwmc89-4A
is the result of a high number of heterozygotes, 22 and 16, respectively, when
only six each are expected. Five markers have a significantly (p < .05)
disproportionate representation of the homozygous alleles, with three markers
(Xbarc206-4A; Xwmc89-4A; Xbarc70-4A) favouring the Paragon allele and
two markers (Xgwm397-4A; Xwmc161-4A) favouring the SS70100073 allele.
For these five markers the number of unscored amplifications averaged 18,
while the rest of the markers averaged five unscored amplifications.
Table 4.5. Summary of marker scores for 94 individuals from the ‘SS7010073 ×
Paragon’ population.
a Number of individuals classified as Paragon homozygotes (P/P), SS7010073 homozygotes
(S/S), heterozygotes (P/S), or unscored (U) are indicated.
b Chi square test based on two degrees of freedom with probability (p) shown that the
markers are in Hardy-Weinberg equilibrium.
The SSR and Rht-A1 marker data was used to construct a linkage map that
contained eight SSR markers in linkage with Rht-A1 and spanned 49 cM
(Figure 4.5). One marker, Xgwm610-4A was very tightly linked to Rht-A1,
having the same marker score in 90 instances and two instances where a
crossover was detected (Appendix V, Individuals 28 and 49). The markers
Xwmc48-4A and Xgpw4545-4A were also tightly linked, being separated from
Rht-A1 by an estimated 3 and 2 cM, respectively. Markers Xgwm610-4A and
Marker P/P S/S P/S U X2
p
Xbarc206-4A 58 21 3 12 18.7 8E-05*
Xgwm397-4A 23 46 1 24 10.8 0.004*
Xwmc617-4A 41 53 0 0 7.9 0.019*
Xwmc48-4A 47 42 0 5 6.2 0.044*
Xgwm610-4A 47 43 4 0 0.8 0.664
Rht-A1 43 43 6 2 0.0 0.994
Xgpw4545-4A 39 40 6 9 0.1 0.948
Xwmc161-4A 20 43 22 9 62.6 3E-14*
Xwmc89-4A 45 14 16 19 42.8 5E-10*
Xbarc70-4A 52 13 5 24 23.3 9E-06*
Xwmc420-4A 38 38 0 18 5.1 0.079
Xgwm44-4A 37 55 0 2 9.9 0.007*
Xwmc497-4A 50 40 2 2 3.8 0.152
Marker scorea
Chi squareb
112
Xgpw4545-4A did not show statistically significant (p < .05) segregation
distortion while segregation distortion of Xwmc48-4A was significant (p = .04).
Figure 4.5. Linkage map of chromosome 4A in the 'SS7010073 × Paragon' population
aligned to previously mapped SSRs. The „SS7010073 × Paragon‟ linkage map was
constructed using JoinMap® with an LOD score of 5 and is based on 94 individual plants.
Marker names are shown to the right of the linkage group with distance (in centimorgans)
indicated to the left. Previously bin-mapped SSR marker intervals (Sourdille et al., 2004) are
shown by the red rectangles in the ideogram to the left with the centromere designated by a
constriction and deletion line breakpoints indicated by arrows with the proportion of arm
remaining shown in parentheses. Black and white rectangles show the C-banding pattern.
Dotted lines connect identical markers between maps. The linkage group to the right is from
the SSR consensus map (Somers et al., 2004) with the approximate location of the
centromere indicated with a grey rectangle.
The „SS7010073 × Paragon‟ SSR markers have some shared colinearity with
the SSR consensus map (Somers et al., 2004) with the notable exception of
Xwmc89-4A, which is located at nearly opposite ends of the two linkage
groups. The location of Xgwm397-4A relative to the other SSR markers also
Xbarc2060
Xgwm39713
Xwmc61716
Xwmc4819Xgwm61021Rht-A122
Xgpw454524
Xwmc16131
Xwmc8949
SS7010073 x Paragon SSR consensus
Xbarc2064
Xgwm39718
Xwmc61713
Xwmc488
Xwmc16146
Xwmc897
Xgwm61012
4AS-4 (0.63)
4AS-1 (0.20)
4AL-5 (0.66)
4AL-4 (0.80)
4AL-13 (0.59)
4AL-12 (0.43)
4AS-3 (0.76)
Deletion bins
Xbarc206
Xgwm610
Xgwm397

113
differs slightly between the two maps. Three of the SSR markers were
previously mapped to bins using the CS deletion stocks (Sourdille et al.,
2004). In the bin map, these markers are widely separated with Xbarc206-4A
mapped distal to breakpoint 0.76 on 4AS, Xgwm610-4A mapped proximal to
breakpoint 0.20 on 4AS, and Xgwm397-4A mapped between breakpoints 0.59
and 0.66 on 4AL. The order of Xgwm610-4A and Xgwm397-4A is reversed
relative to the „SS7010073 × Paragon‟ linkage group.
4.4. DISCUSSION
The previously unmapped Rht-A1 locus in wheat has been identified and
physically and genetically mapped. Rht-A1 is located on chromosome 4AL
between the centromere and breakpoint 0.66 based on mapping using CS
aneuploid and deletion lines. The location of Rht-A1 on 4AL differs relative to
the homoeologous Rht-B1 and Rht-D1 loci, which are located on the short
arms of 4BS and 4DS. However, this is not surprising due to a pericentric
inversion that resulted in the majority of the native 4AS being transferred to
4AL (Figure 4.1). The region of 4AL containing Rht-A1 could not be further
narrowed using homozygous deletion lines because of the apparently
contradictory result where 4AL-13 (breakpoint 0.59) did not amplify the Rht-
A1-specific product that the shorter 4AL-12 (breakpoint 0.43) did amplify.
This result introduces the possibility that a previously unidentified interstitial
deletion may exist in 4AL-13 between the centromere and 4AL-12, although a
misidentification of seed stock cannot be fully ruled out despite having tested
two separate sources ordered from the WGRC. To determine if stock
misclassification has occurred, genetic markers previously assigned to bins
delineated by the 4AL-13 and 4AL-12 breakpoints could be screened or these
deletion lines could be cytologically screened.
Genetic mapping of Rht-A1 in the „SS7010073 × Paragon‟ population
identified eight linked SSR markers (Figure 4.5), including three (Xwmc48-4A,
Xgwm610-4A, and Xgpw454-4A) within 3 cM or less of Rht-A1. The order
between the seven markers in common between the „SS7010073 × Paragon‟
map and SSR consensus map (Somers et al., 2004) were in general

114
agreement, with the exceptions of Xwmc89-4A, which is considerably more
distal in the „SS7010073 × Paragon‟ map and Xgwm397-4A, which differs
slightly in order. While the „SS7010073 × Paragon‟ SSR markers were in
general agreement with the SSR consensus map, the three markers
(Xbarc206-4A, Xgwm397-4A, and Xgwm610-4A) that were previously bin-
mapped (Sourdille et al., 2004) are assigned to bins that are physically
separated by large distances even though these markers were contained
within 21 cM in the „SS7010073 × Paragon‟ population (Figure 4.5).
Xgwm610-4A, which is separated from Rht-A1 by 1 cM in „SS7010073 ×
Paragon‟, was previously mapped to the 4AS bin located between the
centromere and breakpoint 0.20 (Sourdille et al., 2004). This result seems to
conflict with the 4AL map location of Rht-A1 in „SS7010073 × Paragon‟,
however if Rht-A1 and Xgwm610-4A are close to the centromere, actual
physical distance may be greater due to suppressed recombination
associated with the centromere (Devos et al., 1995; Akhunov et al., 2003)
making it possible that Rht-A1 and Xgwm610-4A are on different chromosome
arms. A close proximity of Rht-A1 and Xgwm610-4A to the centromere and a
4AL location of Xgwm610-4A is also indicated by the SSR consensus map
(Figure 4.5). The previously mapped bin location of Xgwm397-4A (between
breakpoints 0.59 and 0.66 on 4AL) clearly differs from its location in
„SS7010073 × Paragon‟ and the SSR consensus map. If an interstitial
deletion in 4AL-13 exists, this could provide one possible explanation for the
difference in location.
The differences described above between the „SS7010073 × Paragon‟ linkage
group, the SSR consensus map (Somers et al., 2004), and the bin-mapped
SSRs (Sourdille et al., 2004) could also be related to actual genetic
differences between the populations. „SS7010073‟ is a synthetic line with the
A genome derived from the tetraploid T. dicoccum (see section 5.3.4.4).
Paragon is a bread wheat cultivar. The bin-mapping of SSRs by Sourdille et
al. (2004) was performed using deletion lines from the bread wheat cultivar
CS and the SSR consensus map (Somers et al., 2004) is composed of data
from four bi-parental populations, three of which are composed solely of bread
wheat cultivars and the fourth is a cross between a bread wheat („Opata 85‟)

115
and a synthetic wheat containing the T. durum (4x) line „Altar84‟. The timing
of the 4A inversions shown in Figure 4.1 are not known, but are thought to
have occurred during the tetraploid stage of wheat (Devos et al., 1995;
Miftahudin et al., 2004). It is not known whether SS7010073 contains the 4A
inversion and therefore the locations of Rht-A1 and the SSR markers may
differ greatly relative to Paragon. This could provide a possible explanation
for the difference in the mapping positions of Xwmc89-4A and Xgwm610-4A
between „SS7010073 × Paragon‟ and the SSR consensus map or deletion
line bin map location shown in Figure 4.5.
Several SSR markers exhibited significant segregation distortion in the
„SS7010073 × Paragon‟ population, although the two markers most closely
flanking Rht-A1 (Xgwm610-4A and Xgpw454-4A) did not show segregation
distortion (Table 4.5). The pattern of distortion did not consistently favour one
parent over the other and there was no clear distortion pattern associated with
marker location. The large number of unscored PCR amplifications
associated with several of the distorted markers provides a likely explanation
for much of the distortion seen, although segregation distortion of markers on
4AL and 4AS was also previously reported by Quarrie et al. (2005). The high
level of segregation distortion for markers such as Xwmc89-4A also provides
a possible explanation for the loss of colinearity of this or other markers as
described above.
While Rht-B1 and Rht-D1 are both located on the short arms of the respective
chromosomes, the locations within the arms appear to differ. For Rht-B1, the
results from the Dt4BL aneuploid PCR amplification support earlier studies
that showed that this locus is located on 4BS (Morris et al., 1972; Gale et al.,
1975; Gale and Marshall, 1976; McVittie et al., 1978; Izumi et al., 1983).
Mapping to a specific 4BS bin was not attempted because of the lack of
homozygous deletion lines on 4BS. However, previous physical mapping
using telocentric F2 mapping of either Rht-B1b or Rht-B1c has placed this
locus within 13 cM of the centromere (McVittie et al., 1978) and genetic
mapping of this locus indicates this locus is near the centromere (Borner et
al., 1997; Ellis et al., 2002; Somers et al., 2004).

116
For Rht-D1, the physical mapping reported in this chapter places the locus on
4DS between breakpoint 0.82 and the telomere. The distal location agrees
with the telocentric F2 mapping of Rht-D1c by Izumi et al. (1983), who found
no linkage between Rht-D1 and the centromere, but differs from the
telocentric F2 mapping of Rht-D1b by McVittie et al. (1978) who estimated a
15 cM distance between Rht-D1 and the centromere. The differences in
telocentric mapping could result from the mapping of different alleles. Rht-
D1c has stronger GA response than Rht-D1b and this may have aided in
mapping precision as seedling length based on GA sensitivity was used to
score for this locus. In addition, ditelosomic lines may not have breakpoints
that end precisely at the centromere (S. Reader, pers. comm.), which may
affect telocentric mapping and could be misleading when assigning
chromosomal arm location as performed herein. The cause of the apparent
difference in Rht-B1 and Rht-D1 map location is not clear. A pericentric
inversion was reported on 4B near the centromere (Mickelson-Young et al.,
1995). However, the affected region appears to be confined to the proximal
37% of 4BS, which does not provide an explanation for the distal location of
Rht-D1 relative to Rht-B1. Deletion-bin mapping of the Rht-B1 locus would be
a useful step in more precisely determining if the physical locations of Rht-B1
and Rht-D1 actually differ. Genes located near the telomere have higher
recombination rates and increased rates of duplicaton relative to proximal
regions (Akhunov et al., 2003). The distal location of Rht-D1 relative to the
proximal Rht-A1 and Rht-B1 locations would be expected to increase
recombination near this locus.
In summary, the Rht-A1 homoeologue identified in Chapter 2 has been
mapped to chromosome 4AL near the centromere, and SSR markers tightly
linked to Rht-A1 have been identified. The flanking markers represent a
valuable tool for studying Rht-A1 and the nearby genetic regions, and could
be useful in marker assisted breeding. Rht-D1 has been mapped to the distal
arm of 4DS, which suggests the possibility of an additional translocation in the
group 4 chromosomes as Rht-B1 has previously been physically mapped
near the centromere.
117
5. GENETIC DIVERSITY AT THE RHT-1 LOCI IN WHEAT
5.1. INTRODUCTION
In plants, DELLA proteins serve a key biological function by integrating
hormonal and environmental signals that affect overall plant growth (Alvey
and Harberd, 2005; Achard et al., 2006; Alvey and Boulton, 2008) and are
associated with abiotic and biotic stress tolerance (Achard and Genschik,
2009). In wheat, DELLA proteins are encoded by the group IV homoeologous
Rht-1 loci. Two alleles at these loci, Rht-B1b and Rht-D1b are major
adaptative alleles that reduce plant height and were key to the „green
revolution‟ in wheat. Both alleles confer a degree of gibberellic acid
insensitivity (GAI) and were derived from a single cultivar, „Norin 10‟, which is
the primary source of semi-dwarfism in wheat varieties in the Western world
(Gale et al., 1981; Dalrymple, 1986). An estimated 70% of wheat acreage in
developing nations is planted to varieties that carry one of these two alleles
(Evans, 1998). Genetic diversity of the Rht-1 locus and the surrounding
region is of particular concern not only due to the important biological and
adaptative functions of this gene, but also because the Rht-B1b and Rht-D1b
alleles have been associated with susceptibility to a major disease in wheat,
Fusarium Head Blight (FHB) (Hilton et al., 1999; Draeger et al., 2007;
Srinivasachary et al., 2008; Srinivasachary et al., 2009). The recent
introgression of both alleles from a single source would be expected to
substantially decrease genetic diversity at the Rht-B1 and Rht-D1 loci as a
reduction in diversity is characteristic of crop domestication genes and genes
under selection relative to ancestral populations (Doebley et al., 2006; Palaisa
et al., 2003; Wang et al., 1999).
Wheat is an allohexaploid that arose from 8,000 to 10,000 years ago from a
cross between tetraploid wheat (AB genomes) and Ae. tauschii (D genome)
(Levy and Feldman, 2002). T. dicoccum (domesticated emmer) has been
suggested as the possible tetraploid donor (Zohary and Hopf, 2000) and T.
dicoccoides (wild emmer) has been identified as the wild progenitor of
domesticated wheat (Haudry et al., 2007). The A genome ancestral line, T.

118
urartu, is estimated to have diverged from bread wheat approximately 0.5
million years ago (Huang et al., 2002; Dvorak and Akhunov, 2005; Chalupska
et al., 2008). Previous studies have shown a great loss in genetic diversity
between hexaploid wheat and tetraploid wheat (Haudry et al., 2007) and
between hexaploid wheat and Ae. tauschii (Caldwell et al., 2004).
At the wheat group IV Rht-1 loci, the sequences of Rht-B1a (CS background)
and Rht-B1b (N. Harberd, University of Oxford, unpublished data) and Rht-
D1a (CS background) and Rht-D1b (Peng et al., 1999) are available. The
prevalence of Rht-B1b and Rht-D1b alleles in regional collections of bread
wheat accessions has been estimated using the GA sensitivity tests (Worland
1986; Yamada 1990; Chrpova et al., 2003) developed by Gale and Gregory
(1977) and more recently using genetic markers (Zhang et al., 2006; Pestsova
et al., 2008) that were developed by Ellis et al. (2002). Additional GAI alleles
that reduce height at the Rht-B1 and Rht-D1 loci have been identified, but the
sequences are unknown. Outside of the Rht-B1a, Rht-B1b, Rht-D1a, and
Rht-D1b ORF sequences and genotyping of varieties for the presence of
these alleles, little is known regarding the genetic variation in the Rht-1 ORF
and the flanking region in wheat. The absence of this information largely
results from the lack of an available Rht-A1 sequence, which has prevented
the creation of primers needed for locus-specific amplification. The lack of a
complete set of homoeologous sequences is the case for most genes in
wheat, hence comparisons of genetic diversity across the three genomes is
rare. Determining existing genetic variation is an important first step toward
finding useful variation that may affect Rht-1 expression, protein function, and
plant phenotype, which may be key to tackling issues such as FHB
susceptibility.
The isolation and characterisation of wheat BAC clones containing Rht-A1,
Rht-B1, and Rht-D1 along with flanking sequences (Chapters 2 and 3)
enables the development of locus-specific primers to assess natural variation
within the Rht-1 region. The objective for this chapter is to measure
nucleotide diversity and to identify unique polymorphisms and haplotypes
associated with the Rht-1 homoeoloci using three sets of wheat germplasm:
119
„Bread Wheat 1‟ (BW1), composed primarily of bread wheats that are either of
agronomic significance in the UK or are closely related to „Norin 10‟; „Bread
Wheat 2‟ (BW2), a subset of diverse accessions from the INRA worldwide
bread wheat collection (Balfourier et al., 2007); „Tetraploid/ Diploid Wheat‟
(TDW), a small set of tetraploid and diploid wheat accessions. For each
homoeologue, sequence was obtained for the entire Rht-1 ORF along with the
adjoining 1760 bp upstream and 439 bp downstream. These flanking regions
encompass the two most highly conserved non-coding regions shared among
the wheat homoeologues, Brachypodium, and rice that were identified in
Chapter 3. The effect on Rht-1 expression of indels of 160 bp and 197 bp
discovered upstream of Rht-B1 are investigated using quantitative RT-PCR
(qRT-PCR).
5.2. MATERIALS AND METHODS
5.2.1. Sources of accessions used for sequencing the Rht-1 region
Wheat germplasm used for sequencing Rht-1 and the flanking region (Rht-
1+flank) was received from the John Innes Centre (JIC) BBSRC cereals
collection (http://www.jic.ac.uk/GERMPLAS/bbsrc_ce), the USDA-ARS
National Plant Germplasm System (http://www.ars-grin.gov/npgs), the
National Institute for Agricultural Research (INRA, France) worldwide core
collection of bread wheats (INRA BWCC; Balfourier et al., 2007), or the
National Institute of Agricultural Botany (NIAB) Distinct, Uniform, and Stable
(DUS) collection (http://www.niab.com). Rht-1+flank sequences from the A, B,
and D genomes of CS are from BAC clones 0224-M10, 1417-F16, and 0155-
I24, respectively (Chapter 2). The sequence of T. urartu was received from
Jizeng Jia (Chinese Academy of Agricultural Sciences (CAAS), P.R. China),
and was derived from a BAC clone (described in Chapter 3). Details of
germplasm sources are shown in Table 5.1.

120
Table 5.1. Sequenced accessions and haplotypes
Seta
Source and
Reference No. Name
Geog.
Origin
Growth
Habit
Reg.
Year Type Haplotypec
BW1 CS BAC library Chinese Spring CHN S na L A1 B1 D1BW1 JIC_W748 Fultz USA W 1871 F A2 B2 D2
BW1 JIC_W814 Gaines USA W 1961 F A2 B3 D3
BW1 JIC_W741 Kanred USA W 1917 F A2 B4 D1
BW1 JIC_W7208 Krasnodari 1 RUS W na F A2 B5 D1
BW1 USDA_PI156641 Norin 10 JPN W 1935 F A2 B6 D3
BW1 USDA_CItr13253 Norin 10/Brevor-14 USA W 1949 F A2 B6 D3
BW1 JIC_W614 Siete Cerros MEX S 1966 F A4 B6 D2
BW1 JIC_W613 Sonora 64 MEX S 1964 F A3 B7 D3
BW1(UK) NIAB DUS Alchemy GBR W 2005 F A2 B8 D3BW1(UK) JIC_W2 April Bearded GBR S na L A2 B9 D4
BW1(UK) NIAB DUS Avalon GBR W 1979 F A2 B9 D3
BW1(UK) NIAB DUS Cadenza GBR S 1992 F A2 B3 D1
BW1(UK) NIAB DUS Cappelle Desprez FRA W 1946 F A2 B10 D4
BW1(UK) NIAB DUS Hobbit 'Sib' GBR W 1975 F A2 B10 D3
BW1(UK) JIC Mercia GBR W 1984 F A2 B9 D4
BW1(UK) NIAB DUS Paragon GBR S 1998 F A2 B11 D4
BW1(UK) NIAB DUS Robigus GBR W 2003 F A2 B6 D2
BW1(UK) NIAB DUS Soissons FRA W 1987 F A2 B6 D5
BW1(UK) JIC_W8551 Squarehead's Master GBR W 1911 F A2 B3 D1
BW1(UK) NIAB DUS Xi19 GBR W 2002 F A2 B3 D3
BW2 INRA_00537 CH62022 CHE W na F A2
BW2 INRA_00748 A.4 AFG W na F A5
BW2 INRA_00822 Aifeng-4 CHN W 1971 F A2
BW2 INRA_00957 Arawa NZL W 1955 F B10
BW2 INRA_01192 Balkan YUG W 1979 F D1
BW2 INRA_01697 Bung Epi Blanc NPL W na L D1
BW2 INRA_01974 CF4563-1-5-3-2-5 FRA W na F A2
BW2 INRA_02411 Daeraad ZAF S 1958 F A6
BW2 INRA_03170 Fronthatch USA S 1963 F B1
BW2 INRA_03220 G72300 GRC S na F D2
BW2 INRA_03485 H93-70 ESP W na F A2
BW2 INRA_03942 JO3045 FIN S na F D1
BW2 INRA_03970 Jufy II BEL S 1954 F B9
BW2 INRA_04645 Mars de Suede Rouge Barbu FRA S 1922 F D1
BW2 INRA_04796 Miche FRA W 1954 F A2
BW2 INRA_04901 Mocho de Espiga Bianca PRT S 1928 F A2
BW2 INRA_05096 N67M2 ISR S na F D3
BW2 INRA_05260 Norin 60 JPN S 1965 F A2
BW2 INRA_05816 Precoce a Barbe Blanche PRT S 1955 F A2
BW2 INRA_06047 Redman CAN S 1946 F D1
BW2 INRA_06318 Rouge de Marchissy FRA W 1929 F B1
BW2 INRA_06396 S975-A4-A1 ZWE S na F D1
BW2 INRA_06740 Strubes Dickkopf DEU W 1880 F A2
BW2 INRA_07040 Tremesino Meira ESP W na L B13
BW2 INRA_08194 Neelkant SYR W 1980 F D2BW2 INRA_08287 DC147U FRA W na F D3
BW2 INRA_09077 Non Plus Extra AUT W 1919 F B9
BW2 INRA_13310 Fruh Weizen DEU W na F B11
BW2 INRA_13436 Fondard Crespin FRA W 1948 F D1
BW2 INRA_13445 Volt FRA W 1994 F D1
BW2 INRA_13471 Ornicar FRA W 1998 F A7
BW2 INRA_13812 W7984 (Synthetic) MEX S na F A6 B6 D6BW2 INRA_13861 Auguste FRA W 1998 F B10
Accessionsb

121
Table 5.1 (continued). Sequenced accessions and haplotypes
a Set: These are as described in section 5.2.2. BW1 = Bread Wheat 1; BW1 (UK) denotes
BW1 varieties with agronomic significance in the United Kingdom. BW2 = Bread Wheat 2;
TDW = Tetraploid/ Diploid Wheats. The Rht-D1 sequence of INRA_13812 was included as
part of the BW2 and TDW sets. All BW1 and BW2 accessions are natural hexaploids except:
INRA_13812 (synthetic of T. durum × Ae. tauschii) and INRA_03485 (T. turgidum/Ae.
ventricosa//T. aestivum altarnense).
b T. urartu sequence was received from J. Jia (CAAS). JIC = John Innes Centre; INRA =
French National Institute for Agricultural Research; NIAB DUS = NIAB Distinct, Uniform, and
Stable germplasm collection; USDA = US Dept. of Agriculture; Geographical (Geog.) origin is
shown using three-letter nation abbreviations; na = not available; unk = unknown; Reg. Year
= Year of Registration; S = spring; W = winter; I = indeterminate; L= landrace; F = fixed
c Haplotypes were determined for the A (A1-A13), B (B1-B16), and/or D (D1-D8) genome of
each accession based on Rht-1+flank sequence. Polymorphisms associated with each
haplotype are shown in Tables 5.6 (Rht-A1+flank), 5.7 (Rht-B1+flank), and 5.8 (Rht-
D1+flank).
CS and CS wheat group IV nullisomic-tetrasomic (NT) lines N4AT4B,
N4AT4D, and N4DT4B and the CS group IV ditelosomic line Dt4BL, were
supplied by S. Reader, JIC, Norwich, UK (these lines were described in
section 4.2.1). DNA of CS and CS aneuploid lines were used to validate
locus specific primers. CS was also used as a phenotypic and genotypic
control and to verify BAC sequence.
SetaSource and
Reference No. Name
Geog.
Origin
Growth
Habit
Reg.
Year Type Haplotypec
BW2 INRA_15950 AS68VM4-3-2/TJB636 13 FRA W na F D3
BW2 INRA_23891 landrace ARM S na L B1
BW2 INRA_23896 landrace TUR S na L D7
BW2 INRA_23909 landrace MAR S na L A8
BW2 INRA_23964 Thori 212-Var.8/1 PAK S 1934 F A9
BW2 INRA_23989 landrace GEO S 1931 L D1
BW2 INRA_23995 landrace RUS S 1950 L B12
BW2 INRA_23996 Guisuiskaya Syao-Bai-Mai CHN S 1953 F A2 B1
BW2 INRA_24056 landrace TUR I na L B1
BW2 INRA_24180 Palestinskaya PAL S 1927 F B1
BW2 INRA_24184 landrace PAL S 1927 L B1
BW2 INRA_24185 landrace TKM S na L B1
TDW INRA_13812 W7984 (Synthetic) MEX S na F D6TDW JIC_7010073 SS7010073 (Synthetic) na W na F A10 B14 D8
TDW USDA_PI428054 T. dicoccoides 57 TUR W na L A11 B15
TDW USDA_PI428097 T. dicoccoides 65 ISR W/S na L A12 B16
TDW BAC clone T. urartu unk unk na L A13
Accessionsb

122
5.2.2. Diversity sets
5.2.2.1. Bread Wheat 1 (BW1) set: Accessions and experimental design
BW1 is composed of 21 natural hexaploid wheat varieties from a mixture of
backgrounds in which all three Rht-1+flank homoeologous regions were
sequenced in each accession (Table 5.1, BW1 set). The BW1 accessions
include a „UK‟ subset of 12 varieties that either originated, or have been
widely grown, in the UK in the last 100 years (Table 5.1, BW1(UK) set); a
„Norin 10‟-related subset of seven varieties associated with the origin or early
spread of the „Norin 10‟-derived Rht-B1b and Rht-D1b alleles; one variety
containing the Rht-B1e semi-dwarf allele (Krasnodari 1); and CS. Seeds of
each BW1 variety were stratified for three days at 4°C on wetted filter paper
and then transferred to room temperature for one week. Following
vernalisation (6 weeks at 4°C) seedlings were transferred to 1-litre pots and
placed in the JIC glasshouse (supplementary lighting, 16 h daylength, 22°C
day / 15°C night) beginning Nov. 10, 2008. Plants were visually assessed
throughout the growth phase and off-types discarded. At maturity, plant
height was measured as the distance from the soil surface to the tip of the
longest tiller, excluding awns. DNA was extracted from individual seedlings
as described in section 4.2.2 and individual plants were genotyped for the
Rht-B1a/b and Rht-D1a/b alleles (section 5.2.3). DNA of one to four plants
from each accession was bulked and used to amplify PCR products used in
sequencing.
5.2.2.2. Bread Wheat 2 (BW2) set: Accessions and experimental design
Accessions that composed the BW2 set were selected by examining
chromosome 4 DArT and SSR marker scores received from F. Balfourier,
combined with PCR analysis to detect the presence/absence of Rht-B1b and
Rht-D1b and the presence/absence of the Rht-B1 indels identified in this
Chapter. In an effort to maximise the number of Rht-A1+flank haplotypes
selected, the sixteen accessions chosen for sequencing of this region
contained the greatest combined number of chromosome 4A alleles, which

123
was determined using the line selection feature, simulated annealing method
(N = 1000) of Powermarker v2.5 (Liu and Muse, 2005). This procedure was
also used to choose accessions for sequencing of the Rht-B1+flank and Rht-
D1+flank regions using markers from 4B and 4D, respectively. Two
accessions that are part of the INRA BWCC, Cadenza and CS, were already
sequenced in the BW1 set, so to maximise the likelihood of finding new
haplotypes, alleles associated with these two lines were excluded from the
selection criterion. For 4B and 4D, markers appearing to be linked to Rht-1
were given priority over apparently unlinked markers. Unlike the BW1 set in
which Rht-1+flank sequences of the A, B, and D genomes of each accession
were sequenced, in the BW2 set only a single Rht-1+flank region from each
accession was sequenced with the exceptions of INRA_23996 (Rht-A1+flank
and Rht-B1+flank) and INRA_13812 (Rht-A1+flank, Rht-B1+flank, and Rht-
D1+flank) (Table 5.1, BW2 set). The BW2 accessions are natural hexaploids
with the following exceptions: (1) INRA_13812, which is the synthetic line
„W7984‟ composed of T. durum (AABB genomes) „Altar 84‟ and Ae. tauschii
(DD) and (2) INRA_03485 (A genome sequenced), which is a cross between
T. turgidum (AABB) / Ae. ventricosa (DDNN) and T. aestivum. The BW2 set
was grown in pots in an outdoor experiment at NIAB along with the remainder
of the INRA BWCC set to collect plant height (distance from the soil surface to
the tip of the longest tiller, excluding awns) data (described in section 6.2.3).
For GA sensitivity data, the BW2 set was grown in the JIC glasshouse along
with the rest of the INRA BWCC set (described in section 6.2.4). DNA was
extracted as described in section 4.2.2 from both replicates of the INRA
BWCC outdoor experiment and both replicates were genotyped for Rht-B1a/b
and Rht-D1a/b (section 5.2.3) and for the Rht-B1 promoter insertions (section
6.2.2). One DNA replicate was used for sequencing with forward primers and
the other for reverse primers to provide 2× coverage.
5.2.2.3. Tetraploid/Diploid Wheat (TDW) set: Accessions and
experimental design
To gauge Rht-1 diversity in a wider pool of germplasm, Rht-1+flank regions
that originated in tetraploid or diploid wheat accessions were sequenced. The

124
TDW set consisted of nine accessions used for Rht-1+flank region
sequencing (in total, four A genome, three B genome, and two D genome Rht-
1+flank sequences) (Table 5.1, TDW set). The Rht-1+flank region of all
genomes was sequenced in the following lines: T. urartu (A genome), T.
dicoccoides 57 (A and B genomes), T. dicoccoides 65 (A and B genomes),
and SS7010073 (A, B, and D genomes) (Table 5.1, TDW). Ernie Sears,
University of Missouri (Columbia, Missouri, USA) created SS7010073 from a
cross between a T. dicoccum and an Ae. tauschii accession. It is thought that
the T. dicoccum accession used in SS7010073 corresponds to „JIC 1070026‟
and that the Ae. tauschii accession corresponds to „JIC 2220053‟ (S. Reader,
JIC, pers. comm.). The second Rht-D1+flank sequence used as part of the
TDW set is from the synthetic INRA_13812, which was also part of the BW2
set. The D genome of this line is from Ae. tauschii. SS7010073 and the two
T. dicoccoides lines were grown alongside the BW1 set. Plant phenotyping,
DNA extraction, and genotyping was performed as described for the BW1 set
(section 5.2.2.1).
5.2.3. Rht-B1a/Rht-B1b and Rht-D1a/Rht-D1b PCR assays
Accessions were genotyped for Rht-B1a/Rht-B1b and Rht-D1a/Rht-D1b
alleles using four separate assays (Table 5.2). Each assay utilised a forward
primer that was locus-specific and a reverse primer designed to be specific to
the semi-dwarf causative SNP. The location of the 3‟ end of the reverse
primers was the same as described by Ellis et al. (2002). For each reverse
primer, a mismatch was introduced at the 3rd nucleotide from the 3‟ end
according to Ye et al. (2001). PCR reactions were performed in 10 µl
volumes containing 1 × Green GoTaq Reaction Buffer (Promega), 3%
glycerol, 0.2 mM of each dNTP, 2 mM MgCl2, 1 µM forward primer, 1 µM
reverse primer, 0.25 µl Taq polymerase, and 20 ng DNA. The PCR profiles
consisted of an initial denaturation of 5 min at 95°C, followed by 40 cycles of
[95°C for 30 s, 60°C for 30 s, and 72°C for 30 s], and concluded with 72°C for
5 min. Amplification products were separated on a 1.5% agarose gel in 1 ×
TBE buffer and visualised under UV light with ethidium bromide.

125
Table 5.2. PCR primers used to identify Rht-B1a/B1b and Rht-D1a/D1b
a Primer sequences are shown in Appendix 1.
b The product sizes expected for plants containing the specified Rht-1 allele. NP = no product
5.2.4. PCR amplification and sequencing of Rht-1 and the flanking region
Locus-specific primers were designed to amplify products of sufficient length
for sequencing of the Rht-1 ORF and at least 1760 bp upstream and 439 bp
downstream sequence in each genome. Primers were designed using
primer3 software (http://frodo.wi.mit.edu/primer3). Primer pairs for amplifying
PCR products are shown in Table 5.3 along with expected product sizes and
coordinates. PCR products were designed to overlap each other by a
minimum of 85 bp. Reaction mixtures, PCR profiles, and gel electrophoreses
were as described in section 5.2.3 except annealing temperature and
extension times are as shown in Table 5.3.
PCR products were purified (primers and dNTPs removed) in 10 µl reaction
mixes that contained 1 × Exonuclease I buffer, 0.75 U Exonuclease I (NEB
Biolabs), 0.25 U shrimp alkaline phosphatase (Promega), and 7.5 µl of PCR
product by incubating at 37°C for 30 min before heating to 80°C for 15 min to
deactivate enzymes. Sequencing reactions were performed in 10 µl Big Dye
(Applied Biosystems (ABI) sequencing mixes that contained 1 × BigDye
Sequence Buffer, 1 µl BigDye (ver. 3.1), 5% dimethyl sulfoxide (DMSO), 1 µM
primer, and 2 µl purified PCR product. Sequencing primers and PCR
products used in the reactions are shown in Table 5.3. PCR profiles
consisted of 98°C for 1 min, followed by 25 cycles of 98°C for 10 s, 50°C for 5
s, and 60°C for 4 min. The DMSO and high denaturation temperature (98°C
instead of 96°C) were used to facilitate sequencing of the G-C rich Rht-1 PCR
products.
Assay Forward Reverse Rht-B1a Rht-B1b Rht-D1a Rht-D1b
Rht-B1a Rht-B-F1 Rht-B1a-R2 265 NP NP NP
Rht-B1b Rht-B-F1 Rht-B1b-R2 NP 265 NP NP
Rht-D1a Rht-D-F5 Rht-D1a-R2 NP NP 385 NP
Rht-D1b Rht-D-F5 Rht-D1b-R2 NP NP NP 385
Primer namea Expected product size (bp)b

126
Table 5.3 Primers used for Rht-1 locus specific amplification and sequencing
a Primer sequences are shown in Appendix 1.
b Annealing temperature in °C.
c Extension time in minutes:seconds.
d Product coordinates refer to nucleotide number relative to the start codon of Rht-1 of
'Chinese Spring' (CS) in the respective genome with negative numbers indicating 5‟
sequence.
e Expected product size in basepairs (bp) relative to CS.
Genome
F/R
primersa
Ann.
temp.b
Ext.
timec
Product
coordinatesd
Exp. prod.
size (bp)e Forward Reverse
Rht-A-F4 Rht-ABD-R10
Rht-F04 Rht-R04
Rht-A-F5 /
Rht-R0163 00:45 -1088 to -386 702
Rht-A-F5 Rht-R01
Rht-A-F2 /
Rht-ABD-R560 00:45 -593 to 81 674
Rht-A-F2 Rht-ABD-R5
Rht-ABD-F4 Rht-ABD-R9
Rht-ABD-F8 Rht-ABD-R1b
Rht-ABD-F6 Rht-ABD-R6
Rht-ABD-F2
Rht-ABD-F3 Rht-ABD-R7
Rht-ABD-F7 Rht-ABD-R8
Rht-ABD-F9 /
Rht-A-R266 01:15 1783 to 2824 1041
Rht-ABD-F9 Rht-A-R3
Rht-B-F4 Rht-R02
Rht-F01 Rht-R03
Rht-ABD-R10
Rht-B-F5 Rht-R05
Rht-F06 Rht-B-R3
Rht-F03 /
Rht-ABD-R560 00:45 -449 to 84 533
Rht-F03 Rht-ABD-R5
Rht-ABD-F4 Rht-ABD-R9
Rht-ABD-F8 Rht-ABD-R1b
Rht-ABD-F6 Rht-ABD-R6
Rht-ABD-F2
Rht-ABD-F3 Rht-ABD-R7
Rht-ABD-F7 Rht-ABD-R8
Rht-ABD-F9 Rht-B-R1
Rht-D-F3 Rht-R04
Rht-F04 Rht-R08
Rht-F07 Rht-R05
Rht-D-F2 Rht-R01
Rht-ABD-R5
Rht-ABD-F4 Rht-ABD-R9
Rht-ABD-F1 Rht-ABD-R1b
Rht-ABD-F2 Rht-ABD-R6
Rht-ABD-F3 Rht-ABD-R7
Rht-ABD-F7 Rht-ABD-R8
Rht-ABD-F9 Rht-D-R1
Sequencing primersDNA amplification
Rht-A-F4 /
Rht-ABD-R1063 01:00 -1823 to -943 880
Rht-A-F3 /
Rht-ABD-R664
A
Rht-ABD-F3 /
Rht-A-R1 64 01:15 921 to 2157 1236
01:30 -261 to 1043 1304
Rht-B-F4 /
Rht-ABD-R1060 01:30 -1888 to -648 1240
1105
Rht-B-F5 /
Rht-B-R360 01:15 -986 to -177 809
Rht-ABD-F3 /
Rht-B-R1 62 01:30 925 to 2397
Rht-B-F1 /
Rht-ABD-R664 01:15 -58 to 1047
01:00 -1919 to -1049 870
Rht-D-F6 /
Rht-ABD-R564 01:30 -1162 to 84
B
D
1246
Rht-D-F1 /
Rht-ABD-R664 01:15 -70 to 1048 1118
Rht-ABD-F3 /
Rht-D-R1 60 01:30 927 to 2422 1495
1472
Rht-D-F3 /
Rht-R0863
127
Sequenced products were precipitated in microtitre plates using the BigDye
v3.1 Cycle Sequencing Kit ethanol/EDTA/sodium acetate method. Using this
method, 1 µl of 125 mM EDTA, 1 µl of 3 M sodium acetate, and 50 µl of 100%
ethanol were added to 10 µl of sequenced product before mixing and
centrifuging at 3000 × g (4°C) for 30 min. To remove supernatant, microtitre
plates were inverted and centrifuged up to a rate of 40 × g and then slowly
stopped. Precipitates were washed with 70 µl of 70% ethanol and re-pelleted
by centrifugation at 3000 × g (4°C) for 15 min. Ethanol was removed by
inverting plates and centrifuging at 40 × g for 1 min. Pellets were air dried in
the dark and resuspended in 10 µl Hi-Di formamide (ABI). Sequencing was
performed using an ABI 3730 DNA Analyzer and bases called with ABI
Sequencing Analysis Software, v5.1.
5.2.5. Assembly of Rht-1 contigs and bioinformatic analyses
Nucleotide contigs were assembled using the ContigExpress package of
Vector NTI (Invitrogen) and assembled sequences aligned using ClustalX
(Larkin et al., 2007). Amino acid alignments were performed using GeneDoc
v2.6.002 software (Nicholas and Nicholas, 1997). Nucleotide diversity per site
( ) (Tajima 1983) and Watterson‟s theta per site ( ) (Nei, 1987) were
calculated using DnaSP v5 software (Librado and Rozas, 2009) on aligned
sequences. Haplotype diversity (h) was calculated using the following
formula: h = n(1-Σf2)/(n-1), where n is the sample size and f is the frequency
of each haplotype (Nei, 1987). Fisher‟s Exact Test was used to determine the
probability value (two-tailed distribution) of the synonymous to non-
synonymous SNP ratios between diploid/tetraploid and natural hexaploid lines
and calculated using http://www.graphpad.com/quickcalcs/contingency1.cfm.
The 160 bp and 197 bp insertion sequences were queried against the TREP
cereal repeat database (http://wheat.pw.usda.gov/ITMI/Repeats) and the
NCBI nucleotide collection (nr/nt) (http://blast.ncbi.nlm.nih.gov/Blast.cgi). The
NCBI BLAST tool was used to determine homology between the insertion

128
sequences and orthologous regions on the Rht-1 BAC, Brachypodium, and
rice sequences.
5.2.6. Rht-1 Transcript analysis
Seeds of CS, Cadenza, SS7010073, Mercia, Paragon, Kanred, and Cappelle
Desprez (sources shown in Table 5.1) were surface sterilised and stratified
(4°C, two days) on wetted filter paper. Germinated seeds were transferred to
petri dishes lined with filter paper and placed in a controlled environment room
(22°C 16/8 hr light/dark) for five days. Shoot tissues were collected into
eppendorf tubes containing a stainless steel bead and immediately snap
frozen in liquid nitrogen and stored at -80°C. Three replicates, each
consisting of ten seedlings, were collected for each accession; however one
replicate of Cadenza and one replicate of SS7010073 were lost during the
RNA extraction process.
For RNA extraction, frozen tissue was ground to a fine powder with a
TissueLyser LT (Qiagen) for 30 s and RNA extracted using the RNEasy plant
mini kit method (Qiagen). To remove contaminating DNA, the „rigorous
DNAse treatment‟ protocol was performed as described in the TURBO DNA-
free procedure (Ambion). Following DNAse treatment, the concentration and
purity of RNA of each sample was determined using a Picodrop
spectrophotometer (Picodrop Limited, Saffron Walden, UK). Only samples
with a 260/280 absorbance ratio (a measure of purity) between 1.6 and 2.0
were used for cDNA synthesis. A total of 1 µg of RNA was used to synthesise
cDNA using the SuperScript III first strand synthesis reverse transcription kit
(Invitrogen) following the manufacturer‟s instructions with a random nonamers
(Invitrogen) concentration of 50 µM. RNA was removed from the RNA-cDNA
duplex using RNase-H (Invitrogen). The resulting single-stranded cDNA was
diluted 1:20 with nuclease-free water prior to quantitative real time PCR (qRT-
PCR).
The qRT-PCR reactions were performed on a DNA engine Opticon2
Contiguous Fluorescence Detector (MJ Research Inc., Alameda, CA, USA).

129
cDNA was amplified using SYBR Green JumpStart Taq ReadyMix (Sigma-
Aldrich) using an initial activation step of 95°C for 3 min, followed by 40 cycles
of [94°C for 20 s, a primer-dependent annealing temperature for 20 s, and
72°C for 30 s], and a final polymerisation of 72°C for 10 min. Melt-curve
analysis was performed from 65°C to 95°C and read every 0.5°C with a 1 s
hold time. For Rht-B1 specific amplification, a forward primer (5‟ – CAC TAC
TAC TCC ACC ATG TTC GAT TCT CTG – 3‟) and reverse primer (5‟ – GCG
GCA GGA GCA GCA GCC – 3‟) were used in reaction mixes with a 68.5°C
annealing temperature. For Rht-D1 specific amplification, a forward primer (5‟
– CCA CGA GAC GCT GGG C – 3‟) and reverse primer (5‟ – CCT TCC TTC
TCC TCC ACC TTG TAG – 3‟) were used in reaction mixes with a 64°C
annealing temperature. Rht-B1b and Rht-D1b primers were designed and
qRT-PCR reaction conditions developed by Robert Saville (Saville, 2011).
The internal controls for normalisation of expression were GAPDH
(Glyceraldehyde 3-phosphate dehydrogenase) and EF1a (Elongation factor
1α) using the following primers: [GAPDH; forward: 5‟ – CCT TCC GTG TTC
CCA CTG TTG – 3‟; reverse: 5‟ – ATG CCC TTG AGG TTT CCC TC – 3‟;
60°C anneal temp (McGrann et al., 2009)] and [EF1a; forward: 5‟ – TGG TGT
CAT CAA GCC TGG TAT GGT – 3‟; reverse: 5 –ACT CAT GGT GCA TCT
CAA CGG ACT – 3‟; 60°C anneal temp (Coram et al., 2008)]. The
normalisation factor was calculated as the geometric mean of the two
normalisation genes. Two technical replicates were analysed for each
sample.
The average threshold cycle (Ct) was calculated from the technical
replications of each sample. Data were analysed using Opticon Monitor
analysis software (v 2.02; MJ Research Inc.). Rht-B1 and Rht-D1 expression
levels were calculated relative to the normalisation factor using the ΔCt
method (Pfaffl, 2001) and corrected for primer efficiencies (ΔΔCt). Normalised
data is presented as the mean of the three biological replicates. Statistical
significance among Rht-B1 transcript levels and among Rht-D1 transcript
levels was determined using analysis of variance (Genstat, 12th edition) by
inputting normalised replicate values. RNA extraction, qRT-PCR

130
amplification, and data calculations were performed with the guidance of R.
Saville, JIC.
5.3. RESULTS
5.3.1. PCR amplification and sequencing
Locus specificity of each primer pair used to amplify DNA of the Rht-1+flank
region listed in Table 5.3 was confirmed using water and the following DNA
templates: CS, CS-N4AT4B (or CS-N4AT4D), CS-Dt4BL, CS-N4DT4B, BAC
clone 0224-M10 (CS-A), BAC clone 1417-F16 (CS-B), and BAC clone 0155-
I24 (CS-D). For each primer pair, the expected product was amplified only
from the specified genome. An example of locus specific primer amplification
for Rht-B1 is shown in Figure 5.1.
Figure 5.1. Example of Rht-1 locus-specific amplification.
The primer pair Rht-B-F1/Rht-ABD-R6 was tested for locus-specificity using PCR. The
following templates were used in PCR reactions and visualised following electrophoresis on a
1.5% agarose gel stained with ethidium bromide: [1] water; [2] genomic DNA (gDNA) of
Chinese Spring (CS); [3] BAC DNA from Rht-A1-containing clone 0224-M10; [4] BAC DNA
from Rht-B1-containing clone 1417-F16; [5] BAC DNA from Rht-D1-containing clone 0155-
I24; [6] gDNA of CS nulli-tetra (NT) N4AT4D; [7] gDNA of CS ditelosomic 4BL; [8] gDNA of
CS N4DT4B. The expected product size was 1105 bp. M = Invitrogen „1 Kb Plus‟ DNA
marker with fragment sizes indicated to the left in basepairs (bp).
Locus-specific products were used for sequencing of the ORF and the
flanking 5‟ and 3‟ regions of Rht-A1, Rht-B1, and Rht-D1 in three sets of
1 2 3 4 5 6 7 8
Mbp
1000
1650
850500
100
2000
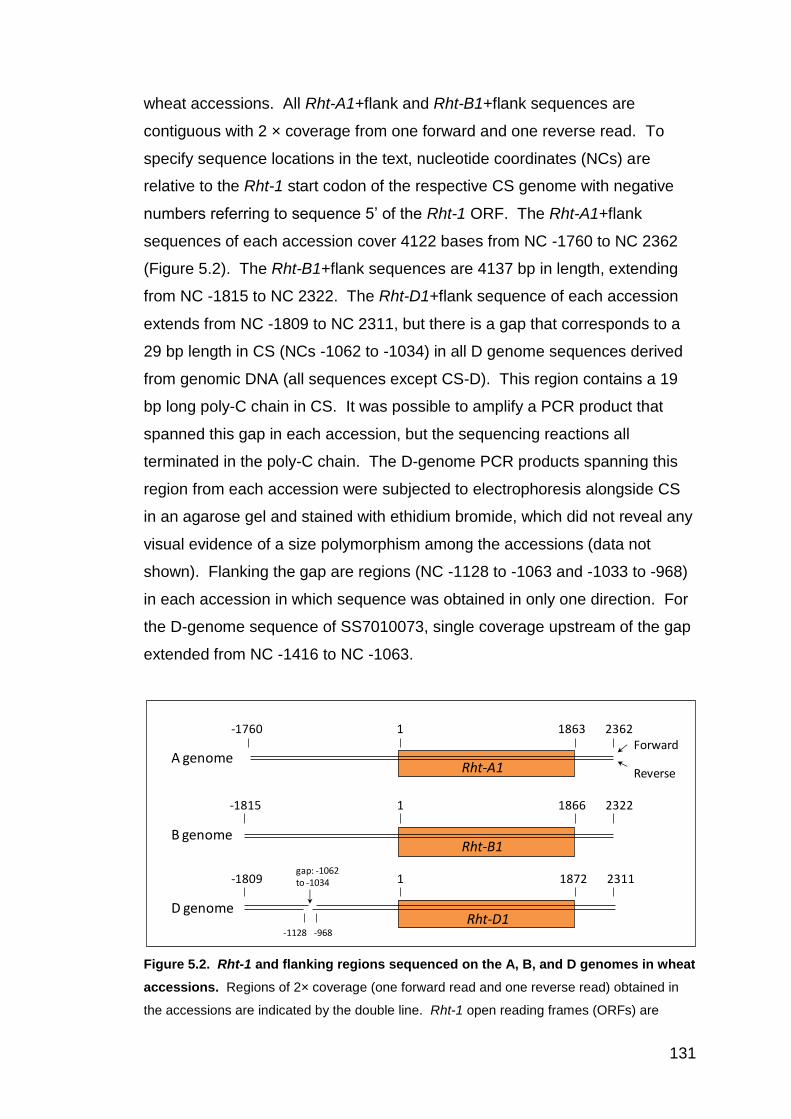
131
wheat accessions. All Rht-A1+flank and Rht-B1+flank sequences are
contiguous with 2 × coverage from one forward and one reverse read. To
specify sequence locations in the text, nucleotide coordinates (NCs) are
relative to the Rht-1 start codon of the respective CS genome with negative
numbers referring to sequence 5‟ of the Rht-1 ORF. The Rht-A1+flank
sequences of each accession cover 4122 bases from NC -1760 to NC 2362
(Figure 5.2). The Rht-B1+flank sequences are 4137 bp in length, extending
from NC -1815 to NC 2322. The Rht-D1+flank sequence of each accession
extends from NC -1809 to NC 2311, but there is a gap that corresponds to a
29 bp length in CS (NCs -1062 to -1034) in all D genome sequences derived
from genomic DNA (all sequences except CS-D). This region contains a 19
bp long poly-C chain in CS. It was possible to amplify a PCR product that
spanned this gap in each accession, but the sequencing reactions all
terminated in the poly-C chain. The D-genome PCR products spanning this
region from each accession were subjected to electrophoresis alongside CS
in an agarose gel and stained with ethidium bromide, which did not reveal any
visual evidence of a size polymorphism among the accessions (data not
shown). Flanking the gap are regions (NC -1128 to -1063 and -1033 to -968)
in each accession in which sequence was obtained in only one direction. For
the D-genome sequence of SS7010073, single coverage upstream of the gap
extended from NC -1416 to NC -1063.
Figure 5.2. Rht-1 and flanking regions sequenced on the A, B, and D genomes in wheat
accessions. Regions of 2× coverage (one forward read and one reverse read) obtained in
the accessions are indicated by the double line. Rht-1 open reading frames (ORFs) are
A genome
B genome
D genome
-1760
-1815
23621 1863
23221 1866
-1809 23111 1872gap: -1062 to -1034
-1128 -968
Rht-A1
Rht-B1
Rht-D1
Forward
Reverse

132
indicated by orange rectangles. Nucleotide coordinates (NCs) of each genome relative to the
Rht-1 translational start codon of Chinese Spring (CS) are shown with negative numbers
indicating sequence 5‟ of the ORF. On the D genome, an arrow indicates the location of a
sequencing gap of 29 bp relative to CS that is also surrounded by a region of single coverage
with boundaries indicated. The gap is present in all D genome sequences except the D
genome BAC sequence from CS. On the D genome of SS7010073, the single coverage 5‟ of
the gap extends from NC -1416 to NC -1063.
5.3.2. Genetic diversity of the Rht-1+flank region of the BW1 set
5.3.2.1. BW1 set: Genotypes and phenotypes
Prior to sequencing, all accessions were genotyped for Rht-B1a/b and Rht-
D1a/b (Table 5.4) and only homozygous plants with the expected genotype
were used for sequencing. Although Kransnodari 1 has an Rht-B1a genotype
using this assay, it is known to contain the Rht-B1e allele (Worland, 1986). A
previous study that used the primers specific to the Rht-B1b SNP developed
by Ellis et al., 2002 also showed that the Rht-B1a product is amplified in
accessions carrying the Kransodari 1 Rht-B1e allele (Pestsova et al., 2008).
Mean plant height varied widely among the BW1 accessions, ranging from 46
cm to 115 cm (Table 5.4). Rht-B1 insertion allele presence/absence was
determined by sequencing as described later in the chapter.

133
Table 5.4. Phenotype and genotype scores of the BW1 and TDW accessions.
a Set: These are as described in section 5.2.2. BW1 = Bread Wheat 1; BW1(UK) denotes
BW1 varieties with agronomic significance in the United Kingdom. TDW = Tetraploid/ Diploid
Wheats.
Accession numbers are shown in Table 5.1.
b 160, 197 indicate the presence of 160 bp and 197 bp insertions 5' of Rht-B1; NP = 160 bp or
197 bp insertions are not present. Rht-B1a/B1b and Rht-D1a/D1b genotypes were
determined using primers (shown in Table 5.2) specific to the Rht-B1b and Rht-D1b causative
SNPs. Semi-dwarf (Rht-B1b and Rht-D1b) alleles are shown in bold font. Krasnodari 1
contains the Rht-B1e allele, but the Rht-B1a/B1b primer pair does not distinguish Rht-B1a
from Rht-B1e (Pestsova et al., 2008)
c Plant height was measured from soil surface to the tip of the tallest tiller for the indicated
number of plants. CV = coefficient of variation. na = not available.
5.3.2.2. BW1 set: Rht-A1+flank diversity
Over the 4122 bp of Rht-A1+flank sequence there were four haplotypes (A1-
A4) and 18 polymorphic sites (PS; 15 SNPs and three indels) among the 21
BW1 varieties with a nucleotide diversity ( ) of 0.35 × 10⁻³ and haplotype
diversity of 0.27 (Table 5.5, BW1 set). All SNP changes discussed in the text
Genotypeb
Seta
Accession
Rht-B1
ins.
Rht-
B1a/B1b
Rht-
D1a/D1b
f
i
l
Plants
(no.)
Mean
(cm)
Range
(cm) CV
BW1 Chinese Spring NP B1a D1a 11 82 76-92 5%
BW1 Fultz NP B1a D1a 6 115 101-129 8%
BW1 Gaines NP B1a D1b 6 68 64-73 5%
BW1 Kanred 197 B1a D1a 5 95 85-109 10%
BW1 Krasnodari 1 NP B1a D1a 6 47 40-52 10%
BW1 Norin 10 NP B1b D1b fill 7 46 43-47 3%
BW1 Norin 10/Brevor-14 NP B1b D1b 7 51 48-57 6%
BW1 Siete Cerros NP B1b D1a 6 55 48-61 9%
BW1 Sonora 64 NP B1a D1b 6 60 54-64 6%
BW1(UK) Alchemy 160 B1a D1b na na na na
BW1(UK) April Bearded 160 B1a D1a 6 107 95-118 8%
BW1(UK) Avalon 160 B1a D1b 6 70 68-73 2%
BW1(UK) Cadenza NP B1a D1a 12 69 61-86 9%
BW1(UK) Cappelle Desprez 197 B1a D1a 5 90 81-93 5%
BW1(UK) Hobbit 'Sib' 197 B1a D1b 7 74 67-77 5%
BW1(UK) Mercia 160 B1a D1a 6 77 72-80 4%
BW1(UK) Paragon 160 B1a D1a 3 80 72-87 9%
BW1(UK) Robigus NP B1b D1a 5 64 63-67 2%
BW1(UK) Soissons NP B1b D1a 6 71 67-78 6%
BW1(UK) Squarehead's Master NP B1a D1a 5 86 76-93 8%
BW1(UK) Xi19 NP B1a D1b 5 57 54-58 3%
TDW SS7010073 197 B1a D1a 6 82 71-93 10%
TDW T. dicoccoides 57 197 B1a D1a 4 69 61-78 10%
TDW T. dicoccoides 65 197 B1a D1a 2 87 82-91 7%
Heightc

134
will show the CS nucleotide preceding the slash “/” and the new nucleotide
following the “/”. CS is the only member of haplotype A1 in the BW1 set,
which differs from all other BW1 haplotypes by the absence of a T nucleotide
at NC -1046 (Table 5.6). To rule out the possibility that the NC -1046 T indel
was due to a sequencing error in the CS-A genome BAC 0224-M10, DNA
from leaf tissue of CS seedlings was amplified from this region and
sequenced. A forward and reverse sequencing read of the genomic DNA
confirmed the absence of the T base in CS (data not shown). Haplotype A2 is
the predominant BW1 haplotype, being present in 18 of the 21 accessions
(Table 5.1), and all 12 accessions in the UK subset have this haplotype. The
only difference between haplotype A2 and CS is the T indel at NC -1046.
Haplotype A3 is present in only one accession, Sonora 64, and differs from
haplotype A2 by a single polymorphism (two polymorphisms relative to CS), a
C/A SNP at NC 1430 in the ORF. The SNP results in a predicted amino acid
change from serine in residue 477 of Rht-A1 in CS to tyrosine in Sonora 64
(S477Y; as shown here, nomenclature for amino acid changes in the text will
show CS residue followed by CS amino acid number followed by new amino
acid). This residue is located between the conserved P and FY domains
identified by Tian et al. (2004) (Figure 5.3, residue 477 of Rht-A1, coord. 483
in the figure due to insertion of gaps during alignment). The A4 haplotype is
present only in Siete Cerros and contains 16 polymorphisms not found in any
other BW1 haplotype and 17 polymorphisms relative to CS. All
polymorphisms in Siete Cerros occur upstream of the Rht-A1 ORF and
consist of 14 SNPs and three single bp indels.
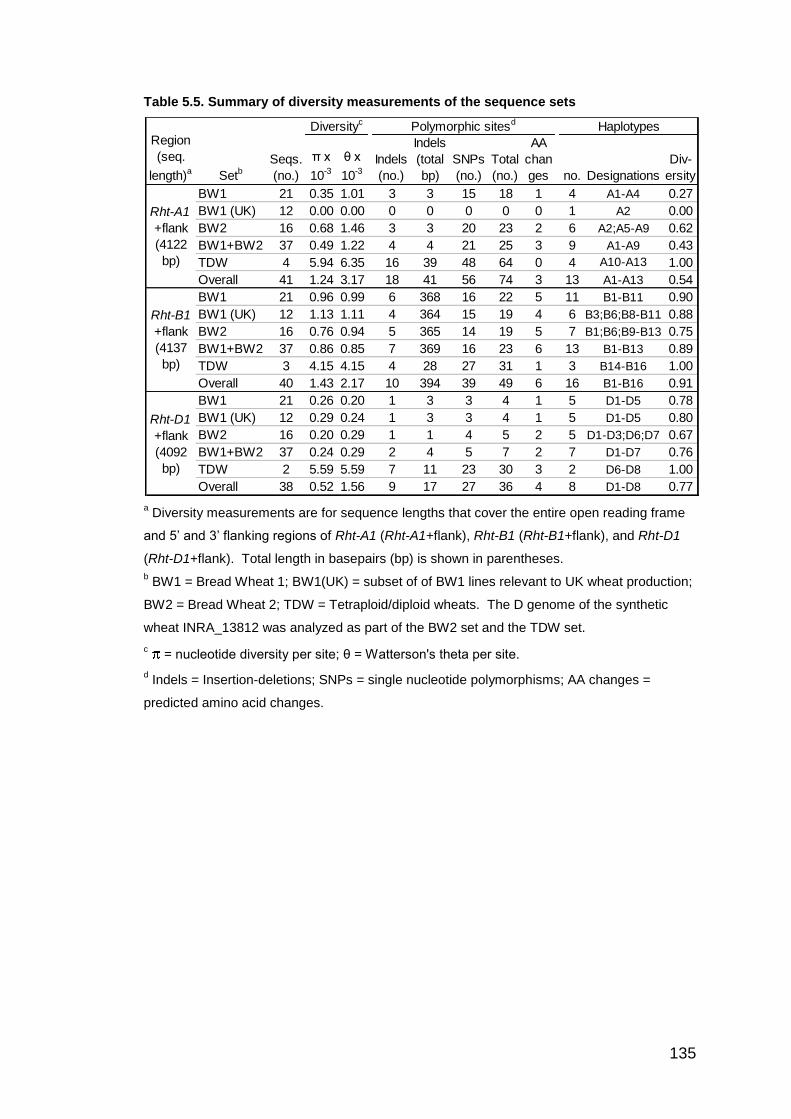
135
Table 5.5. Summary of diversity measurements of the sequence sets
a Diversity measurements are for sequence lengths that cover the entire open reading frame
and 5‟ and 3‟ flanking regions of Rht-A1 (Rht-A1+flank), Rht-B1 (Rht-B1+flank), and Rht-D1
(Rht-D1+flank). Total length in basepairs (bp) is shown in parentheses.
b BW1 = Bread Wheat 1; BW1(UK) = subset of of BW1 lines relevant to UK wheat production;
BW2 = Bread Wheat 2; TDW = Tetraploid/diploid wheats. The D genome of the synthetic
wheat INRA_13812 was analyzed as part of the BW2 set and the TDW set.
c = nucleotide diversity per site; θ = Watterson's theta per site.
d Indels = Insertion-deletions; SNPs = single nucleotide polymorphisms; AA changes =
predicted amino acid changes.
Region
(seq.
length)a SetbSeqs.
(no.)
π x
10-3
θ x
10-3
Indels
(no.)
Indels
(total
bp)
SNPs
(no.)
Total
(no.)
AA
chan
ges no. Designations
Div-
ersity
BW1 21 0.35 1.01 3 3 15 18 1 4 A1-A4 0.27
BW1 (UK) 12 0.00 0.00 0 0 0 0 0 1 A2 0.00
BW2 16 0.68 1.46 3 3 20 23 2 6 A2;A5-A9 0.62
BW1+BW2 37 0.49 1.22 4 4 21 25 3 9 A1-A9 0.43
TDW 4 5.94 6.35 16 39 48 64 0 4 A10-A13 1.00
Overall 41 1.24 3.17 18 41 56 74 3 13 A1-A13 0.54
BW1 21 0.96 0.99 6 368 16 22 5 11 B1-B11 0.90
BW1 (UK) 12 1.13 1.11 4 364 15 19 4 6 B3;B6;B8-B11 0.88
BW2 16 0.76 0.94 5 365 14 19 5 7 B1;B6;B9-B13 0.75
BW1+BW2 37 0.86 0.85 7 369 16 23 6 13 B1-B13 0.89
TDW 3 4.15 4.15 4 28 27 31 1 3 B14-B16 1.00
Overall 40 1.43 2.17 10 394 39 49 6 16 B1-B16 0.91
BW1 21 0.26 0.20 1 3 3 4 1 5 D1-D5 0.78
BW1 (UK) 12 0.29 0.24 1 3 3 4 1 5 D1-D5 0.80
BW2 16 0.20 0.29 1 1 4 5 2 5 D1-D3;D6;D7 0.67
BW1+BW2 37 0.24 0.29 2 4 5 7 2 7 D1-D7 0.76
TDW 2 5.59 5.59 7 11 23 30 3 2 D6-D8 1.00
Overall 38 0.52 1.56 9 17 27 36 4 8 D1-D8 0.77
Haplotypes
Rht-A1
+flank
(4122
bp)
Rht-B1
+flank
(4137
bp)
Rht-D1
+flank
(4092
bp)
Polymorphic sitesdDiversityc

136
Table 5.6. Summary of polymorphisms and haplotypes in the Rht-A1+flank region
Coord.a CS (A1)b A2 A3 A4 A5 A6 A7 A8 A9 A10 A11 A12 A13
-1741 A G G G
-1729 C T T T T T T
-1714 A T
-1671 C T
-1654 A -
-1635 G A A A A A
-1620 C T
-1610 A -
-1527 C G
-1413 G C C C
-1366 G A A A
-1329 T G
-1318 A G
-1303 G A
-1289 A C
-1286 G A
-1202 A G
-1193 A G G G
-1155 T C C C
-1139 C A A A A
-1088 A G G G G G G
-1087 T C C C C C C
-1065 T - -
-1064 - T
-1062 C G
-1057 C - - -
-1056 - CCCCCC
-1056 T C
-1050 T G G G G G
-1046 - T T T T T T T T T T T T
-1046 C T
-1037 T C
-1027 T A
-1013 G A A A A A
-998 T G G G G
-907 C G
-894 G A A
-877 A G
-835 - A
-820 - A A A
-817 T C
-808 A T
-749 C T
-741 T A
-738 G A
-732 C G
-639 GAAAAA -
-633 G A
-599 A T T
-497 A G
Haplotypesc

137
Table 5.6 (continued). Summary of polymorphisms and haplotypes in the Rht-A1+flank
region
a Nucleotide coordinates that mark the locations of polymorphisms present amongst the
accessions are shown relative to the start nucleotide of the Chinese Spring (CS) Rht-A1
sequence with negative numbers referring to sequence 5‟ of the open reading frame (ORF).
Nucleotide changes occurring in the ORF are indicated in orange background with predicted
amino acid (aa) changes shown in bold font directly below with affected residue.
b Nucleotides present in the reference sequence of CS are as shown with missing sequence
relative to other haplotypes denoted by a “-“. Where predicted amino acid changes occur, the
amino acid present in CS is shown as a 1-letter code in bold font directly below the causative
nucleotide change. The (A1) denotes that CS is representative of haplotype A1.
c For haplotypes A2-A13, nucleotides and amino acids are indicated in red background where
haplotypes differ from CS.
d The sets of accessions containing the haplotypes are indicated. bw1 = bread wheat 1; UK
denotes bw1 varieties with agronomic significance in the United Kingdom. bw2 = bread wheat
2; tdw = tetraploid/ diploid wheats. Accessions and haplotypes of each set are shown in
Table 5.1.
Coord.a CS (A1)b A2 A3 A4 A5 A6 A7 A8 A9 A10 A11 A12 A13
-490 A -
-485 T C
-462 - CAGTA
-455 T -
-377 T C C C
-298 C A
-297 C T
-234 C T
-183 TCGC - -
-156 TTC -
-130 C -
-33 A G G G G G
291 C G
294 C G
297 C T
565 T A
aa189 S T
994 G A
aa332 G S
1245 A G G
1311 G A
1430 C A
aa477 S Y
2024 C T T
2219 ACTGT - -
2281 A T
2348 G -
Setsd: bw1 bw1 bw1 bw1 bw2 bw2 bw2 bw2 bw2 tdw tdw tdw tdw
UK
bw2
Haplotypesc

138
Figure 5.3. Predicted amino acid changes in the Rht-1 ORF identified among the wheat
diversity sets. The open reading frame (ORF) sequences of Rht-A1a, Rht-B1a, and Rht-
D1a from the Chinese Spring (CS) background were aligned using ClustalX. Amino acids in
black, grey, and white background are present in 3, 2, and 1 homoeologue, respectively.
Coordinates to the right of each row show the amino acid number of the preceding residue in
each homoeologue. Coordinates are also shown above the sequence for referral in the text,
but because of the introduction of gaps (-) to facilitate alignment they do not correspond to
any one sequence. Conserved protein domain motifs (Tian et al., 2004) are underlined in
blue with name indicated below. Red arrows indicate the location of amino acid changes that
occur in the diversity sets relative to CS. The affected amino acids are underlined in red
Rht-A1a :
Rht-B1a :
Rht-D1a :
10 20 30 40 50 60 70
MKREYQDAGGSGGGGG-MGSSEDKMMVS--AAAGEGEEVDELLAALGYKVRASDMADVAQKLEQLEMAMG
MKREYQDAGGSGGGGGGMGSSEDKMMVSGSAAAGEGEEVDELLAALGYKVRASDMADVAQKLEQLEMAMG
MKREYQDAGGSGGGGGGMGSSEDKMMVS--AAAGEGEEVDELLAALGYKVRASDMADVAQKLEQLEMAMG
: 67
: 70
: 68
Rht-A1a :
Rht-B1a :
Rht-D1a :
80 90 100 110 120 130 140
MGGVGAGAAPDDSFATHLATDTVHYNPTDLSSWVESMLSELNAPPPPLPPAPQQLNASTSSTVTG-GGYF
MGGVGAGAAPDDSFATHLATDTVHYNPTDLSSWVESMLSELNAPPPPLPPAP-QLNASTSSTVTG-GGYF
MGGVGAGAAPDDSFATHLATDTVHYNPTDLSSWVESMLSELNAPPPPLPPAP-QLNASTSSTVTGSGGYF
: 136
: 138
: 137
Rht-A1a :
Rht-B1a :
Rht-D1a :
150 160 170 180 190 200 210
DLPPSVDSSCSTYALRPIPSPAGAVGPADLSADS-VRDPKRMRTGGSSTSSSSSSSSSLGGGARSSVVEA
DLPPSVDSSCSTYALRPIPSPA--VAPADLSADSVVRDPKRMRTGGSSTSSSSSSSSLGGGGARSSVVEA
DLPPSVDSSSSIYALRPIPSPAGATAPADLSADS-VRDPKRMRTGGSSTSSSSSSSSSLGGGARSSVVEA
: 205
: 206
: 206
Rht-A1a :
Rht-B1a :
Rht-D1a :
220 230 240 250 260 270 280
APPVAAGANA-PALPVVVVDTQEAGIRLVHALLACAEAVQQENFSAAEALVKQIPLLAASQGGAMRKVAA
APPVAAAAGA-PALPVVVVDTQEAGIRLVHALLACAEAVQQENFSAAEALVKQIPLLAASQGGAMRKVAA
APPVAAAANATPALPVVVVDTQEAGIRLVHALLACAEAVQQENLSAAEALVKQIPLLAASQGGAMRKVAA
: 274
: 275
: 276
Rht-A1a :
Rht-B1a :
Rht-D1a :
290 300 310 320 330 340 350
YFGEALARRVFRFRPQPDSSLLDAAFADLLHAHFYESCPYLKFAHFTANQAILEAFAGCRRVHVVDFGIK
YFGEALARRVFRFRPQPDSSLLDAAFADLLHAHFYESCPYLKFAHFTANQAILEAFAGCRRVHVVDFGIK
YFGEALARRVFRFRPQPDSSLLDAAFADLLHAHFYESCPYLKFAHFTANQAILEAFAGCRRVHVVDFGIK
: 344
: 345
: 346
Rht-A1a :
Rht-B1a :
Rht-D1a :
360 370 380 390 400 410 420
QGMQWPALLQALALRPGGPPSFRLTGVGPPQPDETDALQQVGWKLAQFAHTIRVDFQYRGLVAATLADLE
QGMQWPALLQALALRPGGPPSFRLTGVGPPQPDETDALQQVGWKLAQFAHTIRVDFQYRGLVAATLADLE
QGMQWPALLQALALRPGGPPSFRLTGVGPPQPDETDALQQVGWKLAQFAHTIRVDFQYRGLVAATLADLE
: 414
: 415
: 416
Rht-A1a :
Rht-B1a :
Rht-D1a :
430 440 450 460 470 480 490
PFMLQPEGEEDPNEEPEVIAVNSVFEMHRLLAQPGALEKVLGTVRAVRPRIVTVVEQEANHNSGTFLDRF
PFMLQPEGEEDPNEEPEVIAVNSVFEMHRLLAQPGALEKVLGTVRAVRPRIVTVVEQEANHNSGTFLDRF
PFMLQPEGEEDPNEEPEVIAVNSVFEMHRLLAQPGALEKVLGTVRAVRPRIVTVVEQEANHNSGTFLDRF
: 484
: 485
: 486
Rht-A1a :
Rht-B1a :
Rht-D1a :
500 510 520 530 540 550 560
TESLHYYSTMFDSLEGGSSGG-PSEVSSGAAAAPAAAGTDQVMSEVYLGRQICNVVACEGAERTERHETL
TESLHYYSTMFDSLEGGSSGG-PSEVSSGAAAAPAAAGTDQVMSEVYLGRQICNVVACEGAERTERHETL
TESLHYYSTMFDSLEGGSSGGGPSEVSSGAAAAPAAAGTDQVMSEVYLGRQICNVVACEGAERTERHETL
: 553
: 554
: 556
Rht-A1a :
Rht-B1a :
Rht-D1a :
570 580 590 600 610 620
GQWRNRLGNAGFETVHLGSNAYKQASTLLALFAGGDGYKVEEKEGCLTLGWHTRPLIATSAWRLAAP
GQWRNRLGNAGFETVHLGSNAYKQASTLLALFAGGDGYKVEEKEGCLTLGWHTRPLIATSAWRLAAP
GQWRNRLGNAGFETVHLGSNAYKQASTLLALFAGGDGYKVEEKEGCLTLGWHTRPLIATSAWRLAGP
: 620
: 621
: 623
DELLA
TVHYNP
LHR I NLS
NLS VHIID
VHIID LHR II
LHR II P FY
FY RE RVER
W-G L-W SAW
E/*G/R M/I K/* Q/*
T/V S/T E/G
frameshift G/S
S/Y
G/A

139
below the arrows and the amino acid change is indicated above the arrow. „Frameshift‟ refers
to a 1 bp nucleotide insertion that occurs at coordinate 333 in an Rht-B1 accession.
5.3.2.3. BW1 set: Rht-B1+flank diversity
The 4137 bp of Rht-B1+flank sequence from the 21 BW1 accessions revealed
11 haplotypes (B1-B11) and haplotype diversity was 0.90 (Table 5.5, BW1
set). Nucleotide diversity was 0.96 × 10⁻³ and there were 22 PS (16 SNPs
and 6 indels) among the accessions, which included a 160 bp and a 197 bp
indel within the upstream region and five predicted amino acid changes in the
Rht-B1 ORF. Haplotype B1 consisted only of CS, which differed from the
other BW1 haplotypes by one to 15 polymorphisms (Table 5.7). There were
four Rht-B1+flank haplotypes (B2, B3, B6, and B7) that each differed from CS
by only one polymorphism. Haplotype B2 differs from CS by a 3 bp deletion
downstream of the ORF (NC 1982) and is only present in the line „Fultz‟. The
B3 haplotype is found in four BW1 varieties (Table 5.1) and has a G/T SNP 5
bp downstream of the ORF (NC 1871). The B6 haplotype contains Rht-B1b
and all five lines with this allele have identical sequences in the Rht-B1+flank
region. As first reported by Peng et al. (1999), the semi-dwarf nature of Rht-
B1b results from a C/T SNP at NC 190 that converts Rht-B1 AA64 from a
glutamine (Q) to a stop codon (*) (Figure 5.3, coord. 64). The B7 haplotype is
only present in Sonora 64 and differs from CS by a 3 bp deletion at NC 2191,
which is part of a CTA repeat-rich region 3‟ of the ORF.
The semi-dwarf line, Krasnodari 1 contains the Rht-B1e allele and is the only
member of haplotype B5 in the BW1 set. Relative to CS, Krasnodari 1 has
three polymorphisms including an A/T SNP in the ORF at NC 181. The ORF
SNP is a nonsense mutation that converts residue 61 of Rht-B1 from lysine
(K) to a stop codon (*) (Figure 5.3, coord. 61). The stop codon occurs in the
DELLA domain at a position that is only three amino acids upstream of the
residue that is converted to a stop codon in Rht-B1b and only two amino acids
upstream of the equivalent residue on the D genome that is converted to a
stop codon in Rht-D1b.

140
Table 5.7. Summary of polymorphisms and haplotypes in the Rht-B1+flank region
Coord.a CS (B1)b B2 B3 B4 B5 B6 B7 B8 B9 B10 B11 B12 B13 B14 B15 B16
-1487 A T T T
-1210 T C
-1198 G T T T T T T
-1180 G A
-1177 T C
-1140 - C
-1053 A G
-1003 T C
-911 T C C C C
-907 G A
-867 TTTCT -
-738 G A A A A A
-694 intact -16
-638 C T
-634 T C C
-629 C T
-591 - +197 +197 +197 +197 +197
-591 - G G A G G
-591 - C C C G C
-591 - A A A G A
-591 - T T C T T
-460 A G
-391 G C
-356 - +160 +160 +160
-322 G T
-243 C -
-231 T G
-131 C T T T T T T
-68 C A
-39 T C
43 G C C C
aa15 G R R R
75 G A A A A
aa25 M I I I I
181 A T
aa61 K *
190 C T
aa64 Q *
614 A G G G
aa205 E G G G
618 T C
723 A G G G G G
984 - T
aa328 L FS
1584 C G
1734 G A
1761 A C C C C
1871 G T
1877 T - -
1931 G A
1982 AAG -
Haplotypesc

141
Table 5.7 (continued). Summary of polymorphisms and haplotypes in the Rht-B1+flank
region
a Nucleotide coordinates that mark the locations of polymorphisms present amongst the
accessions are shown relative to the start nucleotide of the Chinese Spring (CS) Rht-B1
sequence with negative numbers referring to sequence 5‟ of the open reading frame (ORF).
Nucleotide changes occurring in the ORF are indicated in orange background with predicted
amino acid (aa) changes shown in bold font directly below with affected residue. Coordinate -
591 marks a 197 bp insertion along with 4 SNPs that occur within the insertion.
b Nucleotides present in the reference sequence of CS are as shown with missing sequence
relative to other haplotypes denoted by a “-“. Intact refers to the presence of sequence in CS
that is deleted in another haplotype. Where predicted amino acid changes occur, the amino
acid present in CS is shown as a 1-letter code in bold font directly below the causative
nucleotide change. The (B1) denotes that CS is representative of haplotype B1.
c For haplotypes B2-B16, nucleotide and amino acids are indicated in red background where
haplotypes differ from CS. “+197” indicates the presence of a 197 bp insertion; “+160”
indicates the presence of a 160 bp insertion; “-16” indicates a 16 bp deletion; “*” = predicted
stop codon; “FS” = amino acid frameshift.
d Accession sets containing each haplotype are indicated. bw1 = bread wheat 1; UK denotes
bw1 varieties with agronomic significance in the United Kingdom. bw2 = bread wheat 2; tdw =
tetraploid/ diploid wheats. Accessions and haplotypes of each set are shown in Table 5.1.
e Previously identified GA insensitive alleles are indicated.
Three of the remaining haplotypes (B8, B9, and B11) in the BW1 set contain a
160 bp insertion relative to CS at NC -356. No sequences with significant
similarity were found when the 160 bp was queried against the TREP cereal
repeat database, the NCBI nucleotide collection (nr/nt), or the CS Rht-1-
containing BAC sequences. Each of the three haplotypes also contains an
A/G SNP in the ORF (NC 614) that gives rise to a predicted E205G change
(Figure 5.3, coord. 209). The change occurs in the N-terminal region of Rht-
B1 and is outside of the conserved domains. These two polymorphisms
Coord.a CS (B1)b B2 B3 B4 B5 B6 B7 B8 B9 B10 B11 B12 B13 B14 B15 B16
2086 C G
2167 C T T T T T
2191 CTA CTA CTA CTA CTA CTA
CTA
CTA
CTA
CTA
CTA
CTA -
2221 A T T T T T
Setsd: bw1 bw1 bw1 bw1 bw1 bw1 bw1 bw1 bw1 bw1 bw1 bw2 bw2 tdw tdw tdw
bw2 UK UK UK UK UK UK
bw2 bw2 bw2 bw2
Allelese: B1e B1b
Haplotypesc

142
constitute the only difference between CS and haplotype B9, which is present
in three BW1 accessions (April Bearded, Avalon, and Mercia). The
accession Alchemy is the only member of haplotype B8, which contains two
SNPs (NC -1487 and -1198) in addition to those found on haplotype B9.
Haplotype B11 is only represented in Paragon among the BW1 set, differing
from haplotype B9 by a CTA insertion in the repeat rich region 3‟ of the ORF
(NC 2191).
The remaining two haplotypes found in the BW1 set (B4 and B10) each
contain a 197 bp insertion upstream of the Rht-B1 ORF relative to CS (NC -
591). No sequences of significant similarity were found when the 197 bp
insertion sequence (from Cappelle Desprez) was queried against the TREP
cereal repeat database, the NCBI nucleotide collection (nr/nt). However,
homologous sequence is present in nearly equivalent regions on the Rht-1-
containing BAC sequences from the A and D genomes. On the A genome,
the region (NC -883 to -702) has significant similarity (2 × 10-55) and 86%
identity to the 197 bp insertion. On the D genome, significant homology (1 ×
10-57) and 86% identity to the insertion was found between NC -872 to -685.
No homology was found when the 197 bp insertion was queried with the
upstream regions (1 bp to 10 000 bp upstream) of rice or Brachypodium. The
B4 haplotype, in addition to the 197 bp insertion, contains 13 polymorphisms
relative to CS (11 SNPs, indels of 1 and 3 bp) and is present only in the
accession Kanred. Four of the polymorphisms (all SNPs) occur in the Rht-B1
ORF and two result in predicted amino acid changes (G15R (Figure 5.3,
coord. 15) and M25I (Figure 5.3, coord. 25)) that occur upstream of the
DELLA domain. The B10 haplotype is composed of two accessions (Cappelle
Desprez and Hobbit „Sib‟) and differs from the B4 haplotype by an A/T SNP at
NC -1487. The UK subset of Rht-B1+flank sequences contained six
haplotypes (B3, B6, B8-B11) of the eleven present in the BW1 set and 19 of
the 22 PS (Table 5.5). The PS in the UK subset included both of the large
indels and four of the five predicted amino acid changes present in the full
BW1 set (the haplotype B5 stop codon is absent). Among the UK lines,
haplotype diversity was 0.88 and = 1.13 × 10⁻³.
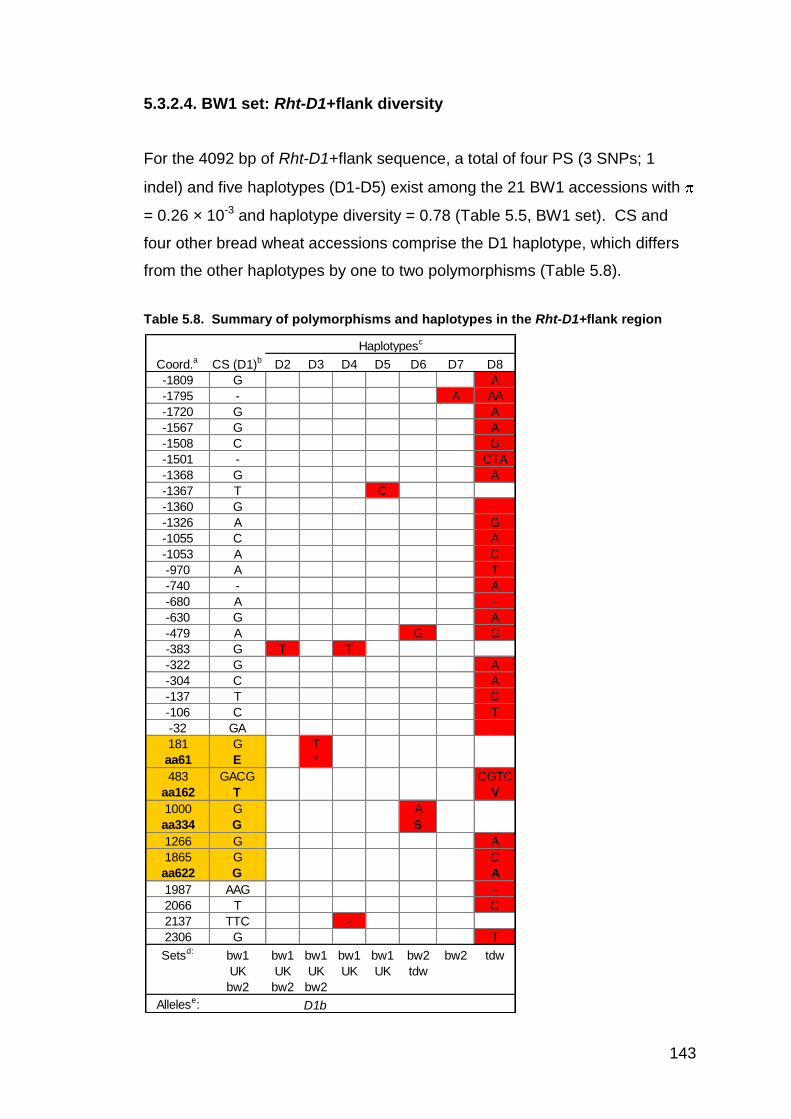
143
5.3.2.4. BW1 set: Rht-D1+flank diversity
For the 4092 bp of Rht-D1+flank sequence, a total of four PS (3 SNPs; 1
indel) and five haplotypes (D1-D5) exist among the 21 BW1 accessions with
= 0.26 × 10⁻³ and haplotype diversity = 0.78 (Table 5.5, BW1 set). CS and
four other bread wheat accessions comprise the D1 haplotype, which differs
from the other haplotypes by one to two polymorphisms (Table 5.8).
Table 5.8. Summary of polymorphisms and haplotypes in the Rht-D1+flank region
Coord.a CS (D1)b D2 D3 D4 D5 D6 D7 D8
-1809 G A
-1795 - A AA
-1720 G A
-1567 G A
-1508 C G
-1501 - CTA
-1368 G A
-1367 T C
-1360 G -
-1326 A G
-1055 C A
-1053 A C
-970 A T
-740 - A
-680 A -
-630 G A
-479 A G G
-383 G T T
-322 G A
-304 C A
-137 T C
-106 C T
-32 GA -
181 G T
aa61 E *
483 GACG CGTC
aa162 T V
1000 G A
aa334 G S
1266 G A
1865 G C
aa622 G A
1987 AAG -
2066 T C
2137 TTC -
2306 G T
Setsd: bw1 bw1 bw1 bw1 bw1 bw2 bw2 tdw
UK UK UK UK UK tdw
bw2 bw2 bw2
Allelese: D1b
Haplotypesc

144
a Nucleotide coordinates that mark the locations of polymorphisms present amongst the
accessions are shown relative to the start nucleotide of the Chinese Spring (CS) Rht-D1
sequence with negative numbers referring to sequence 5‟ of the open reading frame (ORF).
Nucleotide changes occurring in the ORF are indicated in orange background with predicted
amino acid (aa) changes shown in bold font directly below with affected residue indicated.
b Nucleotides present in the reference sequence of CS are as shown with missing sequence
relative to other haplotypes denoted by a “-“. Where predicted amino acid changes occur, the
amino acid present in CS is shown as a 1-letter code in bold font directly below the causative
nucleotide change. The (D1) denotes that CS is representative of haplotype D1.
c For haplotypes D2-D8, nucleotide and amino acids are indicated in red background where
haplotypes differ from CS.
d The sets of accessions containing the haplotypes are indicated. bw1 = bread wheat 1; UK
denotes bw1 varieties with agronomic significance in the United Kingdom. bw2 = bread wheat
2; tdw = tetraploid/diploid wheats. Haplotype D6, which contains only INRA_13812 was used
as part of the bw2 and tdw sets. Accessions and haplotypes of each set shown in Table 5.1.
e Previously identified GA insensitive alleles are indicated.
Haplotype D2 of the BW2 set differs from CS by a single G/T SNP at NC -383.
Haplotype D3 consists of the eight accessions that contain the Rht-D1b semi-
dwarf allele (Table 5.1). The D3 sequence is identical to CS with the
exception of the Rht-D1b causative SNP (G/T) at residue 61 of Rht-D1 (Peng
et al., 1999), which converts a glutamic acid (E) residue in CS to a stop codon
(*) (Figure 5.3, coord. 63). Haplotype D4 is present in four BW1 accessions
and contains the upstream SNP (NC -383) found in haplotype D2 and a 3 bp
deletion downstream of the Rht-1 ORF (NC 2137). Haplotype D5 is present in
a single accession (Soissons) and differs from CS by only a T/C SNP (NC -
1367). The UK subset of accessions contain all of the Rht-D1+flank BW1
haplotypes and PS with = 0.29 × 10⁻³ and haplotype diversity = 0.80.
5.3.3. Genetic diversity of the Rht-1+flank region of the BW2 set
5.3.3.1. BW2 set: Genotype and phenotype results
Chromosome IV marker data was used in an attempt to select accessions
with the most diverse 4A, 4B, and 4D chromosomes amongst the INRA
BWCC for sequence analysis. The lines selected for sequencing of the Rht-

145
A1+flank region contained 116 of the 147 4A alleles found amongst the INRA
BWCC, the lines selected for sequencing of Rht-B1+flank contained 72 of the
93 4B alleles, and the lines selected for sequencing of Rht-D1+flank
contained 39 of the 52 4D alleles (data not shown). A wide range of plant
heights (54-189 cm when grown in the UK) and GA treatment differences
(difference in mean seed-to-first-ligule (STFL) lengths of seedlings in the GA+
treatment minus STFL lengths of seedlings in the GA- treatment, which is a
measure of GA sensitivity; described in Chapter 6) of 1.5 to 50.3 mm occur
among the sequenced accessions (Table 5.9). The GA sensitivity and plant
heights of the sequenced accessions cover the ranges found in the entire
INRA BWCC as presented in Chapter 6. Among the accessions selected for
Rht-B1+flank sequencing, the alleles Rht-B1a, Rht-B1b, the 160 bp insertion,
and the 197 bp insertion are each represented. Among the Rht-D1+flank
sequences, the Rht-D1a and Rht-D1b alleles are both represented.
Table 5.9. Genotype and phenotype summary of the Bread Wheat 2 (BW2) set
Code Name
Gen-
omes
seq.d
Rht-
B1
ins.
Rht-
B1a/
B1b
Rht-
D1a/
D1b
Plant ht.
(cm)
GA trt.
diff.
(mm)
INRA_00537 CH62022 A fill 160 B1a D1a fill 114 19.6
INRA_00748 A.4 A NP B1a D1a 160 25.7
INRA_00822 Aifeng-4 A 197 B1a D1b 86 13.9
INRA_00957 Arawa B 197 B1a D1a 137 27.3
INRA_01192 Balkan D NP B1a D1a 107 36.2
INRA_01697 Bung Epi Blanc D NP B1a D1a 157 50.3
INRA_01974 CF4563-1-5-3-2-5 A NP B1b D1a 94 2.2
INRA_02135 Chinese Spring - NP B1a D1a 136 38.5
INRA_02411 Daeraad A 197 B1a D1a 130 33.5
INRA_03170 Fronthatch B NP B1a D1a 140 41.0
INRA_03220 G72300 D NP B1a D1a 146 21.3
INRA_03485 H93-70 A NP B1a D1a 172 24.3
INRA_03942 JO3045 D NP B1a D1a 146 23.2
INRA_03970 Jufy II B 160 B1a D1a 127 29.7
INRA_04645 Mars De Suede Rouge Barbu D NP B1a D1a 183 33.3
INRA_04796 Miche A 160 B1a D1a 121 22.8
INRA_04901 Mocho De Espiga Bianca A 197 B1a D1a 135 38.3
INRA_05096 N67M2 D NP B1b D1b 54 1.5
INRA_05260 Norin 60 A NP B1a D1b 100 1.7
INRA_05816 Precoce A Barbe Blanche A 197 B1a D1a 153 15.8
INRA_06047 Redman D NP B1a D1a 137 17.7
INRA_06318 Rouge De Marchissy B NP B1a D1a 189 23.8
INRA_06396 S975-A4-A1 D NP B1a D1a 89 17.4
INRA_06740 Strubes Dickkopf A 160 B1a D1a 146 20.0
GenotypebAccessionsa Phenotypec

146
Table 5.9 (continued). Genotype and phenotype summary of the Bread Wheat 2 (BW2)
set
a The BW2 accessions are a subset of the INRA BWCC and the genotype and phenotype
data for the whole collection are presented in Chapter 6.
b 160, 197 indicate the presence of a 160 or a 197 bp insertion 5' of Rht-B1; NP = 160 or 197
bp insertion not present. Semi-dwarf (Rht-B1b and Rht-D1b) alleles are shown in bold font.
c Plant heights were measured using plants grown outdoors in pots at NIAB (Cambridge, UK)
as described in section 6.2.3. GA treatment difference (GA trt. diff) refers to difference in
mean seed-to-first-ligule (STFL) lengths of seedlings in the GA+ treatment minus STFL
lengths of seedlings in the GA- treatment (described in section 6.2.4).
d Cadenza and Chinese Spring (both listed as "-") were sequenced as part of the BW1 set
using different seed sources and are included for genotypic and phenotypic comparisons.
5.3.3.2. BW2 set: Rht-A1+flank diversity
The 16 Rht-A1+flank sequences from the BW2 set contained 23 PS (20 SNPs
and 3 indels) and six haplotypes (A2 and A5-A9) with = 0.68 × 10⁻³ and
haplotype diversity = 0.62 (Table 5.5, BW2 set). Five of the haplotypes (A5-
Code Name
Gen-
omes
seq.d
Rht-
B1
ins.
Rht-
B1a/
B1b
Rht-
D1a/
D1b
Plant ht.
(cm)
GA trt.
diff.
(mm)
INRA_07040 Tremesino Meira B NP B1a D1a 155 36.3
INRA_08194 Neelkant D NP B1b D1a 121 19.0
INRA_08254 Cadenza - NP B1a D1a 105 31.0
INRA_08287 DC147U D 197 B1a D1b 118 4.7
INRA_09077 Non Plus Extra B 160 B1a D1a 149 28.7
INRA_13310 Fruh Weizen B 160 B1a D1a 167 20.0
INRA_13436 Fondard Crespin D NP B1a D1a 165 27.0
INRA_13445 Volt D NP B1b D1a 91 11.3
INRA_13471 Ornicar A NP B1b D1a 90 7.7
INRA_13812 W7984 A B D NP B1b D1a 112 14.2
INRA_13861 Auguste B 197 B1a D1b 80 8.4
INRA_15950 AS68VM4-3-2/TJB636 13 D 197 B1a D1b 106 5.7
INRA_23891 Landrace B NP B1a D1a 142 15.0
INRA_23896 Landrace D NP B1a D1a 161 24.8
INRA_23909 Landrace A NP B1a D1a 144 40.7
INRA_23964 Thori 212-Var.8/1 A NP B1a D1a 129 32.5
INRA_23989 Landrace D NP B1a D1a 171 21.3
INRA_23995 Landrace B NP B1a D1a 150 21.8
INRA_23996 Guisuiskaya Syao-Bai-Mai A B NP B1a D1a 126 34.2
INRA_24056 Landrace B NP B1a D1a 176 36.3
INRA_24180 Palestinskaya B NP B1a D1a 139 33.7
INRA_24184 Landrace B NP B1a D1a 184 27.0
INRA_24185 Landrace B NP B1a D1a 152 30.0
Accessionsa Genotypeb Phenotypec

147
A9) and seven of the polymorphisms (Table 5.6), including two predicted
amino acid changes were not present in the BW1 set. Similar to the BW1 set,
all accessions contained the NC -1046 T insertion, which was not present in
CS. Also similar to the BW1 set, the most common BW2 haplotype is A2,
which is present in 10 of the 16 accessions. (Table 5.1). The five novel
haplotypes in BW2 differed from CS by 2 to 20 polymorphisms. Haplotype A5
is present in one BW2 line (INRA_00748) and differed from A2 by a single
SNP in the ORF (NC 565, T/A) that leads to a S189T predicted amino acid
change. The change occurs outside of a conserved domain and in the middle
of a 9-residue poly-serine string (Figure 5.3, coord. 194). Haplotype A6 is
contained in two BW2 lines and has two SNPs (NC -1046 and -599) not
present in haplotype A2. Haplotype A7 is represented by a single line
(INRA_13471) and differs from haplotype A2 by a single SNP in the ORF (G/A
at NC 994, G332S). The predicted change occurs in the VHIID protein
domain (Figure 5.3, coord. 338). Haplotype A8 differs from haplotype A2 by a
single SNP at NC -599 (also found in the A6 haplotype) and is present in only
INRA_23909. The last haplotype of the BW2 set, A9, is represented by a
single accession, INRA_23964, and has 19 polymorphisms not found in any
other BW2 line and differs from CS by a total of 20 polymorphisms, all of
which are 5‟ of Rht-A1. This haplotype is most closely related to the A4
haplotype (from BW1), differing by only three PS (NC -998, -894, and -820).
5.3.3.3. BW2 set: Rht-B1+flank diversity
The 16 accessions of the BW2 set that were sequenced for Rht-B1+flank
contained seven haplotypes (B1, B6, and B9-B13) and 19 PS (14 SNPs and 5
indels) with = 0.76 × 10⁻³ and haplotype diversity = 0.75 (Table 5.5, BW2
set. Only two haplotypes (B12 and B13) and one PS not present in the BW1
set were discovered in this set (Table 5.7). The novel PS is a 1 bp T insertion
in the Rht-B1 ORF that leads to a predicted frameshift mutation in haplotype
B12, which is present in only INRA_23995. The Rht-B1+flank nucleotide
sequence of haplotype B12 is otherwise identical to CS. The T insertion
precedes NC 984 and occurs near the beginning of the C terminus of the Rht-

148
B1 protein (residue 328 of Rht-B1) in the VHIID protein motif (Figure 5.3,
coord. 333). The resulting protein is predicted to contain 633 amino acids
with a stop codon encoded by NCs 1899 to 1901. The other new haplotype in
the BW2 set, haplotype B13, differs from CS by three polymorphisms
previously identified in the BW1 set: a C/T SNP (NC -131), a G/C SNP (NC
43) leading to a predicted G15R change, and a CTA insertion (NC 2191),
which did not occur together in other haplotypes. This haplotype is present
only in the line INRA_07040. The remaining 14 accessions have previously
identified haplotypes (Table 5.1). Eight of the accessions contained the B1
haplotype, which was only found in CS among the BW1 set. A single
accession (INRA_13812) contained the Rht-B1b semi-dwarf allele and it has
sequence identical to the BW1 lines carrying this allele (haplotype B6). The
remaining accessions belonged to haplotypes B9 (two accessions), B10 (two
accessions), and B11 (one accession).
5.3.3.4. BW2 set: Rht-D1+flank diversity
Among the 16 BW2 Rht-D1+flank sequences there are 5 haplotypes (D1-D3,
D6-D7) and 5 PS (4 SNPs and 1 indel) with = 0.20 × 10⁻³ and haplotype
diversity = 0.67 (Table 5.5, BW2 set). Two of the haplotypes (D6 and D7) and
three of the PS were not found in the BW1 set (Table 5.8). Two of the novel
PS are found in haplotype D6, which otherwise is identical to the CS
haplotype. One of these is a G/A SNP that occurs in the ORF at NC 1000
leading to a predicted G334S change (Figure 5.3, coord. 338). The residue
change occurs in the VHIID conserved domain and at the equivalent residue
where a glycine/serine substitution occurs on the A genome in haplotype A7.
The second SNP (A/G) in this haplotype occurs upstream of the Rht-D1 ORF
(NC -479). The sole member of this haplotype is the synthetic hexaploid
INRA_13812. The second novel haplotype, D7, contains the third
polymorphism not present in the BW1 set, a 1 bp insertion relative to CS at
NC -1795. This is the only polymorphism that distinguishes this haplotype
(present only in INRA_23896) from CS. Nine of the remaining 14 accessions
have sequence identical to CS, belonging to haplotype D1 (Table 5.1). Two

149
accessions belong to haplotype D2. Lastly, three BW2 accessions contain
the Rht-D1b allele and have sequence identical to the BW1 accessions
carrying the Rht-D1b allele and belong to haplotype D3.
5.3.4. Genetic diversity of the Rht-1+flank region of the TDW set
5.3.4.1. TDW set: Genotype and phenotype results
Three of the TDW lines (T. dicoccoides 57, T. dicoccoides 65, and
SS7010073) were phenotyped and genotyped alongside the BW1 lines (Table
5.4). The D genome of INRA_13812 is derived from Ae. tauschii so the Rht-
D1+flank sequence was analysed as part of the TDW set in addition to being
analysed as part of the BW2 set. Phenotype and genotype data of
INRA_13812 is shown in Table 5.9. T. urartu was not grown. Rht-B1b and
Rht-D1b were not present among the TDW sequences.
5.3.4.2. TDW set: Rht-A1+flank diversity
There are 64 PS (16 indels and 48 SNPs) among the four A genome
sequences of the TDW set and 49 of the PS are not present in the two BW
(BW = combined BW1 and BW2) sets and = 5.94 × 10⁻³ (Table 5.5). The
four Rht-A1+flank sequences from the TDW set each comprise unique
haplotypes (A10-A13) not present among the BW sets (Table 5.6). There are
no Rht-A1+flank PS that distinguish all of the TDW sequences from all of the
BW sequences. Only five of the 64 PS found among the TDW sequences are
located in the Rht-A1 ORF and none result in a predicted amino acid change.
Of the 16 indels present in the TDW Rht-A1+flank sequences, the largest is
six bp in length. The TDW Rht-A1+flank sequence most similar to CS is
SS7010073 (haplotype A10), which has an A genome derived from
domesticated emmer (T. dicoccum). Haplotype A10 differs from CS by 8 PS
(7 SNPs and a 3 bp indel), four of which were not present in any of the BW
sequences. The wild emmers T. dicoccoides 57 (haplotype A11) and T.
dicoccoides 65 (haplotype A12) differ from CS by 19 polymorphisms (18

150
SNPs and 1 bp indel) and 16 polymorphisms (14 SNPs, a 4 bp indel, and a 5
bp indel), respectively. Haplotype A11 most closely resembles the BW
haplotypes A9 (differing by only a single bp insertion at NC -1065) and A4
(four polymorphisms). Haplotype A12 contains six polymorphisms not found
in the BW sets. Of all the A genome sequences, T. urartu (haplotype A13)
contained the largest number of PS (53) relative to CS and 39 of these, which
is more than half of all the Rht-A1+flank PS found among all the accessions,
are unique to T. urartu. The TDW lines share several of the polymorphisms
that separate them from CS and the other BW sequences, but also differ from
one another by at least 15 polymorphisms.
5.3.4.3. TDW set: Rht-B1+flank diversity
The three TDW Rht-B1+flank sequences are each unique haplotypes (B14-
B16) that are not present in the BW sets (Table 5.7). Among these
sequences = 4.15 × 10⁻³ and there are 31 PS (27 SNPs and 4 indels), 27 of
which are not are not present among any of the BW sequences (Table 5.5).
All three of the TDW haplotypes contain the 197 bp insertion and none
contain the 160 bp insertion. A 16 bp deletion also occurs in SS7010073
(haplotype B14) relative to CS and this deletion is not found in any other
accession. Similar to the A genome, there are no B genome PS that
distinguished all of the TDW accessions from all of the BW lines. Among the
31 PS in the Rht-B1+flank region of the TDW lines, there are five in the ORF
and only one of these leads to a predicted amino acid change. The PS
leading to a predicted amino acid change (M25I) was previously identified in
the BW accessions (Figure 5.3, coord. 25) and is present in haplotype B14
and T. dicoccoides 65 (haplotype B16). Haplotype B14 is the most dissimilar
of the three TDW haplotypes relative to the CS haplotype, differing by 23
polymorphisms while T. dicoccoides 57 (haplotype B15) and haplotype B16
differed from CS by 13 and 15 polymorphisms, respectively. The fewest PS
found between a BW haplotype and a TDW haplotype is 11, which occurs
between haplotypes B4 and B16.

151
5.3.4.4. TDW set: Rht-D1+flank diversity
The two Ae. tauschii D genome Rht-D1+flank sequences analysed in the
TDW set are derived from the synthetic hexaploids SS7010073 and
INRA_13812 (W7984). Each Ae. tauschii sequence represents a unique
haplotype (SS7010073 = haplotype D8 and INRA_13812 = haplotype D6;
Table 5.8). There are 30 PS (23 SNPs and 7 indels) between the two Rht-
D1+flank haplotypes and = 5.59 × 10⁻³ (Table 5.5, TDW set). None of the
PS found in haplotypes D6 and D8 were present among the BW accessions
(haplotype D6 is considered only as part of the TDW set in this and the
following comparison). Unlike the A and B genome Rht-1+flank sequences, a
polymorphism was identified (an A/G SNP at NC -479) that distinguishes the
D genome haplotypes of the TDW set from the D genome haplotypes of the
BW set.
As described previously in the BW2 set, haplotype D6 differs from CS by only
two PS (Table 5.8). In contrast, haplotype D8 differs by 30 PS, which consist
of 23 SNPs and seven indels that range in size from 1 to 3 bp. Six of the D8
haplotype SNPs occur in the Rht-D1 ORF and result in two predicted amino
acid changes. Four of the ORF SNPs are consecutive (NC 483 to 486)
resulting in a GACG/CGTC change. The SNPs at NC 484 to 486 result in a
T162V change on Rht-D1 (Figure 5.3, coord. 165). The second predicted
amino acid change that occurs between CS and haplotype D8 involves a G/C
SNP at NC 1865 that results in a G622A predicted amino acid change (Figure
5.3, coord. 626). Both of the amino acid changes occur outside of conserved
protein domains. The SS7010073 nucleotides and amino acids associated
with the T162V and G622A changes on Rht-D1 match the Rht-A1 and Rht-B1
sequences of CS (Figure 5.3), indicating that the SS7010073 Rht-D1
sequence is more closely related to the ancestral Rht-1 sequence of wheat
than are CS or the other BW Rht-D1 sequences.
To determine the sources of the T. dicoccum and Ae. tauschii lines used to
create the SS7010073 synthetic, the Rht-1 genes of T. dicoccum accession

152
„JIC 1070026‟ and Ae. tauschii accession „JIC 2220053‟, which are thought to
be the SS7010073 parental lines (S. Reader, JIC), were sequenced. For „JIC
1070026‟, the sequence of the Rht-A1 and Rht-B1 ORFs and the flanking 500
bp upstream and 439 bp downstream perfectly matched the colinear
sequences in SS7010073. Similarly, for „JIC 2220053‟, the Rht-D1 ORF and
flanking 500 bp 5‟ and 439 bp 3‟ perfectly matched the colinear D genome
sequence of SS7010073. These results suggest that „JIC 1070026‟ and „JIC
2220053‟ are likely the parents of SS7010073.
5.3.5. Comparisons of the Rht-1+flank regions among the A, B, and D
genomes of the bread wheat sets
Among the three genomes of the two BW sets, the B genome contains the
greatest level of nucleotide diversity ( = 0.86 x 10⁻³), followed by the A ( =
0.49 x 10⁻³) and D ( = 0.24 x 10⁻³) genomes (Table 5.5, BW1+BW2).
However, in terms of Watterson‟s theta, the genomes rank A > B > D. The B
genome contains the greatest number of haplotypes (13) relative to the A (9
haplotypes) and D (7 haplotypes) genomes in BW1+BW2 and has the highest
haplotype diversity (0.89) followed by the D (0.76) and A genomes (0.43).
The low haplotype diversity among the A genome sequences results from the
predominance of a single haplotype (A2) that accounts for 28 of the 37 (76%)
of the Rht-A1+ flank sequences among the BW1+BW2 sets (Figure 5.4).
Similarly, the D genome sequences belong mainly to two haplotypes (D1 and
D3), which contain 25 of the 37 (68%) of the Rht-D1+ flank sequences.
However, on the B genome, no haplotype accounts for more than nine (25%)
of the Rht-B1+ flank sequences.

153
Figure 5.4. Distribution of haplotypes among the (A) A genome, (B) B genome, and (C)
D genome sequences of the bread wheat (BW1 and BW2) sets. Haplotype designations
are shown followed by the number of accessions (37 accessions per genome) containing that
haplotype.
In the bread wheat sequences, the largest number of Rht-1 PS occur on the A
genome (25 PS; 0.61% of the sites polymorphic) followed by the B genome
(23 PS; 0.56% of the sites polymorphic), and the D genome (7 PS; 0.17% of
the sites polymorphic) (Figure 5.5). The distribution of PS among the 5‟, ORF,
and 3‟ regions varied greatly among the genomes of the bread wheats. For
the A genome, the frequency of PS in the 5‟ region was seven fold larger than
in the ORF and no PS were found in the 3‟ region. In the B genome, the
frequency of PS was greatest in the 3‟ region. For each genome, the
frequency of PS in the ORF was less than that of the non-coding regions;
however, this difference was less pronounced in the B genome. The B
genome contains eight of the 13 ORF PS and six of the 11 predicted amino
acid changes among the bread wheats. Averaged across the three genomes
A01; 1
A02; 28
A03; 1
A04; 1
A05; 1
A06; 2
A07; 1 A08; 1A09; 1
B01; 9
B02; 1
B03; 4
B04; 1
B05; 1
B06; 6B07; 1
B08; 1
B09; 5
B10; 4
B11; 2B12; 1
B13; 1
D01; 14
D02; 5
D03; 11
D04; 4
D05; 1 D06; 1D07; 1
(A) (B)
(C)

154
of the BW accessions (Figure 5.5, Bread Wheat ABD), the frequency of PS in
the Rht-1 ORF was less than half of that found in the 5‟ or 3‟ regions. This
trend was even more pronounced in the TDW lines, in which the frequency of
PS in the 5‟ and 3‟ regions was 11 times and 3 times higher, respectively,
than in the ORF (Figure 5.5; Tetraploid/Diploid wheat ABD).
Figure 5.5. Percentage of sites that are polymorphic in the Rht-1 open reading frame
(ORF) and flanking 5’ and 3’ regions in the bread wheat and tetraploid/diploid
accessions. For the bread wheat accessions, the A, B, and D genomes are shown
separately and then combined (ABD).
5.3.6. Predicted amino acid changes in Rht-1
Among the Rht-1+flank sequences of the natural hexaploids (all sequences
from the BW sets excluding the D genome of INRA_13812), there are twelve
ORF polymorphisms that result in ten predicted amino acid changes (Tables
5.5 to 5.8). Among the nine TDW sequences, there are 15 ORF
polymorphisms and four predicted amino acid changes (Tables 5.5 to 5.8).
0.0%
0.2%
0.4%
0.6%
0.8%
1.0%
1.2%
1.4%
1.6%
1.8%
2.0%
A B D ABD ABD
5'
ORF
3'
Overall
Bread WheatTetraploid/Diploid
% o
f si
tes
po
lym
orp
hic
0
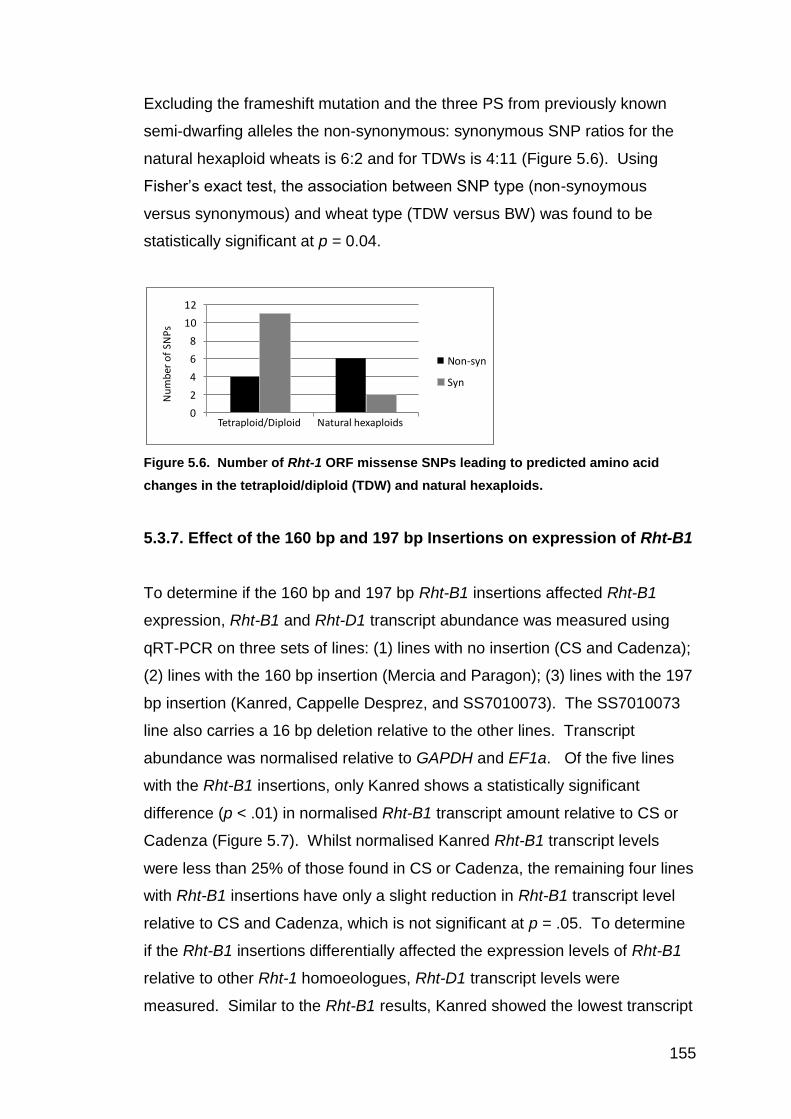
155
Excluding the frameshift mutation and the three PS from previously known
semi-dwarfing alleles the non-synonymous: synonymous SNP ratios for the
natural hexaploid wheats is 6:2 and for TDWs is 4:11 (Figure 5.6). Using
Fisher‟s exact test, the association between SNP type (non-synoymous
versus synonymous) and wheat type (TDW versus BW) was found to be
statistically significant at p = 0.04.
Figure 5.6. Number of Rht-1 ORF missense SNPs leading to predicted amino acid
changes in the tetraploid/diploid (TDW) and natural hexaploids.
5.3.7. Effect of the 160 bp and 197 bp Insertions on expression of Rht-B1
To determine if the 160 bp and 197 bp Rht-B1 insertions affected Rht-B1
expression, Rht-B1 and Rht-D1 transcript abundance was measured using
qRT-PCR on three sets of lines: (1) lines with no insertion (CS and Cadenza);
(2) lines with the 160 bp insertion (Mercia and Paragon); (3) lines with the 197
bp insertion (Kanred, Cappelle Desprez, and SS7010073). The SS7010073
line also carries a 16 bp deletion relative to the other lines. Transcript
abundance was normalised relative to GAPDH and EF1a. Of the five lines
with the Rht-B1 insertions, only Kanred shows a statistically significant
difference (p < .01) in normalised Rht-B1 transcript amount relative to CS or
Cadenza (Figure 5.7). Whilst normalised Kanred Rht-B1 transcript levels
were less than 25% of those found in CS or Cadenza, the remaining four lines
with Rht-B1 insertions have only a slight reduction in Rht-B1 transcript level
relative to CS and Cadenza, which is not significant at p = .05. To determine
if the Rht-B1 insertions differentially affected the expression levels of Rht-B1
relative to other Rht-1 homoeologues, Rht-D1 transcript levels were
measured. Similar to the Rht-B1 results, Kanred showed the lowest transcript
0
2
4
6
8
10
12
Ancestral Lines Natural Hexaploids
Non-syn
Syn
Nu
mb
er o
f SN
Ps
Tetraploid/Diploid Natural hexaploids

156
level after normalisation (less than 25% CS or Cadenza), which was
significant at p < .01. The Cappelle-Desprez Rht-D1 transcript level was also
significantly reduced relative to CS and Cadenza (p < 0.05), but was still 64%
and 75% of Cadenza and CS, respectively. In Kanred, the expression levels
of GAPDH and EF1a normalisation genes were unusually high relative to the
other accessions, which accounts for most of the reduction in Rht-B1 and Rht-
D1 expression levels relative to the other accessions.
Figure 5.7. Expression of Rht-B1 and Rht-D1 in accessions with the Rht-B1 160 bp
insertion (160 bp ins.), Rht-B1 197 bp insertion (197 bp ins.), or neither insertion (No
ins.). Normalised data is presented as the mean of the three biological replicates and error
bars denote the 95% confidence interval (2 × the standard error of the mean) of each sample.
GAPDH = Glyceraldehyde 3-phosphate dehydrogenase, EF1a = Elongation factor 1α.
5.4. DISCUSSION
Over the combined distances of the A, B, and D genome Rht-1+flank regions
(12,351 bp) from the Bread Wheat sets (BW1+ BW2; 37 sequences from each
genome), the total number of polymorphic sites (PS) is 55 (42 SNP sites; 13
indel sites) and nucleotide diversity ( ) is 0.54 × 10⁻³. The frequency of Rht-1
0.00
0.10
0.20
0.30
0.40
0.50
0.60
0.70
0.80
0.90
1.00
Ch
ines
e Sp
rin
g
Cad
enza
Mer
cia
Par
ago
n
Kan
red
Cap
pel
le D
esp
rez
SS1
01
007
3
Ch
ines
e Sp
rin
g
Cad
enza
Mer
cia
Par
ago
n
Kan
red
Cap
pel
le D
esp
rez
SS1
01
007
3
Rht-D1
Rht-B1
Exp
ress
ion
rela
tive
to
GA
PD
H/E
F1a
No ins.
160 bpins.
197 bpins.
No ins.
160 bpins.
197 bpins.

157
SNP sites (1 SNP/294 bp) and PS (1 PS/225 bp) falls within the range
reported in comparable bread wheat diversity studies while values are
relatively low. The following values were reported in studies in which genes
(coding and non-coding sequences) from the A, B, and D genomes were
represented: 1 SNP/91 bp, = 1.83 × 10⁻³ for the Spa1 homoeologues among
42 accessions (Ravel et al., 2009); 1 SNP/212 bp, = 0.9 × 10⁻³ for 21 genes
among 27 accessions (Ravel et al., 2006); 1 SNP/441 bp for the GAMYB
homoeologues from 42 accessions (Haseneyer et al., 2008); 1 SNP/540 bp of
wheat EST sequence from 12 accessions (Somers et al., 2003). In a study
that examined only the A and B genomes of bread wheat, 1 PS/362 bp and
= 0.83 × 10⁻³ existed among 41 accessions (Haudry et al., 2007). The
combined distance of the BW Rht-1 ORF homoeologous sequences (5601
bp) contained a low frequency of polymorphic sites relative to non-coding
regions, a pattern also seen in other bread wheat genes (Ravel et al., 2006;
Haseneyer et al., 2008; Ravel et al., 2009).
The nucleotide diversity ( = 0.41 × 10⁻³) of the BW Rht-1 ORF accessions is
only a fraction of the values reported for the ORF of Rht-1 orthologues in
maize, sorghum, or pearl millet (Pennisetum glaucum). For maize, the nearly
full-length D8 (an Rht-1 orthologue) sequences of 92 inbreds from three
diverse gene pools had a value of 1.8 × 10⁻³ (4 times that in wheat Rht-1)
(Thornsberry et al., 2001). For sorghum, the partial-length sequences of the
Rht-1 orthologue analysed in 26 inbreds from West and Central Africa
averaged had = 1.63 × 10⁻³ (4 times that in wheat Rht-1) (Li et al., 2010). In
pearl millet, the partial-length sequences of the Rht-1 orthologue measured in
20 inbreds from West and Central Africa had = 7.04 × 10⁻³ (17 times more
than wheat Rht-1) (Li et al., 2010). The relatively low diversity observed in the
bread wheat Rht-1 coding region relative to the Panicoideae species may be
the result of an overall reduction in the diversity of bread wheat relative to
these species and is in agreement with the findings of Wicker et al. (2009)
that relative to maize, sequence diversity within wheat genes is minimal.
Reduced Rht-1 diversity in wheat relative to maize, sorghum, and pearl millet
may also have resulted from extremely strong selection for the semi-dwarfing

158
alleles Rht-B1b and Rht-D1b over the last 50 years that would be expected to
increase the frequency of these two haplotypes at the expense of other
haplotypes, although evidence of some selection at the D8 locus has also
been reported in maize (Thornsberry et al., 2001). Differences in
experimental sets (e.g. unequal representations of the total diversity in each
of the crops) between studies represents another factor that contributes to the
interspecific differences reported here.
The A genome of the BW sets contained an intermediate number of
haplotypes (9), the lowest haplotype diversity (0.43), an intermediate
nucleotide diversity value ( = 0.49 × 10⁻³), and the highest number (25) of
polymorphic sites (Table 5.5, Rht-A1:BW1+BW2). Although the bread wheat
A genome sequences contain the largest number of PS among the genomes,
80% result from only two haplotypes (A4 and A9) and 76% of all A genome
sequences belong to a single haplotype (A2) (Figure 5.4). For the UK subset,
all 12 Rht-A1+flank UK sequences were identical and belonged to single
haplotype, A2 (Table 5.5). The lack of Rht-A1+flank diversity in the UK subset
relative to the other BW sequences is surprising because the UK bread
wheats captured most of the Rht-B1+flank and Rht-D1+flank diversity and
haplotypes. In contrast, genetic diversity of the A genome of UK bread wheat
varieties was previously found to be significantly higher than on the B and D
genomes (White et al., 2008). Also, while selection at Rht-B1 and Rht-D1 is
known to have occurred, no known selection has occurred at the Rht-A1
locus. The lack of Rht-A1 diversity in UK wheats suggests the possibility that
this locus may be linked to an additional trait that has been selected for in UK
bread wheat varieties. The A4 and A9 haplotypes, which contain 80% of the
Rht-A1+flank PS in the BW sets differ by only three polymorphisms and are
each present in only one accession. Both haplotypes are closely related to
the A11 haplotype from T. dicoccoides 57 with A9 differing by one
polymorphism and A4 differing by four polymorphisms. A4 is present in „Siete
Cerros‟, a Mexican line released from the CIMMYT programme in the 1960s
that also contains the Rht-B1b allele. Of the Mexican varieties exported to
developing nations, offspring of „Siete Cerros‟ (also known as „cross 8156‟

159
and by several other designations) was the most widely planted as of 1974
(Dalrymple, 1976) suggesting this haplotype may be fairly widespread.
Haplotype A9 is present in INRA_23964 (Thori 212-Var.8/1), a fixed line that
was released in Pakistan in 1934 (F. Balfourier, pers. comm.), which does not
contain Rht-B1b or Rht-D1b (see Appendix VII). A4 and A9 represent
potentially useful sources of diversity in the Rht-A1 region, which could prove
useful considering the overall lack of haplotype diversity around Rht-A1.
Among the three genomes sequenced from the BW accessions, the Rht-
B1+flank sequences contained the greatest number of haplotypes (13), the
highest haplotype diversity (0.89), the highest nucleotide diversity ( = 0.86 ×
10-3), and an intermediate number of polymorphic sites (23) (Table 5.5, Rht-
B1+flank:BW1+BW2). Indels of 16 bp, 160 bp, and 197 bp exist among the
BW Rht-B1+flank sequences whereas no indel greater than 3 bp exists
among the equivalent Rht-A1+flank or Rht-D1+flank BW genome sequences.
In addition, six of the eleven polymorphisms predicted to alter the Rht-1 amino
acid sequence in the BW sets occur on the B genome. In previous studies,
higher genetic diversity on the B genome relative to the A and D wheat
genomes was found based on nucleotide sequence (Ravel et al., 2006;
Haseneyer et al., 2008; Li et al., 2010) and genetic marker (Huang et al.,
2002; Wang et al., 2007) comparisons. The UK subset of 12 bread wheats
represented much of the diversity found among the 37 bread wheats as six of
the 13 B genome haplotypes and 19 of the 23 PS were found in the UK
subset, including both large indels and five of the six predicted amino acid
changes.
The three large Rht-B1+flank indels (16 bp, 160bp, and 197 bp) are all located
within 1 kb of the start codon (Table 5.7). The furthest upstream indel (NCs -
694 to -679 relative CS) is a 16 bp deletion that occurs in only the synthetic
line SS7010073, which has a B genome derived from T. dicoccum. The
largest indel is 197 bp (inserted between NC -592 and -591 of CS) and the
insertion is present in five of the bread wheat lines (Kanred; Cappelle
Desprez; Hobbit 'Sib'; INRA_00957 („Arawa‟); INRA_13861 („Auguste‟)) and

160
all three TDW accessions („SS7010073‟; T. diccocoides 57; T. dicoccoides
65). Presence of the 197 bp insertion in all of the sequenced ancestral lines
and homologous sequence in colinear regions upstream of Rht-A1 and Rht-
D1 indicate that the intact sequence is the ancestral condition and that CS
and the majority of the bread wheat accessions examined here have the 197
bp sequence deleted. Colinear regions in rice and Brachypodium do not have
significant homology to the 197 bp sequence and no similarity to the
sequence was found in BLAST searches of the TREP cereal repeat database
or the NCBI nucleotide collection (nr/nt). Of the three indels, the 160 bp indel
occurs nearest to the Rht-B1 start codon (inserted between NCs -357 and -
356 of CS). Eight bread wheat lines (Alchemy; April Bearded; Avalon; Mercia;
Paragon; INRA_03970 („Jufy II‟); INRA_09077 („Non Plus Extra‟);
INRA_13310 („Fruh Weizen‟)) and no TDW lines contain the insertion. There
is no significant homology to the 160 bp insertion on the Rht-A1- or Rht-D1-
containing BAC clones indicating that the 160 bp indel is an insertion relative
to the ancestral condition. No similarity to the 160 bp insertion was found in
BLAST searches of the TREP cereal repeat database or the NCBI nucleotide
collection (nr/nt). Interestingly, the 160 bp insertion falls in the middle of the
only sequence 5‟ of Rht-1 that is highly conserved among the three CS Rht-1
homoeologues, rice and Brachypodium (Table 4.4, BLAST hit 1), suggesting
the possibility that a cis-regulatory region may be disrupted by the insertion.
The Rht-B1 indels did not clearly affect Rht-B1 transcript levels using stem
and leaf tissue collected from 5-day old seedlings (Figure 5.7). A decrease in
normalised expression levels was seen in accessions with the 16 bp, 160 bp,
or 197 bp insertions relative to lines with the insertion; however, except for
Kanred (197 bp insertion), these reductions were slight and not below the
significance threshold of p = 0.05. In Kanred, normalised Rht-B1 transcript
levels were reduced 75%, however Kanred had unusually high transcript
levels of the two normalisation genes (GAPDH and EF1a) while absolute Rht-
B1 and Rht-D1 expression levels were only slightly reduced relative to the
other lines. Hence, further experiments are required to confirm this reduction.
While no clear effect of the Rht-B1 insertion alleles on Rht-B1 transcript level
was evident in this experiment, this could relate to the age and tissue type

161
assayed. Rht-1 expression patterns in wheat have previously been shown to
differ based on tissue type and developmental stage (R. Saville, 2011) and
expression of SLN1 and SLR1 (the Rht-1 orthologues in barley and rice,
respectively) were also found to differ based on tissue type (Chandler et al.,
2002; Kaneko et al., 2003). To more fully determine whether the Rht-B1
upstream indels affect expression of this gene it will be necessary to analyze
more tissues and to sample at multiple developmental stages. The effect of
the Rht-B1 indels on plant height is not easily determined with the limited set
of data available and this will be investigated further in a larger accession set
in Chapter 6.
For the Rht-1+flank region of the bread wheat varieties, the D genome
contained the least genetic variation, having the fewest haplotypes (7), an
intermediate haplotype diversity value (0.76), the lowest nucleotide diversity
( = 0.24 × 10⁻³), and the lowest number of polymorphic sites (7) (Table 5.5,
Rht-D1:BW1+BW2). There were no large indels in the bread wheat
sequences and no amino acid changes outside of the previously described
Rht-D1b causative SNP. No haplotypes on the D genome differed by more
than four polymorphisms and two haplotypes represent 68% of the
sequences. Other studies of wheat have also found the D genome to be the
least diverse based on nucleotide sequence (Chao et al., 2009) or marker
variation (Bryan et al., 1997; Huang et al., 2002; Wang et al., 2007; White et
al., 2008). In the current study, reduced diversity in the D genome of the BW
sets may be artificially enhanced by the inclusion of 11 lines containing Rht-
D1b whereas only six lines with Rht-B1b were included in the B genome set.
The 12 UK bread wheats represented most of the Rht-D1+flank diversity
found among the bread wheats, containing five of the six haplotypes and four
of the five PS (excluding the INRA_13812 synthetic accession, which has a D
genome derived from Ae. tauschii). The paucity of polymorphisms in the Rht-
D1+flank area and the lack of predicted amino acid changes in the bread
wheat D genomes relative to the tetraploid/diploid wheats suggest that
ancestral lines will be important sources of diversity in this region.

162
The nine Rht-1+flank sequences derived from the TDW accessions
represented haplotypes not present in the BW sets (Tables 5.6, 5.7, and 5.8).
Although the TDW set consisted of only nine sequences (D genome
sequence of INRA_13812 synthetic included), it contained a combined total of
126 PS (2.4 times more than found among the 110 bread wheat sequences)
and an average of 1 PS/98 bp. Among the four A genome TDW sequences,
there were 64 PS in the Rht+1 flank region (2.5 times more than among the
37 bread wheat A genomes) and 49 were found only in the TDW accessions.
Relative to the CS Rht-A1+flank sequence, T. urartu differed by 52
polymorphisms while the T. dicoccoides lines differed by 16 to 19
polymorphisms, which agrees with prior reports that the A genome of bread
wheat is more closely related to T. dicoccoides than T. urartu (Dvorak and
Akhunov, 2005). Excluding the T. urartu sequence, the Rht-A1+flank
nucleotide diversity among the remaining emmer wheats ( = 3.08 × 10⁻³) was
still over six times greater than among the A genome sequences of the BW
sets. The Rht-A1+flank haplotypes of the TDW lines deviated from the bread
wheat haplotypes (excluding A4 and A9, described above) by seven or more
polymorphisms. The increased diversity of the three emmer sequences
compared to the BW set was seen also in the Rht-B1+flank sequences, with
nucleotide diversity ( = 4.17 × 10⁻³) of the B genomes of the T. dicoccoides
and T. dicoccum accessions being over four times greater than among BW B
genome sequences. The most similar Rht-B1+flank sequences between the
TDW and BW sets differed by 11 polymorphisms. At the Rht-1+flank region
over both the A and the B genomes, 78% of the nucleotide diversity of the T.
dicoccoides lines ( = 3.20 × 10⁻³) is absent in the bread wheat lines ( = 0.7
× 10-3), which is similar to the 69% loss found between T. dicoccoides and the
A and B genomes of bread wheat (Haudry et al., 2007). The two D genome
TDW sequences are from SS7010073 and INRA_13812 (W7984), which are
synthetics that both have D genomes derived from Ae. tauschii. Between
these two sequences there are 30 PS (over seven times more than found
among the BW D genome sequences) and none of the PS are present among
any other D genome sequences. This reduced diversity in the D genome of
bread wheat relative to Ae. tauschii is in agreement with the work of Caldwell

163
et al. (2004) who reported a 30-fold reduction in genetic diversity of bread
wheat relative to Ae. tauschii based upon analysis of the diversity of granule-
bound starch synthase (GBSS). The Rht-D1+flank sequences of
INRA_13812 and CS differ by only two polymorphisms whereas the Rht-
D1+flank regions of SS7010073 and CS differ by 30 polymorphisms. A high
degree of similarity between the D genomes of INRA_13812 and bread wheat
was also reported for GAMYB where two polymorphisms were present
(Haseneyer et al., 2008) and for nine of ten D-genome derived genes from
bread wheat that differed from the INRA_13812 by one or no polymorphisms
(Ravel et al., 2006).
A total of 13 polymorphisms (12 SNPs and a 1 bp indel) that occur in the Rht-
1 coding region resulted in amino acid changes. Three of the SNPs occur in
the DELLA motif and result in a stop codon (nonsense mutation) and these
are associated with the Rht-B1b, Rht-D1b, and Rht-B1e semi-dwarfing alleles.
No sequence variation occurred among the Rht-B1b haplotypes or among the
Rht-D1b haplotypes, most likely due to the recent introduction (beginning in
1960) of both alleles into Western wheat varieties from a single source, Norin
10 (Gale and Youssefian, 1985; Dalrymple, 1986). The Rht-B1b and Rht-D1b
haplotypes each differ from CS by only the causative SNP, indicating that the
semi-dwarf mutations may have arisen in a variety closely related to CS.
Similar geographic origins of CS (a Chinese landrace) and Norin 10 (a
Japanese line that may have been derived from Korea (Cho et al., 1980))
support this hypothesis. The third nonsense mutation occurs on the B
genome of the accession Krasnodari 1, which contains the Rht-B1e semi-
dwarfing allele (Worland, 1986). The presence of the stop codon at Rht-1
amino acid coordinate 61 (Figure 5.3) in the DELLA domain just three
residues upstream of the Rht-B1b stop codon and two residues upstream of
the respective position of the Rht-D1b stop codon on the D genome indicates
that this polymorphism likely causes or contributes to the semi-dwarf stature
of Rht-B1e. The 1 bp insertion leading to a frameshift occurs on the B
genome of INRA_23995 at Rht-1 amino acid coordinate 333 (Figure 5.3),
which is in the conserved VHIID protein domain. INRA_23995 is a Russian
landrace that has a height near the median of the BW2 accessions that do not

164
contain the Rht-B1b or Rht-D1b semi-dwarf alleles (Table 5.9). The nearest
stop codon following the frameshift occurs at coordinates 1899-1901, resulting
in a predicted protein length of 633 amino acids. The VHIID domain is part of
the C-terminus, which acts as the repression domain in SLR1 in barley (Itoh et
al., 2002). A frameshift mutation in this location would be expected to lead to
a LoF, GA-constitutive growth response phenotype of elongated and slender
stems and leaves (Ikeda et al., 2001; Gubler et al., 2002), although mutations
in the C-terminus that reduce GA sensitivity and produce a dwarf phenotype
have been reported in Brassica rapa (Muangprom et al., 2005) and maize
(Lawit et al., 2010). However, due to the buffering effects of Rht-A1 and Rht-
D1, only a dominant or semi-dominant mutation is likely to produce an
observable phenotype. However, the Rht-B1 LoF mutation in combination
with the Rht-D1b GAI allele could reduce the buffering capacity at this locus (1
GAI DELLA protein: 1 GA sensitive DELLA protein instead of 1 GAI: 2 GA
sensitive), which may result in a stronger dwarfing phenotype.
The remaining nine PS in the Rht-1 ORFs are missense changes, with only
one of these (Figure 5.3 coord. 338 (G to S) occurring in a conserved domain.
G338S occurs in the VHIID domain and occurs in the Rht-A1 ORF of
INRA_13471 and in the Rht-D1 ORF of INRA_13812. This amino acid is
otherwise conserved in the CS wheat homoeologues, and in the
Brachypodium, barley, rice, maize, and sorghum Rht-1 orthologues (Figure
3.3, coord. 357) and the Arabidopsis GAI orthologue (Tian et al., 2004),
suggesting this may be an important amino acid. The remaining missense
polymorphisms occur outside of the conserved domains, although three of
these (Figure 5.3 coords. 194 (S to T), 209 (E to G), and 483 (S to Y)) are
conserved in the Rht-1 orthologues found in Brachypodium, barley, rice,
maize, and sorghum indicating these changes could be significant. Overall,
six of the missense PS occur in the natural hexaploids and four in the TDW
lines, which is surprising considering that among the sequenced natural
hexaploid ORFs, eight SNPs were identified whereas 15 SNPs were found in
the TDW ORFs. This is the result of a significantly higher (p = .04) proportion
of non-synonymous to synonymous SNPs in the natural hexaploid ORFs
relative to the TDW ORFs (Figure 5.6). In rice, a nearly two-fold increase in

165
the ratio of non-synonymous to synonymous substitutions was found among
domesticated rice cultivars than among wild relatives with 25% of these found
to be deleterious and the result of genetic „hitchhiking‟ (Lu et al., 2006).
In summary, diversity and haplotypes in the Rht-1 region was higher on the B
genome than on the A and D genomes. Knowledge of alternative Rht-1
haplotypes is important when searching for novel sources of variation in this
region. This is directly applicable at the Rht-D1 locus where Rht-D1b is
thought to be linked to increased FHB susceptibility (Srinivasachary et al.,
2009). Also, on the A genome, the presence of only a single haplotype in UK
bread wheats could be problematic if this haplotype is associated with
detrimental agronomic issues. For future wheat breeding programmes, a pre-
existing knowledge of genetic variation around the Rht-1 loci will aid in
screening for useful alleles. The novel haplotypes and polymorphisms
discovered here require further characterisation to determine their usefulness
in wheat breeding. Characterisation of the two largest indels discovered here,
the Rht-B1 160 bp and 197 bp insertions was carried out here by measuring
Rht-B1 transcript levels and these alleles will be further characterised based
on plant height, flowering date, and GA sensitivity in Chapter 6.

166
6. RHT-1 AND PPD-D1 ASSOCIATIONS WITH HEIGHT, GA SENSITIVITY,
AND HEADING DATE IN A WORLDWIDE BREAD WHEAT COLLECTION.
6.1. INTRODUCTION
Alleles at the Rht-B1, Rht-D1, and Ppd-D1 loci have a major influence on the
adaptability of wheat to climate and modern agricultural practices. It is well
established that the homoeologous group IV Rht-B1b and Rht-D1b semi-
dwarf alleles reduce plant height (Gale and Youssefian, 1985; Flintham et al.,
1997). Plants carrying Rht-B1b, Rht-D1b, or additional alleles at these loci
that reduce plant height (summarised in Table 1.2) have reduced GA
sensitivity, which is associated with suppressed plant growth. The GA
insensitive (GAI) nature of plants containing a dwarf allele relative to the GA
sensitive (GAS) wild type alleles was first determined by Allan et al. (1959).
This finding led to the development of GA sensitivity tests to identify GAI
alleles based on stem elongation response to GA (Gale and Gregory, 1977).
GA insensitivity and semi-dwarfism in plants containing Rht-B1b and Rht-D1b
are caused by SNPs that lead to premature stop codons in the DELLA
domain, which is involved in GA signalling (Peng et al., 1999). Based on
these SNPs, perfect PCR primers were created to discriminate between
accessions carrying Rht-B1a or Rht-B1b and between accessions carrying
Rht-D1a or Rht-D1b (Ellis et al., 2002).
Ppd-D1 is mapped to the short arm of chromosome 2D, where the
photoperiod insensitive Ppd-D1a allele and the photoperiod sensitive allele
Ppd-D1b reside (Worland et al., 1988). The Ppd-D1a allele, which contains a
2,089 bp deletion in the promoter region, is associated with early flowering
under both short and long days, with the strongest effects occurring under
short days (Beales et al., 2007). Worland et al. (1988) reported that Ppd-D1a
varieties had ear emergence accelerated by six to eight days when October-
sown in the UK (Norwich). Perfect PCR markers have been developed to
detect the presence/absence of the 2,089 bp deletion (Beales et al., 2007).
The Ppd-D1a allele is also associated with a reduction in plant height, but the
effect has been difficult to estimate because in most varieties the allele is

167
present with Rht8, a GA sensitive semi-dwarf allele. The Ppd-D1 and Rht8
loci are linked at estimated genetic distances of 20.9 cM by Worland et al.,
(1998) and 21.7 cM by Gasperini (2010). Ppd-D1a and Rht8 were introduced
together into European wheats through the Japanese variety Akakomugi in
the early 20th century (Giorgi et al., 1982; Worland, 1999). Worland et al.
(1998) reported an 18 cm reduction in substitution lines containing Rht8+Ppd-
D1a with 10 cm of the height reduction contributed by Ppd-D1a and 8 cm by
Rht8. More recently, Gasperini (2010) genotyped the same substitution line
population used by Worland et al. (1998) using the Ppd-D1a perfect markers
to differentiate the effects of Rht8 and Ppd-D1a on height. The author
reported that the presence of Rht8 resulted in a 14 cm (13%) height reduction
while Ppd-D1a only accounted for a 4 cm (3%) height reduction.
In Chapter 5 of this thesis, sequencing of the Rht-B1 region in 37 diverse
wheat accessions led to the discovery of varieties that contained insertions
within 600 bp of the start codon. One of the insertions was 160 bp in size,
occurring 356 bp upstream of the Rht-B1 ORF (CS reference sequence) and
was present in eight varieties. The second insertion was 197 bp in size,
occurred 591 bp upstream of the ORF and was found in six accessions
including all three of the tetraploid wheats. The locations of the insertions just
upstream of Rht-B1 suggest that they could be within the promoter region.
The 160 bp insertion occurs in the middle of a 120 bp stretch of sequence that
is highly conserved in all three wheat Rht-1 homoeologues and in Rht-1
orthologues in rice and Brachypodium (section 3.3.2.2., Table 3.5) and the
insertion could thus affect regulation of Rht-B1 expression, although this could
not be confirmed by analysis of one-week old seedlings (section 5.3.7). The
effect of these alleles on plant phenotype, however, is yet to be investigated.
The INRA core collection of 372 bread wheat accessions (INRA BWCC) is a
subset that contains an estimated 98% of the genetic diversity of a larger set
of 3,942 accessions that originated from 45 geographical areas (Balfourier et
al., 2007). The INRA BWCC has been genotyped with genome-wide sets of
DArT (578 polymorphic) and SSR markers (approximately 100 polymorphic)
allowing population structure to be estimated (F. Balfourier, INRA, pers.

168
comm.). In addition, plant heights and ear emergence of the full set was
recorded in Clermont-Ferrand, France (Bordes et al., 2008). The collection
represents a valuable resource for evaluating agronomic characteristics and
allelic frequencies and for performing association analyses.
The objectives of this Chapter are to (1) characterise the INRA BWCC for
plant height, GA sensitivity, and heading date, (2) determine the prevalences
of Rht-B1b, Rht-D1b, Ppd-D1a, and the Rht-B1 160 bp and 197 bp insertions
in the collection, (3) determine associations that exist between phenotype and
genotype, and (4) search for novel GAI alleles in the collection.
6.2. MATERIALS AND METHODS
6.2.1. Germplasm
Seed of 368 bread wheat varieties from the INRA BWCC were provided by F.
Balfourier, INRA, Clermont-Ferrand, France. This represents the entire set of
bread wheat lines in the INRA 372CC collection (four of the original
accessions were later found to not be hexaploid (F. Balfourier, pers. comm.)).
Several control lines were utilised in the experiments including Rht-1 NILs in
the backgrounds of Cappelle Desprez (CD), Mercia, April Bearded (AB), and
Bersee, which were provided by M. Ambrose (JIC). The NILs with
introgressed semi-dwarf alleles will be given the nomenclature „Variety
name_Introgressed allele‟ in the text. The controls also include the Ppd-D1a
substitution lines (SLs) in the backgrounds of Mercia and CS, which were
provided by D. Laurie (JIC). The SLs were developed by C. Law and T.
Worland at the JIC and contain a whole 2D chromosome substitution from
Ciano 67 (D. Laurie, pers. comm.) and are referred to as „Mercia_C67 2D‟ and
„CS_C67 2D‟ in the text. Additional control lines included Norin 10 (Rht-
B1b+Rht-D1b; USDA-ARS PI156641) and Xi19 (Rht-B1a+Rht-D1b) and
Robigus (Rht-B1b+Rht-D1a), obtained from the NIAB DUS collection.

169
6.2.2. DNA extraction and genotyping
All DNA extractions were performed as described in section 4.2.2 using the
CTAB method. For the INRA BWCC lines, DNA of fixed lines was extracted
from bulks of four plants and DNA of landraces was extracted from individual
plants. Both replicates of the INRA BWCC fixed lines and four plants of each
landrace were genotyped for Rht-B1a/b, Rht-D1a/b, Ppd-D1a/b, and the Rht-
B1 160 bp and 197 bp insertions. Each control replicate (four plants) was
bulked and genotyped for Rht-B1a/b, Rht-D1a/b, and Ppd-D1a/b.
The Rht-B1a/b and Rht-D1a/b PCR assays were performed as described in
section 5.2.3. The Ppd-D1a/b assay is slightly modified from Beales et al.
(2007). The multiplex PCR reaction was performed in a 10 µl volume
containing 1 × Green GoTaq Reaction Buffer (Promega), 0.2 mM dNTPs, 1.5
mM MgCl2, 0.5 µM each of primer 414F-F10 and primers 414F-R4 and DgR3
(see Appendix I for sequences), 0.125 µl Taq Polymerase, and 2 ng of DNA
template. The PCR profile consisted of 95°C for 2 min, followed by 40 cycles
of [95°C for 20 s; 55°C for 20 s, and 72°C for 40 s], and 5 min at 72°C.
Amplified products were separated in a 1.5% agarose gel in 1 × TBE buffer
and visualised under UV light with ethidium bromide. A 297 bp product is
amplified in accessions with Ppd-D1a and a 414 bp product is amplified in
accessions with Ppd-D1b.
A multiplex PCR assay was developed to detect the Rht-B1 160 bp and 197
bp insertions. PCR reactions utilised a 10 µl reaction mix that contained 1 ×
Green GoTaq Reaction Buffer (Promega), 3% glycerol, 0.2 mM dNTPs, 1.5
mM MgCl2, 1 µM primer Rht-F11, 0.33 µM primers 160-R1, 197-R1 and Rht-
ABD-R9 (sequences shown in Appendix I), 0.125 µl Taq Polymerase, and 2
ng of DNA template. The PCR profile consisted of 95°C for 5 min, followed by
40 cycles of [95°C for 30 s; 60°C for 30 s, and 72°C for 1 min], and 5 min at
72°C. Amplified products were separated in a 1.5% agarose gel in 1 × TBE
buffer and visualised under UV light with ethidium bromide. Primers Rht-F11
and Rht-ABD-R9 flank the two insertions. In lines without an insertion these
primers amplify a 1050 bp product. Primer 160-R1 lies within the 160 bp
170
insertion and is designed to anneal only in lines with this insertion, thereby
amplifying a 449 bp product. Primer 197-R1 lies within the 197 bp insertion
and is designed to amplify a 361 bp product only in lines with this insertion. In
lines with an insertion, the flanking Rht-F11/Rht-ABD-R9 primer pair could
theoretically amplify products of 1210 bp (160 bp assay) or 1247 bp (197 bp
assay), but under the stated amplification conditions this does not occur.
6.2.3. INRA BWCC outdoor experiment
The INRA BWCC was grown outdoors in 4l pots at NIAB, Cambridge, UK, and
plants were sown 25 November 2008 or 18 February 2009. The November
sowing consisted primarily of winter wheat types and the February sowing
consisted primarily of spring wheat types. In each sowing, the experimental
unit was a 4l pot containing four plants of a variety grown in coarse compost
mixed with 1 tsp of 11-11-18 (N%-P%-K%) controlled-release fertiliser.
The November sowing contained 249 INRA BWCC accessions representing
235 winter, 8 facultative, and 6 spring growth habit types at two replicates
each (inclusion of accessions with the spring growth habits was accidental).
As controls, 22 winter/facultative lines were grown in the experiment, although
only 15 were analyzed (see Table 6.1, section 6.3.1) because seven lines
were discovered to be segregating at the Rht-B1 or Rht-D1 locus following
sowing. Seeds were planted in compost in 96-well trays in the glasshouse
under natural lighting (21°C, 16 hr period that included all daylight; 17°C, 8 hr)
to promote uniform germination. Following emergence (5 December)
seedlings were exposed to ambient air temperature and natural lighting in the
glasshouse before healthy seedlings were transplanted to 4l pots (6 Jan.
2009). On 21 January, the pots were moved outside to “plunge beds” and
positioned according to the experimental design (Figures 6.1 and 6.2). The
experimental design of the November sowing was an incomplete block design
that consisted of two main blocks with 3 row blocks (plunge beds) per main
block and 105 pots per row block (630 experimental units in total). The 22
controls were represented once in each plunge bed and the 249 INRA BWCC
varieties were represented once in each main block. Experimental units were

171
randomised to achieve maximum efficiency using:
http://biometrics.hri.ac.uk/DesignOfExperiments/
UnstructuredTreatmentDesigns.html
Figure 6.1. Experimental layout of the November 2008 and February 2009 sowings of
the INRA BWCC. Plants were grown outside in 4l pots placed in plunge beds. Blue
rectangles indicate plunge beds from the November sowing and red rectangles represent
plunge beds from the February sowing. In the February sowing, one plunge bed was split
between the two main blocks. All plunge beds were capable of holding 161 4l pots (7 pots
wide by 23 pots long). In brown, are features that shaded a portion of the plunge beds for
periods of the day with approximate height in feet („) shown in parentheses. Spatial location
and dimensions are show in approximate scale except glasshouse width and length, which
are not to scale.
Building (10‟)
NorthTree
(30‟)
Nov sowing
main block 1
Nov sowing
main block 2
Feb
sowing main block 1
Feb
sowing main block 2
He
dg
e (8
‟)
Gla
ssh
ou
se (1
5‟)
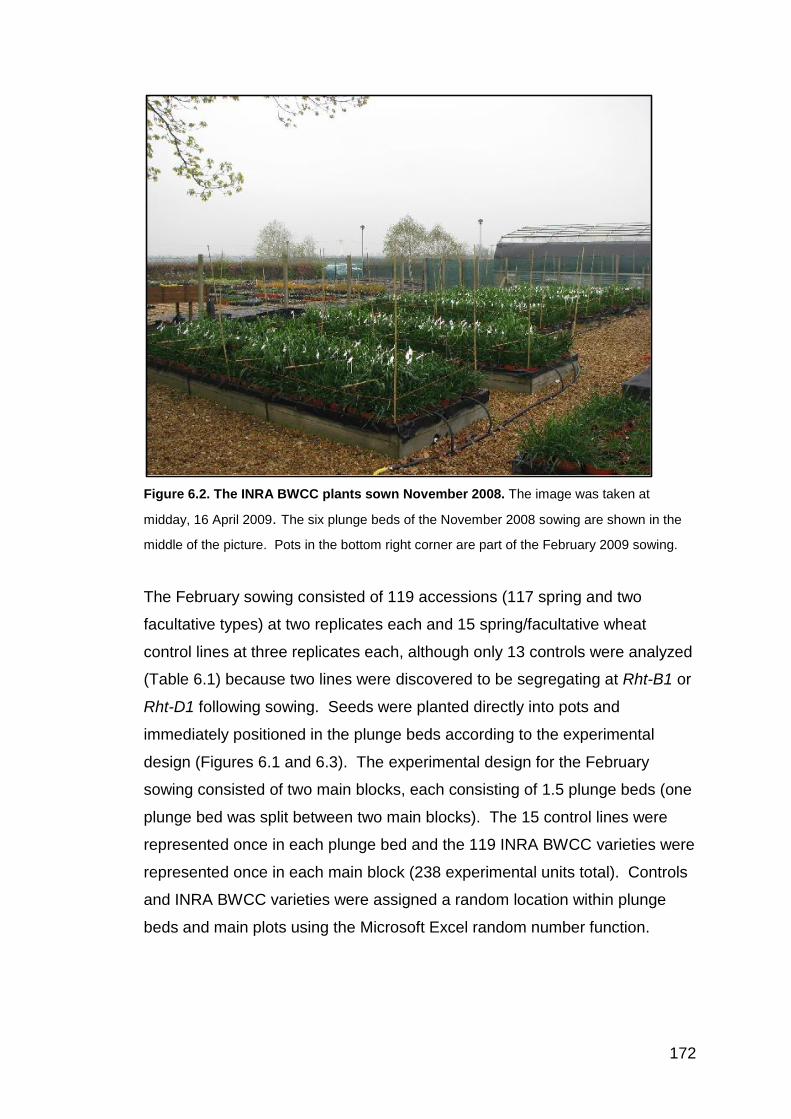
172
Figure 6.2. The INRA BWCC plants sown November 2008. The image was taken at
midday, 16 April 2009. The six plunge beds of the November 2008 sowing are shown in the
middle of the picture. Pots in the bottom right corner are part of the February 2009 sowing.
The February sowing consisted of 119 accessions (117 spring and two
facultative types) at two replicates each and 15 spring/facultative wheat
control lines at three replicates each, although only 13 controls were analyzed
(Table 6.1) because two lines were discovered to be segregating at Rht-B1 or
Rht-D1 following sowing. Seeds were planted directly into pots and
immediately positioned in the plunge beds according to the experimental
design (Figures 6.1 and 6.3). The experimental design for the February
sowing consisted of two main blocks, each consisting of 1.5 plunge beds (one
plunge bed was split between two main blocks). The 15 control lines were
represented once in each plunge bed and the 119 INRA BWCC varieties were
represented once in each main block (238 experimental units total). Controls
and INRA BWCC varieties were assigned a random location within plunge
beds and main plots using the Microsoft Excel random number function.

173
Figure 6.3. The INRA BWCC plants sown February 2009. The image was taken late
afternoon 1 April 2009. The three plunge beds that composed the February 2009 sowing are
in the foreground. Plunge beds from the November 2008 sowing are in the background.
For both sowings, 4l pots of Xi19 wheat (4 plants per pot) were placed along
the perimeters of the plunge beds to reduce edge effects. For all accessions,
plant roots were allowed to grow through holes in the pot bottoms to obtain
moisture and additional nutrients from the plunge beds, which were filled with
peat and irrigated as needed. To prevent lodging of plants, bamboo poles
were erected and baling twine strung between poles to create a grid that kept
plants erect. To control powdery mildew, fungicides were applied as follows:
3 April 2009 (Fortress at 1 ml l-1, November sowing); 15 April 2009 (Flexity at
1 ml l-1, November sowing), 22 May 2009 (Fortress at 1 ml l-1, both sowings);
6 June 2009 (Flexity at 1 ml l-1; both sowings). Fungicides were selected that
did not contain known growth regulators. Both sowings were sprayed to
control aphids as follows: 29 May (Decis at 0.7 ml l-1) and 3 July (Gazelle at
0.5 g l-1). Both sowings were covered with netting in July to prevent bird
damage. Plants were harvested and threshed in August 2009. Heading date
was recorded as the number of days from the 1st of January until the
inflorescence of the primary tiller from each pot was 50% emerged from the

174
flag leaf. Plant height was recorded as the distance from the soil surface to
the tip of the tallest tiller in each pot (excluding awns) at harvest. Obvious off-
types based on plant appearance or flowering date were excluded from height
and flowering date measurements.
6.2.4. GA sensitivity experiments
Three experiments were conducted in the glasshouses at the JIC, Norwich,
UK to examine the GA responsiveness of the INRA BWCC lines. The first
experiment contained all 368 INRA BWCC varieties, the second experiment
contained 161 INRA BWCC varieties and the third contained 19 INRA BWCC
varieties. Seed used in the GA sensitivity experiments was collected from
bagged ears of plants grown in the INRA BWCC outdoor experiment. Seed
sourced from plants homozygous at the Rht-B1 and Rht-D1 loci (based on the
Rht-B1a/b and Rht-D1a/b PCR assays) was available for all but three
accessions. Each GA sensitivity experiment also contained the following
control lines: AB, AB_Rht-D1b, AB_Rht-B1c, Bersee, Bersee_Rht-B1b,
Mercia, and Mercia_Rht-D1b. The control lines were all sourced from plants
homozygous at the Rht-B1 and Rht-D1 loci, seeds were collected from
bagged heads to ensure foreign pollen was excluded.
The GA responsiveness tests were based on those described by Gale and
Gregory (1977), but along with a GA+ treatment also consisted of a GA-
treatment. The GA+ treatment contained 10 ppm GA3 (Sigma product
number G-7645) dissolved in 0.1% ethanol. The GA- treatment consisted
only of 0.1% ethanol. GA treatments were assigned to whole trays and trays
were watered with a GA+ or GA- treatment as plants needed moisture. Each
tray contained 60 wells filled with a peat/sand mixture that was wetted with the
GA+ or GA- solution prior to transplanting of seedlings (one seedling per well)
to begin the experiments. The experimental unit consisted of an individual
seedling. Trays were placed in the glasshouse under artificial lighting (300 to
400 µmol m-2 s-1) with day/night temperatures of 20°C/15°C, 16 h daylength.

175
In GA sensitivity experiment 1 (GA expt. 1), seeds were stratified at 4°C on
wetted filter paper for two days beginning 3 October 2009 before transplanting
to 60-well trays to begin the experiment. GA expt. 1 consisted of three main
blocks with seven trays designated as GA+ treatment and seven trays
designated as GA- treatment per main block (42 trays total). The locations of
GA+ and GA- trays were randomly assigned within main blocks. Each INRA
BWCC accession was represented in each main block treatment (in total,
three GA+ plants and three GA- plants per INRA BWCC accession). Each
control was represented once per tray (42 GA+ and 42 GA- plants per
control). On 21 October, plants were uprooted and the length from the seed-
to-first-ligule (STFL) was recorded as shown in Figure 6.4.
Figure 6.4. Seed-to-first-ligule (STFL) length measured in the GA sensitivity
experiments. The measured length (shown by arrows) extended from the seed (bottom
white line) to the first ligule (top white line).
In GA sensitivity experiment 2 (GA expt. 2), seeds were stratified for three
days at 4°C on wetted filter paper beginning 3 December 2009 and
transferred to room temperature for three days before transplanting to 60-well
trays. GA expt. 2 consisted of three main blocks with three GA+ trays and

176
three GA- trays per main block (18 trays total). GA+ and GA- trays were
randomly assigned a location within main blocks. Each INRA BWCC
accession was represented once per main block (three GA+ and three GA-
plants per INRA BWCC accession) and each control was represented once
per tray (nine GA+ and nine GA- plants per control). STFL lengths were
recorded on 21 December.
In GA sensitivity experiment 3 (GA expt. 3), seeds were stratified at 4°C on
wetted filter paper beginning 29 April 2010 and moved to room temperature
on 2 May where they remained for four days but for a single day (4 May)
when they were returned to 4°C to limit growth prior to transplanting. GA
expt. 3 consisted of six main blocks for the GA+ and GA- treatments with a
main block consisting of 1/3 of a tray (four trays total were used). Each INRA
BWCC accession was represented once in each main block (six GA+ and six
GA- plants per INRA BWCC accession) and each control was represented
once on each tray (two GA+ and two GA- plants per control). However, due
to tray dimensions or poor seed germination, the following INRA BWCC
accessions were not represented in all main blocks: INRA_03752 (two GA+
and two GA- plants), INRA_00347 and INRA_01065 (four GA+ and four GA-
plants each). STFL lengths were recorded on 19 May.
6.2.5. Statistical analyses
In GA expt. 1 and 2, the GA sensitivity classification of plants was determined
using a mixed model (MM) and a least significant difference (LSD). In GA
expt. 3, only the LSD was used. In the MM, a mixture model consisting of two
independent normal distributions with different means and variances (George
et al., 2000) was fitted with a probability (α) of an observation belonging to
one distribution and a probability (1- α) of belonging to a second distribution.
An observation consisted of the mean STFL length of an accession in the
GA+ treatment in an experiment. All five parameters (μ1, σ12, μ2, σ2
2, and α)
were fitted using maximum log likelihood (MLL) in Microsoft Excel using the
Solver function. Posterior probabilities of any individual observation belonging
to either of the two distributions were calculated from the probability density

177
functions of each using the estimated means and variances as: p(dist 1) /
(p(dist 1) + p(dist 2)) and p(dist 2) / (p(dist 1) + p(dist 2)). A threshold
posterior probability greater than or equal to 0.95 was used to assign
individual observations to one or the other of the two GA classes (GAI or
GAS). Individuals with posterior probabilities < 0.95 for either of the two
distributions were classified as having an intermediate (INT) GA response.
In the LSD test, a t-value was calculated for each accession by rearranging
the LSD formula to solve for t: t = LSD/SED (Snedecor and Cochran, 1967),
where SED (standard error of the difference between two means) = ((s2/na) +
(s2/nb) )1/2 where s2 = the estimated variance in a GA experiment; na = the
number of GA+ plants of an accession; nb = the number of GA- plants of an
accession. GA experimental variances and SEDs were determined using a
REML (Restricted Maximum Likelihood) mixed model in Genstat, 12th edition
(VSN International) with GA treatment, variety, and the interaction as fixed
effects and replicate as a random effect. The GA treatment difference of an
accession (STFL length in the GA+ treatment minus STFL length in the GA-
treatment) was substituted for LSD in the formula and t values calculated.
The probability that a t-value fit a normal two-tailed t distribution with null
hypothesis of treatment difference = 0 was calculated using the TDIST
function in Excel. For GA expts. 1 and 2, 100 degrees of freedom (d.f.) were
used for the t-test and for GA expt. 3, 26 d.f. were used. When the probability
of the null hypothesis being true was ≤ 0.05, accessions were classified as
GA sensitive and when the probability was > 0.05, accessions were classified
as having no significant treatment difference (NSTD).
For plant height, heading date, and GA treatment difference (GA expts. 1, 2,
and 3), the effect of alleles at the Rht-B1, Rht-D1, and Ppd-D1 loci were
estimated using these loci and all possible interactions as fixed effects and
variety as a random effect in a REML mixed model (referred hereafter as Rht-
B1*Rht-D1*Ppd-D1 REML). Only accessions homozygous at these three loci
(352 accessions) were included in the analysis. To separate mean
differences among Rht-B1 alleles, Rht-B1 REML analyses were performed for
each phenotype using the following fixed terms in each model: (1) Rht-B1, (2)

178
the locus (Rht-D1 or Ppd-D1) that accounted for most of the remaining
variation in the Rht-B1*Rht-D1*Ppd-D1 REML, and (3) the interaction of (1)
and (2). To separate mean differences among Ppd-D1 alleles and among
Rht-B1+Rht-D1 allelic combinations, Ppd-D1*RHT REML analyses were
performed for each phenotype. Three fixed terms were used in each model:
(1) Ppd-D1, (2) RHT, which was composed of the Rht-B1a+Rht-D1a, Rht-
B1a+Rht-D1b, Rht-B1b+Rht-D1a, and Rht-B1b+Rht-D1b genotypes, and (3)
the interaction of (1) and (2). For the Rht-B1 REML and Ppd-D1*RHT REML
analyses, the locus with the greatest effect in the Rht-B1*Rht-D1*Ppd-D1
REML was placed first in the model and variety served as the random term.
The LSD threshold for main effect means was 0.05 and no attempt was made
to separate means of interactions. All of the above statistical analyses were
carried out with the guidance of Ian Mackay, Statistical Geneticist, NIAB.
Genotype/phenotype association analysis was also performed using mean
plant height, mean heading date, and mean GA treatment differences (data
from expts. 1 and 2 only) along with presence/absence scores for the 160 bp
insertion, the 197 bp insertion, Rht-B1b, Rht-D1b, and Ppd-D1a. Associations
were considered significant at a threshold of p < 0.001. To control for
population structure and kinship among varieties, a mixed model was fitted in
which relationships among varieties were accounted for by the inclusion of a
kinship matrix estimated from a genome-wide set of DArT and SSR markers
(Yu et al., 2006). Kinship was estimated using a simple matching coefficient.
As this is proprietary information that was not made available to this project,
these calculations were carried out by F. Balfourier, INRA. This association
analysis, which controls for population structure is termed AA-PS in the text.
6.3. RESULTS
6.3.1. Rht-1 and Ppd-D1 genotyping of control lines
All controls used in the INRA BWCC outdoor experiment were genotyped for
Rht-B1a/b, Rht-D1a/b, and Ppd-D1a/b to confirm the presence of these alleles
(Table 6.1). Nine accessions that were segregating at one of these loci or

179
that did not contain the expected allele were excluded from the phenotypic
analysis. Controls containing Rht-B1 and Rht-D1 dwarfing alleles other than
Rht-B1b or Rht-D1b could not be clearly identified using the Rht-B1a/b and
Rht-D1a/b PCR assays. At the Rht-B1 locus, no product was obtained using
the Rht-B1a/b primer pairs when gDNA from any of the four control lines with
the Rht-B1c allele was used in PCR reactions. Rht-B1a/b PCR reaction
mixes containing gDNA of CD_Rht-B1d as template amplified the Rht-B1b
product; hence the Rht-B1d control was indistinguishable from Rht-B1b
controls using these assays. Rht-B1a/b PCR reactions containing gDNA of
CD_Rht-B1e as template amplified only the Rht-B1a product, and therefore
the Rht-B1e control was indistinguishable from the Rht-B1a controls. At the
Rht-D1 locus, Rht-D1a/b reactions with gDNA of Mercia_Rht-D1c as template
resulted in amplification of only the Rht-D1b product and therefore the Rht-
D1c control was indistinguishable from Rht-D1b controls using this assay. At
the Ppd-D1 locus, PCR assay results demonstrated the presence of Ppd-D1a
in „Norin 10‟, CS_C67 2D, and Mercia_C67 2D, and the presence of Ppd-D1b
in the remaining controls.
Table 6.1. Summary of genotypic and phenotypic data of control lines used in the
INRA 368 BWCC outdoor experiment.
Varietya
Sow-
ing Reps
Rht-
B1
Rht-
D1
Ppd-
D1
Mean
(cm)
% of
WT
Range
(cm) Mean
Rel
WT Range
CD Nov08 1 B1a D1a D1b 114 114 148 148
CD_Rht-B1b Nov08 6 B1b D1a D1b 108 95% 104-122 148 -1 146-150
CD_Rht-D1b Nov08 5 B1a D1b D1b 97 85% 92-102 148 0 144-151
CD_Rht-B1c Nov08 4 NP D1a D1b 53 46% 38-88 153 +5 146-157
CD_Rht-B1d Nov08 4 B1b D1a D1b 106 93% 101-111 148 -1 146-149
CD_Rht-B1e Nov08 5 B1a D1a D1b 80 71% 70-89 149 1 144-150
Mercia Nov08 6 B1a D1a D1b 100 94-104 144 142-146
Mercia_Rht-B1b Nov08 2 B1b D1a D1b 96 96% 91-100 143 -1 142-144
Mercia_Rht-D1b Nov08 6 B1a D1b D1b 74 74% 65-81 146 +2 143-148
Mercia_Rht-B1c Nov08 6 NP D1a D1b 40 40% 35-45 150 +6 144-153
Mercia_Rht-D1c Nov08 6 B1a D1b D1b 76 76% 71-81 146 +1 143-148
Mercia_C67 2D Nov08 6 B1a D1a D1a 97 97% 86-102 138 -7 135-140
Norin 10 Nov08 4 B1b D1b D1a 87 75-112 134 131-135
Robigus Nov08 4 B1b D1a D1b 90 86-100 142 126-149
Xi19 Nov08 5 B1a D1b D1b 91 86-99 146 145-148
Heading date (days)dPlant ht.cGenotypingb

180
Table 6.1 (continued). Summary of genotypic and phenotypic data of control lines
used in the INRA 368 BWCC outdoor experiment.
a Introgressed Rht-1 alleles are shown following the underscore. Mercia_C67 2D and
CS_C67 2D refer to Mercia and Chinese Spring varieties with a 2D substitution from Ciano
67. CD = Cappelle Desprez; AB= April Bearded
b Rht genotypes based on PCR with Rht-B1a/b and Rht-D1a/b primers; NP = no product;
semi-dwarf (“-b”) alleles are shown in bold font. Ppd-D1 genotype based on PCR with Ppd-
D1a/b primers with photoperiod insensitive (“-a”) alleles shown in bold font.
c Plant heights of lines with a dwarf or photperiod insensitive allele are shown as a percentage
of the wild type (% of WT) from the same genetic background.
d Heading date is the number of calendar days after January 1. „Rel WT‟ = Difference in days
to heading relative to the WT line in the same genetic background (where appropriate).
6.3.2. Multiplex PCR identifies Rht-B1 insertion types
The multiplex PCR assayed designed to detect the upstream Rht-B1
insertions was tested using varieties known (see Table 5.7) to have no
insertion (CS), a 160 bp insertion (Mercia, AB, Paragon), or a 197 bp insertion
(CD, Hobbit Sib, SS7010073). A 1050 bp product was specifically amplified
using gDNA of the line with no insertion (Figure 6.5, CS; lane 2), a 449 bp
product was specifically amplified using gDNA of lines with the 160 bp
insertion (Figure 6.5, Mercia, AB, or Paragon; lanes 3, 4, 5), and a 361 bp
product was specifically amplified using gDNA of lines with the 197 bp
insertion (Figure 6.5, CD or Hobbit Sib; lanes 6, 7). SS7010073 contains the
197 bp insertion and a 16 bp deletion in this region, and a 345 bp product is
amplified when gDNA of this line serves as template (Figure 6.5, lane 8).
Varietya
Sow-
ing Reps
Rht-
B1
Rht-
D1
Ppd-
D1
Mean
(cm)
% of
WT
Range
(cm) Mean
Rel
WT Range
AB Feb09 3 B1a D1a D1b 175 170-181 155 153-157
AB_Rht-B1b Feb09 2 B1b D1a D1b 145 83% 145-145 153 -2 152-154
AB_Rht-D1b Feb09 3 B1a D1b D1b 142 81% 137-145 157 +2 155-158
AB_Rht-B1c Feb09 3 NP D1a D1b 53 30% 50-56 161 +6 161-162
Bersee Feb09 3 B1a D1a D1b 125 123-129 158 153-163
Bersee_Rht-B1b Feb09 3 B1b D1a D1b 91 73% 87-95 156 -3 153-159
Bersee_Rht-D1b Feb09 3 B1a D1b D1b 91 73% 85-96 160 +2 157-162
Bersee_Rht-B1c Feb09 2 NP D1a D1b 47 38% 42-52 168 +9 167-168
CD Feb09 2 B1a D1a D1b 108 106-110 164 162-166
CS Feb09 3 B1a D1a D1b 131 121-138 145 143-148
CS_C67 2D Feb09 3 B1a D1a D1a 133 102% 122-146 142 -4 141-143
Norin 10 Feb09 1 B1b D1b D1a 66 66 147 147
Xi19 Feb09 3 B1a D1b D1b 83 76-89 155 153-157
Genotypingb Plant ht.c Heading date (days)d

181
Figure 6.5. Validation of the Rht-B1 160 bp and 197 bp insertion PCR assay. The PCR
mix included the forward primer, Rht-F11, in combination with reverse primers 160-R1, 197-
R1, and Rht-ABD-R9. Templates were: water (lane 1); gDNA of CS (no Rht-B1 insertion; 2);
gDNA of Mercia, April Bearded, or Paragon (all have the 160 bp insertion; 3, 4, 5); gDNA of
Cappelle Desprez or Hobbit Sib (both have the 197 bp insertion; 6, 7); gDNA of SS7010073
(197bp insertion and a 16 bp deletion; 8). Reaction mixtures were subject to electrophoresis
on a 1.5% agarose gel stained with ethidium bromide and visualised under UV light. M =
molecular marker Hyperladder IV (Bioline) with size in bp indicated.
6.3.3. Frequency of Rht-1 and Ppd-D1 alleles in the INRA BWCC
Among the 368 INRA BWCC accessions, the 160 bp insertion was present in
59 accessions (16%), and the 197 bp insertion was present in 44 accessions
(12%) (Table 6.2A). The two insertions never occurred together in the same
accession. The Rht-B1 insertion data was then correlated with the Rht-B1a/b,
Rht-D1a/b, and Ppd-D1a/b genotype data. With a single exception, the Rht-
B1 insertions always occurred in accessions containing the Rht-B1a allele
(Table 6.2). Rht-B1a_160 and Rht-B1a_197 will be used to refer to the 160
bp and 197 bp insertions, respectively, in the Rht-B1a background. The
single exception was INRA_06986 („Tom Thumb‟), which amplified the
product associated with the 197 bp insertion, but did not amplify a product
with the Rht-B1a/b primer pairs. „Tom Thumb‟ is known by pedigree to
contain the Rht-B1c allele and this result is similar to that reported for the Rht-
B1c control lines (section 6.3.1). Rht-B1a_0 (Rht-B1a with no insertion) was
the most frequent Rht-B1 allele among the INRA BWCC lines, occurring in
bp
500400300
1000
M 1 2 3 4 5 6 7 8

182
214 (58.2%) of the accessions while Rht-B1b was present in 45 (12.2%) of
the accessions. Rht-D1a occurred in 318 (86.4%) accessions and Rht-D1b
occurred in 47 (12.8%) accessions (Table 6.2B). Rht-B1b and Rht-D1b were
present together in nine of the accessions. Six of the lines were not
homozygous at the Rht-B1 locus and three were not homozygous at the Rht-
D1 locus, including two lines that were not homozygous at either locus.
Table 6.2. Summary of INRA BWCC Rht-B1 (A), Rht-D1 (B), and Ppd-D1 (C) genotypes.
a For all 368 accessions, genotypes were determined using DNA extracted from plants grown
during the INRA BWCC outdoor experiment. For fixed lines, two bulks of four plants were
separately genotyped. For landraces, four separate plants were genotyped.
b Rht-B1a
and Rht-B1b designations based on the Rht-B1a/b PCR assays. Rht-B1a_0, Rht-
B1a_160, and Rht-B1a_197 refer to accessions containing Rht-B1a with no insertion, a 160
bp insertion, or a 197 bp insertion, respectively. Rht-B1_197 refers to an accession („Tom
Thumb‟) that contains the 197 bp insertion but did not amplify a product associated with Rht-
B1a or Rht-B1b. „Not homozygous‟ refers to accessions in which the majority of samples
were heterozygous or genotype scores for samples did not match.
c Rht-D1 locus designations based on the Rht-D1a/b PCR assays.
d Ppd-D1 locus designations based on the Ppd-D1a/b PCR assay (Beales et al., 2007). The
~450 bp product does not correspond to the Ppd-D1b (414 bp product) or Ppd-D1a (297 bp
product) allele. „No product‟ indicates that a product was not obtained in either replicate.
A) Rht-B1 locusb No. % of total
Rht-B1a_0 214 58.2%
Rht-B1a_160 59 16.0%
Rht-B1a_197 43 11.7%
Rht-B1_197 1 0.3%
Rht-B1b 45 12.2%
Not homozygous 6 1.6%
B) Rht-D1 locusc No. % of total
Rht-D1a 318 86.4%
Rht-D1b 47 12.8%
Not homozygous 3 0.8%
C) Ppd-D1 locusd No. % of total
Ppd-D1a 95 25.8%
Ppd-D1b 265 72.0%
450bp product 1 0.3%
No product 6 1.6%
Not homozygous 1 0.3%
Accessionsa
Accessions
Accessions

183
At the Ppd-D1 locus, the photoperiod sensitive Ppd-D1b allele was present in
265 varieties (72.0%) while the insensitive Ppd-D1a allele was present in 95
varieties (25.8%) (Table 6.2C). An approximately 450 bp product was
amplified when gDNA of the accession INRA_13812 served as template in the
Ppd-D1a/b PCR assay. The ~450 bp product is larger than the expected Ppd-
D1b (414 bp) or Ppd-D1a (297 bp) products. Using the Ppd-D1a/b primer
pair, no product was amplified from gDNA of three fixed lines (two replicates
of four bulked plants were tested separately) and from three landraces (four
plants were tested separately).
To determine the geographical prevalence of alleles, the 368 INRA BWCC
accessions were classified according to geographical area as originally
designated by Balfourier et al. (2007). The accessions come from 44
geographical regions with the largest proportion (28%) originating in France
(Table 6.3). Among the Rht-B1 alleles, Rht-B1a_160 is most prevalent in
accessions from Europe, central Russia, and North America, absent in
accessions from Africa, South America, and Australia-New Zealand, and in
low frequency or absent in the remaining regions. Rht-B1a_197 is most
prevalent in accessions from France and the USA, which combined have 29
of the 42 (69%) accessions containing this allele. In the remaining
geographical areas, Rht-B1a_197 is generally in low prevalence or not
represented. Rht-B1b is in highest frequency in accessions from Mexico-
Guatemala, Syria, and Israel-Lebanon-Palestine, in moderate frequency in
several European countries, and absent or infrequent in the remaining
geographical regions. Rht-D1b is most prevalent in Mexico-Guatemala and
Israel-Lebanon-Palestine, and occurs in moderate frequency in many regions,
but is absent in the majority of the regions. Ppd-D1a is most common in
accessions from Japan, Mexico-Guatemala, China-Korea-Mongolia, Australia-
New Zealand, and countries bordering the Mediterranean. For the accessions
that did not amplify a product with the Ppd-D1a/b primers, the landraces were
collected from the Black Sea region (one each from Azerbaijan, Georgia, and
Turkey) and the three fixed lines were from Russia, Ethiopia, and France.

184
Table 6.3. Distribution of Rht and Ppd alleles by geographical area in the INRA BWCC
a Rht-B1a_0, Rht-B1a_160, and Rht-B1a_197 refer to accessions containing Rht-B1a with no
insertion, a 160 bp insertion, or a 197 bp insertion, respectively. Segregants (SEG) at each
locus are shown with the number of accessions in parentheses. The Rht-B1c (B1c)
designation is based on pedigree. Rht-B1c contains the 197 bp insertion.
b NP = No product; 450 = 450 bp product amplified using the Ppd-D1a/b primers with number
of accessions in parenthesis.
Geographical
areac Total
B1a_
160
B1a_
197
B1a_
0 B1b Other D1a D1b Other D1a D1b Other
FRA 103 22 25 42 13 SEG(1) 86 17 25 77 NP(1)
NLD 4 1 3 3 1 4
DEU 6 3 1 2 6 6
GBR–IRL 5 2 2 SEG(1) 2 3 5
BEL 3 3 3 3
SWE 2 1 1 2 2
NOR–DNK 1 1 1 1
FIN 6 1 5 6 6
CHE 6 1 1 3 1 6 6
POL 6 4 1 1 6 1 5
CSK 6 3 1 2 6 3 3
AUT 6 1 3 2 6 6
ROM 3 2 1 3 2 1
BGR 5 3 2 5 5
UKR–BLR 4 4 2 2 2 2
YUG–HRV 2 1 1 2 2
HUN 6 3 1 2 6 1 5
ESP 11 1 1 7 1 SEG(1) 10 1 3 8
PRT 4 2 2 4 4
GRC–ALB–MAD 2 2 2 2
ITA 5 3 2 5 2 3
USA 12 2 4 3 2 B1c (1) 11 1 1 11
CAN 9 1 8 9 1 8
AUS–NZL 13 1 9 2 SEG(1) 11 2 4 9
RUS–Central 15 5 10 14 1 1 13 NP(1)
Caucasus 7 7 7 5 NP(2)
TUR 7 7 7 1 5 NP(1)
NPL 24 1 23 24 2 21 SEG(1)
CHN–KOR–MNG 16 1 14 1 14 2 5 11
JPN 12 1 8 2 SEG(1) 7 3 SEG(1) 9 3
PAK–KSM 5 5 4 1 1 4
SYR 4 1 3 4 3 1
ISR–LBN–PAL 7 4 3 4 3 3 4
AFG–IRN–IRQ 1 1 1 1
IND 5 1 4 5 1 4
DZA–MAR 2 2 2 2
EGY–TUN 4 3 SEG(1) 1 2 SEG(1) 3 1
ETH–NER 4 1 3 4 3 NP(1)
KEN 2 2 2 2
ZAF–ZWE 3 1 1 1 2 1 2 1
BRA 3 1 2 3 1 2
COL–PER 2 2 2 1 1
MEX–GTM 10 5 5 4 6 7 2 450(1)
ARG–URY 5 1 4 4 1 1 4
SUM 368 59 43 214 45 7 318 47 3 95 265 8
Rht-B1 a Rht-D1 Ppd-D1 b

185
c Geographic areas of accessions as shown by Balfourier et al. (2007). RUS–Central (Russia
central) consists of TJK–TKM–KAZ–KIR–UZB and the Caucasus consist of ARM-GEO-AZE.
AFG Afghanistan; ALB Albania; ARG Argentina; ARM Armenia; AUS Australia; AUT Austria;
AZE Azerbaijan; BEL Belgium; BGR Bulgaria; BLR Belarus; BRA Brazil; CAN Canada; CHE
Switzerland; CHN China; COL Colombia; CSK Czech and Slovak Republics; DEU Germany;
DNK Denmark; DZA Algeria; EGY Egypt; ESP Spain; ETH Ethiopia; FIN Finland; FRA
France; GEO Georgia; GBR Great Britain; GRC Greece; GTM Guatemala; HUN Hungary;
HRV Croatia; IND India; IRL Ireland; IRN Iran; IRQ Iraq; ISR Israel; ITA Italy; JPN Japan; KAZ
Kazakhstan; KEN Kenya; KIR Kyrgyzstan; KOR Korea; KSM Kashmir; LBN Lebanon; MAD
Macedonia; MAR Morocco; MEX Mexico; MNG Mongolia; NER Niger; NLD Netherlands; NOR
Norway; NPL Nepal; NZL New Zealand; PAL Palestine; PAK Pakistan; POL Poland; POR
Portugal; PER Peru; ROM Romania; SYR Syria; SWE Sweden; TJK Tajikistan; TKM
Turkmenistan; TUN Tunisia; TUR Turkey; URY Uruguay; UKR Ukraine; USA United States;
UZB Uzbekistan; YUG Yugoslavia; ZAF South Africa; ZWE Zimbabwe.
6.3.4. Plant heights and heading dates of INRA BWCC accessions and
controls in relation to genotype
The majority of control lines used in the INRA BWCC performed as expected
with lines containing GAI alleles having reduced height and lines with the Ppd-
D1a allele having earlier heading dates than wild type lines in the same
genetic background (Table 6.1). Averaged over the CD, Mercia, AB, and
Bersee genetic backgrounds, the Rht-B1b+Rht-D1a lines were 13% shorter
and ear emergence 1.6 days earlier than wild type lines. Averaged over the
same four backgrounds, the Rht-B1a+Rht-D1b lines were 22% shorter and
ears emerged 1.3 days later than wild type lines. The Rht-B1c NILs were on
average 62% shorter and had heading dates 6.4 days later than the wild type
lines. For the Ppd-D1a substitution lines, CS_C67 2D flowered four days
earlier and was 102% the height of CS. Mercia_C67 2D flowered seven days
earlier and was 97% the height of Mercia. Xi19 and Norin 10 were the only
two controls present in both sowings. Norin 10 from the February 2009
sowing was 76% the height and flowered 13 days later than Norin 10 from the
November 2008 sowing. Similarly, the February 2009 sowing of Xi19 was
91% the height and flowered 9 days later than the November 2008 sowing.
Among the 368 INRA BWCC accessions, plant heights ranged from 54 to

186
200.5 cm with a mean of 133 cm (Appendix VI). A histogram of plant heights
appeared to have a bi-modal distribution (Figure. 6.6A), but accessions could
not be easily split into two groups using the MM approach (see section 6.2.5),
so this was not performed. Nine accessions with the Rht-B1a+Rht-D1a
genotype have plant heights less than the mean of accessions containing Rht-
B1b or Rht-D1b (100 cm) and INRA_13481 was the shortest Rht-B1a+Rht-
D1a accession with a plant height of 84.5 cm. Conversely, there were no
accessions containing a semi-dwarfing allele that were taller than the Rht-
B1a+Rht-D1a mean plant height (144 cm). INRA_07092, which contains the
Rht-B1b allele, was the tallest semi-dwarf accession at 135.5 cm.
Figure 6.6. Distributions of heights (A) and heading dates (B) of the INRA BWCC lines.
0
5
10
15
20
25
≤ 5
05
0.1
-55
55
.1-6
06
0.1
-65
65
.1-7
07
0.1
-75
75
.1-8
08
0.1
-85
85
.1-9
09
0.1
-95
95
.1-1
00
10
0.1
-10
51
05
.1-1
10
11
0.1
-11
51
15
.1-1
20
12
0.1
-12
51
25
.1-1
30
13
0.1
-13
51
35
.1-1
40
14
0.1
-14
51
45
.1-1
50
15
0.1
-15
51
55
.1-1
60
16
0.1
-16
51
65
.1-1
70
17
0.1
-17
51
75
.1-1
80
18
0.1
-18
51
85
.1-1
90
19
0.1
-19
51
95
.1-2
00
20
0.1
-20
5>
20
5
Accessio
ns (
no
.)
Height (cm)
A)
0
10
20
30
40
50
60
70
≤1
13
11
3.1
-11
6
11
6.1
-11
9
11
9.1
-12
2
12
2.1
-12
5
12
5.1
-12
8
12
8.1
-13
1
13
1.1
-13
4
13
4.1
-13
7
13
7.1
-14
0
14
0.1
-14
3
14
3.1
-14
6
14
6.1
-14
9
14
9.1
-15
2
15
2.1
-15
5
15
5.1
-15
8
15
8.1
-16
1
16
1.1
-16
4
16
4.1
-16
7
16
7.1
-17
0
17
0.1
-17
3
17
3.1
-17
6
17
6.1
-17
9
17
9.1
-18
2
18
2.1
-18
5
>1
85
Days to Heading
Accessio
ns (
no
.)
B)
187
Heading dates of the INRA BWCC lines ranged from 116 to 185 days with a
mean of 141 days (Appendix VI). Heading dates were normally distributed;
however there was a skew toward early ear emergence and three accessions
had very late heading dates (nine to 25 days later than the next latest line;
Figure 6.6B). The three late accessions were from the February 2009 sowing,
indicating these lines may be winter types that flowered late due to a lack of
vernalisation. Among all INRA BWCC lines, INRA_08227 (Ppd-D1a
genotype) had the earliest ear emergence, three days earlier than any other
line. The Ppd-D1a accession with the latest heading date was INRA_03306
with a heading date of 153 days. The earliest flowering accession with the
Ppd-D1b allele was INRA_08233 with a heading date of 121 days.
6.3.5. GA sensitivities among INRA BWCC and control accessions
6.3.5.1 GA sensitivities of accessions in GA experiment 1
In GA expt. 1, the STFL lengths of the INRA BWCC and control lines from the
GA+ treatment revealed an apparent bi-modal distribution (Appendix VII;
Figure 6.7A). Because the distribution was bi-modal, the MM approach was
used to calculate the probability that controls and INRA BWCC lines were GAI
(pGAI) or GAS (pGAS = 1 - pGAI) based on GA+ treatment STFL lengths as
described in section 6.2.5. For the controls, the MM procedure identified the
three GAS Rht-B1a+Rht-D1a lines as GAS with pGAS = 1 in all three lines
(Table 6.4). Using the MM, three of the four accessions with dwarfing alleles
had a response classified as GAI (AB_Rht-B1c, pGAI=1; Mercia_Rht-D1b,
pGAI = 0.98; AB_Rht-D1b, pGAI = 0.93); however unexpectedly, Bersee_Rht-
B1b GA+ treatment values more closely resembled a GAS response (pGAS =
0.91). In a similar analysis of GA sensitivity, an LSD test was used to
calculate the probability that an accession‟s GA treatment difference was
equal to zero. A low probability of no GA treatment difference is indicative of
a GAS response. The conclusions drawn from the LSD analysis were similar
to those obtained using MM for all control lines, including Bersee_Rht-B1b,
which had a 0.09 probability of no GA treatment difference. The Rht-
B1a+Rht-D1a control lines all had large GA treatment differences, ranging

188
from 24.2 to 30.8 mm. GA treatment differences also existed for the Rht-B1b,
Rht-D1b, and Rht-B1c NILs, but were smaller, ranging from 2.3 to 9.0 mm.
Figure 6.7. Distributions of seed to first ligule (STFL) lengths of the GA+ treatment of
INRA BWCC and control lines in GA sensitivity experiment 1 (A), 2 (B), and 3 (C).
0
10
20
30
40
50
≤ 2
5
25
.1-3
0
30
.1-3
5
35
.1-4
0
40
.1-4
5
45
.1-5
0
50
.1-5
5
55
.1-6
0
60
.1-6
5
65
.1-7
0
70
.1-7
5
75
.1-8
0
80
.1-8
5
85
.1-9
0
90
.1-9
5
95
.1-1
00
10
0.1
-10
5
10
5.1
-11
0
11
0.1
-11
5
11
5.1
-12
0
12
0.1
-12
5
>1
25
A)
Accessio
ns (
no
.)
STFL length range (mm)
0
5
10
15
20
≤2
5
25
.1-3
0
30
.1-3
5
35
.1-4
0
40
.1-4
5
45
.1-5
0
50
.1-5
5
55
.1-6
0
60
.1-6
5
65
.1-7
0
70
.1-7
5
75
.1-8
0
80
.1-8
5
85
.1-9
0
90
.1-9
5
95
.1-1
00
10
0.1
-10
5
10
5.1
-11
0
11
0.1
-11
5
11
5.1
-12
0
12
0.1
-12
5
>1
25
B)
Accessio
ns (
no
.)
STFL length range (mm)
0
2
4
6
8
≤ 2
5
25
.1-3
0
30
.1-3
5
35
.1-4
0
40
.1-4
5
45
.1-5
0
50
.1-5
5
55
.1-6
0
60
.1-6
5
65
.1-7
0
70
.1-7
5
>7
5
C)
STFL length range (mm)
Accessio
ns (
no
.)

189
Table 6.4. Summary of GA treatment effects on control lines
a Mean seed to first ligule (STFL) lengths for the GA+ treatment, GA- treatment, and the GA
treatment difference (trt diff; GA+ STFL length minus GA- STFL length).
b pGAI is the probability that a line is classified as GA insensitive based on a mixed model
(MM) approach using the GA+ treatment values. pGAS = 1-pGAI. N/A = not applicable.
c An LSD test with a critical t value of p =.05 was used to determine the probability that the
GA treatment difference is significantly greater than zero.
d Introgressed alleles are shown following the underscore.
e Rht genotype based on the Rht-B1a/b and Rht-D1a/b PCR assays. Rht-B1c did not amplify
a product in the Rht-B1a/b assays.
For the INRA BWCC accessions in GA expt. 1, STFL lengths in the GA+
treatment ranged from 34 to 123 mm (mean of 79.8 mm) and GA treatment
differences ranged from -15 mm to 69 mm (mean of 23.3 mm) (Table 6.5, GA
expt. 1; Appendix VII). Mean STFL lengths in the GA+ treatment and GA-
treatment, and GA treatment differences all had the same ranking among Rht-
LSDc
GA
Expt. Control Lined
Rht
genotypee GA+ trt GA- trt
GA trt
diff. pGAI pGAS
pGA trt
diff =0
AB B1aD1a 88.1 57.3 30.8 0.00 1.00 0.00
AB_Rht-D1b B1aD1b 55.5 51.8 3.7 0.93 0.07 0.48
AB_Rht-B1c D1a 29.3 27.0 2.3 1.00 0.00 0.66
Bersee B1aD1a 94.1 64.6 29.4 0.00 1.00 0.00
Bersee_Rht-B1b B1bD1a 70.8 61.8 9.0 0.09 0.91 0.09
Mercia B1aD1a 81.6 57.4 24.2 0.00 1.00 0.00
Mercia_Rht-D1b B1aD1b 49.2 46.7 2.6 0.98 0.02 0.62
Mean 66.9 52.4 14.6
AB B1aD1a 93.9 63.7 30.2 0.00 1.00 0.00
AB_Rht-D1b B1aD1b 54.9 52.2 2.7 1.00 0.00 0.49
AB_Rht-B1c D1a 28.6 26.2 2.3 1.00 0.00 0.55
Bersee B1aD1a 95.6 69.8 25.8 0.00 1.00 0.00
Bersee_Rht-B1b B1bD1a 68.1 58.3 9.8 0.78 0.22 0.02
Mercia B1aD1a 90.4 60.7 29.8 0.00 1.00 0.00
Mercia_Rht-D1b B1aD1b 46.4 45.0 1.4 1.00 0.00 0.71
Mean 68.3 53.7 14.6
AB B1aD1a 61.0 36.5 24.5 N/A N/A 0.00
AB_Rht-D1b B1aD1b 45.5 37.5 8.0 N/A N/A 0.12
AB_Rht-B1c D1a 28.0 26.0 2.0 N/A N/A 0.69
Bersee B1aD1a 72.5 36.0 36.5 N/A N/A 0.00
Bersee_Rht-B1b B1bD1a 59.0 36.5 22.5 N/A N/A 0.00
Mercia B1aD1a 60.0 29.5 30.5 N/A N/A 0.00
Mercia_Rht-D1b B1aD1b 35.5 29.0 6.5 N/A N/A 0.20
Mean 51.6 33.0 18.6
MMb
1
2
3
Mean STFL length (mm)a

190
1 genotypes with Rht-D1a+Rht-B1a > Rht-B1b+Rht-D1a > Rht-B1a+Rht-D1b
> Rht-B1b+Rht-D1b. GA- treatment differences were the least pronounced.
Using the MM approach, 254 accessions were classified as GAS, 45 as GAI,
and 60 as INT. With the LSD approach, 253 accessions were classified as
GAS (i.e. p no treatment difference ≤ 0.05) and 102 accessions were
classified as NSTD (p of no treatment difference > 0.05), which is indicative of
an insensitive or an intermediate GA response.
Table 6.5. Summary GA responses of INRA BWCC lines in GA experiments 1, 2, and 3
GA
Expt
Rht
Genotyped Statistice GA+ trt GA- trt
Trt Diff
(mm) GAS GAI INT GAS NSTD
count 272 276 268 249 0 23 239 29
min;max 58;123 31;84 0;69
mean 87.8 59.4 28.2
count 36 36 36 2f 10 24 9g 27
min;max 45;75 27;60 -3;26
mean 59.3 47.5 11.8
count 38 38 38 1h 25 12 2i 36
min;max 40;76 36;60 -12;30
mean 51.9 46.6 5.3
count 9 9 9 0 9 0 0 9
min;max 42;54 37;59 -15;10
mean 45.6 43.6 2.0
count 359 363 355 254 45 60 253 102
min;max 34;123 27;84 -15;69
mean 79.8 56.3 23.3
count 91 91 91 76 1j 14 88 2
min;max 53;123 48;89 5;51
mean 92.0 63.4 28.6
count 33 33 33 0 26 7 4k 29
min;max 39;77 38;72 -3;20
mean 58.6 51.3 7.3
count 23 23 23 0 22 1 2l 21
min;max 44;65 40;59 -7;16
mean 53.2 49.0 4.1
count 3 3 3 0 3 0 0 3
min;max 38;50 36;47 -5;3
mean 42.8 42.6 0.2
count 154 154 154 77 54 23 95 59
min;max 27;123 48;89 -7;51
mean 77.1 57.9 19.3
count 19 19 19 NA NA NA 19 0
min;max 44;73 24;45 12;31
mean 56.9 31.7 19.7
1
B1aD1a
All
genotypes
Mean STFL length (mm)a LSD class.c
B1aD1a
B1bD1a
B1aD1b
B1bD1b
MM class.b
B1aD1a3
B1bD1a
B1aD1b
B1bD1b
All
genotypes
2

191
a STFL = Length from seed to first ligule. Treatment difference (Trt Diff) is GA+ treatment
STFL length minus GA- treatment STFL length averaged across all accessions within an Rht-
genotype. Trt diffs in GA expt. 3 were multiplied by 0.78 to allow for comparisons to be made
with GA expts. 1 and 2 as described in section 6.3.5.3.
b A mixed model (MM) approach was used to classify accessions based on GA+ STFL
lengths in expts 1 and 2. Accessions were classified as GA insensitive (GAI) if pGAI ≥ 0.95;
GA sensitive (GAS) if pGAS ≥ 0.95, or intermediate (INT) if pGAI < 0.95 and pGAS < 0.95.
c An LSD was used to determine the probability that an accession‟s treatment difference was
equal to zero. Accessions were classified as GAS if the probability of no treatment difference
was ≤ 0.05 or as „no significant treatment difference‟ (NSTD) if p > 0.05. NSTD is indicative
of a GAI or INT response.
d Rht genotype determined using Rht-B1a/b, and Rht-D1a/b primers. Accessions
heterozygous at these loci or that contained alternative alleles are only included under "All
genotypes".
e Count refers to the number of accessions belonging a specified genotype or classification
group. Min = minimum value; Max = maximum value.
f INRA BWCC lines 13811 (Opata 85); 13812 (W7984)
g INRA BWCC lines 01747 (114/62); 02424 (Danubia); 03050 (Flamura-85); 03176 (Fukuho-
komugi); 07092 (Tyler); 08194 (Neelkant); 13210 (Solaris); 13476 (Taldor); 13811 (Opata 85)
h INRA BWCC line 20224 (Fantaziya-Odesskaya)
i INRA BWCC lines 00822 (Aifeng-4); 20224 (Fantaziya-Odesskaya)
j INRA BWCC line 03752 (IAR W83-2)
k INRA BWCC lines 02345 (Corsodor); 06027 (Recital); 08194 (Neelkant); 13811 (Opata 85)
l INRA BWCC lines 01647 (BT2281); 20276 (Equinox)
MM and LSD GA response classifications were evaluated against the Rht-
B1+Rht-D1 genotype to determine if any unexpected GA responses occurred
(Table 6.5, GA expt. 1). Differences between Rht-1 genotype and GA
response could be indicative of the presence of a novel allele affecting GA
sensitivity at these or other loci. Using the MM approach, 249 Rht-B1a+Rht-
D1a accessions were classified as GAS, 23 as INT, and none as GAI.
Similarly, the LSD classified 239 of the Rht-B1a+Rht-D1a accessions as GAS
and 29 as NSTD. These results suggest the absence of any novel GAI
alleles. For the 36 accessions with the Rht-B1b+Rht-D1a genotype, only ten
were classified as GAI using MM, 24 as INT, and two as GAS (INRA_13811;
INRA_13812). The LSD approach classified nine Rht-B1b+Rht-D1a
accessions (listed in Table 6.6, footnote g) as GAS including INRA_13811
and 27 as NSTD. For the 38 accessions with the Rht-B1a+Rht-D1b

192
genotype, the MM approach classified 25 as GAI, 12 as INT, and one
(INRA_20224) as GAS. Using the LSD approach, two lines (INRA_20224;
INRA_00822) with the Rht-B1a+Rht-D1b genotype were classified as GAS
and 36 as NSTD. All nine of the accessions with the Rht-B1b+Rht-D1b
genotype were categorised as GAI in the MM approach and as NSTD in the
LSD approach.
6.3.5.2 GA sensitivities of accessions in GA experiment 2
Based primarily on results from GA expt. 1, 154 INRA BWCC lines along with
the same seven control lines used in GA expt. 1 were selected for a second
GA sensitivity test. The objective of GA expt. 2 was to increase the number of
replicates of: (1) any Rht-B1a+Rht-D1a variety not classified as GAS in the
MM or LSD analysis, (2) any variety with a semi-dwarf allele classified as INT
in the MM procedure or with a probability of no treatment difference of 0.50 or
less based on LSD, or (3) any variety in which zero or one replicate of either
GA treatment was obtained (72 accessions).
The STFL lengths from the GA+ treatment of the INRA BWCC and control
lines in GA expt. 2, revealed an apparent bi-modal distribution similar to GA
expt. 1 (Figure 6.7B). As for GA expt. 1, the Rht-B1a+Rht-D1a controls were
all identified as belonging to the GAS group using the MM and LSD tests
(Table 6.4, GA expt. 2). Three of the four lines with a dwarfing allele
(AB_Rht-D1b, AB_Rht-D1c, and Mercia Rht-D1b) were classified as GAI (p =
1) using MM, and GA treatment difference was not significantly greater than
zero using LSD. For Bersee_Rht-B1b, the MM placed the probability of this
line being GAI as 0.78, whereas the LSD approach classified this control as
GA sensitive (p = 0.02 of no GA treatment difference). Similar to GA expt. 1,
GA treatment differences of plants containing Rht-B1a+Rht-D1a ranged from
25.8 to 30.2 mm and GA treatment differences for the Rht-B1b, Rht-D1b, and
Rht-B1c NILs ranged from 2.3 to 9.8 mm.
In GA expt. 2, when all INRA BWCC genotypes were assessed, the STFL
lengths in the GA+ treatment ranged from 27 to 123 mm (mean of 77.1) and

193
GA treatment differences ranged from -7 to 51 mm (mean of 19.3) (Table 6.5,
GA expt. 2; Appendix VII). The mean STFL lengths of the GA+ treatment,
GA- treatment and GA treatment difference all had the same Rht-1 genotype
rankings as for GA expt. 1, with Rht-D1a+Rht-B1a > Rht-B1b+Rht-D1a > Rht-
B1a+Rht-D1b > Rht-B1b+Rht-D1b. Using the MM approach, 77 accessions
were classified as GAS, 54 as GAI, and 23 as INT. With the LSD approach,
95 accessions were classified as GAS and 59 were classified as NSTD.
Analysis of GA classifications in light of Rht-1 genotypes in GA expt. 2
revealed that of 91 accessions with the Rht-B1a+Rht-D1a alleles, 76 were
categorised as GAS, 14 as INT, and one (INRA_03752) as GAI using the MM
approach (Table 6.5, GA expt. 2). LSD classifications of Rht-B1a+Rht-D1a
accessions placed 88 in the GAS class and three into the NSTD class. Of the
33 accessions with the Rht-B1b+Rht-D1a genotype, 26 were classified as
GAI, seven as INT, and none as GAS using the MM approach. With the LSD
test, four Rht-B1b+Rht-D1a accessions were classified as GAS (INRA lines
02345, 06027, 08194, and 13811) and 29 as NSTD. For the 23 accessions
with the Rht-B1a+Rht-D1b genotype, the MM method classified 22 as GAI,
one as INT, and none as GAS. Using the LSD test on this same group, two of
the 23 INRA BWCC lines (INRA_01647; INRA_20276) were classified as GAS
and 21 as NSTD. The three accessions with the Rht-B1b+Rht-D1b genotype
were all categorised as GAI in the MM procedure and as NSTD by the LSD.
6.3.5.3 GA sensitivities of accessions in GA experiment 3
To more fully determine if any of the Rht-B1a+Rht-D1a INRA BWCC lines
tested in GA expt. 1 or 2 potentially contained a novel GAI allele, a third GA
sensitivity experiment was performed. GA expt. 3 consisted of the same
seven controls used in GA expts. 1 and 2, and 19 Rht-B1a+Rht-D1a INRA
BWCC lines with a short height in the INRA BWCC outdoor experiment and a
small GA treatment difference when averaged across GA expts. 1 and 2.
A bi-modal distribution of STFL lengths of the INRA BWCC accessions and
controls was not apparent in GA expt. 3 (Figure 6.7C); hence the MM

194
approach was not used to classify the GA response. As in GA expts. 1 and 2,
controls with the Rht-B1a+Rht-D1a genotype had probabilities of no GA
treatment difference equal to zero (Table 6.4, GA expt. 3). For the controls
lines containing a dwarfing allele, the probability values of no GA treatment
difference were reduced relative to GA expts. 1 and 2 (i.e. the dwarf control
NILs appeared more GA sensitive in expt. 3). The mean treatment difference
among GA expt. 3 controls was 18.6 mm, which is four mm greater than in GA
expts. 1 or 2. Overall, the control results indicate that it will be more difficult to
distinguish GAI accessions in GA expt. 3 than in GA expts. 1 or 2. As mean
treatment differences among controls in GA expts. 1 and 2 were 78% that of
GA expt. 3, GA expt. 3 treatment differences were “adjusted” by multiplying by
0.78 to facilitate comparisons with GA expts. 1. and 2.
All INRA BWCC lines in GA expt. 3 had the Rht-B1a+Rht-D1a genotype and
all 19 were classified as GAS based on the LSD (Table 6.5, GA expt. 3). The
STFL lengths in the GA+ treatment ranged from 44 to 73 mm (mean of 56.9)
and “adjusted” GA treatment differences ranged from 12 to 31 mm (mean of
19.7; Appendix VII). In GA expt. 3, INRA_03752 (the only accession
classified as GAI in a previous GA experiment) had the longest STFL length
of any accession in the GA+ treatment (72.5 mm), which was over double that
of its GA- length (33.5 mm). Mean GA treatment differences of each
accession averaged across the three experiments are shown in Appendix VI.
6.3.6. Phenotype-genotype associations of INRA BWCC accessions
6.3.6.1. Rht-B1*Rht-D1*Ppd-D1 REML analysis
A REML analysis was conducted to estimate the effects of the Rht-B1, Rht-
D1, and Ppd-D1 genotypes on heading date, plant height, and mean GA
treatment difference. For heading date, Ppd-D1 had a statistically significant
effect (F probability (F pr) < 0.001 of no effect) and accounted for the majority
of the genotype variance (Table 6.6A). Rht-B1 was also significantly (F pr =
0.023) associated with heading date while Rht-D1 and the genotype
interactions were not significant at F pr ≤ 0.05. For height, significant effects

195
(all with F pr < 0.001) were associated with Rht-B1, Rht-D1, Ppd-D1, and Rht-
B1.Ppd-D1 (Table 6.6B) with most of the genotype variation due to the main
effects of Rht-B1 and Rht-D1. The remaining interaction terms were not
significant at F pr ≤ 0.05, although Rht-B1.Rht-D1 was nearly significant (F pr
= 0.084). For mean GA difference, Rht-B1, Rht-D1, and Rht-B1.Rht-D1 all
had F pr values < 0.001 (Table 6.6C) while the remaining genotypic effects
were not significant at F pr ≤ 0.05. Rht-B1 and Rht-D1 main effects
constituted nearly the entire variance component among genotype classes.
Table 6.6. Summary of Rht-B1*Rht-D1*Ppd-D1 REML mixed model analyses for
heading date (A), plant height (B), and mean GA difference (C) in the INRA 368 BWCC.
A) HEADING DATE
Effect Terma
Wald
statisticb ndf cF
statistic ddf d F pr e
Fixed Ppd-D1 62.2 1 62.2 337 <0.001
Fixed Rht-B1 9.64 3 3.21 337 0.023
Fixed Rht-D1 0.47 1 0.47 337 0.496
Fixed Ppd-D1.Rht-B1 0.17 3 0.06 337 0.983
Fixed Ppd-D1.Rht-D1 0.5 1 0.5 337 0.478
Fixed Rht-B1.Rht-D1 0.52 3 0.17 337 0.914
Fixed Ppd-D1.Rht-B1.Rht-D1 4 2 2 337 0.137
Residual variance (variety)f = 59.16 with SE = 4.56
B) PLANT HEIGHT
Effect Term
Wald
statistic ndf
F
statistic ddf F pr
Fixed Rht-B1 238.03 3 79.34 337 <0.001
Fixed Rht-D1 145.03 1 145.03 337 <0.001
Fixed Ppd-D1 57.6 1 57.6 337 <0.001
Fixed Rht-B1.Rht-D1 6.69 3 2.23 337 0.084
Fixed Rht-B1.Ppd-D1 19.07 3 6.36 337 <0.001
Fixed Rht-D1.Ppd-D1 1.37 1 1.37 337 0.243
Fixed Rht-B1.Rht-D1.Ppd-D1 1.31 2 0.65 337 0.52
Residual variance (variety) = 399.7 with SE = 30.8
C) MEAN GA TREATMENT DIFFERENCE
Effect Term
Wald
statistic ndf
F
statistic ddf F pr
Fixed Rht-B1 266.22 3 88.74 337 <0.001
Fixed Rht-D1 318.93 1 318.93 337 <0.001
Fixed Ppd-D1 0.48 1 0.48 337 0.488
Fixed Rht-B1.Rht-D1 27.45 3 9.15 337 <0.001
Fixed Rht-B1.Ppd-D1 1.06 3 0.35 337 0.788
Fixed Rht-D1.Ppd-D1 1.93 1 1.93 337 0.166
Fixed Rht-B1.Rht-D1.Ppd-D1 0.54 2 0.27 337 0.762
Residual variance (variety) = 53.58 with SE = 4.13

196
a Rht-B1 consists of Rht-B1a_0 (no insertion), Rht-B1a_160 (160 bp insertion), Rht-B1a_197
(197 bp insertion), and Rht-B1b alleles. Rht-D1 consists of Rht-D1a and Rht-D1b alleles.
Ppd-D1 consists of Ppd-D1a and Ppd-D1b alleles. The (.) indicates an interaction term.
b the Wald statistic is a measure of variation
c ndf = numerator degrees of freedom
d ddf = denominator degrees of freedom
e F pr = F probability of no treatment difference.
f Residual variance between varieties within genotypic terms was estimated using variance as
the random term in the model. SE = Estimated standard error of the residual variance.
6.3.6.2. Rht-B1 genotype REML and means analysis
Mean effects of the Rht-B1 alleles on heading date, plant height, and GA
treatment difference were compared using the INRA BWCC accession data.
As other loci were found to significantly influence these phenotypes (Table
6.6), mean Rht-B1 allelic effects were estimated in relation to either Rht-D1 or
Ppd-D1, depending on which locus accounted for the largest portion of the
remaining genotype variation in the Rht-B1*Rht-D1*Ppd-D1 REML analysis.
For each phenotype, a fitted mean was calculated for each Rht-B1 allele as
the average value across both allelic classes of the second locus. Fitted
means were declared to be significantly different (SD) or not significantly
different (NSD) using an LSD with a probability threshold of ≤ 0.05.
For mean heading date, Rht-B1 alleles were compared across the Ppd-D1
backgrounds as Ppd-D1 was previously shown (Table 6.6A) to account for
most of the heading date variation. The mean heading dates of Rht-B1a_160
accessions and Rht-B1a_197 accessions were later than that of Rht-B1_0 or
Rht-B1b accessions regardless of Ppd-D1 allele (Table 6.7A). Comparing
Rht-B1 fitted means, heading dates of Rht-B1a_160 accessions were 1.1
days later than Rht-B1a_197 accessions (NSD), 2.9 days later than Rht-
B1a_0 accessions (SD), and 2.8 days later than the Rht-B1b accessions
(NSD). Rht-B1a_197 accessions also flowered later than Rht-B1a_0
accessions (1.8 days, NSD) or Rht-B1b accessions (1.7 days, NSD) when
comparing fitted means.

197
Table 6.7. Mean effects of Rht-B1 alleles on heading date (A), plant height (B), and GA
treatment difference (C) among INRA BWCC accessions.
a Days from January 1. Rht-B1a_160, Rht-B1a_197, and Rht-B1a_0 refer to Rht-B1a alleles
with a 160 bp, a 197 bp, or no insertion, respectively. The numbers of accessions possessing
each genotypic combination are indicated in parentheses.
b Fitted mean refers to the average effect associated with an Rht-B1 allele across the Ppd-D1
alleles (box A) or across the Rht-D1 alleles (boxes B and C).
c Significant differences are based on an LSD with a probability threshold of 0.05. Direction of
significance is shown with by >.
d Mean GA treatment difference (trt diff) refers to the increase in seed-to-first-ligule (STFL)
length of the GA+ treatment minus the GA- treatment.
For mean plant height, the effects of the Rht-B1 alleles were compared across
Rht-D1 backgrounds (Table 6.7B). Relative to the three Rht-B1a alleles, the
Rht-B1b allele was associated with shorter plant heights in both Rht-D1
backgrounds. The reductions in fitted mean plant height associated with Rht-
B1b ranged from 24.3 to 39 cm relative to the Rht-B1a alleles, and all
differences were significant at p ≤ 0.05. Rht-B1a alleles with an insertion
were associated with height reductions relative to Rht-B1a_0. Comparing
fitted means, Rht-B1a_197 accessions were 14.7 cm (12%) shorter (SD) than
Rht-B1a_0 accessions and Rht-B1_160 accessions were 9.7 cm (8%) shorter
A) MEAN DAYS TO HEADINGa
Ppd-D1a Ppd-D1b
Fitted
meanb
Fitted means significantly different
at p ≤ 0.05c
Rht-B1a_160 137 (11) 145.4 (47) 141.2 Rht-B1a_160 > Rht-B1a_0
Rht-B1a_197 136.5 (11) 143.7 (31) 140.1
Rht-B1a_0 134.8 (43) 141.7 (165) 138.3
Rht-B1b 134.6 (25) 142.2 (19) 138.4
B) MEAN PLANT HEIGHT (cm)
Rht-D1a Rht-D1b
Fitted
mean
Fitted means significantly different
at p ≤ 0.05
Rht-B1a_160 142.1 (54) 89.2 (4) 115.7 Rht-B1a_160 > Rht-B1b
Rht-B1a_197 126.4 (31) 94.9 (11) 110.7 Rht-B1a_197 > Rht-B1b
Rht-B1a_0 147.3 (187) 103.6 (21) 125.4 Rht-B1a_0> Rht-B1a_197,Rht-B1b
Rht-B1b 100.7 (35) 72.2 (9) 86.4
C) MEAN GA TRT DIFF (mm)d
Rht-D1a Rht-D1b
Fitted
mean
Fitted means significantly different
at p ≤ 0.05
Rht-B1a_160 28.3 (54) 0.6 (4) 14.4 Rht-B1a_160 > Rht-B1b
Rht-B1a_197 27.4 (31) 5.3 (11) 16.3 Rht-B1a_197 > Rht-B1b
Rht-B1a_0 29.4 (187) 5.1 (21) 17.3 Rht-B1a_0> Rht-B1b
Rht-B1b 9.4 (35) 0.7 (9) 5.0

198
(NSD) than Rht-B1a_0 accessions. Between the two insertion alleles, Rht-
B1_160 was associated with a 15.7 cm height increase over Rht-B1_197 in
the Rht-D1a background, but also a 5.7 cm height decrease in the Rht-D1b
background, indicative of an interaction. However, Rht-B1a_160+Rht-D1b is
present in only four lines and may be an unreliable estimate of the true mean.
For the fitted means of the Rht-B1a insertion alleles, Rht-B1a_160 was 5 cm
taller than Rht-B1a_197 (NSD).
For GA sensitivity, the effects of Rht-B1 alleles were estimated across the
Rht-D1 loci (Table 6.7C). Similar to plant height, the GA treatment difference
associated with Rht-B1b was significantly lower (p < 0.05) than each of the
Rht-B1a alleles, with reductions ranging from 9.4 to 12.3 cm. Comparing
fitted means, a reduced GA treatment difference is associated with Rht-
B1a_160 (-2.9 mm; -17%) and Rht-B1a_197 (-1.0 mm; -6%) relative to Rht-
B1a_0; however these differences were NSD. When comparing among the
Rht-B1a alleles, Rht-B1a_197 has the smallest mean GA treatment difference
in the Rht-D1a background and the largest mean GA treatment difference in
the Rht-D1b background, which indicates an interaction.
6.3.6.3. RHT*Ppd-D1 REML and means analysis
A means analysis was performed to estimate the changes in heading date,
plant height, and GA treatment difference associated with Rht-B1+Rht-D1
semi-dwarf allele combinations in differing Ppd-D1 backgrounds (Table 6.8).
In this analysis, Rht-B1a allelic classes were combined due to the small
effects of the insertions relative to Rht-B1b. Accessions with the Ppd-D1a
allele had a fitted mean heading date that was 6.6 days earlier than
accessions with the Ppd-D1b allele (SD, using an LSD threshold of p < 0.05).
In contrast, there was only a 1.6 day range in heading dates among the Rht-1
genotype classes when comparing fitted means. The six accessions that did
not amplify a PCR product using the Ppd-D1 primers had a mean heading
date of 142.2 days and the accession (INRA_13812) that amplified a 450 bp
product had a mean heading date of 142 days. These heading dates are
similar to the fitted mean heading date of Ppd-D1b (142.3 days).
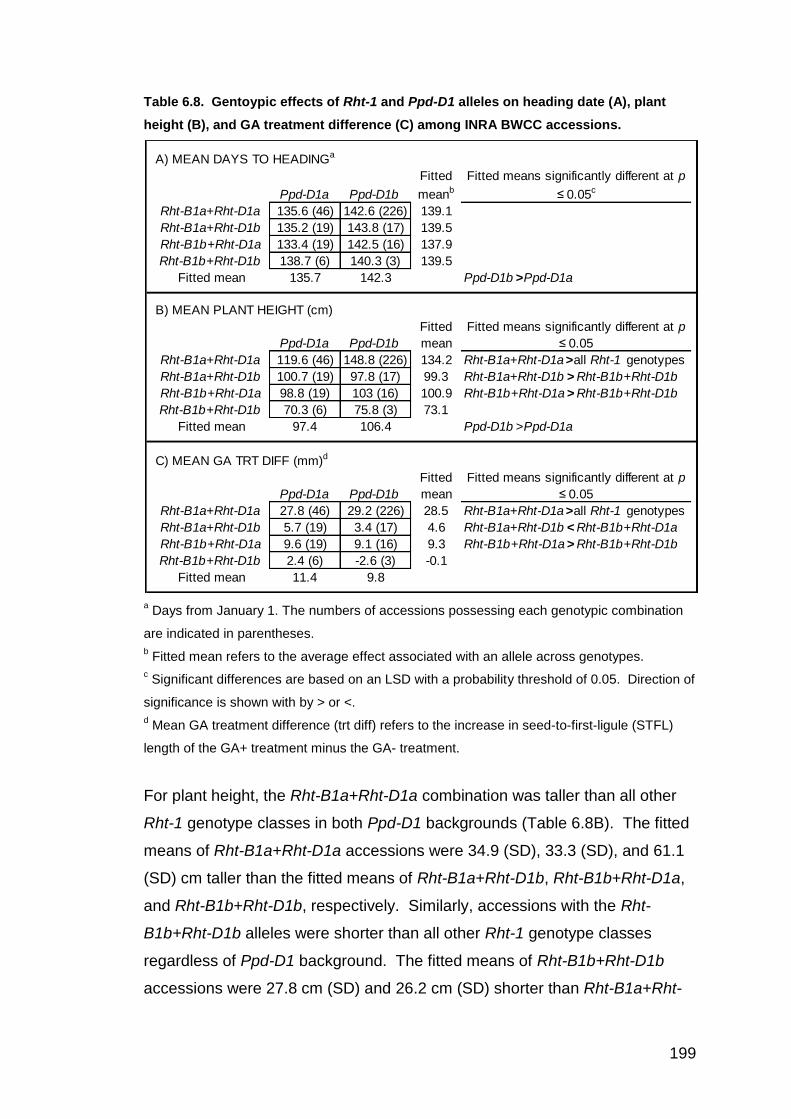
199
Table 6.8. Gentoypic effects of Rht-1 and Ppd-D1 alleles on heading date (A), plant
height (B), and GA treatment difference (C) among INRA BWCC accessions.
a Days from January 1. The numbers of accessions possessing each genotypic combination
are indicated in parentheses.
b Fitted mean refers to the average effect associated with an allele across genotypes.
c Significant differences are based on an LSD with a probability threshold of 0.05. Direction of
significance is shown with by > or <.
d Mean GA treatment difference (trt diff) refers to the increase in seed-to-first-ligule (STFL)
length of the GA+ treatment minus the GA- treatment.
For plant height, the Rht-B1a+Rht-D1a combination was taller than all other
Rht-1 genotype classes in both Ppd-D1 backgrounds (Table 6.8B). The fitted
means of Rht-B1a+Rht-D1a accessions were 34.9 (SD), 33.3 (SD), and 61.1
(SD) cm taller than the fitted means of Rht-B1a+Rht-D1b, Rht-B1b+Rht-D1a,
and Rht-B1b+Rht-D1b, respectively. Similarly, accessions with the Rht-
B1b+Rht-D1b alleles were shorter than all other Rht-1 genotype classes
regardless of Ppd-D1 background. The fitted means of Rht-B1b+Rht-D1b
accessions were 27.8 cm (SD) and 26.2 cm (SD) shorter than Rht-B1a+Rht-
A) MEAN DAYS TO HEADINGa
Ppd-D1a Ppd-D1b
Fitted
meanb
Fitted means significantly different at p
≤ 0.05c
Rht-B1a+Rht-D1a 135.6 (46) 142.6 (226) 139.1
Rht-B1a+Rht-D1b 135.2 (19) 143.8 (17) 139.5
Rht-B1b+Rht-D1a 133.4 (19) 142.5 (16) 137.9
Rht-B1b+Rht-D1b 138.7 (6) 140.3 (3) 139.5
Fitted mean 135.7 142.3 Ppd-D1b >Ppd-D1a
B) MEAN PLANT HEIGHT (cm)
Ppd-D1a Ppd-D1b
Fitted
mean
Fitted means significantly different at p
≤ 0.05
Rht-B1a+Rht-D1a 119.6 (46) 148.8 (226) 134.2 Rht-B1a+Rht-D1a >all Rht-1 genotypes
Rht-B1a+Rht-D1b 100.7 (19) 97.8 (17) 99.3 Rht-B1a+Rht-D1b > Rht-B1b+Rht-D1b
Rht-B1b+Rht-D1a 98.8 (19) 103 (16) 100.9 Rht-B1b+Rht-D1a > Rht-B1b+Rht-D1b
Rht-B1b+Rht-D1b 70.3 (6) 75.8 (3) 73.1
Fitted mean 97.4 106.4 Ppd-D1b >Ppd-D1a
C) MEAN GA TRT DIFF (mm)d
Ppd-D1a Ppd-D1b
Fitted
mean
Fitted means significantly different at p
≤ 0.05
Rht-B1a+Rht-D1a 27.8 (46) 29.2 (226) 28.5 Rht-B1a+Rht-D1a >all Rht-1 genotypes
Rht-B1a+Rht-D1b 5.7 (19) 3.4 (17) 4.6 Rht-B1a+Rht-D1b < Rht-B1b+Rht-D1a
Rht-B1b+Rht-D1a 9.6 (19) 9.1 (16) 9.3 Rht-B1b+Rht-D1a > Rht-B1b+Rht-D1b
Rht-B1b+Rht-D1b 2.4 (6) -2.6 (3) -0.1
Fitted mean 11.4 9.8
200
D1b and Rht-B1b+Rht-D1a accessions, respectively. Comparing accessions
with a single Rht-1b allele, the fitted mean plant height of Rht-B1b+Rht-D1a
accessions was 1.6 cm (NSD) greater than that of Rht-B1a+Rht-D1b
accessions. Accessions with the Ppd-D1a allele showed a 9 cm reduction in
plant height relative to Ppd-D1b accessions when comparing fitted means
(SD). However, a clear interaction with Rht-1 is evident as Ppd-D1a
accessions are 29.2 cm shorter than Ppd-D1b accessions in the Rht-
B1a+Rht-D1a background, but in genetic backgrounds containing Rht-B1b
and/or Rht-D1b, Ppd-D1a mean plant heights are from 5.5 cm shorter to 2.9
cm taller than Ppd-D1b mean plant heights.
For mean GA treatment difference, significant differences were found among
Rht-1 genotypes but not between Ppd-D1 genotypes (Table 6.8C). Rht-
B1a+Rht-D1a accessions were associated with an increased mean GA
treatment difference in both Ppd-D1 backgrounds. Comparing fitted means,
Rht-B1a+Rht-D1a lines had increases in mean GA treatment difference of
23.9 (SD), 19.2 (SD), and 28.6 (SD) mm relative to Rht-B1a+Rht-D1b, Rht-
B1b+Rht-D1a, and Rht-B1b+Rht-D1b, respectively. The Rht-B1b+Rht-D1b
accessions had lower mean GA treatment differences than all other Rht-1
genotype classes in both Ppd-D1 backgrounds. Comparing fitted means, GA
treatment differences of Rht-B1b+Rht-D1b lines were 4.7 mm (NSD) less than
Rht-B1a+Rht-D1b lines and 9.4 mm (SD) less than Rht-B1b+Rht-D1a lines.
The fitted means of the Rht-B1b+Rht-D1a accessions were 4.7 (SD) mm
greater than the fitted means of the Rht-B1a+Rht-D1b accessions.
6.3.6.4. Rht-B1 and Ppd-D1 association analysis with adjustment for
population structure (AA-PS)
An association analysis that accounts for the effects of population structure
(AA-PS) was performed using a kinship matrix based on genome-wide DArT
and SSR markers (Table 6.9). In the AA-PS, the primary effect of the
presence / absence of each allele (Rht-B1b; Rht-B1a_160; Rht-B1a_197; Rht-
D1b; Ppd-D1a) on mean heading date, plant height, and GA treatment
difference (GA expts. 1 and 2 only) was determined with a significance

201
threshold set at p = 0.001. For heading date, only Ppd-D1a was significantly
associated. Plant height was found to be significantly associated with Rht-
B1b, Rht-D1b, and Ppd-D1a, but not with Rht-B1a_160 or Rht-B1a_197.
Similarly, GA treatment difference was found to be associated with Rht-B1b,
Rht-D1b, and Ppd-D1a, but not with Rht-B1a_160 or Rht-B1a_197.
Table 6.9. Summary of the INRA BWCC association analysis with adjustment for
population structure (AA-PS)
a Heading date and plant heights recorded in Cambridge, UK. GA treatment differences (GA
trt. diff.) represent combined data from GA sensitivity expts 1 and 2.
b Association is based on presence/absence of the indicated allele
c NS = not significant at p < 0.001
d R
2 values are indicated only for associations with p < 0.001
6.3.7. Phenotype and genotype analyses of INRA BWCC accession types
To determine the effect of growth habit, varietal type (fixed or landrace), and
year of registration of accessions on plant phenotype an additional REML
analysis was performed and means separated using an LSD (probability
threshold of 0.05) when more than two means were compared. Growth habit
did not significantly affect height or GA treatment difference, but did have a
significant effect on heading date (Table 6.10A). Accessions with a spring
growth habit were associated with a 4.5 day delay (SD) relative to winter habit
Traita Alleleb P valuec R²d
Rht-B1b 5.69E-22 0.228
Rht-B1a_160 NS
Rht-B1a_197 NS
Rht-D1b 1.2E-23 0.234
Ppd-D1a 1.1E-22 0.219
Rht-B1b 6.5E-27 0.274
Rht-B1a_160 NS
Rht-B1a_197 NS
Rht-D1b 2.5E-40 0.389
Ppd-D1a 1.8E-10 0.108
Rht-B1b NS
Rht-B1a_160 NS
Rht-B1a_197 NS
Rht-D1b NS
Ppd-D1a 1.1E-14 0.154
Heading
date
GA trt.
diff.
Plant
height

202
accessions and an 8.5 day delay (SD) relative to facultative habit accessions.
However, these differences may relate to the later planting date (February
2009) of the spring types relative to the winter and most facultative types
(November 2008). Delays in heading date were reported for controls from the
February 2009 sowing relative to the November 2008 sowing (section 6.3.4.)
The frequencies of Rht-B1b, Rht-D1b, and Ppd-D1a do not differ largely
between the spring and winter accessions while the Rht-B1 insertion alleles
are several-fold more frequent in the winter lines than in the spring lines.
Table 6.10. Allelic composition, plant heights, and heading dates of INRA BWCC
accessions by growth habit (A), varietal type (B) and year of registration (C)
a Days from January 1. sem = standard error of the mean
A) Growth Habit
Habit No. mean sem mean sem mean sem
160bp
ins
197bp
ins
Rht-
B1b
Rht-
D1b
Ppd-
D1a
Facultative 10 135.4 1.4 134.7 9.9 22.1 4.5 0.00 0.20 0.30 0.00 0.40
Spring 115 143.9 1.6 130.3 7.9 24.7 1.1 0.04 0.05 0.10 0.14 0.23
Winter 227 139.4 1.4 134.6 9.1 23.4 0.8 0.23 0.15 0.13 0.13 0.26
B) Varietal Type
Type No. mean sem mean sem mean sem
160bp
ins
197bp
ins
Rht-
B1b
Rht-
D1b
Ppd-
D1a
Fixed 322 140.4 1.6 129.3 8.4 22.9 0.7 0.17 0.13 0.14 0.14 0.28
Landrace 46 143.2 1.6 161.5 6.9 30.5 1.2 0.09 0.00 0.00 0.00 0.00
C) Year of Registration
Period No. mean sem mean sem mean sem
160bp
ins
197bp
ins
Rht-
B1b
Rht-
D1b
Ppd-
D1a
1) 1800-99 9 145.6 2.8 154.6 7.1 28.0 1.6 0.56 0.11 0.00 0.00 0.11
2) 1900-19 10 145.8 2.2 161.0 5.0 33.2 2.0 0.20 0.00 0.00 0.00 0.00
3) 1920-39 37 144.9 1.9 154.8 4.1 28.6 1.1 0.14 0.03 0.00 0.00 0.08
4) 1940-59 32 142.8 0.9 135.1 3.6 27.8 1.9 0.19 0.13 0.03 0.03 0.09
5) 1960-79 55 140.4 1.1 121.1 3.5 20.5 1.9 0.16 0.20 0.11 0.25 0.36
6) 1980-99 49 139.4 1.0 107.7 3.1 17.4 1.8 0.16 0.14 0.37 0.22 0.43
3>5,6
4>5,6
Sig. Diff. (p<.05)d
Sig.Diff. (p<.05)
Sig.Diff. (p<.05)
3>5,6
1>4,5,6
2>4,5,6
3>4,5,6
4>5,6
5>6
L>F L>F L>F
GA trt diff
(mm)
1>6
2>6
1>6
2>5,6
Days to
heading Allele Frequency
Accessions Height (cm)
Days to
headinga Allele Frequencyc
Accessions Height (cm)
Days to
heading Allele Frequency
Accessions Height (cm)
GA trt diff
(mm)b
NSNSS>I,W
GA trt diff
(mm)

203
b GA trt diff = Difference in STFL length between the GA+ and GA- treatments among
accessions averaged across all three GA experiments.
c Allele frequency indicates proportion of lines that are homozygous for the allele shown.
d Any significant differences (Sig. Diff. p ≤ 0.05) are shown for each phenotype or NS is
indicated if no significant difference exists. In box A, S = Spring, I = Indeterminate, W=
Winter. In box B, L = landrace and F = fixed. In box 3, the registration period is indicated by
a number from 1 to 6 as assigned above.
The effects of varietal type were statistically significant for heading date, plant
height, and GA treatment difference (Table 6.10B). The average days to
heading were 143.2 for landraces and 140.4 days for fixed varieties. The
reduction in days to heading in the fixed varieties relative to landraces
coincides with an increased prevalence of the early-flowering Ppd-D1a allele,
which occurs in 28% of the fixed lines, but none of the landraces. The mean
height of the landraces was 161.5 cm while the fixed lines averaged only
129.3 cm. Reduced height in the fixed lines relative to landraces coincides
with greater prevalence of Rht-B1b (0.14) and Rht-D1b (0.14) in fixed lines
than in landraces where neither allele was detected. Rht-B1a_197 bp was
present in 13% of the fixed lines and was not detected in the landraces. Rht-
B1a_160 was present in 17% of the fixed lines and is the only allele among
this group of five that was also detected in the landraces (freq. = 0.09).
For the 200 INRA BWCC accessions for which the year of varietal registration
was available, REML analysis indicated that the period in which a variety was
released had a significant effect on heading date, plant height, and GA
treatment difference (Table 6.10C). A trend over time towards reduced days
to heading, reduced plant height and reduced GA treatment difference was
evident, along with an increased prevalence of Rht-B1b, Rht-D1b, and Ppd-
D1a (Table 6.10). Mean heading dates of accessions released from 1980-
1999 were 5.5 to 6.4 days earlier (SD) than those released in the time periods
prior to 1940 (1800-99, 1900-19, and 1920-39). Mean heading date of the
period 1960-1979 was also significantly earlier than 1920-39. Associated with
time periods that have earlier heading dates is an increased prevalence of
Ppd-D1a. In the periods 1960-79 and 1980-99, Ppd-D1a frequencies were
0.36 and 0.43, respectively, while in the time periods before 1940 Ppd-D1a

204
frequency ranged from 0 to 0.11. Mean plant height in the period 1980-1999
(107.7 cm) was significantly shorter than in any other time period. Similarly,
mean plant height from 1960-79 (121.1 cm) was significantly shorter than in
the preceding time periods, and mean plant height from 1940-1959 (135.1
cm) was also significantly reduced relative to preceding periods. GA
treatment difference was significantly less in the periods 1960-1979 and 1980-
99 relative to 1900-19, 1920-39, and 1940-59 and significantly less in 1980-99
relative to 1800-99. Reduced plant height and reduced GA treatment
differences are associated with increased usage of the Rht-B1b and Rht-D1b
alleles, which were not present in any variety released before 1940 and had
increasing prevalence in the time periods following 1940. However, in the
time frame 1940-59, only two of 32 accessions contained one of these alleles,
yet plant heights were significantly shorter than in the preceding time periods.
For the Rht-B1 insertions, no clear trend in prevalence with time period of
registration is apparent. The 160 bp insertion was most prevalent in the
1800‟s (five of nine lines, 0.56 frequency) and following that time frame, the
frequency of lines containing this allele in any 20-year time span ranged from
0.14 to 0.20. The 197 bp insertion was most frequent (0.20) in accessions
registered between 1960 and 1979 and least frequent (0.0) from 1900-1919.
6.3.8. Correlations among height, GA sensitivity, and ear emergences of
the INRA BWCC
Correlation analyses among plant height, GA treatment difference, and
heading date of accessions revealed the highest correlation among these
three phenotypes is between plant height and GA treatment difference (R2 =
0.338 (Figure 6.8). Short heights and small GA treatment differences are
most frequently represented in accessions with the Rht-B1b or Rht-D1b allele
(Figure 6.8A). In comparison, the correlations between heading date and GA
treatment difference (R2 = 0.010) (Figure 6.8B) and between heading date
and plant height (R2 = 0.033) (Figure 6.8C) were much lower.

205
Figure 6.8. Correlations between plant phenotypes among INRA BWCC accessions.
Correlations were made between plant height and GA treatment difference (A), days to
heading and GA treatment difference (B), and plant height and days to heading (C) for the
INRA BWCC accessions. Each point represents the mean of an accession. Rht WT =
Accessions with the Rht-B1a+Rht-D1a genotype; Rht SD = accessions with a semi-dwarfing
allele (Rht-B1b and/or Rht-D1b); Ppd-D1b = accessions containing the Ppd-D1b allele; Ppd-
D1a = accessions containing the Ppd-D1a allele.
R
100
110
120
130
140
150
160
170
180
190
-20 0 20 40 60
Days to
Head
ing
GA trt dif f (mm)
50
70
90
110
130
150
170
190
210
100 120 140 160 180 200
Pla
nt H
eig
ht
(cm
)
Days to Heading
R2 = 0.010
R2 = 0.033
A)
B)
C)
50
70
90
110
130
150
170
190
210
-20 0 20 40 60
Pla
nt
He
igh
t(c
m)
GA trt dif f (mm)
R2 = 0.338
Rht Wt; Ppd-D1b
Rht Wt; Ppd-D1a
Rht SD; Ppd-D1b
Rht SD; Ppd-D1a

206
6.4. DISCUSSION
6.4.1. Rht-1 and Ppd-D1 allelic prevalence in the INRA BWCC
Approximately 23% of the 368 INRA BWCC accessions contained either Rht-
B1b and/or Rht-D1b with Rht-B1b occurring in 12.2% and Rht-D1b occurring
in 12.8% of the accessions (2.4% contained both alleles) (Table 6.2). In 67
wheat varieties from 20 countries held in the Institute of Field and Vegetable
Crops, Novi Sad, core collection, Rht-B1b occurred in 58% of the accessions
and Rht-D1b in 22% of the accessions (Tosovic-Maric, 2008). Other studies
have examined prevalence of these alleles in geographically restricted sets of
accessions, which vary widely in the occurrence of these alleles: in 220
autumn-sown Chinese wheats, Rht-B1b and Rht-D1b were present in 25%
and 46% of the varieties, respectively (Zhang et al. 2006); in 57 Czech
varieties, Rht-B1b and Rht-D1b were present in 11% and 25% of the varieties,
respectively (Chrpova et al., 2003); in 105 Serbian wheats, Rht-B1b and Rht-
D1b were present in 29% and 22% of the germplasm, respectively (Tosovic-
Maric, 2008); in 95 winter wheat varieties registered in Germany in 2004, Rht-
B1b and Rht-D1b were present in 6% and 38% of varieties, respectively
(Knopf et al., 2008); in 216 CIMMYT wheats, Rht-B1b and Rht-D1b were
present in 82% and 14% of the accessions, respectively (Dan et al., 2009).
The relatively low occurrence of Rht-B1b and Rht-D1b in the INRA BWCC is
likely due to a high proportion of accessions that pre-date the widespread use
of the Rht-1 semi-dwarfing alleles (beginning in the 1960s). The increased
usage of semi-dwarf alleles over time is evident in the collection as Rht-B1b
and Rht-D1b were not present in any fixed line released before 1947 or in any
landrace while nearly 60% of the INRA BWCC varieties released between
1980 and 1999 contained one of these alleles (Table 6.10). Although Rht-B1b
and Rht-D1b were not present in INRA BWCC fixed lines released prior to
1947 or lNRA BWCC landraces, both alleles are present in Japanese
landraces (Yamada 1990) and are supposedly derived from the Japanese
landrace „Daruma‟, which was present as early as 1894 (Kihara, 1983).
Among the INRA BWCC accessions, the frequencies of Rht-B1a_160 (16.0%)
207
and Rht-B1a_197 (11.7%) are similar to the frequencies of the Rht-B1b and
Rht-D1b (Table 6.2). Both insertions are found in several geographical
regions (Table 6.3) and can be found in wheat accessions registered prior to
1900 (Table 6.10). The 160 bp insertion is present in five of the nine fixed
lines released prior to 1900 (the earliest being released in 1830) and in four
landraces (three from France and one from Nepal). The 197 bp allele was
found in a single fixed line released prior to 1900 and was not present in any
landraces. However, as reported in Chapter 5, this insertion was present in
accessions of T. dicoccoides and T. dicoccum and the sequence has high
homology to collinear regions on the A and D genomes of bread wheat
indicating that the presence of the 197 bp sequence is the ancestral condition.
The primer pairs used to screen for the Rht-B1 and Rht-D1 alleles did not
clearly identify any alternative alleles in the 368 INRA BWCC accessions.
However, a polymorphism would not be easily recognised unless it prevented
primer annealing or was a large indel that could be visualised on an agarose
gel. In the case of lines containing Rht-B1c, no product was amplified with
either the Rht-B1a or Rht-B1b primer pair (Table 6.1). The Rht-B1c allele has
recently been sequenced and a > 2 kb insertion is thought to exist in the
DELLA domain (Wu et al., 2011), which is in the region that would be
amplified by the Rht-B1a or Rht-B1b primer pair. The increased product size
is the likely cause of the PCR amplification failure as the 30 s extension time
used may be insufficient to amplify a > 2 kb product. Not surprisingly, the
dwarf alleles Rht-B1d, Rht-B1e, and Rht-D1c from the control set were not
identified using the Rht-B1a/b or Rht-D1a/b primer pairs. The inability of
primers designed to the Rht-B1a/b or Rht-D1a/b SNPs to identify these alleles
was also reported by Pestsova et al. (2008) when using Rht-B1a/b and Rht-
D1a/b primers from Ellis et al. (2002).
The photoperiod insensitive Ppd-D1a allele was present in 25.8% of the
accessions (Table 6.2) and was found in geographical regions worldwide
except for Northern European nations (Table 6.3). In an examination of 485
lines from the GEDIFLUX collection of European bread wheats released
between 1940 and 2000, the Ppd-D1a allele was present in only 5% of the

208
accessions and was rarely found in Northern European wheats (Wilhelm,
2007). The Ppd-D1a allele is most suited to growing seasons that are shorter
than those found in Northern Europe (Worland et al., 1998), which explains its
absence in this region. Looking only at accessions originating from France (a
central / southern European nation), Ppd-D1a occurred in 24% of the INRA
BWCC accessions, which is similar to the percentage (30%) reported for
French accessions in the GEDIFLUX collection (Wilhelm, 2007). In the INRA
BWCC, Ppd-D1a was most prevalent in the period 1980-1999 (43% of the
varieties) (Table 6.10), but was also present in a variety (INRA_14011)
registered as early as 1899.
In addition to the Ppd-D1a and Ppd-D1b alleles, which result in 297 bp and
414 bp products, respectively, with the Ppd-D1 primers designed by Beales et
al. (2007), an approximately 450 bp product was amplified from the synthetic
line „W7984‟ (INRA_13812). Guo et al. (2010) amplified a 453 bp product with
the same Ppd-D1 primers using DNA extracted from synthetic wheat and Ae.
tauschii accessions. The similar product sizes, and Ae. tauschii origins of the
two alleles, indicate that these are likely the same allele. The larger size of
the 453 bp product relative to the 414 bp Ppd-D1b product results from 24 bp
and 15 bp insertions that are separated by 105 bp (Guo et al., 2010). For
three fixed lines and three landraces from the INRA BWCC, no product was
amplified using the Ppd-D1 primers even though multiple DNA replicates
known to amplify products with other primers were used. The data suggest a
previously unidentified polymorphism upstream of Ppd-D1, which may have
originated near the Black Sea as the landraces carrying this apparent allele
were from Azerbaijan, Georgia, and Turkey.
6.4.2. Genotype-Phenotype associations in the INRA BWCC
For heading date, the Ppd-D1 locus accounts for the majority of the genotype
variation in the Rht-B1.Rht-D1.Ppd-D1 REML analysis, but the effect of Rht-
B1 is also significant (p = 0.023). In the AA-PS, only Ppd-D1 was associated
with heading date (Table 6.9). Ear emergence of Ppd-D1a plants was an
average of 6.6 days earlier than Ppd-D1b plants (Table 6.8). Similarly,

209
Worland et al (1988) reported that Ppd-D1a generally accelerates ear
emergence by six to eight days in the UK. In the GEDIFLUX bread wheat
collection, Wilhelm (2007) reported that heading date of Ppd-D1a accessions
was an average of eight days earlier than lines containing Ppd-D1b when
grown in the UK. At the Rht-B1 locus, Rht-B1a_160 accessions in the INRA
BWCC had significantly later heading dates (2.9 days) than Rht-B1a_0
accessions. The cause of this association is not clear, but may be related to
population structure, which was not accounted for in the means comparisons.
A lack of association of Rht-B1b and Rht-D1b with heading date agrees with
previous observations (J. Flintham, pers. comm.).
Changes in plant height in the Rht-B1.Rht-D1.Ppd-D1 REML mixed model
were associated with the Rht-B1, Rht-D1, and Ppd-D1 loci (F pr values for all
loci < 0.001) with most of the variation associated with the Rht-1 loci (Table
6.6B). All three loci were also found to be highly associated (p values both
less than 5.7 x 10⁻²²) with changes in plant height in the AA-PS (Table 6.9).
The greatest changes in mean plant height were associated with the Rht-B1b
and Rht-D1b alleles (Table 6.8B). The mean plant heights of Rht-B1a+Rht-
D1b, Rht-B1b+Rht-D1a, and Rht-B1b+Rht-D1b accessions were 74% (34.9
cm shorter), 75% (33.3 cm shorter), and 54% (61.1 cm shorter), respectively,
that of the Rht-B1a+Rht-D1a accessions (Table 6.8B). The reductions in
height due to the Rht-1 semi-dwarf alleles is slightly greater than reported by
Flintham et al. (1997) using NIL comparisons (% heights of Rht-B1a+Rht-D1a:
Rht-B1a+Rht-D1b, 83%; Rht-B1b+Rht-D1a, 86%; Rht-B1b+Rht-D1b, 58%),
but with the same rank. The larger effect of the semi-dwarf alleles in the
INRA BWCC collection may be partially due to the inclusion of germplasm that
pre-dates the widespread use of Rht-B1b and Rht-D1b. This older
germplasm would be expected to contain fewer secondary height-reducing
alleles than modern germplasm, thereby exaggerating the effects of these
alleles. The presence of additional alleles affecting height in the more
recently released INRA BWCC lines is suggested by the significantly shorter
mean plant height in the years 1940-59 relative to preceding time periods
even though only two of the 32 accessions released between 1940-59
contained Rht-B1b or Rht-D1b. Changes in plant height associated with the

210
Rht-B1 insertion alleles were less pronounced, but still present in the Rht-B1
means analysis. Mean plant heights of Rht-B1a_160 and Rht-B1a_197
accessions were 92% (9.7 cm shorter) and 88% (14.7 cm shorter) the height
of Rht-B1a_0 accessions. The Rht-B1a_197 height reduction was significant
at p < 0.05 (Table 6.7B). In the AA-PS, the effects of these alleles were not
significant (Table 6.9), although the probability threshold (p < 0.001) was
greater. Also, the AA-PS did not include Rht-B1b, Rht-D1b, or Ppd-D1
genotype information and the strong effects of these alleles may have masked
weaker effects on plant height.
Accessions containing Ppd-D1a have plant heights that are 92% (9 cm
shorter) that of Ppd-D1b accessions when averaged over the four Rht-
B1+Rht-D1 genotype groups (Table 6.8B). However, the Rht-B1*Rht-
D1*Ppd-D1 REML analysis indicates that a significant interaction of Ppd-D1
with Rht-B1 (F pr < 0.001) and a nearly significant interaction with Rht-D1 (F
pr = 0.084) are present (Table 6.6). Height changes associated with Ppd-D1
are by far the greatest in the Rht-B1a+Rht-D1a background, where Ppd-D1a
accessions are on average 80% the height (29.2 cm shorter) of Ppd-D1b
accessions. In backgrounds containing Rht-B1b and/or Rht-D1b, Ppd-D1a
accessions have mean plant heights that are 93% (5.5 cm reduction) to 103%
(2.9 cm increase) the mean plant heights of Ppd-D1b accessions. The cause
of the interaction is not clear and is further complicated by a close linkage of
Ppd-D1a with the semi-dwarf allele Rht8 (approximate 21-22 cM separation
(Worland et al., 1998; Gasperini, 2010)) and a shared ancestry, at least in
European varieties, that is traced back to the Japanese variety Akakomugi
(Giorgi et al., 1982; Worland, 1999). Accessions with the Ppd-D1a allele (and
therefore also likely to contain Rht8) in the Rht-B1a+Rht-D1a background had
a greater height reduction here than in Cappelle-Desprez (Rht-B1a+Rht-D1a
background)/Mara 2D substitution RILs where height reductions of 18 cm
(Worland et al., 1998) and 16 cm (15%) (Gasperini, 2010) were reported. The
greater height reduction associated with Ppd-D1a in the Rht-B1a+Rht-D1a
background reported here may, as described above, be caused by additional
height genes present among INRA BWCC accessions or may result from
population structure.

211
Changes in GA treatment difference (a measure of GA sensitivity) in the Rht-
B1*Rht-D1*Ppd-D1 REML were associated with Rht-B1 and Rht-D1, but not
with Ppd-D1 (Table 6.6C). As with plant height, the greatest changes in GA
treatment difference were associated with the Rht-B1b and Rht-D1b
genotypes (Tables 6.7C; 6.8C). Both alleles were also associated with GA
treatment difference in the AA-PS (Table 6.9). INRA BWCC accessions with
the Rht-B1a+Rht-D1a alleles had a significantly (p < 0.05) greater mean GA
treatment difference (28.5 mm) than accessions with the Rht-B1b+Rht-D1a
(9.6 mm), Rht-B1a+Rht-D1b (4.7 mm), or Rht-B1b+Rht-D1b (-0.1 mm)
genotype. The slight response to GA present in the Rht-B1b+Rht-D1a and
Rht-B1a+Rht-D1b accessions was also reported by Yamada (1990) and
indicates that varieties containing a single Rht-1 semi-dwarf allele are partially
sensitive to GA. Interestingly, the Rht-B1b+Rht-D1a mean GA treatment
difference was significantly greater (p < 0.05) than that of Rht-B1a+Rht-D1b in
the means analysis. A greater GA response in Rht-B1b+Rht-D1a wheat
accessions relative to Rht-B1a+Rht-D1b accessions was also reported by
Yamada (1990) in Japanese fixed lines and landraces. The increased GA
sensitivity and plant height associated with Rht-D1b relative to Rht-B1b
suggests that the effect associated with Rht-B1b may be slightly less potent
than that associated with Rht-D1b. Rht-B1a_160 and Rht-B1a_197 were
associated with a slight reduction (2.9 mm and 1.0 mm, respectively) in GA
treatment difference relative to Rht-B1a_0. However, none of these
differences were significant at p < 0.05 (Table 6.7C). Neither insertion allele
was associated at p < 0.001 with GA treatment difference in the AA-PS (Table
6.9).
Although the variation in GA treatment difference associated with Ppd-D1 was
very small and not statistically significant in the REML analysis (Table 6.6),
the effect was found to be highly significant (1.8 x 10⁻¹⁰) in the AA-PS. This is
surprising because accounting for population structure generally reduces the
statistical significance of associations (I Mackay, NIAB, pers. comm.) and the
Ppd-D1 and Rht8 loci are generally not associated with GA insensitivity. The
direction (increase or decrease) of the effect of the Ppd-D1a allele on GA

212
sensitivity is not clear. In the Rht-B1a+Rht-D1a background, the mean GA
treatment difference associated with Ppd-D1a is 1.4 mm less than that
associated with Ppd-D1b while in backgrounds containing Rht-B1b and/or
Rht-D1b, Ppd-D1a is associated with an increased GA treatment difference
(0.5 to 5.0 mm) relative to Ppd-D1b (Table 6.8C). As discussed above, the
AA-PS does not directly account for the Rht-B1 or Rht-D1 loci. This is likely to
be an important consideration as 49% (44 of 90) of the Ppd-D1a accessions
contain Rht-B1b and/or Rht-D1b whereas only 14% (36 of 262) of the Ppd-
D1b accessions contain Rht-B1b and/or Rht-D1b.
In summary of the association analyses, Rht-B1b and Rht-D1b were
significantly associated with reduced plant height, reduced GA sensitivity, and
not associated with significant changes in heading date in either the Rht-
B1*Rht-D1*Ppd-D1 REML analysis or the AA-PS analysis. Rht-B1a_160 and
Rht-B1a_197 were not associated with changes in height, GA sensitivity or
heading date in the AA-PS. In the Rht-B1*Rht-D1*Ppd-D1 REML analysis,
however, Rht-B1a_160 and Rht-B1a_197 were associated with reduced plant
height, reduced GA sensitivity, and later ear emergence relative to Rht-B1a_0
when comparing fitted means. These effects were not significant at a
probability threshold of 0.05 except for plant height (Rht-B1a_197 > Rht-
B1a_0) and heading date (Rht-B1a_160 was later than Rht-B1a_0),
suggesting that if a real effect exists, it may be small. Ppd-D1a was
significantly associated with earlier ear emergence and reduced height in the
Rht-B1*Rht-D1*Ppd-D1 REML and AA-PS analyses. An association of Ppd-
D1a with GA sensitivity did not occur in the Rht-B1*Rht-D1*Ppd-D1 REML
analysis, but was present in the AA-PS analysis, although it is not clear if Ppd-
D1a increased or decreased GA sensitivity.
6.4.3. Correlations among phenotypes in the INRA BWCC
The plant heights of the individual accessions ranged from 54 to 200.5 cm
(mean of 133 cm) and heading dates ranged from 116 to 185 days (mean of
141 days). When the INRA BWCC accessions were grown in Clermont-
Ferrand by Bordes et al. (2008), plant heights ranged from 49 to 150 cm
213
(mean of 94 cm) and ear emergence dates ranged from 127 to 160 days
(mean of 140 days). UK heading dates were likely measured at an earlier
stage than in France as ear emergence in France was recorded as the date
(from January 1) when spikes had emerged from 50% of the tillers (Bordes et
al., 2008) and UK heading dates were recorded as the date when 50% of the
primary spike was visible above the flag leaf. Nonetheless, the mean heading
dates are fairly similar, while mean plant heights between the two locations
are very different. Height difference could be attributed to differences in
growth conditions as plants in the UK were grown in pots and irrigated while
being grown in the soil without irrigation in France.
When correlations between plant phenotypes recorded in this study were
estimated, not surprisingly the strongest correlation was between GA
treatment difference and plant height (R2 = 0.338; Figure 6.8). Correlations
between plant height and heading date were low (R2 = 0.033). In contrast,
Bordes et al (2008) reported R2 values of 0.33 between ear emergence and
plant height when the INRA BWCC was grown in France. The differences
may relate to the different growing conditions used as described above. In
another study that looked at the correlation between plant height and
flowering date in European winter wheat landraces and obsolete cultivars
grown in Prague-Ruzyně, Czech Republic, Dotlacil et al. (2003) estimated an
R2 value of 0.036, similar to that reported here. UK heading date and GA
treatment difference were only weakly correlated (R2 = 0.010), suggesting that
GA sensitivity has little effect on heading date in the UK.
6.4.4. GA sensitivities among INRA BWCC accessions
The MM procedure, which was based solely on the GA+ treatment, is similar
to the scoring methods employed by Gale and Gregory (1977), which were
used to classify GA-treated seedlings based on length distribution. For the
Rht-B1a+Rht-D1a accessions, the MM procedure only identified one
accession (INRA_03752, „IAR W83-2‟) as GA insensitive (Table 6.5). This
accession was classified as GA insensitive in GA expt. 2 due to a non-
significant (p < 0.05) treatment difference, but in GA expt. 1 and 3, this line

214
was classified as GA sensitive as the treatment differences were much
greater. It is not clear why the treatment differences varied between
experiments for this accession. The LSD test, based on GA treatment
differences, identified 29 Rht-B1a+Rht-D1a as NSTD (no significant treatment
difference, an indicator of GA insensitivity) in GA expt. 1. However, GA expts.
2 and 3 showed 28 of these accessions to be GA sensitive based on the LSD
test and the 29th accession was not re-tested due to poor germination.
Among INRA BWCC accessions containing Rht-B1b or Rht-D1b, the MM
procedure correctly identified these as GA insensitive in the majority of cases
(64% of the time across GA experiments) and more importantly, in only three
instances of 142 (2%) incorrectly identified these accessions as GA sensitive
(Table 6.5). For the LSD test, INRA BWCC accessions containing Rht-B1b or
Rht-D1b were incorrectly identified as GA sensitive in 17 instances of 142
(12%) and classification of accessions as GA insensitive was not possible.
These results indicate that the MM procedure had a greater success rate in
correctly classifying GAI accessions than the LSD procedure. In addition, the
MM procedure only requires the use of a GA+ treatment whereas the LSD
requires a GA+ and GA- treatment. However, GAI accessions that have long
STFL lengths in the GA+ treatment (due to genetic background) would be
more difficult to detect with the MM.
These results indicate that there may not be additional GA insensitive alleles
in the INRA BWCC, or if present they are more responsive to GA than Rht-
B1b, Rht-D1b, or Rht-B1c. An example of a more responsive GAI allele is
Rht-B1d, which when treated with GA has seedling lengths shorter than wild
type and longer than Rht-B1b or Rht-D1b seedlings (Worland, 1986).
Intermediate GA responders might be difficult to detect in this collection due to
the heterogeneity of genetic backgrounds or due to experimental conditions.
Based on mean values from the three GA expts., 42 Rht-B1a+Rht-D1a
accessions fall within the range of GA treatment differences found among
accessions with the Rht-B1b or Rht-D1b allele (20.8 mm or less; Appendix
VI), suggesting that intermediate GA sensitivity alleles may exist at the Rht-1
loci.

215
Part of the objective of the GA screen was to identify a GAI allele at the Rht-
A1 locus, at which no alleles affecting height are as of yet known. In contrast,
several spontaneous GAI mutants exist at the Rht-B1 and Rht-D1 loci (listed
in Table 1.2). The absence of GAI alleles at the Rht-A1 locus in the BWCC
and the low level of Rht-A1 genetic diversity among the bread wheat
accessions studied in Chapter 5, suggest that alterations at this locus may be
detrimental to wheat survival.
6.4.5. Conclusions
Overall, although no novel GAI alleles were clearly detected in the INRA
BWCC, valuable information was gained regarding GA sensitivity testing and
analyses, which can be employed in searches of other germplasm sets for
GAI alleles. Association analyses of the Rht-B1 insertions indicates these
alleles may have a minor effect on GA sensitivity and plant height, suggesting
the need for further study of the insertion haplotypes. In addition, genotyping
of the INRA BWCC accessions for the Rht-B1 insertions, Ppd-D1, Rht-B1,
and Rht-D1 along with phenotyping for plant height, GA response, and
flowering date increases knowledge of the INRA BWCC set, which may help
identify intermediate GAI alleles and will be useful for utilising this collection in
other genetic studies.

216
7. ORIGINS OF THE RHT-B1B AND RHT-D1B ALLELES
7.1 INTRODUCTION
The predominant sources of semi-dwarfism in modern wheat varieties are the
Rht-B1b and Rht-D1b alleles with an estimated 70% of the wheat acreage
planted with varieties carrying one of these alleles (Evans, 1998). The
primary source of both of these mutant alleles is the line „Norin 10‟ (Gale and
Youssefian, 1985; Dalrymple, 1986), which originated in Southeast Asia.
„Norin 10‟ was introduced to the Western world by S.C. Salmon, a USDA
advisor to the army in Japan, who noticed the stiff, short-stemmed variety and
sent it to the USA (Reitz and Salmon, 1968). Orville Vogel, a breeder at
Washington State University, crossed „Norin 10‟ to a U.S. adapted variety
„Brevor‟. Progeny of the „Norin 10‟ × „Brevor‟ cross, particularly selection 14,
became the primary donors of semi-dwarf alleles in U.S. wheat varieties
(Dalyrmple, 1986). Norman Borlaug at the International Maize and Wheat
Improvement Centre (CIMMYT) in Mexico received selections of „Norin
10/Brevor‟ and incorporated the semi-dwarf trait into Mexican wheat varieties,
which were soon utilised globally as part of the „green revolution‟. In addition
to „Norin 10‟, relatively minor sources of semi-dwarfism have also been used,
including „Suweon (also referred to as „Suwon‟) 92‟ and „Seu Seun 27‟ (Allan
et al., 1968). „Seu Seun 27‟, was the apparent semi-dwarf donor for several
U.S. varieties in the 1960s and 1970s and 'Suweon 92‟ had more limited use
(Dalrymple 1980).
„Norin 10‟, „Seu Seun 27‟, and „Suweon 92‟ are thought to have in common
the ancestor „Daruma‟, believed to have been the donor of Rht-B1b and Rht-
D1b (Dalrymple, 1980; Kihara, 1983; Dalrymple, 1986). The history of
„Daruma‟, a landrace (Worland, 1986; Yamada, 1990), dates back to as early
1894 where it was recorded as a control variety in wheat performance trials in
Japan (Kihara, 1983). The origin of semi-dwarfism in „Daruma‟ is not clear
and may have arisen by spontaneous mutation in Japanese wheat
populations or may have arisen in China or Korea (Kihara, 1983). It was
suggested by Cho et al. (1980), that „Daruma‟ is derived from the native

217
Korean wheat „Anzunbaengimil‟ or ‟Nanjangmil‟ “crippled wheat”, existing in
the 3rd or 4th century AD before being introduced to Japan during the 16th
century Korean-Japanese War.
The lineage from „Daruma‟ to „Norin 10‟ as reported by Dalrymple (1980),
Kihara (1983), and Dalrymple (1986) is shown in Figure 7.1. „Daruma‟ or a
white variant called „Shiro-Daruma‟ was crossed with „Glassy Fultz‟ (a variant
of the American variety „Fultz‟) in 1917 in Japan to produce „Fultz-Daruma‟. In
1925, „Fultz Daruma‟ was crossed with „Turkey Red‟ (which was widely grown
in the USA in the early 20th century and often referred to as „Turkey‟) to
produce „Tohuku‟ selection number 34, better known as „Norin 10‟, which was
registered and released in 1935 in Japan. Figure 7.1 also shows the lineage
from „Daruma‟ to „Suweon 92‟ and „Seu Seun 27‟ as described by Dalrymple
(1980), Kihara (1983), and Dalrymple (1986). A red variant of „Daruma‟ („Aka-
Daruma‟) was crossed to „Glassy Fultz‟ to produce the line „Aka-
Daruma/Glassy Fultz‟ in Japan with year unknown. This line was crossed to
„Kanred‟ (a line originally selected from „Crimean‟, a strain of „Turkey Red‟) in
Japan and F3 seeds exported to Korea where „Suweon 85‟ was released in
1932. „Suweon 85‟ was then crossed to „Suweon 13‟ to produce „Suweon 92‟
and „Suweon 90‟, which were both released in 1934 in Korea. „Shiroboro‟, a
Japanese variety, was crossed to „Suweon 90‟ to produce „Seu Seun 27‟,
which was used as a breeding line.

218
Figure 7.1. Origins of Rht-B1b and Rht-D1b. The genealogy from „Daruma‟ to „Norin
10/Brevor-14‟, „Suweon 92‟, and „Seu Seun 27‟ are shown according to Dalrymple (1986) and
Kihara (1983). The dashed line (x?) indicates that „Daruma‟, instead of „Shiro-Daruma‟ may
be a parent of „Fultz Daruma‟. The country where breeding was performed is shown in italics
above that section of the chart. The year crosses were performed is shown in parenthesis
and year of varietal release is shown in bold font if known.
The objective of this chapter is to use molecular techniques to confirm the
donors of the Rht-B1b and Rht-D1b alleles present in „Norin 10/Brevor-14‟
and to determine the Rht-1 alleles present in „Seu Seun 27‟ and „Suweon 92‟
and the donors of these alleles. To accomplish this, the available accessions
shown in the ancestral genealogy of these lines (Figure 7.1.) were grown and
genotyped with markers specific to the Rht-B1b and Rht-D1b causative SNPs.
Determining the ancestral lineage of the semi-dwarf alleles will aid in
determining the origin of the alleles, which may also be useful for identifying
alternative Rht-B1b and Rht-D1b sources.
'Daruma'
'Shiro-Daruma'
'Glassy Fultz'
'Aka-Daruma'
'Suweon 92'(1934)
'Suweon 13'
'Suweon 85' (1932)
'Kanred'
'Aka-Daruma/Glassy Fultz'
'Glassy Fultz'
'Seu Seun 27'
'Shiroboro'
'Suweon 90' (1934)
'Fultz Daruma'
'Turkey Red'
'Norin 10'
'Brevor'
'Norin 10/Brevor-14'
Japan
USA
Korea
×(1917)
×(1925)
(1935)
×(1949)
×
×?
×
×
× (1936)
Japan

219
7.2. MATERIALS AND METHODS
7.2.1. Germplasm sources
Seed of accessions used for Rht-1 genotyping and plant phenotyping were
provided by: M. Ambrose, JIC BBSRC cereals collection; H. Bockelman,
USDA-ARS National Plant Germplasm System (NPGS); the NIAB DUS
collection; T.Sasanuma, Kihara Institute of Biological Research (KIBR),
Yokohama City University, Yokohama, Japan; Kyoto University, Kyoto, Japan;
and CIMMYT. Accessions from Kyoto University and CIMMYT were obtained
through M. Ambrose. Accessions from KIBR were ordered through the
KOMUGI Wheat Genetics Resources Database
(http://www.shigen.nig.ac.jp/wheat/komugi) (Table 7.1). Accession numbers
in the text will be enclosed in square brackets [ ]. All germplasm was grown
from original source material except [PI157599-1], which is a self-pollinated
progenitor from an Rht-B1b+Rht-D1b homozygous [PI157599] individual.
Table 7.1. Summary of seed accessions and Rht-B1 and Rht-D1 genotype results
Varietyb
Accession
Numberc Seed Sourced
No. plants
assayed Rht-B1 and Rht-D1 alleles
Aka-Daruma PI325843 USDA-ARS 12B1a D1b (8); B1a/ b D1b (2);
B1a D1a/ b (1); B1- D1b (1)
Aka-Daruma KT020-009 KIBR 8B1a D1b (6); B1a/ b D1b (1);
B1a/ b D1a/ b (1)
Aka-Daruma KU-1206 Kyoto University 6 B1a D1b (5); B1a D1a/ b (1)
Aka-Daruma CWI24999 CIMMYT did not germinate
Brevor CItr12385 USDA-ARS 8 B1a D1a
Daruma KT020-110 KIBR 6 B1b D1a (5), B1b D1- (1)
Daruma CWI25102 CIMMYT did not germinate
Fultz W748 JIC 4 B1a D1a
Fultz PI5493 USDA-ARS 8 B1a D1a
Fultz-Daruma PI325844 USDA-ARS 4 B1a D1a
Kanred CItr5146 USDA-ARS 8 B1a D1a
Kanred PI90832 USDA-ARS 7 B1a D1a
Kanred W741 JIC 4 B1a D1a
Norin 10 W204 JIC 4 B1b D1b (3); B1a/ b D1b (1)
Norin 10 PI156641 USDA-ARS 7 B1b D1b (6); B1b D1a/ b (1)
Norin 10/Brevor-14 W9743 JIC 4 B1b D1b (3); B1a/ b D1a (1)
Norin 10/Brevor-14 CItr13253 USDA-ARS 22B1b D1b (18); B1b D1a/ b (2);
B1a/ b D1a/ b (1); B1- D1b (1)
Genotype Resultsa

220
Table 7.1 continued. Summary of seed accessions and Rht-B1 and Rht-D1 genotype
results
a B1 and D1 denote the genome; suffix „a‟ denotes wild type alleles; suffix ‘b’ denotes the Rht-
B1b or Rht-D1b alleles, which are shown in bold font. Where there is segregation at a locus,
this is shown by a (/) between the genotypes. The numbers of plants of each genotype are
indicated in parenthesis when segregants are present. A (-) represents no amplified product.
b „Suweon‟ has also been described as „Suwon‟; „Turkey Red‟ has also been described as
„Turkey‟.
c PI5493 is also recorded as Cltr1923; PI157603 also is recorded as Cltr12666. PI157599-1
refers to progeny of a PI157599 (Rht-B1b+Rht-D1b) individual.
d USDA-ARS = United States Dept. of Agriculture - Agricultural Research Service, National
Plant Germplasm System; KIBR = Kihara Institute of Biological Research; CIMMYT =
International Maize and Wheat Improvement Center; JIC = John Innes Centre.
7.2.2. Growth conditions of accessions
Plants were grown in one of three glasshouse sowings: JIC 2008, NIAB 2010,
or JIC 2010 (Table 7.2). Each sowing contained the lines Mercia (Rht-
B1a+Rht-D1a) and „Norin10/Brevor-14‟ (N10/B14) [Cltr-13253] (Rht-B1b+Rht-
D1b) for comparative purposes across sowings. Mercia is included only as a
control whereas N10/B14 [Cltr-13253] is also part of the „Daruma‟ progeny
tree. Seeds of all varieties were stratified for 3-5 days at 4°C on filter paper,
and then placed at room temperature for 5-7 days before transplanting to 96-
well trays containing compost. Following transplanting, all plants were
vernalised at 4°C for 8-9 weeks and a minimum of six seedlings per accession
Varietyb
Accession
Numberc Seed Sourced
No. plants
assayed Rht-B1 and Rht-D1 alleles
Seu Seun 27 PI157584 USDA-ARS 5 B1a D1a
Shiro-Daruma PI191345 USDA-ARS 14 B1a D1a (13); B1a/ b D1a (1)
Shiro-Daruma KT020-016 KIBR 8 B1a D1b
Shiro-Daruma CWI25422 CIMMYT 8 B1a D1a (7); B1a/ b D1a (1)
Shiro-Daruma PI325845 USDA-ARS 8 B1a D1b
Shiroboro 1 KT020-015 KIBR 8 B1a D1a
Suweon 85 PI157599 USDA-ARS 6 B1b D1b (3); B1a/ b D1b (3)
Suweon 85 PI157599-1 USDA-ARS 8 B1b D1b
Suweon 85 BW6431 CIMMYT 8 B1b D1b
Suweon 85 PI157600 USDA-ARS 8 B1b D1a
Suweon 92 CItr13132 USDA-ARS 8 B1b D1b
Suweon 92 PI157603 USDA-ARS 8 B1a D1a (7); B1a/ b D1a (1)
Turkey Red PI565351 USDA-ARS 8 B1a D1a
Turkey Red PI565343 USDA-ARS 4 B1a D1a
Genotype Resultsa

221
were transferred to 1 litre pots and grown in the glasshouse until maturity.
Plants were treated with fungicide to control powdery mildew with care take to
use fungicides that did not contain known plant growth regulators.
Table 7.2. Summary of plant phenotype scores
a Control varieties included in each sowing are shown in grey background.
b PI157599-1 refers to progeny of a PI157599 Rht-B1b+Rht-D1b individual.
c Rht-1 genotype of plants that were phenotyped. „a’ = wild type allele; „b’ = Rht-B1b or Rht-
D1b (dwarfing alleles shown in bold font).
d Number of individual plants phenotyped for awn presence, height, and 50% heading date.
e Seg indicates accessions segregating for awn presence/absence
Sow-
inga Variety
Accession
numberb
Rht-1
genotypec Ind.d Awnse Mean Range CV Mean Range CV
Aka-Daruma PI325843 B1a D1b 3 Yes 59 55-61 6% 95 94-97 2%
Fultz W748 B1a D1a 4 No 110 101-115 6% 125 118-129 4%
Fultz Daruma PI325844 B1a D1a 4 Yes 93 90-98 4% 109 108-111 1%
Kanred W741 B1a D1a 4 Seg 95 85-109 12% 116 103-124 8%
Mercia W3685 B1a D1a 4 No 77 72-80 5% 121 120-122 1%
Norin 10 W204 B1b D1b 3 Yes 43 40-49 12% 106 105-108 2%
Norin 10 PI156641 B1b D1b 4 Yes 47 45-47 2% 107 106-107 0%
N10/B14 W9743 B1b D1b 1 Yes 42 - - 125 - -
N10/B14 CItr13253 B1b D1b 4 Yes 52 50-57 6% 119 118-120 1%
Seu Seun 27 PI157584 B1a D1a 4 Yes 82 78-87 4% 104 102-106 2%
Shiro-Daruma PI191345 B1a D1a 5 Yes 88 62-112 21% 104 102-109 3%
Suweon 85 PI157599 B1b D1b 2 Yes 47 45-50 8% 96 95-97 1%
Turkey Red PI565343 B1a D1a 4 Yes 88 81-100 10% 116 115-118 1%
Aka-Daruma PI325843 B1a D1b 5 Yes 74 55-85 16% 118 115-123 3%
Aka-Daruma KU-1206 B1a D1b 5 Yes 75 61-84 13% 117 113-121 3%
Aka-Daruma KT020-009 B1a D1b 6 Yes 83 61-93 14% 118 115-121 2%
Daruma KT020-110 B1b D1a 5 Yes 92 85-102 7% 124 123-125 1%
Mercia W3685 B1a D1a 8 No 86 70-97 12% 138 135-141 1%
N10/B14 CItr13253 B1b D1b 8 Yes 56 45-61 10% 139 137-141 1%
Shiro-Daruma KT020-016 B1a D1b 8 Yes 65 50-79 16% 118 116-121 2%
Shiro-Daruma CWI25422 B1a D1a 7 Yes 146 114-166 11% 137 136-139 1%
Shiro-Daruma PI191345 B1a D1a 7 Yes 148 117-174 12% 138 134-141 2%
Shiroboro 1 KT020-015 B1a D1a 8 Yes 97 80-113 13% 122 121-124 1%
Suweon 85 PI157599-1 B1b D1b 8 Yes 71 62-78 7% 129 126-130 1%
Suweon 85 BW6431 B1b D1b 8 Seg 72 64-81 8% 133 129-136 2%
Suweon 92 CItr13132 B1b D1b 8 Yes 71 55-86 16% 129 127-132 1%
Brevor CItr12385 B1a D1a 7 No 76 72-81 5% 122 121-123 1%
Fultz PI5493 B1a D1a 8 No 112 103-122 6% 119 117-123 2%
Kanred PI90832 B1a D1a 7 No 98 92-105 5% 118 117-120 1%
Kanred CItr5146 B1a D1a 8 Yes 120 113-127 4% 126 121-136 4%
Mercia W3685 B1a D1a 8 No 68 64-76 6% 124 122-127 1%
N10/B14 CItr13253 B1b D1b 6 Yes 48 43-56 9% 128 124-136 4%
Shiro-Daruma PI325845 B1a D1b 8 Yes 59 56-62 5% 102 99-105 2%
Suweon 85 PI157600 B1b D1a 7 Yes 66 63-73 6% 111 108-113 2%
Suweon 92 PI157603 B1a D1a 8 No 110 97-117 6% 119 117-122 2%
Turkey Red PI565351 B1a D1a 8 Yes 107 98-119 7% 127 124-132 2%
50% heading (DAS)gPlant height (cm)f
JIC
2008
NIAB
2010
JIC
2010

222
f Height of the primary tiller from soil surface to the tip of the inflorescence, not including
awns; CV = coefficient of variation.
g Days after sowing (DAS) until the primary tiller was 50% emerged from the flag leaf.
Seeds of the JIC 2008 planting were stratified beginning 29 July 2008. A total
of 13 accessions were included (Table 7.2, JIC 2008). Plants were removed
from vernalisation, transplanted, and placed in the JIC glasshouse with
supplementary lighting (16 hr photoperiod; 22/20°C day/night) on 8 October.
The NIAB 2010 planting consisted of 13 accessions (Table 7.2, NIAB 2010)
that were stratified beginning 7 Jan 2010. Plants were transplanted on 19
March, and placed in the NIAB glasshouse under natural temperature and
light conditions. The third planting, JIC 2010, consisted of 10 accessions
(Table 7.2, JIC 2010) and stratification began 6 July 2010. Plants were
transplanted and placed in the JIC glasshouse under supplementary artificial
lighting (16 hr photoperiod; 22/15°C day/night) on 20 Sep 2010.
7.2.3. Genotyping and phenotyping of accessions
For genotyping, leaf tissue of individual seedlings was collected and DNA
extracted using the method described in section 4.2.2. Accessions were
genotyped for Rht-B1a, Rht-B1b, Rht-D1a, and Rht-D1b as described in
section 5.2.3. Heading date was recorded as the number of days after sowing
(DAS) until the inflorescence of the primary tiller was 50% emerged above the
flag leaf. Plant height was measured at maturity as the distance from the soil
surface to the tip of the inflorescence (not including awns) of the primary tiller.
Awns were visually scored as absent or present following flowering. Rht-1
segregants and phenotypic off-types were not included in the phenotypic
analysis.
7.3. RESULTS
All but four varieties that comprise the 'Daruma' progeny tree (Figure 7.1)
were obtained. The missing varieties were „Aka-Daruma/Glassy Fultz‟,
„Suweon 13‟, „Suweon 90‟, and „Glassy Fultz‟. „Fultz‟ was obtained as a near

223
substitute for „Glassy Fultz‟. For each variety, from one to four different
accessions were obtained. A minimum of four plants per accession were
scored with the Rht-B1a/b and Rht-D1a/b markers with the exceptions of [CWI
24999] from variety „Daruma‟, and [CWI-25102] from variety „Aka-Daruma‟,
which did not germinate (Table 7.1). Several accessions were not
homozygous at the Rht-B1 and Rht-D1 loci and accessions within a variety in
some cases did not have the same genotypes. Of the 29 accessions that
were genotyped, nine segregated at the Rht-B1 locus and five segregated at
the Rht-D1 locus, which includes four lines that segregated at both loci. The
segregants represented 25% or less of the plants of any accession with the
exception of „Suweon 85‟ [PI157599] in which three individuals were Rht-
B1b/b and three individuals were Rht-B1a/b. Multiple accessions were
genotyped for nine of the varieties, the genotypes of the respective
accessions were in agreement for six of the varieties, but this was not the
case for „Shiro-Daruma‟, „Suweon 85‟, and „Suweon 92‟ (described below).
The heading dates, flowering dates, and awn presence scores of each
accession are shown in Table 7.2. The Table 7.2 phenotypes were only
recorded on plants homozygous at the Rht-B1 and Rht-D1 loci. Among the
three sowings, the „Mercia‟ and „N10/B14‟ [Cltr 13253] controls both have their
greatest plant height in NIAB 2010 (mean = 71 cm) compared with JIC 2008
(mean = 65 cm) and JIC 2010 (mean = 58 cm). Similarly, among the two
controls, the 50% heading date occurred latest in NIAB 2010 (mean = 139
DAS) compared with JIC 2010 (mean = 126 DAS) and JIC 2008 (mean = 120
DAS). The coefficient of variation (CV) for height across all accessions was
greatest in the NIAB 2010 sowing (mean CV = 12%) compared with JIC 2008
(mean CV = 8%) and JIC 2010 (mean CV = 6%). The 50% heading date in
each sowing had a mean CV of 2%.
In each sowing (with „Mercia‟ excluded because it is not part of the „Daruma‟
progeny tree), the plant heights of the double semi-dwarfs (Rht-B1b+Rht-D1b)
were lowest, followed by plants carrying a single dwarfing allele (Rht-
B1b+Rht-D1a or Rht-B1a+Rht-D1b), and the tallest lines were those carrying
both wild type alleles (Rht-B1a+Rht-D1a). The only exception to this is „Shiro-
224
Daruma‟ [KT020-016] (Rht-B1a+Rht-D1b), which was only tested in the NIAB
2010 sowing and was shorter than three Rht-B1b+Rht-D1b accessions. The
largest CV for height in any sowing date is within 4 percentage points of the
mean of the CVs for that sowing date with the exception of „Shiro-Daruma‟
[PI191345] in the JIC 2008 sowing, which is 13 percentage points higher than
the mean sowing CV with plant heights ranging widely from 62 to 112 cm.
Variation in flowering date was greatest in „Kanred‟ [W741] from the JIC 2008
sowing, which had a CV of 8% and a 22-day spread in heading date whereas
among all sowings, the next highest CV was 4% (three accessions) and the
next highest range in heading date was 16 days („Kanred‟ [Cltr5146], JIC
2010 sowing). „Kanred‟ [W741] and „Suweon 85‟ [BW6431] are the only two
accessions that segregated for presence/absence of awns.
The „N10/B14‟ pedigree tree is shown in Table 7.3 along with a summary of
the results from the Rht-1 genotyping and the plant phenotyping (from Tables
7.1 and 7.2, respectively). For comparative purposes among sowings, plant
heights and heading dates are shown relative to the mean of the „N10/B14‟
[Cltr 13253] plants grown in that sowing. In the „N10/B14‟ pedigree tree, the
only accessions with the Rht-B1b+Rht-D1b genotype are „Norin 10‟ and
„N10/B14‟. In contrast, the „Norin 10‟ parental lines „Fultz Daruma‟ and
„Turkey Red‟ do not contain Rht-B1b or Rht-D1b and plant heights are double
that of „Norin 10‟. The „Fultz Daruma‟ parental lines are „Glassy Fultz‟, which
could not be obtained, and „Shiro-Daruma‟. „Fultz‟ was instead acquired as a
near substitute for „Glassy Fultz‟ and neither accession of this line contained
Rht-B1b or Rht-D1b. Of the four „Shiro-Daruma‟ accessions, two ([KT020-
016] and [PI325845]) have an Rht-B1a+Rht-D1b genotype and two
([PI191345] and [CWI 25422]) have Rht-B1a+Rht-D1a as the predominant
genotype. However, in [PI191345] one plant out of 14 and in [CWI 25422]
one plant out of 8 was an Rht-B1a/b heterozygote (Table 7.1). The
accessions of „Shiro-Daruma‟ also differ greatly for days to heading with mean
heading date ranging from 1 to 26 days before „N10/B14‟. Accession
[PI191354] of „Shiro-Daruma‟ was grown twice (JIC 2008 = flowering in the
autumn under artificial lighting and NIAB 2010 = flowering in the spring under
natural lighting) and found to differ by two weeks relative to the „N10/B14‟

225
control. „Daruma‟, the progenitor of „Shiro-Daruma‟, did not contain the Rht-
D1b allele, but was homozygous for Rht-B1b+Rht-D1a (six seedlings tested).
Table 7.3. Rht-1 genotypes and plant phenotypes of the ‘Norin 10’ ancestors.
a „Norin 10‟ ancestry is duplicated from Fig. 7.1 except for the addition of „Fultz‟, which was
investigated due to the unavailability of „Glassy Fultz‟. An (×) indicates a genetic cross and
arrows point to the resulting progeny. „Daruma‟ instead of „Shiro-Daruma‟ may have been
crossed to „Glassy Fultz‟ (Dalrymple, 1986).
b The predominant Rht-B1 and Rht-D1 genotypes are indicated with Rht-B1b or Rht-D1b
alleles indicated by a (-b) and shown in bold font. Wild type (-a) alleles are in plain font. An
(*) indicates that segregants at a particular locus were detected.
c Plant heights are given as a percentage of the height of „Norin 10/Brevor-14‟ (N10/B14)
plants grown in the same sowing.
Varietya
Accession
Number Rht-B1 b Rht-D1 Sowing Awns
Plant ht.
(% of
N10/B14)c
Days to
heading
(diff vs.
N10/B14)d
Daruma KT020-110 B1b D1a NIAB '10 awned 166% -15
JIC '08 awned 168% -15
NIAB '10 awned 267% -1
KT020-016 B1a D1b NIAB '10 awned 117% -21
CWI25422 B1a* D1a NIAB '10 awned 263% -2
PI325845 B1a D1b JIC '10 awned 123% -26
×
Glassy Fultz (not available)
W748 B1a D1a JIC '08 no awns 211% 6
PI5493 B1a D1a JIC '10 no awns 234% -9
Fultz Daruma PI325844 B1a D1a JIC '08 awned 179% -10
×PI565343 B1a D1a JIC '08 awned 169% -4
PI565351 B1a D1a JIC '10 awned 224% -1
W204 B1b * D1b JIC '08 awned 83% -13
PI156641 B1b D1b * JIC '08 awned 89% -13
×Brevor CItr12385 B1a D1a JIC '10 no awns 159% -6
W9743 B1b D1b * JIC '08 awned 80% 6
JIC '08 awned 100% 0
NIAB '10 awned 100% 0
JIC '10 awned 100% 0
PI191345 B1a* D1a
CItr13253 B1b * D1b *Norin 10/Brevor-14
Shiro-Daruma
Fultz
Turkey Red
Norin 10

226
d Days to heading are given as the difference in days relative to N10/B14 from the same
sowing, with (-) indicating earlier heading.
The pedigree tree of „Suweon 92‟ and „Seu Seun 27‟ is shown in Table 7.4
along with a summary of the Rht-B1 and Rht-D1 genotypes identified and
plant phenotypes (height and heading date relative to „N10/B14‟ [Cltr13253])
obtained from Tables 7.1 and 7.2. The single accession of „Seu Seun 27‟ did
not contain a semi-dwarfing allele and was 158% the height of the „N10/B14‟
control. The available parental line of „Seu Seun 27‟ („Shiroboro 1‟) also did
not carry Rht-B1b or Rht-D1b. The two accessions of „Suweon 92‟ differed in
genotype and phenotype. [Cltr13132] was homozygous for Rht-B1b+Rht-D1b
and was awned, whereas in [PI157603] Rht-B1a+Rht-D1a predominated,
plants were awnless, and mean plant height was nearly double that of
[Cltr13132]. Three original sources of „Suweon 85‟, the only available parent
of „Suweon 92‟, were genotyped. One of these, [BW6431], was homozygous
Rht-B1b+Rht-D1b. A second source, [PI157599], was homozygous Rht-D1b
and segregated at the Rht-B1 locus. The third „Suweon 85‟ source
[PI157600] had the genotype Rht-B1b+Rht-D1a. Three accessions of
„Kanred‟, a parent of „Suweon 85‟ were tested and all three sources were
homozygous for Rht-B1a+Rht-D1a and plants were relatively tall, but the
accessions differed in awn phenotype: [PI 90832] had no awns, [Cltr 5146]
was awned, and [W741] segregated for awn presence. Germplasm of the
other parent of Suweon 85, „Aka-Daruma/Glassy Fultz‟, was not available. Of
the parents of „Aka-Daruma/Glassy Fultz‟, „Glassy Fultz‟ was not available
and (as described above) the progenitor line „Fultz‟ was homozygous Rht-
B1a+Rht-D1a. Three accessions of „Aka-Daruma‟ were tested and all three
had the predominate genotype of Rht-B1a+Rht-D1b. Two of these
accessions, [PI325843] and [KT020-009], had Rht-B1a/b segregants in 2 of
12 seeds and 2 of 8 seeds, respectively. „Daruma‟, as described before, was
homozygous for Rht-B1b+Rht-D1a.

227
Table 7.4. Rht-1 genotypes and phenotypes of varieties in the ‘Suweon 92’ and ‘Seu
Seun 27’ genealogy.
a „Norin 10‟ ancestry is duplicated from Fig. 7.1 except for the addition of „Fultz‟, which was
investigated due to the unavailability of „Glassy Fultz‟. An (×) indicates a genetic cross and
arrows point to the resulting progeny.
b PI157599-1 represents progeny of an Rht-B1b+Rht-D1b individual from PI157599.
c The predominant Rht-B1 and Rht-D1 genotypes are indicated with Rht-B1b or Rht-D1b
alleles indicated by a (-b) and shown in bold font. Wild type (-a) alleles are in plain font. An
(*) indicates that segregants at a particular locus were detected.
Varietya
Accession
Numberb Rht-B1 c Rht-D1 Sowing Awns
Plant ht.
(% of
N10/B14)d
Days to
heading
(diff vs.
N10/B14)e
Daruma KT020-110 B1b D1a NIAB '10 awned 166% -15
JIC '08 awned 113% -24
NIAB '10 awned 134% -21
KT020-009 B1a* D1b * NIAB '10 awned 149% -21
KU-1206 B1a D1b * NIAB '10 awned 134% -22
×
Glassy Fultz (not available)
W748 B1a D1a JIC '08 no awns 211% 6
PI5493 B1a D1a JIC '10 no awns 234% -9
Aka Daruma x
Glassy Fultz (not available)
×W741 B1a D1a JIC '08 seg 181% -4
CItr5146 B1a D1a JIC '10 awned 251% -3
PI90832 B1a D1a JIC '10 no awns 205% -10
PI157599 B1b * D1b JIC '08 awned 90% -23
PI157599-1 B1b D1b NIAB '10 awned 129% -10
BW6431 B1b D1b NIAB '10 seg 129% -6
PI157600 B1b D1a JIC '10 awned 138% -17
×Suweon 13 (not available)
Cltr13132 B1b D1b NIAB '10 awned 129% -10
PI157603 B1a* D1a JIC '10 no awns 231% -9
Suweon 90 (not available)
×Shiroboro 1 KT020-015 B1a D1a NIAB '10 awned 174% -17
Seu Seun 27 PI157584 B1a D1a JIC '08 awned 158% -16
PI325843 B1a* D1b *
Suweon 92
Aka-Daruma
Fultz
Kanred
Suweon 85

228
d Plant heights are given as a percentage of the height of „Norin 10/Brevor-14‟ (N10/B14)
plants grown in the same sowing.
e Days to heading are given as the difference in days relative to N10/B14 from the same
sowing, with (-) indicating earlier heading.
7.4. DISCUSSION
In this chapter, the origins of the Rht-B1b and Rht-D1b alleles utilised in
wheat breeding in the Western world were investigated by assaying the semi-
dwarf donor varieties „Norin 10‟, „Suweon 92‟, and „Seu Seun 27‟ along with
their progenitors (Figure 7.1) using allele-specific molecular markers and by
measuring plant phenotypes. Two accessions of „Norin 10‟ were examined
and both had a primary genotype of Rht-B1b+Rht-D1b (Table 7.1) and were
short statured (43 and 47 cm mean height; Table 7.2). The presence of Rht-
B1b and Rht-D1b in „Norin 10‟ was previously demonstrated by Gale et al.
(1981) and Yamada (1989) by test crossing with Rht-1 alleles and measuring
GA response in F2 plants and by Ellis et al. (2002) using genetic markers.
The Rht-B1b+Rht-D1b genotype was also the predominant genotype of
„N10/B14‟ (the progeny of „Norin 10‟ × „Brevor‟) as previously reported by Gale
et al. (1981) using Rht-1 test-crosses and GA sensitivity testing. The absence
of semi-dwarfing alleles in „Brevor‟ demonstrates that „Norin 10‟ is the source
of both semi-dwarfing alleles in „N10/B14‟, which was the primary semi-dwarf
donor used in Orville Vogel‟s and Norman Borlaug‟s breeding programmes
(Dalrymple, 1986). An accession of „Suweon 92‟, [Cltr 13132], also was
shown to have the Rht-B1b+Rht-D1b genotype and was short statured (129%
of „N10/B14‟). The increase in height over „N10/B14‟ may be the result of
additional genes for tall culm height that are reported to exist in this variety
(Allan et al., 1968). The second source of „Suweon 92‟ tested, [PI 157603],
carries neither Rht-B1b nor Rht-D1b and is much taller (231% of „N10/B14)
than the first source and, unlike the first source, has no awns. The second
accession of „Suweon 92‟ likely represents a seed misclassification because
„Suweon 92‟ is reported to be semi-dwarf and to carry both Rht-1 mutant
alleles based on Rht-1 testcrosses and GA sensitivity testing (Allan et al.,
1968). A single accession, [PI 157584], of „Seu Seun 27‟ was acquired;

229
however, neither Rht-B1b nor Rht-D1b was detected. Most likely, this also
represents a seed misclassification as the presence of a semi-dwarf allele had
been previously reported for „Seu Seun 27‟ [PI 157584] (Allan et al., 1968).
Although Rht-B1b+Rht-D1b is the predominant genotype of „Norin 10‟, it is not
clear where these alleles arose based on genotyping results (Table 7.3). The
parental lines of „Norin 10‟ are reported as „Turkey Red‟ and „Fultz-Daruma‟,
however, none of the accessions of these varieties contained Rht-B1b or Rht-
D1b (Table 7.1) and all were tall. The two „Turkey Red‟ accessions were
169% and 224% the height of „N10/B14‟ (Table 7.3). In agreement, Yamada
(1990) reported that „Turkey Red‟ was GA responsive (an indicator that the
GA insensitive Rht-B1b and Rht-D1b alleles are absent) and tall with a culm
length of 139 cm. U.S. historical records for „Turkey Red‟ show that this
variety was widely sown and “midtall” (short = 30 to 90 cm, midtall = 60 to 120
cm; tall = 90 to 150 cm under conditions in California) (Clark et al., 1922),
giving further evidence that „Turkey Red‟ is unlikely to contain Rht-B1b or Rht-
D1b. The other „Norin 10‟ parent, „Fultz Daruma‟ is descended from the
„Daruma‟ lineage thought to be the source of semi-dwarfism in „Norin 10‟
(Kihara, 1983; Dalrymple, 1986). However, the „Fultz Daruma‟ accession that
was assayed, [PI 325844], did not contain Rht-B1b or Rht-D1b and was tall
(179% the height of N10/B14). In agreement, „Fultz Daruma‟ was reported to
be GA responsive and tall by Yamada (1990). In contrast, a photograph
taken of „Fultz Daruma‟ by Matsumoto (1968) showed the culm of „Fultz
Daruma‟ to be shorter than that of „Norin 10‟. This photograph suggests that
the accession of „Fultz Daruma‟ used to produce „Norin 10‟ is not the same as
the accession stored in the USDA-ARS NPGS collection and may contain
Rht-B1b and Rht-D1b. Further, the USDA received seed of „Fultz Daruma‟ in
1968, well after it would have been crossed to „Turkey Red‟ (1925) and „Fultz‟
is listed in the database (http://www.ars-grin.gov/npgs) as the parent of this
accession instead of „Glassy-Fultz‟, raising more doubt as to whether this
accession is representative of the „Fultz Daruma‟ that gave rise to „Norin 10‟.
On the Suweon side of the pedigree chart (Table 7.4), assay results show that
the Rht-B1b+Rht-D1b alleles present in „Suweon 92‟ are also the predominant

230
alleles present in its parental line, „Suweon 85‟. The Rht-B1b+Rht-D1b
homozygous „Suweon 85‟ plants were 129% the height of „N10/B14‟. The
additional height may be the result of additional alleles for tall culm length that
were detected in „Suweon 92‟ by Allan et al. (1968). „Suweon 85‟ is likely the
source of both alleles in „Suweon 92‟, but it is also possible that „Suweon 13‟,
which was not assayed, is a donor. Similar to „Norin 10‟, the immediate
source of the semi-dwarfing alleles in „Suweon 85‟ is not clear. The parental
line „Kanred‟ is an unlikely donor because none of the accessions contained
Rht-B1b or Rht-D1b and plant heights were 1.8 to 2.5 times the height of
„N10/B14‟. In addition, „Kanred‟ is a selection from a strain of „Turkey Red‟,
which (as shown above) does not contain Rht-B1b or Rht-D1b, and „Kanred‟
is described as “midtall” in height (Clark et al., 1922). The more likely
immediate donor of Rht-B1b and Rht-D1b to „Suweon 85‟ is „Aka-
Daruma/Glassy Fultz‟, but no accessions were available.
„Daruma‟ is thought to be the common ancestor of „Norin 10‟, „Suweon 92‟,
and „Seu Suen 27‟ and the source of semi-dwarfism in these lines (Kihara
1983; Dalrymple, 1986); however, „Daruma‟ [KT020-110] had an Rht-
B1b+Rht-D1a genotype with no segregants detected and a mean height (92
cm) that was 166% of „N10/B14‟. Similarly, Yamada (1990) reported that
„Daruma‟ had an Rht-B1b+Rht-D1a genotype (based on test crosses and GA
responsiveness of the F2) and was 91 cm in height. Surprisingly, the two
variants of „Daruma‟, „Shiro-Daruma‟ and „Aka-Daruma‟, were shown to have
predominant genotypes of Rht-B1a+Rht-D1b. Four sources of „Shiro-Daruma‟
were assayed and two were homozygous Rht-B1a+Rht-D1b while the other
two accessions were predominately Rht-B1a+Rht-D1a; however, importantly,
an individual in each of the Rht-B1a+Rht-D1a sources was found to be
heterozygous Rht-B1a/b (Table 7.1). Similarly, for „Aka-Daruma‟, while Rht-
B1a+Rht-D1b was the predominant genotype, two of the three sources
assayed contained two seeds each that were heterozygous Rht-B1a/b. The
presence of these alleles in low frequency could be the result of
contamination of the original seed sources or the alleles may not have been
fixed in the original populations. „Daruma‟, „Aka-Daruma‟, and „Shiro-Daruma‟
are landraces according to Yamada (1990). „Daruma‟ is also described as a

231
landrace by Worland (1986) and as a “native variety” by Kihara (1983). The
Rht-B1a/b segregants found in „Shiro-Daruma‟ and „Aka-Daruma‟ may
represent alleles that were segregating in low frequency in the original
populations. Another possibility is that the alleles were not in low frequency,
but were simply under-represented in the sample taken for curation. If these
accessions were segregating at the Rht-1 locus in curated stocks, the Rht-
B1b+Rht-D1b plants may have been inadvertently selected against during
seed grow-outs as the double-dwarf would appear to be an off-type. The
presence of Rht-B1b in the parental line „Daruma‟ also suggests that Rht-B1b
was likely present in the original „Aka-Daruma‟ and „Shiro-Daruma‟
populations. In a similar manner, the accessions of „Daruma‟ in seed banks
may not be representative of native „Daruma‟ populations. For „Daruma‟, only
six seeds were tested from a single source, so segregants in low frequency
may not have been detected.
„Shiro-Daruma‟ and „Glassy Fultz‟ are historically thought to be the parents of
„Fultz-Daruma‟. Dalrymple (1986), however, noted that the official records list
„Daruma‟ as the parent of „Fultz-Daruma‟ and that the use of the white variant
„Shiro-Daruma‟ is suggested by Inazuka (1971) and Matsumoto (1968). „Aka-
Daruma‟ and „Glassy Fultz‟ are thought to be the parents of „Aka-
Daruma/Glassy Fultz‟. Seed of „Glassy-Fultz‟ could not be found in the
germplasm banks that were searched, so its parent „Fultz‟ was acquired
instead. Neither of the „Fultz‟ accessions contained a semi-dwarfing allele
and both were over twice the height of „N10/B14‟. Historically, „Fultz‟ was
widely grown in the USA and considered mid-tall (Clark et al., 1922), giving
further evidence that „Fultz‟ is unlikely to contain Rht-B1b or Rht-D1b.
Because „Glassy Fultz‟ is a variant of „Fultz‟, these results reduce the
likelihood that it would carry an Rht-B1b or Rht-D1b. Yamada (1990),
however, identified an accession called „Shou Fultz‟, and explained that
“shou” corresponds to “glassy” in English. Yamada went on to report that
„Shou Fultz‟ contained the Rht-B1b allele (based on test crosses and F2 GA
responsiveness) and speculated that the Rht-B1b allele in this line may have
resulted from a spontaneous mutation in „Fultz‟. If „Shou Fultz‟ does
232
correspond to the „Glassy Fultz‟ used in these crosses, it raises the possibility
of an alternative source of the Rht-B1b allele.
In summary, the Rht-B1b and Rht-D1b alleles are present in „Norin 10‟,
„Suweon 85, and „Suweon 92‟, which are all descendants of „Daruma‟. The
source of these alleles is unclear as the parental lines do not have an Rht-
B1b+Rht-D1b genotype. One explanation for this discrepancy is that the
parentage of these lines (Figure 7.1) is in some way incorrect and/or that seed
has been misclassified. A second explanation is that „Glassy Fultz‟ (perhaps
known in collections as „Shou Fultz‟) contributed the Rht-B1b allele to these
varieties and the Rht-D1b allele was contributed by „Shiro-Daruma‟ or „Aka-
Daruma‟. However, the existence of Rht-B1b in „Daruma‟ and the presence of
Rht-B1b segregants in „Aka-Daruma‟ and „Shiro-Daruma‟ also suggest a third
explanation. This explanation, which is not exclusive of the others, is that
both semi-dwarfing alleles originally came from „Daruma‟ as shown in Figure
7.1, but the seed bank accessions of „Daruma‟, „Aka-Daruma‟ and „Shiro-
Daruma‟, which are all landraces, is not representative of the populations
used to make the original crosses.

233
8. GENERAL DISCUSSION
The introduction of the group IV semi-dwarf alleles Rht-B1b (formerly Rht1)
and Rht-D1b (formerly Rht2) into bread wheat varieties beginning in the
1960s was a major contributor to the green revolution. These alleles are
estimated to be present in 90% of modern semi-dwarf wheat varieties
(Worland et al., 1998b) with a single variety, „Norin 10‟, serving as the primary
source of both alleles. Rht-B1b and Rht-D1b, along with the GA sensitive
Rht-B1a and Rht-D1a alleles in CS, were cloned and sequenced over a
decade ago (Peng et al., 1999). However, prior to this project, outside of the
ORF sequences of these four alleles, little was known regarding the sequence
diversity of the group IV Rht loci or the genetic composition of the contiguous
sequence that was presumably introgressed into wheat varieties along with
the semi-dwarfing alleles. Furthermore, while there were indications that the
Rht-A1 homoeologue existed (Peng et al., 1999), there was no published
sequence and the locus had not been mapped.
Whilst Rht-B1b and Rht-D1b generally benefit wheat production, deleterious
effects are also associated with these alleles. In several studies, Rht-D1b has
been associated with increased susceptibility to Fusarium Head Blight (FHB),
a major wheat disease (Hilton et al., 1999; Draeger et al., 2007; Holzapfel et
al., 2008; Voss et al., 2008; Meidaner and Voss, 2008; Srinivasachary et al.,
2008; 2009), and it has been suggested this is due to linkage (Srinivasachary
et al., 2009). Rht-B1b in some studies has also been associated with
changes in the level of resistance / susceptibility to FHB, although the effects
were minor relative to Rht-D1b (Steiner et al., 2004; Medianer and Voss,
2008; Srinivasachary et al., 2009). In addition, the yield advantage normally
associated with Rht-B1b or Rht-D1b diminishes or disappears in low wheat
production environments (Gale and Youssefian, 1985; Flintham et al., 1997;
Chapman et al., 2007), and both alleles have a reduced coleoptile length and
seedling vigour, which in dry soils can result in poor stand establishment
(Rebetzke et al., 2001). In light of the agronomic issues associated with Rht-
B1b and Rht-D1b, the primary objectives of this project were to gain a better
understanding of the pre-existing genetic variation that exists at the Rht-B1,

234
Rht-D1, and Rht-A1 loci, and to determine the genetic makeup of the
contiguous region immediately surrounding these loci.
Screening of the CS BAC library (Chapter 2) was a necessary first step in
order to obtain the homoeologous Rht-1 sequences in a common genetic
background. The screening process contained challenges in itself as the
attempt to screen the French component of the library using probes designed
to be Rht-1 specific resulted in the identification of only two Rht-1 containing
clones although the probes had hybridised to several BAC clones. Screening
of the UK component of the library using PCR with Rht-1-specific primers was
much more effective. The screening was facilitated by the 3-D pooling of the
BAC library (Febrer et al, 2009), which greatly reduced the number of PCR
reactions required to identify Rht-1 containing clones. The PCR screen
identified 13 Rht-1 containing BAC clones, of which three (one each from the
A, B, and D genomes) were selected for full-length sequencing and assembly.
From this PhD project, which was the first to use the pooled BAC library, it is
clear that it represents a valuable resource to the wheat breeding community
in the absence of a fully assembled genomic sequence. In addition,
sequence of all three Rht-1 homoeologues allows for primers to be designed
for locus-specific amplification and for examining Rht-1 homoeologue gene
expression.
Analysis of the Rht-1 containing BAC sequences (Chapter 3) revealed that
most of the contiguous region was composed of transposable elements, but
also revealed the existence of Rht-1 on each BAC along with a DUF6
(Domain of Unknown Function 6) family gene immediately upstream. The A
and D genome BACs also contained a ZnF (zinc finger) family gene, which
was not present on the B genome BAC, but may still be present upstream of
the BAC sequence. The proportion of genic sequence comprised less than
3% of any CS BAC clone, similar to the findings of other studies of the wheat
genome (Li et al., 2004; Devos et al, 2005; Paux et al., 2006), indicating this
region is not particularly gene-rich or gene-poor. The conserved gene
synteny among the three wheat homoeologues, rice, Brachypodium,
sorghum, and maize is a positive indicator that synteny may extend further 5‟

235
and 3‟. Until a large number of ordered markers on the group IV
chromosomes of wheat become available it will be difficult to understand how
far this synteny extends. Currently available sequences of rice,
Brachypodium, and the ongoing physical mapping and sequencing of the
barley gene space by the International Barley Genome Sequencing
Consortium (IBSC;http://barleygenome.org) will be useful for determining the
extent of synteny and identifying genes linked to Rht-B1b or Rht-D1b that may
be important in FHB resistance or other wheat agronomic characteristics. The
region immediately 5‟ of the sequenced region proves to be interesting as tb1
is the next gene upstream of the ZnF gene. Tb1 is an important
domestication gene in maize that controls branch number (Doebley et al.,
2004) and the barley orthologue Intermedium-C (Int-C) is associated with
lateral spikelet fertility and plant tillering (Ramsay et al., 2011). In contrast to
the high level of gene synteny, transposable elements were not conserved
amongst even the wheat homoeologues, similar to previous studies of
homoeologues wheat regions (Gu et al., 2004; Chalupska et al., 2008;
Ragupathy and Cloutier, 2008). This demonstrates how rapidly transposon
sequences evolve relative to genes as the A, B, and D genome progenitors of
wheat diverged only 2-4 MYA (Huang et al., 2002; Dvorak and Akhunov,
2005; Chalupska et al., 2008), whereas the Poaceae species analysed here
diverged up to 60 MYA.
Analysis of the three genes discovered on the wheat BACs revealed a pattern
of conservation among the Poaceae that mirrored previously established
phylogenetic relationships (Paterson et al., 2009). In all cases, the barley
ORF sequences were the most similar to wheat suggesting the potential
usefulness of a fully-assembled barley sequence. After barley, Brachypodium
sequences of the three genes were the most similar to wheat, suggesting a
greater value of Brachypodium sequence for wheat genomics relative to rice,
maize, and sorghum. Genetic comparisons amongst the Poaceae of the
ORFs of the three genes revealed the ZnF gene was the most highly
conserved and DUF6 the least conserved. The high level of conservation
among the Poaceae ZnF orthologues suggests that alterations to the amino
acid sequence of the ZnF may be deleterious to the plant, thereby suggesting

236
an essential role of this gene. The ZnF gene is a specialised type of zinc
finger known as a RING (Really Interesting New Gene) type protein. RING-
type proteins are involved in protein:protein interactions including assembly of
large protein complexes and the ubiqitination of proteins (Joazeiro and
Weissman, 2000; Mathews and Sunde, 2002). The Rht-1 gene was largely
conserved amongst the three CS wheat homoeologues and there were no
evident predicted stop codons or frameshift mutations. However, there was
still variation amongst the homoeologues in the ORF and surrounding
sequence that could potentially affect RNA expression or protein function. In
the ORF, the predicted peptide lengths vary from 620 to 623 and non-
conserved amino acids resulting from SNPs or indels occur at 1.9% to 2.6%
of the sites when comparing any two homoeologues. Rht-A1 and Rht-D1
were the most similar homeologues. As expected, larger differences between
Rht-1 homoeologues are present just upstream and downstream of the coding
region. The 3‟ region and 5‟ regions are still both highly conserved among the
wheat homoeologues, suggesting that both regions could play important
regulatory roles. Comparative analyses of the 5‟ and 3‟ wheat homoeologue
sequences with the same regions in rice and Brachypodium revealed three
areas of high conservation amongst the sequences. The most conserved
sequence (~ 120 bp in length) occurred between 300 and 500 bp 5‟ of the
ORF of Rht-1 or its orthologue and two regions were identified 3‟ of the ORF,
a ~100 bp sequence between 200 and 450 bp downstream and a ~300 bp
sequence between1.6 and 2 kb downstream. Currently, little is known
regarding the regulatory regions that affect Rht-1 expression and the high
level of conservation in these regions suggest these regions may be involved
in cis-regulation of Rht-1. Sequence analysis of diverse wheat accessions
revealed the presence of two 5‟ insertions (relative to CS) of 160 and 197 bp.
The 160 bp insertion occurs 356 bp 5‟ of the ORF and in the middle of the
most highly conserved region among wheat, rice and Brachypodium whilst the
197 bp insertion occurs 591 bp upstream. Homology to the 197 bp sequence
was not present in region immediately upstream (1 to 10 000 bp) of the Rht
orthologues in rice and Brachypodium. These insertions were investigated
further and may affect plant height, GA sensitivity, and flowering time in
237
wheat, although no effect on RNA transcript abundance was detected in the
stems and leaves of seedlings (discussed below).
In this project, the Rht-A1 locus has been clearly identified based on a
chromosome 4A location (Chapter 4), high nucleotide similarity to Rht-B1 and
Rht-D1, and a high degree of gene synteny in the Rht-A1 region relative to the
Rht-B1 and Rht-D1 homoeologous regions (Chapter 3). However, unlike Rht-
B1 and Rht-D1, which are on 4BS and 4DS, respectively, Rht-A1 is located on
4AL. The location of Rht-A1 on the long arm of 4A is not unexpected because
the majority of the native short arm of 4A is located on the long arm of
chromsome 4A in modern bread wheat cultivars due to a pericentric inversion
thought to have occurred in tetraploid wheat (Miftahudin et al., 2004). Rht-A1
appears to be near the centromere based on physical and genetic mapping;
however this requires further investigation due to conflicting results between
4AL Kansas deletion lines, which precluded determining a more precise
location on 4AL. Nonetheless, the molecular tools associated with Rht-A1
developed as part of this project (an Rht-A1 marker, Rht-A1 sequences, and
identification of linked SSR markers linked to Rht-A1) provides a resource to
further investigation of this locus and the surrounding region and should be a
useful resource for marker-based selection.
Interestingly, while Rht-B1 appears to be located near the centromere based
on previous physical telocentric F2 mapping (McVittie et al., 1978) and genetic
mapping (Borner et al., 1997; Ellis et al. 2002; Somers et al., 2004), Rht-D1
was mapped between breakpoint 0.82 and the telomere with the Kansas
deletion lines in this project. The telomeric location agrees with telocentric F2
mapping performed by Izumi et al. (1983), but differs from the more proximal
location (15 cM from the centromere) reported by McVittie et al. (1978).
Mapping Rht-B1 with the Kansas deletion lines is possible, but complicated by
the presence of a male sterility gene near the centromere, which precludes
the production of homozygous 4BS deletion lines. Although a translocation
near the centromere of 4B has been reported (Mickelson-Young et al., 1995),
there are no reports of a translocation involving the telomeric region of 4BS or
4DS. The telomeric location of Rht-D1 would suggest potentially greater

238
recombination at and near this locus relative to the more proximal Rht-A1 or
Rht-B1, as recombination is generally greater towards the telomere (Devos et
al., 1995; Akhunov et al., 2003).
In this project, sequence diversity was present among bread wheat and
tetraploid/diploid wheats at the Rht-A1, Rht-B1, and Rht-D1 ORFs and in the
flanking 5‟ (~1750 bp) and 3‟ (~450 bp) regions (Chapter 5). A large amount
of genetic diversity at the Rht-1 loci was shown to be lost between
tetraploid/diploid wheat and bread wheat, similar to other reports of reduced
genetic diversity in bread wheat relative to ancestral lines (Caldwell et al.,
2004; Haudry et al., 2007). Focusing on bread wheat only, among the three
homoeologous Rht-1 regions, diversity was the greatest on the B genome and
least on the D genome. Lack of diversity in the D genome relative to the A
and B genomes has been reported in several previous studies of bread wheat
(Bryan et al., 1997; Huang et al., 2002; Wang et al., 2007; White et al., 2008;
Chao et al., 2009). This likely is the result of the origin of bread wheat from
just a small number of hexaploidisation events with the D genome donor Ae.
tauschii (Talbert et al., 1998; Caldwell et al., 2004) along with little inter-
mating between bread wheat and Ae. tauschii (Dvorak et al., 1998), whereas
a substantial amount of inter-mating appears to have occurred between T.
aestivum and tetraploid wheat (Dvorak et al., 2006; Dubocovsky and Dvorak
2007; Luo et al., 2007). The Rht-B1 locus and flanking region of the
accessions sequenced in this project had the greatest nucleotide and
haplotype diversity. The polymorphisms included the three largest indels
(197, 160, and 16 bp) and the largest number of predicted amino acid
changes found among the Rht-1 homoeoloci, including a previously unknown
frameshift mutation. Several other studies have reported greater genetic
diversity on the B genome relative to the A and D genomes (Huang et al.,
2002; Ravel et al., 2006; Wang et al., 2007; Haseneyer et al., 2008; Li et al.,
2010). The closest known wild relative to the B genome is Ae. speltoides
(Kilian et al., 2007) and its out-crossing nature may attribute to the higher
level of genetic diversity often reported for the B genome. The Rht-A1 locus,
while containing more nucleotide diversity and more haplotypes than Rht-D1
had the lowest haplotype diversity among the three genomes. This results

239
from the high proportion (~75%) of accessions that belong to a single
haplotype, which includes all 12 “UK” accessions. The low haplotype diversity
suggests there may have been selection at Rht-A1 or a linked locus. If Rht-
A1 is centromeric, this may also reduce recombination at this locus.
There was no sequence variation amongst the Rht-B1b alleles or amongst the
Rht-D1b alleles. This is not surprising considering the recent introgression of
these alleles into bread wheat with the Japanese line Norin 10 serving as the
primary source for both alleles (Dalrymple, 1986). Strong selection for Rht-
B1b and Rht-D1b almost certainly has resulted in reduced haplotype diversity
at these loci and at linked loci. The size of the linkage block, also known as a
“selective sweep” is likely to be large for the reasons given above and likely
affects a large number of genes. This is one reason why it is important to
understand haplotype diversity at these loci. The haplotypes discovered in
this project represent potentially useful sources of genetic variation for further
research of important regulatory regions associated with Rht or for identifying
beneficial variants of linked genes, such as genes potentially affecting FHB
resistance, which could greatly benefit wheat breeding efforts.
Among the novel Rht-1 alleles discovered in this project, the Rht-B1 160 bp
and 197 bp indels were analysed further due to their large sizes and location
in a potentially important regulatory region (discussed above). Sequencing of
wheat tetraploid lines revealed the absence of the 160 bp insertion, indicating
this is likely an insertion relative to the ancestral condition. This insertion
dates back to at least 1830 as it was present in an accession released in that
year (Line 03070 from the INRA BWCC; Balfourier et al., 2007). In contrast,
the 197 bp sequence was present in the tetraploid lines and regions of high
homology exist on the A and D genomes, indicating that the absence of the
197 bp sequence is representative of a deletion relative to the ancestral
condition. Bioinformatic analysis revealed that neither insertion sequence has
high homology to sequences in the NCBI (nr/nt) database or the TREP cereal
repeat database. The insertions were then studied using qRT-PCR to
estimate transcript abundance in stem and leaf tissue collected from two-
week old wheat seedlings of accessions that contained no insertion, the 160

240
bp insertion, or the 197 bp insertion (Chapter 5). Significant (p < 0.05)
changes in Rht-B1 transcript levels were not consistently related to either of
the insertions indicating that the insertions do not have a major effect on Rht-
B1 transcript level in leaf and stem tissues at this developmental stage. It is
possible that changes in RNA transcript occur at a later developmental stage
or in tissue types that were not measured in this study. To determine if the
Rht-B1 insertions affected plant height, GA sensitivity, or heading date in
wheat, association analyses were performed that utilised genotypic and
phenotypic data collected on the INRA BWCC as part of this project (Chapter
6). This revealed that accessions containing the 160 bp or 197 bp allele (Rht-
B1a_160 and Rht-B1a_197, respectively) had mean reductions in plant height
and GA sensitivity, and a delay in mean ear emergence relative to Rht-B1a
accessions with no insertion (Rht-B1a_0). However, the height reductions
were minor relative to the effects of Rht-B1b and only the height difference
between Rht-B1a_197 bp and Rht-B1a_0 and heading date between Rht-
B1a_160 and Rht-B1a_0 were significant at a probability threshold of 0.05.
The use of bi-parental populations (one with an insertion and one without) or
examination of the insertions in a common background would be powerful
tools to determine the effects of these alleles. Integration of these alleles into
a common genetic background has now been initiated at NIAB.
In an attempt to discover novel GAI alleles at the Rht-1 loci (particularly at
Rht-A1 where alleles affecting plant height or GA sensitivity are yet to be
found), the INRA BWCC was screened by measuring response of seedlings
to GA application. However, the experimental method and statistical analyses
(mixed model or LSD analyses) employed did not clearly reveal the presence
of any GAI alleles in the collection outside of Rht-B1b, Rht-D1b, or Rht-B1c,
indicating that novel GAI alleles either do not exist in the collection or
experimental conditions were insufficient to detect them. While the methods
using in this study rarely incorrectly classified accessions containing Rht-B1b
or Rht-D1b (both were genotyped in the collection as part of the PhD project)
as GA sensitive, these alleles were only classified as GAI 64% of the time.
The difficulty in classifying GAI alleles as GAI may be due to the effect of
genetic background differences between the diverse accessions,

241
experimental design (for instance, too few plants screened per accession),
and the slight GA response detected in accessions containing Rht-B1b or Rht-
D1b, all of which would make detection of differences in seedling length
between GA sensitive and insensitive lines more difficult. Rht-1 alleles that
have a GA response that is intermediate the Rht-1b and Rht-1a alleles would
be even more difficult to detect. Intermediate GAI alleles (potentially including
Rht-B1a_160 and Rht-B1a_197) may exist in the collection as indicated by
the large number Rht-B1a+Rht-D1a accessions (42) that fall within the range
of GA treatment differences found among accessions with the Rht-B1b or Rht-
D1b allele (20.8 mm or less; Appendix VI). The absence of a GAI allele at the
Rht-A1 locus, which is known to be expressed (Saville, 2011), relative to the
Rht-B1 and Rht-D1 loci where several GAI alleles are known to exist, suggest
that insensitivity at this locus may be detrimental to wheat. Even though no
additional GAI alleles were discovered, knowledge was gained regarding the
use of experimental and statistical methods and it appears that the mixed
model method was more efficient at correctly classifying previously known
Rht-B1b and Rht-D1b alleles than the LSD method, although this method
would appear to be more likely to incorrectly classify GAI accessions that may
have long seedling lengths due to other genes.
The origin of the Rht-B1b and Rht-D1b alleles in „Norin 10‟ (the major donor of
these alleles) and „Suweon 85‟ (a minor donor) was investigated by
genotyping accessions that make up the historical pedigree (Chapter 7) of
these two lines (Figure 7.1). Historically, Rht-B1b and Rht-D1b are thought to
be derived from „Daruma‟, a landrace present in Japan as early as 1894
(Kihara, 1983). However, the genotyping of several accessions from the
historical pedigree revealed that none of the progenitors of „Norin 10‟ or
„Suweon 85‟ were homozygous for both alleles, including „Daruma‟, which was
homozygous for only Rht-B1b. However, the homozygous Rht-D1b genotype
in the „Daruma‟ variants „Shiro-Daruma‟ and „Aka-Daruma‟ and the presence
of Rht-B1a/Rht-B1b heterozygotes in a small percentage of plants from these
accessions suggests that the curated seed used in this study may not be
representative of the original landraces, which may have been segregating at
these loci. Hence, there is no clear evidence that contradicts the historical
242
pedigree, suggesting that „Daruma‟ is still the most likely donor of Rht-B1b
and Rht-D1b for „Norin 10‟ and „Suweon 85‟. Genotyping in this instance
identified potential off-types in the accessions contained in seed banks, but
has also strengthened confidence of the genotype of other accessions. For
instance, the matching Rht-1 sequences of SS7010073 and the putative T.
dicoccum and Ae. tauschii donors supports the claim that these are the
donors. In addition, genotyping for Rht-B1b and Rht-D1b was critical in the
GAI and plant height screening. Hence, this project also emphasises the
value of genotyping for quality assurance.
The Rht-1 loci are agronomically important loci and in this project, I have
increased knowledge of these loci and developed tools that can be further
used for targeted breeding of improved wheat varieties. My PhD project is the
first to determine all three Rht-1 homoeologous sequences (including Rht-A1,
previously unpublished) and the genetic makeup of the nearby surrounding
region in a common genetic background in wheat. With the sequences, I
developed locus-specific primers and for each homoeologue sequenced the
entire Rht-1 ORF and over two kb of flanking region in approximately 40
diverse wheat accessions to estimate genetic diversity. Included among the
novel polymorphisms discovered were 160 bp and 197 bp insertions within
600 nucleotides of Rht-B1 that I further characterised using Rht-1
homoeologue specific expression analysis and by performing association
analysis in a worldwide collection of bread wheat accessions. The Rht-B1
haplotypes and other haplotypes discovered in this project require further
characterisation, but represent potentially useful sources of Rht-1 variation for
wheat breeding efforts. Specifically, the discovery of novel haplotypes and
the development of genetic tools associated with the Rht-1 loci in this project
represent a necessary starting point in characterising the Rht-B1b and Rht-
D1b selective sweeps, which may be useful for identify linked genes with
improved resistance to the disease Fusarium Head Blight. Overall,
approaches similar to the one taken here could be applied for creation of tools
for knowledge-based breeding at other wheat loci to improve wheat
performance, which is especially critical in the face of climate change and
current food insecurity.

243
REFERENCES Achard P, Cheng H, De Grauwe L, Decat J, Schoutteten H, Moritz T, Van Der Straeten D, Peng JR, Harberd, NP (2006) Integration of plant responses to environmentally activated phytohormonal signals. Science 311: 91-94 Achard P, Genschik P (2009) Releasing the brakes of plant growth: how GAs shutdown DELLA proteins. J Exp Bot 60: 1085-1092 Achard P, Gong F, Cheminant S, Alioua M, Hedden P, Genschik P (2008a) The cold-inducible CBF1 factor-dependent signalling pathway modulates the accumulation of the growth-repressing DELLA proteins via its effect on gibberellin metabolism. Plant Cell 20: 2117-2129 Achard P, Renou JP, Berthome R, Harberd NP, Genschik P (2008b) Plant DELLAs restrain growth and promote survival of adversity by reducing the levels of reactive oxygen species. Curr Biol 18: 656-660 Akhunov ED, Akhunova AR, Dvorak J (2005) BAC libraries of Triticum urartu, Aegilops speltoides and Ae. tauschii, the diploid ancestors of polyploid wheat. Theor Appl Gen 111: 1617-1622 Akhunov ED, Goodyear AW, Geng S, Qi L-L, Echalier B, Gill BS, Dvorak J, Miftahudin, Gustafson JP, Lazo G, Chao S, Anderson OD, Linkiewicz AM, Dubcovsky J, La Rota M, Sorrells, ME, Zhang D, Nguyen HT, Kalavacharla P, Hossain K, Kianian SF, Peng J, Lapitan N, Gonzalez-Hernandez JL, Anderson JA, Choi D, Close TJ, Dilbirligi M, Gill KS, Walker-Simmons MK, Steber C, McGuire PE, Qualset CO, Dvorak J (2003) The organization and rate of evolution of wheat genomes are correlated with recombination rates along chromosome arms. Genome Res 13:753-763 Allan RE (1989) Agronomic comparisons between Rht1 and Rht2 semidwarf genes in winter wheat Crop Sci 29:1103-1108 Allan RE, Vogel OA, Craddock JC (1959) Comparative response to gibberellic acid of dwarf, semi-dwarf, and standard short and tall winter wheat varieties. Agron J 51:737-740. Allan RE, Vogel OA, Peterson CJ (1968) Inheritance and differentiation of semidwarf culm length of wheat. Crop Sci 8: 701-704 Allouis S, Moore G, Bellec A, Sharp R, Faivre Rampant P, Mortimer K, Pateyron S, Foote TN, Griffiths S, Caboche M, Chalhoub, B (2003) Construction and characterisation of a hexaploid wheat (Triticum aestivum L.) BAC library from the reference germplasm 'Chinese Spring'. Cer Res Comm 31: 331-338. Alvey L, Boulton MI (2008) DELLA proteins in signalling. Encyclopedia of Life Sciences. John Wiley & Sons, Ltd: Chichester Alvey L, Harberd NP (2005) DELLA proteins: integrators of multiple plant growth regulatory inputs? Physiologia Plantarum 123:153-160

244
Balfourier F, Roussel V, Strelchenko P, Exbrayat-Vinson F, Sourdille P, Boutet G, Koenig J, Ravel C, Mitrofanova O, Beckert M, Charmet G (2007) A worldwide bread wheat core collection arrayed in a 384-well plate. Theor App Gen 114:1265–1275. Bassel GW, Zielinska E, Mullen RT, Bewley JD (2004) Down-regulation of DELLA genes is not essential for germination of tomato, soybean, and Arabidopsis seeds. Plant Physiol 136: 2782-2789 Beales J, Turner A, Griffiths S, Snape JW, Laurie DA (2007) A pseudo-response regulator is misexpressed in the photoperiod insensitive Ppd-D1a mutant of wheat (Triticum aestivum L.). Theor Appl Genet 115:721–733. Boddu J, Cho S, Kruger WM, Muehlbauer GJ (2006) Transcriptome analysis of the barley-Fusarium graminearum interaction. Molecular Plant-Microbe Interactions 19: 407-417. Bordes J, Branlard G, Oury FX, Charmet G, Balfourier F (2008) Agronomic characteristics, grain quality and flour rheology of 372 bread wheats in a worldwide core collection. J Cereal Sci 48: 569–579. Börner A, Lehmann CO, Mettin D, Plaschke J, Schlegel R, Schlegel G, Melz G, Thiele V (1991) GA-insensitivity of 'Ai-bian 1a' / Pleiotropic effects of isogenic Rht-lines. Annual Wheat Newsletter 37: 59-60 Börner A, Mettin D (1988) The genetic control of gibberellic acid insensitivity of the wheat variety Ai-Bian 1. In: Miller, TE and Koebner, RMD (Eds) Proc 7th Int Wheat Genet Symp, Cambridge, England, Bath Press, Bath, Avon, pp. 489-492. Börner A, Plaschke J, Korzun V, Ben Amer IM, Stracke S (1995) Genetics of GA insensitivity of two Ethiopian wheats. Wheat genetics research report. Ann. Wheat Newsletter 41: 91 Börner A, Roder M, Korzun V (1997) Comparative molecular mapping of GA insensitive Rht loci on chromosomes 4B and 4D of common wheat (Triticum aestivum L.). Theor Appl Genet 95: 1133-1137 Borojevic K, Borojevic K (2005) The transfer and history of “Reduced height genes” (Rht) in wheat from Japan to Europe. J Heredity 96: 455-459 Boss PK, Thomas MR (2002) Association of dwarfism and floral induction with a grape „green revolution‟ mutation. Nature 416: 847-850. Bossolini E, Wicker T, Knobel PA, Keller B (2007) Comparison of orthologous loci from small grass genomes Brachypodium and rice: implications for wheat genomes and grass genome annotation. Plant J 49: 704-717. Brooking IR, Kirby EJM (1981) Interrelationship between stem and ear development in winter wheat: The effects of a Norin 10 dwarfing gene, Gai/Rht2. J Agric Sci 97: 373-381 Brown NA, Urban M, Van De Meene AML, Hammond-Kosack KE (2010) The infection biology of Fusarium graminearum: Defining the pathways of spikelet to spikelet colonisation in wheat ears. Fungal Biology 114: 555-571.
245
Bryan GJ, Collins AJ, Stephenson P, Orry A, Smith JB, Gale MD (1997) Isolation and characterisation of microsatellites from hexaploid bread wheat. Theor Appl Gen 94: 557-563 Buerstmayr H, Steiner B, Lemmens M, Ruckenbauer P (2000) Resistance to Fusarium head blight in winter wheat: heritability and trait associations. Crop Sci 40: 1012-1018. Bush MG, Evans LT (1988) Growth and development in tall and dwarf isogenic lines of spring wheat. Field Crops Res 18: 243-270 Caldwell KS, Dvorak J, Lagudah ES, Akhunov E, Luo M-C, Wolters P, Powell W (2004) Sequence polymorphism in polyploidy wheat and their D-genome diploid ancestor. Genetics 167: 941-947 Cao W, Somers DJ, Fedak G (2009) A molecular marker closely linked to the region of Rht-D1c and Ms2 genes in common wheat (Triticum aestivum) Genome 52 :95-99. Carver TJ, Rutherford KM, Berriman M, Rajandream MA, Barrell BG and Parkhill J (2005) ACT: the Artemis Comparison Tool. Bioinformatics 21: 3422-3423 Cenci A, Chantret N, Kong X, Gu Y, Anderson OD, Fahima T, Distelfeld A, Dubcovsky J (2003) Construction and characterization of a half million clone BAC library of durum wheat (Triticum turgidum ssp durum). Theor Appl Gen 107: 931-939 Chalhoub B, Lefevre A, Rouault P, Pateyron S, Bellec A, Laffont P, Belcram H, Caboche M (2002) Construction of an hexaploid wheat BAC library for studying gene organization and cloning of interesting genes and QTLs. Presented at Plant, Animal & Microbe Genomes X Conference, San Diego, CA, USA, 12-16 Jan. , poster 350.
Chalupska D, Lee HY, Faris JD, Evrard A, Chalhoub B, Haselkorn R, Gornicki, P (2008) Acc homoeoloci and the evolution of wheat genomes. Proc Natl Acad Sci USA 105(28): 9691–9696 Chandler PM, Marion-Poll A, Ellis M, Gubler F (2002) Mutants at the Slender1 locus of barley cv Himalaya. Molecular and Physiological Characterization. Plant Physiol 129: 181-190 Chao S, Zhang W, Akhunov E, Sherman J, Ma Y, Luo M-C, Dubcovsky J (2009) Analysis of gene-derived SNP marker polymorphism in US wheat (Triticum aestivum L.) cultivars. Mol Breeding 23: 23-33. Chapman, SC, Mathews, KL, Trethowan, RM, and Singh, RP (2007) Relationsips between height and yield in near-isogenic spring wheats that contrast for major reduced height genes. Euphytica 157:391-397 Charmet G (2011) Wheat domestication: Lessons for the future. Comptes Rendus Biologies 334: 212-220. Chebotar SV, Korzun VN, Sivolap YM (2001) Allele distribution at locus WMS261 marking the dwarfing gene Rht8 in common wheat cultivars of southern Ukraine. Russian Journal of Genetics 37: 894-898 Cho CH, Hong BH, Park MW, Shim JW, and Kim BK (1980) Origin, dissemination, and utilization of wheat semi-dwarf genes in Korea. Annual Wheat Newsletter 27:67.

246
Cholick FA, Welsh JR, Cole CV (1977) Rooting patterns of semidwarf and tall winter wheat cultivars under dryland field conditions. Crop Sci 17: 637-640. Chrpova JS, Skorpik M, Prasilova P, Sip V (2003) Detection of Norin 10 dwarfing genes in winter wheat varieties registered in the Czech Republic. Czech J Genet Plant Breed 39:89–92. Church GM, Gilbert W (1984) Genomic sequencing. Proc Natl Acad Sci USA 81:1991–1995 Clark JA, Martin JH, Ball CR (1922) Classification of American wheat varieties. U.S. Dept. Agric. Bull. No 1074. Clark RM, Linton E, Messing J, Doebley JF (2004) Pattern of diversity in the genomic region near the maize domestication gene tb1. Proc Natl Acad Sci US 101-700-707 Close TJ, Wise R, Wing R, Kleinhofs A, Chin A, Fenton RD, Begum D, Frisch D, Atkins M, Yu Y, Henry D, Palmer M, Rambo T, Simmons J, Oates R, Main D, Wanamaker, S (2008) Hordeum vulgare green seedling (Blumeria infected) cDNA library HVSMEm (HVcDNA0014) 2. Unpublished Coram TE, Wang MN, Chen XM (2008) Transcriptome analysis of the wheat - Puccinia striiformis f. sp tritici interaction. Molec Plant Pathol 9: 157-169. Cuthbert JL, Somers DJ, Brule-Babel AL, Brown PD, Crow GH (2008) Molecular mapping of quantitative trait loci for yield and yield components in spring wheat (Triticum aestivum L.). Theor Appl Genet 117: 595-608. Dalrymple DG (1976) Development and spread of high-yielding varieties and wheat and rice in the less developed nations. Foreign Agric Econ Rep No. 95 (5th edition) Dalrymple DG (1980) Development and spread of semi-dwarf varieties of wheat and rice in the United States. Agric Econ Rep No 455 Dalrymple DG (1986) Development and spread of high-yielding wheat varieties in developing countries. Agency for International Development, Washington, D.C., U.S.A. Dan L, FangPing Y, ZhongHu H, DaNian Y, XianChun X (2009) Characterization of Lr34/Yr18, Rht-B1b, Rht-D1b genes in CIMMYT wheat cultivars and advanced lines using STS markers. Sci Agric Sin 42:17-27. De Lucas M, Daviere JM, Rodrigues-Falcon M, Iglesias-Pedraz JM, Lorrain S, Fankhauser C, Blazquez MA, Titarenko E, Prat S (2008) A molecular framework for light and gibberellin control of cell elongation. Nature 451: 480-484 Devos KM, Costa de Oliveira A, Xu X, Estill JC, Estep M, Jogi A, Morales M, Pinheiro J, San Miguel P, Bennetzen JL (2008) Structure and organization of the wheat genome – the number of genes in the hexaploid wheat genome. In: Appels R, Esatwood R, Lagudah E, Langridge P, Mackay M, McIntyre L, Sharp P (eds) Proc 11th Int Wheat Genet Symp. Sydney, Sydney University Press, eO24, pp1-5

247
Devos, KM, Dubcovsky J, Dvorak J, Chinoy CN, Gale MD (1995) Structural evolution of wheat chromosomes 4A, 5A, and 7B and its impact on recombination. Theor Appl Genet 91: 282-288. Devos KM, Ma J, Pontaroli AC, Pratt LH, Bennetzen JL (2005) Analysis and mapping of randomly chosen bacterial artificial chromosome clones from hexaploid bread wheat. Proc Natl Acad Sci USA 102: 19243-19248. Dill A, Sun TP (2001) Synergistic de-repression of gibberellin signaling by removing RGA and GAI function in Arabidopsis thaliana. Genetics 159: 777-785 Doebley JF (2004) The genetics of maize evolution. Ann Rev Gen 38: 37-59 Doebley JF, Gaut BS, Smith DS (2006) The molecular genetics of crop domestication. Cell 127:1309-1321 Dotlacil L, Hermuth J, Stehno Z (2003) Earliness, spike productivity and protein content in European winter wheat landraces and obsolete cultivars. Plant Soil and Env 49: 67–74. Draeger R, Gosman N, Steed A, Chandler E, Thomsett M, Srinivasachary, Schondelmaier J, Buerstmayr H, Lemmens M, Schmolke M, Mesterhazy A, Nicholson P (2007) Identification of QTLs for resistance to Fusarium head blight, DON accumulation and associated traits in the winter wheat variety Arina. Theor Appl Genet 115:617-625 Dubocovsky J, Dvorak J (2007) Genome plasticity a key factor in the success of polyploidy wheat under domestication. Science 316: 1862-1866 Dvorak J, Akhunov ED (2005) Tempos of gene locus deletions and duplications and their relationship to recombination rate during diploid and polyploidy evolution in the Aegilops-Triticum alliance. Genetics 171: 323-332 Dvorak J, Akhunov ED, Akhunov AR, Deal KR, Luo M-C (2006) Molecular characterization of a diagnostic DNA marker for domesticated tetraploid wheat provides evidence for gene flow from wild tetraploid wheat to hexaploid wheat. Molec Biol Evol 23: 1386-1396 Dvorak J, Lou M-C, Yang Z-L, Zhang H-B (1998) The structure of Aegilops tauschii genepool and the evolution of hexaploid wheat. Theor Appl Genet 97: 657-670 Ellis MH, Rebetzke GJ, Azanza F, Richards RA, Spielmeyer W (2005) Molecular mapping of gibberellin-responsive dwarfing genes in bread wheat. Theor Appl Gen 111: 423-430 Ellis MH, Rebetzke GJ, Chandler P, Bonnett D, Spielmeyer W, Richards RA (2004) The effect of different height reducing genes on the early growth of wheat. Funct Plant Biol 31: 583-589 Ellis MH, Spielmeyer W, Gale KR, Rebetzke GJ, and Richards RA (2002) “Perfect” markers for the Rht-B1b and Rht-D1b dwarfing genes in wheat. Theor Appl Gen 105:1038-1042 Endo TR, Gill BS (1996) The deletion stocks of common wheat. J of Hered 87: 295-307

248
Evans LT (1998) Feeding the Ten Billion. Plant and population growth, Cambridge University Press Farrar K, Donnison IS (2007) Construction and screening of BAC libraries made from Brachypodium genomic DNA. Nature protocols 2: 1661-1674
Febrer M, Wilhelm E, Al-Kaff N, Wright J, Powell W, Bevan, MW, Boulton, MI (2009) Rapid identification of the three homoeologues of the wheat dwarfing gene Rht using a novel PCR-based screen of three-dimensional BAC pools. Genome 52: 993-1000 Felsenstein J (2004) PHYLIP (Phylogeny Inference Package) version 3.6. Distributed by the author. Dept. of Genome Sciences, University of Washington, Seattle, USA Feng S, Martinez C, Gusmaroli G, Wang Y, Zhou J, Wang F, Chen L, Yu L, Iglesias-Pedraz, JM, Kircher S, Schafer E, Fu X, Fan L-M, Deng XW (2008) Coordinated regulation of Arabidopsis thaliana development by light and gibberellins. Nature 451: 475-479 Flint-Garcia SA, Thornsberry JM, Buckler ES (2003) Structure of linkage disequilibrium in plants. Annu Rev Plant Biol 54:357-374 Flintham JE, Borner A, Worland AJ, Gale MD (1997) Optimizing wheat grain yield: effects of Rht (gibberellins-insensitive) dwarfing genes. J Agric Sci, Camb. 128:11-25 Flintham JE, Gale MD (1983) The „Tom Thumb‟ dwarfing gene, Rht3, in wheat. 2. Effects on height, yield, and grain quality. Theor Appl Genet 62: 121-126 Flintham JE, Gale MD (1998) Plant height and yield components of inbred isogenic and F1 hybrid Rht dwarf wheats. J Appl Genet 39:73-83 Fu HH, Zheng ZW, Dooner HK (2002) Recombination rates between adjacent genic and retrotransposon regions in maize vary by 2 orders of magnitude. Proc Natl Acad Sci USA 99:1082-1087 Fu X, Richards DE, Fleck B, Xie D, Burton N, Harberd NP (2004) The Arabidopsis mutant sleepy1gar2-1 protein promotes plant growth by increasing the affinity of the SCFSLY1 E3 ubiquitin ligase for DELLA protein substrates. The Plant Cell 16: 1406-1418 Fulton TM, Chunwongse J, Tanksley SD (1995) Microprep protocol for extraction of DNA from tomato and other herbaceous plants. Plant Mol Biol Rep 13: 207-209 Gale MD (1979) The effects of the Norin 10 dwarfing genes on yield in wheat. In Proceedings Fifth International Wheat Genetics Symposium, New Delhi, India, Feb. 1978, pp. 978-987. Editor S. Ramanajam. Indian Society of Genetics and Plant Breeding. IARI, New Delhi, India. Gale MD, Atkinson MD, Chinoy CN, Harcourt RL, Jia J, Li QY, Devos KM (1995) Genetic maps of hexaploid wheat. Proc 8th Int Wheat Genet Symp China Agricultural Scientech Press (eds. Li ZS, Xin XY), pp. 1333-1500 Gale MD, Devos KM (1998) Comparative genetics in the grasses. Proc Nat Acad Sci USA 95:1971-1974

249
Gale MD, Gregory RS (1977) A rapid method for early generation selection of dwarf genotypes in wheat. Euphytica 26:733-738 Gale MD, King RW (1988) Semi-dwarf genes in Australian wheats. Agric Sci 1: 18-20 Gale MD, Law CN, Marshall GA, Snape JW, Worland AJ (1982) Analysis and evaluation of semi-dwarfing genes in wheat including a major height reducing gene in the variety „Sava‟. Semi-Dwarfing Cereal Mutants and Their Use in Cross-Breeding, IAEA-TECDOC 268. Proceedings of a Research Coordination Meeting, Joint FAO/IAEA Division, pp. 7-23. Gale MD, Law CN, Worland AJ (1975) The chromosomal location of a major dwarfing gene from Norin 10 in new British semi-dwarf wheats. Heredity 35:417-421. Gale MD, Marshall GA (1976) The chromosomal location of GAI1 and RHT1, genes for gibberellins insensitivity and semi-dwarfism, in a derivative of Norin 10 wheat. Heredity 37: 283-289 Gale MD, Marshall GA, Rao MV (1981) A classification of the Norin 10 and Tom Thumb dwarfing genes in British, Mexican, Indian and other hexaploid bread wheat varieties. Euphytica 30:355-361 Gale MD, Youssefian S (1985) Dwarfing genes in wheat. Progress in Plant Breeding, Vol. 1, ed. GE Russell, pp. 1-35 Gasperini, D (2010) Genetic and physiological characterisation of Rht8 in hexaploid wheat. PhD thesis, John Innes Centre / University of East Anglia, Norwich, UK George AW, Visscher PM, Haley CS (2000) Mapping quantitative trait loci in complex pedigrees: a two-step variance component approach. Genetics 156: 2081-2092 Gervais L, Dedryver F, Morlais JY, Bodusseau V, Negre S, Bilous M, Groos C, Trottet M (2003) Mapping of quantitative trait loci for field resistance to Fusarium head blight in an European winter wheat. Theor Appl Gen 106: 961-970 Giorgi B, Mosconi C (1982) Short-straw mutants and other dwarfing gene sources used for the improvement of wheats and barley in Italy. Semi-Dwarfing Cereal Mutants and Their Use in Cross-Breeding, IAEA-TECDOC 268. Proceedings of a Research Coordination Meeting, Joint FAO/IAEA Division, pp. 53-64 Gosman N, Bayles R, Jennings P, Kirby J, Nicholson P (2007) Evaluation and characterisation of resistance to fusarium head blight caused by Fusarium culmorum in UK winter wheat cultivars. Plant Pathology 56:264-276 Guo Z, Song Y, Zhou R, Ren Z, Jia J (2010) Discovery, evaluation and distribution of haplotypes of the wheat Ppd-D1 gene. New Phytol 185: 841–851. Gu YQ, Coleman-Derr D, Kong X, Anderson, OD (2004) Rapid genome evolution revealed by comparative sequence analysis of orthologous regions fromfour triticeae genomes. Plant Physiology 135: 459-470 Gu YQ, Salse J, Coleman-Derr D, Dupin A, Crossman C, Lazo GR, Huo N, Belcram H, Ravel C, Charmet G, Charles M, Anderson OD, Chalhoub B (2006) Types and rates of sequence evolution at the high-molecular-weight glutenin locus in hexaploid wheat and its ancestral genomes. Genetics 174: 1493-1504

250
Gubler F, Chandler PM, White RG, Llewellyn DJ, Jacobsen JV (2002) Gibberellin signaling in barley aleurone cells. Control of SLN1 and GAMYB expression. Plant Physiol 129: 191-200 Gupta PK, Mir RR, Mohan A, Kumar J (2008) Wheat Genomics: Present Status and Future Prospects, International Journal of Plant Genomics, Article ID 896451, 36 pages Haberle J, Schweizer G, Schondelmaier J, Zimmermann G, Hartl L (2009) Mapping of QTL for resistance against Fusarium head blight in the winter wheat population Pelikan//Bussard/Ning8026. Plant Breeding 128: 27-35. Haseneyer G, Ravel C, Dardevet M, Balfourier F, Sourdille P, Charmet G, Brunel D, Sauer S, Geiger HH, Graner A, Stracke S (2008) High level of conservation between genes coding for the GAMYB transcription factor in barley (Hordeum vulgare L.) and bread wheat (Triticum aestivum L.) collections. Theor Appl Genet 117: 321-331. Haudry A, Cenci A, Ravel C, Bataillon T, Brunel D, Poncet C, Hochu I, Poirier S, Santoni S, Glemin S, David J (2007) Grinding up wheat: a massive loss of nucleotide diversity since domestication. Mol Biol Evol 24: 1506-1517 Hedden P (2003) The genes of the Green Revolution. Trends in Genet. 19: 5-9 Hilton AJ, Jenkinson P, Hollins TW, Parry DW (1999) Relationship between cultivar height and severity of Fusarium ear blight in wheat. Plant Path 48: 202-208 Holzapfel J, Voss H-H, Miedaner T, Korzun V, Haberle J, Schweizer G, Mohler V, Zimmermann G, Hartl L (2008) Inheritance of resistance to Fusarium head blight in three European winter wheat populations. Theor Appl Genet 117: 1119-1128 Hoogendoorn J, Gale MD (1988) The effects of dwarfing genes on heat tolerance in CIMMYT germplasm. Cereal Breeding Related to Integrated Cereal Production (Eds. ML Jorna and LAJ Slootmaker), Wageningen, The Netherlands: PUDOC, pp. 61-66 Huang S, Sirikhachornkit A, Su X, Faris J, Gill B, Haselkorn R, Gornicki P (2002) Genes encoding plastid acetyl-CoA carboxylase and 3-phosphoglycerate kinase of the Triticum/Aegilops complex and the evolutionary history of polyploid wheat. Proc Nat Acad Sci USA 99: 8133-8138. Ikeda A, Ueguchi-Tanaka M, Sonoda Y, Kitano H, Koshioka M, Futsuhara Y, Matsuoka M, Yamaguchi J (2001) Slender rice, a constitutive gibberellin response mutant, is caused by a null mutation of the SLR1 gene, an ortholog of the height-regulating gene GAI/RGA/RHT/D8. Plant Cell 13: 999-1010 Inazuka G (1971) Norin 10, A Japanese semi-dwarf wheat variety. Technical Report No. 82, Wheat Information Service, Kyoto University, Japan: 25-30 Innes P, Blackwell RD (1984) Effects of differences in date of ear emergence and height on the yield and water use of winter wheat. Plant Breeding Institute Annual Report 1983:103-106 Itoh H, Shimada A, Ueguchi-Tanaka M, Kamiya N, Hasegawa Y, Ashikari M, Matsuoka M (2005) Overexpression of a GRAS protein lacking the DELLA domain confers altered gibberellin responses in rice. Plant J 44: 669-679

251
Itoh H, Ueguchi-Tanaka M, Sato Y, Ashikari M, Matsuoka M (2002) The gibberellin signaling pathway is regulated by the appearance and disappearance of SLENDER RICE1 in nuclei. Plant Cell 14: 57-70 Izumi N, Sawada S, Sasakuma T (1981) A dominant gene of dwarfism located on chromosome 4D in Triticum aestivum cv. „Ai-bain 1‟. Wheat Information Service 53:21-24 Izumi N, Sawada S, Sasakuma T (1983) Genetic analysis of dwarfness in Triticum aestivum L. cv. „Ai-bian 1‟. Seiken Ziho 31: 38-48 Jia JZ, Ding SK, Li YH, Zhang H (1992) Studies of main dwarf genes and dwarf resources on Chinese wheat. Scientia Agric Sin 25: 1-5 Joazeiro CAP, Weissman AM (2000) RING finger proteins: mediators of ubiquitin ligase activity. Cell 102: 549–552 Kaneko M, Itoh H, Inukai Y, Sakamoto T, Ueguchi-Tanaka M, Ashikari M, Matsuoka M (2003) Where do gibberellin biosynthesis and gibberellin signaling occur in rice plants? Plant J 35: 104-115 Kihara H (1983) Origin and history of “Daruma” – a parental variety of Norin 10. Proc. 6th Int Wheat Genet Symp: 13-19. Kilian B, Ozkan H, Deusch O, Effgen S, Brandolini A, Kohl J, Martin W, Salamini F (2007) Independent wheat B and G genome origins in outcrossing Aegilops progenitor haplotypes. Mol Biol Evol 24: 217-227 King K, Moritz T, Harberd NP (2001) Gibberellins are not required for normal stem growth in Arabidopsis thaliana in the absence of GAI and RGA. Genetics 159: 767-776 Kirby EJM (1993) Effect of sowing depth on seedling emergence, growth and development in barley and wheat. Field Crops Res 35:101-111. Klahr A, Zimmermann G, Wenzel G, Mohler V (2007) Effects of environment, disease progress, plant height and heading date on the detection of QTLs for resistance to Fusarium head blight in an European winter wheat cross. Euphytica 154:17-28 Klein PE, Klein RR, Cartinhour SW, Ulanch PE, Dong J, Obert JA, Morishige DT, Schlueter SD, Childs KL, Ale M, et al. (2000) A high-throughput AFLP-based method for constructing integrated genetic and physical maps: progress toward a sorghum genome map. Genome Res 10: 789-807 Knopf C, Becker H, Ebmeyer E, Korzun V (2008) Occurrence of three dwarfing Rht genes in German winter wheat varieties. Cer Res Comm 36:553-560. Koorneef M, Elgersma A, Hanhart CJ, Loenen-Martinet EP, Rijn L, Zeevaart JAD (1985) A gibberellin insensitive mutant of Arabidopsis thaliana. Physiologia Plantarum 65: 33-39 Korzun V, Roder MS, Ganal MW, Worland AJ, Law CN (1998) Genetic analysis of the dwarfing gene (Rht8) in wheat. Part I. Molecular mapping of Rht8 on the short
252
arm of chromosome 2D of bread wheat (Triticum aestivum L.). Theor Appl Genet 96: 1104-1109 Kumar S, Mohan A, Balyan HS, Gupta PK (2009) Orthology between genomes of Brachypodium, wheat and rice. BMC Research Notes 2: 93 Larkin MA, Blackshields G, Brown NP, Chenna R, McGettigan PA, McWilliam H, Valentin F, Wallace IM, Wilm, A, Lopez R, Thompson JD, Gibson TJ, Higgins DG (2007) Clustal W and Clustal X version 2.0. Bioinformatics 23: 2947-2948 Lawit SJ, Wych HM, Xu D, Kundu S, Tomes DT (2010) Maize DELLA proteins dwarf plant8 and dwarf plant9 as modulators of plant development. Plant Cell Physiol 51: 1854-1868 Lee S, Cheng H, King KE, Wang W, Husssain A, Lo J, Harberd NP, Peng J (2002) Gibberellin regulates Arabidopsis seed germination via RGL2, a GAI/RGA-like gene whose expression is upregulated following imbibition. Genes and Development 16: 646-658 Levy AA, Feldman M (2002) The impact of polyploidy on grass genome evolution. Plant Physiol 130: 1587-1593 Li W, Zhang P, Fellers JP, Friebe B, Gill BS (2004) Sequence compositions, organization, and evolution of the core Triticaea genome. Plant J 40: 500-511. Li XP, Zhao, XQ, He X, Zhao GY, Li B, Liu DC, Zhang AM, Zhang XY, Tong YP, Li ZS (2011) Haplotype analysis of the genes encoding glutamine synthetase plastic isoforms and their association with nitrogen-use- and yield-related traits in bread wheat. New Phytologist 189: 449-458. Li Y, Bhosale S, Haussmann BIG, Stich B, Melchinger AE, Parzies HK (2010) Genetic diversity and linkage disequilibrium of two homologous genes to maize D8: Sorghum SbD8 and pearl millet PgD8. J Plant Breed and Crop Sci 2: 117-128. Librado P, Rozas J (2009) DnaSP v5: A software for comprehensive analysis of DNA polymorphism data. Bioinformatics 25:1451-1452. Lijavetzky D, Muzzi G, Wicker T, Keller B, Wing R, Dubcovsky J (1999) Construction and characterization of a bacterial artificial chromosome (BAC) library for the A genome of wheat. Genome 42: 1176-1182. Liu K, Muse SV (2005) PowerMarker: Integrated analysis environment for genetic marker data. Bioinformatics 21:2128-2129. Lorick KL, Jensen JP, Fang S, Ong AM, Hatakeyama S, Weissman AM. (1999) RING fingers mediate ubiquitin-conjugating enzyme (E2)-dependent ubiquitination. Proc Natl Acad Sci USA 96(20):11364-11369 Lu J, Tang T, Tang H, Huang J, Shi S, Wu CI (2006) The accumulation of deleterious mutations in rice genomes: a hypothesis on the cost of domestication. Trends Genet 22: 126-131. Luo M-C, Yang Z-L, You FM, Kawahara T, Waines JG, Dvorak J (2007) The structure of wild and domesticated emmer wheat populations, gene flow between them, and the site of emmer domestication. Theor Appl Genet 114: 947-959

253
Lupton FGH, Oliver RH, Ellis FB, Barnes BT, Howse KR, Welbank PJ, Taylor PJ (1974) Root and shoot growth of semidwarf and taller winter wheats. Ann Appl Biol 77: 129-144 Ma Z, Weining S, Sharp PJ, Liu C (2000) Non-gridded library: a new approach for BAC (bacterial artificial chromosome) exploitation in hexaploid wheat (Triticum aestivum). Nucl Acids Res 28: e106 Matsumoto T (1968) Norin 10, a dwarf winter wheat variety. Japan Agric Res Quart 3(4):22-26 Matthews JM, Sunde M (2002) Zinc fingers-folds for many occasions. IUBMB Life 54: 351-355 McCartney CA, Somers DJ, Fedak G, DePauw RM, Thomas J, Fox SL, Humphreys DG, Lukow O, Savard ME, McCallum BD, Gilbert J, Cao W (2007) The evaluation of FHB resistance QTLs introgressed into elite Canadian spring wheat germplasm. Molec Breed 20: 209-21 McKey J (1973) The wheat root. Proceedings 4th International Wheat Genetics Symposium. Missouri Agricultural Experiment Station, College of Agriculture, University of Missouri, Columbia, Missouri, USA, pp827-842 McGrann GRD, Townsend BJ, Antoniw JF, Asher MJC, Mutasa-Goettgens ES (2009) Barley elicits a similar early basal defence response during host and non-host interactions with Polymyxa root parasites. European J of Plant Pathol 123: 5-15. McIntosh RA (1988) Catalogue of gene symbols for wheat. Proceedings of the Seventh International Wheat Genetics Symposium (Eds TE Miller and RMD Koebner) Cambridge, England, Bath Press, Bath pp 1225-1323 Mesterhazy A, Toth B, Bartok T, Varga M (2008) Breeding strategies against FHB in winter wheat and their relation to type I resistance. Cer Res Comm 36: 37-43 McVittie JA, Gale MD, Marshall GA, Westcott B (1978) The intra-chromosomal mapping of the Norin 10 and Tom Thumb dwarfing genes. Heredity 40: 67-70 Mickelson-Young L, Endo TR, Gill BS (1995) A cytogenetic ladder-map of the wheat homoeologous group-4 chromosomes. Theor Appl Genet 90: 1007-1011. Miedaner T (1997) Breeding wheat and rye for resistance to Fusarium diseases. Plant Breed 116: 201-220 Miedaner T, Voss HH (2008) Effect of dwarfing Rht genes on Fusarium head blight resistance in two sets of near-isogenic lines of wheat and check cultivars. Crop Sci 48: 2115-2122 Miftahudin, Ross K, Ma X-F, Mahmoud AA, Layton J, Rodriguez M, Chikmawati T, Ramalingam J, Feril O, Pathan MS, Surlan Momirovic G, Kim S, Chema K, Fang P, Haule L, Struxness H, Birkes J, Yaghoubian C, Skinner R, McAllister J, Nguyen V, Qi LL, Gill BS, Linkiewicz AM, Dubcovsky J, Akhunov ED, Dvorak J, Dilbirligi M, Gill KS, Peng JH, Lapitan NLV, Bermudez-Kandianis CE, Sorrells ME, Hossain KG, Kalavacharla V, Kianian SF, Lazo GR, Chao S, Anderson OD, Gonzalez-Hernandez J, Wennerlind EJ, Anderson JA, Choi D-W, Fenton RD, Close TJ, McGuire PE,

254
Qualset CO, Nguyen HT, and Gustafson JP (2004) Analysis of EST loci on wheat chromosome group 4. Genetics 168: 651-663 Miralles DJ, Slafer GA (1995) Individual grain weight responses to genetic reduction in culm length in wheat as affected by source-sink manipulations. Field Crops Res 43: 55-66 Miralles DJ, Slafer GA, Lynch V (1997) Rooting patterns in near isogenic lines of spring wheat for dwarfism. Plant and Soil 197: 79-86 Moore G, Devos K, Wang Z, Gale M (1995) Cereal genome evolution: Grasses, line up and form a circle. Curr Biol 5: 737-739 Moore, T (in prep) PhD thesis, John Innes Centre / University of East Anglia, Norwich, UK Moullet O, Zhang HB, Lagudah ES (1999) Construction and characterisation of a large DNA insert library from the D genome of wheat. Theor Appl Gen 99: 305-313 Morris R, Schmidt JW, Johnson VA (1972) Chromosomal location of a dwarfing gene in a Tom Thumb wheat derivative by monosomic analysis. Crop Sci 12: 247-249 Muangprom A, Thomas SG, Sun TP, Osborn, TC (2005) A novel dwarfing mutation in a green revolution gene from Brassica rapa. Plant Physiol. 137:931-938 Nakamura H, Inazu A, Hirano H (1999) Allelic variation in high-molecular-weight glutenin subunit Loci of Glu1 in Japanese common wheats. Euphytica 106: 131-138 Naranjo T, Roca P, Goicoechea PG, Giraldez R (1987) Arm homoeology of wheat and rye chromosomes. Genome 29: 873-882 Navarro L, Bari R, Achard P, Lison P, Nemri A, Harberd NP, Jones JDG (2008) DELLAs control plant immune responses by modulating the balance and salicylic acid signaling. Curr Biol 18: 650-655 Nei, M (1987) Molecular Evolutionary Genetics. Columbia University Press, New York Nelson JC, Sorrells ME, Van Deynze AE, Lu YH, Atkinson M, Bernard M, Leroy P, Faris JD, Anderson JA (1995) Molecular mapping of wheat: major genes and rearrangements of homoeologous groups 4, 5, and 7. Genetics 141: 721-731 Nizam Uddin M, Marshall DR (1989) Effects of dwarfing genes on yield and yield components under irrigated and rainfed conditions in wheat (Triticum aestivum L.). Euphytica 42: 127-134 Nicholas KB, Nicholas HB (1997) GeneDoc: a tool for editing and annotation multiple sequence alignments. Distributed by the author (www.psc.edu/biomed/genedoc) Nilmalgoda SD, Cloutier S, Walichnowski AZ (2003) Construction and characterization of a bacterial artificial chromosome (BAC) library of hexaploid wheat (Triticum aestivum L.) and validation of genome coverage using locus-specific primers. Genome 46: 870-878

255
Nordberg M, Borevitz, JO, Bergelson J, Berry CC, Chory J, Hagenblad J, Kreitman M, Maloof JN, Noyes T, Oefner PJ, Stahl EA, Weigel D (2002) The extent of linkage disequilibrium in Arabidopsis thaliana. Nature 30: 190-193 Ogawa M, Kusano T, Katsumi M, Sano H (2000) Rice gibberellin insensitive gene homolog, OsGAI, encodes a nuclear-localized protein capable of gene activation at transcriptional level. Gene 245: 21-29 Oh E, Yamaguchi S, Hu JH, Yusuke J, Jung B, Paik I, Lee HS, Sun TP, Kamiya Y, Choi G (2007) PIL5, a phytochrome-interacting bHLH protein, regulates gibberellin responsiveness by binding directly to the GAI and RGA promoters in Arabidopsis seeds. Plant Cell 19: 1192-1208 Olsen KM, Caicedo AL, Polato N, McClung A, McCouch S, Purugganan MD (2006) Selection under domestication: evidence for a sweep in the rice waxy genomic region. Genetics 173:975-983 Palaisa K, Morgante M, Tinge, S, Rafalski A (2004) Long range patterns of diversity and linkage disequilibrium surrounding the maize Y1 gene are indicative of an asymmetric selective sweep. Proc Natl Acad Sci US 101: 9885-9890 Palaisa K, Morgante M, Williams, M, Rafalski A (2003) Contrasting effects of selection on sequence diversity and linkage disequilibrium at two phytoene synthase loci. Plant Cell 15: 1795-1806 Paterson AH, Bowers JE, Chapman BA (2004) Ancient polyploidization predating divergence of the cereals, and its consequences for comparative genomics. Proc Natl Acad Sci USA 101: 9903-9908 Paterson AH, Bowers JE, Feltus FA, Tang H, Lin L, Wang X (2009) Comparative Genomics of Grasses Promises a Bountiful Harvest. Plant Physiol (149): 125–131 Paux E, Roger D, Badaeva E, Gay G, Bernard M, Sourdille P, Feuillet, C (2006) Characterizing the composition and evolution of homoeologous genomes in hexaploid wheat through BAC-end sequencing on chromosome 3B. Plant J 48:463-474. Pearce S, Saville R, Chandler PM, Wilhelm EP, Boulton M, Phillips AL, Hedden P, Nicholson P, Thomas SG (2011, in review) Molecular characterisation of Rht-1 dwarfing genes in hexaploid wheat Peng JR, Carol P, Richards DE, King KE, Cowling RJ, Murphy GP, Harberd NP (1997) The Arabidopsis GAI gene defines a signaling pathway that negatively regulates gibberellin responses. Genes and Development 11: 3194-3205 Peng JR, Richards DE, Hartley NM, Murphy GP, Devos KM, Flintham JE, Beales J, Fish LJ, Worland AJ, Pelica F, Sudhakar D, Christou P, Snape JW, Gale MD, Harberd NP (1999) 'Green revolution' genes encode mutant gibberellin response modulators. Nature 400: 256-261 Pestsova EG, Korzun V, Borner A (2008) Validation and utilisation of Rht dwarfing gene specific markers. Cer Res Comm 36:235-246. Pfaffl, MW (2001) A new mathematical model for relative quantification in real-time RT-PCR. Nucleic Acids Res 29(9).

256
Pysh LD, Wysocka-Diller JW, Camilleri C, Bouchez D, Benfey, PN (1999) The GRAS gene family in Arabidopsis: sequence characterization and basic expression analysis of the SCARECROW-LIKE genes. Plant J 18:111-119 Quarrie SA, Steed A, Calestani C, Semikhodskii A, Lebreton C, Chinoy C, Steele N, Pljevljakusic D, Waterman E, Weyen F, Schondelmaier J, Habash DZ, Farmer P, Saker L, Clarkson DT, Abugalieva A, Yessimbekova M, Turuspekov Y, Abugalieva S, Tuberosa R, Sanguineti M-C, Hollintong PA, Aragues R, Royo A, Dodig D (2005) A high-density genetic map of hexaploid wheat (Triticum aestivum L.) from the cross Chinese Spring × SQ1 and its use to compare QTLs for grain yield across a range of environments. Theor Appl Genet 110: 865-880. Ragupathy R, Cloutier, S. (2008) Genome organisation and retrotransposon driven molecular evolution of the endosperm Hardness (Ha) locus in Triticum aestivum cv Glenlea. Molec Genet Genomics 280(6): 467-481 Ramakrishna W, Dubcovsky J, Park Y-J, Busso C, Emberton J, SanMiguel P, Bennetzen JL (2002) Different types and rates of genome evolution detected by comparative sequence analysis of orthologous segments from four cereal genomes. Genetics 162: 1389-1400 Ramsay L, Comadran J, Druka A, Marshall DF, Thomas WT, Macaulay M, MacKenzie K, Simpson C, Fuller J, Bonar N, Hayes PM, Lundqvist U, Franckowiak JD, Close TJ, Muehlbauer GJ, Waugh R (2011) INTERMEDIUM-C, a modifier of lateral spikelet fertility in barley, is an ortholog of the maize domestication gene TEOSINTE BRANCHED 1. Nature Genet 43: 169-173 Raquin AL, Brabant P, Rhone B, Balfourier F, Leroy P, Goldringer I (2008) Soft selective sweep near a gene that increases plant height in wheat. Molec Ecol 17: 741-756. Ratnayaka I, Baga M, Fowler DB, Chibbar, RN (2005) Construction and characterization of a BAC library of a cold-tolerant hexaploid wheat cultivar. Crop Sci 45:1571-1577. Ravel C, Martre P, Romeuf I, Dardevet M, El-Malki R, Bordes J, Duchateau N, Brunel D, Balfourier F, Charmet G (2009) Polymorphism in the wheat transcriptional activator Spa influences its pattern of expression and has pleiotropic effects on grain protein composition, dough viscoelasticity, and grain hardness. Plant Physiol 151: 2133-2144. Ravel C, Praud S, Murigneux A, Canaguier A, Sapet F, Samson D, Balfourier F, Dufour F, Chalhoub B, Brunel D, Béckert M, Charmet G (2006) Single-nucleotide polymorphism frequency in a set of selected lines of bread wheat (Triticum aestivum L.) Genome 49: 1131-1139. Rebetzke GJ, Appels R, Morrison AD, Richards RA, McDonald G, Ellis MH, Spielmeyer W, Bonnett DG (2001) Quantitative trait loci on chromosome 4B for coleoptile length and early vigour in wheat (Triticum aestivum L.). Aust J Agric Res 52:1221-1234 Rebetzke GJ, Ellis MH, Bonnett DG, Richards RA (2007) Molecular mapping of genes for coleoptile growth in bread wheat (Triticum aestivum L.) Theor Appl Genet 114: 1173-1183
257
Reif JC, Zhang P, Dreisigacker S, Warburton ML, van Ginkel M, Hoisington D, Bohn M, Melchinger AE (2005) Wheat genetic diversity trends during domestication and breeding. Theor Appl Genet 110: 859-864 Reitz LP, Salmon SC (1968) Origin, history, and use of Norin 10 wheat. Crop Sci 8:686-689 Remington DL, Thornsberry JM, Matsuoka Y, Wilson LM, Whitt SR, Doebley J, Kresovich S, Goodman MM, Buckler ES (2001) Structure of linkage disequilibrium and phenotypic associations in the maize genome. Proc Natl Acad Sci US 98: 11479-11484
Richards RA (1992a) The effect of dwarfing genes in spring wheat in dry environments. I. Agronomic characteristics. Aust J Agric Res 43: 517-527 Richards RA (1992b) The effect of dwarfing genes in spring wheat in dry environments. II. Growth, water use and water-use efficiency. Aust J Agric Res 43: 529-529 Richards RA, Passioura JB (1981) Seminal root morphology and water use of wheat. I. environmental effects. Crop Sci 21: 249-252 Salse J, Bolot S, Throude M, Jouffe V, Piegu B, Quraishi UM, Calcagno T, Cooke R, Delseny M, Feuillet C (2008) Identification and characterization of shared duplications between rice and wheat provide new insight into grass genome evolution. Plant Cell 20: 11–24
Sambrook J, Fritsch EF, Maniatis T (1989) Molecular cloning: a Laboratory Manual. 2nd ed. Cold Spring Harbour Laboratory Press, New York.
Sasaki A, Itoh H, Gomi K, Ueguchi-Tanaka M, Ishiyama K, Kobayashi M, Jeong DH, An G, Kitano H, Ashikari M, Matsuoka M (2003) Accumulation of phosphorylated repressor for gibberellin signaling in an F-box mutant. Science 299: 1896-1898 Saville, R (2011) Understanding DELLA in wheat: linking genotype to phenotype. PhD thesis, John Innes Centre / University of East Anglia, Norwich, UK
Schillinger WF, Donaldson E, Allan RE, Jones SS (1998) Winter wheat seedling emergence from deep sowing depths. Agron J 90: 582-586 Schmolke M, Zimmermann G, Buerstmayr H, Schweizer G, Miedaner T, Korzun V, Ebmeyer E, Hartl L (2005) Molecular mapping of Fusarium head blight resistance in the winter wheat population Dream/Lynx. Theor Appl Gen 111: 747-756 Schnable PS, Ware D, Fulton RS, Stein JC, Wei F, Pasternak S, et al. (2009) The B73 maize genome: complexity, diversity, and dynamics. Science 326: 1112-1115 Schuelke M (2000) An economic method for the fluorescent labeling of PCR fragments. Nature Biotech 18: 233-234 Sears (1954) The aneuploids of common wheat. Missouri Agric Ext Serv USDA Coop 572: 2-59.

258
Shizuya H, Birren B, Kim U, Mancino V, Slepak T, Tachiiri Y, Simon M (1992) Cloning and stable maintenance of 300-kilobase-pair fragments of human DNA in Escherichia coli using an F-factor-based vector. PNAS USA 89: 8794-8797.
Siddique HM, Belford RK, Tennant D (1990) Root:shoot ratios of old and modern, tall and semi-dwarf wheats in a Mediterranean environment. Plant and Soil 121: 89-98 Silverstone AL, Ciampaglio CN, Sun TP (1998) The Arabidopsis RGA gene encodes a transcriptional regulator repressing the gibberellin signal transduction pathway. Plant Cell 10: 155-169 Snedecor GW, Cochran WG (1967) Statistical Methods (6th edition). The Iowa State University Press, Ames, IA, USA. Sohrt K, Soll J (2000) Toc64, a New Component of the Protein Translocon of Chloroplasts. J Cell Biol 148(6): 1213-1221 Sojka RE, Stolzy LH, Fisher RA (1981) Seasonal drought response of selected wheat cultivars. Agron J 73:838-844 Somers DJ, Fedak G, Savard M (2003a) Molecular mapping of novel genes controlling Fusarium head blight resistance and deoxynivalenol accumulation in spring wheat. Genome 46:555-564 Somers DJ, Isaac P, Edwards K (2004) A high-density microsatellite consensus map for bread wheat (Triticum aestivum L.) Theor Appl Genet 109: 1105-1114 Somers DJ, Kirkpatrick R, Moniwa M, Walsh A (2003b) Mining single-nucleotide polymorphisms from hexaploid wheat ESTs. Genome 49: 431-437 Sourdille P, Singh S, Cadalen T, Brown-Guedira GL, Gay G, Qi L, Gill BS, Dufour P, Murigneux A, Bernard M (2004) Microsatellite-based deletion bin system for the establishment of genetic-physical map relationships in wheat (Triticum aestivum L.) Funct Integr Genomics 4: 12-25 Srinivasachary, Gosman N, Steed A, Hollins TW, Bayles R, Jennings P, Nicholson P. (2009) Semi-dwarfing Rht-B1 and Rht-D1 loci of wheat differ significantly in their influence on resistance to Fusarium head blight. Theor Appl Genet 118: 695-702 Srinivasachary, Gosman N, Steed A, Simmonds J, Leverington-Waite M, Wang Y, Snape J, Nicholson P (2008) Susceptibility to Fusarium head blight is associated with the Rht-D1b semi-dwarfing allele in wheat. Theor Appl Gen 116: 1145-1153 Steiner B, Lemmens M, Griesser M, Scholz U, Schondelmaier J, Buerstmayr H (2004) Molecular mapping of resistance to Fusarium head blight in the spring wheat cultivar Frontana. Theor Appl Genet 109: 215-224 Subbiah BV, Katyal JC, Narasimh RL, Dakshina C (1968) Preliminary investigations on root distribution of high yielding wheat varieties. Int Journ Appl Radiation and Isotopes 19: 385-390 Sun TP (2010) Gibberellin-GID1-DELLA: A pivotal regulatory module for plant growth and development. Plant Physiol 154: 567-570 Swigonova Z, Lai J, Ma J, Ramakrishna W, Llaca V, Bennetzen JL, Messing J (2004)

259
Close split of sorghum and maize genome progenitors. Genome Res 14: 1916-1923 Syme JR, Pugsley AT (1974) A Mexican wheat and its application to Australian wheat improvement. SABRAO J 7: 1-5. Tajima, F (1983) Evolutionary relationship of DNA sequences in finite populations. Genetics 105: 437-460. Talbert, LE, Smith LY, Blake NK (1998) More than one origin of hexaploid wheat is indicated by sequence comparison of low-copy DNA. Genome 41: 402-407 Tanksley SD, McCouch R (1997) Seed banks and molecular maps: unlocking genetic potential from the wild. Science 277: 1063-1066 The International Brachypodium Initiative (IBI) (2010) Genome sequencing and analysis of the model grass Brachypodium distachyon. Nature 463: 763-768 Thornsberry JM, Goodman MM, Doebley J, Kresovich S, Nielsen D, Buckler ES (2001) Dwarf8 polymorphisms associate with variation in flowering time. Nat Genet 28: 286-289. Tian C, Wan P, Sun S, Li J, Chen M (2004) Genome-wide analysis of the GRAS gene family in rice and Arabidopsis. Plant Molec Biol 54: 519–532 Tosovic-Maric B, Kobiljski B, Obreht D, Vapa L (2008) Evaluation of wheat Rht genes using molecular markers. Genetika 40: 31-38. Tyler L, Thomas SG, Hu J, Dill A, Alonso JM, Ecker JR, Sun TP (2004) DELLA proteins and gibberellin-regulated seed germination and floral development in Arabidopsis. Plant Physiol 135: 1008-1019 Ueguchi-Tanaka M, Hirano K, Kitano H, Matsuoka M (2008) Release of the repressive activity of rice DELLA protein SLR1 by gibberellin does not require SLR1 degradation in the gid2 mutant. The Plant Cell 20: 2437-2446 Uegechi-Tanaka M, Nakajima M, Katoh E, Ohmiya H, Asano K, Saji S, Hongyu X, Ashikari M, Kitano H, Yamaguchi I, Matsuoka M (2007) Molecular interactions of a soluble gibberellin receptor, GID1, with a rice DELLA protein, SLR1, and gibberellin. Plant Cell 19: 2140-2155 Voss HH, Holzapfel J, Hartl L, Korzun V, Rabenstein F, Ebmeyer E, Coester H, Kempf H, Miedaner T (2008) Effect of the Rht-D1 dwarfing locus on Fusarium head blight rating in three segregating populations of winter wheat. Plant Breeding 127: 333-339 Wang H, Wang X, Chen P, Liu D (2007) Assessment of genetic diversity of Yunnan, Tibetan, and Xinjiang wheat using SSR markers. J of Genetics and Genomics 34: 623-633 Wang RL, Stec A, Hey J, Lukens L, Doebley J (1999) The limits of selection during maize domestication. Nature 398:236-239 Weston DE, Elliott RC, Lester DR, Rameau C, Reid JB, Murfet IC, Ross JJ (2008) The pea DELLA proteins LA and CRY are important regulators of gibberellin synthesis and root growth. Plant Physiol 147: 199-205

260
White J, Law JR, MacKay I, Chalmers KJ, Smith JSC, Kilian A, Powell, W (2008) The genetic diversity of UK, US and Australian cultivars of Triticum aestivum measured by DArT markers and considered by genome. Theor Appl Gen 116: 439-453 Wicker T, Krattinger SG, Lagudah ES, Komatsuda T, Pourkheirandish M, Matsumoto T, Cloutier S, Reiser L, Kanamori H, Sato K, Perovic D, Stein N, Keller B (2009) Analysis of intraspecies diversity in wheat and barley genomes identifies breakpoints of ancient haplotypes and provides insight into the structure of diploid and hexaploid triticeae gene pools. Plant Physiol 149: 258-270. Wilhelm, EP (2007) Genetic analysis of photoperiod response in pasta wheat and bread wheat. MSc thesis, John Innes Centre/University of East Anglia Winkler RG, Freeling M (1994) Physiological genetics of the dominant gibberellin-nonresponsive maize dwarfs, Dwarf8 and Dwarf9. Planta 193: 341-348 Wojciechowski T, Gooding MJ, Ramsay L, Gregory PJ (2009) The effects of dwarfing genes on seedling root growth of wheat. J Exp Bot 60: 2565-2573 Worland AJ (1986) Gibberellic acid insensitive dwarfing genes in Southern European wheats. Euphytica 35: 857-866 Worland AJ (1999) The importance of Italian wheats to worldwide varietal improvement. J Genet & Breed 53:165-173 Worland AJ, Borner A, Korzun V, Li WM, Petrovíc S, Sayers EJ (1998a) The influence of photoperiod genes on the adaptability of European winter wheats. Euphytica 100: 385–394. Worland AJ, Korzun V, Roder MS, Ganal MW, Law CN (1998b) Genetic analysis of the dwarfing gene Rht8 in wheat. Part II. The distribution and adaptive significance of allelic variants at the Rht8 locus of wheat as revealed by microsatellite screening. Theor Appl Genet 96: 1110-1120 Worland AJ Law CN (1986) Genetic analysis of chromosome 2D of wheat: 1. The location of genes affecting height, day-length insensitivity, hybrid dwarfism and yellow-rust resistance. Zeitschrift Fur Pflanzenzuchtung-Journal of Plant Breeding 96: 331-345 Worland AJ, Law CN, Petrovic S (1990) Height reducing genes and their importance to Yugoslavian winter wheat varieties. Savremena Poljo-privreda 38: 245–258 Worland AJ, Petrovic, S (1988) The gibberellic acid insensitive dwarfing gene from the wheat variety Saitama 27. Euphytica 38:55-63 Worland AJ, Petrovíc S, Law CN (1988) Genetic analysis of chromosome 2D of wheat II. The importance of this chromosome to Yugoslavian varieties. Plant Breeding 100: 247-259. Worland AJ, Sayers EJ (1995) Rht1(B.dw), an alternative allelic variant for breeding semi-dwarf wheat varieties. Plant Breeding 114: 397-400. Wu J, Kong X, Liu Y, Xiao J, Jin C, Zhang C, Jia J (2004) A hexaploid wheat BAC sequencing and analysis of microcolinearity between wheat and rice at the Rht-D1

261
locus. Poster presentation at: New Directions for a Diverse Planet: Proceedings of the 4th International Crop Science Congress. Brisbane, Australia, 26 Sep – 1 Oct 2004. Wu et al (2011, in review). GA-insensitive Rht3 repressor caused by a new TRIM insertion in DELLA domain Xia ZJ, Sato H, Watanabe S, Kawasaki S, Harada K (2005) Construction and characterization of a BAC library of soybean. Euphytica 141: 129-137 Xu Z, Deal KR, Li W, Covaleda L, Chang Y-L, Dvorak J, Luo MC, Gill BS, Anderson OD, Zhang HB (2002) Construction and characterization of five large-insert BAC and BIBAC libraries of Aegilops tauschii, the diploid donor of the wheat D genome. In: 10th international plant and animal genome conference, San Diego, USA: 101 Yamada T (1989) Identification of GA-insensitive Rht genes in Japanese modern varieties and lanraces of wheat. Euphytica 43:53-57. Yamada T (1990) Classification of GA response, Rht genes and culm length in Japanese varieties and landraces of wheat. Euphytica 50: 221-239 Yan W, Li HB, Cai SB, Ma HX, Rebetzke GJ, Liu CJ (2011) Effects of plant height on type I and type II resistance to fusarium head blight in wheat. Plant Pathology. On-line pre-publication Doi: 10.1111/j.1365-3059.2011.02426.x Ye S, Dhillon S, Ke X, Collins AR, Day INM (2001) An efficient procedure for genotyping single nucleotide polymorphisms. Nucl Acids Res 29(17):e88. Yim Y-S, Moak P, Sanchez-Villeda H, Musket T, Close P, Klein P, Mullet J, McMullen M, Fang Z, Schaeffer M et al. (2007) A BAC pooling strategy combined with PCR-based screenings in a large, highly repetitive genome enables integration of the maize genetic and physical maps. BMC Genomics 8: 47 Youssefian S, Kirby EJM, Gale MD (1992) Pleitropic effects of the GA-insensitive Rht dwarfing genes in wheat 2. Effects on leaf, stem, ear and floret growth. Field Crops Res 28: 191-210 Yu J, Pressoir G, Briggs WH, Bi IV, Yamasaki M, Doebley JF, McMullen MD, Gaut BS, Nielsen DM, Holland JB, Kresovich S, Buckler ES (2006) A unified mixed-model method for association mapping that accounts for multiple levels of relatedness. Nature Genetics 38: 203-208 Zhao Xu, Hao Wang (2007) LTR_FINDER: an efficient tool for the prediction of full-length LTR retrotransposons", Nucleic Acids Res. 35 (Web Server issue): W265-W268. Zhang X, Yang S, Zhou Y, He Z, Xia X (2006) Distribution of the Rht-B1b, Rht-D1b and Rht8 reduced height genes in autumn-sown Chinese wheats detected by molecular markers. Euphytica 152:109-116. Zohary D, Hopf M (2000) Domestication of plants in the Old World: the origin and spread of cultivated plants in West Asia, Europe and the Nile Valley. New York: Oxford University Press.

Appendix I. Primer sequences
262
Designation Dirb Sequence (5' to 3')
160-R1 R CGG CCA GTT AAA TAT CGT CTG
197-R1 R AAT TAA TTC TAG CGT CCA CTC G
414F-F10 F ACG CCT CCC ACT ACA CTG
414F-R4 R GTT GGT TCA AAC AGA GAG C
D-BAC_F1 F CCG CTG TGC TCT GAA AAG AT
D-BAC_F2 F AAT TCG TTA TCG GCG AAA AGT
D-BAC_F3 F TCT GCC AAA TTG TCC TTG GT
D-BAC_F4 F TGA CGG ATC CTA CTC CAA GG
D-BAC_F5 F TTT TCG AGT GGC ATT TCC TC
D-BAC_R1 R ATC GGT CAG TTT TGG TTG AA
D-BAC_R2 R CTG ATG CGA TAG GCA AAC CT
D-BAC_R3 R CCG GAT AAA TTA CGC TGG AA
D-BAC_R4 R GTG AGA GGA CGA GGG ACA AG
D-BAC_R5 R CGC CCA CCT GAG GTA TAA CT
DgR3 R CAC TGG TGG TAG CTG AGA TT
PS-Rht-R2 R GGA GGA AGA AGG AGG AAG AAT A
PS-Rht-R4 R GGA GGA AGA AGG AGG AAG AAT G
Rht-11-R R CCT GTC GTC AGG GGC GGC GCC AGC
Rht-16-F F GGC ATG GGC TCG TCC GAG GAC AAG
Rht-22-F F GCC AGA GAT AGA TAG AGA GGC G
Rht-9-R R GAT CGG CCG CAG CGC GTA GAT GC
Rht-A-F2 F CCC TCA ACA GTG CAA TAC CTT C
Rht-A-F3 F GAT GCC GTC TCG CAA TCT
Rht-A-F4 F TCC CAC AAA ATT GAG CCA AC
Rht-A-F5 F TTG ACT TGT GCC TAC CTC TTT TT
Rht-A-R1 R TTA CGG GTG ATC ATG GAG GT
Rht-A-R2 R GGT TGG TGC AGT GTA AAG CTG
Rht-A-R3 R TGC AAA GCC ATC ATG TTC ATA
Rht-ABD-F1 F GGA CAC CGT GCA CTA CAA CC
Rht-ABD-F2 F CAG GAG CTC TGT GGT GGA G
Rht-ABD-F3 F TTC TAC GAG TCC TGC CCC TA
Rht-ABD-F4 F GAA CCG AGG CAA GCA AAA G
Rht-ABD-F6 F ACT CCT CCT GCA GCA CCT AC
Rht-ABD-F7 F GCC CTG GAG AAG GTC CTG
Rht-ABD-F8 F AGA AGC TGG AGC AGC TGG A
Rht-ABD-F9 F AGA AGG AGG GCT GCC TGA C
Rht-ABD-R1 R GAG AGG TTC TCC TGC TGC AC
Rht-ABD-R1a R CCA GCA AGG GTA TCT GCT TC
Rht-ABD-R1b R CAG CCT CCA CCA CAG AGC
Rht-ABD-R5 R CGA CAC CAT CAT CTT GTC CT
Rht-ABD-R6 R TGC ATC CCC TGC TTG ATG
Rht-ABD-R7 R CAG GAA TGT GCC GGA GTT
Rht-ABD-R8 R CCG GGG TTG TGT TGT CCT

Appendix I continued.
263
b Direction (Dir) of primers were forward (F) or reverse (R)
Designation Dirb Sequence (5' to 3')
Rht-ABD-R9 R GAG GTC GGT GGG GTT GTA GT
Rht-ABD-R10 R CAT AGC TAA TGC GAC ACA CG
Rht-B-F1 F AGG CAA GCA AAA GCT TGA GA
Rht-B-F2 F GAA ATG TTG GTT GTT ATA TCC TTG G
Rht-B-F4 F CAC CAC CGA TCT CGA ACA A
Rht-B-F5 F CAA TGA CAA AAT AAT AGC CAT TCT C
Rht-B-R1 R CGG CAA AGG AAG CTA AGT TG
Rht-B-R3 R AGC GGC AGC GTA GTA GTT GT
Rht-B1a-R2 R CCA TGG CCA TCT CCA GAT G
Rht-B1b-R2 R CCC ATG GCC ATC TCC AGA TA
Rht-D-F1 F CGA GGC AAG CAA AAG CTT C
Rht-D-F2 F CAG TGC AAT ACA CAG ATG CTT CA
Rht-D-F3 F ATG GTC GCC TTT GTT TCT TG
Rht-D-F5 F GCT CGT TCT CCT CCC AGT TC
Rht-D-F6 F GGG TAC TTA TGT TAT TTG CTT GTT GG
Rht-D-R1 R AAT TGC AAA GCC ACC ATT G
Rht-D1a-R2 R ATG GCC ATC TCG AGC TGT TC
Rht-D1b-R2 R CAT GGC CAT CTC GAG CTG TTA
Rht-F03 F GAG TCT GAC GCA GCA GAG AG
Rht-F04 F TTC AAT ATT AAT TTT AAT CAT CCC ACA
Rht-F06 F AAC CGT GTG TCG CAT TAG C
Rht-F07 F CCC GCT TTT CCC CTT TTG
Rht-F11 F TTG TGA TTC CCA CCG GTT C
Rht-R01 R ACC AGA CAA ACT TCG CCA TC
Rht-R02 R CCC CGA CTC CCA CTT TAT TT
Rht-R03 R ATC GGA GCT CTT ACG TTT TTC C
Rht-R04 R CAA GTC TTT TAG ATC ATG TAC TTA TGC
Rht-R05 R CCA GCA CGA ATA TTT ACC AAG G
Rht-R08 R GGG GTG GCA CAA GAG GTG

Appendix III: Annotation of Chinese Spring BAC Clones 0224_M10 (A genome) (A), 1417-F16 (B genome) (B), and 0155_I24 (D genome) (C)
264
(A) DEFINITION: Triticum aestivum clone BAC 0224_M10 genomic sequence (164257 bp); ACCESSION: Chinese Spring Rht-A1a
mobile element 126..1937
/note=“TREP3198 Retrotransposon, LTR, Gypsy, RLG_Fatima_B_consensus-1”
mobile element complement(2189..3175) /note=“TREP3160 Retrotransposon, LTR, Copia, RLC_WIS_A_consensus-1”
TSD 3605..3609 /note=“ target site duplication of TREP3250 Retrotransposon, LTR, Gypsy, RLG_Sabrina_D_115G1-2”
LTR 3610..5184
/note=“ long terminal repeat of TREP3250 Retrotransposon, LTR, Gypsy, RLG_Sabrina_D_115G1-2”
mobile element 5185..10278 /note=“TREP3250 Retrotransposon, LTR, Gypsy, RLG_Sabrina_D_115G1-2”
LTR 10279..11842
/note=“ long terminal repeat of TREP3250 Retrotransposon, LTR, Gypsy, RLG_Sabrina_D_115G1-2”
TSD 11843..11847
/note=“ target site duplication of TREP3250 Retrotransposon, LTR, Gypsy, RLG_Sabrina_D_115G1-2”
mobile element complement(12107..13426) /note=“TREP3456 Retrotransposon, LTR, Copia, RLC_Barbara_consensus-1”
TSD 13442..13446 /note=“ target site duplication of RLC_WIS_B_consensus-1, Retrotransposon, LTR, Copia, TREP3161"
LTR 13447..15175
/note=“long terminal repeat of RLC_WIS_B_consensus-1, Retrotransposon, LTR, Copia, TREP3161”
mobile element 15175..20467
/note=RLC_WIS_B_consensus-1, Retrotransposon, LTR, Copia, TREP3161” LTR 20468..22189
/note=“long terminal repeat of RLC_WIS_B_consensus-1, Retrotransposon, LTR, Copia, TREP3161"
TSD 22190..22194 /note=“ target site duplication of RLC_WIS_B_consensus-1, Retrotransposon, LTR, Copia, TREP3161"
mobile element complement(22208..22409) /note=“TREP3456 Retrotransposon, LTR, Copia, RLC_Barbara_consensus-1"
CDS complement(24659..24737, 24835..24914, 25031..25111, 25242..25311,
25440..25514, 26833..27038, 27377..27626, 27704..27749, 29214..29283, 31686..31755, 33343..33427, 33551..33635, 33746..33836, 34419..34552)
/gene /product = “putative zinc-finger protein gene”
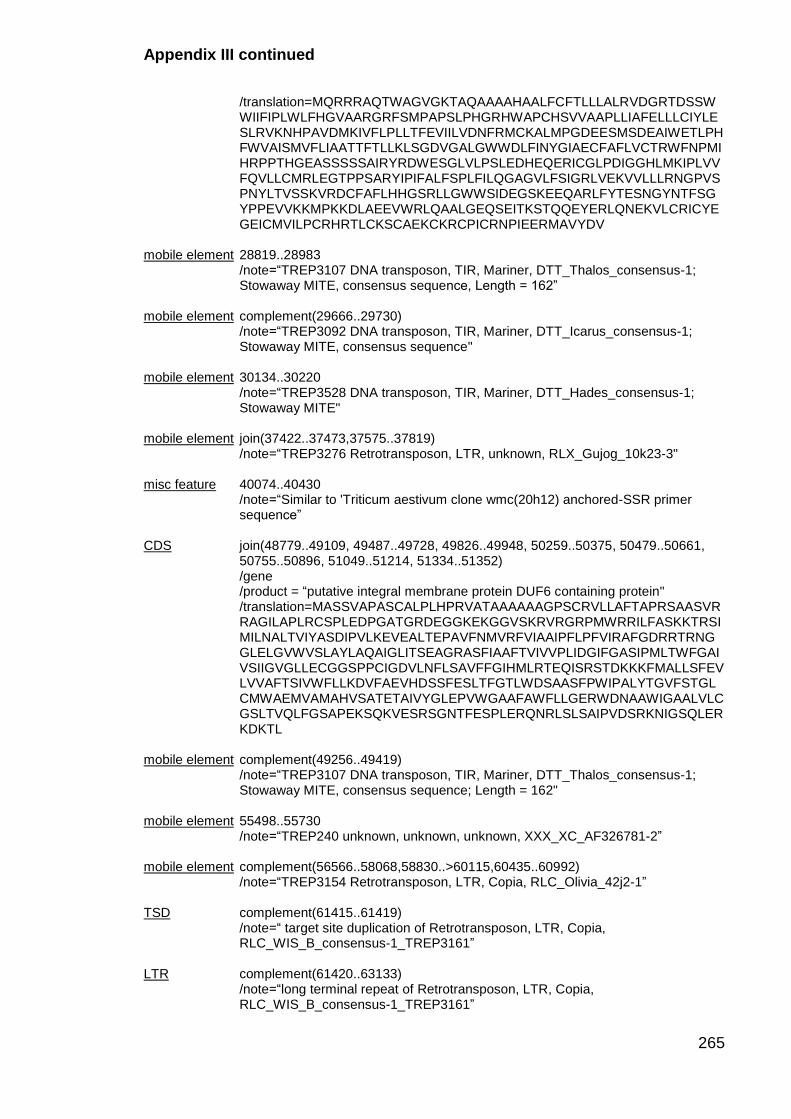
Appendix III continued
265
/translation=MQRRRAQTWAGVGKTAQAAAAHAALFCFTLLLALRVDGRTDSSWWIIFIPLWLFHGVAARGRFSMPAPSLPHGRHWAPCHSVVAAPLLIAFELLLCIYLESLRVKNHPAVDMKIVFLPLLTFEVIILVDNFRMCKALMPGDEESMSDEAIWETLPHFWVAISMVFLIAATTFTLLKLSGDVGALGWWDLFINYGIAECFAFLVCTRWFNPMIHRPPTHGEASSSSSAIRYRDWESGLVLPSLEDHEQERICGLPDIGGHLMKIPLVVFQVLLCMRLEGTPPSARYIPIFALFSPLFILQGAGVLFSIGRLVEKVVLLLRNGPVSPNYLTVSSKVRDCFAFLHHGSRLLGWWSIDEGSKEEQARLFYTESNGYNTFSGYPPEVVKKMPKKDLAEEVWRLQAALGEQSEITKSTQQEYERLQNEKVLCRICYEGEICMVILPCRHRTLCKSCAEKCKRCPICRNPIEERMAVYDV
mobile element 28819..28983
/note=“TREP3107 DNA transposon, TIR, Mariner, DTT_Thalos_consensus-1; Stowaway MITE, consensus sequence, Length = 162”
mobile element complement(29666..29730) /note=“TREP3092 DNA transposon, TIR, Mariner, DTT_Icarus_consensus-1; Stowaway MITE, consensus sequence"
mobile element 30134..30220 /note=“TREP3528 DNA transposon, TIR, Mariner, DTT_Hades_consensus-1; Stowaway MITE"
mobile element join(37422..37473,37575..37819)
/note=“TREP3276 Retrotransposon, LTR, unknown, RLX_Gujog_10k23-3" misc feature 40074..40430
/note=“Similar to 'Triticum aestivum clone wmc(20h12) anchored-SSR primer sequence”
CDS join(48779..49109, 49487..49728, 49826..49948, 50259..50375, 50479..50661,
50755..50896, 51049..51214, 51334..51352) /gene /product = “putative integral membrane protein DUF6 containing protein" /translation=MASSVAPASCALPLHPRVATAAAAAAGPSCRVLLAFTAPRSAASVRRAGILAPLRCSPLEDPGATGRDEGGKEKGGVSKRVRGRPMWRRILFASKKTRSIMILNALTVIYASDIPVLKEVEALTEPAVFNMVRFVIAAIPFLPFVIRAFGDRRTRNGGLELGVWVSLAYLAQAIGLITSEAGRASFIAAFTVIVVPLIDGIFGASIPMLTWFGAIVSIIGVGLLECGGSPPCIGDVLNFLSAVFFGIHMLRTEQISRSTDKKKFMALLSFEVLVVAFTSIVWFLLKDVFAEVHDSSFESLTFGTLWDSAASFPWIPALYTGVFSTGLCMWAEMVAMAHVSATETAIVYGLEPVWGAAFAWFLLGERWDNAAWIGAALVLCGSLTVQLFGSAPEKSQKVESRSGNTFESPLERQNRLSLSAIPVDSRKNIGSQLERKDKTL
mobile element complement(49256..49419)
/note=“TREP3107 DNA transposon, TIR, Mariner, DTT_Thalos_consensus-1; Stowaway MITE, consensus sequence; Length = 162"
mobile element 55498..55730 /note=“TREP240 unknown, unknown, unknown, XXX_XC_AF326781-2”
mobile element complement(56566..58068,58830..>60115,60435..60992) /note=“TREP3154 Retrotransposon, LTR, Copia, RLC_Olivia_42j2-1”
TSD complement(61415..61419) /note=“ target site duplication of Retrotransposon, LTR, Copia, RLC_WIS_B_consensus-1_TREP3161”
LTR complement(61420..63133)
/note=“long terminal repeat of Retrotransposon, LTR, Copia, RLC_WIS_B_consensus-1_TREP3161”
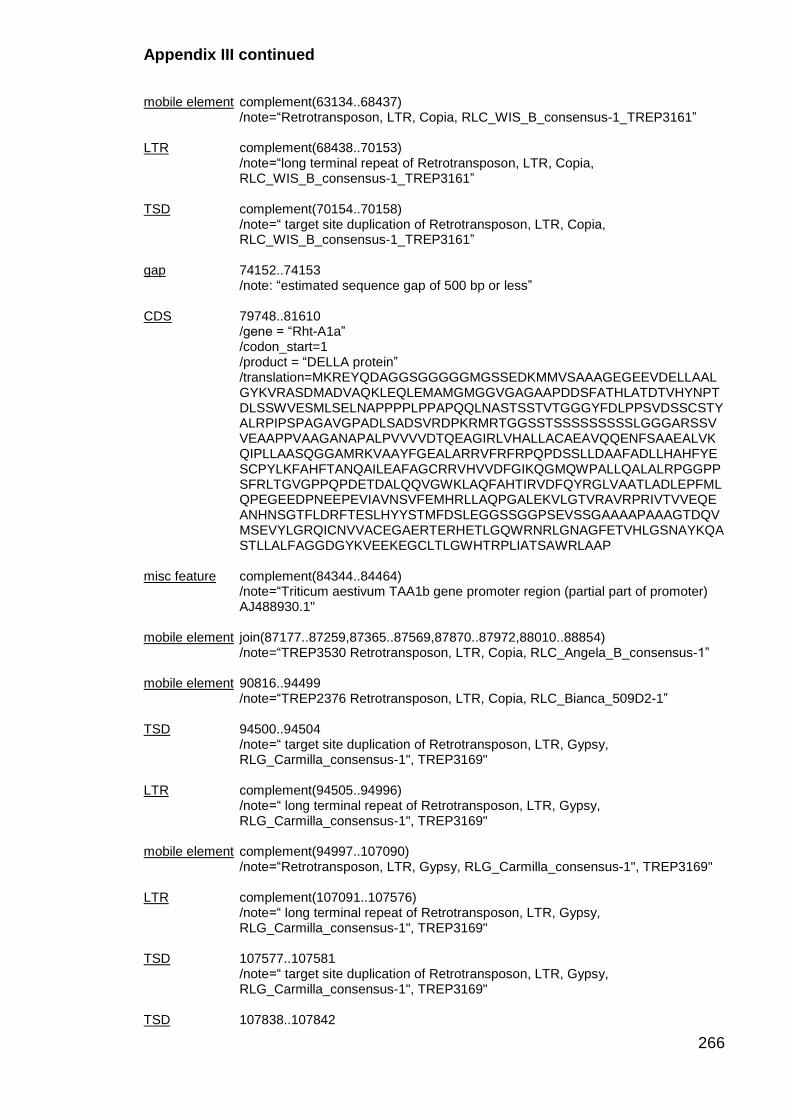
Appendix III continued
266
mobile element complement(63134..68437) /note=“Retrotransposon, LTR, Copia, RLC_WIS_B_consensus-1_TREP3161”
LTR complement(68438..70153)
/note=“long terminal repeat of Retrotransposon, LTR, Copia, RLC_WIS_B_consensus-1_TREP3161”
TSD complement(70154..70158) /note=“ target site duplication of Retrotransposon, LTR, Copia, RLC_WIS_B_consensus-1_TREP3161”
gap 74152..74153 /note: “estimated sequence gap of 500 bp or less”
CDS 79748..81610
/gene = “Rht-A1a” /codon_start=1 /product = “DELLA protein” /translation=MKREYQDAGGSGGGGGMGSSEDKMMVSAAAGEGEEVDELLAALGYKVRASDMADVAQKLEQLEMAMGMGGVGAGAAPDDSFATHLATDTVHYNPTDLSSWVESMLSELNAPPPPLPPAPQQLNASTSSTVTGGGYFDLPPSVDSSCSTYALRPIPSPAGAVGPADLSADSVRDPKRMRTGGSSTSSSSSSSSSLGGGARSSVVEAAPPVAAGANAPALPVVVVDTQEAGIRLVHALLACAEAVQQENFSAAEALVKQIPLLAASQGGAMRKVAAYFGEALARRVFRFRPQPDSSLLDAAFADLLHAHFYESCPYLKFAHFTANQAILEAFAGCRRVHVVDFGIKQGMQWPALLQALALRPGGPPSFRLTGVGPPQPDETDALQQVGWKLAQFAHTIRVDFQYRGLVAATLADLEPFMLQPEGEEDPNEEPEVIAVNSVFEMHRLLAQPGALEKVLGTVRAVRPRIVTVVEQEANHNSGTFLDRFTESLHYYSTMFDSLEGGSSGGPSEVSSGAAAAPAAAGTDQVMSEVYLGRQICNVVACEGAERTERHETLGQWRNRLGNAGFETVHLGSNAYKQASTLLALFAGGDGYKVEEKEGCLTLGWHTRPLIATSAWRLAAP
misc feature complement(84344..84464)
/note=“Triticum aestivum TAA1b gene promoter region (partial part of promoter) AJ488930.1"
mobile element join(87177..87259,87365..87569,87870..87972,88010..88854)
/note=“TREP3530 Retrotransposon, LTR, Copia, RLC_Angela_B_consensus-1”
mobile element 90816..94499 /note=“TREP2376 Retrotransposon, LTR, Copia, RLC_Bianca_509D2-1”
TSD 94500..94504 /note=“ target site duplication of Retrotransposon, LTR, Gypsy, RLG_Carmilla_consensus-1", TREP3169"
LTR complement(94505..94996) /note=“ long terminal repeat of Retrotransposon, LTR, Gypsy, RLG_Carmilla_consensus-1", TREP3169"
mobile element complement(94997..107090) /note=“Retrotransposon, LTR, Gypsy, RLG_Carmilla_consensus-1", TREP3169"
LTR complement(107091..107576) /note=“ long terminal repeat of Retrotransposon, LTR, Gypsy, RLG_Carmilla_consensus-1", TREP3169"
TSD 107577..107581 /note=“ target site duplication of Retrotransposon, LTR, Gypsy, RLG_Carmilla_consensus-1", TREP3169"
TSD 107838..107842

Appendix III continued
267
/note=“ target site duplication of Retrotransposon, LTR, Copia, RLC_WIS_A_consensus-1”
LTR 107843..109620 /note=“ long terminal repeat of Retrotransposon, LTR, Copia, RLC_WIS_A_consensus-1”
mobile element 109621..114681
/note=“Retrotransposon, LTR, Copia, RLC_WIS_A_consensus-1”
LTR 114682..116456 /note=“ long terminal repeat of Retrotransposon, LTR, Copia, RLC_WIS_A_consensus-1”
TSD 116457..116461 /note=“ target site duplication of Retrotransposon, LTR, Copia, RLC_WIS_A_consensus-1”
mobile element 116462..117037 /note=“TREP2376 Retrotransposon, LTR, Copia, RLC_Bianca_509D2-1”
misc feature 129602..130183 /predicted gene
//note=“homology with wEST CK209908 (homeobox protein DLX-2 related cluster) and CK209889 (Cluster related to UPI000037F185; COG3434: Predicted signal transduction protein containing EAL and modified HD-GYP domains)”
mobile element complement(131306..136997,138462..144668) /note=“TREP3414 DNA transposon, TIR, CACTA, "DTC_Clifford_consensus-1"
gap 137254..137255 /note: “estimated sequence gap of 500 bp or less”
mobile element complement(145672..149405)
/note=“TREP3458 Retrotransposon, LTR, Gypsy, RLG_Jeli_consensus-1”
mobile element 149796..152280 /note=“TREP3529 Retrotransposon, LTR, Copia, RLC_Angela_A_consensus-1”
gap 150952..150953
/note: “estimated sequence gap of 500 bp or less”
mobile element 152282..153987 /note=“TREP3251 Retrotransposon, LTR, Gypsy, RLG_Sabrina_D_AY146588-2”
mobile element 154120..154372 /note=“TREP3245 Retrotransposon, LTR, Gypsy, RLG_Sabrina_B_AY368673-1”
TSD 154388..154392 /note=“target site duplication of TREP3529 Retrotransposon, LTR, Copia, RLC_Angela_A_consensus-1”
LTR 154393..156111
/note=“ long terminal repeat of "TREP3529 Retrotransposon, LTR, Copia, RLC_Angela_A_consensus-1”
mobile element 156112..161363 /note=“TREP3529 Retrotransposon, LTR, Copia, RLC_Angela_A_consensus-1"
LTR 161364..163084

Appendix III continued
268
/note=“ long terminal repeat of TREP3529 Retrotransposon, LTR, Copia, RLC_Angela_A_consensus-1"
TSD 163085..163089 /note=“target site duplication of TREP3529 Retrotransposon, LTR, Copia, RLC_Angela_A_consensus-1"
mobile element 163090..163481 /note=“TREP3245 Retrotransposon, LTR, Gypsy, RLG_Sabrina_B_AY368673-1"
mobile element 163573..164257 /note=“TREP3251 Retrotransposon, LTR, Gypsy, RLG_Sabrina_D_AY146588-2"

Appendix III continued
269
(B) DEFINITION: Triticum aestivum clone BAC 1417_F16 genomic sequence (187310 bp); ACCESSION: Chinese Spring Rht-B1a repeat region 1..1327
/note="TREP3529 Retrotransposon, LTR, Copia, RLC_Angela_A_consensus-1" LTR 1328..2396
/note="long terminal repeat of TREP3269 Retrotransposon, LTR, Gypsy, RLG_WHAM_consensus-1"
misc feature 4056..4057
/note: “estimated sequence gap of 500 bp or less” mobile element 4130..4383
/note="TREP3269 Retrotransposon, LTR, Gypsy, RLG_WHAM_consensus-1" repeat region complement(4410..6026)
/note="TREP3189 Retrotransposon, LTR, Gypsy, RLG_Fatima_consensus-1” LTR 6401..7823
/note="long terminal repeat of TREP3269 Retrotransposon, LTR, Gypsy, RLG_WHAM_consensus-1"
LTR 6416..14539
/note="TREP3269 Retrotransposon, LTR, Gypsy, RLG_WHAM_consensus-1" mobile element 8027..9008
/note="TREP3269 Retrotransposon, LTR, Gypsy, RLG_WHAM_consensus-1" LTR 14540..15605
/note="TREP3269 Retrotransposon, LTR, Gypsy, RLG_WHAM_consensus-1" mobile element complement(15949..17397)
/note="TREP3276 Retrotransposon, LTR, unknown, RLX_Gujog_10k23-3" mobile element complement(17399..19953, 22509..22749)
/note="TREP1241 DNA transposon, TIR, CACTA, DTC_TAT2_231A16-1" mobile element complement(22751..23280)
/note="TREP3276 Retrotransposon, LTR, unknown, RLX_Gujog_10k23-3" LTR 23294..24251
/note="long terminal repeat of TREP3269 Retrotransposon, LTR, Gypsy, "RLG_WHAM_consensus-1"
mobile element 24252..32500
/note="TREP3269 Retrotransposon, LTR, Gypsy, RLG_WHAM_consensus-1" LTR 29050..30121
/note="long terminal repeat of TREP3269 Retrotransposon, LTR, Gypsy, "RLG_WHAM_consensus-1"
mobile element 32545..32701
/note="TREP3173 Retrotransposon, LTR, Gypsy, RLG_Derami_AY368673-1" TSD 33520..33524
/note=”target site duplication of TREP1527 Retrotransposon, LTR, Copia, "RLC_Inga_AY661558-2”
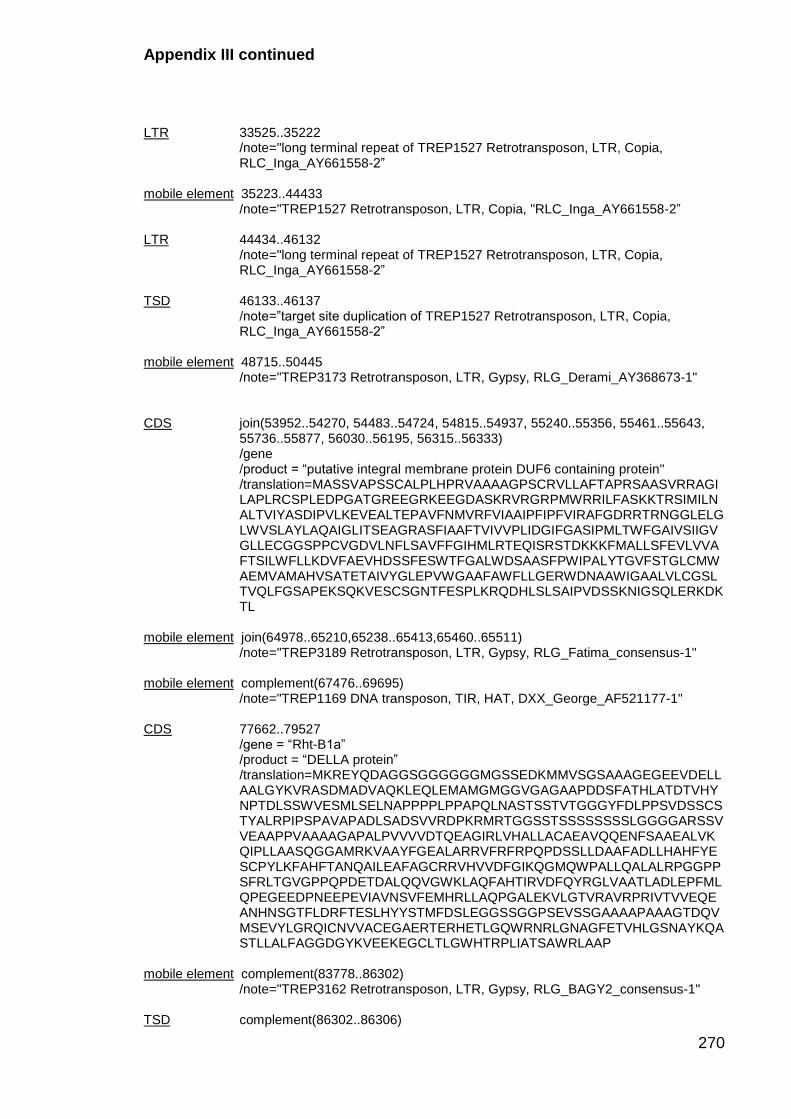
Appendix III continued
270
LTR 33525..35222
/note="long terminal repeat of TREP1527 Retrotransposon, LTR, Copia, RLC_Inga_AY661558-2”
mobile element 35223..44433
/note="TREP1527 Retrotransposon, LTR, Copia, "RLC_Inga_AY661558-2” LTR 44434..46132
/note="long terminal repeat of TREP1527 Retrotransposon, LTR, Copia, RLC_Inga_AY661558-2”
TSD 46133..46137
/note=”target site duplication of TREP1527 Retrotransposon, LTR, Copia, RLC_Inga_AY661558-2”
mobile element 48715..50445
/note="TREP3173 Retrotransposon, LTR, Gypsy, RLG_Derami_AY368673-1" CDS join(53952..54270, 54483..54724, 54815..54937, 55240..55356, 55461..55643,
55736..55877, 56030..56195, 56315..56333) /gene /product = “putative integral membrane protein DUF6 containing protein" /translation=MASSVAPSSCALPLHPRVAAAAGPSCRVLLAFTAPRSAASVRRAGILAPLRCSPLEDPGATGREEGRKEEGDASKRVRGRPMWRRILFASKKTRSIMILNALTVIYASDIPVLKEVEALTEPAVFNMVRFVIAAIPFIPFVIRAFGDRRTRNGGLELGLWVSLAYLAQAIGLITSEAGRASFIAAFTVIVVPLIDGIFGASIPMLTWFGAIVSIIGVGLLECGGSPPCVGDVLNFLSAVFFGIHMLRTEQISRSTDKKKFMALLSFEVLVVAFTSILWFLLKDVFAEVHDSSFESWTFGALWDSAASFPWIPALYTGVFSTGLCMWAEMVAMAHVSATETAIVYGLEPVWGAAFAWFLLGERWDNAAWIGAALVLCGSLTVQLFGSAPEKSQKVESCSGNTFESPLKRQDHLSLSAIPVDSSKNIGSQLERKDKTL
mobile element join(64978..65210,65238..65413,65460..65511)
/note="TREP3189 Retrotransposon, LTR, Gypsy, RLG_Fatima_consensus-1" mobile element complement(67476..69695)
/note="TREP1169 DNA transposon, TIR, HAT, DXX_George_AF521177-1" CDS 77662..79527
/gene = “Rht-B1a” /product = “DELLA protein” /translation=MKREYQDAGGSGGGGGGMGSSEDKMMVSGSAAAGEGEEVDELLAALGYKVRASDMADVAQKLEQLEMAMGMGGVGAGAAPDDSFATHLATDTVHYNPTDLSSWVESMLSELNAPPPPLPPAPQLNASTSSTVTGGGYFDLPPSVDSSCSTYALRPIPSPAVAPADLSADSVVRDPKRMRTGGSSTSSSSSSSSLGGGGARSSVVEAAPPVAAAAGAPALPVVVVDTQEAGIRLVHALLACAEAVQQENFSAAEALVKQIPLLAASQGGAMRKVAAYFGEALARRVFRFRPQPDSSLLDAAFADLLHAHFYESCPYLKFAHFTANQAILEAFAGCRRVHVVDFGIKQGMQWPALLQALALRPGGPPSFRLTGVGPPQPDETDALQQVGWKLAQFAHTIRVDFQYRGLVAATLADLEPFMLQPEGEEDPNEEPEVIAVNSVFEMHRLLAQPGALEKVLGTVRAVRPRIVTVVEQEANHNSGTFLDRFTESLHYYSTMFDSLEGGSSGGPSEVSSGAAAAPAAAGTDQVMSEVYLGRQICNVVACEGAERTERHETLGQWRNRLGNAGFETVHLGSNAYKQASTLLALFAGGDGYKVEEKEGCLTLGWHTRPLIATSAWRLAAP
mobile element complement(83778..86302)
/note="TREP3162 Retrotransposon, LTR, Gypsy, RLG_BAGY2_consensus-1" TSD complement(86302..86306)

Appendix III continued
271
/note=”target site duplication of TREP3198 Retrotransposon, LTR, Gypsy, RLG_Fatima_B_consensus-1"
LTR complement(86307..86776)
/note=”long terminal repeat of TREP3198 Retrotransposon, LTR, Gypsy, RLG_Fatima_B_consensus-1"
mobile element complement(86777..94987)
/note="TREP3198 Retrotransposon, LTR, Gypsy, RLG_Fatima_B_consensus-1" LTR complement(94988..95457)
/note=”long terminal repeat of TREP3198 Retrotransposon, LTR, Gypsy, RLG_Fatima_B_consensus-1"
TSD complement(95458..95462)
/note=”target site duplication of TREP3198 Retrotransposon, LTR, Gypsy, RLG_Fatima_B_consensus-1"
mobile element complement(96203..101007)
/note="TREP3162 Retrotransposon, LTR, Gypsy, RLG_BAGY2_consensus-1” mobile element 101008..105203
/note="TREP3174 Retrotransposon, LTR, Gypsy, RLG_Egug_EF067844-16" TSD 105204..105208
/note=target site duplication of TREP3198 Retrotransposon, LTR, Gypsy, RLG_Fatima_B_consensus-1"
LTR 105209..105681
/note=long terminal repeat of TREP3198 Retrotransposon, LTR, Gypsy, RLG_Fatima_B_consensus-1"
mobile element 105682..113822
/note="TREP3198 Retrotransposon, LTR, Gypsy, RLG_Fatima_B_consensus-1" LTR 113823..114295
/note=long terminal repeat of TREP3198 Retrotransposon, LTR, Gypsy, RLG_Fatima_B_consensus-1"
TSD 114296..114300
/note=target site duplication of TREP3198 Retrotransposon, LTR, Gypsy, RLG_Fatima_B_consensus-1"
mobile element complement(114924..116763)
/note="TREP3530 Retrotransposon, LTR, Copia, RLC_Angela_B_consensus-1" mobile element 116802..117559
/note="TREP3239 Retrotransposon, LTR, Gypsy, RLG_Sabrina_consensus-1" mobile element complement(117572..121727)
/note="TREP3530 Retrotransposon, LTR, Copia, RLC_Angela_B_consensus-1" mobile element complement(122513..124825)
/note="TREP3202 Retrotransposon, LTR, Gypsy, RLG_Ifis_59e04-1" mobile element 125058..128027
/note="TREP3026 DNA transposon, TIR, CACTA, DTC_Jorge_59e04-1" misc feature complement(130587..130961)
/note= “similarity to EF396184.1: Triticum aestivum clone MML-002 HMW glutenin seed storage protein gene, promoter region"

Appendix III continued
272
mobile element complement(132413..133098)
/note="TREP2092 Retrotransposon, LTR, Copia, "RLC_TAR2_AY853252-1"
mobile element complement(134460..134642) /note="TREP3445 DNA transposon, TIR, Harbinger, DTH_Kerberos_consensus-
1" mobile element complement(140571..141797)
/note="TREP3254 Retrotransposon, LTR, Gypsy, RLG_Sakura_10k23-4" misc feature 141823..141824
/note: “estimated sequence gap of 500 bp or less” mobile element 144536..148325
/note="TREP3026 DNA transposon, TIR, CACTA, DTC_Jorge_59e04-1" LTR 148329..150041
/note="long terminal repeat ofTREP3161 Retrotransposon, LTR, Copia, "RLC_WIS_B_consensus-1"
mobile element 150042..155357
/note="TREP3161 Retrotransposon, LTR, Copia, RLC_WIS_B_consensus-1" LTR 155358..157073
/note="long terminal repeat ofTREP3161 Retrotransposon, LTR, Copia, RLC_WIS_B_consensus-1"
mobile element 158258..160454
/note="TREP3026 DNA transposon, TIR, CACTA, DTC_Jorge_59e04-1" mobile element complement(160627..161634)
/note="TREP1418 Retrotransposon, LTR, Gypsy, RLG_Ifis_AY368673-1" mobile element complement(162142..163087)
/note="TREP3169 Retrotransposon, LTR, Gypsy, RLG_Carmilla_consensus-1” mobile element complement(164294..164994)
/note="TREP1418 Retrotransposon, LTR, Gypsy, RLG_Ifis_AY368673-1" mobile element 165214..166778
/note="TREP3254 Retrotransposon, LTR, Gypsy, RLG_Sakura_10k23-4" mobile element complement(166779..171095)
/note="TREP3202 Retrotransposon, LTR, Gypsy, RLG_Ifis_59e04-1" mobile element complement(179640..181027)
/note="TREP3202 Retrotransposon, LTR, Gypsy, RLG_Ifis_59e04-1" mobile element complement(181409..183300)
/note="TREP3529 Retrotransposon, LTR, Copia, RLC_Angela_A_consensus-1" mobile element 183301..184837
/note="TREP1438 Retrotransposon, LTR, Gypsy, RLG_Wilma_AY494981-2" mobile element complement(184838..187310)
/note="TREP3529 Retrotransposon, LTR, Copia, RLC_Angela_A_consensus-1.

Appendix III continued
273
(D) DEFINITION: Triticum aestivum clone BAC 0155_I24 genomic sequence (213794 bp); ACCESSION: Chinese Spring Rht-D1a mobile element 1..1989
/note="TREP3530 Retrotransposon, LTR, Copia, RLC_Angela_B_consensus-1" misc_feature 3378..3490
/note="similarity to wEST CB307615 (HFIG600 Hessian fly infested cDNA library Triticum aestivum cDNA, mRNA sequence). Partial hit"
mobile element complement(4094..4810)
/note="TREP3067 DNA transposon, TIR, Mutator, DTM_Remus_consensus-1" mobile element complement(5527..5681)
/note="TREP99 Retrotransposon, LTR, Gypsy, RLG_Cereba_AY040832-2"
CDS complement(6381..6459, 6557..6636, 6753..6833, 6944..7013, 7142..7216, 8483..8688, 9027..9276, 9354..9399, 9998..10067, 12454..12523, 13468..13552, 13643..13727, 13836..13926, 14545..14678) /gene /product = “putative zinc-finger protein gene”
/translation=MQRRRAQTWAGVGKTAQAAAAHAALFCFTLLLALRVDGRTDSSWWIIFIPLWLFHGVAARGRFSMPAPSLPHGRHWAPCHSVVAAPLLIAFELLLCIYLESLRVKNHPAVDMKIVFLPLLTFEVIILVDNFRMCKALMPGDEESMSDEAIWETLPHFWVAISMVFLIAATTFTLLKLSGDVGALGWWDLFINYGIAECFAFLVCTRWFNPMIHRPPTHGEASSSSSAIRYRDWESGLVLPSLEDHEQERICGLPDIGGHLMKIPLVVFQVLLCMRLEGTPPSARYIPIFALFSPLFILQGAGVLFSIGRLVEKLVLLLRNGPVSPNYLTVSSKVRDCFAFLHHGSRLLGWWSIDEGSKEEQARLFYTESNGYNTFSGYPPEVVKKMPKKDLAEEVWRLQAALGEQSEITKSTQQEYERLQNEKVLCRICYEGEICMVILPCRHRTLCKSCAEKCKRCPICRNPIEERMAVYDV
mobile element complement(9595..9679)
/note="TREP3081 DNA transposon, TIR, Mariner, DTT_Athos_consensus-1" mobile element complement(10410..10509)
/note="TREP3092 DNA transposon, TIR, Mariner, DTT_Icarus_consensus-1" mobile element complement(12901..12991)
/note="TREP3100 DNA transposon, TIR, Mariner, DTT_Tantalos_42j2-1" mobile element 16775..17025
/note="TREP1318 DNA transposon, TIR, CACTA, DTC_TAT1_AF459088-1" mobile element complement(17197..18714)
/note="TREP3246 Retrotransposon, LTR, Gypsy, RLG_Sabrina_C_210J24-2 mobile element 18879..19283
/note="TREP3178 Retrotransposon, LTR, Gypsy, RLG_Erika_consensus-1" gap 19776..19777
/note: “estimated sequence gap of 500 bp or less” mobile element 20095..23277
/note="TREP3178 Retrotransposon, LTR, Gypsy, RLG_Erika_consensus-1." mobile element complement(23283..23763)
/note="TREP3254 Retrotransposon, LTR, Gypsy, RLG_Sakura_10k23-4" mobile element complement(23979..24584)

Appendix III continued
274
/note="TREP3269 Retrotransposon, LTR, Gypsy, RLG_WHAM_consensus-1" mobile element complement(24744..25118)
/note="TREP3254 Retrotransposon, LTR, Gypsy, RLG_Sakura_10k23-4" mobile element complement(25144..29355)
/note="TREP3246 Retrotransposon, LTR, Gypsy, RLG_Sabrina_C_210J24-2" mobile element complement(29356..34389)
/note="TREP3530 Retrotransposon, LTR, Copia, RLC_Angela_B_consensus-1" CDS join(40731..41061, 41431..41672, 41762..41884, 42195..42311, 42415..42597,
42693..42834, 42987..43152, 43275..43293) /gene /product = “putative integral membrane protein DUF6 containing protein"
/translation=MASSLAPASCALPLHPRVATAAAAAAGPSCRVLLAFTAPRSAASVRRAGILAPLRCSPLEDPGATGREEGGKEKGGVSKRVHGRPMWRRILFASKKTRSIMILNALTVIYASDIPVLKEVEALTEPAVFNMVRFVIAAIPFIPFVIRAFGDRRTRNGGLELGVWVSLAYLAQAIGLITSEAGRASFIAAFTVIVVPLIDGIFGASIPMLTWFGAIVSVIGVGLLECGGSPPCVGDVLNFLSAVFFGIHMLRTEQISRSTDKKKFMALLSFEVLVVALTSIIWFLLKDAFVEVHDSSFESWTFGTLWDSAASFPWIPALYTGVFSTGLCMWAEMVAMAHVSATETAIVYGLEPVWGATFAWFLLGERWDNAAWIGAALVLCGSLTVQLFGSAPEKSQKVESRSGNTFESPLKRQERLSLSAIPVDSRKNIGSQLERKDKTL
mobile element complement(41201..41363)
/note="TREP3107 DNA transposon, TIR, Mariner, DTT_Thalos_consensus-1; Stowaway"
mobile element 46153..49507
/note="TREP3322 Retrotransposon, LINE, unknown, RIX_Reina_EF540321-1" mobile element complement(56211..57797)
/note="TREP3454 Retrotransposon, LINE, unknown, RIX_Karin_consensus-1" mobile element complement(57798..60125)
/note="TREP1241 DNA transposon, TIR, CACTA, DTC_TAT2_231A16-1" gap 61082..61083
/note: “estimated sequence gap of 500 bp or less” mobile element complement(61496..63562)
/note="TREP3454 Retrotransposon, LINE, unknown, RIX_Karin_consensus-1" TSD complement(64339..64343)
/note="target site duplication of TREP3160 Retrotransposon, LTR, Copia, RLC_WIS_A_consensus-1"
LTR complement(64344..66150)
/note="long terminal repeat of TREP3160 Retrotransposon, LTR, Copia, RLC_WIS_A_consensus-1"
mobile element complement(66151..67924)
/note="TREP3160 Retrotransposon, LTR, Copia, RLC_WIS_A_consensus-1" LTR complement(67925..69464)
/note="long terminal repeat of TREP3223 Retrotransposon, LTR, Gypsy, RLG_Romani_10k23-3"
mobile element complement(69629..70930)
/note="TREP238 Retrotransposon, LINE, unknown, RIX_Isabelle_AF326781-1"
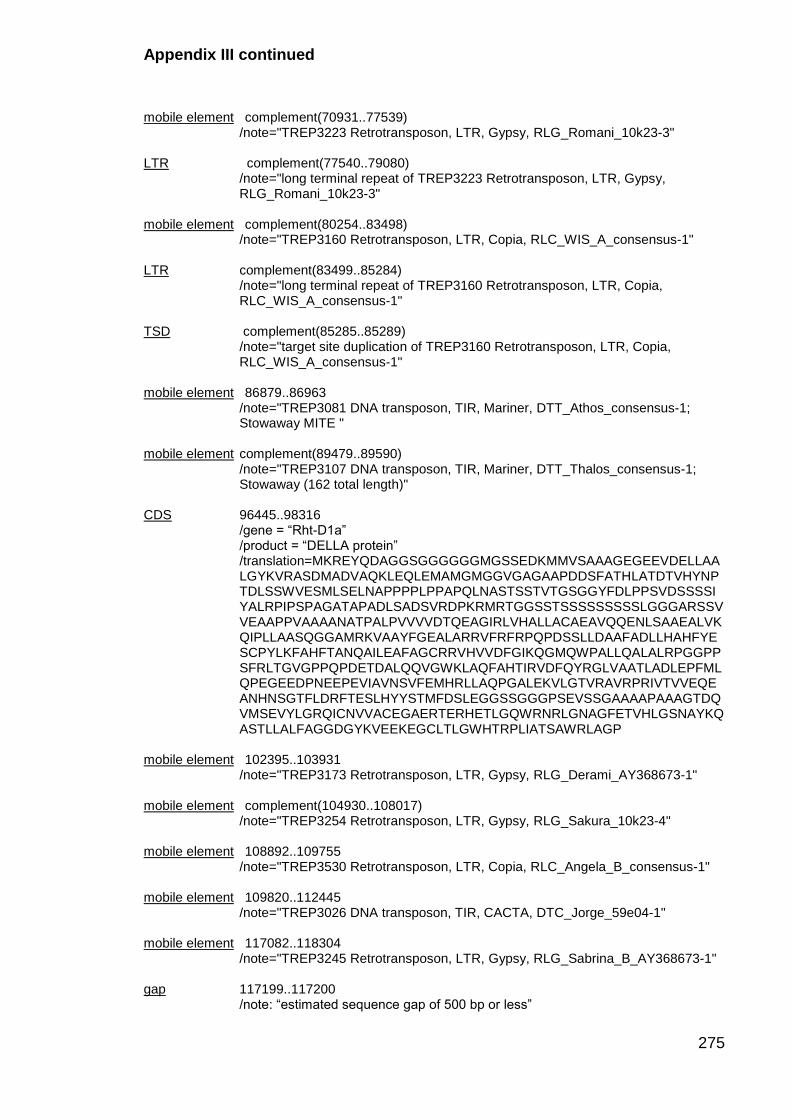
Appendix III continued
275
mobile element complement(70931..77539)
/note="TREP3223 Retrotransposon, LTR, Gypsy, RLG_Romani_10k23-3" LTR complement(77540..79080)
/note="long terminal repeat of TREP3223 Retrotransposon, LTR, Gypsy, RLG_Romani_10k23-3"
mobile element complement(80254..83498)
/note="TREP3160 Retrotransposon, LTR, Copia, RLC_WIS_A_consensus-1" LTR complement(83499..85284)
/note="long terminal repeat of TREP3160 Retrotransposon, LTR, Copia, RLC_WIS_A_consensus-1"
TSD complement(85285..85289)
/note="target site duplication of TREP3160 Retrotransposon, LTR, Copia, RLC_WIS_A_consensus-1"
mobile element 86879..86963
/note="TREP3081 DNA transposon, TIR, Mariner, DTT_Athos_consensus-1; Stowaway MITE "
mobile element complement(89479..89590)
/note="TREP3107 DNA transposon, TIR, Mariner, DTT_Thalos_consensus-1; Stowaway (162 total length)"
CDS 96445..98316
/gene = “Rht-D1a” /product = “DELLA protein” /translation=MKREYQDAGGSGGGGGGMGSSEDKMMVSAAAGEGEEVDELLAALGYKVRASDMADVAQKLEQLEMAMGMGGVGAGAAPDDSFATHLATDTVHYNPTDLSSWVESMLSELNAPPPPLPPAPQLNASTSSTVTGSGGYFDLPPSVDSSSSIYALRPIPSPAGATAPADLSADSVRDPKRMRTGGSSTSSSSSSSSSLGGGARSSVVEAAPPVAAAANATPALPVVVVDTQEAGIRLVHALLACAEAVQQENLSAAEALVKQIPLLAASQGGAMRKVAAYFGEALARRVFRFRPQPDSSLLDAAFADLLHAHFYESCPYLKFAHFTANQAILEAFAGCRRVHVVDFGIKQGMQWPALLQALALRPGGPPSFRLTGVGPPQPDETDALQQVGWKLAQFAHTIRVDFQYRGLVAATLADLEPFMLQPEGEEDPNEEPEVIAVNSVFEMHRLLAQPGALEKVLGTVRAVRPRIVTVVEQEANHNSGTFLDRFTESLHYYSTMFDSLEGGSSGGGPSEVSSGAAAAPAAAGTDQVMSEVYLGRQICNVVACEGAERTERHETLGQWRNRLGNAGFETVHLGSNAYKQASTLLALFAGGDGYKVEEKEGCLTLGWHTRPLIATSAWRLAGP
mobile element 102395..103931
/note="TREP3173 Retrotransposon, LTR, Gypsy, RLG_Derami_AY368673-1" mobile element complement(104930..108017)
/note="TREP3254 Retrotransposon, LTR, Gypsy, RLG_Sakura_10k23-4" mobile element 108892..109755
/note="TREP3530 Retrotransposon, LTR, Copia, RLC_Angela_B_consensus-1" mobile element 109820..112445
/note="TREP3026 DNA transposon, TIR, CACTA, DTC_Jorge_59e04-1" mobile element 117082..118304
/note="TREP3245 Retrotransposon, LTR, Gypsy, RLG_Sabrina_B_AY368673-1" gap 117199..117200
/note: “estimated sequence gap of 500 bp or less”

Appendix III continued
276
mobile element 120007..125187 /note="TREP766 DNA transposon, TIR, CACTA, DTC_Jorge_231A16-1"
mobile element 128763..142057
/note="TREP3169 Retrotransposon, LTR, Gypsy, RLG_Carmilla_consensus-1" mobile element complement(143540..143957)
/note="TREP232 DNA transposon, TIR, Mutator, "DTM_Deimos_AF326781-1" TSD 144835..144839
/note="target site duplication of TREP3254 Retrotransposon, LTR, Gypsy, RLG_Sakura_10k23-4"
LTR 144840..146387
/note="long terminal repeat of TREP3254 Retrotransposon, LTR, Gypsy, RLG_Sakura_10k23-4"
mobile element 146388..150379
/note="TREP3254 Retrotransposon, LTR, Gypsy, RLG_Sakura_10k23-4" LTR 150380..151924
/note="long terminal repeat of TREP3254 Retrotransposon, LTR, Gypsy, RLG_Sakura_10k23-4"
TSD 151925..151929
/note="target site duplication of TREP3254 Retrotransposon, LTR, Gypsy, RLG_Sakura_10k23-4"
mobile element 152199..154346
/note="TREP766 DNA transposon, TIR, CACTA, DTC_Jorge_231A16-1" mobile element 154347..164446
/note="TREP3529 Retrotransposon, LTR, Copia, RLC_Angela_A_consensus-1" TSD complement(164447..164451)
/note="target site duplication of TREP2318 Retrotransposon, LTR, Gypsy, RLG_Nusif_AY494981-1"
LTR complement(164452..165358)
/note="long terminal repeat of TREP2318 Retrotransposon, LTR, Gypsy, RLG_Nusif_AY494981-1"
mobile element complement(165359..170921)
/note="TREP2318 Retrotransposon, LTR, Gypsy, RLG_Nusif_AY494981-1" LTR complement(170922..171828)
/note="long terminal repeat of TREP2318 Retrotransposon, LTR, Gypsy, RLG_Nusif_AY494981-1"
TSD complement(171829..171833)
/note="target site duplication of TREP2318 Retrotransposon, LTR, Gypsy, RLG_Nusif_AY494981-1"
mobile element 172111..182151
/note="TREP3189 Retrotransposon, LTR, Gypsy, RLG_Fatima_consensus-1" mobile element 182152..183849
/note="TREP3530 Retrotransposon, LTR, Copia, RLC_Angela_B_consensus-1" mobile element 184035..185556
/note="TREP3250 Retrotransposon, LTR, Gypsy, RLG_Sabrina_D_115G1-2"

Appendix III continued
277
mobile element 185578..186361
/note="TREP3530 Retrotransposon, LTR, Copia, RLC_Angela_B_consensus-1" mobile element 186885..191025
/note="TREP3250 Retrotransposon, LTR, Gypsy, RLG_Sabrina_D_115G1-2" mobile element 191026..192740
/note="TREP3530 Retrotransposon, LTR, Copia, RLC_Angela_B_consensus-1" mobile element 192907..194501
/note="TREP3250 Retrotransposon, LTR, Gypsy, RLG_Sabrina_D_115G1-2" mobile element complement(194520..197112)
/note="TREP3269 Retrotransposon, LTR, Gypsy, RLG_WHAM_consensus-1" mobile element 198781..200347
/note="TREP3250 Retrotransposon, LTR, Gypsy, RLG_Sabrina_D_115G1-2" LTR 200367..200848
/note="long terminal repeat of TREP3254 Retrotransposon, LTR, Gypsy, RLG_Sakura_10k23-4"
mobile element 200849..206357
/note="TREP3254 Retrotransposon, LTR, Gypsy, RLG_Sakura_10k23-4" LTR 206358..206839
/note="long terminal repeat of TREP3254 Retrotransposon, LTR, Gypsy, RLG_Sakura_10k23-4"
mobile element 207589..213064
/note="TREP3456 Retrotransposon, LTR, Copia, RLC_Barbara_consensus-1"

Appendix IV. Poaceae orthologues in the Rht region
278
Genea Genomeb Strand Locus Name/Numberc Sequence locationd
Start
coord.
relative
Rht-1 e
End
coord.
relative
Rht-1
Exons
(no.)
ORF
(nt)f
ORF +
Introns
(nt)
Amino
acids
(no.)
Tb1 B. distachyon plus Bradi1g11060 Chr1:8129288..8130445 -56466 -55309 1 1158 1158 385
ZnF B. distachyon minus Bradi1g11070 Chr1:8149832..8164731 -35921 -21022 14 1425 14900 474
DUF6 B. distachyon plus Bradi1g11080 Chr1:8168243..8171632 -17510 -14121 8 1320 3390 439
Rht-1 B. distachyon plus Bradi1g11090 Chr1:8185754..8187625 1 1872 1 1872 1872 623
Bradi1g11100 B. distachyon plus Bradi1g11100 Chr1:8201693..8203891 15939 18137 2 423 2199 140
Toc64 B. distachyon minus Bradi1g11110 Chr1:8215229..8225462 29475 39708 13 1767 10234 588
DUF6 H. vulgare EST derived NA n/a n/a 8 1308 n/a 435
Rht-1 H. vulgare AF460219 (SLN1) NA n/a n/a 1 1857 1857 618
ZnF H. vulgare EST derived NA n/a n/a 14 1422 n/a 473
Tb1 O. sativa plus Os03g49880 Chr3:28422062..28423228 -83862 -82696 1 1167 1167 388
ZnF O. sativa minus Os03g49900 Chr3:28449229..28442280 -63643 -56694 14 1422 6950 473
DUF6 O. sativa plus Os03g49940 Chr3:28463889..28466335 -42034 -39588 8 1365 2447 454
LOC_Os03g49960 O. sativa minus Os03g49960 Chr3:28475938..28467680 -29986 -38244 19 1620 8259 539
Rht-1 O. sativa plus Os03g49990 (SLR1) Chr3:28505924..28507801 1 1878 1 1878 1878 625
Toc64 O. sativa minus Os03g50010 Chr3:28534130..28526495 20571 28206 13 1761 7636 586
Toc64 S. bicolor plus Sb01g010650 Chr1:9389669..9402483 -30546 -17732 13 1767 12815 588
Rht-1 S. bicolor minus Sb01g010660 Chr1:9420215..9422098 1 1884 1 1884 1884 627
DUF6 S. bicolor minus Sb01g010670 Chr1:9454427..9457360 34213 37146 8 1326 2934 441
ZnF S. bicolor plus Sb01g010680 Chr1:9471685..9478938 51471 58724 14 1422 7254 473
Tb1 S. bicolor minus Sb01g010690 Chr1:9506057..9507199 85842 86984 1 1143 1143 380
ZnF T. urartu A minus ZnF BAC_T.urartu:19834..28865 -39576 -30545 14 1422 9032 473
DUF6 T. urartu A plus DUF6 BAC_T.urartu:42927..45500 -16483 -13910 8 1323 2574 440
Rht-1 T. urartu A plus Rht-A1 BAC_T.urartu:59411..61273 1 1863 1 1863 1863 620
ZnF T. aestivum A (CS) minus ZnF BAC_0224_M10:24659..34552 -55088 -45195 14 1422 9894 473
DUF6 T. aestivum A (CS) plus DUF6 BAC_0224_M10:48779..51352 -30968 -28395 8 1323 2574 440
Rht-1 T. aestivum A (CS) plus Rht-A1 BAC_0224_M10:79748..81610 1 1863 1 1863 1863 620
DUF6 T. aestivum B (CS) plus DUF6 BAC_1417_F16:53952..56333 -23709 -21328 8 1311 2382 436
Rht-1 T. aestivum B (CS) plus Rht-B1 BAC_1417_F16:77662..79527 1 1866 1 1866 1866 621

Appendix IV continued
279
a Orthologues of a given gene are grouped under a common gene name. Rht = Reduced height; DUF6 = Domain of Unknown Function 6 family gene ZnF =
Zinc finger family gene; Tb1 = Teosinte branched 1; Toc64 is a subunit of the pre-protein translocon of the outer envelope of chloroplasts. Other loci are named according to species’ convention. b For wheat species, genome from which the BAC sequence is derived is given after species name. For T. aestivum, clones were derived from Chinese
Spring (CS) or Aibai/10*CS. Z. mays sequences are from the B73 inbred with chromosome number indicated c H. vulgare Rht-1 is from Genbank accession AF460219. H. vulgare DUF6 is from the combined sequences of TA54310_4513 and GH226632, which do not
cover the full length of the gene (~165 bp shortcoming). ORF, ORF+Introns, and amino acid numbers are estimated. H. vulgare ZnF is from combined sequences of TA38367_4513, TA38365_4513, and TA38366_4513. Orthologous gene names are given in parenthesis if available. d Sequence location for BAC clones are relative to the beginning of the BAC sequence, otherwise chromosomal location is given if available
e Start and end coordinates are relative to the Rht-1 orthologue.
f ORF - open reading frame
Genea Genomeb Strand Locus Name/Numberc Sequence locationd
Start
coord.
relative
Rht-1 e
End
coord.
relative
Rht-1
Exons
(no.)
ORF
(nt)f
ORF +
Introns
(nt)
Amino
acids
(no.)
ZnF T. aestivum D (CS) minus ZnF BAC_0155_I24:6381..14678 -90063 -81766 14 1422 8298 473
DUF6 T. aestivum D (CS) plus DUF6 BAC_0155_I24:40731..43293 -55713 -53151 8 1323 2563 440
Rht-1 T. aestivum D (CS) plus Rht-D1 BAC_0155_I24:96445..98316 1 1872 1 1872 1872 623
ZnF T. aestivum D (Aibai/10*CS) minus ZnF BAC_1J9:108486..116784 -90235 -81937 14 1422 8299 473
DUF6 T. aestivum D (Aibai/10*CS) plus DUF6 BAC_1J9:142474..145036 -56247 -53685 8 1323 2563 440
Rht-1 T. aestivum D (Aibai/10*CS) plus Rht-D1 BAC_1J9:198722..200593 1 1872 1 1872 1872 623
Tb1 Z. mays (B73)_chr1 minus AC233950.1_FG002 Chr1:264847670..264848770 -351204 -350104 1 1101 1101 366
ZnF Z. mays (B73)_chr1 minus GRMZM2G704032 Chr1:265009869..265017820 -189004 -181053 14 1422 7952 473
DUF6 Z. mays (B73)_chr1 plus GRMZM2G093849 Chr1:265182866..265186162 -16007 -12711 8 1344 3297 447
Rht-1 Z. mays (B73)_chr1 plus GRMZM2G144744 (D8) Chr1:265198874..265200766 1 1893 1 1893 1893 630
GRMZM2G086003 Z. mays (B73)_chr1 minus GRMZM2G086003 Chr1:265398712..265402061 199838 203187 9 849 3350 282
GRMZM2G063355 Z. mays (B73)_chr5 minus GRMZM2G063355 Chr5:11681303..11683108 -55634 -53829 5 702 1804 233
Rht-1 Z. mays (B73)_chr5 minus GRMZM2G024973 (D9) Chr5:11736937..11738814 1 1878 1 1878 1878 625
ZnF Z. mays (B73)_chr5 plus GRMZM2G024690 Chr5:11773272..11782144 36336 45208 14 1419 8873 472
Tb1 Z. mays (B73)_chr5 minus AC190734.2_FG003 Chr5:11801898..11802977 64961 66040 1 1080 1080 359

Appendix V. Marker scores of the 'SS7010073 x Paragon' F5 population.
280
Indivi
dual
Xbarc
206-
4A
Xgwm
397-
4A
Xwmc
617-
4A
Xwmc
48-
4A
Xgwm
610-
4A
Rht-
A1
Xgpw
4545-
4A
Xwmc
161-
4A
Xwmc
89 -
4A
Xbarc
70 -
4A
Xwmc
420-
4A
Xwmc
617-
4A
Xgwm
44 -
4A
Xwmc
497-
4A
1 P - P P P P P P/S - S S P S S
2 P - P P P P P P/S - - - P S P
3 S S S S S S S S P P - S P P
4 S S S S S S S S S P P P P S
5 P S S S S S S S P P S S P S
6 P/S S S S S S S S P P P S S P
7 P - S S S S S S P - P S P P
8 P - P P P - - P P P S P P P
9 P S S S S S - S P P P S S S
10 P S S S S S S S S P P S S S
11 P P P P P P S P/S P S S P P P
12 P P P P P P P P P P S P S S
13 P S S S S S S S P P S S P S
14 S S S S S S S S S P P S P P
15 P P P P P P P P/S P/S P S P P P
16 P/S S S P P/S P/S P/S - P/S S P S S P
17 - - P P P P - P/S P P S P P P
18 - S S P P P P P P P S S S P
19 - S S S S S S S P - P S S S
20 - S S S S S S S P - P S P P
21 - P P P P P P P/S P/S P S P S P
22 - S S S S S S S S P P S S S
23 - - P P P P P P P S S P S P
24 - S S P P P P P/S P/S P S S S P
25 P S S S S S S S - P - S S P
26 P S P P P P P P - - P P P P
27 P P P P P P P P P/S - P P S P
28 P - S P P P/S P/S S P P P S P S
29 P P P P P P P P P - P P S P
30 P P P P P P P P P/S - P P S S
31 P S S S S S S S S - S S P P
32 P P P P P P P P/S P/S P/S S P S S
33 S S S S S S S S P P S S S P
34 S S S P S S P P/S P/S S P S P P
35 P P P P P P P - P - S P S S
36 P - P P P P P P P - - P S S
37 P P/S S S S S - S S P P S S S
38 S S S S S S S S P - P S S P
39 P S P P P P P P P/S P P P S P
40 P - P P P P P P/S P/S P - P P P
41 P P P P P P P/S P - P P P S P
42 S S S S S S S S P P S S S S
43 P S S S S S S S P P P S S P
44 P S S S S S S S P P S S P S
45 - P P P P P P - P P S P P S
46 P P P P P P P P/S P/S - P P P P
47 S - S P P P S S P P - S S P
48 P P P - P P P P/S P P S P P S
49 P - P P P P/S P P/S - - - S S P
50 P S S S S S S S S - S S P P
51 P - P P P P P P/S P/S P P P S P

Appendix V continued
281
a P = Paragon allele (yellow background); S = SS7010073 allele (blue background); P/S =
Paragon/SS7010073 heterozygote (grey background); the (-) in white background represents a result that was not scored. A count summary is shown in bold font at the bottom.
Indivi
dual
Xbarc
206-
4A
Xgwm
397-
4A
Xwmc
617-
4A
Xwmc
48-
4A
Xgwm
610-
4A
Rht-
A1
Xgpw
4545-
4A
Xwmc
161-
4A
Xwmc
89 -
4A
Xbarc
70 -
4A
Xwmc
420-
4A
Xwmc
617-
4A
Xgwm
44 -
4A
Xwmc
497-
4A
52 P S S - S S S S P S S S P S
53 - - P P P P P/S P/S P/S - P P P P
54 P S S S S S S S P P S S S S
55 S S S S S S S S S P/S S S S S
56 P - P P P P P P/S P/S P S P P P
57 S S S S S S S S S S P S - S
58 P P P P P/S P/S P/S P/S P/S P S P S P
59 P P P P P P P P P - - P S P
60 S S S S S S S S S S P S S S
61 S S S S S S S S S - P S P S
62 S S S S S S S S P P P S S S
63 P P P P P P P P/S P P P P P P
64 - S P S P P S - P - - P - -
65 S - S S S S S S - S S S S S
66 S P S S S S S S P S S S P S
67 P - S P P P P P P P S S S S
68 P S S S S S S S S P P S P S
69 S S S S S S S S S P S S P P
70 S S S S S S S S P P - S S P
71 S S S S S S S S P S P S S S
72 P - P P P P P P P P S P P S
73 P S S P P/S P/S P - - P P S S P
74 S S S S S S S S - P S S P P
75 P P P P P P P - P - P P S P
76 S S S S S S - - P P S S S S
77 P P P P P P - - P/S - - P P P/S
78 P S S S S S S S S - P S P S
79 P P P P P P P P/S P P - P P P
80 P S S S S S S S - P - S S P/S
81 P - S S S S P S - P/S - S S S
82 P - S P P/S P/S P P/S - P P S P P
83 P - P - P P P P/S - P/S - P P P
84 P - P P P P P P - P P P S P
85 P S S - P P - P - P/S - S S S
86 P/S - P P P P P P - P - P P S
87 P - P P P P P P - P P P S P
88 S - S S S S S S - S S S S S
89 - S S S S S - S - - S S S -
90 P S S S S S S S P S P S S S
91 P S S P P - - P P P S S S P
92 P P P P P P P P/S P P S P S P
93 P P P P P P P - P - S P S S
94 P P P - P P P/S P P P - P S P
P 58 23 41 47 47 43 39 20 45 52 38 41 37 50
S 21 46 53 42 43 43 40 43 14 13 38 53 55 40
P/S 3 1 0 0 4 6 6 22 16 5 0 0 0 2
- 12 24 0 5 0 2 9 9 19 24 18 0 2 2
Markera

Appendix VI. Summary of INRA BWCC phenotype and genotype results
282
gap
INRA BWCC
number Accession name Origind
Growth
habite
Year of
reg.f Type
Sowing
Date Rht-B1g Rht-D1h Ppd-D1i gap
Plant
height (cm)
Days to
headingj
GA trt
diff (mm)
INRA_00007 (95-13*BEZOSTAIA)3-3 FRA W NA fixed Nov-08 B1a_197 D1a D1a 104.5 139 18.1
INRA_00019 CH01193 CHE W NA fixed Nov-08 B1b D1a D1b 127 143 3.8
INRA_00092 11IWSWSN14 USA W NA fixed Nov-08 B1a_197 D1a D1b 134 140 33.7
INRA_00177 DI15 FRA W NA fixed Nov-08 B1a_0 D1a D1b 162 146 28.7
INRA_00234 DI182-9 FRA W NA fixed Nov-08 B1a_160 D1a D1b 137.5 144 35.2
INRA_00236 DI185 FRA W NA fixed Nov-08 B1a_0 D1a D1a 127.5 133 32.3
INRA_00338 DI276 FRA W NA fixed Nov-08 B1a_0 D1a D1a 120 123 16.2
INRA_00347 2838-39 BGR W NA fixed Nov-08 B1a_0 D1a D1a 118 132 16.3
INRA_00386 DI330 FRA W NA fixed Nov-08 B1a_0 D1a D1a 129 134 22.0
INRA_00419 DI37-12-2 FRA W NA fixed Nov-08 B1a_160 D1a D1b 127 141 25.0
INRA_00421 3716-1 BGR W NA fixed Nov-08 B1a_0 D1a D1a 114.5 136 30.5
INRA_00477 DI50-12 FRA W NA fixed Nov-08 B1a_160 D1a D1a 130.5 141 24.3
INRA_00514 6-1-3 EGY S NA fixed Feb-09 B1a_0 D1a D1b 135 138 19.8
INRA_00524 60293 NLD W NA fixed Nov-08 B1a_0 D1a D1b 123 140 32.3
INRA_00537 CH62022 CHE W NA fixed Nov-08 B1a_160 D1a D1b 113.5 144 19.6
INRA_00546 664-258-18 BGR W NA fixed Nov-08 B1b D1a D1a 102 126 12.2
INRA_00748 A.4 AFG W NA fixed Nov-08 B1a_0 D1a D1b 160 131 25.7
INRA_00776 ACADEMIE DE PEKIN CHN F NA fixed Feb-09 B1b D1a D1a 93 135 4.9
INRA_00794 ADMONTER AUT W after 1934 fixed Nov-08 B1a_0 D1a D1b 172 144 33.5
INRA_00797 ADULAR DEU W 1986 fixed Nov-08 B1a_197 D1a D1b 118.5 144 25.3
INRA_00800 AFRICA MAYO KEN S 1960 fixed Feb-09 B1a_0 D1a D1b 123 140 24.3
INRA_00822 AIFENG-4 CHN W 1971 fixed Nov-08 B1a_197 D1b D1a 86 119 13.9
INRA_00833 AKADARUMA JPN W 1924 fixed Nov-08 B1a_0 D1a D1a 125 133 47.5
INRA_00871 ALMA FRA W 1942 fixed Nov-08 B1a_0 D1a D1b 137.5 144 21.7
INRA_00901 AMIFORT FRA W 1991 fixed Nov-08 B1a_160/197 het D1b D1a 89.5 134 0.6
INRA_00912 ANDES-56 COL S 1956 fixed Feb-09 B1a_0 D1a D1a 121 139 40.5
Genotype Resultsb Phenotype Resultsc INRA BWCC accessionsa

Appendix VI continued
283
gap
INRA BWCC
number Accession name Origind
Growth
habite
Year of
reg.f Type
Sowing
Date Rht-B1g Rht-D1h Ppd-D1i gap
Plant
height (cm)
Days to
headingj
GA trt
diff (mm)
INRA_00933 APEX GBR S 1972 fixed Feb-09 B1a_160 D1a D1b 91.5 169 36.4
INRA_00957 ARAWA NZL W 1955 fixed Nov-08 B1a_197 D1a D1b 137 138 27.3
INRA_00964 ARCHE FRA W 1989 fixed Nov-08 B1a_197 D1a D1b 97.5 138 18.1
INRA_00983 ARGENT GBR W 1979 fixed Nov-08 B1a_197 D1b D1b 92 149 0.7
INRA_01005 ARKAS DEU S 1976 fixed Nov-08 B1a_0 D1a D1b 112 135 29.7
INRA_01032 ARROMANCHES FRA W 1962 fixed Nov-08 B1a_197 D1a D1b 119 144 36.0
INRA_01044 ARTOIS-DESPREZ FRA W 1957 fixed Nov-08 B1a_0 D1a D1b 121 145 29.2
INRA_01065 ATAKEDA-KOMUGI JPN W NA fixed Nov-08 B1a_0 D1a D1a 130 120 21.6
INRA_01080 ATUT-II AUT W 1974 fixed Nov-08 B1a_0 D1a D1b 119.5 146 23.0
INRA_01110 AURORE AUS S 1914 fixed Feb-09 B1a_0 D1a D1b 147 150 33.3
INRA_01113 AUSTRO BANKUT AUT S 1919 fixed Feb-09 B1a_0 D1a D1b 163 156 40.7
INRA_01177 BAHATANE-87 DZA S NA fixed Feb-09 B1a_0 D1a D1b 148 147 16.2
INRA_01182 BAIONETTE I ITA W after 1900 fixed Nov-08 B1a_0 D1a D1b 188.5 143 28.0
INRA_01192 BALKAN YUG W 1979 fixed Nov-08 B1a_0 D1a D1a 107 134 36.2
INRA_01217 BARANI-70 PAK S 1970 fixed Feb-09 B1a_0 D1b D1a 97.5 141 4.0
INRA_01232 BARBU DU FINISTERE FRA W NA landrace Nov-08 B1a_160 D1a D1b 171.5 142 24.7
INRA_01236 BARBU DU TRONCHET CHE W NA landrace Nov-08 B1a_0 D1a D1b 200.5 148 31.5
INRA_01244 BASS AUS S 1983 fixed Feb-09 B1b D1a D1a 90.5 140 6.5
INRA_01249 BAULMES CHE W NA fixed Nov-08 B1a_0 D1a D1b 181 149 37.5
INRA_01281 BEL ET BON FRA W NA fixed Nov-08 B1a_197 D1a D1b 114 149 23.0
INRA_01288 BELLYEI-590 HUN W NA fixed Nov-08 B1a_160 D1a D1b 179 139 17.5
INRA_01313 BENCHUNG NPL W NA fixed Nov-08 B1a_0 D1a D1b 153 124 36.3
INRA_01321 BENNI USA W 1980 fixed Nov-08 B1a_197 D1a D1a 136 130 29.3
INRA_01332 BERZATACA FIN W NA fixed Nov-08 B1a_160 D1a D1b 169.5 141 43.7
INRA_01357 BIRGITTA SWE W 1960 fixed Nov-08 B1a_160 D1a D1b 160.5 148 19.7
INRA_01400 BLANC PRECOCE FRA W NA fixed Nov-08 B1a_0 D1a D1b 162 145 34.2
INRA BWCC accessionsa Genotype Resultsb Phenotype Resultsc

Appendix VI continued
284
gap
INRA BWCC
number Accession name Origind
Growth
habite
Year of
reg.f Type
Sowing
Date Rht-B1g Rht-D1h Ppd-D1i gap
Plant
height (cm)
Days to
headingj
GA trt
diff (mm)
INRA_01402 BLASON FRA W 1976 fixed Nov-08 B1a_160 D1a D1a 105 142 31.3
INRA_01417 BLE D'OR FRA W NA landrace Nov-08 B1a_160 D1a D1b 124 146 20.3
INRA_01422 BLE DE CRETE FRA W NA landrace Nov-08 B1a_0 D1a D1b 171 144 39.0
INRA_01429 BLE DE HAIE FRA W NA landrace Nov-08 B1a_160 D1a D1b 165 151 20.0
INRA_01446 BLE DE MARAT BARBU FRA W NA landrace Nov-08 B1a_0 D1a D1b 176 147 24.3
INRA_01498 BLE DU ROUSSILLON FRA W NA landrace Nov-08 B1a_0 D1a D1b 176 137 24.3
INRA_01529 BLONDYNKA POL W 1920 fixed Nov-08 B1a_0 D1a D1b 180 153 29.3
INRA_01531 BLUEBOY USA W 1964 fixed Nov-08 B1b D1a D1b 110 141 5.8
INRA_01542 BODELLIN AUS S NA fixed Feb-09 B1a_0/197 het D1a D1a 105 141 29.2
INRA_01643 BT2277 TUN S after 1962 fixed Feb-09 B1a/b het D1a/b het D1a 118 139 27.3
INRA_01647 BT2281 TUN S after 1963 fixed Feb-09 B1a_0 D1b D1a 99.5 139 10.2
INRA_01655 BT2296 TUN W after 1964 fixed Nov-08 B1a_0 D1b D1a 110 120 -1.7
INRA_01660 BUCK ATLANTICO ARG S 1952 fixed Feb-09 B1a_0 D1a D1b 130 145 46.3
INRA_01676 BUCKBUCK'S' MEX S 1980 fixed Feb-09 B1a_0 D1b D1a 94 142 5.0
INRA_01696 BUNG EPI BARIOLE NPL W NA landrace Nov-08 B1a_0 D1a D1b 157 129 41.0
INRA_01697 BUNG EPI BLANC NPL W NA landrace Nov-08 B1a_0 D1a D1b 157 136 50.3
INRA_01747 114/62 AUT W NA fixed Nov-08 B1b D1a D1b 106.5 145 10.2
INRA_01768 CANDEAL DE AREVALO ESP W NA landrace Nov-08 B1a_0 D1a D1b 161.5 142 28.0
INRA_01774 CANUCK CAN S 1974 fixed Feb-09 B1a_0 D1a D1b 148.5 144 32.1
INRA_01885 CENAD 512 ROM W 1958 fixed Nov-08 B1a_0 D1a D1b 156 137 27.0
INRA_01899 CEREALOR FRA W 1964 fixed Nov-08 B1a_197 D1a D1b 109 138 24.3
INRA_01957 CF3003-2-7-4-4-3 FRA W NA fixed Nov-08 B1a_197 D1b D1b 113.5 141 -1.3
INRA_01974 CF4563-1-5-3-2-5 FRA W NA fixed Nov-08 B1b D1a D1b 94 135 2.2
INRA_02025 CH73052 CHE W NA fixed Nov-08 B1a_197 D1a D1b 123 145 28.7
INRA_02072 CHANATE MEX S 1971 fixed Feb-09 B1a_0 D1b D1a 99 138 0.7
INRA_02135 CHINESE SPRING CHN S NA landrace Feb-09 B1a_0 D1a D1b 136 145 38.5
INRA BWCC accessionsa Genotype Resultsb Phenotype Resultsc

Appendix VI continued
285
gap
INRA BWCC
number Accession name Origind
Growth
habite
Year of
reg.f Type
Sowing
Date Rht-B1g Rht-D1h Ppd-D1i gap
Plant
height (cm)
Days to
headingj
GA trt
diff (mm)
INRA_02141 CHIRKUNG NPL W NA fixed Nov-08 B1a_0 D1a D1b 156 128 32.5
INRA_02145 CHITLANG NPL W NA fixed Nov-08 B1a_0 D1a D1b/b het 148.5 127 47.0
INRA_02153 CHORTANDINKA RUS W NA fixed Nov-08 B1a_160 D1a D1b 145 150 22.8
INRA_02169
CHYAKSILA EPI NON
VELU NPL W NA landrace Nov-08 B1a_160 D1a D1b 139.5 137 39.8
INRA_02171 CHYAMTANG NPL W NA fixed Nov-08 B1a_0 D1a D1b 154 130 38.2
INRA_02289 COLLEGE ECLIPSE AUS S 1906 fixed Feb-09 B1a_0 D1a D1b 140 135 29.7
INRA_02301 COMET AUS S 1986 fixed Feb-09 B1b D1a D1b 96 142 8.3
INRA_02308 COMPTON USA W 1983 fixed Nov-08 B1a_0 D1b D1b 122 138 2.4
INRA_02330 COPPADRA TUR S NA fixed Feb-09 B1a_0 D1a D1b 156.5 137 28.3
INRA_02337 CORIN FRA W 1976 fixed Nov-08 B1a_197 D1a D1a 94.5 136 29.3
INRA_02345 CORSODOR FRA W 1987 fixed Nov-08 B1b D1a D1b 102 146 14.6
INRA_02353 COTIPORA BRA S 1965 fixed Feb-09 B1a_197 D1a D1a 164.5 150 34.7
INRA_02358 COURTOT FRA W 1974 fixed Nov-08 B1b D1b D1b 75 137 -14.7
INRA_02364 CP4 FRA W NA fixed Nov-08 B1a_197 D1a D1b 131 145 41.3
INRA_02399 D130-63 POL W NA fixed Nov-08 B1a_160 D1a D1b 175 149 23.7
INRA_02411 DAERAAD ZAF S 1958 fixed Feb-09 B1a_197 D1a D1b 130 142 33.5
INRA_02424 DANUBIA CZE W 1984 fixed Nov-08 B1b D1a D1a 95.5 145 15.5
INRA_02438 DAVIDOC FRA W 1986 fixed Nov-08 B1a_160 D1a D1a 111.5 137 42.0
INRA_02444 DAYKU NPL W NA fixed Nov-08 B1a_0 D1a D1b 155.5 131 28.0
INRA_02475 DETENICKA CERVENA CZE W 1937 fixed Nov-08 B1a_160 D1a D1b 188.5 146 28.0
INRA_02481 DH8701 FRA W NA fixed Nov-08 B1a_160 D1a D1a 101 138 27.2
INRA_02485 DHOJE NPL W NA fixed Nov-08 B1a_0 D1a D1b 141 125 32.8
INRA_02489 DI6402-34-2-4 FRA W NA fixed Nov-08 B1a_0 D1a D1b 107.5 149 29.3
INRA_02491 DI6404-19-15 FRA W NA fixed Nov-08 B1a_197 D1a D1a 112.5 137 21.3
INRA_02507 DI7003-1-12 FRA W NA fixed Nov-08 B1a_160 D1a D1a 112 139 22.3
INRA_02508 DI7005-113-3 FRA W NA fixed Nov-08 B1b D1b D1b 81.5 141 6.3
INRA BWCC accessionsa Genotype Resultsb Phenotype Resultsc

Appendix VI continued
286
gap
INRA BWCC
number Accession name Origind
Growth
habite
Year of
reg.f Type
Sowing
Date Rht-B1g Rht-D1h Ppd-D1i gap
Plant
height (cm)
Days to
headingj
GA trt
diff (mm)
INRA_02526 DI7202-103 FRA W NA fixed Nov-08 B1b D1b D1b 71 144 0.7
INRA_02534 DI7210-15-11 FRA W NA fixed Nov-08 B1b D1a D1b 78.5 152 4.3
INRA_02536 DI7215-100 FRA W NA fixed Nov-08 B1a_0 D1a D1a 118.5 140 34.3
INRA_02573 DIANA POL W 1966 fixed Nov-08 B1a_160 D1a D1b 146.5 151 27.7
INRA_02574 DIANA II CZE W 1967 fixed Nov-08 B1a_197 D1a D1b 123 145 21.0
INRA_02606 DNEPROVSKAIA ? UKR W 1980 fixed Nov-08 B1a_0 D1a D1a 129 135 40.2
INRA_02626 DONG FANG HONG NO.3 CHN W 1979 fixed Nov-08 B1a_0 D1a D1b 130.5 127 35.3
INRA_02644 DRAGON FRA F 1967 fixed Nov-08 B1a_197 D1a D1b 123 146 17.8
INRA_02650 DRAVA HRV W 1980 fixed Nov-08 B1a_160 D1a D1a 96.5 134 39.5
INRA_02683 E108 FRA W NA fixed Nov-08 B1a_0 D1a D1b 166.5 142 54.3
INRA_02698 EBRO ESP W 1966 fixed Nov-08 B1a_0 D1a D1b 172 142 25.0
INRA_02709 EGYPCIO 208 ARG S NA fixed Feb-09 B1a_160 D1a D1b 146.5 148 32.3
INRA_02759 EMU'S' MEX S 1979 fixed Feb-09 B1a_0 D1b D1a 97.5 141 3.0
INRA_02802 ESPOIR FRA W 1950 fixed Nov-08 B1a_160 D1a D1b 125 150 32.3
INRA_02810 ESTANZUELA-DORADO URY S 1981 fixed Feb-09 B1a_0 D1a D1b 136.5 144 34.5
INRA_02991 FERRUGINEUM RUS W NA fixed Nov-08 B1a_160 D1a D1b 178 149 28.2
INRA_03050 FLAMURA-85 ROM W 1984 fixed Nov-08 B1b D1a D1a 113.5 130 13.6
INRA_03070 FLINT USA W 1830 fixed Nov-08 B1a_160 D1a D1b 153 140 28.3
INRA_03165 FRONTANA 3671 BRA S NA fixed Feb-09 B1a_0 D1a D1b 131.5 137 24.5
INRA_03170 FRONTHATCH USA S 1963 fixed Feb-09 B1a_0 D1a D1b 139.5 151 41.0
INRA_03176 FUKUHOKOMUGI JPN S 1979 fixed Feb-09 B1b D1a D1a 91.5 134 14.8
INRA_03213 G66257 GRC S NA fixed Feb-09 B1a_0 D1a D1a 153.5 139 29.7
INRA_03218 G7 NPL W NA fixed Nov-08 B1a_0 D1a D1b 170 138 32.3
INRA_03220 G72300 GRC S NA fixed Feb-09 B1a_0 D1a D1a 146 141 21.3
INRA_03256 GAMENYA AUS S 1958 fixed Feb-09 B1a_0 D1a D1b 112.5 139 37.3
INRA_03267 GAU NPL W NA fixed Nov-08 B1a_0 D1a D1b 157.5 133 43.5
INRA BWCC accessionsa Genotype Resultsb Phenotype Resultsc

Appendix VI continued
287
gap
INRA BWCC
number Accession name Origind
Growth
habite
Year of
reg.f Type
Sowing
Date Rht-B1g Rht-D1h Ppd-D1i gap
Plant
height (cm)
Days to
headingj
GA trt
diff (mm)
INRA_03278 GELPA FRA W 1967 fixed Nov-08 B1a_0 D1a D1b 104.5 148 18.6
INRA_03299 GH126 FRA W NA fixed Nov-08 B1a_0 D1a D1a 118 137 17.7
INRA_03306 GHURKA AUS S 1924 fixed Feb-09 B1a_0 D1a D1a 113.5 153 22.7
INRA_03342 GK-SZÖKE HUN W 1985 fixed Nov-08 B1b D1a D1a 108 138 3.3
INRA_03358 GLENLEA CAN S 1972 fixed Feb-09 B1a_0 D1a D1b 140 142 25.3
INRA_03366 GODOLLOI 15 HUN W 1957 fixed Nov-08 B1a_160 D1a D1b 146.5 126 35.3
INRA_03402 GRANAROLO ITA F 1973 fixed Nov-08 B1b D1a D1a 88 125 3.5
INRA_03406 GRANIT RUS W 1978 fixed Nov-08 B1a_0 D1a D1b 119 142 23.5
INRA_03414 GRENIER FRA W 1992 fixed Nov-08 B1b D1a D1b 98.5 141 8.3
INRA_03437 GUDEL NPL W NA fixed Nov-08 B1a_0 D1a D1b 153 128 28.7
INRA_03442 GULAR AUS S 1927 fixed Feb-09 B1a_0 D1a D1b 126.5 138 30.4
INRA_03463 H742A ISR S NA fixed Feb-09 B1b D1b D1a 59 140 1.7
INRA_03485 H93-70 ESP W NA fixed Nov-08 B1a_0 D1a D1b 171.5 138 24.3
INRA_03617 HIVERNAL FRA W 1961 fixed Nov-08 B1a_197 D1a D1b 108 148 17.8
INRA_03645 HONGGAOAN NPL W NA fixed Nov-08 B1a_0 D1a D1b 149.5 128 29.0
INRA_03665 HOROSHIRI KOMUGI JPN W 1974 fixed Nov-08 B1a_0 D1b D1a 110 136 10.0
INRA_03696 HYBRIDE 56 VILMORIN FRA S 1956 fixed Feb-09 B1a_0 D1a D1b 152 145 37.3
INRA_03752 IAR W83-2 ETH W NA fixed Nov-08 B1a_0 D1a NP 143 134 34.7
INRA_03753 IAS 1 BRA S 1955 fixed Feb-09 B1a_0 D1a D1b 145.5 145 39.2
INRA_03804 ICARDA 079 SYR W NA fixed Nov-08 B1b D1a D1a 95 133 4.4
INRA_03857 INIA-19 MEX S NA fixed Feb-09 B1b D1b D1a 66 146 4.3
INRA_03896 JANGO FRA W NA fixed Nov-08 B1a_197 D1a D1a 100.5 131 27.2
INRA_03912 JASZAJI TF HUN W 1973 fixed Nov-08 B1a_160 D1a D1b 175 142 36.3
INRA_03942 JO3045 FIN S NA fixed Feb-09 B1a_0 D1a D1b 145.5 146 23.2
INRA_03965 JUBING NPL W NA fixed Nov-08 B1a_0 D1a D1a 151.5 133 25.3
INRA_03970 JUFY II BEL S 1954 fixed Feb-09 B1a_160 D1a D1b 127 151 29.7
INRA BWCC accessionsa Genotype Resultsb Phenotype Resultsc

Appendix VI continued
288
gap
INRA BWCC
number Accession name Origind
Growth
habite
Year of
reg.f Type
Sowing
Date Rht-B1g Rht-D1h Ppd-D1i gap
Plant
height (cm)
Days to
headingj
GA trt
diff (mm)
INRA_03975 JUNBESI NPL W NA fixed Nov-08 B1a_0 D1a D1b 162 133 20.0
INRA_03991 K1898-9/L200-6 BGR W NA fixed Nov-08 B1a_0 D1a D1a 125.5 142 37.0
INRA_04036 KATYIL AUS S 1982 fixed Nov-08 B1a_0 D1a D1b 128.5 137 19.3
INRA_04055 KE HAN NO.8 CHN S NA fixed Feb-09 B1a_0 D1a D1b 141 147 26.3
INRA_04067 KENYA 350 KEN S 1951 fixed Feb-09 B1a_0 D1a D1b 130 138 15.2
INRA_04105 KID FRA W after 1946 fixed Nov-08 B1a_160 D1a D1b 97.5 144 23.5
INRA_04111 KIRAC 66 TUR W 1970 fixed Nov-08 B1a_0 D1a D1b 139.5 131 40.7
INRA_04157 KOLBEN 3 SWE W 1929 fixed Nov-08 B1a_0 D1a D1b 151 128 34.5
INRA_04187 KRAKA DNK W 1981 fixed Nov-08 B1a_0 D1a D1b 125 149 22.3
INRA_04194 KRELOF 3 FRA W NA fixed Nov-08 B1a_160 D1a D1b 174.5 150 24.3
INRA_04207 KULUNG NPL W NA fixed Nov-08 B1a_0 D1a D1b 157.5 128 21.0
INRA_04300 LESCZYNSKA WEZESNA POL W 1937 fixed Nov-08 B1a_160 D1a D1b 171 147 33.5
INRA_04324 LITTLE CLUB USA S 1878 fixed Nov-08 B1a_197 D1a D1b 158 141 31.0
INRA_04343 LONTOI FIN W 1971 fixed Nov-08 B1a_0 D1a D1b 171 139 34.0
INRA_04477 M45/66 ARG S NA fixed Feb-09 B1a_0 D1a D1b 112.5 144 24.5
INRA_04482 M708//G25/N163 ISR S NA fixed Feb-09 B1a_0 D1a D1b 139 134 22.4
INRA_04487 MACHA JPN S NA fixed Feb-09 B1a_0 D1a D1b 164 158 49.7
INRA_04492 MADIN PATEGA BARBU NPL W NA landrace Nov-08 B1a_0 D1a D1b 146 129 28.5
INRA_04525 MALGORZATKA UDYCKA POL W 1958 fixed Nov-08 B1a_160 D1a D1b 169.5 147 21.8
INRA_04645
MARS DE SUEDE ROUGE
BARBU FRA S 1922 fixed Feb-09 B1a_0 D1a D1b 183 154 33.3
INRA_04664 MASTER GBR W 1983 fixed Nov-08 B1a_0/160 het D1b D1b 109 143 -2.9
INRA_04670 MATRADERECSKEI TF HUN W 1973 fixed Nov-08 B1a_0 D1a D1b 182.5 145 14.5
INRA_04698
MEDRA/AURORA//HOHEN
TURM/DINA POL W NA fixed Nov-08 B1a_197 D1a D1a 122.5 144 14.2
INRA_04702 MEIRA ESP S NA fixed Feb-09 B1a_0/197 het D1a D1b 154.5 153 33.0
INRA BWCC accessionsa Genotype Resultsb Phenotype Resultsc

Appendix VI continued
289
gap
INRA BWCC
number Accession name Origind
Growth
habite
Year of
reg.f Type
Sowing
Date Rht-B1g Rht-D1h Ppd-D1i gap
Plant
height (cm)
Days to
headingj
GA trt
diff (mm)
INRA_04706 MELCHIOR NLD S 1974 fixed Feb-09 B1a_0 D1a D1b 103.5 151 25.5
INRA_04712 MENFLO ITA S 1955 fixed Feb-09 B1a_0 D1a D1b 139.5 145 21.2
INRA_04776 MEXIQUE 58 MEX S 1974 fixed Feb-09 B1a_0 D1b D1a 104 139 -1.2
INRA_04784 MEXIQUE 9 MEX S NA fixed Feb-09 B1b D1a D1b 109 141 12.0
INRA_04796 MICHE FRA W 1954 fixed Nov-08 B1a_160 D1a D1b 121 145 22.8
INRA_04838 MINTURK USA W 1919 fixed Nov-08 B1a_0 D1a D1b 164.5 144 38.3
INRA_04874 MISKAAGANI LBN S NA fixed Feb-09 B1a_0 D1a D1b 140.5 144 23.7
INRA_04901
MOCHO DE ESPIGA
BIANCA PRT S 1928 fixed Feb-09 B1a_197 D1a D1b 135 140 38.3
INRA_04925 MONJO NPL W NA fixed Nov-08 B1a_0 D1a D1a 138 120 26.8
INRA_04947 MOTTIN FRA W NA landrace Nov-08 B1a_0 D1a D1b 173 142 37.8
INRA_04991 MV-MA HUN W 1982 fixed Nov-08 B1b D1a D1b 81 143 4.0
INRA_05088 N46 ISR S NA fixed Feb-09 B1b D1b D1a 66 141 1.2
INRA_05096 N67M2 ISR S NA fixed Feb-09 B1b D1b D1a 54 140 1.5
INRA_05102 NABU EPI BLANC NPL W NA landrace Nov-08 B1a_0 D1a D1b 157 132 20.5
INRA_05108 NACHIPUNDO NPL S NA fixed Feb-09 B1a_0 D1a D1b 146 157 24.3
INRA_05115 NANG NANO 140 ESP W NA fixed Nov-08 B1a_0 D1a D1a 125.5 122 36.7
INRA_05116 NANKING NO.25 CHN S NA fixed Feb-09 B1a_0 D1a D1b 142.5 144 41.8
INRA_05120 NAPHAL IND W 1978 fixed Nov-08 B1a_160 D1a D1a 117.5 133 27.3
INRA_05166 NEPAL 84 NPL W NA fixed Nov-08 B1a_0 D1a D1b 159.5 132 25.3
INRA_05167 NEPAL 89 NPL W NA fixed Nov-08 B1a_0 D1a D1b 168 135 22.0
INRA_05219 NONG DA NO.141 CHN F 1982 fixed Nov-08 B1a_0 D1a D1a 117 124 15.7
INRA_05250 NORIN 29 JPN S 1949 fixed Feb-09 B1a_160 D1a/b het D1a 132.5 137 12.3
INRA_05260 NORIN 60 JPN S 1965 fixed Feb-09 B1a_0 D1b D1a 100 141 1.7
INRA_05266 NORIN 64 JPN S after 1983 fixed Feb-09 B1a/b het D1a/b het D1a 99 134 11.2
INRA_05293 NOUGAT FRA W 1985 fixed Nov-08 B1a_160 D1a D1b 98.5 133 32.2
INRA BWCC accessionsa Genotype Resultsb Phenotype Resultsc
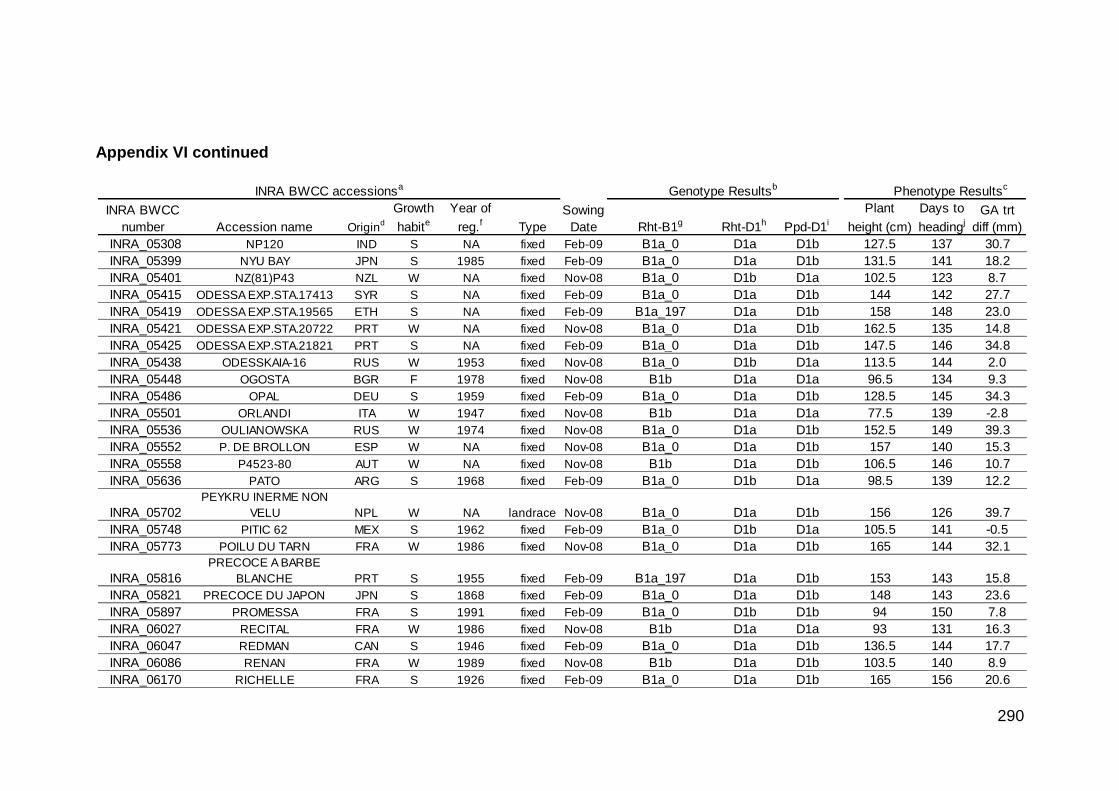
Appendix VI continued
290
gap
INRA BWCC
number Accession name Origind
Growth
habite
Year of
reg.f Type
Sowing
Date Rht-B1g Rht-D1h Ppd-D1i gap
Plant
height (cm)
Days to
headingj
GA trt
diff (mm)
INRA_05308 NP120 IND S NA fixed Feb-09 B1a_0 D1a D1b 127.5 137 30.7
INRA_05399 NYU BAY JPN S 1985 fixed Feb-09 B1a_0 D1a D1b 131.5 141 18.2
INRA_05401 NZ(81)P43 NZL W NA fixed Nov-08 B1a_0 D1b D1a 102.5 123 8.7
INRA_05415 ODESSA EXP.STA.17413 SYR S NA fixed Feb-09 B1a_0 D1a D1b 144 142 27.7
INRA_05419 ODESSA EXP.STA.19565 ETH S NA fixed Feb-09 B1a_197 D1a D1b 158 148 23.0
INRA_05421 ODESSA EXP.STA.20722 PRT W NA fixed Nov-08 B1a_0 D1a D1b 162.5 135 14.8
INRA_05425 ODESSA EXP.STA.21821 PRT S NA fixed Feb-09 B1a_0 D1a D1b 147.5 146 34.8
INRA_05438 ODESSKAIA-16 RUS W 1953 fixed Nov-08 B1a_0 D1b D1a 113.5 144 2.0
INRA_05448 OGOSTA BGR F 1978 fixed Nov-08 B1b D1a D1a 96.5 134 9.3
INRA_05486 OPAL DEU S 1959 fixed Feb-09 B1a_0 D1a D1b 128.5 145 34.3
INRA_05501 ORLANDI ITA W 1947 fixed Nov-08 B1b D1a D1a 77.5 139 -2.8
INRA_05536 OULIANOWSKA RUS W 1974 fixed Nov-08 B1a_0 D1a D1b 152.5 149 39.3
INRA_05552 P. DE BROLLON ESP W NA fixed Nov-08 B1a_0 D1a D1b 157 140 15.3
INRA_05558 P4523-80 AUT W NA fixed Nov-08 B1b D1a D1b 106.5 146 10.7
INRA_05636 PATO ARG S 1968 fixed Feb-09 B1a_0 D1b D1a 98.5 139 12.2
INRA_05702
PEYKRU INERME NON
VELU NPL W NA landrace Nov-08 B1a_0 D1a D1b 156 126 39.7
INRA_05748 PITIC 62 MEX S 1962 fixed Feb-09 B1a_0 D1b D1a 105.5 141 -0.5
INRA_05773 POILU DU TARN FRA W 1986 fixed Nov-08 B1a_0 D1a D1b 165 144 32.1
INRA_05816
PRECOCE A BARBE
BLANCHE PRT S 1955 fixed Feb-09 B1a_197 D1a D1b 153 143 15.8
INRA_05821 PRECOCE DU JAPON JPN S 1868 fixed Feb-09 B1a_0 D1a D1b 148 143 23.6
INRA_05897 PROMESSA FRA S 1991 fixed Feb-09 B1a_0 D1b D1b 94 150 7.8
INRA_06027 RECITAL FRA W 1986 fixed Nov-08 B1b D1a D1a 93 131 16.3
INRA_06047 REDMAN CAN S 1946 fixed Feb-09 B1a_0 D1a D1b 136.5 144 17.7
INRA_06086 RENAN FRA W 1989 fixed Nov-08 B1b D1a D1b 103.5 140 8.9
INRA_06170 RICHELLE FRA S 1926 fixed Feb-09 B1a_0 D1a D1b 165 156 20.6
INRA BWCC accessionsa Genotype Resultsb Phenotype Resultsc
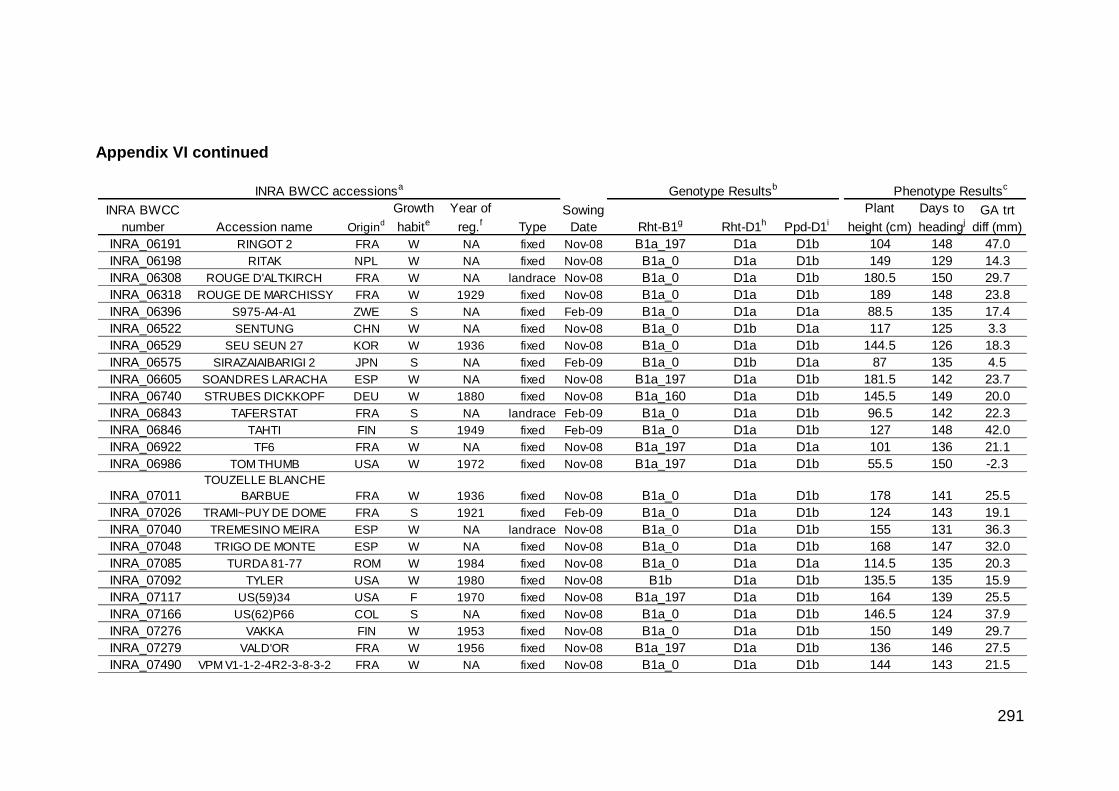
Appendix VI continued
291
gap
INRA BWCC
number Accession name Origind
Growth
habite
Year of
reg.f Type
Sowing
Date Rht-B1g Rht-D1h Ppd-D1i gap
Plant
height (cm)
Days to
headingj
GA trt
diff (mm)
INRA_06191 RINGOT 2 FRA W NA fixed Nov-08 B1a_197 D1a D1b 104 148 47.0
INRA_06198 RITAK NPL W NA fixed Nov-08 B1a_0 D1a D1b 149 129 14.3
INRA_06308 ROUGE D'ALTKIRCH FRA W NA landrace Nov-08 B1a_0 D1a D1b 180.5 150 29.7
INRA_06318 ROUGE DE MARCHISSY FRA W 1929 fixed Nov-08 B1a_0 D1a D1b 189 148 23.8
INRA_06396 S975-A4-A1 ZWE S NA fixed Feb-09 B1a_0 D1a D1a 88.5 135 17.4
INRA_06522 SENTUNG CHN W NA fixed Nov-08 B1a_0 D1b D1a 117 125 3.3
INRA_06529 SEU SEUN 27 KOR W 1936 fixed Nov-08 B1a_0 D1a D1b 144.5 126 18.3
INRA_06575 SIRAZAIAIBARIGI 2 JPN S NA fixed Feb-09 B1a_0 D1b D1a 87 135 4.5
INRA_06605 SOANDRES LARACHA ESP W NA fixed Nov-08 B1a_197 D1a D1b 181.5 142 23.7
INRA_06740 STRUBES DICKKOPF DEU W 1880 fixed Nov-08 B1a_160 D1a D1b 145.5 149 20.0
INRA_06843 TAFERSTAT FRA S NA landrace Feb-09 B1a_0 D1a D1b 96.5 142 22.3
INRA_06846 TAHTI FIN S 1949 fixed Feb-09 B1a_0 D1a D1b 127 148 42.0
INRA_06922 TF6 FRA W NA fixed Nov-08 B1a_197 D1a D1a 101 136 21.1
INRA_06986 TOM THUMB USA W 1972 fixed Nov-08 B1a_197 D1a D1b 55.5 150 -2.3
INRA_07011
TOUZELLE BLANCHE
BARBUE FRA W 1936 fixed Nov-08 B1a_0 D1a D1b 178 141 25.5
INRA_07026 TRAMI~PUY DE DOME FRA S 1921 fixed Feb-09 B1a_0 D1a D1b 124 143 19.1
INRA_07040 TREMESINO MEIRA ESP W NA landrace Nov-08 B1a_0 D1a D1b 155 131 36.3
INRA_07048 TRIGO DE MONTE ESP W NA fixed Nov-08 B1a_0 D1a D1b 168 147 32.0
INRA_07085 TURDA 81-77 ROM W 1984 fixed Nov-08 B1a_0 D1a D1a 114.5 135 20.3
INRA_07092 TYLER USA W 1980 fixed Nov-08 B1b D1a D1b 135.5 135 15.9
INRA_07117 US(59)34 USA F 1970 fixed Nov-08 B1a_197 D1a D1b 164 139 25.5
INRA_07166 US(62)P66 COL S NA fixed Nov-08 B1a_0 D1a D1b 146.5 124 37.9
INRA_07276 VAKKA FIN W 1953 fixed Nov-08 B1a_0 D1a D1b 150 149 29.7
INRA_07279 VALD'OR FRA W 1956 fixed Nov-08 B1a_197 D1a D1b 136 146 27.5
INRA_07490 VPM V1-1-2-4R2-3-8-3-2 FRA W NA fixed Nov-08 B1a_0 D1a D1b 144 143 21.5
INRA BWCC accessionsa Genotype Resultsb Phenotype Resultsc

Appendix VI continued
292
gap
INRA BWCC
number Accession name Origind
Growth
habite
Year of
reg.f Type
Sowing
Date Rht-B1g Rht-D1h Ppd-D1i gap
Plant
height (cm)
Days to
headingj
GA trt
diff (mm)
INRA_07585 WATTINES FRA W 1974 fixed Nov-08 B1a_197 D1a D1b 113 144 40.3
INRA_07848 RONGOTEA NZL W 1979 fixed Nov-08 B1a_0 D1b D1b 111.5 137 2.3
INRA_07965 BLANC DE CHENAN FRA W NA landrace Nov-08 B1a_0 D1a D1b 154 150 35.0
INRA_07968 BLE DANOIS FRA W NA landrace Nov-08 B1a_0 D1a D1b 168.5 141 32.0
INRA_07973 BORDEAUX 113 FRA W 1936 fixed Nov-08 B1a_0 D1a D1a 168.5 147 34.0
INRA_07988 CREPIN A FRA W NA fixed Nov-08 B1a_160 D1a D1b 173 138 38.3
INRA_08011 INSTITUT 1802 FRA W NA fixed Nov-08 B1a_160 D1a D1b 124.5 145 11.0
INRA_08048 RALET FRA W NA landrace Nov-08 B1a_0 D1a D1b 190 145 29.3
INRA_08051 BLE BARBU DE MUROL FRA W NA landrace Nov-08 B1a_0 D1a D1b 156 138 45.3
INRA_08058 ZANDA BEL W 1939 fixed Nov-08 B1a_160 D1a D1b 162 151 24.2
INRA_08073 CORONATION CAN W 1938 fixed Nov-08 B1a_0 D1a D1b 153 135 17.1
INRA_08079 KITCHENER CAN W 1911 fixed Nov-08 B1a_0 D1a D1b 175.5 140 29.5
INRA_08097 STANLEY CAN W 1890 fixed Nov-08 B1a_0 D1a D1b 171 136 30.3
INRA_08113 GP260 CAN S 1983 fixed Feb-09 B1a_0 D1a D1a 129.5 137 36.5
INRA_08165 NAVARRO 150 ESP W NA fixed Nov-08 B1a_160 D1a D1a 117.5 134 24.8
INRA_08170 WS-13 CARDENO 34/45 ESP W NA fixed Nov-08 B1b D1b D1a 111 130 5.0
INRA_08194 NEELKANT SYR W 1980 fixed Nov-08 B1b D1a D1a 121 127 19.0
INRA_08197 SANUNU SYR W NA fixed Nov-08 B1b D1a D1a 115.5 127 8.7
INRA_08227 NISHIKAZE KOMUGI JPN W 1986 fixed Nov-08 B1b D1a D1a 96 116 5.9
INRA_08233 HOUMANA NER S NA fixed Nov-08 B1a_0 D1a D1b 117.5 121 22.1
INRA_08254 CADENZA FRA S 1993 fixed Nov-08 B1a_0 D1a D1b 105 141 31.0
INRA_08276 CARIBO DEU W 1968 fixed Nov-08 B1a_160 D1a D1b 118.5 148 14.6
INRA_08280 (V*C)5-3 FRA W NA fixed Nov-08 B1a_197 D1a NP 115.5 150 35.3
INRA_08287 DC147U FRA W NA fixed Nov-08 B1a_197 D1b D1b 118 142 4.7
INRA_08289 TM7MB1-1 FRA W NA fixed Nov-08 B1a_160 D1b D1b 109.5 140 3.0
INRA_08513 LIMPOPO ZWE S 1981 fixed Feb-09 B1b D1b D1a 66 137 0.7
INRA_08578 GH 'S' MEX S NA fixed Feb-09 B1b D1a D1a 105 145 8.4
INRA BWCC accessionsa Genotype Resultsb Phenotype Resultsc

Appendix VI continued
293
gap
INRA BWCC
number Accession name Origind
Growth
habite
Year of
reg.f Type
Sowing
Date Rht-B1g Rht-D1h Ppd-D1i gap
Plant
height (cm)
Days to
headingj
GA trt
diff (mm)
INRA_09024 GENESIS FRA W 1992 fixed Nov-08 B1a_160 D1b D1b 86 147 -2.0
INRA_09048 HOPEA FIN S 1936 fixed Feb-09 B1a_0 D1a D1b 108 185 28.3
INRA_09077 NON PLUS EXTRA AUT W 1919 fixed Nov-08 B1a_160 D1a D1b 148.5 157 28.7
INRA_09087 PRINCE-LEOPOLD BEL W 1936 fixed Nov-08 B1a_160 D1a D1b 191 151 29.8
INRA_13210 SOLARIS CZE W 1976 fixed Nov-08 B1b D1a D1a 117.5 134 12.9
INRA_13282 ANATOLIE2 FRA W NA fixed Nov-08 B1a_197 D1a D1a 114 142 23.3
INRA_13286 BAROOTA-WONDER AUS S 1895 fixed Feb-09 B1a_0 D1a D1b 162 160 30.3
INRA_13292 CONCURRENT FRA W 1905 fixed Nov-08 B1a_0 D1a D1b 151 143 27.7
INRA_13310 FRUH WEIZEN DEU W NA fixed Nov-08 B1a_160 D1a D1b 167 140 20.0
INRA_13436 FONDARD CRESPIN FRA W 1948 fixed Nov-08 B1a_0 D1a D1b 164.5 138 27.0
INRA_13440 PROVINS FRA W 1949 fixed Nov-08 B1a_0 D1a D1b 134 142 32.5
INRA_13445 VOLT FRA W 1994 fixed Nov-08 B1b D1a D1a 91 140 11.3
INRA_13454 SPONSOR FRA W 1994 fixed Nov-08 B1a_197 D1b D1b 93 146 3.3
INRA_13461 BEHERT FRA W 1994 fixed Nov-08 B1a_160 D1b D1b 89.5 144 2.0
INRA_13471 ORNICAR FRA W 1998 fixed Nov-08 B1b D1a D1b 90 139 7.7
INRA_13476 TALDOR FRA W 1998 fixed Nov-08 B1b D1a D1a 86.5 140 14.4
INRA_13481 APACHE FRA W 1998 fixed Nov-08 B1a_160 D1a D1a 84.5 134 16.5
INRA_13494 BELLOVAC FRA W NA fixed Nov-08 B1a_197 D1b D1a 85.5 141 4.6
INRA_13500 ORFIELD FRA W NA fixed Nov-08 B1a_197 D1b D1b 95.5 149 4.7
INRA_13502 PALIO FRA W NA fixed Nov-08 B1a_0 D1b D1a 86 135 7.5
INRA_13642 AGATHA CAN S 1970 fixed Feb-09 B1a_0 D1a D1b 131 143 25.7
INRA_13781 TAI 911 CHN W NA fixed Nov-08 B1a_0 D1a D1a 100.5 121 28.3
INRA_13792 CENTURK USA W 1971 fixed Nov-08 B1a_160 D1a D1b 137.5 135 41.8
INRA_13799 PAMUKALE TUR S 1997 fixed Feb-09 B1a_0 D1a D1a 134.5 148 24.7
INRA_13800 ZILVE TUR S NA fixed Feb-09 B1a_0 D1a D1b 157 148 32.3
INRA_13811 OPATA 85 MEX S 1985 fixed Feb-09 B1b D1a D1b 123.5 154 20.8
INRA_13812 W7984 MEX S NA fixed Feb-09 B1b D1a 450bp 112 142 14.2
INRA_13861 AUGUSTE FRA W 1998 fixed Nov-08 B1a_197 D1b D1b 80 149 8.4
INRA BWCC accessionsa Genotype Resultsb Phenotype Resultsc
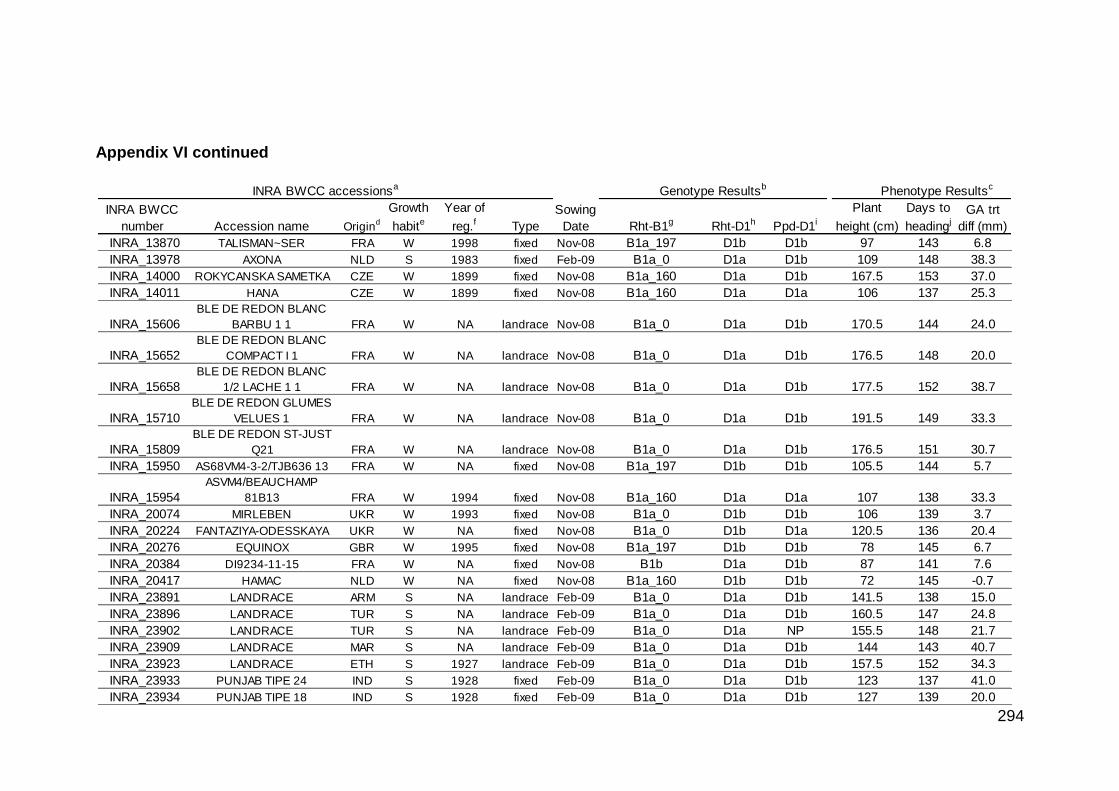
Appendix VI continued
294
gap
INRA BWCC
number Accession name Origind
Growth
habite
Year of
reg.f Type
Sowing
Date Rht-B1g Rht-D1h Ppd-D1i gap
Plant
height (cm)
Days to
headingj
GA trt
diff (mm)
INRA_13870 TALISMAN~SER FRA W 1998 fixed Nov-08 B1a_197 D1b D1b 97 143 6.8
INRA_13978 AXONA NLD S 1983 fixed Feb-09 B1a_0 D1a D1b 109 148 38.3
INRA_14000 ROKYCANSKA SAMETKA CZE W 1899 fixed Nov-08 B1a_160 D1a D1b 167.5 153 37.0
INRA_14011 HANA CZE W 1899 fixed Nov-08 B1a_160 D1a D1a 106 137 25.3
INRA_15606
BLE DE REDON BLANC
BARBU 1 1 FRA W NA landrace Nov-08 B1a_0 D1a D1b 170.5 144 24.0
INRA_15652
BLE DE REDON BLANC
COMPACT I 1 FRA W NA landrace Nov-08 B1a_0 D1a D1b 176.5 148 20.0
INRA_15658
BLE DE REDON BLANC
1/2 LACHE 1 1 FRA W NA landrace Nov-08 B1a_0 D1a D1b 177.5 152 38.7
INRA_15710
BLE DE REDON GLUMES
VELUES 1 FRA W NA landrace Nov-08 B1a_0 D1a D1b 191.5 149 33.3
INRA_15809
BLE DE REDON ST-JUST
Q21 FRA W NA landrace Nov-08 B1a_0 D1a D1b 176.5 151 30.7
INRA_15950 AS68VM4-3-2/TJB636 13 FRA W NA fixed Nov-08 B1a_197 D1b D1b 105.5 144 5.7
INRA_15954
ASVM4/BEAUCHAMP
81B13 FRA W 1994 fixed Nov-08 B1a_160 D1a D1a 107 138 33.3
INRA_20074 MIRLEBEN UKR W 1993 fixed Nov-08 B1a_0 D1b D1b 106 139 3.7
INRA_20224 FANTAZIYA-ODESSKAYA UKR W NA fixed Nov-08 B1a_0 D1b D1a 120.5 136 20.4
INRA_20276 EQUINOX GBR W 1995 fixed Nov-08 B1a_197 D1b D1b 78 145 6.7
INRA_20384 DI9234-11-15 FRA W NA fixed Nov-08 B1b D1a D1b 87 141 7.6
INRA_20417 HAMAC NLD W NA fixed Nov-08 B1a_160 D1b D1b 72 145 -0.7
INRA_23891 LANDRACE ARM S NA landrace Feb-09 B1a_0 D1a D1b 141.5 138 15.0
INRA_23896 LANDRACE TUR S NA landrace Feb-09 B1a_0 D1a D1b 160.5 147 24.8
INRA_23902 LANDRACE TUR S NA landrace Feb-09 B1a_0 D1a NP 155.5 148 21.7
INRA_23909 LANDRACE MAR S NA landrace Feb-09 B1a_0 D1a D1b 144 143 40.7
INRA_23923 LANDRACE ETH S 1927 landrace Feb-09 B1a_0 D1a D1b 157.5 152 34.3
INRA_23933 PUNJAB TIPE 24 IND S 1928 fixed Feb-09 B1a_0 D1a D1b 123 137 41.0
INRA_23934 PUNJAB TIPE 18 IND S 1928 fixed Feb-09 B1a_0 D1a D1b 127 139 20.0
INRA BWCC accessionsa Genotype Resultsb Phenotype Resultsc

Appendix VI continued
295
gap
INRA BWCC
number Accession name Origind
Growth
habite
Year of
reg.f Type
Sowing
Date Rht-B1g Rht-D1h Ppd-D1i gap
Plant
height (cm)
Days to
headingj
GA trt
diff (mm)
INRA_23937 PUNJAB TIPE 15 IND S 1928 fixed Feb-09 B1a_0 D1a D1b 122 138 22.0
INRA_23944 LANDRACE CHN S NA landrace Feb-09 B1a_0 D1a D1b 170 152 35.5
INRA_23945 LANDRACE CHN S NA landrace Feb-09 B1a_0 D1a D1b 169 150 29.8
INRA_23950 SARRUBRA RUS S 1931 fixed Feb-09 B1a_160 D1a D1b 160 143 24.4
INRA_23957 R 1 CHN S 1932 fixed Feb-09 B1a_0 D1a D1b 132 178 22.3
INRA_23960 117-VAR.12/564 PAK S 1934 fixed Feb-09 B1a_0 D1a D1b 143 141 26.8
INRA_23964 THORI 212-VAR.8/1 PAK S 1934 fixed Feb-09 B1a_0 D1a D1b 128.5 138 32.5
INRA_23970 LANDRACE TJK S NA landrace Feb-09 B1a_0 D1a D1b 159.5 150 35.2
INRA_23971 LANDRACE TJK S NA landrace Feb-09 B1a_0 D1a D1b 175 147 29.7
INRA_23974 LANDRACE TJK S NA landrace Feb-09 B1a_0 D1a D1b 157.5 147 19.3
INRA_23977 LANDRACE GEO S 1931 landrace Feb-09 B1a_0 D1a D1b 167 149 17.9
INRA_23981 SOOR GHANUM PAK S NA landrace Feb-09 B1a_0 D1a D1b 122 138 29.8
INRA_23989 LANDRACE GEO S 1931 landrace Feb-09 B1a_0 D1a NP 171 150 21.3
INRA_23995 LANDRACE RUS S 1950 landrace Feb-09 B1a_0 D1a D1b 150 151 21.8
INRA_23996
GUISUISKAYA SYAO-BAI-
MAI CHN S 1953 fixed Feb-09 B1a_0 D1a D1b 126 134 34.2
INRA_24003 KULDZHINSKAYA CHN S 1959 fixed Feb-09 B1a_0 D1a D1b 176 149 25.0
INRA_24006 U-MAN-SYAO-MAI CHN S 1954 fixed Feb-09 B1a_0 D1a D1b 152 142 43.0
INRA_24019 DALNEVOSTOCHNAYA 10 RUS S 1978 fixed Feb-09 B1a_160 D1a D1b 144 143 34.7
INRA_24031 KRASNAYA CAN W 1914 fixed Nov-08 B1a_160 D1a D1b 179 144 30.0
INRA_24054 STEPNYACHKA UKR W 1969 fixed Nov-08 B1a_0 D1a D1b 163 140 26.7
INRA_24056 LANDRACE TUR F NA landrace Nov-08 B1a_0 D1a D1b 175.5 138 36.3
INRA_24058 SARY-BUGDA GULGERI RUS W 1928 fixed Nov-08 B1a_0 D1a D1b 174 140 27.7
INRA_24066 CROISEMENT 268 CHE W 1929 fixed Nov-08 B1a_0 D1a D1b 156 153 26.3
INRA_24075 SPIN 121-VAR.12/536 PAK F 1933 fixed Nov-08 B1a_0 D1a D1b 141 126 33.2
INRA_24080 DOLIS PURI GEO W 1933 fixed Nov-08 B1a_0 D1a D1b 176.5 139 29.3
INRA_24089 TAU-BUGDA RUS W 1955 fixed Nov-08 B1a_0 D1a NP 195.5 141 30.3
INRA_24108 ALBIDUM 12 RUS W 1980 fixed Nov-08 B1a_160 D1a D1b 171.5 146 38.0
INRA BWCC accessionsa Genotype Resultsb Phenotype Resultsc

Appendix VI continued
296
a Accession information on the INRA BWCC (Bread wheat core collection) received from F. Balfourier, INRA.
b Genotyping was performed using DNA from the INRA BWCC outdoor experiment, which consisted of two separate bulks of four plants for fixed lines and
four individual plants for landraces. Heterozygotes (het) are shown with segregating alleles separated by a "/". c Plant heights and days to heading were recorded in the INRA BWCC outdoor experiment, Cambridge (UK) and values represent the mean of two replicates.
GA treatment differences (GA trt diffs) represent the average of GA exps. 1, 2, and 3 (Norwich, UK). GA trt diff = GA+ treatment seed-to-first-ligule (STFL) length minus GA- treatment STFL length. d Countries of origin are: (AFG Afghanistan; ALB Albania; ARG Argentina; ARM Armenia; AUS Australia; AUT Austria; AZE Azerbaijan; BEL Belgium; BGR Bulgaria; BLR Belarus; BRA Brazil; CAN Canada; CHE Switzerland; CHN China; COL Colombia; CSK Czech and Slovak Republics; DEU Germany; DNK Denmark; DZA Algeria; EGY Egypt; ESP Spain; ETH Ethiopia; FIN Finland; FRA France; GEO Georgia; GBR Great Britain; GRC Greece; GTM Guatemala; HUN Hungary; HRV Croatia; IND India; IRL Ireland; IRN Iran; IRQ Iraq; ISR Israel; ITA Italy; JPN Japan; KAZ Kazakhstan; KEN Kenya; KIR Kyrgyzstan; KOR Korea; KSM Kashmir; LBN Lebanon; MAD Macedonia; MAR Morocco; MEX Mexico; MNG Mongolia; NER Niger; NLD Netherlands; NOR Norway; NPL Nepal; NZL New Zealand; PAL Palestine; PAK Pakistan; POL Poland; POR Portugal; PER Peru; ROM Romania; RUS Russia; SYR Syria; SWE Sweden; TJK Tajikistan; TKM Turkenistan; TUN Tunisia; TUR Turkey; URY Uruguay; UKR Ukraine; USA United States; UZB Uzbekistan; YUG Yugoslavia; ZAF South Africa; ZWE Zimbabwe) e S=spring, W=winter, F=facultative
f Year of reg = Year of registration; NA = not available g Rht-B1a and Rht-B1b designations based on the Rht-B1a/b PCR assays. Rht-B1a_0, Rht-B1a_160, and Rht-B1a_197 refer to accessions containing Rht-
B1a with no insertion, a 160 bp insertion, or a 197 bp insertion, respectively. Rht-B1_197 contains the 197 bp insertion but did not amplify a product associated with Rht-B1a or Rht-B1b. h Rht-D1 locus designations based on the Rht-D1a/b PCR assays.
i Ppd-D1 locus designations based on the Ppd-D1a/b PCR assay (Beales et al., 2007). The ~450 bp does not correspond to the Ppd-D1b (414 bp product) or Ppd-D1a (297 bp product) allele. ‘No product’ indicates that a product was not obtained in either replicate. j Days from January 1.
gap
INRA BWCC
number Accession name Origind
Growth
habiteYear of
reg.f Type
Sowing
Date Rht-B1g Rht-D1h Ppd-D1i gap
Plant
height (cm)
Days to
headingj
GA trt
diff (mm)
INRA_24180 PALESTINSKAYA PAL S 1927 fixed Feb-09 B1a_0 D1a D1b 139 140 33.7
INRA_24184 LANDRACE PAL S 1927 landrace Feb-09 B1a_0 D1a D1b 183.5 155 27.0
INRA_24185 LANDRACE TKM S NA landrace Feb-09 B1a_0 D1a D1b 151.5 139 30.0
INRA_24186 SARY-BUGDA AZE F 1928 fixed Nov-08 B1a_0 D1a D1b 196 141 29.2
INRA_24193 LANDRACE AZE W NA landrace Nov-08 B1a_0 D1a NP 165.5 132 26.5
INRA_24196 ARAZBUGDASI AZE W 1934 fixed Nov-08 B1a_0 D1a D1b 173.5 144 35.8
INRA_24209 ARDITO ITA F 1916 fixed Feb-09 B1a_0 D1a D1b 153 149 45.7
INRA_24210 LAMMAS GBR W 1850 fixed Nov-08 B1a_160 D1a D1b 180.5 153 26.5
INRA BWCC accessionsa Genotype Resultsb Phenotype Resultsc

Appendix VII. Summary of GA sensitivity experiments 1, 2, and 3 for the INRA BWCC accessions and control lines.
297
Accessiona gap gap gap gap gapOverall
INRA BWCC
number / control
line gapRht-B1 Rht-D1 Ppd-D1 gap
GA+
length
(mm)c
GA-
length
(mm)d
Trt Diff
(mm)e
MM
pGAIf
LSD
pGA trt
diff = 0ggap
GA+
length
(mm)
GA-
length
(mm)
Trt
Diff
(mm)
MM
pGAI
LSD
pGA trt
diff = 0gap
GA+
length
(mm)
GA-
length
(mm)
Trt Diff
(corr'd)
mmi
Trt Diff
t value
(calc.)
LSD
pGA trt
diff = 0gap
Trt
diff j
INRA_00007 B1a_197 D1a D1a 61.0 54.5 6.5 0.73 0.45 82.3 56.0 26.3 0.02 0.00 54.2 26.8 21.4 8.80 0.00 18.1
INRA_00019 B1b D1a D1b 51.3 51.3 0.0 0.97 1.00 60.3 52.7 7.7 0.98 0.19 3.8
INRA_00092 B1a_197 D1a D1b 88.0 54.3 33.7 0.00 0.00 33.7
INRA_00177 B1a_0 D1a D1b 79.7 51.0 28.7 0.00 0.00 28.7
INRA_00234 B1a_160 D1a D1b 81.0 51.0 30.0 0.00 0.00 92.7 52.3 40.3 0.00 0.00 35.2
INRA_00236 B1a_0 D1a D1a 82.7 50.3 32.3 0.00 0.00 32.3
INRA_00338 B1a_0 D1a D1a 77.5 61.3 16.2 0.01 0.04 16.2
INRA_00347 B1a_0 D1a D1a 66.5 59.0 7.5 0.31 0.38 84.0 61.7 22.3 0.01 0.00 57.7 33.3 19.1 6.28 0.00 16.3
INRA_00386 B1a_0 D1a D1a 65.3 50.0 15.3 0.40 0.05 81.7 53.0 28.7 0.03 0.00 22.0
INRA_00419 B1a_160 D1a D1b 75.3 50.3 25.0 0.02 0.00 25.0
INRA_00421 B1a_0 D1a D1a 80.0 49.5 30.5 0.00 0.00 30.5
INRA_00477 B1a_160 D1a D1a 75.3 51.0 24.3 0.02 0.00 24.3
INRA_00514 B1a_0 D1a D1b 77.5 63.5 14.0 0.01 0.10 91.3 65.7 25.7 0.00 0.00 19.8
INRA_00524 B1a_0 D1a D1b 91.7 59.3 32.3 0.00 0.00 32.3
INRA_00537 B1a_160 D1a D1b 76.5 59.7 16.8 0.01 0.03 63.5 35.0 22.3 9.60 0.00 19.6
INRA_00546 B1b D1a D1a 59.3 46.3 13.0 0.82 0.06 55.0 43.7 11.3 1.00 0.05 12.2
INRA_00748 B1a_0 D1a D1b 96.0 70.3 25.7 0.00 0.00 25.7
INRA_00776 B1b D1a D1a 45.5 36.7 8.8 0.99 0.26 39.3 38.3 1.0 1.00 0.86 4.9
INRA_00794 B1a_0 D1a D1b 100.0 58.0 42.0 0.00 0.00 96.0 71.0 25.0 0.00 0.00 33.5
INRA_00797 B1a_197 D1a D1b 77.3 52.0 25.3 0.01 0.00 25.3
INRA_00800 B1a_0 D1a D1b 76.7 52.3 24.3 0.01 0.00 24.3
INRA_00822 B1a_197 D1b D1a 65.0 40.5 24.5 0.43 0.00 44.3 41.0 3.3 1.00 0.56 13.9
INRA_00833 B1a_0 D1a D1a 95.5 48.0 47.5 0.00 0.00 47.5
INRA_00871 B1a_0 D1a D1b 90.0 68.3 21.7 0.00 0.00 21.7
INRA_00901
B1a_160/
197 het D1b D1a 48.0 49.5 -1.5 0.99 1.00 50.0 47.3 2.7 1.00 0.64 0.6
Genotypeb GA exp. 1 GA exp. 2 GA exp. 3h

Appendix VII continued
298
Accessiona gap gap gap gap gapOverall
INRA BWCC
number / control
line gapRht-B1 Rht-D1 Ppd-D1 gap
GA+
length
(mm)c
GA-
length
(mm)d
Trt Diff
(mm)e
MM
pGAIf
LSD
pGA trt
diff = 0ggap
GA+
length
(mm)
GA-
length
(mm)
Trt
Diff
(mm)
MM
pGAI
LSD
pGA trt
diff = 0gap
GA+
length
(mm)
GA-
length
(mm)
Trt Diff
(corr'd)
mmi
Trt Diff
t value
(calc.)
LSD
pGA trt
diff = 0gap
Trt
diff j
INRA_00912 B1a_0 D1a D1a 81.0 40.5 40.5 0.00 0.00 40.5
INRA_00933 B1a_160 D1a D1b 91.3 54.3 37.0 0.00 0.00 92.5 56.7 35.8 0.00 0.00 36.4
INRA_00957 B1a_197 D1a D1b 78.0 50.7 27.3 0.00 0.00 27.3
INRA_00964 B1a_197 D1a D1b 59.5 51.0 8.5 0.81 0.41 75.3 49.7 25.7 0.24 0.00 55.5 29.6 20.2 8.33 0.00 18.1
INRA_00983 B1a_197 D1b D1b 54.7 54.0 0.7 0.94 0.93 52.7 52.0 0.7 1.00 0.91 0.7
INRA_01005 B1a_0 D1a D1b 88.0 58.3 29.7 0.00 0.00 29.7
INRA_01032 B1a_197 D1a D1b 90.3 54.3 36.0 0.00 0.00 36.0
INRA_01044 B1a_0 D1a D1b 81.5 52.3 29.2 0.00 0.00 29.2
INRA_01065 B1a_0 D1a D1a 71.0 50.0 21.0 0.08 0.05 73.3 54.3 19.0 0.39 0.00 62.0 30.3 24.8 8.80 0.00 21.6
INRA_01080 B1a_0 D1a D1b 82.7 59.7 23.0 0.00 0.00 23.0
INRA_01110 B1a_0 D1a D1b 109.0 70.0 39.0 0.00 0.00 103.3 75.7 27.7 0.00 0.00 33.3
INRA_01113 B1a_0 D1a D1b 104.7 64.0 40.7 0.00 0.00 40.7
INRA_01177 B1a_0 D1a D1b 78.7 62.5 16.2 0.00 0.04 16.2
INRA_01182 B1a_0 D1a D1b 99.0 71.0 28.0 0.00 0.00 28.0
INRA_01192 B1a_0 D1a D1a 87.5 51.3 36.2 0.00 0.00 36.2
INRA_01217 B1a_0 D1b D1a 53.5 49.5 4.0 0.95 0.64 4.0
INRA_01232 B1a_160 D1a D1b 83.0 58.3 24.7 0.00 0.00 24.7
INRA_01236 B1a_0 D1a D1b 89.5 58.0 31.5 0.00 0.00 31.5
INRA_01244 B1b D1a D1a 47.7 41.7 6.0 0.99 0.39 48.7 41.7 7.0 1.00 0.23 6.5
INRA_01249 B1a_0 D1a D1b 103.5 66.0 37.5 0.00 0.00 37.5
INRA_01281 B1a_197 D1a D1b 76.7 53.7 23.0 0.01 0.00 23.0
INRA_01288 B1a_160 D1a D1b 85.0 67.5 17.5 0.00 0.03 17.5
INRA_01313 B1a_0 D1a D1b 110.0 73.7 36.3 0.00 0.00 36.3
INRA_01321 B1a_197 D1a D1a 78.7 49.3 29.3 0.00 0.00 29.3
INRA_01332 B1a_160 D1a D1b 99.3 55.7 43.7 0.00 0.00 43.7
INRA_01357 B1a_160 D1a D1b 76.5 64.5 12.0 0.01 0.16 87.7 60.3 27.3 0.00 0.00 19.7
Genotypeb GA exp. 1 GA exp. 2 GA exp. 3h

Appendix VII continued
299
Accessiona gap gap gap gap gapOverall
INRA BWCC
number / control
line gapRht-B1 Rht-D1 Ppd-D1 gap
GA+
length
(mm)c
GA-
length
(mm)d
Trt Diff
(mm)e
MM
pGAIf
LSD
pGA trt
diff = 0ggap
GA+
length
(mm)
GA-
length
(mm)
Trt
Diff
(mm)
MM
pGAI
LSD
pGA trt
diff = 0gap
GA+
length
(mm)
GA-
length
(mm)
Trt Diff
(corr'd)
mmi
Trt Diff
t value
(calc.)
LSD
pGA trt
diff = 0gap
Trt
diff j
INRA_01400 B1a_0 D1a D1b 98.7 64.5 34.2 0.00 0.00 34.2
INRA_01402 B1a_160 D1a D1a 81.3 50.0 31.3 0.00 0.00 31.3
INRA_01417 B1a_160 D1a D1b 52.5 75.0 54.7 20.3 0.26 0.00 20.3
INRA_01422 B1a_0 D1a D1b 113.3 74.3 39.0 0.00 0.00 39.0
INRA_01429 B1a_160 D1a D1b 87.3 67.3 20.0 0.00 0.00 20.0
INRA_01446 B1a_0 D1a D1b 90.3 66.0 24.3 0.00 0.00 24.3
INRA_01498 B1a_0 D1a D1b 80.0 62.3 17.7 0.00 0.07 95.3 64.3 31.0 0.00 0.00 24.3
INRA_01529 B1a_0 D1a D1b 75.3 46.0 29.3 0.02 0.00 29.3
INRA_01531 B1b D1a D1b 49.0 40.5 8.5 0.98 0.32 50.3 47.3 3.0 1.00 0.60 5.8
INRA_01542
B1a_0/
197 het D1a D1a 91.0 60.0 31.0 0.00 0.00 97.0 69.7 27.3 0.00 0.00 29.2
INRA_01643 B1a/b het
D1a/b
het D1a 84.0 60.5 23.5 0.00 0.00 89.3 58.3 31.0 0.00 0.00 27.3
INRA_01647 B1a_0 D1b D1a 56.7 52.7 4.0 0.90 0.57 65.3 49.0 16.3 0.90 0.01 10.2
INRA_01655 B1a_0 D1b D1a 46.7 48.3 -1.7 0.99 1.00 -1.7
INRA_01660 B1a_0 D1a D1b 92.3 46.0 46.3 0.00 0.00 46.3
INRA_01676 B1a_0 D1b D1a 47.0 42.0 5.0 0.99 0.56 5.0
INRA_01696 B1a_0 D1a D1b 114.3 73.3 41.0 0.00 0.00 41.0
INRA_01697 B1a_0 D1a D1b 107.3 57.0 50.3 0.00 0.00 50.3
INRA_01747 B1b D1a D1b 62.3 45.0 17.3 0.64 0.03 55.0 52.0 3.0 1.00 0.60 10.2
INRA_01768 B1a_0 D1a D1b 105.5 77.5 28.0 0.00 0.00 28.0
INRA_01774 B1a_0 D1a D1b 96.5 70.0 26.5 0.00 0.01 110.7 73.0 37.7 0.00 0.00 32.1
INRA_01885 B1a_0 D1a D1b 85.0 58.0 27.0 0.00 0.00 27.0
INRA_01899 B1a_197 D1a D1b 78.3 54.0 24.3 0.00 0.00 24.3
INRA_01957 B1a_197 D1b D1b 55.3 60.0 -4.7 0.93 1.00 51.3 49.3 2.0 1.00 0.73 -1.3
INRA_01974 B1b D1a D1b 54.3 48.0 6.3 0.94 0.42 54.3 56.3 -2.0 1.00 1.00 2.2
Genotypeb GA exp. 1 GA exp. 2 GA exp. 3h

Appendix VII continued
300
Accessiona gap gap gap gap gapOverall
INRA BWCC
number / control
line gapRht-B1 Rht-D1 Ppd-D1 gap
GA+
length
(mm)c
GA-
length
(mm)d
Trt Diff
(mm)e
MM
pGAIf
LSD
pGA trt
diff = 0ggap
GA+
length
(mm)
GA-
length
(mm)
Trt
Diff
(mm)
MM
pGAI
LSD
pGA trt
diff = 0gap
GA+
length
(mm)
GA-
length
(mm)
Trt Diff
(corr'd)
mmi
Trt Diff
t value
(calc.)
LSD
pGA trt
diff = 0gap
Trt
diff j
INRA_02025 B1a_197 D1a D1b 76.0 47.3 28.7 0.01 0.00 28.7
INRA_02072 B1a_0 D1b D1a 53.3 52.7 0.7 0.96 0.92 0.7
INRA_02135 B1a_0 D1a D1b 87.5 49.0 38.5 0.00 0.00 38.5
INRA_02141 B1a_0 D1a D1b 103.0 70.5 32.5 0.00 0.00 32.5
INRA_02145 B1a_0 D1a
D1b/b
het 105.3 58.3 47.0 0.00 0.00 47.0
INRA_02153 B1a_160 D1a D1b 75.5 52.7 22.8 0.01 0.00 22.8
INRA_02169 B1a_160 D1a D1b 102.0 61.0 41.0 0.00 0.00 107.0 68.3 38.7 0.00 0.00 39.8
INRA_02171 B1a_0 D1a D1b 104.0 60.0 44.0 0.00 0.00 100.3 68.0 32.3 0.00 0.00 38.2
INRA_02289 B1a_0 D1a D1b 56.3 93.7 64.0 29.7 0.00 0.00 29.7
INRA_02301 B1b D1a D1b 54.5 48.7 5.8 0.94 0.45 54.0 43.3 10.7 1.00 0.07 8.3
INRA_02308 B1a_0 D1b D1b 43.7 40.5 3.2 0.99 0.68 48.7 47.0 1.7 1.00 0.77 2.4
INRA_02330 B1a_0 D1a D1b 79.0 50.7 28.3 0.00 0.00 28.3
INRA_02337 B1a_197 D1a D1a 77.3 48.0 29.3 0.01 0.00 29.3
INRA_02345 B1b D1a D1b 64.3 49.5 14.8 0.49 0.06 58.0 43.7 14.3 0.99 0.01 14.6
INRA_02353 B1a_197 D1a D1a 114.7 80.0 34.7 0.00 0.00 34.7
INRA_02358 B1b D1b D1b 44.3 59.0 -14.7 0.99 1.00 -14.7
INRA_02364 B1a_197 D1a D1b 96.0 54.7 41.3 0.00 0.00 41.3
INRA_02399 B1a_160 D1a D1b 91.7 68.0 23.7 0.00 0.02 23.7
INRA_02411 B1a_197 D1a D1b 97.0 57.0 40.0 0.00 0.00 98.7 71.7 27.0 0.00 0.00 33.5
INRA_02424 B1b D1a D1a 64.7 43.0 21.7 0.46 0.01 61.7 52.3 9.3 0.97 0.11 15.5
INRA_02438 B1a_160 D1a D1a 89.7 47.7 42.0 0.00 0.00 42.0
INRA_02444 B1a_0 D1a D1b 106.5 78.5 28.0 0.00 0.00 28.0
INRA_02475 B1a_160 D1a D1b 77.0 49.0 28.0 0.01 0.00 28.0
INRA_02481 B1a_160 D1a D1a 72.3 47.0 25.3 0.05 0.00 80.7 51.7 29.0 0.04 0.00 27.2
INRA_02485 B1a_0 D1a D1b 104.3 71.5 32.8 0.00 0.00 32.8
Genotypeb GA exp. 1 GA exp. 2 GA exp. 3h
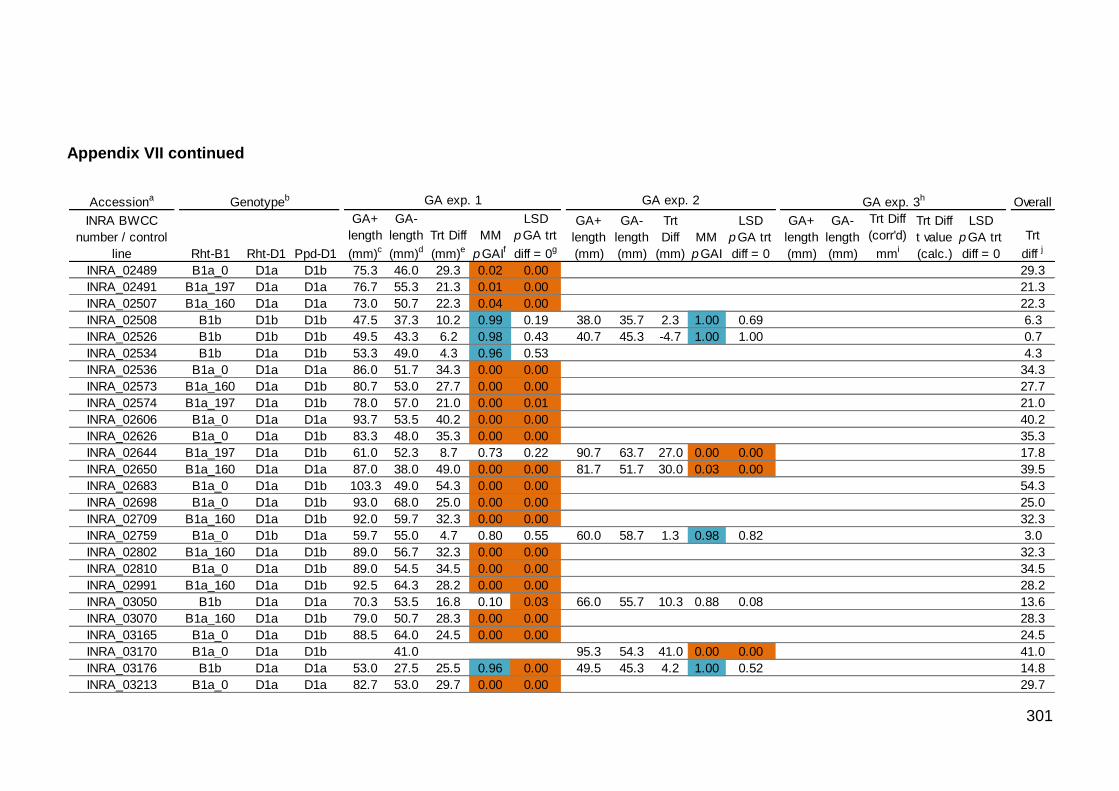
Appendix VII continued
301
Accessiona gap gap gap gap gapOverall
INRA BWCC
number / control
line gapRht-B1 Rht-D1 Ppd-D1 gap
GA+
length
(mm)c
GA-
length
(mm)d
Trt Diff
(mm)e
MM
pGAIf
LSD
pGA trt
diff = 0ggap
GA+
length
(mm)
GA-
length
(mm)
Trt
Diff
(mm)
MM
pGAI
LSD
pGA trt
diff = 0gap
GA+
length
(mm)
GA-
length
(mm)
Trt Diff
(corr'd)
mmi
Trt Diff
t value
(calc.)
LSD
pGA trt
diff = 0gap
Trt
diff j
INRA_02489 B1a_0 D1a D1b 75.3 46.0 29.3 0.02 0.00 29.3
INRA_02491 B1a_197 D1a D1a 76.7 55.3 21.3 0.01 0.00 21.3
INRA_02507 B1a_160 D1a D1a 73.0 50.7 22.3 0.04 0.00 22.3
INRA_02508 B1b D1b D1b 47.5 37.3 10.2 0.99 0.19 38.0 35.7 2.3 1.00 0.69 6.3
INRA_02526 B1b D1b D1b 49.5 43.3 6.2 0.98 0.43 40.7 45.3 -4.7 1.00 1.00 0.7
INRA_02534 B1b D1a D1b 53.3 49.0 4.3 0.96 0.53 4.3
INRA_02536 B1a_0 D1a D1a 86.0 51.7 34.3 0.00 0.00 34.3
INRA_02573 B1a_160 D1a D1b 80.7 53.0 27.7 0.00 0.00 27.7
INRA_02574 B1a_197 D1a D1b 78.0 57.0 21.0 0.00 0.01 21.0
INRA_02606 B1a_0 D1a D1a 93.7 53.5 40.2 0.00 0.00 40.2
INRA_02626 B1a_0 D1a D1b 83.3 48.0 35.3 0.00 0.00 35.3
INRA_02644 B1a_197 D1a D1b 61.0 52.3 8.7 0.73 0.22 90.7 63.7 27.0 0.00 0.00 17.8
INRA_02650 B1a_160 D1a D1a 87.0 38.0 49.0 0.00 0.00 81.7 51.7 30.0 0.03 0.00 39.5
INRA_02683 B1a_0 D1a D1b 103.3 49.0 54.3 0.00 0.00 54.3
INRA_02698 B1a_0 D1a D1b 93.0 68.0 25.0 0.00 0.00 25.0
INRA_02709 B1a_160 D1a D1b 92.0 59.7 32.3 0.00 0.00 32.3
INRA_02759 B1a_0 D1b D1a 59.7 55.0 4.7 0.80 0.55 60.0 58.7 1.3 0.98 0.82 3.0
INRA_02802 B1a_160 D1a D1b 89.0 56.7 32.3 0.00 0.00 32.3
INRA_02810 B1a_0 D1a D1b 89.0 54.5 34.5 0.00 0.00 34.5
INRA_02991 B1a_160 D1a D1b 92.5 64.3 28.2 0.00 0.00 28.2
INRA_03050 B1b D1a D1a 70.3 53.5 16.8 0.10 0.03 66.0 55.7 10.3 0.88 0.08 13.6
INRA_03070 B1a_160 D1a D1b 79.0 50.7 28.3 0.00 0.00 28.3
INRA_03165 B1a_0 D1a D1b 88.5 64.0 24.5 0.00 0.00 24.5
INRA_03170 B1a_0 D1a D1b 41.0 95.3 54.3 41.0 0.00 0.00 41.0
INRA_03176 B1b D1a D1a 53.0 27.5 25.5 0.96 0.00 49.5 45.3 4.2 1.00 0.52 14.8
INRA_03213 B1a_0 D1a D1a 82.7 53.0 29.7 0.00 0.00 29.7
Genotypeb GA exp. 1 GA exp. 2 GA exp. 3h

Appendix VII continued
302
Accessiona gap gap gap gap gapOverall
INRA BWCC
number / control
line gapRht-B1 Rht-D1 Ppd-D1 gap
GA+
length
(mm)c
GA-
length
(mm)d
Trt Diff
(mm)e
MM
pGAIf
LSD
pGA trt
diff = 0ggap
GA+
length
(mm)
GA-
length
(mm)
Trt
Diff
(mm)
MM
pGAI
LSD
pGA trt
diff = 0gap
GA+
length
(mm)
GA-
length
(mm)
Trt Diff
(corr'd)
mmi
Trt Diff
t value
(calc.)
LSD
pGA trt
diff = 0gap
Trt
diff j
INRA_03218 B1a_0 D1a D1b 95.7 63.3 32.3 0.00 0.00 32.3
INRA_03220 B1a_0 D1a D1a 92.0 70.7 21.3 0.00 0.00 21.3
INRA_03256 B1a_0 D1a D1b 87.3 51.0 36.3 0.00 0.00 99.0 60.7 38.3 0.00 0.00 37.3
INRA_03267 B1a_0 D1a D1b 100.5 57.0 43.5 0.00 0.00 43.5
INRA_03278 B1a_0 D1a D1b 68.0 44.3 23.7 0.21 0.00 73.0 58.0 15.0 0.41 0.01 50.8 29.0 17.1 7.35 0.00 18.6
INRA_03299 B1a_0 D1a D1a 57.7 39.3 18.3 0.88 0.01 67.0 50.3 16.7 0.84 0.00 48.0 25.0 18.0 7.74 0.00 17.7
INRA_03306 B1a_0 D1a D1a 83.7 61.0 22.7 0.00 0.00 22.7
INRA_03342 B1b D1a D1a 55.3 50.0 5.3 0.93 0.49 56.3 55.0 1.3 0.99 0.82 3.3
INRA_03358 B1a_0 D1a D1b 77.0 0.01 99.0 73.7 25.3 0.00 0.00 25.3
INRA_03366 B1a_160 D1a D1b 82.3 47.0 35.3 0.00 0.00 35.3
INRA_03402 B1b D1a D1a 51.3 46.3 5.0 0.97 0.47 48.0 46.0 2.0 1.00 0.73 3.5
INRA_03406 B1a_0 D1a D1b 71.7 60.0 11.7 0.06 0.24 86.0 50.7 35.3 0.01 0.00 23.5
INRA_03414 B1b D1a D1b 59.7 47.5 12.2 0.80 0.12 60.3 56.0 4.3 0.98 0.45 8.3
INRA_03437 B1a_0 D1a D1b 100.7 72.0 28.7 0.00 0.00 28.7
INRA_03442 B1a_0 D1a D1b 70.3 60.5 9.8 0.10 0.21 101.0 50.0 51.0 0.00 0.00 30.4
INRA_03463 B1b D1b D1a 43.7 42.0 1.7 0.99 0.83 1.7
INRA_03485 B1a_0 D1a D1b 74.3 113.3 89.0 24.3 0.00 0.00 24.3
INRA_03617 B1a_197 D1a D1b 65.7 49.0 16.7 0.38 0.02 75.5 59.7 15.8 0.23 0.02 60.0 33.2 21.0 8.63 0.00 17.8
INRA_03645 B1a_0 D1a D1b 93.3 64.3 29.0 0.00 0.00 29.0
INRA_03665 B1a_0 D1b D1a 57.7 45.3 12.3 0.88 0.08 56.0 48.3 7.7 0.99 0.19 10.0
INRA_03696 B1a_0 D1a D1b 99.0 61.7 37.3 0.00 0.00 37.3
INRA_03752 B1a_0 D1a NP 110.0 41.0 69.0 0.00 0.00 53.0 48.3 4.7 1.00 0.42 72.5 33.5 30.5 7.71 0.00 34.7
INRA_03753 B1a_0 D1a D1b 99.5 60.3 39.2 0.00 0.00 39.2
INRA_03804 B1b D1a D1a 65.0 58.3 6.7 0.43 0.39 63.7 61.5 2.2 0.94 0.74 4.4
INRA_03857 B1b D1b D1a 42.3 38.0 4.3 0.99 0.53 4.3
INRA_03896 B1a_197 D1a D1a 77.0 49.0 28.0 0.01 0.00 78.3 52.0 26.3 0.10 0.00 27.2
Genotypeb GA exp. 1 GA exp. 2 GA exp. 3h

Appendix VII continued
303
Accessiona gap gap gap gap gapOverall
INRA BWCC
number / control
line gapRht-B1 Rht-D1 Ppd-D1 gap
GA+
length
(mm)c
GA-
length
(mm)d
Trt Diff
(mm)e
MM
pGAIf
LSD
pGA trt
diff = 0ggap
GA+
length
(mm)
GA-
length
(mm)
Trt
Diff
(mm)
MM
pGAI
LSD
pGA trt
diff = 0gap
GA+
length
(mm)
GA-
length
(mm)
Trt Diff
(corr'd)
mmi
Trt Diff
t value
(calc.)
LSD
pGA trt
diff = 0gap
Trt
diff j
INRA_03912 B1a_160 D1a D1b 96.7 60.3 36.3 0.00 0.00 36.3
INRA_03942 B1a_0 D1a D1b 88.0 66.0 22.0 0.00 0.03 94.0 69.7 24.3 0.00 0.00 23.2
INRA_03965 B1a_0 D1a D1a 86.3 58.0 28.3 0.00 0.00 89.7 67.3 22.3 0.00 0.00 25.3
INRA_03970 B1a_160 D1a D1b 85.7 0.00 95.2 65.5 29.7 0.00 0.00 29.7
INRA_03975 B1a_0 D1a D1b 93.0 73.0 20.0 0.00 0.02 20.0
INRA_03991 B1a_0 D1a D1a 82.0 45.0 37.0 0.00 0.00 37.0
INRA_04036 B1a_0 D1a D1b 43.0 80.7 61.3 19.3 0.04 0.00 19.3
INRA_04055 B1a_0 D1a D1b 94.3 68.0 26.3 0.00 0.00 26.3
INRA_04067 B1a_0 D1a D1b 62.0 62.0 0.0 0.67 1.00 97.7 67.3 30.3 0.00 0.00 15.2
INRA_04105 B1a_160 D1a D1b 85.0 70.0 15.0 0.00 0.15 90.3 58.3 32.0 0.00 0.00 23.5
INRA_04111 B1a_0 D1a D1b 86.0 45.3 40.7 0.00 0.00 40.7
INRA_04157 B1a_0 D1a D1b 96.5 62.0 34.5 0.00 0.00 34.5
INRA_04187 B1a_0 D1a D1b 77.0 54.7 22.3 0.01 0.00 22.3
INRA_04194 B1a_160 D1a D1b 92.3 68.0 24.3 0.00 0.00 24.3
INRA_04207 B1a_0 D1a D1b 83.5 62.5 21.0 0.00 0.01 21.0
INRA_04300 B1a_160 D1a D1b 94.0 60.5 33.5 0.00 0.00 33.5
INRA_04324 B1a_197 D1a D1b 96.0 65.0 31.0 0.00 0.00 31.0
INRA_04343 B1a_0 D1a D1b 104.0 70.0 34.0 0.00 0.00 34.0
INRA_04477 B1a_0 D1a D1b 79.0 54.5 24.5 0.00 0.00 24.5
INRA_04482 B1a_0 D1a D1b 90.5 61.0 29.5 0.00 0.01 92.3 77.0 15.3 0.00 0.01 22.4
INRA_04487 B1a_0 D1a D1b 123.3 73.7 49.7 0.00 0.00 49.7
INRA_04492 B1a_0 D1a D1b 84.0 55.5 28.5 0.00 0.00 28.5
INRA_04525 B1a_160 D1a D1b 76.0 67.0 9.0 0.01 0.36 88.3 53.7 34.7 0.00 0.00 21.8
INRA_04645 B1a_0 D1a D1b 111.0 77.7 33.3 0.00 0.00 33.3
INRA_04664
B1a_0/16
0 het D1b D1b 47.5 59.0 -11.5 0.99 1.00 58.0 52.3 5.7 0.99 0.38 -2.9
Genotypeb GA exp. 1 GA exp. 2 GA exp. 3h

Appendix VII continued
304
Accessiona gap gap gap gap gapOverall
INRA BWCC
number / control
line gapRht-B1 Rht-D1 Ppd-D1 gap
GA+
length
(mm)c
GA-
length
(mm)d
Trt Diff
(mm)e
MM
pGAIf
LSD
pGA trt
diff = 0ggap
GA+
length
(mm)
GA-
length
(mm)
Trt
Diff
(mm)
MM
pGAI
LSD
pGA trt
diff = 0gap
GA+
length
(mm)
GA-
length
(mm)
Trt Diff
(corr'd)
mmi
Trt Diff
t value
(calc.)
LSD
pGA trt
diff = 0gap
Trt
diff j
INRA_04670 B1a_0 D1a D1b 77.5 63.0 14.5 0.01 0.09 14.5
INRA_04698 B1a_197 D1a D1a 68.0 62.0 6.0 0.21 0.44 77.3 55.7 21.7 0.13 0.00 53.5 34.5 14.9 6.40 0.00 14.2
INRA_04702
B1a_0/19
7 het D1a D1b 91.7 58.7 33.0 0.00 0.00 33.0
INRA_04706 B1a_0 D1a D1b 81.3 57.7 23.7 0.00 0.00 83.3 56.0 27.3 0.02 0.00 25.5
INRA_04712 B1a_0 D1a D1b 86.5 65.3 21.2 0.00 0.01 21.2
INRA_04776 B1a_0 D1b D1a 54.0 52.3 1.7 0.95 0.83 53.3 57.3 -4.0 1.00 1.00 -1.2
INRA_04784 B1b D1a D1b 60.0 47.0 13.0 0.78 0.10 57.3 46.3 11.0 0.99 0.06 12.0
INRA_04796 B1a_160 D1a D1b 76.5 61.3 15.2 0.01 0.05 88.7 58.3 30.3 0.00 0.00 22.8
INRA_04838 B1a_0 D1a D1b 99.0 60.7 38.3 0.00 0.00 38.3
INRA_04874 B1a_0 D1a D1b 95.7 72.0 23.7 0.00 0.00 23.7
INRA_04901 B1a_197 D1a D1b 108.0 69.7 38.3 0.00 0.00 38.3
INRA_04925 B1a_0 D1a D1a 80.5 53.7 26.8 0.00 0.00 26.8
INRA_04947 B1a_0 D1a D1b 101.3 63.5 37.8 0.00 0.00 37.8
INRA_04991 B1b D1a D1b 51.3 47.3 4.0 0.97 0.57 4.0
INRA_05088 B1b D1b D1a 44.5 43.3 1.2 0.99 0.88 1.2
INRA_05096 B1b D1b D1a 42.5 41.0 1.5 0.99 0.86 1.5
INRA_05102 B1a_0 D1a D1b 92.5 72.0 20.5 0.00 0.01 20.5
INRA_05108 B1a_0 D1a D1b 95.0 70.7 24.3 0.00 0.00 24.3
INRA_05115 B1a_0 D1a D1a 79.0 42.3 36.7 0.00 0.00 36.7
INRA_05116 B1a_0 D1a D1b 97.0 56.0 41.0 0.00 0.00 98.0 55.3 42.7 0.00 0.00 41.8
INRA_05120 B1a_160 D1a D1a 75.0 47.7 27.3 0.02 0.00 27.3
INRA_05166 B1a_0 D1a D1b 86.3 61.0 25.3 0.00 0.01 25.3
INRA_05167 B1a_0 D1a D1b 92.3 70.3 22.0 0.00 0.00 22.0
INRA_05219 B1a_0 D1a D1a 33.5 66.7 48.3 18.3 0.85 0.00 44.0 27.2 13.2 5.41 0.00 15.7
Genotypeb GA exp. 1 GA exp. 2 GA exp. 3h

Appendix VII continued
305
Accessiona gap gap gap gap gapOverall
INRA BWCC
number / control
line gapRht-B1 Rht-D1 Ppd-D1 gap
GA+
length
(mm)c
GA-
length
(mm)d
Trt Diff
(mm)e
MM
pGAIf
LSD
pGA trt
diff = 0ggap
GA+
length
(mm)
GA-
length
(mm)
Trt
Diff
(mm)
MM
pGAI
LSD
pGA trt
diff = 0gap
GA+
length
(mm)
GA-
length
(mm)
Trt Diff
(corr'd)
mmi
Trt Diff
t value
(calc.)
LSD
pGA trt
diff = 0gap
Trt
diff j
INRA_05250 B1a_160
D1a/b
het D1a 77.7 55.0 22.7 0.01 0.00 66.0 64.0 2.0 0.88 0.76 12.3
INRA_05260 B1a_0 D1b D1a 40.0 38.3 1.7 1.00 0.81 1.7
INRA_05266 B1a/b het
D1a/b
het D1a 61.0 38.3 22.7 0.73 0.00 40.7 41.0 -0.3 1.00 1.00 11.2
INRA_05293 B1a_160 D1a D1b 80.0 51.0 29.0 0.00 0.00 85.0 49.7 35.3 0.01 0.00 32.2
INRA_05308 B1a_0 D1a D1b 91.0 0.00 103.7 73.0 30.7 0.00 0.00 30.7
INRA_05399 B1a_0 D1a D1b 73.0 56.0 17.0 0.04 0.03 83.3 64.0 19.3 0.02 0.00 18.2
INRA_05401 B1a_0 D1b D1a 49.3 39.7 9.7 0.98 0.17 52.0 44.3 7.7 1.00 0.19 8.7
INRA_05415 B1a_0 D1a D1b 98.7 71.0 27.7 0.00 0.00 27.7
INRA_05419 B1a_197 D1a D1b 91.0 68.0 23.0 0.00 0.01 23.0
INRA_05421 B1a_0 D1a D1b 93.0 80.7 12.3 0.00 0.08 99.7 82.3 17.3 0.00 0.00 14.8
INRA_05425 B1a_0 D1a D1b 95.5 60.7 34.8 0.00 0.00 34.8
INRA_05438 B1a_0 D1b D1a 51.0 49.0 2.0 0.97 0.80 2.0
INRA_05448 B1b D1a D1a 55.0 47.0 8.0 0.93 0.44 65.3 54.7 10.7 0.90 0.07 9.3
INRA_05486 B1a_0 D1a D1b 90.0 61.0 29.0 0.00 0.00 103.5 64.0 39.5 0.00 0.00 34.3
INRA_05501 B1b D1a D1a 52.0 54.5 -2.5 0.97 1.00 59.7 62.7 -3.0 0.98 1.00 -2.8
INRA_05536 B1a_0 D1a D1b 98.7 59.3 39.3 0.00 0.00 39.3
INRA_05552 B1a_0 D1a D1b 77.0 68.7 8.3 0.01 0.29 87.7 65.3 22.3 0.00 0.00 15.3
INRA_05558 B1b D1a D1b 63.0 52.7 10.3 0.59 0.14 62.3 51.3 11.0 0.96 0.06 10.7
INRA_05636 B1a_0 D1b D1a 63.3 50.3 13.0 0.57 0.06 60.3 49.0 11.3 0.98 0.05 12.2
INRA_05702 B1a_0 D1a D1b 99.7 60.0 39.7 0.00 0.00 39.7
INRA_05748 B1a_0 D1b D1a 52.0 52.5 -0.5 0.97 1.00 -0.5
INRA_05773 B1a_0 D1a D1b 96.5 66.0 30.5 0.00 0.00 107.3 73.7 33.7 0.00 0.00 32.1
INRA_05816 B1a_197 D1a D1b 87.5 71.7 15.8 0.00 0.04 15.8
INRA_05821 B1a_0 D1a D1b 78.5 60.0 18.5 0.00 0.08 84.3 55.7 28.7 0.01 0.00 23.6
Genotypeb GA exp. 1 GA exp. 2 GA exp. 3h

Appendix VII continued
306
Accessiona gap gap gap gap gapOverall
INRA BWCC
number / control
line gapRht-B1 Rht-D1 Ppd-D1 gap
GA+
length
(mm)c
GA-
length
(mm)d
Trt Diff
(mm)e
MM
pGAIf
LSD
pGA trt
diff = 0ggap
GA+
length
(mm)
GA-
length
(mm)
Trt
Diff
(mm)
MM
pGAI
LSD
pGA trt
diff = 0gap
GA+
length
(mm)
GA-
length
(mm)
Trt Diff
(corr'd)
mmi
Trt Diff
t value
(calc.)
LSD
pGA trt
diff = 0gap
Trt
diff j
INRA_05897 B1a_0 D1b D1b 60.7 50.0 10.7 0.75 0.13 60.7 55.7 5.0 0.97 0.39 7.8
INRA_06027 B1b D1a D1a 60.0 41.0 19.0 0.78 0.07 61.7 48.0 13.7 0.97 0.02 16.3
INRA_06047 B1a_0 D1a D1b 84.7 67.0 17.7 0.00 0.01 17.7
INRA_06086 B1b D1a D1b 60.7 48.5 12.2 0.75 0.12 53.0 47.3 5.7 1.00 0.33 8.9
INRA_06170 B1a_0 D1a D1b 63.0 55.5 7.5 0.59 0.47 96.3 62.7 33.7 0.00 0.00 20.6
INRA_06191 B1a_197 D1a D1b 92.0 45.0 47.0 0.00 0.00 47.0
INRA_06198 B1a_0 D1a D1b 84.7 72.0 12.7 0.00 0.20 104.0 86.0 18.0 0.00 0.00 61.0 45.3 12.2 5.27 0.00 14.3
INRA_06308 B1a_0 D1a D1b 89.3 59.7 29.7 0.00 0.00 29.7
INRA_06318 B1a_0 D1a D1b 91.3 67.5 23.8 0.00 0.00 23.8
INRA_06396 B1a_0 D1a D1a 65.0 0.43 77.7 57.0 20.7 0.12 0.00 54.3 36.2 14.2 5.83 0.00 17.4
INRA_06522 B1a_0 D1b D1a 57.7 44.0 13.7 0.88 0.08 47.7 54.7 -7.0 1.00 1.00 3.3
INRA_06529 B1a_0 D1a D1b 74.7 57.0 17.7 0.02 0.07 79.0 67.0 12.0 0.08 0.17 62.0 29.8 25.1 10.83 0.00 18.3
INRA_06575 B1a_0 D1b D1a 41.0 36.5 4.5 1.00 0.56 4.5
INRA_06605 B1a_197 D1a D1b 84.3 60.7 23.7 0.00 0.00 23.7
INRA_06740 B1a_160 D1a D1b 70.7 55.7 15.0 0.09 0.03 88.0 63.0 25.0 0.00 0.00 20.0
INRA_06843 B1a_0 D1a D1b 65.5 54.0 11.5 0.39 0.27 88.3 55.3 33.0 0.00 0.00 22.3
INRA_06846 B1a_0 D1a D1b 105.0 63.0 42.0 0.00 0.00 42.0
INRA_06922 B1a_197 D1a D1a 77.3 61.0 16.3 0.01 0.04 57.5 24.3 25.9 11.17 0.00 21.1
INRA_06986 B1_197 D1a D1b 34.0 35.0 -1.0 1.00 1.00 27.3 31.0 -3.7 1.00 1.00 -2.3
INRA_07011 B1a_0 D1a D1b 85.5 60.0 25.5 0.00 0.00 25.5
INRA_07026 B1a_0 D1a D1b 66.3 55.5 10.8 0.33 0.17 90.7 63.3 27.3 0.00 0.00 19.1
INRA_07040 B1a_0 D1a D1b 104.0 67.7 36.3 0.00 0.00 36.3
INRA_07048 B1a_0 D1a D1b 89.0 57.0 32.0 0.00 0.00 32.0
INRA_07085 B1a_0 D1a D1a 72.5 51.0 21.5 0.05 0.04 75.0 57.3 17.7 0.26 0.00 55.8 28.0 21.8 9.37 0.00 20.3
INRA_07092 B1b D1a D1b 64.5 41.7 22.8 0.47 0.00 62.7 53.7 9.0 0.95 0.12 15.9
INRA_07117 B1a_197 D1a D1b 89.5 64.0 25.5 0.00 0.00 25.5
Genotypeb GA exp. 1 GA exp. 2 GA exp. 3h

Appendix VII continued
307
Accessiona gap gap gap gap gapOverall
INRA BWCC
number / control
line gapRht-B1 Rht-D1 Ppd-D1 gap
GA+
length
(mm)c
GA-
length
(mm)d
Trt Diff
(mm)e
MM
pGAIf
LSD
pGA trt
diff = 0ggap
GA+
length
(mm)
GA-
length
(mm)
Trt
Diff
(mm)
MM
pGAI
LSD
pGA trt
diff = 0gap
GA+
length
(mm)
GA-
length
(mm)
Trt Diff
(corr'd)
mmi
Trt Diff
t value
(calc.)
LSD
pGA trt
diff = 0gap
Trt
diff j
INRA_07166 B1a_0 D1a D1b 102.0 62.5 39.5 0.00 0.00 99.3 63.0 36.3 0.00 0.00 37.9
INRA_07276 B1a_0 D1a D1b 92.0 62.3 29.7 0.00 0.00 29.7
INRA_07279 B1a_197 D1a D1b 82.5 55.0 27.5 0.00 0.00 27.5
INRA_07490 B1a_0 D1a D1b 76.5 55.0 21.5 0.01 0.01 21.5
INRA_07585 B1a_197 D1a D1b 96.0 55.7 40.3 0.00 0.00 40.3
INRA_07848 B1a_0 D1b D1b 53.3 47.0 6.3 0.96 0.52 53.3 55.0 -1.7 1.00 1.00 2.3
INRA_07965 B1a_0 D1a D1b 89.0 54.0 35.0 0.00 0.00 35.0
INRA_07968 B1a_0 D1a D1b 101.0 69.0 32.0 0.00 0.00 32.0
INRA_07973 B1a_0 D1a D1a 111.3 77.3 34.0 0.00 0.00 34.0
INRA_07988 B1a_160 D1a D1b 97.0 61.0 36.0 0.00 0.00 110.0 69.3 40.7 0.00 0.00 38.3
INRA_08011 B1a_160 D1a D1b 75.3 73.0 2.3 0.02 0.81 60.8 35.8 19.6 8.05 0.00 11.0
INRA_08048 B1a_0 D1a D1b 89.7 60.3 29.3 0.00 0.00 29.3
INRA_08051 B1a_0 D1a D1b 114.3 69.0 45.3 0.00 0.00 45.3
INRA_08058 B1a_160 D1a D1b 92.0 60.0 32.0 0.00 0.00 82.7 66.3 16.3 0.02 0.01 24.2
INRA_08073 B1a_0 D1a D1b 66.7 62.5 4.2 0.30 0.59 86.7 56.7 30.0 0.00 0.00 17.1
INRA_08079 B1a_0 D1a D1b 84.0 54.5 29.5 0.00 0.00 29.5
INRA_08097 B1a_0 D1a D1b 95.0 64.7 30.3 0.00 0.00 30.3
INRA_08113 B1a_0 D1a D1a 100.5 64.0 36.5 0.00 0.00 36.5
INRA_08165 B1a_160 D1a D1a 77.3 52.5 24.8 0.01 0.00 24.8
INRA_08170 B1b D1b D1a 53.7 46.7 7.0 0.95 0.32 49.7 46.7 3.0 1.00 0.60 5.0
INRA_08194 B1b D1a D1a 65.3 47.0 18.3 0.40 0.01 60.0 40.3 19.7 0.98 0.00 19.0
INRA_08197 B1b D1a D1a 70.3 57.7 12.7 0.10 0.07 67.7 63.0 4.7 0.81 0.42 8.7
INRA_08227 B1b D1a D1a 45.3 34.5 10.8 0.99 0.17 45.7 44.7 1.0 1.00 0.86 5.9
INRA_08233 B1a_0 D1a D1b 71.7 55.7 16.0 0.06 0.02 87.5 59.3 28.2 0.00 0.00 22.1
INRA_08254 B1a_0 D1a D1b 95.7 64.7 31.0 0.00 0.00 31.0
INRA_08276 B1a_160 D1a D1b 76.3 62.3 14.0 0.01 0.05 54.8 35.5 15.1 6.51 0.00 14.6
Genotypeb GA exp. 1 GA exp. 2 GA exp. 3h

Appendix VII continued
308
Accessiona gap gap gap gap gapOverall
INRA BWCC
number / control
line gapRht-B1 Rht-D1 Ppd-D1 gap
GA+
length
(mm)c
GA-
length
(mm)d
Trt Diff
(mm)e
MM
pGAIf
LSD
pGA trt
diff = 0ggap
GA+
length
(mm)
GA-
length
(mm)
Trt
Diff
(mm)
MM
pGAI
LSD
pGA trt
diff = 0gap
GA+
length
(mm)
GA-
length
(mm)
Trt Diff
(corr'd)
mmi
Trt Diff
t value
(calc.)
LSD
pGA trt
diff = 0gap
Trt
diff j
INRA_08280 B1a_197 D1a NP 92.3 57.0 35.3 0.00 0.00 35.3
INRA_08287 B1a_197 D1b D1b 53.7 49.0 4.7 0.95 0.55 4.7
INRA_08289 B1a_160 D1b D1b 49.7 46.7 3.0 0.98 0.67 3.0
INRA_08513 B1b D1b D1a 42.7 42.0 0.7 0.99 0.92 0.7
INRA_08578 B1b D1a D1a 71.5 59.7 11.8 0.07 0.13 77.0 72.0 5.0 0.15 0.56 8.4
INRA_09024 B1a_160 D1b D1b 41.7 43.7 -2.0 0.99 1.00 -2.0
INRA_09048 B1a_0 D1a D1b 82.0 61.5 20.5 0.00 0.05 90.0 54.0 36.0 0.00 0.00 28.3
INRA_09077 B1a_160 D1a D1b 31.0 87.7 59.0 28.7 0.00 0.00 28.7
INRA_09087 B1a_160 D1a D1b 87.3 57.5 29.8 0.00 0.00 29.8
INRA_13210 B1b D1a D1a 63.7 48.7 15.0 0.54 0.03 59.3 48.5 10.8 0.98 0.10 12.9
INRA_13282 B1a_197 D1a D1a 70.3 53.7 16.7 0.10 0.02 82.7 52.7 30.0 0.02 0.00 23.3
INRA_13286 B1a_0 D1a D1b 102.0 71.5 30.5 0.00 0.00 112.0 82.0 30.0 0.00 0.00 30.3
INRA_13292 B1a_0 D1a D1b 94.0 69.0 25.0 0.00 0.02 103.3 73.0 30.3 0.00 0.00 27.7
INRA_13310 B1a_160 D1a D1b 90.3 70.3 20.0 0.00 0.00 20.0
INRA_13436 B1a_0 D1a D1b 90.7 63.7 27.0 0.00 0.00 27.0
INRA_13440 B1a_0 D1a D1b 86.0 53.5 32.5 0.00 0.00 32.5
INRA_13445 B1b D1a D1a 60.0 48.7 11.3 0.78 0.11 11.3
INRA_13454 B1a_197 D1b D1b 46.3 43.0 3.3 0.99 0.63 3.3
INRA_13461 B1a_160 D1b D1b 52.0 50.0 2.0 0.97 0.80 2.0
INRA_13471 B1b D1a D1b 62.3 52.0 10.3 0.64 0.19 54.7 49.7 5.0 1.00 0.39 7.7
INRA_13476 B1b D1a D1a 64.5 45.0 19.5 0.47 0.01 58.3 49.0 9.3 0.99 0.11 14.4
INRA_13481 B1a_160 D1a D1a 70.7 50.0 20.7 0.09 0.00 64.0 52.7 11.3 0.93 0.05 52.3 30.0 17.5 7.52 0.00 16.5
INRA_13494 B1a_197 D1b D1a 43.5 37.3 6.2 0.99 0.43 44.3 41.3 3.0 1.00 0.60 4.6
INRA_13500 B1a_197 D1b D1b 50.0 45.3 4.7 0.98 0.55 4.7
INRA_13502 B1a_0 D1b D1a 45.7 37.0 8.7 0.99 0.27 53.0 46.7 6.3 1.00 0.27 7.5
INRA_13642 B1a_0 D1a D1b 77.0 51.3 25.7 0.01 0.00 25.7
Genotypeb GA exp. 1 GA exp. 2 GA exp. 3h

Appendix VII continued
309
Accessiona gap gap gap gap gapOverall
INRA BWCC
number / control
line gapRht-B1 Rht-D1 Ppd-D1 gap
GA+
length
(mm)c
GA-
length
(mm)d
Trt Diff
(mm)e
MM
pGAIf
LSD
pGA trt
diff = 0ggap
GA+
length
(mm)
GA-
length
(mm)
Trt
Diff
(mm)
MM
pGAI
LSD
pGA trt
diff = 0gap
GA+
length
(mm)
GA-
length
(mm)
Trt Diff
(corr'd)
mmi
Trt Diff
t value
(calc.)
LSD
pGA trt
diff = 0gap
Trt
diff j
INRA_13781 B1a_0 D1a D1a 89.0 60.0 29.0 0.00 0.00 88.3 60.7 27.7 0.00 0.00 28.3
INRA_13792 B1a_160 D1a D1b 96.3 54.5 41.8 0.00 0.00 41.8
INRA_13799 B1a_0 D1a D1a 72.7 48.0 24.7 0.04 0.00 24.7
INRA_13800 B1a_0 D1a D1b 96.0 61.5 34.5 0.00 0.00 93.3 63.3 30.0 0.00 0.00 32.3
INRA_13811 B1b D1a D1b 72.5 48.0 24.5 0.05 0.00 71.3 54.3 17.0 0.55 0.00 20.8
INRA_13812 B1b D1a 450bp 75.0 58.0 17.0 0.02 0.09 77.3 66.0 11.3 0.13 0.05 14.2
INRA_13861 B1a_197 D1b D1b 45.7 37.5 8.2 0.99 0.29 48.7 40.0 8.7 1.00 0.13 8.4
INRA_13870 B1a_197 D1b D1b 52.7 47.3 5.3 0.96 0.44 57.0 48.7 8.3 0.99 0.15 6.8
INRA_13978 B1a_0 D1a D1b 82.3 31.0 51.3 0.00 0.00 97.5 72.3 25.2 0.00 0.00 38.3
INRA_14000 B1a_160 D1a D1b 84.3 47.3 37.0 0.00 0.00 37.0
INRA_14011 B1a_160 D1a D1a 69.7 42.0 27.7 0.13 0.00 78.3 55.3 23.0 0.10 0.00 25.3
INRA_15606 B1a_0 D1a D1b 89.3 65.3 24.0 0.00 0.00 24.0
INRA_15652 B1a_0 D1a D1b 84.7 64.7 20.0 0.00 0.00 20.0
INRA_15658 B1a_0 D1a D1b 105.0 66.3 38.7 0.00 0.00 38.7
INRA_15710 B1a_0 D1a D1b 91.7 58.3 33.3 0.00 0.00 33.3
INRA_15809 B1a_0 D1a D1b 88.7 58.0 30.7 0.00 0.00 30.7
INRA_15950 B1a_197 D1b D1b 44.3 37.7 6.7 0.99 0.34 44.7 40.0 4.7 1.00 0.42 5.7
INRA_15954 B1a_160 D1a D1a 74.3 41.0 33.3 0.02 0.00 33.3
INRA_20074 B1a_0 D1b D1b 54.3 48.7 5.7 0.94 0.42 51.0 49.3 1.7 1.00 0.77 3.7
INRA_20224 B1a_0 D1b D1a 76.0 46.5 29.5 0.01 0.00 61.3 50.0 11.3 0.97 0.05 20.4
INRA_20276 B1a_197 D1b D1b 59.0 44.0 15.0 0.83 0.06 49.0 50.7 -1.7 1.00 0.00 6.7
INRA_20384 B1b D1a D1b 55.7 48.5 7.2 0.92 0.36 58.3 50.3 8.0 0.99 0.17 7.6
INRA_20417 B1a_160 D1b D1b 48.3 49.0 -0.7 0.98 1.00 -0.7
INRA_23891 B1a_0 D1a D1b 78.0 63.0 15.0 0.00 0.03 15.0
INRA_23896 B1a_0 D1a D1b 97.5 72.7 24.8 0.00 0.00 24.8
INRA_23902 B1a_0 D1a NP 97.0 75.3 21.7 0.00 0.00 21.7
Genotypeb GA exp. 1 GA exp. 2 GA exp. 3h

Appendix VII continued
310
Accessiona gap gap gap gap gapOverall
INRA BWCC
number / control
line gapRht-B1 Rht-D1 Ppd-D1 gap
GA+
length
(mm)c
GA-
length
(mm)d
Trt Diff
(mm)e
MM
pGAIf
LSD
pGA trt
diff = 0ggap
GA+
length
(mm)
GA-
length
(mm)
Trt
Diff
(mm)
MM
pGAI
LSD
pGA trt
diff = 0gap
GA+
length
(mm)
GA-
length
(mm)
Trt Diff
(corr'd)
mmi
Trt Diff
t value
(calc.)
LSD
pGA trt
diff = 0gap
Trt
diff j
INRA_23909 B1a_0 D1a D1b 97.0 56.3 40.7 0.00 0.00 40.7
INRA_23923 B1a_0 D1a D1b 89.0 54.7 34.3 0.00 0.00 34.3
INRA_23933 B1a_0 D1a D1b 114.0 81.0 33.0 0.00 0.01 113.8 64.8 49.0 0.00 0.00 41.0
INRA_23934 B1a_0 D1a D1b 86.0 66.0 20.0 0.00 0.02 20.0
INRA_23937 B1a_0 D1a D1b 98.5 76.5 22.0 0.00 0.01 22.0
INRA_23944 B1a_0 D1a D1b 89.7 57.0 32.7 0.00 0.00 105.7 67.3 38.3 0.00 0.00 35.5
INRA_23945 B1a_0 D1a D1b 95.3 65.5 29.8 0.00 0.00 29.8
INRA_23950 B1a_160 D1a D1b 77.5 54.0 23.5 0.01 0.03 91.7 66.3 25.3 0.00 0.00 24.4
INRA_23957 B1a_0 D1a D1b 87.3 65.0 22.3 0.00 0.00 22.3
INRA_23960 B1a_0 D1a D1b 88.0 70.0 18.0 0.00 0.09 113.3 77.7 35.7 0.00 0.00 26.8
INRA_23964 B1a_0 D1a D1b 97.5 65.0 32.5 0.00 0.00 32.5
INRA_23970 B1a_0 D1a D1b 59.0 102.0 66.8 35.2 0.00 0.00 35.2
INRA_23971 B1a_0 D1a D1b 113.3 83.7 29.7 0.00 0.00 29.7
INRA_23974 B1a_0 D1a D1b 96.3 77.0 19.3 0.00 0.01 19.3
INRA_23977 B1a_0 D1a D1b 84.0 71.5 12.5 0.00 0.14 94.7 71.3 23.3 0.00 0.00 17.9
INRA_23981 B1a_0 D1a D1b 89.0 60.0 29.0 0.00 0.02 100.3 69.7 30.7 0.00 0.00 29.8
INRA_23989 B1a_0 D1a NP 72.7 58.3 14.3 0.04 0.04 94.7 66.3 28.3 0.00 0.00 21.3
INRA_23995 B1a_0 D1a D1b 94.5 72.7 21.8 0.00 0.01 21.8
INRA_23996 B1a_0 D1a D1b 94.5 56.5 38.0 0.00 0.00 105.7 75.3 30.3 0.00 0.00 34.2
INRA_24003 B1a_0 D1a D1b 88.0 63.0 25.0 0.00 0.00 25.0
INRA_24006 B1a_0 D1a D1b 85.0 42.0 43.0 0.00 0.00 43.0
INRA_24019 B1a_160 D1a D1b 103.3 68.0 35.3 0.00 0.00 107.7 73.7 34.0 0.00 0.00 34.7
INRA_24031 B1a_160 D1a D1b 84.7 54.7 30.0 0.00 0.00 30.0
INRA_24054 B1a_0 D1a D1b 80.0 53.3 26.7 0.00 0.00 26.7
INRA_24056 B1a_0 D1a D1b 108.0 63.0 45.0 0.00 0.00 103.7 76.0 27.7 0.00 0.00 36.3
INRA_24058 B1a_0 D1a D1b 85.3 57.7 27.7 0.00 0.00 27.7
Genotypeb GA exp. 1 GA exp. 2 GA exp. 3h

Appendix VII continued
311
a Accession information on the INRA BWCC (Bread wheat core collection) received from F. Balfourier, INRA. Control lines are also included.
b Genotyping was performed using DNA from the INRA BWCC outdoor experiment, which consisted of two separate bulks of four plants for fixed lines and four
individual plants for landraces. Heterozygotes (het) are shown with segregating alleles separated by a "/". NP = no product. c GA+ length = Seed-to-first-ligule (STFL) length in the GA+ treatment
d GA- length = STFL length in the GA- treatment
e Treatment difference (Trt Diff) = GA+ length minus GA- length.
Accessiona gap gap gap gap gapOverall
INRA BWCC
number / control
line gapRht-B1 Rht-D1 Ppd-D1 gap
GA+
length
(mm)c
GA-
length
(mm)d
Trt Diff
(mm)e
MM
pGAIf
LSD
pGA trt
diff = 0ggap
GA+
length
(mm)
GA-
length
(mm)
Trt
Diff
(mm)
MM
pGAI
LSD
pGA trt
diff = 0gap
GA+
length
(mm)
GA-
length
(mm)
Trt Diff
(corr'd)
mmi
Trt Diff
t value
(calc.)
LSD
pGA trt
diff = 0gap
Trt
diff j
INRA_24066 B1a_0 D1a D1b 88.0 61.7 26.3 0.00 0.00 26.3
INRA_24075 B1a_0 D1a D1b 89.7 67.0 22.7 0.00 0.02 112.7 69.0 43.7 0.00 0.00 33.2
INRA_24080 B1a_0 D1a D1b 92.3 63.0 29.3 0.00 0.00 29.3
INRA_24089 B1a_0 D1a NP 94.7 64.3 30.3 0.00 0.00 30.3
INRA_24108 B1a_160 D1a D1b 81.0 43.0 38.0 0.00 0.00 38.0
INRA_24180 B1a_0 D1a D1b 98.0 67.0 31.0 0.00 0.00 108.0 71.7 36.3 0.00 0.00 33.7
INRA_24184 B1a_0 D1a D1b 88.0 61.0 27.0 0.00 0.00 27.0
INRA_24185 B1a_0 D1a D1b 97.0 67.0 30.0 0.00 0.00 30.0
INRA_24186 B1a_0 D1a D1b 90.5 61.3 29.2 0.00 0.00 29.2
INRA_24193 B1a_0 D1a NP 78.0 51.5 26.5 0.00 0.00 26.5
INRA_24196 B1a_0 D1a D1b 105.3 69.5 35.8 0.00 0.00 35.8
INRA_24209 B1a_0 D1a D1b 122.7 77.0 45.7 0.00 0.00 45.7
INRA_24210 B1a_160 D1a D1b 83.5 57.0 26.5 0.00 0.00 26.5
AB B1a D1a D1b 88.1 57.3 30.8 0.00 0.00 93.9 63.7 30.2 0.00 0.00 61.0 36.5 19.2 4.84 0.00 26.7
AB_Rht-D1b B1a D1b D1b 55.5 51.8 3.7 0.93 0.48 54.9 52.2 2.7 1.00 0.49 45.5 37.5 6.3 1.58 0.13 4.2
AB_Rht-B1c B1_197 D1a D1b 29.3 27.0 2.3 1.00 0.66 28.6 26.2 2.3 1.00 0.55 28.0 26.0 1.6 0.40 0.70 2.1
Bersee B1a D1a D1b 94.1 64.6 29.4 0.00 0.00 95.6 69.8 25.8 0.00 0.00 72.5 36.0 28.5 7.21 0.00 27.9
Bersee_Rht-B1b B1b D1a D1b 70.8 61.8 9.0 0.09 0.09 68.1 58.3 9.8 0.78 0.02 59.0 36.5 17.6 4.45 0.00 12.1
Mercia B1a D1a D1b 81.6 57.4 24.2 0.00 0.00 90.4 60.7 29.8 0.00 0.00 60.0 29.5 23.8 6.03 0.00 26.0
Mercia_Rht-D1b B1a D1b D1b 49.2 46.7 2.6 0.98 0.62 46.4 45.0 1.4 1.00 0.71 35.5 29.0 5.1 1.28 0.21 3.0
Genotypeb GA exp. 1 GA exp. 2 GA exp. 3h

Appendix VII continued
312
f Mixed model (MM) probability of accessions belonging to the GA insensitive (pGAI) are shown with pGAI ≥ 0.95 shown in blue background and pGAI ≤ 0.05 is shown in orange background. Probability GAI ≤ 0.05 is equivalent to a probability of ≥ 0.95 of a GA sensitive classification. g the probability of no treatment difference (p GA trt diff = 0) is shown for each accession. Probabilities ≤ 0.05 are shown in orange background, which is indicative of a
GA sensitive accession. h MM probabilities were not calculated for GA exp. 3 due to the lack of a bi-modal distribution of the GA+ STFL lengths.
i For GA exp 3, the mean GA treatment difference among controls was greater than in GA exp. 1 and 2. The GA trt diff value of each accession was multiplied by 0.7818 to allow for comparisons to GA exp. 1 and 2. j Overall trt diffs are taken as the average of GA exp. 1 trt diff, GA exp. 2 trt diff, and GA exp. 3 trt diff (corr'd).