genesis of the kapuskasing (ontario) migmatitic mafic ... · nyman etal.,1995; and references...
TRANSCRIPT

J. metamorphic Geol., 1996, 14, 591–611
Genesis of the Kapuskasing (Ontario) migmatitic mafic granulites bydehydration melting of amphibolite: the importance of quartz toreaction progressT . H. D. HARTEL* AND D. R . M. PATT ISONDepartment of Geology and Geophysics, University of Calgary, Calgary, Alberta, Canada T2N 1N4
ABSTRACT Migmatitic, granulite-grade mafic gneisses make up a significant part of the Kapuskasing Structural Zone(KSZ), Ontario. Although they contain a common mineral assemblage [hornblende (Hbl)+plagioclase(Pl )+diopside (Di)±garnet (Grt)+quartz (Qtz)±titanite (Ttn)], the mafic gneisses show wide variationsin modal mineralogy from hornblende-rich to diopside+garnet-rich varieties and all gradations between.Up to 25 vol.% segregated plagioclase+quartz-rich (trondhjemitic) leucosome (Tdh) is intimately associ-ated with the mafic gneiss, occurring in a continuum of patches, veins and transecting dykes at scalesranging from decimetres to micrometres. The texture and composition of the leucosome, combined withP-T estimates for the host rocks above the solidus, suggest it represents crystallized trondhjemitic melt.Quartz is mainly restricted to the segregated leucosomes but more rarely occurs in a variety of interstitialtextures in the mafic gneiss, suggesting that it crystallized from a melt phase rather than having beenpresent as a solid phase at peak metamorphic conditions. Modal and textural data indicate a reactionrelationship of the form: Hbl+Pl(+Qtz?)=Grt+Di+Ttn+leucosome (Tdh), implying that the granulite-forming process involved dehydration melting of an amphibolite protolith. Pressure-temperature estimatesfrom Grt+Di+Pl+Qtz geothermobarometry are 9 kbar and 685-735 °C; however, based on experimentalstudies of dehydration melting of amphibolite, we estimate that peak conditions were closer to 11 kbar,850 °C. Mass balance analysis, using the technique of singular value decomposition, and reaction spaceanalysis were used to quantify the reaction and to determine the controls on reaction progress. Thefollowing mass balance provides a model for the natural reaction:
1.00 Hbl+0.92 Pl+3.76 Qtz=1.14 Grt+1.54 Di+0.21 Ttn+1.49 Tdh+0.14 ‘pg’+0.39 Fe−1Mg+0.33 NaSiCa−1Al−1
where ‘pg’ is a pargasite-like exchange. In all model mass balances tested, quartz is a reactant with alarge coefficient. We argue that the abundance of quartz in the amphibolite protolith was the primarycontrol on the differing extents of reaction observed. Mineral compositional variation exerted a secondarycontrol on reaction progress, with Fe-richer layers containing An-richer plagioclase and more actinoliticamphibole reacting earliest ( i.e. at lowest temperatures). Comparison of the calculated amount of meltproduced in the gneisses with that now observed implies expulsion of 5–30% of the melt. These volumesare similar to those predicted from REE modelling of Archaean tonalities and trondhjemites from agarnet amphibolite source, suggesting that the KSZ mafic gneisses may be representative of partiallydepleted source rocks for trondhjemite-tonalite generation.Key words: amphibolite; dehydration melting; granulite; mass balance analysis; migmatite; quartz, reactionprogress.
reactions can be represented by the addition of aINTRODUCTION vapour-producing dehydration reaction (1) and a
vapour-consuming melting reaction (2) such that freeThe process of dehydration melting (Thompson, 1982)involves the incongruent reaction of hydrous minerals water as a phase is eliminated, e.g.(e.g. micas and amphiboles) to form simultaneously
Pl+Hbl+Qtz=Di+Grt+H2O (1)anhydrous minerals (e.g. garnet and pyroxenes) and aquartzofeldspathic melt phase (e.g. Powell, 1983; Pl+Qtz+H2O=trondhjemitic melt (2 )Waters, 1988; Pattison, 1991). Dehydration melting
Hbl+Pl+Qtz=Di+Grt+trondhjemitic melt (3 )Correspondence: [email protected]
(abbreviations from Kretz, 1983). A significant feature*Present address: Brandley Consulting, 4528 41st St. SW,T3A 0N2, Calgary, Alberta, Canada. of dehydration melting reactions is that aH2O
is buffered591

592 T. H. D. H ARTE L AND D .R .M. PATT IS ON
to fixed values (or, in the case of multivariancy, to modal variability of the mafic gneisses makes themideal for investigating granulite-forming processes overrestricted values) when the complete reaction assem-
blage is present (Clemens & Vielzeuf, 1987). This a range of mafic compositions in which pressure andtemperature can safely be assumed to have beencontrasts with vapour-releasing subsolidus dehydration
reactions or vapour-consuming melting reactions the same.Specific goals of the study are (1) to search forwhose location in P–T space can be displaced by
varying aH2O. In the absence of fluid infiltration, simple textural and modal mineralogical evidence either in
support of or against granulite and migmatite forma-heating will inevitably lead to dehydration meltingregardless of the initial aH2O
(see T –aH2Odiagram in tion by dehydration melting; (2) to determine the
integrated whole-rock reaction or reactions accountingPattison, 1991).Dehydration melting provides an appealing mechan- for the observed mineral assemblages and textures;
and (3) to account for the variable modal mineralogyism to form simultaneously granulite facies rocks(anhydrous residues of the melting process) and between adjacent layers. We use combined modal and
textural observations to infer qualitatively, and mineralgranitoid melts (Brown & Fyfe, 1970), the latter whichmay segregate and migrate upwards in the crust. From chemistry and mass balance analysis to model quanti-
tatively the granulite+leucosome-producing reac-a field perspective, first-order evidence in support ofdehydration melting as a common granulite-forming tion(s). The observed features are shown to be well
modelled by differing extents of reaction of essentiallymechanism is the common occurrence in granulites ofsegregated quartzofeldspathic leucosomes, at scales one common dehydration-melting reaction. We argue
that the primary control on extent of reaction wasranging from submillimetre to 1-10s of metres (migmat-itic granulites). Many of the structural and textural abundance of quartz in the protolith, with mineral
compositional variation between layers exerting afeatures of leucosomes in migmatitic granulites suggestthat they were at one time wholly or partially fluid. secondary control.Combined with their quartzofeldspathic (granitoid)composition and P–T estimates of their host rocks
GEOLOGICAL SETTINGabove the wet solidus, the evidence strongly suggeststhat the leucosomes represent crystallized silicate melt. The Kapuskasing Structural Zone (Percival, 1983; Percival & West,
1994) cuts obliquely across the EW-trending subprovinces of theThere has been comparatively little work done onArchaean Superior craton. The KSZ comprises high-grade metamor-granulite-grade migmatization processes in mafic (met- phic rocks and is marked by strong positive gravity and aeromagneticabasic) systems compared with the large number of anomalies. The KSZ has an elongate surface expression at least 50 km
theoretical, experimental and field-based studies on wide and 500 km long. It trends NNE from the north-eastern shoreof lake Superior towards the southern tip of James Bay, where themetapelitic systems (e.g. Ashworth, 1976; Brown, 1979;structure disappears under a cover of Phanerozoic sediment (Fig. 1).Thompson, 1982; Vielzeuf & Clemens, 1987; Waters,
The KSZ is interpreted as an uplifted portion of the Archaean1988; Patino-Douce & Johnson, 1991; Pattison, 1991; continental crust (Percival, 1983). It was thrust eastward andNyman et al., 1995; and references therein). Constraints upward over greenschist facies rocks of the Abitibi subprovince
along a series of W-dipping crustal-scale thrust faults (Geis et al.,on phase relations, melt compositions and melt1990) whose surface expression is represented by the Ivanhoe Lakevolumes for K-poor metabasic rocks undergoingshear zone (Bursnall et al., 1994). The overall structure is interpretedvapour-absent dehydration melting are provided by to represent an intracratonic uplift related to Hudsonian collisionthe experimental studies of Ellis & Thompson (1986), (Percival & West, 1994). Although having experienced a range of
Beard & Lofgren (1991), Rushmer (1991), Rapp et al. magmatic and metamorphic events between 2700 and 2585 Ma, themain stage of high-grade metamorphism occurred about 2660 Ma(1991), Wolf & Wyllie (1991, 1993), Thompson & Ellis(Corfu, 1987; Krogh & Moser, 1994). The age of major uplift along(1994) and Patino-Douce & Beard (1995). Field-basedthe Ivanhoe Lake fault remains uncertain, with ages between 2450studies of migmatitic mafic granulites include those of and 1930 Ma having been suggested (Hanes et al., 1994; Krogh &
Percival (1983), Tait & Harley (1988), Beard (1990), Moser, 1994; Percival & Peterman, 1994).Sawyer (1991) and Williams et al. (1995).
The purpose of this study is to determine controlsSetting and location of outcropson the genesis of migmatitic mafic granulites using
as a natural example the mafic gneisses of the The southern part of the KSZ, between Chapleau and Foleyet,Kapuskasing Structural Zone (KSZ), Ontario consists of NE-striking, NW-dipping belts of paragneiss, migmatitic
mafic gneiss, ultramafic gneiss, dioritic to tonalitic gneiss and locally(Percival, 1983; see also Canadian Journal of Earthgneissic meta-anorthosite (Thurston et al., 1977; Percival, 1983).Sciences, 1994, Vol. 31, no. 7). Although showing aMafic rocks are characterized by Grt+Di±Opx mineral assem-common mineral assemblage (Hbl+Pl+Qtz±Grt+ blages, indicative of high-pressure granulite-grade metamorphismDi±Ilm±Ttn), the gneisses show a particularly wide (Percival, 1983). To the NW, lower grade mafic rocks are diopside-
range of modal mineralogy within small outcrop-sized bearing but garnet-absent (fig. 3 of Percival, 1983).Clean exposures of migmatitic mafic gneiss are found in outcropsareas, ranging from hornblende+ plagioclase-rich
along Highway 101 between Foleyet and Chapleau (Percival, 1986)layers to Grt+Di+plagioclase-rich layers and alland in water-blasted outcrops near Harold Lake just off the Warren-gradations between (Percival, 1983). A variety of Carty logging road, about 2.5 km north of Highway 101 (Fig. 1).
plagioclase+quartz-rich (trondhjemitic) leucosomes of The Warren-Carty exposures are the primary focus of this study.Despite their location c. 2 km from the metamorphosed Shawmerevarious types and scales occur within the gneisses. The
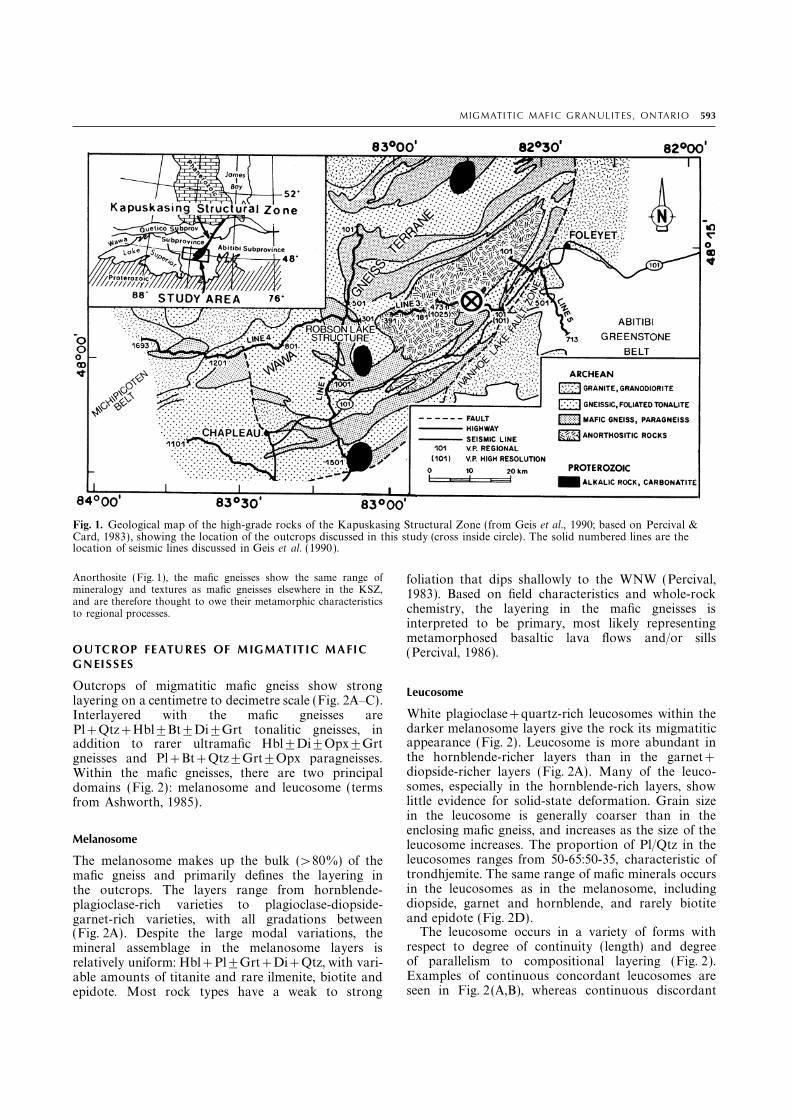
MIG MATI TI C MAF I C G RAN UL IT ES , ON TARI O 593
Fig. 1. Geological map of the high-grade rocks of the Kapuskasing Structural Zone (from Geis et al., 1990; based on Percival &Card, 1983), showing the location of the outcrops discussed in this study (cross inside circle) . The solid numbered lines are thelocation of seismic lines discussed in Geis et al. (1990 ).
Anorthosite (Fig. 1), the mafic gneisses show the same range of foliation that dips shallowly to the WNW (Percival,mineralogy and textures as mafic gneisses elsewhere in the KSZ, 1983). Based on field characteristics and whole-rockand are therefore thought to owe their metamorphic characteristics chemistry, the layering in the mafic gneisses isto regional processes.
interpreted to be primary, most likely representingmetamorphosed basaltic lava flows and/or sills
OUTCROP FEATURES OF M IGMATIT IC M AFIC (Percival, 1986).GNEISSES
Outcrops of migmatitic mafic gneiss show strong Leucosomelayering on a centimetre to decimetre scale (Fig. 2A–C).White plagioclase+quartz-rich leucosomes within theInterlayered with the mafic gneisses aredarker melanosome layers give the rock its migmatiticPl+Qtz+Hbl±Bt±Di±Grt tonalitic gneisses, inappearance (Fig. 2). Leucosome is more abundant inaddition to rarer ultramafic Hbl±Di±Opx±Grtthe hornblende-richer layers than in the garnet+gneisses and Pl+Bt+Qtz±Grt±Opx paragneisses.diopside-richer layers (Fig. 2A). Many of the leuco-Within the mafic gneisses, there are two principalsomes, especially in the hornblende-rich layers, showdomains (Fig. 2): melanosome and leucosome (termslittle evidence for solid-state deformation. Grain sizefrom Ashworth, 1985).in the leucosome is generally coarser than in theenclosing mafic gneiss, and increases as the size of the
Melanosome leucosome increases. The proportion of Pl/Qtz in theleucosomes ranges from 50-65:50-35, characteristic ofThe melanosome makes up the bulk (>80%) of thetrondhjemite. The same range of mafic minerals occursmafic gneiss and primarily defines the layering inin the leucosomes as in the melanosome, includingthe outcrops. The layers range from hornblende-diopside, garnet and hornblende, and rarely biotiteplagioclase-rich varieties to plagioclase-diopside-and epidote (Fig. 2D).garnet-rich varieties, with all gradations between
The leucosome occurs in a variety of forms with(Fig. 2A). Despite the large modal variations, therespect to degree of continuity (length) and degreemineral assemblage in the melanosome layers isof parallelism to compositional layering (Fig. 2).relatively uniform: Hbl+Pl±Grt+Di+Qtz, with vari-Examples of continuous concordant leucosomes areable amounts of titanite and rare ilmenite, biotite andseen in Fig. 2(A,B), whereas continuous discordantepidote. Most rock types have a weak to strong

594 T. H. D. H ARTE L AND D .R .M. PATT IS ON
Fig. 2. Outcrop photographs of migmatitic mafic gneisses. (A) Interlayered mafic gneiss (dark-medium grey) with abundantquartzofeldspathic leucosome (white). The darkest layers are hornblende-rich, whereas the lighter grey layers are richer in garnetand diopside. Note the variations in distribution, size and continuity of leucosomes. Divisions on the hammer are 10 cm. (B)Layered mafic gneiss showing details of different types of leucosomes: continuous, layer-parallel leucosome (1); continuous, cross-cutting leucosome (2); small, discontinuous, layer-parallel leucosome contained within individual layers (3); small, discontinuous,incipiently cross-cutting leucosome (4). Leucosome types commonly, but not always, show continuous transitions with each other.Note the greater abundance of leucosome in the hornblende-richer (darker) layers. Divisions on the hammer are 10 cm. (C)Trondhjemitic vein (white) cross-cutting interlayered mafic (dark) and tonalitic (light grey) gneiss. Note the dark hornblende-richmargins against the vein where it cross-cuts the Grt+Di-bearing mafic gneiss. This feature is suggestive of late, retrogradehydration of the mafic gneiss, interpreted to be due to hydrous fluid release from the trondhjemitic vein when it crystallized. Coinis 2.6 cm in diameter. (D) Detail of leucosome development in mafic gneiss. Notice the range of scales of development of leucosome,from obvious discrete segregations several cm in length (1) to almost imperceptible segregations, mm in size, which merge into themafic host rock (2). Notice also the occurrence of garnet and diopside within both the mafic host rock and the leucosome. Coin is2.3 cm in diameter.
leucosomes are illustrated in Fig. 2(B,C). The discor- what appear to be shear bands, whereas in othersthe leucosome occurs as pods and lenses within thedant leucosomes have the appearance of dykes and
veins that have been injected into the mafic gneisses relatively homogeneous groundmass. In places theleucosomes appear to be completely isolated (in two(e.g. Fig. 2C). Some discordant leucosomes show
continuous transitions with concordant and patchy dimensions), but more typically they show evidencefor incipient connectivity with other relatively isolatedleucosomes hosted in mafic gneiss, suggesting that a
portion of the discordant leucosome is locally derived. leucosomes and with more continuous leucosomes(Fig. 2B,D). The size of the leucosomes ranges fromA number of discordant leucosomes show dark, coarse-
grained hornblende-rich margins against the enclosing several centimetres in width and tens of centimetres inlength down to millimetre-scale segregations withmafic gneiss (Fig. 2C).
Discontinuous leucosomes show a variety of only a few grains of plagioclase and quartz. Theselatter leucosomes merge imperceptibly into theaspect ratios from elongate to rounded and patchy
(Fig. 2B,D). In some rocks, leucosome has accumulated Hbl+Pl+Grt+Di-rich mafic host gneiss (Fig. 2D).This continuity of scales suggests an internal origin forin dilatant zones such as in boudin necks and in

MIG MATI TI C MAF I C G RAN UL IT ES , ON TARI O 595
the leucosome, a view supported by the relativeTextures of garnet, diopside and titaniteuniformity in the texture and mineralogy in the
different leucosome types. Within the hornblende-rich layers, the texture isgenerally granoblastic apart from a weak lineationThe overall impression of the distribution, connec-
tivity and continuity of scales of the leucosome is that defined by preferential orientation of hornblende. Thegarnet+diopside-rich layers show a generally grano-of an internally derived fluid material that was variably
segregated into pods, dilatant zones and fractures. The blastic texture. Grain size in all layer types rangesfrom 0.2 to 3 mm, averaging 1-2 mm.plagioclase+quartz-rich nature of leucosome, com-
bined with P–T estimates above the wet solidus of Figure 4 shows textures of garnet, diopside andtitanite. Garnet porphyroblasts in the gneisses rangeplagioclase+quartz (see below), suggests that the fluid
was a silicate melt phase of trondhjemitic composition. from inclusion-poor to inclusion-rich. Figure 4(A)shows garnet porphyroblasts with anhedral-euhedralThe intimate occurrence of the leucosome within the
gneisses and the apparent stability of garnet and grain boundaries that contain inclusions of opticallycontinuous hornblende and rarer plagioclase. Indiopside in many leucosomes (e.g. Fig. 2D) suggests
that at some point the leucosome material was stable contrast to the generally granoblastic texture ofgarnet, Fig. 4(B) shows skeletal garnet betweenwith the solid granulite assemblage. On the other
hand, the hornblende-rich margins typically developed hornblende grains that merges into a larger, inclusion-bearing garnet porphyroblast. Diopside shows aagainst discontinuous leucosomes (e.g. Fig. 2C) is
suggestive of local rehydration of the garnet+diopside- similar range of textures to garnet (Fig. 4C,D).Diopside is generally granoblastic, locally withbearing host gneiss, most likely from water that was
released from the trondhjemitic melt during inclusions of plagioclase and hornblende (Fig. 4c).Rarer skeletal diopside is found along contactscrystallization.between hornblende grains (Fig. 4d) or betweenhornblende and plagioclase grains. Titanite is gener-
PETROGRAPHY ally inclusion free, but locally contains hornblendeinclusions (Fig. 4E), and also occurs as small grains
Modal mineralogy along hornblende-hornblende contacts (Fig. 4B,F) orrarely on the margins of ilmenite crystals (Fig. 4B).Seven samples of mafic gneiss were selected for point
counting, covering the range of melanosome composi- In some samples, garnet and diopside porphyroblastsshow all gradations between skeletal, poikiloblastictions from hornblende-rich to garnet+diopside-rich.
The aim was to restrict the point counting to portions and inclusion-free textures. The range of textures isinterpreted to represent different stages in the progress-of the gneiss away from obvious segregated leucosome,
although in some samples it was difficult to discern ive growth of garnet, diopside and titanite at theexpense of hornblende and plagioclase. Initial growthmelanosome-leucosome contacts. The results are plot-
ted in Fig. 3. A negative correlation between horn- of garnet and diopside occurred along margins ofhornblende (skeletal textures; Fig. 4B,D,F); withblende and each of plagioclase, diopside, garnet and
titanite is seen. quartz shows no consistent modal increased reaction progress, porphyroblasts developed(Fig. 4A,C,E).pattern with respect to hornblende (see discussion
below).Distribution and texture of quartz and plagioclase-quartzsegregations
The bulk of the quartz in the mafic gneisses occurs inmacroscopic plagioclase+quartz segregations (leuco-somes) of varying scales. However, small amounts ofquartz occur locally in the melanosome. The distri-bution and textures of quartz contrasts with those forhornblende, garnet, diopside and titanite. Microscopicplagioclase+quartz-rich segregations (microleuco-somes) and plagioclase+quartz-rich film-likeintergrowths show a number of similarities to thedistribution and textures of quartz, so they aredescribed together.
Description
Figure 5 shows textures of quartz, plagioclase+quartz microleucosomes and plagioclase+quartzFig. 3. Area chart showing modal mineralogy of the seven
melanosome layers discussed in the paper. films. Figure 5(A) shows the margin between a

596 T. H. D. H ARTE L AND D .R .M. PATT IS ON
Fig. 4. Photomicrographs of garnet, diopside and titanite. (A) Garnet porphyroblasts with inclusions of hornblende, the latterwhich are optically continuous with the remnant hornblende running diagonally. Notice the euhedral margin of the garnetporphyroblast against the hornblende (arrow), suggesting that the garnet grew at the expense of hornblende. (B) Skeletal garnetbetween hornblende crystals that is continuous with larger garnet porphyroblast. Small crystals of titanite are also developed at thehornblende margins. (C) Diopside porphyroblast showing inclusions of hornblende, some of which are optically continuous. (D)Skeletal diopside between hornblende crystals that grades into coarser-grained diopside crystals. (E) Titanite crystal containinginclusions of hornblende. (F) Small titanite crystal developed at a triple junction between hornblende crystals and adjacent to athin quartz ‘film’ between hornblende crystals.
plagioclase+quartz-rich leucosome and hornblende- the main leucosome between hornblende crystals inthe melanosome. Figure 5(B) shows a coarse-grained,rich host gneiss. Of special note are a number of
irregularly shaped, generally elongate intergrowths of irregularly shaped quartz crystal on the margin of aleucosome adjacent to a medium-grained, granoblasticmainly quartz with lesser plagioclase that extend from

MIG MATI TI C MAF I C G RAN UL IT ES , ON TARI O 597
Fig. 5. Photomicrographs of quartz and quartz-plagioclase films. (A) Margin between Qtz-Pl leucocratic segregation (upper part)and hornblende-rich melanosome (lower part). Notice the smooth transition from coarse-grained intergrown Pl+Qtz withcurvilinear margins in the leucocratic segregation to narrower necks and intergranular pockets of Pl+Qtz between hornblendecrystals. (B) Margin between leucocratic Pl+Qtz segregation (right side) with Cpx+Pl+Hbd+Grt melanosome ( left side) . Notethe contrast between the large, irregularly shaped, optically continuous quartz grain in the leucosome compared with the finer-grained, generally granoblastic texture of plagioclase, diopside, garnet and hornblende in the melanosome. (C) Textures inmelanosome. The overall texture of the melanosome is granoblastic, with the exception of quartz which occurs interstitially insmall, irregularly shaped crystals with high surface to volume ratio between the other minerals. (D) Enlargement of (A). Interstitialquartz is developed at a triple junction between three hornblende crystals and along hornblende grain margins. Below the quartz isa pocket of fine-grained, intergrown plagioclase+quartz between two hornblende crystals. (E) Quartz ‘films’ with high surface tovolume ratios occurring between hornblende crystals. Such films typically show smooth transitions into coarser Pl+Qtzsegregations. (F) Photomicrograph ( left side) and back-scattered electron image (right side) of a Pl+Qtz ‘film’ between onehornblende and several plagioclase crystals. The film consists of finely intergrown ‘droplets’ of plagioclase and quartz (see Fig. 8 fora compositional profile through a similar film).
598 T. H. D. H ARTE L AND D .R .M. PATT IS ON
intergrowth of plagioclase, garnet and diopsideRelation to other textures(melanosome).
Figure 5(C,D) show two examples of interstitial The quartz and plagioclase+quartz microtexturesextend the continuity of scales of leucosome develop-textures of quartz. In Fig. 5(C), the quartz occurs
principally along grain margins of hornblende, plagio- ment noted at outcrop scale (decimetre-millimetre) tothe microscopic scale (millimetre-micrometre), andclase and diopside and, in one place, occupies a triple
junction between hornblende, diopside and plagioclase. provide further evidence for an internal origin for theleucosome. The skeletal nature of the quartz andFigure 5(D), an enlargement of a portion of Fig. 5(A),
shows interstitial quartz at a triple junction of three plagioclase+quartz films, and their occurrence alonggrain margins of hornblende and plagioclase, resembleshornblende crystals in addition to a plagioclase+
quartz microleucosome between two hornblende crys- the skeletal garnet and diopside textures noted above,and suggests a related mode of origin. Small crystalstals. Figure 5(E) shows several elongate quartz films
between hornblende and plagioclase grains. All of the of garnet, diopside and titanite sometimes occur in oralong the margins of plagioclase+quartz microleuco-above types of quartz show irregular, nongranoblastic
textures with high surface-volume ratios. somes and films, analogous to the occurrence of theseminerals in leucosomes at outcrop scale (e.g. Fig. 2D).Figure 5(F) shows an optical image and a back-
scattered electron image of a plagioclase+quartz film Although the above features are relatively common,many rocks show no evidence for skeletal diopsidebetween a plagioclase and hornblende grain. Several
rocks contain these films. The films typically show and garnet or for thin plagioclase+quartz microleuco-somes. The most likely explanation is that thesecontinuous transitions into plagioclase+quartz micro-
leucosomes and interstitial quartz grains. The films delicate textures were destroyed by later deformation.consist primarily of vermicular or droplet shapedquartz with plagioclase between. Quartz and plagio-
Interpretation of modal mineralogy and textures as productsclase become more equidimensional with increasingof dehydration meltingfilm width. The average width and length of 70
plagioclase-quartz films are 0.009 and 0.2 mm, Summarizing the above observations, the modal miner-alogy and outcrop/thin-section textures provide strongrespectively.evidence for the reaction of hornblende and plagioclaseto form garnet, diopside and titanite. The composition
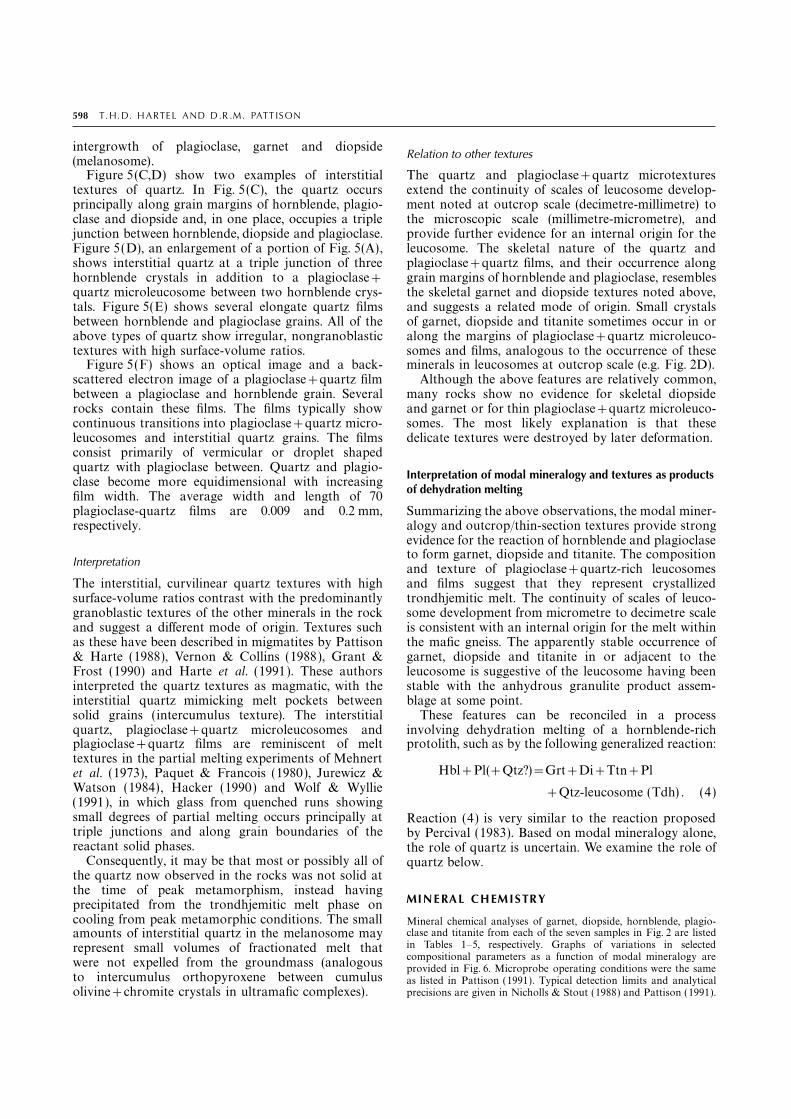
Interpretation and texture of plagioclase+quartz-rich leucosomesand films suggest that they represent crystallizedThe interstitial, curvilinear quartz textures with high
surface-volume ratios contrast with the predominantly trondhjemitic melt. The continuity of scales of leuco-some development from micrometre to decimetre scalegranoblastic textures of the other minerals in the rock
and suggest a different mode of origin. Textures such is consistent with an internal origin for the melt withinthe mafic gneiss. The apparently stable occurrence ofas these have been described in migmatites by Pattison
& Harte (1988), Vernon & Collins (1988), Grant & garnet, diopside and titanite in or adjacent to theleucosome is suggestive of the leucosome having beenFrost (1990) and Harte et al. (1991). These authors
interpreted the quartz textures as magmatic, with the stable with the anhydrous granulite product assem-blage at some point.interstitial quartz mimicking melt pockets between
solid grains (intercumulus texture). The interstitial These features can be reconciled in a processinvolving dehydration melting of a hornblende-richquartz, plagioclase+quartz microleucosomes and
plagioclase+quartz films are reminiscent of melt protolith, such as by the following generalized reaction:textures in the partial melting experiments of Mehnert
Hbl+Pl(+Qtz?)=Grt+Di+Ttn+Plet al. (1973), Paquet & Francois (1980), Jurewicz &Watson (1984), Hacker (1990) and Wolf & Wyllie +Qtz-leucosome (Tdh) . (4 )(1991), in which glass from quenched runs showingsmall degrees of partial melting occurs principally at Reaction (4) is very similar to the reaction proposedtriple junctions and along grain boundaries of the by Percival (1983). Based on modal mineralogy alone,reactant solid phases. the role of quartz is uncertain. We examine the role of
Consequently, it may be that most or possibly all of quartz below.the quartz now observed in the rocks was not solid atthe time of peak metamorphism, instead having
MINERAL CHEMISTRYprecipitated from the trondhjemitic melt phase oncooling from peak metamorphic conditions. The small Mineral chemical analyses of garnet, diopside, hornblende, plagio-
clase and titanite from each of the seven samples in Fig. 2 are listedamounts of interstitial quartz in the melanosome mayin Tables 1–5, respectively. Graphs of variations in selectedrepresent small volumes of fractionated melt thatcompositional parameters as a function of modal mineralogy arewere not expelled from the groundmass (analogous provided in Fig. 6. Microprobe operating conditions were the same
to intercumulus orthopyroxene between cumulus as listed in Pattison (1991). Typical detection limits and analyticalprecisions are given in Nicholls & Stout (1988) and Pattison (1991).olivine+chromite crystals in ultramafic complexes).

MIG MATI TI C MAF I C G RAN UL IT ES , ON TARI O 599
Table 1. Summary of electron microprobe analyses of garnet. Table 3. Summary of electron microprobe analyses ofhornblende.
SA1-3a SA1-4a SA1-8 SA1-12 SA1-13SA1-3a SA1-4a SA1-4b SA1-6 SA1-8 SA1-12 SA1-13a
SiO2 37.50 37.87 37.93 37.86 37.68TiO2 0.03 0.05 0.03 0.03 0.03 SiO2 41.29 41.85 42.96 43.38 42.39 41.42 42.29Al2O3 20.21 20.44 20.93 20.66 20.77 TiO2 2.04 1.72 1.40 1.22 1.59 1.88 1.65FeO 26.30 27.44 26.36 26.47 26.85 Al2O3 12.67 12.86 11.90 11.68 12.33 12.56 11.91MnO 2.94 1.41 2.50 2.44 2.33 FeO 19.27 19.32 16.52 15.68 17.86 18.03 18.57MgO 3.25 3.18 3.87 3.58 3.56 Cr2O3 na 0.11 0.06 na 0.07 0.07 0.06CaO 9.45 10.38 9.21 9.41 9.15 MnO 0.22 0.10 0.23 0.22 0.21 0.19 0.18Total 99.65 100.77 100.82 100.44 100.36 MgO 8.33 8.06 10.01 10.75 9.06 8.64 9.15
CaO 11.81 11.84 11.68 11.86 11.57 11.67 11.81Si 2.995 2.991 2.981 2.991 2.981Na2O 1.56 1.44 1.41 1.49 1.55 1.45 1.55Al 1.903 1.903 1.939 1.923 1.937K2O 1.09 1.17 0.87 0.74 0.82 1.07 0.81Ti 0.002 0.003 0.002 0.002 0.002F 1.10 bdl 0.09 0.09 0.09 0.08 bdlFe 1.757 1.812 1.732 1.749 1.777Cl na 0.02 bdl na 0.01 bdl bdlMn 0.199 0.095 0.166 0.163 0.156Total 98.38 98.49 97.13 97.11 97.55 97.06 97.98Mg 0.387 0.374 0.453 0.421 0.420-O=Cl,F 0.04 0.00 0.04 0.04 0.04 0.03 0.00Ca 0.809 0.878 0.776 0.797 0.775Total 98.34 98.49 97.09 97.07 97.51 97.03 97.98
XAlm 0.56 0.57 0.55 0.56 0.57Si 6.257 6.322 6.473 6.507 6.404 6.318 6.392XSps 0.06 0.03 0.05 0.05 0.05Al 2.263 2.290 2.113 2.065 2.195 2.258 2.121XPrp 0.12 0.12 0.14 0.13 0.13Ti 0.232 0.195 0.159 0.138 0.181 0.216 0.188XGrs 0.26 0.28 0.25 0.25 0.25Cr na 0.013 0.007 na 0.008 0.008 0.007XMg 0.18 0.17 0.21 0.19 0.19Fe 2.442 2.441 2.082 1.967 2.256 2.300 2.347Mn 0.028 0.013 0.029 0.028 0.027 0.025 0.023Cations calculated for 12 oxygens.Mg 1.881 1.815 2.248 2.403 2.040 1.964 2.061Ca 1.917 1.916 1.886 1.906 1.873 1.907 1.912Na 0.458 0.422 0.412 0.433 0.454 0.429 0.454K 0.211 0.225 0.167 0.142 0.158 0.208 0.156Table 2. Summary of electron microprobe analyses of diopside.F 0.048 bdl 0.043 0.043 0.043 0.039 bdlCl na 0.005 bdl na 0.003 bdl bdlSA1-3a SA1-4a SA1-6 SA1-8 SA1-12 SA-13a
XMg 0.44 0.43 0.52 0.55 0.47 0.46 0.47SiO2 50.95 51.11 52.26 51.82 51.95 51.84 XFe3+ 0.11 0.07 0.11 0.13 0.10 0.08 0.14TiO2 0.23 0.34 0.12 0.18 0.22 0.23Al2O3 2.42 3.00 2.01 2.31 2.33 2.55 Cations calculated for 23 oxygen equivalents. na=not analysed. bdl=below detection limit.FeO 12.35 12.92 9.87 11.59 11.59 11.64MnO 0.33 0.16 0.32 0.32 0.27 0.26MgO 10.93 10.63 12.73 11.68 11.68 11.59
(outer 15 mm) were analysed from 4–6 different grains in eachCaO 21.39 21.73 21.89 21.82 22.25 22.11Na2O 0.62 0.63 0.57 0.58 0.55 0.70 sample, with variations due to grain size and neighbouring mineralTotal 99.21 100.52 99.76 100.28 100.84 100.92 noted. Additional constraints on zoning patterns were provided by
compositional (X-ray) maps on two samples.Si 1.948 1.932 1.963 1.952 1.948 1.942To avoid obvious resetting problems at the rims, core compositionsAl 0.109 0.134 0.089 0.102 0.103 0.113
Ti 0.007 0.010 0.003 0.005 0.006 0.007 from the largest grains were selected for mass balance analysis andFe 0.395 0.408 0.310 0.365 0.363 0.365 thermobarometry calculations. These are the values listed in TablesMn 0.011 0.005 0.010 0.010 0.009 0.008 1–5 and used in Fig. 6. However, as discussed below, we consider itMg 0.623 0.599 0.713 0.655 0.653 0.647 unlikely that all elements in the cores of coexisting phases quenchedCa 0.876 0.880 0.881 0.880 0.894 0.888 in at the same time, let alone at peak metamorphic conditions.Na 0.046 0.046 0.042 0.042 0.040 0.051
XMg 0.61 0.59 0.70 0.64 0.64 0.64
GarnetCations calculated for 6 oxygens.
Within individual garnet grains, compositional zoning appears tobe minor except within about 100–200 mm of the rims. XCa showsminor and irregular core-rim variation, with rims ranging from theIn the cation assignments for garnet, diopside and hornblende in
Tables 1–3, Fe cations are calculated assuming all Fe is Fe2+. same values as the cores to 0.02–0.03 higher. For Mg/(Mg+Fe),rims are consistently lower by 0.02–0.03. The noncoincidence ofEstimates of Fe3+ in garnet, diopside and hornblende were made
assuming electroneutrality using the methods described in Pattison zoning in XCa and Mg/(Mg+Fe) is like that described by Pattison& Begin (1994), which they ascribed to continued exchange of(1991, p. 323). Hornblende estimates are based on an average of the
13eCNK and 15eNK methods of Robinson et al. (1982). For garnet, Fe-Mg after Ca in the garnet had been quenched in. Referring toFig. 6(A), as the modal abundance of hornblende decreases, XCadiopside and hornblende, average calculated Fe3+/(Fe3++Fe2+)
values are 0.08, 0.10 and 0.11, respectively (Hartel, 1993 ); these increases from 0.26 to 0.29, whereas Mg/(Mg+Fe) decreases from0.22 to 0.18. XMn shows no pattern with modal mineralogy, andvalues may or may not be significant owing to the large uncertainties
in the calculation schemes. Cosca et al. (1991) favour the 13eCNK averages about 0.05.method for Fe3+ estimation in amphibole, which for our hornblendesincreases Fe3+ by about 0.2 cations and increases Fe3+/(Fe3++Fe2+)to about 0.2. Diopside
Zoning in Mg/(Mg+Fe) is present within 50–100 mm of the rims,characterized by a core-rim increase of 0.02–0.03. Al zoning isMineral zoning and selection of analysis pointsirregular, most typically showing a decrease of about 0.03 Al cationstowards the rims. Referring to Fig. 6(B), as the modal abundance ofIn slowly cooled high-grade rocks such as the KSZ mafic gneisses
(Percival & Peterman, 1994), nonuniform re-equilibration of mineral hornblende decreases, Mg/(Mg+Fe) shows an overall decrease fromabout 0.71 to 0.62, whereas Al cations show an increase from aboutcompositions on cooling from peak conditions is expected (cf.
Pattison & Begin, 1994). To test this possibility, cores and rims 0.09 to 0.13 cations.

600 T. H. D. H ARTE L AND D .R .M. PATT IS ON
Table 4. Summary of electron microprobeanalyses of plagioclase.SA1-4a SA1-4a
SA1-3a SA1-3b core rim SA1-4b SA1-4c SA1-6 SA1-8 SA1-12 SA1-13a
SiO2 58.09 58.74 56.77 59.95 58.46 58.75 58.04 57.75 57.10 56.66TiO2 bdl bdl bdl bdl na bdl bdl bdl bdl naAl2O3 26.41 26.13 27.63 26.24 26.79 26.24 26.43 26.80 27.34 27.29FeO 0.04 0.05 0.08 0.25 0.07 bdl 0.06 0.05 0.08 0.08MnO na na bdl bdl bdl bdl na bdl bdl bdlMgO 0.00 bdl bdl bdl bdl bdl 0.00 bdl bdl bdlCaO 8.10 7.94 9.70 7.98 8.46 8.06 8.32 8.80 9.23 9.38Na2O 7.01 7.16 6.01 6.90 6.78 7.18 6.89 6.52 6.28 6.23K2O 0.13 0.14 0.15 0.16 0.10 0.13 0.11 0.10 0.16 0.10Total 99.78 100.15 100.34 101.49 100.66 100.40 99.86 100.02 100.20 99.74
Si 2.604 2.622 2.540 2.636 2.598 2.617 2.601 2.585 2.556 2.550Al 1.395 1.374 1.458 1.362 1.403 1.378 1.396 1.414 1.443 1.447Fe2+ 0.002 0.002 0.003 0.009 0.002 bdl 0.002 0.002 0.003 0.003Ca 0.389 0.380 0.465 0.377 0.403 0.385 0.400 0.422 0.443 0.452Na 0.609 0.619 0.521 0.588 0.584 0.620 0.599 0.566 0.545 0.544K 0.007 0.008 0.009 0.009 0.005 0.008 0.006 0.006 0.009 0.006
XAn 0.39 0.38 0.47 0.39 0.41 0.38 0.40 0.42 0.44 0.45XAb 0.61 0.62 0.52 0.60 0.59 0.61 0.60 0.57 0.55 0.54XOr 0.00 0.00 0.00 0.00 0.00 0.00 0.00 0.00 0.00 0.00
Cations calculated for 8 oxygens. na=not analysed. bdl—below detection limit.
Table 5. Summary of electron microprobe analyses of titanite. plagioclase-quartz film between a hornblende crystal and a plagio-clase crystal (e.g. Fig. 5F). Several individual analyses in the profile
SA1-12 SA1-4a SA1-3a most likely represent mixed analyses from adjoining fine-grainedquartz and plagioclase crystals, with peaks in Si content representing
SiO2 31.46 31.95 31.49 quartz-dominated analyses. The Pl/Qtz ratio (c. 60:40) and the AnTiO2 39.45 39.77 39.32 content (32–40%, neglecting the higher An peak in some quartz-Al2O3 1.09 1.07 1.15dominated analyses) indicate that the films are trondhjemitic inCr2O 0.05 0.05 bdlcomposition.FeO 0.74 0.57 0.66
MnO 0.06 0.05 0.08 Plagioclase compositions in the different domains show distinctMgO bdl bdl bdl compositional ranges. The An content in hornblende-rich domainsCaO 26.87 26.83 25.90 (39–47%) is intermediate between that of the trondhjemite leucosomeNa2O bdl bdl bdl and films (35–40%) and the garnet+diopside+plagioclase-richK2O bdl bdl bdl domains (43–80%). In the garnet+diopside+plagioclase-richF 0.07 0.18 0.14 domains the An contents are more variable than that in hornblende-Total 99.78 100.47 98.74
rich domains. The relationship in which the An content of plagioclase−O=F 0.03 0.08 0.06in the segregated leucosome and films is lower than that in theTotal 99.75 100.39 98.68melanosome is consistent with an anatectic origin for the leucosomeSi 1.022 1.029 1.031 (Johannes, 1983, and references therein) .Ti 0.964 0.963 0.968
The An content of plagioclase in small, discontinuous trondhjem-Al 0.042 0.041 0.044itic leucosomes within the mafic gneiss is similar to that inCr 0.001 0.001 bdl
Fe 0.020 0.015 0.018 continuous, cross-cutting trondhjemite bodies (30–38%). This sup-Ca 0.936 0.926 0.908 ports the textural evidence suggesting that at least some of the cross-Mn 0.002 0.001 0.002 cutting veins and dykes owe their origin to leucosome generated inF 0.007 0.018 0.015 the mafic gneisses.Cations calculated for 5 oxygens.
P–T–aH
2O
CONDITIONS
Hornblende Pressure-temperature conditions from geothermobaro-metry were calculated from the subassemblageZoning in Mg/(Mg+Fe) is characterized by rims higher than coresGrt–Di–Pl–Qtz using the data in Tables 1, 2 and 4,by 0.01–0.04. Al zoning shows no consistent pattern, with some rims
higher and others lower than the cores by 0.00–0.14 cations. and are listed in Table 6. Complications in interpretingReferring to Fig. 6 (C), as the modal abundance of hornblende the results include the possibility of down-temperaturedecreases, total Al cations show an increase from 2.05 to 2.25; resetting following the thermal peak, and uncertainMg/(Mg+Fe) decreases from about 0.58 to 0.45; Ca cations show
aSiO2if quartz was not part of the solid assemblage atno significant variation; and Na+K shows a modest increase from
peak conditions.0.58 to 0.67.
Plagioclase and plagioclase-quartz films Temperature
Plagioclase from melanosome shows weak to strong normal zoning, Temperature results based on Fe-Mg exchange betweenwith rims lower in An content by 0.03–0.10, averaging 0.04 (e.g. garnet and diopside using four different calibrationsSA1-4a in Table 4). Apart from sample SA1-3a, An content increases are listed in Table 6. The averages and ranges (infrom about An40 to about An47 as a function of decreasing
parentheses) are as follows (temperatures in °C): 745hornblende content (Fig. 6D).Figure 7 shows a step scan through the long dimension of a (725–765) (Ellis & Green, 1979); 640 (615–660)

MIG MATI TI C MAF I C G RAN UL IT ES , ON TARI O 601
Fig. 6. Mineral compositional variations (core compositions) as a function of modal hornblende. Refer to Tables 1–4 for fullchemical analyses. (A) Garnet. XMg=Mg/(Mg+Fe). XGr=Ca/(Ca+Fe+Mg+Mn). (B) Diopside. XMg=Mg/(Mg+Fe). Al cationsare calculated for six oxygens (see Table 2). (C) Hornblende. XMg=Mg/(Mg+Fe). (Na+K), Ca and Al cations are calculated for 23oxygen equivalents (see Table 3). (D) Plagioclase. XAn=Ca/(Ca+Na+K).
diopside and decreasing Mg/(Mg+Fe) in garnet indi-cates obvious down-temperature Fe-Mg exchange inthe rims. Flat Fe-Mg profiles in the interior of garnetand diopside grains that preserve irregular core-rimvariations of XCa and Al cations, respectively, mayalso indicate resetting of Fe-Mg in the interior of thegrains (see Pattison & Begin, 1994).
Further evidence for Fe-Mg resetting comes fromevaluation of the calculated temperatures with respectto experimentally constrained petrogenetic grids. Alarge body of experimental data on natural andsynthetic starting compositions indicates that theminimum temperature for vapour-absent dehydration
Fig. 7. Electron microprobe profile through the long dimension melting of K-poor amphibolite over a wide pressureof a plagioclase–quartz film, similar to that illustrated in interval (3–15 kbar) is 850–900 °C (Ellis & Thompson,Fig. 5(F). The profile starts in plagioclase and finishes in 1986; Hacker, 1990; Beard & Lofgren, 1991; Rushmer,hornblende. 1991; Rapp et al., 1991; Wolf & Wyllie, 1991, 1993;
Sen & Dunn, 1994; Thompson & Ellis, 1994; Patino-Douce & Beard, 1995). Patino-Douce & Beard (1995)(Pattison & Newton, 1989); 730 (700–750) Berman
(1991, June, 1992 update); and 710 (685–725) found that a dry quartz-bearing mixture of hornblendeand plagioclase, close in composition to hornblende(Aranovich & Pattison, 1994; Berman et al., 1995).
Regardless of calibration, we consider that these and plagioclase in the Kapuskasing gneisses, began toundergo dehydration melting between 880 and 900 °Ctemperatures are unlikely to represent peak conditions
owing to the likelihood of Fe-Mg resetting (cf. Frost at 10 kbar. The occurrence of the subassemblageGrt+Opx±Bt±Kfs in paragneisses interlayered with& Chacko, 1989; Pattison & Begin, 1994) during the
slow cooling of the KSZ (Percival & Peterman, 1994). mafic gneiss near the study area (Percival, 1983)suggests a minimum temperature of about 860 °C atThe core-rim pattern of increasing Mg/(Mg+Fe) in

602 T. H. D. H ARTE L AND D .R .M. PATT IS ON
Table 6. Pressure-temperature estimates from Grt-Di-Pl-Qtz thermobarometry.
Pressure (kbar)Temperature (°c)
for calculated T for T=850 °Cfor calculated P
ln(Kd ) B(Grt-Di) EG PN B BAP B ENK MEA* B* ENK MEA* aSiO2
=0.8
SA1-3a 1.97 745 635 735 710 9.3 9.3 9.6 11.0 9.9 11.2 10.1SA1-4a 1.96 765 660 750 725 9.6 9.3 9.9 11.2 9.8 11.4 10.3SA1-8 1.93 745 650 735 715 9.3 9.3 9.6 11.0 9.8 11.2 10.1SA1-12 2.00 735 630 715 700 8.9 9.0 9.5 10.9 9.5 10.9 10.0SA1-13a 2.02 725 615 700 685 8.5 8.7 9.3 10.7 9.2 10.7 9.8Average 1.98 745 640 730 710 9.1 9.1 9.6 11.0 9.6 11.1 10.1
B—Berman (1988, 1991; June 1992 update); BAP—Berman et al. (1995); EG—Ellis & Green (1979); ENK—Eckert et al. ( 1991); MEA—Moecher et al. (1988); PN—Pattison & Newton( 1989); *average of Fe- and Mg-end-member expressions.
10 kbar (Vielzeuf & Clemens, 1992; Vielzeuf & Montel, Mader et al. (1994) study, in the range aH2O0.15–0.35.
If temperature was as high as 850 °C, the values1994). Consequently, we consider 850 °C to be aminimum estimate of peak metamorphic temperature. increase by 0.2–0.4. Reduced activity of water is
consistent with the inferred process of vapour-absentRegardless of whether 700–750 °C or 850 °C tem-peratures are accepted as peak conditions, any of these dehydration melting.temperatures lies well above the water-saturatedtrondhjemite solidus at 10 kbar (see fig. 10 of Pattison,
MASS BALANCE ANALYSIS1991). In the absence of regional-scale influx of lowaH2O
fluids, we suggest that dehydration of hornblende Mass balance analysis was applied to the maficmigmatites to (1) see if there are any mass balanceswas accompanied by melting, consistent with the
textural data. within the rocks that provide a good model for thereaction relationships inferred from modal mineralogyand textures, and (2) search for controls on thePressure variable extent of reaction of hornblende in thedifferent layers.Taking aSiO2
=1 and temperature estimates from garnet-diopside thermometry (685–725 °C), pressure estimates First, the thermodynamic variance of individual
samples was examined to see if there are any massfrom garnet-diopside-plagioclase-quartz barometryusing TWQ are very similar to those reported by balances implied within the analytical uncertainty of
the measured mineral compositions. The algebraicMader et al. (1994), averaging 9.1 kbar (range 8.7–9.6).If the average temperature was as high as 850 °C, approach we adopted for this analysis is that of
singular value decomposition (SVD) (Fisher, 1989;however, pressures increase to about 11.0 kbar(Table 6), owing to the positive slope of the equilibria Gordon et al., 1991). Fisher’s software was used for
the calculations. An example of the procedure in aused for barometry (see fig. 3 of Mader et al., 1994).This result is more consistent with experimental studies simple system is described in the Appendix. The
Appendix is available from: (1) the Journal of(Rapp et al., 1991; Wolf & Wyllie, 1993; Patino-Douce& Beard, 1995) that suggest minimum pressures of Metamorphic Geology World Wide Web site; (2 ) the
British Library, via their Supplementary Publications10 kbar for garnet production from dehydration melt-ing of a hornblende+plagioclase+quartz protolith. Scheme, no. 90416; or (3) the authors. Mineral
exchange vectors (Thompson, 1982a, b) were sub-If quartz was not present at peak conditions, aSiO2may have been lower than unity, which will affect the sequently incorporated in an attempt to improve themodelling of the reactions (Hartel, 1993).pressure estimate. We consider substantially reduced
aSiO2at peak conditions to be unlikely, owing to the
presence of abundant trondhjemitic leucosome in theComposition of phasesrocks. If aSiO2
was as low as 0.8, pressures are loweredby about 0.9 kbar relative to aSiO2
=1, resulting in anMineral phasesaverage pressure at 850 °C of 10.1 kbar. Accepting
that aSiO2was close to unity, we favour the 11.0 kbar The mineral phases considered are hornblende, plagio-
clase, garnet, diopside, titanite and quartz. The com-estimate.positions of the minerals are described in terms of thefollowing 10 cations: Si, Ti, Al, Fe, Mn, Mg, Ca, Na,
Activity of water K and H (Tables 1–5). No distinction was madebetween Fe2+ and Fe3+. F and Cl are present inActivity of water was calculated using the method of
displaced amphibole equilibria described in Mader negligible abundance (Tables 1–5) and have beenignored. Hornblende is assumed to contain two Het al. (1994). The results are in the same range as the
MIG MATI TI C MAF I C G RAN UL IT ES , ON TARI O 603
atoms, although this value is considered to be aMass balance analysis using SVDmaximum in granulites forming under conditions of
reduced activity of water (see discussion below). For our mass balance analysis, we chose the sevenphases that account for over 99% of the mode(hornblende, plagioclase, quartz, garnet, diopside, titan-
Melt phase ite, Tdh) in the chemical system K–Na–Ca–Fe–Mg–Mn–Al–Ti–Si–H (KNCFMMnATSH) which accountsIn contrast to the solid phases, whose compositions
can be measured, the composition of trondhjemitic for over 99% of the oxygen-free composition of therock. Model mass balances are listed in Table 8 formelt has to be estimated. Three different compositions
were used, which are listed in Table 7. The first melt different samples and melt compositions. For eachmodel mass balance, percentage deviations from perfectcomposition is based on the observed average model
leucocratic mineralogy of the leucosomes now in the cation and charge balance are also listed (see expla-nation in the Appendix).rocks, 40% quartz and 60% plagioclase, with an
assumed plagioclase composition representative of themeasured plagioclase in the leucosome, An35. A reliable
Example calculation: sample SA1-12estimate of an aluminous ferromagnesian componentin the melt was impossible to obtain owing to the lack For sample SA1-12 and melt composition Tdh2 from
Table 7, SVD analysis of the 7×10 composition matrixof textural or compositional criteria to distinguishbetween Fe-Mg-Al minerals (garnet, diopside, horn- yields seven nonzero singular values, indicating a rank
of 7 and at least divariant equilibrium (refer toblende) that may have been mechanically entrained inthe melt segregations from those that might have Appendix). However, the smallest singular value is
close to zero, opening the possibility that, withincrystallized from the melt. Consequently, two meltcompositions were used from the experimental litera- analytical uncertainties in mineral compositions, a
model matrix of reduced rank (6) might provide anture that provide analogues of the mineral andleucosome compositions at Kapuskasing: MMA Mix adequate representation of the original composition
matrix. In this situation, a mass balance is implied,no. 3 from table 4 of Rushmer (1991), and Run 207from table 3 of Beard & Lofgren (1991). Owing to which for SA1-12 is:uncertainty in water contents of melts produced from
1.00 Hbl+0.72 Pl+4.14 Qtz+0.17 Ttndehydration melting of amphibolite [Beard & Lofgren(1991) estimated water contents of 5–6 wt% whereas =0.90 Grt+1.98 Di+1.56 Tdh . (5 )Rushmer (1991) estimated water contents closer to2 wt%], we have chosen an intermediate value of There are a number of ways to evaluate this model
mass balance. If one considers the absolute deviations4 wt%. Following the approach of Waters (1988), meltcompositions were recast into cations assuming 10 from perfect cation and charge balance summed over
all elements in mass balance (5), compared with thatoxygens per formula unit.possible from analytical uncertainty alone (see examplein the Appendix), the results are within three times the1s analytical uncertainty. Recasting this deviation asa percentage of the total number of cations andTable 7. Melt compositions.charges on one side of the model mass balance (here,
B&L 91 Rush 91 the left-hand side), the deviations amount to 7.1 andTdh 1 Tdh 2 207 MMA#35.3%, respectively. When assessed in this way, sample
SiO2 73.36 72.60 69.54 74.21 SA1-12 may be viewed as preserving something closeTiO2 0.00 0.00 0.57 1.05to (if not exactly) univariant equilibrium.Al2O3 14.98 14.83 14.71 13.21
FeO 0.00 0.00 2.82 2.67 On the other hand, the occurrence of severalMnO 0.00 0.00 0.06 0.06 elements in individual phases with residuals greaterMgO 0.00 0.00 0.84 0.60CaO 4.26 4.22 3.62 1.92 than three times the 1s analytical uncertainty indicatesNa2O 4.40 4.35 2.93 1.46 that the model matrix of rank 6 is not an adequateK2O 0.00 0.00 0.92 0.82 representation of the compositional matrix, and there-H2O 3.00 4.00 4.00 4.00Total 100.00 100.00 100.00 100.00 fore that the above mass balance is not valid (seeSi 3.820 3.752 3.655 3.828 discussion in Appendix). Deviations from perfect cationAl 0.920 0.903 0.912 0.803 and charge balance for some major elements, such asTi 0.000 0.000 0.022 0.041 Ca and Mg, exceed the 3s uncertainties. Finally, aFe 0.000 0.000 0.124 0.115Mn 0.000 0.000 0.003 0.003 conspicuous inconsistency in mass balance (5) is theMg 0.000 0.000 0.066 0.046 occurrence of titanite and hornblende, the only twoCa 0.238 0.234 0.204 0.106
phases with significant Ti, on the same side of theNa 0.444 0.436 0.299 0.146K 0.000 0.000 0.062 0.054 mass balance.H 1.042 1.379 1.403 1.376 To address this last point, we weighted Ti by aCations calculated for 10 oxygens. factor of 10 in the SVD analysis, yielding the following

604 T. H. D. H ARTE L AND D .R .M. PATT IS ON
Table 8. Model mass balances from SVD analysis in the system KNCFMMnASTH.
% deviation† fromModel mass balances perfect mass balance
Mass H atoms inbalance Sample Melt* Hbl/Tdh* Hbl Pl Qtz Grt Di Ttn Tdh Cations Charge
( 5) SA1-12a‡ Tdh2 2/1.379 1.00 0.72 4.14 −0.90 −1.98 0.17 −1.56 7.0 5.1( 6) SA1-12b Tdh2 2/1.379 1.00 0.80 4.24 −0.94 −1.76 −0.21 −1.61 7.5 4.6( 7) SA1-8 Tdh2 2/1.379 1.00 0.79 4.17 −0.89 −1.86 −0.17 −1.61 7.8 4.7( 8) SA1-4a Tdh2 2/1.379 1.00 0.81 4.11 −0.94 −1.74 −0.18 −1.61 7.1 4.2( 9) SA1-12 Rush 2/1.376 1.00 0.37 5.14 −0.73 −1.93 −0.14 −1.63 8.3 4.8
( 10) SA1-12 B&L 2/1.403 1.00 0.58 4.13 −0.79 −1.79 −0.17 −1.59 7.5 4.4( 11) SA1-12 Tdh1 2/1.042 1.00 1.23 5.33 −0.96 −1.71 −2.17 −0.21 6.3 3.5( 12) SA1-12 Tdh2 1/1.379 1.00 0.28 3.43 −0.88 −1.93 −0.20 −0.99 10.8 6.9
* Refer to Table 7. † See Appendix for explanation. ‡ Mass balance (5) is from an unweighted SVD analysis. All other mass balances are from SVD analysis in which Ti is weighted by afactor of 10 (see discussion in text).
mass balance: 11 in Table 8), and hornblende containing one ratherthan two H atoms was used with Tdh2, giving mass1.00 Hbl+0.80 Pl+4.24 Qtz balance (12). Because all of the H in the melt comesfrom that released from the reaction of hornblende,=0.94 Grt+1.76 Di+0.21 Ttn+1.61 Tdh . (6 )the effect of reducing the H content of melt (massApart from the improvement with respect to titanite balance 11) with no change in H content of hornblendeand hornblende, mass balance (6) is very similar to is to increase the amount of melt produced per molemass balance (5). The overall deviations from perfect of hornblende consumed, which correspondingly resultscation and charge balance for mass balance (6) are 7.4 in increases in the coefficients for plagioclase andand 4.6%, respectively. The similarity of these values quartz. Conversely, reducing the H content of horn-to those for mass balance (5) suggests that the blende (mass balance 12) for a fixed H content in theweighting provides no worse fit to the original melt results in a smaller volume of melt produced,composition matrix than the unweighted model which results in reductions in the coefficients formatrix did. plagioclase and quartz.With respect to the natural rocks, mass balance (6)
qualitatively accounts well for the textures and modalRole of quartzvariations observed in the natural samples (compare
with Figs 2–5 and reaction 4). Therefore, notwithstand- All of the above model mass balances have quartz asing some of the problems noted above, mass balance a reactant with a large coefficient. Considering the(6) appears to provide a first-order model of the generally low modal abundance of quartz in metabas-natural reaction. altic amphibolites, and the magmatic quartz texturesin the Kapuskasing rocks, availability of quartz may
Results for other samples and melt compositions have been of central importance in controlling theprogress of the hornblende-consuming, Grt+Di+Tdh-The above procedure was repeated for different samples producing reaction.and melt compositions (see Table 8). Ti was weighted
by a factor of 10 in all cases. For samples SA1-8 andSA1-4a, the hornblende-richest and hornblende- Mass balance analysis incorporating exchange vectorspoorest samples, respectively, the computed massbalances (7 and 8 in Table 8) are insignificantly
Rationaledifferent from the one for SA1-12. To examine theeffect of using different melt compositions, model mass Because the natural granulite-forming reaction in detail
appears to be multivariate, an attempt was made tobalances were calculated for SA1-12 using melt com-positions MMA Mix no. 3 of Rushmer (1991) and improve the modelling of the reaction by incorporating
mineral exchange vectors (e.g. Thompson, 1982a,b;glass 207 from Beard & Lofgren (1991), assuming4 wt% water in the melts (mass balances 9 and 10 in Russ-Nabelek, 1989). A complication in the modelling
of multivariate reactions is that the composition of theTable 8). The main difference compared to massbalance (6) is the smaller coefficient of plagioclase, minerals now in the rocks is not the same as the
composition at the start of the reaction (neglecting theowing to the lower Na and Ca content of theexperimental melt compositions compared with the later effects of compositional modification on cooling).
An indication of the variation in mineral compositionsestimated melt composition. To examine the effect ofvarying the H content of melt and of hornblende, through the Grt+Di+Tdh-producing reaction may
be obtained from the wide range of reaction progressmodel mass balances for SA1-12 were calculated withthe following two changes: melt composition Tdh1 in the interlayered gneisses, from hornblende-rich
(small amount of reaction progress) to hornblende-(3 wt% water) was used in place of Tdh2 (mass balance

MIG MATI TI C MAF I C G RAN UL IT ES , ON TARI O 605
poor (large amount of reaction progress). The composi- proportion to mass balance (13) (which incorporatesthe pl and fm exchanges). Based on the maximumtional effects related to reaction progress will be
superimposed on the primary mineral compositional observed variation of Al in hornblende (c. 0.2 cations),addition of 0.2 times the ‘pg’ exchange to mass balancevariability imposed by the bulk composition of the
individual layers. (13) yields the following combined mass balance:1.00 Hbl+1.03 Pl+3.47 Qtz=1.26 Grt
Evaluation of exchange components +1.44 Di+0.21 Ttn+1.43 Tdh+0.20 ‘pg’Referring to Fig. 6, the primary chemical variations as +0.55 fm+0.46 pl . (15)a function of modal mineralogy include: Mg/(Mg+Fe)in garnet, diopside and hornblende; An content in With regard to the coefficients of the additive
components, mass balance (15) shows many similaritiesplagioclase; and Al content in hornblende and to alesser extent diopside. Numerous studies have shown to mass balance (6) from SVD analysis, including a
large coefficient for quartz. The sense of Mg-enrichmentthat variation in Al content of hornblende mainlyreflects a combination of (Fe,Mg)−1Si−1Al2 (tschermak as a function of reaction progress is consistent with
constraints from natural and experimental data onexchange) and (Vac−1Si−1(Na,K)Al ) (‘edenite-like’exchange; Schumacher, 1991) (see studies of Raase amphibole stability (e.g. Wolf & Wyllie, 1993). The
sense of decreasing anorthite content is consistent withet al., 1986; Russ-Nabelek, 1989; Schumacher, 1991).In the samples from Kapuskasing, the ratio of the normal zoning seen in individual plagioclase grains,
although quantitatively the amount of plagioclasetschermak exchange to edenite-like exchange is #251(Table 3 and Fig. 6c; Hartel, 1993). exchange may be too high to reconcile with the
observations (the amount of implied plagioclaseexchange per mole of plagioclase consumed would
Model reactions drive the plagioclase to nearly pure albite). A secondproblematic aspect of mass balance (15) is the c. 151We chose the system Na(+K)–Ca–Fe(+Mn)–Mg–
Al–Si–Ti–H (NCFMASTH) as an appropriate chemi- ratio of Grt/Di produced, which seems high comparedwith the observed Grt/Di ratios in Fig. 3.cal system. Mn has been combined with Fe, and K has
been combined with Na. The measured mineralcompositions of sample SA1-12 and Tdh2 were selected
Optimization of mass balance analysisas the additive components. Based on the abovediscussion, the following exchange components were Both mass balance (6) from SVD analysis and
multivariate mass balance (15) are deficient in certainincluded: (1) a 251 ratio of tschermak and edeniteexchange, with Fe/Mg in the same ratio as in the ways. Mass balance (6) is unsatisfactory in balancing
all elements to within three sigma uncertainty (e.g. Cahornblende (‘pg’) ; (2) Ca−1Al−1NaSi exchange (pl );and (3) Fe−1Mg exchange (fm). The 8×10 matrix of and Mg). Mass balance (16), although a perfect cation
and charge balance, appears to involve too muchadditive and exchange components is shown in Table 9.Row reduction of the matrix reveals that it has a rank plagioclase exchange and suggests a rather high Grt/Di
ratio. We have therefore combined the two approachesof 8, with two implied independent mass balances thatspan reaction space (e.g. mass balances 13 and 14 in in an attempt to balance all elements within three
sigma uncertainty using the minimum amount ofTable 9).To obtain a single mass balance incorporating all multivariancy. The minimum ratio of multivariate
mass balance (15) to mass balance (6) (the latterthree exchange components, mass balance (14) (whichincorporates the ‘pg’ exchange) must be added in some recalculated in the same eight-component system as
Table 9. Analysis of multivariant massbalances for SA1-12. Additive components Exchange components
Hbl Pl Qtz Grt Di Ttn Tdh2 ‘pg’ fm pl
Si 6.318 2.556 1.000 2.991 1.948 1.022 3.752 −1.000 0.000 1.000Al 2.258 1.443 0.000 1.923 0.103 0.042 0.903 1.667 0.000 −1.000Ti 0.216 0.000 0.000 0.002 0.006 0.964 0.000 0.000 0.000 0.000Fe 2.325 0.003 0.000 1.912 0.372 0.020 0.000 −0.361 −1.000 0.000Mg 1.964 0.000 0.000 0.421 0.653 0.000 0.000 −0.306 1.000 0.000Ca 1.907 0.443 0.000 0.797 0.894 0.936 0.234 0.000 0.000 −1.000Na 0.637 0.554 0.000 0.000 0.040 0.000 0.436 0.333 0.000 1.000H 2.000 0.000 0.000 0.000 0.000 0.000 1.397 0.000 0.000 0.000
Two independent mass balances (normalized to 1.00 Hbl and 1.00 ‘pg’)(13) 1.00 0.83 3.88 −1.27 −1.29 −0.21 −1.43 −0.59 −0.42(14) 1.01 −2.04 0.05 −0.77 0.01 −1.00 0.17 −0.19
Massbalance (13) plus 0.2 times mass balance (14)(15) 1.00 1.03 3.47 −1.26 −1.44 −0.21 −1.43 −0.20 −0.55 −0.46
606 T. H. D. H ARTE L AND D .R .M. PATT IS ON
mass balance 15) required to balance all elements to because garnet without diopside is not reported down-grade of the garnet+diopside isograd (Percival, 1983).within three sigma uncertainty is 0.7150.29. The result
is: The two proportions of hornblende and quartztested are: 55% Hbl and 5% Qtz (Fig. 8a,c); and 45%
1.00 Hbl+0.92 Pl+3.76 Qtz Hbl and 15% Qtz (Fig. 8b,d). All area charts havevol.% leucosome produced as the measure of reaction=1.14 Grt+1.54 Di+0.21 Ttn+1.49 Tdhprogress. In Fig. 8(a,b), the leucosome generated is+0.14 ‘pg’+0.39 fm+0.33 pl . (16) assumed to leave the rock when it is formed, and thehornblende, quartz, plagioclase, diopside, garnet and
We accept mass balance (16) as the best model of the titanite are renormalized to 100%. Figure 8(c,d) illus-natural granulite-forming reaction. trates the other extreme in which none of the leucosome
is lost from the rock. Variation in reaction coefficientsas the reaction proceeds has been ignored.Relation between mass balance and reaction history
Even though mass balance (16) provides a good modelComparison with natural modal variationsfor the observed modal, textural and mineral chemical
variations in the rocks, there is no guarantee that this Variations in the extent of reaction of reaction (17)reaction actually occurred in the rocks as written. generally account well for the observed modal vari-Mass balance (16) may instead represent the integrated ations: garnet, diopside and titanite increase at theeffects of a several-stage reaction history, perhaps expense of hornblende and quartz. The plagioclaseinvolving a more-or-less discontinuous quartz- pattern in Fig. 8(a,b) is similar to that in Fig. 3, in thatconsuming dehydration melting reaction followed by it shows relatively little variation as a function ofmore subtle reactions controlled by mineral exchange modal hornblende, due to the assumption of completevectors in hornblende and plagioclase (e.g. Frost & extraction of trondhjemitic leucosome and consequentTracy, 1991, pp. 259–262). Our data do not allow us renormalization of the mode. In Fig. 8(c,d), in whichto distinguish between these possibilities. melt is assumed to be retained in the rock, plagioclase
decreases as expected. The irregular variation of quartzin Fig. 3 compared with Fig. 8 is discussed below.Conversion to volumes
Although providing a good first-order model for ourMass balance (16) was converted to modal amounts observations, we do not wish to imply that all of theof minerals using the following mineral volumes (values modal variability in the gneisses is due solely toin cm3 mol−1), interpolated from end-member data variable reaction progress of mass balance (17) asfrom Berman (1988, 1991 update): hornblende – 274.8; controlled by the Hbl/Qtz ratio. Other variations inplagioclase – 100.8; quartz – 23.7; garnet – 117.4; bulk composition could result in a wider range ofdiopside – 66.8; titanite – 55.7. The second-order modal proportions than implied by Fig. 8.volumetric effects of exchange components in themultivariate mass balances were ignored. Melt volumes
CONTROLS ON REACTION PROGRESS DURINGwere calculated using the procedure described byDEHYDRATION MELTINGLange (1994). For a 10-oxygen formula unit, the
volume of melt composition Tdh2 containing 4 wt%Primary control on reaction progress: abundance of quartzwater at 10 kbar, 850 °C is 129.1 cm3 (giving a meltin the protolithdensity of 2.4 g cm−3 ). The modal balance is:Referring to mass balance (17), modal hornblende
1.00 Hbl+0.34 Pl+0.32 quartz reacts out about three times faster than quartz.Whether the system will be exhausted first in quartz=0.48 Grt+0.37 Di+0.04 Ttn+0.70 Tdh . (17)or in hornblende depends on the starting compositionof the Hbl+Pl+Di+Qtz protolith. Figure 8(a,c) showThis modal balance is similar to that inferred by Beard
& Lofgren (1991) in their experiments on dehydration the situation in which quartz reacts out first, leaving asolid Hbl+Grt+Di+Pl+Ttn residue and an amountmelting of hornblende+plagioclase+quartz.of melt (now Pl+quartz leucosome) that depends onhow effectively it was removed from the reacting rock
Evaluation of reaction progress in area charts (see discussion below). Figure 8(b,d) shows the situ-ation in which hornblende reacts out first, leaving aFigure 8 contains area charts showing modal changes
as a function of reaction progress of reaction (17). The solid Qtz+Grt+Di+Pl+Ttn residue.None of the rocks from the study suite is hornblende-starting assemblage contains 35% plagioclase, two
different proportions of hornblende and quartz, and free, suggesting that quartz in all cases reacted outfirst and therefore controlled the extent of reaction.5% diopside assumed to have been inherited from
lower grade (see isograd map in Percival, 1983). We Thus, a significant proportion of the modal variabilitybetween the interlayered garnet+diopside-rich andassume there was no garnet in the starting composition

MIG MATI TI C MAF I C G RAN UL IT ES , ON TARI O 607
Fig. 8. Area charts showing variations in modal mineralogy as a function of reaction progress for modal mass balance (17).Reaction progress is monitored as a function of trondhjemitic leucosome produced. The solid vertical line represents the point atwhich a reactant (either quartz or hornblende) is consumed, causing the reaction to stall. The number at the lower right of eachdiagram is the vol.% leucosome produced at the point the reaction stalls. (A) Starting mineralogy – Hbl/Qtz/Pl/Di=555553555.All melt is assumed to be expelled as it is produced. Quartz reacts out first, leaving a Hbl+Di+Grt+Pl+Ttn residue. (B) Startingmineralogy – Hbl/Qtz/Pl/Di=4551553555. All melt is assumed to be expelled as it is produced. Hornblende reacts out first, leavinga Qtz+Grt+Di+Pl+Ttn residue. (C) Same starting mineralogy as (A). All melt is assumed to be retained in the rock, resulting inthe same mineral assemblage as (A) in addition to trondhjemitic leucosome. (D) Same starting mineralogy as (B). All melt isassumed to be retained in the rock, resulting in the same mineral assemblage as (B) in addition to trondhjemitic leucosome.
hornblende-rich layers may be ascribed to varying variations would be manifested in modal differenceswithin the common assemblage. The simplest expla-amounts of quartz in the protolith, with the quartz-
richest protoliths now represented by the nation is that in the KSZ rocks, the different sets ofFe-Mg ratios reflect the P–T conditions at whichgarnet+diopside-richest layers. Although some of the
modal variability may also reflect variable modal quartz was consumed in the reaction (Fig. 9). Althoughsubsequent modification of the mineral compositionsmineralogy in the rocks prior to dehydration melting
(e.g. variable abundance of diopside), the roughly is indicated by the similarity in Kd(Fe-Mg) betweengarnet and diopside in the different layers (Table 6),proportional abundance of garnet and diopside in
Fig. 3, combined with the textural data, is consistent indicating continued Fe-Mg exchange following stallingof the main net transfer reaction, this later exchangewith significant production of both minerals by the
dehydration melting reaction. will have only a second-order effect on the Fe-Mgratios of the phases over the temperature intervalFurther support for the above interpretation comes
from the fact that the Hbl+Grt+Di subassemblage concerned.Referring to Fig. 3, the amount of modal quartz inshows a range of Fe-Mg ratios in different layers even
though the rocks experienced the same P–T conditions. the melanosome varies from 2 to 15% and shows noconsistent pattern as a function of modal hornblende.Neglecting the effects of other compositional variations
(discussed below), if several layers contain the same Quartz in the modes is due to the presence ofinterstitial quartz (e.g. Fig. 5c–e) in addition to quartzmineral assemblage and equilibrated at the same P–T
conditions, the Fe-Mg ratios of the minerals in all contained in subtle quartzofeldspathic segregations inthe melanosome which were not recognized as suchlayers should in theory be the same; bulk compositional
608 T. H. D. H ARTE L AND D .R .M. PATT IS ON
Dunn (1994) suggested that the type and extent ofreaction in dehydration melting experiments onamphibolite was controlled by presence or absenceof quartz.
Secondary controls on reaction progress: mineralcompositional variations
Mineral compositional variations will have influencedthe temperature of inception and progress of reaction.The most important compositional variations areFe-Mg ratio, Al content of hornblende and XAn ofplagioclase.
The rocks showing the greatest extent of reaction(Di+Grt-rich layers) are the Fe-richest. These layersshow the poorest development of internal leucocraticsegregations, suggesting that the melt that accompaniedthe production of abundant garnet and diopside wasmechanically expelled from the rock. In contrast, thehornblende-richest layers, which are the Mg-richest,show the best development of internal leucosomes,suggesting that they may have been quenched shortly
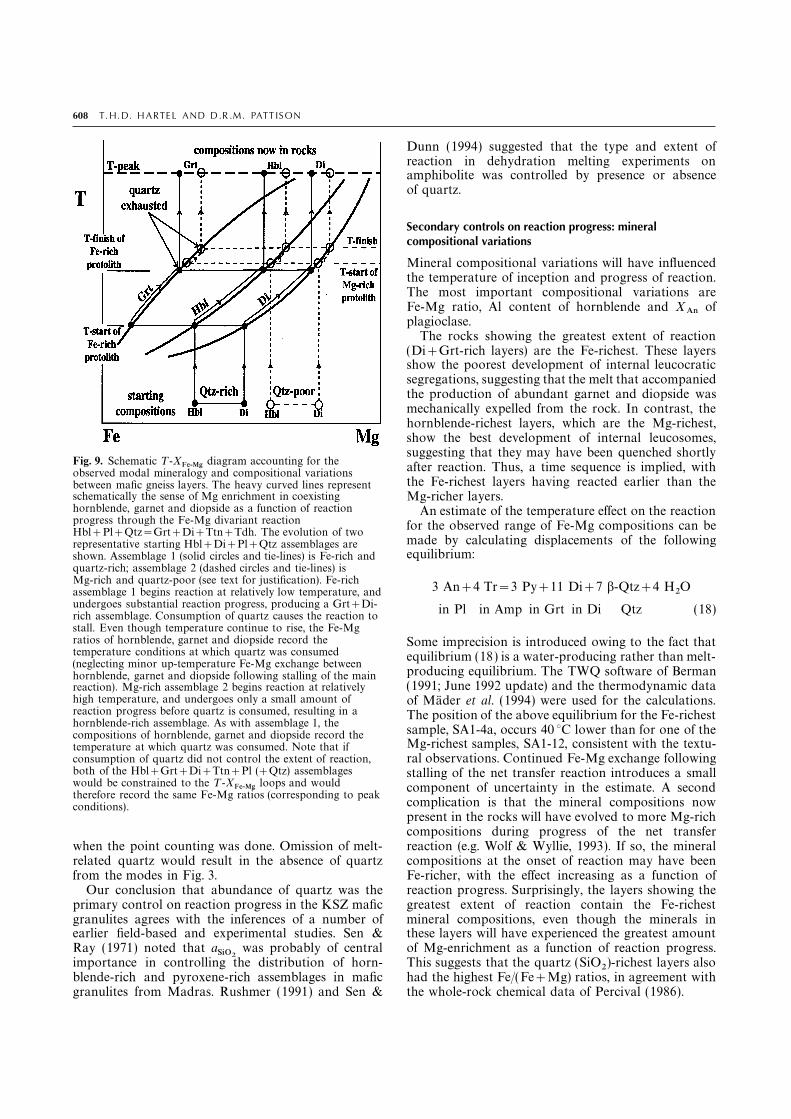
Fig. 9. Schematic T -XFe-Mg diagram accounting for the after reaction. Thus, a time sequence is implied, withobserved modal mineralogy and compositional variationsthe Fe-richest layers having reacted earlier than thebetween mafic gneiss layers. The heavy curved lines represent
schematically the sense of Mg enrichment in coexisting Mg-richer layers.hornblende, garnet and diopside as a function of reaction An estimate of the temperature effect on the reactionprogress through the Fe-Mg divariant reaction for the observed range of Fe-Mg compositions can beHbl+Pl+Qtz=Grt+Di+Ttn+Tdh. The evolution of two made by calculating displacements of the followingrepresentative starting Hbl+Di+Pl+Qtz assemblages are
equilibrium:shown. Assemblage 1 (solid circles and tie-lines) is Fe-rich andquartz-rich; assemblage 2 (dashed circles and tie-lines) isMg-rich and quartz-poor (see text for justification). Fe-rich 3 An+4 Tr=3 Py+11 Di+7 b-Qtz+4 H2Oassemblage 1 begins reaction at relatively low temperature, andundergoes substantial reaction progress, producing a Grt+Di- in Pl in Amp in Grt in Di Qtz (18)rich assemblage. Consumption of quartz causes the reaction tostall. Even though temperature continue to rise, the Fe-Mgratios of hornblende, garnet and diopside record the Some imprecision is introduced owing to the fact thattemperature conditions at which quartz was consumed equilibrium (18) is a water-producing rather than melt-(neglecting minor up-temperature Fe-Mg exchange between producing equilibrium. The TWQ software of Bermanhornblende, garnet and diopside following stalling of the main
(1991; June 1992 update) and the thermodynamic datareaction). Mg-rich assemblage 2 begins reaction at relativelyhigh temperature, and undergoes only a small amount of of Mader et al. (1994) were used for the calculations.reaction progress before quartz is consumed, resulting in a The position of the above equilibrium for the Fe-richesthornblende-rich assemblage. As with assemblage 1, the sample, SA1-4a, occurs 40 °C lower than for one of thecompositions of hornblende, garnet and diopside record the
Mg-richest samples, SA1-12, consistent with the textu-temperature at which quartz was consumed. Note that ifconsumption of quartz did not control the extent of reaction, ral observations. Continued Fe-Mg exchange followingboth of the Hbl+Grt+Di+Ttn+Pl (+Qtz) assemblages stalling of the net transfer reaction introduces a smallwould be constrained to the T -XFe-Mg loops and would component of uncertainty in the estimate. A secondtherefore record the same Fe-Mg ratios (corresponding to peak complication is that the mineral compositions nowconditions).
present in the rocks will have evolved to more Mg-richcompositions during progress of the net transferreaction (e.g. Wolf & Wyllie, 1993). If so, the mineralwhen the point counting was done. Omission of melt-
related quartz would result in the absence of quartz compositions at the onset of reaction may have beenFe-richer, with the effect increasing as a function offrom the modes in Fig. 3.
Our conclusion that abundance of quartz was the reaction progress. Surprisingly, the layers showing thegreatest extent of reaction contain the Fe-richestprimary control on reaction progress in the KSZ mafic
granulites agrees with the inferences of a number of mineral compositions, even though the minerals inthese layers will have experienced the greatest amountearlier field-based and experimental studies. Sen &
Ray (1971) noted that aSiO2was probably of central of Mg-enrichment as a function of reaction progress.
This suggests that the quartz (SiO2)-richest layers alsoimportance in controlling the distribution of horn-blende-rich and pyroxene-rich assemblages in mafic had the highest Fe/(Fe+Mg) ratios, in agreement with
the whole-rock chemical data of Percival (1986).granulites from Madras. Rushmer (1991) and Sen &

MIG MATI TI C MAF I C G RAN UL IT ES , ON TARI O 609
The effects of the observed range of plagioclase trondhjemites and tonalities. Modelling by Rudnick &Taylor (1986) and Rapp et al. (1991) suggested thatcomposition and Al content of hornblende were
similarly estimated using equilibrium (22). Varying the about 20% melting from such mafic rocks couldaccount for the observed REE patterns. Based on ourXAn content of plagioclase by ±5XAn results in a
displacement of ±15 °C, whereas varying the Al mass balance modelling, we estimate that 5–35 vol.%trondhjemitic leucosome was generated during pro-content of amphibole by ±0.1 cations (accompanied
by variation in Si, Mg, Fe, Na, and K appropriate to duction of the Grt+Di-bearing KSZ mafic gneisses, ofwhich most (5–30%) was expelled. These figures agreethe ‘pg’ exchange) results in a displacement of ±20 °C.
Combining all of the compositional effects for the well with the inferences from REE modelling. Theinferred amount of melting (4–25%) and modalobserved range of mineral compositions, the onset of
the reaction could have varied by as much as about mineralogy of the residue (15–45% plagioclase,30–50% hornblende, 2–35% diopside, 3–15% garnet)75 °C, with the lowest temperatures being for Fe-rich
layers containing Al-poor hornblende and An-rich inferred in the study of Luais & Hawkesworth (1994)is remarkably similar to the observed modes inplagioclase. This spread of temperatures is greater than
implied by Beard & Lofgren (1991), who found that our study.the inception of dehydration melting was apparentlyinsensitive to the composition of the starting amphibole ACKNOW LEDGEM ENTSand plagioclase.
This article represents part of an MSc thesis preparedIt is important to note that mineral compositionalby T.H.D.H. at the University of Calgary under thevariation alone cannot account for the differing extentssupervision of D.R.M.P. We express our thanks to J.A.of reaction observed in the gneisses. Fe-rich hornblendePercival, who introduced us to the KSZ during severalstill remains in the Grt+Di-rich layers (e.g. SA1-4b),field excursions, and who reviewed the first draft ofeven though it should have reacted out had there beenthe paper. E.W. Sawyer, J.S. Beard and especially B.R.any solid quartz available. The hornblende is notFrost are thanked for their formal reviews. J. Machacek,enriched in minor components (e.g. F) that might haveD. Glatiotis, J. Resultay, M. Horvath and B. Fongstabilized it (Table 3). Plagioclase in these layers,provided us with excellent technical assistance. Thisalthough strongly zoned, is relatively calcic whichresearch was supported by NSERC research grantwould favour rather than retard reaction.037233 to D.R.M.P. and by a grant from the GeologicalSurvey of Ontario.
EXPULSION OF MELT
Figure 8 shows opposite extremes in the assumed REFERENCESextent to which trondhjemitic leucosome was expelled
Aranovich, L. Ya. & Pattison, D. R. M., 1994. Reassessment offrom the rocks. In these models, 10–35% leucosome is the garnet-clinopyroxene Fe-Mg exchange thermometer: I.generated, depending on the amount of quartz in the Reanalysis of the Pattison and Newton (1989 ) run products.protolith. In outcrop, apart from rocks containing Contributions to Mineralogy and Petrology, 119, 16–29.
Ashworth, J. R., 1976. Petrogenesis of migmatites in the Huntlyobviously intrusive veins and dykes, most layersPortsoy area, north-east Scotland. Mineralogical Magazine,contain 5–10 vol.% leucosome, sometimes as high as40, 661–682.20% in the hornblende-richer layers (Fig. 2). These Ashworth, J. R., 1985. Introduction. In: Migmatites (ed. Ashworth,
variations imply variable extents of expulsion of the J. R.), pp. 1–35. Blackie, Glasgow.Beard, J. S., 1990. Partial melting of metabasites in the contactmelt intermediate between the two extremes. The small
aureoles of gabbroic plutons in the Smartville Complex, Sierraamount of leucosome in the Grt+Di-richest layersNevada, California. In: T he Nature and Origin of Cordilleransuggests that melt generation and expulsion in theseMagmatism (ed. Anderson, J.L.), Geological Society of Americalayers may have occurred prior to leucosome gener- Memoir, 174, 303–313.
ation in the hornblende-rich layers. Evidence for melt Beard, J. S. & Lofgren, G. E., 1991. Dehydration melting andwater-saturated melting of basaltic and andesitic greenstonesexpulsion and transport comes from the abundantand amphibolites at 1, 3, and 6.9 kbar. Journal of Petrology,transecting trondhjemitic veins and dykes within32, 365–401.the gneisses. Begin, N. J. & Pattison, D. R. M., 1994. Metamorphic evolution
Numerous studies have used rare earth element of granulites in the Minto Block, northern Quebec: extractionof peak P–T conditions taking account of late Fe-Mg(REE) and trace element data from Archaeanexchange. Journal of Metamorphic Geology, 12, 411–428.trondhjemitic and tonalitic intrusive bodies to make
Berman, R. G., 1988. Internally consistent thermodynamic datainferences on the source rocks for the magmas (e.g. for minerals in the system Na2O-K2O-CaO-MgO-FeO-Fe2O3-Rudnick & Taylor, 1986; Sylvester et al., 1986; Rapp Al2O3-SiO2-TiO2-H2O-CO2. Journal of Petrology, 29, 445–522.et al., 1991; Luais & Hawkesworth, 1994; and references Berman, R. G., 1991. Thermobarometry using multi-equilibrium
calculations: a new technique, with petrological applications.therein). Rudnick & Taylor (1986), Rapp et al. (1991)Canadian Mineralogist, 29, 833–855.and Luais & Hawkesworth (1994) concluded that a
Berman, R. G., Aranovich, L. Ya. & Pattison, D. R. M., 1995.Grt±Di±Amp-bearing mafic granulite or eclogite is Reassessment of the garnet-clinopyroxene Fe-Mg exchangethe most likely source rock to produce the highly thermometer: II. Thermodynamic analysis. Contributions to
Mineralogy and Petrology, 119, 30–42.fractionated, heavy REE-depleted signatures of many
610 T. H. D. H ARTE L AND D .R .M. PATT IS ON
Brown, G. C. & Fyfe, W. S., 1970. The production of granitic Johannes, W., 1983. Metastable melting in granite and relatedsystems. In: Migmatites, Melting and Metamorphism (edsmelts during ultrametamorphism. Contributions to MineralogyAtherton, M. P. & Gribble, C. D.), pp. 27–36. Shiva,and Petrology, 28, 310–318.Nantwich, England.Brown, M., 1979. The petrogenesis of the St. Malo migmatite
Jurewicz, S. R. & Watson, E. B., 1984. Distribution of partialbelt, Armorican Massif, France, with particular reference tomelt in a felsic system: the importance of surface energy.the diatexites. Neues Jahrbuch fur Mineralogie Abh., 135, 48–74.Contributions to Mineralogy and Petrology, 85, 25–29.Bursnall, G. T., Leclair, A. D., Moser, D. E. & Percival, J. A.,
Kretz, R., 1983. Symbols for rock-forming minerals. American1994. Structural correlation within the Kapuskasing uplift.Mineralogist, 68, 277–279.Canadian Journal of Earth Sciences, 31, 1081–1095.
Krogh, T. E. & Moser, D. E., 1994. U-Pb zircon and monaziteClemens, J. D. & Vielzeuf, D., 1987. Constraints on melting andages from the Kapuskasing uplift: age constraints on defor-magma production in the crust. Earth and Planetary Sciencemation within the Ivanhoe Lake fault zone. Canadian JournalL etters, 86, 287–306.of Earth Sciences, 31, 1096–1103.Corfu, F., 1987. Inverse age stratification in the Archean crust
Lange, R. A., 1994. The effect of H2O, CO2 and F on the densityof the Superior province: evidence for infra- and subcrustaland viscosity of silicate melts. In: Volatiles in Magmas (edsaccretion from high resolution U-Pb zircon and monaziteCarroll, M. R. & Holloway, J. R.), Mineralogical Society ofages. Precambrian Research, 36, 259–275.America, Reviews in Mineralogy, 30, 331–370.Cosca, M. A., Essene, E. J. & Bowman, J. R., 1991. Complete
Luais, B. & Hawkesworth, C. J., 1994. The generation ofchemical analyses of metamorphic hornblendes: implicationscontinental crust: an integrated study of crust-forming pro-for normalizations, calculated H2O activities and thermobaro-cesses in the Archean of Zimbabwe. Journal of Petrology,metry. Contributions to Mineralogy and Petrology, 108, 472–484.35, 43–93.Eckert, J. O., Newton, R. C. & Kleppa, O. J., 1991. The DH of
Mader, U. K., Percival, J. A. & Berman, R. G., 1994.reaction and recalibration of garnet-pyroxene-plagioclase-Thermobarometry of garnet-clinopyroxene-hornblende granu-quartz geobarometers in the CMAS system by solutionlites from the Kapuskasing structural zone. Canadian Journalcalorimetry. American Mineralogist, 76, 148–160.of Earth Sciences, 31, 1134–45.Ellis, D. J. & Green, D. H., 1979. An experimental study of the
Mehnert, K. R., Busch, W. & Schneider, G., 1973. Initial meltingeffect of Ca upon garnet-clinopyroxene Fe-Mg exchangeat grain boundaries of quartz and feldspar in gneisses andequilibria. Contributions to Mineralogy and Petrology, 71, 13–22.granulites. Neues Jahrbuch fur Mineralogie Monatshefte,Ellis, D. J. & Thompson, A. B., 1986. Subsolidus and partial1973, 165–183.melting reactions in the quartz-excess CaO+MgO+
Moecher, D. P., Essene, E. J. & Anovitz, L. M., 1988. CalculationAl2O3+SiO2+H2O system under water-excess and water-and application of clinopyroxene-garnet-plagioclase-quartzdeficient conditions to 10 kb: some implications for the origin geobarometers. Contributions to Mineralogy and Petrology,of peraluminous melts from mafic rocks. Journal of Petrology,100, 92–106.27, 91–121. Nicholls, J. & Stout, M. Z., 1988. Picritic melts in Kiluaea –Fisher, G. W., 1989. Matrix analysis of metamorphic mineral evidence from the 1967–1968 Halemaumau and Hiiakaassemblages and reactions. Contributions to Mineralogy and eruptions. Journal of Petrology, 29, 1031–1057.Petrology, 102, 69–77. Nyman, M. W., Pattison, D. R. M. & Ghent, E. D., 1995. MeltFrost, B. R. & Chacko, T., 1989. The granulite uncertainty extraction during formation of K-feldspar+sillimanite migma-principle: Limitations on thermobarometry in granulites. tites, west of Revelstoke, British Columbia. Journal ofJournal of Geology, 97, 435–450.Petrology, 36, 351–372.Frost, B. R. & Tracy, R. J., 1991. Phase equilibria and Paquet, J. & Francois, P., 1980. Experimental deformation ofthermobarometry of calcareous, ultramafic and mafic rocks, partially melted granitic rocks at 600–900 °C and 250 MPaand iron formations. In: Contact Metamorphism (ed. Kerrick, confining pressure. T ectonophysics, 68, 131–146.D. M.), Mineralogical Society of America Reviews in Patino-Douce, A. E. & Beard, J. S., 1995. Dehydration-melting
Mineralogy, 26, 207–320. of biotite gneiss and quartz amphibolite from 3 to 15 kbar.Geis, W. T., Cook, F. A., Green, A. G., Percival, J. A., West,Journal of Petrology, 36, 707–738.G. F. & Milkereit, B., 1990. Thin thrust sheet formation of Patino-Douce, A. E. & Johnson, A. D., 1991. Phase equilibriathe Kapuskasing structural zone revealed by LITHOPROBE and melt productivity in the pelitic system: implications forseismic reflection data. Geology, 18, 513–516. the origin of peraluminous granitoids and aluminous granu-Gordon, T. M., Ghent, E. D. & Stout, M. Z., 1991. Algebraic lites. Contributions to Mineralogy and Petrology, 107, 202–218.analysis of the biotite-sillimanite isograd in the File Lake Pattison, D. R. M., 1991. Infiltration-driven dehydration andarea, Manitoba. Canadian Mineralogist, 29, 673–686. anatexis in granulite facies metagabbro, Grenville Province,Grant, J. A. & Frost, B. R., 1990. Contact metamorphism and Ontario, Canada. Journal of Metamorphic Geology, 9, 315–332.partial melting of pelitic rocks in the aureole of the Laramie Pattison, D. R. M. & Begin, N. J., 1994. Compositional maps ofanorthosite complex, Morton Pass, Wyoming. American metamorphic orthopyroxene and garnet: evidence for a
Journal of Science, 290, 425–427. hierarchy of closure temperatures and implications for geother-Hacker, B. R., 1990. Amphibolite facies-to-granulite facies mometry of granulites. Journal of Metamorphic Geology,
reactions in experimentally deformed, unpowdered amphibo- 12, 387–410.lite. American Mineralogist, 75, 1349–1361. Pattison, D. R. M. & Harte, B., 1988. Evolution of structurally
Hanes, J. A., Archibald, D. A., Queen, M. & Farrar, E., 1994. contrasting anatectic migmatites in the 3-kbar BallachulishConstraints from 40Ar/39Ar geochronology on the tectonother- aureole, Scotland. Journal of Metamorphic Geology, 6, 475–494.mal history of the Kapuskasing uplift in the Canadian Pattison, D. R. M. & Newton, R. C., 1989. Reversed experimentalSuperior province. Canadian Journal of Earth Sciences, 31, calibration of the garnet-clinopyroxene Fe-Mg exchange1146–1171. thermometer. Contributions to Mineralogy and Petrology,
Harte, B., Pattison, D. R. M. & Linklater, C. M., 1991. Field 101, 87–103.relations and petrography of partially melted pelitic and semi- Percival, J. A., 1983. High-grade metamorphism in the Chapleau-pelitic rocks. In: Equilibrium and Kinetics in Contact Foleyet area, Ontario. American Mineralogist, 68, 667–686.Metamorphism: the Ballachulish Igneous Complex and its Percival, J. A., 1986. The Kapuskasing uplift: Archean green-T hermal Aureole (eds Voll, G., Topel, J., Pattison, D. R. M. & stones and granulites. Geological Association of Canada,Seifert, F.), pp. 181–210. Springer Verlag, Heidelberg. Ottawa 1986 meeting, Field trip 16 guidebook.
Hartel, T. H. D., 1993. Genesis of mafic migmatites from the Percival, J. A. & Card, K. D., 1983. Archean crust as revealedKapuskasing Structural Zone, Ontario, Canada. MSc Thesis, in the Kapuskasing uplift, Superior province, Canada. Geology,
11, 323–326.University of Calgary, Canada.

MIG MATI TI C MAF I C G RAN UL IT ES , ON TARI O 611
Percival, J. A. & Peterman, Z. E., 1994. Rb-Sr biotite and whole depleted dacites of the Michipicoten greenstone belt?Geological Association of Canada – Mineralogical Associationrock data from the Kapuskasing uplift and their bearing on
the cooling and exhumation history. Canadian Journal of of Canada Annual meeting, Abstracts with program, 11,133.Earth Sciences, 31, 1172–1181.
Percival, J. A. & West, G. F., 1994. The Kapuskasing uplift: a Tait, R. E. & Harley, S. L., 1988. Local processes involved inthe generation of migmatites within mafic granulites.geological and geophysical synthesis. Canadian Journal of
Earth Sciences, 31, 1256–1286. T ransactions of the Royal Society of Edinburgh: Earth Sciences,79, 209–222.Powell, R., 1983. Fluids and melting under upper amphibolite
facies conditions. Journal of Geological Society of L ondon, Thompson, A. B., 1982. Dehydration melting of pelitic rocksand the generation of H2O-undersaturated granitic liquids.140, 629–633.
Raase, P., Raith, M., Ackermand, D. & Lal, R. K., 1986. American Journal of Science, 282, 1567–1595.Thompson, A. B. & Ellis, D. J., 1994.Progressive metamorphism of mafic rocks from greenschist to
granulite facies in the Dharwar craton of southern India. CaO+MgO+Al2O3+SiO2+H2O to 35 kbar: amphibole,talc, and zoisite dehydration and melting reactions in theJournal of Geology, 94, 261–282.
Rapp, R. P., Watson, E. B. & Miller, C. F., 1991. Partial melting silica-excess part of the system and their possible significancein subduction zones, amphibolite melting, and magma fraction-of amphibolite/eclogite and the origin of Archean trondhjem-
ites and tonalites. Precambrian Research, 51, 1–25. ation. American Journal of Science, 294, 1229–1289.Thompson, J. B., 1982a. Composition space: an algebraic andRobinson, P., Spear, F. S., Schumacher, J. C., Laird, J., Klein, C.,
Evans, B. W. & Doolan, B. L., 1982. Phase relations of geometric approach. In: Characterization of MetamorphismT hrough Mineral Equilibria (ed. Ferry, J. M.), Mineralogicalmetamorphic amphiboles: natural occurrence and theory. In:
Amphiboles: Petrology and Experimental Phase Relations (eds Society of America, Reviews in Mineralogy, 10, 1–32.Thompson, J. B., 1982b. Reaction space: an algebraic andVeblen, D. R. & Ribbe, P. H.), Mineralogical Society of
America, Reviews in Mineralogy, 9B, 1–227. geometric approach. In: Characterization of MetamorphismT hrough Mineral Equilibria (ed. Ferry, J. M.), MineralogicalRudnick, R. L. & Taylor, S. R., 1986. Geochemical constraints
on the origin of Archean tonalitic-trondhjemitic rocks and Society of America, Reviews in Mineralogy, 10, 33–52.Thurston, P. C., Siragusa, G. M. & Sage, R. P., 1977. Geologyimplications for lower crustal composition. In: T he Nature of
the L ower Continental Crust (eds Dawson, J. B., Carswell, of the Chapleau area. Ontario Division of Mines, GeoscienceReport, 157.D. A., Hall, J. & Wedepohl, K. H.), Geological Society of
L ondon, Special Publication, 24, 179–191. Vernon, R. H. & Collins, W. J., 1988. Igneous microstructuresin migmatites. Geology, 16, 1126–1129.Rushmer, T., 1991. Partial melting of two amphibolites: con-
trasting experimental results under fluid-absent conditions. Vielzeuf, D. & Clemens, J. D., 1992. The fluid-absent melting ofphlogopite+quartz: experiments and models. AmericanContributions to Mineralogy and Petrology, 107, 41–59.
Russ-Nabelek, C., 1989. Isochemical contact metamorphism of Mineralogist, 77, 1206–1222.Vielzeuf, D. & Montel, J. M., 1994. Partial melting ofmafic schist, Laramie anorthosite complex, Wyoming: amphi-
bole compositions and reactions. American Mineralogist, metagreywackes. Part, I. Fluid-absent experiments and phaserelationships. Contributions to Mineralogy and Petrology,74, 530–548.
Sawyer, E. W., 1991. Disequilibrium melting and the rate of 117, 375–393.Waters, D. J., 1988. Partial melting and the formation of granitemelt-residuum separation during migmatisation of mafic rocks
from the Grenville Front, Quebec. Journal of Petrology, facies assemblages in Namaqualand, South Africa. Journal ofMetamorphic Geology, 6, 387–404.32, 701–738.
Schumacher, R., 1991. Composition and phase relations of calcic Williams, M. L., Hanmer, S. K., Darrach, M. & Kopf, C., 1995.Syntectonic generation and segregation of tonalitic melts fromamphiboles in epidote- and clinopyroxene-bearing rocks of
the amphibolite and lower granulite facies, central amphibolite dikes in the lower crust, Chipman dike swarm,northern Saskatchewan. Journal of Geophysical Research,Massachusetts, U.S.A. Contributions to Mineralogy and
Petrology, 108, 196–211. 100–B8, 15,717–15,734.Wolf, M. B. & Wyllie, P. J., 1991. Dehydration-melting of solidSen, C. & Dunn, T., 1994. Dehydration melting of a basaltic
composition amphibolite at 1.5 and 2.0 GPa: implications for amphibolite at 10 kbar: textural development, liquid intercon-nectivity and applications to the segregation of magmas.the origin of adakites. Contributions to Mineralogy and
Petrology, 117, 394–409. Mineralogy and Petrology, 44, 151–179.Wolf, M. B. & Wyllie, P. J., 1993. Garnet growth duringSen, S. K. & Ray, S., 1971. Hornblende-pyroxene granulites vs.
pyroxene granulites: a study from the type charnockite area. amphibolite anatexis: implications of a garnetiferous restite.Journal of Geology, 101, 357–373.Neues Jahrbuch fur Mineralogie Abh., 115, 291–314.
Sylvester, P. J., Attoh, K. & Schultz, K. J., 1986. Did anatexisin the Kapuskasing structural zone produce the HREE Received 31 October 1995; revision accepted 8 April 1996.