genes expressed in specific areas of the human fetal ... · belgium, 6gladstone institutes,...
TRANSCRIPT

Genes Expressed in Specific Areas of the Human FetalCerebral Cortex Display Distinct Patterns of EvolutionNelle Lambert1,2., Marie-Alexandra Lambot1., Angeline Bilheu1, Valerie Albert3, Yvon Englert3,
Frederick Libert1, Jean-Christophe Noel4, Christos Sotiriou5, Alisha K. Holloway6, Katherine S. Pollard6,7,
Vincent Detours1, Pierre Vanderhaeghen1*
1 Institut de Recherches en Biologie Humaine et Moleculaire (IRIBHM), Universite Libre de Bruxelles (ULB), Brussels, Belgium, 2 Hopital Universitaire des Enfants Reine
Fabiola, Child Psychiatry Department, Brussels, Belgium, 3 Department of Obstetrics and Gynaecology, Universite Libre de Bruxelles (ULB), Brussels, Belgium,
4 Department of Pathology, Erasme Hospital, Universite Libre de Bruxelles (ULB), Brussels, Belgium, 5 Bordet Cancer Institute, Universite Libre de Bruxelles (ULB), Brussels,
Belgium, 6 Gladstone Institutes, University of California San Francisco, San Francisco, California, United States of America, 7 Division of Biostatistics & Institute for Human
Genetics, University of California San Francisco, San Francisco, California, United States of America
Abstract
The developmental mechanisms through which the cerebral cortex increased in size and complexity during primateevolution are essentially unknown. To uncover genetic networks active in the developing cerebral cortex, we combinedthree-dimensional reconstruction of human fetal brains at midgestation and whole genome expression profiling. This novelapproach enabled transcriptional characterization of neurons from accurately defined cortical regions containingpresumptive Broca and Wernicke language areas, as well as surrounding associative areas. We identified hundreds ofgenes displaying differential expression between the two regions, but no significant difference in gene expression betweenleft and right hemispheres. Validation by qRTPCR and in situ hybridization confirmed the robustness of our approach andrevealed novel patterns of area- and layer-specific expression throughout the developing cortex. Genes differentiallyexpressed between cortical areas were significantly associated with fast-evolving non-coding sequences harboring human-specific substitutions that could lead to divergence in their repertoires of transcription factor binding sites. Strikingly, whilesome of these sequences were accelerated in the human lineage only, many others were accelerated in chimpanzee and/ormouse lineages, indicating that genes important for cortical development may be particularly prone to changes intranscriptional regulation across mammals. Genes differentially expressed between cortical regions were also enriched fortranscriptional targets of FoxP2, a key gene for the acquisition of language abilities in humans. Our findings point to asubset of genes with a unique combination of cortical areal expression and evolutionary patterns, suggesting that they playimportant roles in the transcriptional network underlying human-specific neural traits.
Citation: Lambert N, Lambot M-A, Bilheu A, Albert V, Englert Y, et al. (2011) Genes Expressed in Specific Areas of the Human Fetal Cerebral Cortex Display DistinctPatterns of Evolution. PLoS ONE 6(3): e17753. doi:10.1371/journal.pone.0017753
Editor: Bassem Hassan, Virginia Industries for the Blind, Belgium
Received December 31, 2010; Accepted February 8, 2011; Published March 18, 2011
Copyright: � 2011 Lambert et al. This is an open-access article distributed under the terms of the Creative Commons Attribution License, which permitsunrestricted use, distribution, and reproduction in any medium, provided the original author and source are credited.
Funding: This work was funded by grants from the Belgian FRS/FNRS, the Belgian FRSM, the Queen Elizabeth Medical Foundation, the Interuniversity AttractionPoles Programme, Belgian State, Federal Office for Scientific, Technical and Cultural Affairs, The Fondation Pierre Clerdent, the Walloon Region ExcellenceProgramme Cibles, The Welbio Programme, the Fonds Erasme and the Belgian Kid’s Fund (to PV, NL, MA), and the National Institute of General Medical Sciences(grant GM82901) (to KSP). PV is a Research Director and NL a clinician-scientist of the FNRS. The funders had no role in study design, data collection and analysis,decision to publish, or preparation of the manuscript.
Competing Interests: The authors have declared that no competing interests exist.
* E-mail: [email protected]
. These authors contributed equally to this work.
Introduction
The cerebral cortex has acquired or expanded a variety of
specific features during evolution of the primate lineage. These
include a larger relative size but also many important qualitative
differences [1,2,3,4,5,6]. The human cortex displays an increased
size and number of specific associative areas, and extensive
specialization of some areas such as the language areas of Broca
and Wernicke [7,8]. These two areas also display a high degree of
lateralization, with most language processing activities being
localized in the left hemisphere [9].
What are the mechanisms underlying the emergence of specific
features in the human cortex? It seems likely that the most
dramatic changes in human brain evolution are related to specific
early developmental events [2,3]. For instance, the overall increase
in cortical surface in primates may be linked to species-specific
features of cortical progenitors [2,4,10,11,12,13]. However, the
developmental mechanisms underlying the species-specific pat-
terning and diversity of cortical areas remain essentially unknown.
Recent studies have started to characterize the transcriptome of
the human fetal cortex, thus identifying genes differentially
expressed between distinct domains [14,15] or displaying
lateralized expression in the embryonic cortex [16,17]. These
studies have also uncovered high prevalence of alternative splicing
among genes differentially expressed in the fetal cortex, as well as
frequent association with human-specific evolution of their
putative cis-regulatory elements or coding sequences [14,17]. On
the other hand, computational analyses have identified genes and
putative transcriptional regulatory elements with signatures of
positive selection in the primate lineage [3,18,19,20,21]. Among
PLoS ONE | www.plosone.org 1 March 2011 | Volume 6 | Issue 3 | e17753

these, the so-called HAR (human accelerated regions) or haCNS
(human accelerated conserved non coding sequences) elements are
highly conserved non-coding regions that have changed rapidly
along the human lineage and are thought to correspond mainly to
regulatory elements that could contribute to species-specific
transcriptional programs [18,19,22,23]. Genomic studies have
also uncovered potential changes in transcription factors that
could regulate the development of features specific to the human
brain. These include FOXP2, a gene required for the acquisition of
language skills, which displays several human-specific molecular
features [24].
Here we developed a novel approach combining three-
dimensional reconstruction of human fetal brain and expression
profiling, to define the transcriptome of neurons from accurately
defined cortical regions containing presumptive language areas of
Broca and Wernicke. Analysis of transcriptional patterns and
evolutionary signatures of genes active in these areas uncovered a
novel set of cortical genes displaying differential expression plus
divergent evolution in their regulatory regions. These genes are
promising candidates for discovering the genetic framework
underlying the acquisition of human-specific neural traits.
Results
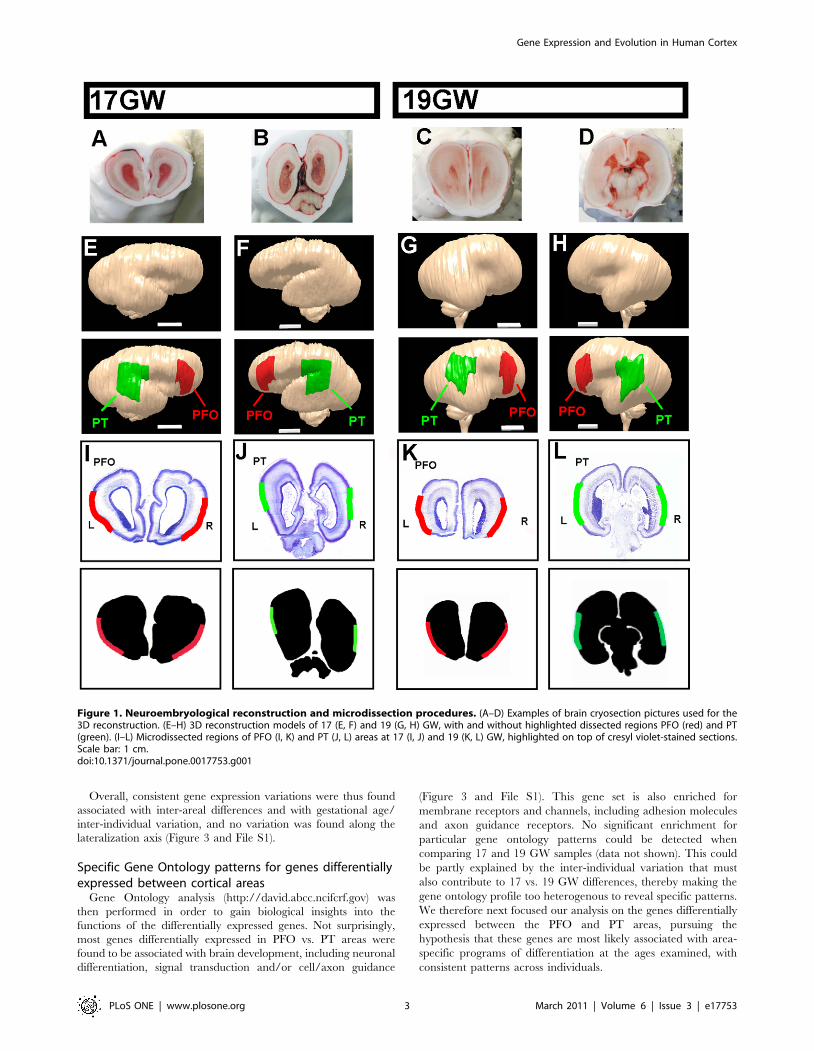
Using three-dimensional reconstruction of human fetalbrain tissue to probe the transcriptome of specificcortical areas
In order to gain insight into the development of human-specific
features of the cerebral cortex, we investigated gene expression
patterns in cortical domains that contain areas thought to have
undergone significant divergence during primate evolution. We
focused on the presumptive language areas of Broca and
Wernicke, as well as surrounding associative areas of the frontal
and parieto-temporal cortex.
Two major challenges in this approach are to determine with
precision the boundaries of the territories of interest, and to isolate
them in a reproducible fashion from different tissue samples. To
tackle these problems, we developed a procedure whereby human
fetal brains of two developmental stages (17 and 19 gestational
weeks (GW)) were processed as a whole, without any prior
dissection. First, the brains were freshly frozen and cryosectioned
(Figure 1A–D). Photographed sections were then used to
reconstruct a three-dimensional (3D) model of each brain, which
allowed us to visualize with great accuracy the areas of interest
(Figure 1E–H). In order to obtain comparable cortical areas
between different brains at different developmental stages, we
performed a ‘morphing’ of each 3D model, thereby allowing a
precise delineation of the same cortical domains in different
samples at different developmental stages. These were used to
determine two cortical regions of interest: one (which we named
PFO), corresponding to parts of the prefrontal/frontal/orbito-
frontal cortex and containing presumptive Broca area and
surrounding associative areas, and the other (named PT),
corresponding to parts of parieto-temporal cortex and containing
presumptive Wernicke area and surrounding associative areas
(Figure 1E–L). The corresponding tissues were then microdissect-
ed on the cryosections using templates generated from the 3D
reconstructions (Figure 1I–L). Importantly, this method enabled us
to collect selectively the tissue corresponding to the cortical plate,
the region containing only post-migratory cortical neurons, and
thus excluding cortical progenitors and migrating neurons from
our samples (Figure 1I–L). Finally, mRNA was extracted from the
corresponding tissue and profiled by conventional microarray
analyses.
Gene expression varies with cortical area but not withlateralization
We compared gene expression patterns in the context of three
main parameters: the area dissected (PFO vs. PT), lateralization
(left vs. right), and gestational age (17 vs. 19 GW). Due to the very
limited availability of human fetal brain samples, each of these
comparisons is based on eight tissue samples from two individuals.
Thus, our power to reliably detect differential expression is a priori
low. We therefore conducted simple, robust statistical analyses
with strict significance thresholds. While this approach may miss
some truly differentially expressed genes, we expected the
detectable differences to be reliable. These expectations were
confirmed by the relatively low number of differentially expressed
genes that we identified, the high concordance observed between
the data obtained from the two individuals, and the large
proportion of these that we validated in independent, low
throughput experiments (see below). Since samples at different
gestational ages were dissected from different individuals, gene
expression associated with this variable also corresponds to inter-
individual variability and must be interpreted accordingly.
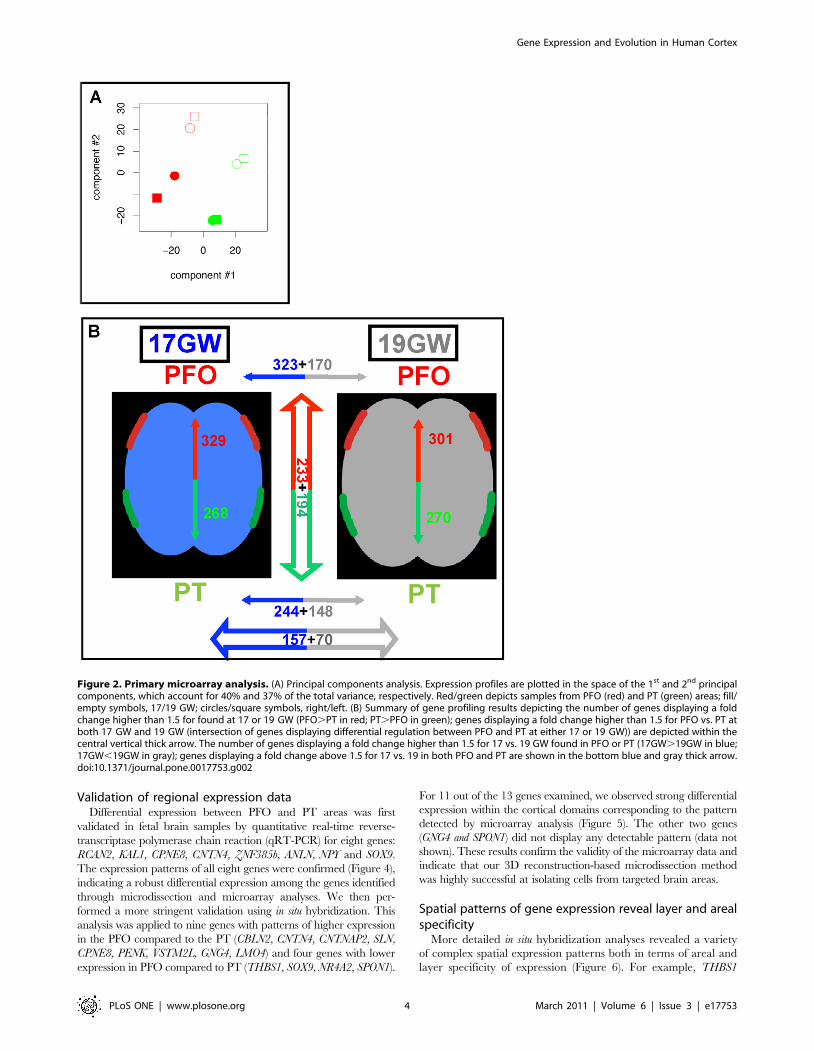
In order to visualize the dominant trends of global gene
expression, we used principal components analysis (Figure 2A).
Projecting gene expression variation onto the first two principal
components, clear separation lines could be drawn between
samples from different cortical areas. Samples from different
developmental stages or individuals were also clearly separated.
Importantly, there was no separation between left and right
samples, even when including the third principal component (not
shown). Hence, little expression variation, if any, can be explained
by the lateralization axis compared to variations related to cortical
area or gestational age/inter-individual variation.
We then investigated whether the expression of individual genes
varies between cortical areas, hemispheres, and gestational age/
individuals. Using the Significance Analysis of Microarray package
[25], we detected (at multiple testing-corrected significance
q,0.01) 1274 genes differentially expressed when comparing the
PFO and PT areas (PFO vs. PT) and 1763 genes when comparing
samples at 17 and 19 GW individuals (17 vs. 19 GW). In contrast,
no genes were significantly differentially expressed when compar-
ing the right- and left-side samples. These findings are consistent
with our principal components analyses, where we observed high
between-sample variation between cortical areas and time points,
but not between hemispheres. We note, however, that we cannot
rule out subtle expression variations along the lateralization axis
that are missed due to low statistical power, with just four
observations per hemisphere. Nonetheless, the lack of differential
gene expression between left- and right-hemispheres is in
agreement with previous reports suggesting that differential
expression between sides of the brain is mainly a feature of much
earlier developmental stages [14,15,16]. Since variation is much
smaller, if not null, along the lateralization axis, right- and left-side
expression profiles were averaged within cortical area or
gestational age. We thus examined the magnitude of individual
genes’ expression changes using fold-change. We found 157 genes
expressed at least 1.5 times higher at 17 compared to 19 GW in
both the PFO and PT areas. By comparison, 70 genes were at least
1.5-fold downregulated at 17 versus 19 GW in both the PFO and
PT areas. Comparing the PFO to the PT, 233 genes were
upregulated and 194 were downregulated at both 17 and 19 GW
(Figure 2). The concordance observed between the 17 and 19 GW
samples was remarkably high, as the vast majority of genes
regulated in PFO vs. PT in the 17 GW samples were found to be
similarly regulated in the 19GW sample, and vice-versa
(Figure 2B).
Gene Expression and Evolution in Human Cortex
PLoS ONE | www.plosone.org 2 March 2011 | Volume 6 | Issue 3 | e17753
Overall, consistent gene expression variations were thus found
associated with inter-areal differences and with gestational age/
inter-individual variation, and no variation was found along the
lateralization axis (Figure 3 and File S1).
Specific Gene Ontology patterns for genes differentiallyexpressed between cortical areas
Gene Ontology analysis (http://david.abcc.ncifcrf.gov) was
then performed in order to gain biological insights into the
functions of the differentially expressed genes. Not surprisingly,
most genes differentially expressed in PFO vs. PT areas were
found to be associated with brain development, including neuronal
differentiation, signal transduction and/or cell/axon guidance
(Figure 3 and File S1). This gene set is also enriched for
membrane receptors and channels, including adhesion molecules
and axon guidance receptors. No significant enrichment for
particular gene ontology patterns could be detected when
comparing 17 and 19 GW samples (data not shown). This could
be partly explained by the inter-individual variation that must
also contribute to 17 vs. 19 GW differences, thereby making the
gene ontology profile too heterogenous to reveal specific patterns.
We therefore next focused our analysis on the genes differentially
expressed between the PFO and PT areas, pursuing the
hypothesis that these genes are most likely associated with area-
specific programs of differentiation at the ages examined, with
consistent patterns across individuals.
Figure 1. Neuroembryological reconstruction and microdissection procedures. (A–D) Examples of brain cryosection pictures used for the3D reconstruction. (E–H) 3D reconstruction models of 17 (E, F) and 19 (G, H) GW, with and without highlighted dissected regions PFO (red) and PT(green). (I–L) Microdissected regions of PFO (I, K) and PT (J, L) areas at 17 (I, J) and 19 (K, L) GW, highlighted on top of cresyl violet-stained sections.Scale bar: 1 cm.doi:10.1371/journal.pone.0017753.g001
Gene Expression and Evolution in Human Cortex
PLoS ONE | www.plosone.org 3 March 2011 | Volume 6 | Issue 3 | e17753
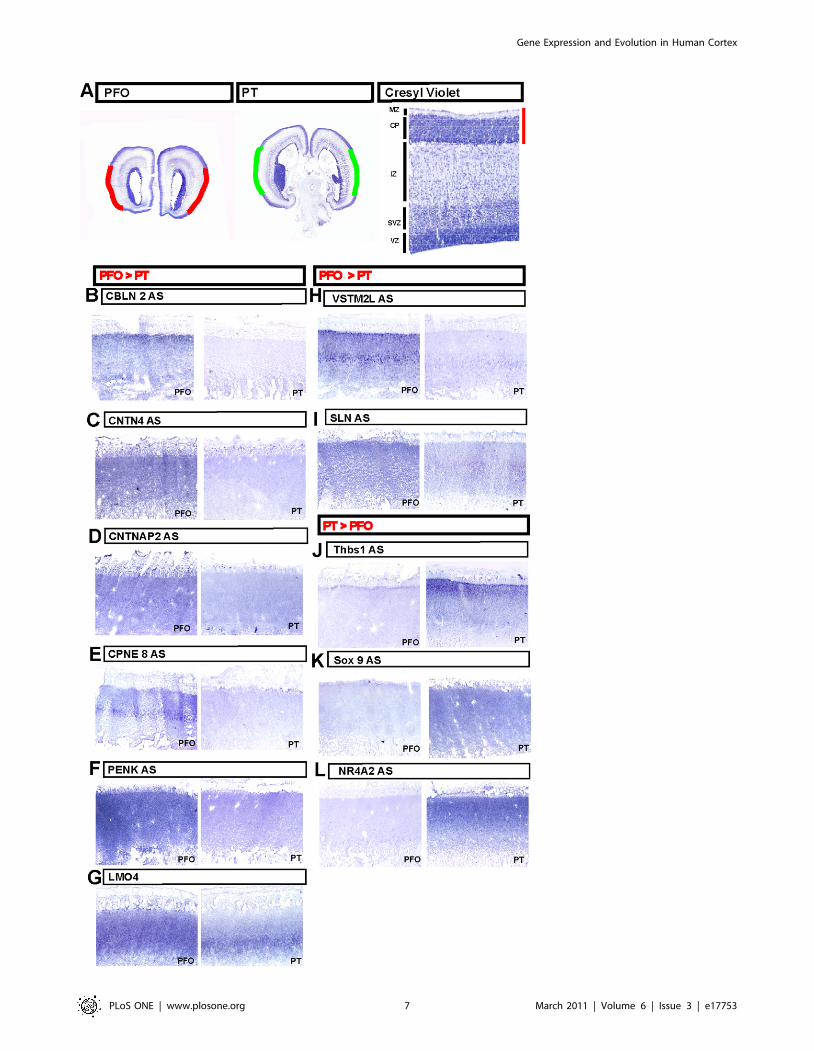
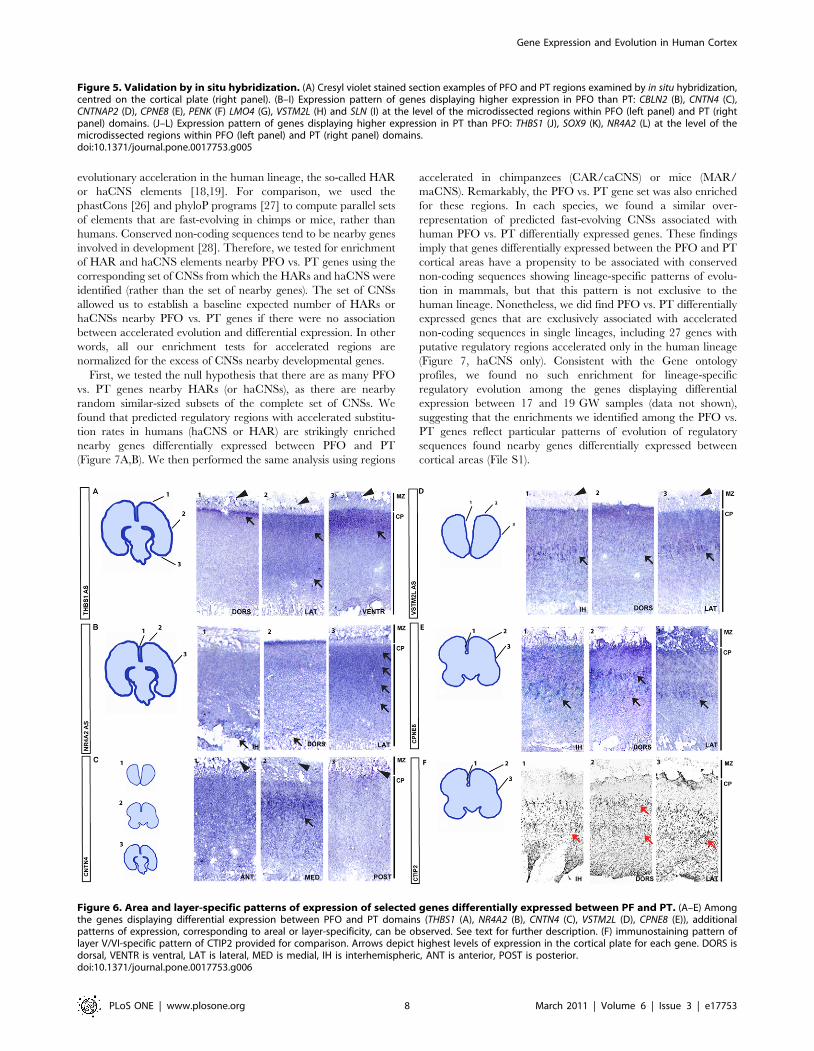
Validation of regional expression dataDifferential expression between PFO and PT areas was first
validated in fetal brain samples by quantitative real-time reverse-
transcriptase polymerase chain reaction (qRT-PCR) for eight genes:
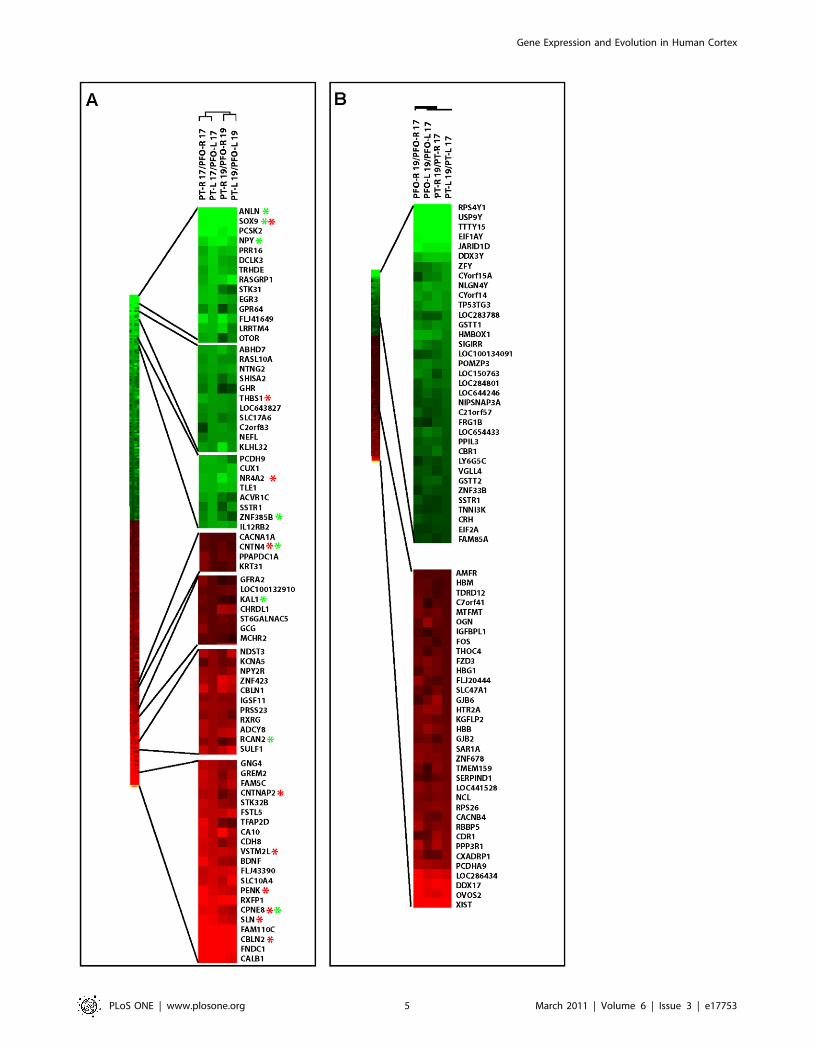
RCAN2, KAL1, CPNE8, CNTN4, ZNF385b, ANLN, NPY and SOX9.
The expression patterns of all eight genes were confirmed (Figure 4),
indicating a robust differential expression among the genes identified
through microdissection and microarray analyses. We then per-
formed a more stringent validation using in situ hybridization. This
analysis was applied to nine genes with patterns of higher expression
in the PFO compared to the PT (CBLN2, CNTN4, CNTNAP2, SLN,
CPNE8, PENK, VSTM2L, GNG4, LMO4) and four genes with lower
expression in PFO compared to PT (THBS1, SOX9, NR4A2, SPON1).
For 11 out of the 13 genes examined, we observed strong differential
expression within the cortical domains corresponding to the pattern
detected by microarray analysis (Figure 5). The other two genes
(GNG4 and SPON1) did not display any detectable pattern (data not
shown). These results confirm the validity of the microarray data and
indicate that our 3D reconstruction-based microdissection method
was highly successful at isolating cells from targeted brain areas.
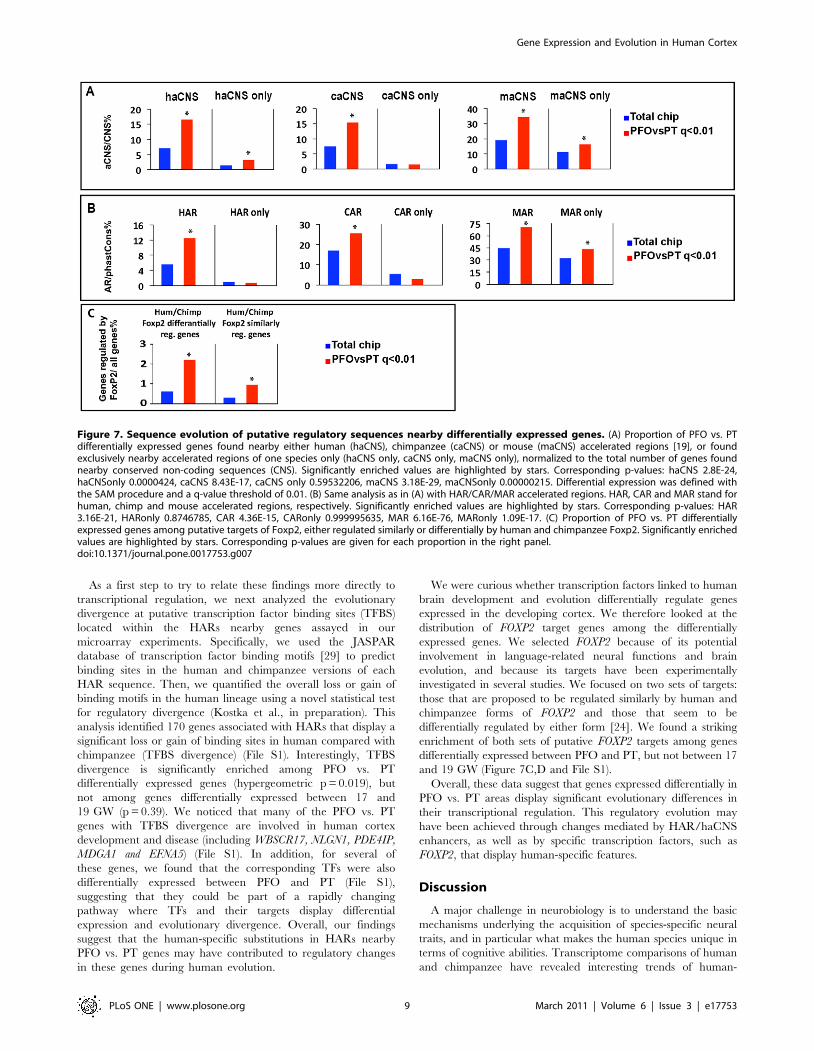
Spatial patterns of gene expression reveal layer and arealspecificity
More detailed in situ hybridization analyses revealed a variety
of complex spatial expression patterns both in terms of areal and
layer specificity of expression (Figure 6). For example, THBS1
Figure 2. Primary microarray analysis. (A) Principal components analysis. Expression profiles are plotted in the space of the 1st and 2nd principalcomponents, which account for 40% and 37% of the total variance, respectively. Red/green depicts samples from PFO (red) and PT (green) areas; fill/empty symbols, 17/19 GW; circles/square symbols, right/left. (B) Summary of gene profiling results depicting the number of genes displaying a foldchange higher than 1.5 for found at 17 or 19 GW (PFO.PT in red; PT.PFO in green); genes displaying a fold change higher than 1.5 for PFO vs. PT atboth 17 GW and 19 GW (intersection of genes displaying differential regulation between PFO and PT at either 17 or 19 GW)) are depicted within thecentral vertical thick arrow. The number of genes displaying a fold change higher than 1.5 for 17 vs. 19 GW found in PFO or PT (17GW.19GW in blue;17GW,19GW in gray); genes displaying a fold change above 1.5 for 17 vs. 19 in both PFO and PT are shown in the bottom blue and gray thick arrow.doi:10.1371/journal.pone.0017753.g002
Gene Expression and Evolution in Human Cortex
PLoS ONE | www.plosone.org 4 March 2011 | Volume 6 | Issue 3 | e17753
Gene Expression and Evolution in Human Cortex
PLoS ONE | www.plosone.org 5 March 2011 | Volume 6 | Issue 3 | e17753

transcripts were detected in some cells of the marginal zone (MZ)
and in the most superficial part of the cortical plate (CP) in the
medio-dorsal part of the parietal cortex (Figure 6A). Specifically,
THBS1 was expressed throughout the CP at more lateral levels
and in a thick, heavily stained, superficial part of the CP at the
most ventral levels. Similarly, NR4A2 was found to be expressed
in the superficial two thirds of the CP in the lateral cortex, while
in more dorsal parts the strongest staining for NR4A2 was
localized to the deepest part of the CP (Figure 6B). For CNTN4
(Figure 6C), the layer specificity of expression varied with
anterior-posterior levels: it was found in some cells of the MZ,
and diffusely in the CP in the PFO regions, while in PT domains,
CNTN4 was strongest in the superficial part of the CP. Finally, for
other genes, such as VSTM2L and CPNE8 (Figure 6D,E), the
intensity of the staining depended of the area examined, but the
signal was always localized to the same layer, corresponding to
presumptive layer V (delineated by CTIP2 expression (Figure 6F)),
with the strongest expression localized to the inter-hemispheric
part of the CP.
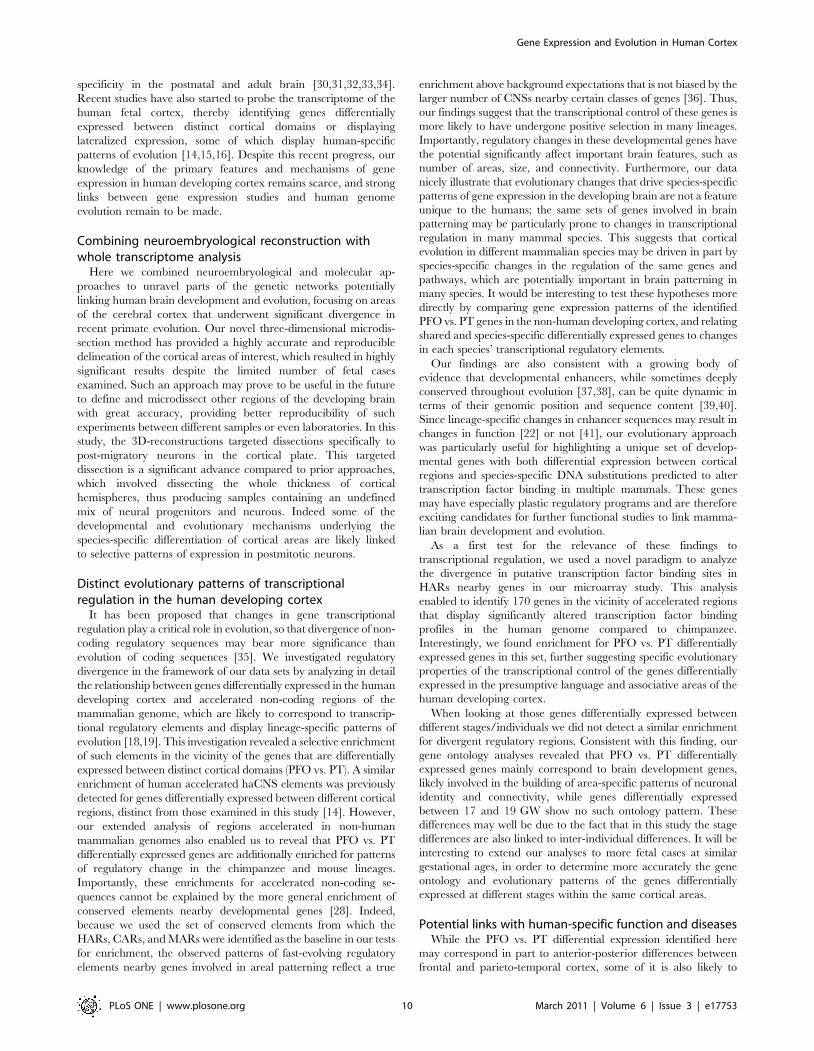
Evolutionary patterns of putative regulatory sequencesof the differentially expressed genes
Together, our microarray, qRTPCR, and in situ hybridization
data analyses pinpointed a set of genes differentially expressed
between PFO and PT cortical domains at mid-gestation. Given
the prominence of these cortical areas in human-specific brain
anatomy and function, we next examined the evolutionary
patterns of predicted regulatory sequences neighboring these
genes. Our analysis extends the approach of Johnson et al. (2009),
who tested for enrichment of fast-evolving conserved non-coding
sequence (CNSs) nearby genes differentially expressed between
fetal brain regions or cortical areas. Specifically, we estimated the
enrichment of PFO vs. PT genes in several collections of CNSs
that were recently identified on the basis of unique patterns of
Figure 4. qRTPCR validation. (A, B) qRTPCR relative expression levels of genes upregulated in PT (A) and PFO (B) using the DDCT relativequantification method, normalized to the PFO-17GW-right sample. and to the housekeeping gene GAPDH. (C, D) Comparison of the PFO VS PTexpression ratios in microarray and qPCR results. Mean of the PFO 17GW/PT17GW and PFO19GW/PT19GW ratios for the qPCR and microarrays resultsfor genes upregulated in PT (C) and PFO (D).doi:10.1371/journal.pone.0017753.g004
Figure 3. Hierarchical clustering of gene expression. (A, B) Clustering of genes differentially expressed (Fold change .1.5) between PFO VS PT(A) or 17/19GW (B), ordered by differential expression ratios. Red star: genes validated by ISH; green star: genes validated by qRTPCR.doi:10.1371/journal.pone.0017753.g003
Gene Expression and Evolution in Human Cortex
PLoS ONE | www.plosone.org 6 March 2011 | Volume 6 | Issue 3 | e17753
Gene Expression and Evolution in Human Cortex
PLoS ONE | www.plosone.org 7 March 2011 | Volume 6 | Issue 3 | e17753
evolutionary acceleration in the human lineage, the so-called HAR
or haCNS elements [18,19]. For comparison, we used the
phastCons [26] and phyloP programs [27] to compute parallel sets
of elements that are fast-evolving in chimps or mice, rather than
humans. Conserved non-coding sequences tend to be nearby genes
involved in development [28]. Therefore, we tested for enrichment
of HAR and haCNS elements nearby PFO vs. PT genes using the
corresponding set of CNSs from which the HARs and haCNS were
identified (rather than the set of nearby genes). The set of CNSs
allowed us to establish a baseline expected number of HARs or
haCNSs nearby PFO vs. PT genes if there were no association
between accelerated evolution and differential expression. In other
words, all our enrichment tests for accelerated regions are
normalized for the excess of CNSs nearby developmental genes.
First, we tested the null hypothesis that there are as many PFO
vs. PT genes nearby HARs (or haCNSs), as there are nearby
random similar-sized subsets of the complete set of CNSs. We
found that predicted regulatory regions with accelerated substitu-
tion rates in humans (haCNS or HAR) are strikingly enriched
nearby genes differentially expressed between PFO and PT
(Figure 7A,B). We then performed the same analysis using regions
accelerated in chimpanzees (CAR/caCNS) or mice (MAR/
maCNS). Remarkably, the PFO vs. PT gene set was also enriched
for these regions. In each species, we found a similar over-
representation of predicted fast-evolving CNSs associated with
human PFO vs. PT differentially expressed genes. These findings
imply that genes differentially expressed between the PFO and PT
cortical areas have a propensity to be associated with conserved
non-coding sequences showing lineage-specific patterns of evolu-
tion in mammals, but that this pattern is not exclusive to the
human lineage. Nonetheless, we did find PFO vs. PT differentially
expressed genes that are exclusively associated with accelerated
non-coding sequences in single lineages, including 27 genes with
putative regulatory regions accelerated only in the human lineage
(Figure 7, haCNS only). Consistent with the Gene ontology
profiles, we found no such enrichment for lineage-specific
regulatory evolution among the genes displaying differential
expression between 17 and 19 GW samples (data not shown),
suggesting that the enrichments we identified among the PFO vs.
PT genes reflect particular patterns of evolution of regulatory
sequences found nearby genes differentially expressed between
cortical areas (File S1).
Figure 6. Area and layer-specific patterns of expression of selected genes differentially expressed between PF and PT. (A–E) Amongthe genes displaying differential expression between PFO and PT domains (THBS1 (A), NR4A2 (B), CNTN4 (C), VSTM2L (D), CPNE8 (E)), additionalpatterns of expression, corresponding to areal or layer-specificity, can be observed. See text for further description. (F) immunostaining pattern oflayer V/VI-specific pattern of CTIP2 provided for comparison. Arrows depict highest levels of expression in the cortical plate for each gene. DORS isdorsal, VENTR is ventral, LAT is lateral, MED is medial, IH is interhemispheric, ANT is anterior, POST is posterior.doi:10.1371/journal.pone.0017753.g006
Figure 5. Validation by in situ hybridization. (A) Cresyl violet stained section examples of PFO and PT regions examined by in situ hybridization,centred on the cortical plate (right panel). (B–I) Expression pattern of genes displaying higher expression in PFO than PT: CBLN2 (B), CNTN4 (C),CNTNAP2 (D), CPNE8 (E), PENK (F) LMO4 (G), VSTM2L (H) and SLN (I) at the level of the microdissected regions within PFO (left panel) and PT (rightpanel) domains. (J–L) Expression pattern of genes displaying higher expression in PT than PFO: THBS1 (J), SOX9 (K), NR4A2 (L) at the level of themicrodissected regions within PFO (left panel) and PT (right panel) domains.doi:10.1371/journal.pone.0017753.g005
Gene Expression and Evolution in Human Cortex
PLoS ONE | www.plosone.org 8 March 2011 | Volume 6 | Issue 3 | e17753
As a first step to try to relate these findings more directly to
transcriptional regulation, we next analyzed the evolutionary
divergence at putative transcription factor binding sites (TFBS)
located within the HARs nearby genes assayed in our
microarray experiments. Specifically, we used the JASPAR
database of transcription factor binding motifs [29] to predict
binding sites in the human and chimpanzee versions of each
HAR sequence. Then, we quantified the overall loss or gain of
binding motifs in the human lineage using a novel statistical test
for regulatory divergence (Kostka et al., in preparation). This
analysis identified 170 genes associated with HARs that display a
significant loss or gain of binding sites in human compared with
chimpanzee (TFBS divergence) (File S1). Interestingly, TFBS
divergence is significantly enriched among PFO vs. PT
differentially expressed genes (hypergeometric p = 0.019), but
not among genes differentially expressed between 17 and
19 GW (p = 0.39). We noticed that many of the PFO vs. PT
genes with TFBS divergence are involved in human cortex
development and disease (including WBSCR17, NLGN1, PDE4IP,
MDGA1 and EFNA5) (File S1). In addition, for several of
these genes, we found that the corresponding TFs were also
differentially expressed between PFO and PT (File S1),
suggesting that they could be part of a rapidly changing
pathway where TFs and their targets display differential
expression and evolutionary divergence. Overall, our findings
suggest that the human-specific substitutions in HARs nearby
PFO vs. PT genes may have contributed to regulatory changes
in these genes during human evolution.
We were curious whether transcription factors linked to human
brain development and evolution differentially regulate genes
expressed in the developing cortex. We therefore looked at the
distribution of FOXP2 target genes among the differentially
expressed genes. We selected FOXP2 because of its potential
involvement in language-related neural functions and brain
evolution, and because its targets have been experimentally
investigated in several studies. We focused on two sets of targets:
those that are proposed to be regulated similarly by human and
chimpanzee forms of FOXP2 and those that seem to be
differentially regulated by either form [24]. We found a striking
enrichment of both sets of putative FOXP2 targets among genes
differentially expressed between PFO and PT, but not between 17
and 19 GW (Figure 7C,D and File S1).
Overall, these data suggest that genes expressed differentially in
PFO vs. PT areas display significant evolutionary differences in
their transcriptional regulation. This regulatory evolution may
have been achieved through changes mediated by HAR/haCNS
enhancers, as well as by specific transcription factors, such as
FOXP2, that display human-specific features.
Discussion
A major challenge in neurobiology is to understand the basic
mechanisms underlying the acquisition of species-specific neural
traits, and in particular what makes the human species unique in
terms of cognitive abilities. Transcriptome comparisons of human
and chimpanzee have revealed interesting trends of human-
Figure 7. Sequence evolution of putative regulatory sequences nearby differentially expressed genes. (A) Proportion of PFO vs. PTdifferentially expressed genes found nearby either human (haCNS), chimpanzee (caCNS) or mouse (maCNS) accelerated regions [19], or foundexclusively nearby accelerated regions of one species only (haCNS only, caCNS only, maCNS only), normalized to the total number of genes foundnearby conserved non-coding sequences (CNS). Significantly enriched values are highlighted by stars. Corresponding p-values: haCNS 2.8E-24,haCNSonly 0.0000424, caCNS 8.43E-17, caCNS only 0.59532206, maCNS 3.18E-29, maCNSonly 0.00000215. Differential expression was defined withthe SAM procedure and a q-value threshold of 0.01. (B) Same analysis as in (A) with HAR/CAR/MAR accelerated regions. HAR, CAR and MAR stand forhuman, chimp and mouse accelerated regions, respectively. Significantly enriched values are highlighted by stars. Corresponding p-values: HAR3.16E-21, HARonly 0.8746785, CAR 4.36E-15, CARonly 0.999995635, MAR 6.16E-76, MARonly 1.09E-17. (C) Proportion of PFO vs. PT differentiallyexpressed genes among putative targets of Foxp2, either regulated similarly or differentially by human and chimpanzee Foxp2. Significantly enrichedvalues are highlighted by stars. Corresponding p-values are given for each proportion in the right panel.doi:10.1371/journal.pone.0017753.g007
Gene Expression and Evolution in Human Cortex
PLoS ONE | www.plosone.org 9 March 2011 | Volume 6 | Issue 3 | e17753
specificity in the postnatal and adult brain [30,31,32,33,34].
Recent studies have also started to probe the transcriptome of the
human fetal cortex, thereby identifying genes differentially
expressed between distinct cortical domains or displaying
lateralized expression, some of which display human-specific
patterns of evolution [14,15,16]. Despite this recent progress, our
knowledge of the primary features and mechanisms of gene
expression in human developing cortex remains scarce, and strong
links between gene expression studies and human genome
evolution remain to be made.
Combining neuroembryological reconstruction withwhole transcriptome analysis
Here we combined neuroembryological and molecular ap-
proaches to unravel parts of the genetic networks potentially
linking human brain development and evolution, focusing on areas
of the cerebral cortex that underwent significant divergence in
recent primate evolution. Our novel three-dimensional microdis-
section method has provided a highly accurate and reproducible
delineation of the cortical areas of interest, which resulted in highly
significant results despite the limited number of fetal cases
examined. Such an approach may prove to be useful in the future
to define and microdissect other regions of the developing brain
with great accuracy, providing better reproducibility of such
experiments between different samples or even laboratories. In this
study, the 3D-reconstructions targeted dissections specifically to
post-migratory neurons in the cortical plate. This targeted
dissection is a significant advance compared to prior approaches,
which involved dissecting the whole thickness of cortical
hemispheres, thus producing samples containing an undefined
mix of neural progenitors and neurons. Indeed some of the
developmental and evolutionary mechanisms underlying the
species-specific differentiation of cortical areas are likely linked
to selective patterns of expression in postmitotic neurons.
Distinct evolutionary patterns of transcriptionalregulation in the human developing cortex
It has been proposed that changes in gene transcriptional
regulation play a critical role in evolution, so that divergence of non-
coding regulatory sequences may bear more significance than
evolution of coding sequences [35]. We investigated regulatory
divergence in the framework of our data sets by analyzing in detail
the relationship between genes differentially expressed in the human
developing cortex and accelerated non-coding regions of the
mammalian genome, which are likely to correspond to transcrip-
tional regulatory elements and display lineage-specific patterns of
evolution [18,19]. This investigation revealed a selective enrichment
of such elements in the vicinity of the genes that are differentially
expressed between distinct cortical domains (PFO vs. PT). A similar
enrichment of human accelerated haCNS elements was previously
detected for genes differentially expressed between different cortical
regions, distinct from those examined in this study [14]. However,
our extended analysis of regions accelerated in non-human
mammalian genomes also enabled us to reveal that PFO vs. PT
differentially expressed genes are additionally enriched for patterns
of regulatory change in the chimpanzee and mouse lineages.
Importantly, these enrichments for accelerated non-coding se-
quences cannot be explained by the more general enrichment of
conserved elements nearby developmental genes [28]. Indeed,
because we used the set of conserved elements from which the
HARs, CARs, and MARs were identified as the baseline in our tests
for enrichment, the observed patterns of fast-evolving regulatory
elements nearby genes involved in areal patterning reflect a true
enrichment above background expectations that is not biased by the
larger number of CNSs nearby certain classes of genes [36]. Thus,
our findings suggest that the transcriptional control of these genes is
more likely to have undergone positive selection in many lineages.
Importantly, regulatory changes in these developmental genes have
the potential significantly affect important brain features, such as
number of areas, size, and connectivity. Furthermore, our data
nicely illustrate that evolutionary changes that drive species-specific
patterns of gene expression in the developing brain are not a feature
unique to the humans; the same sets of genes involved in brain
patterning may be particularly prone to changes in transcriptional
regulation in many mammal species. This suggests that cortical
evolution in different mammalian species may be driven in part by
species-specific changes in the regulation of the same genes and
pathways, which are potentially important in brain patterning in
many species. It would be interesting to test these hypotheses more
directly by comparing gene expression patterns of the identified
PFO vs. PT genes in the non-human developing cortex, and relating
shared and species-specific differentially expressed genes to changes
in each species’ transcriptional regulatory elements.
Our findings are also consistent with a growing body of
evidence that developmental enhancers, while sometimes deeply
conserved throughout evolution [37,38], can be quite dynamic in
terms of their genomic position and sequence content [39,40].
Since lineage-specific changes in enhancer sequences may result in
changes in function [22] or not [41], our evolutionary approach
was particularly useful for highlighting a unique set of develop-
mental genes with both differential expression between cortical
regions and species-specific DNA substitutions predicted to alter
transcription factor binding in multiple mammals. These genes
may have especially plastic regulatory programs and are therefore
exciting candidates for further functional studies to link mamma-
lian brain development and evolution.
As a first test for the relevance of these findings to
transcriptional regulation, we used a novel paradigm to analyze
the divergence in putative transcription factor binding sites in
HARs nearby genes in our microarray study. This analysis
enabled to identify 170 genes in the vicinity of accelerated regions
that display significantly altered transcription factor binding
profiles in the human genome compared to chimpanzee.
Interestingly, we found enrichment for PFO vs. PT differentially
expressed genes in this set, further suggesting specific evolutionary
properties of the transcriptional control of the genes differentially
expressed in the presumptive language and associative areas of the
human developing cortex.
When looking at those genes differentially expressed between
different stages/individuals we did not detect a similar enrichment
for divergent regulatory regions. Consistent with this finding, our
gene ontology analyses revealed that PFO vs. PT differentially
expressed genes mainly correspond to brain development genes,
likely involved in the building of area-specific patterns of neuronal
identity and connectivity, while genes differentially expressed
between 17 and 19 GW show no such ontology pattern. These
differences may well be due to the fact that in this study the stage
differences are also linked to inter-individual differences. It will be
interesting to extend our analyses to more fetal cases at similar
gestational ages, in order to determine more accurately the gene
ontology and evolutionary patterns of the genes differentially
expressed at different stages within the same cortical areas.
Potential links with human-specific function and diseasesWhile the PFO vs. PT differential expression identified here
may correspond in part to anterior-posterior differences between
frontal and parieto-temporal cortex, some of it is also likely to
Gene Expression and Evolution in Human Cortex
PLoS ONE | www.plosone.org 10 March 2011 | Volume 6 | Issue 3 | e17753
reflect the transcriptional programmes that are specifically active
in language areas. Language acquisition is thought to have
occurred at some point during late hominid evolution, but the
underlying mechanisms remain completely unknown. Several
hypotheses have been proposed, including the evolutionary
acceleration of genes involved in the control of fine motor control,
such as the FOXP2 gene, which is also mutated in human-specific
forms of language production impairment [20,42]. While we did
not find significant differences in FOXP2 expression between the
cortical regions examined, we did find a significant enrichment for
FOXP2 putative targets among genes differentially expressed
between the PFO and PT areas. Among these, CNTNAP2 [24]
has also been suggested to be associated with neurodevelopmental
disorders affecting language [42]. These findings might reflect
differential expression of FOXP2 at an earlier developmental stage,
or involvement of a co-regulator.
Aside from language, several genes were uncovered that could
be involved in other important aspects of cortical function and
disease. The NR4A2 transcription factor gene is a particularly
striking example as it displays highly complex differential
expression in PFO and PT areas and layers (Figures 5,6), and
for which higher divergence of binding sites are found in several
target genes showing differential expression in the same regions
(File S1). NR4A2, also known as Nurr1, encodes a member of the
steroid-thyroid hormone-retinoid receptor superfamily that is
expressed in a complex pattern in the cortex, which may be
different in mouse and primates [43,44], and could be involved in
several human brain diseases [45,46]. Similarly, we identified
Thrombospondin-1 (THBS1), which binds to LRP8 (a.k.a.
APOER2) and VLDLR receptors, also receptors for reelin, and
seems to play a role in murine postnatal neuronal migration, as
well as in synaptogenesis [47,48]. As this gene is differentially
expressed between different cortical areas in humans and also
expressed among pioneer Cajal-Retzius neurons, it constitutes an
intriguing candidate gene linking early and late aspects of cortical
development.
Our analyses of acceleration and TFBS divergence also
highlighted several differentially expressed genes potentially
involved in human cortex development and disease, such as
WBSCR17 (candidate gene of the cognitive Williams-Beuren
syndrome)[49], NLGN1 (implicated in synapse formation and
autism)[50], PDE4IP (implicated in control of brain size or human
microcephaly)[51,52], MDGA1 and EFNA5 (guidance factors
involved in cortical patterning) [53,54,55].
In conclusion, our approach combining neuroembryology and
whole genome expression profiling, together with evolutionary
analyses of putative regulatory regions, led to the identification of a
distinct repertoire of cortical genes displaying selective patterns of
expression and evolution. This gene set is a rich source of
candidates to elucidate the genetic networks underlying human
cortex evolution and the acquisition of higher neural functions.
Materials and Methods
Tissue collection and preparationThe study was approved by the three relevant Ethics
Committees (Erasme Hospital, Universite Libre de Bruxelles,
and Belgian National Fund for Scientific Research FRS/FNRS)
on research involving human subjects. Written informed consent
was given by the parents in each case.
Human fetuses were obtained following medical pregnancy
termination. Two fetuses aged 17 and 19 GW were used for the
microarray analyses, while additional cases used for validation
ranged from 9 to 24 GW. All the cases were examined with
standard feto-pathological procedures [56] and none displayed
clinical or neuropathological evidence of brain malformation. As
soon as possible after expulsion (less than 6 hours), the brain was
removed using the standard fetal autopsy procedure (Valdes-
Dapena, 1983), embedded as a whole in OCT compound
(Sakura), and snap-frozen in a 2-methylbutane on dry ice bath.
Post-mortem delay before freezing was 2 h for the 19 GW fetus
and 6 h for the 17GW fetus.
3D reconstruction and dissection of specific cortical areasAll specimens were cut in the coronal plane on a customized
Leica CM3000 microtome. A digital picture was taken every ten
slides (each 25 mm thick). 3D reconstruction of each brain was
performed using customized procedures ([57] and File S1). Briefly,
pictures were aligned manually using Adobe Photoshop to
generate the image stack needed to perform the 3D reconstruction
of the brain. 3D-doctor (Able Software Corp.H) was used for the
rendering of the 3D model, which was then used to select defined
cortical areas PFO and PT, containing presumptive Broca and
Wernicke areas. These were first selected on the 17 GW left
hemisphere, then transferred to the right hemisphere and to
corresponding regions in the 19 GW brain. To this aim we used
the 3D doctor registration function to transform the shape of the
17GW model into the shape and size of the 19GW model, creating
a 17GWp19 model, which then could be faithfully matched to the
actual 19GW model. Once all areas boundaries were drawn on
the 19GW model, the 17GWp19 model was inserted inside the
19GW model to check the area match. The 3D model of each case
was then used to determine the sections and subregions to be
dissected, in relation with adjacent cresyl violet-stained sections,
which enabled to generate precise templates of dissection of the
sections of interest, focusing on focusing on the cortical plate of the
PFO and PT domains (cf Figure 1). The sections were then
dissected manually following these templates, before RNA
extraction.
Transcriptome analysesRNA was extracted from each sample (PFO-17GW-left, PT-
17GW-left, PFO-19GW-left, PT-19GW-left, PFO-17GW-right,
PT-17GW-right, PFO-19GW-right, PT-19GW-right) using
RNeasy kit (Qiagen), and the corresponding cDNAs were
prepared and hybridized according to manufacturer’s instructions
(Affymetrix HGU133+v2.0). All statistical analyses were per-
formed with the R language for statistical computing version 2.9.0
(R Core Development [58] and Bioconductor 2.4 [59] with all
functions run using default parameters unless specified otherwise.
Data are available from the GEO database (http://www.ncbi.nlm.
nih.gov/geo) under accession number GSE21858.
Pre-processing. Affymetrix HGU133+v2.0 chips were
normalized with the Robust Multi-array Analysis (RMA) program
[60] and annotated with the HGU133+v2 Bioconductor annotation
packages. Probe sets mapping to a same gene symbol were
averaged.
Detection of regulated genes. Regulated genes were
searched with the Significance Analysis of Microarray version
1.26, a nonparametric procedure that handles multiple testing
[25]. The same unpaired two-class set up, 4 vs. 4 arrays, was used
in the comparison of 17 vs. 19 weeks, left vs. right, and PFO vs. PT
areas. As an alternative analysis, we defined differentially
expressed genes as those with a 1.5-fold change in expression,
i.e., expression values were averaged across the lateral axis in each
class, and then the ratio of the averages of the two classes was
calculated.
Gene Expression and Evolution in Human Cortex
PLoS ONE | www.plosone.org 11 March 2011 | Volume 6 | Issue 3 | e17753
Dimension reduction. Principal components analysis was
computed with R’s prcomp function using all the genes present on
the microarrays. Hierarchical clustering was calculated with
Cluster [61].
Evolutionary computational analysesEach conserved non-coding sequence (CNS) plus the subsets of
human- chimp- and mouse-specific accelerated regions were
obtained from [19]. For comparison, we computed a larger set of
conserved elements using multiple sequence alignments of all
currently available mammalian genomes from the UCSC genome
browser database using the phastCons program (Siepel et al., 2005).
Then, we identified subsets of human-, chimp-, and mouse-
accelerated elements using the program phyloP [27]. All conserved
elements from both sources were mapped to the nearest gene with
Galaxy [62] using appropriate UCSC human genome build, hg17
for CNS [19] and hg18 for phastCons elements. Nearest genes
were then mapped to the Affymetrix microarray data on the basis
of gene symbols. Enrichment analyses were performed using the
hypergeometric test, with the entire CNS or phastCons list as a
reference set.
Transcription factor binding sites were predicted in the human
and chimp versions of each HAR sequence using position-specific
weight matrices from the JASPAR database (release 12 Oct 2009)
[29]. We assessed the statistical significance of binding site losses
and gains by combining evidence across transcription factors,
using a model for two correlated binomial distributions (Kostka et
al., in prep.). Enrichment analyses were performed as above.
In situ hybridizationIn situ hybridization using digoxigenin-labeled RNA probes was
performed as described previously using PCR amplified or plasmid
templates [63,64]. The PFO and PT alternate sections were
always processed together in order to allow comparison of the
obtained staining. Sense probe was used as a negative control for
each probe and revealed no specific staining (data not shown).
Quantitative RT-PCRqPCR primers were designed using primer3 (http://frodo.wi.mit.
edu/primer3/). cDNA was synthesized from 250 ng total RNA
from the 8 cortex samples using random hexamers (Qiagen) and
SuperScriptTM II Reverse Transcriptase (Invitrogen). qPCR
reactions (10 ng cDNA) were performed using Brilliant II FAST
SYBR Green QPCR Master Mix and ROX (Stratagene).
Amplification of the gene of interest and the housekeeping control
genes -GAPDH and TTC1 was done in duplicate from each
sample and a no template control. Quantification was done using
the DDCT relative quantification method. The sample PFO-
17GW-right was used for calibration.
Supporting Information
File S1
(PDF)
Acknowledgments
We thank G. Vassart for continuous support and interest, members of
IRIBHM for helpful discussions and advice. Help and support from the
Departments of Obstetrics/Gynaecology and Pathology of Erasme
Hospital are deeply acknowledged.
Author Contributions
Conceived and designed the experiments: NL M-AL PV VD. Performed
the experiments: NL AB CS M-AL. Analyzed the data: NL M-AL PV VD
AKH KSP. Contributed reagents/materials/analysis tools: VA YE FL J-
CN. Wrote the paper: NL M-AL VD KSP AKH PV.
References
1. Rakic P (2009) Evolution of the neocortex: a perspective from developmental
biology. Nat Rev Neurosci 10: 724–735.
2. Molnar Z, Metin C, Stoykova A, Tarabykin V, Price DJ, et al. (2006) Comparative
aspects of cerebral cortical development. Eur J Neurosci 23: 921–934.
3. Amadio JP, Walsh CA (2006) Brain evolution and uniqueness in the human
genome. Cell 126: 1033–1035.
4. Fish JL, Dehay C, Kennedy H, Huttner WB (2008) Making bigger brains-the
evolution of neural-progenitor-cell division. J Cell Sci 121: 2783–2793.
5. Carroll SB (2003) Genetics and the making of Homo sapiens. Nature 422:
849–857.
6. Roth G, Dicke U (2005) Evolution of the brain and intelligence. Trends Cogn
Sci 9: 250–257.
7. Fisher SE, Marcus GF (2006) The eloquent ape: genes, brains and the evolution
of language. Nat Rev Genet 7: 9–20.
8. Gil-da-Costa R, Martin A, Lopes MA, Munoz M, Fritz JB, et al. (2006) Species-
specific calls activate homologs of Broca’s and Wernicke’s areas in the macaque.
Nat Neurosci 9: 1064–1070.
9. Sun T, Walsh CA (2006) Molecular approaches to brain asymmetry and
handedness. Nat Rev Neurosci 7: 655–662.
10. Kriegstein A, Noctor S, Martinez-Cerdeno V (2006) Patterns of neural stem and
progenitor cell division may underlie evolutionary cortical expansion. Nat Rev
Neurosci 7: 883–890.
11. Cheung AF, Kondo S, Abdel-Mannan O, Chodroff RA, Sirey TM, et al. (2009)
The Subventricular Zone Is the Developmental Milestone of a 6-Layered
Neocortex: Comparisons in Metatherian and Eutherian Mammals. Cereb
Cortex.
12. Hansen DV, Lui JH, Parker PR, Kriegstein AR (2010) Neurogenic radial glia in
the outer subventricular zone of human neocortex. Nature.
13. Fietz SA, Kelava I, Vogt J, Wilsch-Brauninger M, Stenzel D, et al. (2010) OSVZ
progenitors of human and ferret neocortex are epithelial-like and expand by
integrin signaling. Nat Neurosci.
14. Johnson MB, Kawasawa YI, Mason CE, Krsnik Z, Coppola G, et al. (2009)
Functional and evolutionary insights into human brain development through
global transcriptome analysis. Neuron 62: 494–509.
15. Abrahams BS, Tentler D, Perederiy JV, Oldham MC, Coppola G, et al. (2007)
Genome-wide analyses of human perisylvian cerebral cortical patterning. Proc
Natl Acad Sci U S A 104: 17849–17854.
16. Sun T, Patoine C, Abu-Khalil A, Visvader J, Sum E, et al. (2005) Early
asymmetry of gene transcription in embryonic human left and right cerebral
cortex. Science 308: 1794–1798.
17. Sun T, Collura RV, Ruvolo M, Walsh CA (2006) Genomic and evolutionary
analyses of asymmetrically expressed genes in human fetal left and right cerebral
cortex. Cereb Cortex 16 Suppl 1: i18–25.
18. Pollard KS, Salama SR, Lambert N, Lambot MA, Coppens S, et al. (2006) An
RNA gene expressed during cortical development evolved rapidly in humans.
Nature 443: 167–172.
19. Prabhakar S, Noonan JP, Paabo S, Rubin EM (2006) Accelerated evolution of
conserved noncoding sequences in humans. Science 314: 786.
20. Enard W, Przeworski M, Fisher SE, Lai CS, Wiebe V, et al. (2002) Molecular
evolution of FOXP2, a gene involved in speech and language. Nature 418:
869–872.
21. Dorus S, Vallender EJ, Evans PD, Anderson JR, Gilbert SL, et al. (2004)
Accelerated evolution of nervous system genes in the origin of Homo sapiens.
Cell 119: 1027–1040.
22. Prabhakar S, Visel A, Akiyama JA, Shoukry M, Lewis KD, et al. (2008) Human-
specific gain of function in a developmental enhancer. Science 321: 1346–1350.
23. Visel A, Prabhakar S, Akiyama JA, Shoukry M, Lewis KD, et al. (2008)
Ultraconservation identifies a small subset of extremely constrained develop-
mental enhancers. Nat Genet 40: 158–160.
24. Konopka G, Bomar JM, Winden K, Coppola G, Jonsson ZO, et al. (2009)
Human-specific transcriptional regulation of CNS development genes by
FOXP2. Nature 462: 213–217.
25. Tusher VG, Tibshirani R, Chu G (2001) Significance analysis of microarrays
applied to the ionizing radiation response. Proc Natl Acad Sci U S A 98:
5116–5121.
26. Siepel A, Bejerano G, Pedersen JS, Hinrichs AS, Hou M, et al. (2005)
Evolutionarily conserved elements in vertebrate, insect, worm, and yeast
genomes. Genome Res 15: 1034–1050.
Gene Expression and Evolution in Human Cortex
PLoS ONE | www.plosone.org 12 March 2011 | Volume 6 | Issue 3 | e17753
27. Pollard KS, Hubisz MJ, Rosenbloom KR, Siepel A (2010) Detection of
nonneutral substitution rates on mammalian phylogenies. Genome Res 20:110–121.
28. Woolfe A, Goodson M, Goode DK, Snell P, McEwen GK, et al. (2005) Highly
conserved non-coding sequences are associated with vertebrate development.PLoS Biol 3: e7.
29. Sandelin A, Alkema W, Engstrom P, Wasserman WW, Lenhard B (2004)JASPAR: an open-access database for eukaryotic transcription factor binding
profiles. Nucleic Acids Res 32: D91–94.
30. Khaitovich P, Enard W, Lachmann M, Paabo S (2006) Evolution of primategene expression. Nat Rev Genet 7: 693–702.
31. Preuss TM, Caceres M, Oldham MC, Geschwind DH (2004) Human brainevolution: insights from microarrays. Nat Rev Genet 5: 850–860.
32. Somel M, Franz H, Yan Z, Lorenc A, Guo S, et al. (2009) Transcriptionalneoteny in the human brain. Proc Natl Acad Sci U S A 106: 5743–5748.
33. Caceres M, Lachuer J, Zapala MA, Redmond JC, Kudo L, et al. (2003) Elevated
gene expression levels distinguish human from non-human primate brains. ProcNatl Acad Sci U S A 100: 13030–13035.
34. Oldham MC, Horvath S, Geschwind DH (2006) Conservation and evolution ofgene coexpression networks in human and chimpanzee brains. Proc Natl Acad
Sci U S A 103: 17973–17978.
35. Levine M, Tjian R (2003) Transcription regulation and animal diversity. Nature424: 147–151.
36. Taher L, Ovcharenko I (2009) Variable locus length in the human genome leadsto ascertainment bias in functional inference for non-coding elements.
Bioinformatics 25: 578–584.37. McEwen GK, Goode DK, Parker HJ, Woolfe A, Callaway H, et al. (2009) Early
evolution of conserved regulatory sequences associated with development in
vertebrates. PLoS Genet 5: e1000762.38. Visel A, Rubin EM, Pennacchio LA (2009) Genomic views of distant-acting
enhancers. Nature 461: 199–205.39. Ritter DI, Li Q, Kostka D, Pollard KS, Guo S, et al. (2010) The importance of
being cis: evolution of orthologous fish and mammalian enhancer activity. Mol
Biol Evol 27: 2322–2332.40. Bradley RK, Li XY, Trapnell C, Davidson S, Pachter L, et al. (2010) Binding
site turnover produces pervasive quantitative changes in transcription factorbinding between closely related Drosophila species. PLoS Biol 8: e1000343.
41. Hare EE, Peterson BK, Iyer VN, Meier R, Eisen MB (2008) Sepsid even-skippedenhancers are functionally conserved in Drosophila despite lack of sequence
conservation. PLoS Genet 4: e1000106.
42. Vernes SC, Newbury DF, Abrahams BS, Winchester L, Nicod J, et al. (2008) Afunctional genetic link between distinct developmental language disorders.
N Engl J Med 359: 2337–2345.43. Watakabe A, Ichinohe N, Ohsawa S, Hashikawa T, Komatsu Y, et al. (2007)
Comparative analysis of layer-specific genes in Mammalian neocortex. Cereb
Cortex 17: 1918–1933.44. Hoerder-Suabedissen A, Wang WZ, Lee S, Davies KE, Goffinet AM, et al.
(2009) Novel markers reveal subpopulations of subplate neurons in the murinecerebral cortex. Cereb Cortex 19: 1738–1750.
45. Rojas P, Joodmardi E, Hong Y, Perlmann T, Ogren SO (2007) Adult mice withreduced Nurr1 expression: an animal model for schizophrenia. Mol Psychiatry
12: 756–766.
46. Xing G, Zhang L, Russell S, Post R (2006) Reduction of dopamine-related
transcription factors Nurr1 and NGFI-B in the prefrontal cortex in
schizophrenia and bipolar disorders. Schizophr Res 84: 36–56.
47. Xu J, Xiao N, Xia J (2010) Thrombospondin 1 accelerates synaptogenesis in
hippocampal neurons through neuroligin 1. Nat Neurosci 13: 22–24.
48. Blake SM, Strasser V, Andrade N, Duit S, Hofbauer R, et al. (2008)
Thrombospondin-1 binds to ApoER2 and VLDL receptor and functions in
postnatal neuronal migration. EMBO J 27: 3069–3080.
49. Schubert C (2009) The genomic basis of the Williams-Beuren syndrome. Cell
Mol Life Sci 66: 1178–1197.
50. Glessner JT, Wang K, Cai G, Korvatska O, Kim CE, et al. (2009) Autism
genome-wide copy number variation reveals ubiquitin and neuronal genes.
Nature 459: 569–573.
51. Bond J, Woods CG (2006) Cytoskeletal genes regulating brain size. Curr Opin
Cell Biol 18: 95–101.
52. Jackson AP, Eastwood H, Bell SM, Adu J, Toomes C, et al. (2002) Identification
of microcephalin, a protein implicated in determining the size of the humanbrain. Am J Hum Genet 71: 136–142.
53. Kahler AK, Djurovic S, Kulle B, Jonsson EG, Agartz I, et al. (2008) Association
analysis of schizophrenia on 18 genes involved in neuronal migration: MDGA1
as a new susceptibility gene. Am J Med Genet B Neuropsychiatr Genet 147B:
1089–1100.
54. Takeuchi A, O’Leary DD (2006) Radial migration of superficial layer cortical
neurons controlled by novel Ig cell adhesion molecule MDGA1. J Neurosci 26:
4460–4464.
55. Dufour A, Seibt J, Passante L, Depaepe V, Ciossek T, et al. (2003) Area
specificity and topography of thalamocortical projections are controlled by
ephrin/Eph genes. Neuron 39: 453–465.
56. Valdes-Dapena M, Huff D (1983) Perinatal autopsy manual.; Pathology. AFIo,
ed.
57. Lambot MA, Mendive F, Laurent P, Van Schoore G, Noel JC, et al. (2009)
Three-dimensional reconstruction of efferent ducts in wild-type and Lgr4 knock-
out mice. Anat Rec (Hoboken) 292: 595–603.
58. Team. DC (2009) Language and Environment for statistical computing. Vienna:
ISBN 3-900051-07-0.
59. Gentleman RC, Carey VJ, Bates DM, Bolstad B, Dettling M, et al. (2004)
Bioconductor: open software development for computational biology and
bioinformatics. Genome Biol 5: R80.
60. Irizarry RA, Bolstad BM, Collin F, Cope LM, Hobbs B, et al. (2003) Summaries
of Affymetrix GeneChip probe level data. Nucleic Acids Res 31: e15.
61. Eisen MB, Spellman PT, Brown PO, Botstein D (1998) Cluster analysis and
display of genome-wide expression patterns. Proc Natl Acad Sci U S A 95:
14863–14868.
62. Taylor J, Schenck I, Blankenberg D, Nekrutenko A (2007) Using galaxy to
perform large-scale interactive data analyses. Curr Protoc Bioinformatics
Chapter 10: Unit 10 15.
63. Lambot MA, Depasse F, Noel JC, Vanderhaeghen P (2005) Mapping labels in
the human developing visual system and the evolution of binocular vision.J Neurosci 25: 7232–7237.
64. Thisse C, Thisse B (2008) High-resolution in situ hybridization to whole-mount
zebrafish embryos. Nat Protoc 3: 59–69.
Gene Expression and Evolution in Human Cortex
PLoS ONE | www.plosone.org 13 March 2011 | Volume 6 | Issue 3 | e17753