generic medicine price discrimination in the emerging markets
TRANSCRIPT

Generic Medicine Price Discrimination in the Emerging Markets
Amy McMahon
E.C. Robins School of Business
University of Richmond
Richmond, VA 23173
973-723-3203
Key Words: Price discrimination, Pharmaceuticals, Emerging markets, Generic medicine
1
Abstract
This paper studies price discrimination in forty emerging markets for forty-nine generic
drugs for the therapeutic areas of cardiovascular diseases and infectious diseases. This paper
studies how the age of a drug and how income distribution in a country affect the price
discrimination of that drug in the country. Price data comes from the World Health Organization
and Health Action International database. This paper shows that: (1) the longer the drug has been
on the market, the less price discrimination that is present; and (2) the greater the income
inequality in a country, the more price discrimination that is present. The paper demonstrates that
the public sector sees lower prices overall and sees less price discrimination than the private
sector. The results are relevant for public health agencies bargaining for low generic drug prices
and for countries denying patent approval to pharmaceutical companies.

2
Generic Medicine Price Discrimination in the Emerging Markets
“The future level of global spending on medicines underscores the similar challenges of access and affordability which face those who consume and pay for healthcare around the world.”
- Michael Kleinrock Director, Research Development IMS Institute for Healthcare Informatics
I. Introduction
Medicine prices and how medicine prices vary from country to country has long been a
controversial topic for the pharmaceutical industry. This difference in prices can be attributed to
the pharmaceutical industry’s practice of price discrimination, pricing based on a consumer’s
price elasticity of demand. Through price discrimination, pharmaceutical companies adapt the
prices of their products to the purchasing power of consumers in different geographical or socio-
economic segments.1 Many pharmaceutical companies also practice tiered pricing within a
country in order to maximize profits2 and to maximize access to patients within that country.3
The alternative to pharmaceutical companies charging varied prices is to charge one price to all
consumers, which would result in some consumers or markets not being served. This is due to
the fact that if pharmaceutical companies charge one price, the price will have to be high enough
to make a decent profit margin, resulting in the price being out of reach for some consumers.
Price discrimination is a practice that serves to maximize utility for the firm and to price
closer to the consumer’s willingness to pay. Economic theory states that price discrimination
occurs when three conditions hold: (a) the seller has monopoly power over production of the
1 Mariano Rojas, "Price Discrimination by Pharmaceutical Companies across Central American Countries," International Journal of Pharmaceutical and Healthcare Marketing, 3, no. 2 (2009): 118-36, 10.1108/17506120910971704 (accessed April 21, 2013). 2 Krishnendu Dastidar, "On Third-Degree Price Discrimination in Oligopoly," The Manchester School, 74, no. 2 (2006): 231-50, 10.1111/j.1467-9957.2006.00490.x (accessed April 22, 2013). 3 Steven Sorrells, interview by Amy McMahon, Pfizer Inc. Headquarters, January 9, 2013.
3
commodity; (b) different buyers are willing to pay different prices for the commodity; and (c)
buyers cannot trade already purchased goods among themselves.4
This paper studies price discrimination of generic drugs within forty developing countries
in two therapeutic areas, infectious diseases and cardiovascular diseases. This paper will examine
two questions: does the age of a drug have a negative effect on the generic price discrimination
within developing countries, and does more unequal income distribution have a positive effect on
generic price discrimination within developing countries?
International pharmaceutical price discrimination has been a debated topic for many
years. Much of the focus has been on the difference between prices in the United States and
prices in the rest of the world. Many authors have evaluated the claim that the United States
carries the burden of the development cost of essential medicines for the rest of the world ( see
Wagner et al. 2004 and Danzon et al. 2004). The focus has recently shifted to reflect the strong
entrance of generic drugs in the market, with numerous studies examining the difference between
brand name drugs and their generic counterparts (see Kong 2004, Frank et al. 1997, and Brekke
et al. 2011). This paper, on the other hand, focuses on price discrimination within the generic
drug market in developing countries.
The global market for medicines is projected to grow to $1.2 trillion by 2016. 5 According
to IMS Data, since 2006, spending on medicine in the “pharmerging” markets6 have increased by
4 Daniel Gifford, and Robert Kidrle, "The Law and Economics of Price Discrimination in Modern Economies: Time for Reconciliation?," Minnesota Legal Studies Research Paper, 8, no. 21 (2008): 1237-93, http://lawreview.law.ucdavis.edu/issues/43/4/articles/43-4_Gifford-Kudrle.pdf (accessed April 21, 2013). 5“The Global Use of Medicines: Outlook Through 2016.” IMS Institute for Healthcare Informatics 2012, p. 8, http://www.imshealth.com/ims/Global/Content/Insights/IMS%20Institute%20for%20Healthcare%20Informatics/Global%20Use%20of%20Meds%202011/Medicines_Outlook_Through_2016_Report.pdf (accessed April 21, 2013).

4
about 43 percent by 2011 and is projected to increase by another 50 percent by 2016, making the
pharmerging markets 30 percent of total global spending on medicine. In comparison, developed
markets’ spending on medicine has decreased since 2006 and is projected to continue to decrease
into 2016. Developed markets will account for only 57 percent of total global spending on
medicine in 2016, as opposed to 73 percent in 2006.7 By 2016, it is projected that the generic
market will double with global generic spending increasing from $242 billion in 2011 to $400-
430 billion by 2016. Highlighting the importance of emerging markets in the future, $224-244
billion of this increase in global generic spending is expected to come from low-cost generics in
“pharmerging” markets.8 Brand name drugs produced by large pharmaceutical companies will
face increased competition from both generic equivalents and local manufacturers’ versions of
drugs, both provided at a cheaper price than the brand name medicines.9 The focus of this paper
on generic drug prices is motivated by this trend of rising generic market share, particularly in
emerging markets.
There are many therapeutic areas that are treated with essential medicines, both generic
and brand name, around the world. The two therapeutic areas chosen for this paper are anti-
infective medicines and cardiovascular medicines. According to the World Health Organization,
cardiovascular diseases (CVDs) are the number one cause of death in the world. For example, in
2008, approximately 17.3 million people died from CVDs, representing 30 percent of all global
6 Pharmerging countries is a term defined by IMS Health (The Global Use of Medicines: Outlook Through 2016.) as countries with greater than $1 billion absolute spending growth over 2012-2016 and countries which have GDP per capita of less than $25,000 at purchasing power parity (PPP). Pharmerging countries include China, Brazil, India, Russia, Mexico, Turkey, Poland, Venezuela, Argentina, Indonesia, South Africa, Thailand, Romania, Egypt, Ukraine, Pakistan, and Vietnam. 7 “The Global Use of Medicines: Outlook Through 2016.” p. 5. 8 Ibid., p. 8. 9 Ibid., p. 8.

5
deaths in that year. Low-income and middle-income countries have a greater prevalence of
CVDs than high-income countries with 80 percent of CVD deaths taking place in low-income
and middle-income countries. CVDs are projected to remain the single leading cause of death
with almost 25 million people projected to die from CVDs in 2030.
Infectious diseases are also a major concern in the world today, with emerging countries
being the most vulnerable to these diseases. According to the World Health Organization,
infectious diseases account for 90% of the global disease burden,10 making anti-infective
medicines essential to both developed and developing countries. Because of poor sanitation and
widespread poverty, emerging markets are a breeding ground for infectious diseases, allowing
once in control diseases to become a problem again.11 As portrayed by the facts presented, drug
prices for these two therapeutic areas are important disease areas to be studied and remain
relevant for the emerging markets examined in this paper.
This paper will expand on the important topics of international price discrimination in the
context of the global pharmaceutical market, but will focus on emerging markets and generic
medicines. There is little literature on price comparisons of emerging countries to each other, as
the focus in the past has been on developed markets, such as comparisons of the U.S. to countries
such as Japan, Chile, France and Germany (see Danzon & Furukawa (2004)). This paper will
focus on price discrimination of generic medicines in these markets. This is also unusual in the
literature, as most studies have looked at brand name prices in comparison to generic prices. It is
important to look at price discrimination among generic drugs in emerging markets because of
10 Jack Radisch, "More medicines for neglected and emerging infectious diseases," Bulletin of the World Health Organization, 85, no. 8 (2007), http://www.who.int/bulletin/volumes/85/8/07-045690/en/ (accessed April 21, 2013). 11 World Health Organization, "WHO Infectious Diseases Report" Last modified 1999. Accessed April 21, 2013. http://www.who.int/infectious-disease-report/pages/ch1text.html.

6
the predicted growth for generics, particularly within the emerging markets, and the greater
affordability of generics for patients in emerging markets. Not only is there evidence of large
differences in factors such as GDP per capita between developed countries and emerging
countries, but there are also varying degrees of development across emerging countries as well.
Therefore, it is important to look at the price discrimination among generics in emerging market
countries because without a certain degree of price discrimination, some patients in emerging
markets would not be served, despite the necessity of both anti-infective and cardiovascular
medicines.
III. Literature Review
Firms have used price discrimination for decades, and many economists have applied the
theory in different industry contexts. The foundations of price discrimination theory began with
the work of mid-nineteenth century engineer-economist Jules Dupuit. Taking an analysis of tolls
for crossing a bridge, Dupuit (1844) constructed an early version of a demand curve to describe
how a lower toll, or lower marginal utility, translates to increased use of the bridge, or increased
consumption. Dupuit took this analysis further to propose that charging an equal price to all
travelers who cross the bridge would be inefficient as not all travelers gain the same utility from
the bridge, and that the government should charge a toll to travelers based on the utility that they
receive from crossing the bridge.12
Pigou (1922) expanded on the theory of price discrimination and developed
classifications for first, second, and third degree price discrimination.13 After Pigou developed
12 Ralph Byrns, "History of Economic Doctrines: Neoclassical Economics I." (unpublished lecture., University of North Carolina, 2002), http://www.unc.edu/depts/econ/byrns_web/EC434/EC434ClassNotes/Lecture_17_HET.htm. 13 As described by Pigou, first-degree price discrimination involves pricing the commodity at each individual’s demand price with the firm capturing the entire consumer surplus in the

7
the three degrees of price discrimination, Ramsey (1927) studied the regulated utility industry
and what the optimal pricing strategy would be in order to maximize social welfare while still
maintaining a return for the monopolist. His work formed the Ramsey pricing model,14 which
states that the markup over marginal cost on a commodity is inversely proportional to the price
elasticity of demand for that commodity.
There have been many extensions of price discrimination theory since Dupuit and Pigou.
Two important directions of price discrimination extensions have been in regards to nonlinear
pricing as well as price discrimination based on separate markets. Nonlinear pricing can be
applied as discounted prices on increased quantities of a good or as prices with fixed and variable
components of the total price.15 Price discrimination in separate markets, on the other hand,
focuses on the differences in willingness or ability to pay in each market and the positive effects
on social welfare by practicing price discrimination in this situation (see Layson 1994).
However, third degree price discrimination does move the market away from proper
redistribution of wealth, creating deadweight loss, in comparison to optimal perfect price
discrimination.
market. The second degree takes price discrimination to a lesser level with firms selling a commodity at different prices but selling the good at the same price for all individuals who purchase the same quantity of the good. An example of second degree price discrimination is the practice of bulk discounts on goods sold in larger quantities, such as a package of eight rolls of paper towels is less expensive than eight single rolls. Third degree price discrimination differentiates price based on n groups of individuals and each individual’s demand elasticity, pricing the commodity at varying prices for each of the n groups, while maintaining the same price for every unit sold within each group. An example of third degree price discrimination would be the cheaper ticket price paid by students or seniors at the movies. 14 For a volume discount extension of Ramsey’s pricing model see Goldman, Leland, & Sibley (1984). 15 Two extensions of nonlinear pricing include: nonlinear taxation as a strategy for maximizing social welfare (see Mirrlees 1971) and monopolists and differentiated duopolists competing with nonlinear pricing, thus allowing for efficient allocation of consumption among buyers (see Rochet et al. 2002; Armstrong et al. 2001; and Holmes 1989).

8
There have also been many theoretical extensions of price discrimination in industries
with large research and development costs, such as the pharmaceutical industry. Schmalensee
(1981) demonstrated that there is an overall increase in social welfare when a single profit-
maximizing firm practices price discrimination. Tirole (1988) demonstrated that by pricing its
products using a two-part tariff consisting of both a fixed and variable component, firms can
maximize the “pie” shared between the firm and consumers by extracting profit from the fixed
component of the price while allowing marginal prices to remain close to marginal cost.16 Felder
(2004) also analyzed a two-part tariff pricing strategy, noting that when there is a price regulator
in the country, a two-part tariff strategy will allow the firm to pay research and development
costs through a lump-sum payment to the manufacturer and then charge a different variable price
to each consumer. Firms in industries with high fixed costs for research and development, but
low or near-zero variable costs of production often employ price discrimination in order to
recover fixed costs while protecting their products from competitors pushing prices near variable
costs (see Sundararajan 2003).
In addition to the literature available on general price discrimination, there is also a
wealth of literature available on price discrimination in the pharmaceutical industry. For
example, in the market for the drug Lipitor, previously a blockbuster patented drug developed by
Pfizer, price discrimination is practiced between Egypt and the U.S. Naguib (2010) attributes this
difference to the price elasticity of demand in each country, with Egypt being more price
sensitive than the U.S. In this study, the difference in price elasticity is due to factors such as
GDP per capita and public expenditure on education as a percentage of GDP. Scherer (2004)
16 Yadav, Prashant. MIT-Zaragoza International Logistics Program, "Differential Pricing for Pharmaceuticals." P. 10-11. Last modified August 2010. Accessed April 21, 2013. http://apps.who.int/medicinedocs/documents/s18390en/s18390en.pdf.

9
explored the welfare effects of patent protection in all countries versus the welfare effects of a
market situation where poor countries were allowed access to generic versions of patented
medicines unavailable in rich countries. Scherer discovered that, in the latter situation, there
would be a negative welfare effect in the rich countries, but there would be a positive increase in
global welfare because the marginal utility of income is greater in poor countries than in rich
countries. Hausman et al. (1988) found that not only does price discrimination increase social
welfare by pricing closer to marginal cost, but this pricing strategy also increases dynamic
welfare because of the positive effects on research and development. Therefore, through price
discrimination pharmaceutical firms can still largely profit from rich countries, while
maintaining access to poor countries. This translates to incentives for innovation in the research
and development of future medicines, benefiting the welfare of all patients. Most of the works
mentioned focus on a pharmaceutical company with monopoly power for the production of a
drug still on patent. This paper, however, looks at price discrimination in an oligopoly situation
for generic drugs.
Other pharmaceutical pricing theories have also been explored. Flynn et all (2009) found
that developing countries with highly uneven income distributions have large groups within the
market that are underserved because of the ultimate price set by the pharmaceutical firm. Lopert
et al. (2002) conclude that firms should set medicine prices based on the incremental cost per
life-year gained for each country based on its per capita GDP, a variable used to measure
patients’ abilities to pay. The work of Dumoulin (2001) is also notable. Dumoulin created a
simulation model that demonstrates that price discrimination maximizes profit for the firm and
affordability for consumers. The simulation determined that price discrimination increases access
by a factor of roughly four to seven times. The model also demonstrates that for countries with

10
the same average GDP per capita, the country with the most concentrated wealth faces a higher
price under price discrimination. This is because firms will choose to price their medicines to the
rich market rather than the poor market, providing firms with greater profits.
There are also many external pricing considerations that affect pharmaceutical companies
in their pricing decisions. Theoretical and empirical studies touch upon topics such as reference
pricing, generic competition, industry regulation, and compulsory licensing or parallel importing.
Brekke et al. (2011) conclude that reference pricing significantly reduces brand-name prices as
well as generic prices and that reference pricing has a strong negative effect on average molecule
prices.17 Frank et al. (1997) show that brand-name medicine prices increase after generic
medicines enter the market and that generic entry also causes a large decrease in the price of
other generic drugs on the market. Danzon et al. (2000) demonstrate that regulation weakens
generic competition while generic competition is substantial in less regulated markets. Hemphill
(2010) explores the practice of compulsory licensing and parallel importing, a practice that
allows countries to evade patent protection, resulting in the erosion of the pharmaceutical firm’s
profit.
Wagner et al. (2004) conclude in their empirical study that price differences do exist
across countries, but the differences are not as large as expected. The authors also conclude that
price discrimination is necessary for low-income countries in order for the countries to ever be
able to afford the best medicines the world can offer, since most low-income countries are unable
to pay. Danzon et al. (2004) also find that price differences exist across countries, but that price
17 Reference pricing is the act of one country’s government benchmarking the prices firms set in that country with another country’s prices. Reference pricing debilitates the ability of firms to price discriminate to the degree that those firms would like in those referencing countries.

11
discrimination between the United States and other countries are roughly in line with income and
are smaller for drugs than for other medical services.
Not only has price discrimination been examined between different markets but the
theory has also been examined in the context of charging different prices to different consumers
within the same market. Kessel (1958) discusses the example of a doctor charging his patients
based on their ability to pay which is derived from their income, charging a banker $250 for a
surgery and a widow $50 for the same surgery. Hoover (1937) also discusses charging different
prices to consumers within the same market; however Hoover describes the price discrimination
based on geography, called spatial price discrimination. More recently, Dastidar (2006),
Hazledine (2006), and Bakó et al. (2012) have studied price discrimination in oligopoly
situations.
The effect of the number of generics on prices has been studied in the past, but in the
context of competition between brand name and generic prices (see Kong 2004). A study was
conducted using the same database used in this paper on descriptive statistics of cardiovascular
medicines and their availability, affordability, and price in 36 countries.18 Research was also
conducted on specific infectious diseases and their affordability (see Etchegorry 2004). Schut et
al. (1986) study price discrimination in some of the same countries as this paper and found a
strong positive relationship between price and per capita GDP, a positive relationship between
price and per capita income, and a negative relationship between price and price control by the
government. Another significant study, by Rojas (2009), looked at price discrimination across
Central America. Rojas finds that country characteristics such as low per-capita income, high
18 Maaike Van Mourik, Alexandra Cameron, Marg Ewen, and Richard Laing, "Availability, price and affordability of cardiovascular medicines: a comparison across 36 countries using HAI/WHO data," BMC Cardiovascular Disorders, 10, no. 25 (2010), 10.1186/1471-2261-10-25 (accessed April 21, 2013).

12
income inequality, and small populations, such as in Honduras and Nicaragua, translate to small
segments of high purchasing power, indicating higher prices in the market. This paper expands
on Rojas’s study in evaluating similar factors’ effects on price discrimination.
IV. Research Design & Method
The model used in this paper is based on the model presented by Kong (2004). Kong uses
the ratio of the generic price to the brand name price as the dependent variable in the model.
Kong includes many independent variables to explain the dependent variable, including: the
market share of brand name products, the age of brand-name products, the number of brand
name products, the age of generic products, and the number of generic products. Because the
model being used for this paper is measuring the difference in generic prices, not the difference
between original and generic prices, some of the variables in Kong’s model have been eliminated
for the model used in this paper and other relevant variables have been added to the model.
Model Specifications
Unlike Kong (2004), this paper analyzes the variables that impact the price
discrimination of generic drug prices in a developing country. The dependent variable is the ratio
of two prices for the same generic drug in the same country and year. The price data is non-
normally distributed; therefore, price percentiles are available. Bakó et al. (2012) notes that it is
important to analyze more than average prices because the average does not reflect the degree of
price discrimination present in a country. Using percentiles, representing a range of prices
available in the market, more accurately depicts the price discrimination in a country. Using this
available data, there are three different price ratios: (1) the price ratio of the 75th percentile
generic price to the median generic price (p75/Median); (2) the price ratio of the 75th percentile
generic price to the 25th percentile generic price (p75/p25); (3) the price ratio of the median

13
generic price to the 25th percentile generic price (Median/p25). Therefore, three regression
analyses are performed for both public procurement price data and for private patient price data.
Public procurement prices were analyzed to examine the efficiency of public health agencies in
bargaining for low prices overall and to examine the factors that affect the variation in those
prices. Private patient prices were analyzed to examine the variability in out-of-pocket generic
prices within a country. The model’s dependent variable will take the form of the three price
ratios. The three ratios will each be a function of the age of the drug and the income distribution
in the country, ceteris paribus:
1) Pit = B1 + B2(Air) + B3(Dit) + B4(Mitr) + B5(Gr) + B6(Yit) + B6(Eit) + B7(Hit) + ε it (-) (+) (?) (-) (?) (-) (-/+)
Where:
Prit = Price Ratio of drug r,19 in country i, at time t
Ari = Age of the Drug
Dit = Income Distribution
Mrit = Market Share
Gr = # Generics on the Market
Yit = GDP per capita, PPP (constant 2005 international $)
Eit = Economic Freedom
Hit = Health Expenditure, total (% of GDP)
The key variables of interest are age of a drug and the income distribution in a country. It
is expected that the age of the drug will have a negative effect on the price ratio, meaning it is
expected that there will be less price discrimination within a country if a drug has been on the
market for a longer period of time. This expectation is based on the assumption that the longer
19 An individual drug in this paper is defined as a generic compound with many manufacturers.

14
the drug has been on the market, there is more competition and less of an ability to price
discriminate because patients have learned what the price from competing manufacturers is.
Income distribution is expected to have a positive effect on the price ratio. This can be
explained by noting that the larger the income inequality in a country, the greater the need for
price discrimination in order to improve access to drugs for patients. Additionally, price
discrimination among manufacturers of generic drugs becomes more worthwhile as well.
Manufacturers are able to split up the market, with some serving the high end of the market, with
resulting higher prices, and other serving the low end of the market, with resulting lower prices.
With greater differences among consumers in the overall market, there is less intense
competition because manufacturers can share the market, each serving a different group.
The expected sign of the market share coefficient is unclear. Market share may have a
positive effect on the price ratio. This may be because a drug with large market share will have a
greater ability to price discriminate since the firm is likely considered a leader in the market and
will likely be the focus of buyers’ minds when they are considering the purchase of a drug.
However, market share may have a negative effect on the price ratio. This may be due to the
greater information available on a drug when it captures a larger portion of the market. There
also may be negative effects due to resale because the drug is more widely available. The
number of generics available on the market is expected to have a negative effect on the price
ratio. With a greater number of generics on the market, there will be less of an ability to price
discriminate because of competition in the market.
It is unclear whether GDP per capita will have a positive or a negative effect on the price
ratio. GDP per capita may have a negative effect on the price ratio because the larger the GDP of
the country, the more developed the country is, thus there is less need for price discrimination.
15
On the other hand, GDP per capita may have a positive effect on the price ratio. GDP per capita
can be skewed when there is high concentration of wealth among a small percent of the
population compared to the rest of the population, thus large GDP per capita may support greater
price discrimination. However, because GDP per capita is a control variable, it is not vital to
estimate the effect on prices.
Health expenditure is expected to have a negative effect on the public sector price ratios
because the greater the government’s health expenditure, the greater its leverage in negotiations
with suppliers for low prices overall. Health expenditure is expected to have a positive effect on
the private sector price ratios because patients purchasing drugs in the private sector do not
typically shop around for drugs.20 Economic freedom is expected to have a negative effect on the
price ratios. When the economic freedom index score is high, the economy is closer to a free
market with price equilibrium and the resulting competition should reduce the potential for price
discrimination.
V. Data & Descriptive Statistics
The generic price data used in this paper come from a database created by Health Action
International (HAI) and the World Health Organization (WHO). Together, the groups created a
standardized method of surveying the prices, availability, affordability, and price components of
medicine in individual countries. The survey was conducted for 21 therapeutic areas, using the
WHO Essential Medicines List Classification.
In this paper, two therapeutic areas were chosen for study, cardiovascular and infectious
diseases, based on prevalence of the data and significance of the two therapeutic areas in
emerging countries. Data are gathered for all available countries within the database for the
20 While income constraints in developing countries might encourage comparison-shopping, scarcity of outlets to purchase medicine is likely to hinder it.

16
chosen therapeutic areas. Generic prices are reported in USD. The median generic price, the 25th
percentile generic price, and the 75th percentile generic price were gathered at the country level
and the year level.21 Prices were gathered for both public sector procurement prices and private
sector patient prices in all available countries.22 The result is an unbalanced panel with
observations at the country and year level for each drug. Since most countries were surveyed in
only one year, most countries have observations for one year. The data span from 2001 to 2010.
Market share data reported in the HAI/WHO database are also included in the model. In
this paper, percentage of availability is used to measure market share for private data and number
of orders is used to measure market share for public data.23 Availability should be highly
correlated with market share because if a drug is more available in the market, it can be inferred
that that drug has a larger market share as well. Number of orders is also a suitable
approximation because drugs with larger market shares should have more of a presence with
government purchasers, increasing the number of orders. The Pearson correlation coefficient for
availability and orders is .100, significant at the ten percent level, meaning that the two variables
have very little correlation and there is not a strong enough association between the two
21 There are some problems that may arise from the data due to the fact that the data has been gathered from emerging countries where data is not always reliable. However, due to the reputability of WHO and HAI, the data should be acceptable for analysis. 22 Public procurement prices were collected instead of public patient prices because this paper seeks to research the medicine prices that pharmaceutical companies are setting. Public patient prices were of slightly higher magnitude but had similar variance in the 25th percentile price, median price, and 75th percentile price for the drugs in each country. 23 Availability of individual medicines is reported in the HAI/WHO Database as the percentage of medicine outlets in which the medicine was found on the day of data collection. This is used as an approximation for private data market share as market share was unavailable to the researcher due to financial constraints. The number of orders of individual medicines by the government is reported in the HAI/WHO Database as the total number of procurement prices (orders) entered for each medicine. This is used as an approximation for public data market share. Market share results should be interpreted with some caution as factors such as the timing of the survey and which medicines were surveyed may affect results.

17
measures to allow one measure to represent market share for both public and private medicine
data.
The following data are gathered from the World Bank: GDP per capita, reported as GDP
per capita at Purchasing Power Parity in constant 2005 international dollars; total healthcare
expenditure as a percentage of GDP; and GINI Index,24 a measurement of income distribution.
GDP per capita will be used to measure willingness or ability to pay in each country. The level
of free enterprise and opportunity within each country is measured by the economic freedom
index compiled by the Heritage Foundation.25
Similar to Kong (2004), this paper measures the number of generics and the age of the
generic drug (measured by the year of approval by the U.S. Food and Drug Administration for
the drug). The number of manufacturers and suppliers producing the drug in the market is used
to estimate the number of generics available. This is a suitable approximation as each of the
manufacturers and suppliers can be assumed to make their own generic version of the drug. It is
also assumed that manufacturers and suppliers of the drug make all dosage types of the drug.
These data come from TheMedica.com, an encyclopedia on the medical industry for the
24 Each country surveyed has a GINI coefficient that indicates the degree of income inequality in the country. The GINI coefficient is calculated as the ratio of the area that is between the uniform income distribution line (the 45-degree line) and the Lorenz curve to the area under the uniform income distribution line. The GINI coefficient ranges from 0, indicating there is uniform income distribution, to 100, indicating there is maximum income inequality and one person holds all of the country’s wealth. Please see the World Bank for more detailed calculation information. The GINI coefficient is represented on a percentile scale. GINI coefficients are not given for every year. Therefore, some of the GINI coefficients recorded are given for a year other than the year the drug price datum was collected in that country. The average difference in the year of the GINI coefficient and the year of the drug data was 1.466 years and the maximum difference was seven years. 25 The economic freedom index ranges from zero to 100, with 100 representing the maximum amount of freedom in the country’s markets. Ten factors are averaged equally into a total score: business freedom, trade freedom, monetary freedom, government size/spending, fiscal freedom, property rights, investment freedom, financial freedom, labor freedom, and freedom from corruption.
18
business-to-business market with key information on manufacturers and suppliers. The age of
each drug is collected from the FDA’s Orange Book, which houses patent approval history
information.
Dummy variables were created for the drugs, countries, and years surveyed. The
reference drug is Lovastatin, a cardiovascular drug for lowering cholesterol. The reference
country is India. The reference year is 2010.
From the available data, there were 52 identifiable emerging market countries with some
data, but after removing countries with missing data, 40 countries remained. 34 countries and 48
drugs were analyzed from the public data,26 providing 1,077 price observations (see Table 1). 40
countries and 49 drugs were analyzed from the private data, providing 1,344 price data for
analysis (see Table 1). The mean prices for public data were as follows: (a) 75th percentile:
$0.21; (b) median: $0.19; (c) 25th percentile: $0.17. The mean prices for private data were as
follows: (a) 75th percentile: $0.70; median: $0.58; 25th percentile: $0.49. Additionally, the mean
price ratios for public data were as follows: (a) p75/Median: 1.124; (b) p75/p25: 1.295; (c)
Median/p25: 1.101 (see Table 2). The mean price ratios for private data were as follows: (a)
p75/Median: 1.309; (b) p75/p25: 1.618; (c) Median/p25: 1.214 (see Table 3). As expected, the
mean price ratios were larger for the private sector than the public sector due to larger price
discrimination and varied willingness to pay in the private sector as well as greater bargaining
strength on the part of governments and public health organizations. The mean age of the drugs
surveyed was 16.735 for the public sector (see Table 2) and 16.638 for the private sector (see
26 As noted above, the panel is unbalanced. Data for each of the 48 drugs are not available for all countries.

19
Table 3).27 The ages ranged from zero to 55 for both sectors. The mean income distribution
GINI coefficient was 40.244 for the public sector (see Table 2) and 40.857 for the private sector
(see Table 3). The GINI coefficients ranged from 29.560 to 67.400 for both sectors.
VI. Empirical Results
For each price ratio model, 5 separate versions of the model, labeled as Model A through
Model E, were run with varying fixed effects.28 Model C, with drug fixed effects and a time
trend variable, was chosen as the model that best fit the data. When the regressions were run for
Models A through D, the independent variable, number of generics, was excluded for Models 1
through 4 and for Model 6. This is likely due to the drug fixed effects that are included in those
models.29 Since Model D and Model E contained country effects, the results were skewed for the
economic freedom and income distribution variables. This was due to country effects being
measured in both the economic freedom and income distribution variables as well as in the fixed
effects. Thus, Model D & E were deemed less appropriate to use for the model of the paper.
Model A did not account for time fixed effects and therefore was not chosen. Model C was a
better model than Model B because the trend variable controls for whether there is less price
27 The average patent approved by the FDA lasts twenty years. Therefore, some of the drugs in the data set are still under patent in the U.S., but their patents are not being honored by the developing countries in the data set. 28 Dummy variables were created for the drugs, countries, and years surveyed to be used to control for fixed effects. Model A controlled for drug fixed effects only. Model B controlled for drug and year fixed effects. Model C controlled for drug and year fixed effects, using a trend variable for year fixed effects. Model D controlled for drug and country fixed effects. Finally, Model E controlled for country and year fixed effects. 29 The Pearson Correlation statistic for the number of generics available for the drug and the age of the drug was .261, significant at the one percent level. It was suspected that the correlation between the number of generics variable and the age variable was causing the exclusion, however, when the models were run without the age variable, the number of generics was still excluded. Therefore, number of generics is likely correlated with multiple variables in the model.

20
discrimination for generic prices over time as consumers become more aware of prices, rather
than at a single point in time.
Model 1: Public p75/Median
First, the results of analysis for the public procurement price data are presented. Model 1
represents the model run with the ratio of the 75th percentile public price to the median public
price for each drug observation as the dependent variable (see Table 4 for results). Age of a
drug resulted in a negative coefficient, as expected, of -.128 with a standard error of .037,
significant at the one percent level. This translates to, on average, a decrease of $0.02 in the
average 75th percentile public price, holding the average median public price constant, for every
one-year increase in the age of a drug. Thus, the older the drug, the less price discrimination that
is present in the public sector, and the closer the prices of the average 75th percentile price and
the average median price.
Income distribution resulted in a positive coefficient, as expected, of .010 with a standard
error of .004, significant at the five percent level. This translates to, on average, an increase of
$0.02 in the average 75th percentile public price, holding the average median public price
constant, for every one standard deviation increase in the GINI coefficient measuring income
distribution. Therefore, as the GINI coefficient increases and a country experiences greater
income inequality, more price discrimination is experienced in the country in the public sector
between the average 75th percentile price and the average median price of the drugs surveyed.
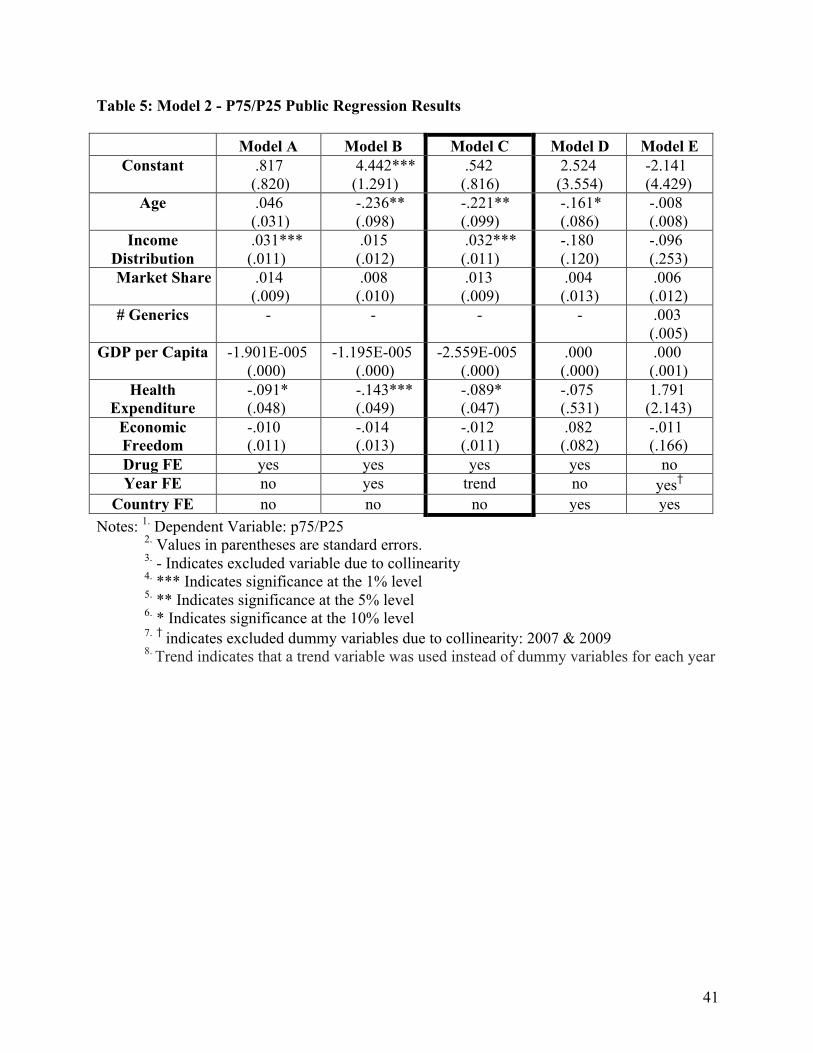
Model 2: Public p75/p25
Model 2 represents the model run with the ratio of the 75th percentile public price to the
25th percentile public price for each drug observation as the dependent variable (see Table 5 for
results). The results are similar to those discussed for Model 1. Age of a drug resulted in a

21
negative coefficient, as expected, of -.221 with a standard error of .099, significant at the five
percent level. This translates to, on average, a decrease of $0.02 in the average 75th percentile
public price, holding the average 25th percentile private price constant, for every one-year
increase in the age of a drug.
Income distribution resulted in a positive coefficient, as expected, of .032 with a standard
error of .011, significant at the one percent level. This can be interpreted as, on average, an
increase of $0.06 in the average 75th percentile public price, holding the average 25th percentile
public price constant, for every one standard deviation increase in the GINI coefficient
measuring income distribution. In both cases, the estimated coefficient for each independent
variable is greater in magnitude than the estimate for Model 1. This is consistent with the range
of the percentiles used in the dependent variable. This suggests that both age and income
inequality demonstrate the expected effects on price discrimination in both the top and bottom
portions of the price distribution in the developing countries surveyed.
Model 3: Public Median/p25
Model 3 represents the model run with the dependent variable as the ratio of the median
public price to the 25th percentile public price for each drug observation (see Table 6 for
results). Age of a drug resulted in a negative coefficient of -.012 with a standard error of .034.
The sign of the coefficient was as expected, however, the coefficient is neither statistically
significant, nor economically significant. This may be due to the fact that there is not enough
variability in the average median public price and the average 25th percentile public price.
Income distribution resulted in a positive coefficient, as expected, of .010 with a standard
error of .041, significant at the five percent level. This translates to, on average, an increase of
$0.02 in the average median public price, holding the average 25th percentile public price
22
constant, for every one standard deviation increase in the GINI coefficient measuring income
distribution. The results for income distribution were similar to Models 1 and 2.
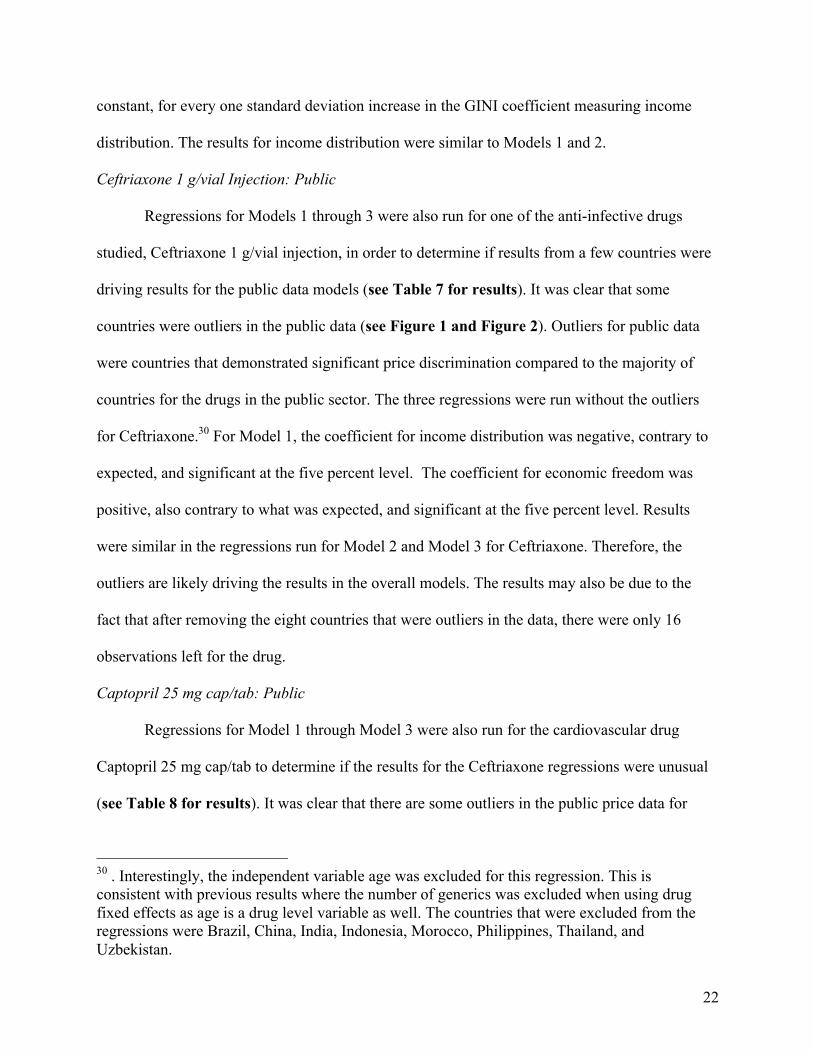
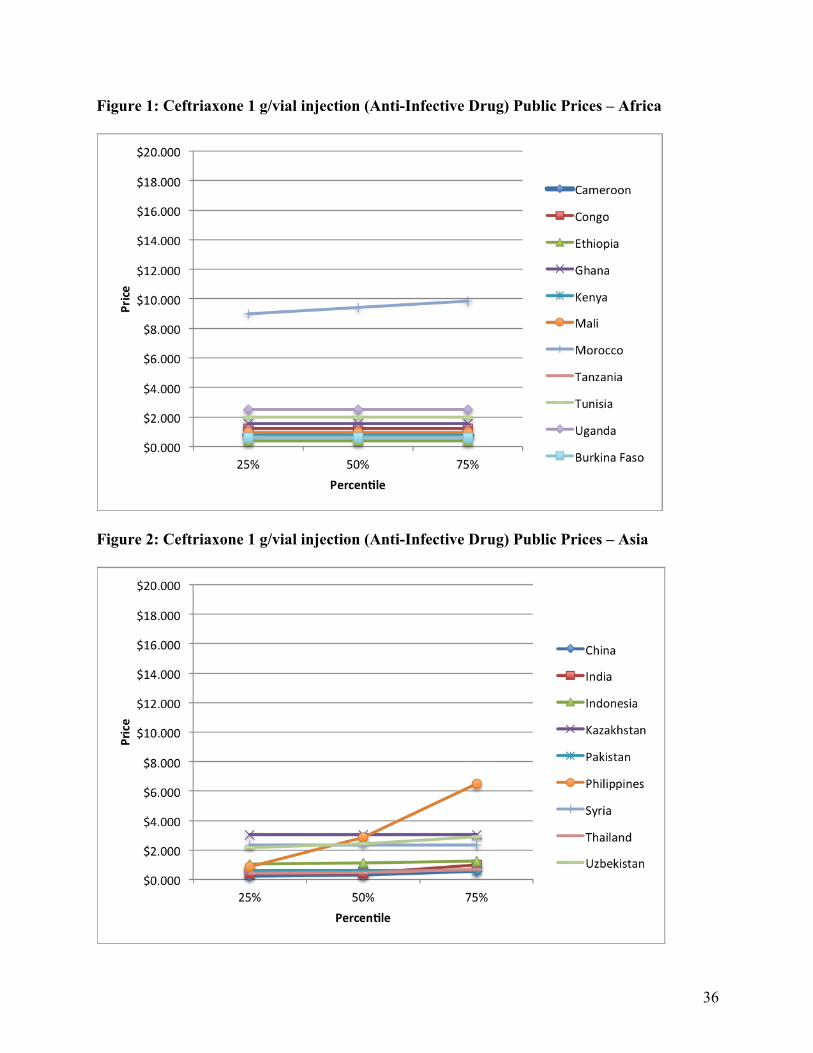
Ceftriaxone 1 g/vial Injection: Public
Regressions for Models 1 through 3 were also run for one of the anti-infective drugs
studied, Ceftriaxone 1 g/vial injection, in order to determine if results from a few countries were
driving results for the public data models (see Table 7 for results). It was clear that some
countries were outliers in the public data (see Figure 1 and Figure 2). Outliers for public data
were countries that demonstrated significant price discrimination compared to the majority of
countries for the drugs in the public sector. The three regressions were run without the outliers
for Ceftriaxone.30 For Model 1, the coefficient for income distribution was negative, contrary to
expected, and significant at the five percent level. The coefficient for economic freedom was
positive, also contrary to what was expected, and significant at the five percent level. Results
were similar in the regressions run for Model 2 and Model 3 for Ceftriaxone. Therefore, the
outliers are likely driving the results in the overall models. The results may also be due to the
fact that after removing the eight countries that were outliers in the data, there were only 16
observations left for the drug.
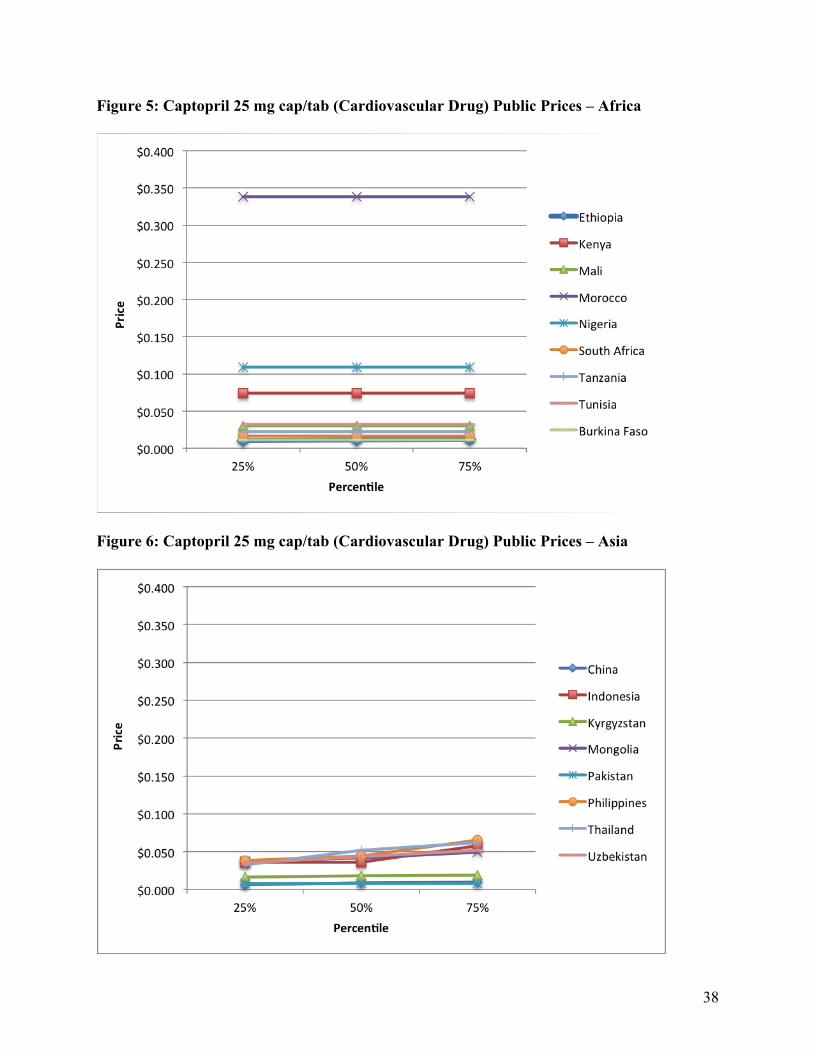
Captopril 25 mg cap/tab: Public
Regressions for Model 1 through Model 3 were also run for the cardiovascular drug
Captopril 25 mg cap/tab to determine if the results for the Ceftriaxone regressions were unusual
(see Table 8 for results). It was clear that there are some outliers in the public price data for
30 . Interestingly, the independent variable age was excluded for this regression. This is consistent with previous results where the number of generics was excluded when using drug fixed effects as age is a drug level variable as well. The countries that were excluded from the regressions were Brazil, China, India, Indonesia, Morocco, Philippines, Thailand, and Uzbekistan.

23
Captopril as well (see Figure 5 and Figure 6). Outliers, similar to those of Ceftriaxone, were
removed from the regressions.31 In Models 1 through 3, Age was included and had a negative
coefficient as expected with significance at the ten percent level for Model 1 and Model 3.
However, for Models 1 and 2, income distribution was negative, contrary to what was expected.
Health expenditure was also not as expected, with a positive coefficient for Model 1 and Model
2. Economic Freedom was positive, contrary to as expected, for all three models. Therefore, this
confirms that the outliers are likely driving the results in the overall models. Similar to the
Ceftriaxone regression results, the results may also be driven by the fact that after the six
countries were removed, there were only 18 observations to run for the regression. The only
independent variable that was at all significant was Age at the ten percent level for Model 1 and
Model 3. This may be because in many countries public health agencies negotiate a single price
for a drug. There is the possibility that there is also a single supplier for public health agencies,
therefore, there is likely to be a single price negotiated between the public health agency and the
single supplier, eliminating or diminishing the price discrimination seen in the public sector. The
results for the two individual drugs are as expected as the data include little to no price
discrimination once the outlier countries are removed. Thus, the expectations on price
discrimination previously proposed for the independent variables would not be accurate if little
or no price discrimination is present in the data.
Model 4: Private p75/Median
The next sections present the results of analysis for the private patient price data. Model 4
represents the model run with the ratio of the 75th percentile private price to the median private
price for each drug observation as the dependent variable (see Table 9 for results). Age of a
31 The countries that were removed from the regressions were Brazil, China, Indonesia, Philippines, Thailand, Uzbekistan.

24
drug resulted in a negative coefficient, as expected, of -.573 with a standard error of .066,
significant at the one percent level. This translates to, on average, a decrease of $0.27 in the
average 75th percentile private price, holding the average median private price constant, for every
one-year increase in the age of a drug. This is also economically significant, given that the
average annual per capita income of the countries surveyed is $4,074.63. Thus, the older the
drug, the less price discrimination that is present in the private sector, and the closer the prices of
the average 75th percentile price and the average median price of drugs.
Income distribution resulted in a positive coefficient of .011 with a standard error of .009.
Although not significant, income distribution’s coefficient was positive as expected. This
translates to, on average, an increase of $0.11 in the average 75th percentile private price, holding
the average median private price constant, for every one standard deviation increase in the GINI
coefficient measuring income distribution. Therefore, as the GINI coefficient increases and a
country experiences greater income inequality, more price discrimination is experienced in the
country in the private sector between the average 75th percentile price and the average median
price of drugs.
Model 5: Private p75/p25
Model 5 represents the model run with the ratio of the 75th percentile private price to the
25th percentile private price for each drug observation as the dependent variable (see Table 10
for results). As with the public sector prices, the results for this price ratio are consistent with
those in the private p75/Median price ratio. Age of a drug resulted in a negative coefficient, as
expected, of -.423 with a standard error of .091, significant at the one percent level. This
translates to, on average, a decrease of $0.11 in the average 75th percentile private price, holding

25
the average 25th percentile private price constant, for every one-year increase in the age of a
drug.
Income distribution resulted in a positive coefficient, as expected, of .021 with a standard
error of .012, significant at the ten percent level. This translates to, on average, an increase of
$0.18 in the average 75th percentile private price, holding the average 25th percentile private price
constant, for every one standard deviation increase in the GINI coefficient measuring income
distribution.
Model 6: Private Median/p25
Model 6 represents the model run with the ratio of the median private price to the 25th
percentile private price for each drug observation as the dependent variable (see Table 11 for
results). Model 6 resulted in very interesting results in comparison to Model 4 and Model 5 for
the private data. Age of a drug resulted in a positive coefficient of .014 with a standard error of
.016. The coefficient was not negative, as expected, but was also not statistically significant. The
coefficient may be positive because all consumers in the country at and below the median are so
poor that manufacturers cannot price discriminate. In developing countries there is often a large
gap between the poor, which represent a large percentage of the population, and the wealthy,
which represent a small percentage of the population. This creates less scope for price
discrimination among this large percentage of the population that is poor. This would explain
why the age of the drug has an effect on price discrimination in the 75th percentile, but not in the
median or 25th percentile.
Income distribution resulted in a positive coefficient, as expected, of .005 with a standard
error of .002, significant at the ten percent level. This can be interpreted as, on average, an
increase of $0.04 in the average median private price, holding the average 25th percentile private

26
price constant, for every one standard deviation increase in the GINI coefficient measuring
income distribution. Again, as the GINI coefficient increases and a country experiences greater
income inequality, more price discrimination is experienced in the country in the private sector
across both the average median price and the average 25th percentile price of drugs. However, the
magnitude of price discrimination is much smaller between the median and 25th percentile than
when the 75th percentile is included.
Discussion
As can be seen in the data, price discrimination is seen much more often in the private
patient data than the public procurement data (see Figure 1 through Figure 8). This is true for
both the anti-infective drug, Ceftriaxone 1 g/vial Injection, and the cardiovascular drug,
Captopril 25 mg/cap tab, that were individually graphed. After looking at the data, the public
prices for these drugs are representative of all public data. However, despite little price
discrimination represented in the public data, the public sector is not without price
discrimination. Interestingly, Africa demonstrated almost no price discrimination in the public
sector. In contrast, the lack of price discrimination was not as true for public procurement prices
in Asia.
There was both more variability and a larger magnitude of variability in prices in the
private sector compared to the public sector. Additionally, the price discrimination is
concentrated at the top for private patient prices, with the largest differences between the 75th
percentile and the median, while the median prices are either very close or equal to the 25th
percentile prices. This is likely due to the fact that income distribution in low-income countries is
not normally distributed, but is log-normally distributed, allowing more scope for price

27
discrimination.32 Additionally, the private sector is better able to price discriminate and can
charge a much higher price, representing the 75th percentile price, to the wealthy, and a lower
price, representing both the median and 25th percentile price, to the poor.33 Public procurement
prices have less room for price discrimination as public health agencies are negotiating prices
with drug manufacturers, negotiating for a lower price overall.
The coefficients for the age of a drug had a larger magnitude for private patient prices
than public procurement prices. This is likely due to the negotiating power of public health
agencies regardless of how long the drug has been on the market. For private buyers, prices tend
to fall as information about prices become more widely available. As a drug ages and new
competitors enter the market in the private sector, prices fall for that drug. Public health agencies
also tend to have more power to ignore drug patents through compulsory licensing, indicating
that the age of a drug would not have as great of an effect for public procurement prices.
Interestingly, for both public and private drug prices, age of a drug resulted in a smaller
magnitude coefficient for the Median/p25 ratios (Models 3 and 6) than for the p75/Median and
p75/p25 ratios. Age was not significant for either Model 3 or Model 6, while all other models
had age coefficients that were significant. This may also be due to the fact that the Median and
p25 prices have less variability, as the difference in income among the poor is minimal in many
emerging market countries compared to the difference between the wealthy and the poor,
allowing less scope for price discrimination.
32 Moritz Drupp, Stefan Baumgärtner, Jasper Meya, Jan Munz, and Martin Quaas, "Income distribution and willingness to pay for public ecosystem services." (unpublished working paper., University of Tübingen, Germany, 2012), http://www.academia.edu/857585/Income_Inequality_and_Willingness_to_Pay_for_Ecosystem_Services. 33 The result of a higher price in the top of the market or the strong market and a lower price in the weak market or the low end of the market through price discrimination is supported by the findings of Dastidar (2006).

28
The coefficients for income distribution for Models 1 through 6 were positive and
comparable for the public and private data for all three ratios, with all income distribution
coefficients significant except for in Model 4. This indicates that more unequal income
distribution leads to greater price discrimination in the generic drug market in developing
countries. Since income is log-normally distributed in low-income countries, generic drug
manufacturers are able to price discriminate between the poor and the wealthy, increasing access
for patients and profitability for the firms. Manufacturers often split up the market, leaving some
manufacturers to serve the poor at a lower price and some manufacturers to serve the wealthy at
a higher price.
Some control variables also demonstrated unusual results in their coefficients. In Model
6, Health expenditure resulted in a negative coefficient of -.010, which was not expected for
private data, with a standard error of .010. The result is not significant however. Economic
freedom resulted in a positive coefficient of .001 with a standard error of .002. The resulting sign
of the coefficient was also contrary to what was expected, however, the result is not significant.
The unusual signs of the coefficients for many of the control variables for the private
Median/p25 dependent variable is likely due to the constant prices often seen among the median
and 25th percentile, as compared to the 75th percentile. For example, if income inequality is very
high, then it is possible that both the 25th percentile and the median prices are set with the poorest
consumers in mind.
While originally it was unclear what the sign of the market share coefficient would be,
the results were split. The coefficients for market share were positive for the public data in
Models 1 through 3, but were negative for the private data in Models 4 through 6. It is likely that
this is because market share was measured in two different ways for public and private market
29
share, as those were the measures that were available using the HAI/WHO Database. This is
interesting as it is expected that because public health agencies have more bargaining power,
these agencies should have the ability to limit price discrimination regardless of the market share
of a drug, however, the public data market share coefficient was positive. The results may be due
to the measurement of market share for public data for this paper as number of orders was used
as an approximation for market share. Another reason that the coefficient for market share may
have been positive for public because the majority of orders for a particular drug compound may
be from one supplier. This supplier would have more power in the bargaining over public
procurement prices, possibly allowing more price discrimination, compared to the higher
bargaining power that public health agencies have when dealing with multiple suppliers.
The negative coefficients for market share in the private data is likely due to the greater
knowledge available on a drug when market share is greater, making it more difficult to price
discriminate. Because private data market share is measured by availability of a drug in the
medicine outlets surveyed, greater availability may make price discrimination harder to achieve.
VII. Summary & Conclusions
Many firms practice price discrimination in order to extract more value from consumers
while still serving much of the market. Price discrimination may also occur between firms,
allowing different firms to effectively serve different parts of the market, thereby reducing
competition and increasing profits. When price discrimination occurs within a country, firms
maximize profits and increase access to patients across the varied income levels in a country.
Firms are able to set different price levels for the same drug in the same country because of the
log-normally distributed income seen in low-income countries as well as by firms splitting up the
market and serving one group of customers in the country.
30
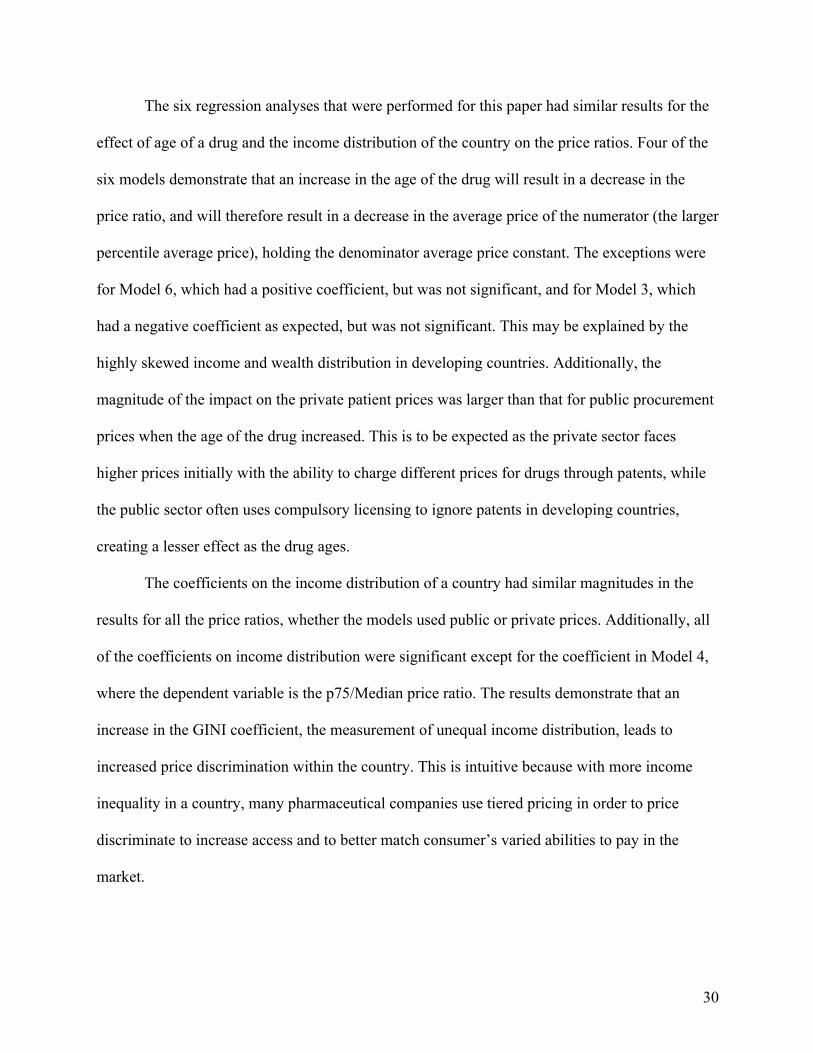
The six regression analyses that were performed for this paper had similar results for the
effect of age of a drug and the income distribution of the country on the price ratios. Four of the
six models demonstrate that an increase in the age of the drug will result in a decrease in the
price ratio, and will therefore result in a decrease in the average price of the numerator (the larger
percentile average price), holding the denominator average price constant. The exceptions were
for Model 6, which had a positive coefficient, but was not significant, and for Model 3, which
had a negative coefficient as expected, but was not significant. This may be explained by the
highly skewed income and wealth distribution in developing countries. Additionally, the
magnitude of the impact on the private patient prices was larger than that for public procurement
prices when the age of the drug increased. This is to be expected as the private sector faces
higher prices initially with the ability to charge different prices for drugs through patents, while
the public sector often uses compulsory licensing to ignore patents in developing countries,
creating a lesser effect as the drug ages.
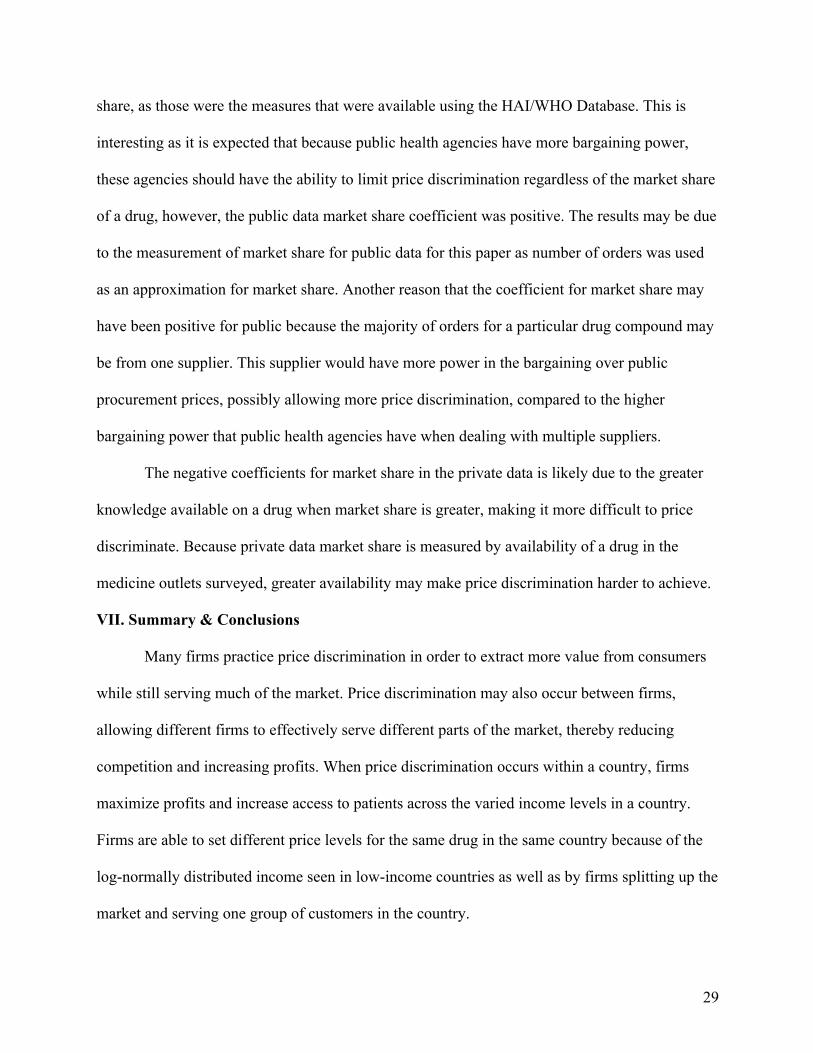
The coefficients on the income distribution of a country had similar magnitudes in the
results for all the price ratios, whether the models used public or private prices. Additionally, all
of the coefficients on income distribution were significant except for the coefficient in Model 4,
where the dependent variable is the p75/Median price ratio. The results demonstrate that an
increase in the GINI coefficient, the measurement of unequal income distribution, leads to
increased price discrimination within the country. This is intuitive because with more income
inequality in a country, many pharmaceutical companies use tiered pricing in order to price
discriminate to increase access and to better match consumer’s varied abilities to pay in the
market.

31
The findings of this paper suggest that both the age of a drug and the income inequality in
a country affect the level of price discrimination within a country. Price discrimination is seen as
necessary by many patients and by pharmaceutical companies, as the practice allows a larger
pool of patients to be granted access to drugs and subsequently allows pharmaceutical companies
to make greater profit on their drugs, incentivizing the companies to continue investing in new
medicines. Drugs that have been on the market for a shorter period of time often result in greater
price discrimination, however, drugs that have been on the market for a longer period of time
often see lower prices overall. The larger the income inequality in a country, the more price
discrimination is necessary and the greater the ability of manufacturers to split up the market,
resulting in a larger presence of price discrimination. In countries where income is more equal,
price discrimination is not as feasible, as a greater number of patients have a similar ability to
pay for medicines. However, countries like the U.S. are known for having high drug prices
essentially for all patients, despite there still being sizable income inequality in the country.
From the findings of this paper, it can be seen that prices are lower for public health
agencies, but critically, there is also less price discrimination demonstrated in public
procurement prices. This is important to note as generic drugs become increasingly demanded by
public health agencies in emerging markets. Pharmaceutical manufacturers should expect less
opportunity for price discrimination with their generic drugs when selling to the public sector.
This creates an issue for pharmaceutical manufacturers who want to price discriminate to
maximize profit and increase access to a greater number of patients, by pricing medicine closer
to a patient’s ability to pay. However, because these manufacturers are selling life saving
medicine, there is great pressure not only to sell to public health agencies, but to provide them a
lower overall price. With lower prices overall, public health agencies are able to improve patient

32
access to medicines. This is increasingly important to many organizations around the world, as
medicine seems to get more expensive and a large percentage of the market remains
underserved.
The results are also important in evaluating the pharmaceutical industry’s practice of
price discrimination and where the burden for research and development cost is allocated. There
are many critics of the pharmaceutical industry who claim that U.S. consumers subsidize
research and development for the rest of the world. These critics believe that U.S. consumers pay
a higher price to help cover the fixed costs of the process of bringing a drug to market, while
developing countries receive significantly smaller prices representing prices closer to the
variable cost of actually producing the drug. While this may be true, the results of this paper
show that prices are non-normally distributed and price discrimination is concentrated at the top
of the market. This suggests the need for further study of the prices of brand-name
pharmaceuticals to determine whether the same portion of consumers in developing countries
contribute to the development costs of drugs as well, even though these consumers are still
paying a lower price than consumers in developed countries.
This paper has implications for the recent patent denials occurring in developing
countries as well. There has been an ongoing debate in the developing world about protection of
intellectual property rights, particularly those of pharmaceutical companies. Recently, India has
been denying many pharmaceutical firms the patent rights to their brand name drugs.34 India’s
denial of patents for brand name drugs is expected to pave the way for generic manufacturers to
make similar compounds and sell these medicines at a much lower price. This may have an
34 Krishna, Jai, and Jeanne Whalen. "Novartis Loses Glivec Patent Battle in India." The Wall Street Journal, , sec. Asia Business, April 1, 2013. http://online.wsj.com/article/SB10001424127887323296504578395672582230106.html?KEYWORDS=india novartis (accessed April 22, 2013).
33
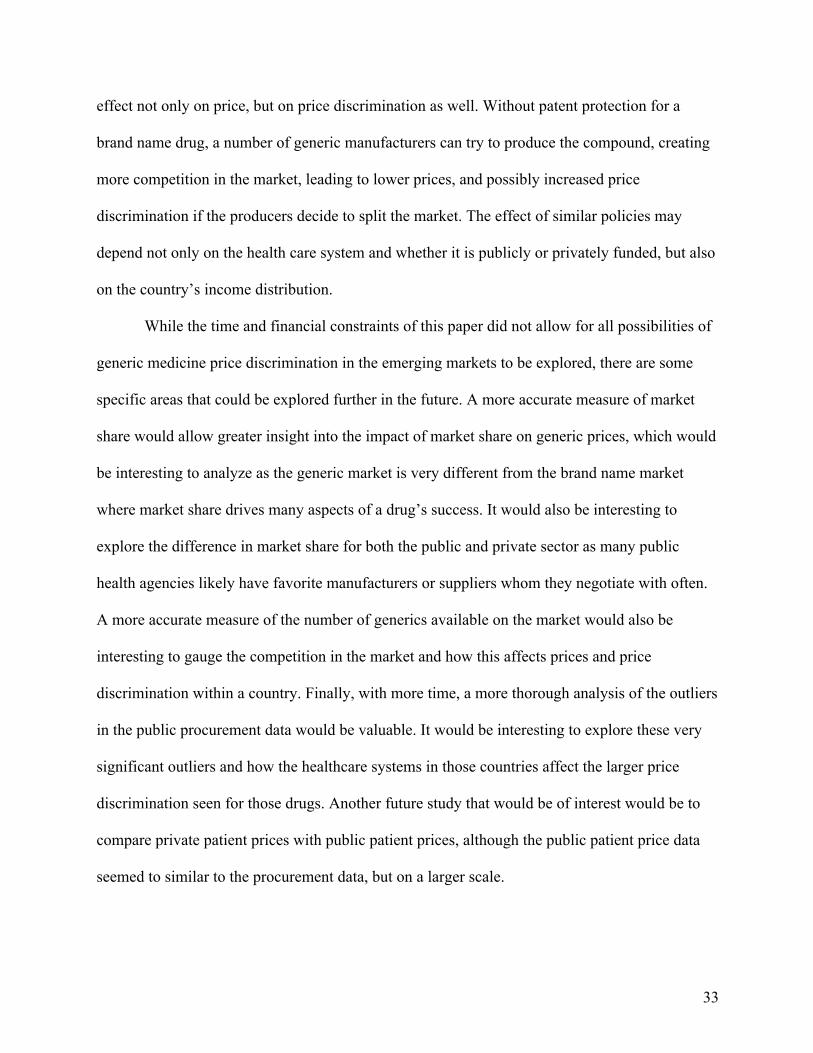
effect not only on price, but on price discrimination as well. Without patent protection for a
brand name drug, a number of generic manufacturers can try to produce the compound, creating
more competition in the market, leading to lower prices, and possibly increased price
discrimination if the producers decide to split the market. The effect of similar policies may
depend not only on the health care system and whether it is publicly or privately funded, but also
on the country’s income distribution.
While the time and financial constraints of this paper did not allow for all possibilities of
generic medicine price discrimination in the emerging markets to be explored, there are some
specific areas that could be explored further in the future. A more accurate measure of market
share would allow greater insight into the impact of market share on generic prices, which would
be interesting to analyze as the generic market is very different from the brand name market
where market share drives many aspects of a drug’s success. It would also be interesting to
explore the difference in market share for both the public and private sector as many public
health agencies likely have favorite manufacturers or suppliers whom they negotiate with often.
A more accurate measure of the number of generics available on the market would also be
interesting to gauge the competition in the market and how this affects prices and price
discrimination within a country. Finally, with more time, a more thorough analysis of the outliers
in the public procurement data would be valuable. It would be interesting to explore these very
significant outliers and how the healthcare systems in those countries affect the larger price
discrimination seen for those drugs. Another future study that would be of interest would be to
compare private patient prices with public patient prices, although the public patient price data
seemed to similar to the procurement data, but on a larger scale.

34
Appendix Table 1: Data Observations
Category Observations
Public Countries Surveyed 34 Private Countries Surveyed 40
Public Drugs Surveyed 48 Private Drugs Surveyed 49
Public Cardiovascular Drugs 13 Private Cardiovascular Drugs 15
Public Anti-Infective Drugs 35 Private Anti-Infective Drugs 34
Public Sector Total Price Observations 1,077 Private Sector Total Price Observations 1,344
Years Surveyed 2001-2010 Table 2: Public Data Descriptives
Category Mean Standard Deviation Min Max p75 $0.21 0.625441 $0.002 $9.846
Median $0.17 0.625441 $0.002 $9.411 p25 $0.17 0.58819 $0.002 $8.976
p75/Median 1.124 0.430685 1.000 5.333 p75/p25 1.295 1.138419 1.000 15.974
Median/p25 1.101 0.387062 1.000 5.974 Age 16.735 8.132618 0.000 55.000
Income Distribution 40.244 7.421244 29.560 67.400 Market Share (Orders) 5.810 7.619649 1.000 49.000
# Generics 23.215 13.34465 1.000 49.000 GDP per capita (in 2005
international $) $3,922.38 3001.359108 $582.46 $11,178.21
Health Expenditure, total (% of GDP)
5.259% 1.679603 2.368% 9.462%
Economic Freedom 55.475 6.595863 39.100 69.600

35
Table 3: Private Data Descriptives
Category Mean Standard Deviation Min Max p75 $0.70 2.242031 $0.00 $20.02
Median $0.58 1.929222 $0.00 $18.40 p25 $0.49 1.704442 $0.00 $18.23
p75/Median 1.309 1.255297 1.000 20.412 p75/p25 1.618 1.607752 1.000 28.917
Median/p25 1.214 0.266089 1.000 3.214 Income Distribution 40.857 7.824124 29.560 67.400
Age 16.638 8.812355 0.000 55.000 Market Share (Availability) 73.8% 0.26116 6.700% 100%
# Generics 21.593 12.74481 1.000 49.000 GDP per capita (in 2005
international $) $4,074.63 3147.89007 $582.46 $11,936.46
Health Expenditure, total (% of GDP)
5.344% 1.625101 2.368% 9.462%
Economic Freedom 55.475 6.364774 39.100 69.600
36
Figure 1: Ceftriaxone 1 g/vial injection (Anti-Infective Drug) Public Prices – Africa
Figure 2: Ceftriaxone 1 g/vial injection (Anti-Infective Drug) Public Prices – Asia

37
Figure 3: Ceftriaxone 1 g/vial injection (Anti-Infective Drug) Private Prices – Africa
Figure 4: Ceftriaxone 1 g/vial injection (Anti-Infective Drug) Private Prices – Asia
38
Figure 5: Captopril 25 mg cap/tab (Cardiovascular Drug) Public Prices – Africa
Figure 6: Captopril 25 mg cap/tab (Cardiovascular Drug) Public Prices – Asia

39
Figure 7: Captopril 25 mg cap/tab (Cardiovascular Drug) Private Prices – Africa
Figure 8: Captopril 25 mg cap/tab (Cardiovascular Drug) Private Prices – Asia

40
Table 4: Model 1 - P75/Median Public Regression Results
Model A Model B Model C Model D Model E Constant .897***
(.309) 2.526*** (.495)
.762*** (.305)
.979 (1.387)
-1.613 (1.753)
Age .003 (.012)
-.127*** (.037)
-.128*** (.037)
-.078** (.054)
-.002 (.003)
Income Distribution
.010** (.004)
.006 (.005)
.010** (.004)
-.065 (.047)
.002 (.100)
Market Share .005 (.004)
.002 (.004)
.004 (.003)
-.003 (.005)
-.002 (.005)
# Generics - - - - .000 (.002)
GDP per Capita -6.717E-007 (.000)
4.398E-006 (.000)
-3.908E-006 (.000)
7.061E-005 (.000)
.000 (.000)
Health Expenditure
-.018 (.018)
-.029 (.019)
-.017 (.018)
.271 (.207)
.909 (.848)
Economic Freedom
-.004 (.004)
-.008 (.005)
-.005 (.004)
.017 (.032)
-.008 (.066)
Drug FE yes yes yes yes no Year FE no yes trend no yes†
Country FE no no no yes yes† Notes: 1. Dependent Variable: p75/Median 2. Values in parentheses are standard errors. 3. - Indicates excluded variable due to collinearity 4. *** Indicates significance at the 1% level 5. ** Indicates significance at the 5% level
6. * Indicates significance at the 10% level 7. † indicates excluded dummy variables due to collinearity: 2007 & Burkina Faso
8. Trend indicates that a trend variable was used instead of dummy variables for each year
41
Table 5: Model 2 - P75/P25 Public Regression Results
Model A Model B Model C Model D Model E Constant .817
(.820) 4.442*** (1.291)
.542 (.816)
2.524 (3.554)
-2.141 (4.429)
Age .046 (.031)
-.236** (.098)
-.221** (.099)
-.161* (.086)
-.008 (.008)
Income Distribution
.031*** (.011)
.015 (.012)
.032*** (.011)
-.180 (.120)
-.096 (.253)
Market Share .014 (.009)
.008 (.010)
.013 (.009)
.004 (.013)
.006 (.012)
# Generics - - - - .003 (.005)
GDP per Capita -1.901E-005 (.000)
-1.195E-005 (.000)
-2.559E-005 (.000)
.000 (.000)
.000 (.001)
Health Expenditure
-.091* (.048)
-.143*** (.049)
-.089* (.047)
-.075 (.531)
1.791 (2.143)
Economic Freedom
-.010 (.011)
-.014 (.013)
-.012 (.011)
.082 (.082)
-.011 (.166)
Drug FE yes yes yes yes no Year FE no yes trend no yes†
Country FE no no no yes yes Notes: 1. Dependent Variable: p75/P25 2. Values in parentheses are standard errors. 3. - Indicates excluded variable due to collinearity 4. *** Indicates significance at the 1% level 5. ** Indicates significance at the 5% level
6. * Indicates significance at the 10% level 7. † indicates excluded dummy variables due to collinearity: 2007 & 2009
8. Trend indicates that a trend variable was used instead of dummy variables for each year

42
Table 6: Model 3 - Median/P25 Public Regression Results
Model A Model B Model C Model D Model E Constant 1.114***
(.281) 1.827*** (.447)
1.081*** (.283)
1.120 (1.213)
.259 (1.501)
Age .019* (.011)
-.016 (.034)
-.012 (.034)
-.012 (.029)
-.002 (.003)
Income Distribution
.010** (.004)
.003 (.004)
.010** (.004)
-.021 (.041)
-.064 (.086)
Market Share .004 (.003)
.003 (.003)
.004 (.003)
.002 (.005)
.003 (.004)
# Generics - - - - .002 (.002)
GDP per Capita
-8.701E-006 (.000)
-7.382E-006 (.000)
-9.484E-006 (.000)
4.356E-005 (.000)
-9.425E-005 (.000)
Health Expenditure
-.035** (.016)
-.051*** (.017)
-.035** (.016)
-.135 (.181)
.795 (.726)
Economic Freedom
-.002 (.004)
-.004 (.005)
-.002 (.004)
.024 (.028)
-.007 (.056)
Drug FE yes yes yes yes no Year FE no yes trend no yes†
Country FE no no no yes yes Notes: 1. Dependent Variable: Median/P25 2. Values in parentheses are standard errors. 3. - Indicates excluded variable due to collinearity 4. *** Indicates significance at the 1% level 5. ** Indicates significance at the 5% level
6. * Indicates significance at the 10% level 7. † indicates excluded dummy variables due to collinearity: 2007 & 2009
8. Trend indicates that a trend variable was used instead of dummy variables for each year

43
Table 7: Ceftriaxone 1 g/vial Injection Public Regressions
P75/Median P75/p25 Median/p25 Constant .878***
(.068) .921***
(.038) .960***
(.045) Age - - -
Income Distribution
-.003** (.001)
-.001 (.001)
-.002* (.001)
Market Share .003 (.002)
.002 (.001)
.002 (.001)
GDP per Capita 3.987E-006 (.000)
1.184E-006 (.000)
2.739E-006 (.000)
Health Expenditure -.007 (.004)
-.006** (.002)
-.001 (.003)
Economic Freedom .003** (.001)
.002** (.001)
.001 (.001)
Drug FE yes yes yes Year FE trend trend trend
Country FE no no no Notes: 1. Eight outliers were dropped for all three regressions.
2. The variable, # Generics, is excluded as it is a constant for one drug. 3. Values in parentheses are standard errors.
4. - Indicates excluded variable due to collinearity 5. *** Indicates significance at the 1% level 6. ** Indicates significance at the 5% level
7. * Indicates significance at the 10% level

44
Table 8: Captopril 25 mg cap/tab Public Regressions
P75/Median P75/p25 Median/p25 Constant 1.022***
(.238) .948***
(.165) 1.068***
(.198) Age -.024*
(.012) -.003 (.009)
-.021* (.010)
Income Distribution
-.001 (.004)
-.002 (.003)
.001 (.003)
Market Share .013*** (.003)
.011*** (.002)
.003 (.003)
GDP per Capita 5.372E-006 (.000)
1.160E-007 (.000)
5.387E-006 (.000)
Health Expenditure .006 (.016)
.012 (.011)
-.006 (.013)
Economic Freedom .004 (.004)
.002 (.003)
.002 (.004)
Drug FE yes yes yes Year FE - - -
Country FE no no no Notes: 1. Outliers were dropped for all three regressions.
2. The variable, # Generics, is excluded as it is a constant for one drug. 3. Values in parentheses are standard errors.
4. - Indicates excluded variable due to collinearity 5. *** Indicates significance at the 1% level 6. ** Indicates significance at the 5% level
7. * Indicates significance at the 10% level
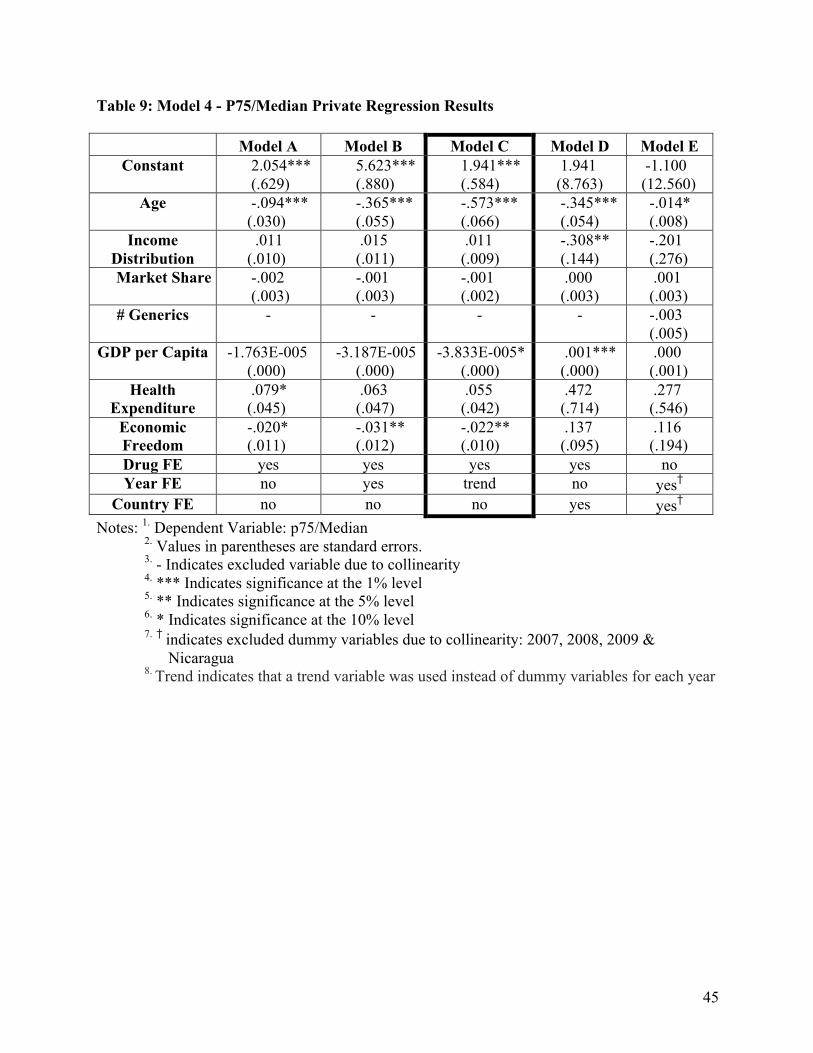
45
Table 9: Model 4 - P75/Median Private Regression Results
Model A Model B Model C Model D Model E Constant 2.054***
(.629) 5.623*** (.880)
1.941*** (.584)
1.941 (8.763)
-1.100 (12.560)
Age -.094*** (.030)
-.365*** (.055)
-.573*** (.066)
-.345*** (.054)
-.014* (.008)
Income Distribution
.011 (.010)
.015 (.011)
.011 (.009)
-.308** (.144)
-.201 (.276)
Market Share -.002 (.003)
-.001 (.003)
-.001 (.002)
.000 (.003)
.001 (.003)
# Generics - - - - -.003 (.005)
GDP per Capita -1.763E-005 (.000)
-3.187E-005 (.000)
-3.833E-005* (.000)
.001*** (.000)
.000 (.001)
Health Expenditure
.079* (.045)
.063 (.047)
.055 (.042)
.472 (.714)
.277 (.546)
Economic Freedom
-.020* (.011)
-.031** (.012)
-.022** (.010)
.137 (.095)
.116 (.194)
Drug FE yes yes yes yes no Year FE no yes trend no yes†
Country FE no no no yes yes† Notes: 1. Dependent Variable: p75/Median 2. Values in parentheses are standard errors. 3. - Indicates excluded variable due to collinearity 4. *** Indicates significance at the 1% level 5. ** Indicates significance at the 5% level
6. * Indicates significance at the 10% level 7. † indicates excluded dummy variables due to collinearity: 2007, 2008, 2009 &
Nicaragua
8. Trend indicates that a trend variable was used instead of dummy variables for each year
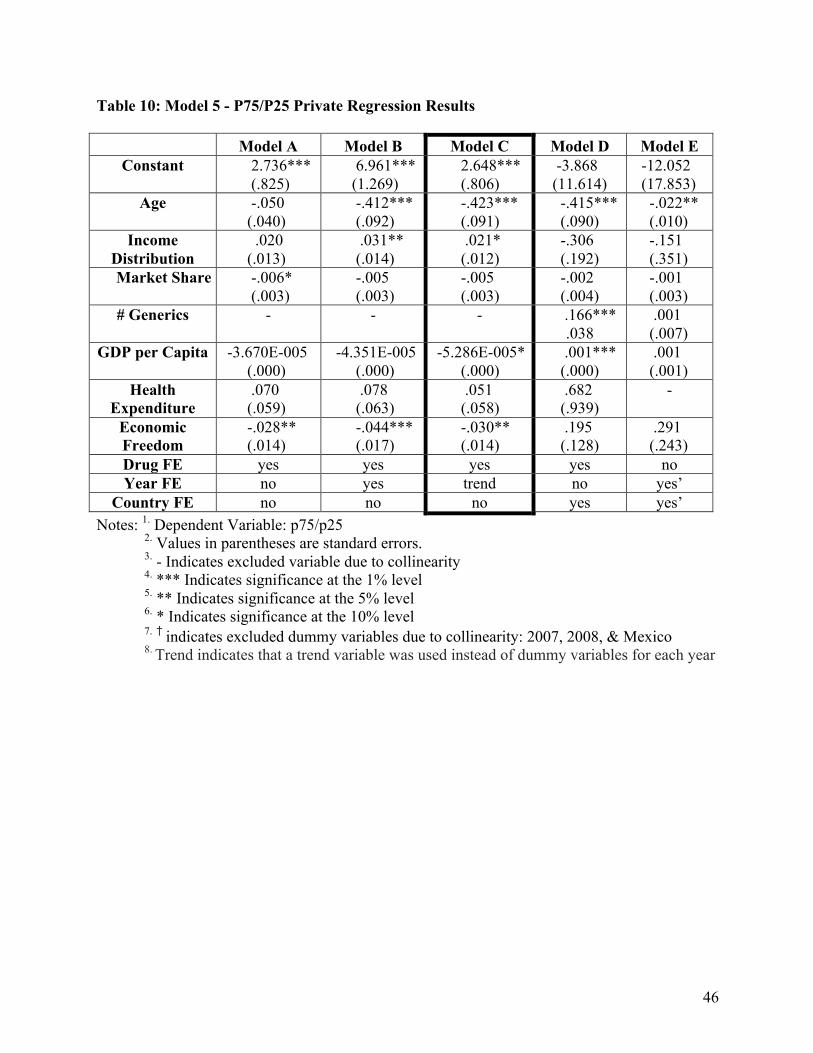
46
Table 10: Model 5 - P75/P25 Private Regression Results
Model A Model B Model C Model D Model E Constant 2.736***
(.825) 6.961*** (1.269)
2.648*** (.806)
-3.868 (11.614)
-12.052 (17.853)
Age -.050 (.040)
-.412*** (.092)
-.423*** (.091)
-.415*** (.090)
-.022** (.010)
Income Distribution
.020 (.013)
.031** (.014)
.021* (.012)
-.306 (.192)
-.151 (.351)
Market Share -.006* (.003)
-.005 (.003)
-.005 (.003)
-.002 (.004)
-.001 (.003)
# Generics - - - .166*** .038
.001 (.007)
GDP per Capita -3.670E-005 (.000)
-4.351E-005 (.000)
-5.286E-005* (.000)
.001*** (.000)
.001 (.001)
Health Expenditure
.070 (.059)
.078 (.063)
.051 (.058)
.682 (.939)
-
Economic Freedom
-.028** (.014)
-.044*** (.017)
-.030** (.014)
.195 (.128)
.291 (.243)
Drug FE yes yes yes yes no Year FE no yes trend no yes’
Country FE no no no yes yes’ Notes: 1. Dependent Variable: p75/p25 2. Values in parentheses are standard errors. 3. - Indicates excluded variable due to collinearity 4. *** Indicates significance at the 1% level 5. ** Indicates significance at the 5% level
6. * Indicates significance at the 10% level 7. † indicates excluded dummy variables due to collinearity: 2007, 2008, & Mexico
8. Trend indicates that a trend variable was used instead of dummy variables for each year
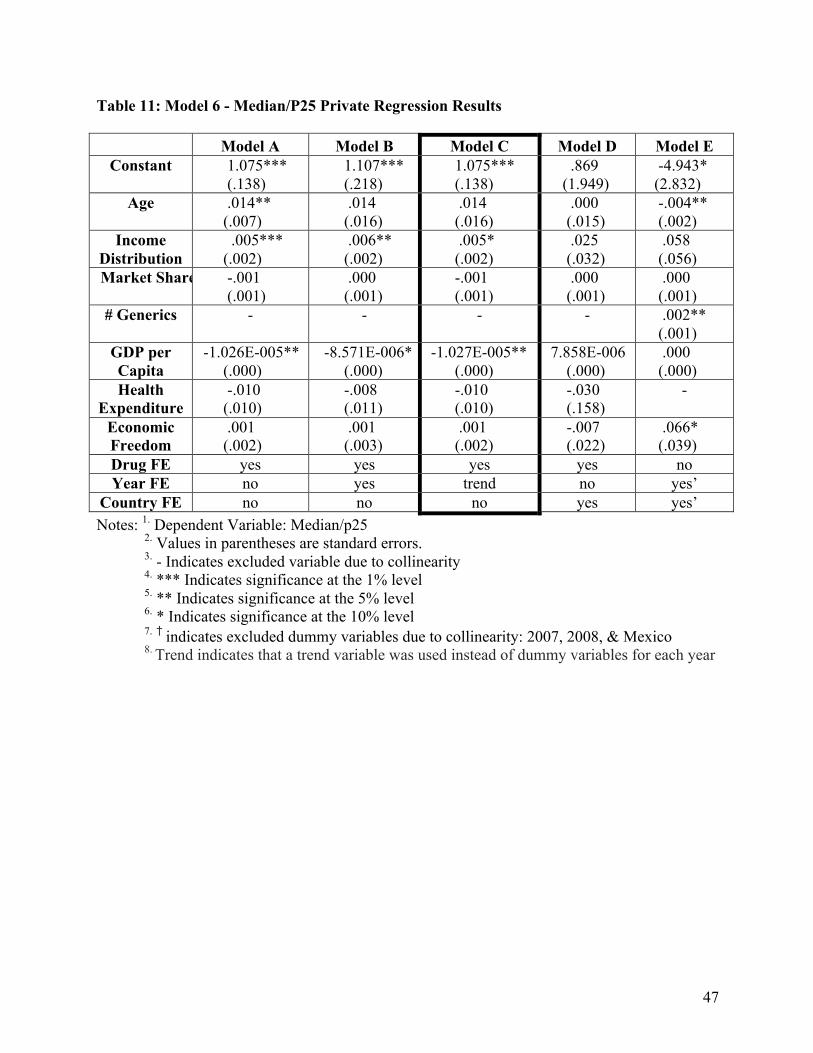
47
Table 11: Model 6 - Median/P25 Private Regression Results
Model A Model B Model C Model D Model E Constant 1.075***
(.138) 1.107*** (.218)
1.075*** (.138)
.869 (1.949)
-4.943* (2.832)
Age .014** (.007)
.014 (.016)
.014 (.016)
.000 (.015)
-.004** (.002)
Income Distribution
.005*** (.002)
.006** (.002)
.005* (.002)
.025 (.032)
.058 (.056)
Market Share -.001 (.001)
.000 (.001)
-.001 (.001)
.000 (.001)
.000 (.001)
# Generics - - - - .002** (.001)
GDP per Capita
-1.026E-005** (.000)
-8.571E-006* (.000)
-1.027E-005** (.000)
7.858E-006 (.000)
.000 (.000)
Health Expenditure
-.010 (.010)
-.008 (.011)
-.010 (.010)
-.030 (.158)
-
Economic Freedom
.001 (.002)
.001 (.003)
.001 (.002)
-.007 (.022)
.066* (.039)
Drug FE yes yes yes yes no Year FE no yes trend no yes’
Country FE no no no yes yes’ Notes: 1. Dependent Variable: Median/p25 2. Values in parentheses are standard errors. 3. - Indicates excluded variable due to collinearity 4. *** Indicates significance at the 1% level 5. ** Indicates significance at the 5% level
6. * Indicates significance at the 10% level 7. † indicates excluded dummy variables due to collinearity: 2007, 2008, & Mexico
8. Trend indicates that a trend variable was used instead of dummy variables for each year

48
References
Armstrong, Mark, and John Vickers. "Competitive Price Discrimination." The RAND Journal of
Economics. no. 4 (2001): 1-27.
http://www.econ.umn.edu/~holmes/class/2003f8601/papers/rje_Winter'01_Armstrong.pd
f (accessed April 22, 2013).
Bakó, Barna, and András Kálecz-Simon. "Price Discrimination in Asymmetric Cournot
Oligopoly." Economics Letters. no. 3 (2012): 301-03. 10.1016/j.econlet.2012.03.016
(accessed April 22, 2013).
Brekke, Kurt, Tor Holmås, and Odd Straume. "Reference Pricing, Competition, and
Pharmaceutical Expenditures: Theory and Evidence from a Natural Experiment." Journal
of Public Economics. no. 7 (2011): 624-38. http://www.elsevier.com/locate/inca/505578
(accessed April 22, 2013).
Byrns, Ralph. "History of Economic Doctrines: Neoclassical Economics I." lecture., University
of North Carolina, 2002.
http://www.unc.edu/depts/econ/byrns_web/EC434/EC434ClassNotes/Lecture_17_HET.h
tm.
Danzon, Patricia, and Jeong Kim. "International Price Comparisons for Pharmaceuticals:
Measurement and Policy Issues." Pharmacoeconomics. no. 1 (1998): 115-28.
http://www.ncbi.nlm.nih.gov/pubmed/10186473 (accessed April 22, 2013).
Danzon, Patricia, and Li-Wei Chao. "Does Regulation Drive Out Competition in Pharmaceutical
Markets?." Journal of Law and Economics. no. 2 (2000). http://ssrn.com/abstract=231772
(accessed April 22, 2013).
49
Danzon, Patricia, and Michael Furukawa. "Prices and Availability of Pharmaceuticals: Evidence
from Nine Countries." Health Affairs. (2004): 521-36. 10.1377/hlthaff.W3.521 (accessed
April 21, 2013).
Dastidar, Krishnendu. "On Third-Degree Price Discrimination in Oligopoly." The Manchester
School. no. 2 (2006): 231-50. 10.1111/j.1467-9957.2006.00490.x (accessed April 22,
2013).
Drupp, Moritz, Stefan Baumgärtner, Jasper Meya, Jan Munz, and Martin Quaas. "Income
distribution and willingness to pay for public ecosystem services." working paper.,
University of Tübingen, Germany, 2012.
http://www.academia.edu/857585/Income_Inequality_and_Willingness_to_Pay_for_Ecos
ystem_Services.
Dumoulin, Jérôme. "Global Pricing Strategies for Innovative Essential Drugs." International
Journal of Biotechnology. no. 3 (2001): 338-49.
http://inderscience.metapress.com/content/264pp1mrvyreqh13/ (accessed April 22, 2013).
Dupuit, Jules. "On the Measurement of the Utility of Public Works." International Economic
Papers. (1844): 83-110.
Etchegorry, M.G., J.P. Helenport, B. Pecoul, J. Jannin, and D. Legros. "Availability and
Affordability of Treatment for Human African Trypanosomiasis." Tropical Medicine &
International Health. no. 11 (2002): 957-59.
http://onlinelibrary.wiley.com/store/10.1046/j.1365-3156.2001.00764.x/asset/j.1365-
3156.2001.00764.x.pdf?v=1&t=hfu1ff0j&s=6e3de1bca7260761af063370c85301492e024
cc4 (accessed April 22, 2013).
50
Flynn, Sean, Aidan Hollis, and Mike Polmedo. "An economic justification for open access to
essential medicine patents in developing countries." Journal of Law, Medicine, & Ethics.
no. 2 (2009): 184-208. 10.1111/j.1748-720X.2009.00365.x (accessed April 23, 2013).
Frank, Richard, and David Salkever. "Generic Entry and the Pricing of Pharmaceuticals."
Journal of Economics & Management Strategy. no. 1 (1997): 75-90.
http://www.nber.org/papers/w5306 (accessed April 23, 2013).
Gifford, Daniel, and Robert Kidrle. "The Law and Economics of Price Discrimination in Modern
Economies: Time for Reconciliation?." Minnesota Legal Studies Research Paper. no. 21
(2008): 1237-93. http://lawreview.law.ucdavis.edu/issues/43/4/articles/43-4_Gifford-
Kudrle.pdf (accessed April 21, 2013).
Goldman, Barry, Hayne Leland, and David Sibley. "Optimal Nonuniform Prices." Review of
Economic Studies. no. 2 (1984): 305-19. 10.2307/2297694 (accessed April 23, 2013).
Hausman, Jerry, and Jeffrey MacKie-Mason. "Price Discrimination and Patent Policy." RAND
Journal of Economics. no. 2 (1988): 253-65. http://www.jstor.org/stable/2555703
(accessed April 23, 2013).
Hazledine, Tim. "Price Discrimination in Cournot-Nash Oligopoly." Economics Letters. no. 3
(2006): 413-20. 10.1016/j.econlet.2006.06.006 (accessed April 22, 2013).
Health Action International & World Health Organization Medicine Prices, Availability,
Affordability and Price Components Database (accessed October 7, 2012),
http://www.haiweb.org/MedPriceDatabase/.
Hemphill, Thomas. "Pharmaceutical Patent Expropriation and Technology Strategy: Strategic
Options and Compulsory Licensing." Technology Analysis & Strategic Management. no.
1 (2010): 19-41.
51
http://www.emeraldinsight.com/bibliographic_databases.htm?id=1845460&show=abstra
ct (accessed April 23, 2013).
Heritage Foundation, "2013 Index of Economic Freedom." Last modified 2013. Accessed April
22, 2013. http://www.heritage.org/index/.
Holmes, Thomas. "The Effects of Third-Degree Price Discrimination in Oligopoly." The
American Economic Review. no. 1 (1989): 244-50. http://www.jstor.org/stable/1804785
(accessed April 23, 2013).
Hoover, Edgar. "Spatial Price Discrimination." The Review of Economic Studies. no. 3 (1937):
182-91. http://www.jstor.org/stable/2967453 (accessed April 23, 2013).
Kessel, Reuben. "Price Discrimination in Medicine." Journal of Law and Economics. (1958): 20-
53. http://www.jstor.org/stable/724881 (accessed April 23, 2013).
Kong, Ying. "The Price Premium of Generic to Brand-Names and Pharmaceutical Price Index."
Applied Economics. no. 7 (2004): 231-37. http://www.jstor.org/stable/724881 (accessed
April 23, 2013).
Krishna, Jai, and Jeanne Whalen. "Novartis Loses Glivec Patent Battle in India." The Wall Street
Journal, , sec. Asia Business, April 1, 2013.
http://online.wsj.com/article/SB10001424127887323296504578395672582230106.html?
KEYWORDS=india novartis (accessed April 22, 2013).
Layson, Stephen. "Market Opening under Third-Degree Price Discrimination." The Journal of
Industrial Economics. no. 3 (1994): 335-40. http://www.jstor.org/stable/2950575
(accessed April 23, 2013).

52
Lopert, R., D. Lang, S. Hill, and D. Henry. "Parallel Trade in Pharmaceutical Products:
Implications for Procuring Medicines in Poor Countries." The Economics of Essential
Medicines. (2002).
Mirrlees, James. "Optimal Tax Theory: A Synthesis." Journal of Public Economics. no. 4
(1976): 327-58. http://dx.doi.org/10.1016/0047-2727(76)90047-5 (accessed April 23,
2013).
Naguib, Rania. "Price Discrimination in Practice: The Market for Drugs in Egypt and the U.S."
working paper., The German University in Cairo, 2010. Working Papers
(20)http://mgt.guc.edu.eg/economics/RePEc/guc/.
Pigou, Arthur C. The Economics of Welfare. London: Macmillan and Co. 1932. Library of
Economics and Liberty [Online] available from
http://www.econlib.org/library/NPDBooks/Pigou/pgEW.html; accessed 23 April 2013;
Internet.
Radisch, Jack. "More medicines for neglected and emerging infectious diseases." Bulletin of the
World Health Organization. no. 8 (2007). http://www.who.int/bulletin/volumes/85/8/07-
045690/en/ (accessed April 21, 2013).
Ramsey, Frank. "A Contribution the Theory of Taxation." The Economics Journal. no. 145
(1927): 47-61.
Rochet, Jean-Charles, and Lars Stole. "Nonlinear Pricing with Random Participation." The
Review of Economic Studies. no. 145 (1927): 277-311.
http://www.jstor.org/stable/2695961 (accessed April 23, 2013).

53
Rojas, Mariano. "Price Discrimination by Pharmaceutical Companies across Central American
Countries." International Journal of Pharmaceutical and Healthcare Marketing. no. 2
(2009): 118-36. 10.1108/17506120910971704 (accessed April 21, 2013).
Scherer, Frederic. "A Note on Global Welfare in Pharmaceutical Patenting." working paper.,
Harvard University - Harvard Kennedy School, 2011. FRB of Philadelphia Working
Paper (03-11)http://dx.doi.org/10.2139/ssrn.570565.
Schut, Frederick, and Peter Van Bergeijk. "International Price Discrimination: The
Pharmaceutical Industry." World Development. no. 9 (1986): 1141-50.
http://www.elsevier.com/locate/worlddev (accessed April 23, 2013).
Schmalensee, Richard. "Output and Welfare Implications of Monopolistic Third-Degree Price
Discrimination." The American Economic Review. no. 9 (1986): 242-47.
http://www.jstor.org/stable/1805058 (accessed April 23, 2013).
Sundararajan, Arun. New York University - Stern School, "Economics of IT." Last modified
2003. Accessed April 23, 2013. http://oz.stern.nyu.edu/io/pricing.html.
The Medica: Global Healthcare Marketplace, "Pharmaceutical Drugs: Generic Drug List."
Accessed April 22, 2013. http://www.themedica.com/drug/.
U.S. Food and Drug Administration, "Orange Book: Approved Drug Products with Therapeutic
Equivalence Evaluations." Last modified November 16, 2012. Accessed April 22, 2013.
http://www.accessdata.fda.gov/scripts/cder/ob/default.cfm.
Van Mourik, Maaike, Alexandra Cameron, Marg Ewen, and Richard Laing. "Availability, price
and affordability of cardiovascular medicines: a comparison across 36 countries using
WHO/HAI data." BMC Cardiovascular Disorders. no. 25 (2010). 10.1186/1471-2261-
10-25 (accessed April 21, 2013).

54
Wagner, Judith, and Elizabeth McCarthy. "International Differences in Drug Prices." Annual
Review of Public Health. no. 1 (2004): 475-95.
10.1146/annurev.publhealth.25.101802.123042 (accessed April 21, 2013).
World databank (GDP per capita, at PPP 2005 international dollars, GINI Index, Healthcare as a
percentage of total GDP, accessed October 7, 2012),
http://databank.worldbank.org/ddp/home.do?Step=1&id=4.
World Health Organization, "WHO Infectious Diseases Report." Last modified 1999. Accessed
April 21, 2013. http://www.who.int/infectious-disease-report/pages/ch1text.html.
Yadav, Prashant. MIT-Zaragoza International Logistics Program, "Differential Pricing for
Pharmaceuticals." Last modified August 2010. Accessed April 21, 2013.
http://apps.who.int/medicinedocs/documents/s18390en/s18390en.pdf.