generic environmental impact statement on animal
TRANSCRIPT

Generic Environmental Impact Statement on AnimalAgriculture in Minnesota
Final Technical Working Paper
on
Topics D, E & F: Economic Structures, Profitability& External Costs
Submitted to the Minnesota Environmental Quality Board
June 29, 2001
Project Leader: William F. Lazarus, Associate Professor and Extension EconomistDepartment of Applied Economics
University of Minnesota(612)625-8150

Final TWP, Economics of Animal Agriculture July 2001
- 1 -
Table of Contents
Revisions to the Economics TWP Based on Comments Made at the June 12, 2001 Meeting of theGEIS Citizens Advisory Committee
About the Authors Listed on Sections of the Economics Technical Working Paper
I. Executive Summary
II. Current Situation and Recent History: Geographic Distribution and Size of Enterprise inMinnesota Animal Agriculture
III. Forces Affecting Structural Change in the Minnesota Livestock Industry
IV. Phosphorus Balance in Minnesota Feedlot Permitting
1) Policy Recommendations
V. Literature Review Update
1) Industry Structure and Competitiveness, and Profitability and Economic Viability
2) Regional Economic Impacts of Animal Agriculture
3) External Costs and Benefits
VI. Appendices
Appendix A: Primer: Introduction to Measures of Regional Economic Impacts
Appendix B: Regional Input-Output Models: A Non-Technical Explanation
Appendix C: "Externalities", reprinted from the Encyclopedia of Economics

Final TWP, Economics of Animal Agriculture July 2001
- 2 -
Revisions to the Economics TWP Based on Comments Made at the June 12, 2001Meeting of the GEIS Citizens Advisory Committee
by William F. Lazarus
July 5, 2001
Question: How do you reconcile the comment made that dairy should remain strong in theMidwest, with recent declines in cow numbers in Minnesota?
Response: This is discussed on page III-13. The statement that dairy should remain strong is aprediction from the Purdue materials. Like all predictions, it may or may not prove accurate overtime. A footnote was added acknowledging the recent declines, which do appear to be slowingcompared to the mid-1990s.
Question: Do the FINBIN swine and dairy enterprise costs and returns discussed on pages V-1-105 to V-1-143 (Tables 25-39) include manure value?
Response: (The following paragraph was added to the discussion of Table 25) The FINBINswine and other livestock enterprise data probably does not include much if any value for themanure. The issue of valuing manure has not been discussed to any great extent among theinstructors and fieldmen, so there is no effort at present to encourage producers to value theirmanure. There is a place to enter "other income" in the computer program, and it is possible thatsome producers may enter manure values, but the averages for other income in 2000 ranged fromone cent per hundredweight for farrow-to-finish to 19 cents per hundredweight for feeder pigfinishing. Nineteen cents represents 0.6 percent of the total $32.40 gross return for thatenterprise. If manure is currently under-valued (which we do not know for sure) and its truevalue were entered, it is unclear how the change would affect the conclusions made in this paperabout risk-return tradeoffs and economies of size. A detailed study would be required to arrive atper-unit manure prices based on crop needs or sale possibilities. If an attempt were made tomore accurately account for manure value, care would also be needed to accurately account forrelated manure handling costs.
Question: Explain the definition of the term "economic inefficiency" as it is used in the firstparagraph and later in the "Externalities" section from the Encyclopedia of Economics, in theAppendix.

Final TWP, Economics of Animal Agriculture July 2001
- 3 -
Response: The Encyclopedia of Economics does not include a definition of economic efficiencyas a separate topic, but the reprinted "externalities" section does include several citations,including Coase's 1960 article, "The Problem of Social Cost" in the Journal of Law andEconomics. Coase's complete explanation is too lengthy to include here, but the basic idea mightbecome clearer by picturing a hypothetical, highly simplified situation where a widget-makingfirm is causing pollution which damages a neighbor's property. One scenario is that the firmignores the damage it is causing the neighbor. Its marginal production costs per unit tend toincrease if it expands production, so under perfect competition it will maximize its profit whereits marginal cost per additional unit equals the price it receives from selling the product. Suppose this profit-maximizing production level is ten widgets/day. If the firm increases ordecreases production, the amount of pollution increases or decreases as well.
This is compared to another scenario 2 where (ignoring measurement difficulties) we arrive at aset of dollar amounts that the neighbor is willing to accept in return for putting up with thedamage resulting from different amounts of pollution. Suppose that producing eight widgets/daycauses no pollution, but the ninth widget causes damage for which the neighbor is willing toaccept a payment of $1/day. A production level of ten widgets causes more pollution, so theneighbor would demand an additional $3/day for the additional damage caused at a ten-widgetlevel. Suppose also that the firm's profit is $2/widget on each of the ninth and tenth widgetsproduced/day. If required to pay $3, the firm will no longer find it profitable to produce the tenthwidget/day, so it cuts production to nine/day, pays the neighbor $1/day, and still makes a $1profit on the ninth widget.
So, in short, the ten-widget production level in scenario 1 is economically inefficient because theneighbor is willing to pay $3 to avoid the pollution of the tenth unit while the firm is only earning$2 in profit by producing it. A (mythical) social planner trying to maximize the sum of the firm'sprofit and the neighbor's well-being could improve that sum by implementing some sort of policythat reduces production to nine widgets, possibly by requiring the firm to pay as in scenario 2. Iffaced with the prospect of paying the $3 for damage, the firm is better off by cutting productionand losing $2 in profit, while the neighbor is indifferent between receiving the $3 or avoiding theadditional damage. Producing the ninth widget and paying $1 in damage is economicallyefficient from a social perspective, on the other hand, because again the $1 makes the neighborindifferent to the damage while the firm makes $1 in profit.
Analysis of a real situation typically involves other issues that are beyond the scope of this briefexplanation. One issue that Coase discusses is how the outcome would differ if 1) the firm isgranted a "right to pollute" and has to be bribed by the neighbor to cut back, versus 2) where theneighbor is granted a "right to avoid pollution" and has to be bribed by the firm to accept thepollution. One source for further information is a book edited by Bruce A. Ackerman, EconomicFoundations of Property Law. Boston: 1975, published by Little, Brown and Company. Itcontains a reprint of the Coase article and a number of related papers.

Final TWP, Economics of Animal Agriculture July 2001
- 4 -
Question: Why wasn't government policy included in the list of four over-riding forcesmentioned in the "Forces" section of the presentation: information technologies, globalization,tightly coordinated supply chains, and public skepticism? Promotional activities aimed at largefarms was mentioned specifically.
Response: Government policy is very important, and is mentioned in the paper. It was notmentioned in the talk as one of the four over-riding forces partly because it was felt that theforces mentioned tend to influence the directions policies take, so that policy is in reaction to theother forces rather than being a separate, independent force. An example is, at least inFriedman's view, globalization increases the cost of protectionist trade policy and pushesgovernments toward more free-market policies. There are many points of view, of course, onwhat influences policy. The paper did explore state promotional activities in detail. They areprobably important in certain circumstances, especially in the short run, but we would argue thatthey are less important to the long-run prosperity of the livestock industry than are the policiesmentioned (environmental, industrial organization, trade and commodity price and incomesupport policies).
Question: (There were a number of questions and comments about new technologies that mayreduce the excess phosphorus quantities estimated in section IV. They did not seem to bequestioning what is in the research itself, but rather calling for additional follow-up research. That follow-up research is beyond the scope of the current project, however.)
Question: Why are swine and dairy farms going out of business more rapidly than other farmtypes, while Table 18 (on page V-1-91) shows that these two farm types earned higher rates ofreturn on equity than did the other types?
Response: (See added text on page V-1-90.) Consolidation is taking place in all farm types. Table 1 on page V-1-13 shows that the total number of farms in Minnesota declined from 86,000in 1993 to 81,000 in 1999. Farms with milk cows and hogs are declining more rapidly than othertypes, however. The short answer to the question is, we don't know. Speculation is hazardous,but we can speculate about several reasons. The low returns that the hog farms experienced in1998 were certainly one factor. We also know that many farm operators and household membershold off-farm jobs. The farms also serve as rural residences and provide value to the householdsthat justify owning the farms even if rates of return are less than alternative investmentopportunities would provide. The other farm types shown in Table 18 are beef and crop farms,which are more likely to be part-time operations because farm labor demands are less intense. Thus, operators of many of these crop and beef operations may put up with the lower returnsbecause they have off-farm income and the farms have value as residences. Also, it was pointedout that the non-farm labor market has been tight in recent years. A farm operator consideringwhether or not to continue may tend to compare their returns not to other farm types but rather to

Final TWP, Economics of Animal Agriculture July 2001
- 5 -
what they can earn in an off-farm job. Perhaps dairy and hog farm operators have been morelikely to obtain off-farm jobs because they are located closer to urban areas or because of skilldifferences. Finally, keep in mind that these rates of returns are from the farms that haveremained in business. Rates of return of the farms that exited may have been lower than for theones that have remained.
Question: How promising are alternative livestock production systems?
Response: In short, dairy grazing systems may have potential under proper management and at asize adequate to provide for family living expenses. Anecdotal evidence suggests that there aregrazing dairies in Minnesota that are doing well, although on average the (self-identified) grazingdairies in the FINBIN record database achieved per-hour returns somewhat lower than otherdairies. It was mentioned that there is a learning curve involved in switching from aconventional to a grazing dairy, and that performance of grazing dairies has improved in recentyears, although the record database is inadequate to show that improvement at this time. Also, asthe adage goes, "Not everything that counts can be counted," and there may be advantages toalternative systems in terms of flexibility, community cohesiveness, and sustainability that wecan not measure with confidence at this time. The potential for alternative swine systems doesnot appear quite as promising as for grazing dairies at this time unless significant marketpremiums are possible.

Final TWP, Economics of Animal Agriculture July 2001
- 6 -
About the Authors Listed on Sections of the EconomicsTechnical Working Paper
(listed here in alphabetical order)
Steffanie Guess-Murphy is Ph.D. Student in the Department of Applied Economics, Universityof Minnesota. Co-authored section VB, "Regional Economic Impacts of AnimalAgriculture."
Dennis R. Keeney, Ph.D. is Professor Emeritus in the Department of Soil Science and formerdirector of the Leopold Center, Iowa State University. Co-authored section IV,"Phosphorus Balance in Minnesota Feedlot Permitting."
William F. Lazarus, Ph.D. is Associate Professor and Extension Economist in the Departmentof Applied Economics, University of Minnesota. Authored section II, "Current Situationand Recent History: Geographic Distribution and Size of Enterprise in Minnesota AnimalAgriculture," section III, "Forces Affecting Structural Change in the Minnesota LivestockIndustry," and section VA, "Literature Review Update: Industry Structure andCompetitiveness, and Profitability and Economic Viability."
Richard A. Levins, Ph.D. is Professor and Extension Economist in the Department of AppliedEconomics, University of Minnesota. Co-authored section IV, "Phosphorus Balance inMinnesota Feedlot Permitting."
George W. Morse, Ph.D. is Professor in the Department of Applied Economics, University ofMinnesota. Co-authored section VB, "Literature Review Update: Regional EconomicImpacts of Animal Agriculture."
Carl V. Phillips, M.P.P., Ph.D. is Visiting Fellow with the Minnesota Center for Philosophy ofScience, University of Minnesota. Authored section VC, "Literature Review Update: External Costs and Benefits."
Joseph G. Schimmel is Nonpoint Source Information & Education Coordinator, University ofMinnesota Extension Service and Minnesota Pollution Control Agency. Co-authoredsection IV, "Phosphorus Balance in Minnesota Feedlot Permitting."

Final TWP, Economics of Animal Agriculture July 2001
- 7 -
I. Executive Summary
Current Situation and Recent History: Geographic Distribution and Size ofEnterprise in Minnesota Animal Agriculture
Farms are consolidating and changing the ways in which they acquire resources and managerisks. The total number of U.S farms peaked at 6.8 million farms in 1935. By 1997, only 1.9million remained. Average acres per farm increased from 155 acres in 1935 to 487 acres in 1997.Most U.S. farms are organized as single proprietorships. Family and non-family corporationswere 4 percent of the farms in 1997 but had 29 percent of the gross sales. Land leasing haschanged from a way for beginning farmers to enter agriculture to a way of gaining access toadditional assets. This allows farmers to avoid debt and risks associated with ownership, and tobe able to respond more quickly to changing market conditions. Farmers have become morereliant on production and marketing contracts over the past 40 years. Eleven percent of U.S.farms had at least one marketing contract, but these farms accounted for 40 percent of the grosssales. Farm operator households typically receive income from several sources, and 88 percentof their household income came from off the farm in 1997. The relative importance of off-farmincome varies widely among different farm types.
The major shifts in the Minnesota livestock industry in the 1990s are that cattle and sheepnumbers are down while hogs, layers, and turkeys have shown growth. Consolidation oflivestock production onto fewer farms is very evident in the hog and dairy farm numbers. Thenumber of operations with hogs declined by 46 percent between 1993 and 1999, while dairyoperations declined by 33 percent over that six-year period. The number of sheep operations wasdown 44 percent over the same time frame. Minnesota has been losing national market share inbeef cow-calf and cattle feeding operations, while our pork industry share is increasing. Notmuch change is evident in the number of cow-calf operations, while the number with cattle onfeed declined by eight percent from 1993 to 1998.
Forces Affecting Structural Change in the Minnesota Livestock Industry
Four over-riding forces that seem evident from this discussion are: 1) information technologieswhich increase the span of control of managers, making larger farms and other businessesfeasible, and are also a major factor underlying globalization of finance and trade, 2)globalization, which presents new export opportunities for Minnesota farmers but also increasesmarket volatility, 3) evolution of the food system into more tightly coordinated supply chainswhich challenge the historical leadership role and independence of farmers, and 4) publicskepticism about science, technology and globalization, which may act as a counterweight thatslows the industrialization of the food system, and at the same time may present marketopportunities to astute producers who can tailor their production and marketing to their demands.
Final TWP, Economics of Animal Agriculture July 2001
- 8 -
Driving forces differ among the dairy, hog/pork, beef, and poultry sectors. Dairy has historicallybeen one of the more-protected agricultural sectors in many nations, so trade liberalization meansthat exports and imports could play an increasing role in domestic milk price movements. Foodsafety and quality concerns, constraints on western water supplies, and new on-farm technologiesfavor a shift toward a Midwestern dairy industry of larger operations that have closer vertical tiesto the rest of the supply chain. The pork industry has largely already made that transition. It mayface the widest array of policy challenges of any of the species, with environmental, animal well-being, worker safety, and concentration and control all being areas of policy concern. The beefindustry faces unique challenges due to its more segmented and dispersed structure. Continuedattempts to improve efficiency by better coordination of the entire beef production chain areexpected. The poultry industry is affected by many of the same forces affecting the other species,but export markets may be more important in the case of poultry.
Policies that can at least potentially affect livestock industry structure are many and varied. Those policy areas most often mentioned in that regard include environmental policy, industrialorganization policies, international trade, commodity price supports, access to farm credit, landuse and urban sprawl, intellectual property protection, subsidies for research and education, taxpolicy, economic development, transportation, immigration, and energy policies.
Phosphorus Balance in Minnesota Feedlot Permitting
An analysis of 3,907 permitted feedlots in Minnesota over the years 1980-2000 shows that thelarger a feedlot becomes, the less likely it is to have enough available land to make good use ofall the P produced by animals on the farm. Further analysis of the data indicates that the problemis not having more animals per se. Rather, the problem is with the ratio of animal units per acre. For each increase in density of one animal unit per acre, surplus P increases by 78 pounds peracre. Larger farms, in general, tend to be more densely populated with animals and thereforehave more surplus P.
At least half of Minnesota’s permitted feedlots are building P levels in surrounding fields. Larger feedlots, on average, have much higher levels of P build-up than do smaller feedlots. Should the GEIS Citizens Advisory Committee determine this P build-up threatens water quality,some difficult decisions must be made. It is clear that if Minnesota wishes to avoid high P soilsin areas that have high levels of animal production, it must devise a permitting process thatlowers the animal density on many feedlots.
Final TWP, Economics of Animal Agriculture July 2001
- 9 -
Literature Review UpdateINDUSTRY STRUCTURE,COMPETITIVENESS, PROFITABILITY AND VIABILITY
This updated literature review combines the original literature review completed in 1999 withnew literature that has become available since that time. It is organized in the same manner asthe study questions laid out in the GEIS scoping document. Topic D covers the dimensions ofthe Minnesota livestock industry, including the numbers, locations, and nature of feedlots; thebusiness structures used by livestock operations; the ownership and control of livestockoperations; the present market situation; and the competitiveness of Minnesota livestockproducers in national and international markets. Topic E covers the profitability and overalleconomic viability of both livestock farms and livestock processing firms including how they areaffected by such factors as economies of scale, production methods, marketing arrangements, andgovernment policies and programs. Livestock processing firms are discussed under question D4,so the discussion under topic E questions will focus on farms.
Thirty additional research publications, not available for the 1999 Literature Review, areincluded in this paper. The updates have been incorporated into the original document, so thatusers have access to a seamless body of text that has the entire set of material in one place. All ofthe tables of statistical data have been updated with the most recent data available as of early2001. The most significant change in the statistical tables is that the 1998 swine and dairy farmbusiness summary data (old Tables 19 and 27) has been replaced by four-year averages. Thesehave only recently become feasible as a result of a new search engine for summarizing theMnSCU and farm business management association record data. Note particularly that the swineproduction economies of size picture looks somewhat different in the new four-year averagesthan it did in the old 1998 data, which was heavily influenced by the late 1998 hog market"crash". Also, there are now economies of size tables for four different swine enterprise typesrather than just farrow-to-finish.
Several new studies are cited on the link between environmental regulations and enforcement,and livestock industry location. The authors of one study entertain the possibility that therelationship between environmental policy and livestock industry location is a two-way one -environmental policy developments may be a result of past livestock industry growth, as well asdriving future growth, although their regression analysis is inadequate to establish which way thecausality lies. That is, the observed regulatory differences may be in response to the growth of thelarge operations, rather than preceding and influencing their growth.
Relative to market access and choice of business organization - proposed federal regulationsimilar to Minnesota's "Agricultural Contracts" law is discussed. An interesting new analysisfrom USDA-ERS is cited relating to farm vs. non-farm terms of trade. The USDA EconomicResearch Service has also done some interesting analyses recently on terms of trade betweenagriculture and the rest of the economy. Their new material shows the diversity of agriculturemore clearly than in the past.

Final TWP, Economics of Animal Agriculture July 2001
- 10 -
REGIONAL ECONOMIC IMPACTS OF ANIMAL AGRICULTURE
1. None of the studies found provide estimates of the net impacts of changes in the size ofthe livestock industry, after considering potential offsetting effects. In very tight labormarkets, reductions in the livestock industry will release labor which will be used in otherindustries. If those industries contribute more to the state’s gross state product thanlivestock, the net impacts would be positive rather than negative. While we doubt thiswould be the case, none of the current research provides insights on this question.
2. Nearly all of the studies found, although labeled ••impact studies, were descriptivestudies that traced the economic linkages between livestock and other sectors. Whilethese studies can show the economic importance of the sector, the data they provide cannot be used to estimate the net impacts of a change in the livestock industry.
3. Studies of the impacts of livestock or livestock processing that use a with/withoutapproach, comparing changes between economic variables in a given community and in•any twin communities have to be very careful in selecting the twins. We found nostudies that reported on the characteristics of the twins in sufficient detail that we couldbe confident that the livestock plants caused the changes noted.
4. The literature on whether small farmers buy more locally than large ones yields mixedresults. An early study suggested that the percent of local purchases was lower for largefarms but that the total amount was as high as for small farms. A more recent studyshows that generally the small farms do buy more within their county but buy almost allof their inputs within the state.
5. The local employment and income impacts of larger pork farmers are higher than smallones when the survival rate is considered. If it were possible to keep all small farms inoperation over time, they would contribute more to the local economies. The quality ofjobs, in terms of wages per worker, was higher for large pork farms whether or notsurvival is considered.
6. Meatpacking plants provide benefits to local farmers but the wages paid are considerablylower than the average manufacturing wage. These wages have fallen greatly over thepast decade as the meat packing plants have moved from urban unionized plants to ruralnon-unionized plants. However, the studies that use a before/after approach to examinethe impacts of these plants are not methodologically correct. Given the changes in thestructure of the industry, the studies would have needed to use a carefully designedwith/without approach.
Final TWP, Economics of Animal Agriculture July 2001
- 11 -
7. Presumably the labor in the meat packing plants are better off than their next bestalternative employment or they will not stay. Many workers do not stay with turn overrates being high. However, if the plants are able to find employees, the current ones mustbe better off than they would be in their next best alternative. The impacts on the socialaspects of the community are less clear but beyond this part of the report.
8. Meatpacking and poultry processing is moving to fewer big plants in remote rural areas.This reduces the odds that communities can use this as a development strategy. However,if the community is remote enough and other alternative jobs are scarce these plants canhave a positive impact.
9. Wages appear to be competitive in the livestock production, after controlling for skillsand regional differences. However, the research base for this conclusion is very thin.
10. The public sector fiscal impacts of livestock operations appear to be positive. Again, theresearch base for this is very preliminary and needs much greater attention. Further, thisresearch does not tell us what would happen if the size of the livestock sector changed ina community or region.
11. Research on the impacts of farm size on poverty has used either the comparable areaapproach or a variation using multiple regression analysis. The most comprehensivestudy found rural poverty rates were influenced most by social relations and economicstructure of the region and least by the size of farms.
12. In order to evaluate the trade-off between economic benefits and environmental or socialcosts of livestock production, changes have to be studied at the community or regionallevel. Studies done in other regions can not be extrapolated onto a local economy sincethe regions are likely to have different economic structures. Consequently, the same typeand size of livestock operation will have very different impacts in different types of localeconomies. Similar differences are probably true on the environmental side. The valueof this generic study is in guiding future research rather than in guiding public policy.

Final TWP, Economics of Animal Agriculture July 2001
- 12 -
EXTERNAL COSTS AND BENEFITS
Like the 1999 Report, this update contains no numbers. Two years has not changed the basic factthat the available studies of externalities are limited and subtle, and taking individual numbersout of them, out of context, as if they were scientific constants, remains inappropriate. In theworst case, some of them would be used as if they were The Answer to some interestingquantitative question. The numbers from many of the papers mentioned here would be useful forinforming optimal policy in Minnesota, but not without expert interpretation with specificquestions in mind, something that is beyond the scope of this review. By the same token, incases where specific titles do not stand out, a body of literature is summarized with generalstatements about the output of research in an area.
The concept of economic externalities remains an excellent way to structure thinking aboutagriculture policy in Minnesota. Quantification of those externalities is possible and has beendone to some extent. Those results can be of great use in response to specific policy questions(though they are of little use in a free-form discussion). However, progress toward a grandgeneralizable set of quantifications is not likely to come in time to afford this decade's agriculturepolicy. Indeed, in many ways, increasing doubts about the narrowly-drawn cost-benefit approachamong supporters of economic approaches (let alone opponents of such approaches) suggests thatwe may be moving further from technocratic analyses of complicated policies that affect materialgoods, aesthetic preferences, ethics, and social structures. Cherry picking seems to be the bestpolicy strategy: take the useful structure, take what quantification there is available andstrategically fill in a few gaps, and use the resulting tools and inputs without depending on fillingall the gaps.

Final TWP, Economics of Animal Agriculture July 2001
SECTION II page 14
II. Current Situation and Recent History: Geographic Distributionand Size of Enterprise in Minnesota Animal Agriculture
Overview
Number of Farms, Farm Size, Tenure, Marketing, Farm IncomeFarms are consolidating and changing the ways in which they acquire resources and managerisks. The total number of U.S farms peaked at 6.8 million farms in 1935. By 1997, only 1.9million remained. Average acres per farm increased from 155 acres in 1935 to 487 acres in 1997.Most U.S. farms are organized as single proprietorships. Family and non-family corporationswere 4 percent of the farms in 1997 but had 29 percent of the gross sales. Land leasing haschanged from a way for beginning farmers to enter agriculture to a way of gaining access toadditional assets. This allows farmers to avoid debt and risks associated with ownership, and tobe able to respond more quickly to changing market conditions. Farmers have become morereliant on production and marketing contracts over the past 40 years. Eleven percent of U.S.farms had at least one marketing contract, but these farms accounted for 40 percent of the grosssales. Farm operator households typically receive income from several sources, and 88 percentof their household income came from off the farm in 1997. The relative importance of off-farmincome varies widely among different farm types.
Terms of TradeTerms of trade between agriculture and the rest of the economy are a longstanding policy issue.Past discussions of terms of trade have focused on price parity. Rates of return on assets orequity capital are a better measure of trade terms because rates of return capture technologicalchange over time. Rates of return for Minnesota farms appear low compared to U.S.manufacturing corporations and food processors and retailers, because all manufacturingcorporations averaged around 12 percent return on equity over the ten years, 1991-2000, whilefarms in the Southwestern Minnesota Farm Business Management Association averaged a returnof around seven percent. Data for food processors and retailers were available only for 1990-96. Over that period, food processors averaged a 17 percent return while food retailers averaged 14percent. On the other hand, a recent comparison of U.S. farm households versus households withnon-farm businesses showed a different picture. Median rates of returns in 1997 for the farmswere comparable with the returns of non-farm businesses, when farmland capital gains wereconsidered. Large farms earned greater returns than did the non-farm businesses. The non-farmbusinesses also experienced more volatility in returns.

Final TWP, Economics of Animal Agriculture July 2001
SECTION II page 15
LivestockThe major shifts in the Minnesota livestock industry in the 1990s are that cattle and sheepnumbers are down while hogs, layers, and turkeys have shown growth. Consolidation oflivestock production onto fewer farms is very evident in the hog and dairy farm numbers. Thenumber of operations with hogs declined by 46 percent between 1993 and 1999, while dairyoperations declined by 33 percent over that six-year period. The number of sheep operations wasdown 44 percent over the same time frame. Minnesota has been losing national market share inbeef cow-calf and cattle feeding operations, while our pork industry share is increasing. Notmuch change is evident in the number of cow-calf operations, while the number with cattle onfeed declined by eight percent from 1993 to 1998.
Hogs
CompetitivenessMinnesota and the rest of the Upper Midwest appear to be strong world competitors in porkproduction. Studies show inconsistent results about the Upper Midwest's competitiveness versusthe southeastern states. Recent cost and return estimates from the USDA Economic ResearchService show an advantage for the Southern Seaboard region over the Heartland region in 1999,in contrast to other studies which showed the U.S. and Canadian plains states and regions ashaving the lowest costs. The Canadian prairie provinces, Argentina and Brazil are the maincompetitive threats that have been identified that could challenge the U.S. in world trade.
ConsolidationNationally, consolidation of the pork industry is continuing. The changes are occurring primarilyin the largest and smallest groups of producers. The largest operations are gaining the greatestmarket share and the very smallest are showing the greatest loss. There were 18 operationsmarketing 500,000 or more pigs per year in 1997, representing 24 percent of total U.S. slaughter. At the other extreme, five percent of U.S. hogs were marketed by approximately 80,000 farmsselling fewer than 1,000 hogs annually.
The 7,500 Minnesota operations with hogs in December 1999 is down by almost half from thenumber with hogs in 1993. There were 17 percent more hogs and pigs on Minnesota farms inDecember 1999, compared to December 1992. The pig crop also increased since 1993, but boththe pig crop and December inventory saw declines between 1998 and 1999.
Production Enterprise TypesAn analysis of the swine enterprises participating in the Minnesota State College UniversityFarm Business Management Program and the Southwestern and Southeastern Minnesota FarmBusiness Management Associations (MnSCU-FBMA) over the four years 1996-99 shows thatswine production is moving rapidly away from farrow-to-finish toward systems where pigs arefarrowed in a separate enterprise, in large, centralized sow units and often located outside of

Final TWP, Economics of Animal Agriculture July 2001
SECTION II page 16
Minnesota. In 1996, half of the hogs sold came from farrow-to-finish enterprises while only 25percent were sold from that type of enterprise in 1999. The number sold from wean-to-finishenterprises tripled, from 4 percent to 12 percent, over the four years, while the number inproduction contract enterprises rose from 13 percent to 31 percent. Independent finishing offeeder pigs has held steady at about one-third of the total marketings, but these finishingenterprises have declined in number and increased in size. Inshipments of pigs into Minnesotawere 23 percent of marketings in 1999. These inshipments were triple the 9 percent share ofmarketings in 1995, five years earlier.
Production VolumeDespite the decline in the number of farrow-to-finish enterprises, they are still providing abouthalf of the total net returns generated by these swine enterprises. It is notable that more hogswere transferred from the contractee enterprises in 1999 than were sold from the farrow-to-finishenterprises, and nearly as many as from the feeder pig finishing enterprises. Despite the volume,the contractee enterprises contributed markedly less to the operations' net returns over the fouryears than did the other enterprises.
Financial PerformanceSpecialized Minnesota hog farms suffered significant financial losses in 1998 after two goodyears in 1996 and 1997. A modest level of profitability returned in 1999, but debt is still athigher levels than before the downturn. These financial stresses have accelerated theconsolidation and production system changes that were already underway in the mid-1990s.
The decline in farrow-to-finish and independent feeder pig finishing enterprises and theincreasing numbers of wean-to-finish and contractee enterprises may be at least partiallyexplained by their relative financial performance. Wean-to-finish enterprises have been riskierbut more profitable than contractee enterprises were over the four years, but both offeredadvantages over the more traditional farrow-to-finish and independent feeder pig finishingenterprises. Hourly earnings of the wean-to-finish enterprises averaged higher over the four yearscompared to the farrow-to-finish and independent feeder pig finishing enterprises, with lowerrisk as measured by the standard deviation of annual returns.
The contractee enterprises provided the lowest average hourly earnings, more than two dollarsper hour less than for farrow-to-finish and independent feeder pig finishing, but did notexperience the losses that the others suffered in 1998. Aside from the lower variability of annualreturns, other explanations that have been put forth for the increasing popularity of contracteeenterprises are the minimal skill required to manage finishing animals compared to a breedingherd, management assistance provided by contractors, and ease of financing due to the reducedincome variability.

Final TWP, Economics of Animal Agriculture July 2001
SECTION II page 17
Independent feeder pig finishing is a high risk enterprise. In 1996 the largest size group averageda return of $88 per hour, but lost money at a rate of $32 per hour in 1998.
SizeAverage size has been increasing for all of the enterprise types, so that the total number of hogssold or transferred from these farms is up 42 percent. Much of this increase was in contracteefinishing with reduced per-unit labor requirements and returns, however. The combination ofgreater volumes but lower per-unit returns has left aggregate net returns for the group of farmsabout the same as it would have been if volume had stayed at 1996 levels but was all produced infarrow-to-finish enterprises. The number of independent feeder pig finishing farms in the largestsize categories (2,501-5000 and over 5,000 marketed per year) increased over the four years1996-1999, while the numbers in the smaller size groups declined.
The number of farms with wean-to-finish enterprises increased over the three-year period 1997-99 in all of the size categories for the wean-to-finish and contractee enterprises. For the farrow-to-finish enterprises, the number of farms increased only at the largest (over 1,000 litters) sizeeven though the hourly returns were over $12 in the two smaller size groups.
Labor EfficiencyThe difference in labor efficiency among the different swine enterprises is apparent. The laborrequirement for the farrow-to-finish enterprises was more than twice as much as for finishingfeeder pigs and for the wean-to-finish enterprises. This difference in labor is to be expected as thefarrow-to-finish enterprises involve managing the sow herd, but the net returns have arguably notbeen adequate to compensate for the added labor. The added labor for wean-to-finish comparedto finishing feeder pigs also makes sense in that wean-to-finish involves starting with youngeranimals.
The contractee enterprises appear markedly more labor efficient than the other enterprises, withless than half as much labor per pig compared to independent finishing of feeder pigs, althoughthe largest feeder pig finishers were about as efficient as the contractees. Part of the reduction incontractee labor may be due to the fact that the contractors provide management functions suchas marketing, acquisition of feed and other inputs, and general supervision. Still, the contractee-contractor system of swine production is around twice as labor efficient as with the otherenterprise types. The flip side of this labor efficiency improvement of course is that theemployment potential of the swine industry is declining.
Economies of SizeThe presence of economies of size in pork production was evaluated by comparing the costs andreturns across the size categories for the four major swine enterprises on the MnSCU-FBMAfarms in 1996-99. The data was averaged across the four years in order to minimize the effects ofyear-to-year random variation and cycle effects, especially with regard to the unusual economicsituation in late 1998 and early 1999. The MnSCU-FBMA swine operations are probably similar

Final TWP, Economics of Animal Agriculture July 2001
SECTION II page 18
to the overall Minnesota and north central U.S. swine industry, except that the "mega" operationsmarketing 500,000 or more per year are not represented and operations marketing less than 1,000per year are under-represented. Economies of size were not evident in the farrow-to-finishenterprises, perhaps because of recent disease problems in the largest operations. Economieswere much more apparent in the other enterprise types.
For the enterprises other than farrow-to-finish, minimum enterprise sizes required to achieveearnings of $10 per hour appear to be 2,500 hogs marketed per year for independent feeder pigfinishing and wean-to-finish, 2,500 pig spaces for contractees (around 7,000 finished per year), or200 litters for farrow-to-finish. In independent feeder pig finishing, the "over 5,000 marketed peryear" group was twice as labor efficient at 0.11 hours per head as was the "2,501-5,000" sizecategory, and as a result averaged $37 per hour over the four years 1996-1999.
Dairy
CompetitivenessMinnesota’s share of the national milk market has declined from 8.3 percent in 1960 to 5.9percent in 1998. Minnesota has dropped in ranking from third in 1960 to fifth in 1998. Nationallythere has been a shift in where milk is produced. The greatest gains in market share have comein the western states. California has increased its market share by a factor of more than 2.5 since1960 and is still growing. Pennsylvania, Michigan, and Vermont have tended to hold their marketshare, while the rest of the Northeast and Midwest has declined. States losing market share havebeen in the more traditional dairy areas - Wisconsin, Minnesota, Iowa, Illinois, Ohio, New York,Missouri, and Kentucky. These traditional areas tend to be made up of herds less homogenous inthe way they are managed and operated with smaller herd sizes, and more diversified operationsthat grow a major portion of the feed supply that is marketed as milk.
The shifts in market share are at least partly explained by cost differences. The USDA regionalproduction cost and return estimates for milk production for 1998 and 1999 show the Pacificregion to be the low cost-of-production region. Total economic cost of producing milk in theUpper Midwest region, which includes Minnesota, was $0.45 per cwt. of milk above the nationalaverage in 1999. The major cost differences in the Upper Midwest region are feed costs that are$0.73 per cwt. lower than the national average, but higher capital costs, higher unpaid laborcosts, and somewhat higher overhead, taxes and insurance. These estimates are limited in thatthey reflect averages for what they consider a single typical dairy for broad regions based onassumed average input costs and returns for the region.
Geographic Shifts in Milk Production Within MinnesotaGeographic shifts in milk production have also been occurring within the state. Minnesota's dairybelt has ranged from the southeastern counties of Houston and Fillmore, up through Winona,Goodhue, Wabasha, Rice, Carver, Wright, Stearns, Morrison, Todd, Ottertail and Becker

Final TWP, Economics of Animal Agriculture July 2001
SECTION II page 19
Counties. The top five milk producing counties are Stearns, Ottertail, Winona, Morrison, andGoodhue. Over time, the exodus from dairying has been more pronounced outside of this regionresulting in a greater geographic consolidation.
Number of Dairy Farms and CowsMinnesota reached a peak of 151,064 dairy farms in 1945. More than 80 percent of the farmssold milk at that time. As of 1999, 11 percent sell milk. Dairy herd numbers were at 9,100 or 12percent of the farms in 1999. Cow numbers have dropped from a high in 1945 of 1,660,000 to540,000 in 2000. Dairy cow numbers declined by eighteen percent between 1993 and 2000, butthe rate of decline appears to be slowing. The dairy cow density on agricultural land has sharplydecreased from one cow for every 19 acres in 1945 to one cow per 54 acres in 1998.
Herd SizeThe structure of the Minnesota dairy industry has experienced dramatic changes in productivity,herd size growth, reduction in total cows and herds, and a dramatic reduction in the number ofmilk processing plants. Dairy farms are restructuring to larger, more specialized farms that aremulti-person owned and operated, on a relatively smaller land base with greater verticalintegration with the market and input sectors, and more diversity in size and productionprocesses. Average herd size in Minnesota has increased from 11 to 58 cows per herd between1945 and 1998. The number of small and medium herd size categories are decreasing mostrapidly and the two largest herd size categories, above 200, cows are increasing in number in the1990s. The average herd size nationally is 79 cows per herd. The number of dairy enterprises ofless than 100 cows has been declining in Minnesota farm business summary programs. Theenterprises in the 101-200 cow group and the 201-500 cow group increased over the four years1996-1999.
ProductivityProductivity per cow has increased threefold between 1945 and 1998. Minnesota ranks sixteenthnationally in production per cow. Minnesota produces more than three times the amount of milkconsumed in the state. Only about 15 to 18 percent of the total milk produced is consumed asfluid milk. The rest is processed into manufactured dairy products such as cheese, dry milk andbutter and ice cream. In the 1970s and early 1980s, Minnesota was a national leader in butter,dry milk powder, and ice cream production. The industry has converted to cheese in response tochanging consumer demands (Conlin 1995b), and almost 70 percent of Minnesota's milk wasmade into cheese in 1997.
IncomeMilk sales are typically the largest generator of farm income in the state, ranging between 18 and22 percent most years. Minnesota farm business summaries provide an indication of the degreeof financial risk and economies of size in dairying and swine production over the four-yearperiod 1996-99. For specialized dairy farms, the worst of the four years was 1997 when net farmincome declined 25 percent from a year earlier, but net farm income averaged nearly the same

Final TWP, Economics of Animal Agriculture July 2001
SECTION II page 20
over the four years as for the swine farms and was less variable. Non-farm income has remainednearly constant on the dairy farms, in contrast to the sharp increase on the swine farms.
ReturnsDairy farm returns on assets and on equity were higher on average in the late 1990s than forswine, and the dairy farms ended with a lower debt-to-asset ratio and better liquidity (highercurrent ratio and term debt coverage ratio). Net return per cow was positive in all size groups,and did not increase with size beyond the 51-100 cow size. There is a marked improvement inlabor efficiency as size increases. Net returns per hour varied from $11.21 for the smallest 1-50cow size to $24.20 for the largest 201-500 cow size.
Alternative Grazing SystemThe most popular alternative dairy system in Minnesota is one that relies on grazing to varyingdegrees as opposed to conventional systems that rely totally or mainly on mechanically harvestedfeeds. The grazing dairies had smaller herd sizes, averaging 48 cows. The majority fell in the 1-50 cow group with a few in the range of 51 to 100 cows. The grazing dairies produced less milkper cow, but also incurred lower feed costs and total expenses per cow. The grazing dairiesearned less per hour than the overall averages, however. The grazing dairies' net return per cowwas less than the average for all sizes and slightly less than for conventional dairies in the 1-50cow size. The grazing dairies earned less per hour than the overall averages.
Beef, Sheep and Poultry
There were 15,800 Minnesota operations with beef cows and 2,700 with sheep in 1999. Operations with cattle on feed numbered 7,400 as of 1998. Structural change in the Minnesotabeef, sheep, and poultry sectors has been relatively minor compared to what is occurring in swineand dairy. Numbers of sheep and lambs are down by almost a third since 1993, although theJanuary 2000 inventory has started to rebound with a 6 percent increase. Cattle on feed have alsorebounded a bit over the past two years, which would be expected given the low feed prices. Beefcow numbers seem to be on a fairly steady downward slide over the period.
Turkey production has grown since the early 1993, but appears to have leveled off in the pastyear at around 43 million birds raised annually. The number of laying hens is also up by 1.3million. Nationally, contract broiler farms were in fair financial condition in 1995, with averagenet farm incomes of $15,969 which was less than half of the average $38,966 earned by otherfarms. While the broiler farms had lower incomes, they also had less invested in the businessthan did other farms, and worked fewer hours on the farm.

Final TWP, Economics of Animal Agriculture July 2001
SECTION III page 21
III. Forces Affecting Structural Change In the Minnesota LivestockIndustry
by William F. Lazarus
EXECUTIVE SUMMARYFour over-riding forces that seem evident from this discussion are: 1) information technologieswhich increase the span of control of managers, making larger farms and other businessesfeasible, and are also a major factor underlying globalization of finance and trade,2) globalization, which presents new export opportunities for Minnesota farmers but alsoincreases market volatility, 3) evolution of the food system into more tightly coordinated supplychains which challenge the historical leadership role and independence of farmers, and 4) publicskepticism about science, technology and globalization, which may act as a counterweight thatslows the industrialization of the food system, and at the same time may present marketopportunities to astute producers who can tailor their production and marketing to the demands.
Driving forces differ among the dairy, hog/pork, beef, and poultry sectors. Dairy has historicallybeen one of the more-protected agricultural sectors in many nations, so trade liberalization meansthat exports and imports could play an increasing role in domestic milk price movements. Foodsafety and quality concerns, constraints on western water supplies, and new on-farm technologiesfavor a shift toward a Midwestern dairy industry of larger operations that are have closer verticalties to the rest of the supply chain. The pork industry has largely already made that transition. Itmay face the widest array of policy challenges of any of the species, with environmental, animalwell-being, worker safety, and concentration and control all being areas of policy concern. Thebeef industry faces unique challenges due to its more segmented and dispersed structure.
Continued attempts to improve efficiency by better coordination of the entire beef productionchain are expected. The poultry industry is affected by many of the same forces affecting theother species, but export markets may be more important in the case of poultry. Policies that canat least potentially affect livestock industry structure are many and varied. Those policy areasmost often mentioned in that regard include environmental policy, industrial organizationpolicies, international trade, commodity price supports, access to farm credit, land use and urbansprawl, intellectual property protection, subsidies for research and education, tax policy,economic development, transportation, immigration, and energy policies.
The first four policy issues (environmental policy, industrial organization policies, internationaltrade, and commodity price supports) are discussed in some detail in the paper because theyinteract in significant ways with technology, resources, and market conditions. State-levelenvironmental policies appear to be a significant factor affecting where livestock expansionoccurs. Most of the other major producing states appear to be catching up with Minnesota inregulatory stringency, however. Uniform federal regulations on the largest operations may lessenthe importance of state differences in the future. Uniformity in environmental rules may increase
Final TWP, Economics of Animal Agriculture July 2001
SECTION III page 22
the importance of corporate farm and contracting legislation, unless proposed federal legislationis enacted in this area as well. Livestock production is modernizing around the world, soindustry shifts across national boundaries could increase as a concern.
Industrial organization policy has long been a concern of the livestock industry. While livestockproducers tend to focus their concerns on consolidation and performance at the packer level, theacademic literature suggests that developments at the retail level may dictate the future of theoverall food industry. National supermarket chains could develop, and food manufacturers'brands could lose ground to those of the retailers. There are calls for continued antitrustvigilence, but the empirical research tends to show that packer consolidation brings efficiencygains that largely offset the deleterious effects of increased market power. The spot market forhogs is shrinking and is expected to largely disappear in a couple more years, with a "market forcontracts" taking its place. Legislation has been proposed at the federal level and in 16 states toprotect contract growers and producers, along similar lines to Minnesota's "AgriculturalContracts" law but with the addition of language to prevent retaliation against producers whoparticipate in producer organizations.
International trade and trade policies are important to the Minnesota livestock industry. The ideaof "putting a fence" around the U.S. (or Minnesota) and restricting supplies to raise prices will bemore costly than in the past, as Friedman's "Golden Straitjacket" imagery suggests. Importcompetition from low-wage countries may contribute to income inequality in the U.S. generaleconomy. The root cause is probably a technological one with no easy answer other than helpingaffected workers to adjust and providing "income safety net" programs for those who find suchadjustments difficult. A "household income safety net" alternative to the current farm pricesupport program seems appealing in that regard, but would entail a dramatic redistribution ofprogram benefits. It is not likely to be enacted without an acrimonious political debate. Thereport of the 21st Century Commission on Production Agriculture suggests that the income safetynet provisions of the 2002 farm bill are more likely to include a three-part income safety netincluding a fixed baseline payment, a counter-cyclical supplemental payment, and a continuationof the marketing assistance loan program.
Global warming is receiving increased attention. Carbon sequestration policies as a response toglobal warming could have dramatic impacts on Minnesota agriculture. On the other hand,global warming is expected to have both positive as well as negative impacts on crop production. One benefit of worldwide trade liberalization is that it would facilitate shifts in cropping patternsin response to global warming.

Final TWP, Economics of Animal Agriculture July 2001
SECTION III page 23
III.1 FORCES AFFECTING STRUCTURAL CHANGE IN THE MINNESOTALIVESTOCK INDUSTRY
by William F. Lazarus
INTRODUCTIONIn The Lexus and the Olive Tree: Understanding Globalization, Thomas Friedman argues thattrade liberalization since the end of the Cold War a decade ago is the root cause of recent changesin the global economy (Friedman 2000). The "Lexus" in the title refers to the luxury automobile,and symbolizes the new economic opportunities available to countries whose economies nolonger must conform to security interests of one of the two great powers. This new opennessalong with the Internet have allowed investors (the "electronic herd") to buy and sell theirinvestments anywhere in the world, more quickly than ever before. The result is increasedpressure for economic policies that conform to the "golden straitjacket" of global investmentnorms. Countries, states or localities that are willing to put on the golden straitjacket of arerewarded with inflows of investment capital. The new investment capital results in industrymodernization and increased productivity. At the same time, the new freedom ends the formerlyprotected status for local industries, which must also modernize or face extinction. Theseformerly protected local firms face competition not only from products of new competitors, butalso for local capital that can now be invested in global financial markets. The downside is thatthe modernizing, streamlining, and privatization jeopardizes the sense of community androotedness of belonging to a family, community, nation, or religion, symbolized by the "olivetree".
Friedman acknowledges the potential for varying degrees of backlash against globalization, inpart because losses from globalization are often more visible than gains. When workers lose jobswhen a factory closes due to foreign competition, for example, they are more likely to mobilizethan the large numbers of consumers who benefit slightly from the low-priced imported goods. Also, he argues that people often don't understand that globalization is largely a technology-driven phenomenon, not a trade-driven one. He uses as an example a receptionist who lost herjob to a computerized voice-mail system imported from Mexico. If imports from Mexico hadbeen restricted, it is likely that a U.S. source would have soon supplied the voice-mail systemanyway and the job loss would have still occurred.
Others have compared the current economic situation to surfing. A recent editorial aboutmanufacturing layoffs seems equally applicable to agriculture: "Surfers, like workers, do not make the waves. Waves form beyond the horizon and arenearly invisible until they reach the shore. Surfers just pick the best looking ones and ridethem for all they are worth - using their skills, creativity and the best equipment availableto them. When one wave ends - as they always do - surfers pound their way back past thebreakers and wait for the next 'big one'. ... Knowledge, after all, is the single mostimportant asset in a global economy. The recent layoffs, while painful, may provideaffected workers with an opportunity to enhance their skills. In every surfer's career will
Final TWP, Economics of Animal Agriculture July 2001
SECTION III page 24
come the occasional wipeout. But so will the next wave." (Global Economy (Usually)Benefits Valley 2001)
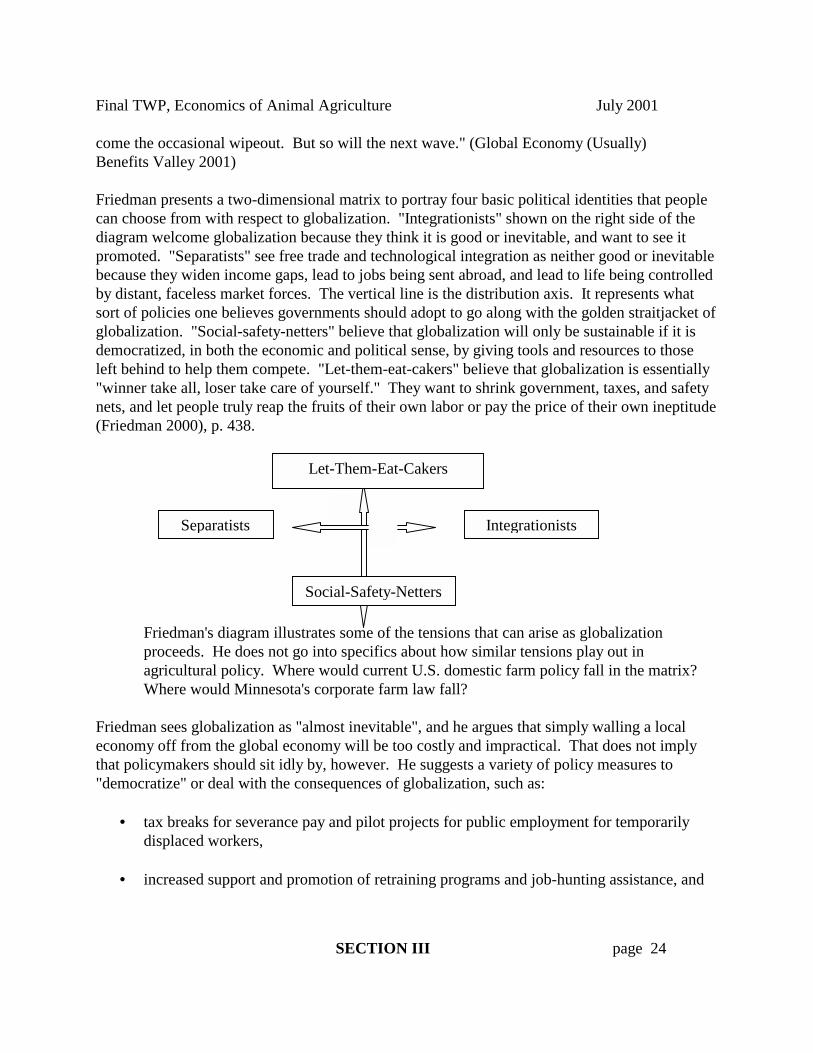
Friedman presents a two-dimensional matrix to portray four basic political identities that peoplecan choose from with respect to globalization. "Integrationists" shown on the right side of thediagram welcome globalization because they think it is good or inevitable, and want to see itpromoted. "Separatists" see free trade and technological integration as neither good or inevitablebecause they widen income gaps, lead to jobs being sent abroad, and lead to life being controlledby distant, faceless market forces. The vertical line is the distribution axis. It represents whatsort of policies one believes governments should adopt to go along with the golden straitjacket ofglobalization. "Social-safety-netters" believe that globalization will only be sustainable if it isdemocratized, in both the economic and political sense, by giving tools and resources to thoseleft behind to help them compete. "Let-them-eat-cakers" believe that globalization is essentially"winner take all, loser take care of yourself." They want to shrink government, taxes, and safetynets, and let people truly reap the fruits of their own labor or pay the price of their own ineptitude(Friedman 2000), p. 438.
Friedman's diagram illustrates some of the tensions that can arise as globalizationproceeds. He does not go into specifics about how similar tensions play out inagricultural policy. Where would current U.S. domestic farm policy fall in the matrix?Where would Minnesota's corporate farm law fall?
Friedman sees globalization as "almost inevitable", and he argues that simply walling a localeconomy off from the global economy will be too costly and impractical. That does not implythat policymakers should sit idly by, however. He suggests a variety of policy measures to"democratize" or deal with the consequences of globalization, such as:
• tax breaks for severance pay and pilot projects for public employment for temporarilydisplaced workers,
• increased support and promotion of retraining programs and job-hunting assistance, and
IntegrationistsSeparatists
Let-Them-Eat-Cakers
Social-Safety-Netters

Final TWP, Economics of Animal Agriculture July 2001
SECTION III page 25
• improved availability of investment capital to the most distressed, low-incomecommunities where private financial markets fail.
THE PROCESS OF CHANGE AND DRIVING FORCESThe "structural change" currently occurring in agriculture includes changes in productcharacteristics, worldwide production and consumption, technology, size of operation, andgeographic location (Boehlje 1999). Food retailing is increasingly more customer-responsive, service-focused, and global in ownership. Input supply and product processingare more consolidated and integrated. Boehlje calls for a refocusing of how industry structureis described. For addressing management questions, structure is often described in terms ofsize, financial characteristics, resource ownership, and technology (see, for example, thediscussion under question D1 below). In order to better understand structural change,Boehlje argues that it is more useful to focus on changes in the ways of doing business. Twoprofound changes in how the agricultural sector carries out its economic and social functionsare: development of supply or value chains, and adoption of biological engineering.
The process of change was described in the 1981 USDA report Structural Change inAgriculture: The Experience for Broilers, Fed Cattle, and Processing Vegetables, based ontransformations that the broiler, fed cattle, and processing vegetable sectors went through inthe 1950s and 1960s (Reimund et al. 1981). That transformation has been described as afour-step process. Forces outside farming trigger structural change, at first to exploit newconditions, and later to manage new risks. New technology, market conditions, and policieslead to 1) technological adaptation, 2) shift to new producing areas, 3) growth anddevelopment, and 4) adjustment to risk. For a brief chronology of U.S. agriculture fromcolonization through the technology boom, see (Hoag 1999).
Two lists of driving forces written sixteen years apart can be found in Reimund et al. and in a1997 Purdue University study (referred to below as "the Purdue report") (Food System 21: Gearing Up for the New Millenium, EC-710 1997). Reimund et al. characterize the drivingforces as falling into three general categories: technological developments, market forces anddemand factors, and policy. Doering et al. refines these basic categories in several ways(Doering et al. 1997). They broaden "technological developments" to "resources andtechnology," which helps draw attention to the fact that new technologies change theefficiency of resource use. Some resources are relatively fixed in extent and exhaustible. Inmany cases, however, new technologies have turned "worthless" areas and materials intovaluable resources as when drainage makes it possible to farm poorly drained soils. From aneconomist's perspective, it is useful to consider resources and technology together.

Final TWP, Economics of Animal Agriculture July 2001
SECTION III page 26
Friedman focused on the global communication capabilities of the Internet, but informationtechnologies are also being used to expand the size of business that one manager cansuccessfully oversee. This increased "span of control" arguably is the underlying forcebehind consolidation of agriculture into fewer, larger farms and the wave of mergers andacquisitions in the broader global economy. The role of information technologies in industryconsolidation is illustrated in a recent Wall Street Journal article, "As Huge Companies KeepGrowing, CEOs Struggle to Keep Pace: Technology and Delegating Help Tame the Barrageof Data, Deals, Decisions" (Murray 2001). Recent trends are summarized as follows:
"By 1999, the average annual revenue of the 50 largest public companies in the U.S.,about $50.8 billion, was 70% higher than it had been just 15 years earlier, even takinginflation into account. More than 50 public companies currently employ more than100,000 workers; in the mid-1980s, only 18 did."
The term "delegating" in the above headline also brings to mind the role of businessmanagement research and education in the increasing size of farms and businesses. When webring young people from the farm to the university and train them in the businessmanagement techniques used by large farms and businesses, we shouldn't be surprised whenthey go back home and put their training to work expanding the size of their farmingoperations. Educational programs often contain the message that farm managers should focuson being "people managers" and delegate the day-to-day labor tasks to others whenappropriate.
The Purdue report also focuses on the international trade component of Reimund's "Marketforces and demand factors." The domestic market is also important, but they argue that themarket has always gone beyond national borders. Strong trade has generally been associatedwith periods of prosperity for American agriculture, and weak trade has paralleleddepressions or recessions in agriculture.
Both reports mention government policy as an important part of the agricultural landscape. In addition to the farm bills focused on prices and incomes, Doering mentions homesteading,conservation, transportation, and land use policy, as well as recent developments concerningmarket structure and concentration, and environmental and food safety regulations.
The Purdue report lists infrastructure development as a fourth major driving force. Infrastructure includes both physical and institutional developments. Transportationsubsidies and water systems for irrigation are examples of U.S. government infrastructureinvestments that have benefited agriculture. The private sector has also invested intransportation, processing, and distribution facilities. The federal government's free landgrants to set up educational institutions are perhaps the most notable institutionalinfrastructure investments. Of course, another aspect of infrastructure is the global financialsystem that Friedman argues is the main force driving globalization.
Final TWP, Economics of Animal Agriculture July 2001
SECTION III page 27
Cooperatives have been another important part of the infrastructure supporting U.S.agriculture. The Purdue report list of forces is then: resources and technology, internationaltrade, infrastructure development, and government policy.
Boehlje uses the term "economic agents" to refer to entities such as business firms whosedecisions affect the economy. Economic agents create or cause changes in the food system inresponse to opportunities offered by the forces described above. Boehlje argues that these(mainly private sector) economic agents are motivated by goals such as economies of sizeand scope, rent appropriation, strategic positioning, financial engineering, supply or valuechain formation, risk management or mitigation, and market power/control exploitation. More specifically, supply chain development is motivated by expected better flow schedulingand resource utilization, increased ability to manage and control quality throughout the chain,reduce risks and especially the risk associated with food safety and contamination throughtraceback, and increased ability to respond quickly to changes in consumer demand for foodattributes. Biological engineering (defined as adoption of process control technology and amanufacturing mentality, especially in production agriculture) is motivated by desires toeliminate the disconnect that has previously occurred at the farmgate in the assembly linefrom genetic material to the retail food store.
A similar discussion focusing on vertical coordination in food supply chains is (Tweeten andFlora 2001). They assert that in the future, tightly coordinated agriculture will becharacterized by clusters with a hub, spoke, and wedge configuration. A livestock-processingplant will be at the hub of the cluster, in close proximity to livestock-feeding operationssupplied by mills drawing grain and oilseed through transportation and communicationspokes delineating crop production "wedges" covering large areas. The nation's landscapewill include a relatively few clusters. Farms in the periphery (wedges) will require less andless labor and other local inputs and thus will provide diminishing social and economicsupport for their own local rural communities. All else being equal, industry-wideproductivity gains decrease aggregate employment and other economic activities in ruralcommunities. Production contracts have decreased farm labor in the aggregate, but havecreated opportunities for contractees in part because lenders are more willing to lend toproducers with risk-reducing multiyear contracts.
While Tweeten and Flora do not go into detail on specific policy recommendations, they dosuggest a number of principles which might help frame GEIS discussions on policies. Thosesuggestions are listed below (paraphrased in the interest of space):
• Allowing operators to choose whichever form of vertical coordination they findadvantageous but relying on the public sector to establish and to enforceenvironmental standards raises real national income while holding down food andfiber costs to consumers.

Final TWP, Economics of Animal Agriculture July 2001
SECTION III page 28
• No universal formula: each community decides which development strategy to use,with state and federal governments establishing environmental ground rules andregulations and by providing information.
• Research and education to improve technology, information systems, riskmanagement, and marketing tools to help family farmers and owners of small ruralfirms.
• Labeling backed by proper standards and enforcement to allow consumers to "vote"by purchasing labeled products with the attributes they desire.
• Local, state, and federal governments should build human capital for alternativeopportunities locally or elsewhere through investment in schools, adult education, andskill building.
• Promote competiton at the federal level through antitrust and other measures.
• Promote market transparency, competition, and efficiency by releasing terms ofcontracts to the public.
The Purdue report suggests an extensive list of forces that are driving change in particular areasof the U.S. economy and the food system. For the general economy, an increasing marketorientation and increasing international trade ("globalization") are key as is the stable monetarypolicy. International trade is discussed in more detail below, but has been influenced by loweredtariffs and trade barriers, dietary transitions in developing countries, and balance of paymentsconstraints.
Another perspective on globalization that has so far not been widely discussed is that it couldhave the effect of reducing the degree of vertical integration in an industry, thus mitigating aissue of considerable concern in the livestock industry, at least in theory (McLaren 2000). Thetheory is more or less implicit in Friedman's anecdotes, but McLaren lays it out explicitly. Thebasic idea is that an input supplier selling to a downstream final goods producer could wait tonegotiate the price of his product until after it is produced, but then risks being "held up" and notreceiving a price high enough to recoup costs. Vertically integrating with the downstream stageeliminates that risk, but has its own disadvantages. If globalization results in opening up moreoverseas markets to the upstream supplier, his risk of being held up is less so there is less need tointegrate.
What are the key aspects of consumer demand that might affect the species mix and productionsystems in the Minnesota livestock industry? Consumer demand is influenced by the agingpopulation, increasing income and wealth, and changing preferences related to health concerns aswell as ethnic shifts. Connor et al. find income is closely related to total food and beverage

Final TWP, Economics of Animal Agriculture July 2001
SECTION III page 29
expenditures, with the richest one-fifth of U.S. households spending more than three times theamount spent by the poorest one-fifth (Connor et al. 1997). They also find that the dominance ofelectronic mass media has given an advantage to food processors with well-known brands,colorful packages, emotionally charged product images, and snappy slogans. They cite researchfindings that only about two percent of U.S. consumers are committed to natural/organic food atany price, but a significant segment of consumers would prefer to purchase foods raised withoutpesticides, antibiotics, and growth hormones. As many as half of all consumers place a value onsustainable agricultural practices. A recent study along these lines is Hurley and Kliebenstein,who compared societal perceptions of and acceptance levels for methods available for managinglivestock odors and manure storage and application (Hurley and Kliebenstein ). Air filtration,natural hog diet additives, and aboveground manure storage were more acceptable than microbialand enzyme manure additives, chemical diet additives, and soil injection of manure. Some of theresults, such as preferences for surface manure application rather than injection, were counter toscientific experts' views. This study, like all ex ante "willingness-to-pay" experiments, is open tothe criticism that consumers' later actual purchases may be different from what they said theywould buy.
Connor et al. also review studies of consumer preference shifts, but find that the research resultsare often not consistent with food consumption data. The aging of the population was found toaffect food choices, to the extent that "adult" versions of certain specific foods grew faster in the1980s than did versions of the same foods aimed at children. Ethnic identity is a strong drivingforce for growth in the food industry, with growth rates of Hispanic and Asian foods higher thanfor other categories. This growth is partially stimulated by immigration and partially by a shift inpreferences by the rest of the population. Mixed results were found for low-calorie or dietversions of foods and beverages, partially due to data problems. Foods with healthy or naturalimages have experienced 50 percent faster growth than foods with less healthy images, althoughresearch on such foods is complicated by changes in consumer perceptions over time. Forexample, in the late 19th century, breakfast cereals were regarded as the ultimate health food,while tomatoes were believed to be poisonous or aphrodisiacs.
Cotterill explains the vertical organization and performance of the food distribution industry interms of the interactions among new technologies, capital markets, and market power (Cotterill2001). Major technological advances in food processing equipment, biological sciences,chemistry, pharmaceuticals, computers, optical scanners, and marketing have lowered the cost ofproduction, created new products, improved quality of older products, and created whole newindustries and market channels. New industries and market channels include the data utilities, A.C. Neilsen and Information Resources, Inc., as well as the artificial insemination industry and thefrozen and chilled food industries. The role of market power is discussed further below in thesection, "Industrial Organization Policies."

Final TWP, Economics of Animal Agriculture July 2001
SECTION III page 30
Friedman uses the olive tree to symbolize the loss of community and rootedness than can resultfrom modernization, streamlining, and privatization of the economy. This loss of communityand rootedness along with public skepticism about science and technology has arguably been afactor in the growth of interest in organic and natural foods and the environmental movement. Johansson traces the origin of the U.S. environmental movement to the mid-19th centurywritings of Ralph Waldo Emerson, David Thoreau and John Muir. Public awareness andconcern over environmental issues became galvanized in the 1960s due to well-publicizedincidents such as the Cuyahoga River in Cleveland erupting in flame, and the publication ofRachel Carson's book Silent Spring (Johansson 2000; Carson 1962). E.F. Schumacher's 1973 book, Small is Beautiful: Economics as if People Mattered addressed the issue of whetherhappiness or a better way of life for those living in a mature industrial country depend ongrowing material wealth (Schumacher 1973).
The protests at recent World Trade Organization meetings and the new national organicstandards just promulgated by USDA are indications of the continuing importance of this issue(USDA Agricultural Marketing Service, The National Organic Program 2001). This skepticismmay act as a counterweight that slows the industrialization of the food system, and at the sametime may present market opportunities to astute producers who can tailor their production andmarketing to the demands.
Friedman also points out that just as technologies such as the Internet extend the reach of firms inthe global marketplace, these technologies can also contribute to better global governancewithout the need for formal global government bodies which would probably be unworkable. The technologies can facilitate networking and publicity resulting in enforcement of globalnorms. Examples are when the Fair Labor Association pressured global apparel makers torestrict child labor, or when animal rights groups pressure a company like MacDonalds to setanimal welfare standards for meat and poultry that it purchases.
FORCES SPECIFIC TO DIFFERENT LIVESTOCK SECTORSThe Purdue report elaborates on how the driving forces differ among the livestock speciessectors: dairy, hog/pork, beef, and poultry. Key points from its analysis are discussed belowalong with insights from other sources:
DairyU.S. policy changes will have a significant on the dairy industry, and are discussed in more detailbelow. Dairy has historically been one of the more-protected agricultural sectors in many nations. Despite trade liberalization, exports and imports are expected to remain small compared to thedomestic market but will play in increasing role in domestic milk price movements. Themarketplace for dairy products is fiercely competitive, with introduction of many new products.

Final TWP, Economics of Animal Agriculture July 2001
SECTION III page 31
Food safety scares drive the industry toward increased vertical linkages and control systems. Dairy herds require substantial quantities of water, so increased urban demand for water in thewestern states could be a factor in gradually shifting the industry back to the Midwest1. Finally,new on-farm technologies such as ultrafiltration and reverse osmosis may allow milk to beconcentrated prior to shipping, which could allow large dairies distant from population centers tobe more competitive.
Dairy CompetitivenessAn Ohio Extension publication, "Dairy Excel's 15 Measures of Dairy Farm Competitiveness,"identifies ten areas of dairy farm competitiveness and the role of each in contributing to thesuccess of the business. They point out that dairy producers that want to stay competitive mustcommit to continued improvement, modernization and change. They suggest a better thanaverage dairy farm today must increase the number of dairy cows by 60 over in the next 10 yearsto maintain their standard of living to offset inflation (Polson et al. 1997).
Dairy farm management records suggest that many Midwest dairy businesses are highlyprofitable when compared to their competitors in the West, East, South, and elsewhere in theworld. However, many others have the opportunity to be more competitive by: 1) increasingcow and herd productivity, 2) increasing the efficient use of capital, 3) tightening their control ofcosts, and 4) marketing more milk per worker. Family economics and lifestyle needs and hopesare critical on-farm forces of change. Dairy profit margins have become slimmer while familyliving costs have risen. Opportunities for quality family time and for breaks in day-to-dayroutines to get away are growing more important to many families. Success must ultimately bemeasured by the personal fulfillment and satisfaction of those having a vested interest in thebusiness, although it will not survive long term without being profitable. (Conlin 1998)Historically Minnesota's dairy industry has flourished because of:
• Inexpensive high quality feeds
• Plentiful supply of water
• Land with limited alternative uses (forage production)
• Desirable climate (at least from a cow's perspective)
• Committed farm families
• Positive market reputation
• Strong support infrastructure, processors, and service and supply providers
1It should be noted, however, that as of the 2000 year milk cow numbers were continuing to decline inMinnesota, although perhaps at a slower rate than in the mid-1990s. See Table 1 in section V-1. A shiftback to the Midwest is not yet apparent in the Minnesota data.

Final TWP, Economics of Animal Agriculture July 2001
SECTION III page 32
There is wide heterogeneity in the economic vitality of Minnesota dairy farm businesses asshown by comparisons of high and low profit dairies in the state. (See Section E. of GEISReport, Profitability and Vitality). Studies have shown that the high profit group are highlycompetitive nationally in being low cost producers of milk. Wisconsin researchers identifiedseveral factors contributing to the shift from the Upper Midwest and Northeast to the West andSouthwest (Lawless et al. 1996):
• A large number of small farms that are unable to support an adequate level of family income
• Many dairy facilities and equipment are obsolete.
• Many operators are approaching retirement.
• Changes in government milk pricing policies.
⇒ Lower support prices beginning in 1981 based on anticipated purchase of surpluses andgovernment costs that included an assessment to farmers to offset the cost.
⇒ A Federal milk marketing system that favored other regions at the expense of the upperMidwest.
• The Upper Midwest is no longer the lowest milk production cost region in the U.S..
• Many do not have access to capital needed to expand and or change their systems to be morecost efficient.
SwineThe rapidly industrializing pork industry could be affected by a number of resource and policyconcerns. The main resource concern is labor. A job in a swine production unit is becomingmore like an industrial job than like what has traditionally been thought of as farm work. Laboravailability is an issue for the entire meat processing industry, including pork processing. Capitalis another resource that can be a limiting factor, especially for smaller operations. Financial riskleads to pressure to reduce operating risk by means such as production and marketing contracts. While the entire livestock industry is affected by government policies and regulations, the porkindustry may face the widest array of policy challenges - environmental, animal well-being,worker safety, and concentration and control all being areas of concern.
The role of economies of size as a factor in pork slaughtering industry consolidation and verticallinkages is evaluated by (Hayenga 1998). Fixed costs declined $3/head for double- versus single-shift plants, while capacity utilization rates can greatly affect variable cost per head and pricingbehavior in the hog market. Government policies and regulations expected to shape the future ofthe hog/pork sector in particular fall into the following areas (Boehlje et al. 1997):
• policies regarding concentration, control, market access, and price discovery,
• environmental regulations,
Final TWP, Economics of Animal Agriculture July 2001
SECTION III page 33
• animal well-being, and
• worker safety
The first two of these policy areas are discussed in more detail below. Policies regarding animalwell-being and worker safety are addressed in separate technical working papers.
"Industrialization" of the Swine IndustryThe swine industry has been undergoing rapid changes in recent years along the lines of theearlier sectors discussed by Reimund et al., that some authors have termed "industrialization."New technologies and management strategies that are thought to be playing a major role include(Positioning Your Pork Operation for the 21st Century 1995):
• feeding programs that are closely geared to animal needs during specific growth phases, andthat respond more quickly to changes in ingredient availability and cost,
• health-enhancing technologies such as all in-all out rearing and early weaning that mayimprove performance, reduce dependence on antibiotics, and/or maintain acceptableperformance in larger facilities,
• breeding systems which utilize crosses of specialized sire and dam lines to achieve desirabletraits, and artificial insemination and related technologies which allow elite lines to beutilized more widely,
• more careful facility design and better information systems to improve throughput of animalsfrom a given investment in land and buildings, and
• networked (cooperative) selling and/or buying among groups of producers, and informationsharing among producers and between producers and processors to capitalize on quantity-and quality-based premiums and discounts and identify areas that need improvement.
Implications for the future include:
• more site-specific micro production management,
• optimization of the supply chain from genetics to the end-user/consumer with better flowscheduling and resource utilization, better quality control, reduced food safety risks, andincreased ability to respond to consumer demand for specific attributes,
• continued challenges related to environmental and odor problems which will affect size andlocation, unless technological fixes are developed,
• an increased role for producer associations that provide services to their members,
• trace-back systems from final product to genetics to quickly and easily identify sources ofcontamination,

Final TWP, Economics of Animal Agriculture July 2001
SECTION III page 34
• heightened risk from new sources such as shutdown of large plants or disruption of contracts,globalization, and more specialized production units.
• Decisions concerning new production, processing, and distribution centers will tend to bemade in a more coordinated fashion than in the past when they were made relativelyindependently.
• Technological advances in production and processing could dramatically alter the laborrequirements to manufacture pork.
• Pork's competitive position could improve relative to beef and possibly even relative topoultry. Finally, ownership of world pork production and processing could become moreglobalized with more firms investing across national boundaries.
Ginder characterizes the situation in terms of a bifurcated production channel, with one sidebeing a producer-centered, commodity hog side dominated by independent producers and a fewlarge production contractors, along with a specialty hog side dominated by the industrializedproducers with packing and processing facilities (Ginder 1998).
The future role of cooperatives under a more industrialized agriculture is an issue which hasreceived attention (Cook 1995; Fulton 1995). Fulton concludes that the changes in bothtechnology and society's values (more individualism) are likely to make cooperation moredifficult in the future. He argues that many cooperatives have been predicated on creatingopportunities for farmers in a world of spot markets, and more direct marketing channels andreductions in output variability would diminish the opportunities for cooperatives. Cook sees apromising but challenging future for cooperatives that take a more offensive rather thandefensive approach.
A number of factors are conducive to successful collective action in U.S. agriculture, such aswhere there is a new market in which existing preferences are unknown, where declining marketsexist, where shared risk through relational contracts can be accomplished, or where producersrecognize asset-specificity-driven opportunism in the early stages of technology adaptation.
Changes in farm profitability and food demand in recent years have led to a great deal of farmerinterest in projects to add value to farm products. (Siebert et al. 1997) review some of the risksinvolved in post-harvest value added investment decisions, especially when the new market levelbeing entered is not thoroughly understood. They suggest an alternative: investing in publiclytraded equities (stocks) of investor-owned processing firms. For example, ConAgra, IBP,Hormel or Smithfield Foods might provide investment opportunities for livestock producers whoare seeking to capture value added at the processing level. Siebert et al. suggest a formula forcalculating the size of the investment needed to achieve a balance between the size of the farm'smarketings and the diversification capacity of the value added investment. Olson points out thatwhile many value-added agricultural ventures succeed, at least as many fail (Olson 2001).
Final TWP, Economics of Animal Agriculture July 2001
SECTION III page 35
Olson provides brief descriptions of 23 such ventures in the Midwest and how they have fared.
A number of Minnesota pork producers became involved in swine production networks in themid-1990s. Twenty producers interviewed in late 1995 cited a number of specific reasons forjoining networks (Koehler et al. 1996). Most of the producers were previously producing hogs inindividually owned farrow-to-finish operations. In general, they were all looking for a way toaccess the technology and systems they saw as necessary to achieve low cost production of theproduct quality and volume necessary to be competitive in the future. Within that general theme,some people emphasized product quality while others focused on volume or labor simplification. The types of arrangements ranged from small-scale, informal farmer-to-farmer formula pricingarrangements to large-scale, jointly owned sow units directed by hired management consultants. Perceived advantages to network participation included:
• disciplined pig flow and larger pig group size that made all in-all out finishing work better,which in turn made it easier to achieve pig health goals
• the opportunity to utilize specialized facilities with modern technology and better workingconditions
• the opportunity to utilize staff with specialized skills and expertise
• discounts on input purchases due to quantity purchasing
Perceived disadvantages included:
• the difficulty of arriving at an equitable sharing of profits among the producer-members ofthe network who might now be involved only in farrowing, only in finishing, or in other partsof the network rather than owning and being in control of the entire system as in a traditionalfarrow-to-finish operation
• more possible points of risk exposure because more people and facilities are involved in thelarger networked system
• increased transportation requirements to move pigs from farrowing to the nursery, and thenon to finishing facilities that are be located on different farms
BeefThe cow-calf sector of the beef industry utilizes large acreages of land. Land use conflicts withnon-farm neighbors over issues such as grazing next to streams could have some effect on theindustry. Government policies such as the Conservation Reserve Program and water and grazingrights could also influence where calves are produced and at what cost. The beef industry facesunique challenges due to its more segmented structure. The cow-calf industry remains dispersedcompared to other sectors. Coordination of the four phases of brood cows, backgrounding,feeding, and processing is difficult. Firms in each phase tend to focus on their own welfarerather than that of the overall industry. Continued attempts to improve efficiency by better

Final TWP, Economics of Animal Agriculture July 2001
SECTION III page 36
coordination of the entire beef production chain are expected. Domestic beef demand has beeneroding, but exports are expected to grow. It remains to be seen how the current "mad cowdisease" scare ultimately affects demand for U.S. beef.
PoultryThe poultry industry is affected by many of the same forces affecting the other species, but exportmarkets may be more important in the case of poultry. Broiler exports approach 20 percent ofdomestic use, and turkey and egg exports are also increasing. Technology for poultry productionis not geographically specific. It may be cheaper to move feed long distances than equivalentquantities of poultry even though the feed quantities are greater. Under that rationale, where toconvert the feed to poultry products is a question, given that feed supplies are located in the U.S.while consumers are located overseas. So far, U.S. poultry companies remained in a strongcompetitive position by capitalizing on the benefits of large-scale operations, capital availability,relatively stable currency, and a stable political system. One factor benefiting U.S. producers isthe difference in preferences for light and dark meat. The less preferred dark meat can be soldoverseas where it is preferred, at prices that discourage foreign competitors.
ECONOMIC ANALYSES OF GOVERNMENT POLICY RELATING TO LIVESTOCKINDUSTRY STRUCTURAL CHANGEEconomic analyses of government policy relating to livestock industry structural change areselectively reviewed in this section. Policy issues are addressed here because, as describedabove, policy is an important driving force for structural change that interacts in significant wayswith technology, resources, and market conditions. Some of the literature discussed here is alsocovered under topic C, "Role of Government," of the GEIS literature review (Hayes et al. 1999). That paper contains more detail about the specifics of laws and regulations, especially Minnesotastate and local regulations relating to the environment and human health. The discussion here isconfined to policies relating to structural change issues and economic implications of broadpolicy areas. Policies that can at least potentially affect livestock industry structure are many andvaried. Those policy areas most often mentioned in that regard include:

Final TWP, Economics of Animal Agriculture July 2001
SECTION III page 37
• environmental policy,
• policies toward industry consolidation and market performance,
• farm credit,
• land use and urban sprawl,
• intellectual property protection,
• subsidies for research and education,
• international trade,
• commodity price and income support,
• tax policy,
• economic development (non-agricultural),
• transportation,
• immigration, and
• energy.
The first three areas (environmental policy, policies toward industry consolidation and marketperformance, and farm credit policy) were addressed in the GEIS "Structure/Profitability" sectionD/E of the literature review in response to specific questions raised in the scoping document.Land use and urban sprawl, intellectual property protection, and subsidies for research andeducation were addressed in the "Role of Government" section C of the literature review. Thematerial from that publication is summarized and updated here. International trade andcommodity price and income support policy is also addressed here in some detail because theyare important forces not previously addressed. Brief comments about the other areas are alsoincluded.
The tradeoffs between environmental, price support, and international trade policies at the federallevel are described in a background paper prepared for the 2002 farm bill debate, (Claasen et al.2001). They point out that performance-based policies (paying producers who achieve goodenvironmental performance or improved performance, or who use environmentally soundpractices) have appealing aspects. Such policies would focus activity on practices that areeffective in a given setting, and reduce producer participation costs by allowing them to select

Final TWP, Economics of Animal Agriculture July 2001
SECTION III page 38
least-cost alternatives. The higher planning and enforcement costs for performance-basedpayments must be weighed against the inefficiencies of the older "one-size-fits-all" approaches,however. Also, payments for good environmental performance or good practices could provideunintended incentives to expand crop production onto previously uncropped land, unlesssodbuster-type provisions are included.
Empirical studies comparing targeted versus nontargeted policies show mixed results. Asimulation analysis of nitrogen fertilizer taxes to reduce groundwater nitrate concentrations ineastern Oregon found that the gains from a spatially-differentiated tax were modest compared toa uniform tax that ignores spatial differences (Fleming and Adams 1997). They considered itunlikely that the gains would be enough to cover the additional monitoring and other costsinvolved in the spatially-oriented tax. They also found that because of the inelasticity of yieldresponse, the tax would have to be about four times the price of nitrogen fertilizer in order tobring about the necessary reductions in fertilizer usage. A tax of that magnitude seems unlikelyto be implemented in the near future, from a political standpoint. On the other hand, a study ofthe impact of a hypothetical 40% reduction in phosphorus loading in the Le Sueur River inMinnesota found that a targeted approach would only reduce net farm income by five percentwhile a nontargeted approach would reduce it by almost 22% (Westra et al. ).
Environmental PolicyA theoretical, spatial model of how livestock producers can be expected to make economicdecisions under economies of size in waste handling is described in (Innes 2000). He uses themodel to derive insights about design of regulations to reduce negative externalities from storageleaks and spills and from excessive land applications of manure. Drabenstott argues that environmental regulations have recently been and will in the future be amajor influence in the future location of the pork industry (Drabenstott 1998). This is a summaryof statistical data from a variety of sources with interpretive comments about driving forces andpossible future directions. Even if tighter regulations do not require existing livestock facilities tobe modified, competitive pressures due to productivity improvements elsewhere in the industrymay reduce the profitability of existing facilities. Producers will then be forced to expand,renovate or replace them (refer to the treadmill hypothesis mentioned under question E2a), atwhich point they become subject to increased regulatory scrutiny. See the discussion by Outlawet al. for empirical results related to this point (Outlaw et al. 1993). Drabenstott argues that the new pork supply chains with tens or hundreds of thousands of sowsprefer large-scale units, and so have tended to locate their units in non-traditional pork producingstates such as Utah and Oklahoma because of their less restrictive environmental regulations. Hestates,
“What is clear is that firms in the pork industry are comparing regulatory climatesacross state lines and even county borders in search of places with fewerregulations. Analysts are divided on how important environmental regulations arein causing geographic shifts in production.” (p. 91)

Final TWP, Economics of Animal Agriculture July 2001
SECTION III page 39
The states are responding rapidly with tighter regulations, however. He also states that there is nocomparison available on state-by-state variation in the overall costs of compliance withenvironmental regulation. Drabenstott claims that two environmental issues will be important inshaping pork industry location decisions:
• whether a national set of environmental standards is enacted, and
• differences in regulation across national borders.
The EPA has announced that it wants final action on national guidelines by December 2001. Drabenstott argues that standardized national standards would tend to push location decisions tothe local level, where some communities are eager to embrace the industry while many others arenot. He also argues that standardized national environmental regulations would highlight the roleof corporate farming laws, which are addressed under question D1b. The issue of livestockproduction moving across national borders is illustrated by (Freese 2000), who found that eightof the 50 largest swine operations in North America in 2000 were located in Canada.
We could find few published empirical analyses of the cost of livestock operations' compliancewith environmental regulations. One reason for the dearth of work on this area may be that theregulations are evolving so rapidly and vary so much across localities and farm types. It isdifficult to arrive at a small number of representative farm situations that can be analyzed toprovide results that are generalizable to the range of farm situations that are out there, and thatwill stay relevant into the future.
A recent PhD thesis at the University of Minnesota examined various ways that Minnesotaregulators could meet federal regulations on phosphorus emissions into the Minnesota River,considering both point and nonpoint sources, and both agricultural runoff and wastewatertreatment plants (Johansson 2000). Findings were that abatement costs varied widely across thevarious land units in the watershed and the point sources. A uniform reduction across all sourceswas the most costly approach. A 40 percent phosphorus abatement could be achieved atsignificantly less cost by using either tradable permits, effluent fees or quotas geared to theefficient reduction for each source.
Impact of State and Local Policies on Locational Shifts of the Livestock IndustryMetcalfe studied regulatory data for 19 states on ten different regulations imposed to controlmanure management on animal feeding operations, and found that the regulations becamesignificantly more stringent between 1994 and 1998 (Metcalfe 2000). He ranked the regulationsusing an index based on 1) some regulation imposed at the local level, requirements for 2)facility and 3) waste system design approval, 4) geological testing, 5) requirements for publicnotice or hearings, 6) regulated setback distances, 7) nutrient management plans, 8) sizerestrictions more stringent than federal NPDES permit levels, 9) bonding requirements, and 10)moratoria on size of operation or on total production. Presence of cost-share programs was alsoconsidered. By his index, Minnesota's regulations were the most stringent in 1994.

Final TWP, Economics of Animal Agriculture July 2001
SECTION III page 40
By 1998, five other states had regulations on a par with Minnesota's (Arkansas, Georgia, Iowa,Kansas, and Mississippi, while Illinois, North Carolina, and South Dakota were only slightly lessstrict than Minnesota. Such broadbrush comparisons may miss important aspects of theregulatory process, however. A recent magazine article focused on the high cost of obtaining afeedlot permit (said to be $50,000 in one in Minnesota case and $70,000 in another), threats oflegal action, and negative local attitudes which are causing livestock producers to considerrelocating to locations outside the Upper Midwest (Sands 2001).
The significance of the state corporate farm laws and state and local environmental policies isdifficult to evaluate reliably. One approach taken in several studies is to measure the policies'impacts by comparing livestock industry trends in states with more and less restrictive policies.The most recent study of this type is Park et al. (Park et al. 2000), a presented paper from the2000 Western Agricultural Economics Association annual meeting. As a presented paper, it hasnot yet received the scrutiny that a peer-reviewed journal article would receive. Some parts ofthe paper are not explained very clearly2. Despite such flaws, the paper is cited here in additionto two older papers discussed below, because it contributes to the knowledge base in at leastthree ways. First, it relates the rather thin literature on livestock industry location to a moresubstantial literature on factors affecting location of manufacturing plants. The authors concludefrom that literature that environmental policy differences generally have little effect onmanufacturing plant location, although in some cases policy stringency is negatively correlatedwith plant location decisions. Second, they entertain the possibility that the relationship betweenenvironmental policy and livestock industry location is a two-way one - environmental policydevelopments may be a result of past livestock industry growth, as well as driving future growth,although their regression analysis is inadequate to establish which way the causality lies. Third,they break out the policy impacts between on small (less than 300 AU), medium (300 to 1,000AU), and large (over 1,000 AU) operations, with all livestock species combined into one sizemeasure with the inventory data converted into animal unit equivalents. They include data for all48 contiguous states over a 30-year period, but their data on policies was taken from a 1998survey so might not have accurately represented earlier policies.
Another study looked at trends in the swine industry in 13 major producing states over the period1988-95 (Mo and Abdalla 1998b) (Mo and Abdalla 1998a). This was a linear regression analysiswith the dependent variable being the annual percentage change in hog inventory by year, for thestates IL, IN, IA, KS, KY, MI, MN, NE, NC, OH, PA, SD, and WI. Sixteen independentvariables were included covering four categories: Natural Endowment, Economic Factors,Business Climate, and Regulation Factors. Of the four categories, economic factors were found
2 For example, a table of annual percentage changes in livestock inventories by size of operation between1970 and 1996. The source of the data is said to be the 1997 Census of Agriculture, but the data is givenin two-year increments while the census is only conducted every five years so perhaps some sort ofsmoothing technique was used to interpolate to the intervening years, or the data was actually obtainedfrom other National Agricultural Statistics Service publications.
Final TWP, Economics of Animal Agriculture July 2001
SECTION III page 41
to have the greatest influence on swine industry growth. These included the hog-corn ratio,percentage of farms with a hog inventory over 1,000 animals, and state slaughter capacity havingpositive impacts on growth. It is interesting that growth was more rapid in states with higherland values rather than lower ones. They had expected a lower land cost to stimulate expansionbecause it would reduce capital requirements. On the other hand, higher land values wouldprovide collateral for facility loans, and that may be the influence that they picked up in theanalysis. They included seven variables to measure the restrictiveness of state and local policies:
• Green index of general environmental regulations at the state level
• Lester classification of states' commitment to environmental protection activities andinstitutional capabilities
• Stringency of states' animal waste programs, based on rankings by three experts
• Staffing levels devoted to state animal waste control programs
• Average amount of fines imposed annually by state regulators
• Presence or absence of an anti-corporate farming law in the state
• Presence of absence of an agricultural exemption to local zoning
The impacts of the policy variables were as follows: The Green and Lester measures were foundto have mixed influences on growth. The Lester measure placed more weight on enforcementcapability, and was associated with lower growth (Mo-Abdalla do not provide details on thevariables entering into the Lester and Green measures, but they cite other publications whichdescribe them in detail). The measure of stringency of animal waste programs was insignificant,possibly because of the way it was measured. Fines tended to have a negative impact on growth. Higher staffing levels were also expected to suppress growth but had the opposite effect,possibly because the causality runs the other direction -- the industry grows, and then staff isincreased in response. Growth was more rapid in states with agricultural exemptions to localzoning. Anti-corporate farming laws, on the other hand, did not slow growth. It should be notedthat they did not attempt to measure how strict each state's anti-corporate farming law was.Osei and Lakshminarayan performed a similar regression analysis of the U.S. dairy industry(Osei and Lakshminarayan 1996). They looked at the probability that a given county wouldexperience an increase in dairy farm numbers between the two census years 1987 and 1992, as afunction of milk price, feed costs, temperature and precipitation, land value, population density,surface water density, and four variables characterizing the stringency of environmental policy.

Final TWP, Economics of Animal Agriculture July 2001
SECTION III page 42
The economic variables of milk price, feed costs, and land values again had the expected effects,with higher milk prices encouraging farms to locate in the county while higher feed costs andland values discouraged location. Values for four environmental variables (air quality,groundwater policy, soil conservation, and an aggregate environmental policy index) wereobtained from data provided by the Fund for Renewable Energy and the Environment as cited in(Lester and Lombard 1990). The four environmental policy variables all reduced the probabilityof location. When population density was introduced as a variable, the separate effects of theenvironmental policy variables were still negative but of lesser magnitudes. This was especiallytrue for air quality policy. Their explanation is that:
"The intuition behind this is clear when we realize that air policy issues arise inrelation to odor and other air quality problems, which are most prominent whendairies are located in residential or densely populated areas. Thus, by locatingaway from densely populated areas, dairies avoid most of the regulatory pressuresrelating to odor and other air pollutants."
This issue is discussed in more detail in the section D/E updated literature review under QuestionE3, "How do government policies, regulations and programs affect the profitability and viabilityof livestock farms and firms in Minnesota? How do governmental policies in other states andcountries differ from those in Minnesota with respect to their impacts on farm/firm profitabilityand viability in those places, and what can we learn from their experiences?" and Question D4,"What is the current market situation, how is the market changing and what are the implicationsfor livestock producers with respect to the following factors: concentration of buyers, contractualbuying and selling arrangements, price discovery and market fairness, access to markets, accessto inputs, such as credit and genetics, terms of trade, and lending practices."
Cost of Compliance with Waste Management RegulationsOne empirical analysis of dairy farms' cost of compliance with 1993 U.S. EnvironmentalProtection Agency standards is (Outlaw et al. 1993). They did an analysis of budgets for anumber of representative farms using their Farm Level Income and Policy Simulation Model(FLIPSIM). They looked at several dairy farm sizes in different regions of the U.S. They usedthe EPA Region VI standards as the basis for comparison, and adjusted them for climatic and soilconditions in the other states. The did not study Minnesota, but for Wisconsin they found thatminimum capital investments for compliance ranged from $20,000 on a 50 cow farm to $40,000on a 175 cow farm. Also:
"Moderate size dairies were found to be affected more adversely by being required to meet thespecified Region VI EPA regulations than large size dairies. Dairies that were already infinancial trouble could be put out of business by requirements to conform with the Region VIEPA standards. Many of these dairies, however, could go out of business regardless of the EPArequirements, albeit at a later date.

Final TWP, Economics of Animal Agriculture July 2001
SECTION III page 43
Large scale dairies that were not already in financial trouble appear to be able to amortize theextra capital investment costs associated with meeting the Region VI EPA requirements. Thissuggests that moderate size dairies faced with needing to make investments to meet the EPAstandards may choose to expand the scope of their operations, if financially able. While suchexpansion would require an even larger investment, it also would hold the potential for makingthe dairy more efficient and competitive." (p. ii)
Efforts to Address Environmental Issues at an International LevelMany environmental issues cross national boundaries, and as a result are being addressed invarious international negotiations. A total of 171 environmental treaties, protocols, andagreements on a diverse set of issues are registered with the United Nations (Peterson 2000). Hesuggests that an umbrella international environmental organization might achieve cost savingsand more optimal levels of environmental protection compared to these piecemeal efforts, anddiscusses design considerations for such an organization. Such an organization could defendenvironmental principles in the same way that the World Trade Organization defends principlesof liberal trade.
Friedman points out that making the leap from national institutions to formal global institutionsbumps into at least two problems: 1) the reluctance of people to give up sovereignty topoliticians and bureaucrats from the other side of the world over which they have not democraticcontrol, and 2) the difficulty of enforcing regulations or behaviors in remote locations orcyberspace (Friedman 2000), p. 206. He feels that the Internet and related technologies are morelikely to improve global governance and enforcement of global norms by means of networkingand publicity, than would formal government institutions.
Industrial Organization PoliciesOne other issue that is driving change the livestock industry is that of policy toward industryconsolidation and market performance. While livestock producers tend to focus their concernson consolidation and performance at the packer level, the academic literature suggests thatdevelopments at the retail level may dictate the future of the overall food industry. Cotterilldescribes how newly unfettered global capital markets since 1980 have altered the food industry(Cotterill 2001). Leveraged buyouts, in particular, have allowed big investors to restructure firmsin ways that tighten the firms' cash flows. When the issue of market power is left out of theanalysis, such restructuring appears beneficial in offering shareholders more risk-return choicesand assuring them that management is pushing relentlessly for profits. Bankruptcy becomes amore credible threat for the restructured firms, however, because of their tightened cash flows. When such firms possess market power, this bankruptcy threat puts them are in a much strongerposition to force concessions from workers and force suppliers to lower prices. Suchconcessions then result in income transfers to the firms but do not necessarily improve economicefficiency of the overall food system.

Final TWP, Economics of Animal Agriculture July 2001
SECTION III page 44
Cottterill describes the neoclassical economic theory behind the common observation that farm-level price changes tend not to be fully transmitted into retail price changes. One counterintuitiveresult of this analysis is that vertical integration of food manufacturers with retailers can be a"win-win" situation for both themselves and consumers. An integrated manufacturer-retailerwho is a monopolist will tend to both offer lower consumer prices and achieve higher profits thanwould food manufacturers and retailers who are monopolists in their stage but separate from theother stage. A related model is proposed by Giraud-Heraud et al. to explain instances in theFrench wine industry where large processers have restricted volumes to what could be sold ashigher-quality brands, even though producers would have benefited from selling additionalproduction in lower-quality segments of the market (Giraud-Heraud et al. 1999). Models suchas this might provide a conceptual framework for exploring what market conditions would haveto be present for Minnesota livestock producers to benefit from direct marketing (such as througha value-added cooperative).
Cotterill sees horizontal mergers among U.S. supermarket chains as a concern for foodmanufacturers and producers, however. He suggests plausible future mergers which could resultin as few as six national supermarket chains who would control over fifty percent of all U.S.supermarket sales. With such volume, these chains would be able to institute their own retailbrands which would be strong enough to diminish the positions and stock market values of thelarge U.S. food manufacturers. This development is presently further along in Europe than in theU.S. An interesting aside is that new VCR-like machines with hard disks are expected to make iteasier for consumers to ignore television commercials. The diminuation of television advertisingcould make it more difficult for manufacturers to maintain their brand equity, placing them at afurther disadvantage compared to retailers. This trend may have implications (not addressed byCotterill) for livestock producer groups who add value by means of long-term marketingcontracts under which premiums are paid in exchange for genetics and production practices thatfit the packers' brands. If these packer brands lose ground to those of the retailers, the marketenvironment faced by producers may change.
"Slotting fees" currently charged by retailers are an example of the use of market power to extractconcessions from manufacturers which then must raise prices to maintain an acceptable return oninvestment, in effect forcing smaller customers to subsidize the large retail chains. Cotterillsuggests that such results may lead to rejuvenated enforcement of the Robinson-Patman Act,which gives retailers (read smaller ones) legal recourse against manufacturers that grantdiscounts to other retailers (read larger ones) that are not cost-justified. The other main policysuggestion he makes is for monopsony/oligopsony merger guidelines that refocus attention onmergers' impacts on farmers and other suppliers, as opposed to the current focus on local retailmarket concentration and consumer prices.
The food marketing sector's market power can affect the welfare of consumers, producers, andoverall economic efficiency. The food-marketing sector is made up of many different productsegments with different degrees of market power. Sexton and Zhang present a theoretical

Final TWP, Economics of Animal Agriculture July 2001
SECTION III page 45
economic model and use it to quantify the welfare effects of various degrees of this market power(Sexton and Zhang 2001). Their key result is that it is important to consider both buyer(oligopsony) and seller (oligopoly) power, and the potential impacts of successive market powerat multiple stages of the market channel. The impacts can be under-estimated if only one stage isevaluated at a time. Compared to a competitive equilibrium where food marketers just covertheir costs with no surplus, oligopsony and oligopoly would redistribute gains away fromproducers and consumers, toward the marketers3. Plausible levels of oligopsony and oligopolywould allow food marketers to capture the largest share of the surplus for themselves, leavingsmaller shares for consumers and producers. The analysis leaves a number of policy-relevantquestions unanswered, however, including 1) whether increasing concentration increasesefficiency or breeds wasteful competition, 2) how important quality and variety are affected byconcentration and market power, 3) whether producers can exercise countervailing powerthrough cooperatives and bargaining, and 4) how effective antitrust regulations are in curtailingmarket power when it exists.
Concerns about market power at the farm level are addressed in Minnesota and many other statesthrough regulations on legal organization choices (Hoppe 1996). In Minnesota, Statute 500.24places limitations in the amount of farmland which a corporation can own. Corporations areprohibited from engaging in agriculture, except for family farm corporations and authorized farmcorporations. Certain other exceptions to the prohibition also apply. Limited liability companiesare prohibited from engaging in agriculture in Minnesota, and the regular business corporationlaws apply to farming in the same way that they apply to other businesses. There are taximplications to the choice of legal organization. Harl includes a discussion of corporate farmlaws in Minnesota and other states, as well as discussing the process of incorporation, what taxesapply, and other factors to consider (Harl 1996). The text of Minnesota’s corporate farm law isaccessible on the World Wide Web (Minnesota State Legislature 1998).
The rationale for regulating legal organization choices in agriculture is given in subdivision 1 of500.24: "The legislature finds that it is in the interests of the state to encourage and protect thefamily farm as a basic economic unit, to insure it as the most socially desirable mode ofagricultural production, and to enhance and promote the stability and well-being of rural societyin Minnesota and the nuclear family." For a related discussion, see Lazarus, and pages 137-39 ofLasley et al. (Lasley et al. 1995; Lazarus 1995). The choices of legal organization available toMinnesota farmers are addressed in more detail below under Question D1b, "To what degree arelivestock producers allowed to operate agricultural systems interdependently as opposed toindependently in Minnesota and in other states and what is the significance?"
3 Welfare effects are measured in terms of "consumer surplus," which is the area under a demand curve orthe difference between what they pay collectively for a product compared to what they would be willing topay, and "producer surplus" showing what producers receive compared to what they would be willing tosell for.

Final TWP, Economics of Animal Agriculture July 2001
SECTION III page 46
Legislation has been proposed at the federal level and in 16 states to protect contract growers andproducers, along similar lines to Minnesota's "Agricultural Contracts" law but with the additionof language to prevent retaliation against producers who participate in producer organizations. Arguments for and against the proposed federal legislation are given in (Boehlje et al. 2001) and(Harl et al. 2001). Boehlje et al. question whether the new rules would be sufficiently restrictivethat the unintended consequence would be to not maintain a relatively independent agriculturalstructure, but instead to encourage vertical integration through ownership of production facilitiesby processors and packers. Harl et al. reply that all of the provisions have precedent in other areasof the law, such as consumer protection legislation or trade regulation, and that the provisionshave not been shown to cause economic harm in those other contexts.
Boehlje et al. do not discuss how the presence of a corporate farm law would affect thelikelihood of ownership integration. The authors of Boehlje et al. are employed at PurdueUniversity, located in Indiana. The fact that Indiana does not have a corporate farm law mayaffect the perspective of their paper. Minnesota's law prohibits such ownership integration, sothat concern may be less real in Minnesota (Hamilton and Andrews 1992). Contract hogproduction has increased in Minnesota in the 1990s to the extent that transfers from contracteeenterprises in 1999 exceeded sales from independent farrow-to-finish enterprises, despite the factthat Minnesota's "Agricultural Contracts" law has been on the books since 1990 (see Tables 25and 31 below). Boehlje et al. also caution that restrictive multi-state or federal regulation mightcause a shift in production to Canada, Latin America, Asia or Australia.
Concentration, conduct, and performance of the meatpacking industry have been extensivelystudied (defining performance by measures such as the ability to charge monopoly prices). Onerecent study was organized by GIPSA in 1992 and published in 1996 (Concentration in the RedMeat Packing Industry 1996). One of the seven individual projects conducted as part of the studywas a literature review of the economic history of the meatpacking industry, theory, and evidence(Azzam and Anderson 1996). (Azzam 1998) is an updated summary of the literature review. (Heffernan et al. 1999) documents the increasing concentration of agricultural production andprocessing in the hands of the top firms and the development of food chain clusters of firmscombined in a variety of business relationships. Changes in concentration in U.S. commerciallivestock slaughter between 1909 and 1994 are summarized in (Azzam and Anderson 1996),pages 22-30. The percentage of slaughter done by the top four firms has been rising since themid-1980s, and was at 82 percent for steers and heifers, 73 percent for sheep, and 46 percent forhogs in 1994.
(Heffernan et al. 1999) and (Azzam 1998) present differing perspectives on the issue ofincreasing concentration. Heffernan et al. predict that four or five global clusters of food firmswill emerge. Heffernan observes that other concentration studies have tended to focus onindividual firms, and so miss important information by neglecting the relationships (e.g. jointventures or strategic alliances) among firms within a cluster. They argue for governmentintervention on the grounds that the current highly concentrated structure allows a handful of

Final TWP, Economics of Animal Agriculture July 2001
SECTION III page 47
firms to control the food system and capture higher-than-competitive profits at the expense ofindependent farmers and rural communities, and that the concentrated food system is toovulnerable to disruption. They do not attempt to measure differences in performance betweenmore and less concentrated industry structures, but rather argue that the risk of poor performanceis too great to delay action until empirical data becomes available.
Azzam reviews the studies that have attempted to measure the relationship betweenconcentration and performance in the meatpacking industry. Some studies were done along thetraditional lines of the Structure-Conduct-Performance (SCP) paradigm; others were based onmore recent methods from what has become known as the New Empirical IndustrialOrganization (NEIO). Cross-industry studies in the 1960s focused on profitability as the measureof performance. They found that industry profitability increased with concentration, and thesestudies had an effect on antitrust policy of that era. These studies were criticized, however, overinterpretation of their profitability-concentration correlations. An alternative interpretation wasthat firms become large because they are efficient due to greater managerial skills andinnovativeness. Later studies shifted their focus from comparing profits across industries, tocomparing prices across geographically separated markets within a single industry. Using priceas the performance indicator instead of profit was thought to be a better way to measure marketpower because price would not pick up effects of efficiency differences that would affect theprofitability measure. Most SCP studies of market power in the US meatpacking industry wereof the price-concentration sort. NEIO models focus more directly than SCP models on what typeof industry conduct is consistent with observed prices and quantities, and can test a variety ofoligopoly theories.
Azzam (Azzam 1998) views the above empirical studies as one way of assessing competition -taking a snapshot of industry equilibria at a point in time. The studies offer little understandingof how the industry reached where it was at that point or whether, in fact, the economic data usedin the studies represent equilibria. Azzam concludes that the evidence from both SCP and NEIOmodels on balance seems to indicate a (statistically) significant but small departure fromcompetitive conduct. The implication is that both consumer and producer welfare could beincreased by steering packer behavior toward closer conformity with the perfectly competitivebenchmark. The question is whether one should target the structure or conduct of the industry.The question of whether the positive efficiency gains from industry consolidation outweigh thenegative effects of greater market power remains an issue. Azzam cites two studies ofbeefpacking which attempted to find out whether the cost reductions achieved througheconomies of plant size or multi-plant operation offset allocative efficiency resulting fromdeteriorating packer market conduct, (Azzam and Schroeter 1995) and (Azzam 1997). Azzamand Schroeter found that the anticompetitive effects of a 50 percent increase in concentrationwere, at most, on the order of 2.4 percent. This was well below their estimate of actual costsavings of 4 percent which is likely to be generated by a 50 percent increase in the size of arepresentative plant in the industry. They concluded that the structural changes in beef packingin recent years have been welfare enhancing on balance. Azzam (1997) used a different approach
Final TWP, Economics of Animal Agriculture July 2001
SECTION III page 48
but also found that the cost-efficiency effect outweighed the market-power effect.One more recent study just released by USDA is (Hahn et al. 1999). They studied monthlychanges in U.S. farm-wholesale price spreads between 1979 and 1996. They did not findevidence that packers were exercising market power, although they caution that withconcentration at 80 percent or higher, the potential for exercising market power in the industrydoes exist. Paul explored the market and cost structure of the U.S. beef industry using monthlycost and revenue data from a USDA Grain Inspection and Stockyards Administration survey ofthe forty-three largest U.S. beef packing plants in 1992-93 (Paul 2001). She found little marketpower exploitation in either the cattle input or beef output markets, and that any apparentevidence is counteracted by cost efficiencies such as utilization and scope economies.
Azzam argues that from a historical standpoint, the meatpacking industry has performed well interms of innovation. It can be viewed as competitive in a dynamic sense of optimizing theallocation of resources between the present and the future. Profits are the returns to theinnovative activity necessary to maintain a dynamically competitive process, and the appropriatetype of competition to be concerned about is not static price competition, but competition ininnovation. Innovations that have grown out of the industry structure range from ice rooms andrefrigerated rail cars adopted a century ago to boxed beef technology today. Thus, it would be amistake to surgically intervene to maintain an industry configuration consistent with the staticnotion of competition. The top meatpacking firms today such as IBP only recently reacheddominant positions, while the top firms at the turn of the century disappeared long ago in whathas been termed a "perennial gale of creative destruction." This would suggest that it is unlikelythat a few firms will be able to maintain their positions for very long even without governmentintervention.
Azzam recommends that policy focus on industry conduct rather than structure (Azzam 1998).The aspect of conduct that policy should focus on is the degree to which competing firms may beable to coordinate their pricing without conspiring in the usual sense of the term - that is, withoutany overt or detectable acts of communication. The challenge is to develop creative measures, inthe form of marketing institutions, to dissipate the rents from implicit collusion. Where acts ofcommunication are overt and detectable, as in the recent ADM price-fixing case, antitrustremedies come into play. Mandatory price reporting as a policy response is discussed furtherbelow in the "State-Level Response" section.
A review of the literature of wholesale meat market concentration summarizes several studieswhich generally raise concerns about packers’ and retailers’ exercise of market power to thedetriment of producers (Strange and Higby 1995). They describe motivations for the movetoward formula pricing of slaughter animals and the problems presented by the reduction in theshare of the market that is traded by negotiation. An analysis of randomly selected meat marketreports shows how the selling of lower quality carcasses and cheaper cuts through channels thatare reported, while higher quality ones are fabricated for their own retail customers or intospecialty cuts that do not fit into reported standard commodity categories, may bias wholesale

Final TWP, Economics of Animal Agriculture July 2001
SECTION III page 49
price reports downward. They provide a brief summary of the 1977 Illinois Brick Co. ruling bythe U.S. Supreme Court, which held that only direct purchasers or sellers may sue a firm fordamages due to the use of market power. This ruling presents an obstacle to farmers who mightbe in the position of being damaged by depressed wholesale prices that are passed on by packersor other intermediaries.
The USDA Advisory Committee on Agricultural Concentration reported to the Secretary ofAgriculture with policy recommendations in 1996 (Concentration in Agriculture: A Report ofthe USDA Advisory Committee on Agricultural Concentration. 2001). Guiding principles theyidentified were to: promote competition; achieve, as close as possible, equal market informationfor buyers and sellers; and assure that markets exist for all comparable products undercomparable terms, while being mindful of avoiding recommendations that proscribe marketbehavior in ways which could ultimately stunt opportunities for growth within the industry. Afew key recommendations that seem germane to the GEIS scoping questions are: • expand the private right to action to parties believing themselves to be damaged by violations
of the Packers & Stockyards Act (P&SA), by providing a right to attorneys' fees,
• amend the PS&A to provide the same enforcement authority in poultry as in red meat,including growers who raise and care for poultry for another entity,
• permit price differentiation only with respect to differences in quality, verifiable differencesin procurement costs (including differences in cost due to quantity), and time of delivery,
• research the reasons for and sources of economic difference in the value of market hogs,
• improve price reporting in a number of specific ways (this report was published beforeCongress enacted mandatory price reporting),
• make sure all parties in contracts or other alliances are well informed about their risks andrewards, set up rules to "level the playing field" with penalties for behavior deemed "a priori"to be exploitative or inappropriate, standardize terminology, and address pollution problemsthat might be a consequence of integration, and
• enable cooperatives and contract grower associations to bargain with processors without fearof recrimination, and require handlers to engage in good-faith negotiation with producercooperatives and networks.
A minority report calls for stronger action, especially with regard to captive supplies and packerprocurement practices.

Final TWP, Economics of Animal Agriculture July 2001
SECTION III page 50
Two federal government agencies responsible for policy regarding concentration of buyers ofagricultural products are the Antitrust Division of the U.S. Department of Justice, and the U.S.Department of Agriculture's Grain Inspection, Packers and Stockyards Administration (GIPSA). An overview of the Antitrust Division's role is available on the Internet at (U.S. Department ofJustice Antitrust Division Overview 99). Text of Congressional testimony about what theantitrust laws prohibit and Antitrust's recent activities related to the meat packing industry isavailable at (Turetsky 1996). The responsibilities of the Grain Inspection, Packers andStockyards Administration are described at (USDA Grain Inspection, Packers and StockyardsAdministration 99).
The meatpacking industry is comprised of multinational firms over which the Minnesota stategovernment and local governments have very little influence. State and local policy optionsavailable to influence livestock processors would include whether to offer financial incentives toattract new slaughter plants, whether to allow the processors to produce their own animals, andhow strict to be in environmental regulations on the plants. The entire scope of state and localpolicies affecting livestock production in the state is also likely to indirectly influence livestockprocessors, because shrinking production seems certain to ultimately result in slaughter plantclosures while new plants will locate in areas that either currently have more production than canbe slaughtered in nearby plants, or appear receptive to expansion.
One implication of marketing contracts for non-contracted producers is that the spot marketbecomes thinner and price discovery becomes less reliable. The term "captive supplies" is usedto refer to the share of supply that does not go through the spot market, either because it istransferred through contractual arrangements or through vertical ownership integration of packersinto the production stage or vice versa.
(Azzam and Anderson 1996) summarizes three studies of packer integration or captive supplieson fed beef cattle prices. Concern about packer feeding is not new, as the first study wasconducted in 1966 (Aspelin and Engelman 1966). They found that packer feeding in the late1950s and early 1960s varied from 4.6 to 7.4 percent of total marketings of fed cattle, with 151-215 packers involved in feeding cattle. They found that packer-feeder volume had a significantnegative impact on terminal market cattle prices in the study area, which was one of the top tenterminal markets. A regression analysis found that a 100-head increase in packer-fed shipmentsto the plant, on average, lowered the local average price for Choice steers relative to othermarkets for the entire week by about $0.06 per hundredweight. A 1991 study found similarresults (Schroeder et al. 1993). This study also found that price variability was not related tocaptive supplies. Another 1991 study found that captive supplies affected prices in Kansas butnot in Colorado, Nebraska or Texas (Hayenga and O'Brien 1992).

Final TWP, Economics of Animal Agriculture July 2001
SECTION III page 51
In 1992, the USDA Packers and Stockyards Administration commissioned a major study toprovide a more definitive answer to the captive supplies question (Ward et al. 1996). They found a:
".. relatively weak negative relationship between transaction prices for cash market cattleand either delivering cattle from an inventory of captive supplies or having an inventoryof captive supplies from which to deliver at a later time. Results were not robust. Several versions of the models were estimated and estimations over sub-periods withinthe 1-year study period yielded inconsistent results. ... Price differences were foundamong procurement methods, but with the possible exception of price differencesbetween forward contracts and cash market prices, observing such price differences ineveryday transaction prices would be difficult." (pp. 81-82)
The USDA Grain Inspection, Packers and Stockyards Administration analyzed the hogprocurement transactions during January 1996 by 4 firms and 12 plants in Iowa, southernMinnesota, eastern Nebraska, and the southeastern corner of South Dakota (Western CornbeltHog Procurement Investigation (GIPSA Backgrounder) 1998). The impact of procurementmethod on pricing was one of the issues studied. Results generally showed higher prices formarketing agreements and carcass merit pricing grade and yield versus spot live purchases. Thespot market transactions tended to exhibit lower hog quality characteristics than the transactionsunder marketing agreements and forward contracts. Small sellers tended to sell on a spot marketbasis and received lower prices. The report of the study seems to leave unanswered the questionof whether the price differential due to seller size was reasonable due to quality and transactioncosts, or whether the smaller sellers were unfairly discriminated against.
A comparison of year-to-year hog production and price changes over the past three decadesshows that prices have become more volatile (Tank ). In the 1970s and 1980s, a one percentchange in production resulted in a price change of around one and a half or two percent. Duringthe late 1990s, the price response has been at least twice that great. It is unclear how much of theincreased volatility is due to the increased prevalence of marketing contracts, and how much isdue to other factors.
In response to the concerns described above, the Secretary of Agriculture announced a new ruleon November 28, 2000 that requires large cattle, swine and lamb packers and importers toprovide information about livestock marketing, including pricing, for public dissemination. Thenew reporting will provide information on 80-95 percent of all cattle, boxed beef, slaughter hog,sheep, lamb meat, and imported lamb meat transactions including purchases for future delivery,and packer-owned livestock, subject to certain confidentiality guidelines. The mandatory pricereporting system was to go into effect on January 30, 2001, but has been delayed until April 2,2001 to allow more time to test the electronic information collection system (USDA AgriculturalMarketing Service, Mandatory Price Reporting 2001).

Final TWP, Economics of Animal Agriculture July 2001
SECTION III page 52
An emerging concern is being raised relative to the privatization of information and the potentialsocial, economic, and environmental impacts that may result. Particular issues are that: 1)Institutional relations governing development, control and application of information inagriculture are changing at an accelerated pace, 2) Current and future processes through whichknowledge is created and information applied in agricultural production systems will bedeveloped through synthesis of political, economic, institutional, and technologicalconsiderations, and diminished public sector involvement and 3) Increased private sectorresponsibility for information development and dissemination in agriculture is significant (Wolf1998).
Recent Developments in International Trade PolicyA major reason that U.S. agriculture has remained competitive internationally is due to itscomparative agricultural productivity as measured by total factor productivity (TFP). Since TFPgrowth in U.S. agriculture is strongly associated with public R&D and infrastructure, the relativecompetitiveness of U.S. agriculture, in the long run, is likely to depend on its ability to sustainand increase growth in TFP. The livestock industry in central and eastern Europe and the formerUSSR has been hurt by the economic reform there, according to another USDA-ERS report,Transition Economies: International Agriculture and Trade Situation and Outlook Report.Potential accession of a number of eastern and central European countries into the EuropeanUnion (EU) seems destined to lead to further reforms of the Common Agricultural Policy (CAP).The financial costs of absorbing these countries may be extreme. (from AgriculturalCompetitiveness: The Case of the United States and Major EU Countries, Transition Economies:International Agriculture and Trade Situation and Outlook Report, and Agriculture and EuropeanUnion Enlargement at (USDA Economic Research Service Publications: InternationalAgriculture 1999))
In this paper, the discussion of recent developments in international trade is framed in terms ofthe following questions:
• Is the U.S. holding its ground in terms of its international balance of trade?
• How important is international trade to Minnesota agriculture?
• What are the roles of regional trade agreements such as NAFTA and multilateral agreementssuch as the WTO?
• What are the implications for future Minnesota policy?
Is the U.S. holding its ground in terms of its international balance of trade?Both U.S. exports and imports have increased substantially in the 1990s, as tariffs and other tradebarriers have been lowered worldwide. Imports have increased more than have exports,however, leaving the U.S. trade balance worse off than a decade ago, both for all commoditiesand for agriculture (the agricultural numbers are shown in Table 1). U.S. agricultural tradeaccounts for 70 to 80 percent of total NAFTA exports and imports, and the bilateral tradebetween the U.S. and the other two countries accounts for about 98 percent of intra-NAFTA

Final TWP, Economics of Animal Agriculture July 2001
SECTION III page 53
agricultural trade (Diao et al. 2001a). Canada and Mexico are among the most important tradingpartners of the U.S., and the trade balance numbers are shown for them as well as for the worldoverall.
Table 1. U.S. Agricultural and Overall Trade Balance, 1990-2000 (millions of constant1996 dollars1)
1990 1996 1998 2000Overall - Exports, Imports, and Net ExportsNAFTA
Exports 128,934 191,001 228,830 281,333Imports 139,971 230,189 260,437 342,964Net Exports -11,038 -39,188 -31,606 -61,631
CanadaExports 96,365 134,210 152,249 176,391Imports 105,240 155,892 168,439 215,301Net Exports -8,875 -21,682 -16,190 -38,909
MexicoExports 32,568 56,791 76,582 104,942Imports 34,731 74,297 91,998 127,663Net Exports -2,163 -17,506 -15,416 -22,721
Rest of the WorldExports 324,357 659,774 678,205 722,234Imports 430,465 729,160 808,857 1,007,859Net Exports -106,108 -69,386 -130,651 -285,626
WorldExports 453,290 850,775 907,036 1,003,567Imports 570,436 959,349 1,069,293 1,350,823Net Exports -117,146 -108,574 -162,257 -347,256
Agricultural - Net ExportsNAFTA $1,714 $1,787 $672 $317
Canada 1,828 133 -759 -939Mexico -113 1,654 1,431 1,257
Europe 6,021 4,835 589 -1,547Asia 16,293 22,249 14,248 13,429Rest of world -4,114 -877 -1,163 -944World $19,915 $27,994 $14,346 $11,255
Source: Overall data from (U.S. Census Bureau, U.S. Trade Balances by Country ). Agriculturaldata from (Scott 2001a), updated with year 2000 data from (USDA Foreign Agricultural Trade ofthe U.S. ).
1Values deflated using GDP implicit price deflator.

Final TWP, Economics of Animal Agriculture July 2001
SECTION III page 54
The Importance of International Trade to MinnesotaThe importance of international trade to Minnesota agriculture can be seen from the fact thatexport revenues accounted for 20 percent to 30 percent of U.S. farm income during the last 30years. As described by Whitton and Jerardo, "Historically, the bulk commodities—wheat, rice,coarse grains, oilseeds, cotton, and tobacco—accounted for most U.S. agricultural exports. However, in the 1990's, as population and incomes worldwide rose, U.S. exports of high-valueproducts (HVP)—meats, poultry, live animals, meals, oils, fruits, vegetables, and beverages—expanded steadily in response to demand for more food diversity. As of fiscal 1999, HVPexports accounted for a 64 percent share of total U.S. agricultural exports, while bulk exportsaccounted for 36 percent. U.S. agricultural exports have exceeded U.S. agricultural imports sincethe late 1950's, generating a surplus in U.S. agricultural trade. The U.S. agricultural exportsurplus narrowed in recent years from its peak in fiscal 1996. However, it is expected to expandas exports rise in response to the recovery from recent financial crises. Over the past 30 years,exports of oilseeds and all HVP groups grew faster than grain exports. But during the 1997-99financial crises in Asia, Russia, and Latin America, growth in exports of oilseeds and of animalproducts declined due to reduced economic growth in Asia, Russia, and Latin America. The dropin the export value of grains, cotton, and oilseed products during the same period reflected lowprices and strong export competition. U.S. imports have increased steadily since 1976, asdemand for food diversification has expanded. U.S. consumers benefit from imports becausethey expand food variety, stabilize year-round supplies of fresh fruits and vegetables, and temperincreases in food prices. Imports' share of total food domestic consumption was relatively low in1975 and 1980. However, imports now account for a rising share of total food consumed inAmerican homes. Spices and herbs, syrups, tree nuts, fruit juices, honey, sugar, and lamb areproducts for which a large share is imported. All U.S. agricultural imports grew throughout the1990's, despite appreciation of the dollar versus currencies affected by the financial crises. Horticultural products are by far the largest U.S. agricultural imports, at 40 percent of the total.Animals and products are next in importance." (Whitton and Jerardo 2000)
Minnesota's shares of U.S. exports are shown in Tables 2 and 3 in order to further illustrate theimportance of international trade to the Minnesota livestock industry. Wheat is the most-exportedof the major Minnesota crops, with 40 to 50 percent of the crop exported over the past five years. About a third of the soybean crop is exported as raw beans. Significant shares of the processedsoybean oil and meal is also exported. Corn exports run about 20 percent of the crop. Poultryexports amount to around 17 percent of production, while 8 percent of red meat and 2 to 4percent of eggs are exported. Export values of meat animals and livestock products haveamounted to 14 to 17 percent of farm cash receipts in recent years. Exports of poultry and eggexports varied from 8 to 12 percent, while dairy products were around 5 to 6 percent of farm cashreceipts. The export values are based on the state's share of total U.S. production of thatcommodity. The export value percentages shown in the bottom panel are larger than the physicalshares of the crops exported because the export values include processing and transport marginsnot included in farm cash receipts.

Final TWP, Economics of Animal Agriculture July 2001
SECTION III page 55
The livestock industry, international trade, and NAFTA are all important to Minnesota grainproducers, as can be seen by comparing corn production and consumption changes between 1985and 1999. In 1985, the corn crop was 724 million bushels. It had increased by more than a thirdby 1999, to 990 million bushels (Minnesota Agricultural Statistics 2000). Part of the increasewas due to yield increases related mainly to favorable weather, and acreage was also up whichmay have been largely due to the elimination of commodity-specific acreage setasides in the1996 FAIR Act. Feeding to swine and poultry increased by over 50 percent over the period, andprocessing into ethanol and sweeteners went from a negligible amount in 1985 to around 130million bushels in 1999. Those increases in livestock feeding and processing were still less thanthe production increase, however, so exports increased as well over the period, with the largestoutshipments going to the Asian market through the Pacific Northwest, and out of Duluth (Fruinand Tiffany ). Mexico has become a significant market for Minnesota grain producers sinceNAFTA, more so for soybeans than for corn. Mexico received about seven percent of allMinnesota grain shipments between July 1999 and June 2000, leading to the conclusion thatNAFTA has changed the general pattern of U.S. agricultural trade from an "east-west" directionto a "north-south" one. An implication for the GEIS is that if Minnesota policies are modified inways that reduce the competitiveness of the Minnesota livestock industry, then at the same timeattention could be given to the grain transportation system to make sure that it has the capacity tocost-effectively handle any increased exports that might result from declines in livestockproduction.
The international financial upheaval that began in Thailand in July 1997 and subsequently spreadto other countries set back economic growth and trade worldwide. World economic growthslipped from 3.2 percent in 1997 to 1.6 percent in 1998. The value of U.S. agricultural exportsdeclined by 23 percent in real terms from fiscal year 1997 to fiscal year 1999. This was less of ablow than the nearly 50-percent drop that occurred in the first half of the 1980s, however. The1997-99 decline was mostly a price phenomenon due to oversupplies in major exportingcountries and weakened demand from crisis-affected countries and other countries such as China(Langley 2000). The 1997-99 decline in agricultural exports attributed to Minnesota was 16percent, or less of an impact than for the U.S. as a whole (see Table 2). One analyst hasestimated that the increase in net imports from Canada and Mexico between 1993 and 1998 hascost Minnesota 6,345 jobs. Job loss for the U.S. overall was 440,172 (Scott 2001b).A related question is, does trade with low-income countries imperil the wages of unskilled U.S.workers and widen the wage inequality in this country? Anderson reviews the literature on thisissue (Anderson 2000). He cites data showing that for at least a decade before the mid-1970s, thegap between wages of college-educated workers and of those with only a high-school educationhad been narrowing. The trend turned in the late 1970s, however. Between 1979 and 1995, menin the bottom decile of full-time workers experienced a 21 percent decline in earnings while thetop 10 percent enjoyed an eight percent earnings increase. In Europe, with more tightly regulatedlabor markets, wages did not change as much but job growth slowed. Economic theory datingfrom the 1940s hypothesized that trade with low-income countries would put downward pricepressure on similar U.S. goods, and force U.S. workers in these industries to accept lower wages.
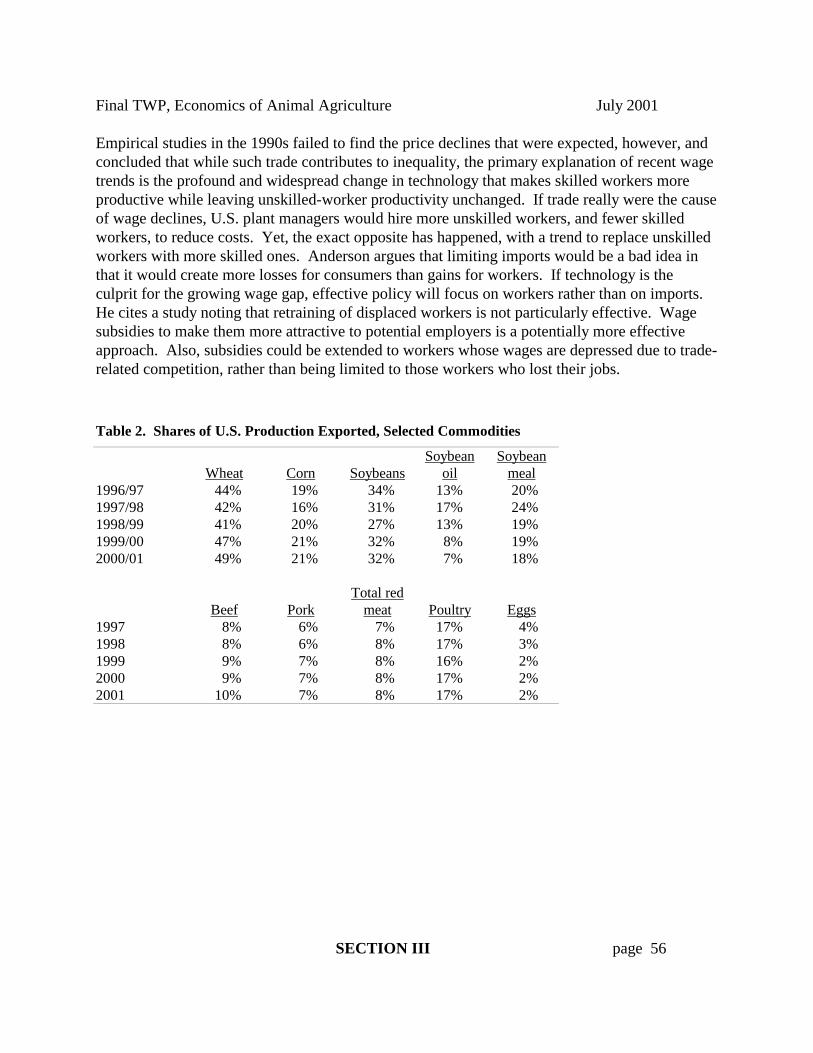
Final TWP, Economics of Animal Agriculture July 2001
SECTION III page 56
Empirical studies in the 1990s failed to find the price declines that were expected, however, andconcluded that while such trade contributes to inequality, the primary explanation of recent wagetrends is the profound and widespread change in technology that makes skilled workers moreproductive while leaving unskilled-worker productivity unchanged. If trade really were the causeof wage declines, U.S. plant managers would hire more unskilled workers, and fewer skilledworkers, to reduce costs. Yet, the exact opposite has happened, with a trend to replace unskilledworkers with more skilled ones. Anderson argues that limiting imports would be a bad idea inthat it would create more losses for consumers than gains for workers. If technology is theculprit for the growing wage gap, effective policy will focus on workers rather than on imports. He cites a study noting that retraining of displaced workers is not particularly effective. Wagesubsidies to make them more attractive to potential employers is a potentially more effectiveapproach. Also, subsidies could be extended to workers whose wages are depressed due to trade-related competition, rather than being limited to those workers who lost their jobs.
Table 2. Shares of U.S. Production Exported, Selected Commodities
Wheat Corn SoybeansSoybean
oilSoybean
meal1996/97 44% 19% 34% 13% 20%1997/98 42% 16% 31% 17% 24%1998/99 41% 20% 27% 13% 19%1999/00 47% 21% 32% 8% 19%2000/01 49% 21% 32% 7% 18%
Beef PorkTotal red
meat Poultry Eggs1997 8% 6% 7% 17% 4%1998 8% 6% 8% 17% 3%1999 9% 7% 8% 16% 2%2000 9% 7% 8% 17% 2%2001 10% 7% 8% 17% 2%
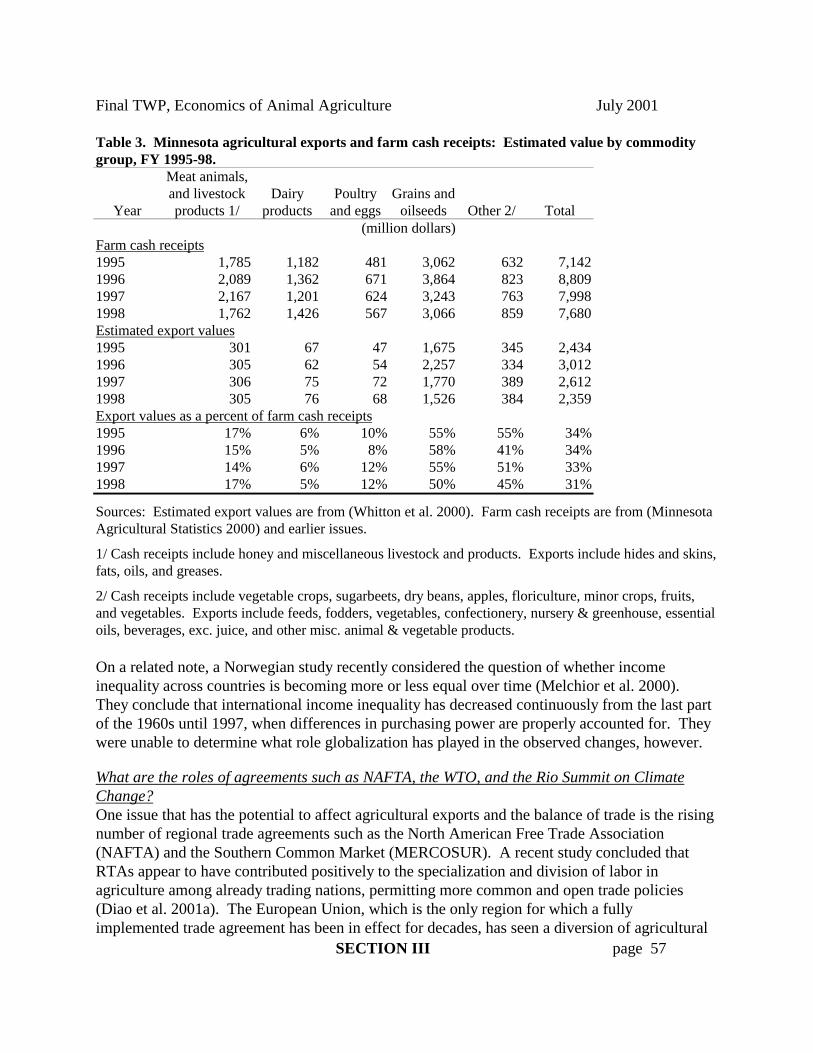
Final TWP, Economics of Animal Agriculture July 2001
SECTION III page 57
Table 3. Minnesota agricultural exports and farm cash receipts: Estimated value by commoditygroup, FY 1995-98.
Year
Meat animals,and livestockproducts 1/
Dairyproducts
Poultryand eggs
Grains andoilseeds Other 2/ Total
(million dollars)Farm cash receipts1995 1,785 1,182 481 3,062 632 7,1421996 2,089 1,362 671 3,864 823 8,8091997 2,167 1,201 624 3,243 763 7,9981998 1,762 1,426 567 3,066 859 7,680Estimated export values1995 301 67 47 1,675 345 2,4341996 305 62 54 2,257 334 3,0121997 306 75 72 1,770 389 2,6121998 305 76 68 1,526 384 2,359Export values as a percent of farm cash receipts1995 17% 6% 10% 55% 55% 34%1996 15% 5% 8% 58% 41% 34%1997 14% 6% 12% 55% 51% 33%1998 17% 5% 12% 50% 45% 31%
Sources: Estimated export values are from (Whitton et al. 2000). Farm cash receipts are from (MinnesotaAgricultural Statistics 2000) and earlier issues.
1/ Cash receipts include honey and miscellaneous livestock and products. Exports include hides and skins,fats, oils, and greases.
2/ Cash receipts include vegetable crops, sugarbeets, dry beans, apples, floriculture, minor crops, fruits,and vegetables. Exports include feeds, fodders, vegetables, confectionery, nursery & greenhouse, essentialoils, beverages, exc. juice, and other misc. animal & vegetable products.
On a related note, a Norwegian study recently considered the question of whether incomeinequality across countries is becoming more or less equal over time (Melchior et al. 2000). They conclude that international income inequality has decreased continuously from the last partof the 1960s until 1997, when differences in purchasing power are properly accounted for. Theywere unable to determine what role globalization has played in the observed changes, however.
What are the roles of agreements such as NAFTA, the WTO, and the Rio Summit on ClimateChange?One issue that has the potential to affect agricultural exports and the balance of trade is the risingnumber of regional trade agreements such as the North American Free Trade Association(NAFTA) and the Southern Common Market (MERCOSUR). A recent study concluded thatRTAs appear to have contributed positively to the specialization and division of labor inagriculture among already trading nations, permitting more common and open trade policies (Diao et al. 2001a). The European Union, which is the only region for which a fullyimplemented trade agreement has been in effect for decades, has seen a diversion of agricultural
Final TWP, Economics of Animal Agriculture July 2001
SECTION III page 58
imports to member countries since the E.U. was formed. European Union policies have notcreated agricultural trade opportunities for the rest of the world.
While NAFTA has come in for criticism in the U.S. for harming the balance of trade, two recentstudies have found that domestic macroeconomic policies in the U.S. and Mexico have also had amajor role in recent trade patterns (Diao et al. 2001a; Krueger 1999). Krueger argues thatMexican currency exchange rate policies in the late 1980s led to significant over-valuation of thepeso by the early 1990s. The use of 1990 as a starting point for trade comparisons such as inTable 2 might therefore be misleading if the over-valuation depressed exports and stimulatedimports at the start of the decade. Other factors which complicate any empirical analysis ofNAFTA’s effects are that trading relations from 1990 onward were affected to some degree byanticipation of the agreement, because President Bush and Mexican President Salinas signed anagreement in June 1990 that they would negotiate to enter into such an agreement. Also, not alltariffs between the three countries were removed when the agreement went into effect on January1, 1994. For most commodities, there was a schedule phasing out the tariffs only over a ten orfifteen-year period, so trade flows in 1994 and afterward were not entirely free of duty. Mexicohad also removed virtually all quantitative import restrictions by 1990 and had reduced tariffs, soKrueger argues that Mexico’s share of the U.S. market after NAFTA would have increased tosome extent even without the agreement. Diao, Roe and Somwaru also find that U.S.macroeconomic policies such as the early 1970s dollar depreciation had significant effects ontrade with Canada and Mexico. They reached their conclusions based on statistical procedurewhich separated out trend and cyclical components of trade patterns among the members ofNAFTA and other regional trading arrangements.
Agricultural trade barriers and producer subsidies inflict real costs, both on the countries that usethese policies and on their trade partners, according to a recent USDA report (Burfisher et al.2001). Trade barriers lower demand for trade partners’ products, domestic subsidies can inducean oversupply of agricultural products which depresses world prices, and export subsidies createincreased competition for producers in other countries. Eliminating global agricultural policydistortions would result in an annual world welfare gain of $56 billion. High protection foragricultural commodities in the form of tariffs continues to be the major factor restricting worldtrade.
The international community is addressing the challenges posed by global climate changethrough the United Nations Framework Convention on Climate Change (UNFCCC) agreed to atthe Earth Summit in Rio de Janeiro in 1992, with 170 member countries. The U.S. ratified theUNFCCC, but has not ratified the 1997 Kyoto protocol, which set specific greenhouse gasemissions reduction targets. The Kyoto protocol would have committed the U.S. to reduceemissions of greenhouse gases to seven percent below their 1990 levels by the period 2008-2012(House 2000). Another round of negotiations in November 2000 at the Hague ended without anagreement (Reiner 2001). Thus, future direction of climate policy is unclear at this time. Given that international responses to climate change are moving slowly, adaptation to the
Final TWP, Economics of Animal Agriculture July 2001
SECTION III page 59
seemingly inevitable change will become increasingly important. Adaptation is likely to occur atthe farm level (changing crop mix and farming practices), and at the national and internationallevels (shifts in cropping patterns, policies, and prices). Substantial cuts in agricultural tariffsand subsidies would facilitate economically efficient adjustments of the world food system toclimate change, according to (Randhir and Hertel 2000). Their simulations suggest that thehalfway trade liberalization implemented under the Uruguay Agreement on Agriculture may bemaking emissions worse, however, because it increases price transmission through tarifficationof the old trade barriers but leaves price-distorting production subsidies in place. In particular,subsidized, high-cost production in the European Community would replace lower-costproduction elsewhere in the world. If production subsidies are removed in future negotiations,production costs would be free to equalize across regions and aggregate welfare would increase.The relationship between U.S. farm policies and greenhouse gas emissions is discussed further inthe next section.
Recent Developments in U.S. Commodity Price and Income Support PolicyOn the policy front, direct U.S. government commodity price support policy and trade policyhave been important forces driving change since at least as far back as the 1930s New Deal. TheFederal Agricultural Improvement and Reform (FAIR) Act of 1996 was a dramatic departurefrom previous farm policies, with perhaps the most significant change being the decoupling ofpayments from crop-specific acreage limitations, which provided increased planting flexibilitybut eliminated the automatic countercyclical payment mechanism that deficiency payments hadpreviously provided. The history of twentieth-century agricultural policy and the politicalmaneuvering that let to the passage of the FAIR Act are reviewed in (Orden et al. 1999). Theyconclude that the two factors that were decisive in the radical policy change embodied in theFAIR Act were 1) the fact that control of Congress changed to the Republican Party in 1995, and2) high commodity prices in late 1995 made the idea of decoupling palatable. They alsoconclude that a number of other circumstances had surprisingly little influence on passage of theFAIR Act, including the Uruguay Round international trade agreement, federal budget pressure,the cumulative structural modernization of agriculture, the diminished potency of the farm lobby,and the emergence of newly dominant ideas about the appropriate role of government in the farmsector. They do not attempt to make a single prediction of the prospects for further farm policyreform, but list six policy-driving factors that are likely to shape the next farm bill: 1) thecontinuing structural transformation of U.S. agriculture, 2) the condition and structure ofinternational markets, 3) party control in Congress, 4) federal budget pressure, 5) the politicalfeedback generated by earlier policy change, and possibly 6) the emergence of new policy ideas.
Orden, Paarlberg and Roe look to the report of the Commission on 21st Century ProductionAgriculture for a public statement about the extent to which reliance on markets and smallergovernment has become dominant within American agriculture. This commission was mandatedas part of the FAIR Act to report on the changes that had taken place in U.S. agriculture, and torecommend specific legislation for future federal involvement in farm programs.

Final TWP, Economics of Animal Agriculture July 2001
SECTION III page 60
It identified four broad policy goals: 1) production of an abundant supply of high-qualityagricultural products at reasonable prices, 2) maintenance of a prosperous and productiveeconomic climate for the farmer producers, 3) maintenance of the family farm organization as adominant part of the production system, and 4) realization of a high quality of life for allindividuals living in rural areas (Commission on 21st Century Production Agriculture 2001). The commission recommends a three-part income safety net including a fixed baseline payment,a counter-cyclical supplemental payment, and a marketing assistance loan program. One issuethat comes into play in price support policy is the international commitments that the U.S. hasmade certain commitments regarding maximum support expenditures. The supplemental incomepayment would be based on aggregate program crop gross income rather than on current pricesand yields of any specific commodity and, as such, is believed to be exempt from thoseinternational commitments. In addition to the main report, one minority report recommends asan alternative, marketing loan rates based on a percentage of production cost, with voluntaryacreage reductions in return for higher loan rates. Another minority report points to the diversityof the farm population and the fact that the average income of farm households in the 1990s oftenexceeded the average U.S. household income, and suggests that three defensible types ofprograms are safety nets only for catastrophic markets or weather situations; social or creditprograms for farmers on the edge; and environmental stewardship programs.
Other key recommendations are for conservation reserve programs and conservation cost-sharing; improved crop insurance and tax preferred savings accounts for risk management; aunified approach to international trade negotiations, separate from negotiations on environmentaland labor issues, and dairy policy that gives attention to federal marketing orders, extension ofdairy compacts, federal price support, and international market opportunities and challenges. The wording of the goals identified by the commission is very similar to that in a recent farmpolicy proposal by Willard Cochrane, but his recommendations differ (Cochrane 1999). Dr.Cochrane's recommendations include an annual cash subsidy of $15,000 to $25,000 to familyfarms rather than commodity price supports, along with more emphasis on investigatingmonopolistic actions of large firms in the food systems.
Previous farm programs have linked payments to farms' production histories. The concept of asafety net oriented toward some minimum standard of living for farm households has generallybeen opposed by farm groups on the grounds that it seems too much like a welfare program, butis receiving increasing attention since Secretary of Agriculture Dan Glickman called 1999 the"Year of the Safety Net." A recent USDA Economic Research Service analysis looked at thecost to the government and the distribution of benefits across different farm sizes and regions ifgovernment assistance were based on: 1) income equal to that of the median non-farm householdin the region, 2) income equal to 185 percent of the poverty line, 3) income equal to the averagenon-farm household's annual expenditures, or 4) income equal to the median hourly earnings ofthe non-farm self-employed ($10 per hour). The analysis was based on farm costs and returnsdata from the 1997 Agricultural Resource Management Survey. Lower-income farmers wouldbenefit relatively more under the four scenarios, while farmers producing selected commodities

Final TWP, Economics of Animal Agriculture July 2001
SECTION III page 61
benefit relatively more from current farm programs. Minnesota farmers overall would receivehigher payments under the median household and median hourly wage scenarios than undercurrent programs. They would receive less under the 185-percent-of-poverty-line and averagehousehold expenditures scenarios, except for northeastern Minnesota which would receive more.
The 185- percent-of-poverty-line scenario is considered the most likely, and would cost about thesame as current programs. It was estimated that this scenario would have cost the government atotal of $21 billion over the three years, 1998-2000 compared to the $19.5 billion actually spent(Gunderson et al. 2000; Offutt 2000).
A recent study by Diao, Somwaru and Roe estimates the effect on production, trade and well-being from the granting of market access, removing export subsidies, and eliminating trade-distorting forms of direct support to farmers in World Trade Organization member countries(Diao et al. 2001b). They find that,
" ... removing trade barriers, subsidies, and support would cause aggregate worldprices of agricultural commodities to rise by over 11 percent relative to an indexof all other prices. Agricultural support and protection in the developed countriesis found to be the major cause of low agricultural prices, and implicitly, a tax onnet agricultural exporters in developing countries. Reform would increase worldtrade in agricultural commodities, but the level of total agricultural production isleft almost unchanged." (page 1)
Prices of livestock and livestock products would rise by 22 percent, with oil and oilseeds rising11 percent and grains other than rice and wheat rising 15 percent. Volume of livestockproduction would decline by 3 percent in the developed countries, with production of oilseedsand grains (other than rice and wheat) declining by 5 and 1 percent, respectively. From thestandpoint of a Minnesota farm operator, a next question suggested by these numbers is, wouldthe changes in market revenues implied by these price and output changes be sufficient to offsetthe loss in government payments? The question is probably moot in that complete, worldwideelimination of agricultural trade barriers and assistance programs is unlikely in the foreseeablefuture. Still, they serve as a reminder that government intrusion into the marketplace may haveprice and other secondary effects which negate the intended purpose of the policies.Dairy policy in the United States includes both Federal and State programs. The two majorfederal dairy programs currently in place are the system of federal milk marketing orders and themilk price support program. A multi-State dairy policy organization, the Northeast InterstateDairy Compact, operates under authority granted in the 1996 Farm Act. General governmentprograms designed to assist international trade and provide domestic and international food aidalso affect the dairy industry (USDA Economic Research Service Briefing Room: dairy: policy2000).

Final TWP, Economics of Animal Agriculture July 2001
SECTION III page 62
Prior to 1981 the price of milk was supported at such levels to insure an adequate supply of milk,reflect changes in the cost of production, and assure a level of farm income to maintainproductive capacity to meet future needs. Since October 1981 the support price has beenestablished by Congress either at specific levels or by formula related to expected surplus levelsrather than parity levels. To implement the price support program, the Commodity CreditCorporation offers to buy carlots of butter, cheese and nonfat dry milk at announced prices thusproviding a floor for milk and dairy product prices. (Commodity Fact Sheet, 1996-97 Dairy priceSupport Program 1997) The purchase program was to have ended on December 31, 1999 but wastwice extended for one year (to the end of 2000 and then 2001) at $9.90 per hundredweight of 3.67 percent butterfat milk (USDA Economic Research Service Briefing Room: dairy: policy2000).
The 33 previously existing milk marketing orders were consolidated into 11 as of January 1,2000, and new methods were put into place for determining class prices at that time. Thesereforms help insure American dairy farmers receive a fair price and that consumers enjoy anabundant affordable supply of milk. The federal order price system set minimum prices for milkused for alternative purposes. The new rules change the determinants of the Basic FormulaPrice, adopt a classified pricing structure for four classes of milk, and make some changes in theclassification structure. Changes were made in the Class I price differentials with lowerdifferentials in Southwest, West, Northwest, North East, and Appalachian areas. Class Idifferentials would rise in the Upper Midwest and Florida. Bailey points out that a direct changein class prices may not represent a direct change in farm gate prices. The Class III price (cheeseand other hard products) in this rule will be lower than the current BFP (Basic Formula Price),and in the Upper Midwest processing plants have regularly bid pay prices above the minimumgovernment prices. Further amendments were implemented on January 1, 2001, but were thenhalted by an injunction on February 2, 2001 (Bailey 2001).
The potential impacts of ending dairy price supports and milk marketing orders were recentlyanalyzed by (Cox and Chavas 2001). Using 1995 dairy program as a base for comparison, theirmost significant finding (to Minnesota, at least) is that eliminating all classified pricedifferentials under the federal and California milk marketing orders, plus eliminating the pricesupport program, would increase the farm price of milk by $0.49/hundredweight in the UpperMidwest region (including Minnesota, Wisconsin, and North Dakota). The price would alsoincrease in the California and Western regions, but would decrease in the other regions andwould decrease by $0.25/cwt for the U.S. overall. Production in the Upper Midwest wouldincrease by about one percent. They describe the January 1, 2001 policy changes describedabove as only a slight change from the 1995 program they used as a base for comparison, andstate that most of their findings remain valid when compared to the current program.
The 104th U.S. Congress in 1996 gave conditional consent to the Northeast Interstate DairyCompact (Section 147 of the Agricultural Market Transition Act, title 1 of Public Law 104-127;7 U.S.C. 7256). This act provided consent for the states of Connecticut, Maine, Massachusetts,

Final TWP, Economics of Animal Agriculture July 2001
SECTION III page 63
New Hampshire, Rhode Island, and Vermont to regulate milk prices for their farmers. Milkpricing is the only agricultural commodity for which congress has given consent to the use ofinterstate compacts. The compact works with the federal order pricing system as a basis for itspricing mechanism. The higher farm level prices are passed to the consumers in the price theypay for fluid milk. A Compact Commission fixes a price that exceeds the federal order price forfluid milk, compact over order premium. The estimated impacts for a state belonging to thecompact are as follows: increased farm marketings in response to a higher price, reducedconsumer purchase of fluid milk due to a higher price, and an increase in portion of milk used forclass 3 which impacts the price of class 3 milk. The estimated impacts on a non-compact stateare: reduced milk marketing due to a price decline, a reduction in the federal order blend price,small increase in fluid milk consumption with a small decline in price, and a total marketreduction in the revenues paid to farmers and collected from retail sales (Bailey 2000). Dairycompacts and Federal Milk Market Order Reform are two current milk-marketing issues undercontentious regional debate. Upper Midwest representatives in Congress submitted H.R. 744submitted a bill to rescind the Northeast Dairy Compact (Sensenbrenner et al. 1999).
"Green payments" linked to environmentally benign practices have been suggested as anotheralternative to current farm programs. One argument in favor of green payments linked toenvironmental practices is that non-farm taxpayers would be more comfortable with the expenseif they feel that the environmental improvements are benefiting them. Green payments could belinked to international greenhouse gas commitments. The USDA Economic Research Serviceweb page contains an extensive discussion of greenhouse gases and global warming at (BriefingRoom: Global Climate Change ). The main approaches being proposed in the U.S. for achievinga reduction are a tax on fossil fuels and increasing forest area (Paudel and Lohr ). A fossil fueltax would likely shift tillage practices in the direction of less conventional and more conservationtillage. U.S. cropland has the potential to sequester carbon equivalent to an estimated 24 percentof the required reduction, so practices such as converting from conventional to conservationtillage and adopting improved cropping systems would help meet the commitment. Paudel andLohr develop a simulation model of tillage systems for producing cotton in Georgia, andconclude that conservation tillage offers economic and environmental benefits over conventionaltillage in that situation.
The impact of a green payment scheme on Minnesota has not been estimated, but in Iowaconversion of corn-soybean rotations to no-till might result in producers receiving revenuespotentially more than $100 million per year if the sequestered carbon were valued at $20 per ton. The Environmental Quality Incentives Program (EQIP) is a currently existing program whichcould be expanded to provide greater revenues to farmers and achieve environmental objectiveswhile meeting pledges made by the U.S. in the General Agreement on Tariffs and Trade (GATT)to remove farm subsidies coupled to farm production (Batie 1999). Batie also observes thatwater-related environmental problems tend to be found close to large populations and the wettereastern part of the U.S. while farm program payments have historically been concentrated in theGreat Plains and the wheat growing areas of eastern Washington and Oregon, however, so green

Final TWP, Economics of Animal Agriculture July 2001
SECTION III page 64
payments will not substitute well for traditional farm payments from a geographic standpoint. Complexity of the present EQIP program has hampered its implementation, however. Challenges include how to target payments to land with the most significant environmentalproblems and how to tailor assistance to farmers' needs.
Farm Credit PolicyUSDA has a series of short, nontechnical reports on their web site which discuss federalgovernment involvement in farm lending and ways in which federal action could improveefficiency (Maxwell 1998). They quote Department of Justice findings that 93 percent of ruralbanking markets are considered non-competitive in that banking business is concentrated amongfew banks. Suggested federal actions include:
• harmonizing charters and regulations for government-sponsored enterprises such as the FarmCredit System and the Federal Agricultural Mortgage Corporation to reduce marketsegmentation,
• regulatory reform for all lenders,
• encouraging entry into concentrated markets through nontraditional mechanisms includingelectronic funds transfers and telecommunications, and
• continued antitrust vigilance.
Federal estate tax changes are suggested to make it easier to transfer family farm businessesacross generations, although they find that only about one-third of heirs in each generationchoose to operate inherited family farms.
Another report in the USDA series addresses beginning farmers' credit needs. They suggest thattraditional credit programs have limited potential to assist young low-equity farmers, becausethey are ill-equipped to deal with the increased risk that accompanies high leverage. Theysuggest tax initiatives such as lowering capital gains taxes on land sold to beginning farmers, tax-exempt or tax-deferred "aggie" savings accounts. Depending on how many of the potential landbuyers are covered by such favorable tax treatment, the tax reductions could simply end up beingbid into land prices so that the land would be no more affordable than it is at present.
They suggest that state statutes be changed to facilitate beginning farmers' access to equitycapital. Limited partnerships, subchapter S corporations, and limited liability corporations aresuggested as ownership forms that would make it easier for investors to purchase an ownershipinterest in the farm and limit their liability to the amount of the investment. It might be difficult,however, to identify a policy design which would provide sufficient capital access to help
Final TWP, Economics of Animal Agriculture July 2001
SECTION III page 65
beginning farmers without giving non-farm investors so much access that family farmers wouldcomplain of unfair competition.
A more in-depth discussion of structural change in agriculture, how it is affecting lenders, and policy implications is presented in (Duncan and Stam 1998). They trace some of the history ofthe traditional farm lending industry, and past policy responses. They expect that the emergenceof non-traditional credit sources and foreign lenders will compete with traditional ones. One areaof concern is the possible impact that failure of large-scale integrated agricultural firms wouldhave on the rest of the nation's food and fiber sector. There is currently no consensus on what ifanything should be done to protect against such an eventuality.
The Minnesota and federal governments have instituted a number of programs that providefinancing and technical and business planning assistance to Minnesota livestock producersbeyond what is available from commercial lenders. Possible sources for new farm productprocessing and marketing ventures include (Sparby March 9, 2001):
• Minnesota Department of Agriculture's Rural Finance Authority and Cooperative GrantProgram
• Agricultural Utilization Research Institute
• Minnesota Technology Institute
• Economic Development Centers
• Midwest Community Development Corporation
• Minnesota Business Finance Corporation
• Small Business Development Centers
• USDA Rural Business-Cooperative Service
• U.S. Small Business Administration
Both Friedman and the Purdue report discussed above emphasize that business managers must beable to adjust rapidly to marketplace changes. Access to credit and technical and businessplanning assistance facilitate such adjustments, so we second a recommendation made by Hayes,et al. for further research on the adequacy of these programs (Hayes et al. 1999), p. C-71. Implications for alternative forms of livestock production are that increased state funding forsuch programs would likely lead to more product differentiation and direct marketing; morejointly-owned value-added processing ventures; more rapid adoption of new production

Final TWP, Economics of Animal Agriculture July 2001
SECTION III page 66
technologies; higher returns to labor and management; and substitution of capital for laborresulting in fewer total jobs in production agriculture which might be offset by additional jobs inprocessing and distribution. Commercial lenders are often said to pressure producers into signingproduction or marketing contracts in order to reduce operating risk. Thus, it seems possible thatincreased credit availability from programs such as those listed above would give producers moreaccess to alternatives that leave them with more control and independence. If true, theseprograms may slow the trend toward increased vertical coordination and consolidation.
Other Policies That Can Affect Minnesota AgricultureThere are a number of other policy areas whose impacts on the livestock industry are less direct,but which will be listed here in the interest of completeness. One area is that of intellectualproperty protection, especially in the area of gene patenting. Recent controversy overbiotechnology has drawn attention to these policies. Another policy area is subsidies for researchand education in general, and in particular subsidies and regulations related to development andadoption of new technologies such as biotechnology precision agriculture, and informationtechnologies. There is an extensive body of literature on the impact of research and education oneconomic development and competitiveness that will not be reviewed here. Funding for theUniversity of Minnesota College of Agriculture, Food and Environmental Sciences; the UnitedStates Department of Agriculture; and USDA is described in (Hayes et al. 1999), pp. C-103 - C-120.
Tax policy can affect the competitiveness of states and localities. At the national level, estatetaxes have been an issue recently. Minnesota policymakers have focused their attention onindustry winners and losers that would result from changes in the system of property and salestaxes. Other policies directed at urban sprawl and non-agricultural economic development ofrural areas will ultimately affect the livestock producers who live there.
Transportation policy could play a role in agricultural competitiveness and structural change. AsFruin and Tiffany have pointed out, NAFTA is tending to shift U.S. shipments of agriculturalcommodities from an "east-west" direction to "north-south," with increasing rail shipments ofgrain from Minnesota to Mexico in particular (Fruin and Tiffany ). Any policy developmentsthat affect livestock industry competitiveness and volume could at least potentially haveimplications for transportation patterns, and policy responses may be called for.
The increasing use of hired workers in agriculture means that worker protection regulations,including minimum wage and hour regulations and safety rules, can have an impact onagriculture. Also, it is obvious that the ethnic makeup of rural communities and the work forcesin livestock operations and processors is changing, which suggests that immigration policies haveplayed a role in changing the Minnesota livestock industry (Martin ; Amato ; Drew 2001). Finally, energy policy has not received much attention for a number of years, but spikes in oil and

Final TWP, Economics of Animal Agriculture July 2001
SECTION III page 67
gas prices and West Coast electricity shortages have refocused the public's attention on energyissues. A research question that has been raised occasionally is, would higher energy prices favorpasture-based or low-capital livestock production systems vis-a-vis confinement systems thatutilize capital and energy inputs to minimize labor requirements? A more specific question is,how would policies regarding ethanol blends in fuel affect the livestock industry. Minneapolisalready requires that fuel be oxygenated, described as containing 2.7% oxygen which isachievable with a blend of 7.7% ethanol or 11% methyl tertyl butyl ether (MTBE) withconventional gasoline (Gallagher et al. 2000). With current exemptions from gasoline excisetaxes, ethanol appears to have the dominant market share of the oxygenated fuel market in mostMidwestern states. If the oxygenation requirement were extended to all of Nebraska, Minnesota,Iowa, Kansas, Missouri, Illinois, Wisconsin, North Dakota, and South Dakota, Gallagher et al.find that local economic benefits would be enough to offset the tax exemption and provide anoverall $399 million net welfare gain. While the overall effect is positive, Midwestern livestockproducers would lose $91 million from higher corn prices.
REFERENCE LIST
Briefing Room: Global Climate Change. Located at:http://www.ers.usda.gov/Briefing/GlobalClimate/index.htm.
Commission on 21st Century Production Agriculture. 1/30/2001. Accessed 1/22/2001.
Commodity Fact Sheet, 1996-97 Dairy price Support Program. 8/1997. Washington D.C.: USDA Farm Service Agency.
Concentration in Agriculture: A Report of the USDA Advisory Committee on AgriculturalConcentration. Located at: http://www.ams.usda.gov:80/concentration/home.htm.Accessed 2/14/2001.
Concentration in the Red Meat Packing Industry. 2/1996. Washington, DC: USDA GrainInspection, Packers and Stockyards Administration.
Food System 21: Gearing Up for the New Millenium, EC-710. 1997. West Lafayette, Indiana:Purdue University Cooperative Extension Service.
Global Economy (Usually) Benefits Valley. 2001 Apr 2. Sunbury Daily Item;A:6.
Minnesota Agricultural Statistics. 2000. USDA Minnesota Agricultural Statistics Service. Located at: http://www.nass.usda.gov/mn/.

Final TWP, Economics of Animal Agriculture July 2001
SECTION III page 68
Positioning Your Pork Operation for the 21st Century. 1995. West Lafayette, IN: PurdueCooperative Extension Service.
U.S. Census Bureau, U.S. Trade Balances by Country. Located at:http://www.cache.census.gov/foreign-trade/balance/index.html.
U.S. Department of Justice Antitrust Division Overview. Located at:www.usdoj.gov/atr/overview.html. Accessed 3/4/1999.
USDA Agricultural Marketing Service, Mandatory Price Reporting. Located at:http://www.ams.usda.gov/lsg/price.htm. Accessed 2/14/2001.
USDA Agricultural Marketing Service, The National Organic Program. Located at:http://www.ams.usda.gov/nop/. Accessed 2/14/2001.
USDA Economic Research Service Briefing Room: dairy: policy. 12/12/2000. Located at:http://www.ers.usda.gov/briefing/dairy/Policy.htm. Accessed 2/14/2001.
USDA Economic Research Service Publications: International Agriculture. 5/4/1999. Locatedat: http://www.econ.ag.gov/Prodsrvs/rept-cty.htm. Accessed 6/30/1999.
USDA Foreign Agricultural Trade of the U.S. Located at: http://www.econ.ag.gov/db/FATUS/.
USDA Grain Inspection, Packers and Stockyards Administration. Located at:www.usda.gov/gipsa/. Accessed 6/16/1999.
Western Cornbelt Hog Procurement Investigation (GIPSA Backgrounder). USDA GrainInspection, Packers and Stockyards Administration. 10/9/1998. Located at:http://www.usda.gov/gipsa/newsinfo/back/hogback.htm. Accessed 5/14/1999.
Amato J. Immigration and the Changing Face of Rural America. Emerging Issues in PublicPolicy: Highlights of the 1999 National Public Policy Education Conference. St. Paul,Minnesota. Farm Foundation.
Anderson M. 2000. Rising U.S. Wage Inequality: Is International Trade the Cause? InternationalEconomic Review, U.S. International Trade Commission, Office of Economics 3379:10-3.
Aspelin AL, Engelman G. 1966. Packer Feeding of Cattle: Its volume and Significance,Consumer and Marketing Services MRR. Washington, DC: USDA.

Final TWP, Economics of Animal Agriculture July 2001
SECTION III page 69
Azzam A. 1997. Measuring market power and cost-efficiency effects of industrial concentration.Journal of Industrial Economics 45:377-86.
Azzam AM. 1998. Competition in the US Meatpacking Industry: Is it History? AgriculturalEconomics 18:107-26.
Azzam AM, Anderson DG. 5/1996. Assessing Competition in Meatpacking: Economic History,Theory, and Evidence, GIPSA-RR 96-6. Packers and Stockyards Programs, GrainInspection, Packers and Stockyards Administration, U.S. Department of Agriculture.
Azzam AM, Schroeter JR. 1995. The Tradeoff Between Oligopsony Power and Cost Efficiencyin Horizontal Consolidation: An Example from Beef Packing. American Journal ofAgricultural Economics 77:825-36.
Bailey K. 2000. Evaluating the Economic Impacts of Regional Milk Pricing Authorities: TheCase of Dairy Compacts. Agricultural and Resource Economics Review 29(2):208-19.
Bailey K. 1/2001. Impact of USDA's Class III & IV Hearing on Milk Prices in the Northeast,Staff Paper 335 [Web Page]. Located at:http://www.aers.psu.edu/dairyoutlook/FedOrderData/MilkPriceModel.htm. Accessed2/14/2001.
Batie S. 8/1999. Green Payments as Foreshadowed by EQIP. E. Lansing, Michigan: Departmentof Agricultural Economics, Michigan State University. Located at: http://agecon.lib.umn.edu/cgi-bin/pdf_view.pl?paperid=1784.
Boehlje M. 1999. Structural Changes in the Agricultural Industries: How Do We Measure,Analyze and Understand Them? American Journal of Agricultural Economics81(5):1028-41.
Boehlje, Michael, Schrader, Lee, Hurt, Chris, Foster, Ken, and Pritchett, James. The ProducerProtection Act - Will It Protect Producers? Agricultural Law Update. AmericanAgricultural Law Association, 2001, 18, pp. 4-6
Boehlje M, Clark K, Hurt C, Jones D, Miller A. 1997. Hog/Pork Sector. Food System 21: Gearing Up for the New Millenium, EC-710. West Lafayette, Indiana: Purdue UniversityCooperative Extension Service.
Burfisher M, Diao X, Elbehri A, Gehlhar M, Gibson P, Leetmaa S, Mitchell L, Nelson F, NimonW, Normile MA, Roe T, Shapouri S, Skully D, Smith M, Somwaru A, Trueblood M,Tsigas M, Wainio J, Whitley D, Young CE. 1/25/2001. The Road Ahead: AgriculturalPolicy Reform in the WTO - Summary Report. Washington, DC: USDA Economic
Final TWP, Economics of Animal Agriculture July 2001
SECTION III page 70
Research Service. Located at: http://www.ers.usda.gov/publications/aer797/.
Carson R. 1962. Silent Spring. Greenwich, Connecticut: Fawcett Publications, Inc.
Claasen R, Hansen L, Peters M, Breneman V, Weinberg M, Cattaneo A, Feather P, Gadsby D,Hellerstein D, Hopkins J, Johnston P, Morehart M, Smith M. 1/2001. Agri-Environmental Policy at the Crossroads: Guideposts on a Changing Landscape,Agricultural Economic Report 794. Washington, DC: USDA Economic ResearchService.
Cochrane W. 1999. A Food and Agriculture Policy for the 21st Century: Summary. 2105 FirstAvenue South, Minneapolis, MN 55404: Institute for Agriculture and Trade Policy.
Conlin BJ. March 1998. Stepping or Leaping into the Future. Positioning for the Future, FourState Dairy Extension Programs. Madison, Wi and New Ulm, MN. University ofMinnesota.
Connor J, Schiek W, Uhl J, Hiemstra S. 1997. Consumer Demand for Food. Food System 21: Gearing Up for the New Millenium, EC-710. West Lafayette, Indiana: Purdue UniversityCooperative Extension Service.
Cook ML. 1995. The Future of Agricultural Cooperatives: A Neo-Institutional Approach.American Journal of Agricultural Economics 77(5):1153-9.
Cotterill R. 2001. Neoclassical Explanations of Vertical Organization and Performance of FoodIndustries. Agribusiness 17(1):33-57.
Cox T, Chavas J-P. 2001. An Interregional Analysis of Price Discrimination and DomesticPolicy Reform in the U.S. Dairy Sector. American Journal of Agricultural Economics83(1):89-106.
Diao X, Roe T, Somwaru A. 2001a. What is the Cause of Growth in Regional Trade: TradeLiberalization or RTAs? The Case of Agriculture. The World Economy 24(1):51-79.
Diao X, Somwaru A, Roe T. 1/2001b. A Global Analysis of Agricultural Trade Reform in WTOMember Countries, Bulletin 01-1. St. Paul, Minnesota: Economic Development Center,University of Minnesota. Located at: http://agecon.lib.umn.edu/cgi-bin/pdf_view.pl?paperid=2372.
Doering O, Boehlje M, Tyner W. 1997. Introduction. Food System 21: Gearing Up for the NewMillenium. West Lafayette, Indiana: Purdue University Cooperative Extension Service.
Drabenstott M. 1998. This Little Piggy Went to Market: Will the New Pork Industry Call the

Final TWP, Economics of Animal Agriculture July 2001
SECTION III page 71
Heartland Home? Economic Review of the Federal Reserve Bank of Kansas City .
Drew DP. 2001 Jan 23. From Many Lands to Minnesota. Star Tribune:1.
Duncan M, Stam JM, editors. 1998. Financing Agriculture into the Twenty-first Century.Boulder, Colorado: Westview Press.
Fleming RA, Adams RM. 1997. The Importance of Site-Specific Information in the Design ofPolicies to Control Pollution. Journal of Environmental Economics and Management33:347-58.
Freese B. 2000. Sow Herd Building Again: This Time It's Canada Making the Move (PorkPowerhouses 2000). Successful Farming :18-20.
Friedman T. 2000. The Lexus and the Olive Tree: Understanding Globalization, Newly Updatedand Expanded Edition. New York: Anchor Books.
Fruin J, Tiffany D. How to Make 1.3 Billion Bushels Disappear. Department of AppliedEconomics Seminar. University of Minnesota, St. Paul, Minnesota.
Fulton M. 1995. The Future of Canadian Agricultural Cooperatives: A Property RightsApproach. American Journal of Agricultural Economics 77(5):1144-52.
Gallagher P, Otto D, Dikeman M. 2000. Effects of an Oxygen Requirement for Fuel in MidwestEthanol Markets and Local Economies. Review of Agricultural Economics 22(2):292-312.
Ginder RG. 1998. Alternative Models for the Future of Pork Production. Royer JS, Rogers RT,Editors. Industrialization of Agriculture: Vertical Coordination in the U.S. Food System.Aldershot, England; Brookfield, Vermont: Ashgatge.
Giraud-Heraud E, Soler L-G, Tanguy H. 1999. Avoiding Double marginalisation in Agro-FoodChains. European Journal of Agricultural Economics 26(2):179-98.
Gunderson C, Morehart M, Whitener L, Ghelfi L, Johnson J, Kassel K, Kuhn B, Mishra A,Offutt S, Tiehen L. 10/2000. A Safety Net for Farm Households. Washington, DC: USDA Economic Research Service. Located at: www.ers.usda.gov.
Hahn WF, Nelson KE, Duewer LA, Gustafson RA. 5/4/1999. U.S. Beef Industry: Cattle Cycles,Price Spreads, and Packer Concentration, Technical Bulletin 1874. Washington, DC: Market and Trade Economics Division, ERS, USDA. Located at: http://www.econ.ag.gov/epubs/pdf/tb1874/.
Final TWP, Economics of Animal Agriculture July 2001
SECTION III page 72
Hamilton ND, Andrews G. 11/1992. State Regulation of Contract Feeding and PackerRegulation in the Swine Industry. Des Moines, Iowa: Drake University, Agricultural LawCenter.
Harl, Neil, Stumo, Michael, McEowen, Roger, Heffernan, William, and O'Brien, Doug. TheProducer Protection Act - Will It Protect Producers? A Rejoinder. Agricultural LawUpdate. Alvin, Texas American Agricultural Law Association, 2001, 18, pp. 1-3, 6-7
Harl NE. 11/1996. The Farm Corporation: What It Is, How It Works, How It Is Taxed. IowaState U. Extension Distribution Center, 119 Printing and Distribution Building, Ames, IA50011: North Central Farm Management Extension Committee.
Hayenga ML. 1998. Cost Structures of Pork Slaughter and Processing Firms: Behavioral andPerformance Implications. Review of Agricultural Economics 20(2):574-83.
Hayenga ML, O'Brien D. 1992. Packer Concentration, Forward Contracting Price Impacts, andthe Relevant Market for Fed Cattle. Purcell W, Editor. Pricing and Coordination inConsolidated Livestock Markets, Captive Supplies, Market Power, IRS Hedging Policy.Blacksburg, VA: Research Institute on Livestock Pricing. p 45-67.
Hayes L, Carpenter S, Koehler R, Sifferath W, Durgan B, Ponce de Leon A, Eidman V, Sundquist WB. 1999. A Summary of the Literature Related to the Role of Government(C). Generic Environmental Impact Statement on Animal Agriculture. St. Paul,Minnesota: Minnesota Environmental Quality Board.
Heffernan W, Hendrickson M, Gronski R. 2/5/1999. Consolidation in the Food and AgricultureSystem. Columbia, Missouri: Department of Rural Sociology, University of Missouri.
Hoag DL. 1999. Agricultural Crisis in America: A Reference Handbook. Santa Barbara,California: ABC-CLIO.
Hoppe B. USDA, Economic Research Service, Farm Structure and Performance Branch. 9/1996. What do We Mean by Farm Structure? [Web Page]. Located at:http://www.econ.ag.gov/fbe/struc/st1.htm. Accessed 4/28/1999.
House R. 12/18/2000. What is the Kyoto Protocol to the United Nations Framework Conventionon Climate Change and what are its implications for U.S. agriculture? [Web Page].Located at: http://www.ers.usda.gov/Briefing/GlobalClimate/Questions/Ccmqa1.htm.Accessed 3/23/2001.
Hurley S, Kliebenstein J. Pork Product Consumer Attitudes Toward Manure Storage, Handling,and Application Methods. Proceedings of the Eighth International Symposium on
Final TWP, Economics of Animal Agriculture July 2001
SECTION III page 73
Animal, Agricultural and Food Processing Wastes. Des Moines, Iowa. St. Joseph, Michigan:American Society of Agricultural Engineers.
Innes R. 2000. The Economics of Livestock Waste and Its Regulation. American Journal ofAgricultural Economics 82:97-117.
Johansson R. 2000. Point-Nonpoint Emissions Trading for Minnesota River Phosphorus. St.Paul, Minnesota: University of Minnesota.
Koehler B, Lazarus B, Buhr B. 4/1996. Swine Production Networks in Minnesota: Resourcesfor Decision Making, Staff Paper P96-6. St. Paul, Minnesota: Department of AppliedEconomics, University of Minnesota. Located at: http://agecon.lib.umn.edu/mn/p96-06.pdf.
Krueger AO. National Bureau of Economic Research. 12/1999. Trade Creation and TradeDiversion Under NAFTA [Web Page]. Located at: www.nber.org/papers/w7429.Accessed 2/23/2001.
Langley S, Report Coordinator. 3/2000. International Financial Crises and Agriculture.Washington, DC: USDA Economic Research Service. Located at: http://usda.mannlib.cornell.edu/reports/erssor/international/wrs-bb/2000/ifca/wrs99-3.pdf.
Lasley P, Duffy M, Ikerd J, Kliebenstein J, Keeney D, Lawrence J. 1995. EconomicDevelopment. Understanding the Impacts of Large-Scale Swine Production: Proceedingsfrom an Interdisciplinary Scientific Workshop. Des Moines. Available for $15 from theCenter for Agricultural Safety and Health, Institute for Rural and Environmental Health,132 IREH, University of Iowa, Iowa City, IA 52242, (319)335-4438.
Lawless G, Cropp R, Harris P. University of Wisconsin Center for Cooperative. 4/1996.Cooperative Ownership Compared to Other business Arrangements for Muti-FamilyDairy Operations [Web Page]. Located at:http://www.wisc.edu/staff/lawless/coopvs3.html. Accessed 5/1999.
Lazarus B. 1995. Public Policies and Values Related to Livestock Industry Structural Change. Structural Change in the Livestock Industry. St. Paul, MN: Livestock SpecializationTeam, Minnesota Extension Service, University of Minnesota.
Lester J, Lombard E. 1990. Comparative Analysis of State Environmental Policy. NaturalResources Journal 30(Spring):301-19.
Martin P. Immigration and the Changing Face of Rural America. Emerging Issues in PublicPolicy: Highlights of the 1999 National Public Policy Education Conference. St. Paul,

Final TWP, Economics of Animal Agriculture July 2001
SECTION III page 74
Minnesota. Farm Foundation.
Maxwell D. 1998. How Would Proposed Changes in Federal Estate Taxes Affect Farmers?Collender R, editor. Issues in Agricultural and Rural Finance, Agriculture InformationBulletin No. 724. Washington, DC: Economic Research Service, U.S. Department ofAgriculture.
McLaren J. 2000. "Globalization" and Vertical Structure. American Economic Review90(5):1239-54.
Melchior A, Telle K, Wiig H. 2000. Globalization and Inequality: A Norwegian Report.Population and Development Review 26(4):843-8.
Metcalfe M. 2000. State Legislation Regulating Animal Manure Management. Review ofAgricultural Economics 22(2):519-32.
Minnesota State Legislature. Minnesota Statutes 1998; Chapter 500. 1998. 500.24 Corporateand Partnership farming [Web Page]. Located at:http://www.revisor.leg.state.MN.us/stats/500/24.html. Accessed 5/1999.
Mo Y, Abdalla CW. 1998a. Analysis Finds Swine Expansion Driven Most by Economic Factors,Local Decisions. Feedstuffs :20.
Mo Y, Abdalla CW. 3/1998b. Analysis of Swine Industry Expansion in the US: The Effect ofEnvironmental Regulation, Staff Paper 316. University Park, PA: Department ofAgricultural Economics and Rural Sociology, Pennsylvania State University.
Murray M. 2001 Feb 8. As Huge Companies Keep Growing, CEOs Struggle to Keep Pace. WallStreet Journal:1.
Offutt S, Administrator, USDA Economic Research Service. 10/2000. Can the Farm Problem BeSolved?, M.E. John Lecture. University Park, PA: Pennsylvania State University. Located at: http://www.aers.psu.edu/Announce/AESeminar/offutt.pdf.
Olson, Joan. High Hopes. Farm Industry News. 7900 International Drive, Minneapolis,Minnesota 55425 Intertec Publishing, 2001
Orden D, Paarlberg R, Roe T. 1999. Policy Reform in American Agriculture: Analysis andPrognosis. Chicago: University of Chicago Press.

Final TWP, Economics of Animal Agriculture July 2001
SECTION III page 75
Osei E, Lakshminarayan PG. 12/1996. Determinants of Dairy Farm Location, Working Paper96-WP 174. Ames, Iowa: Center for Agricultural and Rural Development, Iowa StateUniversity.
Outlaw JL, Schwart RBJr, Knutson RD, Pagano AP, Miller JW, Gray AW. 5/1993. Impacts ofDairy Waste Management Regulations, AFPC Policy Working Paper 93-4. CollegeStation, Texas: Agricultural and Food Policy Center, Texas A&M University.
Park D, Seidl A, Davies S, Frasier WM. 6/2000. Environmental Policy Influences on LivestockStocking and Location Decisions. Fort Collins, Colorado: Department of Agriculturaland Resource Economics, Colorado State University. Located at: http://agecon.lib.umn.edu/cgi-bin/pdf_view.pl?paperid=2224.
Paudel K, Lohr L, Meeting the Kyoto Target Through Conservation Tillage and Its Implicationfor Natural Capital Maintenance, Production Efficiency, and Sustainability. Athens,Georgia: Department of Agricultural and Applied Economics, University of Georgia. Located at: http://agecon.lib.umn.edu/cgi-bin/pdf_view.pl?paperid=2205.
Paul CJM. 2001. Market and Cost Structure in the U.S. Beef Packing Industry: A Plant-LevelAnalysis. American Journal of Agricultural Economics 83(1):64-76.
Peterson W. 2000. Design of Supranational Organizations for the Provision of InternationalPublic Goods: Global Environmental Protection. Review of Agricultural Economics22(2):355-69.
Polson J, Shoemaker D, Oelker E, Schnitkey G. 10/1997. Dairy Excel's 15 Measures of DairyFarm Competitiveness. Columbus, Ohio: Ohio State University, Cooperative Extension.
Randhir T, Hertel T. 2000. Trade Liberalization as a Vehicle for Adapting to Global Warming.Agricultural and Resource Economics Review 29(2):159-72.
Reimund DA, Martin JR, Moore CV. 4/1981. Structural Change in Agriculture: The Experiencefor Broilers, Fed Cattle, and Processing Vegetables, Technical Bulletin 1648.
Washington, DC: USDA Economics and Statistics Service.
Reiner D. 2001. Climate Impasse: How the Hague Negotiations Failed. Environment :36-43.
Sands, Laura. Run for the Border: Onerous Permits Chase Livestock Across State Lines. TopProducer. 1818 Market Street, 31st Floor, Philadelphia, PA 19103-3654 Farn JournalCorporation, 2001
Final TWP, Economics of Animal Agriculture July 2001
SECTION III page 76
Schroeder TC, Jones R, Mintert J, Barkley AP. 1993. The Impact of Forward Contracting on FedCattle Transaction Prices. Review of Agricultural Economics 15:325-38.
Schumacher EF. 1973. Small is Beautiful: Economics as if People Mattered. New York: Harper& Row.
Scott RE. Economic Policy Institute. Exported to Death: The Failure of AgriculturalDeregulation [Web Page]. Located at: http://www.epinet.org. Accessed 2/23/2001a.
Scott RE. Economic Policy Institute. NAFTA's Pain Deepens: Job Destruction Accelerates in1999 With Losses in Every State [Web Page]. Located at: http://www.epinet.org/.Accessed 2/23/2001b.
Sensenbrenner et al. 2/11/1999. Bill to rescind the consent of Congress to the NortheastInterstate Dairy Compact. (Introduced in the House), H.R. 744.
Sexton R, Zhang M. 2001. An Assessment of the Impact of Food Industry Market Power on U.S.Consumers. Agribusiness 17(1):59-79.
Siebert JW, Jones R, Sporleder TL. 1997. The VEST Model: An Alternative Approach to ValueAdded. Agribusiness: An International Journal 13(6):561-7.
Sparby M, AURI Program Development Director. March 9, 2001. Presentation on Financingand Business Planning, at the On-Farm Dairy Processing Roundtable. University ofMinnesota, St. Paul, MN:
Strange M, Higby A. 11/1995. From the Carcass to the Kitchen: Competition and the WholesaleMeat Market. Walthill, Nebraska: Center for Rural Affairs.
Tank, Al. Percent Change in Pork Production and Percent Change in Price in Recent HogProduction Cycles (from presentation at the Minnesota Pork Congress, MinneapolisConvention Center, January 28, 1999), National Pork Producers Council, personalcommunication,
Turetsky D. 6/11/1996. Statement before the Committee on Commerce, Science, andTransportation, U.S. Senate. Washington, DC: Antitrust Division, U.S. Department ofJustice. Located at: www.usdoj.gov/atr/public/testimony/turetsky.696.html.
Tweeten LG, Flora CB. 3/2001. Vertical Coordination of Agriculture in Farming-DependentAreas. Council for Agricultural Science and Technology, Task Force Report 137. Located at: http://www.cast-science.org/castpubs.htm#vert.

Final TWP, Economics of Animal Agriculture July 2001
SECTION III page 77
Ward C, Schroeder TC, Barkley AP, Koontz SR. 5/1996. Role of Captive Supplies in BeefPacking. Washington, DC: Grain Inspection, Packers and Stockyards Administration,USDA. Located at: http://www.usda.gov/gipsa/newsinfo/pubs/pubs.htm#psp.
Westra JV, Easter KW, Olson KD, Targeting Nonpoint Pollution Control: Phosphorus in theMinnesota River Basin. St. Paul, Minnesota: Department of Applied Economics,University of Minnesota.
Whitton C, Jerardo A. 12/27/2000. USDA Economic Research Service Briefing Room: U.S.Agricultural Trade [Web Page]. Located at:http://www.ers.usda.gov/briefing/AgTrade/usagriculturaltrade.htm. Accessed 1/22/2001.
Whitton C, Jerardo A, Fant M. 12/29/2000. USDA Economic Research Service Briefing Room: Foreign Agricultural Trade of the United States (fatus) [Web Page]. Located at:http://www.ers.usda.gov/data/FATUS/. Accessed 1/22/2001.
Wolf SA. 1998. Privatization of Information and Agricultural Industrialization. Boca Raton,Florida: CRC Press.

Final TWP, Economics of Animal Agriculture July 2001
SECTION III page 78

Final TWP, Economics of Animal Agriculture July 2001
SECTION III page 79

Final TWP, Economics of Animal Agriculture July 2001
SECTION III page 80
IV. Phosphorus Balance in Minnesota Feedlot Permitting
by Joseph G. Schimmel, Richard A. Levins, and Dennis R. Keeney
Introduction
The Minnesota Pollution Control Agency began issuing feedlot permits in 1971. A primary goalof these permits was to ensure that livestock producers had enough land to apply manure atnitrogen based rates. To achieve this goal each permit incorporated a land application plan formanure produced on the farm that balances nitrogen (N) from manure with the N requirements ofcrops grown on land owned, or under contract, by the person requesting the permit. The permitprocess was revised in 1978 and most recently in 2000. The current focus is now to limit N onall acres to which manure is applied and to limit phosphorus (P) in certain sensitive situations.
When sufficient manure is added to cropland to satisfy N needs, the crop will usually not requireall the P added in the manure. Therefore P can accumulate in the soils receiving manure at Nfertilizer rates. Phosphorus as phosphate leaches only slowly compared to nitrate, and it presentsunique problems. Too much P causes our lakes and streams to produce too much algae andweeds. As the algae and weeds die, oxygen is consumed causing odors and problems for fish andother aquatic animals. How much P is building up in fields that have been given feedlot permits? And, if the amount is judged too high, what should we do? These two questions are the subjectsof this report.
This report was requested by the Environmental Quality Board as part of the GenericEnvironmental Impact Statement on Animal Agriculture. Other studies are underway that willattempt to define sites where the chances of P moving into the water are high, to recommendapplication rates under different circumstances, and to assess the consequences of P regulation. We will restrict ourselves to an analysis of how much surplus P (if any) is being applied to farmfields from feedlots that have been given permits in Minnesota.
Defining Surplus Phosphorus
For purposes of this study, we define surplus P as a situation where P is being applied as manureover a long period of time, at levels above those that can be removed by crops. We recognizethat, depending on existing P levels in the soil, excessive P application rates in a given year mayor may not contribute to water quality problems. No matter what the soil test levels are when thepermit is granted, P levels will eventually become high if sufficient excess manure P is appliedyear after year.
Final TWP, Economics of Animal Agriculture July 2001
SECTION III page 81
THE DATA WE USED
We began with an MPCA database consisting of 5,483 feedlot permits issued by delegatedcounty programs during the years 1980-2000. Each feedlot record in the database showedidentification information including the owner, the date of issue, and the location of the feedlot. The database also showed how many acres were available for manure application. Finally, eachrecord contained the species, type, and number of animals permitted for the feedlot. Forexample, one permit allowed 300 nursery pigs, 550 feeder pigs, 600 finishing pigs, 170 sows,and 10 boars. As a second example, a permit was issued for a feedlot having 21 beef cows and18 calves.
Each permit record was carefully analyzed for completeness. In addition, we only acceptedrecords for feedlots having at least 10 animal units, and no more than 1,000 animal units. Feedlots in this size range are most consistent with regulations in force during the time periodcovered. The final total of permits that met the criteria of complete data and proper size was3,907. No other criteria were used to accept or reject permits for analysis; our goal was acomprehensive review of the permitted feedlots. While this is a large number, there are 16,000feedlots permitted by MPCA and by MPCA regional offices that are not included in our study.
The 3,907 feedlot permits we analyzed included 766,050 animal units and 1,333,062 acresavailable for manure application.
HOW WE ANALYZED THE DATA
In most general terms, we needed to know two important numbers for each permitted farm. First,we needed to know how much P4 was generated from manure. Second, we needed to know the Pused by crops grown on the acres available for manure application. These numbers were notavailable directly from the database, so we had to estimate them from information that we had.
The Midwest Plan Service2 gives the average amount of P produced by each animal type in ourdatabase for each day that animal is on the farm. For example, the manure produced in a day bya 1,400-pound dairy cow contains 0.24 pounds of P. We also needed to estimate how many dayseach animal would be on the farm. In consultation with Extension agricultural engineers, wedetermined a days on farm estimate for each animal type in the database. For example, breedinglivestock were assumed to be on the farm for 365 days per year. Feeder cattle, however, wereassumed to be on the farm for only 201 days per year. These numbers were then used to estimatetotal phosphorus produced by each animal type on the farm during the year, that is,
4 P2O5 was used as this is the form of P almost universally reported in agricultural literature. Onepound of P is equal to 2.86 pounds of P2O5. We use the terms P and P2O5 interchangeably.
2 Livestock Waste Facilities Handbook MWPS-18. Second edition, 1985.

Final TWP, Economics of Animal Agriculture July 2001
SECTION III page 82
P per day x days on farm x number of head = Total P produced
Next, we estimated P used by crops on the farm. Our overall procedure was to determine atypical acre for each county. To do this, we took the ten-year county average for acres harvestedof crops to which manure is usually applied: corn, corn silage, alfalfa, grass hay, small grains,and soybeans. We also found the 10-year average yield3 for each of these crops. Knowing thecrops and yields allowed us to use Minnesota Department of Agriculture4 data to determinephosphorus removal. For example, corn removes 36 pounds of P for every 100 bushels of grainharvested.
Now we could construct a typical acre and determine P removal for that acre in each county. Forexample, in Rock County, the typical acre looked like this:
The typical acre for Rock Countyremoved 38.18 pounds of P per year.
Total P removed by crops on each farm was found by multiplying the number of acres times theP removal for a typical acre in the county in which the farm was located. Having determined Pproduced from manure and P removed on each farm, we estimated the surplus or shortage of P bysubtracting the second number from the first:
Surplus P = P from manure P removed by crops
Results for All Feedlots
The results of our analysis are shown in Figure 1. Each vertical bar in Figure 1 shows whatpercent of the total feedlots we analyzed had surplus P in certain ranges. (The totals arepresented as pounds per acre, rather than total pounds, to facilitate later comparisons amongdifferent feedlots.) A negative surplus should be read as a shortage.
3 Acreage and yield data were from Minnesota Agricultural Statistics, various years.
4 Minnesota Department of Agriculture. Useful Management Data, 1995.
Crop Percent of Land Yield/AcreAlfalfa 4 3.68 tons
Hay 1 3.31 tonsCorn 48 120.6 bu.
Corn Silage 2 14.48 tonsOats 1 71.8 bu.Soybeans 43 37.5 bu.

Final TWP, Economics of Animal Agriculture July 2001
SECTION III page 83
The feedlots we analyzed were evenly split between those that had P shortages (negativenumbers on the horizontal scale) and those that had P surpluses (positive numbers on thehorizontal scale). However, seventy percent of the animal units were on feedlots that had surplusP. The median value of surplus P for all feedlots was 0.4 pounds per acre. In total, the amountof P available from manure on the feedlots was 54.2 million pounds. Crop use was estimated at52.8 million pounds, so 1.4 million pounds of surplus P would be applied by the feedlots eachyear.
It is important to note that our surplus P estimates, in total and per feedlot, are conservative•mostlikely, the actual values are somewhat higher than what we show. The reason is that we areassuming that the manure is being spread to take best advantage of P. In fact, at many farms it isbeing spread to take best advantage of N. It is therefore entirely possible that a farm with anoverall shortage of P is applying excess P from manure to at least some of its acres. It is alsoentirely possible that a farm with an overall surplus of P is supplementing at least some of itsacres with additional P from non-manure sources. We have no way to assess this possibilitywithout on-farm assessments.
We also recognize that the animal unit figures we used are those for animals permitted, not thoseactually on the farm. If, for some reason, a feedlot is operating below capacity, the numbers weused will overestimate surplus P for the feedlot. However, it must be recognized that the feedlotstill had a permit to generate the amount of surplus P we estimated, regardless of whether itactually does so.
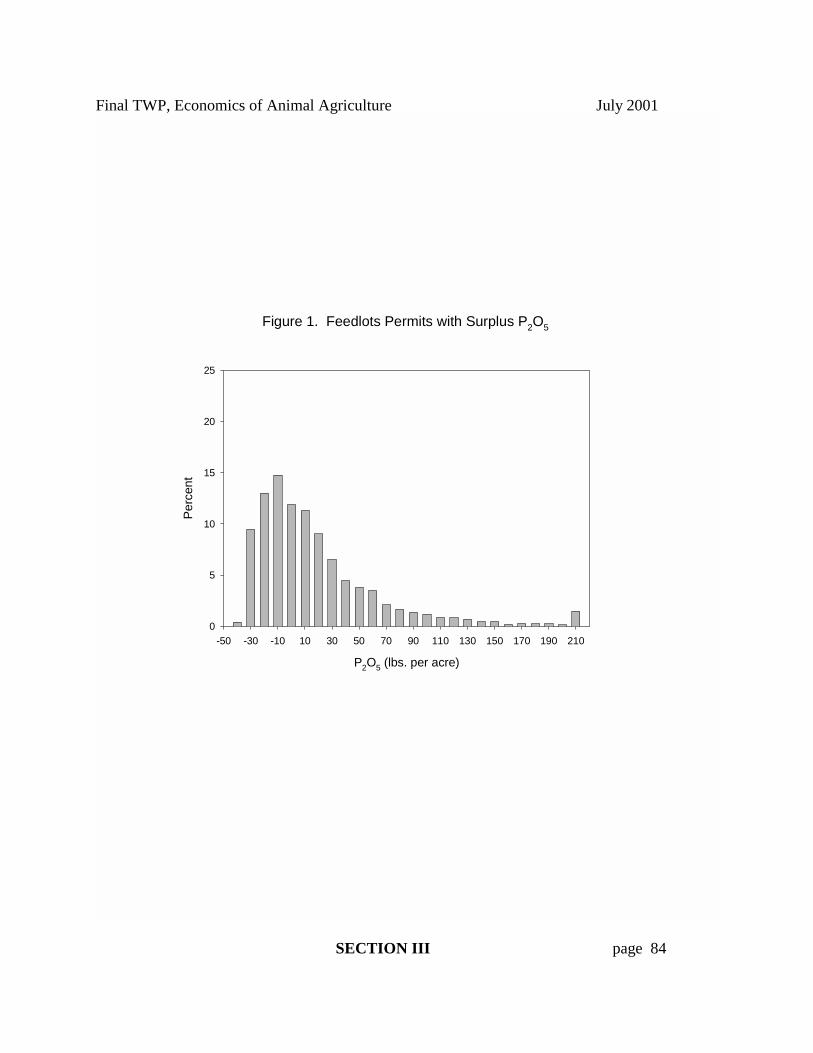
Final TWP, Economics of Animal Agriculture July 2001
SECTION III page 84
Figure 1. Feedlots Permits with Surplus P2O5
P2O5 (lbs. per acre)
-50 -30 -10 10 30 50 70 90 110 130 150 170 190 210
Per
cent
0
5
10
15
20
25

Final TWP, Economics of Animal Agriculture July 2001
SECTION III page 85
FURTHER ANALYSIS OF THE DATA
In Figures 2, 3, and 4, the results just presented are broken down into three size classes ofpermitted feedlots. Figure 2 is for feedlots permitted to have fewer than 100 animal units. Figure 3 is for feedlots with at least 100, but fewer than 300, animal units. The largest facilitiesin our study, those with more than 300 animal units, are presented in Figure 4. For simplicity, wewill call these three groups - small, medium, and large feedlots, respectively.
There were 1,482 small feedlots in the study. These feedlots, on average, had 55 animal unitsand 220 acres of land. Small farms had a median P shortage of 17.3 pounds per acre. Themedium feedlots, of which there were 1,620, averaged 172 animal units and 343 acres in size. This group of farms had a median P surplus of 4.5 pounds per acre. The largest feedlotsaveraged 503 animal units and 558 acres of land available for manure disposal. There were 805feedlots in this group, and their median surplus P was 38.2 pounds for each acre of land to whichmanure was applied.
As is shown in Figures 2, 3, and 4, there is a large spread to the data. Some of the larger feedlotshave a more desirable P balance than do some of the smaller feedlots. Farm size is therefore notthe only variable influencing the P balance. Nonetheless, the figures show the center of the databars moving steadily toward larger surpluses as feedlot size increases. The median surplus P forthe large feedlots is 55.5 pounds per acre higher than that for the small feedlots.
The overall message is clear: the larger a feedlot becomes, the less likely it is to have enoughavailable land to make good use of all the P produced by animals on the farm. Further analysisof the data indicates that the problem is not having more animals per se. Rather, the problem iswith the ratio of animal units per acre. As is shown in Figure 5, for each increase in density ofone animal unit per acre, surplus P increases by 78 pounds per acre. Larger farms, in general,tend to be more densely populated with animals and therefore have more surplus P.
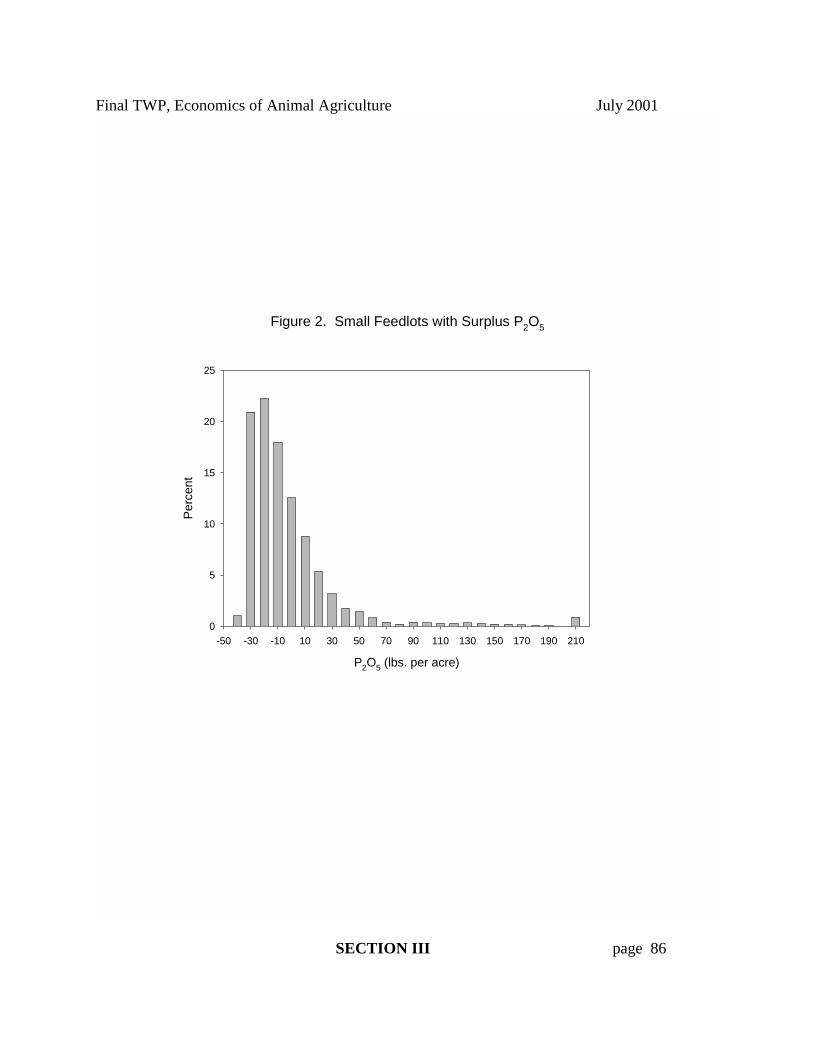
Final TWP, Economics of Animal Agriculture July 2001
SECTION III page 86
Figure 2. Small Feedlots with Surplus P2O5
P2O5 (lbs. per acre)
-50 -30 -10 10 30 50 70 90 110 130 150 170 190 210
Per
cent
0
5
10
15
20
25

Final TWP, Economics of Animal Agriculture July 2001
SECTION III page 87
Figure 3. Medium Feedlots with Surplus P2O5
P2O5 (lbs. per acre)
-50 -30 -10 10 30 50 70 90 110 130 150 170 190 210
Per
cent
0
5
10
15
20
25

Final TWP, Economics of Animal Agriculture July 2001
SECTION III page 88
Figure 4. Large Feedlots with Surplus P2O5
P2O5 (lbs. per acre)
-50 -30 -10 10 30 50 70 90 110 130 150 170 190 210
Per
cent
0
5
10
15
20
25

Final TWP, Economics of Animal Agriculture July 2001
SECTION III page 89
Figure 5. The Effect of Animal Density on Surplus P2O5
Animal Density (Animal Units per acre)
0 1 2 3 4 5 6 7 8 9 10
P2O
5 (lb
s. p
er a
cre)
-50
50
150
250
350
450

Final TWP, Economics of Animal Agriculture July 2001
SECTION III page 90
Some Directions for Policy and Planning
If it is judged that surplus P, as estimated in this study, is a threat to water quality, then a stickyproblem for policy arises. The main cause of P surpluses is a high ratio of animal units to acresavailable for spreading manure. If old permits are to be reviewed and revised to reduce thesesurplus numbers, there are two obvious paths: reduce the number of animal units or increase thenumber of acres available for spreading manure. Both are difficult. Reducing animal units maylead to inefficient, and therefore more costly, use of existing buildings and other facilities used inraising livestock. Increasing acres may not be possible in all cases because surrounding land maynot be available for spreading manure. Furthermore, manure application costs will rise ashauling distance increases.
New rules might be developed to better account for P as well as N balances. We acknowledgethe protective measures in the recently revised rules to prohibit the long term build up of P nearwaters, to require set backs, and to require a P strategy for large facilities with high P soils. Feedlots permitted with new standards (N and P balance) would face difficulties of moreexpensive land application, but should at least be able to properly size buildings and facilities. Perhaps a new permitting program could be combined with special incentives to encouragesmaller feedlots. These are, for the most part, those that can most easily meet new environmentalperformance guidelines. At the same time, they may have more difficulty competing from aneconomic standpoint, and would therefore benefit from the financial incentives a new programmight offer.
Finally, a compromise might be considered for feedlots with a previously issued permit. Theland application plans for these feedlots have presumably been designed with only N in mind. The plans could be reviewed for each feedlot with an eye toward relaxing N limits and tighteningP limits. This would not be easily done, nor would it be popular with those who might see it assomehow backing off on nitrogen standards. At the same time, some gains might be madewithout incurring the cost of changing permitted animal unit and acreage levels.
As part of this latter suggestion, or as a stand-alone program, it might also make sense to reviewP applications from commercial sources. The reason for this is simple enough: the more P weallow from commercial sources, the less P from manure will be in demand by crop farmers. Manure separation systems that can allow P-containing components of manure to be hauledgreater distances at lower cost might also be investigated. Other potential solutions may beassociated with selling manure and changing animal diets to reduce P in manure.
All of the preceding section is intended only to guide discussion. The justification for furtherconsideration of any of these ideas depends on the extent to which the GEIS Citizens AdvisoryCommittee determines that surplus P results indicate a serious threat to the environment.

Final TWP, Economics of Animal Agriculture July 2001
SECTION III page 91
Conclusion
At least half of Minnesota•s permitted feedlots are building P levels in surrounding fields. Larger feedlots, on average, have much higher levels of P build-up than do smaller feedlots. Should the GEIS Citizens Advisory Committee determine this P build-up threatens water quality,some difficult decisions must be made. It is clear that if Minnesota wishes to avoid high P soilsin areas that have high levels of animal production, it must devise a permitting process thatlowers the animal density on many feedlots. Further study is needed regarding why the P levelsvary as they do, and the best ways to achieve any desired reductions in light of the economicpressures faced by the livestock industry today.
Final TWP, Economics of Animal Agriculture July 2001
Section V-1 page 92
V-1. Literature Review Update: Industry Structure and Competitiveness,and Profitability and Economic Viability
by William F. Lazarus
List of TablesTABLE 1. CHANGES IN THE MINNESOTA LIVESTOCK INDUSTRY, 1993-99 .............................................105
TABLE 2. SHIFTS IN PERCENT OF U.S. MILK PRODUCTION .......................................................................106
TABLE 3. HERD SIZE PROFILE PERCENT INVENTORY BY SIZE GROUPS FOR SELECTED STATES --1998 ..................................................................................................................................................................107
TABLE 4. MINNESOTA'S CHANGING DAIRY LANDSCAPE ..........................................................................108
TABLE 5. DAIRYING'S CONTRIBUTION TO FARM INCOME..........................................................................111
TABLE 6. SHIFTS IN STATE MARKET SHARES OF U.S. LIVESTOCK AND POULTRY PRODUCTION ..112
TABLE 7. ESTIMATED NUMBER OF U.S. SWINE OPERATIONS AND SHARE OF U.S. SLAUGHTER 1997,BY SIZE CATEGORY.....................................................................................................................................116
TABLE 8. HOG PRODUCTION COSTS BY REGION ..........................................................................................125
TABLE 9. COMPARISON OF PORK PRODUCTION COSTS (U.S. $/CWT) .....................................................126
TABLE 10. HOG PRODUCTION COSTS AND RETURNS PER HUNDREDWEIGHT GAIN, 1999 ................127
TABLE 11. MILK PRODUCTION ECONOMIC COSTS AND RETURNS, PER CWT SOLD, 1998-99............132
TABLE 12. THE ORGANIZATIONAL/ FINANCIAL STRUCTURE OF THE AGRIBUSINESS FIRM: THECHOICES AND OPTIONS..............................................................................................................................135
TABLE 13. COMPARISON OF SOLE PROPRIETORSHIP, CORPORATION, PARTNERSHIP AND LIMITEDLIABILITY COMPANY FORMS OF ORGANIZATION ..............................................................................140
TABLE 14. COMPARISON OF SOLE PROPRIETOR, PARTNERSHIP, CORPORATION AND LAND TRUSTFORMS OF ORGANIZATION § .....................................................................................................................141
TABLE 15. SUMMARY OF LEGAL AGRICULTURAL BUSINESS ORGANIZATIONS IN MINNESOTA....150
TABLE 16. 1995 FOOD SUPPLY SERVINGS COMPARED WITH FOOD GUIDE PYRAMIDRECOMMENDATIONS. .................................................................................................................................171
TABLE 17. RATES OF RETURN ON EQUITY ON SOUTHWESTERN MINNESOTA FARM BUSINESSASSOCIATION FARMS COMPARED TO ALL MANUFACTURING CORPORATIONS, FOODPROCESSORS, AND FOOD RETAILERS, 1991-2000..................................................................................186
TABLE 18. RATES OF RETURN ON EQUITY (COST BASIS) ON SOUTHWESTERN ANDSOUTHEASTERN MINNESOTA FARM BUSINESS MANAGEMENT ASSOCIATION FARMS BYFARM TYPE, 1989-99.....................................................................................................................................188
TABLE 19. WILLINGNESS TO STAY IN PRODUCTION UNTIL 2002 BY SIZE GROUP AT EACH HOGPRICE...............................................................................................................................................................202
TABLE 20. ESTIMATED MARKET SHARES OF MNSCU-FBMA PARTICIPANTS COMPARED TO ALL U.S.SWINE OPERATIONS, BY SIZE CATEGORY.............................................................................................204

Final TWP, Economics of Animal Agriculture July 2001
Section V-1 page 93
TABLE 21. MNSCU-FBMA HOG FARM FINANCIAL PERFORMANCE, 1996-2000. ......................................205
TABLE 22. HOG FARMS AS A PERCENTAGE OF ALL MNSCU-FBMA FARMS, 1996-2000. .......................207
TABLE 23. TYPES OF SWINE ENTERPRISES PRESENT ON MNSCU-FBMA FARMS, 1996-99. .................209
TABLE 24. MINNESOTA PIG CROP, INSHIPMENTS, AND MARKETINGS, 1995-99. ..................................209
TABLE 25. MNSCU-FBMA FARROW-TO-FINISH ENTERPRISE COSTS AND RETURNS BY SIZE,AVERAGE 1996-2000 .....................................................................................................................................214
TABLE 26. INDEPENDENT FINISHING ENTERPRISE COSTS AND RETURNS BY SIZE, AVERAGE 1996-2000 ..................................................................................................................................................................215
TABLE 27. WEAN-TO-FINISH ENTERPRISE COSTS AND RETURNS BY SIZE, AVERAGE 1996-2000 .....216
TABLE 28. CONTRACTEE ENTERPRISE COSTS AND RETURNS BY SIZE, AVERAGE 1996-2000............217
TABLE 29. RELATIVE FINANCIAL PERFORMANCE OF THE MAJOR TYPES OF SWINE ENTERPRISESON MNSCU-FBMA FARMS, 1996-2000. ......................................................................................................222
TABLE 30. NUMBERS OF MINNESOTA FARMS SELLING HOGS AND PIGS BY SIZE GROUPS, 1978-97226
TABLE 31. NUMBERS OF MINNESOTA FARMS FARROWING SOWS BY SIZE GROUPS, 1978-97.........227
TABLE 32. CONSTRUCTION DATE AND DATE OF LAST IMPROVEMENTS IN FACILITIES ON MIDWESTDAIRY FARMS................................................................................................................................................229
TABLE 33. CHARACTERISTICS AND FINANCIAL PERFORMANCE OF POOLED DATA SET, ALL FARMSAND BY HERD SIZE, 1992 ............................................................................................................................231
TABLE 34. INCOME, COSTS AND RETURNS, MINNESOTA DAIRY FARMS, 1996.....................................234
TABLE 35. MINNESOTA DAIRY FARM BALANCE SHEET, 1996 ..................................................................234
TABLE 36. BUSINESS PERFORMANCE MEASURES, 1996 .............................................................................235
TABLE 37. DAIRY FARMS AS A PERCENTAGE OF ALL MNSCU-FBMA FARMS, 1996-99. .......................237
TABLE 38. MNSCU-FBMA DAIRY FARM FINANCIAL PERFORMANCE, 1996-99. ......................................240
TABLE 39. DAIRY ENTERPRISE COSTS AND RETURNS BY SIZE, AVERAGE 1996-99 .............................241
TABLE 40. NUMBER OF MILK COWS ON MINNESOTA FARMS BY HERD SIZE, 1993 TO 1999 WITHPROJECTIONS TO 2004.................................................................................................................................243
TABLE 41. NUMBER OF MINNESOTA DAIRY FARMS BY HERD SIZE, 1993 TO 1997 WITHPROJECTIONS TO 2004.................................................................................................................................244
TABLE 42. ECONOMIC PERFORMANCE COMPARISON OF THREE DAIRY FARMING SYSTEMS........259
Final TWP, Economics of Animal Agriculture July 2001
Section V-1 page 94
INTRODUCTION
This updated literature review combines the original literature review completed in 1999 withnew literature that has become available since that time. It is organized in the same manner asthe study questions laid out in the GEIS scoping document. Topic D covers the dimensions ofthe Minnesota livestock industry, including the numbers, locations, and nature of feedlots; thebusiness structures used by livestock operations; the ownership and control of livestockoperations; the present market situation; and the competitiveness of Minnesota livestockproducers in national and international markets.
Topic E covers the profitability and overall economic viability of both livestock farms andlivestock processing firms including how they are affected by such factors as economies of scale,production methods, marketing arrangements, and government policies and programs. Livestockprocessing firms are discussed under question D4, so the discussion under topic E questions willfocus on farms.
Some of the study questions under topic E are closely related to questions under topic D, such asE3 on effects of government policies and D1 on choices of business organization. Severalquestions within each topic are also closely related. After conferring with Environmental QualityBoard staff, we have rearranged the order of such questions in order to improve the flow of thepresentation.
Business, production, processing, and distribution systems in the food chain are in a period ofrapid change. These changes are in response to a host of dynamic economic and social forcessuch as global economic competitiveness, monetary policy, government regulations, consumerpreferences, environmental stewardship, and food safety and new technologies, to the social andeconomic needs of farm families and rural communities. Business decisions on how to structureand operate the businesses to position themselves to survive and compete are increasinglyinfluenced by external global forces. These decisions are typically subjective decisions based onspecific situations and are continually being revised in response to a rapidly changing climate. Therefore, the nature of firms within the industry is a collage of various types of businessorganizations and the way they operate. There are no two firms alike in the way they operate. Availability of research based information to address several of the questions on businessstructure and competitiveness is limited due to the dynamics of the industry and the historicnature of research based information. Therefore these authors have supplemented verifiableresearch based information available with industry facts, statistics, and knowledgeable expertsinterpretations of the assessments to more fully answer the questions posed with current thinkingand ideas. The authors used care to be objective in selecting these references for which thereappears to be general agreement.
Readers must also be aware that the livestock industry is composed of species subsectors that arevery different from each other. They compete at the retail level. The poultry industry, broilers,

Final TWP, Economics of Animal Agriculture July 2001
Section V-1 page 95
turkeys, and eggs is quite integrated and concentrated. The beef cow calf industry is verydispersed, with many small producers on more marginal land, but beef feedlots that are moreconcentrated and integrated. The swine industry has been evolving in recent years toward greaterconcentration and integration. The dairy industry has been moving more slowly than swine in thisdirection. Because of these differences and differences in the input resources, readers arecautioned about making general conclusions that apply universally to a non-homogenouslivestock industry.
Changing linkages between producers and those firms that provide inputs to producers and buytheir products, are key elements of the structural change occurring in food distribution anddistribution. The NE-165 Regional Research Project, •Private Strategies, Public Policies, andFood System Performance,• includes researchers from U.S. land grant universities andgovernment agencies. This group held a conference in 1995 on •Vertical Coordination in theFood System.• Updated versions of the conference papers were recently published in a bookwhich focuses on the changing nature of linkages in the food chain (Royer and Rogers 1998). The book covers a wide range of topics including: how to measure the degree of verticalcoordination among industry segments involved in manufacture of a particular product (e.g. icecream or animal feeds); effect of ownership on contract structure in the beet sugar industry; andalternative models for the future of pork production.
There is one publication that deserves special mention as a source of data: (Food System 21: Gearing Up for the New Millenium, EC-710 1997). We recognize that it contains expertopinion-based predictions about the future of the food system. These predictions are believed tobe reliable, but they are also by nature unverifiable. The report also contains occasionalstatements that some readers may view as value judgements. The primary objective of the bookis to present a fifty-member Purdue University faculty task force's best sense of what the foodand agricultural system will look like in the first part of the 21st century. They expect that theanalysis will be useful for at least three different levels of decision making:
1) specific sectors such as particular types of livestock operations,
2) linkages and interdependencies between and among the various stages of the food system,and
3) implications for input supply firms.
They focus on four categories of drivers of change:
1) demand/consumption/demographics, such as changing export markets, internationalcompetition and actions of competitors, changing age and work habits of U.S. families andconsumers, and changing attitudes about food safety and quality,

Final TWP, Economics of Animal Agriculture July 2001
Section V-1 page 96
2) productivity and technology, such as the status of intellectual property rights,
3) government regulation and policy, such as antitrust and international trade policy, and
4) resources such as capital, human resources, and information and industry infrastructure aswell as the environment.
Two USDA reports provide overviews of vertical coordination in the pork and broiler industries. The first reviews the trend data on pork packer coordinating arrangements and describes aprocedure they used to estimate the impact of improved quality and lower acquisition costs onretail prices and consumer welfare (Martinez 1997). The second finds that recent changes in thestructure of the U.S. pork industry reflect, in many ways, changes in the broiler industry(Martinez 1999). Vertical integration and production contracts in broiler production facilitatedrapid adoption of new technology, improved quality control, assured market outlets for broilers,and provided a steady flow of broilers for processing. Incentives for contracting and verticalintegration in the pork industry may yield comparable results. If so, these arrangements mightlead to larger supplies of higher quality pork products at economical prices. The report provideshistorical background on vertical integration in the broiler and pork industries; explores themotives for vertical integration and contracting; examines the relationship between verticalintegration and the price and quality of pork and chicken products; and explores the public policyimplications of vertical integration in the pork industry. Increased contracting, integration andconsolidation also result in concerns about market power and barriers to entry. Independentproducers' production and marketing decisions may be distorted due to reductions in the amountand accuracy of publicly available market information.
SUMMARY OF NEW LITERATURE ADDED
Thirty additional research publications, not available for the 1999 Literature Review, areincluded in this paper. The updates have been incorporated into the original document, so thatusers have access to a seamless body of text that has the entire set of material in one place. Theupdates are also described briefly below.
The Procite computerized bibliographic database has been reconfigured to enter publication titlesrather than "Anonymous" in the in-text citations for publications without credited authors, whichwill hopefully improve readability.
All of the tables of statistical data have been updated with the most recent data available as ofearly 2001. The most significant change in the statistical tables is that the 1998 swine and dairyfarm business summary data (old Tables 19 and 27) has been replaced by four-year averages. These have only recently become feasible as a result of a new search engine for summarizing theMnSCU and farm business management association record data.

Final TWP, Economics of Animal Agriculture July 2001
Section V-1 page 97
Note particularly that the swine production economies of size picture looks somewhat different inthe new four-year averages than it did in the old 1998 data, which was heavily influenced by thelate 1998 hog market "crash". Also, there are now economies of size tables for four differentswine enterprise types rather than just farrow-to-finish.
A few subheadings have been added and revised to better delineate sections.
Question D2 on the current situation in the Minnesota livestock industry, changes taking place,why are the changes occurring, and what are their implications, is unchanged except for theaddition of (Gunderson et al. 2000), (Short 2000), (Cash Hog Prices Likely to be Gone in TwoYears 2001), (Production Costs Changed Little in 1999, but Lower Commodity Prices Cut MostReturns 2000), and (Freese 2000).
Question D1b on interdependence and corporate farm laws is unchanged except for the additionof citations on proposed federal contracting legislation - (Boehlje et al. 2001) and (Harl et al.2001).
Section V-1 page 98
Question E3 on impact of government policies, regulations and programs on theprofitability and viability of livestock farms is enhanced with an MDA report on the costof the revised feedlot rules is cited - (Wilcox 2001). There is a new article comparingregulations in 19 states - (Metcalfe 2000). There is also a new study on the impacts ofstate corporate farm laws and state and local environmental policies on the dairy industryshifts, (Park et al. 2000), that complements one cited originally on the swine industry. Arecent theoretical article on manure regulation, (Innes 2000), was added along with non-technical discussions in (Innes 1999) and (Lovell and Kuch 1999).
The section on "International Policy Developments" is smaller because much of thematerial was moved to a separate publication prepared under Task 3, "Forces DrivingChange In The Dairy, Swine And Poultry Sectors Of Minnesota Agriculture."
Question D3 on livestock farm - non-farm differences and similarities is unchanged.
Under question D4 on changes in the market situation, (Senauer 2001) was added ondifferentiation in food demand. A number of publications were added under"Concentration in the Meatpacking Industry," including (Concentration in Agriculture: AReport of the USDA Advisory Committee on Agricultural Concentration. 2001), severalrelating to the lysine price-fixing case that support the concerns raised in the originalHeffernan paper ((Connor 1997), (Lieber 2000), and (Levins 2001)). Several journalarticles including (Hayenga 1998) were added on the role of economies of size as a factorin pork slaughtering industry consolidation and vertical linkages and (Anderson et al.1998) on beef packing plant closures, and (Muth and Wohlgenant 1999) and (Paul 2001)on market power and economies of size in beef packing firms.
(MacDonald and Ollinger 2000) also recently examined the extent of scale economies inhog slaughter.
The information on Minnesota's approach to mandatory price reporting has been updated(Minnesota Department of Agriculture, Minnesota Daily Livestock Market Price Report2001). The new federal mandatory pricing system is discussed in (USDA AgriculturalMarketing Service, Mandatory Price Reporting 2001). (Schroeder and Ward 2000) wasadded to the section on "Price discovery". (Ward and Stevens 2000) look at the effects ofindustry structural change on price transmission and its effects on producers. A relatedanalysis of broiler price asymmetry is (Bernard and Willet 1996). The section on dairypolicy was updated with the latest material from the USDA Economic Research Service,(USDA Economic Research Service Briefing Room: dairy: policy 2000) and extensioneconomists (Bailey 2001).
The USDA Economic Research Service has also done some interesting analyses recentlyon terms of trade between agriculture and the rest of the economy. Their new materialshows the diversity of agriculture more clearly than in the past. Their data shows thatmedian returns of farm businesses were comparable to non-farm businesses (Hopkins andMorehart 2000).

Section V-1 page 99
Several new citations were added on impacts of lending practices. A citation was addedon the impact of bank mergers and acquisitions on agricultural lending, (Ahrendsen et al.1999). (Sparby March 9, 2001) describes financing and technical and business planningassistance to Minnesota livestock producers. (Boehlje and Ray 1999) finds that at least inthe case of a typical hog finishing contract, contract production can provide producerswith a higher rate of return on equity and less risk then independent production if thecontract makes additional financing available.
Question D5 on ownership and control, and D6 on starting and exiting, are unchanged,except for the addition of (Freese 2000).
Question E1 on economies of size is updated with new statistical information. Therevised statistical tables 20 through 29 for swine, and 37 through 39 for dairy, includenew information related economies of size and different production arrangements. Theyshow costs and returns by size for the most common enterprises, and compare contracteeswine finishing and grazing dairy enterprises to the other enterprise types.
Question E2 on economic viability is unchanged.
The "List of Major Relevant Ongoing Work" has been updated.
Two items were added to "Recommendations for Additional Future Research", whichwere suggested by the discussion in the "Forces Affecting Structural Change in theMinnesota Livestock Industry" paper. One deals with the adequacy of policy measures todeal with the consequences of globalization. The other is to evaluate the adequacy offinancing, technical and business planning assistance available to producers to facilitaterapid adjustments to marketplace changes.
New publications added since the original literaturereview
Cash Hog Prices Likely to be Gone in Two Years. 2001 Mar 8. Feedstuffs.
Concentration in Agriculture: A Report of the USDA Advisory Committee onAgricultural Concentration. Located at:http://www.ams.usda.gov:80/concentration/home.htm. Accessed 2/14/2001.
Minnesota Department of Agriculture, Minnesota Daily Livestock Market Price Report.Located at: http://www.mda.state.mn.us/livestock/Start.asp. Accessed 2/14/2001.
Production Costs Changed Little in 1999, but Lower Commodity Prices Cut MostReturns. Agricultural Income and Finance. Washington, D.C. USDA EconomicResearch Service, 2000, AIS-75, pp. 25-28, 50-55

Section V-1 page 100
USDA Agricultural Marketing Service, Mandatory Price Reporting. Located at:http://www.ams.usda.gov/lsg/price.htm. Accessed 2/14/2001.
USDA Economic Research Service Briefing Room: dairy: policy. 12/12/2000. Locatedat: http://www.ers.usda.gov/briefing/dairy/Policy.htm. Accessed 2/14/2001.
Ahrendsen BL, Dixon RL, Lee LT. 1999. Independent Commercial Bank Mergers andAgricultural Lending Concentration. Journal of Agricultural and AppliedEconomics 31(2):215-27.
Anderson DW, Murray BC, Teague JL, Lindrooth RC. 1998. Exit From the MeatpackingIndustry: A Microdata Analysis. American Journal of Agricultural Economics80:96-106.
Bailey K. 1/2001. Impact of USDA's Class III & IV Hearing on Milk Prices in theNortheast, Staff Paper 335 [Web Page]. Located at:http://www.aers.psu.edu/dairyoutlook/FedOrderData/MilkPriceModel.htm.
Accessed 2/14/2001.
Bernard JC, Willet LS. 1996. Asymmetric Price Relationships in the U.S. BroilerIndustry. Journal of Agricultural and Applied Economics 28(2):279-89.
Boehlje M, Ray J. 1999. Contract vs. Independent Pork Production: Does FinancingMatter? Agricultural Finance Review 59:31-42.
Boehlje, Michael, Schrader, Lee, Hurt, Chris, Foster, Ken, and Pritchett, James. TheProducer Protection Act - Will It Protect Producers? Agricultural Law Update.American Agricultural Law Association, 2001, 18, pp. 4-6
Connor J. 1997. The Global Lysine Price-Fixing Conspiracy of 1992-95. Review ofAgricultural Economics 19(2):412-27.
Freese B. 2000. Sow Herd Building Again: This Time It's Canada Making the Move(Pork Powerhouses 2000). Successful Farming :18-20.
Gunderson C, Morehart M, Whitener L, Ghelfi L, Johnson J, Kassel K, Kuhn B, MishraA, Offutt S, Tiehen L. 10/2000. A Safety Net for Farm Households. Washington,DC: USDA Economic Research Service. Located at: www.ers.usda.gov.
Harl, Neil, Stumo, Michael, McEowen, Roger, Heffernan, William, and O'Brien, Doug.The Producer Protection Act - Will It Protect Producers? A Rejoinder.Agricultural Law Update. Alvin, Texas American Agricultural Law Association,2001, 18, pp. 1-3, 6-7
Section V-1 page 101
Hayenga ML. 1998. Cost Structures of Pork Slaughter and Processing Firms: Behavioraland Performance Implications. Review of Agricultural Economics 20(2):574-83.
Hopkins J, Morehart M. September 25, 2000. An Empirical Analysis of the FarmProblem: Comparability in Rates of Return. Challenging the AgriculturalEconomics Paradigm, A Symposium Honoring the Career of Luther G. Tweeten. Columbus, Ohio: Department of Agricultural Economics, The Ohio StateUniversity.
Innes R. 2000. The Economics of Livestock Waste and Its Regulation. American Journalof Agricultural Economics 82:97-117.
Innes R. 1999. Regulating Livestock Waste: An Economic Perspective. Choices :14-9.
Levins RA. 2001. Book Review: Rats in the Grain. Choices :47.
Lieber JB. 2000. Rats in the Grain. New York and London: Four Walls Eight Windows.
Lovell SI, Kuch PJ. 1999. Rethinking Regulation of Animal Agriculture. Choices :9-13.
MacDonald JM, Ollinger ME. 2000. Scale Economies and Consolidation in HogSlaughter. American Journal of Agricultural Economics 82(2):334-46.
Metcalfe M. 2000. State Legislation Regulating Animal Manure Management. Review ofAgricultural Economics 22(2):519-32.
Muth M, Wohlgenant MK. 1999. A Test for Market Power Using Marginal Input andOutput Prices With Application to the U.S. Beef Processing Industry. AmericanJournal of Agricultural Economics 81:638-43.
Park D, Seidl A, Davies S, Frasier WM. 6/2000. Environmental Policy Influences onLivestock Stocking and Location Decisions. Located at: http://agecon.lib.umn.edu/cgi-bin/pdf_view.pl?paperid=2224.
Paul CJM. 2001. Market and Cost Structure in the U.S. Beef Packing Industry: A Plant-Level Analysis. American Journal of Agricultural Economics 83(1):64-76.
Schroeder T, Ward C. 6/30/2000. Price Discovery Issues and Trends in Cattle and HogMarkets. Kansas State University and Oklahoma State University. Located at: http://agecon.lib.umn.edu/cgi-bin/pdf_view.pl?paperid=2216.
Senauer B. 4/2001. The Food Consumer of the 21st Century: New ResearchPerspectives, Working Paper 01-03. St. Paul, Minnesota: Retail Food IndustryCenter, University of Minnesota.

Section V-1 page 102
Short S. 9/2000. Structure, Management, and Performance Characteristics of SpecializedDairy Farm Businesses in the United States. Washington, DC: USDA EconomicResearch Service. Located at: www.ers.usda.gov.
Sparby M, AURI Program Development Director. March 9, 2001. Presentation onFinancing and Business Planning, at the On-Farm Dairy Processing Roundtable.University of Minnesota, St. Paul, MN:
Ward RW, Stevens T. 2000. Pricing Linkages in the Supply Chain: The Case ForStructural Adjustments in the Beef Industry. American Journal of AgriculturalEconomics 82(5):1112-22.
Wilcox D. Agricultural Development Section, Minnesota Department of Agriculture. 2/1/2001. Feedlot Financial Needs Assessment Report [Web Page]. Located at:http://www.mda.state.mn.us/feedlots/assessment.pdf. Accessed 2/26/2001.
CRITICAL REVIEW OF INFORMATION SOURCES(Original Plus Updates)
Topic D covers the dimensions of the Minnesota livestock industry, including thenumbers, locations, and nature of feedlots; the business structures used by livestockoperations; the ownership and control of livestock operations; the present marketsituation; and the competitiveness of Minnesota livestock producers in national andinternational markets.
Topic E covers the profitability and overall economic viability of both livestock farmsand livestock processing firms including how they are affected by such factors aseconomies of scale, production methods, marketing arrangements, and governmentpolicies and programs. Livestock processing firms are discussed above under questionD4, so the discussion under topic E questions will focus on farms.
QUESTION D2. WITH RESPECT TO THE FOLLOWING FACTORS,WHAT IS THE CURRENT SITUATION IN THE MINNESOTA LIVESTOCKINDUSTRY, WHAT ARE THE CHANGES TAKING PLACE, WHY ARE THECHANGES OCCURRING, AND WHAT ARE THEIR IMPLICATIONS:
a. Geographic distribution, and size of enterprise
General Livestock Industry Trends

Section V-1 page 103
Farm structure discussions frequently cover aspects such as (Quiroga 1991; Gunderson etal. 2000; U.S. Census of Agriculture 1998):
• Number and size of farms: Total number of U.S farms peaked at 6.8 million farms in1935, and has declined to 1.9 million in 1997. Average acres per farm increased from155 acres in 1935 to 487 acres in 1997.
• Concentration: Seventy-four percent of the farms were non-commercial (sales lessthan $50,0000) in 1997 and accounted for 7 percent of the production. Farms withsales of $1 million or more made up 1.4 percent of the farms but accounted for 42percent of the gross sales. Four percent of farms produced half of the gross sales.Eight percent produced 72% of the gross sales. Seventeen percent of the farmsproduced half of the gross sales in 1900 compared to 4 percent in 1997.
• Tenure: Most operations were full owners in 1997, but part owners and tenants hadlarger farms. Tenure differs by sales class, with commercial farms less likely to be fullowners. Land leasing has changed from a way for beginning farmers to enteragriculture to a way of gaining access to additional assets. This allows farmers toavoid debt and risks associated with ownership, and to be able to respond morequickly to changing market conditions.
• Legal Organization: Most U.S. farms are organized as single proprietorships, butpartnerships and family corporations tend to be much larger. Partnerships made uponly 9 percent of the U.S. farms in 1997 but accounted for 18% of the gross sales.Family and non-family corporations were 4 percent of the farms but had 29% of thegross sales.
• Contracting: Farmers have become more reliant on production and marketingcontracts over the past 40 years. Eleven percent of U.S. farms had at least onemarketing contract, but these farms accounted for 40 percent of the gross sales.
• Operator Characteristics: Full time commercial farms made up 21 percent of allfarms, but accounted for 76 percent of the value of gross sales. Forty five percent ofall farm operators reported farm or ranch as their major occupation in 1993, operated73 percent of the land and had 82% of the gross sales. Retired operator accounted fora substantial proportion of all farms but produced relatively little.
• Operator households: Farm operator households typically receive income from severalsources, and 88% of their household income came from off the farm in 1997. Therelative importance of off-farm income varies widely among different farm types.
Recent trends in the Minnesota livestock industry are shown in Table 2. There were15,800 Minnesota operations with beef cows and 2,700 with sheep in 1999. Opeationswith cattle on feed numbered 7,400 as of 1998. Cattle and sheep numbers are down in
Section V-1 page 104
the state. Numbers of sheep and lambs are down by almost a third since 1993, althoughthe January 2000 inventory has started to rebound with a 6 percent increase. Cattle onfeed has also rebounded a bit over the past two years, which would be expected given thelow feed prices. Beef cow numbers seem to be on a fairly steady downward slide over theperiod. Dairy cow numbers declined by eighteen percent between 1993 and 2000, but herate of decline appears to be slowing.
The sectors that have shown growth since the early 1990s are hogs, layers, and turkeys. Perhaps the big story is hogs -- there were 17 percent more hogs and pigs on Minnesotafarms in December 1999, compared to December 1992. The pig crop also increased since1993, but both the pig crop and December inventory saw declines between 1998 and1999.
Turkey production has grown since the early 1993, but appears to have leveled off in thepast year. The number of laying hens is also up by 1.3 million. The Golden Ovaloperation in Renville County is at around two million hens, so it would appear that therest of the egg industry is pretty static.
Consolidation of livestock production onto fewer farms is very evident in the hog anddairy farm numbers. The number of operations with hogs declined by 46 percent between1993 and 1999. Dairy operations are also down, by 28 percent. Not much change isevident in the number of cow-calf operations, while the number with cattle on feed isdown eight percent. The number of sheep operations was down substantially as of a yearago.
The 1997 Census of Agriculture reports that there were 819 Minnesota operations with 50percent or more of their sales from poultry and eggs. Of those, 219 had 50 percent ormore of sales from chicken eggs, 168 from broilers, and 257 from turkeys.

Section V-1 page 105
Table 4. Changes in the Minnesota Livestock Industry, 1993-99
Species 1993 1998 1999 2000 1998-99
1999-2000
1993-99
1993-2000
number of animals (000) percentInventories and Production:
All sheep & lambs, 1/1inventory
245 165 175 165 6% -6% -29% -33%
All cattle, 1/1 inventory 2,849 2,500 2,500 2,550 0% 2% -12% -10%
Cattle on feed, 1/1 inventorya 330 265 270 285 2% 6% -18% -14%Beef cows, 1/1 inventory 410 395 385 400 -3% 4% -6% -2%Milk cows, 1/1 inventory 660 555 545 540 -2% -1% -17% -18%All hogs and pigs, prev. 12/1inv.
4,700 5,700 5,700 5,500 0% -4% 21% 17%
Pig crop, annual 8,618 9,612 9,289 -3% 8%Turkeys raised, annual 42,000 44,500 43,500 -2% 4%Laying hens, annual average 10,731 12,032 12,310 2% 15%Broilers raised, annual 46,600
1993 1997 1998 1999 1997-98
1998-99
1993-99
Operations with: Number operations percent changeHogs 14,000 9,000 8,500 7,500 -6% -12% -46%All cattle and calves 38,000 33,000 31,000 30,000 -6% -3% -21%Milk cows 13,500 10,500 9,700 9,100 -8% -6% -33%Beef cows 16,000 16,000 15,800 15,800 -1% 0% -1%Cattle on feed 8,000 7,500 7,400 -1%Sheep 4,800 2,900 2,600 2,700 -10% 4% -44%
All farmsb 86,000 81,000 80,000 81,000 -1% 1% -6%Source: (Minnesota Agricultural Statistics 2000)
aCattle on feed are animals for slaughter market being fed a ration of grain or otherconcentrates and are expected to produce a carcass that will grade select or better.
bA farm is any establishment from which $1,000 or more of agricultural products weresold or would normally be sold during the year.
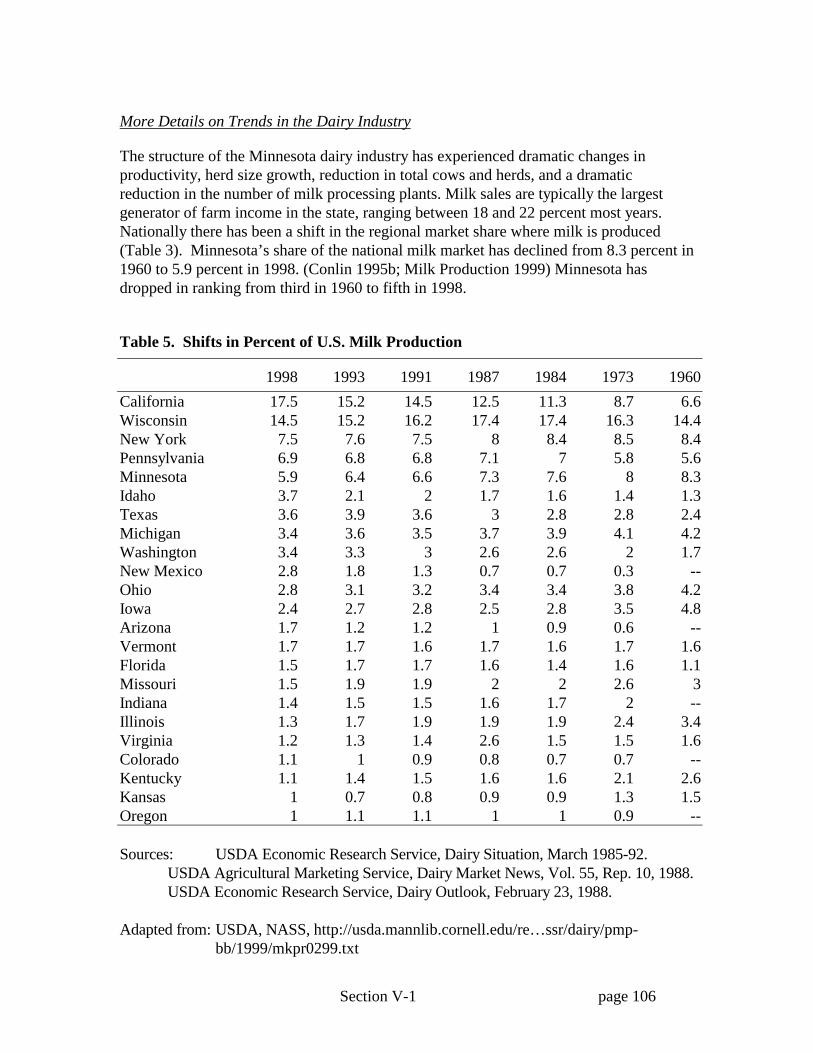
Section V-1 page 106
More Details on Trends in the Dairy Industry
The structure of the Minnesota dairy industry has experienced dramatic changes inproductivity, herd size growth, reduction in total cows and herds, and a dramaticreduction in the number of milk processing plants. Milk sales are typically the largestgenerator of farm income in the state, ranging between 18 and 22 percent most years.Nationally there has been a shift in the regional market share where milk is produced(Table 3). Minnesota’s share of the national milk market has declined from 8.3 percent in1960 to 5.9 percent in 1998. (Conlin 1995b; Milk Production 1999) Minnesota hasdropped in ranking from third in 1960 to fifth in 1998.
Table 5. Shifts in Percent of U.S. Milk Production
1998 1993 1991 1987 1984 1973 1960California 17.5 15.2 14.5 12.5 11.3 8.7 6.6Wisconsin 14.5 15.2 16.2 17.4 17.4 16.3 14.4New York 7.5 7.6 7.5 8 8.4 8.5 8.4Pennsylvania 6.9 6.8 6.8 7.1 7 5.8 5.6Minnesota 5.9 6.4 6.6 7.3 7.6 8 8.3Idaho 3.7 2.1 2 1.7 1.6 1.4 1.3Texas 3.6 3.9 3.6 3 2.8 2.8 2.4Michigan 3.4 3.6 3.5 3.7 3.9 4.1 4.2Washington 3.4 3.3 3 2.6 2.6 2 1.7New Mexico 2.8 1.8 1.3 0.7 0.7 0.3 --Ohio 2.8 3.1 3.2 3.4 3.4 3.8 4.2Iowa 2.4 2.7 2.8 2.5 2.8 3.5 4.8Arizona 1.7 1.2 1.2 1 0.9 0.6 --Vermont 1.7 1.7 1.6 1.7 1.6 1.7 1.6Florida 1.5 1.7 1.7 1.6 1.4 1.6 1.1Missouri 1.5 1.9 1.9 2 2 2.6 3Indiana 1.4 1.5 1.5 1.6 1.7 2 --Illinois 1.3 1.7 1.9 1.9 1.9 2.4 3.4Virginia 1.2 1.3 1.4 2.6 1.5 1.5 1.6Colorado 1.1 1 0.9 0.8 0.7 0.7 --Kentucky 1.1 1.4 1.5 1.6 1.6 2.1 2.6Kansas 1 0.7 0.8 0.9 0.9 1.3 1.5Oregon 1 1.1 1.1 1 1 0.9 --
Sources: USDA Economic Research Service, Dairy Situation, March 1985-92.USDA Agricultural Marketing Service, Dairy Market News, Vol. 55, Rep. 10, 1988.USDA Economic Research Service, Dairy Outlook, February 23, 1988.
Adapted from: USDA, NASS, http://usda.mannlib.cornell.edu/re…ssr/dairy/pmp-bb/1999/mkpr0299.txt

Section V-1 page 107
The greatest gains in market share have come in the western states of California,Washington, Arizona, New Mexico, and Idaho. California has increased its market shareby a factor of more than 2.5 since 1960 and is still growing. Pennsylvania, Michigan, andVermont have tended to hold their market share, while the rest of the Northeast andMidwest has declined. States losing market share have been in the more traditional dairyareas - Wisconsin, Minnesota, Iowa, Illinois, Ohio, New York, Missouri, and Kentucky.The reasons for these shifts are not well documented in the literature but there is evidenceof differences in the average cost of production (Table 11 below), productivity (MilkProduction various issues), herd size (Table 4), use of technology, level of specialization,and mode of operation. These traditional areas tend to be made up of herds lesshomogenous in the way they are managed with smaller herd sizes, and more diversifiedoperations that grow a major portion of the feed supply that is marketed as milk.
Minnesota reached a peak of 151,064 dairy farm in 1945. More than 80% of the farmssold milk at that time. Dairy herd numbers were at 9,100 or 12% of the farms in 1999.Cow numbers have dropped from a high in 1945 of 1,660,000 to 540,000 in 2000. Thedairy cow density on agricultural land has sharply decreased from 19 acres per cow in1945 to 54 acres per cow in 1998. Herd size in Minnesota has increased from 11 to 58cows per herd between 1945 and 1998. The number of small and medium herd sizecategories are decreasing most rapidly and the two largest herd size categories, above200, cows are increasing in number in the 1990s. The average herd size nationally is 79cows per herd. Table 3 documents the herd size profile of Minnesota dairies with othermajor milk producing states and state that have been increasing their market share.
Table 6. Herd Size Profile Percent Inventory by Size Groups for Selected States -- 1998
1-29 30-49 50-99 100-199 200-499 500+
Percent of total cowsCalifornia -- -- -- 3 18 78
Wisconsin 5 21 43 18 10 3
New York 3 11 34 26 15 12
Pennsylvania 5 25 37 22 10 2
Minnesota 6 22 40 16 12 4
Michigan 5 11 25 32 18 10
Idaho 1 2 6 12 19 61
Washington -- 1 4 16 32 47
New Mexico -- -- -- 1 3 96
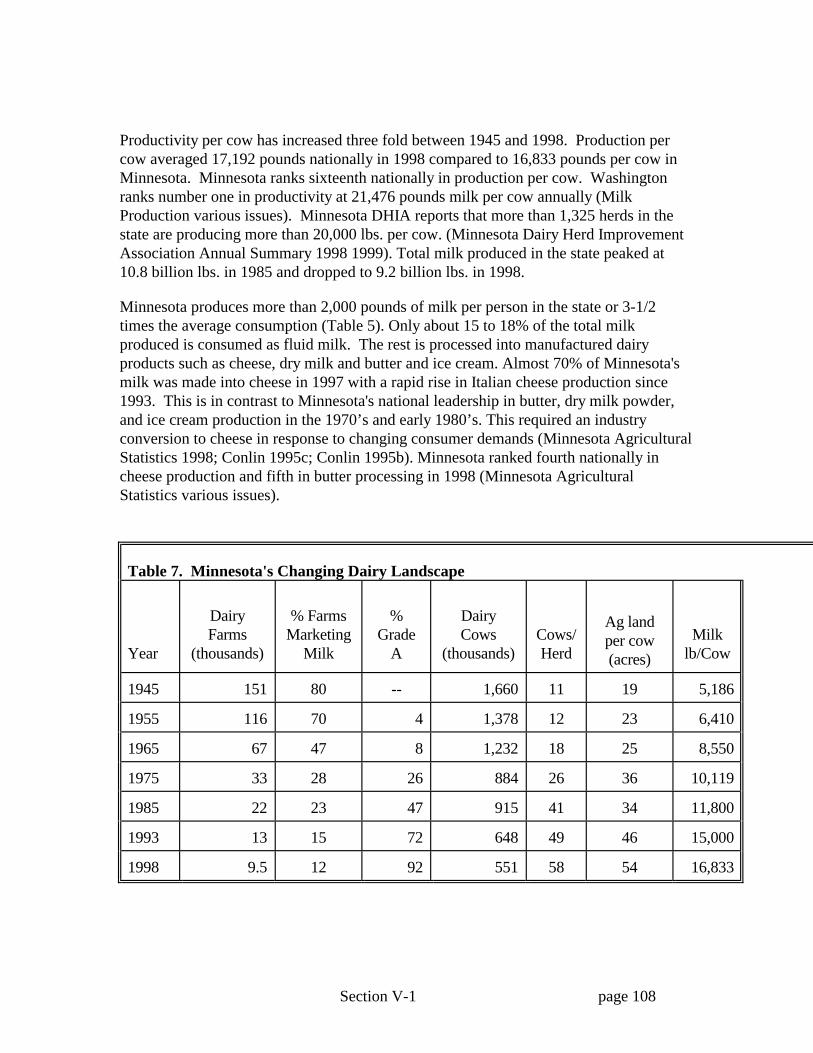
Section V-1 page 108
Productivity per cow has increased three fold between 1945 and 1998. Production percow averaged 17,192 pounds nationally in 1998 compared to 16,833 pounds per cow inMinnesota. Minnesota ranks sixteenth nationally in production per cow. Washingtonranks number one in productivity at 21,476 pounds milk per cow annually (MilkProduction various issues). Minnesota DHIA reports that more than 1,325 herds in thestate are producing more than 20,000 lbs. per cow. (Minnesota Dairy Herd ImprovementAssociation Annual Summary 1998 1999). Total milk produced in the state peaked at10.8 billion lbs. in 1985 and dropped to 9.2 billion lbs. in 1998.
Minnesota produces more than 2,000 pounds of milk per person in the state or 3-1/2times the average consumption (Table 5). Only about 15 to 18% of the total milkproduced is consumed as fluid milk. The rest is processed into manufactured dairyproducts such as cheese, dry milk and butter and ice cream. Almost 70% of Minnesota'smilk was made into cheese in 1997 with a rapid rise in Italian cheese production since1993. This is in contrast to Minnesota's national leadership in butter, dry milk powder,and ice cream production in the 1970’s and early 1980’s. This required an industryconversion to cheese in response to changing consumer demands (Minnesota AgriculturalStatistics 1998; Conlin 1995c; Conlin 1995b). Minnesota ranked fourth nationally incheese production and fifth in butter processing in 1998 (Minnesota AgriculturalStatistics various issues).
Table 7. Minnesota's Changing Dairy Landscape
Year
DairyFarms
(thousands)
% FarmsMarketing
Milk
%Grade
A
DairyCows
(thousands)Cows/Herd
Ag landper cow(acres)
Milklb/Cow
1945 151 80 -- 1,660 11 19 5,186
1955 116 70 4 1,378 12 23 6,410
1965 67 47 8 1,232 18 25 8,550
1975 33 28 26 884 26 36 10,119
1985 22 23 47 915 41 34 11,800
1993 13 15 72 648 49 46 15,000
1998 9.5 12 92 551 58 54 16,833

Section V-1 page 109
Geographic shifts in milk production have also been occurring within the state.Minnesota's dairy belt has ranged from the Southeast: Houston and Fillmore counties, upthrough Winona, Goodhue, Wabasha, Rice, Carver, Wright, Stearns, Morrison, Todd,Ottertail and Becker Counties. The top five milk producing counties are Stearns, Ottertail,Winona, Morrison, and Goodhue. Over time, the exodus from dairying has been morepronounced outside of this region resulting in a greater geographic consolidation. (Conlin1995b)
The structure and performance of specialized dairy farm businesses in the U.S. aredescribed in (Short 2000). "Specialized dairy farm businesses" were those that had atleast $50,000 in dairy-related sales. Data from the 1993-95 USDA Farm Costs andReturns Surveys and the 1996 Agricultural Resource Management Study showed thatmilk producers are struggling to adjust to markets that are more dependent on the forcesof supply and demand. In general, they did a fairly good job of meeting short-term debt,generating returns, and meeting long-term debt from 1993 to 1996. Those in the UpperMidwest region of Minnesota, Wisconsin and Michigan earned rates of return on equityof 2 to 3 percent (considering only current income, not capital gains) over the four-yearperiod. These rates of return were similar to the national averages, except for 1993 whenwet weather affected the region. Herd size was the most significant factor contributing tovariation in net farm income, accounting for 90% of the variation. Production, financial,and marketing strategies were compared across regions and farm sizes. One notableresult was that the larger farms used marketing strategies extensively. Almost half of theUpper Midwest farms with $500,000 in sales contracted the sales of their product as amarketing strategy. Hedging, on the other hand, was not used very much.
Professor Joe Conlin, a University of Minnesota extension dairy scientist working withthe dairy industry since 1968, characterized some of the changes taking place in theMinnesota dairy industry over time. See Table 6, based on agricultural statistics availablefrom the Minnesota Department of Agriculture. (Conlin 1995b)
He identified ten major trends that are underway in the dairy industry (Conlin 1995b):
1) Dairy farms are restructuring to larger, more specialized farms that are multi-personowned and operated, on a relatively smaller land base with greater vertical integrationwith the market and input sectors, and more diversity in size and productionprocesses.
2) Higher priority given to management goals: efficiency, profitability and life qualitywith higher productivity per unit of labor, feed, and asset, more emphasis on effectivemanagement of people, adoption of cost effective technologies, use of outsideexpertise and greater systemization, routinization and specialization of productiontasks.
Section V-1 page 110
a) Implementation of quality management concepts such as management informationsystems, strategic and tactical business plans and action protocols, team work, andmonitoring and control systems.
b) Increased business networking and collaboration through joint ownership, creativefinancing and risk sharing, leasing arrangements, closer linkages betweenproduction and consumption, more outsourcing operational phases, and greateruse of external advisors.
3) Greater price volatility with less government involvement in regulating prices of feedand milk, and expanding potential for export pressures and greater use of price risktools such as futures, options, and contracts.
4) Stronger consumer driven markets with more emphasis on quality defined in humanhealth/safety risks, consumer tastes, packaging and product preferences, with growingcompetitive opportunities in international markets and niche markets and productdifferentiation.
5) Restructuring of the dairy industry business/service sector with mergers, andconsolidations having fewer processing plants, greater privatization of information,globalization of technology and services, with a feed industry becoming more pricedriven with greater use of commodities, and separation of consulting services fromproduct sales.
6) Changing public policy with markets being more driven by supply/demand andquality, less regulation of pricing policies, broader public input on agricultural policy,particularly issues related to the environment, food safety, and animal care. The dairybusiness will be more sensitive to broad government policies related to taxes, interestrate, environment, health, trade, crop programs, etc.
7) Stricter environmental protection policies related to protection of ground water andair quality that will bring greater integration of manure application with the croppingand land characteristics.
8) Cow numbers will shift to regions that have dairy friendly communities with plentifulsupplies, cost competitive feed and services, with a desirable climate, infrastructure ofdairy support services and markets, and where there is access to capital.

Section V-1 page 111
Table 8. Dairying's Contribution To Farm Income
Year
Gross FarmMilk Income($ thousands)
% TotalFarm Income
Dairying
AveragePrice $/cwt
State TotalMilk lb.(billions)
No. MinnesotaButter & Cheese
Plants
1945 184 20 2.70 8.6 845
1955 247 19 3.12 8.8 625
1965 348 22 3.34 10.7 327
1975 687 15 7.68 8.9 86
1985 1,026 21 12.05 10.8 44
1993 1,229 18 12.67 9.7 27
1998 1,362 16 13.19 9.2 20
More Details on Trends in Other Livestock and Poultry
Table 7 shows percentage shifts in market share for the top ten states and Minnesota (ifnot one of the top ten) for selected years since 1970. Minnesota has been losing marketshare in beef cow-calf and cattle feeding operations, while our pork industry share isincreasing. While the state's sheep numbers in absolute terms are down (see Table 1), soare national inventories so that in percentage terms our market share is fairly stable. Ourpoultry market share has also been stable in the 1990s. One question that has been raisedis whether there are any examples of states where livestock production was declining interms of market share vs. other states, and had turned around and is growing today. Missouri and Oklahoma's increases in hog inventories since 1991 are two exampleturnarounds that stand out. Wyoming's market share in sheep inventories also increasedin 1998, but they actually lost inventories in absolute terms, just not to the extent thatother states did.

Section V-1 page 112
Table 9. Shifts in State Market Shares of U.S. Livestock and Poultry ProductionBeef cows, 1/1 inventory
1998 1995 1992 1990 1985 1980 1975 1970TX 16.4 17.1 16.2 15.7 15.8 15.1 15.2 15.3MO 5.9 6.0 6.1 5.9 5.7 6.1 6.1 5.2OK 5.8 5.6 5.7 5.7 5.6 5.8 6.0 5.8NE 5.7 5.4 5.2 5.3 5.1 5.3 5.2 5.0SD 4.6 4.7 4.5 4.5 4.6 4.1 4.7 4.6MT 4.6 4.4 4.3 4.0 4.3 3.8 3.7 4.3KS 4.3 4.3 4.0 4.2 4.3 4.6 4.3 4.9KY 3.4 3.3 3.3 3.1 2.9 3.0 3.1 2.9FL 3.0 3.2 3.2 3.3 3.3 3.2 3.2 2.4IA 2.9 3.0 3.4 3.4 3.7 4.7 4.0 3.9MN 1.2 1.2 1.1 1.1 1.2 1.5 1.6 1.4other 42.2 43.0 44.3 44.9 44.7 44.3 44.4 45.7
Cattle on feed, 1/1 inventory1998 1996 1993 1991 1986 1981 1976 1971
TX 21.0 20.6 19.4 18.3 18.7 15.8 14.6 11.6KS 17.4 17.3 15.1 13.8 12.5 9.5 10.4 7.2NE 16.9 15.9 16.8 18.2 16.6 14.1 10.8 11.1CO 8.4 8.4 7.9 7.9 8.2 7.3 7.2 6.8IA 7.3 5.7 7.0 8.2 5.9 11.8 11.8 15.6OK 3.2 3.2 2.7 2.6 2.8 2.8 2.2 1.9CA 2.9 2.7 3.5 3.5 4.0 5.8 7.4 7.8SD 2.3 2.6 2.7 2.5 3.1 3.1 2.8 2.7ID 2.2 2.1 2.2 2.0 1.8 2.1 1.6 1.7MN 2.0 2.6 2.6 2.7 2.6 3.2 3.3 4.3other 16.3 18.9 20.2 20.3 23.8 24.5 27.9 29.3
Hogs and pigs, 12/1 inventory1997 1994 1991 1989 1984 1979 1974 1969
IA 23.4 24.2 26.0 25.1 26.3 24.1 24.3 24.6NC 16.2 11.7 6.3 4.8 4.3 3.9 3.4 2.8MN 9.0 8.1 8.5 8.3 8.0 7.3 6.7 5.5IL 7.9 8.9 10.2 10.6 10.0 10.3 11.8 11.6NE 5.9 7.3 7.8 7.8 6.8 6.2 5.5 5.0MO 5.8 5.8 4.7 5.0 6.4 6.9 7.1 7.4OK 2.7 1.0 0.3 0.4 0.4 0.5 0.6 0.7OH 2.7 3.0 3.3 3.9 3.6 3.1 3.5 4.5KS 2.4 2.2 2.5 2.7 3.0 3.1 3.2 2.9SD 2.1 2.9 3.4 3.2 3.0 3.0 3.1 3.0other 21.8 25.0 26.9 28.3 28.4 31.6 30.7 32.0

Section V-1 page 113

Section V-1 page 114
Table 6 (continued)Breeding sheep and lambs, 1/1inventory
1998 1995 1993 1990 1985 1980 1975 1970TX 21.1 21.0 21.9 19.7 18.9 20.3 20.0 19.6WY 9.2 8.4 8.6 7.3 8.4 8.7 9.6 9.8CA 7.9 8.4 7.7 8.1 9.8 9.0 7.3 6.8MT 7.0 7.0 6.3 6.7 5.3 5.1 5.0 6.2SD 6.0 6.3 6.0 5.6 6.4 6.5 5.8 5.8UT 5.7 5.6 5.4 5.1 5.5 5.4 5.3 5.6CO 4.3 3.9 4.5 4.7 4.2 4.6 4.4 4.7ID 4.2 3.7 2.8 2.8 3.3 4.1 4.5 3.6NM 3.9 4.1 4.6 4.9 5.5 5.4 4.4 4.5OR 3.2 3.8 3.9 3.6 3.9 3.5 2.9 2.6MN 2.0 2.2 2.2 2.2 2.1 2.0 2.4 2.4other 25.5 25.8 26.1 29.4 26.6 25.5 28.3 28.2
Turkeys raised, annual1996 1994 1992 1990 1985 1980 1975 1970
NC 20.3 20.6 20.9 19.2 16.1 12.9 10.6 8.1MN 13.2 12.8 12.8 14.1 14.2 13.7 16.2 16.9MO 8.1 7.2 6.8 6.0 6.6 7.4 6.7 7.3AR 7.3 7.7 8.2 7.5 8.0 8.5 5.9 6.5CA 6.9 6.8 7.9 12.0 11.5 13.5 13.2 13.9VA 6.6 6.2 5.7 5.2 6.6 5.5 4.4 3.5IN 4.9 5.1 5.5 4.8 3.5 3.7 3.7 4.3SC 3.6 2.6 3.1 2.8 2.2 2.8 2.7 2.7PA 3.4 3.1 2.8 2.8 3.6 3.0 2.4 2.0OH 3.2 2.7 2.3 2.2 1.9 1.6 2.4 3.4other 22.5 25.2 24.1 23.5 25.8 27.4 31.8 31.4
Broilers raised, annual1996 1993 1991 1989 1984 1979 1974 1969
AR 15.5 15.1 15.5 16.1 16.2 16.2 15.3 14.0GA 15.5 14.4 14.0 14.9 14.6 13.7 14.0 15.4AL 11.5 13.0 13.8 13.1 17.6 12.1 12.7 12.3NC 9.7 10.2 9.8 10.2 10.5 9.9 10.1 10.3MS 8.5 7.9 7.2 6.8 7.2 7.0 7.4 7.7TX 5.2 5.3 5.5 5.2 4.7 5.7 5.8 5.9DE 3.9 4.2 4.4 4.7 5.1 4.9 5.2 5.2MD 3.8 4.4 4.3 4.6 6.4 6.5 6.7 6.8VA 3.4 3.7 3.6 3.3 3.6 3.1 2.5 2.2CA 3.2 3.6 4.2 4.4 4.6 3.9 3.4 2.9MN 0.7 0.8 0.8 0.8 0.7 0.5 0.4 0.5other 19.1 17.4 16.6 15.8 8.8 16.6 16.5 16.8Source: (Minnesota Agricultural Statistics 1998)

Section V-1 page 115
Information on the size distribution of swine operations is available from several sources. The USDA National Agricultural Statistics Service publishes data on the number ofswine operations and percent of inventory by size in the December 1 Hogs and Pigsreports each year. This is usually the most current source of information, and is based onsurveys which appear to be reasonably sound from a statistical standpoint. One drawbackof the Hogs and Pigs Report data is that it does not provide much detail on the largestsized operations, since the largest size category is "over 5,000 pigs" in inventory. Another source with more detail is the Census of Agriculture. This includes sizebreakdowns by number in inventory, number sold per year, and number of littersfarrowed per year. The census is probably the most accurate data available, since allfarms are enumerated rather than only a sample as with the Hogs and Pigs report. Adrawback of the census is that it is only done every five years, so the data is not always ascurrent as with Hogs and Pigs. It also is somewhat lacking in detail about the largest sizecategories, with the largest size categories being "5,000 or more pigs inventory", "7,500or more pigs sold per year", and "1,000 or more litters farrowed per year."
These three different size measures can be confusing for the casual reader, so care mustbe taken when comparing different sources to assure consistency of comparisons. Formost intensively managed swine operations, the number of pigs sold per year will begreater than the number in inventory at any point in time, since it only takes about sixmonths for a pig to reach market weight. Also, roughly 7 - 10 pigs are typically sold perlitter farrowed, depending on the age at sale, death losses, and other factors, so thenumber sold will be greater than the number of litters farrowed. The numbers are furthercomplicated by the fact that some operations both farrow and finish the pigs to marketweight, while increasingly operations only farrow the pigs and sell or transfer them toothers for finishing.
A third source with more detail on the largest operations is a series of annual surveysconducted by researchers at Iowa State University and the University of Missouri. Thelatest report from this activity is (Lawrence et al. undated). The sampling frame is basedmainly on the list of subscribers to a swine trade magazine, with complete enumeration ofthe largest operations. As such, its statistics may not be quite as reliable as the other twosources but is often used because of its additional detail. The size distribution by numbermarketed (sold) per year is shown in Table 8. It shows that there were 18 operationsmarketing 500,000 or more pigs per year in 1997, representing 24 percent of total U.S.slaughter.
Their summary of the most recent size trends was:
"Consolidation of the pork industry is continuing.However, the changes are occurring primarily inthe largest and smallest groups of producers. Thelargest operations are gaining the greatest marketshare and the very smallest are showing the

Section V-1 page 116
greatest loss. In 1997, 145 firms marketing 50,000hogs or more a year marketed approximately 33.1million head (37% of U.S. produced) of hogs in1997 (Table 7). This figure compares with 16million head from 66 firms in that size class in1994, the last such study completed (Grimes andRhodes, 1995). This is a dramatic increase in onlythree years. Another 51.7 million hogs (56%) weremarketed by an estimated 23,400 operations selling1,000-49,999 head a year. The remaining 5% of theU.S. hogs were marketed by approximately 80,000farms selling fewer than 1,000 hogs annually basedon USDA estimate of the number of farms with hogs,December 1997, Hogs and Pigs." (p. 2)
Table 10. Estimated Number of U.S. Swine Operations and Share of U.S. Slaughter 1997,by Size Category.
Annual Number of Marketings Operations Market Share(1000 Head) (Number) (%)
<1 80,000 5.41-2 11,708 12.12-3 4,996 9.73-5 3,438 9.9
5-10 1,978 9.910-50 1,318 16.2
50-500 127 13.1500+ 18 23.8
Source: (Lawrence et al. undated)

Section V-1 page 117
In the hard copy and PDF versions, four maps from MN Ag Stats will be inserted hereshowing which MN counties have concentrations of different livestock species

Section V-1 page 118
c. Type of business organization and degree of vertical integration orcoordination
One source of information on type of business organization is the Census of Agriculture,which gives a breakdown of the number of sole proprietorships, partnerships, andcorporations (U.S. Census of Agriculture 1998). All farms are lumped together in thestatistics, rather than having a separate breakdown just for livestock livestock operations.Corporations with more than ten shareholders made up only 0.3 percent of Minnesotafarms in 1997, and accounted for 4.2 percent of the market value of products sold.
Extent of Marketing and Production Contracts in the Swine Industry
It would be possible to measure vertical integration or coordination by measures such aspacker control of production through ownership of production facilities, marketingcontracts, or production contracts. Feed or genetics suppliers may exercise a certaindegree of control of production through ownership or contracts. Veterinarians and otherinformation providers may be involved in production decisions to some degree.
According to a February 1999 survey of nine the largest twelve pork packers, 64 percentof the slaughter hog purchases during January 1999 were priced under some contractualmethod other than the spot market (Hog Marketing Contract Study, University ofMissouri and National Pork Producers Council 1999). This was an increase from 57percent in 1997. Formula price contracts tied to the spot market amounted to 44 percentof sales, so that the spot market determined prices for 80 percent of the hogs which isdown only slightly from the 82.5 percent found in the 1997 survey. About 18 percent ofthe hogs were purchased under some system that supposedly reduces price risk toproducers, but the amount of the risk reduction is unclear because many of the contractsinvolve ledger balances which may have to be repaid later in the life of the contract. When the authors state that the spot market determined prices of hogs sold under formulaprices, we believe that they are speaking of daily price movements over the short run. Asone reviewer points out, over the longer run, increased use of marketing contracts maycause thinning of the spot market. As the spot market thins, the hogs sold on the spotmarket may become less representative which could frustrate price discovery. A morerecent report found that spot market sales of hogs were down to 17 percent of all hogs inJanuary 2001, which was an eight percent decline from a year earlier. If this rate ofdecline continues, the cash market could disappear within two years (Cash Hog PricesLikely to be Gone in Two Years 2001). This topic is discussed further under section D4f,“price discovery and market fairness.”
Production contracting may not initially be thought of as falling under "contractualbuying and selling arrangements," but it does involve buying and selling the farmoperation's labor, facility and other services, so will be mentioned here. The latest figureson the level of production contracting in the swine industry is from the 1998 IndustryStructure Study by Glenn Grimes, University of Missouri and John Lawrence, Iowa StateUniversity (Miller 1998). They found that 17 percent of 1997 slaughter hogs were

Section V-1 page 119
farrowed under contract, and 30 percent were finished under contract. They also lookedat when currently held contracts were signed. The largest signup was in 1997. Mostcontracts are set to expire at a fairly even rate between now and the year 2007. Production contracting is the norm in the poultry industry, with 85 percent of broilersgrown under contract in 1995. Most of the remaining chickens are grown on farmsowned and operated by the integrator (Perry et al. 1999).
The most recent USDA estimates of hog production costs and returns include informationon the use of contracts. They found that for the United States overall, 41 percent of allhogs were produced under contract in 1999. Regions ranged from 7 percent in theMississippi Portal region to 87 percent in the Southern Seaboard. In the Heartland region(southern Minnesota down to Missouri and east to Ohio), 29 percent were produced undercontract (Production Costs Changed Little in 1999, but Lower Commodity Prices CutMost Returns 2000).
Milk Marketing Contracts
No research-based studies were found on milk marketing contracts. Most milk ismarketed through farmer cooperatives with informal marketing arrangements thatproducers can change processors at relatively short notice. Upper Midwest milkprocessors are currently in highly competitive with each other to secure producer milk tomaintain plant-processing efficiency in the face of a declining supply. The authors areaware of several incentives processors are using to compete for producer milk such asquality premiums, discounts on hauling charges, management services, volumepremiums, and various forms of formal milk contracts. The extent to which milkcontracts are used is not available. Little is known about the terms of these contracts inthat they are proprietary and are confidential between the producer and processor.
Quantifying Vertical Coordination and Vertical Integration
Vertical coordination has been described as a continuum of vertical governancestructures, variable in the extent to which one party of a vertical exchange prescribes thebehavioral pattern of another (Henderson and Frank 1998). Henderson and Frank reviewthe literature on quantifying vertical coordination and vertical integration, and discuss themeasurement difficulties involved. They show upstream vertical coordination indices for38 different U.S. food-manufacturing industries for 1982. They find that, for example,ice cream and frozen desserts have an index of 0.999, while animal fats and oils are at0.009. Some other industries of relevance to the GEIS are processed egg products, 0.771; fluid milk, 0.543, and fresh meats, 0.528.
Related comments including a discussion of the USDA Packers and Stockyards study ofpacker concentration and vertical coordination in the swine industry is included underquestion D4 below.

Section V-1 page 120
The Top Fifty Milk Cooperatives in the U.S.
Hoards Dairyman compiles an annual summary of milk volume and membership of thetop fifty milk cooperatives in the U.S (Mowrey 1998). In 1998, the top fifty milkcooperatives in the U.S. ranked on volume of milk accounted for 120 billion pounds ofthe national production of 157 billion pounds in 1998. They claimed 70,820 memberdairy farmers. The ranking of the largest cooperatives has had some major shifts in themost recent years because of mergers. These shifts are expected to continue with veryrecent mergers and merger discussions in progress. The ten milk cooperatives withlargest milk volume accounted for half of total 1998 U.S. milk production:
Member Milk NumberDairy Cooperative (bil. pounds) MembersDairy Farmers of America, Springfield, MO 31,500 18,453Land O Lakes Inc, St Paul, MN 7,988 6,400California Milk Producers, Artesia, CA 6,750 336Foremost Farms USA, Barb, WI 5,400 5,850Family Dairies, Madison, WI 5,256 7,625 Darigold Farms, Seattle, WA 5,050 878Dairylea Cooperative Inc., Syracuse, N.Y. 4,886 2,369North Central AMPI, New Ulm, MN 4,400 5,000Dairymans Cooperative Creamery Assn, Tulare, CA 4,212 245Manitowoc Milk Producers Cooperative, Manitowoc, WI 3,540 3,230
The second-ranked cooperative, Land O Lakes, has merged with ninth-ranked DairymansCooperative Creamery Association since these 1998 figures were compiled.
"Industrialization" of the Swine Industry
The swine industry has been undergoing rapid changes in recent years along the lines ofthe earlier sectors discussed by Reimund et al., that some authors have termed"industrialization." An overview of recent trends and driving forces is included in achapter of Purdue University's Food System 21 report (Boehlje et al. 1997). The types ofvertical linkages and transaction methods in Canada, the Netherlands, and the U.S. arecompared by (Srivastava et al. 1998), who conclude that industrialization, globalization,and changes in consumer demand and preferences are resulting in massive structural andoperational changes in the international pork industry. More detail on specifictechnologies and their potential to improve profitability is provided in (Positioning YourPork Operation for the 21st Century 1995). New technologies and management strategiesthat are thought to be playing a major role include:
• feeding programs that are closely geared to animal needs during specific growthphases, and that respond more quickly to changes in ingredient availability and cost,
• health-enhancing technologies such as all in-all out rearing and early weaning thatmay reduce improve performance, dependence on antibiotics, and/or maintainacceptable performance in larger facilities,
Section V-1 page 121
• breeding systems which utilize crosses of specialized sire and dam lines to achievedesirable traits, and artificial insemination and related technologies which allow elitelines to be utilized more widely,
• more careful facility design and better information systems to improve throughput ofanimals from a given investment in land and buildings, and
• networked (cooperative) selling and/or buying among groups of producers, andinformation sharing among producers and between producers and processors tocapitalize on quantity- and quality-based premiums and discounts and identify areasthat need improvement.
Government policies and regulations that Boehlje et al. expect to shape the future of thehog/pork industry fall into the areas of:
• environmental regulations,
• animal well-being,
• worker safety, and
• policies regarding concentration, control, market access, and price discovery.
Implications they see for the future include:
• more site-specific micro production management,
• optimization of the supply chain from genetics to the end-user/consumer with betterflow scheduling and resource utilization, better quality control, reduced food safetyrisks, and increased ability to respond to consumer demand for specific attributes,
• continued challenges related to environmental and odor problems which will affectsize and location, unless technological fixes are developed,
• an increased role for producer associations that provide services to their members,
• trace-back systems from final product to genetics to quickly and easily indentifysources of contamination,
• heightened risk from new sources such as shutdown of large plants or disruption ofcontracts, globalization, and more specialized production units.
• Decisions concerning new production, processing, and distribution centers will tendto be made in a more coordinated fashion than in the past when they were maderelatively independently.
• Technological advances in production and processing could dramatically alter thelabor requirements to manufacture pork.

Section V-1 page 122
• Pork's competitive position could improve relative to beef and possibly even relativeto poultry. Finally, ownership of world pork production and processing could becomemore globalized with more firms investing across national boundaries.
Another analysis of industrialization of the pork sector is presented by several authors in(Royer and Rogers 1998). The chapter by Rhodes in that book includes a number ofsuggestions for research on ways to:
• reduce social costs of the changes,
• help smaller operations to remain competitive,
• manage the risks involved in the new industry structure,
• assure legal protections for growers that make sense in terms of efficiencyconsiderations, market and political realities, and mainstream ethics, and
• evaluate the tradeoffs for various current and potential production areas, and developinstitutional rules that could greatly reduce social costs.
The chapter by Ginder in the same book characterizes the situation in terms of abifurcated production channel, with one side being a producer-centered, commodity hogside dominated by independent producers and a few large production contractors, alongwith a specialty hog side diminated by the industrialized producers with packing andprocessing facilities.
The future role of cooperatives under a more industrialized agriculture is an issue whichhas received attention from a number of researchers. (Fulton 1995) and (Cook 1995)discussed the outlook for cooperatives. Fulton concludes that the changes in bothtechnology and society's values (more individualism) are likely to make cooperation moredifficult in the future. He argues that many cooperatives have been predicated on creatingopportunities for farmers in a world of spot markets, and more direct marketing channelsand reductions in output variability would diminish the opportunities for cooperatives. Cook sees a promising but challenging future for cooperatives that take a more offensiverather than defensive approach, and a number of factors conducive to successfulcollective action in U.S. agriculture, such as where there is a new market in whichexisting preferences are unknown, where declining markets exist, where shared riskthrough relational contracts can be accomplished, or where producers recognize asset-specificity-driven opportunism in the early stages of technology adaptation.
Changes in farm profitability and food demand in recent years have led to a great deal offarmer interest in projects to add value to farm products. (Siebert et al. 1997) reviewsome of the risks involved in post-harvest value added investment decisions, especiallywhen the new market level being entered is not thoroughly understood. They suggest analternative: investing in publicly traded equities (stocks) of investor-owned processingfirms. For example, ConAgra, IBP, Hormel or Smithfield Foods might provideinvestment opportunities for livestock producers who are seeking to capture value addedat the processing level. Siebert et al. suggest a formula for calculating the size of the
Section V-1 page 123
investment needed to achieve a balance between the size of the farm's marketings and thediversification capacity of the value added investment.
Production Networks as a Minnesota Response to Swine Industry Industrialization
A number of Minnesota pork producers became involved in swine production networks inthe mid-1990s. Twenty producers interviewed in late 1995 cited a number of specificreasons for joining networks (Koehler et al. 1996). Most of the producers werepreviously producing hogs in individually-owned farrow-to-finish operations. In general,they were all looking for a way to access the technology and systems they saw asnecessary to achieve low cost production of the product quality and volume necessary tobe competitive in the future. Within that general theme, some people emphasized productquality while others focused on volume or labor simplification. The types ofarrangements ranged from small-scale, informal farmer-to-farmer formula pricingarrangements to large-scale, jointly owned sow units directed by hired managementconsultants. Perceived advantages to network participation included:
• disciplined pig flow and larger pig group size that made all in-all out finishing workbetter, which in turn made it easier to achieve pig health goals
• the opportunity to utilize specialized facilities with modern technology and betterworking conditions
• the opportunity to utilize staff with specialized skills and expertise
• discounts on input purchases due to quantity purchasing
Perceived disadvantages included:
• the difficulty of arriving at an equitable sharing of profits among the producer-members of the network who might now be involved only in farrowing, only infinishing, or in other parts of the network rather than owning and being in control ofthe entire system as in a traditional farrow-to-finish operation
• more possible points of risk exposure because more people and facilities are involvedin the larger networked system
• increased transportation requirements to move pigs from farrowing to the nursery, andthen on to finishing facilities that are be located on different farms
d. Competitiveness in national and international markets
Competitiveness can be evaluated by comparing US numbers against selected majorcompeting livestock-producing countries, comparing Minnesota against selected otherstates, and comparing counties or multi-county regions within the state.

Section V-1 page 124
Pork Competitiveness
Benchmarking is a method for identifying and measuring important performancemeasures and best management practices for performance improvement. Benchmarking isbeing used extensively in many industries and service sectors from autos to education forquality and performance improvement. Management not only compares their performancewith previous time periods but also with other similar actors in the business or servicesector. Quality management research provides evidence that benchmarking is an effectiveapproach to continuos improvement. Comparison of performance overtime providesmeasures of improvement. Comparison with the best performing businesses helps toidentify competitive opportunities for improvement. A successful benchmarking programrequires collective agreement on the performance measure to be used, and a system forcollection and distribution of the benchmarking information. There are many referencesin the business literature by various authors about benchmarking in various business andservice sectors, such as (Keehley and McBride 1997) and (Bogan and English 1994).
The swine industry is evolving so rapidly that it is difficult for producers and others todetermine benchmarks that can indicate what is required to remain competitive in thefuture. The one-time, in-depth studies described below can be helpful in this regard, andthe Minnesota farm business management record summaries discussed later in the"economies of size" section are other sources of benchmarking data. Another sourcewhich may become available in the future is a national database which the National PorkProducers Council is developing (Pork Leader 1999). This database, as proposed, will bemade up of standardized production and financial information submitted by producersand summarized using standardized formulas.
(Drabenstott 1998) addresses the question of whether the US pork industry could losemarket share to other major pork producing countries or regions. He summarizes a costanalysis (Martin et al. 1998) which shows that the Canadian prairie provinces have thelowest pork production costs of the regions studied, and have a cost advantage over theUS western corn belt including Minnesota (Table 9). The analysis is based on a set ofbudgets originally developed at Purdue University, with input expenses adjusted for pricedifferences across regions. (Drabenstott 1998) also shows that pork production inManitoba has doubled in the past 12 years (since 1984), a period over which productionin Minnesota increased by 12 percent (Minnesota Agricultural Statistics various issues). (McEwan 1999) attributes the Manitoba expansion to the fact that the Manitoba porkindustry is highly concentrated in the hands of a few decision-makers who haveresponded rapidly to low feed prices brought about by the reduction in Canadian graintransportation subsidies. Roughly one-third of the Manitoba pork production is by twofeed companies, while one-third is fed by a small number of Hutterite colonies and theremaining one-third is by independent pork producers. The growth in the Canadianindustry is confirmed by (Freese 2000), who finds that in 2000, eight of the 50 largestswine operations in North America are located in Canada.

Section V-1 page 125
Table 11. Hog Production Costs by Region
Size of operationRegion 1200 sow 3000 sow
(cost per 100 kg in Canadiandollars)
U.S. West Corn Belt 88.67 84.44U.S. East Corn Belt 89.99 85.27U.S. South East 98.36 93.78U.S. Mountain 104.15 99.24Maritime Provinces 104.26 100.08Quebec 101.22 96.82Ontario 87.23 81.93Eastern Prairie Provinces 74.06 69.78Western Prairie Provinces 84.08 79.30Argentina 104.64 101.55Chile 107.96 105.10Netherlands 143.24 137.16Denmark 142.95 136.37Source: (Martin et al. 1998), George Morris Centre at University of
Guelph
(Drabenstott 1998) also argues that Argentina and Brazil could expand pork productionsubstantially in the future. Argentina's pork production costs appear to be much higherthan in the US and Canada, due mainly to an unusually high cost of capital. Two-thirdsof its cost disadvantage is due to higher interest rates alone. If they are able to reduceinflation and interest rates, Argentine costs could be much more competitive. Brazil wasnot included in the cost analysis but has many similarities to Argentina. Brazil has nearlydoubled its pork production since 1980, according to USDA estimates cited byDrabenstott.
(Brewer et al. 1998) compares pork production costs in five U.S. states (Iowa, Illinois,Nebraska, Kansas, and Missouri, but not Minnesota) with two Canadian provinces(Alberta and Ontario), the Netherlands and Denmark (Table 10). They based theircomparison more heavily on averages from farm business record programs and less onbudgets than did (Martin et al. 1998), but arrived at the same ranking of the U.S. versusinternational competitors: Alberta's costs are a little less than in the U.S., while Ontario'sare a little more. The Netherlands and Denmark have costs almost twice as high as in theU.S. In a companion paper, Hayenga discusses the structures of the swine industries ineach of the countries compared (Hayenga 1998a). He concludes that North America has acompetitive advantage in export of pork products to many parts of the world whererelative transportation costs are not prohibitive.

Section V-1 page 126
Table 12. Comparison of Pork Production Costs (U.S. $/cwt)
Item Average U.S. Large U.S. Alberta Ontario Netherlands DenmarkMW MW
Variable cost:Feed cost 25.47 22.75 20.12 27.03 34.00 34.77Labor cost 4.42 3.45 4.40 3.98 10.63 10.40Interest 1.54 1.39 0.92 1.14 2.88 3.58Other variable costs 5.63 5.94 5.41 6.21 14.47 11.81Sub-total 37.06 33.53 30.85 38.36 61.98 60.56Fixed cost:Housing costs 6.22 5.50 8.12 8.61 12.60 17.03Total costs 43.28 39.03 38.97 46.97 74.58 77.59Source: (Brewer et al. 1998)
Recent U.S. regional cost and return estimates from the USDA Economic ResearchService show an advantage for the Southern Seaboard region (Virginia down through theCarolinas and west to eastern Louisiana) over the Heartland region (southern Minnesotadown through Missouri and east to Ohio) in 1999, in contrast to the studies by Martin andothers which showed the U.S. and Canadian plains states and regions as having the lowestcosts (Table 11). The USDA estimates are based on a 1998 survey of 1,600 producerswith 25 hogs or more in 21 states, weighted to represent 95 percent of the hog inventory. One explanation for the difference in results between this and the Martin study may bethat there may be more variation between the low and high-cost farms in the Midwestthan in the southern region. The USDA numbers represent the average farm while theMartin numbers may be attempting to represent what is possible with good managementand facilities.

Section V-1 page 127
Table 13. Hog production costs and returns per hundredweight gain, 1999
ItemU.S.
Heart-land
N.Crescent
N. GreatPlains
PrairieGateway
EasternUpland
S. Sea-board
Miss.Portal
Dollars per cwt gain 1/Gross value of production Market hogs 29.21 29.61 28.12 31.14 28.33 24.68 29.29 26.16 Feeder pigs 9.72 7.82 3.99 8.01 2.17 15.17 18.64 9.59 Cull stock 0.93 0.85 1.81 0.72 1.90 1.79 0.46 1.48 Breeding stock 0.65 0.33 0.29 0.08 3.25 2.96 0.43 0.48 Inventory change -0.17 -0.89 -0.98 0.64 1.46 -0.66 1.45 -1.02 Other income 2/ 1.32 1.47 1.74 0.95 0.93 1.14 0.96 1.26 Total, gross value of
production41.66 39.19 34.97 41.54 38.04 45.08 51.23 37.95
Operating costs: Feed -- Grain 5.07 6.46 7.27 3.10 4.90 4.70 0.70 10.27 Protein sources 4.21 5.62 5.60 1.95 3.73 2.04 0.38 4.68 Complete mixes 9.79 7.54 4.12 12.60 8.58 11.88 17.75 4.12 Other feed items 3/ 0.17 0.20 0.20 0.02 0.12 0.77 0.01 0.09 Total feed cost 19.24 19.82 17.19 17.67 17.33 19.39 18.84 19.16Other -- Feeder pigs 11.13 9.59 7.78 17.06 11.06 7.39 16.53 6.32 Veterinary and medicine 1.04 1.14 0.93 0.81 0.83 1.18 0.86 1.47 Bedding and litter 0.03 0.04 0.02 0.02 0.03 0.03 0.00 0.01 Marketing 0.97 0.62 0.52 0.54 0.64 1.51 2.18 0.77 Custom services 0.37 0.29 0.27 0.04 0.09 0.14 0.73 0.33 Fuel, lube, and electricity 1.12 1.21 1.15 0.94 0.90 1.59 0.81 2.20 Repairs 0.76 0.86 0.81 0.47 0.69 1.00 0.44 1.06 Other operating costs 4/ 0.03 0.03 0.03 0.05 0.05 0.07 0.03 0.00 Interest on operating capital 0.82 0.79 0.68 0.88 0.74 0.76 0.95 0.74 Total, operating costs 35.51 34.39 29.38 38.48 32.36 33.06 41.37 32.06
Allocated overhead: Hired labor 2.22 2.30 2.25 0.97 2.77 2.37 1.72 2.80 Opportunity cost of unpaid labor 5.17 5.97 6.82 4.81 3.97 9.30 2.16 25.60 Capital recovery of machinery
and equip.10.09 10.45 10.98 8.64 10.31 12.47 8.27 24.70
Opportunity cost of land (rentalrate)
0.05 0.05 0.07 0.02 0.06 0.08 0.04 0.85
Taxes and insurance 0.45 0.48 0.44 0.85 0.52 0.78 0.26 0.77 General farm overhead 0.94 0.98 0.95 1.30 1.17 1.07 0.61 2.97 Total, allocated overhead 18.92 20.23 21.51 16.59 18.80 26.07 13.06 57.69
Total costs listed 54.43 54.62 50.89 55.07 51.16 59.13 54.43 89.75Value of production less total costslisted
-12.77 -15.43 -15.92 -13.53 -13.12 -14.05 -3.20 -51.80
Value of production less operatingcosts
6.15 4.80 5.59 3.06 5.68 12.02 9.86 5.89
Supporting information:Production arrangement (percent of production) 5/ Independent 59 71 73 47 84 40 13 93 Under contract 41 29 27 53 16 60 87 7Size of operation (head sold/removed) 5/ Market hogs 1,726 1,522 1,032 1,776 2,012 873 5,074 367 Feeder pigs 1,224 845 214 664 593 1,464 6,652 253Source: (Production Costs Changed Little in 1999, but Lower Commodity Prices Cut Most Returns 2000)1/ Cwt gain = (cwt sold - cwt purchased) + cwt inventory change. 2/ Value of manure production.3/ Milk replacer, milk, milk by-products, antibiotics, and other medicated additives.4/ Costs for odor control and fees, permits, licenses, and other regulatory costs.

Section V-1 page 128
5/ Developed from survey base year, 1998.

Section V-1 page 129
Dairy Competitiveness
An Ohio Extension publication identified ten areas of dairy farm competitiveness and therole of each in contributing to the success of the business. They point out that dairyproducers that want to stay competitive must commit to continued improvement,modernization and change. They suggest a better than average dairy farm today mustincrease the number of dairy cows by 60 over in the next 10 years to maintain theirstandard of living to offset inflation (Polson et al. 1997).
They identified the measures listed below as guidelines for competitive performancelevels.1. Rate of production measured by pounds of milk sold per worker (For large breeds,
>600,000 to 1,000,000 pounds)
2. Cost control as measured by• Total feed cost per 100 pounds of milk sold (<$6.00)• Milking herd feed cost per 100 pounds of milk sold (<$4.00)• Operating expense ratio (<70%)
3. Capital Efficiency as measured by• Dairy investment per cow (<$6,000)• Asset turn over Rate (>.50)
4. Profitability as measured by• Net farm income (>$75,000 per owner operator)• Rate of return on assets (>11.0%)
5. Liquidity as measured by current ratio (>1.3)
6. Debt repayment schedule measured by scheduled annual debt payment as a percent ofgross receipts (<20%)
7. Solvency as measure by• Debt to asset ratio (<40%)• debt per cow ( <$2,000 if not expanding, $,3,000 if expanding)
8. Mission Statement on which the management team agrees to why they are in business (Written statement)
9. Maintain family’s standard of living as measured over time (Expand herd 60% every10 years)
10. Motivated labor force (well trained, enthusiastic, empowered family and employeeswho share commitment to the mission and goals of the business)
Section V-1 page 130
Dairy farm management records suggest that many Midwest dairy businesses are highlyprofitable when compared to their competitors in the West, East, South, and elsewhere inthe world. However, many others have the opportunity to be more competitive by: 1. increasing cow and herd productivity, 2. increasing the efficient use of capital, 3.tightening their control of costs, and 4. marketing more milk per worker. Familyeconomics and lifestyle needs and hopes are critical on-farm forces of change. Dairyprofit margins have become slimmer while family living costs have risen. Opportunitiesfor quality family time and for breaks in day-to-day routines to get away are growingmore important to many families. Success must ultimately be measured by the personalfulfillment and satisfaction of those having a vested interest in the business; it will notsurvive long term without being profitable. (Conlin 1998)
The Minnesota Dairy Industry's Competitive Strengths
Historically Minnesota's dairy industry has flourished because of:
• Inexpensive high quality feeds
• Plentiful supply of water
• Land with limited alternative uses (forage production)
• Desirable climate
• Committed farm families
• Positive market reputation
• Strong support infrastructure, processors, and service and supply providers
There is wide heterogeneity in the economic vitality of Minnesota dairy farm businessesas shown by comparisons of high and low profit dairies in the state. (See Section E. ofGEIS Report, Profitability and Vitality). Studies have shown that the high profit groupare highly competitive nationally in being low cost producers of milk.
Wisconsin researchers identified several factors contributing to the shift from the UpperMidwest and Northeast to the West and Southwest. (Lawless et al. 1996)
• A large number of small farms that are unable to support an adequate level of familyincome
• Many dairy facilities and equipment are obsolete.
• Many operators are approaching retirement.

Section V-1 page 131
• Changes in government milk pricing policies.
⇒ Lower support prices beginning in 1981 based on anticipated purchase ofsurpluses and government costs that included an assessment to farmers to offsetthe cost.
⇒ Federal Milk Marketing system that favored other regions at the expense of theupper Midwest.
• The Upper Midwest is no longer the lowest milk production cost region in the U.S..
• Many do not have access to capital needed to expand and or change their systems tobe more cost efficient.
The USDA Economic Research Service reports estimated production cost and returns formilk production by region of the U.S. The most recent estimates for 1998 and 1999(Table 12) are consistent with a time trend that shows the Pacific region to be the lowcost-of-production region. Total economic cost of producing milk in the Upper Midwestregion, which includes Minnesota, was $0.45 per cwt. of milk above the national averagein 1999. The major cost differences in the Upper Midwest region are feed costs that are$0.73 per cwt. lower than the national average, but higher capital costs, higher unpaidlabor costs, and somewhat higher overhead, taxes and insurance. These estimates arelimited in that they reflect averages for what they consider a single typical dairy for broadregions based on assumed average input costs and returns for the region. These estimatesdo not capture the heterogeneity in performance efficiencies within the region particularlyin the more traditional dairy areas that are in a period of rapid change. The mostsustainable dairies in the long run will be among the lowest cost producers.

Section V-1 page 132
Table 14. Milk production economic costs and returns, per cwt sold, 1998-99United States Corn Belt Northeast Pacific Southeast Southern Plains Upper
Item 1998 1999 1998 1999 1998 1999 1998 1999 1998 1999 1998 1999 1998 1999
Gross value of production: Milk 15.51 14.40 15.39 14.29 15.63 15.14 15.07 13.78 17.63 16.76 15.70 15.00 15.48 14.00 Cattle 0.83 0.90 1.04 1.12 0.73 0.80 0.61 0.64 0.92 0.98 0.84 0.92 0.94 1.03 Other income 1/ 0.55 0.54 0.47 0.46 0.43 0.41 0.56 0.55 0.51 0.50 0.36 0.35 0.68 0.66 Total, gross value of production 16.89 15.84 16.90 15.87 16.79 16.35 16.24 14.97 19.06 18.24 16.90 16.27 17.10 15.69
Economic (full ownership) costs: Feed costs (inc. in variable cash expenses) 7.51 6.79 8.00 7.47 7.80 7.65 6.87 6.53 8.26 7.33 8.49 7.40 7.33 6.06 Variable cash expenses 11.54 10.85 12.12 11.61 12.84 12.68 9.61 9.40 13.28 12.31 11.42 10.40 11.57 10.29 General farm overhead 0.62 0.60 0.66 0.64 0.61 0.60 0.39 0.38 0.74 0.72 0.53 0.51 0.75 0.73 Taxes and insurance 0.36 0.31 0.33 0.28 0.48 0.41 0.14 0.12 0.40 0.34 0.18 0.16 0.46 0.39 Capital replacement 2.10 2.17 2.21 2.25 2.07 2.12 1.34 1.44 2.51 2.66 1.99 2.13 2.53 2.57 Operating capital 0.10 0.09 0.10 0.09 0.11 0.10 0.08 0.07 0.11 0.09 0.10 0.08 0.10 0.08 Other nonland capital 0.87 0.85 0.87 0.84 0.82 0.80 0.56 0.57 1.47 1.49 0.79 0.81 1.03 0.99 Land 0.01 0.01 0.01 0.01 0.00 0.00 0.01 0.01 0.01 0.01 0.00 0.00 0.01 0.01 Unpaid labor 1.65 1.59 2.68 2.54 2.38 2.23 0.43 0.43 0.31 0.29 0.83 0.77 1.95 1.86 Total, economic costs 17.25 16.47 18.98 18.26 19.31 18.94 12.56 12.42 18.83 17.91 15.84 14.86 18.40 16.92
Residual returns to management and risk -0.36 -0.63 -2.08 -2.39 -2.52 -2.59 3.68 2.55 0.23 0.33 1.06 1.41 -1.30 -1.23
1/ Includes the dairy's share of receipts from cooperative patronage dividends, assessment refunds, renting or leasing of dairy animals, the estimated value of manure as afertilizer, and insurance
Source: (Milk Costs and Returns: 1998-99 Costs of Production from the Agricultural Resource Management Study 2000)

Section V-1 page 133
Another source of data on national and international competitiveness that might be usefulfor future in-depth research is the Farm Level Income and Policy Simulation Model(FLIPSIM) modeling activity at the Agricultural and Food Policy Center at Texas A&MUniversity (Texas A&M University Agricultural and Food Policy Center 99). That groupof researchers maintains contact with a panel of representative farms across the U.S. They contact the farm operators periodically, and collect financial data which is used todevelop a set of 80 farm budgets each of which represents a size and type of farm in 27states. These budgets are used in a computer simulation model to analyze policyalternatives and make economic projections. The number of farms is too limited topermit state-level analysis, however. For example, they have no panel farms inMinnesota. Dairy is fairly well represented with farm budgets for the north central statesof WI, MI and MO, northeastern states of NY and VT, western states CA, ID and WA,and southern states of NM, TX, GA and FL. The only hog farm budgets are for IL, IN,MO, and NC. Beef is represented by budgets for MT, WY, and CO. They have a numberof publications listed on the web site which contain the results of analyses done using themodel. One publication that contains a description of the panel farms is Policy WorkingPaper 98-1, REPRESENTATIVE FARMS ECONOMIC OUTLOOK FOR THEJANUARY 1998 FAPRI/AFPC BASELINE. They have also started to develop somerepresentative farm budgets for a few other countries as well. Dairy farm budgets havebeen completed for Mexico and Kenya, and work has started on dairy budgets for Canadaand Germany. They have not done any budgets for other types of livestock operationsoutside the U.S.
QUESTION D1. WHAT CHOICES OF BUSINESS ORGANIZATION AREAVAILABLE TO LIVESTOCK PRODUCERS IN MINNESOTA AND IN OTHERSTATES? TO WHAT DEGREE ARE LIVESTOCK PRODUCERS ALLOWEDTO OPERATE AGRICULTURAL SYSTEMS INTERDEPENDENTLY ASOPPOSED TO INDEPENDENTLY IN MINNESOTA AND IN OTHER STATESAND WHAT IS THE SIGNIFICANCE?
D1a. What choices of business organization are available to livestock producers inMinnesota and in other states?
(Boehlje and Lins 1998) describes the basic business organization choices, which aresummarized in Table 13. Choices of legal organization include sole proprietorship;partnership (general, limited, and in Minnesota limited liability); corporation (regular andsubchapter S); limited liability company (not allowed in Minnesota); land trust; andcooperative. It is worth noting that, increasingly, farms may utilize more than one type oflegal organization. For example, the farmland is owned by individual family members assole proprietors, some of whom also own livestock buildings as general partners, and arealso shareholders in an operating corporation which owns the livestock and equipment.There are also different business arrangements such as production contracts, jointventures, and strategic alliances, as well as leasing options and sources of equity and debtcapital.

Section V-1 page 134
Summaries of the status of forms of business organization utilized in Minnesota areprovided in (Lazarus 99) and (Prim et al. undated)
Most Minnesota livestock operations are organized as single-family, sole proprietorshipswhere the farmer and/or the farm family that owns the production or owns, or leases, theproductive assets provide day-to-day labor and management.
Single-family sole proprietorships, while they are common and have a rich heritage, arenot the only way to organize the capital, land, labor, and management decision makingrequired for agricultural production. There are other options, as well. The range ofoptions for organizing and financing a business has expanded considerably in recent yearsdue in part to innovations in financial markets. Some livestock producers are utilizingthese various options in order to finance the capital needs of larger facilities while sharingcontrol, returns and risks among multiple owners, employees, and other stakeholders.
The choices and options include legal organization, business arrangement, leasingoptions, and sources of both equity and debt capital. Legal organization options inaddition to sole proprietorships are partnerships (general and limited), regular andSubchapter S corporations, limited liability companies, land trusts and cooperatives. Thelimited liability partnership is a relatively new legal option available to Minnesotafarmers. Business arrangement options in addition to the traditional independentproduction include production and marketing contracts, joint ventures, and strategicalliances (Boehlje and Lins 1998).

Section V-1 page 135
Table 15. The Organizational/ Financial Structure of the Agribusiness Firm: The Choices and Options
Legal Organization Business Arrangement Leasing Options Equity Debt
! Sole Proprietorship
! Partnership
- General
- Limited
! Corporation
- Regular
- Subchapter S
! Limited Liability Company
! Land Trust
! Cooperative
! Independent Producer
! Contract Producer
! Subcontractor
! Joint Venture
! Strategic Alliance
! Franchise Agreement
! Licensing
! Real Estate Lease
- Cash lease
- Share lease
- Flexible cash lease
- Shared appreciation lease
! Facility/ EquipmentOperating Lease
! Capital/ Financial Lease
! Leveraged Lease
! Leasebacks
! Sources
- Initial capital contributions
- Retained earnings
- Stock
* Common stock
* Preferred stock
- "External" equity
- Warrants or options
- Venture capital
! Business Practices
- Payout (dividend orwithdrawal) policy
- Intrafamily transfers
- ESOPs and stock options
- "Buyout" policies
! Loans
- Maturity
- Interest rate
- Amortization arrangement
- Prepayment features
- Security/ collateral
- Conversion of terms
- Shared appreciationmortgages
- Reverse mortgages
- Interest rate strips, futures,options, swaps
! Bonds
- Convertible bonds
- Callable bonds
- "Zero coupon" or deepdiscount bonds
SOURCE: NCR-568, Planning the Financial/Organizational Structure of Farm and Agribusiness Firms: What Are the Options?, August 1998.

Section V-1 page 136
Legal organization choices are regulated in Minnesota and many other states (Hoppe1996). In Minnesota, Statute 500.24 places limitations in the amount of farmland which acorporation can own. Corporations are prohibited from engaging in agriculture, except forfamily farm corporations and authorized farm corporations. Certain other exceptions tothe prohibition also apply. Limited liability companies are prohibited from engaging inagriculture in Minnesota, and the regular business corporation laws apply to farming inthe same way that they apply to other businesses. There are tax implications to the choiceof legal organization. Harl includes a discussion of corporate farm laws in Minnesota andother state, as well as discussing the process of incorporation, what taxes apply, and otherfactors to consider (Harl 1996). The text of Minnesota’s corporate farm law is accessibleon the World Wide Web at the address listed in the reference list.
The rationale for regulating legal organization choices in agriculture is given insubdivision 1 of 500.24: "The legislature finds that it is in the interests of the state toencourage and protect the family farm as a basic economic unit, to insure it as the mostsocially desirable mode of agricultural production, and to enhance and promote thestability and well-being of rural society in Minnesota and the nuclear family." For arelated discussion, see pages 137-39 of Lasley et al., and Lazarus (Lasley et al. 1995;Lazarus 1995).
Production networks are a type of business arrangement popular in the Minnesota swineindustry. A recent University of Minnesota report lists things to consider when joining anetwork (Koehler, et al.) It includes a financial analysis of a typical arrangement, andincludes a spreadsheet template for analyzing specific situations.
Boehlje and Lins (Boehlje and Lins 1998) have described a comprehensive range ofoptions for organizing and financing farm business firms, and explain circumstances inwhich various options are likely to be most useful (see Table 14). These options haveexpanded in recent years as innovations in financial markets have created newalternatives to meet varied needs. Historically, financing focused on internally-generatedequity, with debt used if internal resources of equity were not adequate to finance thegrowth of the business. Sole proprietorship has been the dominant organizationalstructure, with limited forward or backward linkage (i.e., contracts or ownership ofsuccessive stages of production). Current options are much broader in terms of 1)business and legal arrangements, 2) asset control strategies, and 3) financinginstruments/options.
Boehlje and Lins point out the need for strategic planning to capture the best financial andorganizational structure for the business. They outline the criteria for making thesechoices.
• Control: The fundamental objective for independent control and individual decisionmaking may be a dominant factor in preponderance of sole proprietorships in thefarm business sector.
Section V-1 page 137
• Returns: This objective focuses on which option will allow access to resources andfunds at the lowest cost and emphasizes the set of economic activities that maximizesprofit. The tax treatment and resulting tax burden of alternative are important, as arethe various ways of sourcing funds.
• Risk: This element involves four issues:
Claim of various parties on income or revenues: Because of legal structure, contractagreement, or financial arrangements, various parties have different claims on thebusiness. Characteristics of these claims, including amount, certainty, and priority,will determine impact on risk.
Claim on assets: Legal and financial arrangements carry specific claims on the assetsof the business. These claims are frequently conditional in nature and contingent onspecific financial performance, which will determine the impact on risk.
Bankruptcy/legal liability: The risk of financial loss from bankruptcy and legalliability depends heavily on financial and organizational structure. The use ofmultiple legal entities may help protect assets of entity from liability. Theorganization and financial structure can significantly affect potential liabilityexposure.
Failure: Success or failure is influenced in part by the financial and organizationalstructure. Failure may result in losses in value or other consequences for relatedbusiness ventures, as well as self-esteem and respectability of the owners.
• Maturity/Permanence/Liquidity: The longevity or permanence of the arrangementis reason for choosing an option. Some business arrangements are difficult or costly todissolve once they are set up while others are more flexible and have a shorter-termmaturity.
LEGAL ORGANIZATIONS
Part of the strategic plan for organizing and financing a business is how to combine thelegal/business arrangements to satisfy the specific goals. More than one legal arrangementis frequently used in successful business ventures.
Harl compares various forms of farm business organizations and state restrictions oncorporations in the North Central Region (Harl 1996). There are three basic forms ofbusiness organizations: sole proprietorship, partnerships, and corporations. Variations ofthese are limited partnerships, and the tax option corporation. These forms are describedas follows:
Sole Proprietorship is when one person operation owns, runs and manages the business.There may be many hired employees.

Section V-1 page 138
Partnership is an aggregation of co-owners to carry on the business for profit. Two ormore persons contribute assets and share management and responsibility for profits andlosses. Each partner is liable for the actions of all partners within the scope of partnershipactivities.
Limited partnership is a special form of partnership where liability for debts andobligations is limited to the investment of the limited partners. Limited partners are justinvestors. A limited partnership must have a general partner who handles management ofthe business and is fully liable for all partnership debts and obligations.
Corporation is a separate business entity distinct from its owners. The corporation drawsa sharp line of distinction between the business and the owners, the shareholders. Thecorporation is a separate legal person as well as a separate taxpayer. The limited liabilityfeature of a corporation is important. Shareholder risk is usually limited to the amount oftheir investment. An employee, officer, or director may be personally liable for negligentactions even though the corporation is also liable. Corporation assets are not liable forpersonal obligations. The life of the corporation does not depend on the life of the people,and the continuity of the business is not affected by the death of a shareholder or thetransfer of stock. Therefore the corporation offers a method of maintaining the farmbusiness as a going concern, avoids the interruptions that result upon death, and providesfor managers to do the long-range planning necessary to keep pace with technicaladvances. Minority shareholders may be disadvantaged by being locked into the rule ofthe majority and have no power to compel directors to pay dividends on the stock. Acorporation may be dissolved by a majority vote, or the state can revoke a charter if thecorporation fails to comply with state laws. Lenders may have less fear that death orincapacitation of a single individual might cause termination of the business. Lenders arelikely to be more liberal in extending credit if there is evidence of managementsuccession and business continuity. Ownership is easily divided into shares of stock. New investment may be made by the purchase of stock or by lending money to thecorporation. Shareholders receive a share of the profits after the salaries have been paid. Lenders incur less risk by receiving a fixed rate of interest. There are limitations on loansfrom federal and federally related agencies. Shareholders can be employed and beeligible for employee benefits such as retirement plans and tax-free medical benefits. Employee benefit plans can not discriminate in favor of shareholder-employees andagainst others. Shares of stock provide a simple and convenient way to transfer property.Shares of stock may be sold, given away, or transferred by will or under state inheritancelaws at death. Shares of stock provide a means for gradual transfer and progressive shiftin ownership in the business. A minor may own stock.
Some characteristics of corporations are often considered to be a disadvantage: all wagesand salaries are subject to FICA including children under 18 years of age; some statesmay require all employees to be covered by worker compensation insurance, whereas notfor partners or sole proprietors; shareholders must meet at least annually for ashareholders meeting, and corporations are required to file and annual report and pay anannual fee (Harl 1996).

Section V-1 page 139
Tax option corporation (sometimes called a subchapter S corporation) is a creation of thefederal tax law. It is a corporation in all respects except that it generally pays no incometax because each shareholder-owner reports a share of corporate income tax.
Limited Liability Company (LLC) is a hybrid that allows the limited liability of acorporation and tax treatment of a partnership. LLCs are more informal in organizationand in operation than a corporation. LLCs offer the owners limited liability like acorporation without facing the double tax on business income like a regular corporation,and does not restrict the number of owners and other limitations of an S-corporation. Under some circumstances a LLC could fail to be classified as a pass through tax statusentity and become classified as a corporation. Laws permitting LLCs vary from state tostate, but most states now allow this form of legal business entity. Added information onLLCs can be found in (Minnesota State Legislature 1998).
Limited Liability Partnership is also a hybrid with general partnership features but hassome aspects of limited liability associated with corporations. Liability of a partner iseliminated for negligence, wrongful acts, and misconduct of other partners andpartnership employees, agents and representatives. Each partner remains personally liablefor their own conduct and for those under their direct supervision. Each partner remainspersonally liable for any commercial obligations of the partnership such as loans, leases,taxes and wages. Creditors have recourse against partnership assets including theinvestments of individual partners. Many states have also enacted legislation providingauthority for limited liability partnerships.
Harl has compared the characteristics of the farm business organizations (Table 13):

Section V-1 page 140
Table 16. Comparison of Sole Proprietorship, Corporation, Partnership and Limited Liability Company Forms of Organization
IssueSole
Proprietorship C CorporationGeneral/ Limited
Liability PartnershipLimited
PartnershipLimited Liability
Company S CorporationNature of Entity Legal person same as the
ownerLegal person separatefrom shareholder-owners
Aggregate of two ormore persons
Aggregate of two ormore persons
Aggregate of two ormore persons
Legal person separatefrom shareholder-owners
Life of Business Fixed term; ends whenowner dies
Perpetual or fixed termof years
Agreed term; terminatesat death of partner; LLPmust register annually
Agreed term; terminatesat death of partner
Agreed term; terminatesat death of partner
Perpetual or fixed termof years
Management Decision Sole proprietor Elected directors andofficers selected bydirectors
Usually agreement ofpartners
Usually general partner Usually manager iselected
Elected directors andofficers selected bydirectors
Formation of Entity Very simple Relatively simple Relatively complex; LLPmust register
Relatively complex Relatively simple Relatively simple
Flexibility in Capitalization N/A Very flexible Very flexible Very flexible Very flexible Somewhat inflexibleLimited Liability None Yes No; LLP partner exempt
from co-partner's tortsNo for GP / Yes for LP Yes Yes
Flexibility in ConductingBusiness Affairs
Inflexible Flexible Flexible Relatively flexible Relatively flexible Somewhat inflexible
Flexibility in Taxable Year None Yes No No No LittleAllocation of Income, Losses,Deductions, and Credits
N/A Somewhat inflexible Very flexible Very flexible Very flexible Generally inflexible
Tax Effect Upon Liquidation No double tax Difficult to avoid doubletax
No double tax No double tax No double tax Generally no double tax(Section 1374)
Convertibility to AnotherEntity Tax-Free
Yes Some restrictions Yes Yes Yes Some restrictions
Line of Business Very flexible Few restrictions Flexible; LLP somerestrictions
Very flexible Few restrictions Few restrictions
Self-employment Income fromEntity
Yes No Yes Yes - GP / No - LP Usually; see proposedRegs § 1.1402(a)-18
To extent of salary andbonus
Effect of Passive LossLimitation Rules
N/A Applies at corp. level;generally avoidable forlarger corps.
Partners may or may notmaterially participate
Ltd. partners deemed notto materially participate
Members may or maynot materially participate
Shareholders may or maynot materially participate
Availability of Entity Losses toOwners
N/A No Flow through of losses toowners
Flow through of losses toowners
Flow through of losses toowners
Flow through of losses toowners
Fringe Benefits Limited compared to CCorporation
Widest available Limited compared to CCorporation
Limited compared to CCorporation
Limited compared to CCorporation
Limited compared to CCorporation
Estate Planning Opportunities Fair Very good Good Very good Very good FairAccumulated Earnings andPHC Tax
N/A Section 531 and Section541 applicable
No No No No
State Taxes Same as individual Generally uniform anddeductible
Generally uniform Generally uniform States vary States vary
Dividend Received Deduction N/A Allowed Not allowed Not allowed Not allowed Not allowedEffect of Bus. Liabilities onOwner's Basis
Full effect No effect Proportionate share Limited partners share innon-recourse
Proportionate share Only shareholder's ownloans
Alternative Minimum Tax Subject to AMT Subject to corporateAMT
Preference items flow toeach partner
Preference items flow toeach member
Preference items flow toeach member
Preference items flow toeach shareholder
Method of Accounting Cash method Depends on size andownership
Generally may use cashmethod
Generally may use cashmethod
Generally may use cashmethod unless farmingsyndicate
Generally may use cashmethod
SOURCE: McEowen, Roger and Harl, Neil E., Principles of Agricultural Law, Agricultural Law Press, 1997.

Section V-1 page 141
Boehlje and Lins have summarized the general characteristics of some additional business organizations in Table 15 (Boehlje and Lins 1998).
Table 17. Comparison of Sole Proprietor, Partnership, Corporation and Land Trust Forms of Organization §Sole Proprietor Partnership Corporation Land Trust
Nature of Entity Single individual Aggregate of two or moreindividuals
Legal person separate fromshareholders
Separate from beneficiaries andtrustees
Life of Business Terminates on death Agreed term; terminates at death ofpartner
Perpetual or fixed term of years Fixed term of years with extensionsthereafter
Liability Personally liable Each partner liable for allpartnership obligations
Shareholders not liable for corporateobligations
Beneficial interests subject toattachment, not land
Source of Capital Personal investment; loans Partners' contributions; loans Contributions of shareholders forstock; sale of stock; bonds and otherloans
Settlor
ManagementDecisions
Proprietor Agreement of partners Shareholders elect directors whomanage business along with officerselected by directors
Beneficiaries and trustee by trustand management agreements
Limits on BusinessActivity
Proprietor's discretion Partnership agreement Articles of incorporation (by-laws)and state corporation laws
Trust and management agreements
Transfer of Interest Terminates proprietorship Dissolves partnership; newpartnership may be formed if allagree
Transfer of stock does not affectcontinuity of business. Stock maybe transferred to outsiders if thereare no restrictions.
Assignment of beneficial agreements
Effect of Death Liquidation Liquidation or sale to survivingpartners
No effect on corporation. Stockpasses by will or inheritance.
Trust agreement and trust codeinterests are personal property bywill or laws of decent
Income Taxes Income taxed to individual Partnership files an informationreturn but pays no tax. Each partnerreports share of income or loss,capital gains and losses as anindividual.
Regular Corporation: Corporationfiles a tax return and pays tax onincome; salaries to shareholder-employees are deductible. Capitalgains are offset by capital losses. Rates, July 1, 1987: 1st $50,000,15%; next $25,000, 25%; over$75,000, 34%.‡
Tax-Option Corporation: Corporation files an informationreturn but pays no tax. Eachshareholder reports share of income,operating loss, and long-term capitalgain.
Income, depreciation, and expensespass to beneficiaries in proportion tothe beneficial interest held
§ Table taken in part from NCR-11, The Farm Corporation. Land trust added by G. Harrison.‡ An additional 5% tax (maximum amount of $11,250) is imposed on a corporation's taxable income above $100,000. This provision phases out the benefit of the 15% and 25%
rates for corporations with taxable incomes of more than $335,000.SOURCE: NCR-568, Planning the Financial/Organizational Structure of Farm and Agribusiness Firms: What Are the Options?, August 1998.

Section V-1 page 142
Boehlje and Lins have described two additional legal forms of business organization that are lesscommon but coming into greater use.
Land Trust is a legal entity that allows a land owner to transfer property to a trustee. The powersof ownership are governed by a trust agreement which places the possession and managementpowers in the hands of the beneficiaries. The primary benefits are the avoidance of probate upondeath, insulation of land from legal judgements, avoidance of problems of multiple ownership,and privacy of ownership. The main problems are management, limited duration (typically 20years), termination of trust, and loss of homestead exemption. Additional information on landtrusts can be found in (Harl 1996).
Cooperatives: Increasingly farmers are using the cooperative structure to jointly acquire andprovide machinery and equipment services, breeding stock, marketing and selling services,advisory and consulting services, and other assets and services. A cooperative is an incorporatedbusiness capitalized by its member patron/owners and remits margin to its patron/owners inproportion to their patronage business. A cooperative is taxed on income at corporate rates butpatronage refunds are tax deductible to the cooperative if specific rules are met (Harl 1996). Wisconsin workers describe New Generation Cooperative (NGC) that differ from mosttraditional marketing cooperatives in that it is market driven, closed with limited members,tradable membership shares, allocate rights to deliver units of the farms raw products, but sharesspread up-front capitalization responsibility equitably among its members. Wisconsin workersreport that the number of new generation cooperatives in the upper Midwest expanded from twoin 1989 to over fifty in 1996. They point out these cooperatives involve cooperation among farmfamilies, provide a means of benefiting from economies of scale, and are usually value addedenterprises adding value to grain and forage through the end livestock product. (Lawless et al.1996)
BUSINESS ARRANGEMENTS
Farmers have a wide choice of business arrangements they can use in addition to the legal formof the business. The alternatives include: independent production, contract production,subcontractor, joint ventures, strategic alliances, franchise agreements, and licensing.
Independent producer is the most common method of conducting business. The firm is free tobuy inputs from whomever and where ever it pleases and whatever market channels it chooses.The independence of the operator’s decisions is the key advantage of this business arrangement.In some commodities, however, economic forces are making it less feasible for independentproducers to compete effectively in an increasing integrated market.
Contract Production is increasing in popularity in livestock and crop production. Contractshave become commonplace in the production of various vegetable and specialty crops, broilers,turkeys, and increasingly in hog and milk. The contract agreement is between the producer andan input supplier or processor. Contract agreements are highly variable in scope but likely to takeon one of the following forms:

Section V-1 page 143
Product specification contracts include detailed product specifications relative to qualitycharacteristics and sizable discounts occur if quality standards are not met.
Resource Providing specify the contractor will supply specific services.
Price-or risk sharing contracts specify a guaranteed price for products with specific qualityattributes, specify a minimum profit margin above a calculated cost of production, and sharingthe margin above a calculated cost or some combination.
Market Access guarantees access by the producer to the processing facility. It is usually a flowscheduling device to use processing facilities more efficiently
Subcontracting or Contract for Services: These arrangements can take many different formsbut essentially involve the payment for services provided. It usually involves fewer services orfunctions than contract production. It may involve payments for feed processing, labor services,custom feeding of hogs or cattle, custom harvesting, manure spreading, or chemical application. Producers may participate on either side of these contracts.
Joint Ventures: A separate business entity or subsidiary is formed by two or more firms tojointly carry out specific business activity. It may be done in an informal fashion to jointly ownmachinery or equipment, feed or breed livestock, market products or buy inputs. Agribusinessfirms have used joint venture arrangements for purchasing, distribution, or merchandisingactivities often as part of a large scale national or international market.
Strategic Alliance : Strategic alliances may be formal or informal to work jointly to achieve adesired end result, goals or procedures. They can work in many different ways, be quite flexible,and are often of limited duration. Each firm has a vested interest in the success of the other firmbut do not share ownership of assets. An example would be a packer forming an alliance with agroup of producers and a feed company to be assured an even flow of quality pork.
Franchise Agreements: These arrangements are most common in the food distribution chain.The benefits come from name recognition, efficiency of promotion, and standardization ofproduct and service functions.
Licensing: This arrangement is not common in production agriculture but is more common inthe input supply and/or product processing industries. It is a way a firm that possesses a certaintechnology but lacks the resources to exploit it completely can license it to another firm for a fee.For example biotechnologies that require large investments to develop, may be licensed to otherfirms to more fully exploit its use.
Leasing: Leasing allows one to acquire control of an asset for a fee without the requirement ofownership. Some view leasing as an alternative form of financing. And is a common method offinancing an asset used in agriculture. It is more frequently used for real estate and buildings thatfor machinery and equipment. There are various forms of leases.

Section V-1 page 144
Cash lease typically involves a cash payment for the annual right to farm or graze a parcel of realestate. Payments are a function of productivity, local supply/demand, but typically fixed with fullor partial payment in advance. About 64 percent of farmland leases were cash leases in 1992.
Share Lease: Both tenant and landlord share some part of the expenses and income. Commonshare leases in the US are 50-50 share with tenant and landlord sharing equally. A share leasemay involve livestock production and is typically more complex than crop share leases. About30 percent of farmland leases in 1992 were share leases.
Flexible cash lease: Annual lease payment may be dependent on yields or price. Thesearrangements are usually combine with a fixed base to guarantee a minimum lease payment. Thishas the feature to transfer some of the risk from the tenant to the landlord.
Shared Appreciation Lease: This is a farmland lease that allows tenant to pay a higher thannormal rent in exchange for some share of future capital gains. This allows the tenant to improvethe property and share in the value of the increase, and provides for acquiring an equity interestin property without borrowing money. This method has been suggested for institutional ownersof farmland but is largely untested in practice. More information on this arrangement can befound (Lins 1990)
Facility/Equipment Operating Lease: Operating leases are typically seasonal or annual withrenewals in length, with no ownership rights or responsibilities to the lessor. They usuallyinvolve a piece of equipment, warehouse space, etc. for a period of time.
Capital/Financial Leases: These leases are longer term, usually a function of the life of the assetto allow the lessee to recover the purchase price of the asset. They are treated much like debt-financed asset purchase from an accounting perspective, and are included on the balance sheet. Qualified capital leases receive unique tax treatment, fully deductible, which may be a majoradvantage. They are more popular in agribusiness than at the farm level, and are used for majorequipment items. In many cases, the option to buy at the end of the lease is structured toencourage purchase or replacement with another leased asset.
Leverage Lease: These leases involve three parties, a lessor, a lessee, and a lender. The lendermakes a loan to the lessor that enables him/her to purchase the asset. The lessor then leases theasset to the lessee. These are common in the transportation industry and could be used more inagriculture. These arrangements allow advantageous use of the tax and financial position of thelessor and lessee.
Leasebacks: This arrangement is commonly used to restructure financially-stressed businesses. The business sells the asset to another with a lease back provision. This provides the lessee use ofthe property. These leases can be effective to improve asset liquidity, and operating flexibility ofthe business.

Section V-1 page 145
EQUITY AND DEBT CAPITAL
An owned business has two fundamental sources of funds, debt and equity. There are a numberof alternative forms of debt and equity to make apparent simple decisions complex. (Boehlje andLins 1998) have described various forms of equity and debt capital. These forms are listedbelow:
Equity Capital• Initial Capital contributions• Retained Earnings• Stock• External Equity• Warrants or Options• Venture Capital
Debt Capital• Loans
• Interest Rates• Amortization arrangements• Prepayment Features• Security/collateral• Conversion terms• Shared appreciation mortgage• Reverse Mortgage• Index rate strips, future, and options
• Bonds• Convertible Bonds• Callable Bonds• Zero Coupon or deep discount bonds
D1b. To what degree are livestock producers allowed to operate agricultural systemsinterdependently as opposed to independently in Minnesota and in other states and what is
the significance?
General Comments
It is beyond the scope of this project to do the legal research needed to describe the corporatefarming laws and other laws related to business arrangements in every state in enough detail toassure complete accuracy and currency. It is apparent these laws are in a state of continuingchange. (Dahl 1991) provided a fairly comprehensive review in 1991 in which he identified ninestates of the fifty states (North Dakota, South Dakota, Minnesota, Wisconsin, Iowa, Illinois,Kansas, Missouri, and Oklahoma), as having major restrictions on corporate farms. He refers to aU.S. Supreme Court case which concluded that state corporate farming restrictions do not violatethe U.S. Constitution or the fourteenth amendment because property law is chiefly a state matter. He includes a map of the US showing states with major or minor restrictions on farm

Section V-1 page 146
corporations. One significant change since Dahl wrote his report is that Illinois no longer hasmajor restrictions on corporate farms. That state repealed its Agricultural Land Ownership Actin 1996. Also, Nebraska is listed by Dahl as having only minor restrictions, although that state isoften viewed as having one of the tightest restrictions in the nation (see reviewer comment). Another source of information on corporate farm laws in every state as of December 1992 is(Aiken 1993).
Neil Hamilton and Greg Andrews of Drake University Law School provided a review of stateregulation of contract feeding and packer integration in the swine industry in 1992 (Hamilton andAndrews 1992). They identified nine Midwestern states that have enacted corporate farminglaws. These were the same states identified by Dahl except that Illinois was not on his list, andNebraska was. Hamilton and Andrews conclude that the language of each law differs but thatmany arguably prohibit contract production of livestock either directly or indirectly. Theyindicate that contract feeding and packer integration were controversial and coming underscrutiny in several states. Their conclusions were that:
1. It is within the states' power to either place restrictions, prohibit or establish guidelines forhow contracting may be done,
2. Minnesota's legislation is the most ambitious example of state regulation of contract feeding,
3. If a state is determined to regulate contract feeding, then efforts should be made to deal withthe identified problems associated with it and the likely concerns if its use should spread,
4. Legislation concerning contract feeding does not necessarily have to prohibit or restrict itsuse but rather can establish guidelines to protect financial interests of producers and insurefairness of contracting methods,
5. One claimed risk of contract feeding legislation is that it will drive contract production toother states,
6. Anti-corporate farming laws can be interpreted as prohibiting both contract feeding andpacker integration by restricted business entities,
7. If contract production increases, states may need to consider legislation to protect producerrights to organize and bargain for fair marketing practices.
Legislation has been proposed at the federal level and in 16 states to protect contract growers andproducers, along similar lines to Minnesota's "Agricultural Contracts" law but with the additionof language to prevent retaliation against producers who participate in producer organizations. Arguments for and against the proposed federal legislation are given in (Boehlje et al. 2001) and(Harl et al. 2001). Boehlje et al. question whether the new rules would be sufficiently restrictivethat the unintended consequence would be to not maintain a relatively independent agriculturalstructure, but instead to encourage vertical integration through ownership of production facilitiesby processors and packers. Harl et al. reply that all of the provisions have precedent in other areasof the law, such as consumer protection legislation or trade regulation, and that the provisions
Section V-1 page 147
have not been shown to cause economic harm in those other contexts. Boehlje et al. do notdiscuss how the presence of a corporate farm law would affect the likelihood of ownershipintegration. The authors of Boehlje et al. are employed at Purdue University, located in Indiana. The fact that Indiana does not have a corporate farm law may affect the perspective of theirpaper. Minnesota's law prohibits such ownership integration, so that concern may be less real inMinnesota (Hamilton and Andrews 1992). Contract hog production has increased in Minnesotain the 1990s to the extent that transfers from contractee enterprises in 1999 exceeded sales fromindependent farrow-to-finish enterprises, despite the fact that Minnesota's "AgriculturalContracts" law has been on the books since 1990 (see Tables 25 and 31 below). Boehlje et al.also caution that restrictive multi-state or federal regulation might cause a shift in production toCanada, Latin America, Asia or Australia.
Neil Harl provided a review of business structure alternatives to assist farmers in determiningtheir best options in 1995. This publication focused on twelve North Central states and providesa review of state laws in these states at that time. Harl discusses the advantages anddisadvantages of various forms of business structures, how they operate, what taxes apply, andthe process of incorporation and dissolving the business (Harl 1996).
Mark Edelman at Iowa State is leading a project of the National Extension Public PolicyCommittee, which compared regulations by state. A preliminary report is available at (Edelmanand et al. 1999). Edelman's results were based on voluntary survey responses from ExtensionPublic Policy faculty in each state. Of the 35 states responding only five states indicated theirstate government prohibited corporations or other entities from owning farmland or engaging inconfined livestock operations. These states included Iowa, Kansas, Minnesota, Nebraska, andSouth Dakota.
Minnesota's Corporate Farm Law was first enacted in 1973. A brief history of Minnesota's law isavailable in (Dahl 1991). Producers are allowed wider latitude to operate interdependently inother livestock activities in Minnesota, compared to dairy, where only family farm corporations,and authorized farm corporations with five or fewer shareholders are allowed. Minnesota doesnot allow the legal form known as a limited liability company (or LLC) to be utilized inagriculture. LLCs are allowed in most other states. A summary of Minnesota's restrictions onforms of legal organization allowed in agriculture are shown in Table 16.
Mark Hanson points out that that livestock operations are expanding in the Midwest to takeadvantage of competitively priced feeds and scale efficiencies possible in larger more modernoperations (Hanson ). As the size of this venture increase, substantial capital must be employedto construct, develop, and implement viable production and marketing entities. These significantcapital requirements demand participation by investors, both on farm and off farm, whichprudently will require corporate liability protection. The business structure allowed in a givenstate becomes a central issue to livestock venture formation. Corporate farming laws tend toseverely restrict the type of business entity and venture that may be entered into. Security laws insome states have a significant impact on raising equity for a project.
Section V-1 page 148
Comments on Individual States' Restrictions
Minnesota: The Minnesota statute 500.24 Corporate and Partnership Farming can be accessed athttp://www.revisor.leg.state.MN.us/stats/5000/24.html.
Minnesota generally only allows family farm, family farm corporations, authorized farmcorporations, authorized livestock farm corporations (except for dairy cattle), family farmpartnerships, and authorized farm partnerships to engage in farming or acquire any interest inagricultural land. “Family” requires that a majority of the shareholders be related to each otherwithin the third degree of kindred and a least one of the related persons is residing on or activelyoperating the farm. (Hanson )
Minnesota repealed a 5,000 limitation on land that could be owned by a farm corporation in1973. They enacted a detailed statute requiring farm corporations to file an annual report, andlimited expansion of corporate farming operations except for family corporations and authorizedfarm corporations (Harl 1996). The law was amended in 1975 to further restrict who canoperate an authorized corporation: shareholders cannot exceed 5 and are natural persons or anestate; the corporation has only one class of stock; revenues from rents, royalties, dividends,interest, and annuities cannot exceed 20 percent of gross receipts; shareholders holding 51percent or more of the stock must reside on the farm and be actively engaged in farming; thecorporation cannot own more than 1,500 acres of land used for farming; and a shareholder of anauthorized corporation cannot be shareholder in another corporation that owns more than 1,500acres of farmland. (Harl 1996), (Hanson ).
In 1994, the limits were relaxed for corporations formed for production of livestock other thandairy cattle by natural persons or family farm corporations that provide 75 percent or more of thecapital investment; 75 percent or more of the control and financial investment must be held byfarmers residing in Minnesota; and at least 51 percent of the required farmers must be activelyengaged in livestock production. Previous other limitations to authorize corporations apply tothe new category of livestock production corporations. Dairy cattle production continues to be anexception to the other types of livestock production and is restricted from an authorizedcorporation as a legal form of business in Minnesota (Harl 1996). A Limited Liability Companyis not a legal business option for agricultural producers in Minnesota.
Hanson identifies an exception to corporations or limited liability companies for a breeding stockfarm that owns land for the purpose of raising breeding stock including embryos for resale tofarmers. A breeding stock farm that is organized to raise livestock other than dairy cattle mustsell castrated animals to be fed out or finished to farming operations that are neither directly norindirectly owned by the entity operating the breeding stock operation. Neither generalpartnerships nor limited liability partnerships are covered by the corporate farming restriction,but partners must be exempt themselves from the corporate farm laws for these entities to beused.
Hanson summarizes by concluding that Minnesota restrictions make structuring animalagriculture other than poultry with liability protection difficult. Authorize livestock corporationsmay be used other than dairy but they restrict investments from non-exempt entities.

Section V-1 page 149
For dairy, generally only a limited liability partnership may be used. He suggests the possibilityof joint ventures in which the buildings and animals are owned by a non-exempt entity andexempt entities conduct the farming and production activities.

Section V-1 page 150
Table 18. Summary of Legal Agricultural Business Organizations in MinnesotaENTITY
TYPEELIGIBLE SHAREHOLDERS INELIGIBLE SHAREHOLDERS NUMBER OF SHAREHOLDERS LIMITED
LIABILITYPASS-THROUGH TAXATION DAIRY AND ROW CROP
ELIGIBLEGeneral Partnerships Natural persons, partnerships,
other entities certified underthe corporate farm law
Entities that are not certifiableunder the corporate farm law,i.e. partnership of non-qualifying corporations
Unlimited No; joint and several liabilityexits for each partner
Yes Yes
Limited PartnershipsA. Family Farm Limited
PartnershipsNatural persons, partnerships,limited partnerships, limitedliability partnerships
Corporations, limited liabilitycompanies
Unlimited, but the majority ofthe shareholders must berelated within the 3rd degreeof kindred
Yes, for limited partners. However, there must be atleast one general partner thatretains liability.
Yes Yes
B. Authorized Farm LimitedPartnerships
Natural persons All non-natural persons suchas partnerships andcorporations
Up to 5; no relation required Yes, for limited partners. However, there must be atleast one general partner thatretains liability.
Yes Yes
CorporationsA. Family Farm Corporations Natural persons, partnerships,
limited partnerships, limitedliability partnerships
Corporations, limited liabilitycompanies
Unlimited, but the majority ofthe shareholders must berelated within the 3rd degreeof kindred
Yes Depends on whether thecorporation is a Subchapter Cor Subchapter S
Yes
B. Authorized FarmCorporations
Natural persons All non-natural persons suchas partnerships andcorporations
Up to 5; no relation required Yes Depends on whether thecorporation is a Subchapter Cor Subchapter S
Yes
C. Authorized LivestockFarm Corporation
Natural persons and familyfarm corporations
All non-natural persons otherthan family farm corporations
Unlimited, but 75% must befarmers, and 51% of the 75%must be livestock farmers
Yes Depends on whether thecorporation is a Subchapter Cor Subchapter S
No; only eligible forcorporations engaged inlivestock production otherthan dairy cattle
Limited Liability Partnerships Natural persons, partnerships,other entities certified underthe corporate farm law
Entities that are not certifiableunder the corporate farm law,i.e. partnership of non-qualifying corporations
Unlimited Yes; the partners may elect tohave some of the partnershave less than joint andseveral liability
Yes Yes
Cooperatives Treated the same ascorporations
Business Trusts Treated the same ascorporations
Limited Liability Companies Prohibited; no exceptions
Source (Prim et al. undated) MN Department of Agriculture
Section V-1 page 151
A brief description will be provided for other neighboring Midwestern states taken fromHanson (Hanson ) and Harl (Harl 1996), except for the South Dakota information whichis taken from South Dakota Statute 47-9A (South Dakota Legislative Research Council99).
Wisconsin: Wisconsin will permit corporations to own land and carry on farmingproviding there are no more than 15 shareholders, no more than two classes of stock, andall shareholders are natural persons. However Wisconsin law prohibits corporations fromengaging in the production of dairy, and hogs. Wisconsin also has a breeding stockexemption. Wisconsin corporate farm law does not prohibit poultry and egg production.
Iowa: Corporate ownership of agricultural land is prohibited. Processor ownership ofbeef and pork feedlots is restricted. If an entity other than a sole proprietorship or generalpartnership desires to own land in Iowa, it must fit into one of the following forms ofownership: a chapter 501 cooperative, a family farm corporation, an authorized farmcorporation, a family farm limited liability company, a networking farmers corporation, anetworking limited liability company, a farmers cooperative association, or a farmerscooperative limited liability company. The ownership structure depends on the makeupof the entity owners.
To qualify as a family farm entity, a family farm corporation or family farm limitedliability company, the majority of members or stockholders must be related to each otheras spouse, parent, grandparent, or lineal descendents of their grandparents or theirspouses. All stockholders or members of an authorized farm corporation or limitedliability company must be natural persons and number no more than 25.
The networking farmer entities - networking farmers corporation or networking limitedliability company - may hold interest in up to 640 acres of agricultural land if at least 75%of the entity’s gross receipts are from the sale of livestock or livestock products. Naturalpersons actively engaged in farming, or a general partnership in which all partners arenatural persons engaged in farming must own 51% of the issued shares and qualifiedpersons must own at least 70% of all issued shares. A qualified farmer is a natural personactively engaged in farming, a general partnership in which all partners are naturalpersons actively engaged in farming, or a farm estate. Qualified persons are qualifiedfarmers, a family farm entity, or a qualified commodity share landlord. Networkingentities can be formed with non farm entities so long as the percentage ownershiprequisite is met.
Authorized Farmer Cooperative, (FCA) farmer cooperative associations and (FCLLC)farmers cooperative limited liability companies, may hold interest in up to 640 acres ofagricultural land if it does not produce forage or grain. They may enter agreement with aperson to produce forage or grain so long as the grain is not received as payment for thelease. Qualified farmers must own at least 51% of the equity interest and qualifiedpersons must own 70% of the equity.

Section V-1 page 152
FCLLC cooperatives must own 100% of all membership interests, and FCAs must own70% of the interests. These business forms also permit joint ventures with non-farmcooperatives so long as the 70% ownership requisite is met by FCAs.
Chapter 501 Cooperative may acquire, lease, or otherwise obtain up to 640 acres ofagricultural land if authorized farming entities own 60% of the stock and are eligible tocast 60% of the votes at member meeting. An authorized farming entity is a naturalperson who regularly participates in the physical labor on the farm or one of the permittedcorporate forms of ownership. Natural persons or partnerships must own at least 75% ofthe stock and be eligible to cast 75% of the voted are member meetings.
Processing entities that control the manufacturing, processing, and preparation for sale ofbeef or pork products are restricted from owning, controlling, or operating hog or cattlefeedlot if their annual wholesale sales is greater than 10 million dollars. They mayparticipate in the breeding and farrowing of swine but cannot directly or indirectly controlthe finishing portion of the operation or provide feed and care for the animals for morethan ten days. They can contract for purchase of swine and cattle for slaughter.(Hanson ).
North Dakota; North Dakota generally allows only limited liability companies orcorporations with less than sixteen members or shareholders related to each other to ownreal estate or engage in the business of farming. Officers or members must be activelyengaged in farming and at least one must live on the farm. Excepted from this restrictionare cooperative corporations where seventy-five percent of its members or shareholdersare actual farmers residing on farms or depending principally on farming for theirlivelihood.
South Dakota: The family farm act of 1998 provides restrictions on corporations orlimited liability companies from forming or being licensed for the purpose of owning,leasing, holding, or otherwise controlling agricultural land to be used in the business ofagriculture, including facilities for the breeding, farrowing, and raising of swine. Familyfarm corporations with at least one shareholder residing on the farm or actively farming,and authorized small farm corporations with 10 or fewer shareholders, are exempt. Thereare other restrictions to this rule. For example, facilities for the purpose of feeding poultryfor meat and egg production, and facilities for feeding livestock are exempt.
Nebraska: The Nebraska constitution allows only family partnership, family farmcorporation, and family ranch corporations to acquire any interest in real estate used forfarming and engaged in farming or ranching. Related individuals must hold a majority ofthe stock and at least one of them must reside or be actively engaged in the day to daylabor and management of the farming operation. This prohibition includes non-stockcooperatives. There are exceptions to this corporate farming restriction; for example,agricultural land used for poultry production is excepted.
Kansas: Statewide, Kansas restricts agricultural land ownership to authorized farmcorporations, family farm corporations, limited liability agricultural companies, familyfarm limited liability agricultural companies, and limited agricultural partnerships. There

Section V-1 page 153
are some qualifying limitations and exceptions. Agricultural land may be held or leasedby a corporation or limited liability company for use as a feedlot, poultry confinementfacility, or rabbit confinement facility. There are some special county approvalrestrictions on corporate or limited liability company use of agricultural land for swine ordairy production.
Illinois: The Agricultural Land Ownership Act was repealed effective August 14, 1996. The Illinois statutes, administrative rules, and case law neither restrict nor expresslypermit corporate ownership for profit of an agricultural pursuit.
Summary Comments
There is wide diversity in the limitations placed on business structure and arrangementsamong the fifty states. Most states do not prohibit corporations or other entities fromowning farmland or engaging in confined livestock operations. Midwestern states tend tobe more restrictive in the business structures allowed for agricultural use (Edelman and etal. 1999), (Dahl 1991). From the above review of Midwest State limitations, there isinconsistency in the language of the laws and how the laws apply to types of livestockproduction, poultry, swine, dairy, or beef. The rationales for these differences areunclear. It is evident that many states have provisions for exceptions, and thatinterpretation of laws in place has changed over time. There is wide diversity in theenvironment regulations among states(Edelman and et al. 1999). Hanson points out thatenvironmental and zoning laws strongly impact location decisions (Hanson 1998).
There is very little documentation on who owns and controls livestock or other farmassets in Minnesota, as discussed below in section D5 on ownership and control. Anecdotal information suggests that there are farm families who working together inmulti-family operations using the various legal forms and business arrangementsmentioned above to achieve desired control, return and risk objectives. To the extent thatthe previous statement is true, multi-family operations are a research topic that relates toquestion D1b on interdependent vs. independent operation. One study on multi-familyoperations is (Lawless et al. 1996). This Wisconsin study points out that the singlegreatest factor affecting multi-family operations are outside economic and demographicforces to which families can only react. Their discussion focused on dairy farms but theprinciples apply to other livestock classes. They discuss five rationales motivating farmmulti-family businesses:
Farm viability: This rationale assumes the best way to survive is to expand theiroperation. Some families do not have the capital and cannot acquire the financing to do italone so are attempting to do it with others. Some see the advantage of scale efficienciesand combining capital, labor, and management expertise as a means of improvingefficiency, and reducing unit production costs.
Quality of Life: By involving more families in larger operations, the workload andmanagement can be parceled so that no one individual is overly burdened. Some do notwant to commit to the 365 day responsibilities of operating a single family operation and

Section V-1 page 154
their descendant are less likely to want to make this commitment.
Value added: Some farm families are looking to add value to their farms grain and forageproduction through a mutual investment in a commonly owned livestock enterprise andenjoy the gain of addition value added income.
Return on Investment: This rationale is to achieve a fair return on their capital investmentin the business.
Community Economic Development: Non-farm community interests in generating jobs,markets, and economic vitality in the community.
QUESTION E3. HOW DO GOVERNMENT POLICIES, REGULATIONSAND PROGRAMS AFFECT THE PROFITABILITY AND VIABILITY OFLIVESTOCK FARMS AND FIRMS IN MINNESOTA? HOW DOGOVERNMENTAL POLICIES IN OTHER STATES AND COUNTRIES DIFFERFROM THOSE IN MINNESOTA WITH RESPECT TO THEIR IMPACTS ONFARM/FIRM PROFITABILITY AND VIABILITY IN THOSE PLACES, ANDWHAT CAN WE LEARN FROM THEIR EXPERIENCES?
Spatial Models to Analyze the Economics of Livestock Waste and Its Regulation
Several economists have developed spatial models of livestock producers' economicdecisions under alternative approaches to regulation, most recently (Innes 2000), whoalso cites earlier work by (Roka 1993) and (Schnitkey and Miranda 1993). Key featuresof Innes' model are assumptions about economies of size in the waste storage andspreading process, and in livestock production apart from its waste aspects. Producersfaced with these economies and a competitive marketplace decide how large theirlivestock facilities will be and how many of these facilities there will be in a given region. The waste storage structures are assumed to have some probabilities of leaking and ofoverflowing. The waste is transported to fields of different distances from storage, withthe objective to minimize the sum of fertilizer purchases plus transport costs. Innesassumes that a large manure spill or leak is more damaging to the environment than thesame quantity spilling or leaking from multiple smaller sites, and concludes that storagestandards should be stricter for larger structures. He takes for granted that it isimpractical to monitor or regulate manure-spreading itself, and considers a) limits onanimal density/acre or on size of facility, and b) taxes on chemical fertilizer asalternatives.
The general conclusion that Innes draws from the model is that because of the negativeexternalities from livestock production, too much (i.e. a higher-than-socially-optimal)production will tend to take place in the absence of regulation. See (Innes 1999) for anon-mathematical discussion of the model, and compare with (Lovell and Kuch 1999) onthe question of how practical the direct regulation of manure spreading is. While thisinsight is useful, a considerable amount of additional work would be required to fit themodel to data and solve it for empirical results relevant to specific locations. Such

Section V-1 page 155
quantification would be necessary to evaluate how much smaller a "socially-optimal"livestock facility would be compared to current sizes that have evolved in the absence ofsize limitations, for example. Even if the model could be quantified and solved, itsusefulness for policy-making might still be limited because of some of the ways itabstracts from reality. It ignores heterogeneity of livestock facilities, for example,ignoring the fact that smaller facilities tend to be older and designed to less stringentenvironmental standards. It also ignores significant aspects of Minnesota's regulatorypolicies, such as monitoring phosphorus buildup through soil testing.
Cost of Compliance with Minnesota's Revised 7020 Feedlot Rules Adopted in 2000
Minnesota's feedlot permitting rules were revised in 2000. One requirement of the newlaw was a mandate that the state must arrive at an estimate of the financial assistance thatproducers would need in order to bring their operations up to the requirements of the newrules. The new rules stated that the Pollution Control Agency may not require a feedlotoperator to spend more than $3,000 to upgrade an existing feedlot with less than 300animal units unless cost-share money is available to the feedlot operator for 75 percent ofthe cost of the upgrade, or to spend more than $10,000 to upgrade an existing feedlot withbetween 300 and 500 animal units, unless cost-share money is available to the feedlotoperator for 75 percent of the cost of the upgrade or $50,000, whichever is less. Thefeedlots are required to come into compliance over a ten-year period. A MinnesotaDepartment of Agriculture work group recently estimated the total ten-year cost forimplementing the new rule at $238 million. Of that total, $163 million is for structuralupgrades falling under the above language. The remaining $75 million is for engineeringassistance, manure management plans, and handling equipment required by the rules butnot covered by the cost-sharing language, and $2 million for feedlots with over 500animal units that would not be eligible for cost sharing because of their size. Cost-sharefunding to cover the structural upgrade portion of that cost would come to $122 million. Current cost-share funding already available is around $50 million, so $73 million inadditional public funds would be needed to meet the requirements of the statute (Wilcox2001).
Impact of State and Local Policies on Locational Shifts of the Swine Industry
Metcalfe studied regulatory data for 19 states on ten different regulations imposed tocontrol manure management on animal feeding operations, and found that the regulationsbecame significantly more stringent between 1994 and 1998 (Metcalfe 2000). He rankedthe regulations using an index based on 1) some regulation imposed at the local level,requirements for 2) facility and 3) waste system design approval, 4) geological testing, 5)requirements for public notice or hearings, 6) regulated setback distances, 7) nutrientmanagement plans, 8) size restrictions more stringent than federal NPDES permit levels,9) bonding requirements, and 10) moratoria on size of operation or on total production. Presence of cost-share programs was also considered. By his index, Minnesota'sregulations were the most stringent in 1994. By 1998, five other states had regulations ona par with Minnesota's (Arkansas, Georgia, Iowa, Kansas, and Mississippi, while Illinois,North Carolina, and South Dakota were only slightly less strict than Minnesota.

Section V-1 page 156
The significance of the state corporate farm laws and state and local environmentalpolicies is difficult to evaluate reliably. One approach taken in several studies is tomeasure the policies' impacts by comparing livestock industry trends in states with moreand less restrictive policies. The most recent study of this type is Park et al. (Park et al.2000), a presented paper from the 2000 Western Agricultural Economics Associationannual meeting. As a presented paper, it has not yet received the scrutiny that a peer-reviewed journal article would receive. Some parts of the paper are not explained veryclearly5. Despite such flaws, the paper is cited here in addition to two older papersdiscussed below, because it contributes to the knowledge base in at least three ways. First, it relates the rather thin literature on livestock industry location to a moresubstantial literature on factors affecting location of manufacturing plants. The authorsconclude from that literature that environmental policy differences generally have littleeffect on manufacturing plant location, but also that cases exist where policy stringency isnegatively correlated with plant location decisions. Second, they entertain the possibilitythat the relationship between environmental policy and livestock industry location is atwo-way one - environmental policy developments may be a result of past livestockindustry growth, as well as driving future growth, although their regression analysis isinadequate to establish which way the causality lies. Third, they break out the policyimpacts between on small (less than 300 AU), medium (300 to 1,000 AU), and large(over 1,000 AU) operations, with all livestock species combined into one size measurewith the inventory data converted into animal unit equivalents. They include livestockdata for all 48 contiguous states over a 30-year period, but their data on policies wastaken from a 1998 survey so might not have accurately represented earlier policies. Onefinding consistent with their expectations was that presence of a corporate farm law had anegative effect on the number of animal units on large operations, while affecting thesmall and medium size groups and total size positively. Some of their other findingswere counterintuitive. For example, they found that agricultural zoning was negativelycorrelated with volume on large operations while written stringency of environmentalregulations and amount of fines levied were positively correlated with large operationvolume. They argue that these counterintuitive findings may be due to a reverseddirection of cause-and-effect. That is, the observed regulatory differences may be inresponse to the growth of the large operations, rather than preceding and influencing theirgrowth.
Another study looked at trends in the swine industry in 13 major producing states over theperiod 1988-95 (Mo and Abdalla 1998b) (Mo and Abdalla 1998a). This was a linearregression analysis with the dependent variable being the annual percentage change inhog inventory by year, for the states IL, IN, IA, KS, KY, MI, MN, NE, NC, OH, PA, SD,
5 For example, a table of annual percentage changes in livestock inventories by size of operationbetween 1970 and 1996. The source of the data is said to be the 1997 Census of Agriculture, butthe data is given in two-year increments while the census is only conducted every five years soperhaps some sort of smoothing technique was used to interpolate to the intervening years, or thedata was actually obtained from other National Agricultural Statistics Service publications.

Section V-1 page 157
and WI. Sixteen independent variables were included covering four categories: NaturalEndowment, Economic Factors, Business Climate, and Regulation Factors. Of the fourcategories, economic factors were found to have the greatest influence on swine industrygrowth. These included the hog-corn ratio, percentage of farms with a hog inventory over1,000 animals, and state slaughter capacity having positive impacts on growth. It isinteresting that growth was more rapid in states with higher land values rather than lowerones. They had expected a lower land cost to stimulate expansion because it wouldreduce capital requirements. On the other hand, higher land values would providecollateral for facility loans, and that may be the influence that they picked up in theanalysis. They included seven variables to measure the restrictiveness of state and localpolicies:
• Green index of general environmental regulations at the state level
• Lester classification of states' commitment to environmental protection activities andinstitutional capabilities
• Stringency of states' animal waste programs, based on rankings by three experts
• Staffing levels devoted to state animal waste control programs
• Average amount of fines imposed annually by state regulators
• Presence or absence of an anti-corporate farming law in the state
• Presence of absence of an agricultural exemption to local zoning
The impacts of the policy variables were as follows: The Green and Lester measureswere found to have mixed influences on growth. The Lester measure placed more weighton enforcement capability, and was associated with lower growth (Mo-Abdalla do notprovide details on the variables entering into the Lester and Green measures, but they citeother publications which describe them in detail). The measure of stringency of animalwaste programs was insignificant, possibly because of the way it was measured. Finestended to have a negative impact on growth. Higher staffing levels were also expected tosuppress growth but had the opposite effect, possibly because the causality runs the otherdirection -- the industry grows, and then staff is increased in response. Growth was morerapid in states with agricultural exemptions to local zoning. Anti-corporate farming laws,on the other hand, did not slow growth. It should be noted that they did not attempt tomeasure how strict each state's anti-corporate farming law was.
Osei and Lakshminarayan performed a similar regression analysis of the U.S. dairyindustry (Osei and Lakshminarayan 1996). They looked at the probability that a givencounty would experience an increase in dairy farm numbers between 1987 and 1992, as afunction of milk price, feed costs, temperature and precipitation, land value, populationdensity, surface water density, and four variables characterizing the stringency of

Section V-1 page 158
environmental policy. The economic variables of milk price, feed costs, and land valuesagain had the expected effects, with higher milk prices encouraging farms to locate in thecounty while higher feed costs and land values discouraged location. Values for fourenvironmental variables (air quality, groundwater policy, soil conservation, and anaggregate environmental policy index) were obtained from data provided by the Fund forRenewable Energy and the Environment as cited in (Lester and Lombard 1990). The fourenvironmental policy variables all reduced the probability of location. When populationdensity was introduced as a variable, the separate effects of the environmental policyvariables were still negative but of lesser magnitudes. This was especially true for airquality policy. Their explanation is that:
"The intuition behind this is clear when we realize that air policy issuesarise in relation to odor and other air quality problems, which are mostprominent when dairies are located in residential or densely populatedareas. Thus, by locating away from densely populated areas, dairies avoidmost of the regulatory pressures relating to odor and other air pollutants."
(Drabenstott 1998) argues that environmental regulations have recently been and will inthe future be a major influence in the future location of the pork industry. This is asummary of statistical data from a variety of sources with interpretive comments aboutdriving forces and possible future directions. He does not quantify the impact of theregulations on profitability of existing farms. Even if tighter regulations do not requireexisting livestock facilities to be modified, competitive pressures due to productivityimprovements elsewhere in the industry may reduce the profitability of existing facilities. Producers will then be forced to expand, renovate or replace them (refer to the treadmillhypothesis mentioned under question E2a), at which point they become subject toincreased regulatory scrutiny. See discussion of Outlaw et al. for empirical results relatedto this point (Outlaw et al. 1993).
Drabenstott argues that the new pork supply chains with tens or hundreds of thousands ofsows prefer large-scale units, and so have tended to locate their units in non-traditionalpork producing states such as Utah and Oklahoma because of their less restrictiveenvironmental regulations. He states,
“What is clear is that firms in the pork industry are comparing regulatoryclimates across state lines and even county borders in search of places withfewer regulations. Analysts are divided on how important environmentalregulations are in causing geographic shifts in production.” (p. 91)
The states are responding rapidly with tighter regulations, however. He also states thatthere is no comparison available on state-by-state variation in the overall costs ofcompliance with environmental regulation. It seems clear that if precise quantitativeestimates of compliance costs are desired for the GEIS, new research will be needed toderive them.
Drabenstott claims that two environmental issues will be important in shaping pork

Section V-1 page 159
industry location decisions:
• whether a national set of environmental standards is enacted, and
• differences in regulation across national borders.
The EPA has announced that it wants final action on national guidelines by December2001. Drabenstott argues that standardized national standards would tend to pushlocation decisions to the local level, where some communities are eager to embrace theindustry while many others are not. He also argues that standardized nationalenvironmental regulations would highlight the role of corporate farming laws, which areaddressed under question D1b.
Cost of Compliance with Dairy Waste Management Regulations
We could find few published empirical analyses of the cost of livestock operations'compliance with environmental regulations. One reason for the dearth of work on thisarea may be that the regulations are evolving so rapidly and vary so much across localitiesand farm types. It is difficult to arrive at a small number of representative farm situationsthat can be analyzed to provide results that are generalizable to the range of farmsituations that are out there, and that will stay relevant into the future.
One empirical analysis of dairy farms' cost of compliance with 1993 U.S. EnvironmentalProtection Agency standards is (Outlaw et al. 1993). They did an analysis of budgets for anumber of representative farms using their Farm Level Income and Policy SimulationModel (FLIPSIM). They looked at several dairy farm sizes in different regions of theU.S. They used the EPA Region VI standards as the basis for comparison, and adjustedthem for climatic and soil conditions in the other states. The did not study Minnesota, butfor Wisconsin they found that minimum capital investments for compliance ranged from$20,000 on a 50 cow farm to $40,000 on a 175 cow farm. Also:
"Moderate size dairies were found to be affected more adversely by being required tomeet the specified Region VI EPA regulations than large size dairies. Dairies that werealready in financial trouble could be put out of business by requirements to conform withthe Region VI EPA standards. Many of these dairies, however, could go out of businessregardless of the EPA requirements, albeit at a later date.
Large scale dairies that were not already in financial trouble appear to be able to amortizethe extra capital investment costs associated with meeting the Region VI EPArequirements. This suggests that moderate size dairies faced with needing to makeinvestments to meet the EPA standards may choose to expand the scope of theiroperations, if financially able. While such expansion would require an even largerinvestment, it also would hold the potential for making the dairy more efficient andcompetitive." (p. ii)

Section V-1 page 160
International Policy Developments
Federal and international agricultural policy is a very broad topic with a voluminousliterature. The question was raised in a meeting of the GEIS Citizens' AdvisoryCommittee as to the extent to which this response should address national-level policiesin the U.S. and other countries, and how they might enter into the eventual GEIS policyrecommendations. The sense of the group seemed to be that the response should focus ondescribing recent national-level policy developments and economic trends which mightmost directly affect the outcomes of Minnesota's policy alternatives. More oninternational policy is included in a separate publication, "Forces Affecting Change in theMinnesota Livestock Industry."
QUESTION D3. HOW ARE LIVESTOCK BUSINESSES DIFFERENT FROMAND SIMILAR TO NON-AGRICULTURAL BUSINESSES WITH RESPECT TOTHE FOLLOWING FACTORS, AND WHAT ARE THE IMPLICATIONS OFTHESE DIFFERENCES:
There are a tremendous number of ways in which livestock businesses and non-agbusinesses are different and similar. This question as stated is much too broad to beresearchable. Environmental Quality Board staff indicated that this question grew out ofconcerns such as: "Does agriculture receive special treatment in terms of public policyand public sentiment, and should it receive such special treatment?" and urged us toaddress the question from that perspective. From a practical standpoint, one way tonarrow this question to a manageable scope would be to state a few specific policy issueswhich call for such a comparison. If that were done, we would be better able to start tofocus on the similarities and differences that are most likely to be important to addressingthose policy issues. For example, one policy issue might be: "Should the state givelivestock facilities and other agricultural property preferential property tax rates comparedto other businesses and residential property?" One way in which studies have addressedthis question is to compare costs of public services to tax revenues. One such study is(Senf 1994), which found that farmland in Farmington, Lake Elmo, and Independencerequired less than $1 of expenditures per $1 of revenues, and a lower ratio ofexpenditures than did residential or commercial/industrial land. At least two studies ofthe cost of urban sprawl are currently underway, one by the Twin Cities MetropolitanCouncil and another by the Minnesota Department of Agriculture (Taff 1999). Additional studies are cited in a paper by the Lincoln Institute of Land Policy (see Tafffor source). They caution that:
"Fiscal impact studies must be carefully evaluated, since the choices ofmethodology and assumptions greatly influence the findings. It has beennoted, for example, that 'the results of most fiscal impact analyses conformwith the policy inclinations of the governments or organizations thatsponsored them.' (Altshuler et al. 1993, page 92). Burchell and Listokin(1992) also note that few fiscal impact analyses are tested for reliability bycomparing actual costs and revenues after development with pre-development projections. Finally, since specific circumstances vary

Section V-1 page 161
considerably from community to community, generalizations should bemade with caution."
Comments on the individual factors:
a. location
One approach to this would be to compare how dependent different county ormetropolitan economies are on agriculture, versus other industries. A map of farming-dependent counties is available on the USDA web site, along with similar maps showingdependence on other industries (Nonmetro Farming-Dependent Counties, 1989 99). Thecriterion for the farming dependence map is that at least 20 percent of labor andproprietors' income is from farming. Roughly half of the counties in southwestern andwest-central Minnesota, along with most of the Red River Valley region and a fewcounties in the southeastern part of the state, are dependent on agriculture by thismeasure. Minnesota appears to be less dependent on agriculture than the region furtherwest, including most of the Dakotas, Nebraska, western Kansas and eastern Colorado,and down into northern Texas.
A larger question might be how diversified county economies are, versus how dependenton any one industry, whether agriculture, mining, forestry, steel, or whatever. On theother hand, if the policy question of the moment is whether to enact some policy whichaffects the economic viability of agriculture, then knowing how dependent one's economyis on agriculture would help one predict the impact of the policy.
Various web sites are available which allow searching for government economic statisticssuch as jobs, income, and number of firms by industry and by state, county, ormunicipality. One is the U of MN Humphrey Institute of Public Affairs' EconomicDevelopment web site (Welcome to the State and Local Policy Program's ECONOMICDEVELOPMENT WEB SITE 99). We could compile some summary information fromthese databases, but most of that work might be better left until some specific policyquestions are identified.
A recent analysis of U.S. Bureau of Labor Statistics payroll data shows that most ruralMinnesota counties are gaining manufacturing jobs, although the author cautions againstcomplacency about the future. Most gained manufacturing payroll between 1988 and1996 by more than the national average increase of 28.3 percent (Beal 1999). By thismeasure, at least, the economy of the state's rural counties may depend less on thelivestock industry than it once did. The complete study is available in (Zimmerman1998). A comparison of Minnesota counties bordering other states against counties in theother states bordering Minnesota shows that the other states are doing better (seeZimmerman's Table III-4, not duplicated here). Jobs in the other state counties increasedby 32 percent from 1988 to 1995, while the Minnesota border counties increased by 20percent. Furthermore, most of Minnesota's border growth came in one county, Dakota. Minnesota border counties other than Dakota only increased by an average of 8 percent. The recent decision by Anderson Windows to locate a new factory in Menomonie,

Section V-1 page 162
Wisconsin rather than in Woodbury, Minnesota reinforces this concern (Hughlett 1999).
Another recent USDA study found that manufacturers in rural and metropolitan locationsare remarkably similar in their adoption of new technologies, worker skill requirements,use of government programs and technical assistance, exports, and sources of financing,based on a national survey (Gale et al. 1999). The most widespread concern was withquality of labor.
Study question 3 asks how livestock businesses are different or similar to non-agriculturalbusinesses. Most industry comparison statistics lump all farms into one industrycategory, so it is easier to compare all agriculture with non-ag than to compare justlivestock businesses. Employment, for example, is not split out separately for livestockversus crop enterprises. Most farm operators raise both livestock and crops, and the shareof time spent on livestock varies widely. One can estimate the share of employmentinvolved in producing a particular species of livestock by such means as multiplyingtypical labor requirements per animal times animal inventories, but such estimates wouldnot be very accurate.
b. technology employed
At a very aggregate level, "technology" implies a mix of capital, labor, and land whichdiffer across different types of businesses. We were unable to locate any publications thatcompare technology in livestock businesses with non-agricultural businesses, other thanpersonal computer use. In 1995, 15 percent of U.S. farms (including both livestock andcrop farms) reported using computers for bookkeeping and financial analysis, 6 percentfor production decisions, 2 percent to aid chemical application or field operations, and 0.8percent reported use of global positioning systems (Sommer et al. 1998). In a June 1997nationwide survey, 43 percent of Minnesota farms reported having access to computers,32 percent owned or leased a computer, 22 percent used computers in the farm business,and 11 percent had Internet access (Farm Computer Usage and Ownership 1997). TheMinnesota numbers were not split out for livestock operations versus crop, but the datafor the north central region was split out. North central livestock operations' computerusage was very similar to that for all Minnesota farms. Minnesota farms' usage was alittle higher than that of all U.S. farms except for the category of Internet use, where 13percent of all U.S. farms reported having Internet access compared to 11 percent ofMinnesota farms.
Computer use by workers in non-metropolitan areas is at 36 percent and increasingrapidly, but still lags behind use by metro workers whose rate is 49 percent based on datafrom the Current Population Surveys for 1984, 1989 and 1993 (Kusmin 1997). Thedifferences are attributed to differences in the mix of occupations. (Gale 1997) discussesa wider range of manufacturing technologies and differing rates of use by manufacturingplants in metro and non-metro locations, but does not include farms.

Section V-1 page 163
c. business concentration
This topic has been widely studied for at least some industries. In agriculture, most workhas focused on the meatpacking industry. Most work that has analyzed businessconcentration has done so from the standpoint of how concentration might affect businessconduct and performance (such as ability to charge monopoly prices). The productionagriculture sector, including livestock businesses, has been regarded as not concentratedenough to raise performance concerns, so to our knowledge has not been studied much.
d. use of land as a resource
We have been able to locate few studies that directly compare use of land as a resource bylivestock businesses and non-agricultural businesses. There are databases that describeland use by agriculture. For example, the U.S. Census of Agriculture contains data onland in farms and in various crops on a nationwide basis and by state and county (U.S.Census of Agriculture 1998). The Minnesota farm business summaries contain data oncrop acres owned and rented by farms with different types of livestock (Olson et al.1999), (Minnesota Farm Business Management Program, Statewide Annual Reports,1996 undated). We are aware of databases of land use data that are focused mainly onconservation issues, and databases exist that contain land use statistics for non-agricultural industry categories such as timber by type of ownership (Statistical Abstractof the United States 1998). We have not delved very far into this topic due to uncertaintyabout what the real questions are and the criteria for comparison that are of interest. Further focusing of the question is needed to improve researchability.
One possible way to narrow this question to a more manageable scope would be toconsider only those aspects of land use that affect the amount of water pollutionoriginating from land used by livestock businesses and other businesses. One study inthat vein is a 1991 survey of Twin Cities residents on the use of lawn care chemicals,including fertilizers and pesticides (Creason and Runge 1992). They found that averagelevels of fertilizer application appeared to fall below recommended levels, and thatpesticide application rates were similar to non-urban agricultural use. They stressed theneed for follow-up studies to obtain better information.
e. patterns of ownership and control
(Strasser 1989) is one source that discusses ownership and control in retailing, which hasparallels with what is happening in the livestock industry. For example, during the 1880'sand 1890's, local retailers protested the rise of department stores and mail-order houses(page 215). Legislation passed in 1912 that authorized parcel post shipments wascontroversial, since it benefited Sears and Montgomery Wards and was a severe blow toretail merchants (page 81). Of course, the current controversies over WalMart takingbusiness away from rural main street retailers illustrates that the retail industry continuesto evolve. Further comments are included under question D5a below.

Section V-1 page 164
f. government regulation and assistance
Government is involved in all sectors of the economy in a myriad of ways. It would beeasier to compare livestock businesses with the rest of the economy if some sort of indexsuch as dollar cost could be assigned to each government program and totaled up for eachindustry. To arrive at such an index would necessitate comparing against a hypotheticalcase of no government involvement, however. As (Browne et al. 1992) point out,
"A market system totally free from government involvement is amisnomer. Market systems require ownership of resources and the right tocollect returns from those resources. So government has to be involvedfrom the outset to establish some public agreement on protecting theownership rights of individual entrepreneurs. The way these rights areestablished has definite repercussions for market performance (in otherwords, for the allocation of resources to their most valuable and best use)and for the distribution of wealth in a society." p. 129
Lacking a way to sum up the overall effect of all types of government involvement, wecan still identify publications which merely describe the major types of regulation andassistance. One recent summary of federal programs affecting rural businesses in generalis (Bowers 1998). They list targeted tax cuts, disaster aid, transportation programs,housing assistance, welfare-to-work programs, and regulatory changes includingtelecommunications, electric power, air and water pollution, public land management,banking, and finance. Many of the federal programs affecting agriculture are included infarm bills, which in recent years have been passed roughly every five years. Mostprovisions of the Federal Agriculture Improvement and Reform Act of 1996 are wellknown, but for a summary see (Young and Westcott 1996).
g. public perceptions
Is this question intended to evaluate the often-heard perception that agriculture is viewedmore favorably by the public than are other industries, and deserves special treatment ingovernment policies? There are several rationales for this perception, such as: 1) a moralor Jeffersonian argument that farmers are more deserving than other people just becausethey work the land and produce a product, food, which is more essential than many otherproducts; 2) a regional economics-based argument that at least some rural communitieshave few other industries to depend on for tax revenues and trade; and 3) a socialargument that owner-operators are more likely to be stable and involved in the localcommunity than are people who work for others, and that owner-operators make up alarger share of the agriculturally-based population than for other industries.
Farmers' values were compared to those of the general population with respect tomorality, political ideology, work ethic, and outlook, in (Drury and Tweeten 1997). Using data from the General Social Surveys of the National Opinion Research Center atthe University of Chicago, they found that:

Section V-1 page 165
"Compared with the general population, the farm family is more stable, thetypical farmer is more religious, politically more conservative, and happierand more satisfied with some aspects of life. "In many aspects,particularly those concerning work ethic and outlook, farmers are notdifferent from others. Nonetheless, as a group, farmers are among thebetter-adjusted members of society. They are optimistic and have ahealthy outlook on life in terms of interpersonal relationships and generalviewpoint." (p. 68)
They conclude that farmers' unique attributes can translate into positive externalitybenefits which the public can weigh against the costs of government interventions to savefamily farms. Offutt et al. took Drury and Tweeten to task, arguing that the basicquestion of preference in policy for farmers is a matter of equity -- of societal andpolitical preference for redistribution among favored and less favored groups -- not one of(economic) efficiency. They also questioned the definition of morality used (Offutt et al.1998), (Drury and Tweeten 1998).
A earlier nationwide mail survey by Tweeten found that the public was much concernedabout farm problems and committed to preserve the family farm. The public wasgenerally supportive of government efforts to help farmers but tended to be undecidedregarding specific measures (Jordan and Tweeten 1987).
There are perhaps over one hundred publications that relate to public perceptions of awide range of specific issues more or less related to agriculture. They do not appear to berelevant to the ag versus non-ag comparison question posed here, so will not be citedindividually, but some of the issues addressed in different studies are:
• biotechnology (the most widely researched issue, by far)
• food hazards
• transmissible spongiform encephalopathies (mad-cow disease)
• food irradiation
• agrichemicals or pesticides
• feed additives such as growth promotants and antibiotics
• how farmers treat the soil
• agricultural research
• regulatory changes

Section V-1 page 166
• natural resources management or wilderness management
• river management and storm water management
• fish farming in general, and shrimp farming in particular
• fee hunting
• the pulp and paper industry
A 1995 BRE ( Business Retention and Enhancement Program) in Becker and Ottertailcounties surveyed dairy producers on their perception of how they thought dairy farmerswere perceived in the community. The responses for negative or indifferent attitudestoward dairy farmers were: Farmers ( not dairy producers) 42%, Main Street Businesses47%, Local Government Officials 51%, Rural non-farm residents 64%, and City residents73%. Of the 131 respondents 73% indicated that it was highly likely they would continueto produce milk through the next three years, with larger herds indicating they planned tocontinue dairying. (Morse et al. 1995) A similar study in Stearns county in 1997 rankedthe top five characteristics dairy farmers valued about dairy farm life: 1) Good place toraise a family 2. Opportunity to make own decisions 3. Time to be used with family 4.Economic rewards from farming and 5. Opportunity to work outdoors. Of the ninety twopercent of the respondents in this survey that plan to continue farming over the next threeyears, 41% said they were likely or very likely to expand their dairy operation. (Love andLazarus 1997)
The Iowa Farm and Rural Life Poll is conducted annually by Iowa State University toaddress major farm and rural issues (Lasley and Larson 1998). The 1998 report presentsfarmers' opinions about economic development directions that have been pursued orsuggested for Iowa. Improving rural infrastructure, maintaining a world class educationalsystem, and diversifying agriculture were supported more strongly in 1998 than ten yearsearlier. There was also strong support for local processing, placing more emphasis onagricultural exports, and funding biotechnology research, but support for these was downslightly from 1988. A majority thought their quality of life had improved in the past fiveyears. They were mainly optimistic about continued improvement in their own family'squality of life, but less optimistic about their communities. There was an increase inconcerns about odor and noise from livestock operations.
Section V-1 page 167
QUESTION D4. WHAT IS THE CURRENT MARKET SITUATION, HOW ISTHE MARKET CHANGING AND WHAT ARE THE IMPLICATIONS FORLIVESTOCK PRODUCERS WITH RESPECT TO THE FOLLOWINGFACTORS:
a. consumer demand (including brand loyalty)
We found a large body of literature related to Question D4 on the changing marketsituation. We have cited some refereed journal articles on consumer demand, but weconcluded that many of the changes in food distribution and retailing that may potentiallyaffect producers are better described in various USDA reports and trade magazines. TheUSDA Economic Research Service monitors trends in food consumption. The latestnumbers by commodity, and a discussion of the methodology used to measureconsumption, are presented in (Putnam and Allshouse 1999). Food consumption isgenerally measured indirectly, by subtracting non-food use from supply numbers.
When economists refer to consumer demand, they are generally referring to a concept thatis somewhat broader than simply per capita consumption at a point in time:
"Demand is a schedule of different quantities of a commodity that buyerswill purchase at different prices at a given time and place." (Kohls 1967),p. 131.
Two consumer demand research issues that have received considerable attention byacademic researchers over the past decade or so are:
• How has the relationship between quantity demanded, on one hand, and price,socioeconomic and other observable variables changed over time, and
• What is the impact of advertising, especially generic versus brand advertising?
The first question is especially important for price forecasting. For example, researchershave studied how consumers' preferences have evolved as a result of a growing awarenessof the health hazard of high fat intake. (Moschini and Meilke 1992), (Green and Alston1990), (Eales and Unnevehr 1988), (Eales and Unnevehr 1993), and (Eales and Unnevehr1994) are all studies that looked at structural change in U.S. meat demand and approachesto estimating demand elasticities.
Interest in the second question has been motivated at least in part by the desire to evaluatethe effectiveness of producer check-off-funded generic advertising for milk, meat, andeggs. (Brester and Schroeder 1995) studied the effects of meat advertising expenditureson beef, pork, and poultry demand. Studies of milk advertising include (Lenz et al.1998), (Kaiser and Liu 1998), (Pritchett et al. 1998), (Kaiser et al. 1992), (Suzuki andKaiser 1997). (Schmit et al. 1997) looked at the impact of generic advertising on eggdemand.

Section V-1 page 168
Generic advertising has raised fluid milk sales an estimated 18.1 billion pounds (6.0%)and cheese sales by 6.8 billion pounds in the period September 1984 and September1997. The impact on sales of butter and frozen products was unaffected. Theseresearchers estimated milk prices were 2.3 percent higher than they would have been inthe absence of the program. They estimated the gross return for each dollar of the 15 centsper hundredweight assessment to return $3.44 from the generic advertising. (Blisard et al.1999)
In 1993, a random sample of 515 consumers in the metropolitan Minneapolis-St. Paul,Minnesota area were surveyed to learn more about consumer preferences for meatcharacteristics (Kinsey et al. 1993). Some key findings were that only four percent ofhouseholds had increased beef consumption over the past year while 37 percent haddecreased beef consumption. Seven percent of the households did not eat meat at all. Concerns about diet and health cut across age and educational groups, and these concernswere correlated with a decrease in beef consumption. There were a number of otherfindings having to do with eggs, poultry, fish, income levels, and fat substitutes. Theyidentified nine market niches such as "low fat," "safety," and "price conscious"households. Over half were willing to pay more for beef that is free of antibiotics andgrowth hormones, but less than one-fourth were concerned about humane treatment ofanimals for meat and only 16 percent worried about their environmental impact. Manydid not know what to think about these issues.
Trend data on where food is purchased might be important to producers who areconsidering direct marketing or other alternatives to the mainstream food distributionsystem. Tables 103 and 104 in (Putnam and Allshouse 1999), not duplicated here,provide data on where food is purchased in the U.S. For example, the percentagepurchased directly from farmers, manufacturers and wholesalers has been flat in the1990s at around two percent. A more in-depth analysis of direct marketing as a ruraldevelopment tool is provided by (Gale 1997). Gale cites growing interest in directmarketing by both consumers and producers, but also cautions that direct selling is stillrelatively small and limited to communities close to urban areas. His analysis is based ondata from the 1992 Census of Agriculture. The 1997 Census of Agriculture has becomeavailable since that article was published, and might provide more recent data on directmarketing income potential (U.S. Census of Agriculture 1998).
Producers who plan to continue to market through mainstream channels may be interestedin the rapid change taking place in the food distribution and retailing sector. The changesappear to be driven partly by consumer demographics and partly by opportunitiespresented by new information systems. Numerous changes have been occurring in thefood wholesaling, food store retailing, and foodservice industries that compose theconsumer food distribution channels (Connor et al. 1997). Increasing levels ofconcentration in wholesaling and at the food store level, and a shift away from merchantwholesalers toward more direct negotiation between food store chains and manufacturersare some of the trends cited. One new initiative that promises to lower costs and improveefficiency is Efficient Consumer Response, which is a cooperative effort betweenprocessors, wholesalers, and retailers to improve distribution efficiency and customer

Section V-1 page 169
service. Connor et al. also speculate about whether the so-called "British Model" ofgrocery retailing might catch on in the U.S. That model entails fewer retail chains - fiveretail chains account for more than 80 percent of the UK market. They would carry fewermanufacturers' brands and more private-label brands, with retail employees playing agreater role in new product development. The UK retailers earn two to four times theprofit rate of their American cousins. The UK model may be starting to influence U.S.retailers, as evidenced by Sainsbury's recent acquisition of two large retail grocery chainsin the northeastern U.S. They appear to be making over these acquisitions in theSainsbury image.
Producers and others can also get a general sense of retailers’ perspectives on what ischanging and why by reading trade magazine articles such as (Tosh 1999). For example,according to Tosh one challenge that full-line meat distributors such as Supervalu face isthe large number of individual items which distribution centers must handle. In its largerdivisions such as the northern region, the number of items can reach 1,700. The varietyof retailers supplied by the wholesaler is part of the problem, such as the Byerly’s storesin Minneapolis handle exclusively prime beef while many other stores do not stock theproduct. Improved packaging is allowing retailers to increase volumes of case-readyproducts. Category management is a management technique that Supervalu and othersare adopting to improve profitability, in marketing areas where sales and demographicdata are available. Another article in the same magazine describes how the distributorand retailer attempt to determine the optimal mix of national brands and private brandsfor the store.
What are the implications of these food distribution changes for producers? Toshprovides a general understanding of the changing marketplace. It does not include thelevel of detail that would be required to quantitatively analyze specific farm-levelproduction and marketing alternatives. Cash register scanner data, for example, might beuseful for some types of analysis but is not generally available to academic researchers. Itis our impression that some farm operators with sufficient resources and entrepreneurialsavvy are establishing relationships with processors and distribution firms which givethem access to such information. The potential for such coordination may be a significantincentive for farmers to increase their operation size or to work together with other farms.
Demand for food in the aggregate is not very responsive to price changes because there islittle opportunity to substitute non-food items in the consumers budget (Putman 1997;Senauer 2001). However demand for individual foods is responsive to prices asconsumers demand more convenience and quality. Rising income increases expendituresfor more expensive food items. Consumer purchases represent a vote in the market placethat provides feedback through the system about their preferences. Changes in themakeup of the population, lifestyles, incomes, attitudes on food safety and health, andconvenience have drastically affected conditions for producers and marketers of foodproducts.

Section V-1 page 170
There have been some major shifts in the eating habits between 1970 and 1996(Agriculture Fact Book 1998):
Coffee -35%Eggs -28%Beverage Milk -22%Red Meat -15%Alcoholic Beverages 17%Fats and Oils 21%Fruits and vegetables 23%Caloric sweeteners 24%Fish 26%Flour/Cereal Products 46%Poultry 90%All Carbonated soft drinks 114%Cheese 143%
U.S. food and beverage expenditures as a share of total personal consumptionexpenditures have fallen from 32.1 percent in 1947 to 16 percent in 1996. The 1996number includes 9.6 percent for consumption at home and 5.4 percent consumed awayfrom home (Connor et al. 1997). They also discuss the implications of changingconsumer preferences on growth potential for different types of food products. Forexample, they use supermarket sales data to document rapid growth in:
• highly convenient foods,
• Asian, Hispanic and Mediterranean foods,
• low-calorie foods,
• packaging that preserves freshness,
• snacks, and
• perceived healthy or natural foods.
USDA researchers studied the potential adjustment in agricultural production as the U.S.diet moves toward the dietary recommendations specified in the Food Guide Pyramid.Their results shown in Table 17 project an increase in animal products of milk, yogurt,and cheese, and of meat, poultry, fish, dry beans, eggs, and nuts. The major reductions areprojected in sugars, fats and oils, and starchy vegetables. (Young and Kantor 1998)

Section V-1 page 171
Table 19. 1995 food supply servings compared with Food Guide Pyramidrecommendations.
Food group
Food Guide Pyramidrecommendation
for a 2,200-caloriediet1
1995 food supplyservings
Change needed tomeet Pyramid
recommendation
Servings Servings PercentGrains 9.0 9.4 --Vegetables 4.0 3.7 8 Dark green leafy and deep yellow vegetables 1.3 0.3 333 Dry beans, peas, and lentils2 0.6 0.2 200 White potatoes and other starchyvegetables
0.8 1.3 -38
Other vegetables 1.3 1.9 -32Fruit 3.0 1.3 131 Citrus, melons, berries 1.5 .6 150 Other fruit 1.5 .7 114Milk, yogurt, and cheese3 2.2 1.8 22
Ounces OuncesMeat, poultry, fish, dry beans, eggs, and nuts4 6.0 5.7 5
Grams GramsAdded fats and oils5 38 59 -36Added sugars6 12 32 -63
Section V-1 page 172
1 USDA, CNPP, 1996; Cronin et al., 1987.2 Dry beans, peas, and lentils can be counted in either the vegetable or meat groups. Countingthese foods toward “vegetable group” servings is consistent with other dietary assessmentstudies.3 Recommendation based on a weighted average of recommended servings for different agegroups of the U.S. population.4 Food supply servings reflect both the lean and fat portion of meat and poultry.5 The Food Guide Pyramid does not make a recommendation for added fats and oils. The upperlimit reported here is based on the assumption that added fats and oils contribute the same 52percent of total fat in the food supply as in 1994, and that total fat is no more than 73 grams of 30percent of total calories for a 2,200-calorie diet.6 The recommendation for added sugars is a suggested upper limit based on caloric intake.
Source: (Young and Kantor 1998)
Farm retail spreads have increased every year for the past 30 years. The average paymentfor farm raw products in 1997 was 23 percent of retail cost. The farm- retail spread variesgreatly by product (Agriculture Fact Book 1998).
b. concentration of buyers
Concentration in the Meatpacking Industry
The USDA Advisory Committee on Agricultural Concentration reported to the Secretaryof Agriculture with policy recommendations in 1996 (Concentration inAgriculture: A Report of the USDA Advisory Committee on AgriculturalConcentration. 2001). Guiding principles they identified were to: promotecompetition; achieve, as close as possible, equal market information for buyersand sellers; and assure that markets exist for all comparable products undercomparable terms, while being mindful of avoiding recommendations thatproscribe market behavior in ways which could ultimately stunt opportunities forgrowth within the industry. A few key recommendations that seem germane tothe GEIS scoping questions are:
• expand the private right to action to parties believing themselves to be damaged byviolations of the Packers & Stockyards Act (P&SA), by providing a right to attorneys'fees,
• amend the PS&A to provide the same enforcement authority in poultry as in red meat,including growers who raise and care for poultry for another entity,
• permit price differentiation only with respect to differences in quality, verifiabledifferences in procurement costs (including differences in cost due to quantity), andtime of delivery,

Section V-1 page 173
• research the reasons for and sources of economic difference in the value of markethogs,
• improve price reporting in a number of specific ways (this report was publishedbefore Congress enacted mandatory price reporting),
• make sure all parties in contracts or other alliances are well informed about their risksand rewards, set up rules to "level the playing field" with penalties for behaviordeemed "a priori" to be exploitative or inappropriate, standardize terminology, andaddress pollution problems that might be a consequence of integration,
• enable cooperatives and contract grower associations to bargain with processorswithout fear of recrimination, and require handlers to engage in good-faith negotiationwith producer cooperatives and networks.
A minority report calls for stronger action, especially with regard to captive supplies andpacker procurement practices.
Changes in concentration in U.S. commercial livestock slaughter between 1909 and 1994are summarized in (Azzam and Anderson 1996), pages 22-30. The percentage ofslaughter done by the top four firms has been rising since the mid-1980s, and was at 82percent for steers and heifers, 73 percent for sheep, and 46 percent for hogs in 1994.
Concentration, conduct, and performance of the meatpacking industry have beenextensively studied (defining performance by measures such as the ability tocharge monopoly prices). One recent study was organized by GIPSA in 1992 andpublished in 1996 (Concentration in the Red Meat Packing Industry 1996). Oneof the seven individual projects conducted as part of the study was a literaturereview of the economic history of the meatpacking industry, theory, and evidence(Azzam and Anderson 1996). (Azzam 1998) is an updated summary of theliterature review. (Heffernan et al. 1999) documents the increasing concentrationof agricultural production and processing in the hands of the top firms and thedevelopment of food chain clusters of firms combined in a variety of businessrelationships.
(Heffernan et al. 1999) and (Azzam 1998) present differing perspectives on the issue ofincreasing concentration. Heffernan et al. predict that four or five global clustersof food firms will emerge. One interesting observation made in the Heffernanpaper is that other concentration studies may tend to focus too much on individualfirms, and so may miss important information by neglecting the relationships (e.g.joint ventures or strategic alliances) among firms within a cluster. They argue forgovernment intervention on the grounds that the current highly concentratedstructure allows a handful of firms to control the food system and capture higher-than-competitive profits at the expense of independent farmers and ruralcommunities, and that the concentrated food system is too vulnerable to

Section V-1 page 174
disruption. They do not attempt to measure differences in performance betweenmore and less concentrated industry structures, but rather argue that the risk ofpoor performance is too great to delay action until empirical data becomesavailable. One well-documented example of where price-fixing practices of agroup of multinational firms resulted in felony convictions was the 1992-95global price-fixing conspiracy, documented in (Connor 1997), (Lieber 2000), and(Levins 2001).
Azzam reviews the studies that have attempted to measure the relationship betweenconcentration and performance in the meatpacking industry. Some studies weredone along the traditional lines of the Structure-Conduct-Performance (SCP)paradigm; others were based on more recent methods from what has becomeknown as the New Empirical Industrial Organization (NEIO). Cross-industrystudies in the 1960s focused on profitability as the measure of performance. Theyfound that industry profitability increased with concentration, and these studieshad an effect on antitrust policy of that era. These studies were criticized,however, over interpretation of profitability-concentration correlations. Analternative interpretation was that firms become large because they are efficientdue to greater managerial skills and innovativeness. Later studies shifted theirfocus from comparing profits across industries, to comparing prices acrossgeographically separated markets within a single industry. Using price as theperformance indicator instead of profit was thought to be a better way to measuremarket power because price would not pick up effects of efficiency differencesthat would affect the profitability measure. Most SCP studies of market power inthe US meatpacking industry were of the price-concentration sort. NEIO modelsfocus more directly than SCP models on what type of industry conduct isconsistent with observed prices and quantities, and can test a variety of oligopolytheories.
Azzam (Azzam 1998) views the above empirical studies as one way of assessingcompetition - taking a snapshot of industry equilibria at a point in time. Thestudies offer little understanding of how the industry reached where it was at thatpoint or whether, in fact, the economic data used in the studies representequilibria. Azzam concludes that the evidence from both SCP and NEIO modelson balance seems to indicate a (statistically) significant but small departure fromcompetitive conduct. The implication is that both consumer and producer welfarecould be increased by steering packer behavior toward closer conformity with theperfectly competitive benchmark. The question is whether one should target thestructure or conduct of the industry.
The question of whether the positive efficiency gains from industry consolidationoutweigh the negative effects of greater market power remains an issue. Azzam cites twostudies of beefpacking which attempted to find out whether the cost reductions achievedthrough economies of plant size or multi-plant operation offset allocative efficiencyresulting from deteriorating packer market conduct, (Azzam and Schroeter 1995) and(Azzam 1997). Azzam and Schroeter found that the anti-competitive effects of a 50

Section V-1 page 175
percent increase in concentration were, at most, on the order of 2.4 percent. This waswell below their estimate of actual cost savings of 4 percent which is likely to begenerated by a 50 percent increase in the size of a representative plant in the industry. They concluded that the structural changes in beef packing in recent years have beenwelfare enhancing on balance. Azzam (1997) used a different approach but also foundthat the cost-efficiency effect outweighed the market-power effect. The role of economiesof size as a factor in pork slaughtering industry consolidation and vertical linkages isevaluated by (Hayenga 1998b). Fixed costs declined $3/head for double- versus single-shift plants, while capacity utilization rates can greatly affect variable cost per head andpricing behavior in the hog market.
Packing plant closures have often raised concerns about industry concentration andmarket access. A recent analysis of cattle slaughtering plant closures found that plant-level factors such as age and capacity were the most important determinants of plant exit(Anderson et al. 1998). Small plants in already-concentrated markets were more likely toexit than those in less-concentrated markets. The reason for the difference may be that inalready-concentrated markets, larger plants may utilize exclusive forward-contractingrelationships with feedlots that reduce open-market supplies to the smaller plants. Theauthors conclude that technical inefficiencies are stronger determinants of exit than aremarket structure factors. They concur with the conclusions of Azzam and Schroeterabove, that any government action aimed at reducing concentration of the beef packingindustry must consider the trade-off between market power and improvement intechnological efficiency.
Azzam argues that from a historical standpoint, the meatpacking industry has performedwell in terms of innovation. It can be viewed as competitive in a dynamic senseof optimizing the allocation of resources between the present and the future. Profits are the returns to the innovative activity necessary to maintain adynamically competitive process, and the appropriate type of competition to beconcerned about is not static price competition, but competition in innovation. Innovations that have grown out of the industry structure range from ice roomsand refrigerated rail cars adopted a century ago to boxed beef technology today.Thus, it would be a mistake to surgically intervene to maintain an industryconfiguration consistent with the static notion of competition. The topmeatpacking firms today such as IBP only recently reached dominant positions,while the top firms at the turn of the century disappeared long ago in what hasbeen termed a "perennial gale of creative destruction." This would suggest that itis unlikely that a few firms will be able to maintain their positions for very longeven without government intervention.
To sum up the Azzam's message, he recommends that policy focus on industry conductrather than structure (Azzam 1998). The aspect of conduct that policy shouldfocus on is the degree to which competing firms may be able to coordinate theirpricing without conspiring in the usual sense of the term - that is, without anyovert or detectable acts of communication. The challenge is to develop creativemeasures, in the form of marketing institutions, to dissipate the rents from implicit

Section V-1 page 176
collusion. Where acts of communication are overt and detectable, as was the casein the beef cartel at the close of the last century, antitrust remedies come into play. Mandatory price reporting as a policy response is discussed further below in the"State-Level Response" section.
Muth and Wohlgenant show that seemingly minor specification differences in aregression model can change the results as to whether beef packing firms areexercising market power in their buying and selling practices (Muth andWohlgenant 1999). When the model coefficients are held constant over time,results showed the presence of market power (marginal revenue or marginal costnot equal to average price). But, when the coefficients were allowed to vary overtime as a function of prices and concentration, the indications of market powerwere no longer statistically significant.
Hahn and others at USDA studied monthly changes in U.S. farm-wholesale price spreadsbetween 1979 and 1996 (Hahn et al. 1999). They did not find evidence thatpackers were exercising market power, although they caution that withconcentration at 80 percent or higher, the potential for exercising market power inthe industry does exist. Paul explored the market and cost structure of the U.S.beef industry using monthly cost and revenue data from a USDA Grain Inspectionand Stockyards Administration survey of the forty-three largest U.S. beef packingplants in 1992-93 (Paul 2001). She found little market power exploitation ineither the cattle input or beef output markets, and that any apparent evidence iscounteracted by cost efficiencies such as utilization and scope economies. MacDonald and Ollinger also recently examined the extent of scale economies inhog slaughter (MacDonald and Ollinger 2000). They found that the industry'slargest plants can deliver pork products to buyers at costs per pound that are 2-3%lower than plants half their size, and assert that this rather modest cost differenceis enough to have important effects on industry structure. They argue that therapid exit of the smaller plants in the 1980s and 1990s is an indication that porkprice competition was strong over the period. Those plants would have remainedin operation if prices had been above their costs.
Dairy Marketing
Restructuring has been characteristic of the dairy industry at all levels in the last 50 years.Technological developments have changed the way things are done on the farm, inassembly, in processing, and in distribution. At every level economies of scale have ledto fewer and larger operations. The kinds of firms have change drastically in response tocost pressure and investment pressures. Cooperatives handled 86 percent of the milk soldto plants and dealers in 1994 compared to 73 percent in 1973. For much of the centuryeight large specialized dairy companies dominated the marketing of fluid milk andmanufactured dairy products and shaped the structure of the industry into the 1970’s.Since then competition with mergers, corporate restructuring and divestitures have takenmany of them out of the business. Foreign owned companies have become more involvedin U.S. dairy markets in recent years. The number of fluid milk plants fell from 10,000 in

Section V-1 page 177
1940 to 478 in 1995. Market power has shifted to retailers and those who service retailoutlets. Cooperatives dominate the butter and ingredients markets and private firms thefrozen products markets. The natural cheese markets is shared, 43 percent cooperativeand 57 percent private proprietary firms in 1992. Manchester suggests that cooperativescould face significant change as public dairy programs are eliminated. And membersexpect them to reduce price volatility, set production quotas, better manage inventories,and expand market sales. (Manchester and Blayney 1997)
Food Marketing
An assessment of the growth, conduct, performance, and structure of food marketinginstitutions - food processors, wholesalers, retailers, and foodservice firms - is providedin (Gallo 1998). He found that:
"New food product introductions fell sharply in 1996. The number of newplants, consumer advertising expenditures, and common stock pricesreached new highs in 1996, as did the number of mergers in thefoodservice industry. Profitability from food manufacturing and retailingwas higher due to strong sales, wage and producer price stability, andstreamlining of operations."
Food industry mergers and acquisitions have continued at a rapid pace, setting a record in1998 (Smith 1999).
A review of the relationship between food retailing concentration and consumer prices,power and profits yielded mixed results, especially with regard to price (Kinsey 1998). That review of the consumer impact of food retailing concentration notes that U.S. foodexpenditures are falling relative to household income, which calls into question theimportance of concentration as a societal concern. One cited study found that greaterconcentration at the wholesale level was associated with lower retail food prices,probably due to economies of scale being passed on to consumers. Overall conclusionswere that increased retail level concentration has been associated with both increases inprices in some food categories and decreases in others. Profits uniformly increased withconcentration, but the reason was unclear. Part of the increase was attributed to loweringcosts through the use of information technology and vertical coordination.
"Casual observation implies that retail food firms engage in fiercecompetition and where prices are high, it is usually due to adding valueand services for which consumers are willing to pay." (p. 24)
A review of the literature of wholesale meat market concentration summarizes severalstudies which generally raise concerns about packers’ and retailers’ exercise of marketpower to the detriment of producers (Strange and Higby 1995). They describemotivations for the move toward formula pricing of slaughter animals and the problemspresented by the reduction in the share of the market that is traded by negotiation. Ananalysis of randomly selected meat market reports shows how the selling of lower quality
Section V-1 page 178
carcasses and cheaper cuts through channels that are reported, while higher quality onesare fabricated for their own retail customers or into specialty cuts that do not fit intoreported standard commodity categories, may bias wholesale price reports downward. They provide a brief summary of the 1977 Illinois Brick Co. ruling by the U.S. SupremeCourt, which held that only direct purchasers or sellers may sue a firm for damages due tothe use of market power. This ruling presents an obstacle to farmers who might be in theposition of being damaged by depressed wholesale prices that are passed on by packers orother intermediaries.
Another interesting aspect of food industry policy is that of "vertical restraints," a termthat refers to complex contractual arrangements between manufacturers and retailers suchas franchise fees, exclusive territories, and forcing the retailer to carry the full line of themanufacturer's products. Theory is ambiguous about the social effects of such restraints.U.S. and U.K. policy toward such restraints in the food system is compared in(McCorriston and Sheldon 1997).
Federal Agencies with Jurisdiction over Antitrust Issues
Two federal government agencies responsible for policy regarding concentration ofbuyers of agricultural products are the Antitrust Division of the U.S. Departmentof Justice, and the U.S. Department of Agriculture's Grain Inspection, Packers andStockyards Administration (GIPSA). An overview of the Antitrust Division's roleis available on the Internet at (U.S. Department of Justice Antitrust DivisionOverview 99). Text of Congressional testimony about what the antitrust lawsprohibit and what Antitrust's recent activities related to the meat packing industryhave been, is available at (Turetsky 1996). The responsibilities of the GrainInspection, Packers and Stockyards Administration are described at (USDA GrainInspection, Packers and Stockyards Administration 99).
State-Level Response
The meatpacking industry is comprised of multinational firms over which the Minnesotastate government and local governments have very little influence. One way inwhich Minnesota has attempted to influence over the meatpacking industry hasbeen to require mandatory price reporting on animals purchased from Minnesotaproducers (Minnesota Department of Agriculture, Minnesota Daily LivestockMarket Price Report 2001). This state-level system, which has been operatingsince September 1999, was superseded by the national system implemented by theUSDA Agricultural Marketing Service on April 2, 2001. The USDA system isdiscussed in more detail below.
Other state and local policy options available to influence livestock processors wouldinclude whether to offer financial incentives to attract new slaughter plants, andenvironmental regulations on slaughter plants. The entire scope of state and localpolicies affecting livestock production in the state is also likely to indirectlyinfluence livestock processors, because shrinking production seems certain to

Section V-1 page 179
ultimately result in slaughter plant closures while new plants will locate in areasthat either currently have more production than can be slaughtered in nearbyplants, or appear receptive to expansion.
c. contractual buying and selling arrangements, and
f. price discovery and market fairness
Livestock Markets
"Price discovery" is the process by which buyers and sellers arrive at a price for aparticular transaction (Schroeder and Ward 2000). One implication of marketingcontracts for non-contracted producers is that the spot market becomes thinner and pricediscovery becomes less reliable, as discussed below. The term "captive supplies" is usedto refer to the share of supply that does not go through the spot market, either because it istransferred through contractual arrangements or through vertical ownership integration ofpackers into the production stage or vice versa.
Concern about packer feeding is not new, as the first study was conducted in 1966 (Aspelin and Engelman 1966). In 1992, the USDA Packers and StockyardsAdministration commissioned a major study to provide a more definitive answer to thecaptive supplies question (Ward et al. 1996). They found a:
".. relatively weak negative relationship between transaction prices for cashmarket cattle and either delivering cattle from an inventory of captive supplies orhaving an inventory of captive supplies from which to deliver at a later time. Results were not robust. Several versions of the models were estimated andestimations over sub-periods within the 1-year study period yielded inconsistentresults. ... Price differences were found among procurement methods, but withthe possible exception of price differences between forward contracts and cashmarket prices, observing such price differences in everyday transaction priceswould be difficult." (pp. 81-82)
Azzam and Anderson report that packer feeding in the late 1950s and early 1960s variedfrom 4.6 to 7.4 percent of total marketings of fed cattle, with 151-215 packers involved infeeding cattle (Azzam and Anderson 1996). They found that packer-feeder volume had asignificant negative impact on terminal market cattle prices in the study area, which wasone of the top ten terminal markets. summarize three studies of packer integration orcaptive supplies on fed beef cattle prices. Their regression analysis found that a 100-headincrease in packer-fed shipments to the plant, on average, lowered the local average pricefor Choice steers relative to other markets for the entire week by about $0.06 perhundredweight. A 1991 study found similar results (Schroeder et al. 1993). This studyalso found that price variability was not related to captive supplies. Another 1991 studyfound that captive supplies affected prices in Kansas but not in Colorado, Nebraska orTexas (Hayenga and O'Brien 1992). In a different approach, Schroeder and Ward reporton market simulations which showed that cash market transaction prices tended to be

Section V-1 page 180
more variable when sizeable proportions of the fed cattle market were under marketingcontracts (Schroeder and Ward 2000). Schroeder and Ward also describe the economicincentives for and drawbacks of formula pricing, which can lead to pricing of largevolumes of production being based on a cash price in a single geographic market for aspecific within-day trading period on a specific day, which can be susceptible to pricemanipulation.
The USDA Grain Inspection, Packers and Stockyards Administration analyzed the hogprocurement transactions during January 1996 by 4 firms and 12 plants in Iowa, southernMinnesota, eastern Nebraska, and the southeastern corner of South Dakota (WesternCornbelt Hog Procurement Investigation (GIPSA Backgrounder) 1998). The impact ofprocurement method on pricing was one of the issues studied. Results generally showedhigher prices for marketing agreements and carcass merit pricing grade and yield versusspot live purchases. The spot market transactions tended to exhibit lower hog qualitycharacteristics than the transactions under marketing agreements and forward contracts. Small sellers tended to sell on a spot market basis and received lower prices. The reportof the study seems to leave unanswered the question of whether the price differential dueto seller size was reasonable due to quality and transaction costs, or whether the smallersellers were unfairly discriminated against.
An analysis of packer kill sheets provided by 300 Iowa pork producers showed that priceincreased with size of operation, at a declining rate (Lawrence 1996). A producermarketing 9,000 to 10,000 head per year would receive about $0.85/hundredweight morethan a producer marketing only 100 head per year. Prices to producers marketing over5,000 head per year leveled off, and the analysis showed that the price advantage peaksout at about 9,000 to 10,000 head. Backfat thickness, yield, and sort loss were includedin order to adjust for quality differences.
A comparison of year-to-year hog production and price changes over the past threedecades shows that prices have become more volatile (Tank 1999). In the 1970s and1980s, a one percent change in production resulted in a price change of around one and ahalf or two percent. During the late 1990s, the price response has been at least twice thatgreat. It is unclear how much of the increased volatility is due to the increased prevalenceof marketing contracts, and how much is due to other factors.
In response to the concerns described above, the Secretary of Agriculture announced anew rule on November 28,2000 that requires large cattle, swine and lamb packers andimporters to provide information about livestock marketing, including pricing, for publicdissemination. The new reporting will provide information on 80-95 percent of all cattle,boxed beef, slaughter hog, sheep, lamb meat, and imported lamb meat transactionsincluding purchases for future delivery, and packer-owned livestock, subject to certainconfidentiality guidelines. The mandatory price reporting system was to go into effect onJanuary 30, 2001, but has been delayed until April 2, 2001 to allow more time to test theelectronic information collection system (USDA Agricultural Marketing Service,Mandatory Price Reporting 2001).

Section V-1 page 181
Ward and Stevens analyze structural change in the beef market by comparing pricetransmission patterns over time from live steer prices to boxed, wholesale, and retailprices. They measure pricing attributes such as the percentage of a price change at onestage that is transmitted to the next stage within a month or two. Looking at the period1974-98, they find a decline in wholesale-to-retail price response, indicating that therelationship between retail chains and their purveyors has changed over that period. Onthe other hand, despite the consolidation that has occurred at the packer level, there hasbeen little change in the price linkage between producers (slaughter steer prices) and thefirst handler (boxed beef prices) (Ward and Stevens 2000).
Retail pork prices did not decline very much in late 1998 and 1999 when farm-level hogprices plummeted, and the lack of response was widely criticized. "Price transmissionasymmetry" is the term used to describe a situation where retail-price response to farm-price declines is less than response to increases. Azzam uses a theoretical model todemonstrate how such asymmetry can arise when spatially competitive retailers competewith each other over time, with the asymmetry depending on the shapes of their demandfunctions (Azzam 1999). He shows that vigorous competition among retailers may notnecessarily result in the larger retail-price declines farmers expect during periods ofdeclining farm prices. Repricing costs explain why retail prices tend to be rigid in theface of both upward and downward movements in the farm price.
A related analysis of broiler price asymmetry is (Bernard and Willet 1996). They foundthat concentration and power of integrators have allowed the wholesale price to becomethe center, causal price in the market. Asymmetric price transmissions are limited,however. Downward movements in the wholesale price are passed on more fully togrowers than are price increases. On the consumer side, only consumers in the NorthCentral region of the U.S. share a larger portion of wholesalers' price increases than pricedecreases.
Dairy Policy
Dairy policy in the United States includes both Federal and State programs. The twomajor federal dairy programs currently in place are the system of federal milk marketingorders and the milk price support program. A multi-State dairy policy organization, theNortheast Interstate Dairy Compact, operates under authority granted in the 1996 FarmAct. General government programs designed to assist international trade andprovide domestic and international food aid also affect the dairy industry (USDAEconomic Research Service Briefing Room: dairy: policy 2000).
Prior to 1981, the price of milk was supported at such levels to insure an adequate supplyof milk, reflect changes in the cost of production, and assure a level of farm income tomaintain productive capacity to meet future needs. Since October 1981 the support pricehas been established by Congress either at specific levels or by formula related toexpected surplus levels rather than parity levels. To implement the price support program,the Commodity Credit Corporation offers to buy carlots of butter, cheese and nonfat drymilk at announced prices thus provides a floor for milk and dairy product prices.

Section V-1 page 182
(Commodity Fact Sheet, 1996-97 Dairy price Support Program 1997) The purchaseprogram was to have ended on December 31, 1999 but was twice extended for one year(to the end of 2000 and then 2001) at $9.90 per hundredweight of milk containing 3.67percent butterfat (USDA Economic Research Service Briefing Room: dairy: policy2000).
The 33 previously existing milk marketing orders were consolidated into 11 as of January1, 2000, and new methods were put into place for determining class prices at that time.These reforms help insure American dairy farmers receive a fair price and that consumersenjoy an abundant affordable supply of milk. The federal order price system set minimumprices for milk used for alternative purposes. The new rules change the determinants ofthe Basic Formula Price, adopt a classified pricing structure for four classes of milk, andmake some changes in the classification structure. Changes were made in the Class Iprice differentials with lower differentials in Southwest, West, Northwest, North East,and Appalachian areas. Class I differentials would rise in the Upper Midwest andFlorida. Bailey points out that a direct change in class prices may not represent a directchange in farm gate prices. The Class III price (cheese and other hard products) in thisrule will be lower than the current BFP (Basic Formula Price), and in the Upper Midwestprocessing plants have regularly bid pay prices above the minimum government prices. Further amendments were implemented on January 1, 2001, but were then halted by aninjunction on February 2, 2001 (Bailey 2001).
USDA began tracking the mail box price milk producers receive within Federal MilkMarket Order areas. Mailbox prices account for all payment for milk, amount and qualitypremiums, performance bonuses, fat and or protein premiums, as well as deductions forpromotion, hauling, capital retains, and coop dues. The average mailbox prices receivedby producers were significantly higher in these orders: Upper Midwest $1.72, ChicagoRegional $1.53, Iowa $.99, Florida $.68, Nebraska-Western Iowa $.57, and SouthwestIdaho-Eastern Oregon $.55. The higher price over minimum blend prices in these areas in1998 were a result of competition for milk by cooperatives and other buyers.(HoardsDairyman Staff 1999)
The 104th U.S. Congress in 1996 gave conditional consent to the Northeast InterstateDairy Compact (Section 147 of the Agricultural Market Transition Act, title 1 of PublicLaw 104-127; 7 U.S.C. 7256). This act provided consent for the states of Connecticut,Maine, Massachusetts, New Hampshire, Rhode Island, and Vermont to regulate milkprices for their farmers. Milk pricing is the only agricultural commodity for whichcongress has given consent to the use of interstate compacts. The compact works withthe federal order pricing system as a basis for its pricing mechanism. The higher farmlevel prices are passed to the consumers in the price they pay for fluid milk. A CompactCommission fixes a price that exceeds the federal order price for fluid milk, compact overorder premium. The estimated impacts for a state belonging to the compact are asfollows: increased farm marketings in response to a higher price, reduced consumerpurchase of fluid milk due to a higher price, and an increase in portion of milk used forclass 3 which impacts the price of class 3 milk. The estimated impacts on a non-compactstate are: reduced milk marketing due to a price decline, a reduction in the federal order
Section V-1 page 183
blend price, small increase in fluid milk consumption with a small decline in price, and atotal market reduction in the revenues paid to farmers and collected from retail sales(Bailey 2000). Dairy compacts and Federal Milk Market Order Reform are two currentmilk marketing issues under contentious regional debate. Upper Midwest representativesin Congress submitted H.R. 744 submitted a bill to rescind the Northeast Dairy Compact(Sensenbrenner et al. 1999).
d. access to markets, and
g. access to inputs, such as credit and genetics
Small, independent producers' access to markets for both farm products and inputs is aconcern that is often expressed in the farm press and elsewhere. Market access ismentioned in some academic publications by way of justification for research on morespecific issues such as what affects hog prices (Lawrence 1996) or simulating the welfareeffects of vertical integration (Pritchett and Liu ). A number of studies have been done onthe impacts of international trade agreements on access to foreign markets for variousindustries. One such study dealing with agriculture is (The Future of the U.S. DairyIndustry: A Domestic and International Perspective 1997). None of these studies seembe very closely related to the issues being addressed in the GEIS, so the others will not becited here. There appears to be little academic research specifically on market access as itrelates to the livestock industry.
Exports have been a relatively minor market for U.S. dairy products. U.S. milk priceshave historically been well above the World market price. thus the price of the majorexport products, butter and dried skim milk, have not been competitive. (HistoricalPerspective on World Dairy Prices 1979-1998,http://www.fas.usda.gov/dlp/circular/1998/98-12Dairy/prd&tr-html). Europe is the largestdairy exporter with 45- 50 percent of the markets. The strong European presence in dairyexports is more related to the government subsidization of dairy products in the Worldmarket rather than low cost of production. The U.S. has only 10 percent, New Zealand 22percent and Australia 9 percent. Dobson states that the U.S., New Zealand and Australiawill move to displace Europe in the world trade of dairy products in the next 10 years asEuropean subsidies decline. The European Union agreed to reduce export subsidies forcheese, butter and nonfat milk in the Uruguay GATT agreements. They will reducesubsidized cheese exports by up to 25 percent by the year 2000. These changes areexpected to bring export competition at more fair prices reflecting world supply anddemand. Dobson points put that U.S has fewer constraints for expansion but will facesubstantial competition particularly in Asia. He points out that the New Zealand DairyBoard is a monopoly that provides product differentiation, vertical integration and earlymovement into new markets. (Dobson 1996)
An emerging concern is being raised relative to the privatization of information and thepotential social, economic, and environmental impacts that may result. Various authorssuggest this to be an important issue that deserves attention by analysts, advocates, policymakers, and those with a direct economic stake in agriculture. These concerns were the

Section V-1 page 184
focus of a 1995 workshop, Privatization of Information and Technology Transfer in U.S.Agriculture. This workshop was organized to stimulate research and debate on therestructuring of agricultural information systems and the implications of the changestaking place. Three principal themes came from this workshop; 1) Institutional relationsgoverning development, control and application of information in agriculture arechanging at an accelerated pace, 2) Current and future processes through whichknowledge is created and information applied in agricultural production systems will bedeveloped through synthesis of political, economic, institutional, and technologicalconsiderations, and diminished public sector involvement and 3) Increased private sectorresponsibility for information development and dissemination in agriculture is significant.An excellent discussion of these issue can be found in the workshop proceedings (Wolf1998).
e. terms of trade
The terms of trade between agriculture and the rest of the economy has been a long-standing issue, often referred to under the heading of "parity." The parity price formulawas written into the Agricultural Adjustment Act of 1933 (Brandow 1977). Price parityratios are calculated by the USDA National Agricultural Statistics Service and publishedin the monthly Agricultural Prices publication under the authority of the AgriculturalAdjustment Act of 1938, as amended (Agricultural Prices various issues), page A-25. The overall parity ratio for U.S. farmers for January 1999 stood at 41 (1910-41 = 100). Aparity ratio less than 100 means that the average per unit purchasing power of all farmproducts is less than half that during the 1910-41 period (page B-2). A major difficulty ininterpreting the parity ratio is how to account for improvements in productivity. Theannual average increase in productivity from 1948 to 1994 was 1.94. The January 1999parity ratio, adjusted based on productivity trend for the prior 15 years, stands at 1041. This suggests that farm inputs are 25 times as productive as in 1910-14, indicating thatthe ratio of prices received to prices paid is around ten times as high now as in 1910-14after considering the increase in productivity. The procedure used by USDA to measureagricultural productivity trends is explained in (Ahearn et al. 1998).
A description of the agricultural economics profession's response to the parity issuethrough 1971 is provided in (Brandow 1977). Full parity prices were foreseen in a 1947report as leading to unmarketable surpluses that would in turn require production controlsand subsidies, to which many economists were opposed. The controversy over freemarkets versus government programs spilled over into discussions of quantifying anequity norm for agriculture. During the 1950s and 1960s farm policy literature containedthe idea that a suitable policy goal was rates of return on labor and investment on efficientfarms that were equal to rates earned on comparable resources outside of agriculture.
Measurement of rates of returns on land and other investments and their use for policypurposes can cause circularity problems, however. In the 1980s, USDA was required tocalculate costs-of-production indicators that the Secretary of Agriculture could use to setsupport prices for major crops. (Harrington 1983) explains the difficulties encountered

Section V-1 page 185
with the procedures used at that time.
"In general, the return to an input should equal the return it would earn inits next best use - its opportunity cost. However, what is the next best useof a specialized input, such as agricultural land? Economic theory alsosays that costs of specialized inputs cannot be determined independently ofthe demand for the product. The opportunity cost concept is difficult toapply to all specialized inputs, including those specialized to agriculture.... If the difficulties inherent in the imputation lead to cost estimates thatare too high or too low and if these estimates influence target prices,artificially induced price spirals may result." (p. 1)
Bearing in mind the circularity issue, a rough comparison of rates of return can be madeby comparing the rates of return on equity (market value) experienced by farms in theSouthwestern Minnesota Farm Business Management Association (SW FBMA) (Olson etal. 1999) and reports for earlier years, with the ratio of profits after income taxes (annualrate) to stockholders' equity experienced by all U.S. manufacturing corporations over thepast ten years (Council of Economic Advisers 2000), (Table 18). The farms' rate of returnon equity at market value was averaged five percentage points less than that ofmanufacturing firms for the six years for which comparable data was available. Asanother comparison, (Gallo 1998) provides after-tax profits as a percentage ofstockholders' equity for food processors and retailers for the period 1986-96. Processors'returns ranged from 13.5% in 1993 to 20.9% in 1988, and were generally flat over theperiod. Retailers' returns generally rose over the period, ranging from 5.3% in 1989 to18.5% in 1994. It should be noted that the farm rates of return are on an accrual-adjustedbasis considering beginning and end-of-year market value balance sheet net worthchanges, so to that extent include both operating income and unrealized capital gains onland and other assets. Part of the increase in the SW FBMA rate of return for 2000 wasdue to a change in the depreciation method used in the calculation from a tax-basedmethod to a management-based method.
One caveat that applies to this comparison and later discussions is that the SW FBMAfarms are not representative of all farms in their area, although their data is often usedbecause it is the best data available. They tend to be larger, a higher proportion of theirland is rented, and they tend to be more efficient than the population of all farms(Andersson and Olson 1996).

Section V-1 page 186
Table 20. Rates of Return on Equity on Southwestern Minnesota Farm BusinessAssociation Farms Compared to All Manufacturing Corporations, Food Processors,and Food Retailers, 1991-2000.
All Manufacturing Food FoodSW FBMA Corporations Processors Retailers
1991 3% 6.2% 17.6% 14.5%1992 6 2.1 15.7 9.01993 3.5 8.0 13.5 11.31994 4.4 15.8 17.7 18.51995 9.1 16.0 18.5 17.21996 9.5 16.7 19.4 17.4
1991-1996 average 5.9 10.8 17.1 14.6
1997 9.7 16.7 a a1998 1.6 15.8 a a1999 6.3 17.1b a a2000 11.3c a a a
aFood processor and retailer data was not available for 1997 through 1999. Manufacturing corporation data was not available for 2000.bAverage for first three quarters of 1999.cPart of the increase in the SW FBMA rate of return for 2000 was due to a change in thedepreciation method used in the calculation from a tax-based method to a management-based method.
Table 19 shows rates of return on equity experienced by the association farms broken outby farm type for the period 1991-2000. The farm type rates are only published for costbasis balance sheet data, rather than on a market value basis as in Table 17, so thenumbers are not directly comparable between the two tables. The 1996-2000 average rateof return across all farms is seven percent when calculated on a cost basis compared toeight percent when calculated on a market value basis, which would indicate that aboutone percentage point of the Table 17 rates is due to capital gains from asset appreciation. Also, cost-basis asset values on the balance sheets are likely to be less than market valueswhen some degree of inflation is present, which would tend to make the cost-basis ratesof return higher than market-based rates for the same income levels. Part of the increasein the rates of return for 2000 was due to a change in the depreciation method used in thecalculation from a tax-based method to a management-based method.
The "All SW FMBA Farms," "Hog", "Crop," "Crop-Hog," and "Crop-Beef" columns arefor the southwestern association. The "SE FBMA Dairy" column is from the southeasternassociation, which has more dairy farm members than does the southwestern association.

Section V-1 page 187
The farm types are based on having 70 percent or more of gross sales from that category. The number of farms included varies from year to year. In 1999, there were 216 totalfarms in the All "SW FBMA Farms" average, including 12 hog farms, 62 crop farms, 34crop-hog farms, 18 crop-beef farms, and 75 other farms. There were 16 dairy farms in theSE FBMA average. It is apparent that the hog, crop and beef farms experienced relativelygood years in 1995 and 1996, while 1997 through 1999 have been much less profitable.The financial performance of the dairy farms was more favorable in 1998 and 1999.
It is interesting to note that swine and dairy farms going out of business more rapidly thanother farm types, while Table 18 shows that these two farm types earned higher rates ofreturn on equity than did the other types. Consolidation is taking place in all farm types. Table 1 on page V-1-13 shows that the total number of farms in Minnesota declined from86,000 in 1993 to 81,000 in 1999. Farms with milk cows and hogs are declining morerapidly than other types, however, despite the higher average returns. We don't know forsure why that is. Speculation is hazardous, but we can speculate about several reasons.The low returns that the hog farms experienced in 1998 were certainly one factor. Wealso know that many farm operators and household members hold off-farm jobs. Thefarms also serve as rural residences and provide value to the households that justifyowning the farms even if rates of return are less than alternative investment opportunitieswould provide. The other farm types shown in Table 18 are beef and crop farms, whichare more likely to be part-time operations because farm labor demands are less intense. Thus, operators of many of these crop and beef operations may put up with the lowerreturns because they have off-farm income and the farms have value as residences. Also,it was pointed out that the non-farm labor market has been tight in recent years. A farmoperator considering whether or not to continue may tend to compare their returns not toother farm types but rather to what they can earn in an off-farm job. Perhaps dairy andhog farm operators have been more likely to obtain off-farm jobs because they are locatedcloser to urban areas or because of skill differences. Finally, keep in mind that these ratesof returns are from the farms that have remained in business. Rates of return of the farmsthat exited may have been lower than for the ones that have remained.

Section V-1 page 188
Table 21. Rates of Return on Equity (Cost Basis) on Southwestern andSoutheastern Minnesota Farm Business Management Association Farms by FarmType, 1989-99
All SW FBMA Crop- Crop- SE FBMAFarms Hog Crop Hog Beef Dairy
1991 3% 4% 2% 5% 4% 8%1992 6 7 3 8 3 71993 2 11 1 1 -1 31994 3 -3 7 5 1 71995 13 22 14 18 8 51996 12 22 11 16 11 61997 5 11 3 3 8 31998 -6 -36 0 -17 -11 141999 7 2 1 4 8 122000c 19 45 15 20 15 16
1991-2000 average 6% 9% 6% 6% 5% 8%
1996-2000 average 7% 9% 6% 5% 6% 10%
Source: Annual reports of the Minnesota Farm Business Management Associations, suchas (Olson et al. 1999).cPart of the increase in the rates of return for 2000 was due to a change in thedepreciation method used in the calculation from a tax-based method to a management-based method.
While the above comparison shows rates of return for Minnesota farms that appear lowcompared to U.S. manufacturing corporations and food processors and retailers, a recentUSDA Economic Research Service study showed that median returns of farm businesseswere comparable to non-farm businesses (Hopkins and Morehart 2000). This papercompares U.S. farm rates of return on assets against those of 245 households with non-farm businesses in 1997. The farm data is from USDA's Agricultural ResourceManagement Surveys. USDA has changed their analysis procedures in recent years sothat they can do a better job of showing how diverse farms are and how much variabilitythere is in costs and rates of returns from one farm to another. Median farm returns onassets were the same as for the non-farm businesses when capital gains on farmland wereconsidered, and that large farms ($250,000 plus in sales) earned greater rates of returnthan for the non-farm businesses. They also found that the effect of direct governmentpayments was slight. Volatility of returns was greater for non-farm businesses than forthe farms.

Section V-1 page 189
h. lending practices
It is assumed that the main interest here is how lending practices might differ to differenttypes and sizes of livestock operations, how any such differences might affect industrystructure, whether any such differences are fair and economically justified, and howgovernment policy might be changed to better address societal goals such as economicefficiency and equity.
Agricultural finance has been a major part of the discipline of agricultural economicssince its inception, and there is a considerable body of agricultural literature. One sourceof refereed literature on agricultural finance is (Ladue ), but other articles are found in theAmerican Journal of Agricultural Economics and other journals. Various articles addressdifferent aspects of the lending decision such as the relative degree of risk involved indifferent types of farms, and ways of assessing risk such as credit scoring models (Novakand LaDue 1997).
One source of basic descriptive information is a recent report from the US Small BusinessAdministration that rated the “small farm friendliness” of all commercial banks and bankholding companies. They defined small farm loans as loans under $250,000, andassigned a decile (10 percent) ranking based on 1) the ratio of small farm loans to totalbank assets, 2) ratio of small farm loans to total farm loans, 3) total dollar amount ofsmall farm lending, and 4) total number of small farm loans. The ranking was based ondata from the banks’ June 1998 “call reports” to banking regulators. The study found thatthe smallest banks had the largest share of small farm loan dollars, and raised concernsthat recent bank consolidations are reducing the number of small banks so that there arefewer small banks remaining to lend to small farms. They found that the stock of smallfarm loans had increased in the past year while the number of such loans declining, sothat either the average loan size is increasing or many small loans have been repaid.
Passage of the Riegle-Neal Interstate Banking and Branching Act of 1994 and itsimplementation in 1997 is expected to increase the rate of bank mergers and acquisitionsover the next few years (Ahrendsen et al. 1999). Ahrendsen et al. evaluate whether suchmergers are likely to decrease agricultural lending, since larger banks tend to have loweragricultural loan-to-asset ratios than do smaller banks. They found mixed results forindependent banks that acquired other banks between 1988 and 1997. The consolidatedbanks tended to adjust their agricultural loan-to-asset ratios to be like that of the acquiringbank. That is, if the acquiring bank's ratio was low, the consolidated bank tend to reduceits ratio as well to near the acquiring bank's ratio. If the acquiring bank had its assetsconcentrated in agriculture, on the other hand, the acquisition tended to have a positiveimpact on the agricultural lending of the acquired bank. Most acquiring banks hadsmaller agricultural loan ratios than the acquired ones, however, so the results suggestthat the agricultural lending of commercial banks will decrease in most instances. Theauthors do not see this result as necessarily implying a gap in agricultural lending,however, because other lenders may step in and fill the gap.
One paper in 1993 indicates that the larger scale of the newer swine operations has

Section V-1 page 190
attracted the interest of investors and lenders from around the world, such as Rabobank inHolland (Braaksma 1993).
A source of information on agricultural credit conditions and analysis of currenteconomic issues is the set of Economic Review publications published by the regionalFederal Reserve Banks, which is available in hard copy and on the Internet. The KansasCity bank in particular publishes a great deal of information on agricultural issues(Federal Reserve Bank of Kansas City. ).
USDA has a series of short, non-technical reports on their web site which discuss federalgovernment involvement in farm lending and ways in which federal action could improveefficiency (Maxwell 1998). They quote Department of Justice findings that 93 percent ofrural banking markets are considered non-competitive in that banking business isconcentrated among few banks. Suggested federal actions include:
• harmonizing charters and regulations for government-sponsored enterprises such asthe Farm Credit System and the Federal Agricultural Mortgage Corporation to reducemarket segmentation,
• regulatory reform for all lenders,
• encouraging entry into concentrated markets through nontraditional mechanismsincluding electronic funds transfers and telecommunications, and
• continued antitrust vigilance.
Federal estate tax changes are suggested to make it easier to transfer family farmbusinesses across generations, although they find that only about one-third of heirs ineach generation choose to operate inherited family farms.
Another report in the USDA series addresses beginning farmers' credit needs. Theysuggest that traditional credit programs have limited potential to assist young low-equityfarmers, because they are ill-equipped to deal with the increased risk that accompanieshigh leverage. They suggest tax initiatives such as lowering capital gains taxes on landsold to beginning farmers, tax-exempt or tax-deferred "aggie" savings accounts. Theysuggest that state statutes be changed to facilitate beginning farmers' access to equitycapital as a substitute for debt. Limited partnerships, subchapter S corporations, andlimited liability corporations are suggested as ownership forms that would make it easierfor investors to purchase an ownership interest in the farm and limit their liability to theamount of the investment. This is the flip side of the often-heard argument that the non-farm investors would unfairly compete with family farmers.
A more in-depth discussion of structural change in agriculture, how it is affecting lenders,and policy implications is presented in (Duncan and Stam 1998). They trace some of thehistory of the traditional farm lending industry, past policy responses. They expect that

Section V-1 page 191
the emergence of non-traditional credit sources and foreign lenders will compete withtraditional ones. One area of concern is the possible impact that failure of large-scaleintegrated agricultural firms would have on the rest of the nation's food and fiber sector. There is currently no consensus on what if anything should be done to protect againstsuch an eventuality.
The Minnesota and federal governments have instituted a number of programs thatprovide financing and technical and business planning assistance to Minnesota livestockproducers beyond what is available from commercial lenders. Possible sources for newfarm product processing and marketing ventures include (Sparby March 9, 2001):
• Minnesota Department of Agriculture's Rural Finance Authority and CooperativeGrant Program
• Agricultural Utilization Research Institute
• Minnesota Technology Institute
• Economic Development Centers
• Midwest Community Development Corporation
• Minnesota Business Finance Corporation
• Small Business Development Centers
• USDA Rural Business-Cooperative Service
• U.S. Small Business Administration
Both Friedman and the Purdue report discussed above emphasize that business managersmust be able to adjust rapidly to marketplace changes. Access to credit and technical andbusiness planning assistance facilitate such adjustments, so we second a recommendationmade by Hayes, et al. for further research on the adequacy of these programs (Hayes et al.1999), p. C-71. Implications for alternative forms of livestock production are thatincreased state funding for such programs would likely lead to more productdifferentiation and direct marketing; more jointly-owned value-added processingventures; more rapid adoption of new production technologies; higher returns to labor andmanagement; and substitution of capital for labor resulting in fewer total jobs inproduction agriculture which might be offset by additional jobs in processing anddistribution.
Financial risk is said to lead to pressure on producers from commercial lenders to reduceoperating risk by means such as production and marketing contracts. Thus, it seemspossible (but unlikely) that increased credit availability would slow the trend toward

Section V-1 page 192
increased vertical coordination and consolidation. A different perspective is that at leastin the case of a typical hog finishing contract, contract production can provide producerswith a higher rate of return on equity and less risk then independent production if thecontract makes additional financing available (Boehlje and Ray 1999). If so, theneconomic opportunity may be driving the increased use of contracts rather than lack offinancing alternatives. Another conclusion of this study, however, is that lenders may beunder-estimating the financial risk of some contracts. (See tables 25 - 29 below for recentfinancial performance of independent and contractee hog enterprises in Minnesota.)
QUESTION D5. WHAT IS THE CURRENT SITUATION AND WHAT ARETHE CHANGES TAKING PLACE IN THE OWNERSHIP AND CONTROL OFLIVESTOCK IN MINNESOTA:
D5a. who owns the livestock and livestock facilities and what is the significance?,
D5b. what are the current trends in type of ownership by animal species, facilitysize and regional location?
also D3e. How are livestock businesses different from and similar to non-agricultural businesses with respect to the following factors, and what are the
implications of these differences: patterns of ownership and control
It is not clear what classification of owners is of interest to these questions. A measurewas debated and almost passed in the Minnesota House of Representatives this session toallow different feedlot regulations for farms where the owners resided, compared to farmswhere the owners did not reside (Journal of the Minnesota House of Representatives 99). That debate suggests that classifying owners by local community of residence might beof interest. On the other hand, the Minnesota Corporate Farming Law differentiatesbetween Minnesota farmers and others, suggesting that a classification based on state ofresidence and principal occupation might be of interest. Unfortunately, our investigationsto date have not turned up any publications that classify either livestock businesses ornon-agricultural businesses according to local community or state of residence, orprincipal occupation of the owners, except for (Freese 1998) and (Freese 2000). Thatreport, published annually, describes the 50 largest U.S. pork producers and lists thestates in which they operate. According to their 2000 data, four of the 50 largestproducers are headquartered in Minnesota: Cargill (6), Christensen Farms (8), LandO'Lakes (11), Pipestone System (15), New Fashion Pork (25), Wakefield Pork (26),Holden Farms (30), and Schwartz Farms (42). In addition, Bell Farms/Hormel Foods(17), Consolidated Nutrition (19), and Pork Technologies (32) operate partially inMinnesota. The report does not go into detail on the ownership and control of theseoperations. Pipestone is reportedly organized as a number of separate corporations whosemanagement is coordinated by a veterinary clinic. Each corporation operates a sow unitjointly owned by producer-shareholders who receive early-weaned pigs and finish them intheir individual operations. The other large operations in Minnesota are believed to beheld under a variety of different ownership arrangements, but detailed information wasnot available on them.

Section V-1 page 193
Two classifications that are available are: 1) type of legal organization (proprietorships,partnerships, and corporations), and 2) ownership by foreign persons versus U.S. citizens. USDA monitors foreign ownership of agricultural land, but does not monitor ownershipof livestock businesses as distinct from other farms. As of December 1995, foreignpersons owned slightly more than one percent of all privately held agricultural land in theU.S. (Krupa 1996)
There are dramatic differences in types of legal organization used by farms versus non-farm businesses. In 1997 corporations made up 18.8 percent of all non-farm businessesbut generated 90 percent of all non-farm business receipts (Statistical Abstract of theUnited States 1998). Corporations with more than ten shareholders made up only 0.3percent of Minnesota farms in 1997, and accounted for 4.2 percent of the market value ofproducts sold (U.S. Census of Agriculture 1998). (Allen and Lueck 1998) use atheoretical model based on a trade-off between moral hazard incentives and gains fromspecialization to explain why farming has generally not converted from small, family-based firms into large, factory-style corporate firms. They compare their model toempirical evidence that family-controlled farm production has narrowed to those stagesthat include the most biologically based aspects of farming. Changes in livestocktechnology, which largely eliminated nature, have allowed factory-corporate productionto dominate in feedlot cattle, hogs, and poultry.
Another study that mentions farm ownership is (Wilson et al. 1993). They studied therisk perceptions and management responses of managers of large Arizona dairy farms. They found that firm size, ownership structure, and age were consistently important indetermining the likelihood of selecting a wide range of important perceptions andmanagement responses.
Broadening the Control Question
It might be useful to broaden the discussion of control from control of livestock inMinnesota to control of the food system generally. Boehlje and Schrader argue that afundamental issue in any negotiation-based coordinated system is the point (or points)and source of power or control. Who dictates, or has the most control, over theperformance of the system, of the sharing or risk and rewards? And what is the source ofthat power or control? They argue that there are two fundamental points of control andone fundamental source of power in a negotiation-based coordinated food production anddistribution system. The first point of control is the end user or consumer and those firmsthat have intimate contact with the consumer. The second point of power is the rawmaterial suppliers, especially suppliers of inputs with the fewest substitutes - the geneticmaterial in plant and animal production, the seed and breeding stock. In both cases, thesource of this power is knowledge. They also argue that the food system is at an earlystage in the process of shifting to contract/ownership coordination, and there may be anopportunity for organizations such as very large producers or producers' cooperatives toassert control and offset the perceived advantage of firms at the consumer or raw materialend points of the system.

Section V-1 page 194
D5c. what legal and business structures are used?
One of the concerns about livestock operations operated as corporations or other liability-limiting forms of business organization appears to be that the limitation on liabilityallows owners and managers to take more risks with environmental and other practicesthan they would take as sole proprietors. It is probably not practical to sort out the impactof this liability issue from the impact of firm size per se in an empirical study – at least ithas not been done to date. Discussions of when and how the corporate form of businessorganization was first written into law, and the concerns that were expressed then aboutcorporations abusing their economic power, can be found in chapter 4 of (Korten 1995)and on pages 25-26 of (Strasser 1989). This concern is not limited to agriculture andprobably would have to be addressed at an economy-wide and national if not internationallevel.
D5d. who makes the decisions over the practices of livestock operations ofdifferent kinds in Minnesota (owners vs. renters)?
We were not sure how to address the "owners vs. renters" dichotomy in this question. Inthe late 1970s, several studies addressed the question of whether rented cropland wasbeing as well protected from soil erosion as owner-operated cropland was. A quicksearch did not turn up any publications on this question more recent than about 1985, so itappears that interest in this topic appears to have declined. None of the publicationsseemed to focus specifically on livestock operations, in any case, so we will not cite themhere. The "renters" category seems less relevant to livestock issues than it does to cropissues. In livestock production, it would seem that a more relevant dichotomy might besomething like:
• independent producers vs.• producers with production contracts (own facilities but not the animals) and
their contractors vs.• owners of larger operations, managers, and their employees who do not have
an investment in the operation.
The decisions of interest also seem unclear. In the 1970s studies, the focus seemed to beon decisions that affected soil erosion and conservation. Conservation issues might alsobe of interest for livestock operations, especially with regard to manure managementpractices. Other areas of interest might be animal welfare and food safety.
One publication that seems to relate most closely to this question is a report onmanagement decisions made by U.S. farmers which was based on data from USDA'sFarm Costs and Returns Survey(Perry and Johnson 1996). They include graphs showingthe percentage of farms where the decisions were made by: 1) the operator, 2) the spouse,3) both, and 4) someone else, with the decisions classified as:
• Buy/sell land,
Section V-1 page 195
• Buy/sell equipment,
• Scheduling,
• Marketing,
• Off-farm job, and
• Taking up a new practice or new crop/livestock.
That report also contains graphs showing the percentage of farms and of value ofproduction with:
• partnerships or family corporations,
• share rent landlords,
• production contracts,
• both landlords and contracts, and
• non-family corporations and cooperatives.
They found that about 73% of farms and 26% of production was from single-family farmswith none of these other arrangements, and that the prevalence of the other arrangementsdecreased in the order listed above. The report did not, however, provide results forlivestock operations only, or discuss how differences in decision-making affectedperformance. Our search of the economics literature to date has not turned up any otherpublications very directly related to these issues.
QUESTION D6. WHAT MOTIVATES LIVESTOCK PRODUCERS ANDPROCESSORS TO START, CONTINUE, EXPAND, AND QUIT BUSINESS?WHAT ARE THE CHARACTERISTICS OF THOSE STARTING,CONTINUING, EXPANDING, AND QUITTING?
D6a. What motivates livestock producers and processors to start, continue,expand, and quit business? and
D6b. What are the characteristics of those starting, continuing, expanding, andquitting?
Minnesota workers studied dairy herds that made significant increases in the total milkmarketed from the farm in the period 1989 to 1993. (Stahl et al. 1999) About 80% of theincrease was achieved from increasing cow numbers and the remainder from improvedproductivity. The herds chosen for this study were from the top 100 DHIA herds making

Section V-1 page 196
the largest increase in milk sold. The fifty herds in the study had an average increase inmilk marketed of 90% and increased herd size by 51 cows. Fifty percent of these farmswere partnerships and the balance was single family farms. These farms made majorchanges such as animal housing, milking systems, feed storage, manure handling, hiredlabor, record keeping, feeding program, use of outside expertise, etc. The primaryreasons these farms made these changes were: increase income, improvement in lifestyle,efficiency of operation, modernize facilities, and desire for a management challenge. Eighty four percent indicated they had met their goals. They reported the areas of greatestdifficulty in this transition period were in rank order: uncertain economic times, limitedaccess to capital, employees difficult to find, expert opinions differed, environmentalregulation, and development of financial plans for financial institutions.
Fundamentally, the motivation of producers to raise livestock probably has not changedsince colonial times – to add value or provide a market for their crops. (Lawrence 1997)describes characteristics and motivations of Iowa producers who quit pork productionbetween 1992 and 1996. They averaged 48 years old, had average annual marketings of745 head, and had relatively little money invested in facilities. Economic reasons (lowreturns or high cost) ranked above other reasons such as access to markets or pressurefrom neighbors as reasons for stopping production. Half of the producers indicated thatthey had experienced health problems while raising hogs.
There is a line of reasoning that the commodity programs of the past few decades, bystabilizing crop prices, may have reduced the risk associated with specialized crop andspecialized livestock operations, compared to diversified crop-livestock operations. Thestabilizing effects of the commodity programs were cited as forces driving thedevelopment of specialized broiler operations and beef feedlots in the 1960s and 1970s(Reimund et al. 1981). The rationale is explained in (Lazarus 1995):
"The rationale is that the effective price that is being supported (what thecrop producer gets) is the sum of the market price for the grain plus thedeficiency payment. But the livestock producer only pays the marketprice. If the market price is less than it would be without the program, thecrop producer is not hurt as long as the deficiency payment makes up thedifference. The other main feature of the feed grain program - croplandsetaside - restricts supply so that deficiency payments are minimized. Still, deficiency payments have been substantial in some years. A majorinput risk for livestock producers has been reduced to the extent that feedprices have stabilized. Without such stability, it might have been moredifficult for large, specialized livestock operations to develop."
The 1996 farm bill converted the deficiency payment feature to a fixed transition paymentno longer linked to current market prices, so that there is less of a stabilizing effect oncrop producers' income. There is also less importance placed on commodity loans forkeeping crops off the market and stabilizing prices, so livestock producers are facingmore volatile feed prices than previously.

Section V-1 page 197
Our impression is that many of the new swine finishing enterprises that were set up inMinnesota in the 1990’s were undertaken by formerly specialized grain producers inresponse to low grain prices. That was the case in one specific operation's situation, asdiscussed in (Watson 1993). At more of an aggregate level, there are the discussions ofthe motivations for the development of integrated food supply chains in Mike Boehlje’smaterials, the Heffernan paper, and elsewhere.
There is a considerable body of literature on motivation for the development of tightervertical integration or contractual coordination linkages in the economy generally and inthe livestock industry specifically. The question is unclear about the extent to which " ...start, continue, expand, and quit business ..." includes the issue of packers integrating intoproduction, large producers building their own packing plants, etc. One publicationwhich provides a brief review of the theory and empirical evidence from a survey of largehog producers and processors is (Lawrence et al. 1997).
QUESTION E1. WHAT ARE THE ECONOMIES OF SCALE (INCLUDINGDISECONOMIES) RELATED TO LIVESTOCK RAISING, AND WHAT ARETHE IMPLICATIONS FOR SIZE AND TYPE OF PRODUCTION SYSTEM?
A clarification of terminology - Economies of size and scale are often usedinterchangeably, but they are somewhat different concepts. Economies of sizerelate to the reduction in average total cost associated with varying levels ofoutput, where the proportional relationship between production resources is notheld constant. In other words, as farms get bigger, the relative proportions ofland, labor, and capital typically change. Economies of scale relate toproportionate increases in all production resources as output increases. For mostfarm situations, "economies of size" is a more commonly used concept, in thatresource ratios typically change as farms become larger. (Harsh et al. 1981), page57 and (Hallam 1991). We will assume that economies of size are what is ofinterest to the GEIS.
One point which needs to be kept prominent in the discussion is the fact that increasingly,livestock businesses operate with multiple locations under one business entity orfirm which controls the multiple locations through direct ownership, contracts orother business arrangements. In a multi-location livestock operation, size can becalculated based on the number of livestock at the same location or the numbercontrolled by the same firm. For some environmental issues such as volume of apotential manure spill, the location size seems most relevant. For other issuessuch as market power, the firm size is probably what matters.
The agricultural economics profession has focused a great deal of attention on thetheoretical and empirical aspects of economies of size and scale for many years. Twocollections of papers were published in 1984 (Center for Agricultural and RuralDevelopment 1984), and 1993 (Hallam 1993). Empirical studies of economies of size inagriculture have generally found the cost curve to be "L"-shaped. Changes in thestructure of agriculture over time are not necessarily consistent with this cost structure.

Section V-1 page 198
These differences can be reconciled by appeal to external, non-size factors, and todifficulties in correctly measuring size economies (Hallam 1991).
Hallam lists three reasons to be interested in economies of size:
1) International competitiveness and terms of trade – economies of size in one countrymay be exploited to maximize domestic welfare, while economies of size in anothercountry may be stifled and an industry protected to attain other social goals.
2) The normative issue of the desirability of the family farm – if research shows thatthere are no economies of size for firms larger than the “typical” family farm, thenpolicies that protect this entity are more palatable to those who argue for economicefficiency as a primary objective.
3) Understanding economies of size may help policy makers, firms and consumers topredict the changing structure of U.S. agriculture.
In summarizing studies relating to economies of size and scale in agriculture, Hallamdraws two general conclusions: 1) there do not seem to be significant economies of sizefor mixed crop farms, the most common farm type; and 2) the cost curve does fall, butremains rather flat over acreage compatible with the “average” family farm. Cost curvesfor livestock producers fall more sharply and over a larger range of output levels. Thisevidence would imply that firm size should be fairly constant. This is not in accordancewith the dramatic decrease in farm numbers and increase in farm size over the past fortyyears. The difference between changes in industry structure and those predicted by the“size economies” theory need to be reconciled.
There are many reasons for these differences:
• pecuniary economies (quantity premiums for selling in larger quantities, and quantitydiscounts in purchasing inputs,
• economies realized as the industry as a whole expands and specializes,
• technical change that continually moves the entire cost structure in favor of largerfirms (the cost structure is “L”-shaped but moves lower and to the right each perioddue to technical change),
• improvement in managerial technique and information use such that relatively minortechnical economies are parlayed into significant operational economies, and
• opportunity costs outside the agricultural sector – if wage levels outside of agricultureare on the rise, then farmers may tend to leave the sector until wages equalize. Thiscan result in farm size increases, especially if equipment efficiency increases at the

Section V-1 page 199
same time.
He points out that differences in farmers’ values and goals may have a major impact onagricultural structure. If the cost curve is only mildly downward sloping, then producerswho value the farming lifestyle will accept a slightly lower return to labor andmanagement and thus make small firms with higher economic costs fully compatible withlarge firms that have lower costs. The inaccuracies in measuring size economies and therelative flatness of most measured curves do not allow the distinguishing of thesepossibilities.
A number of potential problems in measuring economies of size were also identified,which are categorized into those which relate to cross-sectional studies, those whichrelate to normative studies, and one which relates to any study where commodities orfirms are aggregated:
• Cross-sectional studies (such as farm record summary data sorted by size, and USDAFarm Costs and Returns Surveys) may encounter problems due to lack ofhomogenous technologies across sizes, and firms may not be fully exploiting theirtechnology at a given point in time. As firms learn, costs drop and the curve shifts. Also, all firms may be producing at the point of minimum average cost so that thereare no observations in the upward sloping portion of the cost curve, masking any sizeeconomies of diseconomies that are present.
• Normative studies (economic-engineering, budget or mathematical programmingmodels) can only represent technologies that are specified available by the researcher. There may be mis-specification of the technologies, if some are left out. If data fromcross-sectional surveys are used to obtain technical coefficients and constructtechnologies, firms with the lowest cost of production may be considered outlyers andleft out.
• Most empirical models involve aggregation over commodities or firms, often in adhoc ways. The results may be biased if such aggregation masks economies of scopeand jointness.
One additional concern which a reviewer pointed out is not very well articulated byHallam - how the farm operator's labor and management is represented. It is often arguedthat an important motivation for farms getting bigger today is to generate greater incomeor net return to the operator's labor and management. For increased size to generategreater income implies that labor may have been under-utilized previously, and/or thatlabor efficiency is being improved through increased mechanization, automation, or moreeffective management. This phenomenon may or may not be captured in the studydepending on how labor and management data is represented.
Economic efficiency, as measured by per unit cost of production, is one component of theincome revenue generated by the farm business to support the family income and lifequality goals. Conlin used the following equation to illustrate the principles:
Section V-1 page 200
Profit = (Price-Cost) * no of units marketed.
Decisions for managing improved profitability of the farm business consist of increasingprice received, reducing cost of production , and or increasing units marketed. Thesecomponents are interdependent in that cost may be reduced by increasing number of unitsproduced, which leads to economies of size as described by the L-shaped curve discussedabove. There also may be some improved market price advantage by marketing moreunits. Obviously, marketing more units where the cost per unit is more than the pricereceived will result in larger revenue losses. Diseconomies of size would suggest the costof production increases at certain size levels, or there are diminishing returns withincreases in size. In spite of diminishing returns on a per unit of production, total profitwill increase with more units marketed up to the point where the cost of the next unit isequal to the revenue generated by that unit. This is the concept of marginal returns.Maximum profitability of the business is where marginal returns equal marginal cost.Therefore the lowest cost of production is not necessarily the most profitable for thebusiness.
Readers must also be cautioned that concept of an L-shaped curve relates to aggregateddata from large numbers of farms or perceived representative farm situations, but that forany individual farm the points on the curve will vary as a result of many individual farmand human factors. Farm business managers continually apply new technology and makechanges to improve their businesses and survive in a competitive environment. Thesechanges impact the cost of production and potential economies of size and scale.
Empirical Studies Relevant to Minnesota
Aggregate Analysis
(Peterson 1997) analyzed economies and diseconomies of size at a very aggregate levelacross all farms in ten Corn Belt states, using data from the 1987 Census of Agriculture. He points out that scale economies must be a temporary, disequilibrium phenomenonsince payments to factors will exceed output. Obviously, this situation cannot persistindefinitely. He performed a regression analysis with the dependent variable being out-of-pocket expenses per dollar of sales, using nine size classes from $2,500 sales and less,to $500,000 sales and over. He found that economies of size were evident in the datawhen using only farm sales as the output variable. When 1) an implicit rental value isplaced on the farm dwelling and added to sales, 2) differences in corn yields across farmsize classes were netted out, and 3) days of off-farm work were factored in, diseconomiesof size became evident. The result is interesting, although we are not sure how useful theresult is to livestock industry issues given that he aggregated all farm types together. Weare also not sure how valid his assumption is that corn yield differences are due todifferences in soil type rather than management. Also, while days of off-farm workhelped explain differences in the expense ratio, he did not have data on off-farm earnings,which might have been a better indication of family well-being. This publication wascited in the January 1998 report from the USDA National Commission on Small Farms tojustify their call for greater support for small farms.
Section V-1 page 201
Hog Farm Profitability
For the pork industry, possible sources of information on economies of size relevant toMinnesota include:
• farm business record summary programs,
• surveys by the USDA National Agricultural Statistics Service, and
• surveys of mid- to large-sized pork producers conducted in recent years by researchersat Iowa State University and the University of Missouri.
The most relevant farm business record summary programs are the Southeastern andSouthwestern Minnesota Farm Business Management Associations and theMinnesota State College University Farm Management Program, both of whichare accessible through the new FINBIN software available through the Universityof Minnesota Center for Farm Financial Management's web site,http://www.cffm.umn.edu/.
None of the current published annual reports from any of these three record summariesinclude swine enterprise averages by size of operation, which would be needed toanalyze economies of size. It would probably be possible to obtain averages bysize from any or all of the three programs if a small amount of funding wereprovided to pay for the staff time to do the necessary computer runs. There isanother problem, however. The most rapid growth in the swine industry todayappears to be coming in the very large or "mega" operations of at least 50,000head marketed per year or roughly 2,500 sows or more. We assume that what theGEIS is most interested in is how profitability of these megas compares to themore traditional, small- to mid-sized, diversified, crop-hog operations. Theproblem is that the megas do not generally participate in university farm businesssummary programs and are not represented in the averages.
Another source of economies of size data is the Farm Costs and Returns Surveyconducted by the USDA National Agricultural Statistics Service and the USDAEconomic Research Service. The most recent report with a size analysis is(McBride 1995), based on the 1992 survey. The farrow-to-finish hog operationsare analyzed in four size categories: fewer than 500 head sold or removed undercontract, 500-999 head, 1,000-2,999 head, and 3,000 head or more. The largestsize breakpoint thus represents only around 150 sows, so the data is not useful incomparing the megas with the traditional mid-sized operations.
The only source covering the megas is the set of surveys of mid- to large-sized porkproducers conducted in recent years by researchers at Iowa State University andthe University of Missouri. The most recent report is (Lawrence et al. undated) Itwas based on useable responses from 2,030 producers from the nationwide VancePublishing mailing list of pork producers compiled by Pork magazine, of which
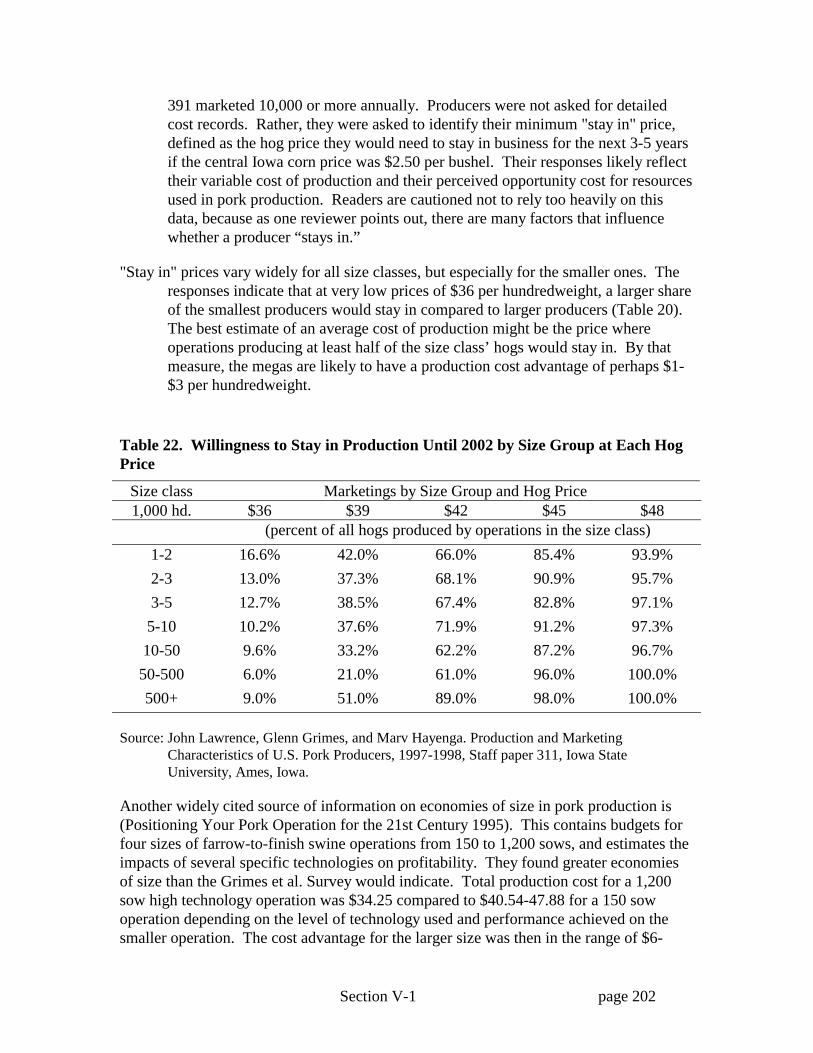
Section V-1 page 202
391 marketed 10,000 or more annually. Producers were not asked for detailedcost records. Rather, they were asked to identify their minimum "stay in" price,defined as the hog price they would need to stay in business for the next 3-5 yearsif the central Iowa corn price was $2.50 per bushel. Their responses likely reflecttheir variable cost of production and their perceived opportunity cost for resourcesused in pork production. Readers are cautioned not to rely too heavily on thisdata, because as one reviewer points out, there are many factors that influencewhether a producer “stays in.”
"Stay in" prices vary widely for all size classes, but especially for the smaller ones. Theresponses indicate that at very low prices of $36 per hundredweight, a larger shareof the smallest producers would stay in compared to larger producers (Table 20). The best estimate of an average cost of production might be the price whereoperations producing at least half of the size class’ hogs would stay in. By thatmeasure, the megas are likely to have a production cost advantage of perhaps $1-$3 per hundredweight.
Table 22. Willingness to Stay in Production Until 2002 by Size Group at Each HogPrice
Size class Marketings by Size Group and Hog Price1,000 hd. $36 $39 $42 $45 $48
(percent of all hogs produced by operations in the size class)1-2 16.6% 42.0% 66.0% 85.4% 93.9%2-3 13.0% 37.3% 68.1% 90.9% 95.7%3-5 12.7% 38.5% 67.4% 82.8% 97.1%5-10 10.2% 37.6% 71.9% 91.2% 97.3%10-50 9.6% 33.2% 62.2% 87.2% 96.7%50-500 6.0% 21.0% 61.0% 96.0% 100.0%500+ 9.0% 51.0% 89.0% 98.0% 100.0%
Source: John Lawrence, Glenn Grimes, and Marv Hayenga. Production and MarketingCharacteristics of U.S. Pork Producers, 1997-1998, Staff paper 311, Iowa StateUniversity, Ames, Iowa.
Another widely cited source of information on economies of size in pork production is(Positioning Your Pork Operation for the 21st Century 1995). This contains budgets forfour sizes of farrow-to-finish swine operations from 150 to 1,200 sows, and estimates theimpacts of several specific technologies on profitability. They found greater economiesof size than the Grimes et al. Survey would indicate. Total production cost for a 1,200sow high technology operation was $34.25 compared to $40.54-47.88 for a 150 sowoperation depending on the level of technology used and performance achieved on thesmaller operation. The cost advantage for the larger size was then in the range of $6-

Section V-1 page 203
14/hundredweight. A companion paper compared a 3,400 sow operation with 250 and650 sow sizes (Hurt et al. 1995). They found that the 3,400 sow size resulted in$4.28/hundredweight lower production costs than with 250 sows, and $1.86 less thanwith 650 sows, under Midwestern U.S. conditions. They also found that the Midwestern3,400 sow size had a cost advantage over the same size operation in North Carolina,because of lower feed costs. The data sources for the Purdue budgets are not documentedin detail. It is not clear how directly their costs were based on record summaries orsurveys, and how much was based on expert opinion and anecdotal information. There isalways the chance that any budget study may leave out certain costs or managementissues which may affect the results that average farms may experience. As a result,surveys such as the Lawrence et al. survey discussed earlier, or record summaries may bemore reliable indicators of overall industry conditions when available.
Table 19 shows that the smallest operations thought they were better able to deal with lowprices than were the larger sized operations. It has been suggested that the smalleroperations may have lower variable costs and greater fixity in their farm assets and coststructure. The lower variable costs might be related to more of their feed being raisedrather than purchased, and depreciated and paid off facilities and equipment. The lack offlexibility in their cost structure may make them more likely to “tough it out” underadverse economic conditions. The information in Table 19 is not adequate to test suchhypotheses.
Financial Performance and Structural Change in the Swine Industry, 1996-2000: Evidence from Minnesota Farm Business Management Records
An analysis of hog farms and swine enterprises in the Minnesota State College UniversitySystem’s Farm Business Management Program and the Southeastern and SouthwesternMinnesota Farm Business Management Associations (MnSCU-FBMA) shows somedramatic structural changes in the industry and some clues about how financialperformance and economies of size are driving those changes.
Pork producers must make a deliberate decision to participate in the MnSCU and FBMAprograms. The database is used in this analysis thus is not a statistically reliable estimatorof the total population of farms, but it is used because it includes detailed financialinformation not available elsewhere. The MnSCU-FBMA enterprises included farrow-to-finish, finishing feeder pigs, and wean-to-finish enterprises. Contractee enterprises werenot included, but some of those marketings may be included by operators with the otherenterprises who contracted out some of their finishing to others. The MnSCU-FBMAfarrow-to-finish enterprises are summarized by number of litters rather than bymarketings, so the size breakpoints are approximate. Multiplying litters by average headsold per litter gave breakpoints of less than 867, 867 to 4,403, and greater than 4,403marked. Table 21 shows the 1999 market shares by size category compared to 1997market shares for all U.S. operations from (Lawrence et al. undated). The MnSCU-FBMAoperations are probably similar to the overall population of medium- to large-sized swineoperations in Minnesota and the Midwest, but do not include any of the "mega"operations that produced 24 percent of the nation's hogs in 1997.
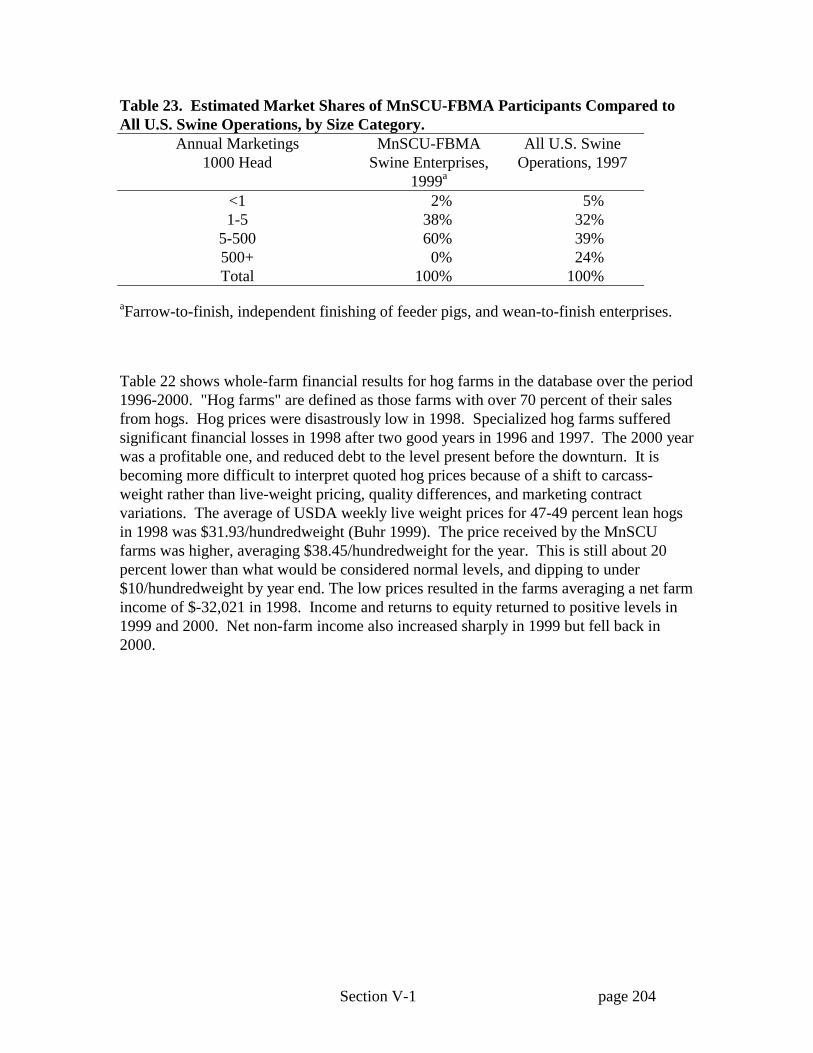
Section V-1 page 204
Table 23. Estimated Market Shares of MnSCU-FBMA Participants Compared toAll U.S. Swine Operations, by Size Category.
Annual Marketings1000 Head
MnSCU-FBMASwine Enterprises,
1999a
All U.S. SwineOperations, 1997
<1 2% 5%1-5 38% 32%
5-500 60% 39%500+ 0% 24%Total 100% 100%
aFarrow-to-finish, independent finishing of feeder pigs, and wean-to-finish enterprises.
Table 22 shows whole-farm financial results for hog farms in the database over the period1996-2000. "Hog farms" are defined as those farms with over 70 percent of their salesfrom hogs. Hog prices were disastrously low in 1998. Specialized hog farms sufferedsignificant financial losses in 1998 after two good years in 1996 and 1997. The 2000 yearwas a profitable one, and reduced debt to the level present before the downturn. It isbecoming more difficult to interpret quoted hog prices because of a shift to carcass-weight rather than live-weight pricing, quality differences, and marketing contractvariations. The average of USDA weekly live weight prices for 47-49 percent lean hogsin 1998 was $31.93/hundredweight (Buhr 1999). The price received by the MnSCUfarms was higher, averaging $38.45/hundredweight for the year. This is still about 20percent lower than what would be considered normal levels, and dipping to under$10/hundredweight by year end. The low prices resulted in the farms averaging a net farmincome of $-32,021 in 1998. Income and returns to equity returned to positive levels in1999 and 2000. Net non-farm income also increased sharply in 1999 but fell back in2000.

Section V-1 page 205
Table 24. MnSCU-FBMA Hog Farm Financial Performance, 1996-2000.
1996 1997 1998 1999 2000 AverageNumber of Swine Farms 135 142 95 94 105 114Liquidity:Current Ratio (Ending) 2.17 1.85 1.19 1.49 1.90 1.72Term Debt Coverage %(accrual)
267% 183% 24% 166% 256% 179%
Solvency:Farm Debt to Asset Ratio(ending, mkt)
48% 54% 65% 61% 54% 56%
Profitability:Return on Assets % 12.5% 9.3% -2.7% 8.0% 15.30% 8.48%Return on Equity % 18.9% 11.8% -25.1% 8.9% 26.50% 8.20%Operating Profit Margin % 23.5% 20.7% -8.1% 19.5% 29.7% 17.06%Net Farm Income $75,301 $61,154 $-32,021 $55,273 $127,389 $57,419Efficiency:Asset Turnover rate (cost) 53.3% 45.2% 32.8% 41.1% 51.5% 44.78%Operating Expense Ratio 76.1% 78.6% 90.2% 79.5% 76.3% 80.14%Depreciation Expense Ratio 5.2% 4.9% 8.2% 6.4% 4.3% 5.80%Interest Expense Ratio 4.7% 5.1% 7.3% 6.4% 4.8% 5.66%Net Farm Income Ratio 14.0% 11.4% -5.8% 7.6% 14.6% 8.36%Family Income:Total Non Farm Income $12,819 $13,496 $15,615 $26,360 $17,073 $17,073
Just under five percent of the farms in the MnSCU-FBMA database were classified ashog farms in 1996. By 2000, hog farms had declined to 4.1 percent of the group. This is agreater decline than that reported by the Minnesota Agricultural Statistics Service for allfarms having one or more hogs on hand during the year (Minnesota Agricultural Statistics2000). By their definition, the number of hog farms declined by 20 percent, from 9,500in 1996 to 7,500 in 1999. Part of the reason for the greater decline in numbers based onincome is that average hog prices dropped from $55.44 per hundredweight in 1996 to$44.19 in 2000. This price decline may have reduced hog income enough to shift somefarms out of the "hog farm" category even though they were still producing the samenumber of animals as before.
Is a swine enterprise still a suitable one for inclusion in a diversified farm business, ordoes modern swine production technology require a greater degree of specialization thanin the past? One way to address this question is to look at how much of total hog salesreported by the MnSCU-FBMA farms is from these specialized hog farms, and howmuch came from farms with less than that degree of specialization. Table 23 shows thatthe percentage of all hog sales coming from specialized hog farms increased in 2000 afterrelative stability over the earlier years.

Section V-1 page 206
The MnSCU-FBMA data reflects the shift away from farrow-to-finish enterprises towardmore specialized systems of production in recent years. Two-thirds of the hog incomecame from farrow-to-finish enterprises in 1996. That category has fallen to 39 percent asof 2000. These enterprise categories are chosen based on management and accountingneeds rather than physical location of the animals, so the hogs in the farrow-to-finishenterprises may not all have been farrowed and finished at the same location although thatwas the traditional system and most probably still are raised that way. Some, however,may be moved for finishing and some may be finished under contract by other operatorswho are included in the "contractee" category.
The enterprises classified as "finish feeder pigs" in the MnSCU-FBMA database arereferred to in this text as "independent finishing of feeder pigs" to distinguish them fromthe "contractee" enterprises, which are believed to be mainly finishing but could includesome other types such as nurseries. In a contractee finishing enterprise, the producerwhose information is included in the database normally provides the facility and labor butdoes not own the animals or provide the feed. A contractee producer thus is protectedfrom price risk in the hog and feed markets, but is vulnerable to the relationship risk thatthe contractor may default, not renew the production contract, or reduce payment rates. While the independent feeder pig finishers own the animals, it is likely that many of themnow purchase pigs under long-term contracts rather than buying lots individually fromsources such as sale barns.
A wean-to-finish enterprise begins with a newly weaned pig rather than an older pigcoming out of a nursery, and incorporates the nursery phase of production as well as thefinishing phase. The enterprises classified as wean-to-finish in the database have theiraccounting records for the nursery and finisher combined. This accounting classificationis not to be confused with the swine industry's use of the term "wean-to-finish" to refer tobuildings where the pigs are placed at weaning and remain through finishing. The wean-to-finish enterprises may involve separate nurseries and finishing buildings, or may usewean-to-finish buildings. Wean-to-finish enterprises are likely to be purchasing early-weaned pigs which are expected to have fewer health problems than those moved afterthe nursery phase or weaned later, because the early-weaned pigs still have antibodies tocertain diseases. To manage the younger pigs, the wean-to-finish producer needs moreskill than the feeder pig finisher typically needs.
Wean-to-finish enterprises have emerged as a significant category, with sales going fromunder three percent of total hog sales to 16 percent in four years. A number of farrow-to-weaning sow units have gone into production in Minnesota and elsewhere in recent years. Sales of weaned pigs from these enterprises have been increasing and were up to 2.2percent of all hog sales in 2000.

Section V-1 page 207
Table 25. Hog Farms as a Percentage of All MnSCU-FBMA Farms, 1996-2000.1996 1997 1998 1999 2000
(number)Total farms 2,730 2,703 2,577 2,721 2,582Hog farmsa 135 142 95 94 105
Hog farms as a percentage of all farms 4.9% 5.3% 3.7% 3.5% 4.1%(millions)
Hog sales on all farms $116 $122 $100 $103 $120Hog sales on hog farms $58 $65 $47 $56 $74
Hog farm share of all hog sales 50% 53% 47% 54% 62%
Enterprise share of gross hog income:Farrow-to-finish 65.1% 48.8% 43.5% 40.0% 38.4%Feeder pig production 2.2% 3.0% 4.8% 3.4% 1.4%Finish feeder pigs 27.1% 30.7% 33.9% 36.5% 25.6%Contracteeb 0.6% 1.2% 1.9% 1.2% 1.1%Farrow-to-weaning 0.9% 1.7% 1.4% 2.5% 2.2%Weaning-to-feeder 1.1% 0.2% 3.0% 0.2% 0.1%Wean-to-finish 2.6% 13.8% 11.2% 16.0% 30.8%Contractor 0.3% 0.6% 0.5% 0.1% 0.3%
Hogs, total 100.0% 100.0% 100.0% 100.0% 100.0%
a"Hog farms" are defined as farms with 70 percent or more of their gross sales from hogs.bThe contractee share appears relatively insignificant in this comparison of gross income,but represents only the contract payments, which are normally only small in relation tothe other enterprises' gross income because contractee does not incur costs for the pigs,feed and other inputs which are supplied by the contractor. See the average numbers ofhogs sold per year in the next table for a comparison of the relative physical sizes of theenterprises.

Section V-1 page 208
The rest of this discussion will focus on four of the above hog enterprise types thatproduce mainly market animals for slaughter: farrow-to-finish, finish feeder pigs,contractee, and wean-to-finish. Trends in the number of swine enterprises of these typesalong with their relative sizes are shown in 23. This data is taken from the livestockenterprise section of the database rather than the whole farm section which was the sourcefor Tables 21 and 22. Feeder pig production, weaning to feeder, and contractorenterprises are fewer in number and so were omitted. The number of farrow-to-finishenterprises has dropped by more than half in five years, while the number of independentfeeder pig finishing enterprises is down by 25 percent. Increases occurred in the numberof wean-to-finish and contractee enterprises, but from a much smaller 1996 base. Thetotal number of hog enterprises is down by 25 percent since 1996. Average size has beenincreasing for all of the enterprise types, however, so that the total number of hogs sold ortransferred from these farms is up 42 percent, to almost 1.2 million per year. The bottompanel of Table 24 shows the fairly striking result is that only a quarter of the animals arenow finished in the same farrow-to-finish operations where they were farrowed, while 75percent are brought in from somewhere else.
The MnSCU-FBMA farms sold or transferred ten percent of all hogs marketed inMinnesota in 1999, as reported by the Minnesota Agricultural Statistics Service (Table 25). Total marketings in the state rose by 30 percent between 1996 and 1999, a lesserincrease than for the MnSCU-FBMA farms.

Section V-1 page 209
Table 26. Types of Swine Enterprises Present on MnSCU-FBMA Farms, 1996-99.
1996 1997 1998 1999 2000Number of enterprises
Farrow-to-finish 249 205 148 112 75Finish feeder pigs 212 190 170 158 114Wean-to-finish 17 28 31 37 41Contractee 38 41 49 67 62Total hog enterprises 516 464 398 374 292
Number sold or transferred/year/farmFarrow-finish 1,635 1,734 2,000 2,647 3,543Finish feeder pigs 1,336 1,527 2,001 2,408 2,490Wean-to-finish 1,879 3,573 3,335 3,747 5,469Contractee 2,152 3,206 4,195 4,386 5,352
Total number sold/transferred, all farmsFarrow-finish 407,028 355,481 296,038 296,458 265,698Finish feeder pigs 283,232 290,130 340,170 380,464 283,860Wean-to-finish 31,943 100,044 103,385 138,639 224,229Contractee 81,776 131,446 205,555 293,862 331,824Total hog enterprises 803,979 877,101 945,148 1,109,423 1,105,611
Share of total animals sold or transferredFarrow-to-finish 51% 41% 31% 27% 24%Finish feeder pigs 35% 33% 36% 34% 26%Wean-to-finish 4% 11% 11% 12% 20%Contractee 10% 15% 22% 26% 30%Total hog enterprises 100% 100% 100% 100% 100%
Table 27. Minnesota Pig Crop, Inshipments, and Marketings, 1995-99.
Annual PigCrop
Inshipments Marketings
(thousands)1995 8,632 770 8,8951996 8,138 1,130 8,9661997 8,873 1,470 9,0411998 9,612 2,010 11,1501999 9,289 2,650 11,653
Source: (Minnesota Agricultural Statistics 2000), page 76.

Section V-1 page 210
A comparison of the costs and returns across the size categories for the four major swineenterprises gives an indication of the presence of economies of size in pork production.The FINBIN software allows tabulations by size of enterprise, but comparisons across thedifferent swine enterprises is complicated by differences in the size measures. Theeconomies of size comparisons were done by averaging across the five years of availabledata in order to minimize the effects of year-to-year random variation and cycle effects,especially with regard to the unusual economic situation in late 1998 and early 1999. FINBIN allows users to generate a size comparison across multiple years by simplyaveraging across all farm records in each size group regardless of which years a particularfarm participated. Such an approach can bias the results, however, if different sizedfarms are over- or under-represented in different years of better or worse profitability. Toavoid such potential bias, summaries were generated for each year. A simple average ofthe individual year costs and returns per unit was then calculated. The approach usedimplicitly assumes that the farms in each size category in each year fairly represents allfarms of that size, ignoring the differences in numbers of farms across groups.
The FINBIN swine and other livestock enterprise data probably does not include much ifany value for the manure. The issue of valuing manure has not been discussed to anygreat extent among the instructors and fieldmen, so there is no effort at present toencourage producers to value their manure. There is a place to enter "other income" in thecomputer program, and it is possible that some producers may enter manure values, butthe averages for other income in 2000 ranged from one cent per hundredweight forfarrow-to-finish to 19 cents per hundredweight for feeder pig finishing. Nineteen centsrepresents 0.6 percent of the total $32.40 gross return for that enterprise. If manure iscurrently under-valued (which we do not know for sure) and its true value were entered, itis unclear how the change would affect the conclusions made in this paper about risk-return tradeoffs and economies of size. A detailed study would be required to arrive atper-unit manure prices based on crop needs or sale possibilities. If an attempt were madeto more accurately account for manure value, care would also be needed to accuratelyaccount for related manure handling costs.
Table 26 shows key summary numbers for the farrow-to-finish enterprises, which aregrouped by litters farrowed per year. The litter breakpoints are multiplied by averagenumber marketed per litter in each size group in order to convert the breakpoints tomarketings per year. Average price received for raised hogs" is shown, but the net returnnumbers are based instead on the "gross return" numbers which also consider inventorychanges, purchases and sales of breeding stock, and transfers. The largest-sizedoperations (over 1,000 litters) had slightly higher total per-unit expenses, so their netreturns were less than for the two smaller-sized groups. Hired labor, custom hiring,interest, and lease expenses are all somewhat higher for the large size group. Oneexplanation for the apparent diseconomy at the largest size may be herd health problems,and in particular the pseudorabies outbreak in southern Minnesota in 1998-99. In the lasttwo years, the largest size group had a higher average for pigs born per litter but fewersold per litter than did the next largest size. Aside from the pseudorabies outbreak, it is

Section V-1 page 211
not known how many of the largest farrow-to-finish operations might have expandedrecently and might be suffering from the stress of managing a larger facility. Expanding afarrow-to-finish enterprise is probably more difficult than expanding a finishing-only sitebecause of the greater complexity of the operation.
Note that as discussed above, a limitation of the FINBIN data is that even the largestoperations are quite small in relation to the largest swine operations in the U.S. Forexample, the "over 1,000 litters" group of farrow-to-finish enterprises shown in Table 25averaged 12,285 head sold in 2000, while Table 23 shows that 24 percent of U.S.marketings in 1997 were from operations selling over 500,000 head. Smithfield Foodsalone managed 695,000 sows in 2000, which translates into around 1.4 million littersfarrowed or 14 million head marketed! (Freese 2000).
Tables 25 through 28 show several calculations related to labor efficiency, the operator'slabor and management opportunity cost that operators specify that their time would beworth in other activities, and what their labor and management time is actually earning inthe swine enterprises. The "net return" line is the difference between the gross returnsand total listed expenses. "Total listed expenses" include the expense items chargeddirectly to the swine enterprise in the farm's accounting records plus allocated shares ofoverhead expenses. Allocated overhead expenses include machinery and buildingdepreciation, interest on term debt, and a number of other items. It is notable that there isno attempt to allocate the farm business' equity capital among enterprises.
"Estimated labor hours" are shown next in tables 25 through 28. These labor estimatesare generally regarded as not being very precise because producers do not usually keeprecords on how much time is spent on different enterprises. The labor estimates arenevertheless used in the tables because their use make it possible to standardize thereturns numbers to an hourly basis that the general public can relate to non-farmemployment. "Labor & mgmt charge" is the share of the operator's labor andmanagement opportunity cost that is allocated to the enterprise. That number is added tothe hired labor expense to arrive at a total labor and management charge. The total laborand management charge is then divided by labor hours to arrive at an hourly "hired andoperator labor & mgmt charge per hour" which represents the hourly rates that theoperators felt their time was worth plus what they paid to hired labor. If the enterpriseearned more than this amount, then the "est. return over labor & mgmt charge" line ispositive. A negative indicates that the enterprise was not able to return what theoperator's time was worth.
The next-to-bottom line adds the hired labor expense and operator labor and managementcharge back in to arrive at a net return without considering any labor cost. The bottomline then divides that net return by estimated labor hours to arrive at what the enterpriseearned per hour of labor.
To illustrate, the farrow-to-finish enterprise shows a positive net return at all sizes exceptfor the 1-100 litter size. The hired and operator labor and management charge variedfrom $9.72 per hour for that size, up to $13.49 per hour at the 501-1,000 litter size. Net

Section V-1 page 212
returns earned per hour varied from $-3.36 to $14.96 per hour.
The independent feeder pig finishing, wean-to-finish, and contractee enterprises alldisplay increased per-unit net returns as size increases. If $10 per hour is arbitrarilychosen as a minimum required hourly return, required enterprise size would be 1,000animals marketed per year for independent feeder pig finishing, 2,500 animals for wean-to-finish, or 2,500 pig spaces for a contractee enterprise, which would translate intoaround 7,000 head finished under contract per year. Hourly earnings were estimatedconsidering both hired and unpaid labor, by adding hired labor expenses back into netreturn and then dividing by estimated labor hours per unit.
The number of farms included for each year is shown in each table by size category. Forthe farrow-to-finish enterprises, the number of farms increased at the largest (over 1,000litters) size even though the hourly returns were also over $12 in the 201-500 litter group. There are several possible reasons why the hourly returns may be inflated as measures oflabor earnings. First, as mentioned above, the format used for the enterprise analysis doesnot consider the equity capital invested in the enterprise because of the difficulty ofallocating equity among enterprises. The opportunity cost of this equity is thus notincluded in total expenses. So, part of the hourly earnings represent a return to equitycapital. If this equity portion could be estimated and subtracted from the hourly returns,the remaining return to labor and management might be reduced significantly. Thenumber of finishers in the largest (over 5,000 marketed) size group declined from 20 to12 in 2000. The number of farms in the comparable-sized wean-to-finish groupincreased, so some of the finishers may have remained in business but switched fromfinishing feeder pigs to finishing weaned pigs so they now appear under the wean-to-finish category.
Another factor explaining the drop in farm numbers might be that the depreciationnumbers used in the analysis are based mainly on tax depreciation and may under-estimate the funds needed to replace or refurbish the facilities. If the numbers under-estimate true replacement-based economic depreciation, then the enterprises may be lessprofitable than they appear here. The facilities on the exiting farms may have reached theend of their useful lives, and projected profitability may not have justified replacing them.
Table 27 shows that independent feeder pig finishing can still be a lucrative enterprisegiven sufficient volume. The "over 5,000 marketed per year" group was twice as laborefficient at 0.11 hours per head as was the "2,501-5,000" size category, and as a resultaveraged $48 per hour over the five years. The number of farms in both of these sizecategories increased over the five years, while the numbers in the smaller size groupsdeclined. Independent feeder pig finishing is a high risk enterprise, however. In 1996 thelargest size group averaged a return of $99 per hour, but lost money at a rate of $32 perhour in 1998.
The wean-to-finish analysis in Table 28 covers only the four-year period 1997-2000because the five enterprises in the database for 1996 were too few to do a sizecomparison. The number of farms has increased in the smallest and largest size

Section V-1 page 213
categories for the wean-to-finish,and for the two largest sizes of contractee enterprises(Table 28).

Section V-1 page 214
Table 28. MnSCU-FBMA Farrow-to-Finish Enterprise Costs and Returns by Size,Average 1996-2000
Litters Farrowed Per YearAll 1-100 101-200 201-500 Over 1000
Estimated Market Animals Marketed Per Year
All9 -886
844 -1,672
1,670 -4,153
Over 7,611
Number of farms:1996 249 91 80 60 51997 205 77 53 55 51998 148 51 46 31 81999 112 31 36 28 102000 75 19 23 19 10
(1996-2000 average)Average number of sows 152 38 86 163 756Litters/sow 1.92 1.49 1.70 1.88 2.13Number marketed/litter 7.98 8.48 8.12 8.18 7.64Number marketed/year 2,331 485 1,186 2,501 12,285
($ per hundredweight, 1996-2000 average)Average price for raised hogs $ 45.53 $ 43.06 $ 44.24 $ 45.04 $ 46.86Gross return $ 43.24 $ 41.14 $ 42.29 $ 43.18 $ 44.25Feed cost $ 24.69 $ 27.05 $ 25.65 $ 24.54 $ 23.98Hired labor $ 2.15 $ 0.90 $ 0.88 $ 1.66 $ 3.05Custom hire $ 0.79 $ 0.30 $ 0.25 $ 0.50 $ 1.90Depreciation $ 2.23 $ 2.56 $ 2.05 $ 2.38 $ 2.00Interest on debt $ 1.99 $ 2.32 $ 1.89 $ 1.77 $ 2.24Machinery & bldg leases $ 1.81 $ 0.42 $ 0.40 $ 0.73 $ 3.96Total expenses per cwt $ 40.41 $ 41.84 $ 38.31 $ 38.29 $ 43.09
Net return $ 2.83 $ (0.70) $ 3.99 $ 4.90 $ 1.16Estimated labor hoursa 0.38 0.65 0.49 0.40 0.27Labor & mgmt charge $ 2.92 $ 5.67 $ 5.14 $ 3.50 $ 0.93Total of hired labor expense
and labor andmanagement charge
$ 5.07 $ 6.58 $ 6.01 $ 5.16 $ 3.97
Hired and operator labor &mgmt charge per hour
$ 13.27 $ 10.06 $ 12.32 $ 12.78 $ 14.94
Est. return over labor & mgmtcharge
$(0.09) $ (6.37) $(1.15) $ 1.39 $ 0.24
Net return w/o laborb $ 4.98 $ 0.20 $ 4.86 $ 6.56 $ 4.21Net return/hour of labor $ 13.04 $ (3.36) $ 7.15 $ 16.23 $ 15.83
aEstimated labor hours included hired and unpaid labor.bNet return w/o labor is calculated by adding the hired labor expense back into net return. Thus,the operator and other unpaid labor may have earned more or less than this hourly amountdepending on how much of total labor hours were hired and at what wage.
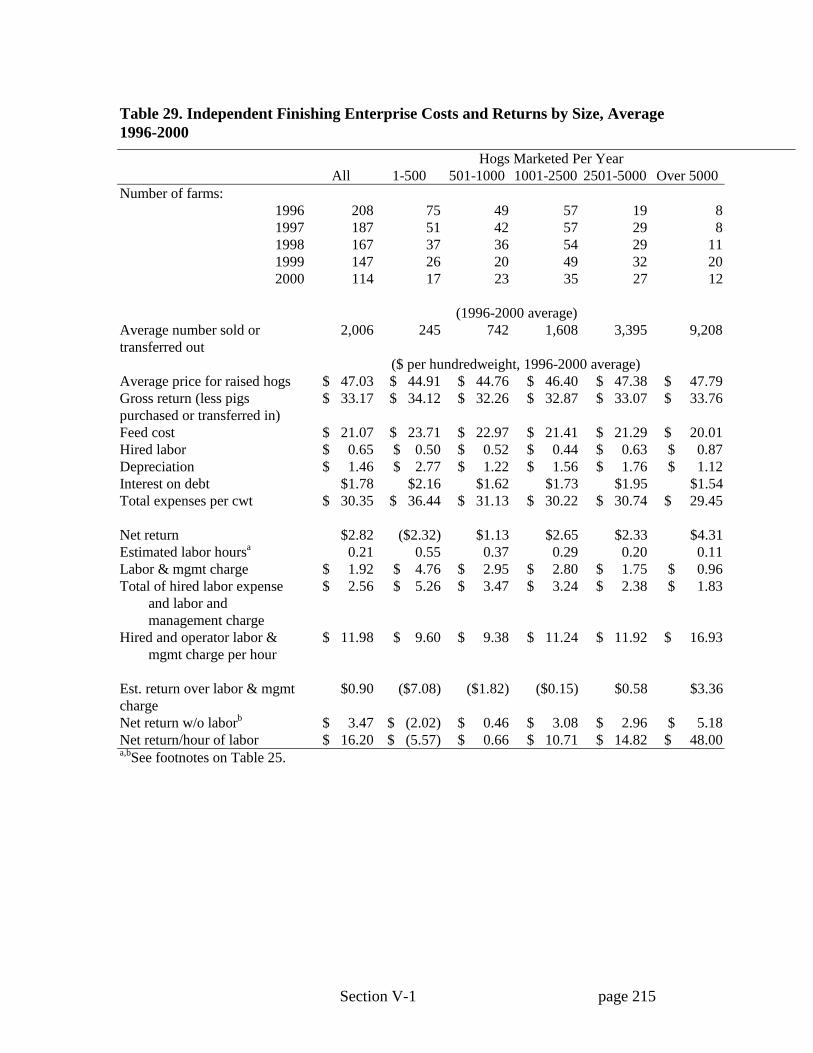
Section V-1 page 215
Table 29. Independent Finishing Enterprise Costs and Returns by Size, Average1996-2000
Hogs Marketed Per YearAll 1-500 501-1000 1001-2500 2501-5000 Over 5000
Number of farms:1996 208 75 49 57 19 81997 187 51 42 57 29 81998 167 37 36 54 29 111999 147 26 20 49 32 202000 114 17 23 35 27 12
(1996-2000 average)Average number sold ortransferred out
2,006 245 742 1,608 3,395 9,208
($ per hundredweight, 1996-2000 average)Average price for raised hogs $ 47.03 $ 44.91 $ 44.76 $ 46.40 $ 47.38 $ 47.79Gross return (less pigspurchased or transferred in)
$ 33.17 $ 34.12 $ 32.26 $ 32.87 $ 33.07 $ 33.76
Feed cost $ 21.07 $ 23.71 $ 22.97 $ 21.41 $ 21.29 $ 20.01Hired labor $ 0.65 $ 0.50 $ 0.52 $ 0.44 $ 0.63 $ 0.87Depreciation $ 1.46 $ 2.77 $ 1.22 $ 1.56 $ 1.76 $ 1.12Interest on debt $1.78 $2.16 $1.62 $1.73 $1.95 $1.54Total expenses per cwt $ 30.35 $ 36.44 $ 31.13 $ 30.22 $ 30.74 $ 29.45
Net return $2.82 ($2.32) $1.13 $2.65 $2.33 $4.31Estimated labor hoursa 0.21 0.55 0.37 0.29 0.20 0.11Labor & mgmt charge $ 1.92 $ 4.76 $ 2.95 $ 2.80 $ 1.75 $ 0.96Total of hired labor expense
and labor andmanagement charge
$ 2.56 $ 5.26 $ 3.47 $ 3.24 $ 2.38 $ 1.83
Hired and operator labor &mgmt charge per hour
$ 11.98 $ 9.60 $ 9.38 $ 11.24 $ 11.92 $ 16.93
Est. return over labor & mgmtcharge
$0.90 ($7.08) ($1.82) ($0.15) $0.58 $3.36
Net return w/o laborb $ 3.47 $ (2.02) $ 0.46 $ 3.08 $ 2.96 $ 5.18Net return/hour of labor $ 16.20 $ (5.57) $ 0.66 $ 10.71 $ 14.82 $ 48.00a,bSee footnotes on Table 25.

Section V-1 page 216
Table 30. Wean-to-Finish Enterprise Costs and Returns by Size, Average 1996-2000Hogs Marketed Per Year
All 1001-2500 2501-5000 Over 5000Number of farms:
1996 - - - - 1997 28 5 11 61998 31 11 6 71999 37 13 9 82000 41 15 9 14
(1996-2000 average)Average number sold ortransferred out
4,172 1,690 3,129 10,870
($ per hundredweight, 1996-2000 average)Average price for hogs $ 43.84 $ 42.01 $ 44.53 $ 44.24Gross return (less pigspurchased or transferred in)
$ 30.95 $ 29.84 $ 31.33 $ 31.25
Feed cost $ 17.99 $ 20.29 $ 18.69 $ 17.19Hired labor $ 0.91 $ 0.27 $ 0.67 $ 1.11Depreciation $ 1.66 $ 1.22 $ 1.55 $ 1.81Interest on debt $ 1.83 $ 1.77 $ 1.72 $ 1.93Total expenses per cwt $ 28.61 $ 29.01 $ 28.25 $ 28.62
Net return $ 1.87 $ 0.66 $ 2.46 $ 2.10Estimated labor hoursa 0.18 0.25 0.18 0.16Labor & mgmt charge $ 1.08 $ 1.91 $ 1.54 $ 0.65Total of hired labor expense
and labor andmanagement charge
$ 1.98 $ 2.18 $ 2.21 $ 1.76
Hired and operator labor &mgmt charge per hour
$ 11.02 $ 8.73 $ 12.44 $ 10.84
Est. return over labor & mgmtcharge
$ 1.01 $ (0.86) $ 1.23 $ 1.59
Net return w/o laborb $ 2.78 $ 0.94 $ 3.13 $ 3.22Net return/hour of labor $ 15.43 $ 3.74 $ 17.62 $ 19.80a,bSee footnotes on Table 25.

Section V-1 page 217
Table 31. Contractee Enterprise Costs and Returns by Size, Average 1996-2000Pig Spaces
All 1-1000 1001-2500 2501-5000Approximate Number of Hogs Marketed Per Year
3 -2,680
2,813 -7,025
6,653 -13,300
Number of farms:1996 38 23 10 51997 41 15 16 101998 49 21 17 101999 67 24 23 172000 62 16 23 21
($ per hundredweight, 1996-2000 average)Pigs/pig space 2.69 2.68 2.81 2.66Average number sold ortransferred out
4,463 1,454 4,320 8,997
Gross return (less pigspurchased or transferred in)
$ 34.77 $ 28.19 $ 36.42 $ 35.59
Hired labor $ 0.95 $ 0.56 $ 0.73 $ 1.20Depreciation $ 11.24 $ 7.71 $ 13.91 $ 9.66Interest on debt $ 10.35 $ 6.46 $ 10.45 $ 11.44Total expenses per cwt $ 32.23 $ 25.38 $ 36.21 $ 31.00
Net return $ 2.74 $ 3.36 $ 1.21 $ 4.45Estimated labor hoursa 0.50 0.85 0.52 0.37Labor & mgmt charge $ 5.47 $ 8.11 $ 6.16 $ 4.44Total of hired labor expense
and labor andmanagement charge
$ 6.42 $ 8.67 $ 6.89 $ 5.64
Hired and operator labor &mgmt charge per hour
$ 12.89 $ 10.18 $ 13.25 $ 15.17
Est. return over labor & mgmtcharge
$ (2.73) $ (4.74) $ (4.95) $ 0.01
Net return w/o laborb $ 3.69 $ 3.93 $ 1.94 $ 5.65Net return/hour of labor $ 7.41 $ 4.61 $ 3.73 $ 15.20a,bSee footnotes on Table 25.
Section V-1 page 218
The decline in farrow-to-finish and independent feeder pig finishing enterprises and theincreasing numbers of wean-to-finish and contractee enterprises may be at least partiallyexplained by their relative financial performance. Two measures of financialperformance that are of great interest to most producers are 1) what net returns areexpected to average over the long term, and 2) how vulnerable they are to downturns inhog prices and input costs throughout the inevitable production and price cycles. Table29 shows that wean-to-finish enterprises have been riskier but more profitable thancontractee enterprises were between 1996 and 2000, but both offered advantages over themore traditional farrow-to-finish and independent feeder pig finishing enterprises.
The two measures of vulnerability to downturns included in Table 29 are the standarddeviation of the individual year numbers, and the coefficient of variation (standarddeviation divided by the average). The number of pigs sold or transferred per year isshown first in the table, and used along with net returns/pig to calculate totals perenterprise and totals across all enterprises. Net returns/hour of labor may be a moreuseful measure of financial performance, however, because labor requirements differ. The wean-to-finish enterprises averaged earnings of over $20 per hour over the five yearscompared to under $15 for the farrow-to-finish and independent feeder pig finishingenterprises, with lower risk as measured by the standard deviation of annual returns. Thecontractee enterprises provided the lowest average hourly earnings, more than five dollarsper hour less than for farrow-to-finish and independent feeder pig finishing, but did notexperience the losses that the others suffered in 1998.
Aside from the lower variability of annual returns, other explanations that have been putforth for the increasing popularity of contractee enterprises are the minimal skill requiredto manage finishing animals compared to a breeding herd, management assistanceprovided by contractors, and ease of financing due to the reduced income variability.
It should be noted that the enterprise summaries do not impute a cost of equity capital, sothe net returns should be interpreted as returns to equity and risk as well as to labor andmanagement. On the returns side, the annual returns do not account for possible capitalgains culminating in a positive salvage value of the facility after debt is repaid. It is alsounclear to what extent the fertilizer value of manure is accounted for in the returns.
The second panel of Table 29 shows the estimated labor hours from the previous tablesconverted to a common basis, per pig sold or transferred out. Size increased and laborefficiency improved over the five years in all of the enterprises on average. Thedifference in labor efficiency among the enterprises is apparent. The labor requirementfor the farrow-to-finish enterprises averaged just over an hour per pig, or more than twiceas much as for finishing feeder pigs and for the wean-to-finish enterprises. This differencein labor is to be expected as the farrow-to-finish enterprises involve managing the sowherd, but the net returns have arguably not been adequate to compensate for the addedlabor. The added labor for wean-to-finish compared to finishing feeder pigs also makessense in that wean-to-finish involves starting with younger animals. The contracteeenterprises appear markedly more labor efficient than the other enterprises, with less than

Section V-1 page 219
half as much labor per pig compared to independent finishing of feeder pigs, although thelargest feeder pig finishers were about as efficient as the contractees (see Table 26, andconvert the per hundredweight figures to a per pig basis).
Part of the reduction in contractee labor may be due to the fact that the contractorsprovide management functions such as marketing, acquisition of feed and other inputs,and general supervision. Five contractor enterprises in the MnSCU database averaged0.06 hours per pig over the five years. Adding this contractor-provided labor to the 0.20contractee-provided hours per pig totals 0.26 hours. This seems to indicate that thecontractee-contractor system of swine production is around twice as labor efficient aswith the other enterprise types.
The flip side of this labor efficiency improvement of course is that the employmentpotential of the swine industry is declining. The labor hours per pig were multiplied bythe total pigs sold or transferred from the enterprises and divided by an assumed 2,500hours per full-time-worker-equivalent factor to arrive at full-time-equivalent jobs (FTEs)that these enterprises employ. Employment has declined by 35 percent, from 295 FTEs in1996 to 162 in 2000, despite the 38% increase in pigs sold. However, much of this laborhas probably just been shifted to large sow units that are not included in the MnSCUdatabase. When additional labor of 0.35 hours per pig of farrowing the pigs in wean-to-finish enterprises and 0.5 hours per pig of farrowing and nursery labor for the finish-feeder-pigs and contractee enterprises is added in, the employment decline is only 15percent over the five years.
Despite the decline in the number of farrow-to-finish enterprises, on average over the fiveyears they are provided about half of the total net returns generated by these swineenterprises, which averaged $5.3 million. It is notable that more hogs were transferredfrom the contractee enterprises has grown to the point where in 2000, more weretransferred from that enterprise than were sold from any of the other enterprises. Despitethe volume, the contractee enterprises contributed markedly less to the operations' netreturns over the five years than did the other enterprises.
Two hypothetical scenarios are also shown at the bottom of Table 29. These show the netreturns and employment that would have resulted over the five years if all of theproduction would have been in farrow-to-finish enterprises at the financial performancelevels achieved by that enterprise type. The first scenario assume the same 38 percentincrease in volume that actually occurred over the five years, but calculates total returnsand employment using the farrow-finish values per pig. Total net returns in 2000 wouldhave been 62 percent greater as they actually were, but the 1998 losses would also havebeen almost twice as great. The five-year average returns would have been a third greaterthan the actual amount. Employment of 367 jobs would have been 66 percent greaterthan the 222 jobs in the MnSCU enterprises themselves, but only 7 percent greater thanthe 344 jobs when farrowing labor for the purchased pigs is factored in. Employmentwould have still declined by 35 percent from 1996 to 200, however, because ofimprovements in the labor efficiency of the farrow-to-finish enterprises over the period.

Section V-1 page 220
The difference between the five-year average $5.3 million in actual returns and thehypothetical $7.0 million in returns under the hypothetical all-farrow-finish scenariomerits further discussion. The feeder pig finishing, wean-to-finish and contracteeenterprises do not include returns to the farrowing phase of hog production, and thecontractee returns do not include returns received by the contractors involved. If thefarrowing and contractor per-pig returns were added to those of the record farms, thetotals would probably be about the same as the per-pig returns of the farrow-finishenterprises shown here6.
If the total per-pig returns are the same, then from a state perspective the $1.7 milliondifference probably reflects not a loss in revenue but rather a revenue shift - away fromthe record farms to the large, new farrowing units and contractors involved (who for themost part are not represented in the farm business summary database). Some of thefarrowing units and contractor enterprises are owned by large individual Minnesota swineoperations or groups of pork producers, so the shifted revenues stay in Minnesotaagriculture.
Other farrowing units and contractors are located out-of-state, so that portion of the shiftwould represent a loss to the state. About a quarter of all hogs marketed in the state in1999 were shipped in, based on reports from the state board of animal health and reportedby the Minnesota Agricultural Statistics Service (see Table 24), but a breakdown is notreadily available as to how many of the imports are market hogs ready for slaughter andhow many are pigs destined for finishing on Minnesota farms. This is over three timesthe inshipments of five years earlier. Changes in Minnesota's breeding herd and marketanimals have tracked closely, however, which implies that these inshipments are probablymust entering for slaughter. Labor problems in Canadian slaughter plants in 1998 and1999 led to Canadian producers shipping hogs to Minnesota plants, which might accountfor some of the increase. Minnesota's situation is different from Iowa's, where thebreeding herd has declined while market animals have increased.
The less attractive farrow-to-finish returns might have dampened the 1996-2000expansion, however, so the 38 percent volume increase might not have happened if allproduction had remained farrow-to-finish. The second hypothetical all-farrow-finishscenario simulates returns and employment that might have occurred if volume hadremained at 1996 levels. Net returns would still have averaged about 10 percent higheron average than they did, but employment would have averaged 8 percent less. Employment would have declined by 53 percent, from 417 jobs in 1996 to 196 in 2000.
This comparison illustrates the risks that independentfinishers face in terms of market volatility, which in aproduction contract situation is usually experienced by the
6 In fact, the dramatic shift toward wean-to-finish and contracting must be motivated bysomething. One motivating factor may be per-pig returns that are greater than for farrow-to-finish. Hourly returns may be greater at least, but on the other hand, if labor requirements per pig areless, higher hourly returns may be achieved without an increase in per-pig returns.

Section V-1 page 221
contractor rather than the contractee. It is fairly welldocumented that in most business enterprises, entrepreneursdemand higher expected returns as a tradeoff for acceptinghigher risks. Contractee hog producers generally provide afacility (a capital investment) and labor. They generallyshift many management decisions to the contractor, alongwith much of the risk. It would be expected that contracteeswill earn lower returns per unit over time in return foravoiding these risks.
It is also fairly well documented that contractee producersdo not avoid all risks. For example, Production contractsoften include performance incentives or bonus plans thatshift at least some production risks such as death losses orpoor feed conversion to the contractee, and there is alsowhat is sometimes referred to as "relationship risk" thatthe contractor will go bankrupt or otherwise default ontheir contractual obligations. One source on the risks andbenefits of hog production contracting with additionaldetails on typical contract provisions is (Dotson 1996).

Section V-1 page 222
Table 32. Relative Financial Performance Of The Major Types Of Swine Enterprises On MnSCU-FBMA Farms, 1996-2000.Average Standard Coefficient of
1996 1997 1998 1999 2000 1996-2000 Deviation VariationNumber of enterprises
Farrow-to-finish 249 205 148 112 75 159Finish feeder pigs 212 190 170 158 114 169Wean-to-finish 17 28 31 37 41 32Contractee 38 41 49 67 62 62
Number sold or transferred/year/farmFarrow-finish 1,635 1,734 2,000 2,647 3,543 2,312Finish feeder pigs 1,336 1,527 2,001 2,408 2,490 1,952Wean-to-finish 1,879 3,573 3,335 3,747 5,469 3,601Contractee 2,152 3,206 4,195 4,386 5,352 3,858
Net returns/pigFarrow-finish $18.03 $11.17 ($17.85) $7.93 $16.86 $7.23 14.61 2.02Finish feeder pigs $17.66 $4.89 ($12.12) $5.47 $12.75 $5.73 11.30 1.97Wean-to-finish $17.79 $12.60 ($6.37) $2.80 $12.91 $7.95 9.68 1.22Contractee ($0.06) $1.79 $1.30 $0.40 $1.57 $1.00 0.79 0.80
Average net return/enterpriseFarrow-finish $29,469 $ 19,377 $(35,702) $ 20,989 $59,729 $8,534 34,513 4.04Finish feeder pigs $23,594 $ 7,467 $(24,252) $ 13,172 $31,748 $4,995 21,487 4.30Wean to finish $33,421 $ 45,023 $(21,249) $ 10,508 $70,601 $16,926 34,874 2.06Contractee $(127) $5,744 $5,454 $1,734 $8,378 $3,201 3,399 1.06
Estimated labor hours per pig sold or transferred outb
Farrow-finish 1.30 1.14 1.08 0.79 0.61 1.08Finish feeder pigs 0.57 0.48 0.42 0.38 0.38 0.46Wean-to-finish 0.77 0.48 0.43 0.41 0.38 0.52Contractee 0.28 0.19 0.17 0.15 0.15 0.20
Net returns/hour of laborFarrow-finish $ 17.92 $ 14.34 $ (11.95) $ 16.58 $30.00 $13.38 15.4 1.15Finish feeder pigs $ 33.46 $ 13.21 $ (25.93) $ 16.61 $36.05 $14.68 24.8 1.69Wean-to-finish $ 24.97 $ 31.67 $ (8.72) $ 12.71 $41.56 $20.44 19.4 0.95Contractee $ 1.54 $ 10.69 $ 10.15 $ 4.93 $12.39 $7.94 4.5 0.57

Section V-1 page 223
Table 29 (continued)Average
1996 1997 1998 1999 2000 1996-2000Total hogs sold or transferred from all enterprises
Farrow-finish 407,028 355,481 296,038 296,458 265,698 324,141Finish feeder pigs 283,232 290,130 340,170 380,464 283,860 315,571Wean-to-finish 31,943 100,044 103,385 138,639 224,229 119,648Contractee 81,776 131,446 205,555 293,862 331,824 208,893Total hog enterprises 803,979 877,101 945,148 1,109,423 1,105,611 968,253Change 1996-2000 38%
Total employment represented by all enterprises at 2,500 hours per full-time-equivalent jobFarrow-finish 211 161 128 94 65 132Finish feeder pigs 65 56 57 58 43 56Wean to finish 10 19 18 23 34 21Contractee 9 10 13 12 19 14Total hog enterprises 295 246 216 191 162 222Employment change 1996-00 -45%Total w/farrowing laborc 372 345 340 346 317 344Employment change 1996-00 -15%
Total net returns, all enterprisesFarrow-finish $7,337,831 $3,972,329 $(5,283,854) $2,350,824 $4,479,693 $2,571,365Finish feeder pigs 5,001,877 1,418,736 (4,122,860) 2,081,138 3,619,215 1,599,621Wean-to-finish 568,160 1,260,636 (658,716) 388,784 2,894,636 890,700Contractee (4,736) 231,130 256,603 111,133 519,432 226,711Total hog enterprises $12,903,132 $6,882,831 $(9,808,827) $4,931,879 $11,512,976 $5,288,397
Two hypothetical scenarios Difference fromWhat net returns and employment in all hog enterprises would have been if all farrow-finish, at actual volumes by year: ActualTotal net returns $14,493,987 $9,801,187 $(16,869,522) $8,797,385 $18,640,714 $6,972,750 32%Total employment, FTEs 417 398 409 351 269 369 7%Employment change 1996-00 -35%
What net returns and employment in all hog enterprises would have been if all farrow-finish, 1996 volume:Total net returns $14,493,987 $8,984,093 $(14,349,864) $6,375,309 $13,555,179 $5,811,741 10%Total employment, FTEs 417 365 348 254 196 316 -8%Employment change 1996-00 -53%

Section V-1 page 224
aCaution should be exercised in interpreting the 1996 contractee data. Economic conditions in the swine industry generally were good that year. MnSCU farm management instructors have suggested that the negative average net returns might have come about because some of the contracteeproducers were just starting up and provided only partial year data. Normally, if such situations are identified, those farms are not included in thesummary but in this case some might have been left in the database. bEstimated labor hours included hired and unpaid labor.cIn analyzing the total employment represented by the various enterprises, it must be kept in mind that the labor to manage the sow unit and farrowthe pigs is not included for the finish-feeder-pigs, wean-to-finish, and contractee enterprises. Pigs for these enterprises are increasingly beingsupplied by large units owned by groups of producers, feed companies, or similar entities that typically have their own accountants and do notparticipate in farm business summary programs. As an approximate measure of this additional labor, this line includes an additional 0.35 hours perpig of farrowing labor for the pigs in wean-to-finish enterprises and 0.5 hours per pig of farrowing and nursery labor for the finish- feeder-pigs andcontractee enterprises, based on budgets for a typical 1,400-sow unit described in (Koehler et al. 1996) and on data from the small number of feederpig production, farrow-to-wean, and wean-to-feeder enterprises in the MnSCU database.

Section V-1 page 225
It has been argued that per unit production costs should be dismissed as an indication ofeconomies of size, and to focus instead on where investment is occurring:
“Because cost studies are inconsistent, the current cost of production maynot be the best indicator of the future structure of the pork industry. In thefinal analysis, investment in facilities may actually provide a betterindication of how commodity-side production will occur in the future thaneither cross-sectional or budgeted cost estimates. The part of the industryinvesting most heavily in production assets is likely to have the largestshare of future production. The vast majority of the new investment inproduction facilities over the past four years has been made bynonintegrated and partially integrated production contractors. Theunwillingness or inability of the independent producer sector to reinvest inproduction assets will (over time) reduce their position in the industry. This may be more a reflection of the absence of technologies within thefinancial reach of individual producers than a lack of interest orcompetence in hog production. But the net result will be to steadily shift alarger and larger percentage of production away from the small- andmedium-size independent producers to production contractors and largerindependent producers.” (Boehlje and Schrader 1998)
The "survivor technique" is a statistical technique which is limited in its potential fordetailed analysis, but is useful for providing an overview of broad trends. Originated inits modern form by (Stigler 1958), it has been applied to many manufacturing and foodindustries to some degree. It is based on the hypothesis that plant sizes which areefficient will survive and plant sizes that are inefficient will decline. The smallest groupwhich shows an increase in its relative share is classes as the "minimum efficient size." Amajor problem is the fact that plants may survive for many reasons other than theirinternal efficiency (French 1977).
Table 30 shows the number of farms selling hogs and pigs by size groups as reported inthe last five Censuses of Agriculture between 1978 and 1997. The number of farms inthe less than 1,000 head category has been declining over the entire period. The 1,000-1,999 size class shows how the minimum economic size has increased in the 1990’s. Thenumber of farms in this class increased until 1992, but has dropped since then. The2,000-4,999 size class is still increasing in number of farms, but the bottom two lines ofTable 32 show that they sold a smaller percentage of the hogs in 1997 than they did in1992. The survivor technique would indicate that sales of at least 5,000 hogs and pigs peryear are required today for economic viability. This is equivalent to around 250 sows at20 pigs per sow per year. it should be noted that the Census of Agriculture defines farmson the basis of location rather than ownership. Pigs on "this place" that are being grownunder production contracts are lumped together with pigs that are owned by the farmoperator who controls or operates the place.
Table 30 is somewhat difficult to interpret because of the increasing segmentation in the

Section V-1 page 226
swine industry. The swine industry was once made up mainly of operations that bothfarrowed and finished the hogs for slaughter. Today, the industry appears to besegmenting rapidly into operations that just farrow or just finish, and there are specializednurseries and breeding stock multipliers which are all lumped together in Table 30.
Table 31 is a little easier to interpret because it shows just farms that farrowed sows. Here again, rapid change is evident. Only the last two censuses are shown. The size classfarrowing 500-999 litters per year is equivalent to around 250-500 sows producing twolitters per year. This class appears economically viable. The 200-499 litter class isincreasing in percent of total farms, but decreasing in percent of total litters. The largestsize class, 1,000 litters or around 500 sows, now produces half of the total number oflitters.
Table 33. Numbers of Minnesota Farms Selling Hogs and Pigs by Size Groups,1978-97
Head Sold Per YearLess than
1,0001,000-1,999
2,000-4,999
5,000 ormore
5,000-7,499
7,500 ormore Total farms
Number of farms by head sold per farm1978 25,150 840 236 26 na na 26,2531982 19,840 1,483 436 44 na na 21,8021987 14,387 1,599 566 100 na na 16,6521992 9,158 2,378 2,031 182 107 75 13,7491997 3,243 1,566 2,391 517 193 324 7,717
Percent of total farms selling hogs and pigs1978 95.8 3.2 0.9 0.1 na na 100.01982 91.0 6.8 2.0 0.2 na na 100.01987 86.4 9.6 3.4 0.6 na na 100.01992 66.6 17.3 14.8 1.3 0.8 0.5 100.01997 42.0 20.3 31.0 6.7 2.5 4.2 100.0
Number of head sold per farm (000)1992 3,146 2,378 2,031 1,586 634 952 9,1411997 1,483 1,566 2,391 7,503 1,150 6,353 12,943
Percent of total hogs sold1992 34.4 26.0 22.2 17.4 6.9 10.4 100.01997 11.5 12.1 18.5 58.0 8.9 49.1 100.0
Source: Census of Agriculture

Section V-1 page 227
Table 34. Numbers of Minnesota Farms Farrowing Sows by Size Groups, 1978-97
Litters Farrowed Per YeearLess than
100 100-199 200-499 500-9991,000 or
moreTotalfarms
Number of farms by number of litters farrowed per year1992 6,656 1,623 900 161 59 9,3991997 2,937 769 602 188 196 4,692
Percent of total farms farrowing sows1992 70.8 17.3 9.6 1.7 0.6 100.01997 62.6 16.4 12.8 4.0 4.2 100.0
Number of litters farrowed1992 217 217 253 108 98 8931997 93 107 175 132 522 1,029
Percent of total litters1992 24.3 24.3 28.3 12.1 11.0 100.01997 9.0 10.4 17.0 12.8 50.7 100.0
Source: Census of Agriculture

Section V-1 page 228
Dairy Farm Profitability
Aging Facilities
Many of the dairy facilities on Midwest farms are old. They are still functional andproductive and have limited alternative uses so they remain in use, but they do not lendthemselves to the use of some new technologies so that limits the level of efficiency that canbe attained. Parlor milking and free stall barns and bunker silos are in the minority. Table32 shows the average year of construction and most recent improvements made onMinnesota and Wisconsin dairy facilities (Conlin 1995a).
Diversification Versus Specialization
Diversification can be a risk-avoiding strategy. The idea is to spread the risk over severalenterprises; low prices of one commodity will be offset by high prices in the other.
The typical Midwest diversified dairy farm produces feed for the dairy herd and relies onmilk sales for 70 to 90 percent of its income. In reality, these farms are highly dependenton the price of milk. The diversified cropping enterprises only protect the farm from highfeed prices. However, the cost of producing a bushel of corn, oats, wheat or barley isfrequently more than the price for which it can be purchased. Production costs of feeds ondairy farms are often higher than on crop farms because of more limited scale efficiencies ofthe cropping enterprises.
Conlin discussed the diversification/specialization question in a proceeding paper based ona review of literature and farm financial records (Conlin 1995b). (See (Conlin 1998) for alist of additional references.) Most of Midwest dairy farms produce a major portion of thefeed for the dairy herd and are diversified in their capital investment, labor activities andmanagement expertise required. Investment capital is almost always a limited resource.
The cropping activities require substantial investments in land and field machinery. Someover-investment occurred in the name of tax management during periods of investment taxcredits and favorable profitability. Generally, diversified farms that raise their feed for smallherds in stanchion barn systems have higher investments and higher labor inputs per cow.
Leasing of equipment and/or cows are options for reducing investments on the dairy farm. Some farmers use custom hire for some or all cropping activity. In most cases, the cost ofleasing cattle exceeds the cost of ownership. It may be advantageous when leased cows willadd to the return over feed and other cash costs, particularly if land and labor resourceswon't otherwise be fully utilized, and especially when the barn won't otherwise be full.

Section V-1 page 229
Table 35. Construction date and date of last improvements in facilities on Midwest dairy farms
Average year built Average year remodeled
MN WI MN WI
HousingMilkingFeed storageFeed handlingWaste disposal
19631964196919731974
19431957196419721974
19761978197819801977
19751979197919811981
North U.S. Dairy Survey, 1990.(Hammond 1989)
USDA researchers (El-Osta and Johnson 1996) compared differences in the traditionalmilk producing states (MN, MI, WI, NY, VT, PA, NY, VT) with non-traditional milkproducing states (FL, CA, WA, TX, AZ). They found significant differences in theresource base, and the structure of profitability and management practices between thetraditional (68 cows) and non-traditional (370 cows) dairies. The factor foundcontributing most to net farm income regardless of location was size of the operation, butsize was irrelevant in explaining per unit returns from dairy. High productivity and lowdebt to asset were strongly related to profitability. The importance of management abilityto the profitability of the farm business is also noted in a five-state survey of thenortheastern and north central region of the U.S. and Canada which found that well-managed farms are able to compete in per-unit profitability with farms many times larger(Ford et al. 1996). This is consistent with overall conclusion by Hallam of an “L”-shapedcost curve which becomes flat at fairly low farm sizes, discussed under question E1.
El-Osta also found other factors contributing to higher levels of profitability in thetraditional dairies were low investment costs in land and equipment, control of purchasedfeed cost, age of the operator, use of automatic takeoffs and artificial insemination, andlevel of adoption of capital- and management intensive technologies (record keepingcombined with parlors). The authors point out that these dairies had a lower adoption rate(9%) of capital- management intensive technologies compared to non-traditional dairies.
Other factors in non-traditional dairies contributing to profitability included lower percow expenditure for forage production, purchased feed, hired labor, and per cowinvestment. Per unit returns for dairies with advanced, more capital intensive parlorsrather than traditional parlors were lower. The study show there are incentives for thesedairies to continue expansion, such as production and marketing economies, managementexpertise, tax incentives, specialization, labor saving equipment, timeliness of gettingthings done, non-farm investment, and farm consolidation. (El-Osta and Johnson 1996)
Milk is a perishable product in a highly competitive national market and is highly

Section V-1 page 230
sensitive to short range changes in the supply demand balance. The roller coaster ups anddowns of milk prices have added a new dimension to management since the mid-1980’s. This volatility has been very frustrating for many dairies while some have thrived on it. Federal government support price for milk is equivalent to $10.05 per cwt. in 1998, andscheduled to be lowered then discontinued on January 1, 2000. The support price isintended to serve as a price safety net. As the support price moved well below theaverage production cost, the market price has become highly volatile. This has led tosome price stabilizing tools, futures and options markets, and milk processor contractsthat set a price floor. Dairy lenders often encourage their use to stabilize income flowsfor meeting loan obligations.
Producers can control only 10 to 12% of the price they receive for their milk compared totheir neighbors. Quality milk premiums can often make a dollar or more difference in themilk price. Milk is priced on a solids basis (protein, fat and other solids); therefore, highsolids milk brings a better price per cwt. Producers need to balance quantity with percentmilk component solids to maximize total returns. Some producers have found ways tonegotiate additional premiums/benefits such as hauling charges, volume premiums, etc.(Conlin 1998)
A 1992 survey of dairy farms in the northern part of the US and Canada provided acomprehensive comparative analysis of financial performance (Ford et al. 1996). Thestudy looked at the farm level performance of 2,200 dairy farms across four states,Michigan, New York, Pennsylvania, Wisconsin, and the providence of Ontario Canada. The data sets were pooled to provide a descriptive analysis of the financial characteristicsof the dairy farm across the region. The results of this study are shown in Table 33, whichsummarizes financial performance of these farms by herd size. The average herd sizewas 84 cows and was summarized in six categories ranging from less those 30 cows toover 250 cows.

Section V-1 page 231
Table 36. Characteristics and Financial Performance of Pooled Data Set, All farms and by Herd Size, 1992
Mean Values by Herd SizeAll
farms10-39cows
40-79cows
80-119cows
120-159cows
160-249cows
250 andover
SIZE OF BUSINESSAverage number of cows 84 32 57 95 136 193 429Milk sold, LB 1,502,715 519,390 969,236 1,702,880 2,535,201 3,558,784 8,274,866Worker equivalent 2.49 1.49 1.89 2.72 3.70 4.79 9.67Total tillable acres 263 129 190 303 434 565 972
RATES OF PRODUCTIONMilk sold per cow, LB 17,348 15,999 17,058 17,999 18,582 18,450 19,191Hay DM per acre, tons 2.84 2.32 2.76 3.05 3.19 3.26 3.46Corn silage per acre, tons 15.74 14.25 15.82 16.23 15.80 15.64 16.97
LABOR EFFICIENCYCows per worker 34 25 33 38 42 44 46Milk sold per worker, LB 595,572 391,349 555,126 678,577 768,247 795,944 881,696
COST CONTROLGrain & conc. Purr. - % milk sales (%) 26 26 25 26 26 26 28Feed & crop expense/cwt ($) 4.48 4.37 4.41 4.66 4.69 4.60 4.68Labor & mach. Costs per cow ($) 849 1,074 834 789 810 771 772Oper. cost of prod. milk ($) 10.04 10.01 9.82 10.32 10.39 10.51 10.52
CAPITAL EFFICIENCY (YEAR AVG.)Farm capital per cow ($) 7,798 8,819 8,053 7,368 6,879 6,525 6,108Machinery & equip. per cow ($) 1,363 1,572 1,391 1,347 1,229 1,062 960Asset turnover ratio 0.40 0.36 0.38 0.43 0.46 0.49 0.56
PROFITABILITYNet farm income w/o apprec. ($) 33,047 11,396 22,510 35,342 54,694 68,570 195,022Net farm income w/ apprec. ($) 54,555 20,065 37,947 59,991 87,200 116,489 291,951Labor & mgmt. Income per oper./ mgr. ($) 2,551 -6,862 -861 3,769 3,890 13,118 90,377Rate of return on equip. cap. w/ apprec. (%) -1.30 -8.63 -2.01 -0.09 3.89 6.05 8.89Rate of return on all cap. w/ apprec. (%) 1.96 -2.66 1.39 3.78 4.71 5.24 7.96
FINANCIAL SUMMARYFarm net worth, end year ($) 443,355 213,198 336,625 495,188 713,151 857,061 1,676.021Debt to asset ratio 0.30 0.26 0.29 0.32 0.28 0.39 0.39Farm debt per cow ($) 2,143 2,098 2,139 2,264 1,818 2,330 2,216SOURCE: A Descriptive Analysis of the Characteristics and Financial Performance of Dairy Farms in Michigan, New York, Ontario, Pennsylvania andWisconsin. Dept. of Ag., Res., and Managerial Econ., Col. of Ag. and Life Sci., Cornell Univ., Ithaca, NY. R.B. 96-08, July 1996.
Section V-1 page 232
The authors concluded that what stood out in their analysis is farms within herd sizecategories have more performance factors in common with other farms in other statesthan they do with farms of different herd sizes in the same state. Ontario is an exceptiondue to larger investments and higher debt per cow under the Ontario milk marketingsystem. The authors provided descriptions of these differences.
ProfitabilityNet farm income, with or without appreciation, is more than 10 times larger on the largestfarms than on the smallest farms. Labor and management income per operator/managervaried from minus $6862 on the smallest farms to over $90,000 on the largest farms. Fulltime operator/management units were based on 2800 hours per year and excluded hiredlabor and unpaid family labor. Rate of return on equity capital with appreciation wasnegative for smaller farms, but almost 9 percent on the largest farms. Rate of return onall capital with appreciation shows a similar pattern but with a smaller range.
ProductivityThe larger herds sold 20% more milk per cow, 19191 lbs for herds averaging 439 cowscompared to 15999 lbs. for herds averaging 32 cows. Pounds of milk per worker variedfrom 391,349 lbs annually for the small herd group to 881,000 for herds over 250 cows. It took one worker per for 26 cows in the small herds compared to 46 cows in the largerherds.
Cost ControlGrain and concentrate purchased as a percent of milk sales, and feed and crop expense percwt. of milk sold generally increased, but by only a small amount, as herd size increased. Labor and machinery costs per cow decreased as herd size increased. Operating costs ofproducing milk increased with herd size because a greater portion of the labor is a cashcost, where as most labor on small farms in provided by the operator and family.
Capital EfficiencyFarm capital per cow decreased dramatically as herd size increased. Farm capital per cowwas one-third less for the largest farms compared to the smallest farms. A similar patternexisted for machinery and equipment investment per cow. Asset turnover rates increasedas herd size increased indicating that each dollar invested is being used more productivelyon larger farms.
Financial SummaryFarm net worth varied from $213,198 on the smallest farms to over $1,675,000 on thelargest farms. Debt to asset ratio increased, while farm debt per cow remains relativelyconstant moving from smallest to largest herd sizes.
The authors noted that the farms in the sample data were a bit larger and higher producingexcept in Pennsylvania herds when compared to the most recent census data averages.

Section V-1 page 233
There are several sources of dairy farm financial data from other states, (Wisconsin,Michigan, Pennsylvania, and New York) that is reported as aggregated averages forauthor defined classifications. Each has it’s own set of characteristics that may limitdirect comparison with the data from Minnesota without technical interpretation.Therefore these have not been included in the dairy farm financial performanceinformation reported here.
The Minnesota Farm Business Management Program conducted administered by theMinnesota State Colleges and Universities provides an annual aggregated summary offarm records from across the state. This is the largest farm financial data source in thestate. It is very useful, but comes with certain restrictions to protect the privacy of theparticipating farms. The data is made available only in summary form, with no access toindividual farm data. These restrictions make it somewhat difficult to assess how similarthe summarized farms are to the entire Minnesota dairy farm population, and do not allowcross-year analysis or factor analysis which might explain in more detail what factorsaffect profitability. Group aggregated summaries provided by the program are based ondairy farms with more than 70% of gross farm income from dairy. Summaries of this dataare shown for two separate years. The 1996 summary below (Tables 34 through 36)provides a high level of detail in order to characterize Minnesota dairy farms. Table 37includes only selected measures but is included to indicate how economic conditions hadchanged by 1999. This data source is not necessarily representative of all Minnesota dairyfarms relative to size, productivity, enterprise mix, and other management factors.
Summaries of Minnesota Farm Business Management records for dairy farms show largefarm-to-farm differences in the economic and production performance of producing milk(Jackson 1999). They also show large swings in profitability from year to year. The 1996comparison of high and low profit Minnesota dairies (Tables 34 through 36) reveals someimportant differences comparing the 20% high profit dairies with the 20% low profitgroup. The profit groups are based on net farm income. This summary is based on morethan 800 Minnesota dairy farms in 1996 from the Farm Management Education Program,Minnesota State Colleges and Universities. Conlin has compiled a summary analysis ofthese records from 804 Minnesota dairy farms and interpreted the results. Some of thecompiled summaries reflect subsets of the 804-farm sample because useable data was notavailable for some farms. Key differences in the overall profit performance of these farmsare as follows: (Conlin 1998)

Section V-1 page 234
Table 37. Income, Costs and Returns, Minnesota Dairy Farms, 1996
Low 20% Average High 20%No. of farms 161 804 161Herd size (cows) 54 64 73Production per cow, lb 14,639 17,428 19,812IncomeMilk price $ 14.56 $ 14.81 $ 14.99Sale culls/calves/other 1.03 0.87 0.86Inventory changes (0.07) 0.39 0.73Gross income per cwt 15.52 16.07 16.58ExpensesHerd replacements $2.71 $ 2.28 $ 2.08Feed cost 7.88 6.54 5.66Other variable cost 3.10 2.50 2.17Overhead cost 2.45 2.28 2.29Labor mgmt charge 1.48 1.11 0.95Total Cost $ 17.62 $ 14.71 $ 13.15Net Return to Capital $ (2.10) $ 1.36 $ 3.43Dairy enterprise return to capital $ (16,601) $ 15,169 $49,607Percent income from dairy 77% 75% 68%Net Farm Income $ (8,105) $ 38,502 $ 102,608
Table 38. Minnesota Dairy Farm Balance Sheet, 1996
Low Average HighFarm AssetsNo. of farms 147 705 104Current $47,630 $65,857 $135,567Intermediate 177,631 297,944 327,076Long term 202,282 217,283 319,909Total Assets 430,543 491,084 782,555Farm LiabilitiesCurrent 51,115 42,271 63,719Intermediate 82,848 72,077 96,892Long term 107,269 100,061 123,163Total Liabilities 241,332 214,409 283,774Net Worth 219,710 315,903 571,836Net Worth Change, 1995-96 -4,331 23,623 78,002Source: Farm Business Management Report 1996, Minnesota State Colleges andUniversities (Minnesota Farm Business Management Program, Statewide AnnualReports, 1996 undated).
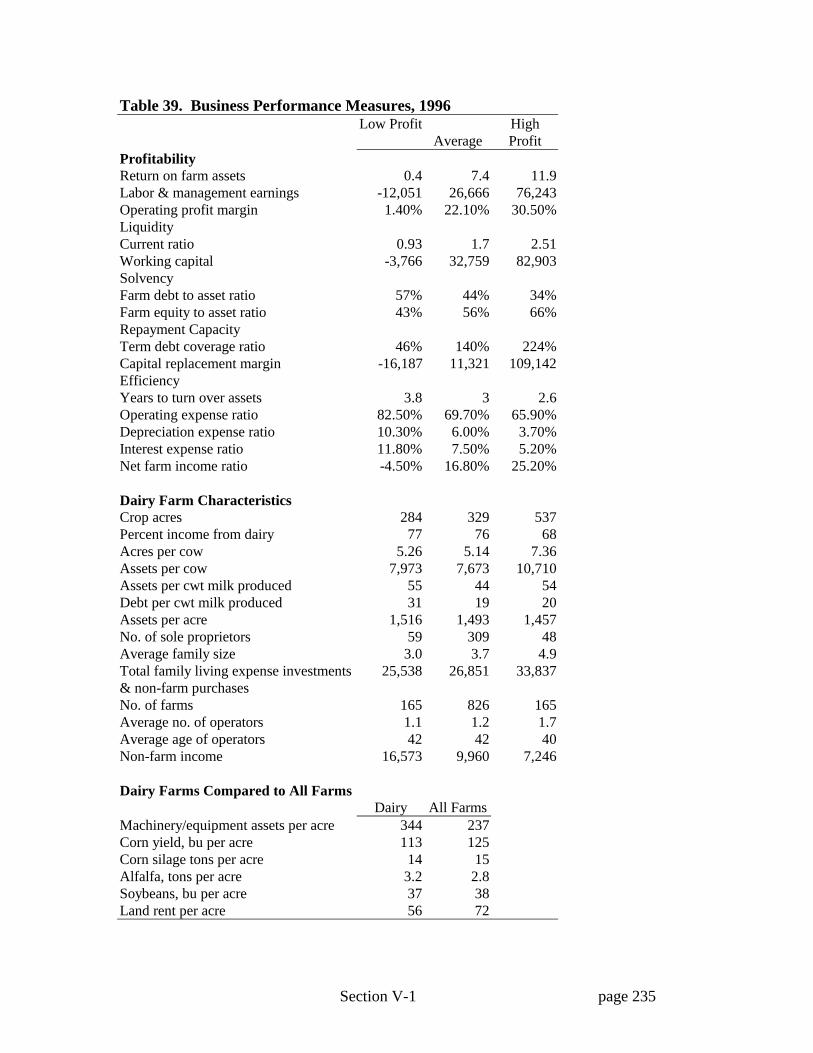
Section V-1 page 235
Table 39. Business Performance Measures, 1996Low Profit
AverageHighProfit
ProfitabilityReturn on farm assets 0.4 7.4 11.9Labor & management earnings -12,051 26,666 76,243Operating profit margin 1.40% 22.10% 30.50%LiquidityCurrent ratio 0.93 1.7 2.51Working capital -3,766 32,759 82,903SolvencyFarm debt to asset ratio 57% 44% 34%Farm equity to asset ratio 43% 56% 66%Repayment CapacityTerm debt coverage ratio 46% 140% 224%Capital replacement margin -16,187 11,321 109,142EfficiencyYears to turn over assets 3.8 3 2.6Operating expense ratio 82.50% 69.70% 65.90%Depreciation expense ratio 10.30% 6.00% 3.70%Interest expense ratio 11.80% 7.50% 5.20%Net farm income ratio -4.50% 16.80% 25.20%
Dairy Farm CharacteristicsCrop acres 284 329 537Percent income from dairy 77 76 68Acres per cow 5.26 5.14 7.36Assets per cow 7,973 7,673 10,710Assets per cwt milk produced 55 44 54Debt per cwt milk produced 31 19 20Assets per acre 1,516 1,493 1,457No. of sole proprietors 59 309 48Average family size 3.0 3.7 4.9Total family living expense investments& non-farm purchases
25,538 26,851 33,837
No. of farms 165 826 165Average no. of operators 1.1 1.2 1.7Average age of operators 42 42 40Non-farm income 16,573 9,960 7,246
Dairy Farms Compared to All FarmsDairy All Farms
Machinery/equipment assets per acre 344 237Corn yield, bu per acre 113 125Corn silage tons per acre 14 15Alfalfa, tons per acre 3.2 2.8Soybeans, bu per acre 37 38Land rent per acre 56 72

Section V-1 page 236
Profitability: Return on assets was 11.9% for high profit dairy farms while the low profitgroup had a return of .4%. This resulted in a higher net return of $3.43 compared to $-2.10per cwt of milk. The high profit dairy farms had an Operating Profit Margin of 30.5%compared to 1.4% for the low 20% profit group. The net worth growth from 1995 to 1996was $-4,331 compared to $78,002 for the low and high profit groups.
Family Living and Unpaid Labor: The high profit group enjoyed an advantage of $7,299more family living and non-farm investment. The average labor management charge per cwtmilk for the high profit group was $.95 compared to $1.48 for the low profit group. The lowprofit group had $16,573 of non-farm income compared to $7,246 for the high profit group.
Price Income Performance: High profit dairies had an income advantage of $1.06 per cwtof milk marketed. The gross income from all of these sources varied from $15.52 for the20% low profit dairies to $16.58 for the high profit group among 800 Minnesota dairy farmsin 1996 (Table 34). High profit dairies received almost $0.43 more per cwt for their milklargely due to premiums for quality and other. Sales of cows and calves and animalinventory changes added $0.63 per cwt to the advantage of the high profit group. Sale of cullcows, dairy animal sales, growth in herd inventory from year to year, and credit for milk fedto calves or used by the family can typically be equivalent to $1.25 to $1.50 per cwt. About40% of the difference in gross income per cwt was due to milk price; the rest was due to non-milk income sources.
Profit Centers for Income per cwt: High Profit dairies have higher gross income per cwt ofmilk marketed. They receive a higher milk price because of premiums for quality, etc. Greater income from animal sales and changes in inventory are important contributors to ahigher gross income per cwt.
Variable Costs: High profit dairies had a lower operating expense ratio, spending $0.66 togenerate $1.00 of income compared to $0.83 for the low profit group. Total cash cost ofproduction was $13.15 compared to $17.62 per cwt. for the low profit group. High profitdairies had lower feed costs by $2.22 per cwt. ($5.66 Vs $7.88) for milking cows, lowerother variable costs ($2.17 Vs $3.10), breeding fees, health care, supplies, repairs, etc. Herdreplacement costs were $2.08 Vs $2.71 per cwt. of milk in favor of the high profit group(Tables 23 and 25).
Capital Costs: High profit dairies had a lower debt asset ratio (34% Vs 57%) but higher totalassets and liabilities. The high profit group had higher investment per cow and about equalinvestment per cwt. of milk. Debt per cwt. of milk was $20 Vs $31 to the advantage of thehigh profit group. High profit dairies had lower overhead costs ($2.29 Vs $2.45), they alsohad a substantial advantage in the depreciation and interest expense ratios and years to turnover assets. The typical $7,500 to $10,000 investment per cow for the income generated isa major profit constraint on many Midwest dairy farms. Machinery and equipment

Section V-1 page 237
investment on dairy farms was $344 per crop acre compared to $237 on all farms (Tables 23and 25).
Production Performance: High profit dairies marketed about 5,200 more LB of milk per cowand had larger herds (73 Vs 54 cows per herd). Minnesota studies showed that with goodcost control and balanced management, returns to labor and management increased by $0.30to $0.50 per cwt. of milk for each additional 1,000 LB of milk produced per cow. Milk andfeed prices will affect this return. Dairy farms when compared to all farms had cropperformance per acre yields: corn grain, 113 Vs 125 Bu; soybeans, 37 Vs 38 Bu; corn silage,14 Vs 15 ton; alfalfa 3.2 Vs 2.8 tons. Land rent paid was $56 per acre for dairy farmscompared to $72 for all farms (Table 36).
The summary shown in Tables 37 through 39 was developed by the author to reflect morecurrent Minnesota dairy farm economic information than the 1996 summary data abovewhich has more detail. This summary is consistent with previously referenced studies ondairy profitability from other states and previous years. Higher levels of profitability (netfarm income) are an evident reflection of relatively high milk prices and relatively lowfeed prices enjoyed in 1998 and 1999. Milk produced per cow also increased.
Table 37 shows that about three quarters of all dairy sales are coming from specializeddairy farms (those with over 70 percent of gross sales coming from milk and dairyanimals). This is a greater degree of specialization than for swine, where about half camefrom more diversified operations.
Table 40. Dairy Farms as a Percentage of All MnSCU-FBMA Farms, 1996-99.
1996 1997 1998 1999(number)
Total farms 2,730 2,703 2,577 2,721Dairy farmsa 663 529 567 533
Dairy farms as a percentage of all farms 24% 20% 22% 20%(millions)
Dairy sales on all farms $156 $136 $169 $175Dairy sales on dairy farms $119 $96 $137 $133
Dairy farm share of all dairy sales 76% 71% 81% 76%
Table 38 shows whole-farm financial results for the specialized dairy farms in thedatabase. The worst of the four years was 1997 when net farm income declined 25percent from a year earlier, but net farm income averaged nearly the same over the fouryears as for the swine farms ($45,658 compared to $44,255) and was less variable (referback to Table 29). Dairy farm returns on assets and on equity were higher on average for
Section V-1 page 238
swine, and the dairy farms ended with a lower debt-to-asset ratio and better liquidity(higher current ratio and term debt coverage ratio). Non-farm income has remainednearly constant on the dairy farms, in contrast to the sharp increase on the swine farms.
Table 39 attempts to address the issue of economies of size in dairying by summarizingthe dairy enterprise costs and returns by size over the four years in a format similar to thatused for the swine enterprises. The number of dairy enterprises has been declining ineach of the size groups up to 100 cows. The enterprises in the 101-200 cow group andthe 201-500 cow group increased over the four years.
The question of whether systems of dairying based on grazing can be competitive withconfinement operations relying totally on harvested feeds is of considerable policyinterest. The first five columns include a small number of operations that indicated thatthey used rotational grazing. Those grazing operations are also summarized separately inthe far-right column. The grazing dairies averaged 48 cows, and the majority fell in the1-50 cow group with a few in the range of 51 to 100 cows. Net return per cow waspositive in all size groups, and did not increase with size beyond the 51-100 cow size. The grazing dairies' net return per cow was less than the average for all sizes and slightlyless than for all in the 1-50 cow size. Experts familiar with the dairy industry report thatthere are a few, larger grazing-based dairy operations in the state that have herds ofseveral hundred cows. Anecdotal information is that these larger grazing-basedoperations are proving to be as profitable as similar-sized confinement operations. Notenough of these larger grazing dairies participate in the farm business summary programsto do a separate set of averages for them, however, so the accuracy of those anecdotalreports can not be confirmed.
It is apparent that the largest group (201-500 cows) does not include several of the state'slargest dairies. Several dairies with over 500 cows that have been recently beendeveloped in the state, with a few having over 1,000 cows. These large dairies typicallyuse private proprietary services for their accounting rather than participating in the public-sector farm business summary programs. It is evident from this summary thatproductivity, cost control, capital efficiency, and herd size are factors affecting thefinancial performance of dairy farms. The higher depreciation and interest expenses percow suggest the herds in the two largest categories are in a period of expansion whichtypically increases production costs until the expanded operations have stabilized.
"Estimated labor hours" are shown in table 39. There is a marked improvement in laborefficiency as size increases, with labor per cow declining from 47 hours in the 1-50 cowgroup to 30 hours at 201-500 cows. As indicated above, these labor estimates aregenerally regarded as not being very precise because producers do not usually keeprecords on how much time is spent on different enterprises. The labor estimates arenevertheless used in the tables because their use make it possible to standardize thereturns numbers to an hourly basis that the general public can relate to non-farmemployment. "Labor & mgmt charge" is the share of the operator's labor andmanagement opportunity cost that is allocated to the enterprise. That number is added tothe hired labor expense to arrive at a total labor and management charge. The total labor

Section V-1 page 239
and management charge is then divided by labor hours to arrive at an hourly "hired andoperator labor & mgmt charge per hour" which represents the hourly rates that theoperators felt their time was worth plus what they paid to hired labor. If the enterpriseearned more than this amount, then the "est. return over labor & mgmt charge" line ispositive. A negative indicates that the enterprise was not able to return what theoperator's time was worth.
The next-to-bottom line adds the hired labor expense and operator labor and managementcharge back in to arrive at a net return without considering any labor cost. The bottomline then is calculated by dividing that net return by estimated labor hours to arrive atwhat the enterprise earned per hour of labor. The charge for hired labor plus operatorlabor and management, and the net returns per hour both increased with size. Net returnsper hour varied from $11.21 for the smallest size to $24.20 for the largest. The grazingdairies earned less per hour than the overall averages.
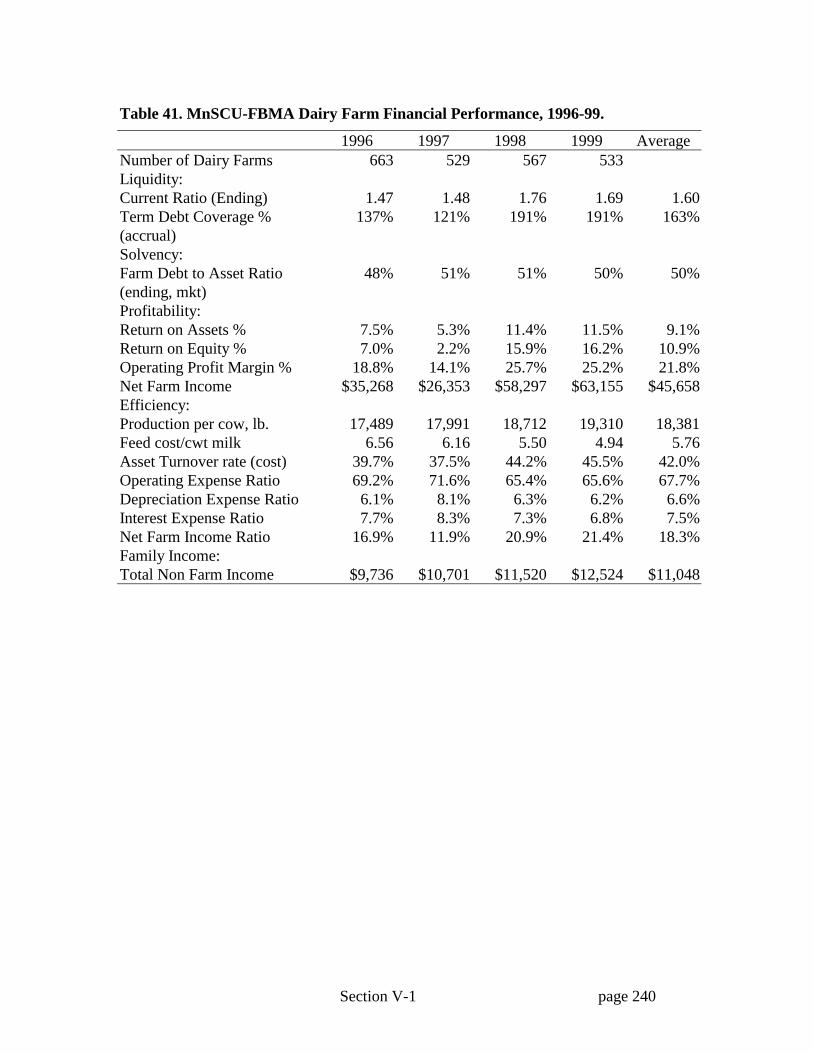
Section V-1 page 240
Table 41. MnSCU-FBMA Dairy Farm Financial Performance, 1996-99.
1996 1997 1998 1999 AverageNumber of Dairy Farms 663 529 567 533Liquidity:Current Ratio (Ending) 1.47 1.48 1.76 1.69 1.60Term Debt Coverage %(accrual)
137% 121% 191% 191% 163%
Solvency:Farm Debt to Asset Ratio(ending, mkt)
48% 51% 51% 50% 50%
Profitability:Return on Assets % 7.5% 5.3% 11.4% 11.5% 9.1%Return on Equity % 7.0% 2.2% 15.9% 16.2% 10.9%Operating Profit Margin % 18.8% 14.1% 25.7% 25.2% 21.8%Net Farm Income $35,268 $26,353 $58,297 $63,155 $45,658Efficiency:Production per cow, lb. 17,489 17,991 18,712 19,310 18,381Feed cost/cwt milk 6.56 6.16 5.50 4.94 5.76Asset Turnover rate (cost) 39.7% 37.5% 44.2% 45.5% 42.0%Operating Expense Ratio 69.2% 71.6% 65.4% 65.6% 67.7%Depreciation Expense Ratio 6.1% 8.1% 6.3% 6.2% 6.6%Interest Expense Ratio 7.7% 8.3% 7.3% 6.8% 7.5%Net Farm Income Ratio 16.9% 11.9% 20.9% 21.4% 18.3%Family Income:Total Non Farm Income $9,736 $10,701 $11,520 $12,524 $11,048

Section V-1 page 241
Table 42. Dairy Enterprise Costs and Returns by Size, Average 1996-99
Number of CowsAll 1-50 51-100 101-200 201-500 Grazing
Number of farms:1996 840 370 367 84 19 221997 721 307 314 76 23 171998 682 279 287 86 29 191999 676 253 287 100 33 13
Average number of cows 73 38 68 132 290 48Milk produced per cow 18,376 16,561 18,192 19,178 19,950 15,158Average milk price (per cwt.) $ 14.54 $ 14.27 $ 14.46 $ 14.69 $ 14.86 $ 14.38Feed cost/cwt milk 7.57 7.56 7.52 7.70 7.56 5.81 ($ per cow)Gross return $ 2,505 $ 2,217 $ 2,469 $ 2,641 $ 2,776 $ 2,054Hired labor 128 39 86 168 271 46Depreciation 97 81 94 101 118 79Interest on debt 120 103 109 118 164 93Total expenses per cow $ 1,989 $ 1,739 $ 1,906 $ 2,112 $ 2,324 $ 1,586
Net return $ 516 $ 479 $ 563 $ 529 $ 452 $ 468Estimated labor hours 39 47 39 36 30 47Labor & mgmt charge $ 190 $ 267 $ 201 $ 157 $ 107 $ 245Total of hired labor expense and
labor and management charge $ 318 $ 306 $ 286 $ 325 $ 378 $ 292
Hired and operator labor & mgmtcharge per hour
8.16 6.57 7.27 9.11 12.65 6.25
Est. return over labor & mgmtcharge
$ 326 $ 212 $ 362 $ 372 $ 345 $ 223
Net return w/o labor $ 644 $ 518 $ 649 $ 698 $ 723 $ 514Net return/hour $ 16.51 $ 11.21 $ 16.69 $ 19.53 $ 24.20 $ 11.01

Section V-1 page 242
The number of milk cows in Minnesota and the number of dairy farms by herd size are shown inTables 40 and 41. The actual numbers as reported by the USDA National Agricultural StatisticsService are shown for 1993 through 1999. Hammond used a Markov chain technique to projectthe trend out from 1998 to the year 2004, based on the assumption that the probability ofincreasing or decreasing numbers in each size group is the same as observed for the changes from1996 to 1997. This also implies that the factors causing the changes: milk prices, demands formilk products, adoption of improved milk production technologies and other determinants ofchanges in industry structure will, on average, continue to impact as they did for 1996-97. The1997 data was the latest available when Hammond did the projections. The actual 1998 and 1999data has since been added as a way of gauging the accuracy of the earlier projections. The rate ofstructural change appears to have slowed down in 1998 and 1999 compared to 1997. Milk priceswere lower in 1997 (Minnesota average $13.16 per hundredweight all milk price) than in 1996($14.60 average), but then were generally higher throughout 1998. the Minnesota price peakedout at $18.99 in December before retreating to average $13.99 for calendar year 1999. Milkprices have continued to decline, reaching $12.20 in November 2000 (Agricultural Prices variousissues). The more favorable milk prices in 1998 may have resulted in less economic pressure toeither exit the industry or to maintain family income by expanding, two actions which wouldhave been reflected in this data. The drop in milk prices in 1999 and 2000 may force more rapidchange like that seen in 1997. The survivor technique applied to Table 41 indicates that theminimum sized dairy operation required to be economically viable is at least 100 cows, becausenumbers in the size classes less than 100 are clearly declining.
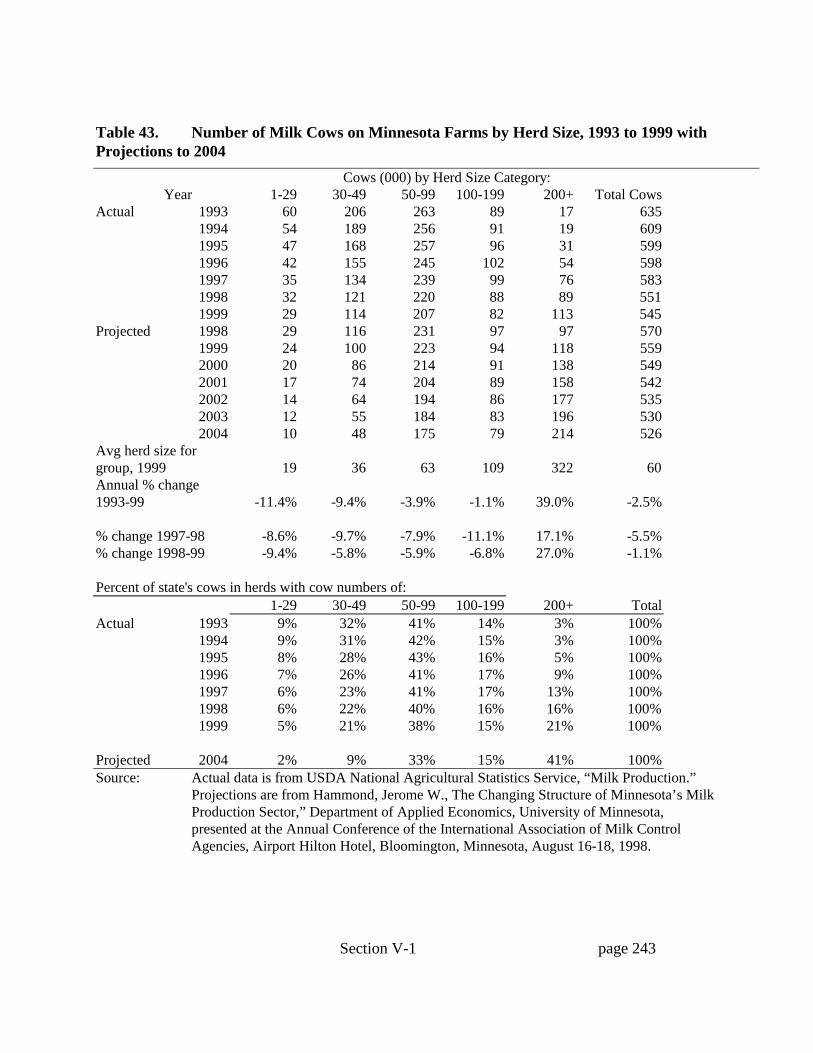
Section V-1 page 243
Table 43. Number of Milk Cows on Minnesota Farms by Herd Size, 1993 to 1999 withProjections to 2004
Cows (000) by Herd Size Category:Year 1-29 30-49 50-99 100-199 200+ Total Cows
Actual 1993 60 206 263 89 17 6351994 54 189 256 91 19 6091995 47 168 257 96 31 5991996 42 155 245 102 54 5981997 35 134 239 99 76 5831998 32 121 220 88 89 5511999 29 114 207 82 113 545
Projected 1998 29 116 231 97 97 5701999 24 100 223 94 118 5592000 20 86 214 91 138 5492001 17 74 204 89 158 5422002 14 64 194 86 177 5352003 12 55 184 83 196 5302004 10 48 175 79 214 526
Avg herd size forgroup, 1999 19 36 63 109 322 60Annual % change1993-99 -11.4% -9.4% -3.9% -1.1% 39.0% -2.5%
% change 1997-98 -8.6% -9.7% -7.9% -11.1% 17.1% -5.5%% change 1998-99 -9.4% -5.8% -5.9% -6.8% 27.0% -1.1%
Percent of state's cows in herds with cow numbers of:1-29 30-49 50-99 100-199 200+ Total
Actual 1993 9% 32% 41% 14% 3% 100%1994 9% 31% 42% 15% 3% 100%1995 8% 28% 43% 16% 5% 100%1996 7% 26% 41% 17% 9% 100%1997 6% 23% 41% 17% 13% 100%1998 6% 22% 40% 16% 16% 100%1999 5% 21% 38% 15% 21% 100%
Projected 2004 2% 9% 33% 15% 41% 100%Source: Actual data is from USDA National Agricultural Statistics Service, “Milk Production.”
Projections are from Hammond, Jerome W., The Changing Structure of Minnesota’s MilkProduction Sector,” Department of Applied Economics, University of Minnesota,presented at the Annual Conference of the International Association of Milk ControlAgencies, Airport Hilton Hotel, Bloomington, Minnesota, August 16-18, 1998.
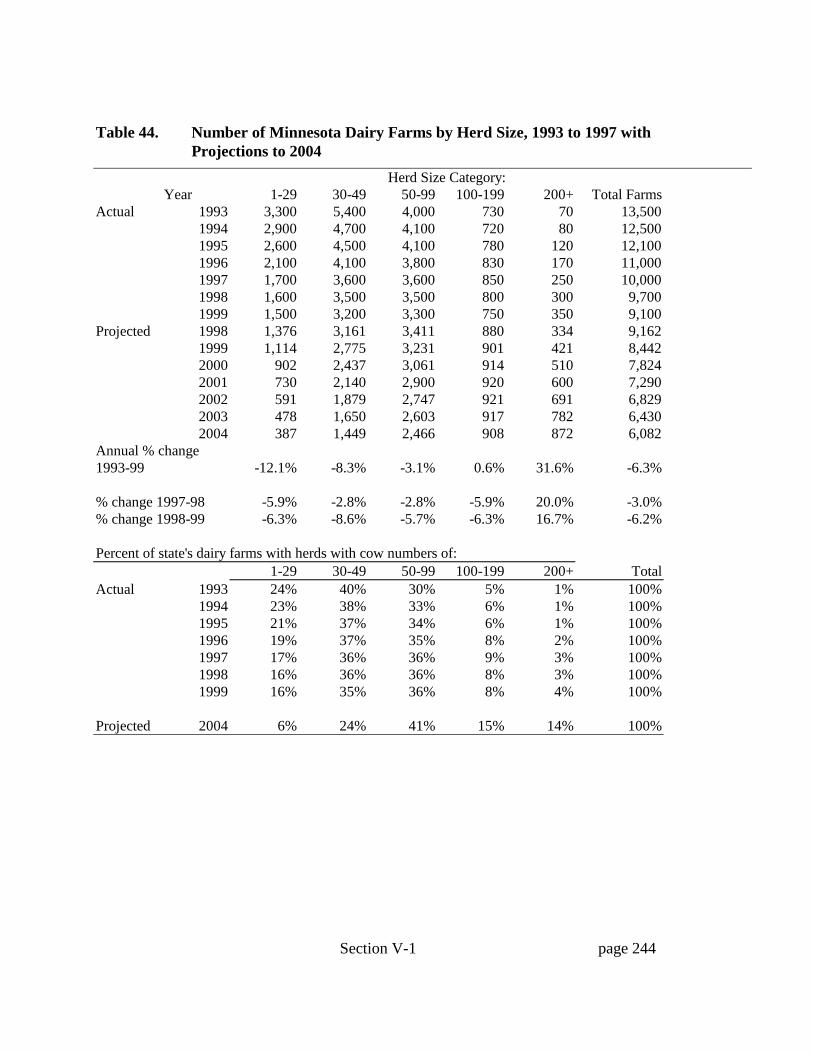
Section V-1 page 244
Table 44. Number of Minnesota Dairy Farms by Herd Size, 1993 to 1997 withProjections to 2004
Herd Size Category:Year 1-29 30-49 50-99 100-199 200+ Total Farms
Actual 1993 3,300 5,400 4,000 730 70 13,5001994 2,900 4,700 4,100 720 80 12,5001995 2,600 4,500 4,100 780 120 12,1001996 2,100 4,100 3,800 830 170 11,0001997 1,700 3,600 3,600 850 250 10,0001998 1,600 3,500 3,500 800 300 9,7001999 1,500 3,200 3,300 750 350 9,100
Projected 1998 1,376 3,161 3,411 880 334 9,1621999 1,114 2,775 3,231 901 421 8,4422000 902 2,437 3,061 914 510 7,8242001 730 2,140 2,900 920 600 7,2902002 591 1,879 2,747 921 691 6,8292003 478 1,650 2,603 917 782 6,4302004 387 1,449 2,466 908 872 6,082
Annual % change1993-99 -12.1% -8.3% -3.1% 0.6% 31.6% -6.3%
% change 1997-98 -5.9% -2.8% -2.8% -5.9% 20.0% -3.0%% change 1998-99 -6.3% -8.6% -5.7% -6.3% 16.7% -6.2%
Percent of state's dairy farms with herds with cow numbers of:1-29 30-49 50-99 100-199 200+ Total
Actual 1993 24% 40% 30% 5% 1% 100%1994 23% 38% 33% 6% 1% 100%1995 21% 37% 34% 6% 1% 100%1996 19% 37% 35% 8% 2% 100%1997 17% 36% 36% 9% 3% 100%1998 16% 36% 36% 8% 3% 100%1999 16% 35% 36% 8% 4% 100%
Projected 2004 6% 24% 41% 15% 14% 100%

Section V-1 page 245
One final comment on the study questions is that the introduction to topic E mentions economiesof scale and government policies, but does not explicitly ask the question of how governmentpolicies, and especially federal commodity programs, may influence economies of scale or have a"large farm bias." There is an extensive body of literature on this topic, and we will not addressit in depth but rather just mention that the issue exists. The question is focused mainly on themajor crops and to some extent dairy, rather than on other livestock and poultry, because thecommodity programs do not directly cover other livestock and poultry. One book that focusedon the debate leading up to the 1996 farm bill was (Cochrane and Runge 1992), but there aremany other publications as well.
QUESTION E2. HOW IS THE PROFITABILITY AND ECONOMIC VIABILITY OFFARMS AND FIRMS AFFECTED BY DIFFERENT PRODUCTION AND MARKETINGARRANGEMENTS? WHAT ARE THE COMPARATIVE INTERNAL ECONOMICCOSTS AND BENEFITS OF VARIOUS LIVESTOCK PRODUCTION SYSTEMS?
Question E2a. How is the profitability and economic viability of farms and firmsaffected by different production and marketing arrangements?
An overview of farmers' use of marketing and production contracts as provided in the 1993USDA Farm Costs and Returns Survey is provided in (Farmers' Use of Marketing andProduction Contracts, Agricultural Economic Report No. 747 1997). Figures on the percentageof pork producers utilizing various types of production and marketing contracts in 1997, andperceived contract advantages and disadvantages are available in (Lawrence et al. undated). Anupdate on marketing contracts is available in (Hog Marketing Contract Study, University ofMissouri and National Pork Producers Council 1999).
There are obviously many different production and marketing arrangements in use in livestockproduction. In responding to this question with respect to an individual livestock operation, it isnecessary to make assumptions about the rest of the industry. A bit of Economics 101 -Generally speaking, at any point in time in any industry made up of more than one firm, thedifferent firms operate at different levels of efficiency, profitability, and risk. They compete, andover time the more profitable firms expand and drive down prices while the less profitable firmsshrink or gradually leave the industry. This scenario assumes that all firms produce an identical,generic commodity.
The impact of different production and marketing arrangements on the profitability and economicviability of a particular, representative farm will depend on how broad the adoption of thearrangement is in the rest of the industry. Increasingly, it is becoming more feasible to produceagricultural products with specific characteristics which may bring different prices whenmarketed though “niche” marketing channels. Over time, livestock operations, like otherbusinesses, tend to adopt the most promising new arrangements. The “treadmill hypothesis”states that the early adopters reap higher profits for awhile when they adopt, but when the rest ofthe industry adopts then profits return to normal levels. Any particular production or marketing

Section V-1 page 246
arrangement aimed at a niche market may provide high returns to the first few farms that get intoit, but the market may become saturated quickly so that later adopters may suffer losses under thesame arrangement (Cochrane 1979), pp. 389-390.
Changes in hog procurement practices are causing a number of problems for farmers whocontinue to rely on the spot market. Some of these problems were identified by 28 hog farmersin Minnesota, Iowa and South Dakota who were interviewed in 1997. The main problemsidentified were ((Land Stewardship Project 1999)):
• delays of several days until packers can accept delivery of animals, rather than the previoussituation where farmers could call and deliver their hogs the same day,
• closing of local buying stations, requiring greater travel distances,
• perceived price reductions relative to what large producers were receiving (it is not clear whatinformation about large producers’ prices they were using to make this comparison, or howaccurate their information was), and
• missing out on quantity premiums or other “special deals” that large producers werereceiving.
Much of the debate about the fairness of long-term hog marketing contracts revolves aroundwhether quantity premiums paid to producers under long-term marketing contracts or for largerspot market lot sizes are unreasonable compared to what is paid for smaller spot sales (see, forexample section V of Land Stewardship Project). “Reasonableness” relates to how suchpremiums compare to differences in packers’ procurement and operating costs. Tworelationships that have not been quantified very well in past research include: 1) how packers’hog procurement costs vary with lot size (number of animals involved in the individualtransaction), and 2) how much slaughter plant per unit operating cost increases when the plant isoperated below or above optimum rates on any given day. This may be an area that can only beeffectively researched using data obtained under the auspices of the USDA Packers andStockyards Administration’s or other government agency’s subpoena power.
The increased use of contracts together with more concentrated ownership of germplasm hasraised concerns of a possible shift in bargaining power away from producers and their receiving asmaller share of revenue from production (Harl undated). The changes and driving forces arewell laid out in this paper, although as discussed in the introduction, like any predictions it is upto readers to judge the likelihood of their coming to pass.

Section V-1 page 247
Swine Farm Profitability
The more major agricultural commodities also go through production and price cycles, but over alonger time period. Hogs, for example, tend to follow a cycle of about four years. Anarrangement that appears profitable when prices are at a high point in the cycle may not looknearly as profitable at the low point.
Less efficient arrangements may have negative impacts on profitability in an economicenvironment where more efficient arrangements are competing. The same, less efficientarrangements may provide adequate profits in a different economic environment where the moreefficient arrangements are restricted by government policies, provided that the policies areadopted over a large enough geographic area that competing products cannot be imported. Thisrestriction scenario does not specify what the rationale might be for such restrictions. Therestrictions could be instituted on economic, environmental, animal welfare, or other grounds.
Marketing arrangements generally address two goals: enhancing the expected price, andreducing risk. The major types of livestock marketing arrangements include the traditional dailyspot markets, futures and options trading though the established futures markets, and marketingcontracts with processors that may extend for periods of a few months up to five years or more. In the case of pork, marketing contracts may be fixed price, fixed basis, formula price, cost plus,price window, and price floor. The price established under the contract may be a final price, orthe contract may be of a cash flow assistance nature in which case the final price may be basedon the spot market price with the difference between the spot price and the contract price being aloan balance kept in a ledger account (Buhr Undated). Direct marketing to local consumers isanother arrangement that is being utilized by some producers.
We assume that we are mainly interested in how different production and marketingarrangements might affect profitability in the future, rather than just in the past. Prices fluctuatedaily. Any comparison of marketing arrangements must take into consideration this pricevariability. Buhr compared three types of hog marketing contracts and found that when averagedout over three years, the contract price averaged from 98 to 104% of the spot market price (BuhrUndated). Simply comparing the prices that a representative farm would have receive on anygiven day, or even in any one year in the past, under different marketing arrangements will notnecessarily predict how the arrangements will perform in the future.
One way to address the price variability issue is to look at processing costs. At least twoassumptions must be made: 1) the retail price is constant, and 2) packers will compete and passany processing cost savings on to farmers. If we accept these two assumptions, then theimplication is that a marketing arrangement that reduces processing costs will improve farmprofitability compared with a marketing arrangement that involves higher processing costs. Overthe long run, however, assumption (1) that the retail price is constant, is probably not valid. Overthe long run, economic theory suggests that any arrangement that increases farm profits above

Section V-1 page 248
normal levels will result in expansion and a farm-level supply increase. In order to sell theincreased production to consumers, it will probably be necessary for prices to decline which willreturn profits to normal levels. The validity of assumption (2) depends on the relative elasticitiesof demand at the farm-packer and packer-retailer levels.
Martinez and others used a simulation model to estimate the changes in hog prices that wouldresult from a packer purchasing hogs under various levels of marketing contracts or integrationwhich specify genetics and market weight, compared to buying on the spot market (Martinez etal. 1998). Also see (Martinez 1997) and (Martinez 1998). They estimated shifts in retail demandrelated to increased leanness, shifts in retail supply related to increased leanness, and hogacquisition costs. They assumed a packer savings of $6.32/head by slaughtering a hog that is19% leaner than average, for a potential marketing cost savings of 2.86%. They assumed thatcontracting or integration would reduce hog purchasing costs by $0.48/head. They also assumedthat consumers would be willing to pay 4.3% more for pork that is 10% leaner. They look atseveral scenarios of 11%, 29% and 100% contracting or integration, and with or withoutconsumer demand changes. They find that in the short run (one year), hog prices would increasefrom 0.2 to 2.0 percent at 29% contracting or integration. After more than five years, however,hog prices would return to normal while hog production would increase by 0.2 to 1.7% at 29%contracting or integration. Higher or lower levels of contracting or integration would result inlarger or smaller impacts.
Poultry Farm Profitability
How have contract livestock and poultry producers fared financially in recent years? Contractpoultry production has had a reputation in recent years of being a fairly low-return enterprise. Empirical evidence on the financial performance of farms with broiler contracts is provided in arecent USDA report. Broiler farms with sales of $50,000 are compared with 1) other farmsgrowing just crops and 2) farms with other livestock but not contract broilers. The report isbased on 1995 data from the Agricultural Resource Management Study (formerly known as theFarm Costs and Returns Survey (Perry et al. 1999). It also discusses the types of contractualarrangements in use. Broiler farms were in fair financial condition in 1995, with net farm incomeof $15,969. They had less invested in the business than other farms, and worked fewer hours onthe farm. The broiler farm net farm income was less than half of the average $38,966 earned byother farms. One question the analysis does not address is whether the broiler farms would haveearned more if they had been engaged in some other enterprises, or whether they chose broilers inthe first place because their resources were too limited for other enterprises. The broiler farmsaveraged $392,353 in farm equity compared with $673,155 for other farms.
One interesting fact identified in the study is that, on average, spouses were more heavilyinvolved in decision-making and management, and worked more hours, on broiler farms than onother farms with comparable sales. Three quarters of the broiler producers said that their majoroccupation was farming. These operators' household income was 78 percent of the average U.S.household's income, largely due to lower off-farm income. There does not seem to be anycomparable financial analysis of other commodities' contract production done on a national basis.

Section V-1 page 249
Question E2b. What are the comparative internal economic costs and benefits ofvarious livestock production systems?
Alternative Swine Systems
Basic information about conventional swine production systems, including some information oninvestment and profitability, is available in (Pork Industry Handbook (collection of individualfact sheets) fact sheets individually dated). There is a great deal of interest in alternative swinehousing and production systems, especially hoop barns, pasture farrowing, and the Swedish deep-bedded system. (Honeyman 1996) lays out the requirements for a sustainable swine productionsystem, with characteristics such as industry structure, barriers to entry, diversity, utilization ofmanure and dead pigs, and pork quality. He lays out four levels of issues, from the farm, therural community, the society or consuming public, and the ecosystem or environment. Anotheroverview of alternative swine systems is provided in (Field Notes No. 2, Swine Production 99).
Two sources of descriptive information about the Swedish deep-bedded system are (Honeyman1995) and (Halverson et al. 1997). Neither of these publications includes an economiccomparison of the Swedish system versus conventional confinement systems.
Dutch swine researchers have studied different housing systems for pregnant sows at theRosmalen Research Institute for Pig Husbandry. (Backus and et al. 1997) is a summary ofseveral research projects conducted between the late 1980s and 1994. Generally, they found thattechnical performance of group-housed dry sows was similar to sows housed individually ingestation stalls. They conclude that group housing is economically feasible, but will requiremore management skill by the farmer compared to individual housing.
Producer-oriented planning information on hoop barns is provided in (Hoop Structures for SwineHousing, AED-41 1997). According to their economic analysis, hoop barns as swine housing donot have a great economic advantage or disadvantage compared to conventional confinementbuildings. Hoop barns involve a lower initial investment but higher operating costs, and littlehistory exists to show how reliable and durable they will be.
One budget analysis of swine production systems under Minnesota conditions is (Lazarus et al.1991). The purpose of this study was to evaluate the potential economic impacts inrepresentative swine facilities of adopting production systems and equipment which addressselected animal welfare concerns. Specific systems studied included:
• conventional, confinement breeding herd housing and finishing
• outdoor farrowing, one litter/year and two litters/year, with confinement finishing

Section V-1 page 250
• gestation stalls which allow sows to turn around and move more than conventional stalls
• electronic sow feeders with pen gestation
• straw-bedded, solid-floored sow housing with individual farrowing pens
• sow-pig nursery where weaning is delayed and pigs are moved less frequently
• marketing lighter-weight, intact boars rather than castrating
All of the alternative systems were found to reduce profitability compared to conventionalconfinement systems to some degree. The electronic sow feeder system and the turnaroundgestation stalls had little impact on profitability, while the outdoor farrowing and straw beddedsystems increased costs by about $4-5.00 per hundredweight of pork produced. As in any proforma budget analysis, the study was based on expert opinion about hypothetical situations,because few or no commercial farms were using these systems at the time, so actual performancemay be different from what was projected.
There is considerable interest in the economic viability of alternative swine production systemsthat require less investment, or offer improved animal welfare or working conditions thatare different from those in environmentally controlled confinement buildings. A projectcurrently underway under the University of Minnesota’s Minnesota Institute forSustainable Agriculture is intended to produce case studies and business record analysesof a set of Minnesota swine operations that are using alternative systems such as hoopbarn finishing or pasture farrowing. The project goal for 1999 is to identify the farms andhelp them to standardize their financial records in a form that can be used for comparativeanalysis, probably using the University of Minnesota’s FINPACK farm financial analysissoftware through the Minnesota State College University’s farm business managementprogram. It will probably take three or four years of data to produce an adequate pictureof the long run comparative economics of alternative systems, so useable results willprobably not be available until early in 2004.
Oltjen and Beckett discussed the valuable role ruminants serve in sustainable agriculturalsystems. They are useful in converting vast renewable resources from rangeland, pasture, andcrop residues or other by-products into food edible for humans. Further, ruminant livestockproduction is consistent with proper agronomic practices in which forages are grown on 25% ofarable land to minimize soil and water erosion. They point out that net returns from of humanlyedible energy and protein are dependent on the production system used. Production efficiencyhas varied from 96% to 276% on humanly consumable protein for dairy. Beef productionefficiency is highly dependent on time spent in the feedlot. Their protein efficiencies range from28% to 59%, and energy efficiency from 52 to 104%. They indicate the protein from ruminantlivestock production is of higher quality with greater biological value. (Oltjen and Beckett 1996)

Section V-1 page 251
Alternative Dairy Systems
The most popular alternative dairy system in Minnesota is one that relies on grazing to varyingdegrees as opposed to conventional systems that rely totally or mainly on mechanically harvestedfeeds. Table 41 above summarizes financial performance of grazing dairies in the MnSCU-FBMA database between 1996 and 1999. The grazing dairies had smaller herd sizes andproduced less milk per cow, but also incurred lower feed costs and total expenses per cow. Thegrazing dairies earned less per hour than the overall averages, however.
Cornell workers reported on the financial performance of 253 specialized dairy farms in NewYork state in 1997. These farms averaged 190 cows with 20,651 pounds of milk per cow sold.Net farm income averaged $39,928 per farm with a rate of return on assets of 3.2%. Differencesin profitability varied from 15% for the top 10% to –241% for the lowest 10%. Farms adoptingbovine somatotropin experienced greater increases in production, had larger herds, and weremore profitable than herds not using this technology. Farms adopting rotational grazinggenerally produced less milk per cow than non-grazing farms, but had somewhat lower costs ofproduction and higher profitability. Large freestall farms averaged the highest milk output percow and per worker, with the lowest cost of production and investment per cow, and the greatestreturns to labor and management. Farms milking three times per day produced more milk andwere $.09 per cwt less than herds milking twice daily. (Knoblauch 1998)
Penn State workers reported findings on the performance of 53 representative randomly selecteddairy farms in 1993. They found moderate intensive grazing achieved a $129 per acre return tooperator labor and management compared to $20 and $58 returns for all hay and maizeenterprises, respectively. Debt per cow was substantially higher for farmers increasing rotationalgrazing intensity. They indicated that pasture acres per cow, high debt to assets, and negativecash flows provided an important motivation to increase grazing intensity. A drawback ofintensive grazing was the likelihood of lower milk production than with confinement feedingwhile the main economic benefit was a reduction of costs associated with forageproduction.(Hanson et al. 1998)
Minnesota workers compared milk production and profitability for confinement feeding androtational grazing with Guernsey and Guernsey X Holstein cows grazing perennial rye grasspastures from mid-May to October. Over the two year period confined cows produced 7% moremilk with similar fat percent compared to the grazed animals. Body weight change and healthwere similar for both groups. Net return per cow averaged $64 greater for the rotational grazedgroup because of lower cost for feeding, facilities, equipment, and labor. They point out thatstored feeding is still required from late autumn to early spring in the North USA. (Rust et al.1995) Minnesota workers surveyed 29 dairy farms using management intensive grazing practicesthrough personal interviews. The respondents cited a change in the use of their time: reducedtime doing chores, baling hay, repairing equipment, planting, harvesting, feeding and manurehandling, and which allowed more time for duties of managing the pastures and the business.These farms reported reduced input purchases such as feed and fuel. (Loeffler et al. 1996)

Section V-1 page 252
Wisconsin workers reported survey results of almost 1200 dairy farms in 1995. About half of thesurveyed farms were confinement operations that used no pasture forage. About 35% of thefarms rely on some pasture to some degree (non-intensive), and 14% were actively pursuingmanagement intensive rotational grazing of some type for a portion of their forage needs. Of thetotal farms surveyed, about 8% used pasture as their primary source of total feed during thegrazing months. The heaviest concentration of grazers were in three Southwest Wisconsincounties. The authors note the highest adoption rates to be in areas of lower farmland values, butalso suggested that social, and institutional factors unrelated to the agronomic and socioeconomiccharacteristics of the region may have influenced the higher adoption rates. Adopters had smallerherds, less likely to use total mixed rations, rBGH, sell grade A milk, have milking parlors, oruse farm business management tools such as DHI records. Grazers spent more total labor hoursper cow, had lower farm income, lower capital investments, and higher off farm income.(Jackson-Smith et al. 1996)
Cornell workers attempted to explain why the characteristics of dairy farmers in two differentcommunities with similar resources but quite different in performance may take on certainpatterns. This was a study of the human capital component of dairying. Farmers in the twocommunities were following the same path toward optimization of milk production but receivingvery different results. The high production community was more advantageous for formaleducation, access to markets, and proximity to an urban center. Among the differences found,farmers in the high production community used more techniques associated with goodmanagement practices, and they were better educated. (Cruise and Lyson, Cornell). The work isconsistent with others that identify the importance of human capital, and management skills inoperation of a successful dairy. ((Center for Epidemology and Animal Health 1996)
USDA-APHIS conducted an extensive national dairy survey covering the major milk producingregions which was intended to monitor dairy health and management practices. The resultscovered herds larger than 30 cows, and reveal management characteristics by herd size andregion. There were several areas of management where differences related to herd size weresmall such as the quality of milk produced and mastitis management control practicesimplemented (Center for Epidemology and Animal Health 1996). There are major differences inthe way manure was handled, stored, and applied to the land. Gutter cleaner use declined andflush systems with recycled water increased in larger herds. More than 90 percent of the herdsover 200 cows used some type of liquid manure storage; primarily either a lagoon or a slurrysystem. Lagoons were more popular in the western states because of greater evaporation frommore arid conditions. Most of the smaller herds handled manure as a solid and were more likelyto spread manure daily during winter months. The practice of incorporating the manure into thesoil within twenty-four hours after land application to minimize odor and nitrogen loss increasedas herd sizes increased.
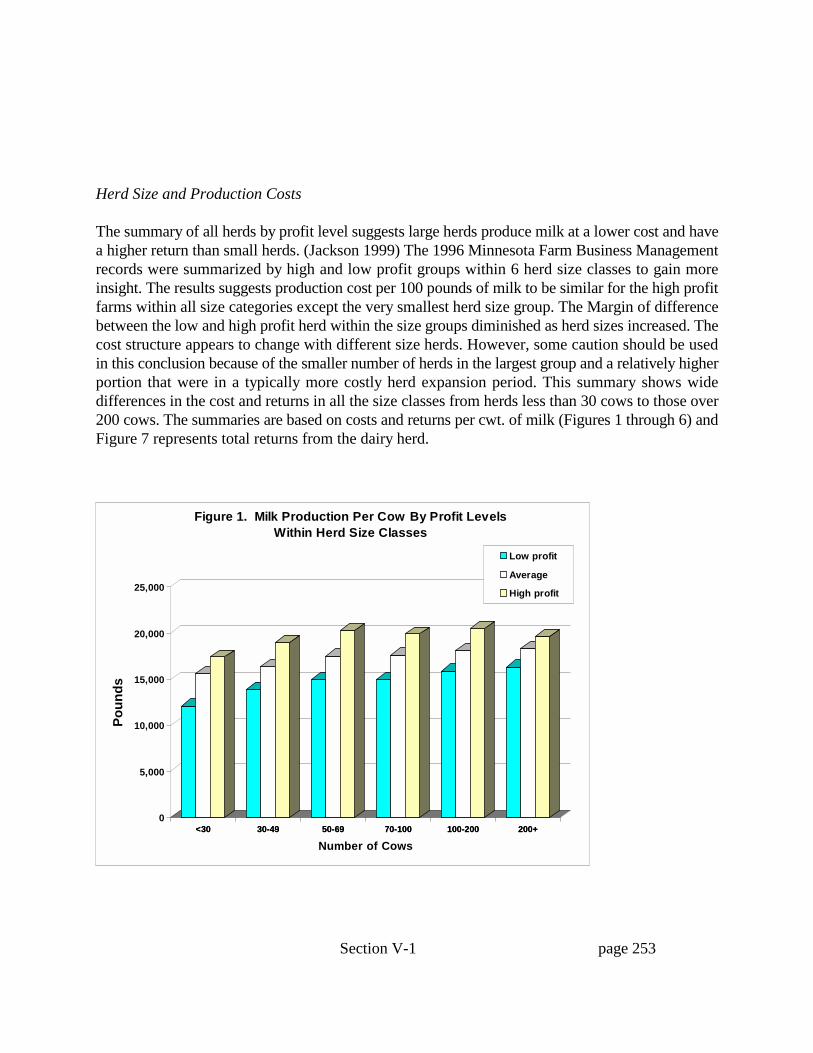
Section V-1 page 253
Herd Size and Production Costs
The summary of all herds by profit level suggests large herds produce milk at a lower cost and havea higher return than small herds. (Jackson 1999) The 1996 Minnesota Farm Business Managementrecords were summarized by high and low profit groups within 6 herd size classes to gain moreinsight. The results suggests production cost per 100 pounds of milk to be similar for the high profitfarms within all size categories except the very smallest herd size group. The Margin of differencebetween the low and high profit herd within the size groups diminished as herd sizes increased. Thecost structure appears to change with different size herds. However, some caution should be usedin this conclusion because of the smaller number of herds in the largest group and a relatively higherportion that were in a typically more costly herd expansion period. This summary shows widedifferences in the cost and returns in all the size classes from herds less than 30 cows to those over200 cows. The summaries are based on costs and returns per cwt. of milk (Figures 1 through 6) andFigure 7 represents total returns from the dairy herd.
<30 30-49 50-69 70-100 100-200 200+0
5,000
10,000
15,000
20,000
25,000
Po
un
ds
<30 30-49 50-69 70-100 100-200 200+
Number of Cows
Low profit
Average
High profit
Figure 1. Milk Production Per Cow By Profit Levels Within Herd Size Classes

Section V-1 page 254
<30 30-49 50-69 70-100 100-200 200+0.00
2.00
4.00
6.00
8.00
10.00
12.00
14.00
16.00
18.00
20.00
$ P
er C
wt
<30 30-49 50-69 70-100 100-200 200+
Herd Size
Low 20%
Average
High 20%
Figure 3. Total Cost Per Cwt By Profit Levels Within Herd Size Classes
<30 30-49 50-69 70-100 100-200 200+0.00
2.00
4.00
6.00
8.00
10.00
12.00
14.00
16.00
18.00
$ P
er C
wt
<30 30-49 50-69 70-100 100-200 200+
Herd Size
Low 20%
Average
High 20%
Figure 2. Gross Income Per Cwt By Profit Levels Within Herd Size Classes
,

Section V-1 page 255
<30 30-49 50-69 70-100 100-200 200+0.00
1.00
2.00
3.00
4.00
5.00
6.00
7.00
8.00
9.00
10.00
$ P
er C
wt
<30 30-49 50-69 70-100 100-200 200+
Herd Size
Low
Average
High
Figure 4. Feed Cost Per Cwt By Profit Levels Within Herd Size Classes
<30 30-49 50-69 70-100 100-200 200+0.00
0.50
1.00
1.50
2.00
2.50
3.00
3.50
$ P
er C
wt
<30 30-49 50-69 70-100 100-200 200+
Herd Size
Low 20%
Average
High 20%
Figure 5. Herd Replacement Cost Per Cwt By Profit Levels Within Herd Size Classes

Section V-1 page 256
<30 30-49 50-69 70-100 100-200 200+-8.00
-6.00
-4.00
-2.00
0.00
2.00
4.00
$ P
er C
wt
<30 30-49 50-69 70-100 100-200 200+
Herd Size
Low 20%
Average
High 20%
Figure 6. Net Return Per Cwt By Profit Levels Within Herd Size Classes
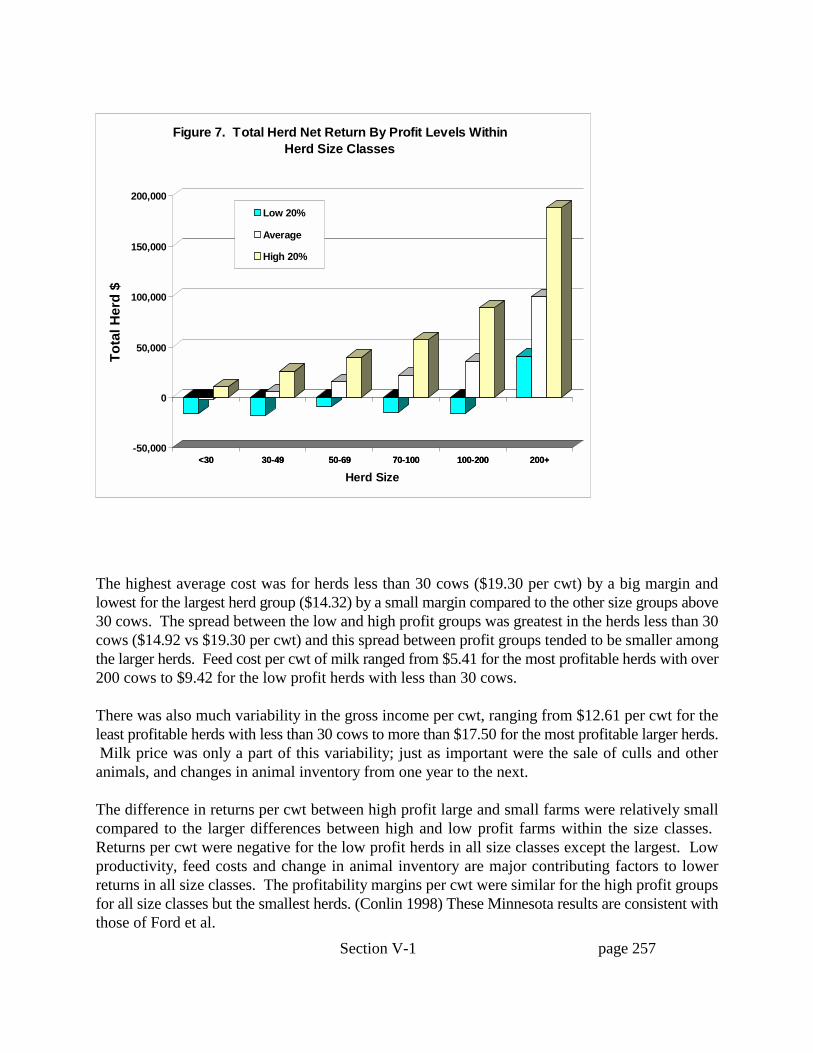
Section V-1 page 257
The highest average cost was for herds less than 30 cows ($19.30 per cwt) by a big margin andlowest for the largest herd group ($14.32) by a small margin compared to the other size groups above30 cows. The spread between the low and high profit groups was greatest in the herds less than 30cows ($14.92 vs $19.30 per cwt) and this spread between profit groups tended to be smaller amongthe larger herds. Feed cost per cwt of milk ranged from $5.41 for the most profitable herds with over200 cows to $9.42 for the low profit herds with less than 30 cows.
There was also much variability in the gross income per cwt, ranging from $12.61 per cwt for theleast profitable herds with less than 30 cows to more than $17.50 for the most profitable larger herds. Milk price was only a part of this variability; just as important were the sale of culls and otheranimals, and changes in animal inventory from one year to the next.
The difference in returns per cwt between high profit large and small farms were relatively smallcompared to the larger differences between high and low profit farms within the size classes. Returns per cwt were negative for the low profit herds in all size classes except the largest. Lowproductivity, feed costs and change in animal inventory are major contributing factors to lowerreturns in all size classes. The profitability margins per cwt were similar for the high profit groupsfor all size classes but the smallest herds. (Conlin 1998) These Minnesota results are consistent withthose of Ford et al.
<30 30-49 50-69 70-100 100-200 200+-50,000
0
50,000
100,000
150,000
200,000
To
tal H
erd
$
<30 30-49 50-69 70-100 100-200 200+
Herd Size
Low 20%
Average
High 20%
Figure 7. Total Herd Net Return By Profit Levels Within Herd Size Classes

Section V-1 page 258
Interpretations of farm level data can provide valuable insights but conclusions are limited by theby the data sample, and wide variability among farms and years. For example the number of herdsin the largest group in the above data was relatively small, 11 herds. Availability of financialperformance of larger Midwest dairies is very limited. There are other data sets that have beencollected within the private sector that are not available in that they are proprietary. More intensestatistical analysis on issues of size and scale efficiencies, alternative dairy farming systems andstrategies to optimize use of resources is needed to provide more conclusive evidence. Developmentof an ongoing program to monitor and provide performance benchmarks for comparisons byproducers would provide a valuable management tool.
The most significant issue is to market enough milk to generate the desired level of family income. Unprofitable farms have significant opportunity to enhance their profit level through improvedmanagement control and increasing productivity. Adding cows to an unprofitable dairy is seldoman effective strategy. The more profitable dairies are the best candidates for increasing family livingthrough increases in cow numbers.
It is useful to compare the discussion in the previous few paragraphs to the discussion of the “L”-shaped cost curve under question E1. Note that the last paragraph focused on income for familyliving, not efficiency or per unit cost.
“This is an important point for two reasons. First, many people assume that thelarger units are needed for efficiency and that to keep the costs of food low farmshave to be big. Second, the current production techniques we employ narrow theprofit margin for the farm. They are getting bigger for the income not to lowercosts of production. Realizing this opens more options for the farmer and societyto pursue if the increase in size is for income not efficiency.” (see reviewercomments)
Many of the already profitable dairies will need to increase herd size to maintain a competitive andviable dairy farm business. Increasing cow numbers in an unprofitable or marginally profitable dairybusiness has a poor chance for success. The profitability problems should be solved first. The abovediscussion based on review of literature and farm financial records.
Many upper Midwest dairy farms are at a crossroads in trying to find better ways to reach their goals. Profitability and family lifestyles are two primary driving forces. The typical upper Midwest dairyfarm is highly diversified in demands for capital, labor and management know-how. All of theseresources are stretched so thinly that it is often difficult to compete. Farm families are looking forways to work smarter, not harder and longer.
Options under consideration include: grazing, expansion, use of consultants, networking with otherfarmers, specialization, contracting, exiting the dairy business, surviving to retirement, etc. In 1994,a University of Minnesota study explored three alternative dairy production systems:
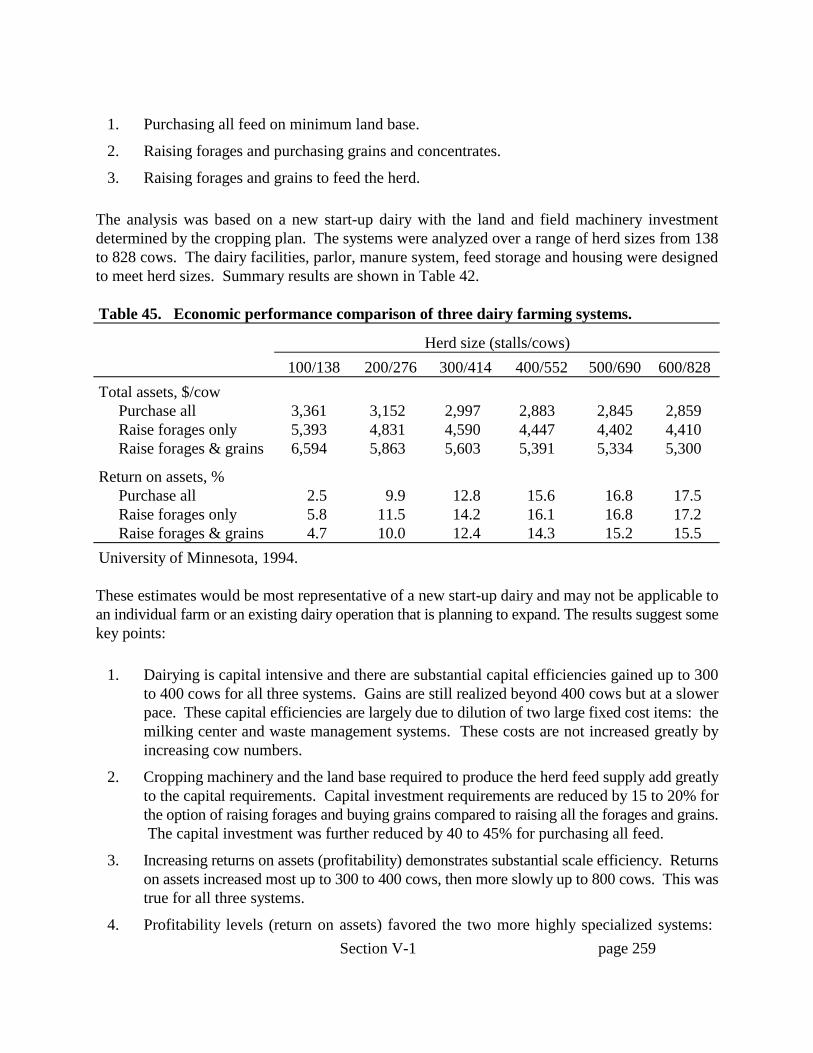
Section V-1 page 259
1. Purchasing all feed on minimum land base.
2. Raising forages and purchasing grains and concentrates.
3. Raising forages and grains to feed the herd.
The analysis was based on a new start-up dairy with the land and field machinery investmentdetermined by the cropping plan. The systems were analyzed over a range of herd sizes from 138to 828 cows. The dairy facilities, parlor, manure system, feed storage and housing were designedto meet herd sizes. Summary results are shown in Table 42.
Table 45. Economic performance comparison of three dairy farming systems.
Herd size (stalls/cows)100/138 200/276 300/414 400/552 500/690 600/828
Total assets, $/cow Purchase all 3,361 3,152 2,997 2,883 2,845 2,859 Raise forages only 5,393 4,831 4,590 4,447 4,402 4,410 Raise forages & grains 6,594 5,863 5,603 5,391 5,334 5,300
Return on assets, % Purchase all 2.5 9.9 12.8 15.6 16.8 17.5 Raise forages only 5.8 11.5 14.2 16.1 16.8 17.2 Raise forages & grains 4.7 10.0 12.4 14.3 15.2 15.5University of Minnesota, 1994.
These estimates would be most representative of a new start-up dairy and may not be applicable toan individual farm or an existing dairy operation that is planning to expand. The results suggest somekey points:
1. Dairying is capital intensive and there are substantial capital efficiencies gained up to 300to 400 cows for all three systems. Gains are still realized beyond 400 cows but at a slowerpace. These capital efficiencies are largely due to dilution of two large fixed cost items: themilking center and waste management systems. These costs are not increased greatly byincreasing cow numbers.
2. Cropping machinery and the land base required to produce the herd feed supply add greatlyto the capital requirements. Capital investment requirements are reduced by 15 to 20% forthe option of raising forages and buying grains compared to raising all the forages and grains. The capital investment was further reduced by 40 to 45% for purchasing all feed.
3. Increasing returns on assets (profitability) demonstrates substantial scale efficiency. Returnson assets increased most up to 300 to 400 cows, then more slowly up to 800 cows. This wastrue for all three systems.
4. Profitability levels (return on assets) favored the two more highly specialized systems:
Section V-1 page 260
purchasing all feed, and raising forages only. The more diversified system of raising allfeeds was the least favorable relative to returns on assets, but still acceptable at larger herdsizes.
Making the leap to a full-fledged modern system is not feasible for many of our current dairy farmbusinesses. The availability of the investment capital needed to move out of the stall barn to amodern freestall system with pit parlor milking in one step requires a major investment of newcapital and additional management competencies. These units have to be large enough to dilute alarge capital cost with enough cows to be profitable. Milking centers with pit parlors and manuresystems are typically the largest fixed cost items in these new systems. A 1994 Minnesota studyshowed 400 to 500 cows were needed to achieve an acceptable level of return on assets of at least12%. Typically, the capital requirements for developing complete new units from the ground up are$1.5 to $2.0 million or $3,000 to near $4,000 per cow. This level of investment may be beyond theavailable loan capital and/or the tolerance for financial risk for many dairy farm families. TheMinnesota study illustrates the impact on the investment per cow if all crops and only forage cropsare raised compared to purchasing all the feed. (Conlin 1998)
Discussion of the Dilemma of Growing Cow Numbers
Most upper Midwest dairies are relatively small herds in stall barns that have reached obsolescence. Modern freestall barns coupled with milking centers are more labor efficient, kinder and gentler onthe backs and knees of milkers, are well ventilated, provide a healthier and more comfortable animalenvironment, are easier to adopt new technologies, have major scale efficiencies in investment percow, and are more flexible for growth options in the future. Finding a way to move out of the stallbarn is a challenge for many wanting a long term, healthy and profitable future in dairying that willenable a quality life style.
The dilemma many face is the lack of adequate capital to quickly modernize to freestalls and pitparlors to support a profitable size at tolerable levels of risk. Few have had experience or trainingin the skills required to manage these modern dairy systems. Moving out of the stall barn changesthe way cows are housed, fed and milked. The move also affects routine work, purchasing feed,handling manure, using consultants, managing people, establishing control systems, and budgetingand forward planning. The skills of managing finances, production and people can be learned withcommitment, study, experience and training.
Typical Midwest dairy farms are highly diversified, raising forage and grain crops for feed for thedairy. Dairy income is the primary income source while the invested capital, labor and managementtalents are diluted over several enterprises. Many farms can benefit from evaluating whichenterprises are contributing most to their profitability and then reallocating their resources to thosethat contribute most. (Conlin 1998)

Section V-1 page 261
List of Major Relevant Ongoing Work
NE-165 Regional Research Project, •Private Strategies, Public Policies, and Food SystemPerformance,• which includes researchers from 24 U.S. land grant universities and severalgovernment agencies, was mentioned earlier as a source of general information on structuralchange in agriculture. Its objectives are to: 1) To analyze the impacts of changes in strategies,technologies, consumer behavior, and policies on the economic performance of the food system,and 2) To provide economic analysis of private and public strategies in order to assess theirimpact on improvement in food safety and other quality attributes. The administrative advisor isDan Rossi at Rutgers University, Cook Office Building, 55 Dudley Road, New Brunswick, N.J.08901, Phone: (732) 932-9155. Termination date is 9/30/2001.
Northeast Regional Research Project NE-177, "Impacts of Structural Change in the DairyIndustry," has two objectives, 1) Determine the interrelationships among and relative importanceof social, economic, technological and political environments, regional conditions, andentrepreneurial strategies affecting restructuring of the dairy industry in different dairy localities,and 2) Identify, examine, and assess the effects of structural change in the dairy sector on localcommunities and related enterprises. The chair is Douglas Jackson-Smith, University ofWisconsin-Madison, Program on Agricultural Technology Studies, 1450 Linden Drive, Rm. 146,Madison, WI 53706-1562, 608-265-2908. Termination date is 9/30/2001. Three states (WI, MI,and NY) have done one or two years of survey work in a dairy-dependent community in the state. Several other states, including Minnesota, have only participated in a limited way due to lack ofoperating funds and faculty time.
North Central Research Project NC-221, "Financing Agriculture and Rural America: Issues ofPolicy, Structure and Technical Change," has the objectives to 1) determine the effects ofchanges in federal and state policies affecting agriculture on the financial and economicperformance of farm and rural non-farm businesses and rural financial markets, 2) identify andevaluate the costs and benefits of structural changes in production agriculture, rural non-farmbusinesses, and rural financial markets, and 3) measure the effects of technical change on ruralfinancial products, services, and firm decision making. The administrative adviser is E.O.Hoiberg, Iowa State University. Termination date is 9/30/03. Fifteen states are involved in thisproject, which generated one of the publications cited above regarding effects of bank mergers onagricultural lending.
The Alternative Swine Production Systems project is a project funded by the MinnesotaLegislature and organized by the Minnesota Institute for Sustainable Agriculture, a partnershipbetween the University of Minnesota and the community as represented by the Sustainers'Coalition. Its major objectives are to 1) research and develop low-emission and low-energyalternative pork production systems, 2) promote alternative pork production systems, includinghoop houses, the Swedish model for farrowing and feeder pig production, and pasture farrowing,and 3) disseminate information on new low-emission and low-energy alternative pork productionsystems to farmers and agricultural service providers including lenders, educators, and vendors.

Section V-1 page 262
One component of the project is to conduct case studies and summarize production and financialperformance data for farms using alternative swine production systems. Farms are currentlybeing identified for the study, and the expectation is to assist the farms to implement astandardized financial analysis system for the year 2000 calendar year. Given the year-to-yearvariability usually experienced in financial performance of individual farms, several years of datawill be needed to make credible comparisons between alternative and conventional swineproduction systems. The project coordinator is Mr. Wayne Martin, Associate Program Director,Alternative Swine Production Systems, University of Minnesota, (612) 625-6224, 385E AnimalScience Building, 1988 Fitch Ave., St. Paul, MN 55108.
There are a large number of individual agricultural experiment station research projects at northcentral U.S. land grant universities that relate in a very general way to the GEIS study questions,but nothing seems focused very specifically on any particular questions. Topics includerevitalizing or improving the profitability of particular livestock enterprises or productionsystems; improving marketing practices; assessing the economic potential of particular livestockindustries in a locale; assessing linkages between economic, environmental, and quality of lifeindicators; and assessing public policy. The agricultural economics departments at PurdueUniversity and Kansas State University are particularly active in the areas of livestock pricediscovery, supply chains, and contracting issues. Project descriptions are available on the USDANational Agricultural Library's Current Research Information System web sitehttp://cris.csrees.usda.gov/.
RECOMMENDATIONS FOR FUTURE RESEARCH
Question D2. With respect to the following factors, what is the current situation in theMinnesota livestock industry, what are the changes taking place, why are the changesoccurring, and what are their implications:
a. geographic distribution and
b. competitiveness in national and international markets
Research could be conducted on the adequacy of policy measures to "democratize" or deal withthe consequences of globalization, such as tax breaks and pilot projects for public employmentfor temporarily displaced farm workers and farm operators; and increased support and promotionof retraining programs and job-hunting assistance. Because the effectiveness of retrainingprograms for unskilled workers has been questioned, subsidies could also be extended to workerswhose wages are depressed due to trade-related competition, rather than being limited to thoseworkers who lost their jobs.
Section V-1 page 263
At the county level, if there was a single aggregate indicator of the restrictiveness of countyfeedlot ordinances or local opinion (and to our knowledge there is no such indicator at this time),it might be interesting to examine the correlation and causal relationships between market shareand that indicator.
One question that was raised in the GEIS discussions is whether there are other states or regionswhere a type of livestock production was declining and then rebounded, and what had been doneto bring about the turnaround. The Missouri swine industry is the main example that has beenidentified, but we have so far been unable to find a concise summary of the history whichdocuments the timelines, what was done, what proved effective, and the economic, social, andenvironmental impacts of the turnaround. This could be a subject for future economic andsociological research.
c. type of business organization and degree of vertical integration or coordinationIf more information was desired on this topic, the type of information presented in the 1993Packers and Stockyards study could be updated with an emphasis on Minnesota. This mightinvolve interviews of such industry leaders as Hormel, Swift, IBP, Cargill, LOL, Hubbard,Harvest States, and large Minnesota pork and dairy producers, for an MS or PhD thesis.
Question D1b. To what degree are livestock producers allowed to operate agriculturalsystems interdependently as opposed to independently in Minnesota and in other statesand what is the significance?
A more in-depth research approach than that used by Mo and Abdalla might be to describe theownership and control structure of interdependently-operated agricultural systems which areoperating in at least one state, and then to compare their structure with the restrictions in otherstates of interest. If the restrictions would prevent their operation "as is", a further step would beto determine what adjustments in the ownership and control structure would be required tocomply with the other states' rules, and to use some sort of economic simulation model toestimate the impacts on profitability. Figuring out what adjustments would be most realistic andthe cost of each would be difficult. If the economics favor an interdependent structure, thenentrepreneurial farm operators tend to exercise considerable ingenuity in coming up with newbusiness arrangements to take advantage of the opportunities within the legal restrictions theyface. It may be difficult for a researcher to anticipate the array of adjustments that entrepreneursmay come up with. For example, it has been suggested (but not proved!) that the present use ofproduction and marketing contracts in swine production is a result of corporate farm laws whichprevent coordination of production through direct ownership. Perhaps another example might beuse of limited liability partnerships for Minnesota dairy farms as a way of involving more thanthe five unrelated owners allowed for an authorized farm corporation.
The business organization form known as a Limited Liability Company or LLC, which is notallowed for agriculture in Minnesota, is another alternative to an authorized farm corporation as a
Section V-1 page 264
way for farmers to operate interdependently. The administrative costs of setting up and operatingan LLC are said to be less than for a corporation, so documenting those differences could be oneaspect of this research.
Another research topic that was suggested in the GEIS discussions would be to quantify theextent to which farm operations are utilizing multiple forms of legal organization, businessarrangements, and capital sources as described in Boehlje and Lins.
Question D4. What is the current market situation, how is the market changing andwhat are the implications for livestock producers with respect to the following factors(concentration of buyers, contractual buying and selling arrangements, price discoveryand market fairness, andlending practices):
The studies cited by Azzam and others on policy response to meatpacking industry concentrationwere done before the disastrous downturn in the hog market in late 1998 and early 1999. Retailpork prices have apparently not fallen as much as many pork producers think they should have inlight of how little producers have been receiving. A specific question which this report does notaddress in detail is, •What is the farm-retail margin for pork and other livestock products, whyhave retail prices not fallen further, and who has been benefitting from recent increases in themargin?
The main source of information on farm-wholesale and wholesale-retail margins is the USDAEconomic Research Service. The estimation of margins is becoming more complicated asproduct mixes change and the production, processing, and distribution stages become moreintegrated, as has been noted by some of the authors cited in the report. For example, more andmore meat reaches consumers in further processed products such as pizza which include dairyproducts and other components. Putting a retail value on the meat portion of such products canbe a challenge. The USDA margin figures are probably the most accurate available, but theirexact magnitude needs to be viewed cautiously.
One reason economists feel that retail prices did not fall further was that limited slaughteringcapacity would have made it difficult to move more meat through to consumers even if pricereductions had stimulated demand. Normal price lag times and the cost ofprocessing/distribution labor, packaging, shipping, etc. may have been other factors limitingretail price discounts, but few specifics are available at this point. This is a matter ofconsiderable debate at the present time, and is an important topic. The time constraints underwhich we were operating did not allow us to address it.
Further research could be conducted on the adequacy of financing, technical and businessplanning assistance available to producers to facilitate rapid adjustments to marketplace changes.Commercial lenders are often said to pressure producers into signing production or marketingcontracts in order to reduce operating risk. Thus, it seems possible that increased creditavailability from programs such as those listed above would give producers more access to
Section V-1 page 265
alternatives that leave them with more control and independence. If true, these programs mayslow the trend toward increased vertical coordination and consolidation.
Question E2a. How is the profitability and economic viability of farms and firms affectedby different production and marketing arrangements?
Perhaps more work could be done on different production and marketing arrangements affectcosts at different stages of the supply chain, and which players in the supply chain would benefitfrom the improvements in the short run and in the long run, along the lines of the publications byMartinez and others that were cited.
Much of the debate about the fairness of long-term hog marketing contracts revolves aroundwhether quantity premiums paid to producers under long-term marketing contracts or for largerspot market lot sizes are unreasonable compared to what is paid for smaller spot sales (see, forexample section V of Land Stewardship Project). •Reasonableness• relates to how suchpremiums compare to differences in packers• procurement and operating costs. Specificresearch needs include: 1) how packers• hog procurement costs vary with lot size (number ofanimals involved in the individual transaction), and 2) how much slaughter plant per unitoperating cost increases when the plant is operated below or above optimum rates on any givenday. These cost differences are difficult for university researchers to study, due to lack of accessto individual transaction and contract data. This may be an area that can only be effectivelyresearched using data obtained under the auspices of the USDA Packers and StockyardsAdministration•s or other government agency•s subpoena power.
Question E2b. What are the comparative internal economic costs and benefits of variouslivestock production systems?
As was mentioned in the critique of the study questions, one issue that is not specifically is theimpact of possible higher future energy prices on the ways livestock is produced and marketed. This is a question that often comes up in discussions about the future of agriculture. This is apossible topic for future research.
More research is needed to better understand and the factors driving profitability, anddevelopment of models to help farm operators to strategically optimize the use of farm resourcesin the context of limited assets in order to achieve environmental and farm family life qualitygoals. These studies would include assessments of the cost and returns of environmentalstewardship practices, adoption of technologies, management protocols, alternative businessstructures and networking with others, transition strategies, to the development of benchmarkingand monitoring systems for better control of management processes.
V-2-266
REFERENCES (Original Plus Updates)
Agricultural Prices. USDA National Agricultural Statistics Service. various issues. Located at:http://usda.mannlib.cornell.edu/reports/nassr/livestock/pct-bbc/. Accessed 4/26/1999.
Agriculture Fact Book. 11/1998. Washington, DC: U.S. Department of Agriculture Office ofCommunications. Located at: http://www.usda.gov:80//news/pubs/fbook98/ch1a.htm.
Cash Hog Prices Likely to be Gone in Two Years. 2001 Mar 8. Feedstuffs.
Commodity Fact Sheet, 1996-97 Dairy price Support Program. 8/1997. Washington D.C.: USDA Farm Service Agency.
Concentration in Agriculture: A Report of the USDA Advisory Committee on AgriculturalConcentration. Located at: http://www.ams.usda.gov:80/concentration/home.htm.Accessed 2/14/2001.
Concentration in the Red Meat Packing Industry. 2/1996. Washington, DC: USDA GrainInspection, Packers and Stockyards Administration.
Farm Computer Usage and Ownership. USDA National Agricultural Statistics Service. 7/30/1997. Located at: http://usda.mannlib.cornell.edu:80/usda/.
Farmers' Use of Marketing and Production Contracts, Agricultural Economic Report No. 747.1/6/1997. Washington, DC: USDA Economic Research Service. Located at: http://www.econ.ag.gov/epubs/pdf/aer747/index.htm.
Federal Reserve Bank of Kansas City. Located at: http://www.kc.frb.org/.
Field Notes No. 2, Swine Production. USDA Sustainable Agriculture Research and Education.Located at: http://www.sare.org/san/ncrsare/docs/FN1198hogs.pdf. Accessed 5/20/1999.
The Future of the U.S. Dairy Industry: A Domestic and International Perspective. 7/14/1997.Columbus, Missouri: Food and Agricultural Policy Institute, University of Missouri.
Hog Marketing Contract Study, University of Missouri and National Pork Producers Council. 1/1999. Located at: http://www.nppc.org/PROD/mktgcontractstudy.html. Accessed5/13/1999.
V-2-267
Hoop Structures for Swine Housing, AED-41. 1997. Ames, Iowa: Midwest Plan Service, IowaState University.
Milk Costs and Returns: 1998-99 Costs of Production from the Agricultural ResourceManagement Study. USDA Economic Research Service. 9/25/2000. Located at:http://www.econ.ag.gov/ers. Accessed 12/8/2000.
Milk Production. USDA National Agricultural Statistics Service, National Agicultural StatisticsBulletin. 2/1999. Located at: http://usda.mannlib.cornell.edu/re...ssr/dairy/pmp-bb/1999/mkpr0299.txt. Accessed 5/1999.
Milk Production. USDA National Agricultural Statistics Service. various issues. Located at:http://usda.mannlib.cornell.edu/reports/nassr/dairy/pmp-bb/. Accessed 4/26/1999.
Minnesota Agricultural Statistics. 1998. St Paul, MN: USDA Minnesota Agricultural StatisticsService.
Minnesota Agricultural Statistics. 2000. USDA Minnesota Agricultural Statistics Service. Located at: http://www.nass.usda.gov/mn/.
Minnesota Agricultural Statistics. various issues. USDA Minnesota Agricultural StatisticsService.
Minnesota Dairy Herd Improvement Association Annual Summary 1998. 3/1999. Buffalo, MN:
Minnesota Department of Agriculture, Minnesota Daily Livestock Market Price Report. Locatedat: http://www.mda.state.mn.us/livestock/Start.asp. Accessed 2/14/2001.
Minnesota Farm Business Management Program, Statewide Annual Reports, 1996. undated.Located at: http://www.mgt.org/fbm/reports/state.htm. Accessed 4/23/1999.
Nonmetro Farming-Dependent Counties, 1989. Rural Economy Division, Economic ResearchService, USDA using data from the Bureau of Economic Analysis. Located at:http://www.econ.ag.gov/briefing/rural/Ruralecn/farmdep.gif. Accessed 5/11/1999.
Pork Industry Handbook (collection of individual fact sheets). fact sheets individually dated. West Lafayette, Indiana: Purdue University Cooperative Extension Service.
Pork Leader. 6/18/1999. Des Moines, Iowa: National Pork Producers Council. Located at: http://www.nppc.org/NEWS/PorkLeader990618.html.

V-2-268
Positioning Your Pork Operation for the 21st Century. 1995. West Lafayette, IN: PurdueCooperative Extension Service.
Production Costs Changed Little in 1999, but Lower Commodity Prices Cut Most Returns.Agricultural Income and Finance. Washington, D.C. USDA Economic Research Service,2000, AIS-75, pp. 25-28, 50-55
Statistical Abstract of the United States. 1998. Washington, DC: U.S. Department of Commerce,Bureau of the Census.
Texas A&M University Agricultural and Food Policy Center. Located at: http://afpc1.tamu.edu/.Accessed 6/9/1999.
U.S. Census of Agriculture. 1998. Washington, DC: USDA National Agricultural StatisticsService. Located at: http://www.nass.usda.gov/census/.
U.S. Department of Justice Antitrust Division Overview. Located at:www.usdoj.gov/atr/overview.html. Accessed 3/4/1999.
USDA Agricultural Marketing Service, Mandatory Price Reporting. Located at:http://www.ams.usda.gov/lsg/price.htm. Accessed 2/14/2001.
USDA Economic Research Service Briefing Room: dairy: policy. 12/12/2000. Located at:http://www.ers.usda.gov/briefing/dairy/Policy.htm. Accessed 2/14/2001.
USDA Grain Inspection, Packers and Stockyards Administration. Located at:www.usda.gov/gipsa/. Accessed 6/16/1999.
Welcome to the State and Local Policy Program's ECONOMIC DEVELOPMENT WEB SITE. University of Minnesota HHH Institute of Public Affairs. Located at:http://www.hhh.umn.edu/Centers/SLP/edweb/. Accessed 4/15/1999.
Western Cornbelt Hog Procurement Investigation (GIPSA Backgrounder). USDA GrainInspection, Packers and Stockyards Administration. 10/9/1998. Located at:http://www.usda.gov/gipsa/newsinfo/back/hogback.htm. Accessed 5/14/1999.
Ahearn M, Yee J, Ball E, Nehring R. 1/1998. Agricultural Productivity in the United States.Washington, DC: USDA Economic Research Service.
Ahrendsen BL, Dixon RL, Lee LT. 1999. Independent Commercial Bank Mergers andAgricultural Lending Concentration. Journal of Agricultural and Applied Economics31(2):215-27.

V-2-269
Aiken JD. 1993. State Restrictions on Landownership by Aliens and Businesses, December 31,1992, Agricultural Handbook No. 702. Washington, DC: Resources and TechnologyDivision, Economic Research Service, USDA.
Allen DW, Lueck D. 1998. The Nature of the Farm. Journal of Law and Economics 41(2):347-86.
Anderson DW, Murray BC, Teague JL, Lindrooth RC. 1998. Exit From the MeatpackingIndustry: A Microdata Analysis. American Journal of Agricultural Economics 80:96-106.
Andersson H, Olson KD. 1996. On Comparing Farm Record Association Members to the FarmPopulation. Review of Agricultural Economics 18:259-64.
Aspelin AL, Engelman G. 1966. Packer Feeding of Cattle: Its volume and Significance,Consumer and Marketing Services MRR. Washington, DC: USDA.
Azzam A. 1997. Measuring market power and cost-efficiency effects of industrial concentration.Journal of Industrial Economics 45:377-86.
Azzam AM. 1999. Asymmetry and Rigidity in Farm-Retail Price Transmission. AmericanJournal of Agricultural Economics 81:525-33.
Azzam AM. 1998. Competition in the US Meatpacking Industry: Is it History? AgriculturalEconomics 18:107-26.
Azzam AM, Anderson DG. 5/1996. Assessing Competition in Meatpacking: Economic History, Theory,and Evidence, GIPSA-RR 96-6. Packers and Stockyards Programs, Grain Inspection,Packers and Stockyards Administration, U.S. Department of Agriculture.
Azzam AM, Schroeter JR. 1995. The Tradeoff Between Oligopsony Power and Cost Efficiencyin Horizontal Consolidation: An Example from Beef Packing. American Journal ofAgricultural Economics 77:825-36.
Backus GBC, et al. 2/1997. Comparison of Four Housing Systems for Non-Lactating Sows.Rosmalen, Netherlands: Research Institute for Pig Husbandry.
Bailey K. 2000. Evaluating the Economic Impacts of Regional Milk Pricing Authorities: TheCase of Dairy Compacts. Agricultural and Resource Economics Review 29(2):208-19.

V-2-270
Bailey K. 1/2001. Impact of USDA's Class III & IV Hearing on Milk Prices in the Northeast,Staff Paper 335 [Web Page]. Located at:http://www.aers.psu.edu/dairyoutlook/FedOrderData/MilkPriceModel.htm. Accessed2/14/2001.
Beal D. 1999. Making Manufacturing Work. St. Paul Pioneer Press .Discusses analysis from The Relocation of Industry, by Engineering Professor FredZimmerman, University of St. Thomas, University of St. Thomas Technology Press.
Bernard JC, Willet LS. 1996. Asymmetric Price Relationships in the U.S. Broiler Industry.Journal of Agricultural and Applied Economics 28(2):279-89.
Blisard N, Blayney D, Chandran R, Allshouse J. Food and Rural Ecinomics Division, USDA-ERS. 3/15/1999. Analysis of Generic Dairy Advertising, 1984-97 [Web Page]. Locatedat: http://econ.ag.gov/epubs/pdf/tb1873. Accessed 5/1999.
Boehlje M, Lins D. 1998. Planning the Financial/Organizational Structure of Farm andAgribusiness Firms: What are the Options? Ames, Iowa: Midwest Plan Service, IowaState University.
Boehlje M, Ray J. 1999. Contract vs. Independent Pork Production: Does Financing Matter?Agricultural Finance Review 59:31-42.
Boehlje, Michael, Schrader, Lee, Hurt, Chris, Foster, Ken, and Pritchett, James. The ProducerProtection Act - Will It Protect Producers? Agricultural Law Update. AmericanAgricultural Law Association, 2001, 18, pp. 4-6
Boehlje M, Schrader LF. 1998. The Industrialization of Agriculture: Questions of Coordination.Royer JS, Rogers RT, Editors. Industrialization of Agriculture: Vertical Coordination inthe U.S. Food System. Aldershot, England; Brookfield, Vermont: Ashgatge.
Boehlje M, Clark K, Hurt C, Jones D, Miller A. 1997. Hog/Pork Sector. Food System 21: Gearing Up for the New Millenium, EC-710. West Lafayette, Indiana: Purdue UniversityCooperative Extension Service.
Bogan CE, English MJ. 1994. Benchmarking for best Practices: Winning Trough InnovativeAdaptation. Washington D.C. McGraw Hill.
Rural Conditions and Trends. Washington, DC: USDA Economic Research Service. Vol. 9,1998.

V-2-271
Braaksma AW. 1993. Group Financial Arrangements EDed. Networking: CompetitivePositioning for Pork Producers. West Des Moines, IA. P.O. Box 10383, Des Moines, IA50306: National Pork Producers Council.
Brandow GE. 1977. Policy for Commercial Agriculture, 1945-71. Martin LR, General Editor andVolume Editor. A Survey of Agricultural Economics Literature, Volume 1, TraditionalFields of Agricultural Economics, 1940's to 1970's. Minneapolis: University of MinnesotaPress. p 231-3.
Brester GW, Schroeder TC. 1995. The Impacts of Brand and Generic Advertising on MeatDemand. American Journal of Agricultural Economics 77(4):969-79.
Brewer C, Kliebenstein J, Hayenga M. 6/30/1998. Pork Production Costs: A Comparison ofMajor Pork Exporting Countries, Staff Paper 302. Ames, IA: Department of Economics,Iowa State University.
Browne WP, Skees JR, Swanson LE, Thompson PB, Laurian J. Unevehr. 1992. Sacred Cows andHot Potatoes. Boulder, CO: Westview Press.
Buhr B, Associate Professor, Department of Applied Economics, University of Minnesota.6/17/1999. Discussion of historical hog prices, personal communication.
Buhr B. Associate Professor, Department of Applied Economics, University of Minnesota. Undated. Market Contracts and Price Determination Issues in Today's Swine Market[Web Page]. Located at: http://apecon.agri.umn.edu/faculty/bbuhr/mktctrct.PDF.Accessed 4/19/1999.
Center for Agricultural and Rural Development. February 1984. Economies of Size Studies: ACollection of Papers Presented. Workshop at Purdue University, West Lafayette, IN.Ames, Iowa: Iowa State University.
Center for Epidemology and Animal Health. USDA:Aphis:VS: attn NAHMs. 1996. Part IIIReference of 1996 Dairy Health and Health Mangement [Web Page]. Located at:http://www.aphis.usda.gov/vs/ceah/cahm/Dairy_cattle/d96.htm. Accessed 5/1999.
Cochrane WW. 1979. The development of American agriculture : a historical analysis.Minneapolis: University of Minnesota Press.
Cochrane WW, Runge CF. 1992. Reforming Farm Policy: Toward a National Agenda. Ames,Iowa: Iowa State University Press.
V-2-272
Conlin BJ. March 1998. Stepping or Leaping into the Future. Positioning for the Future, FourState Dairy Extension Programs. Madison, Wi and New Ulm, MN. University ofMinnesota.
Conlin BJ. 1995a. 1. Strategies for Minnesota Dairy Producers. Structural Change in theLivestock Industry. St. Paul, MN: Livestock Specialization Team, Minnesota ExtensionService, University of Minnesota; 1995 Mar. Conlin BJ. Strategies for Minnesota DairyProducers. St Paul, MN: University of MN, Minnesota Extension Service.
Conlin BJ. 1995b. The Changing Dairy Industry. [1. Conlin, Bernard J. The Changing DairyIndustry, Structural Change in the Livestock Industry. St. Paul, MN: LivestockSpecialization Team, Minnesota Extension Service, University of Minnesota; 1995March.]St Paul, MN: Livestock Specialization Team, Minnesota Extension Service,University of Minnesota.
Conlin BJ. 1995c. The Changing Dairy Industry. [1. Conlin, Bernard J. The Changing DairyIndustry, Structural Change in the Livestock Industry. St. Paul, MN: LivestockSpecialization Team, Minnesota Extension Service, University of Minnesota; 1995March.St Paul, MN: Livestock Specialization Team, Minnesota Extension Service,University of Minnesota.
Conlin J. May 1998. Improving Dairy Profit: What’s Broken? What Do We Fix First?Minnesota Dairy Herd Health Conference 1998. St Paul, MN. College of VeterinaryMedicine, University of MN.
Connor J. 1997. The Global Lysine Price-Fixing Conspiracy of 1992-95. Review of AgriculturalEconomics 19(2):412-27.
Connor J, Schiek W, Uhl J. 1997. Food Distribution Industries. Food System 21: Gearing Upfor the New Millenium, EC-710. West Lafayette, Indiana: Purdue University CooperativeExtension Service.
Cook ML. 1995. The Future of Agricultural Cooperatives: A Neo-Institutional Approach.American Journal of Agricultural Economics 77(5):1153-9.
Council of Economic Advisers. 2000. Economic Report to the President. Washington, DC: U.S.Government Printing Office.
Creason JR, Runge CF. 4/1992. Use of Lawn Chemicals in the Twin Cities, Public Report Series#7. St. Paul, Minnesota: Minnesota Water Resources Research Center.

V-2-273
Dahl DC. 1991. The Minnesota Corporate Farm Law. Minnesota Agricultural Economist (667).
Dobson B. Agriculture and Life Sciences, University of Wisconsin. 12/1996. Autralia, N.Z.U.S. Will Compete for the Biggest Piece of Cream Pie [Web Page]. Located at:http://www.cals.wisc.edu/media/news/12_96/world_dairy_trade.html. Accessed 5/1999.
Dotson E, editor. 7/1996. Guide to Contracting. Des Moines, Iowa: National Pork ProducersCouncil.
Drabenstott M. 1998. This Little Piggy Went to Market: Will the New Pork Industry Call theHeartland Home? Economic Review of the Federal Reserve Bank of Kansas City .
Drury R, Tweeten L. 1997. Have Farmers Lost Their Uniqueness? Review of AgriculturalEconomics 19(1):58-90.
Drury R, Tweeten L. 1998. Have Farmers Lost Their Uniqueness? Response. Review ofAgricultural Economics 20(1):206-7.
Duncan M, Stam JM, editors. 1998. Financing Agriculture into the Twenty-first Century.Boulder, Colorado: Westview Press.
Eales JS, Unnevehr LJ. 1988. Demand for Beef and Chicken Products: Separability and Structural Change. American Journal of Agricultural Economics 70(3):521-32.
Eales JS, Unnevehr LJ. 1994. The Inverse Almost Ideal Demand System. European EconomicReview 38(1):101-15.
Eales JS, Unnevehr LJ. 1993. Simultaneity and Structural Change in U.S. Meat Demand.American Journal of Agricultural Economics 75(2):259-68.
Edelman MA, et al. Chair, Department of Economics, Iowa State University. 2/2/1999. AnimalConfinement Policy National Task Force Preliminary State Policy Survey Results [WebPage]. Located at: http://cherokee.agecon.clemson.edu/summary.htm. Accessed4/20/1999.
El-Osta HS, Johnson JD. Resource Economics Division, Economic Research Service, U.S.Department of Agriculture. 1996. Determinants of Financial Performance of CommercialDairy Farms [Web Page]. Located at: http://www.econ.ag.gov/epubs/pdf/tb1859/.Accessed 5/1999.
V-2-274
Ford SR, Gardner S, Gripp S, Harsh, W. Knoblauch, A. Novakovic, Putman L, Stephenson M,Weersink A, Yonkers R. 7/1996. A Descriptive Analysis of the Characteristics andFinancial Performance of Dairy farms in Michigan, New York, Ontario, Pennsylvania,and Wisconsin. R..B. 98-08 ed. Ithaca , NY: Department of Agricultural Resource andManagerical Sciences.
Freese B. 1998. Pork Powerhouses 1998. Successful Farming :19-23.
Freese B. 2000. Sow Herd Building Again: This Time It's Canada Making the Move (PorkPowerhouses 2000). Successful Farming :18-20.
French B. 1977. The Analysis of Productive Efficiency in Agricultural Marketing: Models,Methods, and Progress. Martin LR, General Editor and Volume Editor. A Survey ofAgricultural Economics Literature, Volume 1, Traditional Fields of AgriculturalEconomics, 1940's to 1970's. Volume 1. Minneapolis, MN: University of MinnesotaPress. p 131-2.
Fulton M. 1995. The Future of Canadian Agricultural Cooperatives: A Property RightsApproach. American Journal of Agricultural Economics 77(5):1144-52.
Gale F. 1997. Direct Farm Marketing as a Rural Development Tool. Rural DevelopmentPerspectives 12(4).
Gale HF, McGranahan DA, Teixeira R, Greenberg E. 4/12/1999. Rural Competitiveness:Results of the 1996 Rural Manufacturing Survey, Agricultural Economic Report No. 776.Washington, DC: Food and Rural Economics Division, Economic Research Service,U.S. Department of Agriculture. Located at: http://www.econ.ag.gov/epubs/pdf/aer776/.
Gale HFJr. 11/20/1997. Rural Manufacturing on the Crest of the Wave: A Study of Rural-UrbanTechnology Use, Rural Development White Paper. Washington, DC: Rural EconomyDivision, Economic Research Service, U.S. Department of Agriculture. Located at: http://www.econ.ag.gov/briefing/rural/briefing/gale/gale.htm.
Gallo AE. 7/1998. The Food Marketing System in 1996. Washington, DC: USDA EconomicResearch System, Food and Rural Economics Division. Located at: http://www.econ.ag.gov/epubs/pdf/aib743/AIB743.PDF.
Green RD, Alston JM. 1990. Elasticities in AIDS Models. American Journal of AgriculturalEconomics 72(2):442-45.

V-2-275
Gunderson C, Morehart M, Whitener L, Ghelfi L, Johnson J, Kassel K, Kuhn B, Mishra A,Offutt S, Tiehen L. 10/2000. A Safety Net for Farm Households. Washington, DC: USDA Economic Research Service. Located at: www.ers.usda.gov.
Hahn WF, Nelson KE, Duewer LA, Gustafson RA. 5/4/1999. U.S. Beef Industry: Cattle Cycles,Price Spreads, and Packer Concentration, Technical Bulletin 1874. Washington, DC: Market and Trade Economics Division, ERS, USDA. Located at: http://www.econ.ag.gov/epubs/pdf/tb1874/.
Hallam A. 1991. Economies of Size and Scale in Agriculture: An Interpretive Review ofEmpirical Measurement. Review of Agricultural Economics 13(1):155-72.
Hallam A, Editor. 1993. Size, Structure, and the Changing Face of American Agriculture.Boulder, CO: Westview Press.
Halverson M, Honeyman M, Adams M. 5/1997. Sustainable Agriculture: Swine Options forIowa. Ames, Iowa: Leopold Center for Sustainable Agriculture, Iowa State University.
Hamilton ND, Andrews G. 11/1992. State Regulation of Contract Feeding and PackerRegulation in the Swine Industry. Des Moines, Iowa: Drake University, Agricultural LawCenter.
Hammond J. 1989. The Minnesota Dairy farm Sector; Summary of the 1988 University ofMinnesota Dairy Farm Survey. St Paul, MN: MN Agricultural Experiment Station.
Hanson GD, Cunningham LC, Ford SA, Mueller LD, Parsons RL. Penn State University, U. 1998. Increasing Intensity of pasture use with dairy cattle: An Economic Analysis [WebPage]. Located at: http://www.zazu.lib.umn.edu/cgi-bin...j(0000119730)&sp.record.source.p=HOTLINK. Accessed 5/1999.
Hanson M. Legal Considerations and Alternative for Animal Agriculture Production Ventures.Livestock Business Structure Summit. Sheraton Midway, St Paul, MN.
Harl, Neil, Stumo, Michael, McEowen, Roger, Heffernan, William, and O'Brien, Doug. TheProducer Protection Act - Will It Protect Producers? A Rejoinder. Agricultural LawUpdate. Alvin, Texas American Agricultural Law Association, 2001, 18, pp. 1-3, 6-7
Harl NE. undated. Contract Agriculture: Will It Tip the Balance? [Web Page]. Located at:www.leopold.iastate.edu/98-4contracting.html. Accessed 6/17/1999.
Harl NE. 11/1996. The Farm Corporation: What It Is, How It Works, How It Is Taxed. IowaState U. Extension Distribution Center, 119 Printing and Distribution Building, Ames, IA50011: North Central Farm Management Extension Committee.

V-2-276
Harrington DH. 1983. Costs and Returns: Economic and Accounting Concepts. AgriculturalEconomics Research 35(4):1-14.
Harsh SB, Larry J. Connor, Gerald D. Schwab. 1981. Managing the Farm Business. EnglewoodCliffs, NJ: Prentice-Hall, Inc.
Hayenga M. 8/1998a. Global Competitiveness of the U.S. Pork Sector, Staff Paper 301. 260Heady Hall, Ames, IA: Iowa State University, Dept. of Economics .
Hayenga ML. 1998b. Cost Structures of Pork Slaughter and Processing Firms: Behavioral andPerformance Implications. Review of Agricultural Economics 20(2):574-83.
Hayenga ML, O'Brien D. 1992. Packer Concentration, Forward Contracting Price Impacts, andthe Relevant Market for Fed Cattle. Purcell W, Editor. Pricing and Coordination inConsolidated Livestock Markets, Captive Supplies, Market Power, IRS Hedging Policy.Blacksburg, VA: Research Institute on Livestock Pricing. p 45-67.
Hayes L, Carpenter S, Koehler R, Sifferath W, Durgan B, Ponce de Leon A, Eidman V, Sundquist WB. 1999. A Summary of the Literature Related to the Role of Government(C). Generic Environmental Impact Statement on Animal Agriculture. St. Paul,Minnesota: Minnesota Environmental Quality Board.
Heffernan W, Hendrickson M, Gronski R. 2/5/1999. Consolidation in the Food and AgricultureSystem. Columbia, Missouri: Department of Rural Sociology, University of Missouri.
Henderson DR, Frank SD. 1998. Quantifying Vertical Coordination: Refinement of The Frank-Henderson Vertical Coordination Index. Royer jS, Rogers RT, Editors. TheIndustrialization of Agriculture: Vertical Coordination in the U.S. Food System.Aldershot, England and Brookfield, Vermont: Ashgate. p 99-112.
Hoards Dairyman Staff. 1999 May 10. Plant Premiums Drove Mailbox Prices Upward. HoardsDairyman:353.
Honeyman M. 1996. Sustainability Issues of U.S. Swine Production. Journal of Animal Science74:1410-7.
Honeyman MS. 1995. Vastgotmodellen: Sweden's Sustainable Alternative for SwineProduction. American Journal of Alternative Agriculture 10(3):129-32.
Hopkins J, Morehart M. September 25, 2000. An Empirical Analysis of the Farm Problem: Comparability in Rates of Return. Challenging the Agricultural Economics Paradigm, ASymposium Honoring the Career of Luther G. Tweeten. Columbus, Ohio: Department of

V-2-277
Agricultural Economics, The Ohio State University.
Hoppe B. USDA, Economic Research Service, Farm Structure and Performance Branch. 9/1996. What do We Mean by Farm Structure? [Web Page]. Located at:http://www.econ.ag.gov/fbe/struc/st1.htm. Accessed 4/28/1999.
Hughlett M. 1999. Andersen plans plant in Wisconsin. St. Paul Pioneer Press :B1.
Hurt C, Good K, Foster K. 2/1995. Comparing Costs of Hog Production in the Midwest WithLarge Integrated North Carolina Systems (unpublished mimeo). W. Lafayette, IN: Purdue University.
Innes R. 2000. The Economics of Livestock Waste and Its Regulation. American Journal ofAgricultural Economics 82:97-117.
Innes R. 1999. Regulating Livestock Waste: An Economic Perspective. Choices :14-9.
Jackson D, Compiler , Minnesota State Colleges and Universities. 5/24/1999. Minnesota FarmBusiness Management Summary, personal communication.
Jackson-Smith D, Barham B, Nevius M, Klemme R. 11/1996. Grazing in Dairyland: The Useand Performance of Management Intensive Rotational Grazing Among Wisconsin DairyFarms. Madison, Wisconsin: Agricultural Technology and Family Farm Institute,University of Wisconsin-Madison.
Jordan B, Tweeten L. 6/1987. Public Perceptions of Farm Problems, Research Report P894.Stillwater, Oklahoma: Agricultural Experiment Station, Division of Agriculture,Oklahoma State University.
Journal of the Minnesota House of Representatives TA21. Located at:http://www.house.leg.state.mn.us/cco/journals/1999-00/j0427052.pdf. Accessed5/26/1999.
Kaiser HM, Forker OD, Lenz J, Sun C-H. 1992. Evaluating Generic Dairy Advertising Impactson Retail, Wholesale, and Farm Milk Markets. Journal of Agricultural EconomicsResearch 44(4):3-17.
Kaiser HM, Liu DJ. 1998. The Effectiveness of Generic versus Brand Advertising: The Case ofU.S. Dairy Promotion. Review of Agricultural Economics 20(1):69-79.
Keehley P, McBride SA. 1997. Can Benchmarking for Best Management Practices Work forGovernment? American Society for Quality Control: Quality Progress .

V-2-278
Kinsey J. 10/1998. Concentration in Food Retailing: A Review of the Evidence AboutConsumer Impact, Working Paper 98-4. St. Paul, Minnesota: Retail Food IndustryCenter, University of Minnesota. Located at: http://agecon.lib.umn.edu/mn/tr98-04.pdf.
Kinsey J, Senauer B, Jonk Y. 11/1993. Desirable Attributes for Value Added Meat Products,Working Paper WP93-7. 332 COB, 1994 Buford Avenue, St. Paul, MN: Center forInternational Food and Agricultural Policy, University of Minnesota.
Knoblauch WaLDP. Cornell University. 6/1998. Dairy Farm management business summaryNew York State 1997 [Web Page]. Located at: http://www.zazu.lib.umn.edu/cgi-bin/webspirs...j(0000072269)&sp.record.source.p=HOTLINK. Accessed 5/1999.
Koehler B, Lazarus B, Buhr B. 4/1996. Swine Production Networks in Minnesota: Resourcesfor Decision Making, Staff Paper P96-6. St. Paul, Minnesota: Department of AppliedEconomics, University of Minnesota. Located at: http://agecon.lib.umn.edu/mn/p96-06.pdf.
Kohls RL. 1967. Marketing of Agricultural Products. Third Edition ed. New York: Macmillan.
Korten DC. 1995. When Corporations Rule the World. West Hartford, Conn.: : Kumarian Press.
Krupa KS. 10/1996. Foreign Ownership of U.S. Agricultural LandUp Slightly, but Still Only About 1 Percent, SB-931 [Web Page]. Accessed 5/20/1999.
Kusmin LD. 1997. Computer Use by Rural Workers is Rapidly Increasing. Rural DevelopmentPerspectives 11(3):11-6.
Agricultural Finance Review. Ithaca, New York: Department of Agricultural, Resource, andManagerial Economics, Cornell University.
Land Stewardship Project. 4/1999. Killing Competition with Captive Supplies. White BearLake, Minnesota:
Lasley P, Duffy M, Ikerd J, Kliebenstein J, Keeney D, Lawrence J. 1995. EconomicDevelopment. Understanding the Impacts of Large-Scale Swine Production: Proceedingsfrom an Interdisciplinary Scientific Workshop. Des Moines. Available for $15 from theCenter for Agricultural Safety and Health, Institute for Rural and Environmental Health,132 IREH, University of Iowa, Iowa City, IA 52242, (319)335-4438.
Lasley P, Larson K. 7/1998. Iowa Farm and Rural Life Poll - 1998 Summary Report. Ames,Iowa: Iowa State University Extension.

V-2-279
Lawless G, Cropp R, Harris P. University of Wisconsin Center for Cooperative. 4/1996.Cooperative Ownership Compared to Other business Arrangements for Muti-FamilyDairy Operations [Web Page]. Located at:http://www.wisc.edu/staff/lawless/coopvs3.html. Accessed 5/1999.
Lawrence J. Department of Economics, Iowa State University. 11/1997. 1997 Survey of FormerIowa Hog Producers, Motivations of Exiting and Incentives to Return, Staff Paper 295[Web Page]. Located at:http://www.econ.iastate.edu/faculty/lawrence/quithogstaffppr.pdf. Accessed 4/26/1999.
Lawrence J, Grimes G, Hayenga M. Iowa State University. undated. Production and MarketingCharacteristics of U.S. Pork Producers, 1997-1998, Staff paper 311 [Web Page]. Locatedat: http://www.econ.iastate.edu/faculty/lawrence/staffppr331.pdf#Staff paper 311.Accessed 4/23/1999.
Lawrence JD. 3/1996. Factors That Influence Prices Producers Receive For Hogs: StatisticalAnalysis of Killsheet and Survey Data, Staff Paper 279. 468F Heady Hall, Ames, IA50011-1070: Iowa State University, Dept. of Economics. Located at: http://silo.lib.umn.edu/isu/isu279.pdf.
Lawrence JD, Rhodes VJ, Grimes GA, Hayenga ML. 1997. Vertical Coordination in the US PorkIndustry: Status, Motivations, and Expectations. Agribusiness 13(1):21-31.
Lazarus B. 1995. Public Policies and Values Related to Livestock Industry Structural Change. Structural Change in the Livestock Industry. St. Paul, MN: Livestock SpecializationTeam, Minnesota Extension Service, University of Minnesota.
Lazarus W. Business Organization [Web Page]. Located at:http://feedlots.coafes.umn.edu/business.htm. Accessed 4/1999.
Lazarus W, Nordquist D, Eidman V. 11/1991. Economics of Some Swine Production Systemswith Reference to Animal Welfare. St. Paul, Minnesota: Department of Agricultural andApplied Economics, University of Minnesota.
Lenz J, Kaiser HM, Chung C. 1998. Economic Analysis of Generic Milk Advertising Impacts on Markets in New York State. Agribusiness 14(1):73-83.
Lester J, Lombard E. 1990. Comparative Analysis of State Environmental Policy. NaturalResources Journal 30(Spring):301-19.
Levins RA. 2001. Book Review: Rats in the Grain. Choices :47.
Lieber JB. 2000. Rats in the Grain. New York and London: Four Walls Eight Windows.

V-2-280
Lins D. 1990. Shared Appreciation Leasing. Agi Finance .
Loeffler B, Murray H, Johnson DG, Fuller EI. University of Minnesota. 1996. Knee Deep In Grass: A Survey of Twenty-Nine Grazing Operations in Minnesota[Web Page]. Located at: http://www.mes.umn.edu/Docuements/D/I/DI6693.html.Accessed 5/1999.
Love P, Lazarus W. 4/1997. Stearns County Dairy Retention and Enhancement ProgramResearch Report. St Paul, MN: MN Extension Service, University of MN.
Lovell SI, Kuch PJ. 1999. Rethinking Regulation of Animal Agriculture. Choices :9-13.
MacDonald JM, Ollinger ME. 2000. Scale Economies and Consolidation in Hog Slaughter.American Journal of Agricultural Economics 82(2):334-46.
Manchester AC, Blayney DP. 9/1997. The Structure of Dairy Markets: Past, Present, and Future[Web Page]. Located at: http://www.econ.usda.gov/. Accessed 5/1999.
Martin L, Kruja Z, Alexiou J. 3/3/1998. Prospects for Hog Production and Processing in Canada.Research Park Centre, 102-150 Research Lane, Guelph, Ontario, N1G 4T2: GeorgeMorris Centre.
Martinez S. USDA Economic Research Service. 12/1998. The US Pork Industry: As ItChanges, Consumers Stand to Benefit [Web Page]. Located at:http://www.econ.ag.gov/epubs/pdf/agout/dec97/ao247e.pdf. Accessed 4/23/1999.
Martinez S. 8/1997. Vertical Coordination and Consumer Welfare: The Case of the PorkIndustry, AER-753. Washington, DC: Economic Research Service, USDA. Located at: http://www.econ.ag.gov/epubs/htmlsum/aer753.htm (summary only).
Martinez SW, Smith KE, Zering KD. 1998. Analysis of Changing Methods of VerticalCoordination in the Pork Industry. Journal of Agricultural and Applied Economicsv30(n2):301-11.
Maxwell D. 1998. How Would Proposed Changes in Federal Estate Taxes Affect Farmers?Collender R, editor. Issues in Agricultural and Rural Finance, Agriculture InformationBulletin No. 724. Washington, DC: Economic Research Service, U.S. Department ofAgriculture.
McBride WD. 11/1995. U.S. Hog Production Costs and Returns, 1992: An EconomicBasebook, Agricultural Economic Report 724. Washington, DC: USDA EconomicResearch Service. Located at: http://www.econ.ag.gov/Prodsrvs/rept-ldp.htm#hogs.

V-2-281
McCorriston S, Sheldon IM. 1997. Vertical Restraints and Competition Policy in the U.S. andU.K. Food Marketing Systems. Agribusiness 13(2):237-52.
McEwan K, Economist, Ontario Ministry of Agriculture and Food, Ridgetown College ofAgricultural Technology, Ridgetown, Ontario, Canada. N0P 2C0. 4/16/1999.Observations about the structure of the Manitoba swine industry, personalcommunication.
Metcalfe M. 2000. State Legislation Regulating Animal Manure Management. Review ofAgricultural Economics 22(2):519-32.
Miller M. 1998. Changing the Way You Do Business. Pork '98 :38-42.
Minnesota State Legislature. Minnesota Statutes 1998; Chapter 500. 1998. 500.24 Corporateand Partnership farming [Web Page]. Located at:http://www.revisor.leg.state.MN.us/stats/500/24.html. Accessed 5/1999.
Mo Y, Abdalla CW. 1998a. Analysis Finds Swine Expansion Driven Most by Economic Factors,Local Decisions. Feedstuffs :20.
Mo Y, Abdalla CW. 3/1998b. Analysis of Swine Industry Expansion in the US: The Effect ofEnvironmental Regulation, Staff Paper 316. University Park, PA: Department ofAgricultural Economics and Rural Sociology, Pennsylvania State University.
Morse G, Ha I, Conlin BJ, Buhr B, and Lazarus W. 4/1995. Becker/Ottertail Dairy Retention andEnhancement Program, Research Report. St Paul, MN: Mn Extension service, Universityof MN.
Moschini G, Meilke KD. 1992. Production Subsidy and Countervailing Duties in VerticallyRelated.Markets: The Hog-Pork Case between Canada and the United States. AmericanJournal of Agricultural Economics 74(4):951-61.
Mowrey C. 1998. Top 50 Co-ops Handle 120 Billion Pounds of Milk. Hoard's Dairyman :681.
Muth M, Wohlgenant MK. 1999. A Test for Market Power Using Marginal Input and OutputPrices With Application to the U.S. Beef Processing Industry. American Journal ofAgricultural Economics 81:638-43.
Novak MP, LaDue EL. 1997. Stabilizing and Extending Qualitative and Quantitative Indicatorsof Creditworthiness in Agricultural Credit Scoring Models. Agricultural Finance Review57.

V-2-282
Offutt S, Smith KR, Ballenger N. 1998. Have Farmers Lost Their Uniqueness? Comment.Review of Agricultural Economics 20(1):203-5.
Olson KD, Christensen JL, Weness EJ, Anderson RD, Fales PA, Nordquist DW. Department ofApplied Economics, University of Minnesota. 3/1999. 1998 Annnual Report of theSouthwestern Minnesota Farm Business Management Association, Staff Paper P99-2[Web Page]. Located at: http://agecon.lib.umn.edu/mn.html#sp. Accessed 4/23/1999.
Oltjen J, Beckett J. University of California, Davis CA. 1996. Role of Ruminant livestock insustainable agriculture [Web Page]. Located at:http://zazu.lib.umn.edu/cgi....j(0000213389)&sp.record.source.p=HOTLINK. Accessed5/1999.
Osei E, Lakshminarayan PG. 12/1996. Determinants of Dairy Farm Location, Working Paper96-WP 174. Ames, Iowa: Center for Agricultural and Rural Development, Iowa StateUniversity.
Outlaw JL, Schwart RBJr, Knutson RD, Pagano AP, Miller JW, Gray AW. 5/1993. Impacts ofDairy Waste Management Regulations, AFPC Policy Working Paper 93-4. CollegeStation, Texas: Agricultural and Food Policy Center, Texas A&M University.
Park D, Seidl A, Davies S, Frasier WM. 6/2000. Environmental Policy Influences on LivestockStocking and Location Decisions. Fort Collins, Colorado: Department of Agriculturaland Resource Economics, Colorado State University. Located at: http://agecon.lib.umn.edu/cgi-bin/pdf_view.pl?paperid=2224.
Paul CJM. 2001. Market and Cost Structure in the U.S. Beef Packing Industry: A Plant-LevelAnalysis. American Journal of Agricultural Economics 83(1):64-76.
Perry J, Banker D, Green R. 4/1/1999. Broiler Farms' Organization, Management, andPerformance, Agriculture Information Bulletin No. 748. Washington, DC: ResourceEconomics Division, Economic Research Service, U.S. Department of Agriculture. Located at: http://www.econ.ag.gov/epubs/pdf/aib748/.
Perry J, Johnson JD. 9/30/1996. Management Decisions Made by U.S. Farmers. Washington,DC: USDA Economic Research Service. Located at: http://www.econ.ag.gov/briefing/fbe/fba/fba1.htm.
Peterson WL. 1/1997. Are Large Farms More Efficient? St. Paul, Minnesota: Department ofApplied Economics, University of Minnesota.
Polson J, Shoemaker D, Oelker E, Schnitkey G. 10/1997. Dairy Excel's 15 Measures of DairyFarm Competitiveness. Columbus, Ohio: Ohio State University, Cooperative Extension.

V-2-283
Prim R, Spanier D, Stanislowski H. undated. Business Structure for Dairies in Minnesota. StPaul, MN: MN Department of Agriculture.
Pritchett JG, Liu DJ. Estimating Backward Integration in a Primary Input Market: The Case ofU.S. Hog Industry. Proceedings of the Sixth Joint Conference on Agriculture, Food, andthe Environment. Minneapolis, Minnesota. 1994 Buford Avenue, St. Paul, MN 55108:University of Minnesota, Center for International Food and Agricultural Policy.
Pritchett JG, Liu DJ, Kaiser HM. 1998. Optimal Choice of Generic Milk AdvertisingExpenditures by Media Outlet. Journal of Agricultural and Resource Economics 23(1):155-69.
Putman JJ. USDA-ERS. 1997. Food Consumption, Prices, and Expenditures 1979-97 [WebPage]. Located at: http://www.econ.ag/epubs/pdf/sb965/. Accessed 5/1999.
Putnam JJ, Allshouse JE. 4/26/1999. Food Consumption, Prices, and Expenditures, 1970-97 ,Statistical Bulletin No. 965. Washington, DC: Food and Rural Economics Division,Economic Research Service, U.S. Department of Agriculture. Located at: http://www.econ.ag.gov/epubs/pdf/sb965/index.htm.
Quiroga RE. 1991. The structure of dairy production technology. 206 leaves, bound : Includesbibliographical references.
Reimund DA, Martin JR, Moore CV. 4/1981. Structural Change in Agriculture: The Experiencefor Broilers, Fed Cattle, and Processing Vegetables, Technical Bulletin 1648.Washington, DC: USDA Economics and Statistics Service.
Roka F. 1993. An Economic Analysis of Joint Production Relationships Between Pork andSwine ManureNorth Carolina State University.
Royer JS, Rogers RT, Editors. 1998. Industrialization of Agriculture: Vertical Coordination inthe U.S. Food System. Aldershot, England; Brookfield, Vermont: Ashgate.
Rust JW, Sheaffer CC, V R Eidman VR, Moon RD, Mathison RD. University of Minnesota. 1995. Intensive Rotational Grazing for Dairy Cattle Feeding [Web Page]. Located at:http://www.zazu.lib.umn.edu/cgi-bin...j(0000340877)&sp.record.source.p=HOTLINK.Accessed 5/1999.
Schmit TM, Reberte JC, Kaiser HM. 1997. An Economic Analysis of Generic Egg Advertisingin California, 1985-1995. Agribusiness 13(4):365-73.
Schnitkey G, Miranda M. 1993. The Impact of Pollution Controls on Livestock-Crop Production.Journal of Agricultural and Resource Economics 18:25-36.
V-2-284
Schroeder T, Ward C. 6/30/2000. Price Discovery Issues and Trends in Cattle and Hog Markets. Kansas State University and Oklahoma State University. Located at: http://agecon.lib.umn.edu/cgi-bin/pdf_view.pl?paperid=2216.
Schroeder TC, Jones R, Mintert J, Barkley AP. 1993. The Impact of Forward Contracting on FedCattle Transaction Prices. Review of Agricultural Economics 15:325-38.
Senauer B. 4/2001. The Food Consumer of the 21st Century: New Research Perspectives,Working Paper 01-03. St. Paul, Minnesota: Retail Food Industry Center, University ofMinnesota.
Senf DR. 1994. Farmland and the Tax Bill: The Cost of Community Services in ThreeMinnesota Cities. 14758 Ostlund Tr. N., Marine on St. Croix, MN 55047: AmericanFarmland Trust and Land Stewardship Project.
Sensenbrenner et al. 2/11/1999. Bill to rescind the consent of Congress to the NortheastInterstate Dairy Compact. (Introduced in the House), H.R. 744.
Short S. 9/2000. Structure, Management, and Performance Characteristics of Specialized DairyFarm Businesses in the United States. Washington, DC: USDA Economic ResearchService. Located at: www.ers.usda.gov.
Siebert JW, Jones R, Sporleder TL. 1997. The VEST Model: An Alternative Approach to ValueAdded. Agribusiness: An International Journal 13(6):561-7.
Smith R. 1999. Food Industry Sets Record For Acquisitions and Mergers. Feedstuffs .
Sommer JE, Hoppe RA, Greene RC, Korb PJ. 12/1998. Structural and Financial Characteristicsof U.S. Farms, 1995: 20th Annual Family Farm Report to the Congress, AgricultureInformation Bulletin No. 746. Washington, DC: Resource Economics Division,Economic Research Service, U.S. Department of Agriculture. Located at: http://www.econ.ag.gov/epubs/pdf/aib746/.
South Dakota Legislative Research Council. Statutory Titles in South Dakota [Web Page].Located at: http://www.state.sd.us/state/legis/lrc/statutes/. Accessed 6/4/1999.
Sparby M, AURI Program Development Director. March 9, 2001. Presentation on Financingand Business Planning, at the On-Farm Dairy Processing Roundtable. University ofMinnesota, St. Paul, MN:
Srivastava R, Ziggers G-W, Schrader L. 1998. Vertical Coordination in the Swine Industry: AMulti-County Study. Canadian Journal of Agricultural Economics 46:539-48.
V-2-285
Stahl TJ, Conlin BJ, Seykora AJ, Steuernagel GR. 1999. Characteristics of Minnesota DairyFarms That Significantly Increase Milk Production From 1989 to 1993. Journal of DairyScience 82(1):45-51.
Stigler GJ. 1958. The Economies of Scale. Journal of Law and Economics 1:54-71.
Strange M, Higby A. 11/1995. From the Carcass to the Kitchen: Competition and the WholesaleMeat Market. Walthill, Nebraska: Center for Rural Affairs.
Strasser S. 1989. Satisfaction guaranteed : the making of the American mass market. New York:Pantheon Books.
Suzuki N, Kaiser HM. 1997. Imperfect Competition Models and Commodity PromotionEvaluation: The Case of U.S. Generic Milk Advertising. Journal of Agricultural andApplied Economics 29(2):315-25.
Taff SAssociate Professor, Department of Applied Economics, University of Minnesota, personalcommunication. 5/13/1999.
Tank ANational Pork Producers Council. 1/12/1999. Percent Change in Pork Production andPercent Change in Price in Recent Hog Production Cycles (from presentation at theMinnesota Pork Congress, Minneapolis Convention Center, January 28, 1999), personalcommunication.
Tosh M. 1999. Meatier Issues. Progressive Grocer :59-60.
Turetsky D. 6/11/1996. Statement before the Committee on Commerce, Science, andTransportation, U.S. Senate. Washington, DC: Antitrust Division, U.S. Department ofJustice. Located at: www.usdoj.gov/atr/public/testimony/turetsky.696.html.
Ward C, Schroeder TC, Barkley AP, Koontz SR. 5/1996. Role of Captive Supplies in BeefPacking. Washington, DC: Grain Inspection, Packers and Stockyards Administration,USDA. Located at: http://www.usda.gov/gipsa/newsinfo/pubs/pubs.htm#psp.
Ward RW, Stevens T. 2000. Pricing Linkages in the Supply Chain: The Case For StructuralAdjustments in the Beef Industry. American Journal of Agricultural Economics82(5):1112-22.
Watson C. 1993. Group Financial Arrangements EDed. Networking: Competitive Positioningfor Pork Producers. West Des Moines, IA. P.O. Box 10383, Des Moines, IA 50306:National Pork Producers Council.
V-2-286
Wilcox D. Agricultural Development Section, Minnesota Department of Agriculture. 2/1/2001.Feedlot Financial Needs Assessment Report [Web Page]. Located at:http://www.mda.state.mn.us/feedlots/assessment.pdf. Accessed 2/26/2001.
Wilson PN, Dahlgran RD, Conklin NC. 1993. "Perceptions as Reality" on Large-Scale DairyFarms. Review of Agricultural Economics 15(1):89-101.
Wolf SA. 1998. Privatization of Information and Agricultural Industrialization. Boca Raton,Florida: CRC Press.
Young CE, Kantor LS. 1998. Moving Toward The Food Guide Pyrimid Implications for USAgriculture. Washington, DC: ERS-USDA. Located at: http://www.econ.ag.gov/ers.
Young CE, Westcott PC. 1996. The 1996 U.S. farm act increases market orientation, Agricultureinformation bulletin 726. Washington, DC: U.S. Department of Agriculture, EconomicResearch Service.
Zimmerman FM, Professor of Manufacturing Systems Engineering, University of St. Thomas.1998. The Relocation of Industry. St. Paul, Minnesota: University of St. ThomasTechnology Press.

V-2-287
V-2. Literature Review Update: Regional Economic Impacts of AnimalAgriculture
by George W. Morse and Steffanie Guess-Murphy
TABLE OF SECTION V-2 CONTENTSSUMMARY OF NEW LITERATURE ADDED ....................................................................... 289SUMMARY OF FINDINGS ...................................................................................................... 289CRITICAL REVIEW OF INFORMATION SOURCES............................................................ 291RECOMMENDATIONS FOR FUTURE RESEARCH............................................................. 316REFERENCES ........................................................................................................................... 319

V-2-288
INTRODUCTION
This section is an update of the 1999 Literature Review on External Costs and Benefits, SectionII on community monetary flows. It focuses on the employment and income impacts tocommunities, regions, or states of livestock production and processing. For brevity, the earlierreport is referred to as the 1999 GEIS Report and this current report as the "2001 GEIS Report."
The purpose of this literature review is to see how regional and community economies areimpacted by animal agriculture. This literature review will explore the following questions:
1) What are the overall economic benefits of animal agriculture (from all sources, includingspin-off economic activity?
2) How do the benefits vary by type of production method, size, and location of operation andthe animal population/ density in area?
3) How are the economic benefits distributed locally (between owners, operators, employees,neighbors, and others) and in the state economy?
Primary attention is given to studies that have been done on Minnesota’s livestock industry. Studies done in other parts of the nation that appeared to have useful insights for Minnesota arealso covered. The studies are organized by species, followed by general livestock studies. Bothfarm production and processing plant studies are considered. Several very useful linkage studiesof agriculture’s contribution to a state’s economy were found but these did not focus onlivestock and thus were not reviewed in detail (Tanjuakio and others 1996; Carter and Goldman1998; Senf and others 1992).
Ongoing research is integrated into the sections rather than having a separate section as in the1999 GEIS report.
Under each section, we first report those studies which have been published in peer reviewedjournals or are in Ph.D. theses. Then we report the ongoing research studies which are inworking papers, staff papers, conference proceedings, or conference papers. We discuss theseseparately because they have not been reviewed by the profession as carefully. We giveconclusions and the strengths and weaknesses of each study so that policymakers could use thosethey feel are sufficiently strong and ignore the rest. However, we caution the readers to use thesevery carefully. First, this review of strengths and weaknesses come from only one set of authorsand not a team of three independent reviewers plus an editor. Second, these reviews are notanonymous which potentially introduces some bias.7 The pieces of on-going research are also 7 For non-academics, this might need some clarification. Consider the consequences if you review an articleauthored by someone controlling grant funds for which you are applying and your review is very critical. Considerthe consequences if you write a very negative review on a very well known person in the field. In both cases theanonymous review, where you neither know the author nor they know the reviewer leads to better reviews.

V-2-289
listed separately in the References section.
A primer on the terminology and methods used in regional economic analysis is included inAppendix A.
SUMMARY OF NEW LITERATURE ADDED
Twenty-six additional research publications, not available for the 1999 GEIS Report, areincluded in this paper. Greater emphasis has been put on the results from anonymously peerreviewed articles rather than ones that are still in the formative stages. All journal articles whichhave met the minimum standard of having been published in a peer reviewed journal areincluded; we do not take into account the journals• rankings in terms of rigor and academicprestige.
SUMMARY OF FINDINGS
The following summarize the major findings of this portion of the literature review:
1) None of the studies found provide estimates of the net impacts of changes in the size of thelivestock industry, after considering potential offsetting effects. In very tight labor markets,reductions in the livestock industry will release labor which will be used in other industries. If those industries contribute more to the state's gross state product than livestock, the netimpacts would be positive rather than negative. While we doubt this would be the case,none of the current research provides insights on this question.
2) Nearly all of the studies found, although labeled "impact" studies, were descriptive studiesthat traced the economic linkages between livestock and other sectors. While these studiescan show the economic importance of the sector, the data they provide can not be used toestimate the net impacts of a change in the livestock industry.
3) Studies of the impacts of livestock or livestock processing that use a with/without approach,comparing changes between economic variables in a given community and in "twin"communities have to be very careful in selecting the twins. We found no studies thatreported on the characteristics of the twins in sufficient detail that we could be confident thatthe livestock plants caused the changes noted.
4) The literature on whether small farmers buy more locally than large ones yields mixedresults. An early study suggested that the percent of local purchases was lower for largefarms but that the total amount was as high as for small farms. A more recent study showsthat generally the small farms do buy more within their county but buy almost all of their

V-2-290
inputs within the state.
5) The local employment and income impacts of larger pork farmers are higher than small oneswhen the survival rate is considered. If it were possible to keep all small farms in operationover time, they would contribute more to the local economies. The quality of jobs, in termsof wages per worker, was higher for large pork farms whether or not survival is considered.
6) Meatpacking plants provide benefits to local farmers but the wages paid are considerablylower than the average manufacturing wage. These wages have fallen greatly over the pastdecade as the meat packing plants have moved from urban unionized plants to rural non-unionized plants. However, the studies that use a before/after approach to examine theimpacts of these plants are not methodologically correct. Given the changes in the structureof the industry, the studies would have needed to use a carefully designed with/withoutapproach.
7) Presumably the labor in the meat packing plants are better off than their next best alternativeemployment or they won't stay. Many workers do not stay with turn over rates being high. However, if the plants are able to find employees, the current ones must be better off thanthey would be in their next best alternative. The impacts on the social aspects of thecommunity are less clear but beyond this part of the report.
8) Meatpacking and poultry processing is moving to fewer big plants in remote rural areas. Thisreduces the odds that communities can use this as a development strategy. However, if thecommunity is remote enough and other alternative jobs are scarce these plants can have apositive impact.
9) Wages appear to be competitive in the livestock production, after controlling for skills andregional differences. However, the research base for this conclusion is very thin.
10) The public sector fiscal impacts of livestock operations appear to be positive. Again, theresearch base for this is very preliminary and needs much greater attention. Further, thisresearch does not tell us what would happen if the size of the livestock sector changed in acommunity or region.
11) Research on the impacts of farm size on poverty has used either the comparable areaapproach or a variation using multiple regression analysis. The most comprehensive study found rural poverty rates were influenced most by social relations and economic structure ofthe region and least by the size of farms.
12) In order to evaluate the trade-off between economic benefits and environmental or socialcosts of livestock production, changes have to be studied at the community or regional level. Studies done in other regions can not be extrapolated onto a local economy since the regionsare likely to have different economic structures. Consequently, the same type and size of

V-2-291
livestock operation will have very different impacts in different types of local economies. Similar differences are probably true on the environmental side. The value of this generic study is in guiding future research rather than in guiding public policy.
CRITICAL REVIEW OF INFORMATION SOURCES
Minnesota Dairy Production StudiesNo peer reviewed journal articles were found on the regional impacts of the Minnesota dairyindustry.
Two studies reported in sponsored projects examined the dairy industry•s regional economicimpacts within Minnesota. The first is an impact study but ignores offsetting effects. Thesecond is a linkage study. A third study was found that tried to examine the impacts of differentsizes of dairy farms.
In 1992, Ag*nomics Research estimated the impacts that differing production trends in the dairyindustry would have on support industries and on state tax revenues by the year 2000. This studyused regional input-output analysis to estimate the changes in payroll, employment, value-addedincome, and state tax revenue of alternative trends in dairy farm production.
The impacts are overstated because the authors failed to account for the offsetting effects ofincreases in employment in other sectors due to the labor released from the dairy industry. Theestimates provided in this study assume that none of the workers who lose their jobs as a result ofreduced dairy farm production will ever find new jobs. Especially in tight labor markets, this isvery unlikely. While some of those that stop farming will not work again, many of these aresimply retiring. The reduction in employment comes from the fact that the younger generation isnot going into the dairy farm. However, if that younger generation goes into a more lucrativetype of work and earns more than they would have on the farm, the state’s economy couldactually improve. It is difficult to determine what the net effect would be if this type ofoffsetting effect had been included.
In 1999 the University of Minnesota Extension Service published a linkage report on theEconomic Importance of Minnesota’s Dairy Industry (Doherty and Morse 1999). This is adescriptive report that traces the linkages between dairy farms, dairy processors, and other sectorsin the state’s economy. While this study demonstrates the importance of the dairy industry, it cannot be used to estimate the impact of expansion or contraction of the size of the dairy industry. Estimates of the impacts of expansions or contractions in the dairy industry would need toexamine potential offsetting effects in other industries. To examine the net effects would requireexplicit definition of the offsetting effects in other sectors.

V-2-292
While this study by Morse and Doherty (1999) did not make the same mistake regarding offsetting effects, it is on the edge. Readers might assumethat they could extrapolate the descriptive results shown in these types of descriptive linkage studies when there is a change in the size of thelivestock industry. This is only correct if the proper offsetting effects are considered.
Doherty (1999) estimates the economic contributions of several sizes of dairy herds. Usinginput-output, she compares the contributions on the state if all herds were in different sizecategories. She points out in the preliminary work that the survival rate of the different sizes offirms will make a difference in the actual impact. For example, if the larger dairy farms have alarger impact (controlling for total output) but a lower survival rate, then their impact would bediminished. Unfortunately, her research does not have the survival rate factored into the finalestimates. This could be done in future research, however.
All of these studies used IMPLAN regional input-output models. A discussion of IMPLANstrengths and weaknesses comes at the end of section 2.1.
Dairy Production Studies in Other States: Only one peer reviewed journal articles was foundon the regional impacts of dairy operations (Hanson, 2000). Unfortunately, this article discussesan integrated modeling approach, which is currently under development, for examiningsustainable dairy production in eastern Pennsylvania. The express purpose of this article is toillustrate the complexity of this issue and to urge authors to empirically demonstrate the impactof equality issues on sustainability. It presents no empirical results.
Two working papers or Extension publications on the regional economic impact of dairyproduction were found. The first is an impact study of expanding dairy herds in North Dakota,but it does not consider offsetting effects. The second is a linkage study to show thecontributions of the current industry in Idaho.
A 1993 study examined the impact on North Dakota of adding twenty 500-cow dairy herds to the state’s economy. Using regional input-outputanalysis, this study estimated the total increase in value-added income to full-time jobs from the addition of the twenty 500-cow dairy herds (Leistritz 1993). These estimates appear valid if the following two assumptions are valid. First, the new jobs go to in-migrants or to new entrantsto the labor force. If the new jobs go to existing workers who are commuting to jobs outside the region then the new income to the region would belower than estimated here. Second, if the jobs go to workers who already work within the region and in-migrants do not come in to take their jobs,this development could drive up wages in the region. Then the number of total jobs would not increase as rapidly as shown by this model. While itis unlikely that wages in the dairy farms would be high enough to cause these shifts, additional analysis would be needed to evaluate the degree towhich these two factors are likely to influence the results.
Another 1993 linkage study examined the importance of dairy production in Idaho (Robison andothers 1993). Idaho had 24 percent more cows in 1991 than in 1970, compared to a 25 percentdrop nationally (p.1). Using an Idaho regional input-output model, the authors estimate thepercent of the state’s gross income in 1989 due to milk and milk processing, measured in value-added terms. Due to differences in the local economic structure the multiplier effects variedconsiderably from region to region. Like the Doherty and Morse (1999) study for Minnesota, thisis a descriptive linkage study that has no implications about the potential impacts of changes inthe size of dairy herds.

V-2-293
Dairy Processing Studies in Minnesota: No peer reviewed journal articles were found on milkprocessing plant regional impacts.
In Minnesota, there were three working papers prepared for the Rural Design Center, Universityof Minnesota (Guess-Murphy 1999a, 1999b, 2000). All three studies used input-output analysiswith type SAM multipliers in the estimation process.
The first study (Guess-Murphy 1999a) estimated the employment and income impacts of theexpansion of First District Association (a milk processing plant located in Litchfield, Minnesota)on a six-county region in Minnesota. This six-county region consisted of Kandiyohi, McLeod,Meeker, Renville, Stearns, and Wright counties. Further, this study estimated the economicimpacts that would result from an increase in the local milk supply to the milk processing plant. The author estimated the economic impacts under three different scenarios. The first scenarioused data from the processing plant to develop a basis to compare the next two scenarios. Therefore, the first scenario just shows the linkages of First District Association (FDA) when itoperates at its 1998 level of production. Further, it assumed that FDA receives 60 percent of itsmilk supply from within the six-county region. The second scenario estimates the impacts of anincrease in local milk supply to FDA. It assumes that FDA’s level of production is fixed at its1998 level of production, but now it receives 100 percent of its milk supply from within the six-county region. The final scenario estimates the impacts of a 25 percent increase in the level ofproduction of FDA assuming that it can receive 100 percent of its milk supply from within theregion.
The second study (Guess-Murphy 1999b) also estimated the employment and income impacts ofthe expansion of a dairy processing plant. However, this study estimated the economic impactsof the expansion of Associated Milk Producers Incorporated (AMPI) on the eight-county regionof Dodge, Fillmore, Goodhue, Houston, Mower, Olmstead, Wabasha, and Winona. Like theabove study, this study also estimated the impacts associated with an increase in the local milksupply to the dairy processing plant. Further, the same scenarios were used as in the first study.
The main objective of the third study (Guess-Murphy 2000) was to estimate the impact of anincrease in the number of dairy cows on three different regions under two different scenarios. The scenarios dealt with the size of the farms that would receive the additional dairy cows(30,000 additional dairy cows to be exact). First, it was assumed that only small farms (50-99)head would receive the 30,000 additional dairy cows. Then, the economic impacts associatedwith the increase in milk production from the additional dairy cows were estimated for MeekerCounty, a six-county region consisting of Kandiyohi, McLeod, Meeker, Renville, Stearns, andWright, and Minnesota as a whole. Next, it was assumed that only medium-sized dairy farms(200+ head) received the 30,000 additional dairy cows. As in the first scenario, the economicimpacts associated with the increase in milk production was estimated on the three regions.
The purpose of all three of Guess-Murphy studies was to examine the relative impacts ofdifferent arrangements within the dairy industry. As such, the question of offsetting effects are

V-2-294
probably not as relevant as with other studies. However, these studies can not be used to showthe net impacts of reductions in dairy production.
Summary of Dairy Regional Economic Impact Studies: The research on the regionaleconomic impacts of dairy production and processing is in its infancy. No peer reviewed journalarticles were found that estimated either the economic linkages or the economic impacts ofchanges in the dairy production or processing.
The working papers and Extension publications either are linkage studies which show the currentimportance of the industry and its support industries or are impact studies that do not report onthe offsetting effects. Consequently, it is impossible to determine the net impacts of thesechanges from these studies.
Only two of the studies report on wages or personal income. However, all eight of the studiesreported on the total value-added income impacts which includes wages as well as profits,interest, and indirect business taxes. Three of the studies reported the changes in value-added tocrops or the number of additional jobs in crops as a result of the dairy production. None of thesestudies examined the changes in property values. Two estimated the changes in tax revenues,and seven of eight estimated the changes in total number of jobs in the state economy.
Three of the studies are descriptions of the linkages of the dairy industry to the rest of theeconomy and make no predictions of the impacts on the economy from changes in the dairyindustry (Doherty and Morse 1999; Doherty 1999; Robison and others 1993). Five studiesattempt to predict changes in the state’s economy from changes in the dairy industry. TheAg*nomics study estimates overall trends in milk production and uses these estimates to predictthe changes in the input and consumer sectors stemming from these changes. Since this studydid not address the potential for offsetting effects, it is not possible to determine whether the netresults will be positive or negative.
The Leistritz (1993) report examines the impacts of twenty, 500-cow herds on the state’seconomy. If there are no price effects due to increased wages stemming from lack of sufficientin-migration of labor or due to shortages in other inputs, then these estimates are reasonable. Additional research would be needed, however, to confirm the validity of these conditions.
All of the studies address the general importance of dairy. Yet, none of them satisfactorilyaddress the net changes in a region’s economy due to changes in the dairy industry. The NorthDakota study probably comes the closest to doing this but both the estimates and the offsettingeffects would need to be localized to guide zoning policies. Since the nature of the impactsdepends on the structure of the local economy, both the size and the distribution of the impactswill vary with the region being studied. This was demonstrated in the Idaho study that reporteddiffering multipliers for the same processing sectors in different regions.

V-2-295
Research on local feedlots would need to factor in offsetting effects. This will also vary widelyfrom region to region. In areas of very high unemployment and little rural residentialdevelopment there will be minor offsetting effects. However, if labor markets are tight and theland is likely to be used for high valued residential developments, the offsetting effects will behigh
Minnesota Pork Production Studies: One Ph.D. thesis examines the linkages between the porkindustry and local economies and the linkages between the pork industry and the state’s economy(Platas, 2000). This also is reported in a popular article (Lazarus, Morse, Platas, and Guess-Murphy, 2000) , Since this study focuses on regional purchasing patterns it is reported under thesection on "Purchased Supplies by Location of Purchase."
A second study is reported in a working paper. A 1992 study by Jahae and van Staalduinenestimated the impacts of a proposed 1200 sow unit on Redwood County, Minnesota and on theeconomy of Minnesota as a whole. They concluded that final demand, total industrial output,property income, employee compensation income, total income, total value added, employment,and population would all increase in both the county and the state due to the proposed sow unit. They estimated a total effect, including indirect and induced effects, of 17 jobs in RedwoodCounty (p. 19) and 25 jobs in Minnesota (p. 24). The production function was adjusted to reflectthe fact that this new unit would be more efficient than the average unit in southern Minnesota(p.1).
Pork Production Studies in Other States: Nine studies have released non-peer reviewedarticles on the pork industry. These are now summarized.
An integrated input-output/econometric model was used by Iowa State University economists toestimate the impacts of different sizes of pork operations. These are reported in two articles(Otto and others 1998; Otto and others 1996). Thompson and Haskins (1998) provided acritique of these articles. All three are reviewed here.
The two articles by Otto, et al. were based on the same research, originally reported in the 1996Pork Industries Economic Review, published by the National Pork Producers Council. Startingwith data from Purdue University on the costs of production and time required on farrow-to-finish operations of 150, 300, 1,200, and 3,400 sows, they used regional input-output analysis toestimate the multiplier effects of each size of operation. In the first paper (Otto and others 1996),they report the impacts under two different assumptions about corn. In the first case, theyassume that the additional pork production will stimulate additional corn production, resulting inhigher regional employment and incomes. In the second case, they assume that there already is asurplus of grain and that this is exported out of the region. In this case, the additional porkproduction would result in less exports but no increase in corn production. Consequently, thespin-off effects would be less. The data from Purdue shows a negative return to capital for the150-sow unit with proportionally higher returns to the larger units.
V-2-296
The authors compared the impacts of a farm in each of the four sizes of sow units. Naturally, thelarger units show more positive impacts on the total number of jobs. The scenario that assumedcorn production would increase as a result of the pork production yielded slightly higher totalemployment but lower earnings per worker.
As discussed in a later section, the local impacts depend on the level of local spending for inputsand consumer spending by farmers. The Otto, et al. studies did not make any adjustment forpotential differences due to size. As discussed later, this omission probably gave a slightadvantage to the smaller farms since larger livestock farms spend more per acre (Chism 1993). Note that this conclusion is very tentative since the data on this relationship is based on a verysmall sample.
Thompson and Haskins (1998) correctly criticize the 1998 article (Otto and others 1998) forfailing to compare the net impacts on the community if all the production had been in the smallerfarms rather than the larger ones. That is, they argue that Otto, et al. should have held the levelof output constant for the four different sizes rather than comparing one very small farm withother larger farms. Using the data from Otto et al. reports, Thompson and Haskins show thattwenty-three of the smallest farms would produce the same amount as the largest farm. UsingOtto et al.’s data, Thompson and Haskins go on to show that if all the production was in thesmallest farms they would employ considerably more persons than the one large one (p. 4).
However, Thompson and Haskins incorrectly suggest that it does not matter whether or not aparticular size of operation survives or not. Their argument appears logical if all sizes of hogoperation are equally likely to survive over the long haul. If one size is more likely to fail thanthe other, then we need to estimate the probability of survival and multiply that times theestimated impacts in order to get a reasonable estimate of the long-term impacts on the region. Neither Thompson/Haskins nor Otto et al. make this type of estimate.
Thompson and Haskins correctly state the strengths and weakness of formal mathematicalmodels such as regional input-output models. They state:
“They use a mathematical model to compute the conclusions that must follow from theassumptions they make. That way, if the methods are sound and they have done thearithmetic correctly, a reader is forced either to accept their conclusions, or to argue withthe assumptions. The model rules out accepting the assumption but disagreeing with theconclusions that follow. That’s the benefit and the power of formal methods ofmathematical modeling. But it’s also their weakness.” (p. 7)
Note, however, that the conclusions that Thompson and Haskins refer to are the factualconsequences of a specific economic shock. Input-output models can provide no “conclusions”on the correct policy to follow. Policy conclusions can come only with a blend of the factualimpacts provided by the models and value judgements (Barrows 1993).

V-2-297
Thompson and Haskins then question the veracity of the cost data used by Otto, et al. Whilepossibly this data is incorrect, Thompson and Haskins provide no evidence to this effect. Anevaluation of the accuracy of this data is beyond the scope of this literature review and wouldtake a team of production economists rather than regional economists.
The Iowa State study on the impacts of different sizes of pork operations (Otto and others 1996;Otto and others 1998) did not adjust the level of input purchases by farm size. As outlined in theoriginal report, the Otto, et al. papers found that larger pork operations had more positiveeconomic impacts than smaller ones. As Thompson and Haskins (1998) point out the Otto, et al.papers should have set the total level of output equal before making a comparison but did not. When this is done, the smaller farms appear to have the advantage in terms of number of jobs butthe disadvantage in terms of the quality of those jobs (i.e. income per worker). However, theThompson and Haskins analysis fails to consider the survival rate of different sizes of farms. Iflarger pork farms are more likely to survive than smaller ones, as Otto, et al. suggest, then theeconomic benefits of large farms are likely to be larger than the small ones.
The Platas study reviewed in detail under the section on regional purchase coefficients correctsfor many of the concerns identified by Thompson and Haskins. It found that larger porkoperations had a greater impact than smaller ones when controlling for the expected differencesin survival rate.
In a 1994 study, DiPietre and Watson used input-output analysis to estimate the impacts ofPremium Standard Farms on the state of Missouri and a five county region where the hogs andthe employees are located. They estimated the impacts during the five-year construction phaseas well as annually after the farm was in full operation (Table 2). These were ex ante estimatesso it is uncertain if the direct impacts were as high as estimated. Naturally, the total impactswould be less than these estimates if the direct ones are lower.
The construction costs were industry estimates on a per sow basis not exact figures fromPremium Standard Farms (p. 26). Type III multipliers, a special version of Type II which yield15 to 20 percent lower results than the Type II, were used to estimate the total effects. Table 2: Economic Impacts of the Premium Standard Farms, Missouri
Phase New Jobs Personal Income *Five Counties Missouri Five Counties Missouri
Construction # 873 1291 $87.2 $ 119.0Operation + 957 1639 $82.0 $ 199.0
# Results over the five+ Annual impacts* in Millions of dollars
V-2-298
Three additional studies estimated the economic impacts of pork production in their respectivestate using input-output analysis (McKissick and others 1998; Thornsbury and others 1993;Warner and Plaxico). The three states that were covered in these analyses were Georgia,Virginia, and Oklahoma, respectively. The Georgia study used IMPLAN for their analysis. TheGeorgia study estimated the total economic output, wages, and employment impacts of fourdifferent size plants on Bacon County, Georgia. The Virginia study estimated the economic andfiscal impacts of an expanding swine complex in Southside Virginia. This study used IMPLANto derive multipliers. The authors then used these multipliers in the Virginia Impact Projection(VIP) model to estimate the impacts. The main impacts estimated were employment, income,retail sales, and tax base impacts. The authors of this study did not detail the VIP model or theprocedure that they used, so no conclusions can be made about the validity of their results. TheVirginia study also estimated the impacts that would occur during the construction phase of thenew plant. The authors of the Oklahoma study did not specify what kind of model they used intheir analysis. They just stated that it was an input-output model. Thus, no conclusions can bemade about their results.
A 1998 study was conducted in Canada that combined economic impact analysis to estimateincome and employment impacts and social impact analysis to assess government andcommunity concerns (Serecon Management Consulting Inc.). This study used a form ofeconomic base model. Consequently, the results can provide no detail on the sectors that areimpacted.
The studies that come the closest to providing the type of information needed for evaluating the feedlot issue at the local level or to evaluateproposals concerning the most desirable structure of pork farming (mostly large or mostly small) are the ones by DiPietre and Watson, 1994; Otto,Orazem, and Huffman, 1998; and Otto, Lawrence, and Swenson, 1996. However, even if their results are reasonable they would not translate easilyto Minnesota’s economy and fiscal structure. Since most decisions on zoning are made at the local level, estimates need to be run for eachproposed project rather than at the state level.
Minnesota Poultry Production Studies: No peer reviewed journal articles were found onpoultry industry linkages or regional economic impacts for Minnesota. One Extension bulletinwas found that dealt with the economic contributions of the poultry industry in Minnesota.
A 1998 linkage study examined the importance of the poultry industry on Minnesota’s economy(Morse 1998). This study only traced the linkages between the poultry production sector, thepoultry processing sector, and the other sectors in Minnesota’s economy. The study did not try toestimate the economic impacts of expansions or contractions in the poultry industry.
By using regional input-output analysis, Morse found that the total number of jobs that werecreated in Minnesota due to the poultry industry was 26,344. Only 10,308 of these jobsdepended directly on the poultry industry. Over 10,000 jobs were created in the supplyindustries, and over 5,000 jobs were created due to increased spending by employees in thepoultry industry.

V-2-299
Besides employment impacts, this study estimated the income impacts associated with thepoultry industry. It was found that poultry producers and processors earned income of $317million. When the supporting industries are included, the estimated earned income for thepoultry industry was $905 million.
Poultry Production and Processing Studies in Other States: Three peer reviewed articleswere found related to poultry production and processing. All three were linkage or economicimportance studies.
Ryan, Carey and Birkhold (1999) trace the linkages between the broiler and egg industries to therest of the Texas economy. While they refer to this as the “economic impact” they use this termincorrectly. Refer to the earlier discussion on the differences between linkage studies and impactstudies.
An eight question survey was sent to twenty-three turkey, broiler, and egg producers. Since onlyone turkey grower responded, this sector was dropped from further analysis. The article reportson the total employment, payroll, feed milled, and gross income for broilers and eggs.
To estimate the indirect effects or multiplier effects, the article uses a generalized multiplierrather than one specific to Texas. They suggest that this “ probably understates the trueeconomic impact of these industries.” Yet, without the data on Texas they have no way ofknowing whether it understates or overstates the contribution to the Texas economy.Further they do not tell us whether they are using Type I, Type II, or SAM multipliers.
Brown (2000) compares the contributions of five red-meat-packing and five poultry-processingplants in their local economies. The study concludes that a $10-million expansion of poultryprocessing plants would contribute more to their local economies than a similar expansion of red-meat packing plants. Brown attributes this to the greater labor intensity of the poultry processingplants.
However, what would be the impact of the poultry processing plants if they were located in thesame communities as the red-meat packing plants and vice versa? Since both types of plantstend to locate close to areas with high levels of production, the impacts of these reverse locationsis likely to be much lower. That is, poultry plants located in the red-meat areas are likely to havemuch lower impacts than the red-meat plants simply because they would have to import theirpoultry from outside the region. Even if the poultry plants could survive, they would have verylow multiplier effects.
A 1995 study estimated that the poultry industry, including both production and processingsectors, in North Carolina helped to create approximately $1.6 billion in state income (Vukinaand others 1995). The poultry industry also supported close to 52,000 jobs. However, this studyis also a descriptive one and can not be used to estimate the impacts of changes in the size of thepoultry industry.

V-2-300
Another 1995 study examined the impacts of the poultry industry (Hurst and others 1995). Theauthors studied the impacts of the broiler and egg industry on Alabama. They used the RIMS IIinput-output model to estimate these impacts. The authors of this study did not explain theirprocedure for estimating the economic impacts of the poultry industry. Thus, we do not reportthe results since it is impossible to evaluate the validity of their assumptions and methods.
All of the poultry studies are descriptive ones which trace the linkages between sectors. Theycan not be used to estimate the impacts of an expansion or contraction of the poultry sectors.
Minnesota Beef Production Studies: No articles were found dealing with the economic impactsof the beef industry on Minnesota.
Beef Production in Other Studies: Two working papers were found about the economicimpacts of the beef industry. Both studies were for North Dakota.
A 1992 linkage study by Bangsund and Leistritz estimated the economic contribution of publicland grazing to the North Dakota economy. This study was only a descriptive study. It did nottry to estimate the impacts that a contraction or expansion in public land grazing would have onNorth Dakota.
The authors estimate that public land grazing contributed about $153.4 million to the NorthDakota economy in 1991. Public land grazing also generated over 1,800 jobs. The authors onlygave secondary employment impact estimates. Thus, public land grazing probably generatedmore jobs than just the 1,800 stated in the study.
A 1993 impact study by Leistritz and Sell estimates the economic impacts of expandedbackgrounding on the North Dakota economy. Backgrounding is a program in which producersof feeder cattle retain the cattle until they achieve a gain of 150 to 300 pounds after weaninginstead of selling the calves out of state. The authors estimate that expanded backgroundingwould generate 1,030 full-time secondary jobs. State tax revenue from additional use and salestax, personal income tax, and corporate income tax receipts were estimated to totalapproximately $1.4 million.
The employment impact estimate was only for secondary effects. Thus, the total employmentimpact is probably higher. Also, part-time employment was not considered in this study. Whenadding full-time and part-time employment, the number of jobs generated will increase. However, the estimates in this study assume that these jobs are going to in-migrants or currentlyunemployed residents. If current residents who are employed by other industries quit their jobsto seek work in this industry, the employment impact will be dampened.
V-2-301
Impacts of Meat Packing Plants: If rural areas attract new meat packing plants will thisstimulate additional economic growth and development in the community or region? What arethe odds that a community can attract these types of firms?
These questions are explored in an article by Drabenstott, Henry, Mitchell (1999). Meatprocessing is the largest rural manufacturing industry, accounting for about 50 percent of all ruralfood processing jobs. Further, “meat processing plants buy more material input per plant fromlocal sources (defined as being within a one-hour drive of the plant) than any of the other eightsectors in the food processing group” (Drabenstott, Henry, Mitchell, 1999, p. 66).
This article tracked the movement of meat packing plants using the Census Bureau'sLongitudinal Research Database (LRD). The LRD provided data on each plant for 1963, 1972,1982, and 1992.
Poultry processing plants moved from the Midwest and Northeast to the South, which had abouthalf of all poultry processing jobs in 1992. The Midwest remained the center of meat packing(58% in 1992) but the plants moved from urban to rural areas and from the eastern Corn Belt tothe western Corn Belt. The processed meats industry is primarily in the Midwest with someshifts from the Northeast to the South.
Drabenstott, Henry, and Mitchell suggest that remote rural areas appear to capture the most newjobs from new meat packing plants. They hypothesize that meat packing plants are searching forlower labor costs and moving closer to livestock herds in remote rural areas. Livestockproduction has moved to more remote areas as the size of herds has increased. The ability to shipboxed meat has made it better for plants to locate near the livestock. This has also resulted inlarger plants. Additional vertical integration in the pork and beef industries is expected to lead togreater geographic concentration in processing plants and larger production units. This suggeststhat few rural areas will attract new meat packing plants.
Wages have fallen abruptly in meat packing plants. This has lead to many of these jobs beingfilled by immigrants.
Farmers, however, are likely to benefit from new meat packing plants being located in theirregion. This research was also reported in a popular article by Drabenstott, Henry, and Mitchell,2000.
Pork Processing Impact Studies: Two studies examined the impacts of pork processing plants. One was published in a peer-reviewed journal andthe other was not.
Broadway (1999) reports on six case studies of hog-processing plants that reopened or moved to small towns in the Corn Belt. The plants offeredmore jobs than could be supplied by the unemployed labor force so commuters and immigrants filled the jobs. He suggests that only one of the sixserves as an example of what attracting a processing plant would do for a community with no experience with the industry. In this very small town(1,600), the 1,250 new jobs resulted in population growth and higher wages. However, these did not significantly increase retail sales.

V-2-302
A key to any study is that it provides sufficient detail on its research methods so someone else could replicate it. Broadway’s article doesn’t passthis test. He only mentions that he "surveyed the towns in 1991.” This study used a before-after impact methodology which is subject to theconcern that other factors might influence the changes.
In a report to the Kerr Center for Sustainable Agriculture, the impact of the 2,200 job Seaboard pork processing plant was examined. This studyused the with/without method for estimating impacts of the Seaboard plant on Texas County, Oklahoma. The authors compared the rate of changein economic, social, environmental and human capital factors in Texas County with the changes in the same factors in thirteen other farm-dependent counties in Oklahoma between 1990 and 1996. If the rate of change between the comparison counties and Texas County was found tobe significant, “then the result arrived at was the presence of Seaboard made a difference.” (Flora, 1999, p. 23).
The report concludes that jobs and bank loans did not increase significantly compared to the comparison counties. Income per capita fell in bothareas with the processing plant paying an average of $8.31 per hour. The tax base and the value of housing increased faster in Texas County than inthe comparison counties.
The report suggests that it was not the residents of Texas County that benefited from the new pork processing jobs, but outsiders who moved intothe area.
Unfortunately the report tells very little about the comparison counties. It only says that “all thefarming dependent counties in Oklahoma are included in the analysis. Farming contributed aweighted annual average of 20 percent or more of total labor and proprietor income over thethree years from 1987 to 1989 in these counties.” Does this make these counties twins whichwould change in the same way as Texas County except for the addition of the plant?
The following questions need to be considered before concluding that the comparison countiesare good matches:
1) What have been the trends in employment in the comparison counties and the target county?
2) Was Texas County growing slower, the same or faster than the other counties?
3) What is the economic structure of the counties outside of agriculture?
4) Did Texas County have a mix of industries likely to grow more slowly than the other counties? Or faster?
5) What was the location of Texas County and the others in relationship to the regional trade centers?
If the mix of non-agricultural industries in the comparison counties was more dynamic than inTexas County or they were located close to other trade centers and receiving spillover growth,then it is not reasonable to attribute the differences to the pork processing plant. The impacts ofthe pork plant might be greater than or smaller than those shown.

V-2-303
Strengths and Weakness of IMPLAN Regional Input-Output Model and Data:Since most of the regional input-output models used were built around the IMPLAN model anddatabase, we consider the strengths and weakness of this model and database.
There are three major data weaknesses in the IMPLAN input-output models. They are: 1) thevalue of inputs purchased by a livestock producer reflect national averages for usage/head andnational prices; 2) the amount of labor used in livestock is estimated to be one worker per farm,regardless of size of the farm; and 3) the regional purchase coefficients are estimated fromsecondary data and might be inaccurate.
Ikerd suggests that the default IMPLAN data might understate the impacts of owner-operatedfamily farms on retail employment and overestimate their impacts in manufacturing (p. 165).
From the data perspective, the major strength of the IMPLAN software is that it allows theanalyst to modify all three of these with local data when it is available. For example, Otto,Lawrence and Swenson (1996) use cost data from Indiana to run the analysis of different sizes ofpork operations in Iowa. Morse used data from the Minnesota poultry industry to adjust theinput purchases when studying turkeys, eggs, and broilers. Doherty used cost data on differentsizes of dairy herds to avoid the first two problems. The third problem was addressed by severalauthors but none adjusted the regional purchase coefficients.
Two general weaknesses of all input-output models are: 1) they are inappropriate to use for verylarge impacts; and 2) they do not account for commuting. If the impact is large enough that itleads to increases in wages or in the prices of any inputs, the results stated by IMPLAN will beoverstated (Kraybill, 1993). After commuting is accounted for the employment impacts arelikely to be considerably smaller than derived from IMPLAN.
In evaluating IMPLAN studies, one should ask if the researcher did the following:
1) Compared the national expenditure patterns to regional ones and adjust where necessary?
2) Validated the models estimated regional purchase coefficients and adjust as necessary?
3) Examined the labor and employee compensation coefficients and adjusted as necessary?
4) Considered the offsetting effects when defining the economic shock scenario?
5) Considered whether the size of the economic shock would be so large that prices would increase for labor or other inputs?
The major strength in regional input-output models is that they can provide detailed estimates bysector. This allows the researcher or the public to check the validity of the assumptions used andthe reasonableness of the results.
V-2-304
HOW DO THE BENEFITS VARY BY TYPE OF PRODUCTION METHOD, SIZE ANDLOCATION OF OPERATION AND THE ANIMAL POPULATION AND DENSITY INTHE AREA?
Is a community’s economy better off with a lot of small farms or a few large ones? This isthe question examined in this section. In many cases size is also related to the productionmethods with small farms being independently owned and operated and the larger ones beingvertically integrated. This section looks at the research on whether large operations andvertically integrated ones yield more or less community benefits than small independentoperations. While the density of animals is often greater in the large integrated operations, noseparate studies were found of the separate impact of the population and density, controlling forsize. This section looks at research which has been done on the differences in wages, valueadded to crop prices, purchased supplies, property values, tax base, jobs, and poverty.
Wages: This section reviews the literature that deals with the effects that animal agriculture canhave on wages, salaries, and benefits.
Hurley, Kliebenstein and Orazem (1999) used data from 967 pork producer employees, or 11%of a sample of National Pork Producers Council-National Hog Farmer magazine subscribers, toexamine wages in the hog industry for 1995. They found that: 1) wages in the pork industryappear to be set by the regional or national markets, and 2) differences in wages were largely dueto differences in human capital, gender, and firm size. Wages in the Southeast and West of theUSA were higher, apparently due to the rapid expansion of large-scale operations there. Theseoperations may have needed to offer higher wages to support this growth.
Hurley, Kliebenstein, and Orazem (1999) state, “Should similar expansion occur in the Midwest,we would expect similar increases in wages. Larger firms pay more than small firms, in partbecause of a production complementarity between skilled labor and technology. However, evencontrolling for technology, a strong positive relationship between wages and annual hogproduction remains."
If the one large buyer had a “buyer’s monopoly,” it is called a “monopsony.” Assume it had abuyer’s monopoly on both labor and livestock. Then it would pay lower wages than it would if itwas a perfectly competitive buyer. And it would pay lower prices for the livestock than if it wasin a perfectly competitive market. Hurley, et al. found that the higher wages offered by largerfirms do not support the hypothesis that larger firms locate in labor markets with low wages orthat larger firms exercise monopsony power in local labor markets. The more generouscompensation packages paid by larger firms suggest that rents accrued as a result of cost savingsdue to economies of scale are shared with employees (p. 161).
Hurley, Orazem and Kliebenstein (2000) report on the changes in wages in pork production from1991 to 1995. They found the predicted wages increased by 61 percent for 1991 to 1999

V-2-305
compared to a 33 percent increase for the average civilian USA wage (p. 11). This resulted inwages in the pork industry moving from 20 percent less than the US average in 1991 to only 3percent less in 1999 (p. 12). Between 1991 and 1995 wages grew for all pork employees.Between 1995 and 1999, the primary factors pushing up pork industry wages were increases ineducation, operation size, and technology use.
However, the results depend on the assumption that the sample in each year is representative ofthe full population. The response rate dropped from 18 percent in 1991 to 11 percent in 1999. Isit possible that the lower response rate in 1999 is skewed toward those with greater education andthat the predicted wages have an upward bias? Despite this, the regression coefficients, whichallow the authors to trace the source of wage increases, probably are not effected by this potentialselectivity bias.
In the 1998 study written by Otto, Orazem, and Huffman, they found that the earnings per workerwere positively related to the size of the farrow-to-finish operation. Workers in the 3,400 sowunits earned an average of 16 percent more than those in the150 sow units. Thompson andHaskins (1998) do not challenge these estimates on the quality of jobs by size of operation.
Grey’s (1998) chapter about the effect of the new IBP plant in Storm Lake illustrates thedifficulties of comparing changes in wages in two points in time. Grey compares the wages atthe previous Hygrade plant that went bankrupt with the new IBP plant rather than comparing theIBP wages with what was currently available in the community.
While it would have been better for IBP workers to have earned the same wage rates as the Hygrade workers, the high wages were one of thefactors for the closure of the Hygrade plant. Were the IBP workers better off with their IBP jobs at the low wages than if they had been unemployedor had to move or to commute? Since the IBP workers were free to either commute or move, one could reason that they picked their best feasiblealternative and thus are better off with the IBP jobs than without them. On the other hand, to conclude this we would need to know if the workerswere given reliable information on the wages, benefits, cost of living, and working conditions. While a comparison to the Hygrade jobs is notrealistic simply because those jobs no longer exist, we do know that the IBP jobs were relatively low paying.
Miller (1991) reported on a survey sponsored by the National Pork Producers Council of 1,472producers and 1,270 employees. Approximately 91 percent of the employees worked in hogoperations that produced 100 or more head of hogs per year, with 25.7 percent working in herdsof 500 sows or more. Eighty-nine percent of the employees were in units of less than 1,000sows. Twenty-eight percent of the employees had a four-year college degree or more, whileanother 33 percent had two-year college programs.
Fogleman, et al. (1999) did personal interviews on 92 Northeastern USA dairy farms to collectdata on wages and other employee compensation. The sample included Northeast DairyProducers Association members. For the 709 employees included in the study the average totalcompensation was $27,433. This average ranged from an average of $21,712 for competencylevel 1 to $38,847 for competency level 5. At all competency levels there was a fairly wide rangeof compensation. In contrast to Hurley, et al. (2000) additional education did not have asignificant impact on compensation. Yet the competency level variables were all significant. The relationship between competency levels and education was unclear. We expect the reason

V-2-306
education had no effect is that the competency levels were highly correlated with education.
Farms with more cows paid high compensation. Experience in other dairy farms did not result inhigher pay while longer tenure on a farm did.
Value-Added to Crop Prices: Will additional production in a county or region lead to highercrop prices? Or will imports from other counties and regions result in a fairly uniform priceacross large regions? No articles were found on this topic but one is underway as mentionedlater.
Purchased Supplies: Two streams of research are relevant here. First, regional input-output analyses provide details on the types of supplies thatare estimated to be purchased by animal producers. The second stream of research examines the question of whether large livestock farmers buyless locally than small ones.
Purchased Supplies from Other Economic Sectors: Table 3 shows the distribution of economic impacts by various sectors for a 1200 sow uniton the state of Minnesota in 1991 (Jahae and van Staalduinen 1992). Not all of these supplies were purchased directly by the hog operation. Forexample, the dairy farm products would have purchased some feed grains, soybeans, and hay to produce milk that was purchased by hog operations. However, all of the amounts shown in Table 3 are spin-offs of the 1200 sow unit.
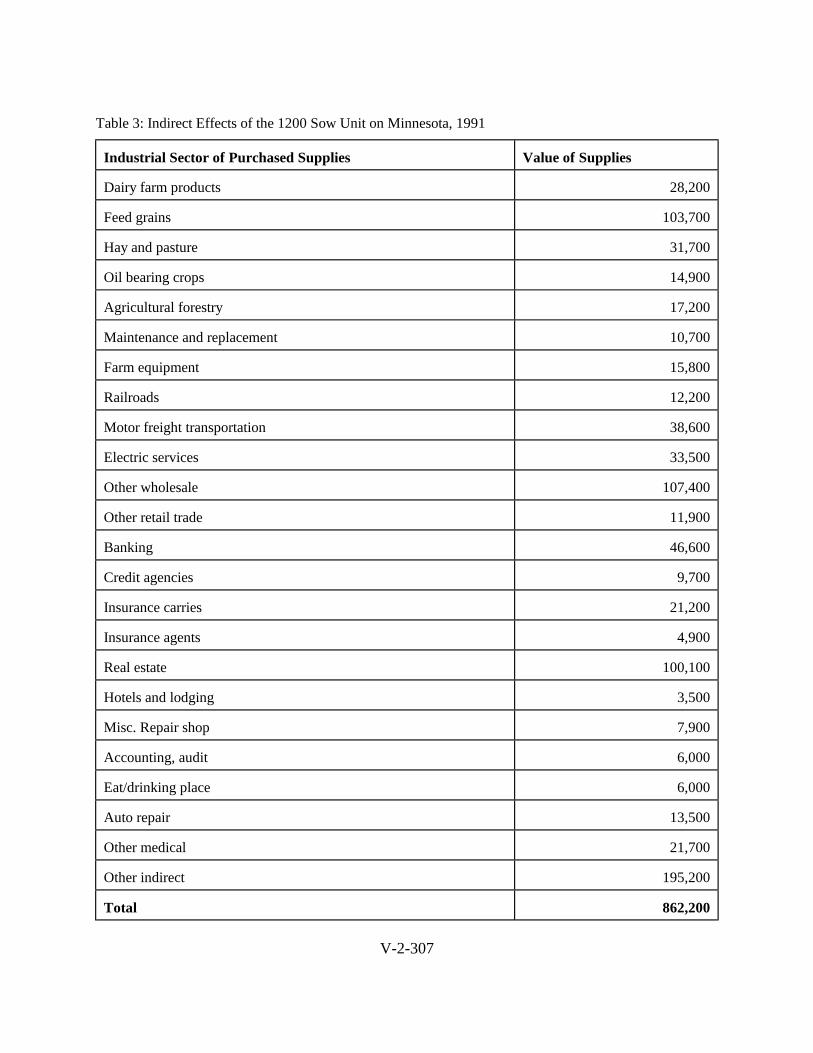
V-2-307
Table 3: Indirect Effects of the 1200 Sow Unit on Minnesota, 1991
Industrial Sector of Purchased Supplies Value of Supplies
Dairy farm products 28,200
Feed grains 103,700
Hay and pasture 31,700
Oil bearing crops 14,900
Agricultural forestry 17,200
Maintenance and replacement 10,700
Farm equipment 15,800
Railroads 12,200
Motor freight transportation 38,600
Electric services 33,500
Other wholesale 107,400
Other retail trade 11,900
Banking 46,600
Credit agencies 9,700
Insurance carries 21,200
Insurance agents 4,900
Real estate 100,100
Hotels and lodging 3,500
Misc. Repair shop 7,900
Accounting, audit 6,000
Eat/drinking place 6,000
Auto repair 13,500
Other medical 21,700
Other indirect 195,200
Total 862,200

V-2-308
Regional input-output analysis can trace the impacts to 528 sectors in the economy. Most of the reports aggregate to avoid overloading the readers. Table 3 is included only to illustrate the type of information provided on purchased supplies by regional input-output models. The impacts for anyspecific feedlot will vary with the location of the feedlot, the nature of that county’s local economy, the nature of the feedlot, and the spendingpatterns of the producer. In addition, the net impacts will vary with the type of other development displaced, if any.
All non-survey input-output models must estimate the amount of inputs to a sector which are imported from outside the region being studied. Generally, this is considered one of the weakest aspects of the non-survey input-output models (Stevens and others 1989; Ralston and others 1985;Swanson 1998). Most of the regional input-output models use an econometric estimate of the RPC or estimate it via the supply-demand poolmethod (Olson and Lindall 1996). The later method assumes that all local purchases come from local supplies prior to going to imports.
The second stream of research attempts to examine the location of the purchases of inputs. Infact, the above estimates include data on the percentage of local purchases that come from localsupplies (called the regional purchase coefficient).
Purchased Supplies by Location of Purchase: Do large livestock farmers buy less locally thansmall ones? If so, the multiplier or spin-off effects of large farmers are less than for smallerones.
Diego Platas’ Ph.D. thesis (2000) examines the linkages between the pork industry and localeconomies and the linkages between the pork industry and the state’s economy. This also isreported in a popular article (Lazarus, Platas, and Morse, 2001) and a research report (Lazarus,Morse, Platas, and Guess-Murphy, 2000).
This study provides an interesting examination of whether large or small pork producerscontribute more to local economies and the state economy. This study made several innovationsover prior studies done in other states (reported next). First, this input-output study used farmlevel data in Minnesota to create local production functions for two different sizes and twodifferent types (farrow-to-finish and finishing only). Second, pork producers were surveyed tolearn their spending patterns for their major inputs. The producers were asked what county andstate they purchased their key inputs. With this data the percentage of local demands satisfiedby local production, called regional purchase coefficient or RPC, was estimated for each input. Third, estimates of the regional economic impacts were made for four different local economiesand for the state for each size/type combination. Fourth, the impact scenarios assumed allproduction was in a given size/type so that the differences would not be due to the difference inoutput levels. Fifth, the consequences of considering the likely survivability of different sizes ofpork operations are considered. These innovations overcome most of the methodologicalconcerns raised by Thompson and Haskins (outlined below).
At the state level, Platas found the overall percentage of inputs purchased within the state torange from 78 percent for large finishing operations to 89 percent for small finishing operations. Large farrow-to-finish operations purchase 85 percent of their inputs within the state compared to88 percent for small farrow-to-finish producers. At the county level, the overall percentage ofinputs purchased within the county was lower for every county and every size and type ofoperation. However, there was huge variation between the counties and operations. Generally,small operators purchased more locally than the large ones. At the state level this difference was

V-2-309
very small for farrow-to-finish operators (3%) and relatively small for finishing operations(11%).
In two counties, the small finishing operators purchase 25% (Blue Earth) and 27% (Pipestone)more locally than the large operators. But in Martin County the small finishing operatorspurchase one percent less than the large ones. For the farrow-to-finish farmers the smaller onespurchase more locally in all cases than the larger ones. However, the difference varies from only7% (Pipestone) to 15% (Blue Earth County) to 25% (Martin County). While this project providesnew information on pork producer purchasing patterns, policy decisions require a picture of theregional economic impacts. We turn to this next.
Platas used the above data in sixteen different input-output models to explore whether small porkproducers contribute more to local economies than large ones. Platas found that the three countyaverage value-added income of large farrow-to-finish farms was 40 percent greater than smallones, assuming both were producing $40 million in pork per county. At the state level, thedifference was even greater (45%). Similar results for the other types/sizes are shown inTable 4.
Table 4: Relative Income Impacts under Other Types of Operation Compared to Small Farrow-to-Finish Operations*
Type of Operation Three-County Average** MinnesotaSmall farrow-to-finish(baseline)
0% 0%
Small finish and large sow +56% +45%Large farrow-to-finish +40% +45%Large finish and large sow +10% +28%*Assumes a 33% attrition rate among small operations, identical to that observed in Minnesotaover the past four years. ** Includes Blue Earth, Martin, and Pipestone Counties. No largefarrow-to-finish operation was in Murray County so it was omitted.
While the large producers yield more economic benefits than the small ones, this doesn’t tell apolicy maker that they should be preferred. These benefits have to be balanced against anyenvironmental costs or benefits by size. Table 4 suggests, however, that state policy makers arelikely to be more favorable toward large producers than local ones. First, the relative economicbenefits of larger producers are higher at the state level than at the local level. Second, anyenvironmental damages are more likely to be local than state-wide.
Platas did not consider offsetting effects but his study is not simply a linkage study as weoutlined earlier. Given the issue he is studying the lack of the offsetting effects is not as relevant.
V-2-310
Sociologist Walter Goldschmidt predicted the demise of rural communities based on the viewthat large farms would buy less locally (1978).
Marousek (1979) surveyed 84 Idaho farmers (49 small ones and 35 large ones) and found thatsmall farms spent a higher percentage of their production expenditures locally than large ones (59versus 55 percent). However, large farms spent nearly five times more than small farms in thelocal area. He found that 22% of the small operators expected to cease farming within five yearsbut none of the large ones did (p. 58).
The Marousek (1979) study is one of the few input-output studies that uses survey data todevelop the regional input-output model. The model is highly aggregated (19 sectors comparedto recent models of 528 sectors) and has only two agricultural sectors. These are: “large farms”and “small farms.” To use input-output with this type of aggregate sectors in agriculture, it isnecessary to assume that the type of crops and livestock in large and small farms is identical. Assuming this, he uses the model to examine the tradeoffs between large and small farms on therest of the community’s economy. He found that:
“Displacement of small farms by large farms results in greater regional income whereasincreasing the number of small farms yields greater regional employment. Agriculturaloutput is comparable for the two farm size structures” (p. 61).
Chism and Levins (1994) found that farmers generally believe that large farmers are less likely tobuy locally than small ones. They surveyed 30 farmers on their opinions about local vs. non-local spending. They found that these farmers felt: 1) larger farmers would benefit more fromsmall differences in prices and would have greater incentives to purchase in non-local markets, 2)large farmers had greater capacity to shop around the region for discounts, and 3) large farmsoften needed specialized inputs not available locally (p. 1). In addition, Chism and Levinsexamined the expenditure records of crop and livestock farmers to determine their actualspending patterns.
The Chism/Levins article is cited widely by those opposed to large farms (Ikerd, 1998, p. 157;DeLind, 1998, p. 29; Thu and Durrenberger, 1998, p. 7; Lasley, 1995, p. 127). In fact, theChism/Levins article reports that large farms buy as much per acre as small ones in absoluteterms. However, the per acre comparison is problematic since the large farms had fewer acres. If a large confinement operation with 500 cows on 15 acres buys most of its feed, the expenditureper acre is going to be much higher than for a 100 herd dairy with 160 acres that grows all ormuch of its own feed.
The Chism/Levins study has two methodological problems. . First, the livestock conclusions arebased on a very small sample (12 farms). Second, “local” was defined as a 20-mile radius ofeach farm. While this seems reasonable, it leaves unclear where the non-local spending goes. Does it go to other rural areas? Given today’s transportation networks and the distance that manyrural people commute to work, should alternative estimates be considered?

V-2-311
In a staff paper from Iowa State, Lawrence, Otto, Meyer, and Folkerts report on a 1993 survey ofpork producers’ spending patterns. These authors report that a larger percentage of largeproducers travel longer distances to purchase inputs compared to smaller producers. However,they do not report the per-acre spending which is needed to determine the local economic impact. Otto in summarizing this work writes:
“Producers of all size operations appear to be willing to shop in more distantcommunities for their inputs and services. For producers who indicated they did not buyinputs in the nearest community, quality and service were most frequently given asreasons when professional services such as accounting, banking, and veterinary medicinewere involved. Pricing became the predominant factor in producer decisions to purchasegeneral supplies and hog equipment. Producers’ concern with price and non-priceattributes of inputs and services suggest that local agribusinesses in rural communities arelikely to face increased competitive pressures from larger and more distant businesses. Rural agribusiness firms that are unable to provide specialized expertise may havedifficulty competing in this environment” (p. 17 and 18).
Property Taxes: Property values might increase in value due to the additional economic demandstemming from growth in the livestock industry. Or, property values might fall due to thenegative influence of odors or water pollution or other externalities. This aspect is reviewed inthe externalities part of the report done by Carl Philips.
Tax Base/Taxes: This section reviews the documentation regarding the effects of animalagriculture on the tax base, and taxes in general, of the respective region. First, the findings fromarticles that deal with Minnesota agriculture will be summarized. Then, the findings from otherstates are reported.
Minnesota: Currently there are no completed studies on the tax base or taxes stemming from animal agriculture.
Other States: Only two studies were found that dealt with the effects that pork production couldhave on taxes and the tax base.
In a 1998 Iowa study, Otto, Orazem, and Huffman estimate the changes in expenditures andrevenues for local units of government as a result of four different sizes of farrow-to-finishoperations. Since the authors do not report any details on the nature of their model, it is difficultto evaluate the veracity of the estimates.
DiPietre and Watson (1994) also estimated the public sector fiscal impacts. They left plenty ofroom for improvement in the estimation methods for the public expenditures. They simplyassumed that the cost of repair to county roadways damaged by construction vehicles was $3.7million or equal to the amount paid by Premium Standard Farms for this same purpose. In

V-2-312
addition, they included $115,000 for “on the job training.” Despite the addition of 873 jobs overfive years, they assumed no additional costs for police, fire, sanitation or other general publicservice costs. Equally as interesting is that they assumed no additional costs for any local publicservices during the operational phase, despite the addition of 957 new jobs. This might bereasonable, given the depressed conditions in the region. However, the report provides littlejustification for these assumptions on expenditures. Poverty: Goldschmidt (1978) suggested that communities that have primarily small farmers arebetter off because the smaller independent farmers will be more interested in the well being oftheir local communities and will invest in its institutions. In contrast, he reasoned that largecommercial farms will have separate management from labor and absentee ownership, resultingin lack of interest in the well-being of the local community. He compared two Californiacommunities, confirming his hypothesis. Goldschmidt examined the communities of Arvin, CA(with primarily large farms) and Dinuba, CA (with primarily small farms). He examined detailedinformation on the character of their agriculture and a wide variety of other social and economicvariables. On the retail businesses, he found that Dinuba had more than twice the number inArvin, “showing that the small farm population supports small business to a far greater extent”(p. 381). In addition, Goldschmidt points out that the “total volume of expenditure and thevolume per person is appreciably smaller in Arvin than in Dinuba” (p.391). However, he alsosuggests that this could be due to the influence of another urban center near Arvin. As with othercomparable area studies, it is difficult to know how much of the difference between two areas isdue to the farm size and how much is due to completely unrelated variables which also influencethe number of businesses and extent of local shopping.
Durrenberger and Thu examined Goldschmidt’s findings relative to the Iowa pork industry. They conclude that “it is more advantageous for Iowa to have more hog farmers rather than morehogs” (p. 409). Quoting a longer summary passage, they write:
Since total hog production is a function of the number of small-to-moderate hog farms,large hog operations have a deleterious relationship to rural hog production. Largehog operations are related to a decline in small and moderately sized operations. Themore farms that produce hogs, the fewer people that use food stamps. This analysissuggests it is important to maintain and create small-to-moderate sized hog operations,not large ones (p. 413).
However, the evidence and the analysis in their article does not support these conclusions. First,Durrenberger and Thu examine the correlation between farm size and number of farms. Theyfind that as farm size increases, the number of farms decline, implying one causes the other. However, their data shows that the most urban counties have the largest number of farms and thesmallest ones. They do not explore the possibility that this reflects the non-farm opportunities inmore urban areas. Seventy-five percent of small farm operators report their principal occupationoutside of farming. On the average, the small farms earned $42,686 in non-farm income whilelosing $4,593 on their farming operations (Steele, 1992). The smaller farms near urban areas are

V-2-313
more feasible because of the greater number of non-farm jobs. The larger farms in rural areasmight not be forcing small farms out but simply required for families to earn sufficient income. A second factor might contribute to small farms near urban areas. Near urban areas manyfarmers expect to sell their land for subdivisions as part of their retirement plan. Consequentlythey can afford to hold onto the land in smaller farms in order to qualify for lower agriculturaltaxes.
Next they observe a negative correlation between the number of farms per capita and thepercentage of people on food stamps. Note, however, that the relationship between the percenton food stamps and the number of farms would have been positive rather than negative if theyhad not first divided farms by population. They did not explore whether the more urban countieshad higher rates of participation in food stamp programs or other factors that might haveinfluenced the differences in rates between these regions. Rather, they attributed all of thesechanges to farm size. A complete model of the factors that influence food stamp participation isneeded and a multivariate analysis to control for the multiple factors. Without this, it is difficultto know if the correlation they find has any meaning.
Why was food stamp participation selected as “the most direct measure of social and economicwell-being,” (p. 411)? Why not income per capita or percent in poverty? While food stampparticipation might indeed be the best measure, Durrenberger and Thu provide no conceptual orempirical justification for their assertion. Would the conclusions they reach hold if these othermeasures for local well being were used? Since this is only a literature review, we do notattempt to answer this. Further research should explore this.
Using regression analysis, MacCannell (1998) studied the relationship between farm size andpoverty rates and family incomes. This study is not germane to the livestock issues in Minnesotasince it dealt with conditions in four Sunbelt states: California, Arizona, Texas, and Florida. Further, he excluded the counties that were principally grain and livestock counties (MacCannell1988).
Flora and Flora (1988) studied the relationship between farm size and community well being infarming areas west of the Mississippi River. Minnesota is not included in the areas studiedexcept for wheat production in the northwest part of the state. They examined 234 counties thathad 20 percent or more of the personal income from wheat and/or livestock but excluded theindustrial agriculture counties in California and Arizona (p. 80-81). The Floras found thatpoverty declined most rapidly in the livestock counties but was initially higher (p. 100).
Lobao (1990) found that industrialization of agriculture had little impact on the quality of life. Summarizing the conclusions about regional differences in farm structure and well being, Lobaoand Shulman (1991), write:
First, compared to non-farm industry, farming is not a strong determinant ofsocioeconomic conditions even in agriculturally dependent areas (van Es and others

V-2-314
1988). Second, the effects of medium-sized farms tend to be constant over the regionsexamined; the studies verify or imply that such farms are related to better socioeconomicconditions. The impacts of small and large farms by region are less clear. Skees andSwanson’s (1988) study suggests that small farms may lower well being, a finding thatwas confirmed in a national study of U.S. counties (Reif 1987). The effects of large-scalefarms do not manifest a consistent pattern across regions (p. 568-569).
Lobao and Shulman (1991) studied the impact of farm size and farm industrialization whilecontrolling for the non-farm economic structure and other variables within regions. They foundthat the impact of industrialization in agriculture varied by region with fewer adverse affects inthe midwest than in the south. Using data on 2,349 nonmetropolitan counties for the 1970 to1980 period, Lobao and Shulman ran multiple regression analyses on poverty rates. Theysummarize their work as follows:
“Rural poverty is largely a function of the prevailing economic structure, the balance ofsocial relations and spatial characteristics. Of these sets of factors, social relationsvariables tend to explain more of the variation in rural poverty rates, and farmingpatterns explain the least. Industrial structure followed social relations as an importantcorrelate of poverty” (pp. 587-594).
The farming patterns included indexes for industrialized farming, larger family farming, andsmaller family farming. The regional industrial structure variables included: percent inperipheral employment, percent in state employment, and non-farm establishment size. Socialrelations variables included: percent unionized, per capita AFDC payments, percent nonwhite,median education, percent unemployed and earlier poverty. The spatial variables included:percent farm-to-rural population in the county, the percent urban, and metropolitan adjacency.
Employment Comparisons: Contract vs. Independent Farmers: Two pieces were reviewedon this topic.
In his analysis of independent hog farming and contract hog production, Ikerd (1998) states that asustainable agriculture paradigm is the only way for rural America to survive. The sustainableagriculture paradigm “relies more on people, including the quality and quantity of labor andmanagement, and relies less on land and capital” (p. 158). Ikerd criticizes a study done inMissouri about the future of pork production in the state (DiPietre and Watson 1994).8 Ikerdargues DiPietre’s report indicates that the drop in total pork production in Missouri is the mainproblem in the state and that the solution is to bring in large corporate hog producers. However,Ikerd writes:
8 The DiPietre 1992 study was not available for review. Comments reflect Ikerd’sdiscussion.

V-2-315
“Only to the extent that it results in higher quality employment opportunities doesincreased hog production contribute to economic development of rural communities. Since large-scale confinement hog operations seek to reduce total costs by usingproduction methods that allow fewer people to produce more hogs, the substitution ofcapital and mass-production technologies for labor and management is the primaryadvantage that large, specialized hog production units have over smaller, diversifiedoperations. The displacement of family farms by large-scale hog production systemsreduces rather than increases total employment in pork production.” (p. 161)
Ikerd goes on to provide estimates of the number of farmers displaced by a $5 million investmentin contract farrowing and finishing operations. There are two critical assumptions in his analysis.First, he assumes the multiplier effects for both the contract units and the independent units arethe same. Yet, since contractors buy much of their feed while independent producers often growtheirs, the multipliers would be higher for contractors than for independents. Second, he assumesa fixed demand for hogs so that growth of one type of producer directly displaces another type ofproducer. This might or might not be true but Ikerd provides no evidence on this. In summary,the estimates provided by Ikerd are only valid if these assumptions are valid and no evidence isprovided on them.
Tweeten and Flora (2001) discuss the economic impact of vertical coordination on communities.Vertical coordination refers to the methods of synchronizing vertical stages in the production andprocessing chain. Contract farming is the most common form of vertical coordination. Thispiece uses economic theory and prior research to explore how vertical coordination impacts:
1) employment in rural areas
2) farm size and incomes
3) overall economic benefits to rural communities.
While many factors are driving farms to be larger, Tweeten and Flora suggest that verticalcoordination saves input and increases productivity and profits. With the productivity gains,there are employment losses in rural areas. There is some evidence that small farms buy morelocally. These two factors suggest that policies to maintain small independent farms are best forrural communities. Yet, Tweeten and Flora suggest that such a policy “is unlikely to be a viablealternative” because the small farms can not produce enough income to support families andhave higher costs of production.
Many farms are too small to support a family and depend upon off-farm income. Tweeten andFlora write: “Because many farming-dependent counties do not have access to off-farm income,the increased average size of contract producers was not necessarily undesirable.”

V-2-316
The article points out that rural communities are changing in many respects regardless of thechanges in farm size. Better and cheaper transportation leads to more commuting to urban areasfor jobs and longer travel for shopping. Both of these change the nature of local employmentopportunities and community services.
HOW ARE THE ECONOMIC BENEFITS DISTRIBUTED LOCALLY (BETWEENOWNERS, OPERTORS, EMPLOYEES, NEIGHBORS, ANDOTHERS) AND IN THE STATE ECONOMY?
Table 5 illustrates the type of employment impacts sometimes reported in regional input-outputstudies. Estimates can also be made for these same groups for all the spin-off industries as well.However, generally the total change in value-added income is reported rather this specificbreakdown.
Table 5. Estimates of Income Impacts by Type of Recipient for the Dairy and Poultry Industries,Producers and Processors, Minnesota
Type of Income Dairy Industry * Poultry Industry #
Employee wages and salaries 50.0 54.5Self-employment income 9.3 14.5Returns to capital 33.4 24.5Indirect business taxes 7.3 5.5Total Value-Added Income 100.0 100.0
* Doherty and Morse, 1999# Morse, 1998.
RECOMMENDATIONS FOR FUTURE RESEARCH
DiscussionCurrent research does not provide much evidence of the potential economic and fiscal impacts ofnew feedlots on communities or counties. The net economic impacts will depend upon thecurrent economic structure of the area, the spending patterns of local farmers, and thecharacteristics and commuting patterns of local labor. The net fiscal impacts will depend on bothadditional tax revenues, changes in state aid, and additional local expenditures. Only two studies (DiPietre and Watson 1994; Otto and others 1998) tried to measure these changes. However,these estimates are specific to their states and there are some questions on the data. Even inMinnesota, the same industry will have different fiscal impacts on different counties.
V-2-317
To estimate the overall economic benefits of animal agriculture as called for in question #1 ofsection F, either regional input-output or integrated econometric/regional input-output are the most accurate and practical. Computable general equilibrium models will not give the detailneeded and are very expensive to build. Export base models are inexpensive to build but give nodetail. Comparable area and before/after studies can not be used ex ante and have manyproblems in developing truly comparable areas. But more importantly, with the comparableareas or before/after models, it is difficult to determine the extent to which the changes are due tofactors other than feedlots.
However, the input-output and integrated econometric/input-output models will give accurateresults only when the data used is accurate and when the impact scenarios are properly defined toinclude both the impacts on the livestock industry and any potential off-setting effects. Anexample of an offsetting effect related to the livestock industry would be the reduction in thenumber of houses built on a new sub-division as a result of a new feedlot. The net effect wouldbe the positive economic impact offset by the negative economic impacts of the loss of theadditional housing. This offsetting effect only occurs if the houses definitely would have gonein without the feedlot.
RecommendationsTo use integrated econometric/regional input-output models on feedlot issues, additional researchis needed on:
1) estimation of the regional purchase coefficients in order to accurately estimate the purchaseswithin a region;
2) examination and verification of the fiscal impact models components of integratedeconometric/input-output models;
3) integration of the social impacts work with the fiscal impact analyses;
4) examination of the regional production functions in input-output models;
5) studying the potential off-setting effects and means of accurately defining the impactscenarios;
6) greater collaboration between economists, sociologists, anthropologists, ecologists, andproduction agriculture scientists in studying the economic, social and environmental impactsof different types of agriculture;
7) practice in using integrated econometric/input-output models in local settings for educational purposes;
V-2-318
8) determination of alternative regional scales;
9) incorporation of a temporal dimension to the economic impact estimates;
10) examination of the overall structure of agricultural production in terms of the local economicimpacts.
The recommended additional research listed above is necessary if clear conclusions are to bereached on question 1. The following section provides greater detail on the recommendations.
Suggestion one deals with estimates of the regional purchase coefficients. Given the importanceof the purchasing patterns on the multiplier effects and the very thin database currently available,additional work should be done to expand on the work of Chism and Levins (1994). While theirwork used an excellent methodology, the sample size of livestock farms was very small (12farms over all types of livestock). The sample size should be expanded greatly so that estimatesof purchasing patterns can be determined for different types and sizes of livestock operations. Two, the fiscal impact models are in their infancy. They need careful examination andverification in a variety of ways, including detailed tracing ex poste of the impacts predicted inex ante models.
Three, there is a need for integration of the social and fiscal impacts. While sociologists oftenpredict that social program costs will increase with the establishment of large-scale livestockoperations, the current fiscal impact models do not adequately incorporate differential growth inpublic sector costs. The achievement of the third suggestion would require an interdisciplinaryteam with a sufficient budget to do longitudinal studies.
Four, we need to examine the regional production functions in input-output models. As somehave pointed out, the data used in I-O models pre-determines many of the results. To improveregional I-O models in this respect will take an interdisciplinary team of farm managementeconomists working with regional economists and a long-term database from farms of differentsizes and types.
Five, the development of scenarios in input-output analysis often ignores the offsetting effects.While CGE models automatically capture some of these, I-O models cannot. These offsettingeffects can be handled outside the model and entered as a secondary shock.
Sixth, greater collaboration is needed between a wide range of social and physical scientists,industry groups, environmental groups, local governments, and citizens to trace the consequencesof different types of agriculture.
Given the many competing research needs, suggestion #6 will only happen if some state agencyinvests sufficient funds to create incentives for ongoing focus on these issues.

V-2-319
Seventh, there is a need to practice using existing integrated econometric/input-output models inlocal settings for educational purposes. While there is much research needed to improve theaccuracy of regional models, much could be learned from applying the existing models ineducational settings now. If used in the fashion suggested by Barrows (1993) and readilypointing to the limits of the models, they can help community leaders recognize new questionsand frame issues more clearly.
Eighth, the definition of •local• needs to be considered. In prior studies (Chism 1993), localwas defined as being within 20 miles of the farm. From the state•s perspective, is this thecorrect definition? If farmers buy inputs 40 miles from their farm but still in Minnesota, theeconomic impacts on the state of Minnesota are positive even if the sales are lost to vendorswithin 20 miles. Insistence on buying within 20 miles might be good for one local communitybut result in higher costs for the farmer as well as hurt another local community. This is an areawhere policy and research methods overlap. To help sort this out, additional research is neededon alternative definitions of •local.•
Ninth, a temporal dimension to the economic impact estimates needs to be incorporated. Nearlyall of the impact models estimate the impacts for a year. Some analyses split out the differencebetween construction and operation (DiPietre and Watson 1994). Few consider the changes overtime in the levels of operation. This should be explored.
Tenth, there is a need to examine the overall structure of agricultural production in terms of thelocal economic impacts. As Dr. Leatherman outlined in his comments, livestock production ischanging in both scale and vertical integration. As he points out current research focuses eitheron specific facilities or industry-wide impacts. It would be useful to do more research on thelarge integrated systems such as the one he describes of a network of production and processingfacilities with 40 confined animal feeding operations and processing for 1 million hogs annually.
REFERENCES
1999 GEIS Peer Reviewed Publications:
DeLind L. 1998. "Parma: a story of hog hotels and local resistance." In: Thu K, Durrenberger E.Pigs, profits, and rural communities. Albany, NY: State University of New York Press. p. 23-38.
Flora C, Flora J. 1988. "Public policy, farm size, and community well-being in farming-dependent counties of the Plains." In: Swanson L. Agriculture and community change in theU.S.: The Congressional Research Reports. Boulder, CO: Westview Press, Inc. p 76-129.
Fox G. 1997. Reason and reality in the methodologies of economics. Cheltenham, UK: EdwardElgar Publishing Limited.

V-3-320
Goldschmidt W. 1978. As you sow: three studies in the social consequences of agribusiness.Montclair, NJ: Allanheld, Osmun and Co. Publishers, Inc.
Grey M. 1998. "Meatpacking in Storm Lake, Iowa: a community in transition." In: Thu K,Durrenberger E. Pigs, profits, and rural communities. Albany, NY: State University of NewYork Press. p. 57-70.
Hertel T. 1990. "General equilibrium analysis of U.S. agriculture: what does it contribute?" TheJournal of Agricultural Economics Research 42(3).
Ikerd J. 1998. "Sustainable agriculture, rural economic development, and large-scale swineproduction." In: Thu K, Durrenberger E. Pigs, profits, and rural communities. Albany, NY: StateUniversity of New York Press. p. 157-69.
Johnson T. 1996. "Methods in rural development policy analysis." In: Rowley T. Ruraldevelopment research: a foundation for policy. Westport, CT: Greenwood Press.
Kilkenny M, Otto D. 1994. "A general equilibrium perspective on structural change in the ruraleconomy." Amer. J. Agr. Econ. 76(December):1130-7.
Lobao L, Schulman M. 1991. "Farming patterns, rural restructuring, and poverty: a comparativeregional analysis. Rural Sociology 56(4):565-602.
Marousek G. 1979. "Farm size and rural communities: some economic relationships." SouthernJournal of Agricultural Economics, December.
Miller R, Blair P. 1985. Input-output analysis: foundations and extensions. Englewood Cliffs,NJ: Prentice-Hall, Inc.
Olson D, Lindall S. 1996. User's guide: IMPLAN professional. Stillwater, MN.
Otto D, Johnson T. 1993. Microcomputer-based input-output modeling: applications toeconomic development. Boulder, CO: Westview Press, Inc.
Ralston D, Hastings S, Rucker S. 1985." Improving regional I-O models: evidence againstuniform regional purchase coefficients across rows." Journal of Regional Science, November:65-80.
Reif L. 1987. "Farm structure, industry structure, and socioeconomic conditions in the UnitedStates." Rural Sociology 52(Winter):462-82.
Shaffer R. 1989. Community economics: economic structure and change in smaller communities.Ames, IA: Iowa State University Press.
V-3-321
Shields M. 1998. An integrated economic impact and simulation model for Wisconsin counties.University of Wisconsin, Madison. Unpublished Ph.D. dissertation.
Stevens B, Treyz G, Lahr M. 1989."On the comparative accuracy of RPC estimatingtechniques." In: Miller R, Polenske K, Rose A, Editors. Frontiers of input-output analysis. NewYork, NY: Oxford University Press.
Swanson M. 1998. Estimating regional purchase coefficients for regional input-output modelsusing Norwegian value-added tax data. St. Paul, MN: University of Minnesota, Department ofApplied Economics. Ph.D. Thesis.
Thu K, Durrenberger E, Editors. 1998. Pigs, profits, and rural communities. Albany, NY: StateUniversity of New York Press.
2001 GEIS Peer Reviewed Publications and Ph.D. Theses:
Broadway, Michael J. (1999) "Hogtowns and rural development." Rural DevelopmentPerspectives 9(1):40-46.
Broadway, Michael J. "Planning for change in small towns or trying to avoid the slaughterhouseblues." 2000. Journal of Rural Studies 16(1):37-46.
Brown, Dennis. 2000. "Poultry processing created more rural jobs than red-meat packing duringthe 1980's." Rural Development Perspectives 9(2):33-39.
Drabenstott, M., Henry, M., Mitchell, K. 1999. "Where have all the packing plants gone? Thenew meat geography in rural America." Economic Review (Third Quarter):65-82.
Drabenstott, M., Henry, M., Mitchell, K. 2000. “Where have all the packing plants gone? Meatgeography causing chaing landscape in rural U.S.” Feedstuffs, March 6, 2000, pp. 14-20.
Hanson, G. 2000. "Ideal types, equity, linkages, and change in sustainable systems." Journal ofthe Community Development Society 31(1):130-137.
Hurley, T., Kliebenstein, J., Orazem, P. 1999. "The structure of wages and benefits in the U.S.pork industry." American Journal of Agricultural Economics (Feb.):144-163.
Papadas, C., Dahl, D. 1999. "Supply-driven input-output multipliers." Journal of AgriculturalEconomics 50(2):269-285.
Platas, D. 2000. Economic and fiscal impacts of different sizes of swine operations onMinnesota counties. University of Minnesota, Dept. of Applied Economics, Ph.D. thesis.
Ryan, L., Carey, J., Birkhold, S. 1999. "Economic impact of the broiler and egg industries in

V-3-322
Texas." Journal of Applied Poultry Research 8:447-451.
Wing, S., Cole, D., Grant, G. 2000. "Environmental injustice in North Carolina's hog industry." Environmental Health Perspectives 108(3):225-231.
1999 GEIS Working Papers and Other Non-Peer Reviewed Publications:
AG NOMICS Research.1992. Dairy sectors economic impact on Minnesota. A report to:Minnesota Dairy and Promotion Council. New Brighton, MN
Barrows R.1993. Public policy education: key concepts and methods. Madison, WI: Universityof Wisconsin, North Central Regional Extension.
Carter H, Goldman G.1998. The measure of California agriculture. University of California,Division of Agriculture and Natural Resources.
Chism J. 1993. Local spending patterns of farm businesses in Southwest Minnesota. St. Paul,MN: University of Minnesota, Department of Agricultural and Applied Economics. Master's PlanB paper.
Chism J, Levins R. 1994. "Farm spending and local selling: how do they match up?" MinnesotaAgricultural Economist 676:1-4.
DiPietre D, Watson C.1994. The economic effect of premium standard farms in Missouri.Columbia, MO: University Extension, Commercial Agriculture Program, CA 144, University ofMissouri.
Doherty B. 1999. The economic impacts of Minnesota's livestock industry. St. Paul, MN:University of Minnesota, Department of Applied Economics. Plan B Paper.
Doherty B, Morse G.1999. Economic importance of Minnesota's dairy industry. St. Paul, MN:University of Minnesota Extension Service. Bulletin BU-7371-S.
Ha I, Morse G. 1998. Economic and fiscal impacts of property tax abatements: a regionalintegrated modeling system approach. Paper presented at the 45th North American meetings ofthe Regional Science Association International 1998 in Santa Fe, NM.
Hurst J, Runge M, Strawn H, Gunther W. 1995. The Alabama poultry industry: an economicimpact study. Auburn, AL: Auburn University, Alabama Agricultural Experiment Station,University of Alabama, Center for Business and Economic Research.
Jahae I, van Staalduinen L. 1992. Application of input-output methodology for local communityimpact analysis: swine production in Redwood County, Minnesota. St. Paul, MN: University ofMinnesota, Department of Agricultural and Applied Economics. Staff Paper P92-12.

V-3-323
Johnson T, Scott J. 1997. The community policy analysis system (COMPAS): a proposednational network of econometric community impact models. Paper presented at FederalForecasters' Conference.
Kilkenny M. 1991. Computable general equilibrium modeling of agricultural policies:documentation of the 30-sector FPGE GAMS model of United States. Washington, DC: U.S.Dept. of Agriculture, Economic Research Service, Agricultural and Rural Economy Division.
Lasley P. 1995. "Economic development." In: Thu K, Understanding the impacts of large- scaleswine production: proceedings from an interdisciplinary scientific workshop, June 29-30, 1995,Des Moines, IowaDes Moines, IA. Des Moines, IA: North Central Regional Center for RuralDevelopment. p. 117-51.
Leistritz F.1993. Economic impact of expanded dairying in North Dakota. Fargo, ND: NorthDakota State University, Department of Agricultural Economics. AE 93010.
Lobao L. 1990. Locality and inequality: farm and industry structure and socioeconomicconditions. Albany, NY: State University of New York Press.
McKissick J, Turner S, Kriesel W, Luke A, Cato T.1998. Feasibility analysis for a proposedpork processing plant in Alma, Georgia. Athens, GA: The University of Georgia, College ofAgricultural and Environmental Sciences, Department of Agricultural and Applied Economics.AGECON-98-046.
Miller D. 1991. Employees: what they're paid, how they're treated. National Hog Farmer Fall:6-10.
Morse G.1998. Economic importance of Minnesota's poultry industry. St. Paul, MN: Universityof Minnesota Extension Service. Bulletin MI-7020.
Otto D, Lawrence J, Swenson D. 1996. "Local economic impacts of hog production." PorkIndustries Economic Review :27-38.
Otto D, Orazem P, Huffman W. 1998. Community and economic impacts of the Iowa hogindustry. In. Iowa's pork industry - dollars and cents. Ames, IA: Iowa State University,Department of Economics. p. 25-8.
Robison M, Foltz J, Meyer N, Wolf S, Smathers R. 1993. The role of the dairy industry inIdaho's economy. Moscow, ID: University of Idaho, College of Agriculture, AgriculturalExperiment Station.
Senf D, Maki W, Houck J.1992. The economic importance of Minnesota's food and agricultureindustry. St. Paul, MN: University of Minnesota, College of Agriculture, Department ofAgricultural and Applied Economics. Staff Paper P92-18.
V-3-324
Shields M, Deller S. 1997. A conjoined input-output/econometric model for Wisconsin counties.Paper prepared for presentation at the annual meetings of the Southern Regional Association,Memphis, TN.
Skees J, Swanson L.1988. Farm structure and rural well-being in the South. Agriculture andcommunity change in the U.S.: the Congressional research reports. Boulder, CO: WestviewPress, Inc. p 238-321.
Tanjuakio R, Hastings S, Tytus P. 1996. The economic contribution of agriculture in Delaware.Agricultural and Resource Economics Review April.
Thompson N, Haskins L. 1998. Searching for "sound science:" a critique of three universitystudies on the economic impacts of large-scale hog operations. Walthill, NE: Center for RuralAffairs.
Thornsbury S, Kambhampaty S, Kenyon D. 1993. Economic impact of a swine complex inSouthside Virginia. Blacksburg, VA: Virginia Cooperative Extension.
van Es J, Chicoine D, Flotow M.1988. Agricultural technologies, farm structure and ruralcommunities in the Corn Belt: policies and implications for 2000. Agriculture and communitychange in the U.S.: the Congressional research reports. Boulder, CO: Westview Press, Inc. p.130-180.
Vukina T, Roka F, Carter T, Brandt J, Zering K.1995. Impact of the poultry industry on theeconomy of North Carolina. North Carolina State University, North Carolina AgriculturalResearch Service Technical Bulletin 307.
Warner L, Plaxico J. The Oklahoma pork industry: an economic impact analysis. Prepared forthe Oklahoma Pork Producers.
2001 GEIS Working Papers and Other Non-Peer Reviewed Publications:
Bartik, Timothy J. and Richard D. Bingham, Can Economic Development Programs BeEvaluated? Upjohn Institute Staff Working Paper 95-29, 1995. http://www.upjohninst.org/publications/wp/9529.html
Dobson, W., Christ, P. 2000. Structural change in the U.S. dairy industry: Growth in scale,regional shifts in milk production and processing and internationalism. University ofWisconsin-Madison, Staff Paper Series No. 438, December.
Drabenstott, M., Henry, M., Mitchell, K. 2000. "Meat geography causing changing landscape inrural U.S." Feedstuffs (March 6):14-20.
Fogleman, S., Milligan R., Maloney, T., Knoblauch, W. 1999. Employee compensation and job
V-3-325
satisfaction on dairy farms in the northeast. Cornell University, Department of Agricultural,Resource, and Managerial Economics, Research Bulletin 99-02 (April).
Guess-Murphy, S. 1999a. Employment and income impacts of first district association milkprocessing plant, Litchfield, Minnesota, 1998. Report for the Center for Rural Design, Universityof Minnesota, Department of Applied Economics.
Guess-Murphy, S. 1999b. Employment and income impacts of associated milk producers,incorporated milk processing plant, Rochester, Minnesota, 1998. Prepared for the Center forRural Design, University of Minnesota, Department of Applied Economics.
Guess-Murphy, S. 2000. Economic impacts of the Minnesota dairy industry. Prepared for theCenter for Rural Design, University of Minnesota, Department of Applied Economics, June.
Hurley, T., Orazem, P., Kliebenstein, J. 2000. Changes in the structure of wages in the U.S.pork industry. Selected Paper - American Agricultural Economics Association Annual Meeting,Tampa, FL, July 30-August 2, 2000.
Kalambokidis, L. 2000. Understanding tax reform in Minnesota. Minnesota AgriculturalEconomist, No. 702 (Fall).
Lazarus, W., Morse, G., Platas, D., Guess-Murphy, S. 2000. Economic and local governmentimpacts of the Minnesota swine industry. University of Minnesota, Department of AppliedEconomics. Final Research Report prepared for the Minnesota Pork Producers Association(April).
Metcalfe, M. 1999. Location of production and endogenous water quality regulation: A look atthe U.S. hog industry. Iowa State University, Center for Agricultural and Rural Development,Working Paper 99-WP 219 (April).
North Central Regional Center for Rural Development. 1999. Bringing home the Bacon? Themyth of the role of corporate hog farming in rural revitalization. A report to the Kerr Center forSustainable Agriculture.
____ “Karl Popper,” Stanford Encyclopedia of Philosophy (http://plato.standord.edu/entries/popper/ 3/23/01.
Rikoon, S. 1999. Large scale hog confinement: Citizen perceptions and the community's health.Community Development Society, Conference proceedings: Community building: Weaving thefabric of resilient community, Spokane, WA, July 25-28.
Tweeten, L.G, C.B. Flora. 2001. Vertical Coordination of Agriculture in Farming-DependentAreas. Task Force Report, No. 13, March, Council for Agricultural Science and Technology.
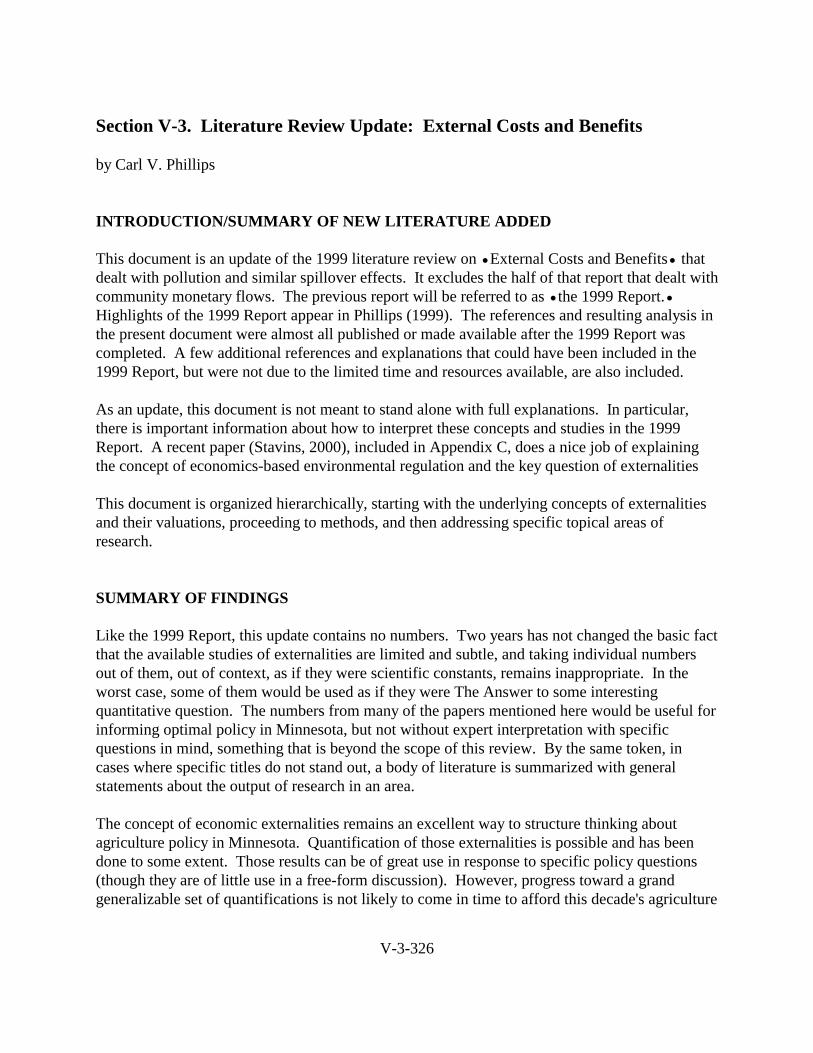
V-3-326
Section V-3. Literature Review Update: External Costs and Benefits
by Carl V. Phillips
INTRODUCTION/SUMMARY OF NEW LITERATURE ADDED
This document is an update of the 1999 literature review on •External Costs and Benefits• thatdealt with pollution and similar spillover effects. It excludes the half of that report that dealt withcommunity monetary flows. The previous report will be referred to as •the 1999 Report.• Highlights of the 1999 Report appear in Phillips (1999). The references and resulting analysis inthe present document were almost all published or made available after the 1999 Report wascompleted. A few additional references and explanations that could have been included in the1999 Report, but were not due to the limited time and resources available, are also included.
As an update, this document is not meant to stand alone with full explanations. In particular,there is important information about how to interpret these concepts and studies in the 1999Report. A recent paper (Stavins, 2000), included in Appendix C, does a nice job of explainingthe concept of economics-based environmental regulation and the key question of externalities
This document is organized hierarchically, starting with the underlying concepts of externalitiesand their valuations, proceeding to methods, and then addressing specific topical areas ofresearch.
SUMMARY OF FINDINGS
Like the 1999 Report, this update contains no numbers. Two years has not changed the basic factthat the available studies of externalities are limited and subtle, and taking individual numbersout of them, out of context, as if they were scientific constants, remains inappropriate. In theworst case, some of them would be used as if they were The Answer to some interestingquantitative question. The numbers from many of the papers mentioned here would be useful forinforming optimal policy in Minnesota, but not without expert interpretation with specificquestions in mind, something that is beyond the scope of this review. By the same token, incases where specific titles do not stand out, a body of literature is summarized with generalstatements about the output of research in an area.
The concept of economic externalities remains an excellent way to structure thinking aboutagriculture policy in Minnesota. Quantification of those externalities is possible and has beendone to some extent. Those results can be of great use in response to specific policy questions(though they are of little use in a free-form discussion). However, progress toward a grandgeneralizable set of quantifications is not likely to come in time to afford this decade's agriculture

V-3-327
policy. Indeed, in many ways, increasing doubts about the narrowly-drawn cost-benefit approachamong supporters of economic approaches (let alone opponents of such approaches) suggests thatwe may be moving further from technocratic analyses of complicated policies that affect materialgoods, aesthetic preferences, ethics, and social structures. Cherry picking seems to be the bestpolicy strategy: take the useful structure, take what quantification there is available andstrategically fill in a few gaps, and use the resulting tools and inputs without depending on fillingall the gaps.
CRITICAL REVIEW OF INFORMATION SOURCES
ConceptThe primary observation at the conceptual level is that there is no apparent change in the attitudesthat make it difficult to use welfare-economics based calculations to aid policy. Scholarly andtechnical publications that focus on agriculture practice do not seem to have changed theiremphasis nearly as much as the policy and popular discussion of agriculture, which isincreasingly devoted to externalities (though typically not using that piece of jargon). Thiscontrasts with other areas of regulation and environmental analysis in general, where externalityanalyses are a huge part of the research literature and effort. This implies that an analysis ofagricultural externalities in Minnesota will have to draw much more on the environmentalliterature than the agriculture literature for methods and data, even for topics that are more socialthan environmental.
Externalities from animal agriculture are increasingly seen as a subsidy granted to the industry(an uncompensated transfer of society's wealth in the form of environmental goods and socialcapital), but policy use of externality-based analysis remains very limited. This, in turn, leavesthe literature devoid of analysis of how well such approaches have worked. (By contrast, there isa burgeoning literature about how economics-influenced policies have worked in other areas ofenvironmental and social policy.) This is possibly attributable to the disconnect • largelyunchanged over the last few years • between "true believers" in valuation methods and cost-benefit analysis as the right tools for environmental policy and those who find these to be thewrong approach because of practical difficulties or fundamental objections to the underlyingliberal philosophy.
Castle (1999) presents a very cogent recent review and criticism of economic approaches toenvironmental and agricultural policy (see also Randall, 1999). The mood of this discussion isone of continuing erosion of the notion of a traditional objective economic analysis of theseissues. This possibly signals a retrenchment of the role of economic externality analysis, fromsome of the quixotic roles it has been cast in, and to more useful advisory roles.
At a less philosophical level, analyzing agricultural externalities is particularly challengingbecause of the heterogeneity of different regions and operations (Lovell and Kuch, 1999).

V-3-328
Studies of complicated systems never result in universal constants, but agricultural externalitiesare particularly difficult because results from North Carolina or England, where many studiestake place, may not be even remotely applicable to Minnesota (or they may be greatapproximations for Minnesota -- but it is difficult to determine).
Economists generally recognize that because of the negative externalities from animal agricultureproduction, too much (i.e., a higher than socially optimal quantity) production takes place (Innes,1999; Gray and Malla, 1998). Furthermore, there is reason to believe that willingness to pay topreserve environmental and other public goods will systematically underestimate the sociallyoptimal expenditure (Brekke and Howarth, 2000). The question of how much (how much toomuch, how much more people would be willing to pay) cannot be answered precisely withcurrent technology, but the direction is generally agreed upon (there is too much, not too little)and the rough magnitude can be estimated for a particular change in a particular place at aparticular time.
Some analysis has emphasized the dual-sided nature of the externalities (Peterson, 1999):pollution, human health, animal well-being, and the loss of natural land on the negative side anddesirable neighbors, favored communities, and an appreciation of the agricultural landscape onthe positive side. A method was recently proposed for estimating the latter of these positivevalues, and applied to the U.S. and other countries (Brunstad, Gaasland, and Vardal, 1999). Theconsolidation of animal agriculture into factory farms can be seen as causing the loss of thepositive externalities (which is equivalent to the creation of a negative externality). Whenstructural change results in the loss of former positive externalities, it is difficult to protect thepublic's interests without proactive policy action because what is being lost (or taken) was neveran entitlement (in contrast with taking someone's clean water), and thus is hard to defend underexisting policies.
In a discussion about Wisconsin, Tweeten (1998) emphasizes the family farms and lifestyleissues as the major externalities relating to agricultural industrialization in the Midwest. Heargues that under the present trends, the only way livestock production will return from itsexodus to the South and West is in the form of large operations, creating a choice in communitiesbetween factory farms and no farms at all. The only alternatives from the perspective of aMidwestern state involve rather deep forays into the market because minor local adjustments arenot likely to change production methods in given the national context (other than by shiftingproducers' incentives within the dichotomous choice of factory farms vs. no farms).
Beyond such discussions, there seems to be almost no economic information on the "MainStreet" issue, the question of how much loss people suffer as a result of the disappearance of thetraditional rural and small-town lifestyles that results from consolidation in the animal agricultureindustry. In particular, there does not seem to be much interest in quantifying this externality,even though is just as legitimate as any other consumer preference. Given that this unquantifieddesire remains a major motivating force in Minnesota agriculture policy, and given that the
V-3-329
policy discussion is (as is typical) dominated by numbers, it remains difficult to use the availableeconomic findings to assist with the core disagreements. There is very limited literature on thistopic available to apply to the Minnesota experience, a situation that has remained true as theGEIS has proceeded. The well-developed technologies for measuring externalities, includingthese (see the 1999 Report), could be brought to bear. (NB: As a conflict of interest disclosure:the author of this paper has no interest in carrying out such research and would participate verylittle or not at all, and thus this is not a self-interested statement.)
The question of whether concentration of production makes particular externalities worse, better,or neither remains open and controversial, though there is a clear concern about structural changeand the resulting externalities. One recent study in the North Central U.S. (Wachenheim andRathge, 2000) found a positive view of agriculture (in general) and concern that consolidatingstructure would hurt the environment, society, and local wealth. One important implication ofthis, that policy makers do not seem to have considered, is that production that is more efficient(in the colloquial sense, measured from a business accounting perspective) may be less efficientin the economic sense • that is, it produces lower total social welfare. Policy makers should,perhaps, not feel inclined to apologize for restricting farming practices based on a specificexternality (e.g., blocking the building of new factory farms because of local pollution concerns),even though this increases production costs and raises prices. Given the broad collection ofexternalities, the socially optimal level of production and consumption is much lower than thefree-market level, and so higher prices will move us toward the social optimum.
Technical improvements in cost-benefit analysis continue to be developed. Most are of littlespecific interest for present purposes. The particularly controversial area of discounting futurebenefits is taken up in a recent book (Portney and Weyant, 1999). One area of cost-benefitanalysis and regulation that should be kept in mind are the observations about how estimates ofthe cost of complying with regulation (reducing pollution, changing production methods, etc.) issystematically overestimated because of the failure to recognize the benefits of improvingtechnology (Hammitt, 2000; Harrington, Morgenstern, and Nelson, 2000; Stavins 2000). At thesame time, appreciation for rare amenities (unspoiled environment, unique communities) tends toincrease with population and wealth, while concern about a few extra dollars tends to decreasewith wealth.
MethodsThe basic methodological issues and tools were described in the 1999 report. Researcherscontinue to refine and apply these methods, but there have been no particular breakthroughs. Many economists of various political leanings continue to strongly advocate externality-valuation-based approaches to improving policy. (However, given the increasing evidence thatthese approaches are very informative in some cases but are far out of reach in others, thisbreadth of this advocacy sounds increasingly like religion rather than science.)
A recent summary of the field can be found in a dedicated issue of Environmental Science &

V-3-330
Technology (Farrow, Goldburg, and Small, 2000; etc.). The articles provide an excellentapproachable primer, though provide limited balance in terms of conceding that there is a largegulf between theory and our ability to apply it. One article in the collection (Bockstael, et al.,2000) does note that the evolution of environmental policy from environmental health (whereexternality valuation is relatively easy) to ecosystem protection (where it approachesprohibitively difficult) has resulted in a poor "forced marriage" (p. 1384) of different methodsand situations. The authors go on to emphasize the importance of measuring costs and benefitsfor some well-defined change, rather than hypothetical aggregate values (which relates closely tothe next subsection in this report).
The overall lesson for the GEIS from this and other current state-of-the-art reports is that cost-benefit thinking regarding externalities can be useful for specific questions but not so useful forsweeping, open-ended policy discussions beyond providing some rough assessments. Asdiscussed in the 1999 Report, it is also quite useful for identifying cases where the benefits of apolicy outweigh the costs (or fall short of them) by a factor of, say, ten, but not so useful for closecalls.
For those who think that conservative (in the sense of using it only when it clearly works) cost-benefit approaches can make better policy for everyone involved, it is important to start agreeingon the terms of the discussion. Agriculture offers a rare opportunity to apply these win-winapproaches to policy making because it has substantially escaped the adversarial process that isbuilt into most U.S. environmental laws. This could change. Law-centric environmental policythinkers are "discovering" that agriculture is a major polluter and are likely to try to increase theirinfluence over it (e.g., Ruhl, 2000).
The Broken ChainThe 1999 Report emphasized the major limitation of existing methods and literature formeasuring the externalities from a particular change in policy or practice. It is worth reiteratingthat point:
It is important to realize that the analysis of how an action leads to a measuredcost or benefit has two distinct steps, the path from action to change in thephysical world (such as an injury to an environmental good), and the path fromthe change in the physical world to a change in human well-being (valuation). The first step is the topic of many of the other areas of the GEIS, while this reportfocuses on the latter. The critical importance of the two step process is that whilewe have the technology to map a certain agricultural practice or policy to humanwelfare outcomes, it has not been done in very many cases. In many cases,someone has gone from Point A (the action) to Point B (the injury), and someonehas gone from Point B' (seldom exactly the same Point B, unfortunately) to PointC (change in welfare), but no one has gone from A to C. As a result, a literaturereview is not sufficient to produce many values -- it can only show what

V-3-331
groundwork has been laid to produce those values. Actually providing the valueswould be new research, not simply a review of the literature. (from the 1999Report)
There are exceptions (particularly in the area of recreational uses of surface water), but a fewexceptions can do little to remedy the huge gaps. It does not appear from the last few years'literature that researchers in the field have taken up this challenge as an object of specific study. Many quantitative analyses of the value of environmental goods and bads do not even contributemuch to the "A to B" and "B to C" parts of the policy question. There is still a habit of reporting"here is what this whole resource is worth, and policy makers should consider that," as if totaldestruction were being contemplated, and sometimes "here is the measured value of ahypothetical change in quality," without regard to whether that change is relevant to anyproposed or predicted changes.
This is not a criticism of the quality and quantity of work in the fields. The research thatattempts to value environmental externalities remains technically complicated, extremely broadin scope, and in pursuit of ever-changing values. Thus, we would expect only slow progress overthe course of a few years.
Some cause for optimism can be found in approaches like that of Magat, Huber, and Viscusi(2000), who structured their analysis of the value of water quality to be able to answer questionsof where marginal cleanup expenditures should be directed (which bodies of water, which uses)to maximize the reduction of negative externalities. This contrasts with most studies whichsimply put a value on an arbitrary difference in quality levels for a single resource. While thisfalls short of linking a specific policy to a physical outcome and through to a value, it is a step inthat direction.
Until a much larger body of valuation literature is developed, and there is more of an eye towardthe entire chain of causality, it will be difficult to estimate the valuation of externalities from aparticular policy or action without a study effort specifically devoted to making the links for thatpolicy/action.
Benefits TransferFurther complicating the use of existing valuation studies for policy decisions is the limitedprogress in improving benefits transfer methods over the last few years. Benefits transfertechniques, methods for accurately using measured valuations from one time/place/situation toestimate valuations for a time, place, and situation of interest, are key to broadening the use ofvaluation in policy making. Much of the thinking in the GEIS process related to valuation seemsto focus on this possibility. As discussed in the 1999 Report, this is difficult and methods havenot been widely validated. Considering the value that would come from improving thesetechniques, as opposed to doing more and more specific, non-applied valuation studies, it isunfortunate that such limited research attention is directed toward this area.

V-3-332
There is currently a push to include gains and (more often) losses of environmental values innational statistics for net production (Nordhaus and Kokkelenberg, 1999). If this goes forward, itwill have to include a huge increase in the number of valuation studies and the methods fortransferring the results. This should produce great tools for states and others to make policy. Furthermore, Europe is moving to catch up with the U.S., providing more data (Pearce andSeccombe-Hett, 2000; Pearce, 1998).
However, recent assessments (Delavan and Epp, 2000; Brouwer, 2000) conclude that suchtransfers are still very difficult and full of uncertainty. Some studies still report success in doingtransfers by comparing the results to direct studies (Scarpa et al., 2000), but there are still fairlyfew such tests in the literature.
The lack of solid methods for benefits transfer does not mean that valuation studies are uselessfor advising policy. At the very least, existing valuation studies will provide useful rough cuts atwhether something is very valuable or not so valuable. As long as the rough nature of theestimate is recognized, it can be very informative to compare Minnesotans' valuation oftraditional rural lifestyles, for example, to the price of maintaining them, to see if they are aboutthe same or differ by a factor of ten in one way or the other.
Survey MethodsAs discussed in more detail in the 1999 Report, contingent valuation (CV) • which, roughlyspeaking, consists of asking people how much they would be willing to pay for some good • isthe only method for measuring many of the externalities associated with animal agriculture. Since the time of the original literature review, CV has remained controversial but still popular touse. (For a recent summary, see Carson, 2000.)CV methodology remains a work in progress. Most proposed variations and new methods(presumably improvements) involve relatively minor changes. The details and an evaluation ofthese are beyond the present scope, though it is worth mentioning a few highlights. Severalrecent works have offered particular substantial innovations in the use of CV. This includesPark, Bowker, and Leeworth (2001), which applies a method suggested by Englin and Cameron(1996) to use travel cost data to help calibrate and anchor CV results. It also includes techniquesfor blending of CV and revealed preferences, the more widely accepted sources of individualvalue (Hite, 2000). Alternative survey methods have been proposed, such as Gregory's (2000)multi-attribute method. But despite the insider rhetoric that these are fundamental departuresfrom CV, they are still based on most of the same premises and methods and subject to the samelimitations.
The bottom line is simple: Survey methods remains necessary for estimating certain values • ifwe are to do so • and continue to improve, but remain highly imperfect.
Other Methods

V-3-333
As with CV, the other methods for valuing externalities that were described in the 1999 Reporthave progressed, but there have been no notable changes in their usefulness.
A new set of measures involving actual market data are emerging, thanks to the increasingpopularity of "eco-labeling" • the inclusion of environmentally friendly or community orientedattributes with a food product, such as organic food products. Since these products are generallymore expensive than their non-eco-labeled counterparts, the extra cost provides a direct revealedwillingness to pay to reduce externalities (Blend and van Ravenswaay, 1999; Nimon and Beghin,1999). There remain several substantial limitations to this method, however. Producers andadvertisers have made limited progress in bringing these options to the public's attention andmaking the labels and certifications effective (Teisl, Roe, and Levy, 1999). Furthermore , it isnot entirely clear that what is being measured is what we want to measure. The major problem isthat a voluntary donation in the form of paying more for something than necessary in order tohelp the world almost certainly understates someone's true value for the service provided. At thesame time, consumers may be purchasing the satisfaction of knowing they did the right thing,despite it being easier to do otherwise, which might result in the price paid overstating truewillingness to pay for the improvement per se. Thus, the study of eco-labeling is likely to remainof interest to marketers and environmental advocates, but not of those trying to computeenvironmental valuation. The one area where new revealed preference data might somedayprove more useful is valuing food safety. Since food safety is a private good, the purchase pricepremium for safer food should reflect its full value. However, skepticism and lack ofinformation will continue to make this difficult to measure for the near future.
Topical Areas of ResearchThe current trends are promising for generating an ever-increasing number of useful findingsregarding externality valuation. While it remains extremely difficult to transfer measures madein one area or for one project or policy to another, a larger volume of studies improves theprospects substantially.
Air PollutionResearch on air pollution is increasingly dealing with LULU (locally undesirable land use) issues(e.g., Schiffman, 1998). This is useful for agriculture policy because the usual emphasis onhealth alone misses much of impact. Sometimes a link to health problems can be establishedfrom agricultural air pollution, but complaints usually are aesthetic (costs which are no less real).
Air pollution presents a particularly good opportunity to deal with the broken chain problem. Real changes in welfare occur over a short time due to reasonably simple • and thus quantifiablein terms of cost causes (or with reasonably simple solutions, anyway). Thus it should be possibleto simultaneously study the cost of the LULU air pollution problem and the cause or actionsnecessary to mitigate it (and their corresponding costs). There is a substantial body of existingand ongoing research about the physical and health effects sides of the issue (the specifics ofwhich are covered in the corresponding reports from the GEIS better than they could be here).

V-3-334
In the area of global air pollution, particularly gasses that contribute to climate change, animalagriculture is a significant contributor, and this is being increasingly recognized in the populardiscussion of the topic (and thus it is increasing in policy and resource attention). There is a hugeliterature on the physical side of this and the relation to agriculture (though there does not seemto be much examination of the effect of industry structure). There is also an increasing literatureon the economic effects of global warming (and thus the measure of the externalities), but thisremains rather uncertain and distant for making state-level policy.
Water PollutionThe greatest progress in terms of new methods, findings, and publications since the time of theoriginal GEIS Literature Review seems to be in the area of water quality, both surface andgroundwater. There are dozens of new studies in the literature that attempt to value water qualityissues that relate to agriculture. This is probably due to the combination of a mature set oftechnologies for measuring water quality (as opposed to the much weaker methods for measuring LULU issues or ecosystem injury), the fact that agriculture is by far the largest contributor ofsuch pollution (as opposed to air pollution), and the fact that the results are fairly local andtraceable (as opposed to global warming). It is important to avoid "lamppost" policy making byresponding primarily to water pollution issues because they are best studied. However, weshould be pleased by the progress in this area.
A project to analyze CV studies of groundwater quality, ongoing since the early 1990s, continuesto make progress, but still concludes that there is not enough of the right kind of analysis to drawfirm conclusions (Bergstrom, Boyle, and Poe 2000 and other published and unpublished work bythe same authors). As with most analyses of the progress of CV studies, the major conclusionshave more to do with the increasing solidity of the method rather than premature conclusionsabout general numbers resulting from it (which is in keeping with the underlying philosophy ofthe present analysis). One particular conclusion from their work (see particularly Bergstrom etal., 1996) is that the multiple values of groundwater over time (current extraction for drinkingwater, current extraction for agriculture, future extraction, and non-extractive value) need to beconsidered, and that current extraction should be analyzed in light of the externalities for otheruses. Other models (Zachariah and Rollins, 1999; Zachariah, 1999) have demonstrated the needto integrate regulation of pollution of groundwater, including pollution from livestock, and theregulation of groundwater extraction, which also is often an externality from livestockproduction.
Specific to the interest of the GEIS, there is evidence that, as suspected, concentrated animaloperations increase per-acre application of manure (Navin and Innes, 1999; Innes, 1999), andthus the resulting runoff and surface water pollution.
Minnesota-specific data about surface water quality valuation is available (Mathews, Homans,and Easter, 1999). Other findings (Magat, Huber, and Viscusi, 2000) provide a wide variety of

V-3-335
values for North Carolina, which continues to offer much of the available data on agriculturalexternalities.
Other Human Health ImpactsMost human health issues are captured in the traditional, media-oriented classifications above,but a few defy easy classification.
Hormonally active chemicals (endocrine disruptors) remain a hotly debated environmental healthconcern (as well as a concern for wildlife and ecosystem protection). These chemicals, whoseimpacts are primarily in the form of water pollution, are traced to agricultural chemical use in theform of pesticides and hormones. There is little agreement on how big this problem is and howmuch can be attributed to agriculture, and it is difficult to find neutral presentations of the issuesand findings. A recent summary can be found in Safe et al. (2000).
The smoking gun confirming the always-suspected link between the use of antibiotics in animalagriculture and antibiotic resistance in medical settings was established at about the time of the1999 Report. Since that time, there has been surprisingly little attention to the topic. Technicaldiscussion about the effect on production can be found in the animal science and veterinaryliteratures. On the public health side, there have been several news- and editorial-leveldiscussions (e.g., Ferber, 2000; Woodman, 1999), but limited scientific review (but see severalarticles in supplemental issues of Acta Veterinaria Scandinavica (the 2000 issues includesThrelfall et al. 2000, which reviews the U.K. experience, and the 1999 issue includes Tollefson etal. 1999, which reviews the U.S. experience).
A substantial portion of foodborne pathogens can be traced to animal agriculture practices. Butdespite overstated claims about having quantified the problem (Mead et al. 1999),we really knowlittle more about the total impact than we did (LaPole, Phillips, and Hedberg, 2001), let alone thespecific effects of agriculture practices.
On the economics side of these impacts, there has been relatively little attention to this as amatter of externality analysis. In short, these concerns have been established as majorexternalities over the last few years, but addressing it from a policy economics perspectiveremains difficult and specifically relating it to the issues of primary interest to the GEIS processis not yet possible.
EcosystemsIt has never been clear how the changing structure of animal agriculture changes its effects onecosystems and biodiversity. Any concerns about increased local pollution are offset, to anunknown degree, but the reduction in agricultural sprawl, particularly in the form of grazing,across most U.S. land. There does not seem to be much literature that addresses this. A goodsummary of issues relating agriculture to biodiversity can be found in Tilman et al. (1999).

V-3-336
It is difficult to write about agricultural externalities today without mentioning biotechnology orgenetically engineered species. This is largely an issue of plants, due to limitations of the currenttechnology, but the centrality of feed crops makes the issue relevant to animal agriculture. Thegoals of the GEIS, however, focusing on the structure of the animal agriculture industry, areorthogonal to concerns about biotechnology. Inevitably partisans on one or both sides of thiscontentious issue will try to introduce it into any discussion of animal agriculture, but nothinguseful can be said about it here.
Animal Well BeingThis area of concern in Minnesota remains understudied, despite repeated calls for more scienceand less "politics." While debates about the topic continue to be energetic, there does not seemto be any economics literature since the 1999 Report. As with many issues, politics is probablymore useful than the very limited economic science and the natural/agricultural sciences thatcannot answer the question of what matters to whom and how much.

V-3-337
REFERENCES
Bergstrom JC, KJ Boyle, CA Job, MJ Kealy (1996). Assessing the economic benefits of groundwater for environmental policy decisions. Water Resources Bulletin 32(2):279-291.
Bergstrom JC, KJ Boyle, GL Poe, eds. (2000). Valuation of water quality. Brookfield Vermont:Edward Elgar.
Bergstrom JC, KJ Boyle, M Yabe (2000). Ground water quality valuation and subjective reiskperceptions: Georgia and Main Case Study. In Bergstrom JC, KJ Boyle, GL Poe, eds. Valuationof water quality. Brookfield Vermont: Edward Elgar.
Blend JR, EO van Ravenswaay (1999). Measuring consumer demand for ecolabeled apples.American Journal of Agricultural Economics, 81:1072-7.
Bockstael NA, AM Freeman, RJ Kopp, PR Portney, VK Smith (2000). Measuring economicvalues for nature. Environmental Science & Technology 34(8):1384-9.
Brekke KA, RB Howarth (2000). The social contingency of wants. Land Economics 76(4):493-503.
Brouwer R (2000). Environmental value transfer: State of the art and future prospects. EcologicalEconomics 32(1):137-52.
Brunstad RJ, I Gaasland, E Vardal (1999). Agricultural production and the optimal level oflandscape preservation. Land Economics 75(4):538-46.
Castle EN (1999). Natural resource and environmental economics: a retrospective view. Reviewof Agricultural Economics 21(2):288-304.
Carson RT (2000). Contingent valuation: a user's guide. Environmental Science & Technology34(8):1413-8.
Delavan W, DJ Epp (2001). Benefits transfer: the case of nitrate contamination in Pennsylvania,Georgia and Maine. In JC Bergstrom, KJ Boyle, GL Poe, eds., Valuation of water quality,Brookfield, Vermont: Edward Elgar Publishers.
Englin J, TA Cameron (1996). Augmenting Travel Cost Models with Contingent Behavior Data.Environmental and Resource Economics, 7:133-147.
Farrow RS, CB Goldburg, MJ Small (2000). Economic valuation of the environment: a specialissue. Environmental Science & Technology 34(8):1381-3.

V-3-338
Ferber D (2000). Antibiotic resistance; superbugs on the hoof? Science 288(5467):792-794.
Gray R, S Malla (1998). A note on evaluating agricultural policy in the presence of health carecost externalities: Dairy production quotas and coronary heart disease costs. Canadian Journal ofAgriculutural Economics, 46(2):247-56.
Gregor RS (2000). Valuing environmental policy options: A case study comparison ofmultiattribute and contingent valuation survey methods. Land Economics 76(2):151-73.
Hammitt JK (2000). Are the costs of proposed environmental regulations overestimated?Evidence from the CFC phaseout? Environmental and Resource Economics 16:281-301.
Harrington W, R Morgenstern, P Nelson. (2000). On the accuracy of regulatorycost estimates.• Journal of Policy Analysis and Management 19(2).
Hite D (2000). Information impacts on stated vs. revealed preference valution of environmentalquality. American Agricultural Economics Assocation annual meeting, 2000, Tampa, Florida.
Innes R (1999). Regulating livestock waste; an economic perspective. Choices, second quarter1999, 14-19.
Innes R (2000). The economics of livestock waste and its regulation. American Journal ofAgricultural Economics 82(1):97-117.
LaPole L, CV Phillips, and C Hedberg. Quantifying the Uncertainty in Estimated FoodborneIllness Incidence using Monte Carlo Simulation. Manuscript.
Lovell SI, PJ Kuch (1999). Rethinking regulation of animal agriculture. Choices, second quarter1999, 9-13.
Magat WA, J Huber, WK Viscusi (2000). An iterative choice approach to valuing clean lakes,rivers, and streams. Harvard Law School John M. Olin Center for Law, Economics, and BusinessDiscussion Paper No. 295.
Mathews LG, FR Homans, KW Easter (1999). Reducing phosphorus pollution in the MinnesotaRiver: how much is it worth? Staff paper P99-4, University of Minnesota Department of AppliedEconomics.
Mead PS, Slutsker L, Dietz V, McCaig LF, Bresee JS, Shapiro C, Griffin PM and Tauxe RV(1999). Food-Related Illness and Death in the United States. Emerging Infectious Diseases 5(5):1-39.

V-3-339
Navin J and R Innes (1999). Do livestock operations raise soil nutrients? Working paper,University of Arizona.
Nimon W, J Beghin (1999). Are eco-labels valuable? Evidence from the apparel industry.American Journal of Agricultural Economics, 81:801-11.
Nordhaus WD, EC Kokkelenberg, eds. (1999). Nature's numbers: Expanding the nationaleconomic accounts to include the environment. Washington, D.C.: National Academy Press.
Park T, JM Bowker, VR Leeworthy (2001). Linking stated and revealed preference models fornonmarket values: snorkeling visits to the Florida Keys. Manuscript, Department of Agriculturaland Applied Economics, University of Georgia.
Pearce D (1998). Cost-benefit analysis and environmental policy. Oxford Review of EconomicPolicy, 14(4):84-100.
Pearce DW, T Secombe-Hett (2000). Economic valuation and environmental decision-making inEurope. Environmental Science & Technology 34(8):1419-25.
Peterson JM (1999). Optimal agricultural land pricing policies under multiple externalities in aglobal economy. American Agricultural Economics Association annual meeting, Nashville,Tennessee.
Phillips CV (1999). How do economists value the environmental effects of livestockproduction? Minnesota Agricultural Economist, no. 697, Summer 1999.
Portney, PR JP Weyant, eds. (1999). Discounting and Intergenerational Equity. Washington,D.C.: Resources for the Future.
Randall A (1999). Taking benefits and costs seriously. In T Tietenberg and H Folmer, eds.,International Yearbook of Environmental and Resource Economics, Northhampton,Massachusetts: Edward Elgar.
Ruhl JB (2000). Farms, their environmental harms, and environmental law: Taking the great leapfrom anti-law to positive law in farm policy. Ecology Law Quarterly, May 2000.
Safe SH, WG Foster, JC Lamb, RR Newbold, GVan Der Kraak (2000). Estrogenicity andendocrine disruption. Council for Agricultural Science and Technology,http://www.cast-science.org/pdf/endocrine.pdf.
Scarpa R, WG Hutchinson, SM Chilton, J Buongiorno (2000). Reliability of benefit value
V-3-340
transfers from contingent valuation data with forest-specific attributes. Working paper.http://papers.ssrn.com/paper.taf?abstract_id=224121.
Schiffman SS (1998). Livestock odors: implications for human health and well-being. Journal ofAnimal Science, 76(5):1343-1355.
Stavins RN (2000). Economic analysis of global climate change policy: a primer. KennedySchool of Government Working Paper 00-003, Harvard University.http://papers.ssrn.com/paper.taf?abstract_id=240389
Teisl MF, B Roe, AS Levy (1999). Ecocertification: Why it may not be a "Field of Dreams."American Journal of Agricultural Economics, 81:1066-71.Threlfall EJ, LR Ward, JA Frost, GA Willshaw. Spread of resistance from food animals to man--the UK experience. Acta Veterinaria Scandinavica, supplement 93:63-68 with discussion 68-74.
Tilman GD et al. (1999). Benefits of biodiversity. Council for Agricultural Science andTechnology, http://www.cast-science.org/biod/biod.htm.
Tollefson L, PJ Fedorka-Cray, FJ Angulo FJ (1999). Public health aspects of antibiotic resistancemonitoring in the USA. Acta Veterinaria Scandinavica, supplement 92:67-75.
Tweeten L (1998). Agricultural industrialization: for better or worse? Anderson Chair OccasionalPaper ESO #2404, Department of Agricultural, Environmental, and Development Economics,The Ohio State University.
Wachenheim C, R Rathge (2000). Societal perceptions of agriculture. Agribusiness and AppliedEconomics Report 449, North Dakota State University.
Woodman R (1999) Overuse of animal antibiotics threatens human health. British MedicalJournal, 319(7209):536.
Zachariah O (1999). Optimal economic management of groundwater quantity and quality: anintegrated approach. Doctoral dissertation, Department of Agricultural Economics and Business,University of Guelph, Ontario.
Zachariah O, K Rollins (1999). Optimal economic management of groundwater quantitiy andquality: an integrated approach. American Agricultural Economics Association annual meetingselected paper, Department of Agricultural Economics and Business, University of Guelph,Ontario.
V-3-341
VII. Appendices
Appendix APrimer: Introduction to Measures of Regional Economic Impacts
This section presents the terminology that is commonly used in economic impact studies lookingat the effects of one industry on other industries and businesses, communities and the state as awhole. While many of these terms are commonly used and understood, sometimes there areseveral common ways of using the terms, and this can create communication problems. Thedefinitions used in this report are as follows.
Region is defined to be any size from a small town or city, county, state, or even the nation. Inthis report we do not consider national studies.
TYPES OF INCOME
Employee compensation includes wages or salary plus fringe benefits such as health and lifeinsurance, retirement payments, and any other non-cash compensation.
Proprietary income consists of self-employed income. For example, the income of self-employed lawyers, doctors, or business owners would fit here.
Profits and other property income include payments from interest, rent, royalties, dividends, aswell as profits.
Indirect business taxes consist of excise and sales taxes but not income taxes or corporate taxes.
Personal income is the sum of employee compensation and proprietary income or the total of allforms of employment income. Value-added income is the sum of personal income plus profits and other property income andindirect business taxes.
Gross Regional Income is identical to the value-added income of the region.
Gross Regional Product (GRP) equals the gross regional income. However, GRP is defined asthe total spent on regional consumption and investment goods, total government purchases, andthe total value of net exports from the region.
V-3-342
Generally, gross regional income or total value-added is used as the key measure of the size of aregional economy. When measuring the impacts on the entire region, gross regional income orvalue-added is often reported because it is the most comprehensive measure.
MULTIPLIER (SPIN-OFF) EFFECTS
The economic impacts of adding a new industry to a region will vary depending on the extent towhich that firm buys raw materials and other inputs within the region. The larger the volume ofpurchases within the region, the larger the regional multiplier or spin-off impacts. Conversely,the smaller the leakages (purchases from outside the region) the greater the spin-off effects.
Regardless of the type of models used, there are several basic concepts used in estimating themultiplier effects. While most of these concepts are directly applicable to input-output modelsdescribed in the next section, they also apply to nearly all of the methods of examining multiplieror spin-off effects. These are defined below:
Economic Shock: In measuring the economic and fiscal impacts of the changes in an industry,we need to define exactly what that change is. Generally, this is called the economic shock. It isan exogenous change (a change from outside the model that you are using to explain the changesin other variables). With the feedlot issue, economic shocks might be drops in demand forlivestock, changes in regulations at the state or local level that restrict the number of animalsgrown, or addition of a new meat packing plant that increases the demand for livestock locally. The economic shock is taken as a given or the starting point in any economic impact analysis.
Direct effects are the changes in expenditures in each industry or for each commodity that stemfrom the economic shock. These do not include any spin-off or multiplier effects. Estimates ofthese direct effects come from surveys or interviews with firms rather than from economicmodels.
Indirect effects are the changes in industries that sell to the industries in which the direct effectsoccur. For example, if a new hog operation opened in Murray County, the additional feed sold tothat unit would be an indirect effect. The corn sold to the feedmill would also be counted. Thefertilizer used on the corn and the trucking services used to deliver the fertilizer would becounted. Induced effects are the changes in expenditures by consumers who work either in the industrydirectly affected or in industries that are indirectly affected.
Offsetting effects are changes in the local economy that occur as a result of your direct effect butwhich are not captured by backward linkages. For example, if you add a new hotel to acommunity, you need to check that this new hotel is not simply taking business away from theexisting hotels. If this offsetting effect happens the direct effect could be zero. When a firm is

V-3-343
lost from a community, other existing firms might simply expand and service the market. Again,there could be no net direct effect due to this offsetting effect.
Type 1 Multipliers report on the total change in income, counting both direct and in-directincomes stemming from the economic shock compared to the direct change in income comingfrom the shock. A multiplier of 2.5 means that total income is 2.5 times as high as direct incomeand that the indirect effect is 1.5 times more than the direct. Type I multipliers are available forall types of income and employment.
Type 2 Multipliers report on the total change in income, counting direct, indirect, and inducedincome divided by the direct change in income. Type 2 multipliers are always higher than type 1multipliers, which leave out the induced impacts. Type 2 multipliers are controversial becausethey assume that any new income will be spent in exactly the same spending patterns as theaverage spending. This is rarely true and generally means that type 2 multipliers overestimate thetrue impacts of an economic shock. On the other hand, type 1 multipliers completely ignoreconsumer spending and tend to underestimate the economic impacts. In practice, someeconomists use modified type 2 multipliers that give some consumer effects but not the fulleffect. Backward Linkages refers to the purchases by an industry from its suppliers or the purchases bya household from the producers of the goods and services it uses. For a pork producer, thebackward linkages are for feeds, equipment, trucking services, etc.
Forward Linkages refers to the sales to other industries or to final consumers. For a porkproducer, sales to a meat packing plant are part of her forward linkages.
Final demand includes sales to consumers within the region being studied and to consumers andindustries outside the region. Sales to governments within the region are also included in finaldemand.
Intermediate demand includes sales to all industries that use the product as part of theirproduction process.
MODELS FOR MEASURING MULTIPLIERS
This section looks at the models used to estimate the regional spin-off effects. We provide ageneral description of these models and a critique, outlining their strengths and weaknesses.Models are simply maps of the economy. As a map outlines the major features of the land, amodel outlines the major features of how an economy works. Just as no one type of map (U.S.interstate highway map, state road map, topological map) will serve all purposes, none of thesemodels is useful in every context.

V-3-344
Economic Base Models are the simplest type of multiplier models. The multiplier is simplydefined as:
Multiplier = Total employment/ Basic Export Employment
Exports are sales outside the region being studied, not necessarily international exports. Nearlyall industry sectors have some export sales, especially when considering domestic exports (salesto people or firms in other states within the country).
When we consider the fact that some industries will purchase more raw materials and inputswithin a region than others, it is apparent that the multipliers will differ between industries. However, the economic base model only has a single multiplier. Input-output models providemultipliers for each industry. For details on economic base models, see Shaffer (1989).
Input-Output Models: These are a double entry accounting system for all industries within aregion. In the rows it traces the sales of each industry to each other industry, to consumers inhouseholds, and to exports (See the rows in Table 1). For example, the Agriculture sector hastotal sales of 100 million in this hypothetical economy and sells 5 million to itself, 10 million tomanufacturing, 10 million to retail, 15 million to households, and exports 60 million. In thecolumns it also traces the expenditures by each industry as it purchases raw materials and inputsfrom other industries, pays workers, and imports goods (See the columns in Table 1). Forexample, agriculture has total expenditures of $100 million. It buys 5, 20, 30 million fromagriculture, manufacturing, and retail respectively. It pays households 25 million, partly aswages and partly as self-employment income and partly as profits. In addition it has to buy 20million in imports from outside the region. The multipliers are derived from this table as shownin Appendix A. The only difference from the example in Table 1 and actual input-outputmodels is the scope. Most have 528 industrial sectors rather than only three as shown in Table 1.
Table 1: Transaction Table for an Area Economy*
EconomicSectors
Agriculture Manufacturing Retail Household Export TotalSales
Agriculture 5 10 10 15 60 100Manufacturing 20 5 5 10 140 180Retail 30 5 5 90 15 145Household 25 80 30 10 25 170Imports 20 80 95 45TotalExpenditures
100 180 145 170

V-3-345
* Example from Goode, 1982. See Appendix A for non-technical explanation of multipliers
Several authors are critical of input-output models. For example, Thompson and Haskins (1998)write that input-output models are •severely limited by both the assumptions made and the dataused• (p.2). They are correct, but this can be seen as virtue rather than a weakness. It ensuresthat users can trace exactly what assumptions and data are used rather than having a mysteriousblack box.
When the input-output model is used to predict the economic impacts of a change in an industry,the following assumptions are made:
2) The output of each sector has a fixed production function, and there is no substitutionbetween the input factors as change in the level of output occurs;
3) The change in the level of output being studied is not large enough to result in changes in theeconomies of scale;
4) The change in the level of output being studied is not large enough to result in changes in theprices of outputs or inputs;
5) The change in the level of output is not large enough to cause a change in the technologybeing used;
6) The percentage of imports for each industry will not be changed by the size of the impacts;
7) All increases in employment come from in-migration or new entrants to the labor force;
8) The estimates of transactions (as shown in Table 1) are accurate.
None of these is likely to be true for large changes in a business or economy. But if the change issmall enough relative to the total economy that prices do not change, then the first four will betrue. Assumption # 5 simply says that the market share of inputs between the region and theoutside world will remain the same as the regional economy grows. Assumption #6 could be aproblem in areas with large amounts of in- and out-commuting. This assumption is removed inthe integrated econometric/input-output models. Assumption #7 seems obvious. However,since some of the input-output models have over 250,000 cells of information and over 3,600pieces of regional data this can be a problem.
Regional input-output models typically are non-survey models that are built from the nationalmodel using regional data for each sector on output, employment, and value-added components. These non-survey models are 90 percent as accurate as the survey models but only about 10percent as expensive. Consequently, practically no one uses survey models at the regional level.
V-3-346
Non-survey models have two additional assumptions. These are:
8) the technology used in the region is identical to that used nationally; and
9) the percentage of regional purchases from local supplies is estimated accurately.
When the regional technology appears to be very different from the national average, manynonsurvey input-output models allow users to substitute survey data for the primary industriesbeing studied. Likewise, semi-survey methods are sometimes used to improve the accuracy ofthe regional purchase coefficients for the principal industries. For additional detail on input-output models see Shaffer, 1989, p. 274-284; Miller and Blair, 1985; Goode, 1982; Olson andLindall, 1996; or Otto and Johnson, 1993.
Integrated Econometric/Input-Output Models: These blend the virtues of the econometricand input-output models. The most common integrated model (Johnson and Scott 1997)estimates the changes in out-commuting and in-commuting for a county, adjusting the number ofin-migrants and new entrants.
This adjustment is important when estimating the fiscal impacts changes. If a person who livesin community A but commutes to work in community B takes a new job in his home community(A), he adds very little to the local demand for services and little to the local tax base. Likewise,additional in-commuters add much less demand on schools and other local public services thando new in-migrants. The other advantage of these models is that the econometric portion includes equations toestimate the additional local government revenues and additional local government expenditures. These models, however, are in their infancy and need additional testing (Johnson 1996; Johnsonand Scott 1997; Shields and Deller 1997; Shields 1998; Ha and Morse 1998).
Computable General Equilibrium Models (CGE): These are simulation models which do notrequire all the assumptions in input-output models. Most CGE models allow impacts largeenough that they result in changes in the prices of inputs or the outputs. Since economists spendmost of their life studying the impacts of price changes, this drives them wild and these modelshave been wildly popular. Unfortunately, the data required for these models is massive. In fact,so much data is needed that the equations are not estimated using local data but rathercoefficients are borrowed from other earlier studies. An advantage of these models is that theymake explicit the many assumptions that often go into any analysis. The complexity of themodels often makes them very time consuming and costly to develop. For an excellentoverview of CGE models, see Robinson, 1989.
The CGE modeling that has been done on agriculture deals with national and international issues (Hertel 1990; Kilkenny 1991; Kilkenny and Otto 1994). No CGE studies were found that dealt

V-3-347
with state or sub-state regions and livestock.
Impact Studies vs. Linkage Studies: The models outlined above can be used to either estimatethe impacts on the rest of the economy of a change in a given sector or simply to describe thelinkages between a sector and the rest of the economy. For brevity, we will call the former•impact studies• and the latter •linkage studies.•
Many of the input-output studies reviewed here are linkage studies. As a description of thelinkages between a livestock sector and the sectors that support it, they are valuable. Further,there is little reason to be concerned about the assumptions inherent in input-output in linkagestudies. These assumptions only become problems when impact studies are done. This meansthat a reader can not assume that if a livestock industry has 10,000 direct jobs and another 16,000support jobs for a total of 26,000 jobs that a policy that reduces the direct jobs by 10% will leadto a reduction in state jobs of 2,600. In fact, maybe the net impact on the state•s economy is apositive 2,600 jobs! Next we explore why this is so.
For impact studies using input-output, one of the major limitations is that •off-setting effects•are not built into the model (endogenous). For example, assume the losses in an agriculturalsector of 1,000 farm level jobs due to a new tough environmental policy. With the multipliereffects, assume that this costs a total of 2,600 jobs related directly to this agricultural sector. Thenet effect on the state is only 2,600 jobs if these people never get a new job in the state. If,however, the labor market is very tight, many of these people will get new jobs. If some of theworkers in the agricultural sector are very close to retirement and elect to retire a little early, theloss of jobs is only for the years left until their regular retirement age. If the new jobs are inindustries with higher value-added incomes (wages, proprietor incomes, and profits) than theagricultural industry, the state•s economy actually benefits from the loss of the farms andagricultural processing plants. It is impossible to determine whether the net impacts on the state•s economy or even the regionaleconomy will be positive or negative. Given the public•s tendency to mistake linkage studies forimpact studies, or at least to misapply the results of linkage studies, it is possible that they areinherently misleading.9 Even in the short-run, many of the workers who lose their jobs willreceive public unemployment assistance. So the consumer spending, while lower, will not go tozero. Either input-output or computable general equilibrium can be used to do impact studiesand can account for the offsetting effects. In input-output models, the offsetting effects must beexplicitly established in the impact scenario. This is very difficult and seldom done in input-output studies. The computable general equilibrium models incorporate the feedback loops sothat the offsetting effects will be identified by the model itself. Unfortunately, the complexity of 9 As the authors of several of these linkage studies, we have seen a number of users make this error, even after thedifference is pointed out.

V-3-348
these feedback loops makes it difficult to have models with sufficient detail to identify differentlivestock species. In fact frequently CGE models only are able to have an agriculture section,much less separate sectors for dairy, pork, beef, etc.
ALTERNATIVES FOR MEASURING IMPACTS
In addition to using models to simulate the impacts of development, researchers can examineactual changes in local economies. Three approaches have been taken to do this (Bartik andBingham, 1995). They are:
1) Before and after measures of local economies;
2) With/Without comparisons of local economies; and
3) Surveys of local citizens or leaders.
Before and After Measures: In the Before and After approach, data is collected on somevariable of interest (jobs, incomes, wages) before the development and then again after thedevelopment. The impact is simply the difference between the value after development minusthe value before development. The problem with this measure is that there might have beenother factors which caused the change other than the program or development being considered. The longer the time between the before and after measures the more likely that outside variableswill influence the outcome.
With/Without Comparisons: The With/Without comparison is done in two steps and requiresa comparison community or region. In the first step, the before and after measures are taken inboth the region of interest and in •identical• regions. Identical means that approximatelyeverything, except for the development being measured, is the same between the regions. Theimpact of the development is then the difference in the before/after developments in the twoareas. The advantage of this approach is that it removes some of the problems of the outsidechanges influencing results since both of the regions will be subject to the same influences •provided they are identical twins. The problem is that it is very difficult to find identical trends.The inference that the difference in growth between two regions is due to the development isonly valid if the two areas are identical and all the influences on their economies are identical. Ifthey are of different sizes or different economic structures (percentage of firms in each industry),then we would expect different rates of growth and change in the two areas without any shock.
Survey Approach: This allows the researcher to ask community leaders about whetherdevelopment occurred or the nature of the development. The advantage is that the researchercan gain insights in the process. The disadvantages are that respondents might not rememberdetails or have precise answers. Also, the respondents might have incentives to exaggerate

V-3-349
impacts. The key question in evaluating survey studies is whether respondents have strongincentives to lie. Before and After Impact Studies This is identical to the comparable areasimpact studies except that the same area is used. The changes in key economic variables aremeasured before and after an economic shock. Like the comparable area studies, this is onlyvalid if the only difference is the economic shock. However, this is seldom the case.
Appendix BRegional Input-Output Models: A Non-Technical Explanation
The following extended quote, from the University of Wisconsin-Extension bulletin (Goode1982), gives a non-technical description of how regional input-output models and multipliers aredeveloped. This was a regional project and Frank Goode is a Professor of AgriculturalEconomics at Pennsylvania State University. The extended quote follows:10
THE TRANSACTION TABLE
The input-output model takes its name from one of the tables typically constructed in suchstudies. This table shows the distribution of sales of each of the sectors in an area economy toeach of the other local sectors and to the export sector. Suppose that we have a rural communityin which we can assign each of the firms to one of four sectors: the agricultural sector, themanufacturing sector, the retail sector, or the household sector. The input-output transactions forsuch a community are shown in Table A1. The first (row) of Table A1 indicates the distributionof total sales of the agricultural sector to the other sectors in the local economy and for export. Agricultural production in the region totals $100. Of that $100, sales to other agricultural firmsaccounts for $5, sales to manufacturing firms for $10, sales to retail establishments, such asgrocery stores, for $10, and direct-marketing sales to the household sector for $15. The balanceof $60 of agricultural output is exported to individuals and firms outside the region. Conversely,each column of the table represents the distribution of input purchases for each of the foursectors. Thus, the columns of such a table represent the inputs and the rows represent the outputsof the sectors in the local economy. Generally, these flows are measured in dollars.
THE INPUT COEFFICIENT TABLE
10 This publication is in the public domain and not copyrighted so it can be quoted at lengthwith full citation and without explicit permission.

V-3-350
The next step in input-output analysis is to use the information in Table A1 to develop an inputcoefficient table. The input coefficients for a particular sector indicate the amount of inputpurchases by that sector, per dollar of output, from each of the sectors. The input coefficients inTable A2 are obtained by dividing the entries of each column of Table A1 by the total of thecorresponding row. For example, each of the entries in the first column would be divided by thetotal of the agricultural row. To produce one dollar's worth of agricultural output requires 5cents' worth of input from other agricultural firms, 20 cents' worth of inputs are required from themanufacturing sector, 30 cents' worth of inputs from the retail sector, 25 cents' worth of inputsfrom the household sector in the form of labor, and 20 cents' worth of various imported inputs.
THE MULTIPLIERS
The next step in input-output analysis is to develop multipliers. There are a variety ofmultipliers, but those most commonly used reflect the total change in output in the economyassociated with a $1 increase in exports from one of the sectors. That is, for an economy such asthat represented by Tables A1 and A2 there would be four multipliers. These multipliers wouldindicate how much total output in the local sectors would increase as a result of a $1 increase inexports from the agriculture, manufacturing, retail, or household sector. These multipliers areobtained as follows.
Suppose we are interested in finding the multiplier for the manufacturing sector because of ananticipated increase in export demand for that sector's output. This could be reflected in theexpansion of employment in an existing firm or the arrival of a new firm. If the manufacturingsector's exports increased by $1, the immediate and so-called direct effect is the $1 increase inoutput in the manufacturing sector. However, increasing output by $1 in the manufacturingsector requires inputs of other sectors. Namely, the $1 increase in manufacturing output requires6 cents' worth of inputs from the agricultural sector, 3 cents' worth of inputs from both themanufacturing and retail sector, and 44 cents' worth of inputs from the household sector. Theseincreases in output are referred to as the first-round indirect effects.
The first-round increases in output require each of the four sectors to increase their inputpurchases. For example, the first round required agricultural production to increase by 6 cents;thus, the agricultural sector must purchase additional inputs. The increased output of 6 cents inthe agricultural sector again required inputs of (only 3/10 of 1 cent from agriculture and) 2 centsfrom the (retail) l sector, and 1 cent each from the manufacturing and household sectors.11
Likewise, the first-round increased output of 3 cents in the manufacturing and retail sectors and44 cents in the household sector requires additional inputs from the other sectors. The inputs
11 The interested reader is referred to William M. Miernyk, The Elements of Input-Output Analysis for a fulldescription of the mathematics. Goode had an error in this sentence. His numbers in Table 3 are ok but thissentence had a math error. We•ve corrected that for ease of exposition.

V-3-351
required to support the first round are referred to as the second-round indirect effects and arefound in Column 3 of Table A3. That is, to support the first-round impacts listed in Column 2 ofTable A3 requires 5 cents' worth of input from agriculture, 4 cents from manufacturing, 25 centsfrom the retail sector, and 4 cents from the household sector. The round-by-round procedurecontinues until the magnitudes are so small as to be negligible. Summing all of the rounds yieldsthe amount that output each of the four sectors would increase in response to the original $1increase in manufacturing-sector exports. In this example the $1 increase in manufacturingexports would require increased output of approximately 16 cents in the agricultural sector, $1.12in the manufacturing sector (this includes the original $1 increase in demand), and 45 cents in theretail sector. The total income of the household sector would increase by about 67 cents. In total,the entire economy will increase by $2.40 in response to the original $1 dollar increase in exportsales of the manufacturing sector. Put another way, each dollar increase in export sales from themanufacturing sector generates an additional $1.40 worth of business in all four sectors in theeconomy. The multipliers for all of the sectors are shown in Table A4.

V-3-352
Table A1: Transaction Table for an Area Economy*
EconomicSectors
Agriculture Manufacturing Retail Household Export Total Sales
Agriculture 5 10 10 15 60 100Manufacturing 20 5 5 10 140 180Retail 30 5 5 90 15 145Household 25 80 30 10 25 170Imports 20 80 95 45Total Expenses 100 180 145 170
Table A2: Input Coefficients for an Area Economy
EconomicSectors
Agriculture Manufacturing Retail Household
Agriculture .05 .06 .07 .09Manufacturing .20 .03 .03 .06Retail .30 .03 .03 .53Household .25 .44 .21 .06
Table A3: Direct and Indirect Effects Associated with a $1 increase in Manufacturing Exports.
EconomicSectors Direct Indirect Rounds*
(1) (2) (3 to 13) TotalAgriculture .06 .05 .05 .16Manufacturing 1 .03 .04 .05 1.12Retail .03 .25 .17 .45Household .44 .04 .19 .67
Total: 2.40*While Goode•s article shows indirect rounds 3 and 4, the typical input-output model uses theequivalent of 13 indirect rounds. The total impact of these indirect rounds is shown above even
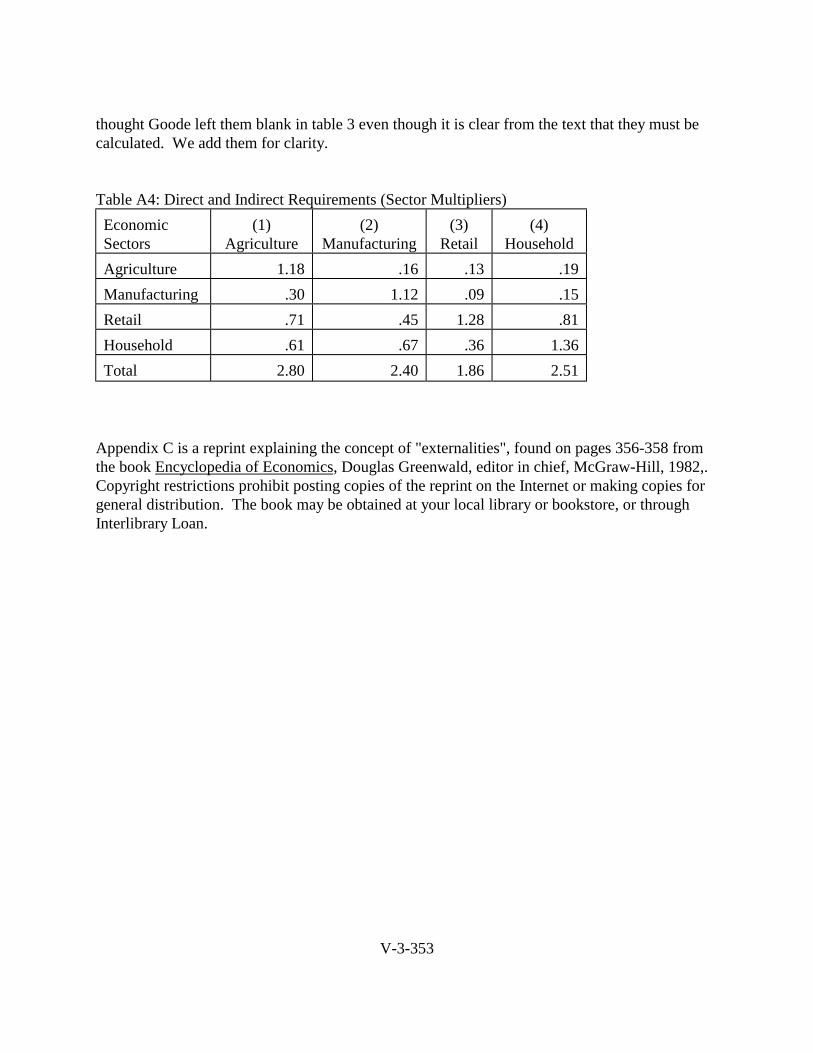
V-3-353
thought Goode left them blank in table 3 even though it is clear from the text that they must becalculated. We add them for clarity.
Table A4: Direct and Indirect Requirements (Sector Multipliers)EconomicSectors
(1)Agriculture
(2)Manufacturing
(3)Retail
(4)Household
Agriculture 1.18 .16 .13 .19Manufacturing .30 1.12 .09 .15Retail .71 .45 1.28 .81Household .61 .67 .36 1.36Total 2.80 2.40 1.86 2.51
Appendix C is a reprint explaining the concept of "externalities", found on pages 356-358 fromthe book Encyclopedia of Economics, Douglas Greenwald, editor in chief, McGraw-Hill, 1982,. Copyright restrictions prohibit posting copies of the reprint on the Internet or making copies forgeneral distribution. The book may be obtained at your local library or bookstore, or throughInterlibrary Loan.