generation entrepreneur? - youth business international · pdf file ·...
TRANSCRIPT

Generation Entrepreneur?The state of global youth entrepreneurship
Authors: Jacqui Kew, Mike Herrington, Yana Litovsky, Helen Gale
Understandingthe entrepreneurial
attitudes, aspirations and activities ofyoung people


Page 3
Contents
Front cover images show (from left to right):Gabriel Álvarez Miguel founded AVI Music in Mendoza, western Argentina, with the backing of YBI member Fundación Impulsar.
Huaping Yang, from Chengdu, China, was able to set up an after-school teaching business with the support of Youth Business China, a member of Youth Business International.
With the support of The Prince’s Trust, a member of Youth Business International, Emma Reilly was able to overcome bullying and mental health challenges to set up a successful design company in Newcastle, north east England.
Forewords by GEM and YBI
List of Figures and Tables
Executive summary
1. Chapter 1 1.1. Introduction 1.2. Youth unemployment 1.3. Why youth entrepreneurship matters 1.4. Factors inhibiting youth entrepreneurship 1.5. About this report
2. Chapter 2 2.1. A global view 2.1.1. Attitudes, activity and aspirations 2.1.1.1. Entrepreneurial pipeline Case study 1: enabling youth entrepreneurship Case study 2: influencing youth entrepreneurship 2.1.1.2. Societal perceptions of entrepreneurship 2.1.2. Job creation 2.1.3. Innovation-orientation Case study 3: youth entrepreneurship and innovation 2.1.4. Sector
2.2. A focus on Latin America and the Caribbean,Middle East and North Africa, sub-Saharan Africa and Asia Pacific and South Asia 2.2.1. Trading 2.2.1.1. Trading space 2.2.1.2. Customer base 2.2.2. Financing 2.2.3. Influences and Motivations
3. Chapter 3: Conclusions and recommendations for policy and practice
4. Appendices 4.1. Appendix 1. About GEM, YBI and Accenture 4.2. Appendix 2. Detailed tables of country specific data
4
6
7
99
121213
16161620263136394042
444444454750
53
6064

Page 4
The Global Entrepreneurship Monitor or GEM as it is best known, was first conceptualised back in 1997 by two leading academics, one from London Business School and the other from Babson College in the Unites States. The first reports published covered ten countries, eight from the OECD, Japan and the USA. Since then over its 14 year history GEM has grown into a Consortium of more than 400 researchers from 100 economies spanning all geographic regions and all levels of economic development covering an estimated 74% of the world’s population and 87% of the world’s GDP. The purpose of GEM is to explore and assess the role of entrepreneurship in national economic growth. GEM’s individual-level, multi-phase focus enables a more comprehensive account of business activity compared with measures of formal registered businesses. It measures individuals, their attitudes, aspirations and intentions as well as looking at nascent and new enterprises together with established businesses. It allows for comparisons with regards to the level and characteristics of entrepreneurial activity among different economies and helps to guide the formulation of effective and targeted policies aimed at stimulation entrepreneurship.
GEM is now considered to be the largest and most authoritative longitudinal study on entrepreneurship in the world today.
The prime motive behind this report, especially in the light of rising global youth unemployment, is to try and understand more about the youth in different countries which in certain economies represent more than 50% of the total population. The study was made possible by the contribution of many of the GEM countries in collecting data during 2012. This partnership with YBI is an important initiative to begin exploration of the state of youth entrepreneurship globally.
M.D.HerringtonExecutive Director, GEMAugust 2013
Foreword
Global Entrepreneurship Monitor (GEM)

Page 5
As the UN Secretary General recently highlighted, “this generation of youth is the largest in history1.” The world will need around half a billion jobs by 2030, as more and more young people join the labour market. This demographic trend unfolds against a backdrop of weak economic recovery and escalating youth unemployment and under-employment rates. “To help meet this challenge, we should encourage, educate and empower young entrepreneurs.”
Many governments, donors, investors, companies and NGOs are rising to this challenge. YBI is the only dedicated global youth entrepreneurship network. Our network of independent not-for-profit initiatives in 38 countries (and counting!) assist under-served young entrepreneurs aged 18-35 to start and grow a business with a combination of training, access to capital, mentoring and other business development services. In 2012 YBI’s members helped 11,884 young people to start their own business. We estimate that these businesses will go on to create nearly 40,000 additional jobs within three years. Many make an important contribution to the social cohesion and economic development of their local communities.
With the need so acute, it is vital that we all maximise the impact of our interventions. Yet the youth entrepreneurship field “is constrained by a severe lack of sound evidence2 ”. YBI is committed to growing as a knowledge-based network and playing its part in leading research to enable better understanding of what drives youth entrepreneurship and what works where any why. That’s why we are delighted to have initiated this partnership with GEM to launch the first study of youth entrepreneurship globally using and expanding GEM’s leading methodology. It was also a great opportunity to build on our strong partnership with Accenture. The company contributed case studies to this report, drawing on interviews with the young entrepreneurs and member CEOs that
their Skills to Succeed corporate citizenship initiative does so much to support. We would also like to thank Mattias Lundberg of The World Bank for his advisory role in this project.
The report tells us that it is young people – up to the age of 35, or 40 in some regions – who are most likely to be starting up in business3 . We must do all we can to support as many aspiring young entrepreneurs as possible, and we hope that this research makes a useful contribution to all who share our aspiration.
Andrew DevenportCEO, YBIAugust 2013
1. http://www.un.org/News/Press/docs/2013/sgsm15135.doc.htm 2. Measuring Success of Youth Livelihoods Interventions, Global Partnership for
Youth Employment, http://www.ilo.org/public/english/employment/yen/downloads/eval/meguide/gpye-me-report.pdf
3. See in particular Figure 2.7
Youth Business International (YBI)

Page 6
Figures
Figure 1.1: Youth unemployment rates by region
Figure 2.1: Percentage who see good opportunities for starting a business in the next 6 months by region over age with covariates
Figure 2.2: Percentage who believe they have the required knowledge/skills to start a business by region over age with covariates
Figure 2.3: Entrepreneurial pipeline for 18 – 34 year olds by region
Figure 2.4: Entrepreneurial pipeline for 35 - 64 year olds by region
Figure 2.5: Nascent and new business rates by age and region Figure 2.6: TEA and established business rates by age and region
Figure 2.7: TEA, by region over age, country with covariates
Figure 2.8: Necessity and opportunity TEA entrepreneurs by age and region
Figure 2.9: Level of education by region and age
Figure 2.10: Entrepreneurship as a good career choice by age and region
Figure 2.11: Status of successful entrepreneurs, by age and region
Figure 2.12: Media coverage for new businesses by age and region
Figure 2.13: Fear of failure by age and region
Figure 2.14: TEA job creation, by age and region
Figure 2.15: TEA job growth expectations, by age and region
Figure 2.16: TEA: Innovative new product market combination by age and region
Figure 2.17: Retail sector participation, by age and region
Figure 2.18: Information, financial, administrative and personal sectors participation, by age and region
Figure 2.19: Trading space, by age and region
Figure 2.20: Percentage of sales expected to be from family and friends by age and region
Figure 2.21: TEA, Source of majority of money to start business by age and region
Figure 2.22: TEA, Number of people influencing the decision to start a business by age and region
Figure 2.23: TEA, People influencing the decision to start a business by age and region
Figure 2.24: Preference to run own business as a long-term option, by age
Tables
Table 2.1: GEM countries classified by economic development level and region
Table 2.2: Sub-Saharan Africa, actual job creation by age
Table 2.3: Non-European Union, actual job creation by age
Table 2.4: Countries participating in the 2012 GEM special youth topic
Table 2.5: Internet users (% of population) and ranking out of 144 countries
Table 2.6: TEA by level of income range, age and region
List of Figures and Tables

Page 7
Young entrepreneurs are more confident than older entrepreneurs about creating jobs over the next five years in all regions except sub-Saharan Africa, but in terms of starting a new business, fewer young people in Europe and Asia think that they have the capability and the opportunity, compared to young people from the Middle East, Africa and Latin America.
This first youth GEM report provides unique insight into the state of youth entrepreneurship globally: how aspirations, attitudes and activities with respect to starting a business compare among youth and adult populations in 69 countries. The report analyses data collected through surveys of more than 198,000 people by National teams participating in the Global Entrepreneurship Monitor. A random representative sample of at least 2,000 people, generally between the ages of 18 and 64 years, is surveyed per economy. The report also analyses responses to optional youth-focused questions relating to on-line trading, customer-base, access to finance and start-up influences. The report presents the findings in two sections: the first compares youth and adult responses from all 69 countries; the second presents the youth-focused results from participating countries.
Entrepreneurial Pipeline
There are significant regional differences in the rates of young people who believe that they have the capacity to start a business and that there are good business opportunities. Sub-Saharan Africa has the highest percentage of youth potential entrepreneurs (60%). However, approximately a third of all young entrepreneurs in this region, with a new or nascent business, are driven to entrepreneurship by necessity. In contrast, while only 17 percent of the youth in Asia Pacific and South Asia would be considered potential entrepreneurs, ten percent of the youth are involved in either nascent or new businesses with the majority (80%) of these youth businesses being opportunity-driven.
Societal perception of entrepreneurship
The visibility and attractiveness of entrepreneurship influences start up rates and the likelihood that businesses will find investors, suppliers, customers and advisors. Three quarters of the youth in Latin America and the Caribbean, sub-Saharan Africa and the MENA region believe that starting a business is a good career choice. The youth (68%) in Asia Pacific and South Asia are least likely to believe that successful new business owners receive high status. Fear of failure is more common in developed economies.
Growth expectations
Young people in all parts of the world except sub-Saharan Africa expect to create more jobs than adults over the next five years. The USA has the highest percentage (12.6%) of youth new or nascent business owners with high growth expectations i.e. who expect to offer employment to more than twenty people within the next five years.
Executive Summary
As many as 73 million young people are estimated to be unemployed in 2013 and studies by the International Labour Organisation (ILO) indicate that the youth are three times more likely than adults to be unemployed. The changing demographic profile in many countries is also leading to a significant increase in young people as a percentage of the total population. With the formal sector in many countries experiencing stagnant or slow growth, it is unlikely that this sector will be able to offer work opportunities to the increasing number of young people looking for employment. Unless alternative employment options are encouraged, the number of unemployed, underemployed youths and youth in vulnerable employment will continue to increase. Youth entrepreneurship needs to be enabled, as an additional way of allowing the youth into the labour market and promoting job creation.
Key findings:
The youth refers to young people between the ages of 18 – 34 years. Adults refers to people between the ages of 35 - 64 years.

Page 8
Innovation-orientation
Young entrepreneurs in all regions of the world perceive themselves, on average, to be more innovative than adults with respect to the extent to which their product or service is new to some or all customers and where few or no other businesses offer the same product. The region with the lowest youth innovation-orientation is MENA.
On-line trading
The youth in Asia Pacific and South Asia are most likely, and the youth in sub-Saharan Africa least likely, to make use of an on-line trading environment.
Access to finance
In sub-Saharan Africa (77.7%), Latin America and the Caribbean (75.7%) and Asia Pacific and South Asia (73.2%) approximately three-quarters of youth new or nascent businesses are primarily reliant on personal/family or friends for funding to start a business. In MENA the figure is almost 70 percent.
Customer base
Young nascent and new businesses in Latin America and the Caribbean are most reliant on family and friends as customers. Almost a quarter of the businesses indicated that between 75 and 100 percent of their customers were family and friends. Young entrepreneurs in Asia Pacific and South Asia are least reliant on family and friend as customers.
Role models
A lack of business-related role models is evident: a third of the youth in sub-Saharan Africa, Latin America and the Caribbean and the MENA region have no-one influencing their decision to start a business. By contrast, in Asia Pacific and South Asia, young entrepreneurs cite a number of people influencing their decision.
Recommendations
On the basis of these findings, the report sets out recommended actions for governments and other stakeholders, such as the media, schools and investors, to create a more enabling environment for young entrepreneurs, in the following key areas: entrepreneurial attitudes; education; access to finance; mentorship; internet capabilities.
Page 9
Entrepreneurship has become a key focus of research over the past three decades. With the focus on entrepreneurship and its potential for economic development and job creation, the recognition of entrepreneurs as having an important role in the economy has emerged. Entrepreneurship is widely acknowledged as a driver of sustainable economic growth as entrepreneurs create new businesses, drive and shape innovation, speed up structural changes in the economy, and introduce new competition – thereby contributing to productivity. Entrepreneurship also drives job creation and hence entrepreneurship is a critical contributor to economic growth that is inclusive and reduces poverty. The Global Entrepreneurship Monitor (GEM) defines entrepreneurship as “any attempt at new business or new venture creation, such as self-employment, a new business organisation, or the expansion of an existing business, by an individual, a team of individuals, or an established business6”.
As many as 73 million young people are estimated to be unemployed in 20137 and studies by the International Labour Office (ILO) indicate that the youth are three times more likely than adults to be unemployed. The changing demographic profile in many countries is also leading to a significant increase in young people as a percentage of the total population, and youth-driven unrest in countries such as Egypt and Tunisia means that research into youth and entrepreneurship is becoming even more important. By 2015, 660 million young people will be looking for work. With the formal sector in many countries experiencing stagnant or extremely slow growth, it is unlikely that this sector will be able to offer work opportunities to the increasing number of young people looking for employment8. Unless alternative employment options are encouraged, the number of unemployed, underemployed youths and youth in vulnerable employment will continue to increase. The traditional job for life career path has become rarer and youth entrepreneurship will need to be seen as an additional way of allowing the youth into the labour market and promoting job creation.
It is estimated that each year 121 million young people turn 16 years old, of which 89% will potentially be searching for work in developing regions9. With 73 million young people already unemployed and an estimated 1.1 billion new potential workers expected between 2012 and 2020,
Chapter 1
Apart from its detrimental effects on future wages and employability, youth unemployment may have a negative impact on happiness, job satisfaction and health for many years.4
Unemployment experiences early in a young person’s career are likely to result in wage scars that continue to depress their employment and earnings prospects even decades later.5
4. Morsy, H. 2012. Scarred generation, in Finance & Development, Vol. 49, No. 1, Mar5. ILO’s Global Employment Trends for Youth 20136. Bosma, N., Wennekers, S., & Amorós, J. in 2012 GEM Global Report7. ILO’s Global Employment Trends for Youth 2013
8. Schoof, U. 2006. Stimulating Youth Entrepreneurship: Barriers and incentives to enterprise start-ups by young people, SEED Working Paper, No 76, ILO, Geneva
9. UNICEF 2012. When the global crisis and youth bulge collide, Double the Jobs Trouble for Youth
1.1 Introduction
1.2 Youth Unemployment
There is growing evidence that the contribution that women entrepreneurs make to society is considerable as they are more likely to reinvest their profits in education, their family and their community.
(How Women Entrepreneurs Are Transforming Economies and Communities, forbes.com)

Page 10
youth unemployment is likely to become an even greater problem over time. The figure of 73 million young people estimated to be unemployed, while hugely concerning, understates the problem as it does not include the vast number of young people that are underemployed or stuck in vulnerable employment opportunities10.
The assumption behind calling for jobs for the youth is that jobs are good and allow young people to make a living, provide for their family and build a stable foundation for professional growth11. However most types of youth employment reveal very few jobs can in fact be considered “good jobs”. The ILO defines vulnerable employment as “the sum of own-account workers and contributing family workers”. These individuals are unlikely to have formal contracts, social security and decent working conditions. Vulnerable employment is likely to offer low earnings and a lack of options with respect to job security. A concern with respect to individuals in vulnerable employment is that they are far more affected in times of economic uncertainty. They have little or no job security, and are unlikely to have access to mechanisms that would offer unemployment benefits if they were to lose their jobs. The low earning potential linked to vulnerable employment also means that these individuals are unlikely to be in a position to save, while employed, as a buffer to protect them during period of unemployment.
The capacity of the world economy to create jobs has been steadily declining since the early 1990s and, other than Latin America, the economic crisis has further fuelled the trend of fewer jobs becoming available. Labour markets are also plagued with low or negative wage growth that is impacting predominantly on wage earners at the lower end of the employment scale12. The impact of the global economic recession on the state of youth unemployment is emphasised in the ILO’s Global Employment Trends for Youth 2013 publication which estimates that the global youth
unemployment rate, estimated at 12.6 percent in 2013, is close to its crisis peak.
The report further shows that the current state of youth unemployment is in line with long-term global trends, namely:
• Rising youth unemployment and falling labour force participation contributed to a decrease in the global youth employment-to-population ratio to 42.3 percent in 2013, compared with 44.8 percent in 2007.
• Globally, the ratio of youth to adult unemployment rates stands at 2.7 in 2013. Young people therefore continue to be almost three times more likely than adults to be unemployed.
• In Europe, an increasing proportion of employed youth are involved in temporary employment and part-time work.
• In countries and regions with high shares of vulnerable employment, the youth employment challenge is as much a problem of poor employment quality as one of unemployment.
• Young people have a higher likelihood than adults of being among the working poor
• Many young people in developing economies begin their working lives engaged in family businesses (likely to be an informal enterprise), and few make the transition to paid employment in the formal sector.
Youth unemployment is particularly prevalent in the following regions: the Middle East, North Africa, non-European Union13 and the Developed Economies and European Union. In these regions youth unemployment rates have continued to soar since 2008. Youth unemployment increased by as much as 24.9 percent in the Developed Economies and European Union between 2008 and 2012, and the youth unemployment rate was at a decades-long high of 18.1 percent in 2012. On current projections,
10. UNICEF 201211. African Economic Outlook 2013. Who are the working youth in Africa? 12. UNICEF 201213. See Table 1.1 for a list of non-European Union countries

Page 11
the youth unemployment rate in the region will not drop below 17 percent before 201614 .
In 2012, youth unemployment rates were highest in the Middle East and North Africa, at 28.3 percent and 23.7 percent, respectively, and lowest in East Asia (9.5 percent) and South Asia (9.3 percent). While South Asia and Sub-Saharan Africa present relatively low regional youth unemployment rates, it is important to note that the lower unemployment rate is linked to high levels of poverty, which means that while unemployment levels may be lower, this is not making huge inroads into decreasing poverty, which seems to indicate that the type of work would not be referred to as “good jobs”. The lower regional average for Sub-Saharan Africa disguises extremely high youth unemployment rates in certain countries. Youth unemployment rates in South Africa, where over half of young people in the labour force were unemployed in the first three quarters of 2012, and in Namibia (58.9 percent in 2008) are much higher than the regional average15. Care must also be taken when reviewing the unemployment rate, particularly for low -income economies. The ILO unemployment rate has active job search as a criterion for inclusion in the unemployment rate. When this criterion is excluded, the unemployment rate doubles in many low-income economies and the unemployed rate in least developed economies is then higher than that of the high-income economies. To put this into context, it is estimated that up to 60 percent of young people in developing regions are either without work, not studying, or engaged in irregular employment16.
Gender differentials in youth unemployment rates are small at the global level and in most regions. Regional youth unemployment rates are lower for young women in the advanced economies and East Asia. However, large gaps between female and male rates are evident in some regions such as North Africa and the Middle East and, to a lesser extent, Latin America and the Caribbean17.
UNESCO18 highlights the growing mismatch between the supply and demand for skills as a key reason driving the high youth unemployment rates. The nature of the skills mismatch differs across the various regions, but is exacerbated by the low growth rates affecting most parts of the world. The various mismatches identified include a general excess of skilled workers, skills shortages in specific sectors with an oversupply of skilled workers in other sectors, a lack of specific skills required by employers and a lack of basic foundation skills that render young people unemployable (and unable to successfully become self-employed).
14. ILO’s Global Employment Trends for Youth 201315. ILO, 201316. ILO, 2013
17. ILO’s Global Employment Trends for Youth 201318. UNESCO, 2013 Tackling youth unemployment through TVET
Years
Perc
enta
ge u
nem
ploy
ed
Figure 1.1: Youth unemployment rates by regionSource: Data from ILO, Global Employment Trends for Youth 2013
5.0%2007 2008 2009 2010 2011 2012 2013
10.0%
15.0%
20.0%
25.0%
30.0%
Middle East
Non-European Union
Latin America and Caribbean
South East Asia and Pacific
North Africa
Developed economies and EU
East Asia
South Asia
Sub-Saharan Africa
Figure 1.1
Youth unemployment rates by regionSource: Data from ILO, Global Employment Trends for Youth 2013
Page 12
The traditional job for life career path has become rarer19 and youth entrepreneurship will need to be seen as an additional way of allowing the youth into the labour market and promoting job creation. Organisations and initiatives such as the ILO20, United Nations, World Bank and YBI highlight a number of additional positive advantages to stimulating youth entrepreneurship:
• youth entrepreneurship is an option to create employment for the youth;
• young entrepreneurs are more likely to hire fellow youths;
• young entrepreneurs are particularly responsive to new economic opportunities and trends;
• young people are active in high growth sectors;
• young people with entrepreneurial skills are better employees;
• young people are more innovative and often create new forms of independent work;
• young people who are self-employed have higher “life satisfaction”21;
• entrepreneurship offers unemployed or discouraged youth an opportunity to build sustainable livelihoods and a chance to integrate themselves into society22;
• entrepreneurial experience and/or education help youth develop new skills that can be applied to other challenges in life. Non-cognitive skills, such as opportunity recognition, innovation, critical thinking, resilience, decision making, teamwork, and leadership will benefit all youth whether or not they intend to become or continue as entrepreneurs23.
The challenges facing young people when deciding whether to start a business could be due to regional or cultural issues specific to the area in which the young person operates. These issues could be gender- or culture-related, educationally-based or due to the particular political or economic issues facing an area. In the MENA region men are 2.8 times more likely to start a business than women, with the exception of Israel, where men are 1.4 times more likely than women to start a business24. This could be a reflection of differences in culture and customs regarding women’s participation in the economy: for example, societal views about women’s role in the workplace and in business more specifically. Education is a particular barrier facing the youth in sub-Saharan Africa. Sub-Saharan Africa is still plagued by significantly lower levels of literacy, poor numeracy skills, high drop-out rates, particularly in secondary schooling and low level of tertiary enrolments. Young people in sub-Saharan Africa are therefore less prepared to compete in the global environment. Continued political uncertainty and continued violent conflict experienced in various parts of the world create additional barriers that will prevent young people from starting a business. For example, the continued unrest in Egypt impacts on areas such as tourism, and as such, impacts on viability of entrepreneurial activity as a career choice.
Research has indicated that a number of barriers are identified by young people across the globe. These include access to finance, lack of appropriate skills, lack of infrastructure, a lack of adequate support structures and a lack of mentorship as barriers to entrepreneurship for young people. Fifty-nine percent of young people in the United Kingdom25 indicated that not having enough money is a key barrier that would prevent them from starting a business. Fear of failure (43%) and the current economic climate (42%) were additional barriers mentioned by these young people. Youth in conflict areas such as the Kashmir indicated on-going conflict as the
19. Schoof, U. 2006. 20. Simpson, J. and Christensen, J. Youth Entrepreneurship & the ILO21. African Economic Outlook, 2013. Who are the working youth in Africa?22. United Nations, 2013. Opportunities and constraints to youth
entrepreneurship
23. World Bank, 2008. Children and the youth, Volume II, Number 6 June 200824. Xavier, S. R., Kelley, D., Kew, J., Herrington, M., & Vorderwulbecke, A. (2012).
Global Entrepreneurship Monitor 2012 Global Report. London: Global Entrepreneurship Research Association
25. The start-up generation, 2013, The Prince’s Trust and Royal Bank of Scotland Group
1.3 Why youthentrepreneurship matters
1.4 Factors inhibiting youth entrepreneurship

Page 13
primary barrier to entrepreneurship. Other barriers included financial risk, corruption, lack of skills and administrative hurdles. Less prevalent barriers included the stigma of failure, market demand and competition. Gender discrimination was highlighted by 67 percent of female respondents26. Barriers to youth employment identified in high-income or middle-income countries include are lack of an enterprise culture in many countries; unfavourable legal, policy and regulatory frameworks for youth entrepreneurship; the lack of entrepreneurship education across formal and informal educational systems; the lack of access to affordable financing in the form of start-up, investment or working capital, and; little knowledge about and access to relevant business development services and support schemes for youth already in business or for those or interested in pursuing an entrepreneurial career27. The youth in sub-Saharan Africa perceive lack of capital, lack of skill, lack of support and lack of market opportunities as the main obstacles to entrepreneurial intention28. Other barriers identified in sub-Saharan Africa include the lack of links to professional networks, corruption, lack of property rights and the over-regulated information and communications technology sector29. Young entrepreneurs often over-report the lack of finance as a key constraint and underestimate other factors such as personal business skills and training. Although research has shown that the access to and provision of finance is a constraint within the youth sector, other constraints such as lack of infrastructure, crime, lack of market opportunities and the lack of adequate management and financial training may need to be addressed by the young business owner before the provision of and access to capital can be seen as the key constraining factor.
This Youth GEM report is a joint venture between YBI and GEM and includes case studies contributed by Accenture30. YBI is the only dedicated global youth entrepreneurship network. YBI is committed to maximising impact through evidence-based practice, and is taking a leadership role in research to help address sector knowledge gaps.
GEM provides a comprehensive view of entrepreneurship across the globe by measuring the attitudes of a population, and the activities and characteristics of individuals involved in various phases and types of entrepreneurial activity.
YBI initiated this joint venture to enable the first GEM study on youth entrepreneurship specifically, with the goal of increasing understanding of what constrains, motivates and assists young entrepreneurs in the entrepreneurial process and how countries can best catalyse the role that youth entrepreneurship can play in economic and social development.
The entrepreneurial process, referred to in the GEM study, allows countries to develop an understanding of the process that individuals would travel through prior to owning/managing an established business. This report analyses data collected by GEM National Teams through the standard annual surveys, specifically disaggregated by age, as well as the results of an additional survey with youth-focused questions on the topics of trading, financing, influences and motivations, in which number of countries participated, primarily from Latin America and the Caribbean, Middle East and North Africa, sub-Saharan Africa and Asia Pacific & South Asia.
26. 2011, Youth Entrepreneurship in Kashmir, Challenges and Opportunities, Mercy Corps
27. 2010, How to build an enabling environment for youth entrepreneurship and sustainable enterprises, ILO
28. Fatoki, O, 2011, An Investigation into the Obstacles to Youth Entrepreneurship in South Africa
29. United Nations, 2013. Opportunities and constraints to youth entrepreneurship30. See Appendix for details on all three organisations
1.5 About this report: Youth Business International (YBI), the Global Entrepreneurship Monitor (GEM)and Accenture

Page 14
YBI is a strategic partner of Accenture’s Skills to Succeed corporate citizenship focus. Through this partnership, Accenture contributes both funding and the time and skills of its employees, and, for this report, Accenture collaborated with YBI to develop practitioner-based case studies that build on the report’s key themes and data. Developed following a series of interviews with YBI member entrepreneurs and CEOs, the case studies focus on three core themes: Enabling Youth Entrepreneurship; Influencing Youth Entrepreneurship and Youth Entrepreneurship and Innovation.
Accenture would like to express great appreciation for the time and insight of the following YBI member organisation entrepreneurs and CEOs, who were involved in this process:
• Gabriel Fernando Álvarez Miguel, Entrepreneur – Fundación Impulsar, Argentina
• Armen Bakirtzian, Entrepreneur – Canadian Youth Business Foundation, Canada
• Julia Deans, CEO – Canadian Youth Business Foundation, Canada
• Huaping Yang, Entrepreneur – Youth Business China, China
• Jeremy Coridun, Entrepreneur – Entreprendre en Banlieue, France
• Stephen Nzusa Mwema, Entrepreneur – Kenya Youth Business Trust, Kenya
• Adetola Ayotunde Adebowale, Entrepreneur – FATE Foundation, Nigeria
• Dahiana Rocío Rojas Cáceres, Entrepreneur – Emprendimientos Juveniles, Paraguay
• Danil Kruglikov, Entrepreneur – Youth Business Russia, Russia
• Boris Tkachenko, CEO – Youth Business Russia, Russia
• Eric Mazataud, Entrepreneur – Youth Business Spain, Spain
• Deborah Stewart, Entrepreneur – Youth Business Trinidad and Tobago, Trinidad & Tobago
• Amira Khammassi, Entrepreneur – Enda Inter Arabe, Tunisia
• Emma Reilly, Entrepreneur – The Prince’s Trust, UK
More details about each of the organisations and the research methodologies are presented in Appendix 1.

Page 15
This Youth GEM report analyses the youth from a geographic regional level and mentions the impact of the economic development level. A key focus of the report is to develop an understanding of how the youth, as a segment of the population, differs from the adult section of the population. Where relevant, the youth may be segmented further into the young youth (18 – 24 years) and the older youth (25 – 34 years).
The report will initially focus on all the regions indicated in Table 2.1. This analysis, provided in sections 2.1, relies on data collected in the APS31 by selected National teams participating in the Global Entrepreneurship Monitor.
Chapter 2
31. The Adult Population Survey is explained in the Appendix to this study
The youth refers to young people between the ages of 18 – 34 years.
Adults refers to people between the agesof 35 - 64 years.
Factor-Driven EconomiesEfficiency-Driven
EconomiesInnovation–Driven
Economies
Latin America & Caribbean
Argentina, Barbados, Brazil, Chile, Colombia, Costa Rica,
Ecuador, El Salvador, Mexico, Panama, Peru, Trinidad &
Tobago, Uruguay
Middle East and North America
Algeria, Egypt, Iran, Palestine
Tunisia Israel
Sub-Saharan AfricaAngola, Botswana, Ethiopia,
Ghana, Malawi, Nigeria, Uganda, Zambia
Namibia, South Africa
Asia Pacific andSouth Asia
Pakistan China, Malaysia, ThailandJapan, Republic of Korea,
Singapore, Taiwan
European UnionEstonia, Hungary, Latvia,
Lithuania, Poland, Romania
Austria, Belgium, Denmark, Finland, France, Germany,
Greece, Ireland, Italy, Netherlands, Portugal,
Slovakia, Slovenia, Spain, Sweden, United Kingdom
Non-European UnionBosnia and Herzegovina,
Croatia, Macedonia, Russia, Turkey
USA
Table 2.1
GEM countries classified by economic development level and regionSource: GEM Global 2012

Page 16
Table 2.1 shows the participating economies by geographic region and economic development level. Latin America and the Caribbean, as a region, comprise efficiency-driven economies. The Middle East/North Africa (MENA) contains predominantly factor-driven economies with the only exceptions of Tunisia, an efficiency-driven economy and Israel, an innovation-driven economy. Sub-Saharan Africa also has mostly factor-driven economies with the only exceptions being Namibia and South Africa, both efficiency-driven economies.
The Asia Pacific and South Asia region includes a combination of all three levels of economic development levels: Pakistan in the factor-driven group, China, Malaysia and Thailand in the efficiency-driven group, and Japan, Republic of Korea, Singapore, and Taiwan in the innovation-driven group. The European Union (EU) is predominantly innovation-driven with only six of the 22 countries in this region being classified as efficiency-driven economies. The non-European Union (non-EU) is largely efficiency-driven, with the exception of Switzerland and Norway, both innovation-driven economies.
The 2012 GEM study offered countries the option to participate in an additional youth-focused special topic. Table 2.4 provides a list of the countries that participated in the special topic. Section 2.2 will provide additional information on youth-related issues provided by the data collected as part of the special topic in 2012.
2.1.1 Attitudes, Activity and Aspirations “The entrepreneurship process is a complex endeavor carried out by people living in specific cultural and social conditions. For this reason, the positive or negative perceptions that society has about entrepreneurship can strongly influence the motivations of people to enter entrepreneurship. Societies benefit from people who are able to
recognise valuable business opportunities and who perceive they have the required skills to exploit them. If the economy in general has a positive attitude towards entrepreneurship, this can generate cultural and social support, financial and business assistance, and networking benefits that will encourage and facilitate potential and existing entrepreneurs32.”
2.1.1.1 Entrepreneurial Pipeline
The entrepreneurial pipeline begins with potential entrepreneurs. In this stage individuals have not embarked on any specific actions to start an enterprise, even though they believe they have the capacity and believe that there are plenty of opportunities to start a business; for this reason they are called potential entrepreneurs. The second stage in the pipeline is intention, individuals have to intend to exploit these opportunities and express an intention to start a business. The following stage is represented by nascent entrepreneurs and new entrepreneurs. The Total Entrepreneurial Activity (TEA) Index, which shows the percentage of population aged 18-64 involved in entrepreneurship, is determined by combining the nascent and new entrepreneurial rates33.
32. 2012 GEM Global Report 33. Since GEM asks whether individuals intend to pursue a business opportunity
in 3 years’ time, it would be appropriate use the entrepreneurial intentions rate for 2009. This figure could then be compared to the TEA for each country
in 2012 to provide an indication as to how many intentional entrepreneurs actually started a business in 3-years time, however, due to practical constraints Figures 2.3 and 2.4 represents the intentional entrepreneurs, nascent, new and established businesses for 2012.
Potential entrepreneurs are individuals whobelieve that they have adequate entrepreneurialskills and who perceive business opportunities.
New entrepreneurs are individuals that are owners/managers of an active business that has been in existence from 3 – 42 months.
2.1 A Global View Nascent entrepreneurs are individuals who are actively involved in setting up a business or who already own a business but whose business has not paid any wages or salaries for 0 - 3 months.

Page 17
Age
Perc
enta
ge t
hat
see
a go
od o
ppor
tuni
ty t
o st
art
a bu
sine
ss
Figure 2.1: Sees good opportunities for starting a business in the next 6 months by region over age with covariates
0.0010 20 30 40 50 60 70
20.00
40.00
60.00
10.00
30.00
50.00
70.00Middle East and North Africa
Sub-Saharan Africa
Asia Pacific and South Asia
European Union
Non-European Union
USA
Latin Americaand the Caribbean
Individuals who own and manage an established business that has been in operation for more than 42 months are referred to as established business owners.
Potential entrepreneurs
The percentage of youth and adults that would be classified as potential entrepreneurs does not vary by age, i.e. the percentage of the youth and adults indicating that they have adequate entrepreneurial skills and who perceive business opportunities per region are almost identical. There are, however, clear regional differences (Figures 2.3 and 2.4) with sub-Saharan Africa having significantly more potential entrepreneurs (60%) than any other region i.e. 60 percent of young people between the age of 18 – 34 believe that they are able to perceive opportunities in their country and are confident in their ability to create and manage a new business.
GEM reports have shown that on average, individuals in factor-driven economies have higher perceptions that there are good opportunities for entrepreneurship, and that they have the capabilities to start businesses. These attitude measures tend to decline with greater economic development levels. GEM argues that while this seems counter-intuitive, individuals in economies at different stages of economic development are likely to have different
kinds of businesses in mind. GEM 2010 indicates that the perception of what is considered an opportunity and the capabilities required to create and manage this entrepreneurial opportunity in developing countries such as in sub-Saharan Africa would differ substantially from the perceptions in countries in the European Union.
Figures 2.1 and 2.2 indicate the relationship between age and the belief that the individual sees good opportunities for starting a business in the next 6 months as well as the belief that they have the required knowledge/skills to start a business.
34. Covariates are control variables that are observed rather than manipulated but can affect the outcome of a study
35. The inclusion of covariates allows for the improved estimates of the trend
against age to be obtained. The national-level covariates include GDP per capita, population, labour force participation rate, and social protection spending as a share of GDP
GEM has found that individuals who are confident that they possess the skills to start a business are four to six times more likely to be involved in entrepreneurial activity.
Figure 2.1
Percentage who see good opportunities for starting a business in the next 6 months by region over age with covariates
Page 18
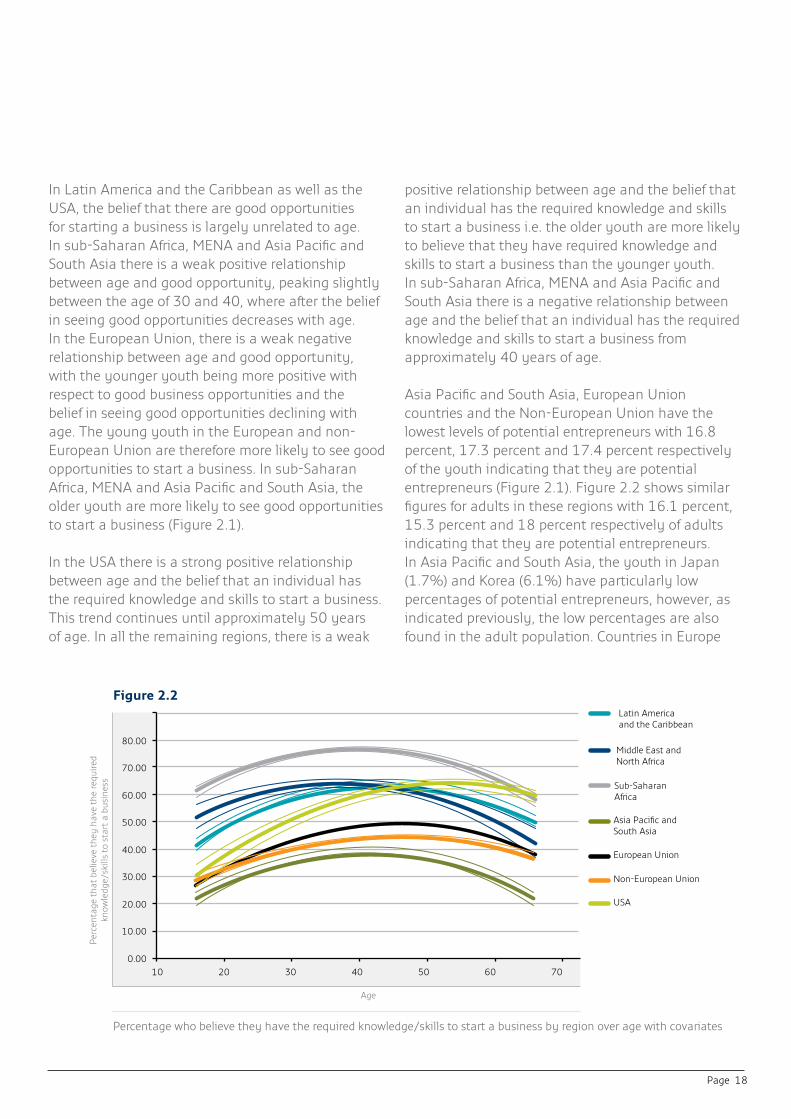
In Latin America and the Caribbean as well as the USA, the belief that there are good opportunities for starting a business is largely unrelated to age. In sub-Saharan Africa, MENA and Asia Pacific and South Asia there is a weak positive relationship between age and good opportunity, peaking slightly between the age of 30 and 40, where after the belief in seeing good opportunities decreases with age. In the European Union, there is a weak negative relationship between age and good opportunity, with the younger youth being more positive with respect to good business opportunities and the belief in seeing good opportunities declining with age. The young youth in the European and non-European Union are therefore more likely to see good opportunities to start a business. In sub-Saharan Africa, MENA and Asia Pacific and South Asia, the older youth are more likely to see good opportunities to start a business (Figure 2.1).
In the USA there is a strong positive relationship between age and the belief that an individual has the required knowledge and skills to start a business. This trend continues until approximately 50 years of age. In all the remaining regions, there is a weak
positive relationship between age and the belief that an individual has the required knowledge and skills to start a business i.e. the older youth are more likely to believe that they have required knowledge and skills to start a business than the younger youth. In sub-Saharan Africa, MENA and Asia Pacific and South Asia there is a negative relationship between age and the belief that an individual has the required knowledge and skills to start a business from approximately 40 years of age.
Asia Pacific and South Asia, European Union countries and the Non-European Union have the lowest levels of potential entrepreneurs with 16.8 percent, 17.3 percent and 17.4 percent respectively of the youth indicating that they are potential entrepreneurs (Figure 2.1). Figure 2.2 shows similar figures for adults in these regions with 16.1 percent, 15.3 percent and 18 percent respectively of adults indicating that they are potential entrepreneurs. In Asia Pacific and South Asia, the youth in Japan (1.7%) and Korea (6.1%) have particularly low percentages of potential entrepreneurs, however, as indicated previously, the low percentages are also found in the adult population. Countries in Europe
Figure 2.2
Percentage who believe they have the required knowledge/skills to start a business by region over age with covariates
Age
Perc
enta
ge t
hat
belie
ve t
hey
have
the
requ
ired
know
ledg
e/sk
ills
to s
tart
a b
usin
ess
Figure 2.2: Has the required knowledge/skills to start a business by region over age with covariates
0.0010 20 30 40 50 60 70
20.00
40.00
60.00
80.00
10.00
30.00
50.00
70.00
Middle East and North Africa
Sub-Saharan Africa
Asia Pacific and South Asia
European Union
Non-European Union
USA
Latin Americaand the Caribbean

Page 19
with particularly low percentages of potential youth entrepreneurs include Hungary (6.6%), Italy (9.2%), Spain (9.3%), Greece (9.4%) and Portugal (12.1%). The percentage of potential adult entrepreneurs in Japan (1.7%), Korea (7.0%), Hungary (4.0%), Spain (8%), Greece (7.4%), Italy (7.7%) and Portugal (9.2%) were also extremely low, all below 10%.
The perceptions of good business opportunities amongst the youth are particularly low in the countries that have been badly impacted by the global economic crisis, i.e. in Hungary (12.6%), Greece (15%), Spain (16.0%) and Portugal (19.4%). By the second quarter of 2012, the youth unemployment in Greece and Spain accounted for more than half of the economically active youth population, the highest youth unemployment rates in Europe. The youth unemployment rate in Portugal (3rd highest), Italy (4th highest) and Hungary (7th higher) were all also above the 2008 unemployment rates36. The low rate of youth potential entrepreneurs in these countries is driven predominantly by the low perception of opportunities. The belief in having the knowledge and skills necessary to start a business in these countries, Hungary (37.7%), Greece (47.0%), Spain (48.0%) and
Portugal (44.5%) are above or just below the average (40%) for the European Region. Given the continued negative impact of the financial crisis in southern Europe, the austerity measures required of these countries, the high youth unemployment rates and the continued debate regarding bail-out terms in this region, the low and declining opportunity perceptions in the region is unsurprising37.
36. ILO, Global Employment Trends for Youth, 201337. 2012, GEM Global Report
Figure 2.3
Entrepreneurial pipeline for 18 – 34 year olds by region
Entrepreneurial pipeline
Perc
enta
ge o
f ind
ivid
uals
at
each
sta
ge o
f pip
elin
e
Figure 2.3: Entrepreneurial pipeline for 18 – 34 year olds by region
0.0%Potential Intention Nascent New Established
20.0%
40.0%
60.0%
10.0%
30.0%
50.0%
Latin America and Carribean
Sub-Saharan Africa
European Union
USA
Middle East and North Africa
Asia Pacific and South Asia
Non-European Union
The Total Entrepreneurial Activity (TEA) rate is the percentage of individuals in an economy that are in the process of starting or are already running new businesses.
Perceptions of good opportunities and having the required skills and knowledge are often the beginnings of an entrepreneurial process for an individual (2008 GEM Global Report).

Page 20
Case study 1
Enabling Youth Entrepreneurship
In identifying some of the most common barriers facing young entrepreneurs, the Report uncovered ways to help ensure their success.
Many young entrepreneurs face challenges that prevent them from succeeding in their endeavors. In fact, being young is sometimes a disadvantage all its own: preconceived notions that young entrepreneurs are inexperienced and ineffective can often overshadow the passion that is so critical to their success. At the same time, however, they face other significant barriers, including limited access to financing and capital, underdeveloped or insufficient skills and lack of mentoring support.
Increase access to capital
Access to financing and capital is, without question, a critical enabler for young entrepreneurs. Many young entrepreneurs said funding is a key barrier that would prevent them from starting a business, particularly since they are less likely to have a strong credit history. Most tap into personal savings, in addition to obtaining money from family and friends, to finance their early operations. Often, this limits initial business offerings, at least until more substantial capital can support a broader range of products or services.
While some interviewees said they were able to achieve a modest start with their own savings and help from loved ones, outside funding was crucial when it came to growing and sustaining their businesses.
Deborah Stewart, who runs Pepe Events Ltd, an events management business company in Trinidad and Tobago, found that, due to her age, many customers were unwilling to give her a chance. “When they saw how young I was, they would change their minds or postpone making a decision.”
According to Eric Mazataud, a young entrepreneur in Spain, “I already knew exactly what I wanted to do. Capital was more about allowing me to achieve scale.”
Gabriel Álvarez Miguel founded AVI Music in Mendoza, western Argentina, with the backing of YBI member Fundación Impulsar.

Page 21
However, this proved challenging in many cases: in order to be eligible for funding from NGOs or loans from banks, young entrepreneurs had to prove they had a viable business model and demonstrate that they had other sources of funding and capital. Also in many countries, access to finance only comes through more structured programmes offered by many NGOs.
Encourage mentorship
While gaining access to capital is a fundamental first step for young entrepreneurs looking to start and expand their businesses, for many, mentorship is just as critical to their success. Interviews showed that a significant number of young entrepreneurs felt isolated and found it difficult to run their businesses with no outside support or advice from a mentor.
YBI Member CEOs who work with young entrepreneurs stress that any programmes providing financing should also supply crucial non-financial support in the form of training and mentoring initiatives, whichprovide young entrepreneurs the opportunity to develop valuable business skills. They also place great importance on finding
mentors who can provide the right kind of support for each young entrepreneur. They have found that mentors should be carefully matched, based on the entrepreneur’s needs, and should be prepared to work with the young entrepreneurs for several years, supporting them when they face difficult decisions or just feel stuck.
Foster critical business skills
Last but certainly not least on the list of enablers is the development of critical business skills. The Report revealed that many young entrepreneurs said they felt they lacked business – rather than technical – skills. While young people often learn technical skills from their parents and have some of the necessary IT skills by the time they finish school, managerial and business skills are key to their success. Yet, many young entrepreneurs are so focused on the start-up of their businesses that they neglect to learn the fundamental components of running them. This can lead to complications related to funding and other key business needs.
Stephen Nzusa Mwema, who runs a computer services business in Kenya, said finding funding was particularly hard before he found a structured programme via a NGO. “I approached banks but I did not have enough money in my account for them to lend to me and my parents didn’t have enough to lend either. After talking to a friend, I heard of the Kenyan Youth Business Trust. I went to their office, signed up for a training programme and in one month had access to funding.”
Gabriel Fernando Álvarez Miguel is the CEO of Avimusic, which provides high quality promotional materials, music videos and recording facilities to local artists in Argentina. The mentoring support Gabriel received from the YBI member organisation that funded his business proved mission critical: “I have a really great friendship with my former mentor – we’re always in contact. I started off with no knowledge of ‘the system’ and as a lawyer, he was able to provide all of this from a legal point of view.”
Deborah Stewart said she felt inexperienced when establishing her business. Without a mentor to consult for advice, she did not know she needed to keep proper financial records, and she was unable to demonstrate transactions and cash flow for her business, “I basically lost two years in the history of my business due to my lack of financial experience.”
Julia Deans, CEO of the Canadian Youth Business Foundation, said, “Creating a business plan and managing cash flow are the main challenges that young entrepreneurs face when starting and running a business.”

Page 22
Entrepreneurial intentions
The youth in all regions were more positive in comparison to adults in indicating an intention to start a business in the next 3 years (Figures 2.3 and 2.4). This trend is most noticeable in the European Union and the non-European Union where the youth are on average 2.2 times and 2 times more likely than adults to indicate an intention to start a business. The youth in Estonia (3x), Lithuania (3.5x), Poland (3.6x), Slovenia (3.4x) and Russia (3x) are more than three times as likely to indicate an intention to start a business as adults.
The increase in unemployment levels in Europe may be impacting on the youth, as the realisation that a career in the formal sector or government is no longer as guaranteed a career path, as it may have seemed prior to the financial crisis of 2008. The intention
to start a business is highest in sub-Saharan Africa, and 2012 Global GEM report confirmed that the results by economic development level show that entrepreneurial intentions are highest in factor-driven economies (48%), decreasing significantly in the efficiency-driven stage (26%) and again in the innovation–driven (11%) group38.
38. 2012, GEM Global Report
Figure 2.4
Entrepreneurial pipeline for 35 - 64 year olds by region
Individuals who intend to pursue a business opportunity within the next 3 years are defined by GEM as those with entrepreneurial intentions.
The TEA rate includes both nascent andnew entrepreneurs.
Entrepreneurial pipeline
Perc
enta
ge o
f ind
ivid
uals
at
each
sta
ge o
f pip
elin
e
Figure 2.4: Entrepreneurial pipeline for 35 - 64 year olds by region
0.0%Potential Intention Nascent New Established
20.0%
40.0%
60.0%
10.0%
30.0%
50.0%
Latin America and Carribean
Sub-Saharan Africa
European Union
USA
Middle East and North Africa
Asia Pacific and South Asia
Non-European Union

Page 23
Nascent, new businesses (TEA rate) andestablished businesses
The percentage of young people involved in nascent businesses is higher than adults in all regions other than the USA. The difference between youth and adult nascent businesses is highest in the European Union and the non-European Union where the youth is 1.4 times more likely to be involved in a nascent business than adults. The youth in Latin America and the Caribbean, Sub-Saharan Africa and the USA are equally likely as adults to be involved in new businesses. The ratio of the youth to adults involved in new businesses in Asia Pacific and South Asia and the non-European Union is 1.1:1. The MENA region has the highest differential with the youth being 1.3 times more likely than adults to be involved in new businesses.
Sub-Saharan Africa has the highest TEA rates for both the youth and adult grouping (Figure 2.5), with youth TEA rates slightly higher than the adult TEA rates. Sub-Saharan Africa and Asia Pacific and South Asia, both show almost equal rates of nascent and new businesses across both age groupings (Figure 2.5). The youth in the USA are 2 times and adults 2.3 times more likely to be involved in a nascent business than a new business (Figure 2.5). The trend of having
Nascent and new business rates by age and region
Age, split into youth and adults by region
Perc
enta
ge n
asce
nt a
nd n
ew b
usin
esse
s
EuropeanUnion
18-34 35-64
Figure 2.5: Nascent and new business rates by age and region
0.00%
5.00%
10.00%
15.00%
20.00%
25.00%
30.00%
35.00%
New Nascent
Latin America and Carribean
18-34 35-64
Middle Eastand North Africa
18-34 35-64
Sub-Saharan Africa
18-34 35-64
Asia Pacificand South Asia
18-34 35-64
Non-EuropeanUnion
18-34 35-64
USA
18-34 35-64
Figure 2.5
TEA rates are highest for the factor-driven economies, and decline with greater development levels (2010 GEM Global Report).
Page 24
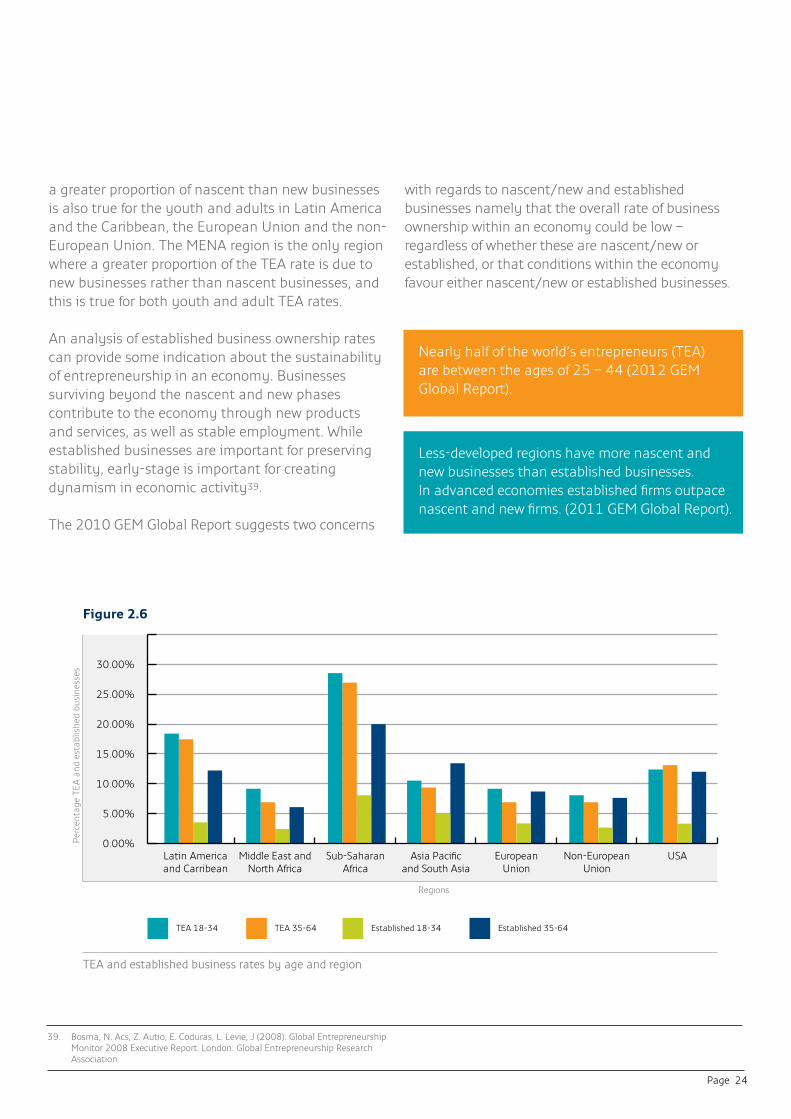
a greater proportion of nascent than new businesses is also true for the youth and adults in Latin America and the Caribbean, the European Union and the non-European Union. The MENA region is the only region where a greater proportion of the TEA rate is due to new businesses rather than nascent businesses, and this is true for both youth and adult TEA rates.
An analysis of established business ownership rates can provide some indication about the sustainability of entrepreneurship in an economy. Businesses surviving beyond the nascent and new phases contribute to the economy through new products and services, as well as stable employment. While established businesses are important for preserving stability, early-stage is important for creating dynamism in economic activity39.
The 2010 GEM Global Report suggests two concerns
with regards to nascent/new and established businesses namely that the overall rate of business ownership within an economy could be low – regardless of whether these are nascent/new or established, or that conditions within the economy favour either nascent/new or established businesses.
39. Bosma, N. Acs, Z. Autio, E. Coduras, L. Levie, J (2008). Global Entrepreneurship Monitor 2008 Executive Report. London: Global Entrepreneurship Research Association
Figure 2.6
TEA and established business rates by age and region
Nearly half of the world’s entrepreneurs (TEA)are between the ages of 25 – 44 (2012 GEM Global Report).
Less-developed regions have more nascent and new businesses than established businesses. In advanced economies established firms outpace nascent and new firms. (2011 GEM Global Report).
Regions
Perc
enta
ge T
EA a
nd e
stab
lishe
d bu
sine
sses
EuropeanUnion
Figure 2.6: TEA and established business rates by age and region
0.00%
5.00%
10.00%
15.00%
20.00%
25.00%
30.00%
TEA 18-34 TEA 35-64 Established 18-34 Established 35-64
Latin America and Carribean
Middle East and North Africa
Sub-Saharan Africa
Asia Pacificand South Asia
Non-EuropeanUnion
USA

Page 25
The report argues that advances in economic development require business activities exhibiting both dynamism and stability, i.e. both nascent/new and established businesses. Dynamism ensures a continual renewal of ideas and value in a society, while stability allows those with the most promise to survive and grow.
Figure 2.6 shows that the youth in all regions are significantly more likely to be involved in nascent/new business than established businesses. The difference is particularly high in Latin America and the Caribbean (4.6x), sub-Saharan Africa (3.7x) and the USA (3.6x). In Asia Pacific and South Asia, the European Union and non-European Union, adult entrepreneurs are over 2.5 times more likely to be an established business than either a nascent/new business. Sub-Saharan Africa has the highest established business rate for the youth (7.9%). This average (7.9%) is distorted by the extremely high reported rate for youth owned established businesses in Ghana (20.5%), and Uganda (22.4%) and therefore disguises the extremely low rate of
youth-owned established business in much of the region. Four of the ten sub-Saharan Africa countries have a youth established business rate of below 3%, namely Botswana (2.4%), Zambia (1.5%), Namibia (1.3%) and South Africa (1.1%).
Figure 2.7 confirms that there is a positive relationship between TEA and age until approximately the age of 35 years (in Latin America and the Caribbean, sub-Saharan Africa, the EU and the non-European Union) and 40 years of age (in MENA, Asia Pacific and South Asia and the USA), thereafter there is a negative relationship between age and TEA. In other words individuals are more likely to be involved in nascent or new businesses as they increase in age, however from the age of 35 – 40 years, individuals are less likely to be involved in nascent and new businesses. The relationship between age and TEA in sub-Saharan Africa and to a lesser degree in Latin America and the Caribbean and the USA is strong. The relationship between TEA and age is weaker in the other regions.
Figure 2.7
TEA, by region over age, country with covariates
Perc
enta
ge T
EA
Figure 2.7, TEA, by region over age, country with covariates
0.0010 20 30 40 50 60 70
10.00
20.00
30.00
40.00
5.00
15.00
25.00
35.00
Age
Middle East and North Africa
Sub-Saharan Africa
Asia Pacific and South Asia
European Union
Non-European Union
USA
Latin Americaand the Caribbean

Page 26
Case study 2
Influencing Youth Entrepreneurship
While young entrepreneurs cited a number of reasons for starting a business, the common motivator among almost all of them was a great business idea and the right opportunity in the market.
Young entrepreneurs start businesses for a wide range of reasons. Many strive for the independence that comes from working for themselves, while, for others, the current economic climate and a shortage of job opportunities motivate them to establish their own businesses, rather than face unemployment. According to the interviews, however, the most common driver among young entrepreneurs is having a great business idea that addresses a perceived gap in the market.
The desire for independence
Because young business leaders are natural self-starters, many guard their independence passionately. In fact, when asked about key measures of success for their businesses, several individuals said the opportunity to choose what to do – and how to do it – was extremely important. Some YBI Member CEOs agree: the desire for independence
is just as important as motivators such as earning an income where unemployment levels are high. But as a result, some entrepreneurs refrain from utilising outside sources of funding, for fear those sources will also bring a measure of outside interference.
Boris Tkachenko, Youth Business Russia, Programme Director, says “The motivation for many of the young entrepreneurs we work with is much more about being independent than difficulty in finding a job.”
Jeremy Coridun is the CEO of Jn Art, a business he runs in France with two other entrepreneurs. The three started Jn Art with their own personal savings, which meant they had total control over the business, rather than having to be accountable to investors or financiers.
Danil Kruglikov is a Russian entrepreneur whose business produces souvenirs and designs made of stone. He had some experience working with stone, and he used that experience to set up his business. According to Danil, he measures his business success as much by the independence it affords him as by standard criteria like profits, expansion or product development.
Huaping Yang, from Chengdu, China, was able to set up an after-school teaching business with the support of Youth Business China, a member of Youth Business International.
Page 27
Family influences
While the desire to “go it alone” drives many people to establish start-ups, there is no question that most of these individuals are also heavily influenced by their families. More than half of the young people surveyed for the Report said parents, siblings and other family members had some influence on their decision to start a business. In some interviews, young entrepreneurs confirmed that they had chosen to start a business because of a family member’s suggestion or because they already had family in that line of business. However, while family is an undeniably important influence, perceived gaps in the market are an even stronger driver – and when these two influences come together, the results can be quite powerful.
Believing in yourself and your business
Young entrepreneurs also reported having a strong belief in themselves and their products. In fact, many said their skills and vision were essential when deciding what type of businesses to establish. Like people in any profession, young entrepreneurs want recognition for their skills and achievements, but many face cultural challenges and have to persuade their support networks that entrepreneurship is just as valuable as traditional careers like medicine or law.
Armen Bakirtzian is a young business owner based in Ontario who, with his father, identified a gap in the market for medical devices for orthopedic surgery and joint replacement that larger companies seemed reluctant to fill. As an engineer, Armen was always trying to improve how things work, and because his father was an orthopedic surgeon, joint replacements seemed like a perfect fit. Armen’s business idea ultimately earned him funding from the Canadian government’s Next Top Young Entrepreneur programme in 2010, which led to further funding for his business.
Dahiana Rocío Rojas Cáceres runs a lingerie business in Paraguay. Because her mother already ran her own lingerie workshop, Dahiana had access to the necessary machinery and tools and was able to develop the technical know-how to run the business herself. Daiana said, “At the time my mother was purely producing for one client. I encouraged her to diversify her client base and grow her business. I quickly realised that I could capitalise on the infrastructure already available within the family and use the skills my mother helped me build to start my own business and make my own income.”
Another young entrepreneur, Adetola Ayotunde Adebowale, runs a clothing business based in Lagos, Nigeria, called Wapa Apparel. Growing up, Adetola’s friends whose fathers were carpenters, electricians and plumbers were more independent because they had acquired skills from their fathers. “That level of independence triggered something within me – without even going to school, these boys were going to be able to fend for themselves.”
When Adetola told his mother he was going to start a business, she was initially against it, saying it was a waste of his education. “There is a bad culture in Nigeria with regard to entrepreneurism – everyone believes you should become a doctor, lawyer or engineer, rather than start your own business.” Over time, however, Adetola’s family became more supportive. Adetola now employs 15 full time staff and 15 part time/flexible staff, whom he brings in when demand is high.

Page 28
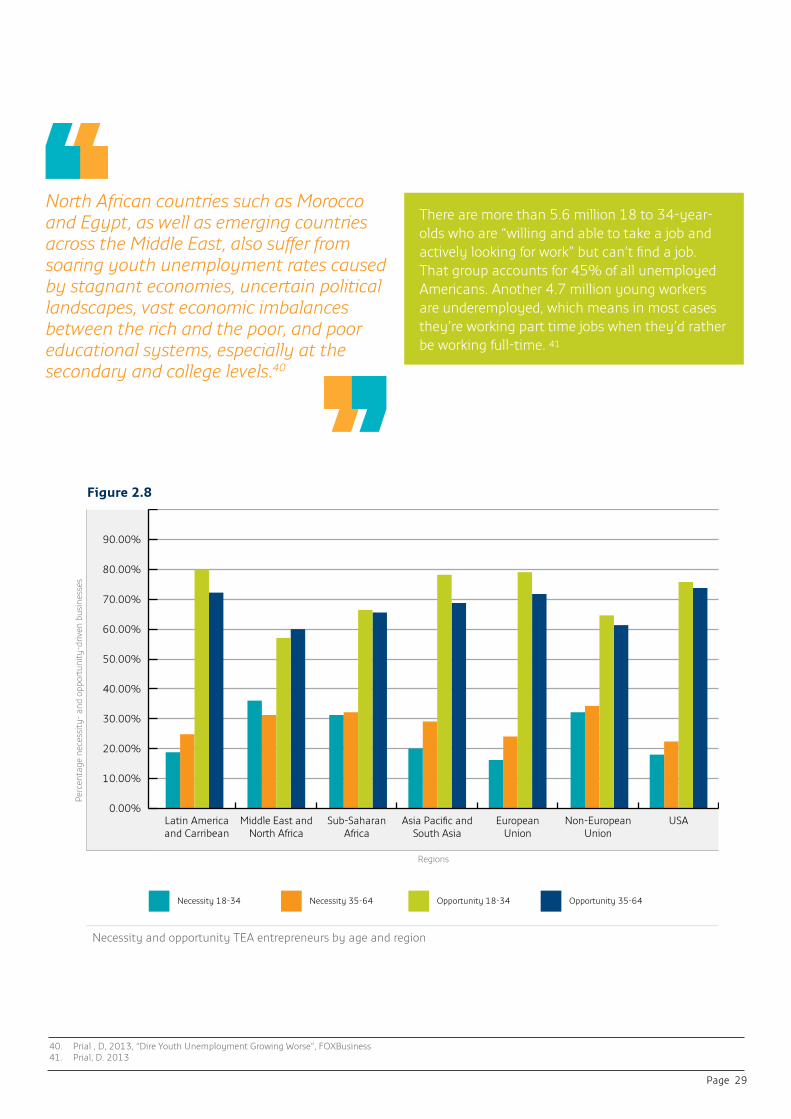
Necessity and opportunity entrepreneurs
Research has shown that entrepreneurs may have different motivations for starting a business: in essence, they may be pushed or pulled into entrepreneurship. Twenty percent or less of the youth involved in nascent/new businesses in Latin America and Caribbean (19%), Asia Pacific & South Asia (20%), the European Union (18%) and the USA (18%) believe that they started their business because they had no other option (Figure 2.8). The youth, on average, in these regions are also less likely than adults to believe that they started their business because they had no other option. Youth entrepreneurs in the EU were an average of 4.6 times more likely to be an opportunity-driven opportunity entrepreneur than a necessity-driven entrepreneur. Adults in the EU are on average 3.1 times more likely to be an opportunity-driven opportunity entrepreneur than a necessity-driven entrepreneur. The youth in Latin America and the Caribbean and the USA were 4.2 times more likely and adult 2.9 times and 3.2 times respectively more likely to be an opportunity-driven business.
While being pulled into entrepreneurship by the prospect of an opportunity is the primary motivator in all geographic regions, approximately a third of youth owned nascent or new businesses in the MENA region (35%), Sub-Saharan Africa (32%) and the non-European Union (32%) are necessity-driven. Approximately a third of adult nascent or new businesses in these regions (Figure 2.8) are also necessity- driven.
These findings are consistent with the general GEM findings which have shown that while the factor-driven economies have the highest TEA rates, they also have the highest proportion of necessity-driven entrepreneurs. Innovation-driven countries, on average, have the highest proportion of opportunity-driven entrepreneurs (2010 GEM Global Report).
The level of economic development seems to have a greater impact than age, on the proportion of necessity- and opportunity-driven businesses.
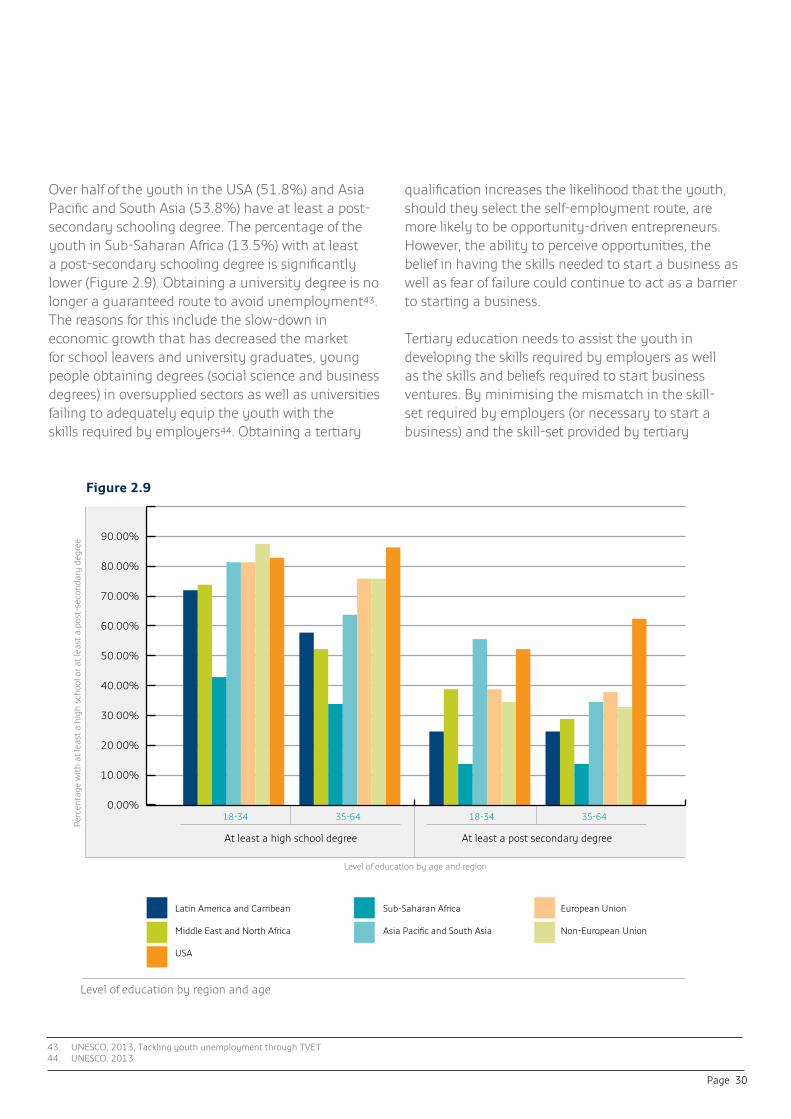
Education
In all regions, other than sub-Saharan Africa, over 70 percent of the youth indicated that they have at least a high school degree. In contrast, less than half (45%) of the youth in sub-Saharan Africa have at least completed high school. As nearly 35 percent of Africa’s youth lack the basic skills required to perform a job42, these young people are also not likely have the necessary skills to successfully start and manage a business.
Figure 2.9 indicates that all regions, excluding the USA, show that the youth are more likely than adults to have obtained a high school degree. The increase in the percentage of the youth (in comparison to adults) that are completing secondary schooling is a positive occurrence as both self-employment and employment opportunities are more likely to be accessible to individuals with a decent level of education.
42. UNESCO, 2012, Global Education for All Meeting, November 20-23, 2012
Necessity-driven entrepreneurs are pushed into starting a business because they have no other work options and need a source of income.
Opportunity–driven entrepreneursare pulled into entrepreneurship by the prospectof opportunity.
GEM has shown that opportunity-driven businesses have a greater impact on employment than necessity-driven businesses.
Page 29
40. Prial , D, 2013, “Dire Youth Unemployment Growing Worse”, FOXBusiness41. Prial, D. 2013
Necessity and opportunity TEA entrepreneurs by age and region
There are more than 5.6 million 18 to 34-year-olds who are “willing and able to take a job and actively looking for work” but can’t find a job. That group accounts for 45% of all unemployed Americans. Another 4.7 million young workers are underemployed, which means in most cases they’re working part time jobs when they’d rather be working full-time. 41
EuropeanUnion
Figure 2.8: Necessity and opportunity TEA entrepreneurs by age and region
0.00%
10.00%
20.00%
30.00%
40.00%
50.00%
60.00%
70.00%
80.00%
90.00%
Necessity 18-34 Necessity 35-64 Opportunity 18-34 Opportunity 35-64
Latin America and Carribean
Middle East and North Africa
Sub-Saharan Africa
Asia Pacific and South Asia
Non-EuropeanUnion
USA
Regions
Perc
enta
ge n
eces
sity
- an
d op
port
unity
-driv
en b
usin
esse
s
Figure 2.8
North African countries such as Morocco and Egypt, as well as emerging countries across the Middle East, also suffer from soaring youth unemployment rates caused by stagnant economies, uncertain political landscapes, vast economic imbalances between the rich and the poor, and poor educational systems, especially at the secondary and college levels.40
Page 30
Over half of the youth in the USA (51.8%) and Asia Pacific and South Asia (53.8%) have at least a post-secondary schooling degree. The percentage of the youth in Sub-Saharan Africa (13.5%) with at least a post-secondary schooling degree is significantly lower (Figure 2.9). Obtaining a university degree is no longer a guaranteed route to avoid unemployment43. The reasons for this include the slow-down in economic growth that has decreased the market for school leavers and university graduates, young people obtaining degrees (social science and business degrees) in oversupplied sectors as well as universities failing to adequately equip the youth with the skills required by employers44. Obtaining a tertiary
qualification increases the likelihood that the youth, should they select the self-employment route, are more likely to be opportunity-driven entrepreneurs. However, the ability to perceive opportunities, the belief in having the skills needed to start a business as well as fear of failure could continue to act as a barrier to starting a business.
Tertiary education needs to assist the youth in developing the skills required by employers as well as the skills and beliefs required to start business ventures. By minimising the mismatch in the skill-set required by employers (or necessary to start a business) and the skill-set provided by tertiary
43. UNESCO, 2013, Tackling youth unemployment through TVET 44. UNESCO, 2013
Level of education by region and age
Figure 2.9
Figure 2.9, Level of education by region and age
0.00%
10.00%
20.00%
30.00%
40.00%
50.00%
60.00%
70.00%
80.00%
90.00%
At least a high school degree
Level of education by age and region
Perc
enta
ge w
ith a
t lea
st a
hig
h sc
hool
or a
t lea
st a
pos
t-se
cond
ary
degr
ee
18-34 35-64
At least a post secondary degree
18-34 35-64
Latin America and Carribean
Middle East and North Africa
USA
Sub-Saharan Africa
Asia Pacific and South Asia
European Union
Non-European Union

Page 31
45. See Figure 1 in Appendix 146. 2012, GEM Global Report
47. 2012, GEM Global Report
degrees, the youth with tertiary education will be less vulnerable with respect to their inability to find employment or select to develop the skills within the self-employment arena. The entrepreneurial framework condition45 Education and Training relates to the extent to which entrepreneurship and entrepreneurial qualities receive attention in all phases of the educational and training system. Five out of the six geographic regions ranked primary and secondary education as the lowest of the nine entrepreneurial framework conditions, with only Sub-Saharan Africa scoring R&D transfer lower than primary and secondary education.
Thirty countries (43.47%) participating in the 2012 GEM surveys scored primary and secondary education below 2 out of 546. This seems to indicate that regardless of the level of education within economies, the type of education offered does not seem to promote entrepreneurship. Given the high level of youth unemployment as well as the number of unemployed graduates, focusing on providing an education that allows young people to be both future employees as well as future employers is critical.
2.1.1.2 Societal perceptions of entrepreneurship
Societal perceptions of entrepreneurship include societal impressions about entrepreneurship as a career choice, whether entrepreneurs are afforded high status and whether they receive positive media attention. This assesses the visibility and attractiveness of entrepreneurship. Positive views on these measures assist in making entrepreneurship more attractive within the community and therefore influence the willingness of individuals to become entrepreneurs. The visibility and attractiveness of entrepreneurship also increases the likelihood that, as society has shown support for these efforts, this will make it easier for businesses to find investors, suppliers, customers and advisors47. Figures 2.10, 2.11 and 2.12 below show the societal perceptions of entrepreneurship by age and region.
Figure 2.10 shows that the perception that entrepreneurship is a good career in Latin America and the Caribbean, the MENA region, and Sub-Saharan Africa is not influenced by age, with similar percentages of the youth and adults indicating that entrepreneurship is considered a good career choice. While youth unemployment in Sub-Saharan
“Basic education increases the efficiency of each individual worker. Moreover, workers who have received little formal education can carry out only simple manual work and find it much more difficult to adapt to more advanced production processes and techniques. Lack of basic education can therefore become a constraint on business development.
(2010/11 Global Competitiveness Report)
GEM has shown a positive correlation between tertiary education, opportunity-driven businesses and job creation.
The young youth refers to young people aged 18 – 24, the older youth refers to young people aged 25 – 34.

Page 32
Africa is lower than in areas such as the MENA areas (Figure 1.1), given the youth bulge in sub-Saharan Africa, the absolute number of unemployed youths is extremely high. Poverty in sub-Saharan Africa is widespread and the lack of formal employment in this region is also not a new phenomenon. Considering entrepreneurship a good career choice may in fact be an acknowledgement that entrepreneurship may be the only career option available.
The youth in Asia Pacific and South Asia (61.2%) have the lowest perception that entrepreneurship is a good career; however, this is higher than adult perceptions (56.8%). The young youth (62.5%) are also slightly more positive in their perception that entrepreneurship is a good career than the older youth (60.4%). Young people in Japan are particularly negative with respect to their perception that entrepreneurship is a good career with only 25.5% of the youth indicating that
entrepreneurship is a good career. This is 19% lower than adults. While overall levels of the perception that entrepreneurship is a good career are lower, the young youth in Asia Pacific and South Asia, the European Union and Non-European Union countries are generally more positive in their belief that entrepreneurship is considered a good career choice than both the older youth and adults. The difference in this belief is most marked in the European Union, where the young youth are 1.2 times more likely than adults to indicate that entrepreneurship is a good career choice. A possible explanation for this is that although there are generally numerous attractive employment alternatives in the European Union countries, such as working for corporations, government or other entities, the financial crisis has led to levels of unemployment in Europe that have not been experienced for some time. With large scale retrenchments and a lack of growth in the formal
Entrepreneurship as a good career choice by age and region
Figure 2.10
EuropeanUnion
Figure 2.10: Entrepreneurship as a good career choice by age and region
0.00%
10.00%
20.00%
30.00%
40.00%
50.00%
60.00%
70.00%
80.00%
90.00%
18-24 25-34 35-64
Latin America and Carribean
Middle East and North Africa
Sub-Saharan Africa
Asia Pacificand South Asia
Non-EuropeanUnion
Regions
Perc
enta
ge o
f you
ng y
outh
, old
er y
outh
and
adu
lts
that
con
side
rs e
ntre
pren
eurs
hip
a go
od c
aree
r cho
ice

Page 33
48. Kelley, D. Bosma, N. Amorós, J. (2010). Global Entrepreneurship Monitor 2010 Global Report. London: Global Entrepreneurship Research Association
sector, young people may no longer see corporations, government or other entities as a key avenue for work and may be more open to seeing entrepreneurial activity in a more positive light.
All geographic regions, with the exception of Latin America and the Caribbean show a higher percentage of both the youth and adults that believe that successful entrepreneurs receive high status (Figure 2.11) compared to the perceptions about entrepreneurship being a good career choice (Figure 2.10). This could be explained by the considerable publicity regarding entrepreneurs like Sir Richard Branson in the United Kingdom, and Bill Gates, Steve Jobs and recently Mark Zuckerberg of Facebook, not only in their home countries, but worldwide48. As with the belief that entrepreneurship is considered a good career choice, the percentage of both the youth (67.4%) and adults (64.3%) in the Asia Pacific and
South Asia that believe that successful entrepreneurs receive high status is lower than in any other region. While overall levels of the perception that successful entrepreneurs receive high status are lower in Asia Pacific and South Asia, the European Union and Non-European Union countries, the young youth in these regions are generally more positive in their belief that entrepreneurs receive high status than both the older youth and adults. The difference in this belief is most marked in the non-European Union, where the young youth are 1.1 times more likely than adults to indicate that entrepreneurs receive high status.
Only half of the youth and adults in the European Union indicated that there is a lot of media coverage for new businesses whereas three quarters of both the youth and adults in sub-Saharan Africa indicated that new businesses are afforded considerable media attention.
Status of successful entrepreneurs, by age and region
Figure 2.11
Regions
Perc
enta
ge o
f you
ng y
outh
, old
er y
outh
and
adu
lts
that
bel
ieve
tha
t pe
rson
s gr
owin
g a
succ
essf
ul b
usin
ess
rece
ive
high
sta
tus
EuropeanUnion
Figure 2.11: Persons growing a successful business receive high status, by age and region
0.00%
10.00%
20.00%
30.00%
40.00%
50.00%
60.00%
70.00%
80.00%
90.00%
18-24 25-34 35-64
Latin America and Carribean
Middle East and North Africa
Sub-Saharan Africa
Asia Pacificand South Asia
Non-EuropeanUnion

Page 34
Figure 2.12 shows that the perception that there is a lot of media coverage for new business is not influenced by age. GEM argues that the visibility and attractiveness of entrepreneurship increases the likelihood the support society shows will make it easier for businesses to find investors, suppliers, customers and advisors. Positive media coverage is an ideal vehicle to increase the visibility of successful entrepreneurs and given the relatively low ratings in the European Union, the non-European Union and the MENA region, these regions should focus on increasing the media coverage of business enterprise – and with high youth unemployment, a focus on youth enterprises will have the added benefit of allowing young people information regarding alternative career paths.
Fear of failure is more common in developed economies and is probably due to the types of entrepreneurial activities in highly developed
countries demanding more knowledge than simple entrepreneurial activities prevalent in factor- driven economies. This is confirmed in Figure 2.13 with the European Union showing the highest level of fear of failure amongst the youth and adult populations and sub-Saharan Africa showing the lowest perception that fear of failure would prevent one from starting a business. This is equally evident in both the youth and adults with only a quarter of both the youth (25.2%) and adults (25.9%) indicating that fear of failure would prevent them from starting a business. Sub-Saharan Africa offers few other job opportunities has weaker formal institutions and in general has a liberalised trade market. This could also, in part, explain the lower fear of failure figures.
Media coverage for new businesses by age and region
Figure 2.12
Fear of failure often prevents individuals from starting a new business.
EuropeanUnion
Figure 2.12: A lot of media coverage for new businesses by age and region
0.00%
10.00%
20.00%
30.00%
40.00%
50.00%
60.00%
70.00%
80.00%
90.00%
18-34 35-64
Latin America and Carribean
Middle East and North Africa
Sub-Saharan Africa
Asia Pacificand South Asia
Non-EuropeanUnion
Regions
Perc
enta
ge o
f you
ng y
outh
, old
er y
outh
and
adu
lts
that
bel
ieve
tha
t th
ere
is a
lot
of m
edia
cov
erag
e fo
r new
bus
ines
ses

Page 35
The youth in the Non-European Union, Latin America and the Caribbean and Asia Pacific and South Asia are less likely to indicate that fear of failure would prevent them from starting a business than adults in these regions. The youth in these regions are, 10.5%, 8.5% and 4.5% respectively less likely to indicate that they would not start a
business due to fear of failure than adults. This is a positive sign as GEM has shown that potential entrepreneurs i.e. individuals that perceive opportunities and have the belief that they have the skills to start a business, can be prevented from acting on these beliefs due to fear of failure.
The European Union has the highest level of fear of failure with almost a half (46.7%) of the youth and adults indicating that fear of failure would prevent them from starting a business. The fear of failure is particularly acute in Greece where over 70% of the youth and adults indicating that fear of failure would prevent them from starting a business. Over half of the youth and adults in Spain, Portugal, Italy and Poland indicated that fear of failure would prevent them from starting a business.
On average, there is little difference in the rate of youth (35.3%) and adult (34.1%) fear of failure in
Fear of failure by age and region
Figure 2.13
The youth in Panama have the lowest fear of failure with only 12% indicating that fear of failure would prevent them from starting a business.
In most economies a relatively small percentage of strategic or high-growth entrepreneurs generate the bulk of new jobs attributable to new firm entries (2012 GEM Global Report).
Regions
Perc
enta
ge o
f you
th a
nd a
dult
s th
at b
elie
ve t
hat
fear
of f
ailu
re
will
pre
vent
the
m fr
om s
tart
ing
a bu
sine
ss
EuropeanUnion
Figure 2.13: Fear of failure by age and region
0.00%
5.00%
10.00%
15.00%
20.00%
25.00%
30.00%
35.00%
40.00%
45.00%
18-34 35-64
Latin America and Carribean
Middle East and North Africa
Sub-Saharan Africa
Asia Pacificand South Asia
Non-EuropeanUnion
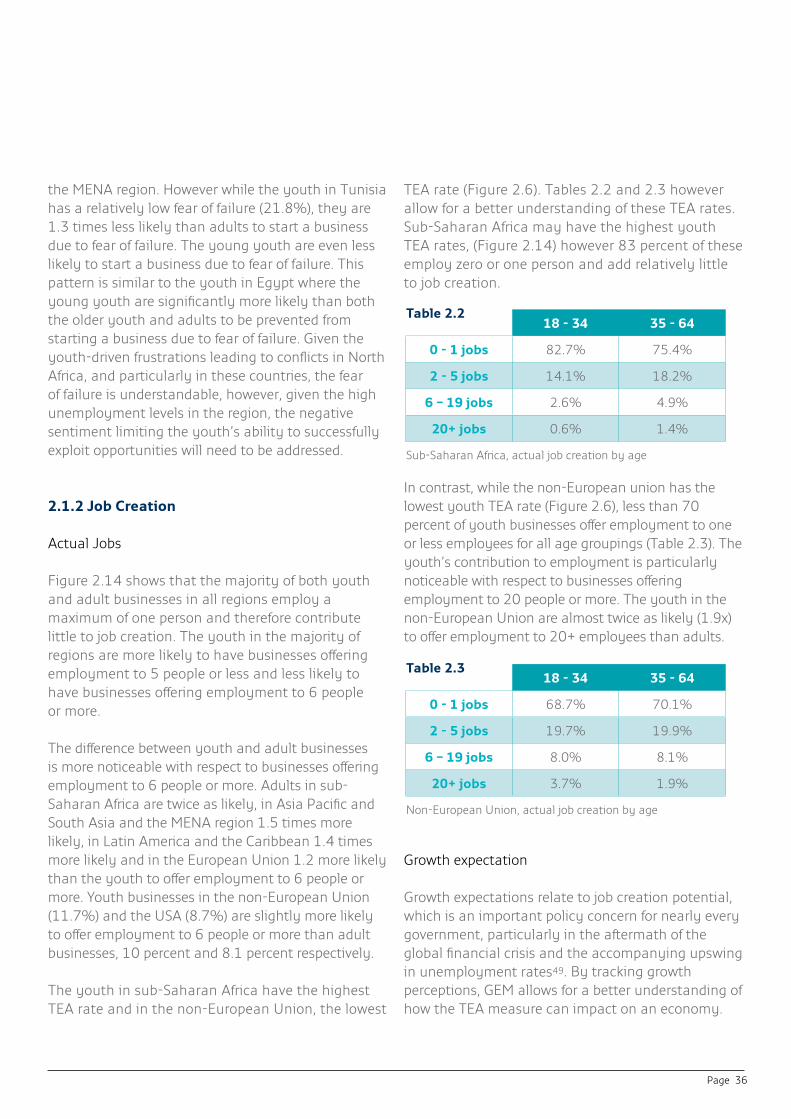
Page 36
the MENA region. However while the youth in Tunisia has a relatively low fear of failure (21.8%), they are 1.3 times less likely than adults to start a business due to fear of failure. The young youth are even less likely to start a business due to fear of failure. This pattern is similar to the youth in Egypt where the young youth are significantly more likely than both the older youth and adults to be prevented from starting a business due to fear of failure. Given the youth-driven frustrations leading to conflicts in North Africa, and particularly in these countries, the fear of failure is understandable, however, given the high unemployment levels in the region, the negative sentiment limiting the youth’s ability to successfully exploit opportunities will need to be addressed.
2.1.2 Job Creation
Actual Jobs
Figure 2.14 shows that the majority of both youth and adult businesses in all regions employ a maximum of one person and therefore contribute little to job creation. The youth in the majority of regions are more likely to have businesses offering employment to 5 people or less and less likely to have businesses offering employment to 6 people or more.
The difference between youth and adult businesses is more noticeable with respect to businesses offering employment to 6 people or more. Adults in sub-Saharan Africa are twice as likely, in Asia Pacific and South Asia and the MENA region 1.5 times more likely, in Latin America and the Caribbean 1.4 times more likely and in the European Union 1.2 more likely than the youth to offer employment to 6 people or more. Youth businesses in the non-European Union (11.7%) and the USA (8.7%) are slightly more likely to offer employment to 6 people or more than adult businesses, 10 percent and 8.1 percent respectively.
The youth in sub-Saharan Africa have the highest TEA rate and in the non-European Union, the lowest
TEA rate (Figure 2.6). Tables 2.2 and 2.3 however allow for a better understanding of these TEA rates. Sub-Saharan Africa may have the highest youth TEA rates, (Figure 2.14) however 83 percent of these employ zero or one person and add relatively little to job creation.
In contrast, while the non-European union has the lowest youth TEA rate (Figure 2.6), less than 70 percent of youth businesses offer employment to one or less employees for all age groupings (Table 2.3). The youth’s contribution to employment is particularly noticeable with respect to businesses offering employment to 20 people or more. The youth in the non-European Union are almost twice as likely (1.9x) to offer employment to 20+ employees than adults.
Growth expectation
Growth expectations relate to job creation potential, which is an important policy concern for nearly every government, particularly in the aftermath of the global financial crisis and the accompanying upswing in unemployment rates49. By tracking growth perceptions, GEM allows for a better understanding of how the TEA measure can impact on an economy.
Non-European Union, actual job creation by age
18 - 34 35 - 64
0 - 1 jobs 68.7% 70.1%
2 - 5 jobs 19.7% 19.9%
6 – 19 jobs 8.0% 8.1%
20+ jobs 3.7% 1.9%
Table 2.3
Sub-Saharan Africa, actual job creation by age
18 - 34 35 - 64
0 - 1 jobs 82.7% 75.4%
2 - 5 jobs 14.1% 18.2%
6 – 19 jobs 2.6% 4.9%
20+ jobs 0.6% 1.4%
Table 2.2

Page 37
Sub-Saharan Africa has the highest percentage of youth businesses with low growth expectations (85.5%) and the lowest percentage of youth businesses (3.9%) with high growth expectations (Figure 2.15). The pattern for adult low, medium and high growth expectations is similar to the youth in sub-Saharan Africa. The young youth (3.3%) in sub-Saharan Africa are even less likely to perceive their nascent or new business as a high growth business.
TEA job creation, by age and region
Figure 2.14
Number of actual jobs created by the youth and adults
Perc
enta
ge o
f you
th a
nd a
dult
bus
ines
ses
crea
ting
0 -
1, 2
– 5
, 6 –
19
and
20
+ jo
bs
Figure 2.14: TEA actual jobs by age and region
0.00%
10.00%
20.00%
30.00%
40.00%
50.00%
60.00%
70.00%
80.00%
90.00%
18 - 34
0 -1 2 - 5 6 - 19 20 +
35- 64
0 -1 2 - 5 6 - 19 20 +
Latin America and Carribean
Middle East and North Africa
USA
Sub-Saharan Africa
Asia Pacific and South Asia
European Union
Non-European Union
High growth companies are usually started by individuals between the ages of 26 - 45 years old. They are likely to have attended college and many hold graduate degrees.(2011 GEM High-Impact Entrepreneurship Global Report)
GEM asks early-stage entrepreneurs how many employees (other than the owners) they currently have and expect to have in the next five years. The difference between current and expected employees indicates growth expectations.
49. 2012, GEM Global Report
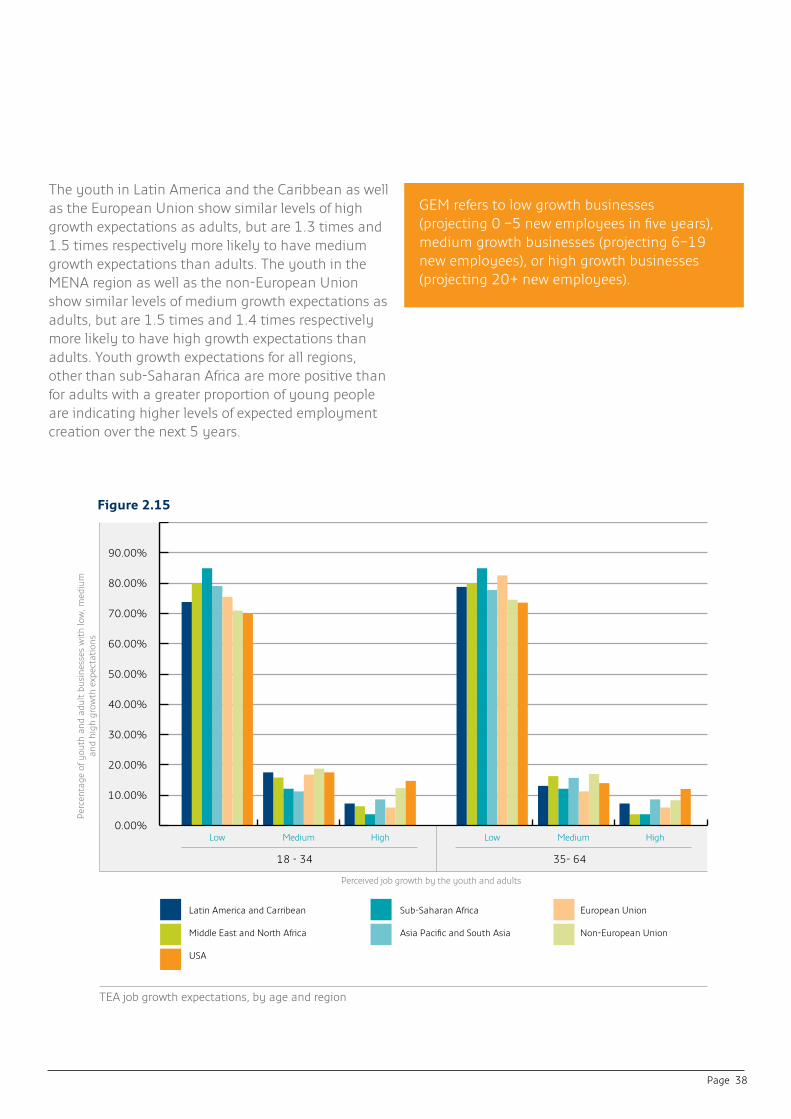
Page 38
The youth in Latin America and the Caribbean as well as the European Union show similar levels of high growth expectations as adults, but are 1.3 times and 1.5 times respectively more likely to have medium growth expectations than adults. The youth in the MENA region as well as the non-European Union show similar levels of medium growth expectations as adults, but are 1.5 times and 1.4 times respectively more likely to have high growth expectations than adults. Youth growth expectations for all regions, other than sub-Saharan Africa are more positive than for adults with a greater proportion of young people are indicating higher levels of expected employment creation over the next 5 years.
TEA job growth expectations, by age and region
Figure 2.15
GEM refers to low growth businesses(projecting 0 –5 new employees in five years), medium growth businesses (projecting 6–19 new employees), or high growth businesses (projecting 20+ new employees).
Perceived job growth by the youth and adults
Perc
enta
ge o
f you
th a
nd a
dult
bus
ines
ses
wit
h lo
w, m
ediu
man
d hi
gh g
row
th e
xpec
tati
ons
Figure 2.15: TEA expected job growth by age and region
0.00%
10.00%
20.00%
30.00%
40.00%
50.00%
60.00%
70.00%
80.00%
90.00%
18 - 34
Low Medium High
35- 64
Low Medium High
Latin America and Carribean
Middle East and North Africa
USA
Sub-Saharan Africa
Asia Pacific and South Asia
European Union
Non-European Union
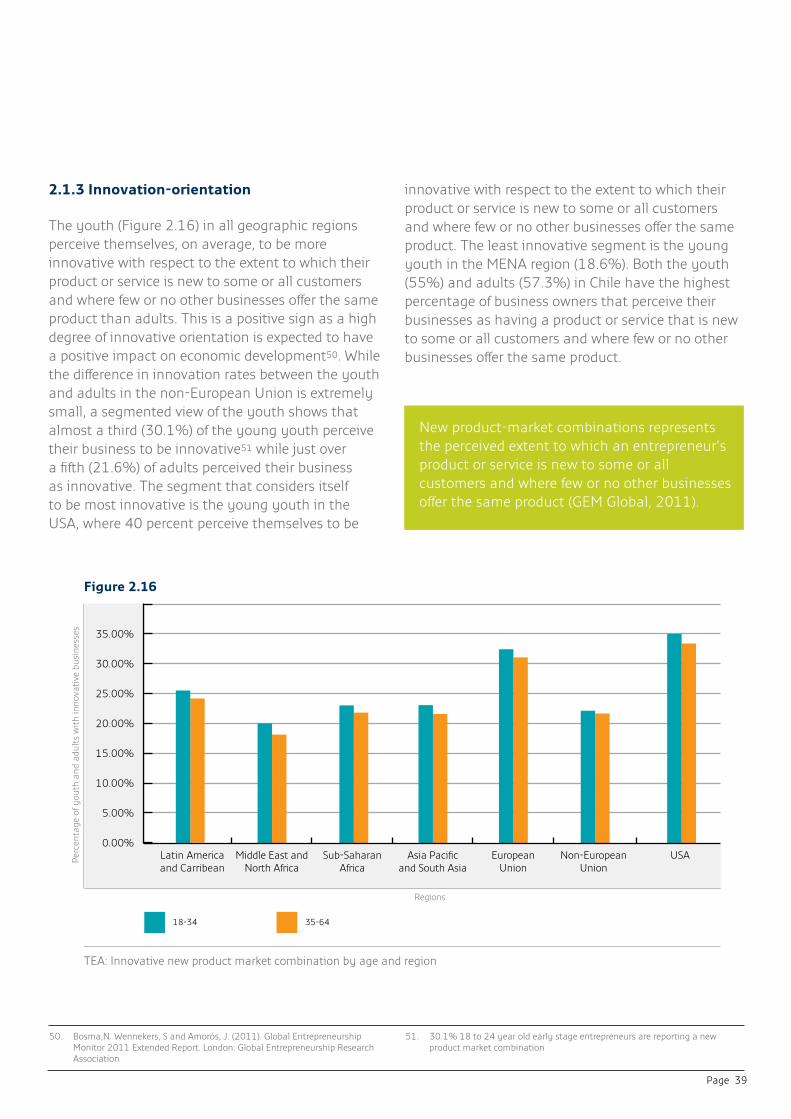
Page 39
2.1.3 Innovation-orientation
The youth (Figure 2.16) in all geographic regions perceive themselves, on average, to be more innovative with respect to the extent to which their product or service is new to some or all customers and where few or no other businesses offer the same product than adults. This is a positive sign as a high degree of innovative orientation is expected to have a positive impact on economic development50. While the difference in innovation rates between the youth and adults in the non-European Union is extremely small, a segmented view of the youth shows that almost a third (30.1%) of the young youth perceive their business to be innovative51 while just over a fifth (21.6%) of adults perceived their business as innovative. The segment that considers itself to be most innovative is the young youth in the USA, where 40 percent perceive themselves to be
innovative with respect to the extent to which their product or service is new to some or all customers and where few or no other businesses offer the same product. The least innovative segment is the young youth in the MENA region (18.6%). Both the youth (55%) and adults (57.3%) in Chile have the highest percentage of business owners that perceive their businesses as having a product or service that is new to some or all customers and where few or no other businesses offer the same product.
TEA: Innovative new product market combination by age and region
Figure 2.16
50. Bosma,N. Wennekers, S and Amorós, J. (2011). Global Entrepreneurship Monitor 2011 Extended Report. London: Global Entrepreneurship Research Association
51. 30.1% 18 to 24 year old early stage entrepreneurs are reporting a new product market combination
New product-market combinations represents the perceived extent to which an entrepreneur’s product or service is new to some or all customers and where few or no other businesses offer the same product (GEM Global, 2011).
Regions
Perc
enta
ge o
f you
th a
nd a
dult
s w
ith
inno
vati
ve b
usin
esse
s
EuropeanUnion
Figure 2.16: TEA: Innovative new product market combination by age and region
0.00%
5.00%
10.00%
15.00%
20.00%
25.00%
30.00%
35.00%
18-34 35-64
Latin America and Carribean
Middle East and North Africa
Sub-Saharan Africa
Asia Pacificand South Asia
Non-EuropeanUnion
USA

Page 40
Case study 3
Youth Entrepreneurship and Innovation
As they bring new products and services to market, young entrepreneurs are inextricably linked with innovation – and are having a significant impact on economic development.
The Report showed young business owners make a significant contribution to innovation, introducing products or services that few other businesses offer and consumers have not yet seen. In turn, this high degree of innovation has a positive effect on economic development.
Business ideas
As they seek to provide “cool” new products for their peers, young entrepreneurs are often drawn to more innovative businesses. But the inclination to deliver groundbreaking products and services can sometimes lead them to run before they can walk.
Understanding the market
Compared to their counterparts in larger companies, entrepreneurs are much closer to their markets. This is particularly true for young entrepreneurs, and, as a result, they are often better positioned to adapt when the environment changes or competition increases.
Young entrepreneurs’ aptitude for marketing to their peers also contributes to their unique success in the marketplace.
Other entrepreneurs, like Huaping Yang in China, used innovation to keep ahead of the competition. “For my business, providing innovative products and services has been essential in ensuring our survival and success in a highly competitive industry.”
For example, Deborah Stewart, who runs an event management business in Trinidad and Tobago, saw the marketplace growing more competitive as other companies began offering services similar to hers. So she began focusing on small events like dinner parties and business functions, where there was less competition.
Boris Tkachenko, Youth Business Russia, Programme Director, said, “Students from technology universities sometimes ask for huge sums of money for wild ideas, even though their business model isn’t feasible. Big innovations often don’t make it past a dream – small innovations are where you can really make money.”
With the support of The Prince’s Trust, a member of Youth Business International, Emma Reilly was able to overcome bullying and mental health challenges to set up a successful design company in Newcastle, north east England.
Page 41
Innovation across cultures
Cultural differences also have an effect on innovation. For example, due to Russia’s political and economic history, entrepreneurship is less developed there than in some other countries.
In countries like Nigeria, on the other hand, young entrepreneurs are developing products that target emerging middle class consumers who want to be seen as different. In these cultures, the interviews found young entrepreneurs filling gaps in the market and addressing economic trends specific to their country.
Entrepreneurial processes
Growing their businesses can be challenging for young entrepreneurs, and an innovative approach can yield significant benefits. For example, a new approach to managing expansion can help ensure a business’ success before it is even fully established. Innovation is just as important to processes as it is to products, and running parallel operations that use the infrastructure of one to support the other can help sustain both businesses while positioning them for growth.
Networks
Networking benefits young entrepreneurs, providing inspiration for those working on their own and helping to facilitate growth for their businesses. When young entrepreneurs find themselves without a network, they often create one.
This was the case for Gabriel Fernando Álvarez Miguel, the CEO of Avimusic, which provides high quality promotional materials and recording facilities to emerging musicians in Argentina. He said, “I started providing these services in the region of Mendoza, where they were not readily available to young and emerging artists.”
Boris Tkachenko said, “I often see young entrepreneurs motivated by their desire to provide something cool and attractive specifically for other young people.”
Adetola Ayotunde Adebowale’s business manufactures garments for a client base that includes firms, schools and individuals. Adetola noticed that the emerging middle class in Nigeria did not want to wear the same things everyone else was wearing, so he delivers something different and unique for consumers in a market saturated with homogenous products.
That’s why, according to Boris Tkachenko, “We need exchanges between entrepreneurs from other countries, as there are common themes in entrepreneurship. Russia hosted the G20 Young Entrepreneurs Alliance (YEA) event this year, which allowed young entrepreneurs to exchange ideas with other people. Next year Russia will host a global entrepreneurship congress, which will also provide good opportunities to take valuable lessons from other countries.”
Emma Reilly runs two businesses in the UK. “League of Pixels’” offers graphic design services, while “The Brave and The Bold” sells t-shirts. When Emma ran just one business producing t-shirts, she found the production costs to be too high, so she shifted her focus to design. Having two businesses gave her the flexibility to support one business with cash flow from the other. Today both of her businesses are growing, and she is using her profits to reinvest and expand abroad.
Gabriel Fernando Álvarez Miguel was matched with a business in California called Full Sale Studios. “This [business] may be the closest I have to an actual ‘role model,’ or at least a vision for where I see [my company] going in the long term.”
Amira Khammassi received support from a micro-credit organisation for her company, but quickly realised the need for her own network. “I contacted everyone I knew in the education sector, as well as experts I didn’t know, to ask questions and learn more on the subject. I took advantage of the university network to gain access to training and share my knowledge as well as gain knowledge from others.”

Page 42
2.1.4 Sector
The retail trade is the largest sector for both youth and adult businesses. However, some interesting trends, particularly with respect to the young youth are noticeable. The young youth, particularly in the non-European Union (47.9%), USA (36.5%) and to a lesser extent the MENA region (44.1%) and the European Union (30.1%) show greater participation in the retail sector than either the older youth or adults. The young youth is therefore 1.7 times, 1.6 times, 1.1 times and 1.2 times respectively more likely to operate in the retail sector than adults in these regions (Figure 2.17). A large section of the retail sector is characterized by low barriers to entry with respect to start-up capital and the level of business skills. The higher than normal unemployment rates in these regions could account for the significantly higher participation rate of the young youth within this sector. However, competition within the retail sector is often high and can be overtraded with many
businesses in this sector facing low margins. This sector may not offer long-term sustainable business options to all of the new entrants but will allow young people to develop business and personal skills that could enable them to offset many of the negative impacts of prolonged unemployment.
The majority of both youth and adult businesses (65%) in sub-Saharan Africa operate in the retail sector (Figure 2.17). The current job creation of nascent and new businesses in sub-Saharan Africa indicates that the majority of both youth and adult businesses have either no or a small number of employees (Figure 2.14). This lends itself to the idea that many of these businesses are “me-too” businesses. The retail sector is also strongly represented in Asia Pacific and South Asia with over half of the entrepreneurs (52%) involved in this sector. The retail sector in Asia Pacific and South Asia has a similar lack of age determined variation.The information and communication, financial
Retail sector participation, by age and region
Figure 2.17
Regions
Perc
enta
ge o
f you
ng y
outh
, old
er y
outh
and
adu
lts
invo
lved
in t
he re
tail
trad
e
EuropeanUnion
Figure 2.17: Retail trade, hotels & restaurants by age and region
0.00%
10.00%
20.00%
30.00%
40.00%
50.00%
60.00%
70.00%
18-24 25-34 35-64
Latin America and Carribean
Middle East and North Africa
Sub-Saharan Africa
Asia Pacificand South Asia
Non-EuropeanUnion
USA
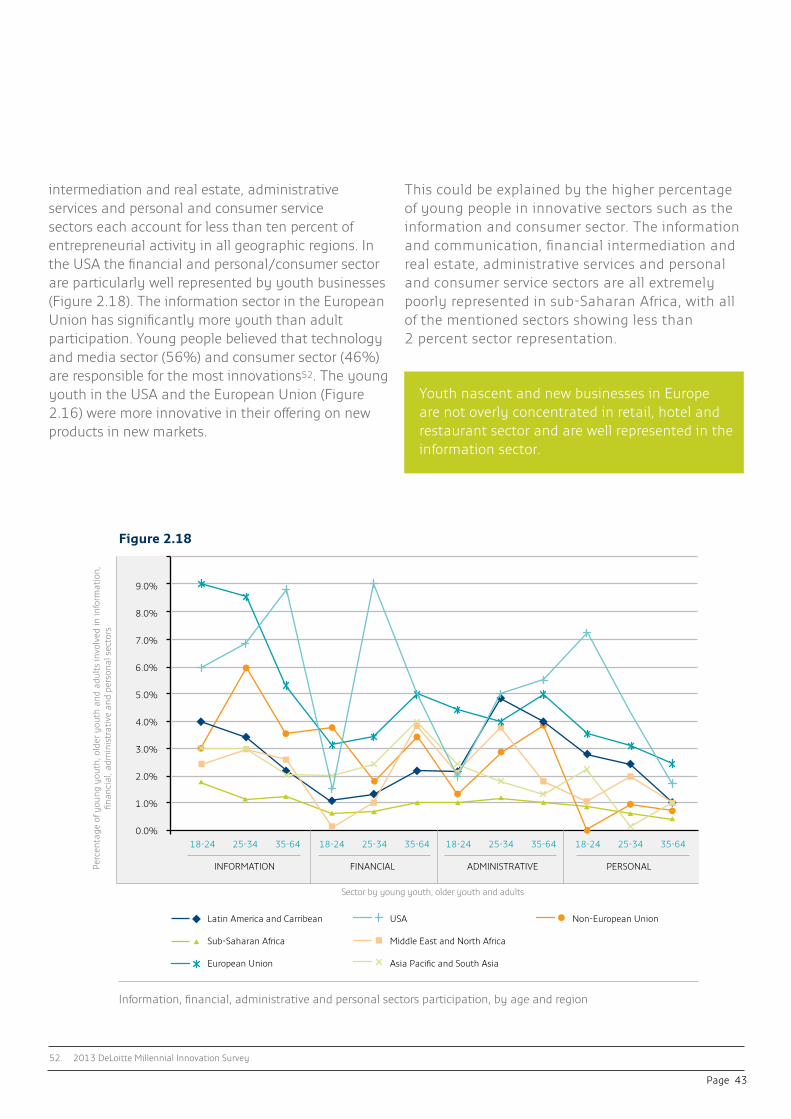
Page 43
intermediation and real estate, administrative services and personal and consumer service sectors each account for less than ten percent of entrepreneurial activity in all geographic regions. In the USA the financial and personal/consumer sector are particularly well represented by youth businesses (Figure 2.18). The information sector in the European Union has significantly more youth than adult participation. Young people believed that technology and media sector (56%) and consumer sector (46%) are responsible for the most innovations52. The young youth in the USA and the European Union (Figure 2.16) were more innovative in their offering on new products in new markets.
This could be explained by the higher percentage of young people in innovative sectors such as the information and consumer sector. The information and communication, financial intermediation and real estate, administrative services and personal and consumer service sectors are all extremely poorly represented in sub-Saharan Africa, with all of the mentioned sectors showing less than 2 percent sector representation.
Information, financial, administrative and personal sectors participation, by age and region
Figure 2.18
52. 2013 DeLoitte Millennial Innovation Survey
Youth nascent and new businesses in Europe are not overly concentrated in retail, hotel and restaurant sector and are well represented in the information sector.
Sector by young youth, older youth and adults
Perc
enta
ge o
f you
ng y
outh
, old
er y
outh
and
adu
lts
invo
lved
in in
form
atio
n,
finan
cial
, adm
inis
trat
ive
and
pers
onal
sec
tors
Latin America and Carribean
Sub-Saharan Africa
European Union
USA
Middle East and North Africa
Asia Pacific and South Asia
Non-European Union
Figure 2.18: Information, financial, administrative and personal sectors
0.0%18-24 25-34
INFORMATION FINANCIAL ADMINISTRATIVE PERSONAL
35-64 18-24 25-34 35-64 18-24 25-34 35-64 18-24 25-34 35-64
2.0%
4.0%
6.0%
7.0%
8.0%
9.0%
1.0%
3.0%
5.0%
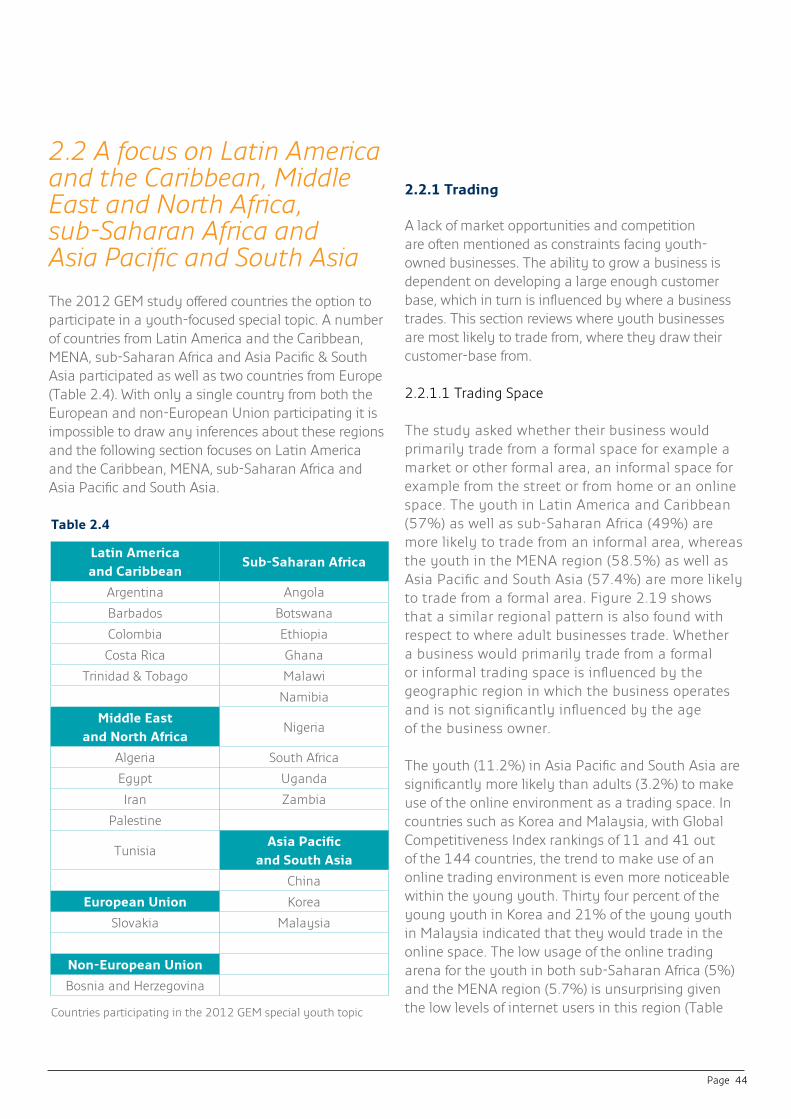
Page 44
2.2 A focus on Latin America and the Caribbean, Middle East and North Africa,sub-Saharan Africa andAsia Pacific and South Asia
The 2012 GEM study offered countries the option to participate in a youth-focused special topic. A number of countries from Latin America and the Caribbean, MENA, sub-Saharan Africa and Asia Pacific & South Asia participated as well as two countries from Europe (Table 2.4). With only a single country from both the European and non-European Union participating it is impossible to draw any inferences about these regions and the following section focuses on Latin America and the Caribbean, MENA, sub-Saharan Africa and Asia Pacific and South Asia.
2.2.1 Trading
A lack of market opportunities and competition are often mentioned as constraints facing youth-owned businesses. The ability to grow a business is dependent on developing a large enough customer base, which in turn is influenced by where a business trades. This section reviews where youth businesses are most likely to trade from, where they draw their customer-base from.
2.2.1.1 Trading Space
The study asked whether their business would primarily trade from a formal space for example a market or other formal area, an informal space for example from the street or from home or an online space. The youth in Latin America and Caribbean (57%) as well as sub-Saharan Africa (49%) are more likely to trade from an informal area, whereas the youth in the MENA region (58.5%) as well as Asia Pacific and South Asia (57.4%) are more likely to trade from a formal area. Figure 2.19 shows that a similar regional pattern is also found with respect to where adult businesses trade. Whether a business would primarily trade from a formal or informal trading space is influenced by the geographic region in which the business operates and is not significantly influenced by the age of the business owner.
The youth (11.2%) in Asia Pacific and South Asia are significantly more likely than adults (3.2%) to make use of the online environment as a trading space. In countries such as Korea and Malaysia, with Global Competitiveness Index rankings of 11 and 41 out of the 144 countries, the trend to make use of an online trading environment is even more noticeable within the young youth. Thirty four percent of the young youth in Korea and 21% of the young youth in Malaysia indicated that they would trade in the online space. The low usage of the online trading arena for the youth in both sub-Saharan Africa (5%) and the MENA region (5.7%) is unsurprising given the low levels of internet users in this region (Table Countries participating in the 2012 GEM special youth topic
Table 2.4
Latin Americaand Caribbean
Sub-Saharan Africa
Argentina Angola
Barbados Botswana
Colombia Ethiopia
Costa Rica Ghana
Trinidad & Tobago Malawi
Namibia
Middle Eastand North Africa
Nigeria
Algeria South Africa
Egypt Uganda
Iran Zambia
Palestine
TunisiaAsia Pacific
and South Asia
China
European Union Korea
Slovakia Malaysia
Non-European Union
Bosnia and Herzegovina
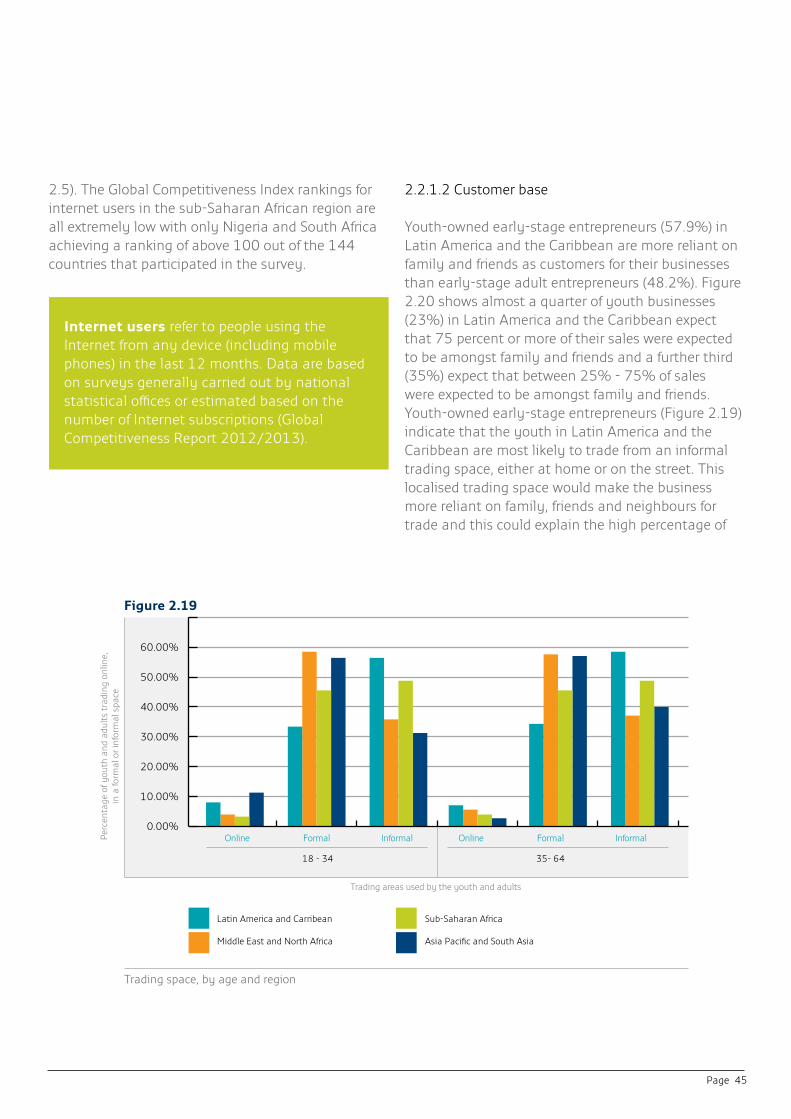
Page 45
2.5). The Global Competitiveness Index rankings for internet users in the sub-Saharan African region are all extremely low with only Nigeria and South Africa achieving a ranking of above 100 out of the 144 countries that participated in the survey.
2.2.1.2 Customer base
Youth-owned early-stage entrepreneurs (57.9%) in Latin America and the Caribbean are more reliant on family and friends as customers for their businesses than early-stage adult entrepreneurs (48.2%). Figure 2.20 shows almost a quarter of youth businesses (23%) in Latin America and the Caribbean expect that 75 percent or more of their sales were expected to be amongst family and friends and a further third (35%) expect that between 25% - 75% of sales were expected to be amongst family and friends. Youth-owned early-stage entrepreneurs (Figure 2.19) indicate that the youth in Latin America and the Caribbean are most likely to trade from an informal trading space, either at home or on the street. This localised trading space would make the business more reliant on family, friends and neighbours for trade and this could explain the high percentage of
Trading space, by age and region
Trading areas used by the youth and adults
Perc
enta
ge o
f you
th a
nd a
dult
s tr
adin
g on
line,
in
a fo
rmal
or i
nfor
mal
spa
ce
Figure 2.19: Trading space, by age and region
0.00%
10.00%
20.00%
30.00%
40.00%
50.00%
60.00%
Online Formal Informal
18 - 34
Online Formal Informal
35- 64
Latin America and Carribean
Middle East and North Africa
Sub-Saharan Africa
Asia Pacific and South Asia
Figure 2.19
Internet users refer to people using the Internet from any device (including mobile phones) in the last 12 months. Data are based on surveys generally carried out by national statistical offices or estimated based on the number of Internet subscriptions (Global Competitiveness Report 2012/2013).
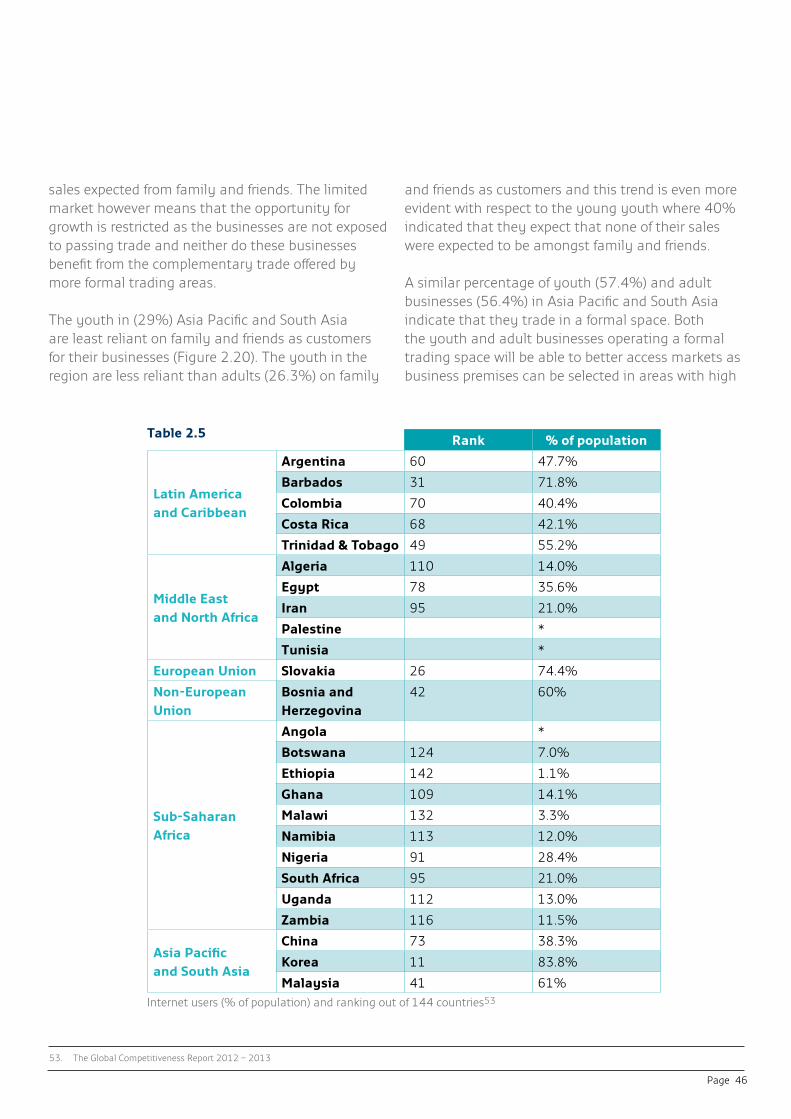
Page 46
Rank % of population
Latin America and Caribbean
Argentina 60 47.7%
Barbados 31 71.8%
Colombia 70 40.4%
Costa Rica 68 42.1%
Trinidad & Tobago 49 55.2%
Middle East and North Africa
Algeria 110 14.0%
Egypt 78 35.6%
Iran 95 21.0%
Palestine *
Tunisia *
European Union Slovakia 26 74.4%
Non-European Union
Bosnia andHerzegovina
42 60%
Sub-Saharan Africa
Angola *
Botswana 124 7.0%
Ethiopia 142 1.1%
Ghana 109 14.1%
Malawi 132 3.3%
Namibia 113 12.0%
Nigeria 91 28.4%
South Africa 95 21.0%
Uganda 112 13.0%
Zambia 116 11.5%
Asia Pacific and South Asia
China 73 38.3%
Korea 11 83.8%
Malaysia 41 61%Internet users (% of population) and ranking out of 144 countries53
Table 2.5
sales expected from family and friends. The limited market however means that the opportunity for growth is restricted as the businesses are not exposed to passing trade and neither do these businesses benefit from the complementary trade offered by more formal trading areas.
The youth in (29%) Asia Pacific and South Asia are least reliant on family and friends as customers for their businesses (Figure 2.20). The youth in the region are less reliant than adults (26.3%) on family
and friends as customers and this trend is even more evident with respect to the young youth where 40% indicated that they expect that none of their sales were expected to be amongst family and friends.
A similar percentage of youth (57.4%) and adult businesses (56.4%) in Asia Pacific and South Asia indicate that they trade in a formal space. Both the youth and adult businesses operating a formal trading space will be able to better access markets as business premises can be selected in areas with high
53. The Global Competitiveness Report 2012 – 2013
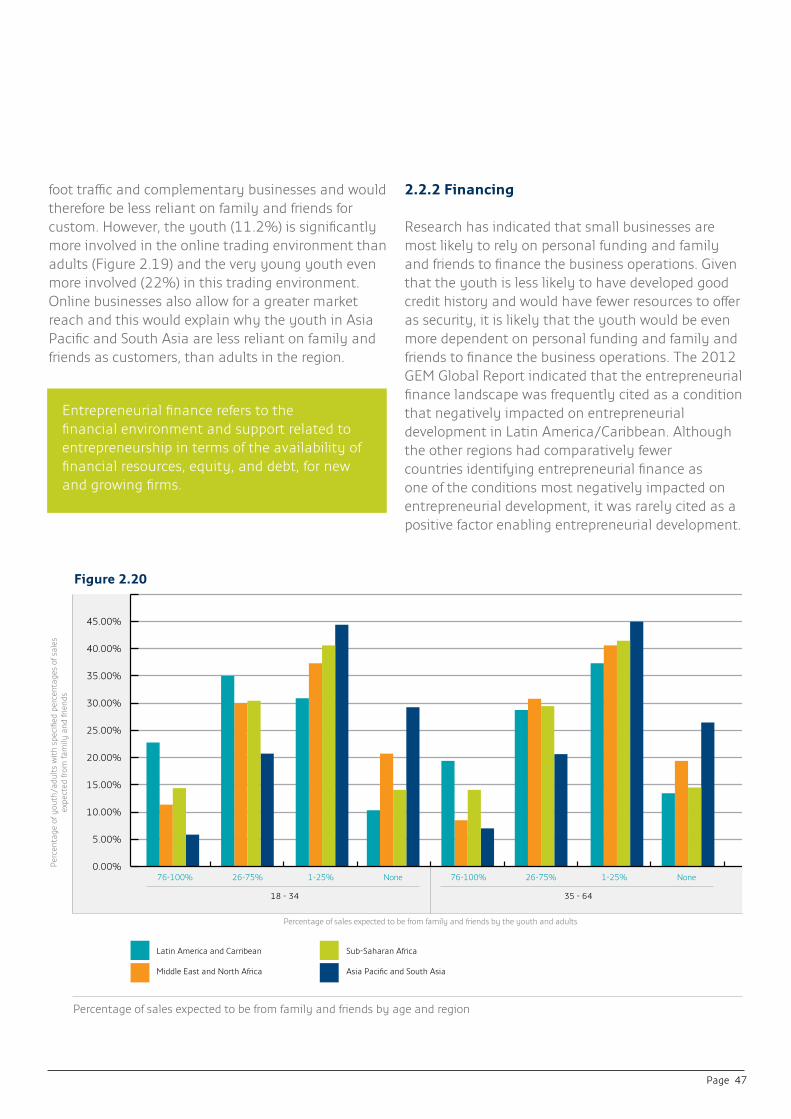
Page 47
foot traffic and complementary businesses and would therefore be less reliant on family and friends for custom. However, the youth (11.2%) is significantly more involved in the online trading environment than adults (Figure 2.19) and the very young youth even more involved (22%) in this trading environment. Online businesses also allow for a greater market reach and this would explain why the youth in Asia Pacific and South Asia are less reliant on family and friends as customers, than adults in the region.
2.2.2 Financing
Research has indicated that small businesses are most likely to rely on personal funding and family and friends to finance the business operations. Given that the youth is less likely to have developed good credit history and would have fewer resources to offer as security, it is likely that the youth would be even more dependent on personal funding and family and friends to finance the business operations. The 2012 GEM Global Report indicated that the entrepreneurial finance landscape was frequently cited as a condition that negatively impacted on entrepreneurial development in Latin America/Caribbean. Although the other regions had comparatively fewer countries identifying entrepreneurial finance as one of the conditions most negatively impacted on entrepreneurial development, it was rarely cited as a positive factor enabling entrepreneurial development.
Percentage of sales expected to be from family and friends by age and region
Percentage of sales expected to be from family and friends by the youth and adults
Perc
enta
ge o
f you
th/a
dult
s w
ith
spec
ified
per
cent
ages
of s
ales
ex
pect
ed fr
om fa
mily
and
frie
nds
Figure 2.20: Percentage of sales expected to be from family and friends by age and region
0.00%
5.00%
10.00%
15.00%
20.00%
25.00%
30.00%
35.00%
40.00%
45.00%
76-100% 26-75% 1-25% None
18 - 34
76-100% 26-75% 1-25% None
35 - 64
Latin America and Carribean
Middle East and North Africa
Sub-Saharan Africa
Asia Pacific and South Asia
Figure 2.20
Entrepreneurial finance refers to the financial environment and support related to entrepreneurship in terms of the availability of financial resources, equity, and debt, for new and growing firms.

Page 48
Figure 2.21 confirms that the majority of funding for youth nascent and new businesses in all regions comes from personal resources, family or friends. Approximately three-quarters of nascent and new youth businesses in sub-Saharan Africa (77.7%), Latin America and the Caribbean (75.7%) and Asia Pacific and South Asia (73.1%) indicated that personal resources, family or friends are the primary funding source for their business. However, while marginally lower, adults businesses in these regions at 76 percent, 72.1 percent and 72.9 percent respectively also primarily rely on personal resources, family or friends to finance their business.
With respect to the youth being more reliant on family and friends and less reliant on personal resources, this is most evident in Asia Pacific and
South Asia where the 57 percent of non-banking funding used by the youth comes from family and friends (the remaining 43 percent is personal funding), whereas 42 percent of non-banking funding used by adults comes from family and friends. This trend is also evident sub-Saharan Africa with 30 percent of non-banking funding used by the youth and 21 percent by adults sourced from family and friends. The youth (41.5%) in Asia Pacific and South Asia are significantly more able to obtain funding from family and friends than in any other region. China is noticeably higher with respect to the majority of funding coming from family. This is consistent across all age groups with 62 percent of nascent and new businesses being majority funded by family and only 8 percent of nascent and new businesses are funded by banks or other financial institutions.
TEA, Source of majority of money to start business by age and region
54. The percentages in Figure 2.20 represent the percentage of the total sample i.e. business owners and not the percentage of respondents that answered this question
Figure 2.2154
Source of majority of funding by age
Perc
enta
ge o
f you
th a
nd a
dult
s ob
tain
ing
maj
orit
y of
fund
ing
per s
ourc
e
Figure 2.21 : TEA, Source of majority of money to start business by age and region
0.00%
10.00%
20.00%
30.00%
40.00%
50.00%
60.00%
Personal Family and friends Bank
18 - 34
Personal Family and friends Bank
35- 64
Latin America and Carribean
Middle East and North Africa
Sub-Saharan Africa
Asia Pacific and South Asia

Page 49
The youth in Latin America and the Caribbean and the MENA region, while still primarily reliant on personal funding, are more reliant on banks and other financial institutions than on family and friends. This trend is also evident in adults in the regions, though adults are even more reliant on banks and other financial institutions than on family and friends. Youth owned nascent and new businesses in the MENA region are less reliant on personal resources, are more reliant on family and friends than Latin America and the Caribbean and sub-Saharan Africa and are more likely than any of the other regions to obtain the majority of their funding from banks.
There is considerable variation with respect to the use of bank and other financial institutions as the major source of funding within the regions. Latin America and the Caribbean ranges from Barbados where approximately a 15 percent of youth businesses (14.7%) and 17.6 percent of adults to Costa Rica where over a fifth of youth businesses (23.9%) and 31.2% of adults use banks and other financial institutions as the major source of funding. The range in other regions is considerably wider with over 41 percent of youth and 44 percent of adult nascent and new businesses in Iran using bank financing as the major source of funding while In Egypt bank’s represent less than ten percent of funding to both the youth and adults.
Given that start-up funding for small businesses predominantly comes from personal savings or money from families, young people in poorer areas would be disadvantaged as the amount of funding from family sources would be limited. Young people are less likely to have accumulated significant amounts of personal savings and this would limit the amount of funding available to start a business, and to continue to fund the business during the nascent and new period.
The regional information shown in Table 2.5 only includes information pertinent to the countries that participated in the special youth topic (Table 2.4). Just under half of the nascent and new businesses in Latin America and the Caribbean and Asia Pacific and South Asia have been started by individuals in the highest 33 percent income range. These regions
Algeria, Palestine, Botswana, Iran and Angola are all factor-driven countries.
Family and friends were the primary source of funding for 41.5% of youth businesses in Asia Pacific and South Asia.
Lowest 33% Middle 33% Highest 33%
18 - 34 35 - 64 18 - 34 35 - 64 18 - 34 35 - 64
Latin Americaand Caribbean
20.5% 22.5% 31.6% 29.2% 47.9% 48.4%
Middle Eastand North Africa
35.9% 33.4% 32.5% 29.9% 31.6% 36.6%
Sub-Saharan Africa 27.9% 25.2% 36.3% 36.2% 35.8% 38.6%
Asia Pacificand South Asia
20.5% 25.5% 28.9% 27.2% 50.5% 47.3%
TEA by level of income range, age and region
Table 2.6
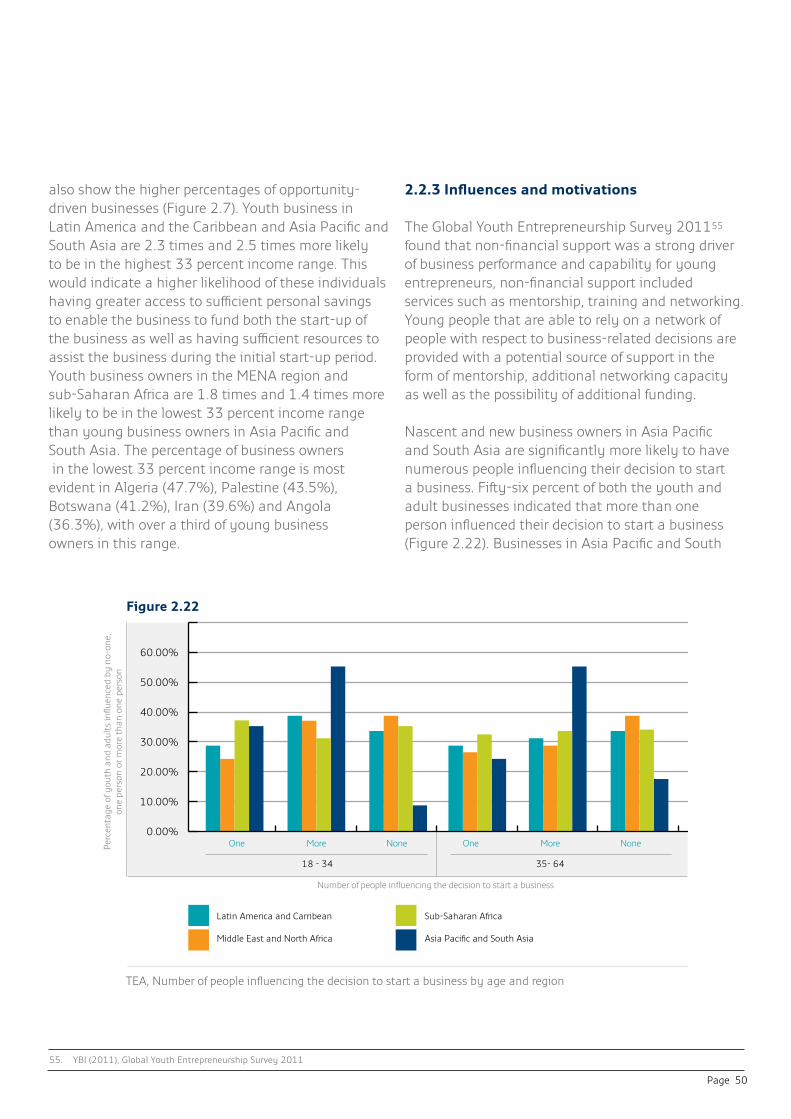
Page 50
also show the higher percentages of opportunity-driven businesses (Figure 2.7). Youth business in Latin America and the Caribbean and Asia Pacific and South Asia are 2.3 times and 2.5 times more likely to be in the highest 33 percent income range. This would indicate a higher likelihood of these individuals having greater access to sufficient personal savings to enable the business to fund both the start-up of the business as well as having sufficient resources to assist the business during the initial start-up period. Youth business owners in the MENA region and sub-Saharan Africa are 1.8 times and 1.4 times more likely to be in the lowest 33 percent income range than young business owners in Asia Pacific and South Asia. The percentage of business owners in the lowest 33 percent income range is most evident in Algeria (47.7%), Palestine (43.5%), Botswana (41.2%), Iran (39.6%) and Angola (36.3%), with over a third of young business owners in this range.
2.2.3 Influences and motivations
The Global Youth Entrepreneurship Survey 201155 found that non-financial support was a strong driver of business performance and capability for young entrepreneurs, non-financial support included services such as mentorship, training and networking. Young people that are able to rely on a network of people with respect to business-related decisions are provided with a potential source of support in the form of mentorship, additional networking capacity as well as the possibility of additional funding.
Nascent and new business owners in Asia Pacific and South Asia are significantly more likely to have numerous people influencing their decision to start a business. Fifty-six percent of both the youth and adult businesses indicated that more than one person influenced their decision to start a business (Figure 2.22). Businesses in Asia Pacific and South
TEA, Number of people influencing the decision to start a business by age and region
55. YBI (2011), Global Youth Entrepreneurship Survey 2011
Figure 2.22
Number of people influencing the decision to start a business
Perc
enta
ge o
f you
th a
nd a
dult
s in
fluen
ced
by n
o-on
e,
one
pers
on o
r mor
e th
an o
ne p
erso
n
Figure 2.22: TEA, Number of people influencing the decision to start a business by age and region
0.00%
10.00%
20.00%
30.00%
40.00%
50.00%
60.00%
One More None
18 - 34
One More None
35- 64
Latin America and Carribean
Middle East and North Africa
Sub-Saharan Africa
Asia Pacific and South Asia
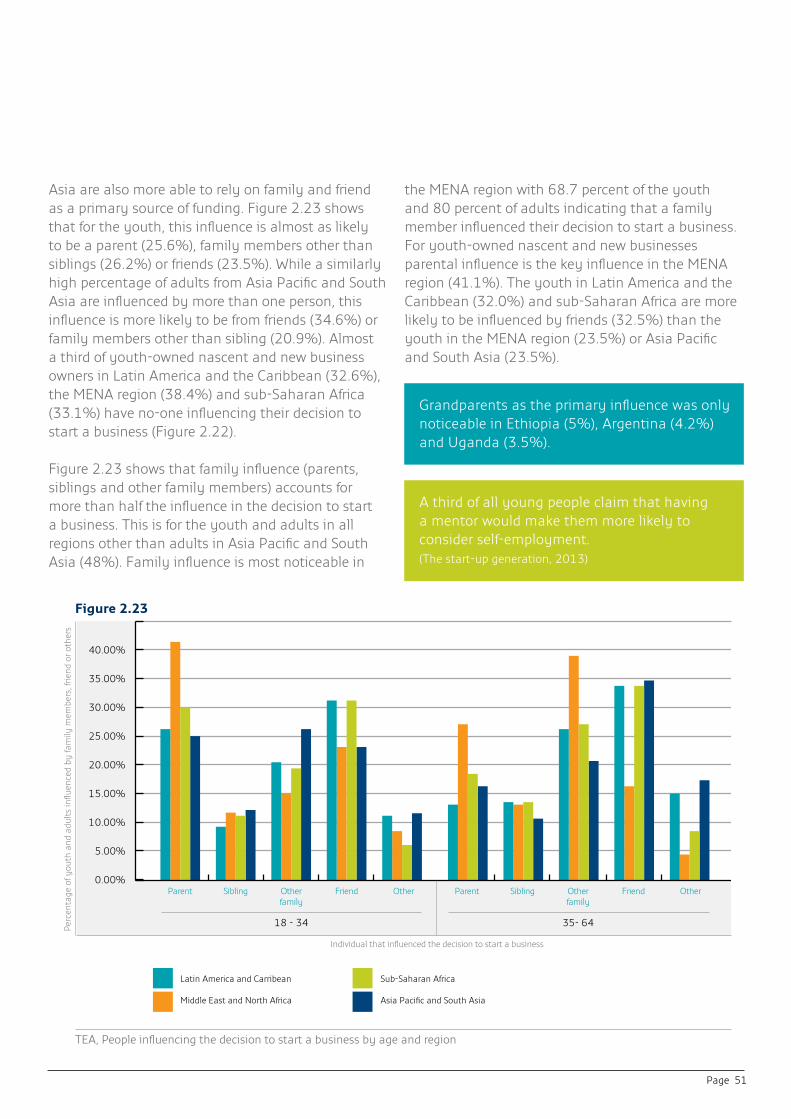
Page 51
Asia are also more able to rely on family and friend as a primary source of funding. Figure 2.23 shows that for the youth, this influence is almost as likely to be a parent (25.6%), family members other than siblings (26.2%) or friends (23.5%). While a similarly high percentage of adults from Asia Pacific and South Asia are influenced by more than one person, this influence is more likely to be from friends (34.6%) or family members other than sibling (20.9%). Almost a third of youth-owned nascent and new business owners in Latin America and the Caribbean (32.6%), the MENA region (38.4%) and sub-Saharan Africa (33.1%) have no-one influencing their decision to start a business (Figure 2.22).
Figure 2.23 shows that family influence (parents, siblings and other family members) accounts for more than half the influence in the decision to start a business. This is for the youth and adults in all regions other than adults in Asia Pacific and South Asia (48%). Family influence is most noticeable in
the MENA region with 68.7 percent of the youth and 80 percent of adults indicating that a family member influenced their decision to start a business. For youth-owned nascent and new businesses parental influence is the key influence in the MENA region (41.1%). The youth in Latin America and the Caribbean (32.0%) and sub-Saharan Africa are more likely to be influenced by friends (32.5%) than the youth in the MENA region (23.5%) or Asia Pacific and South Asia (23.5%).
Grandparents as the primary influence was only noticeable in Ethiopia (5%), Argentina (4.2%) and Uganda (3.5%).
A third of all young people claim that having a mentor would make them more likely to consider self-employment.(The start-up generation, 2013)
TEA, People influencing the decision to start a business by age and region
Figure 2.23
Individual that influenced the decision to start a business
Perc
enta
ge o
f you
th a
nd a
dult
s in
fluen
ced
by fa
mily
mem
bers
, frie
nd o
r oth
ers
Figure 2.23: TEA, Influenced the decision to start a business by age and region
0.00%
5.00%
10.00%
15.00%
20.00%
25.00%
30.00%
35.00%
40.00%
18 - 34
Parent Sibling Other family
Friend Other
35- 64
Parent Sibling Other family
Friend Other
Latin America and Carribean
Middle East and North Africa
Sub-Saharan Africa
Asia Pacific and South Asia
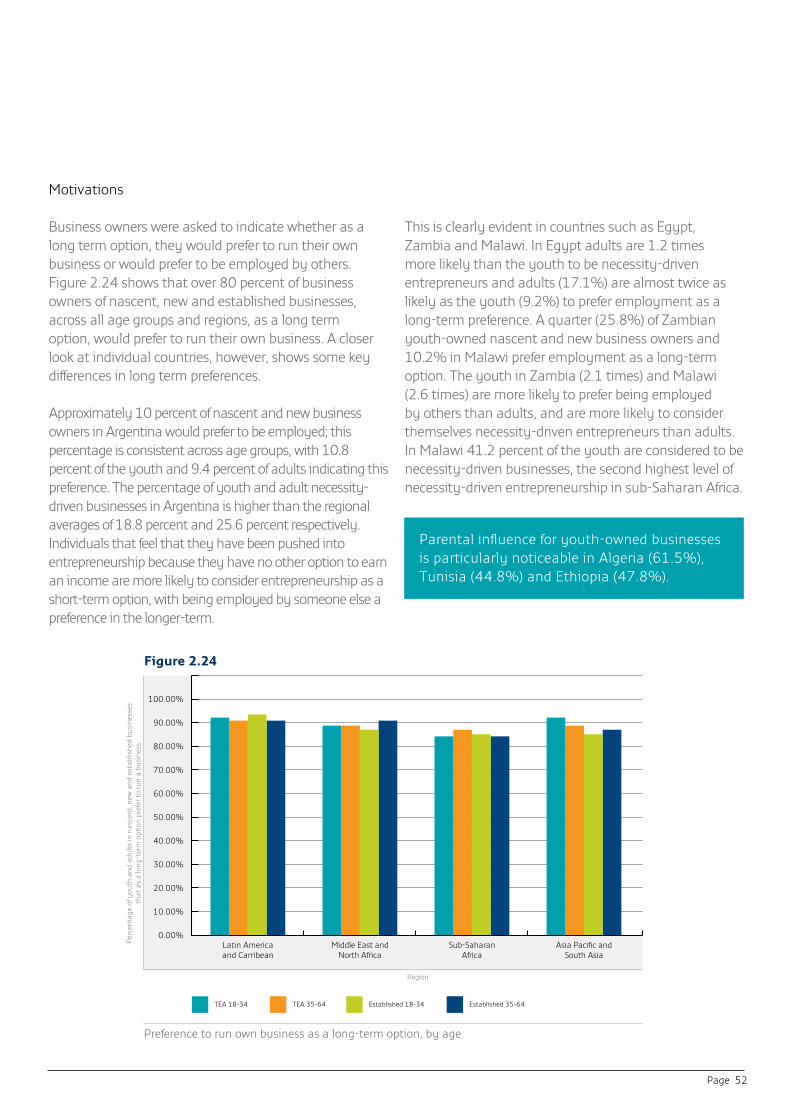
Page 52
Motivations
Business owners were asked to indicate whether as a long term option, they would prefer to run their own business or would prefer to be employed by others. Figure 2.24 shows that over 80 percent of business owners of nascent, new and established businesses, across all age groups and regions, as a long term option, would prefer to run their own business. A closer look at individual countries, however, shows some key differences in long term preferences.
Approximately 10 percent of nascent and new business owners in Argentina would prefer to be employed; this percentage is consistent across age groups, with 10.8 percent of the youth and 9.4 percent of adults indicating this preference. The percentage of youth and adult necessity-driven businesses in Argentina is higher than the regional averages of 18.8 percent and 25.6 percent respectively. Individuals that feel that they have been pushed into entrepreneurship because they have no other option to earn an income are more likely to consider entrepreneurship as a short-term option, with being employed by someone else a preference in the longer-term.
This is clearly evident in countries such as Egypt, Zambia and Malawi. In Egypt adults are 1.2 times more likely than the youth to be necessity-driven entrepreneurs and adults (17.1%) are almost twice as likely as the youth (9.2%) to prefer employment as a long-term preference. A quarter (25.8%) of Zambian youth-owned nascent and new business owners and 10.2% in Malawi prefer employment as a long-term option. The youth in Zambia (2.1 times) and Malawi (2.6 times) are more likely to prefer being employed by others than adults, and are more likely to consider themselves necessity-driven entrepreneurs than adults. In Malawi 41.2 percent of the youth are considered to be necessity-driven businesses, the second highest level of necessity-driven entrepreneurship in sub-Saharan Africa.
Preference to run own business as a long-term option, by age
Region
Perc
enta
ge o
f you
th a
nd a
dult
s in
nas
cent
, new
and
est
ablis
hed
busi
ness
es
that
as
a lo
ng-t
erm
opt
ion
pref
er t
o ru
n a
busi
ness
Figure 2.24: TEA, as a long term option, prefer to run your own business by age and region
0.00%
10.00%
20.00%
30.00%
40.00%
50.00%
60.00%
70.00%
80.00%
90.00%
100.00%
TEA 18-34 TEA 35-64 Established 18-34 Established 35-64
Latin America and Carribean
Middle East and North Africa
Sub-Saharan Africa
Asia Pacific and South Asia
Figure 2.24
Parental influence for youth-owned businesses is particularly noticeable in Algeria (61.5%), Tunisia (44.8%) and Ethiopia (47.8%).
Page 53
Chapter 3
So what do we know about young entrepreneursin the various regions?
European Union
• Only 17.3 percent of the youth indicate that they have both the belief that there are good business opportunities as well as the belief that they have the skills and knowledge required to start a business.
• Only 9.2 percent of the youth are involved in either nascent or new businesses.
• The majority of youth businesses are opportunity-driven.
• High levels of fear of failure with almost half (49.2%) of the older youth and 43 percent of the young youth indicating that fear of failure would prevent them from starting a business.
• This region has the lowest percentage (61.2%) of the youth that believe that starting a business is a good career choice.
• Youth nascent and new businesses in Europe are not overly concentrated in retail, hotel and restaurant sector and are well represented in the information sector.
• Below average percentage of youth new or nascent business owners with high growth expectations (6.6%) i.e. expect to offer employment to 20+ people within the next 5 years.
Non-European Union
• Only 17.4 percent of the youth indicate that they have both the belief that there are good business opportunities as well as the belief that they have the skills and knowledge required to start a business.
• Only 8.5 percent of the youth are involved in either nascent or new businesses.
• A third (32.4%) of these businesses are necessity-driven (32.4%).
• High levels of fear of failure with 39.4 percent of the older youth and 33.5 percent of the young youth indicating that fear of failure would prevent them from starting a business.
• A third of the youth (35.6%) are involved in the retail, hotel and restaurant sector.
• Lowest percentage of youth nascent and new businesses that have a maximum of one employee.
• Almost 12 percent of youth new or nascent businesses have high growth expectations, i.e. expect to offer employment to 20+ people within the next 5 years.
Sub-Saharan Africa
• Sixty percent of the youth indicate that they have both the belief that there are good business opportunities as well as the belief that they have the skills and knowledge required to start a business.
• Highest percentage of young people involved in nascent and new businesses (29%), however approximately a third of all young new and nascent business owners’ necessity-driven.
• Low levels of fear of failure with only 25 percent of the youth indicating that fear of failure would prevent them from starting a business.
• Three-quarters of the youth believe that starting a business is a good career choice.
• Although this region has the highest percentage of youth TEA, the majority (85.5%) of the businesses have low growth potential i.e. less than 5 employees expected in the next 5 years and only 3.9 percent of the youth indicated high growth potential i.e. intend creating 20+ jobs over the next 5 years.
• The large majority (65%) of nascent or new youth businesses operate in the retail, hotel and restaurant sector.
• Less than half (45%) of young people have completed secondary school.
• Young people in this region are least likely to make use of an on-line trading environment.
• Three-quarters (77.7%) of new or nascent businesses are primarily reliant on personal/family or friends for funding to start a business.
• Young nascent and new businesses in this region are quite reliant on family and friend as customers. Forty percent of the businesses indicated that between 25 and 100 percent of their customers were family and friends.

Page 54
• The lack of business-related role models is evident in that a third of young people had no-one influencing their decision to start a business.
• Friends are an important influence, with over a third of young business owners indicting that friends had influenced their decision to start a business.
• Young nascent and new business owners, as a long term option, would prefer to continue to run their own business. This preference is least prevalent in this region.
Latin America and the Caribbean
• Almost 40 percent of the youth indicate that they have both the belief that there are good business opportunities as well as the belief that they have the skills and knowledge required to start a business.
• Almost a fifth (18%) of the youth are involved in nascent or new businesses with less than a fifth (18%) of these businesses being necessity-driven.
• Thirty percent of young people indicated that fear of failure would prevent them from starting a business.
• Three quarters of young people in this region believe that starting a business is a good career choice.
• Seven percent of youth owned nascent or new business owners indicated high growth potential i.e. intend to create 20+ jobs in the next 5 years.
• The retail, hotel and restaurant sector is the most popular sector for youth business (44.6%). Four percent of the youth are active in the information sector.
• Three-quarters (75.7%) of new or nascent businesses are primarily reliant on personal/family or friends for funding to start a business.
• Young nascent and new businesses in this region are most reliant on family and friend as customers. Almost a quarter of the businesses indicated that between 75 and 100 percent of their customers where family and friends.
• The lack of business-related role models is evident in that a third of the youth had no-one influencing their decision to start a business.
• Friends are an important influence, with over a third of young business owners indicting that friends had influenced their decision to start a business.
• Young nascent and new business owners, as a long term option, would prefer to continue to run their own business.
Asia Pacific and South Asia
• Only 16.8 percent of the youth indicate that they have both the belief that there are good business opportunities as well as the belief that they have the skills and knowledge required to start a business.
• Ten percent of the youth are involved in either nascent or new businesses.
• The majority (80%) of youth businesses are opportunity-driven.
• Forty percent of the youth indicated that fear of failure would prevent them from starting a business.
• Just over 60 percent (61.2%) of the youth believe that starting a business is a good career choice.
• The youth (68%) in this region are least likely to believe that successful new business owners receive high status.
• Almost 9 percent of the youth involved in new and nascent businesses have high growth expectations i.e. intend creating 20+ jobs in the next 5 years.
• Over half (53.8%) of the youth in this region have at least a post-secondary school degree; this is the highest percentage in all regions.
• The youth in this region are most likely to make use of an on-line trading environment.
• While three-quarters (73.2%) of new or nascent businesses are reliant on personal/family or friends for funding to start a business, family and friends are the primary source of funding (41.5%) in this region.
• Young nascent or new businesses in this region are least reliant on friends or family as customers, with 29 percent indicating that none of their customers friends or family.
• The youth in this area have a number of people influencing their decision to start a business.

Page 55
• Young nascent and new business owners, as a long term option, would prefer to continue to run their own business.
MENA region
• Thirty percent of the youth indicate that they have both the belief that there are good business opportunities as well as the belief that they have the skills and knowledge required to start a business.
• Less than ten percent of the youth are involved in nascent or new businesses and approximately a third (35.5%) of these are necessity – driven.
• A third of young people (35%) indicated that fear of failure would prevent them from starting a business.
• Three quarters of young people in this region believe that starting a business is a good career choice.
• High growth expectations are indicated by 6.3 percent of the youth involved in new and nascent businesses.
• Less than half the youth in this region operate in the retail, hotel and restaurant sector with 44.1% (18 – 24 years old) and 33.3 percent (25 – 34 years old) of nascent or new businesses operating in this sector.
• A fifth (21.9%) of the youth-owned new or nascent businesses indicated that they are innovative i.e. that they offer new products in new markets.
• Young nascent or new business owners in this region are the least innovative, with 18.6 percent (18 – 24 year olds) and 20.6% (25 – 34 year olds) indicating that they offer new products in new markets.
• Just fewer than 70% of youth-owned new or nascent businesses are reliant on personal/family or friends for funding to start a business, of which a quarter (26.1%) is reliant on family and friends as the primary source of funding.
• Twenty percent of young nascent or new businesses indicated that none of their customers friends or family.
• The lack of business-related role models is evident in that a third of the youth had no-one influencing their decision to start a business. However, of those that are influenced to start a business, over 40 percent indicated that parental influence in key.
• Young nascent and new business owners, as a long term option, would prefer to continue to run their own business.
USA
• A quarter of young people (24.9%) in this region indicated that they have both the belief that there are good business opportunities as well as the belief that they have the skills and knowledge required to start a business.
• Thirteen percent of the youth are involved in nascent or new businesses with over three-quarters (77.1%) of these involved in opportunity-driven businesses.
• Nascent and new businesses in this region are spread across a number of regions, with a quarter of youth businesses involved in the retail, hotel and restaurant, 6.8 percent involved in the information sector and 9.3 percent operating in the financial sector.
• This region has the highest percentage (12.6%) of youth new or nascent business owners with high growth expectations i.e. expect to offer employment to 20+ people within the next 5 years.
• Young nascent or new business owners in this region are the most innovative, with 35 percent of the youth indicating that they offer new products in new markets.
• Over half (51.8%) of young people have at least a post-secondary school degree.

Page 56
Youth unemployment is currently a concern for all regions. The long-term negative impact of youth unemployment has been well-documented, and youth frustrations have seen an increase in unrest in various areas across the globe. Polices that focus on youth and in particular that focus on improving work opportunities for young people are imperative. The recommendations indicated below are recommended policy areas by region where interventions could either: create a more enabling environment for young
entrepreneurs, such as better equipping young people to see entrepreneurship as a viable career option or improving entrepreneurial education; or enable youth job creation, such as encouraging high growth expectations amongst young entrepreneurs.
Non-European Union:• Low level of potential entrepreneurs• Education• Fear of failure• Media coverage
Latin Americaand the Caribbean:• Tertiary education• Mentorship programmes• Access to finance• High growth expectations• Trading spaces
European Union:• Low level of potential entrepreneurs• Fear of failure • Education• Media Coverage • High growth expectations
Sub-Saharan Africa• Education, both secondary and tertiary• Internet access• Access to finance• Mentorship programmes• Growth expectations• Sector distribution• Trading spaces
Asia Pacific and South Asia• Low level of potential entrepreneurs• Fear of failure• Entrepreneurship as a good career choice• Status of business owners
MENA• Media Coverage• Fear of failure• Innovative-businesses• Education• High-growth expectations

Page 57
Conclusions
It is important to remember that globally economies are constrained by levels of unemployment not seen since the great depression. The high levels of unemployment and debt as well as and low levels of growth is affecting not only the developing world but, the impact is currently as noticeable, and in many cases, more noticeable in the developed world. Sluggish growth, high unemployment and persistently high debt levels have created a global perception of negativity. Within this environment, it is even more difficult for governments to work towards limiting the negative and possibly long-term effects of youth unemployment. The financial crisis has had an enormous impact on the global employment and business environment. The ability of young people to perceive good business opportunities in this climate is challenging, however governments, the media and educational institutions need to manage young people’s expectations, without which, young people are less likely to see themselves as potential entrepreneurs.
GEM clearly indicates that it is difficult to make direct comparisons between countries with respect to entrepreneurial development as countries have a particular cultural, economic, political and social structure that influences the entrepreneurial climate in which businesses operate. The recommendations for the youth in the various regions are therefore fairly general as there is considerable diversity amongst the youth even within each region.
The recommendations below attempt to highlight key areas where attention could improve various facets that hinder the likelihood of increased rates of entrepreneurial activity on the youth.
Entrepreneurial Attitudes
Population-wide attitudes with respect to the perception of good opportunities, perception of skills and knowledge required to start a business and fear of failure as an inhibitor as well as and societal
support for this activity are important indicators of potential entrepreneurs. Societal support for entrepreneurship is influenced by society’s perception of entrepreneurship. This includes societal impressions about entrepreneurship as a career choice, whether entrepreneurs are afforded high status and whether they receive positive media attention. This assesses the visibility and attractiveness of entrepreneurship. Positive views on these measures assist in making entrepreneurship more attractive within the community and therefore influence the willingness of individuals to become entrepreneurs
Potential entrepreneurs are individuals who have not embarked in any specific actions to start an enterprise, but believe they have the skills and knowledge to start a business and believe that there are plenty of opportunities to start a business. GEM has also found that individuals who are confident that they possess the skills to start a business are four to six times more likely to be involved in entrepreneurial activity.
In sub-Saharan Africa positive attitudes toward entrepreneurship are generally high amongst the youth and entrepreneurship is a more common source of generating income. The youth see this activity as a viable career option and are more prepared to start a business. This region has high levels of youth potential entrepreneurs as well as the highest percentage of youth TEA, the percentage of the youth involved in nascent and new businesses. However, these businesses are more likely to be in the retail sector, necessity-based and low growth businesses. The retail sector is often over-traded as entry to this sector is easy and can be characterised by a large number of undifferentiated businesses.
In the European Union, non-European union and Asia less than a fifth of the youth can be considered potential entrepreneurs. As the perception of good opportunities and having the required skills and knowledge are often the beginnings of an

Page 58
entrepreneurial process for an individual, policies and practices that increase the number of potential youth entrepreneurs are important. In all these regions, educational level are high with the majority of young people completing secondary schooling and a considerable number continuing with post-secondary degrees. However, the high percentage of young people indicating that fear of failure is preventing them from starting a business, as well as the low percentage of young people indicating that they do not believe that they have the skills to start a business, suggests that the type of education being offered is not preparing young people for an entrepreneurial career path. A further concern is the low percentage of young people that believe that starting a business is a good career choice. These regions are in need of initiatives that focus on identifying, developing and motivating potential entrepreneurs as well as improving societal-wide attitudes to support these individuals.
Educational institutions, as well as the media will need to focus on promoting business as a viable career path, with a particular focus on successful youth-owned businesses. The media needs to question the regularity with which it showcases positive youth entrepreneurial role-models and the quantity of news space given to the role and importance of entrepreneurs with respect to economic development and job creation. Attitudes can mirror current conditions, and this can clearly be seen by the particularly low levels of potential entrepreneurs and the lack of positive attitudes to entrepreneurship in countries such as Greece and Spain. These countries continue to be severely affected by the financial crisis. Media institutions need to focus on instilling a more positive attitude in the youth by focusing on young people that have identified and pursued opportunities regardless of the pessimism surrounding these economies. Perceptions are powerful tools and the media is perfectly positioned to impact on the pessimistic or more positive attitudes within an economy.
Education
GEM research has consistently rated entrepreneurship education at primary and secondary school levels as poor. This seems to indicate that regardless of the level of education within economies, the type of education offered does not seem to promote entrepreneurship. Given the high level of youth unemployment as well as the number of unemployed graduates, focusing on providing an education that allows young people to be both future employees as well as future employers is critical.
Education in the European Union, non-European union, MENA and Asia needs to focus on minimising the mismatch in skills to ensure that the youth are leaving educational institutions with skills required in the workplace. A further focus should be on enabling the youth to develop skills necessary to perceive opportunities within business environments. In sub-Saharan Africa the focus on education needs to be on improving literacy levels, increasing the number of individuals with at least a post-secondary schooling degree and ensuring that the throughput of young people through secondary schooling increases is an imperative.
Job creation and Growth expectations
Job creation is on the mind of nearly every policy maker in all parts of the world. High growth businesses are key employment drivers but require significantly different support to smaller and particularly micro businesses. Youth in all the regions other than sub-Saharan Africa showed higher levels of either medium or high growth expectations. These expectations need to be supported through policy interventions that that focus on high growth businesses. These interventions may well be more resource intensive, and may demand a shift in support from generic support for all small businesses to focussed support for high growth businesses. The

Page 59
2007 Global Report on High-Growth Entrepreneurship highlights the importance of alleviating regulatory burdens that become more cumbersome as organisations grow, and suggest a honeymoon period which provides a time period before firms need to comply with the additional compliance requirements. The report also cautions against creating regulatory traps that deter entrepreneurial firms from growing beyond certain size56.
Access to finance
GEM has shown that, in most regions, entrepreneurial finance is not considered to be a factor that most negatively impacts on entrepreneurial development; however it is rarely cited as a positive factor enabling entrepreneurial development. It is important to remember there is still a significant reliance of youth businesses on personal and/or family as the primary source of funding to start a business. In many regions almost three-quarters of funding to start youth businesses comes from personal, family or friends. There is therefore space for policies that allow greater access to funding for youth businesses. By easing access to finance, economies could create a more enabling environment for youth businesses. The 2007 GEM Global Report on High-Growth Entrepreneurship emphasises that small businesses and high-growth businesses have different finance requirements, with small businesses needing better access to grants, subsidies and soft loans, while policies that promote R&D loans and innovation grants, business angel finance and venture finance would be more beneficial in promoting high-growth entrepreneurs57.
Mentorship
Although research has shown that the access to and provision of finance is a constraint within the youth sector, other constraints such as the lack of adequate management and financial training
is often as important a barrier. The Global Youth Entrepreneurship Survey 201158 found that non-financial support was a strong driver of business performance and capability for young entrepreneurs, non-financial support included services such as mentorship and networking. The youth in Latin America and the Caribbean as well as sub-Saharan Africa have limited access to people with which to discuss business-related decisions. Mentorship programmes and access to non-financial support in these areas are critical. Mentorship as an important facet to youth business development was also identified by Accenture in their interviews with young entrepreneurs commissioned as part of this report.
Internet capabilities
The internet as a trading space is underutilised by sub-Saharan Africa and only the youth in Asia Pacific and South Asia have made significant in-roads into this trading space. The ability to access larger markets and to access more geographically diverse markets is enhanced with the use of the internet. Internet access, both at educational institutions as well as internet capacity within regions needs to be enhanced to afford the youth the opportunity to develop and expand their businesses beyond localised markets that rely largely on friends and family as a customer base.
56. Erkko A, (2007) 2007 Global Report on High-Growth Entrepreneurship, Babson College, London Business School, and Global Entrepreneurship Research Consortium (GERA)
57. Erkko A, (2007) 2007 Global Report on High-Growth Entrepreneurship58. YBI (2011), Global Youth Entrepreneurship Survey 2011

Page 60
About GEM
Policy makers agree that entrepreneurs both young and old, and the new businesses they establish, play a critical role in the development and well-being of their societies. The purpose of the Global Entrepreneurship Monitor (GEM) is to explore, track and assess the role of entrepreneurship in national economic growth. GEM’s individual-level, multi-phase focus enables a more comprehensive account of business activity than measures of formally registered businesses only. In other words, GEM captures both informal and formal activity that includes those in the process of starting as well as those running new and established businesses. GEM also provides other indicators such as entrepreneurial perceptions and intentions among non-entrepreneurs.
Academics and policy makers are increasingly appreciating and accounting for the role played by new and small businesses in the economy. GEM contributes to this recognition with longitudinal studies and comprehensive analyses of entrepreneurial attitudes and activity across
the globe. Since its inception in 1997 by scholars at Babson College and London Business School, GEM has developed into one of the world’s leading research consortia concerned with improving our understanding of the relationships between entrepreneurship and national development. GEM’s key objectives are as follows:
• to track entrepreneurial attitudes, activity and aspirations within countries to provide annual national assessments of the entrepreneurial sector;
• to allow for comparison of levels of entrepreneurial activity among countries;
• to determine the extent to which entrepreneurial activity influences economic growth within individual countries;
• to identify factors which encourage and/or hinder entrepreneurial activity; and
• to guide the formulation of effective and targeted policies aimed at stimulating entrepreneurship within individual countries.
Appendix 1
About GEM, YBI and Accenture
The GEM modelSource: GEM Global Report, 2011
Figure 1Basic requirements• Institutions• Infrastructure• Macroeconomic stability• Health and primary education
Efficiency enhancers• Higher education and training• Goods market efficiency• Labour market efficiency• Financial market sophistication• Technological readiness• Market size
Innovation and entrepreneurship• Entrepreneurial finance• Government policies• Government entrepreneurship programs• Entrepreneurship education• R&D transfer• Commercial, legal infrastructure for entrepreneurship• Internal market openness• Physical infrastructure for entrepreneurship• Cultural and social norms
Social Economic Development(Jobs, Innovation, Social value)
Established firms
From otheravailable sources
Social, cultural,political context
From GEM NationalExpert Surveys
(Employee Entrepreneurship Activity)
From GEM 2011 Adult Population Surveys (APS)
Entrepreneurship Profile
Attitudes:Perceived opportunities and acabilities: fear and failure: Status of entrepreneurship
Activity:Opportunity/Necessity driven, Early stage; Inclusiveness; Industry; Exits
Aspirations:Growth, InnovationInternational orientationSocial value creation
From GEM Adult Population Surveys (APS)

Page 61
The GEM conceptual model
The GEM model (Figure 1) maintains that, at a national level, the framework conditions that apply to established business activity differ from those that apply to entrepreneurial activity. The performance of larger established firms is influenced by general business conditions, which influence firms’ ability to compete effectively, to start new or ancillary businesses and to create jobs. An additional set of factors, referred to as Entrepreneurial Framework Conditions, influence individuals’ decisions to pursue entrepreneurial initiatives. Both the national and the entrepreneurial framework conditions are dependent on the social, political and economic context in which they exist. These contexts are influential in creating unique business and entrepreneurial environments, and should therefore be taken into account when analysing cross-national differences and national developments over time. The GEM conceptual model is a dynamic entity that is progressively developed to incorporate advances in understanding of the entrepreneurial process and to allow for further exploration of patterns detected in GEM studies.
How GEM measures entrepreneurship
One of the primary objectives of GEM is to measure entrepreneurial activity in a way that allows for meaningful cross-national as well as intra-country comparisons over time. GEM focuses on the role played by individuals in the entrepreneurial process. Every person engaged in any behaviour related to new business creation, no matter how modest, is regarded as having an impact on the national level of entrepreneurship.
Another important feature of the GEM model is that it is concerned with entrepreneurship as a process. The GEM survey collects data on people who are potential entrepreneurs, intentional entrepreneurs, those in the process of setting up new businesses as well as those who own and manage new and established businesses.
The primary measure of entrepreneurship used by GEM is the Total Early-Stage Entrepreneurial Activity (TEA) index. TEA indicates the prevalence of business start-ups (or nascent entrepreneurs) and new firms in the adult (18 - 64 years of age) population – in other words, it captures the level of dynamic early-stage entrepreneurial activity in a country.
GEM methodology
In order to provide for reliable comparisons across countries, GEM data is obtained using a research design that is harmonised over all participating countries. The data is gathered on an annual basis from two main sources:
Adult population survey (APS)
This data set is a survey of the adult population, generally people between the ages of 18 and 64 years, however countries may sample people between the ages of 18 - 99. Each of the participating countries conducts the survey among a random representative sample of at least 2,000 adults. The surveys are conducted at the same time of year (between April and July) using a standardised questionnaire provided by the GEM Global data team. Each national team conducts the survey using a preferred vendor, and the raw data is then sent directly to the Data Team analysts at GERA (Global Entrepreneurship Research Association) for checking and uniform statistical calculations before being made available to the participating countries for analysis and interpretation, and, ultimately, to compile the annual national report.
Accredited research companies in different countries around the world interviewed between 2 000 and 30 000 respondents during May and June 2012 in the 18-64 year old age cohort. The questionnaire is translated into the local languages. To ensure that the sample is representative, area stratified probability sampling is used. The sample is stratified by gender, age and population group, and where appropriate by region and community size. Metro,

Page 62
cities and large towns, small towns and villages, and rural – are also used. Certain countries may use national, non-stratified survey designs.
National experts survey (NES)
The national experts’ survey is an important component of GEM as it provides insights into the entrepreneurial climate in each country. Four experts from each of the entrepreneurial framework condition categories must be interviewed, making a minimum total of 36 experts per country. Out of this sample, a minimum of 255 must be entrepreneurs or business owners and 50% must be professionals.
Additional aspects such as geographical distribution, gender, public versus private sector and the level of experience are also taken into account in selecting the sample.
The information is used to add context to the report and to explain the relationship between entrepreneurial activity and economic growth. Additional sources of data
In addition to the annual surveys, GEM also makes use of standardised data from international data sources such as the World Bank, the World Economic Forum and the United Nations. These data are used to determine the relationship between entrepreneurial activity and national economic growth.www.gemconsortium.org
Youth specific survey
For this Youth GEM report, YBI devised an additional youth questionnaire, with advice from the World Bank, focused on priority issues, to provide deeper insight into the barriers that young entrepreneurs face, their enablers, motivations and inspirations. According to the GEM business model, this questionnaire was optional for GEM National Teams.
About Accenture
Accenture is a global management consulting, technology services and outsourcing company, with approximately 266,000 people serving clients in more than 120 countries. Combining unparalleled experience, comprehensive capabilities across all industries and business functions, and extensive research on the world’s most successful companies, Accenture collaborates with clients to help them become high-performance businesses and governments.
Skills to Succeed is Accenture’s global corporate citizenship initiative, which focuses on advancing employment and entrepreneurship opportunities in both mature and emerging markets. By 2015, we plan to equip 500,000 people around the world with the skills to get a job or build a business. To achieve this, Accenture will continue to work with strategic partners that share its skills-building goals. Current partners include Junior Achievement, Plan International, Save the Children and Youth Business International, among other organizations. Additionally, the company offers its people volunteering and pro bono opportunities and expands its impact by replicating and scaling successful initiatives. Since 2010, Accenture and the Accenture Foundations have contributed more than $100 million dollars to support the company’s corporate citizenship efforts, through a combination of cash plus Accenture time and skills.www.accenture.com
Case Study Methodology
Accenture collaborated with YBI to develop practitioner-based case studies that build on the key themes and data from the report. Developed following a series of interviews with YBI Member entrepreneurs and CEOs, the case studies focus on three core themes: Enabling Youth Entrepreneurship; Influencing Youth Entrepreneurship and Youth Entrepreneurship and Innovation.

Page 63
About Youth Business International (YBI)
Network approach
Youth Business International is a global network of independent non-profit initiatives helping young people to start and grow their own business and create employment. YBI members assist under-served young entrepreneurs with a combination of training, access to capital and mentoring. They adapt this common approach to their local context, working in partnership with governments, businesses and multilateral and civil society organisations.www.youthbusiness.org
YBI-GEM joint venture
YBI initiated a joint venture with GEM to enable the first GEM study on youth entrepreneurship specifically. The goal of the research collaboration is to increase understanding of what constrains, motivates and assists young entrepreneurs in the entrepreneurial process to inform more effective practice and policy in youth entrepreneurship, guiding how practitioners can best support young people to start and grow successful businesses and how policymakers and donors can best catalyse the role that youth entrepreneurship can play in economic and social development.
EMPOWERMENT
STRONGER COMMUNITIES
TRAINING
MENTORING
ACCESS TO CAPITAL
JOB CREATION
YOUNG PEOPLE AGED 18-35 WHO LACK THE
MEANS TO START THEIR OWN BUSINESS
CONTACT THEIR LOCAL YBI MEMBER
WHO BUILD THEIR SKILLS AND LINK THEM WITH THE SUPPORT AND
FINANCE THEY NEED
TRANSFORMING THEIR LIVES AND
THE LIVES OF THOSE AROUND THEM
QUIC
K FA
CTYOUTH
UNEMPLOYMENT RATE IN
NORTH AFRICA
27.9%
OUR APPROACH: All around the world, YBI members use a tried and tested approach, adapted to their local context, to provide
support for under-served young people and help them succeed in business.

Page 64
Appendix 2
Detailed tables of country specific data
Sees good opportunities for starting a business in
the next 6 months 59
Has the required knowledge or skills to
start a business 60
Fear of failure would prevent you to start a
business* 61
18-34 35-64 18-34 35-64 18-34 35-64
Latin America and Caribbean
Argentina 53.5% 47.1% 61.6% 65.1% 26.5% 27.5%
Barbados 50.2% 44.1% 68.0% 71.4% 19.6% 14.9%
Brazil 53.1% 51.8% 53.0% 54.8% 28.6% 33.3%
Chile 68.9% 61.7% 57.6% 61.7% 26.4% 29.4%
Colombia 70.4% 73.0% 53.2% 59.5% 28.3% 35.2%
Costa Rica 46.7% 47.6% 60.5% 66.1% 37.2% 33.3%
Ecuador 60.9% 56.4% 72.6% 71.7% 31.9% 33.8%
El Salvador 44.4% 41.0% 55.6% 61.6% 42.1% 41.3%
Mexico 46.3% 43.8% 60.3% 64.3% 26.8% 24.5%
Panama 38.0% 38.9% 42.2% 44.3% 18.7% 15.0%
Peru 59.2% 54.7% 66.5% 64.4% 31.1% 29.6%
Trinidad & Tobago 61.6% 57.2% 78.2% 74.2% 14.8% 18.4%
Uruguay 54.2% 48.6% 54.4% 60.3% 28.2% 26.3%
Regional 54.4% 51.2% 60.3% 63.0% 27.7% 27.9%
Middle East and North Africa
Algeria 44.7% 46.7% 58.1% 50.2% 33.4% 37.3%
Egypt 52.8% 54.8% 59.5% 57.7% 35.9% 29.6%
Iran 41.7% 35.6% 57.8% 49.2% 40.9% 42.3%
Israel 35.8% 26.3% 27.8% 30.5% 46.9% 46.7%
Palestine 47.5% 44.2% 62.1% 55.4% 41.1% 38.8%
Tunisia 35.2% 29.8% 65.1% 59.1% 14.1% 15.8%
Regional 42.9% 39.6% 55.1% 50.3% 35.4% 35.1%
Sub-Saharan Africa
Angola 64.1% 69.0% 69.8% 75.3% 35.8% 40.6%
Botswana 66.8% 66.5% 70.7% 70.4% 24.2% 25.8%
Ethiopia 67.6% 61.5% 74.7% 62.2% 31.4% 34.4%
Ghana 79.8% 78.6% 85.1% 87.7% 20.2% 15.7%
Malawi 74.9% 73.1% 86.2% 81.6% 11.1% 14.7%
Namibia 76.0% 74.1% 75.0% 72.5% 34.2% 36.6%
Nigeria 82.4% 82.0% 85.9% 90.2% 22.1% 19.8%
South Africa 38.9% 31.7% 39.5% 39.5% 29.4% 32.2%
Uganda 81.0% 80.1% 88.3% 86.6% 14.1% 17.3%
Zambia 77.6% 78.3% 82.9% 85.1% 17.8% 15.1%
Regional 70.9% 69.5% 75.8% 75.1% 24.0% 25.2%
59. Section 2.1, Figure 2.1: Sees good opportunities by region over age60. Section 2.1, Figure 2.2: Has the required knowledge to start business by
region over age
61. Section 2.1, Figure 2.13: Fear of failure by age and region
* Only among those who perceive opportunity to start a business

Page 65
Sees good opportunities for starting a business in
the next 6 months 59
Has the required knowledge or skills to
start a business 60
Fear of failure would prevent you to start a
business* 61
18-34 35-64 18-34 35-64 18-34 35-64
Asia Pacific and South Asia
China 37.1% 29.8% 39.1% 36.8% 29.9% 39.5%
Japan 7.8% 5.7% 7.0% 10.0% 58.7% 49.4%
Korea 16.4% 10.4% 17.5% 32.0% 46.5% 40.1%
Malaysia 35.8% 35.6% 29.2% 32.5% 36.0% 36.7%
Pakistan 46.7% 46.2% 49.6% 47.6% 33.3% 28.4%
Singapore 26.3% 20.4% 25.8% 27.0% 38.1% 44.2%
Taiwan 44.1% 35.2% 19.5% 30.5% 35.2% 39.5%
Thailand 49.7% 41.3% 49.4% 43.7% 49.9% 50.2%
Regional 33.0% 28.1% 29.6% 32.5% 40.9% 41.0%
European Union
Austria 51.0% 48.4% 41.8% 53.5% 42.5% 32.6%
Belgium 32.1% 33.9% 33.8% 38.8% 49.8% 36.2%
Denmark 51.5% 40.9% 27.6% 32.8% 46.3% 34.9%
Estonia 57.4% 37.0% 43.2% 43.2% 28.7% 40.6%
Finland 57.5% 54.2% 28.1% 37.6% 40.8% 34.2%
France 44.5% 33.7% 32.8% 37.2% 48.5% 38.7%
Germany 40.5% 34.1% 31.0% 39.9% 40.5% 42.7%
Greece 15.0% 11.5% 47.1% 51.9% 66.6% 56.4%
Hungary 12.6% 10.0% 37.7% 41.1% 26.8% 39.6%
Ireland 29.4% 22.7% 41.9% 47.6% 37.9% 32.9%
Italy 22.3% 18.7% 33.2% 28.5% 61.7% 55.5%
Latvia 44.0% 26.0% 45.9% 42.1% 38.4% 35.0%
Lithuania 44.9% 21.1% 37.2% 41.4% 35.4% 36.3%
Netherlands 37.9% 32.7% 34.7% 45.9% 36.1% 27.2%
Poland 27.4% 15.7% 55.9% 52.6% 46.1% 40.3%
Portugal 19.4% 14.1% 44.7% 48.2% 46.2% 38.8%
Romania 43.7% 31.2% 40.9% 36.5% 37.9% 44.2%
Slovakia 24.6% 13.3% 52.0% 48.2% 38.6% 37.9%
Slovenia 23.5% 17.5% 50.8% 51.6% 28.7% 26.2%
Spain 16.0% 12.7% 48.2% 51.6% 45.1% 39.4%
Sweden 69.8% 64.5% 29.3% 41.2% 35.6% 30.7%
UK 32.3% 33.1% 41.7% 50.3% 42.7% 31.9%
Regional 36.2% 28.5% 40.0% 43.7% 41.9% 37.8%
Non-European Union
Bosnia and Herzegovina
23.5% 17.2% 50.8% 48.1% 26.5% 27.3%
Croatia 21.0% 15.0% 43.4% 44.4% 34.9% 37.0%
Macedonia 34.4% 28.4% 61.8% 50.7% 36.3% 42.0%
Norway 59.0% 67.3% 24.1% 40.0% 43.3% 37.6%
Russia 24.6% 17.0% 26.0% 21.9% 45.0% 48.0%
Switzerland 27.7% 40.0% 21.7% 45.4% 37.2% 30.4%
Turkey 43.2% 37.1% 51.4% 47.8% 27.7% 33.0%
Regional 33.4% 31.7% 39.9% 42.6% 35.8% 36.5%
USAUSA 43.3% 43.6% 46.2% 61.4% 31.4% 32.9%
Regional 43.3% 43.6% 46.2% 61.4% 31.4% 32.9%
Regional average is unweighted
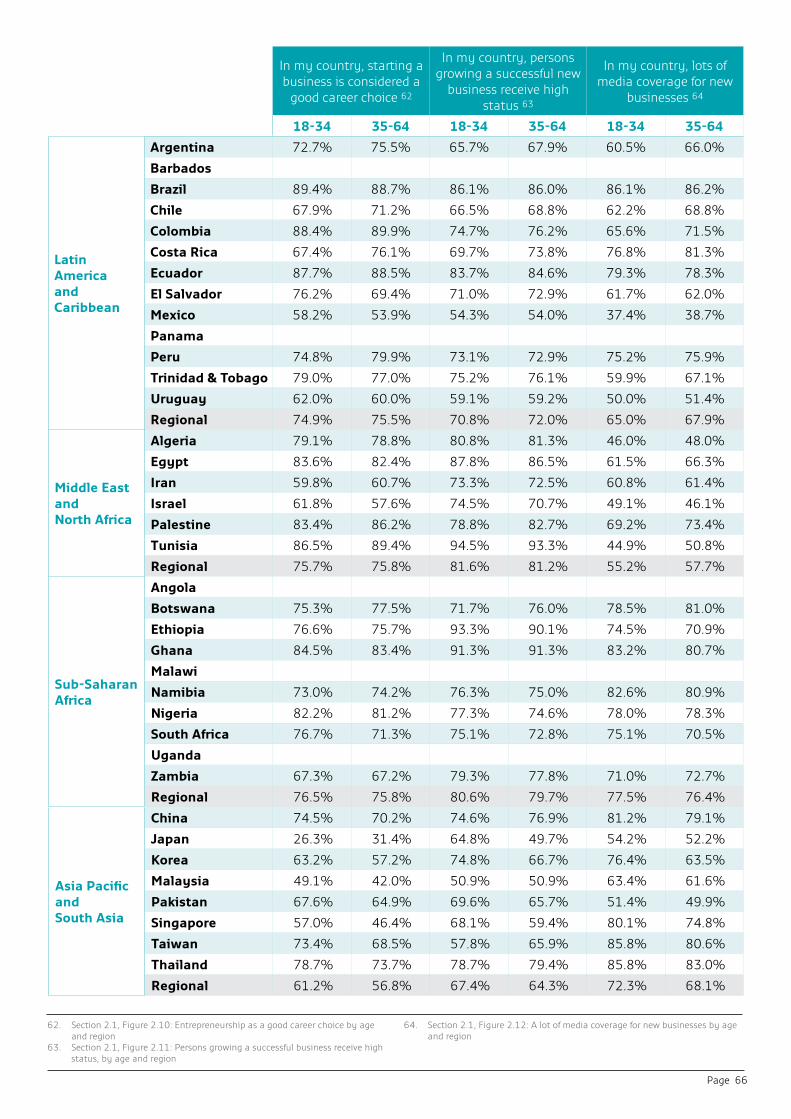
Page 66
In my country, starting a business is considered a
good career choice 62
In my country, persons growing a successful new
business receive high status 63
In my country, lots of media coverage for new
businesses 64
18-34 35-64 18-34 35-64 18-34 35-64
Latin America and Caribbean
Argentina 72.7% 75.5% 65.7% 67.9% 60.5% 66.0%
Barbados
Brazil 89.4% 88.7% 86.1% 86.0% 86.1% 86.2%
Chile 67.9% 71.2% 66.5% 68.8% 62.2% 68.8%
Colombia 88.4% 89.9% 74.7% 76.2% 65.6% 71.5%
Costa Rica 67.4% 76.1% 69.7% 73.8% 76.8% 81.3%
Ecuador 87.7% 88.5% 83.7% 84.6% 79.3% 78.3%
El Salvador 76.2% 69.4% 71.0% 72.9% 61.7% 62.0%
Mexico 58.2% 53.9% 54.3% 54.0% 37.4% 38.7%
Panama
Peru 74.8% 79.9% 73.1% 72.9% 75.2% 75.9%
Trinidad & Tobago 79.0% 77.0% 75.2% 76.1% 59.9% 67.1%
Uruguay 62.0% 60.0% 59.1% 59.2% 50.0% 51.4%
Regional 74.9% 75.5% 70.8% 72.0% 65.0% 67.9%
Middle East and North Africa
Algeria 79.1% 78.8% 80.8% 81.3% 46.0% 48.0%
Egypt 83.6% 82.4% 87.8% 86.5% 61.5% 66.3%
Iran 59.8% 60.7% 73.3% 72.5% 60.8% 61.4%
Israel 61.8% 57.6% 74.5% 70.7% 49.1% 46.1%
Palestine 83.4% 86.2% 78.8% 82.7% 69.2% 73.4%
Tunisia 86.5% 89.4% 94.5% 93.3% 44.9% 50.8%
Regional 75.7% 75.8% 81.6% 81.2% 55.2% 57.7%
Sub-Saharan Africa
Angola
Botswana 75.3% 77.5% 71.7% 76.0% 78.5% 81.0%
Ethiopia 76.6% 75.7% 93.3% 90.1% 74.5% 70.9%
Ghana 84.5% 83.4% 91.3% 91.3% 83.2% 80.7%
Malawi
Namibia 73.0% 74.2% 76.3% 75.0% 82.6% 80.9%
Nigeria 82.2% 81.2% 77.3% 74.6% 78.0% 78.3%
South Africa 76.7% 71.3% 75.1% 72.8% 75.1% 70.5%
Uganda
Zambia 67.3% 67.2% 79.3% 77.8% 71.0% 72.7%
Regional 76.5% 75.8% 80.6% 79.7% 77.5% 76.4%
Asia Pacific and South Asia
China 74.5% 70.2% 74.6% 76.9% 81.2% 79.1%
Japan 26.3% 31.4% 64.8% 49.7% 54.2% 52.2%
Korea 63.2% 57.2% 74.8% 66.7% 76.4% 63.5%
Malaysia 49.1% 42.0% 50.9% 50.9% 63.4% 61.6%
Pakistan 67.6% 64.9% 69.6% 65.7% 51.4% 49.9%
Singapore 57.0% 46.4% 68.1% 59.4% 80.1% 74.8%
Taiwan 73.4% 68.5% 57.8% 65.9% 85.8% 80.6%
Thailand 78.7% 73.7% 78.7% 79.4% 85.8% 83.0%
Regional 61.2% 56.8% 67.4% 64.3% 72.3% 68.1%
62. Section 2.1, Figure 2.10: Entrepreneurship as a good career choice by age and region
63. Section 2.1, Figure 2.11: Persons growing a successful business receive high status, by age and region
64. Section 2.1, Figure 2.12: A lot of media coverage for new businesses by age and region

Page 67
In my country, starting a business is considered a
good career choice 62
In my country, persons growing a successful new
business receive high status 63
In my country, lots of media coverage for new
businesses 64
18-34 35-64 18-34 35-64 18-34 35-64
European Union
Austria 52.2% 43.5% 79.7% 73.9%
Belgium 64.3% 61.2% 56.0% 58.1% 50.8% 55.4%
Denmark
Estonia 60.6% 50.8% 63.6% 61.8% 44.2% 39.7%
Finland 43.8% 45.8% 84.9% 82.6% 68.6% 68.2%
France 69.7% 61.8% 79.9% 75.2% 46.0% 38.5%
Germany 53.6% 46.6% 78.7% 75.3% 43.1% 51.9%
Greece 67.0% 62.6% 65.0% 70.6% 29.3% 35.7%
Hungary 47.1% 38.1% 74.6% 73.7% 28.6% 29.7%
Ireland 48.9% 42.7% 82.7% 80.4% 55.1% 66.2%
Italy 70.4% 64.9% 68.0% 70.5% 50.1% 51.9%
Latvia 65.6% 55.8% 56.0% 51.6% 54.5% 52.5%
Lithuania 68.5% 59.6% 53.7% 52.4% 44.9% 32.4%
Netherlands 81.7% 78.2% 68.8% 63.4% 56.4% 59.3%
Poland 67.4% 68.3% 55.3% 58.3% 52.8% 58.6%
Portugal
Romania 69.5% 72.4% 76.0% 71.7% 57.9% 53.2%
Slovakia 54.3% 47.5% 74.3% 74.4% 59.4% 59.5%
Slovenia 58.5% 49.6% 72.6% 70.2% 51.3% 50.9%
Spain 61.8% 64.7% 64.2% 63.5% 44.8% 48.6%
Sweden
UK 56.4% 45.6% 81.6% 73.6% 44.3% 48.6%
Regional 61.1% 55.8% 70.3% 68.5% 49.0% 50.0%
Non-European Union
Bosnia and Herzegovina
77.7% 82.7% 80.7% 67.4% 45.7% 35.7%
Croatia 65.3% 63.5% 46.9% 38.7% 41.9% 38.5%
Macedonia 75.2% 65.8% 68.9% 65.3% 68.1% 61.4%
Norway 59.6% 45.5% 81.9% 78.4% 54.3% 61.7%
Russia 62.9% 57.8% 66.4% 60.8% 46.4% 43.5%
Switzerland 47.8% 42.3% 59.0% 65.7% 53.6% 59.2%
Turkey 66.2% 67.8% 75.0% 77.1% 55.9% 58.8%
Regional 65.0% 60.8% 68.4% 64.8% 52.3% 51.3%
USAUSA
Regional 0.0% 0.0% 0.0% 0.0% 0.0% 0.0%
Regional average is unweighted

Page 68
Involved in early-stage Entrepreneurial Activity (nascent or
new business) 65
Percent of TEA motivated by necessity 66
Percent of TEA motivated by opportunity 67
TEA: Innovative (new product market
combination) 68
18-34 35-64 18-34 35-64 18-34 35-64 18-34 35-64
Latin America & Caribbean
Argentina 20.0% 17.9% 27.6% 41.3% 72.4% 58.7% 30.2% 28.5%Barbados 19.4% 15.2% 10.1% 14.9% 89.9% 83.5% 9.6% 17.4%Brazil 17.1% 14.0% 28.9% 31.5% 70.6% 68.0% 1.1% 1.3%Chile 22.8% 22.4% 13.4% 20.6% 86.0% 79.1% 54.9% 57.3%Colombia 23.3% 17.3% 6.9% 18.9% 92.9% 80.7% 47.2% 35.1%Costa Rica 14.8% 15.2% 16.4% 23.9% 83.6% 73.5% 16.4% 11.0%Ecuador 27.4% 25.9% 31.4% 40.1% 68.2% 59.6% 38.7% 41.5%El Salvador 15.3% 15.3% 26.9% 44.0% 69.4% 55.2% 34.1% 24.5%Mexico 12.2% 12.1% 13.5% 13.4% 83.8% 86.6% 18.9% 24.2%Panama 8.6% 10.2% 19.4% 19.6% 80.6% 78.6% 23.9% 14.0%Peru 20.1% 20.3% 21.9% 25.0% 75.8% 74.1% 18.3% 18.4%Trinidad & Tobago
15.6% 14.4% 15.1% 15.0% 82.6% 83.4% 11.0% 18.2%
Uruguay 18.3% 12.0% 12.6% 24.9% 86.3% 72.9% 22.7% 26.8%Regional 18.1% 16.3% 18.8% 25.6% 80.2% 73.4% 25.2% 24.5%
Middle East and North Africa
Algeria 10.4% 7.1% 32.1% 26.9% 61.4% 65.2% 19.5% 21.0%Egypt 9.3% 6.1% 31.0% 38.1% 40.5% 38.5% 12.1% 12.5%Iran 12.7% 8.2% 40.8% 44.5% 59.0% 55.5% 10.0% 3.7%Israel 7.5% 5.8% 21.2% 17.1% 64.8% 72.7% 27.0% 31.3%Palestine 9.5% 10.3% 45.5% 37.2% 54.5% 62.8% 21.2% 21.9%Tunisia 4.6% 5.0% 42.3% 28.9% 56.3% 63.2% 29.8% 21.5%Regional 9.0% 7.1% 35.5% 32.1% 56.1% 59.6% 19.9% 18.7%
Sub-Saharan Africa
Angola 29.1% 37.1% 25.9% 21.3% 69.7% 78.4% 24.8% 17.8%Botswana 27.2% 28.3% 29.0% 40.3% 69.0% 56.0% 23.5% 21.5%Ethiopia 18.0% 10.7% 20.9% 19.3% 78.8% 80.7% 13.8% 13.5%Ghana 41.4% 30.2% 27.5% 27.8% 70.9% 71.5% 9.6% 11.3%Malawi 35.9% 35.0% 41.2% 43.2% 58.8% 56.8% 36.2% 37.3%Namibia 16.1% 21.2% 33.1% 41.8% 65.3% 55.9% 32.1% 34.7%Nigeria 35.7% 34.4% 32.3% 37.0% 67.2% 62.8% 19.5% 20.3%South Africa 6.8% 7.8% 31.2% 32.1% 67.5% 66.4% 46.2% 39.8%Uganda 39.7% 28.6% 47.8% 41.4% 51.2% 57.0% 8.9% 11.1%Zambia 41.0% 42.1% 34.3% 28.6% 65.7% 71.4% 16.1% 13.1%Regional 29.1% 27.5% 32.3% 33.3% 66.4% 65.7% 23.1% 22.0%
Asia Pacific and South Asia
China 16.7% 10.8% 31.6% 41.1% 67.6% 57.6% 23.0% 19.5%Japan 4.4% 3.8% 10.8% 26.3% 85.3% 68.3% 17.8% 24.0%Korea 4.0% 8.1% 17.6% 39.5% 78.8% 60.5% 37.6% 23.6%Malaysia 7.8% 6.1% 11.1% 16.3% 88.9% 83.7% 20.2% 13.1%Pakistan 12.0% 11.0% 53.8% 51.6% 44.7% 46.2% 26.8% 31.0%Singapore 9.6% 12.6% 9.8% 16.8% 90.2% 80.6% 26.7% 19.7%Taiwan 9.4% 6.4% 13.5% 21.8% 86.5% 78.2% 13.1% 23.8%Thailand 21.5% 17.3% 10.4% 21.8% 88.6% 76.7% 22.1% 17.5%Regional 10.7% 9.5% 19.8% 29.4% 78.8% 69.0% 23.4% 21.5%
65. Section 2.1, Figure 2.5: Nascent and new business rates by age and region66. Section 2.1, Figure 2.8: Necessity and opportunity TEA entrepreneurs by age
and region
67. Section 2.1, Figure 2.8: Necessity and opportunity TEA entrepreneurs by age and region
68. Section 2.1, Figure 2.16: TEA: Innovative new product market combination by age and region

Page 69
Involved in early-stage Entrepreneurial Activity (nascent or
new business) 65
Percent of TEA motivated by necessity 66
Percent of TEA motivated by opportunity 67
TEA: Innovative (new product market
combination) 68
18-34 35-64 18-34 35-64 18-34 35-64 18-34 35-64
European Union
Austria 10.3% 9.2% 10.9% 10.7% 80.0% 82.2% 33.9% 33.4%Belgium 3.1% 6.3% 16.8% 18.2% 63.1% 80.0% 50.9% 33.3%Denmark 6.4% 4.8% 4.9% 10.4% 93.6% 88.0% 41.8% 46.2%Estonia 19.9% 10.7% 10.1% 27.6% 88.2% 69.2% 38.5% 36.6%Finland 7.2% 5.3% 13.9% 19.3% 82.2% 68.2% 32.0% 26.0%France 6.4% 4.5% 8.9% 25.1% 91.1% 72.9% 39.8% 48.7%Germany 6.2% 4.9% 18.4% 23.6% 81.6% 73.9% 32.1% 31.6%Greece 7.0% 6.2% 30.5% 29.5% 69.5% 70.5% 15.1% 29.8%Hungary 9.7% 8.9% 23.6% 35.9% 73.7% 61.4% 28.1% 16.1%Ireland 6.5% 5.8% 20.6% 34.6% 79.4% 64.1% 33.0% 41.0%Italy 6.2% 3.5% 17.2% 14.5% 77.7% 67.2% 31.3% 27.8%Latvia 17.9% 10.6% 22.5% 28.2% 76.0% 68.2% 34.7% 34.5%Lithuania 10.0% 4.7% 19.7% 31.0% 78.9% 63.8% 22.4% 19.0%Netherlands 9.9% 10.5% 3.0% 10.9% 93.2% 79.5% 23.4% 29.4%Poland 12.2% 7.5% 42.6% 38.7% 53.1% 53.3% 27.7% 36.9%Portugal 9.0% 6.8% 19.5% 16.5% 75.6% 71.2% 34.0% 29.5%Romania 12.0% 7.1% 18.6% 31.4% 80.4% 68.6% 31.9% 29.0%Slovakia 13.5% 8.1% 33.0% 38.5% 67.0% 59.6% 28.6% 25.8%Slovenia 6.5% 4.8% 3.1% 10.4% 94.9% 86.7% 46.2% 31.7%Spain 6.5% 5.3% 24.3% 26.5% 74.9% 70.6% 35.0% 27.6%Sweden 6.8% 6.2% 4.4% 8.3% 88.9% 84.2% 26.8% 17.6%UK 9.0% 9.0% 13.6% 21.1% 86.4% 75.4% 34.0% 28.5%Regional 9.2% 6.9% 17.3% 23.2% 79.5% 71.8% 32.8% 30.9%
Non-European Union
Bosnia and Herzegovina
8.2% 7.5% 49.4% 63.9% 49.2% 34.0% 12.5% 13.7%
Croatia 12.4% 5.9% 28.5% 41.1% 70.4% 58.0% 20.0% 25.7%
Macedonia 8.4% 6.0% 51.7% 52.2% 46.5% 46.9% 24.5% 16.8%Norway 5.9% 7.2% 4.8% 8.6% 92.9% 87.1% 21.4% 23.7%Russia 5.8% 3.4% 38.1% 34.5% 60.6% 64.1% 14.2% 14.7%Switzerland 4.1% 6.9% 22.7% 16.7% 72.8% 75.0% 36.4% 30.5%Turkey 14.6% 10.3% 31.6% 30.0% 64.8% 69.3% 24.0% 25.9%Regional 8.5% 6.8% 32.4% 35.3% 65.3% 62.1% 21.8% 21.6%
USAUSA 12.4% 13.1% 18.4% 23.0% 77.1% 74.4% 35.0% 33.6%Regional 12.4% 13.1% 18.4% 23.0% 77.1% 74.4% 35.0% 33.6%
Regional average is unweighted

Page 70
TEA jobs growth (less than 1) 69
TEA jobs growth (2 to 5)
TEA jobs growth (6 to 19)
TEA jobs growth (20+)
18-34 35-64 18-34 35-64 18-34 35-64 18-34 35-64
Latin America and Caribbean
Argentina 44.3% 43.9% 36.5% 34.8% 13.2% 12.3% 6.0% 8.9%Barbados 53.5% 55.4% 30.0% 30.7% 11.4% 10.7% 5.1% 3.2%Brazil 63.8% 65.3% 24.4% 23.7% 8.7% 8.4% 3.1% 2.7%Chile 29.9% 28.4% 38.6% 38.8% 24.4% 25.1% 7.2% 7.7%Colombia 13.9% 20.9% 30.3% 40.3% 36.4% 19.6% 19.4% 19.1%Costa Rica 41.4% 44.5% 36.8% 37.4% 16.4% 13.5% 5.3% 4.5%Ecuador 59.4% 64.7% 30.7% 27.2% 7.3% 6.6% 2.7% 1.5%El Salvador 48.5% 48.0% 28.6% 28.9% 17.1% 17.1% 5.8% 6.0%Mexico 33.7% 38.8% 54.8% 35.7% 9.5% 19.1% 2.0% 6.4%Panama 55.2% 64.0% 40.0% 32.7% 3.6% 3.3% 1.1% 0.0%Peru 35.5% 39.0% 44.0% 47.9% 17.6% 10.7% 2.9% 2.4%Trinidad & Tobago
46.9% 53.1% 37.0% 26.6% 8.8% 13.4% 7.3% 6.9%
Uruguay 45.6% 57.2% 37.4% 23.6% 12.3% 11.7% 4.6% 7.5%Regional 44.0% 47.9% 36.1% 32.9% 14.4% 13.2% 5.6% 5.9%
Middle East and North Africa
Algeria 68.9% 66.6% 20.2% 21.5% 9.2% 11.0% 1.7% 0.9%Egypt 23.0% 37.4% 32.8% 28.1% 29.4% 27.9% 14.8% 6.6%Iran 46.9% 50.6% 36.0% 34.4% 14.6% 13.7% 2.4% 1.3%Israel 69.6% 56.0% 13.3% 18.3% 6.3% 13.1% 10.7% 12.5%Palestine 34.6% 34.7% 39.4% 40.2% 18.4% 18.2% 7.6% 6.8%Tunisia 64.3% 54.6% 21.7% 19.1% 12.3% 21.0% 1.7% 5.2%Regional 51.2% 50.0% 27.2% 27.0% 15.0% 17.5% 6.5% 5.6%
Sub-Saharan Africa
Angola 63.5% 58.7% 21.1% 21.2% 10.1% 16.6% 5.4% 3.4%Botswana 37.5% 45.8% 25.3% 28.0% 25.9% 17.5% 11.2% 8.8%Ethiopia 61.3% 44.8% 28.4% 34.7% 8.3% 9.7% 2.0% 10.8%Ghana 52.4% 56.0% 32.9% 28.7% 12.0% 11.1% 2.7% 4.1%Malawi 81.3% 77.2% 17.1% 21.3% 1.7% 1.5% 0.0% 0.0%Namibia 47.6% 50.3% 29.8% 37.1% 16.1% 9.9% 6.6% 2.7%Nigeria 36.2% 41.4% 41.3% 34.8% 16.1% 16.9% 6.4% 6.9%South Africa 44.5% 48.1% 24.1% 29.0% 18.8% 12.7% 12.6% 10.2%Uganda 56.2% 62.8% 37.6% 30.6% 5.6% 4.7% 0.6% 2.0%Zambia 37.5% 42.7% 54.9% 50.4% 7.0% 5.9% 0.6% 1.0%Regional 51.8% 52.8% 31.2% 31.6% 12.2% 10.7% 4.8% 5.0%
Asia Pacific and South Asia
China 60.5% 65.4% 20.0% 17.4% 10.1% 8.6% 9.4% 8.6%Japan 44.3% 50.0% 12.9% 24.0% 22.9% 16.8% 19.8% 9.1%Korea 25.0% 52.2% 39.7% 19.9% 18.5% 10.8% 16.8% 17.1%Malaysia 41.9% 47.7% 42.2% 43.6% 11.4% 6.1% 4.5% 2.6%Pakistan 49.8% 46.8% 31.8% 24.0% 8.8% 17.6% 9.6% 11.6%Singapore 28.4% 28.2% 31.0% 33.1% 22.5% 25.5% 18.1% 13.2%Taiwan 38.1% 45.3% 21.0% 19.1% 19.5% 21.1% 21.4% 14.5%Thailand 62.2% 68.4% 28.7% 18.4% 6.0% 10.3% 3.1% 2.9%Regional 43.8% 50.5% 28.4% 24.9% 15.0% 14.6% 12.8% 9.9%
69. Section 2.1, Figure 2.15: TEA expected job growth by age and region

Page 71
TEA jobs growth (less than 1) 69
TEA jobs growth (2 to 5)
TEA jobs growth (6 to 19)
TEA jobs growth (20+)
18-34 35-64 18-34 35-64 18-34 35-64 18-34 35-64
European Union
Austria 69.7% 66.6% 20.3% 23.1% 8.3% 5.7% 1.7% 4.6%Belgium 40.2% 48.1% 25.0% 34.9% 29.1% 13.5% 5.8% 3.5%Denmark 43.8% 48.5% 28.8% 26.9% 17.8% 10.9% 9.6% 13.6%Estonia 33.3% 42.6% 31.3% 28.4% 26.9% 20.3% 8.6% 8.7%Finland 53.6% 68.6% 22.3% 20.1% 14.0% 5.7% 10.1% 5.6%France 32.7% 47.9% 33.8% 36.2% 22.5% 11.5% 11.1% 4.4%Germany 42.2% 48.4% 28.8% 32.0% 15.7% 12.9% 13.3% 6.7%Greece 81.6% 71.1% 13.1% 13.5% 4.4% 9.5% 0.9% 5.9%Hungary 46.9% 51.0% 29.9% 24.2% 11.5% 16.5% 11.7% 8.3%Ireland 33.9% 45.8% 32.8% 24.3% 18.0% 14.7% 15.3% 15.2%Italy 62.8% 69.8% 25.1% 21.3% 3.6% 5.9% 8.6% 3.0%Latvia 21.7% 38.4% 21.5% 22.0% 35.3% 21.9% 21.4% 17.7%Lithuania 32.9% 48.3% 18.4% 19.0% 30.3% 19.0% 18.4% 13.8%Netherlands 60.1% 72.9% 25.4% 16.7% 11.8% 6.9% 2.7% 3.6%Poland 45.8% 51.6% 27.2% 30.9% 17.3% 11.5% 9.8% 6.1%Portugal 51.2% 67.2% 28.1% 18.2% 14.5% 10.2% 6.2% 4.4%Romania 31.2% 39.3% 29.8% 19.7% 27.7% 19.4% 11.2% 21.6%Slovakia 36.1% 50.4% 31.9% 22.8% 23.8% 14.9% 8.2% 11.9%Slovenia 40.2% 60.1% 26.9% 23.3% 18.0% 10.5% 14.9% 6.1%Spain 67.2% 64.8% 22.6% 26.5% 8.3% 5.7% 1.9% 3.0%Sweden 63.6% 64.8% 22.5% 18.3% 7.0% 15.6% 7.0% 1.2%UK 36.2% 61.3% 31.2% 20.4% 21.5% 11.1% 11.2% 7.2%Regional 46.7% 55.8% 26.2% 23.8% 17.6% 12.4% 9.5% 8.0%
Non-European Union
Bosnia and Herzegovina
53.4% 57.9% 23.3% 11.5% 17.4% 23.4% 5.9% 7.2%
Croatia 44.3% 51.2% 27.8% 22.4% 18.0% 17.4% 9.9% 9.0%
Macedonia 33.5% 36.7% 32.8% 41.0% 24.5% 14.9% 9.1% 7.4%Norway 50.0% 63.4% 28.6% 28.0% 14.3% 6.5% 7.1% 2.2%Russia 53.2% 42.2% 22.8% 29.1% 16.3% 23.3% 7.8% 5.4%Switzerland 68.1% 61.0% 22.8% 27.8% 9.1% 5.6% 0.0% 5.5%Turkey 36.9% 43.1% 28.7% 17.8% 15.4% 22.5% 18.9% 16.7%Regional 48.5% 50.8% 26.7% 25.4% 16.4% 16.2% 8.4% 7.6%
USAUSA 47.3% 45.3% 22.7% 29.1% 18.7% 13.6% 11.3% 12.0%Regional 47.3% 45.3% 22.7% 29.1% 18.7% 13.6% 11.3% 12.0%
Regional average is unweighted
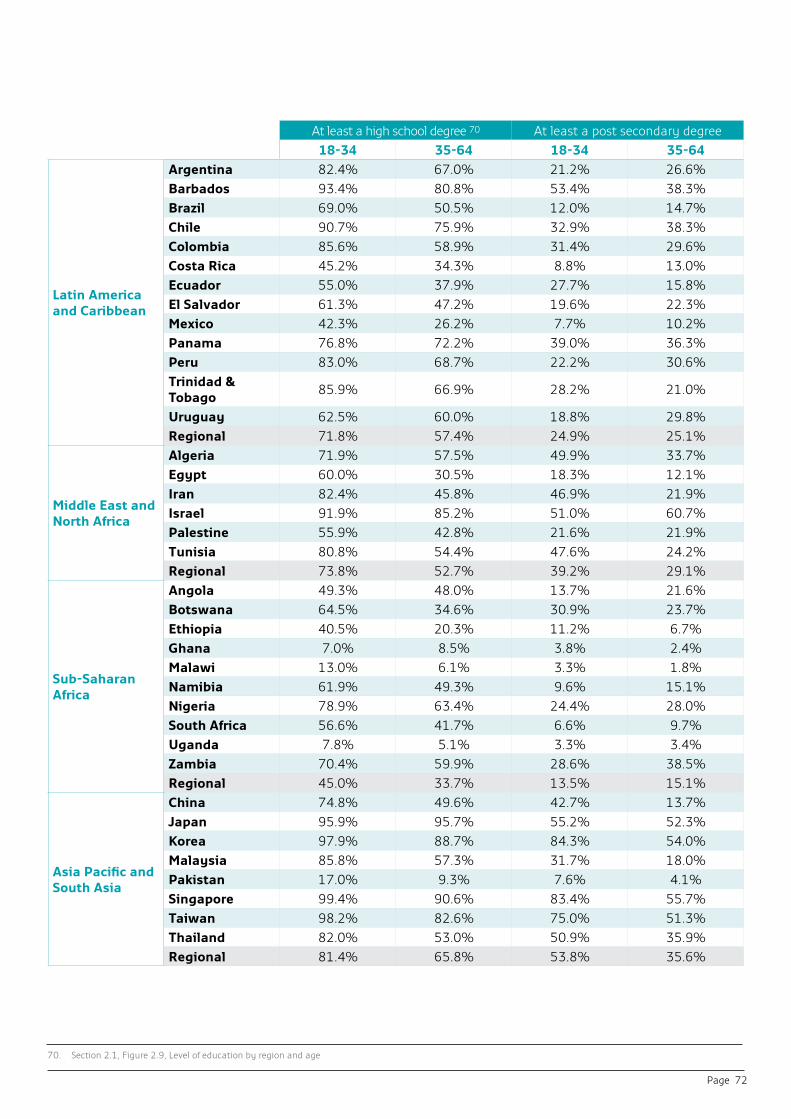
Page 72
At least a high school degree 70 At least a post secondary degree18-34 35-64 18-34 35-64
Latin America and Caribbean
Argentina 82.4% 67.0% 21.2% 26.6%Barbados 93.4% 80.8% 53.4% 38.3%Brazil 69.0% 50.5% 12.0% 14.7%Chile 90.7% 75.9% 32.9% 38.3%Colombia 85.6% 58.9% 31.4% 29.6%Costa Rica 45.2% 34.3% 8.8% 13.0%Ecuador 55.0% 37.9% 27.7% 15.8%El Salvador 61.3% 47.2% 19.6% 22.3%Mexico 42.3% 26.2% 7.7% 10.2%Panama 76.8% 72.2% 39.0% 36.3%Peru 83.0% 68.7% 22.2% 30.6%Trinidad & Tobago
85.9% 66.9% 28.2% 21.0%
Uruguay 62.5% 60.0% 18.8% 29.8%Regional 71.8% 57.4% 24.9% 25.1%
Middle East and North Africa
Algeria 71.9% 57.5% 49.9% 33.7%Egypt 60.0% 30.5% 18.3% 12.1%Iran 82.4% 45.8% 46.9% 21.9%Israel 91.9% 85.2% 51.0% 60.7%Palestine 55.9% 42.8% 21.6% 21.9%Tunisia 80.8% 54.4% 47.6% 24.2%Regional 73.8% 52.7% 39.2% 29.1%
Sub-Saharan Africa
Angola 49.3% 48.0% 13.7% 21.6%Botswana 64.5% 34.6% 30.9% 23.7%Ethiopia 40.5% 20.3% 11.2% 6.7%Ghana 7.0% 8.5% 3.8% 2.4%Malawi 13.0% 6.1% 3.3% 1.8%Namibia 61.9% 49.3% 9.6% 15.1%Nigeria 78.9% 63.4% 24.4% 28.0%South Africa 56.6% 41.7% 6.6% 9.7%Uganda 7.8% 5.1% 3.3% 3.4%Zambia 70.4% 59.9% 28.6% 38.5%Regional 45.0% 33.7% 13.5% 15.1%
Asia Pacific and South Asia
China 74.8% 49.6% 42.7% 13.7%Japan 95.9% 95.7% 55.2% 52.3%Korea 97.9% 88.7% 84.3% 54.0%Malaysia 85.8% 57.3% 31.7% 18.0%Pakistan 17.0% 9.3% 7.6% 4.1%Singapore 99.4% 90.6% 83.4% 55.7%Taiwan 98.2% 82.6% 75.0% 51.3%Thailand 82.0% 53.0% 50.9% 35.9%Regional 81.4% 65.8% 53.8% 35.6%
70. Section 2.1, Figure 2.9, Level of education by region and age

Page 73
At least a high school degree 70 At least a post secondary degree18-34 35-64 18-34 35-64
European Union
Austria 83.7% 86.9% 28.2% 25.0%Belgium 88.9% 86.3% 44.0% 52.9%Denmark 84.4% 88.2% 53.9% 78.3%Estonia 89.8% 94.7% 34.9% 37.0%Finland 95.1% 84.1% 33.3% 29.4%France 71.8% 56.8% 46.2% 39.3%Germany 77.4% 62.7% 43.0% 26.8%Greece 93.1% 78.0% 50.0% 44.4%Hungary 69.0% 62.2% 39.9% 34.0%Ireland 94.0% 88.0% 65.7% 60.7%Italy 46.7% 59.1% 9.8% 15.3%Latvia 88.3% 93.3% 35.6% 34.5%Lithuania 95.9% 98.3% 58.1% 76.7%Netherlands 96.2% 94.6% 26.1% 29.2%Poland 89.2% 88.1% 38.2% 17.4%Portugal 39.8% 28.1% 34.7% 26.2%Romania 63.8% 54.1% 25.7% 22.4%Slovakia 81.6% 68.2% 31.0% 22.1%Slovenia 89.1% 79.3% 37.6% 42.6%Spain 72.9% 61.3% 31.8% 32.0%Sweden 92.6% 90.6% 36.3% 44.8%UK 82.8% 70.7% 53.3% 53.7%Regional 81.2% 76.1% 39.0% 38.4%
Non-European Union
Bosnia and Herzegovina
92.9% 78.1% 19.6% 14.1%
Croatia 73.6% 55.7% 19.2% 15.6%Macedonia 91.5% 74.7% 33.5% 24.9%
Norway 98.3% 96.2% 45.2% 61.9%Russia 92.0% 89.2% 64.7% 61.9%Switzerland 92.0% 93.8% 14.7% 33.8%Turkey 77.9% 42.6% 45.4% 21.0%Regional 88.3% 75.8% 34.6% 33.3%
USAUSA 83.1% 88.0% 51.8% 64.7%Regional 83.1% 88.0% 51.8% 64.7%
Regional average is unweighted

Page 74
TEA: In lowest 33% income range 71
TEA: In middle 33% income range
TEA: In highest 33% income range
18-34 35-64 18-34 35-64 18-34 35-64
Latin America and Caribbean
Argentina 23.4% 22.6% 37.0% 29.9% 39.7% 47.4%
Barbados 31.5% 31.1% 30.1% 27.4% 38.4% 41.5%
Brazil 28.4% 30.1% 36.3% 36.4% 35.3% 33.5%
Chile 15.8% 11.7% 21.4% 22.6% 62.8% 65.7%
Colombia 7.9% 9.5% 38.3% 43.0% 53.8% 47.6%
Costa Rica 23.8% 23.2% 25.4% 25.6% 50.8% 51.2%
Ecuador 13.4% 16.2% 39.1% 35.1% 47.5% 48.7%
El Salvador 26.5% 5.7% 26.3% 32.2% 47.2% 62.0%
Mexico 11.3% 18.5% 37.4% 29.1% 51.3% 52.4%
Panama 41.3% 25.1% 28.0% 32.2% 30.7% 42.7%
Peru 28.2% 22.4% 21.6% 24.6% 50.2% 52.9%
Trinidad & Tobago 15.6% 25.9% 27.3% 20.0% 57.1% 54.1%
Uruguay 19.3% 16.8% 29.9% 25.9% 50.8% 57.3%
Regional 22.1% 19.9% 30.6% 29.5% 47.3% 50.5%
Middle East and North Africa
Algeria 47.7% 33.5% 21.8% 18.2% 30.6% 48.3%
Egypt 21.4% 29.9% 33.6% 39.8% 44.9% 30.3%
Iran 39.6% 37.4% 36.8% 36.0% 23.6% 26.6%
Israel 18.2% 17.0% 55.0% 38.4% 26.8% 44.7%
Palestine 43.5% 33.8% 27.4% 32.2% 29.1% 33.9%
Tunisia 27.3% 32.5% 42.8% 23.4% 30.0% 44.0%
Regional 32.9% 30.7% 36.2% 31.3% 30.8% 38.0%
Sub-Saharan Africa
Angola 36.3% 20.5% 30.1% 42.6% 33.6% 36.9%
Botswana 41.2% 48.5% 25.7% 19.0% 33.1% 32.5%
Ethiopia 31.1% 18.8% 30.0% 31.7% 38.8% 49.5%
Ghana 29.8% 34.4% 45.4% 44.2% 24.8% 21.4%
Malawi 22.6% 21.7% 15.1% 17.1% 62.3% 61.2%
Namibia 26.0% 27.5% 37.3% 35.5% 36.6% 36.9%
Nigeria 0.0% 0.0% 58.3% 58.0% 41.7% 42.0%
South Africa 35.1% 19.0% 40.4% 38.3% 24.5% 42.7%
Uganda 31.0% 38.3% 45.6% 41.3% 23.4% 20.4%
Zambia 25.8% 23.3% 35.0% 34.4% 39.2% 42.3%
Regional 27.9% 25.2% 36.3% 36.2% 35.8% 38.6%
Asia Pacific and South Asia
China 16.7% 23.2% 32.7% 29.1% 50.5% 47.8%
Japan 39.6% 35.1% 26.8% 20.9% 33.6% 43.9%
Korea 12.4% 26.6% 29.3% 33.3% 58.3% 40.1%
Malaysia 32.5% 26.8% 24.8% 19.1% 42.7% 54.1%
Pakistan 23.9% 15.7% 33.3% 41.9% 42.9% 42.4%
Singapore 16.6% 26.4% 43.7% 29.5% 39.7% 44.1%
Taiwan 26.7% 42.2% 45.4% 33.0% 27.9% 24.8%
Thailand 42.3% 43.2% 22.6% 21.4% 35.0% 35.5%
Regional 26.3% 29.9% 32.3% 28.5% 41.3% 41.6%
71. Section 2.2, The regional averages reported in Table 2.5 in the report differ slightly as Table 2.5 only includes the countries which participated in the optional youth survey

Page 75
TEA: In lowest 33% income range 71
TEA: In middle 33% income range
TEA: In highest 33% income range
18-34 35-64 18-34 35-64 18-34 35-64
European Union
Austria 39.2% 18.1% 31.1% 32.5% 29.8% 49.4%
Belgium 49.0% 6.3% 7.1% 38.9% 44.0% 54.8%
Denmark 27.2% 12.6% 37.5% 30.6% 35.3% 56.8%
Estonia 16.7% 14.1% 25.6% 22.5% 57.7% 63.4%
Finland 19.0% 9.4% 27.1% 21.9% 53.9% 68.8%
France 32.2% 14.9% 38.4% 45.3% 29.3% 39.8%
Germany 57.0% 17.7% 18.7% 35.0% 24.3% 47.3%
Greece 0.0% 0.0% 48.5% 49.3% 51.5% 50.7%
Hungary 20.8% 17.3% 19.4% 13.4% 59.8% 69.3%
Ireland 30.9% 30.4% 23.4% 19.7% 45.6% 49.9%
Italy 38.5% 43.0% 45.2% 30.1% 16.3% 26.9%
Latvia 12.0% 24.5% 18.9% 22.2% 69.1% 53.3%
Lithuania 8.5% 19.5% 39.0% 34.1% 52.5% 46.3%
Netherlands 18.4% 8.8% 23.3% 28.0% 58.3% 63.1%
Poland 15.6% 48.0% 35.3% 22.6% 49.1% 29.5%
Portugal 14.0% 24.9% 34.0% 20.4% 52.1% 54.8%
Romania 4.6% 20.7% 25.4% 35.3% 70.0% 44.0%
Slovakia 15.6% 24.9% 28.6% 32.5% 55.7% 42.6%
Slovenia 17.8% 33.1% 47.7% 29.9% 34.6% 37.1%
Spain 11.6% 11.2% 32.1% 25.3% 56.3% 63.4%
Sweden 45.6% 18.5% 25.2% 25.9% 29.3% 55.6%
UK 14.3% 24.6% 32.8% 15.0% 53.0% 60.4%
Regional 23.1% 20.1% 30.2% 28.7% 46.7% 51.2%
Non-European Union
Bosnia and Herzegovina
5.5% 16.4% 34.6% 43.0% 59.9% 40.5%
Croatia 9.5% 17.2% 36.4% 31.0% 54.0% 51.8%
Macedonia 28.3% 22.6% 48.3% 39.3% 23.4% 38.1%
Norway 30.0% 18.9% 37.5% 35.6% 32.5% 45.6%
Russia 15.6% 15.7% 39.5% 39.4% 44.9% 44.9%
Switzerland 10.5% 14.4% 31.6% 19.1% 57.9% 66.6%
Turkey 8.0% 8.3% 26.0% 23.4% 66.0% 68.3%
Regional 15.4% 16.2% 36.3% 33.0% 48.4% 50.8%
USAUSA 25.3% 24.7% 25.8% 23.2% 49.0% 52.1%
Regional 25.3% 24.7% 25.8% 23.2% 49.0% 52.1%
Regional average is unweighted

Page 76
TEA: Business will primarily trade from 72 As a long term option, prefer to RUN OWN BUSINESS 73
Formal space(market, formal space)
Informal space(street, home)
Online
18-34 35-64 18-34 35-64 18-34 35-64 18-34 35-64
Latin America and Caribbean
Argentina 42.1% 46.5% 44.2% 41.7% 13.7% 11.8% 84.3% 80.1%Barbados 22.0% 27.8% 71.5% 65.1% 6.4% 7.1% 89.2% 88.7%Colombia 39.2% 38.5% 49.7% 55.2% 11.2% 6.2% 98.5% 98.3%Costa Rica 40.0% 41.8% 53.3% 55.1% 6.7% 3.1% 98.9% 94.8%Trinidad & Tobago
25.2% 19.7% 67.4% 73.3% 7.4% 7.1% 94.9% 97.2%
Regional 33.7% 34.9% 57.2% 58.1% 9.1% 7.0% 93.2% 91.8%
Middle East and North Africa
Algeria 55.4% 61.1% 39.4% 34.9% 5.3% 4.0% 89.3% 86.5%Egypt 62.6% 58.2% 37.4% 41.8% 0.0% 0.0% 90.8% 82.9%Iran 77.0% 61.3% 10.6% 20.2% 12.4% 18.5% 80.8% 89.0%Palestine 35.5% 39.0% 63.4% 57.8% 1.2% 3.1% 86.9% 92.1%Tunisia 62.0% 64.8% 28.5% 29.4% 9.5% 5.8% 100 % 97.7%Regional 58.5% 56.9% 35.8% 36.8% 5.7% 6.3% 89.6% 89.6%
Sub-Saharan Africa
Angola 42.5% 53.9% 52.7% 37.3% 4.8% 8.8% 80.6% 75.4%Botswana 41.6% 38.7% 52.3% 56.5% 6.1% 4.8% 90.2% 94.2%Ethiopia 50.2% 41.9% 44.6% 52.5% 5.2% 5.6% 96.7% 95.0%Ghana 44.0% 41.7% 51.0% 49.4% 5.1% 8.9% 84.6% 87.9%Malawi 45.3% 46.1% 48.6% 47.0% 6.2% 6.9% 83.9% 93.3%Namibia 51.6% 44.7% 43.4% 54.4% 5.1% 1.0% 82.4% 81.0%Nigeria 43.6% 49.9% 52.8% 47.0% 3.6% 3.1% 86.5% 90.4%South Africa 26.1% 26.5% 67.0% 67.9% 7.0% 5.6% 91.6% 88.4%Uganda 51.3% 44.4% 46.0% 52.6% 2.7% 3.0% 90.0% 90.4%Zambia 63.1% 64.2% 32.7% 29.1% 4.3% 6.8% 69.2% 83.2%Regional 45.9% 45.2% 49.1% 49.4% 5.0% 5.4% 85.6% 87.9%
Asia Pacific and South Asia
China 52.7% 46.5% 39.6% 48.9% 7.7% 4.6% 92.2% 95.7%Korea 69.1% 82.8% 13.6% 12.4% 17.3% 4.9% 90.6% 77.9%Malaysia 50.5% 39.8% 41.0% 60.2% 8.5% 0.0% 93.9% 91.0%Regional 57.4% 56.3% 31.4% 40.5% 11.2% 3.2% 92.2% 88.2%
72. Section 2.2, Figure 2.19: Trading space, by age and region73. Section 2.2, Figure 2.24: TEA, as a long term option, prefer to run your own
business by age and region
Regional average is unweighted

Page 77
74. 2.21: TEA, Source of majority of money to start business by age and region
Regional average is unweighted
TEA: Source of majority of money to start business will come from 74
Personal savings Family savingsBank or other
financial institution Friend
18-34 35-64 18-34 35-64 18-34 35-64 18-34 35-64
Latin America and Caribbean
Argentina 63.7% 56.7% 12.1% 16.8% 16.2% 13.5% 3.6% 2.4%Barbados 69.0% 72.1% 13.0% 7.0% 14.7% 17.6% 1.4% 1.9%Colombia 55.0% 49.0% 16.0% 13.1% 17.3% 28.5% 5.0% 3.8%Costa Rica 46.6% 37.6% 19.3% 20.4% 23.9% 31.2% 4.6% 5.4%Trinidad & Tobago
54.0% 66.9% 13.8% 5.3% 27.6% 21.8% 1.5% 1.7%
Regional 57.6% 56.5% 14.8% 12.6% 19.9% 22.5% 3.2% 3.0%
Middle East and North Africa
Algeria 29.4% 43.0% 16.1% 21.4% 51.6% 33.3% 2.4% 1.0%Egypt 67.0% 68.4% 20.1% 14.8% 6.3% 9.5% 6.4% 2.8%Iran 31.5% 33.2% 21.8% 25.0% 44.0% 41.0% 2.0% 0.0%Palestine 34.0% 45.4% 33.5% 17.0% 21.3% 23.2% 11.2% 11.2%Tunisia 51.1% 64.7% 15.7% 4.0% 29.7% 29.7% 1.5% 0.0%Regional 42.6% 50.9% 21.4% 16.4% 30.6% 27.3% 4.7% 3.0%
Sub-Saharan Africa
Angola 37.3% 29.2% 18.2% 13.0% 40.3% 53.6% 1.5% 2.0%Botswana 41.7% 55.3% 12.1% 11.2% 35.0% 24.7% 2.3% 0.5%Ethiopia 60.7% 75.1% 27.1% 11.5% 8.8% 8.8% 1.3% 2.0%Ghana 70.3% 64.5% 15.0% 14.9% 9.2% 13.6% 3.2% 4.0%Malawi 62.2% 65.1% 18.9% 18.0% 9.4% 10.4% 3.4% 1.5%Namibia 47.6% 49.0% 13.5% 10.9% 34.5% 29.3% 3.9% 9.8%Nigeria 57.0% 61.2% 31.3% 20.9% 6.3% 12.0% 2.6% 2.8%South Africa 34.5% 54.5% 30.1% 7.9% 26.5% 24.2% 3.6% 3.6%Uganda 67.1% 77.0% 17.6% 4.5% 9.5% 12.9% 3.5% 4.0%Zambia 66.2% 67.7% 20.3% 15.7% 9.1% 13.5% 2.7% 2.5%Regional 54.5% 59.9% 20.4% 12.9% 18.9% 20.3% 2.8% 3.3%
Asia Pacific and South Asia
China 22.4% 27.1% 62.3% 61.6% 8.1% 8.2% 6.1% 2.7%Korea 19.6% 40.4% 25.7% 9.1% 36.7% 30.4% 8.8% 4.3%Malaysia 52.8% 59.9% 19.8% 11.5% 25.4% 26.6% 2.0% 2.0%Regional 31.6% 42.5% 35.9% 27.4% 23.4% 21.7% 5.6% 3.0%
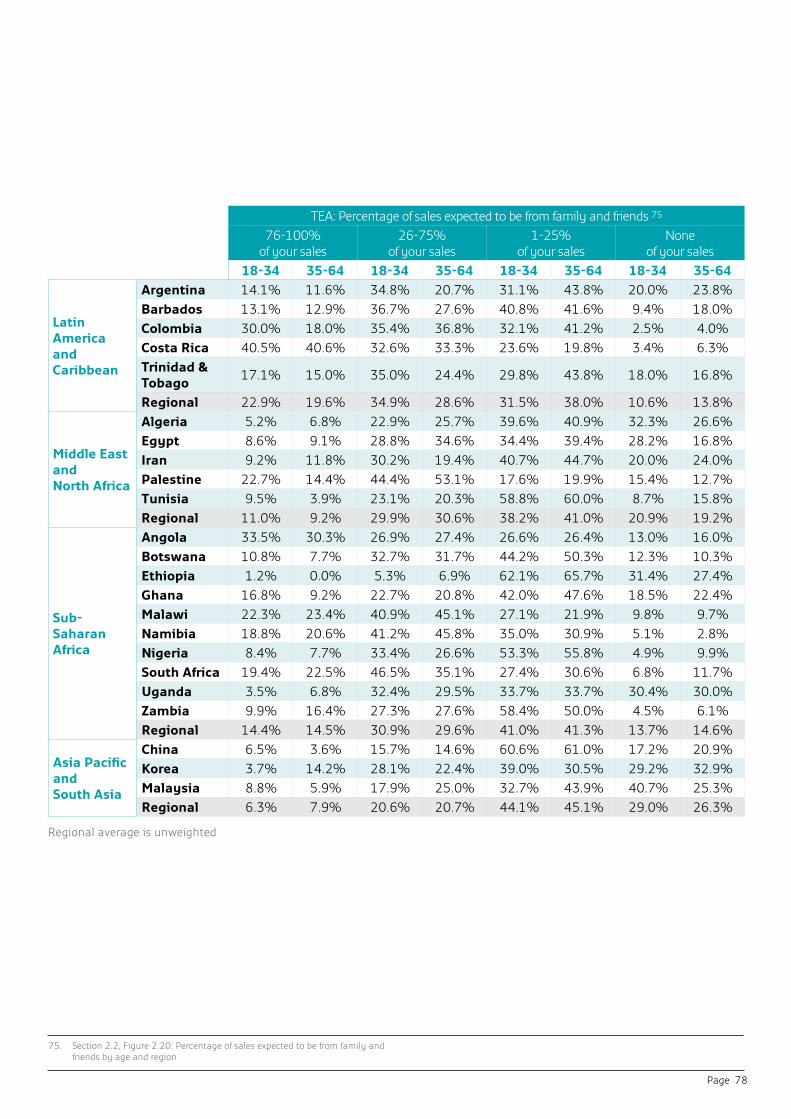
Page 78
TEA: Percentage of sales expected to be from family and friends 75
76-100% of your sales
26-75% of your sales
1-25% of your sales
None of your sales
18-34 35-64 18-34 35-64 18-34 35-64 18-34 35-64
Latin America and Caribbean
Argentina 14.1% 11.6% 34.8% 20.7% 31.1% 43.8% 20.0% 23.8%Barbados 13.1% 12.9% 36.7% 27.6% 40.8% 41.6% 9.4% 18.0%Colombia 30.0% 18.0% 35.4% 36.8% 32.1% 41.2% 2.5% 4.0%Costa Rica 40.5% 40.6% 32.6% 33.3% 23.6% 19.8% 3.4% 6.3%Trinidad & Tobago
17.1% 15.0% 35.0% 24.4% 29.8% 43.8% 18.0% 16.8%
Regional 22.9% 19.6% 34.9% 28.6% 31.5% 38.0% 10.6% 13.8%
Middle East and North Africa
Algeria 5.2% 6.8% 22.9% 25.7% 39.6% 40.9% 32.3% 26.6%Egypt 8.6% 9.1% 28.8% 34.6% 34.4% 39.4% 28.2% 16.8%Iran 9.2% 11.8% 30.2% 19.4% 40.7% 44.7% 20.0% 24.0%Palestine 22.7% 14.4% 44.4% 53.1% 17.6% 19.9% 15.4% 12.7%Tunisia 9.5% 3.9% 23.1% 20.3% 58.8% 60.0% 8.7% 15.8%Regional 11.0% 9.2% 29.9% 30.6% 38.2% 41.0% 20.9% 19.2%
Sub-Saharan Africa
Angola 33.5% 30.3% 26.9% 27.4% 26.6% 26.4% 13.0% 16.0%Botswana 10.8% 7.7% 32.7% 31.7% 44.2% 50.3% 12.3% 10.3%Ethiopia 1.2% 0.0% 5.3% 6.9% 62.1% 65.7% 31.4% 27.4%Ghana 16.8% 9.2% 22.7% 20.8% 42.0% 47.6% 18.5% 22.4%Malawi 22.3% 23.4% 40.9% 45.1% 27.1% 21.9% 9.8% 9.7%Namibia 18.8% 20.6% 41.2% 45.8% 35.0% 30.9% 5.1% 2.8%Nigeria 8.4% 7.7% 33.4% 26.6% 53.3% 55.8% 4.9% 9.9%South Africa 19.4% 22.5% 46.5% 35.1% 27.4% 30.6% 6.8% 11.7%Uganda 3.5% 6.8% 32.4% 29.5% 33.7% 33.7% 30.4% 30.0%Zambia 9.9% 16.4% 27.3% 27.6% 58.4% 50.0% 4.5% 6.1%Regional 14.4% 14.5% 30.9% 29.6% 41.0% 41.3% 13.7% 14.6%
Asia Pacific and South Asia
China 6.5% 3.6% 15.7% 14.6% 60.6% 61.0% 17.2% 20.9%Korea 3.7% 14.2% 28.1% 22.4% 39.0% 30.5% 29.2% 32.9%Malaysia 8.8% 5.9% 17.9% 25.0% 32.7% 43.9% 40.7% 25.3%Regional 6.3% 7.9% 20.6% 20.7% 44.1% 45.1% 29.0% 26.3%
75. Section 2.2, Figure 2.20: Percentage of sales expected to be from family and friends by age and region
Regional average is unweighted


Youth Business International www.youthbusiness.org