generation and transmission · pdf file2017 state of the market report for pjm 539 section 12...
TRANSCRIPT

2017 State of the Market Report for PJM 537
Section 12 Planning
© 2018 Monitoring Analytics, LLC
Generation and Transmission Planning1
OverviewPlanned Generation and Retirements• Planned Generation. As of December 31, 2017,
99,452.5 MW of capacity were in generation request queues for construction through 2024, compared to an installed capacity of 201,496.5 MW as of December 31, 2017. Of the capacity in queues, 9,880.7 MW, or 9.9 percent, are uprates and the rest are new generation. Wind projects account for 18,287.9 MW of nameplate capacity or 18.4 percent of the capacity in the queues. Natural gas fired projects account for 59,999.8 MW of capacity or 60.3 percent of the capacity in the queues.
• Generation Retirements. 32,699.3 MW have been, or are planned to be, retired between 2011 and 2020. Of that, 6,935.9 MW are planned to retire after December 31, 2017. In 2017, 2,126.8 MW were retired. Of the 6,935.9 MW pending retirement, 4,620.0 MW (66.6 percent) are coal units. The coal unit retirements were a result of low gas prices, low capacity prices and the investments required for compliance with the EPA’s Mercury and Air Toxics Standards (MATS) for some units.
• Generation Mix. A significant shift in the distribution of unit types within the PJM footprint continues as natural gas fired units enter the queue and coal fired steam units retire. There are 199.0 MW of coal fired steam capacity and 59,999.8 MW of gas fired capacity in the queue. The replacement of coal fired steam units by units burning natural gas will significantly affect future congestion, the role of firm and interruptible gas supply, and natural gas supply infrastructure.
Generation and Transmission Interconnection Planning Process• Any entity that requests interconnection of a
new generating facility, including increases to the capacity of an existing generating unit, or that requests interconnection of a merchant transmission
1 Totals presented in this section include corrections to historical data and may not match totals presented in previous reports.
facility, must follow the process defined in the PJM tariff to obtain interconnection service.2 PJM’s process is designed to ensure that new generation is added in a reliable and systematic manner. The process is complex and time consuming at least in part as a result of the required analyses. The cost, time and uncertainty associated with interconnecting to the grid may create barriers to entry for potential entrants.
• The queue contains a substantial number of projects that are not likely to be built. The queue process results in a substantial number of projects that drop out. Excluding currently active projects and projects currently under construction, 3,685 projects, representing 474,780.1 MW, have entered the queue process since its inception. Of those, 753 projects, representing 51,560.5 MW, went into service. Of the projects that entered the queue process, 68.2 percent of the MW withdrew prior to completion. Such projects may create barriers to entry for projects that would otherwise be completed by taking up queue positions, increasing interconnection costs and creating uncertainty.
• Feasibility, impact and facilities studies may be delayed for reasons including disputes with developers, circuit and network issues and retooling as a result of projects being withdrawn. The Earlier Queue Submittal Task Force (EQSTF) was established in August 2015 to address delays associated with the submittal of large numbers of requests at the end of the queue window, which resulted in revisions to the PJM Open Access Transmission Tariff, effective October 31, 2016.3 4 On December 15, 2016, the Commission issued a notice of proposed rulemaking proposing additional queue reforms intended to improve certainty, promote more informed interconnection, and enhance interconnection processes.5
• A transmission owner (TO) is an “entity that owns, leases or otherwise has a possessory interest in facilities used for the transmission of electric energy in interstate commerce under the tariff.”6 Where
2 See OATT Parts IV & VI.3 See Earlier Queue Submittal Task Force at <http://www.pjm.com/committees-and-groups/closed-
groups/eqstf.aspx>.4 See Letter Order, ER16-2518-000 (Oct. 7, 2016).5 157 FERC ¶ 61,212 (2016).6 See OATT § 1 (Transmission Owner).

538 Section 12 Planning
2017 State of the Market Report for PJM
© 2018 Monitoring Analytics, LLC
the transmission owner is a vertically integrated company that also owns generation, there is a potential conflict of interest when the transmission owner evaluates the interconnection requirements of new generation which is a competitor to the generation of the parent company and when the transmission owner evaluates the interconnection requirements of new generation which is part of the same company as the transmission owner. There is also a potential conflict of interest when the transmission owner evaluates the interconnection requirements of a merchant transmission developer which is a competitor of the transmission owner.
Regional Transmission Expansion Plan (RTEP)• The Transmission Expansion Advisory Committee
(TEAC) regularly reviews internal and external proposals to improve transmission reliability throughout PJM. These proposals are periodically presented to the PJM Board of Managers for authorization. In 2017, the PJM Board approved over $1.7 billion in upgrades.
• There are currently three backbone projects under development, Surry Skiffes Creek 500kV, and the conversion of the Marion-Bayonne and Bayway-Linden lines from 138 kV to 345 kV.7
• Through December 31, 2017, PJM has completed two market efficiency cycles. In the first cycle, PJM received 92 proposals for 11 identified issues. In the second market efficiency cycle, PJM received 96 proposals for four identified issues.
• The first Targeted Market Efficiency Process (TMEP) analysis included the investigation of congestion on 50 market to market flowgates. The study resulted in the evaluation of 13 potential upgrades, resulting in the recommendation of five TMEP projects. The five projects address $59 million in historical congestion, with a TMEP benefit of $99.6 million. The projects have a total cost of $20 million, with a 5.0 average benefit/cost ratio. PJM and MISO presented the five recommended projects
7 See “2017 RTEP Process Scope and Input Assumptions White Paper,” P 25. <http://www.pjm.com/-/media/library/reports-notices/2017-rtep/20170731-rtep-input-assumptions-and-scope-whitepaper.ashx?la=en>.
to their boards in December, 2017, and both boards approved all five projects.8
• On April 6, 2017, the PJM Board lifted the suspension of the Artificial Island project. The project is expected to be in service by June 2020.
Transmission Facility Outages• PJM maintains a list of reportable transmission
facilities. When the reportable transmission facilities need to be taken out of service, PJM transmission owners are required to report planned transmission facility outages as early as possible. PJM processes the transmission facility outage requests according to rules in PJM’s Manual 3 to decide if the outage is on time or late and whether or not they will allow the outage.9
• There were 15,613 transmission outage requests submitted in the 2017/2018 planning period. Of the requested outages, 73.4 percent were planned for five days or shorter and 8.5 percent were planned for longer than 30 days. Of the requested outages, 43.7 percent were late according to the rules in PJM’s Manual 3.
RecommendationsThe MMU recommends improvements to the planning process.
• The MMU recommends that PJM continue to incorporate the principle that the goal of transmission planning should be the incorporation of transmission investment decisions into market driven processes as much as possible. (Priority: Low. First reported 2001. Status: Not adopted.)
• The MMU recommends the creation of a mechanism to permit a direct comparison, or competition, between transmission and generation alternatives, including which alternative is less costly and who bears the risks associated with each alternative. (Priority: Low. First reported 2013. Status: Not adopted.)
• The MMU recommends that rules be implemented to permit competition to provide financing for transmission projects. This competition could
8 See PJM. “MISO PJM IPSAC,” (January 12, 2018) <http://www.pjm.com/-/media/committees-groups/stakeholder-meetings/ipsac/20180112/20180112-ipsac-presentation.ashx>.
9 PJM. “Manual 03: Transmission Operations,” Rev. 52 (Dec. 22, 2017) Section 4.

2017 State of the Market Report for PJM 539
Section 12 Planning
© 2018 Monitoring Analytics, LLC
reduce the cost of capital for transmission projects and significantly reduce total costs to customers. (Priority: Low. First reported 2013. Status: Not adopted.)
• The MMU recommends that rules be implemented to require that project cost caps on new transmission projects be part of the evaluation of competing projects. (Priority: Low. First reported 2015. Status: Not adopted.)
• The MMU recommends that barriers to entry be addressed in a timely manner in order to help ensure that the capacity market will result in the entry of new capacity to meet the needs of PJM market participants and reflect the uncertainty and resultant risks in the cost of new entry used to establish the capacity market demand curve in RPM. (Priority: Low. First reported 2012. Status: Not adopted.)
• The MMU recommends that the question of whether Capacity Injection Rights (CIRs) should persist after the retirement of a unit be addressed. Even if the treatment of CIRs remains unchanged, the rules need to ensure that incumbents cannot exploit control of CIRs to block or postpone entry of competitors.10 (Priority: Low. First reported 2013. Status: Not adopted.)
• The MMU recommends outsourcing interconnection studies to an independent party to avoid potential conflicts of interest. Currently, these studies are performed by incumbent transmission owners under PJM’s direction. This creates potential conflicts of interest, particularly when transmission owners are vertically integrated and the owner of transmission also owns generation. (Priority: Low. First reported 2013. Status: Not adopted.)
• The MMU recommends that PJM establish fair terms of access to rights of way and property, such as at substations, in order to remove any barriers to entry and permit competition between incumbent transmission providers and merchant transmission providers in the RTEP. (Priority: Medium. First reported 2014. Status: Not adopted.)
10 See “Comments of the Independent Market Monitor for PJM,” Docket No. ER12-1177-000 <http://www.monitoringanalytics.com/reports/Reports/2012/IMM_Comments_ER12-1177-000_20120312.pdf>.
• The MMU recommends that PJM enhance the transparency and queue management process for merchant transmission investment. Issues related to data access and complete explanations of cost impacts should be addressed. The goal should be to remove barriers to competition from merchant transmission. (Priority: Medium. First reported 2015. Status: Not adopted.)
• The MMU recommends consideration of changing the minimum distribution factor in the allocation from 0.01 to 0.00 and adding a threshold minimum usage impact on the line. (Priority: Medium. First reported 2015. Status: Not adopted.)
• The MMU recommends that PJM reevaluate all transmission outage tickets as on time or late as if they were new requests when an outage is rescheduled and apply the standard rules for late submissions to any such outages. (Priority: Low. First reported 2014. Status: Not adopted.)
• The MMU recommends that PJM draft a clear definition of the congestion analysis required for transmission outage requests to include in Manual 3 after appropriate review. (Priority: Low. First reported 2015. Status: Not adopted.)
• The MMU recommends that PJM modify the rules to reduce or eliminate the approval of late outage requests submitted or rescheduled after the FTR auction bidding opening date. (Priority: Low. First reported 2015. Status: Not adopted.)
• The MMU recommends that PJM not permit transmission owners to divide long duration outages into smaller segments to avoid complying with the requirements for long duration outages. (Priority: Low. First reported 2015. Status: Not adopted.)
• The MMU recommends improvements in queue management including that PJM establish a review process to ensure that projects are removed from the queue if they are not viable, as well as a process to allow commercially viable projects to advance in the queue ahead of projects which have failed to make progress, subject to rules to prevent gaming. (Priority: Medium. First reported 2013. Status: Partially adopted.)
• The MMU recommends an analysis of the study phase of PJM’s transmission planning to reduce the need for postponements of study results, to

540 Section 12 Planning
2017 State of the Market Report for PJM
© 2018 Monitoring Analytics, LLC
efficient and effective as a result. The PJM queue evaluation process should continue to be improved to help ensure that barriers to competition for new generation investments are not created. Issues that need to be addressed include the ownership rights to CIRs, whether transmission owners should perform interconnection studies, and improvements in queue management to ensure that projects are removed from the queue if they are not viable, as well as a process to allow commercially viable projects to advance in the queue ahead of projects which have failed to make progress.
The PJM rules for competitive transmission development through the RTEP should build upon FERC Order No. 1000 to create real competition between incumbent transmission providers and merchant transmission providers. PJM should enhance the transparency and queue management process for merchant transmission investment. Issues related to data access and complete explanations of cost impacts should be addressed. The goal should be to remove barriers to competition from merchant transmission. Another element of opening competition would be to consider transmission owners’ ownership of property and rights of way at or around transmission substations. In many cases, the land acquired included property intended to support future expansion of the grid. Incumbents have included the costs of the property in their rate base. Because PJM now has the responsibility for planning the development of the grid under its RTEP process, property bought to facilitate future expansion should be a part of the RTEP process and be made available to all providers on equal terms.
There are currently no market incentives for transmission owners to submit and complete transmission outages in a timely and efficient manner. Requiring transmission owners to pay does not create an effective incentive when those payments are passed through to transmission customers. The process for the submission of planned transmission outages needs to be carefully reviewed and redesigned to limit the ability of transmission owners to submit transmission outages that are late for FTR auction bid submission dates and are late for the Day-Ahead Energy Market. The submission of late transmission outages can inappropriately affect market outcomes when market participants do not have the ability to modify market bids and offers.
decrease study completion times, and to improve the likelihood that a project at a given phase in the study process will successfully go into service. (Priority: Medium. First reported 2014. Status: Partially adopted.)
• The MMU recommends that PJM limit the scope of supplemental projects that can obtain exceptions to the Order No. 1000 process, to ensure maximum competition. (Priority: Medium. New recommendation. Status: Not adopted.)
ConclusionThe goal of PJM market design should be to enhance competition and to ensure that competition is the driver for all the key elements of PJM markets. But transmission investments have not been fully incorporated into competitive markets. The construction of new transmission facilities has significant impacts on the energy and capacity markets. But when generating units retire or load increases, there is no market mechanism in place that would require direct competition between transmission and generation to meet loads in the affected area. In addition, despite FERC Order No. 1000, there is not yet a transparent, robust and clearly defined mechanism to permit competition to build transmission projects, to ensure that competitors provide a total project cost cap, or to obtain least cost financing through the capital markets.
The addition of a planned transmission project changes the parameters of the capacity auction for the area, changes the amount of capacity needed in the area, changes the capacity market supply and demand fundamentals in the area and may effectively forestall the ability of generation to compete. But there is no mechanism to permit a direct comparison, let alone competition, between transmission and generation alternatives. There is no mechanism to evaluate whether the generation or transmission alternative is less costly, whether there is more risk associated with the generation or transmission alternatives, or who bears the risks associated with each alternative. Creating such a mechanism should be an explicit goal of PJM market design.
Managing the generation queues is a highly complex process. The PJM queue evaluation process has been substantially improved in recent years and it is more

2017 State of the Market Report for PJM 541
Section 12 Planning
© 2018 Monitoring Analytics, LLC
When a project is suspended, PJM extends the scheduled milestones by the duration of the suspension. If, at any time, a milestone is not met, PJM will initiate the termination of the Interconnection Service Agreement (ISA) and the corresponding cancellation costs must be paid by the customer.13
Table 12-1 shows MW in queues by expected completion date and MW changes in the queues between December 31, 2016, and December 31, 2017, for ongoing projects, i.e. projects with the status active, under construction or suspended.14 Projects that are already in service are not included here. The total MW in queues increased by 17,516.2 MW, or 21.4 percent, from 81,936.3 MW at the end of 2016 to 99,452.5 MW on December 31, 2017.
Table 12-1 Queue comparison by expected completion year (MW): December 31, 2016 to December 31, 201715
Year Change
YearAs of
12/31/2016As of
12/31/2017 MW Percent2016 21,064.0 0.0 (21,064.0) (100.0%)2017 12,957.0 10,827.9 (2,129.1) (16.4%)2018 14,859.6 22,367.2 7,507.6 50.5%2019 18,416.5 26,679.1 8,262.6 44.9%2020 10,869.3 24,903.5 14,034.2 129.1%2021 1,925.9 10,983.9 9,058.0 470.3%2022 250.0 3,690.9 3,440.9 1,376.4%2023 0.0 0.0 0.0 0.0%2024 1,594.0 0.0 (1,594.0) (100.0%)Total 81,936.3 99,452.5 17,516.2 21.4%
Table 12-2 shows the project status changes in more detail and how scheduled queue capacity has changed between December 31, 2016, and December 31, 2017. For example, 28,415.2 MW entered the queue between January 1, 2017 and December 31, 2017. Of those 28,415.2 MW, 9,657.3 MW have been withdrawn. Of the total 63,727.4 MW marked as active at the beginning of 2017, 6,941.0 MW were withdrawn, 2,810.1 MW were suspended, 1,705.6 MW started construction, and 398.3 MW went into service by December 31, 2017. The Under Construction column shows that 791.4 MW came out of suspension and 1,705.6 MW began construction in 2017, in addition to the 16,489.3 MW of capacity that maintained the status under construction from December 31, 2016 through December 31, 2017.
13 PJM does not track the duration of suspensions or PJM termination of projects.14 Expected completion dates are entered when the project enters the queue. Actual completion
dates are generally different than expected completion dates.15 Wind and solar capacity in Table 12-1 through Table 12-4 have not been adjusted to reflect
derating.
Planned Generation and RetirementsPlanned Generation AdditionsExpected net revenues provide incentives to build new generation to serve PJM markets. The amount of planned new generation in PJM reflects investors’ perception of the incentives provided by the combination of revenues from the PJM energy, capacity and ancillary service markets. On December 31, 2017, 99,452.5 MW of capacity were in generation request queues for construction through 2024, compared to an installed capacity of 201,496.5 MW as of December 31, 2017. Although it is clear that not all generation in the queues will be built, PJM has added capacity.11 In 2017, 5,124.5 MW of nameplate capacity went into service in PJM.
PJM Generation QueuesGeneration request queues are groups of proposed projects, including new units, reratings of existing units, capacity resources and energy only resources. Each queue is open for a fixed amount of time. Studies commence on all projects in a given queue when that queue closes. The duration of the queue period has varied. Queues A and B were open for a year. Queues C through T were open for six months. Starting in February 2008, Queues U through Y1 were open for three months. Starting in May 2012, the duration of the queue period was reset to six months, starting with Queue Y2. Queue AD1 closed on September 30, 2017. Queue AD2 began on October 1, 2017.
All projects that have been entered in a queue have a status assigned. Projects listed as active are undergoing one of the studies (feasibility, system impact, facility) required to proceed. Other status options are under construction, suspended, and in service. Withdrawn projects are removed from the queue and listed separately. A project cannot be suspended until it has reached the status of under construction. Any project that entered the queue before February 1, 2011, can be suspended for up to three years. Projects that entered the queue after February 1, 2011, face an additional restriction in that the suspension period is reduced to one year if they affect any project later in the queue.12
11 See Monitoring Analytics, “New Generation in the PJM Capacity Market: MW and Funding Sources for Delivery Years 2007/2008 through 2018/2019,” <http://www.monitoringanalytics.com/reports/Reports/2016/New_Generation_in_the_PJM_Capacity_Market_20160504.pdf>.
12 See “PJM Manual 14C Generation and Transmission Interconnection Process,” Rev. 12 (June 22, 2017) Section 3.7

542 Section 12 Planning
2017 State of the Market Report for PJM
© 2018 Monitoring Analytics, LLC
Table 12-2 Change in project status (MW): December 31, 2016 to December 31, 2017Status at 12/31/2017
Status at 12/31/2016Total at
12/31/2016 Active SuspendedUnder
Construction In Service Withdrawn(Entered during 2017) 18,757.8 0.0 0.0 0.0 9,657.3 Active 63,727.4 51,872.4 2,810.1 1,705.6 398.3 6,941.0 Suspended 5,790.0 371.0 3,645.3 791.4 0.0 982.3 Under Construction 24,012.9 108.9 2,900.7 16,489.3 4,228.1 285.9 In Service 46,934.1 0.0 0.0 0.0 46,934.1 0.0 Withdrawn 305,900.6 0.0 0.0 0.0 0.0 305,900.6 Total 446,365.0 71,110.1 9,356.1 18,986.3 51,560.5 323,767.2
Table 12-3 shows the amount of capacity active, in service, under construction, suspended, or withdrawn for each queue since the beginning of the RTEP process and the total amount of capacity that had been included in each queue. All items in queues A-M are either in service or have been withdrawn. As of December 31, 2017, there are 99,452.5 MW of capacity in queues that are not yet in service, of which 9.4 percent are suspended, 19.1 percent are under construction and 71.5 percent have not begun construction.
Table 12-3 Capacity in PJM queues (MW): December 31, 201716
Queue Active In ServiceUnder
Construction Suspended Withdrawn TotalA Expired 31-Jan-98 0.0 8,631.0 0.0 0.0 17,252.0 25,883.0B Expired 31-Jan-99 0.0 4,645.5 0.0 0.0 15,656.7 20,302.2C Expired 31-Jul-99 0.0 531.0 0.0 0.0 3,474.8 4,005.8D Expired 31-Jan-00 0.0 850.6 0.0 0.0 7,369.0 8,219.6E Expired 31-Jul-00 0.0 795.2 0.0 0.0 8,033.8 8,829.0F Expired 31-Jan-01 0.0 52.0 0.0 0.0 3,092.5 3,144.5G Expired 31-Jul-01 0.0 1,189.6 0.0 0.0 17,980.8 19,170.4H Expired 31-Jan-02 0.0 702.5 0.0 0.0 8,421.9 9,124.4I Expired 31-Jul-02 0.0 103.0 0.0 0.0 3,738.3 3,841.3J Expired 31-Jan-03 0.0 42.0 0.0 0.0 846.0 888.0K Expired 31-Jul-03 0.0 99.0 0.0 0.0 485.3 584.3L Expired 31-Jan-04 0.0 256.5 0.0 0.0 4,033.7 4,290.2M Expired 31-Jul-04 0.0 504.8 0.0 0.0 3,705.6 4,210.4N Expired 31-Jan-05 0.0 2,398.8 38.0 0.0 8,090.2 10,527.0O Expired 31-Jul-05 0.0 1,668.2 437.0 0.0 5,466.8 7,572.0P Expired 31-Jan-06 0.0 3,037.3 253.0 0.0 5,320.5 8,610.8Q Expired 31-Jul-06 0.0 3,147.9 0.0 0.0 11,385.7 14,533.6R Expired 31-Jan-07 0.0 1,986.4 60.0 1,240.0 19,468.9 22,755.3S Expired 31-Jul-07 0.0 3,669.5 0.0 70.0 12,396.5 16,136.0T Expired 31-Jan-08 0.0 3,014.0 1,208.0 300.0 23,013.3 27,535.3U Expired 31-Jan-09 200.0 837.3 649.9 820.0 30,829.6 33,336.8V Expired 31-Jan-10 390.0 2,748.6 36.1 761.0 12,877.6 16,813.3W Expired 31-Jan-11 663.0 2,175.7 837.1 618.8 19,759.2 24,053.7X Expired 31-Jan-12 1,687.5 4,601.2 3,258.9 1,979.0 18,816.3 30,343.0Y Expired 30-Apr-13 470.5 2,433.1 3,036.6 267.2 19,532.2 25,739.5Z Expired 30-Apr-14 997.0 714.4 5,543.4 114.3 6,931.5 14,300.7AA1 Expired 31-Oct-14 3,542.3 199.8 2,215.0 396.1 5,645.5 11,998.7AA2 Expired 30-Apr-15 4,814.2 320.9 676.5 2,474.9 7,779.8 16,066.3AB1 Expired 31-Oct-15 11,863.1 64.0 715.9 170.7 7,629.9 20,443.6AB2 Expired 31-Mar-16 10,854.9 122.1 20.9 103.6 4,163.0 15,264.5AC1 Through 30-Sep-16 16,538.4 18.7 0.0 40.5 3,490.8 20,088.5AC2 Through 30-Apr-17 6,612.7 0.0 0.0 0.0 5,772.0 12,384.7AD1 Through 30-Sep-17 10,482.8 0.0 0.0 0.0 1,225.0 11,707.8AD2 Through 30-Apr-18 1,993.7 0.0 0.0 0.0 82.4 2,076.1Total 71,110.1 51,560.5 18,986.3 9,356.1 323,767.2 474,780.1
16 Projects listed as partially in service are counted as in service for the purposes of this analysis.
2017 State of the Market Report for PJM 543
Section 12 Planning
© 2018 Monitoring Analytics, LLC
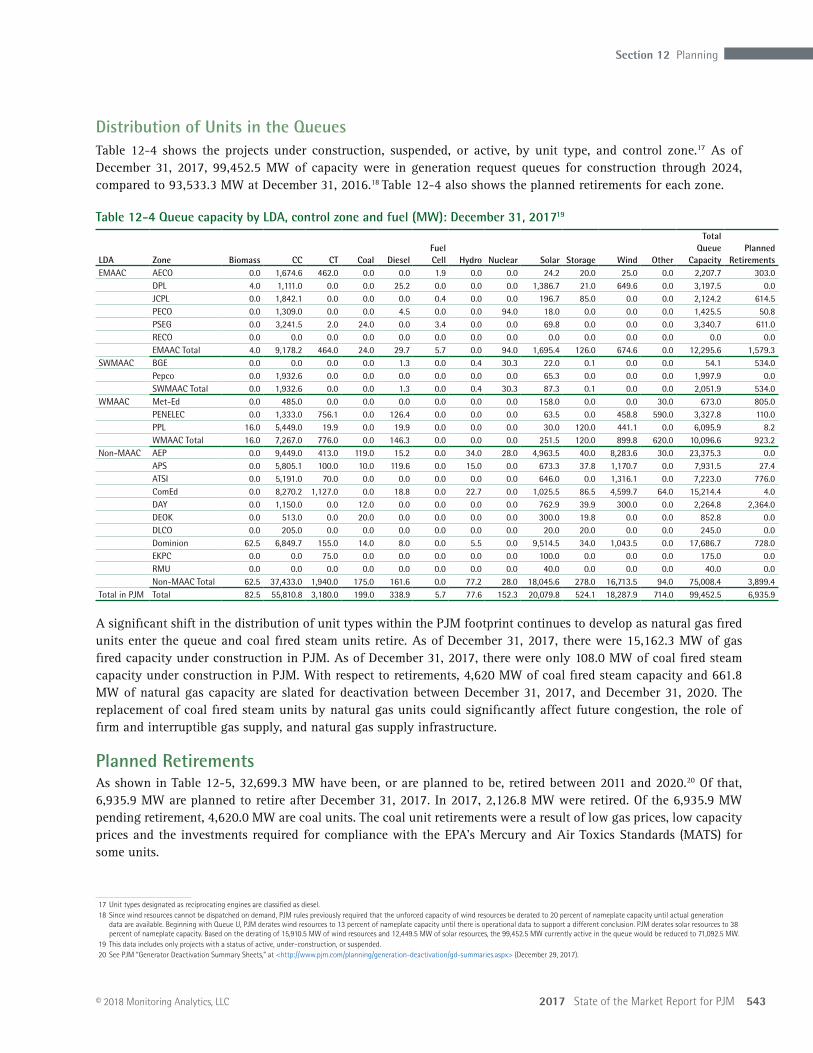
Distribution of Units in the QueuesTable 12-4 shows the projects under construction, suspended, or active, by unit type, and control zone.17 As of December 31, 2017, 99,452.5 MW of capacity were in generation request queues for construction through 2024, compared to 93,533.3 MW at December 31, 2016.18 Table 12-4 also shows the planned retirements for each zone.
Table 12-4 Queue capacity by LDA, control zone and fuel (MW): December 31, 201719
LDA Zone Biomass CC CT Coal DieselFuel Cell Hydro Nuclear Solar Storage Wind Other
Total Queue
CapacityPlanned
RetirementsEMAAC AECO 0.0 1,674.6 462.0 0.0 0.0 1.9 0.0 0.0 24.2 20.0 25.0 0.0 2,207.7 303.0
DPL 4.0 1,111.0 0.0 0.0 25.2 0.0 0.0 0.0 1,386.7 21.0 649.6 0.0 3,197.5 0.0JCPL 0.0 1,842.1 0.0 0.0 0.0 0.4 0.0 0.0 196.7 85.0 0.0 0.0 2,124.2 614.5PECO 0.0 1,309.0 0.0 0.0 4.5 0.0 0.0 94.0 18.0 0.0 0.0 0.0 1,425.5 50.8PSEG 0.0 3,241.5 2.0 24.0 0.0 3.4 0.0 0.0 69.8 0.0 0.0 0.0 3,340.7 611.0RECO 0.0 0.0 0.0 0.0 0.0 0.0 0.0 0.0 0.0 0.0 0.0 0.0 0.0 0.0EMAAC Total 4.0 9,178.2 464.0 24.0 29.7 5.7 0.0 94.0 1,695.4 126.0 674.6 0.0 12,295.6 1,579.3
SWMAAC BGE 0.0 0.0 0.0 0.0 1.3 0.0 0.4 30.3 22.0 0.1 0.0 0.0 54.1 534.0Pepco 0.0 1,932.6 0.0 0.0 0.0 0.0 0.0 0.0 65.3 0.0 0.0 0.0 1,997.9 0.0SWMAAC Total 0.0 1,932.6 0.0 0.0 1.3 0.0 0.4 30.3 87.3 0.1 0.0 0.0 2,051.9 534.0
WMAAC Met-Ed 0.0 485.0 0.0 0.0 0.0 0.0 0.0 0.0 158.0 0.0 0.0 30.0 673.0 805.0PENELEC 0.0 1,333.0 756.1 0.0 126.4 0.0 0.0 0.0 63.5 0.0 458.8 590.0 3,327.8 110.0PPL 16.0 5,449.0 19.9 0.0 19.9 0.0 0.0 0.0 30.0 120.0 441.1 0.0 6,095.9 8.2WMAAC Total 16.0 7,267.0 776.0 0.0 146.3 0.0 0.0 0.0 251.5 120.0 899.8 620.0 10,096.6 923.2
Non-MAAC AEP 0.0 9,449.0 413.0 119.0 15.2 0.0 34.0 28.0 4,963.5 40.0 8,283.6 30.0 23,375.3 0.0APS 0.0 5,805.1 100.0 10.0 119.6 0.0 15.0 0.0 673.3 37.8 1,170.7 0.0 7,931.5 27.4ATSI 0.0 5,191.0 70.0 0.0 0.0 0.0 0.0 0.0 646.0 0.0 1,316.1 0.0 7,223.0 776.0ComEd 0.0 8,270.2 1,127.0 0.0 18.8 0.0 22.7 0.0 1,025.5 86.5 4,599.7 64.0 15,214.4 4.0DAY 0.0 1,150.0 0.0 12.0 0.0 0.0 0.0 0.0 762.9 39.9 300.0 0.0 2,264.8 2,364.0DEOK 0.0 513.0 0.0 20.0 0.0 0.0 0.0 0.0 300.0 19.8 0.0 0.0 852.8 0.0DLCO 0.0 205.0 0.0 0.0 0.0 0.0 0.0 0.0 20.0 20.0 0.0 0.0 245.0 0.0Dominion 62.5 6,849.7 155.0 14.0 8.0 0.0 5.5 0.0 9,514.5 34.0 1,043.5 0.0 17,686.7 728.0EKPC 0.0 0.0 75.0 0.0 0.0 0.0 0.0 0.0 100.0 0.0 0.0 0.0 175.0 0.0RMU 0.0 0.0 0.0 0.0 0.0 0.0 0.0 0.0 40.0 0.0 0.0 0.0 40.0 0.0Non-MAAC Total 62.5 37,433.0 1,940.0 175.0 161.6 0.0 77.2 28.0 18,045.6 278.0 16,713.5 94.0 75,008.4 3,899.4
Total in PJM Total 82.5 55,810.8 3,180.0 199.0 338.9 5.7 77.6 152.3 20,079.8 524.1 18,287.9 714.0 99,452.5 6,935.9
A significant shift in the distribution of unit types within the PJM footprint continues to develop as natural gas fired units enter the queue and coal fired steam units retire. As of December 31, 2017, there were 15,162.3 MW of gas fired capacity under construction in PJM. As of December 31, 2017, there were only 108.0 MW of coal fired steam capacity under construction in PJM. With respect to retirements, 4,620 MW of coal fired steam capacity and 661.8 MW of natural gas capacity are slated for deactivation between December 31, 2017, and December 31, 2020. The replacement of coal fired steam units by natural gas units could significantly affect future congestion, the role of firm and interruptible gas supply, and natural gas supply infrastructure.
Planned RetirementsAs shown in Table 12-5, 32,699.3 MW have been, or are planned to be, retired between 2011 and 2020.20 Of that, 6,935.9 MW are planned to retire after December 31, 2017. In 2017, 2,126.8 MW were retired. Of the 6,935.9 MW pending retirement, 4,620.0 MW are coal units. The coal unit retirements were a result of low gas prices, low capacity prices and the investments required for compliance with the EPA’s Mercury and Air Toxics Standards (MATS) for some units.
17 Unit types designated as reciprocating engines are classified as diesel.18 Since wind resources cannot be dispatched on demand, PJM rules previously required that the unforced capacity of wind resources be derated to 20 percent of nameplate capacity until actual generation
data are available. Beginning with Queue U, PJM derates wind resources to 13 percent of nameplate capacity until there is operational data to support a different conclusion. PJM derates solar resources to 38 percent of nameplate capacity. Based on the derating of 15,910.5 MW of wind resources and 12,449.5 MW of solar resources, the 99,452.5 MW currently active in the queue would be reduced to 71,092.5 MW.
19 This data includes only projects with a status of active, under-construction, or suspended.20 See PJM “Generator Deactivation Summary Sheets,” at <http://www.pjm.com/planning/generation-deactivation/gd-summaries.aspx> (December 29, 2017).

544 Section 12 Planning
2017 State of the Market Report for PJM
© 2018 Monitoring Analytics, LLC
Table 12-5 Summary of PJM unit retirements by fuel (MW): 2011 through 2020
Battery Coal DieselHeavy
Oil Hydro KeroseneLandfill
GasLight
OilNatural
Gas NuclearWaste
Coal WindWood Waste Total
Retirements 2011 0.0 543.0 0.0 0.0 0.0 0.0 0.0 131.0 522.5 0.0 0.0 0.0 0.0 1,196.5 Retirements 2012 0.0 5,907.9 0.0 0.0 0.0 0.0 0.0 788.0 250.0 0.0 0.0 0.0 16.0 6,961.9 Retirements 2013 0.0 2,558.9 2.9 166.0 0.0 0.0 7.0 3.0 82.0 0.0 31.0 0.0 8.0 2,858.8 Retirements 2014 0.0 2,239.0 50.0 0.0 0.0 184.0 15.3 188.0 294.0 0.0 0.0 0.0 0.0 2,970.3 Retirements 2015 0.0 7,064.8 0.0 0.0 0.0 644.2 2.0 222.3 1,319.0 0.0 0.0 10.4 0.0 9,262.7 Retirements 2016 0.0 243.0 51.0 0.0 0.5 0.0 9.9 22.0 74.0 0.0 0.0 0.0 0.0 400.4 Retirements 2017 40.0 2,038.0 0.0 0.0 0.0 0.0 0.8 0.0 34.0 0.0 0.0 0.0 0.0 2,112.8 Planned Retirements (2018 and later) 27.4 4,620.0 2.4 148.0 0.0 0.0 4.0 52.8 661.8 1,419.5 0.0 0.0 0.0 6,935.9 Total 67.4 25,214.6 106.3 314.0 0.5 828.2 39.0 1,407.1 3,237.3 1,419.5 31.0 10.4 24.0 32,699.3
A map of the retirements between 2011 and 2020 is shown in Figure 12-1 with a mapping to unit names identified in Table 12-6.
Figure 12-1 Map of PJM unit retirements: 2011 through 2020

2017 State of the Market Report for PJM 545
Section 12 Planning
© 2018 Monitoring Analytics, LLC
Table 12-6 Unit identification for map of PJM unit retirements: 2011 through 2020 ID Unit ID Unit ID Unit ID Unit ID Unit ID Unit1 AES Beaver Valley 36 Clinch River 3 71 GUDE Landfill 106 McKee 1 141 Rolling Hills Landfill Generator 176 Walter C Beckjord 5-62 Albright 1 37 Columbia Dam Hydro 72 Gilbert 1-4 107 McKee 2 142 SMART Paper 177 Walter C Beckjord GT 1-43 Albright 2 38 Colver Power Project 73 Glen Gardner 1-8 108 Mercer 1 143 Sammis 1-4 178 Warren County Landfill4 Albright 3 39 Conesville 3 74 Glen Lyn 5-6 109 Mercer 2 144 Schuylkill 1 178 Werner 1-45 Armstrong 1 40 Crane 1 75 Harrisburg 4 CT 110 Mercer 3 145 Schuylkill Diesel 180 Will County 36 Armstrong 2 41 Crane 2 76 Hatfield’s Ferry 1 111 Miami Fort 6 146 Sewaren 1 151 Willow Island 17 Arnold (Green Mtn. Wind Farm 42 Crane GT1 77 Hatfield’s Ferry 2 112 Middle 1-3 147 Sewaren 2 152 Willow Island 28 Ashtabula 5 43 Crawford 7 78 Hatfield’s Ferry 3 113 Missouri Ave B,C,D 148 Sewaren 3 153 Winnebago Landfill9 Avon Lake 7 44 Crawford 8 79 Hopewell James River Cogeneration 114 Mitchell 2 149 Sewaren 4 154 Yorktown 1-210 BL England 1 45 Cromby 1 80 Howard Down 10 115 Mitchell 3 150 Sewaren 611 BL England 2 46 Cromby 2 81 Hudson 1 116 Modern Power Landfill NUG 151 Sporn 1-412 BL England 3 47 Cromby D 82 Hudson 2 117 Muskingum River 1-5 152 Sporn 513 BL England Diesel Units 1-4 48 Dale 1-2 83 Hutchings 1-3, 5-6 118 National Park 1 153 Spruance NUG1 (Rich 1-2)14 Bay Shore 1 49 Dale 3 84 Hutchings 4 119 Niles 1 154 Spruance NUG2 (Rich 3-4)15 Bay Shore 2 50 Dale 4 85 Indian River 1 120 Niles 2 155 State Line 316 Bay Shore 3 51 Deepwater 1 86 Indian River 3 121 Oyster Creek 156 State Line 417 Bay Shore 4 52 Deepwater 6 87 Ingenco Petersburg 122 Perryman 2 157 Stuart 118 Bayonne Cogen Plant (CC) 53 Dixon Lee Landfill Generator 88 Kanawha River 1-2 123 Picway 5 158 Stuart 219 Benning 15 54 Eastlake 1 89 Kanmer 1-3 124 Piney Creek NUG 159 Stuart 320 Benning 16 55 Eastlake 2 90 Kearny 10 125 Portland 1 160 Stuart 421 Bergen 3 56 Eastlake 3 91 Kearny 11 126 Portland 2 161 Stuart Diesels 1-422 Big Sandy 2 57 Eastlake 4 92 Kearny 9 127 Potomac River 1 162 Stuart Diesels 1-423 Brunner Island Diesels 58 Eastlake 5 93 Killen 2 128 Potomac River 2 163 Sunbury 1-424 Brunot Island 1B 59 Eddystone 1 94 Killen CT 129 Potomac River 3 164 Tait Battery25 Brunot Island 1C 60 Eddystone 2 95 Kinsley Landfill 130 Potomac River 4 165 Tanners Creek 1-426 Burger 3 61 Edgecomb NUG (Rocky 1-2) 96 Kitty Hawk GT 1 131 Potomac River 5 166 Three Mile Island Unit 127 Burger EMD 62 Edison 1-3 97 Kitty Hawk GT 2 132 Pottstown LF (Moser) 167 Titus 128 Burlington 8,11 63 Elrama 1 98 Koppers Co. IPP 133 R Paul Smith 3 168 Titus 229 Burlington 9 64 Elrama 2 99 Lake Kingman 134 R Paul Smith 4 169 Titus 330 Buzzard Point East Banks 1,2,4-8 65 Elrama 3 100 Lake Shore 18 135 Riverside 4 170 Viking Energy NUG31 Buzzard Point West Banks 1-9 66 Elrama 4 101 Lake Shore EMD 136 Riverside 6 171 Wagner 232 Cedar 1 67 Essex 10-11 102 Laurel Mountain Battery 137 Riversville 5 172 Walter C Beckjord 133 Cedar 2 68 Essex 12 103 MH50 Markus Hook Co-gen 138 Riversville 6 173 Walter C Beckjord 234 Chesapeake 1-4 69 Fauquier County Landfill 104 Mad River CTs A 139 Roanoke Valley 1 174 Walter C Beckjord 335 Chesapeake 7-10 70 Fisk Street 19 105 Mad River CTs B 140 Roanoke Valley 2 175 Walter C Beckjord 4
The list of pending retirements is shown in Table 12-7.

546 Section 12 Planning
2017 State of the Market Report for PJM
© 2018 Monitoring Analytics, LLC
Table 12-7 Planned retirement of PJM units: December 31, 201721
Unit Zone ICAP (MW) Fuel Unit Type
Projected Deactivation
Date BL England 3 AECO 148.0 Heavy Oil Steam 24-Jan-18 Brunner Island Diesels PPL 8.2 Light Oil Diesel 25-Feb-18 Dixon Lee Landfill Generator ComEd 4.0 Landfill Gas Diesel 06-Mar-18 Yorktown 1-2 Dominion 323.0 Coal Steam 13-Mar-18 Laurel Mountain Battery APS 27.4 Battery Battery 16-Mar-18 Hopewell James River Cogeneration Dominion 89.0 Coal Steam 31-May-18 Crane 1 BGE 190.0 Coal Steam 01-Jun-18 Crane 2 BGE 195.0 Coal Steam 01-Jun-18 Killen 2 DAY 600.0 Coal Steam 01-Jun-18 Stuart 2 DAY 577.0 Coal Steam 01-Jun-18 Stuart 3 DAY 577.0 Coal Steam 01-Jun-18 Stuart 4 DAY 577.0 Coal Steam 01-Jun-18 Stuart Diesels 1-4 DAY 2.4 Diesel Diesel 01-Jun-18 Killen CT DAY 24.0 Light Oil CT 01-Jun-18 Stuart Diesels 1-4 DAY 6.6 Light Oil Diesel 01-Jun-18 Sewaren 1 PSEG 104.0 Natural Gas Steam 01-Jun-18 Sewaren 2 PSEG 118.0 Natural Gas Steam 01-Jun-18 Sewaren 3 PSEG 107.0 Natural Gas Steam 01-Jun-18 Sewaren 4 PSEG 124.0 Natural Gas Steam 01-Jun-18 Bayonne Cogen Plant (CC) PSEG 158.0 Natural Gas Steam 01-Nov-18 Spruance NUG1 (aka Spruance 1 Rich 1-2) Dominion 115.5 Coal Steam 12-Jan-19 Spruance NUG2 (aka Spruance 2 Rich 3-4) Dominion 85.0 Coal Steam 12-Jan-19 BL England 2 AECO 155.0 Coal Steam 30-Apr-19 MH50 Markus Hook Co-gen PECO 50.8 Natural Gas Steam 13-May-19 Three Mile Island Unit 1 Nuclear Generating Station Met-Ed 805.0 Nuclear Nuclear 30-Sep-19 Crane GT1 BGE 14.0 Light Oil CT 31-Oct-19 Oyster Creek Nuclear Generating Station JCPL 614.5 Nuclear Nuclear 31-Dec-19 Sammis 1-4 ATSI 640.0 Coal Steam 31-May-20 Wagner 2 BGE 135.0 Coal Steam 01-Jun-20 Colver Power Project PENELEC 110.0 Coal Steam 01-Sep-20 Bay Shore 1 ATSI 136.0 Coal Steam 01-Oct-20 Edgecomb NUG (aka Edgecomb Rocky 1-2) Dominion 115.5 Coal Steam 31-Oct-20Total 6,935.9
Table 12-8 shows the capacity, average size, and average age of units retiring in PJM, from 2011 through 2020, while Table 12-9 shows these retirements by state. The majority, 77.1 percent, of all MW retiring during this period are coal fired steam units. These coal fired steam units have an average age of 54.2 years and an average size of 172.7 MW. Over half of the retiring coal fired steam units, 55.0 percent, are located in either Ohio or Pennsylvania. Retirements have generally consisted of smaller subcritical coal fired steam units and those without adequate environmental controls to remain viable beyond 2017.
21 Units designated as external installed capacity have been removed.

2017 State of the Market Report for PJM 547
Section 12 Planning
© 2018 Monitoring Analytics, LLC
Table 12-8 Retirements by fuel type: 2011 through 2020
FuelNumber of
UnitsAvg. Size
(MW)
Avg. Age at Retirement
(Years) Total MW Percent Battery 2 33.7 6.5 67.4 0.2% Coal 146 172.7 54.2 25,214.6 77.1% Diesel 5 21.3 39.8 106.3 0.3% Heavy Oil 2 157.0 48.9 314.0 1.0% Hydro 1 0.5 113.8 0.5 0.0% Kerosene 20 41.4 45.5 828.2 2.5% Landfill Gas 10 3.9 13.1 39.0 0.1% Light Oil 32 44.0 43.6 1,407.1 4.3% Natural Gas 55 58.9 47.3 3,237.3 9.9% Nuclear 2 709.8 47.8 1,419.5 4.3% Waste Coal 1 31.0 20.3 31.0 0.1% Wind 1 10.4 15.6 10.4 0.0% Wood Waste 2 12.0 23.2 24.0 0.1% Total 279 117.2 48.8 32,699.3 100.0%
Table 12-9 Retirements (MW) by fuel type and state: 2011 through 2020
State Battery Coal Diesel Heavy Oil Hydro KeroseneLandfill
Gas Light OilNatural
Gas NuclearWaste
Coal WindWood Waste Total
DC 0.0 0.0 0.0 0.0 0.0 0.0 0.0 788.0 0.0 0.0 0.0 0.0 0.0 788.0DE 0.0 254.0 0.0 0.0 0.0 0.0 0.0 0.0 34.0 0.0 0.0 0.0 0.0 288.0IL 0.0 1,624.0 0.0 0.0 0.0 0.0 10.4 0.0 0.0 0.0 0.0 0.0 0.0 1,634.4IN 0.0 982.0 0.0 0.0 0.0 0.0 0.0 0.0 0.0 0.0 0.0 0.0 0.0 982.0KY 0.0 995.0 0.0 0.0 0.0 0.0 0.0 0.0 0.0 0.0 0.0 0.0 0.0 995.0MD 0.0 635.0 51.0 0.0 0.0 0.0 0.8 14.0 189.0 0.0 0.0 0.0 0.0 889.8NC 0.0 324.5 0.0 0.0 0.0 0.0 0.0 31.0 0.0 0.0 0.0 0.0 0.0 355.5NJ 0.0 1,543.0 0.0 148.0 0.5 828.2 9.8 220.0 2,680.5 614.5 0.0 0.0 0.0 6,044.5OH 40.0 9,248.6 52.4 0.0 0.0 0.0 0.0 228.9 0.0 0.0 0.0 0.0 0.0 9,569.9PA 0.0 4,627.0 0.0 166.0 0.0 0.0 16.0 57.9 333.8 805.0 31.0 10.4 24.0 6,071.1VA 0.0 2,340.5 2.9 0.0 0.0 0.0 2.0 67.3 0.0 0.0 0.0 0.0 0.0 2,412.7WV 27.4 2,641.0 0.0 0.0 0.0 0.0 0.0 0.0 0.0 0.0 0.0 0.0 0.0 2,668.4Total 67.4 25,214.6 106.3 314.0 0.5 828.2 39.0 1,407.1 3,237.3 1,419.5 31.0 10.4 24.0 32,699.3
Generation Deactivations in 2017Table 12-10 shows the units that were deactivated in 2017.
Table 12-10 Unit deactivations in 2017
Company Unit Name ICAP (MW) Primary FuelZone
NameAverage Age
(Years)Retirement
Date Dominion Resources, Inc. Roanoke Valley 1 165.0 Coal Dominion 22.8 01-Mar-17 Dominion Resources, Inc. Roanoke Valley 2 44.0 Coal Dominion 21.8 01-Mar-17 City of Dover McKee 1 17.0 Natural Gas DPL 55.4 31-May-17 City of Dover McKee 2 17.0 Natural Gas DPL 55.3 31-May-17 Public Service Enterprise Group Incorporated Hudson 2 620.0 Coal PSEG 48.5 01-Jun-17 Public Service Enterprise Group Incorporated Mercer 1 316.0 Coal PSEG 56.5 01-Jun-17 Public Service Enterprise Group Incorporated Mercer 2 316.0 Coal PSEG 56.0 01-Jun-17 Northeast Maryland Waste Disposal Authority GUDE Landfill 0.8 Landfill Gas Pepco 8.8 24-Aug-17 Dynegy Inc. Stuart 1 225.0 Coal DAY 46.5 30-Sep-17 The AES Corporation Stuart 1 202.0 Coal DAY 46.5 30-Sep-17 American Electric Power Company, Inc. Stuart 1 150.0 Coal DAY 46.5 30-Sep-17 The AES Corporation Tait Battery 40.0 Battery DAY 4.4 13-Dec-17 Total 2,112.8

548 Section 12 Planning
2017 State of the Market Report for PJM
© 2018 Monitoring Analytics, LLC
Existing Generation MixAs of December 31, 2017, PJM had an installed capacity of 201,496.5 MW (Table 12-11). This measure differs from capacity market installed capacity because it includes energy-only units, excludes all external units, and uses nameplate values for solar and wind resources.
Table 12-11 Existing PJM capacity: December 31, 2017 (By zone and unit type (MW))22
ZONE CC CT Coal Diesel Fuel Cell Hydro Nuclear Solar Storage Wind Other Total AECO 901.9 570.7 613.9 14.6 1.6 0.0 0.0 59.4 0.0 7.5 202.0 2,371.5 AEP 6,840.0 3,682.2 18,159.8 80.3 0.0 1,071.9 2,071.0 14.7 6.0 2,474.0 738.0 35,137.9 APS 1,749.0 1,560.9 5,409.0 47.9 0.0 129.2 0.0 46.1 78.9 1,191.5 0.0 10,212.5 ATSI 1,570.5 1,618.3 5,394.0 63.7 0.0 0.0 2,134.0 0.0 0.0 0.0 325.0 11,105.5 BGE 0.0 936.6 2,098.0 22.4 0.0 0.4 1,716.0 1.1 0.0 0.0 823.5 5,598.0 ComEd 3,146.1 7,244.0 3,840.1 109.1 0.0 0.0 10,473.5 9.0 127.6 3,081.9 1,326.0 29,357.3 DAY 0.0 1,368.5 2,331.0 47.5 0.0 0.0 0.0 1.1 40.0 0.0 0.0 3,788.1 DEOK 47.2 654.0 3,934.0 4.8 0.0 112.0 0.0 0.0 20.0 0.0 47.0 4,819.0 DLCO 244.0 15.0 660.0 0.0 0.0 6.3 1,777.0 0.0 0.0 0.0 0.0 2,702.3 Dominion 8,371.6 4,092.7 4,903.6 171.8 0.0 3,589.3 3,581.3 337.6 0.0 208.0 2,662.4 27,918.3 DPL 2,498.5 1,820.4 437.0 162.1 30.0 0.0 0.0 213.4 0.0 0.0 1,149.0 6,310.4 EKPC 0.0 774.0 1,687.0 0.0 0.0 70.0 0.0 0.0 0.0 0.0 0.0 2,531.0 JCPL 2,682.5 763.1 0.0 16.1 0.0 400.0 614.5 260.6 0.0 0.0 25.5 4,762.3 Met-Ed 2,630.8 401.7 35.0 33.4 0.0 19.5 805.0 0.0 0.0 0.0 165.0 4,090.4 PECO 3,209.0 834.0 3.3 2.9 0.0 3,284.0 4,546.8 3.0 1.0 0.0 975.8 12,859.8 PENELEC 850.0 407.5 6,056.5 150.0 0.0 590.8 0.0 0.0 28.4 958.8 743.0 9,785.0 Pepco 1,827.0 1,204.7 2,433.0 11.1 0.0 0.0 0.0 0.0 0.0 0.0 1,216.1 6,691.9 PPL 2,657.9 616.5 2,225.5 55.5 0.0 706.6 2,520.0 15.0 20.0 219.7 2,944.4 11,981.1 PSEG 4,000.3 1,134.0 0.0 11.1 0.0 5.0 3,493.0 182.7 4.0 0.0 644.1 9,474.2 RECO 0.0 0.0 0.0 0.0 0.0 0.0 0.0 0.0 0.0 0.0 0.0 0.0 Total 43,226.3 29,698.8 60,220.7 1,004.3 31.6 9,985.0 33,732.1 1,143.7 325.9 8,141.4 13,986.8 201,496.5
Figure 12-2 and Table 12-12 show the age of PJM generators by unit type. Units older than 40 years comprise 80,669.0 MW, or 40.0 percent, of the total capacity of 201,496.5 MW.
Table 12-12 PJM capacity (MW) by age (years): December 31, 2017Age (years) CC CT Coal Diesel Fuel Cell Hydro Nuclear Solar Storage Wind Other Total Less than 20 36,420.8 21,072.4 3,250.0 666.8 31.6 339.7 0.0 1,143.7 325.9 8,141.4 247.9 71,640.1 20 to 40 6,273.5 4,441.8 14,632.8 117.9 0.0 3,493.2 18,018.9 0.0 0.0 0.0 2,209.3 49,187.4 40 to 60 532.0 4,184.6 41,790.4 215.6 0.0 4,133.0 15,713.2 0.0 0.0 0.0 9,946.1 76,514.9 Greater than 60 0.0 0.0 547.5 4.0 0.0 2,019.1 0.0 0.0 0.0 0.0 1,583.5 4,154.1 Total 43,226.3 29,698.8 60,220.7 1,004.3 31.6 9,985.0 33,732.1 1,143.7 325.9 8,141.4 13,986.8 201,496.5
Figure 12-2 PJM capacity (MW) by age (years): December 31, 2017
0
5,000
10,000
15,000
20,000
25,000
30,000
35,000
40,000
45,000
CC CT Coal Diesel Fuel Cell Hydro Nuclear Solar Storage Wind Other
MW in
Ser
vice
Unit Type
Less than 20 years20 to 40 years40 to 60 yearsGreater than 60 years
22 The capacity described in this section refers to all capacity in PJM at the summer installed capacity rating, regardless of whether the capacity entered the RPM Auction. This table previously included external units.

2017 State of the Market Report for PJM 549
Section 12 Planning
© 2018 Monitoring Analytics, LLC
EQSTF proposed that these project costs be assigned directly to the developer that submitted the project. This would significantly increase the cost burden that developers would experience if a project is found to be deficient in the review process.
The EQSTF proposed to change the timing of queue windows and Feasibility Study dates to enable more generation projects to participate in the PJM Base Residual Auction. The EQSTF proposed shifting start dates for the queue windows back a month from May 1 to April 1 and Nov 1 to October 1. The EQSTF also proposed shifting feasibility study dates from Dec 1 to Nov 1 and June 1 to May 1.
Revisions to the OATT developed by the EQSTF were approved by the FERC effective October 31, 2016.25 The revised OATT completed the EQSTF work assignment. The final meeting of the EQSTF was held on March 21, 2016.
On December 15, 2016, the Commission issued a notice of proposed rulemaking proposing additional queue reforms intended to improve certainty, promote more informed interconnection, and enhance interconnection processes.
Interconnection Queue AnalysisIn the study phase of the interconnection planning process, a series of studies are performed to determine the feasibility, impact, and cost of projects in the queue. Table 12-13 is an overview of PJM’s study process. System impact and facilities studies are often redone when a project is withdrawn in order to determine the impact on the projects remaining in the queue.
25 See Letter Order, ER16-2518-000 (Oct. 7, 2016).
Generation and Transmission Interconnection Planning ProcessPJM made changes to the queue process in May 2012.23 These changes included reducing the length of the queues, creating an alternate queue for some small projects, and adjustments to the rules regarding suspension rights and Capacity Interconnection Rights (CIR). PJM staff reported on June 11, 2015, that due to these and other process improvements, the study backlog has been significantly reduced. The Earlier Queue Submittal Task Force (EQSTF) was established in August 2015, to further address the issue.24
The Earlier Queue Submittal Task ForceIn 2015 and 2016, participants of the Earlier Queue Submittal Task Force (EQSTF) drafted rule changes to the Interconnection Queue process meant to address high levels of deficient project applications being submitted to PJM for review.
To discourage incomplete interconnection project requests, the EQSTF proposed to only assign queue positions for project applications that had submitted all required project elements including site control. In addition, all project applications would be required to remedy any deficiencies by the end of the queue window in order to be considered in feasibility studies or be terminated and withdrawn. Queue positions had historically been assigned to project developers that paid the study deposit and submitted a project application by the appropriate submission deadline. Project applications with missing information were assigned queue numbers so long as these two criteria were met.
The EQSTF also proposed rule changes to interconnection study fee structures that would discourage the submission of speculative or incomplete queue projects. Under the old rules, deposits provided by developers for interconnection studies could not be charged until after a queue position was accepted. Under the new rules, these deposits would be available for charging before a queue position is assigned.
In addition, rather than socializing the study costs for deficient applications from project developers, the
23 See PJM Interconnection, L.L.C., Docket No. ER12-1177 (Feb. 29, 2012).24 See Earlier Queue Submittal Task Force at <http://www.pjm.com/committees-and-groups/closed-
groups/eqstf.aspx>.

550 Section 12 Planning
2017 State of the Market Report for PJM
© 2018 Monitoring Analytics, LLC
Table 12-15 and Table 12-16 show the time spent at various stages in the queue process and the completion time for the studies performed. For completed projects, there is an average time of 1,007 days, or 2.8 years, between entering a queue and going into service. For withdrawn projects, there is an average time of 650 days, or 1.8 years, between entering a queue and withdrawing.
Table 12-15 Average project queue times (days): December 31, 2017
StatusAverage
(Days)Standard Deviation Minimum Maximum
Active 945 528 99 3,745In-Service 1,007 720 1 4,024Suspended 2,059 1,150 696 4,773Under Construction 1,928 1,049 473 4,977Withdrawn 650 685 1 4,249
Average Time in QueueTable 12-16 presents information on the time in the stages of the queue for those projects not yet in service. Of the 826 projects in the queue as of December 31, 2017, 62 had a completed feasibility study and 127 were under construction.
Table 12-13 PJM generation planning process
Process Step Start on Financial ObligationDays for PJM to
CompleteDays for Applicant to Decide
Whether to ContinueFeasibility Study Close of current queue Cost of study (partially
refundable deposit)90 30
System Impact Study Upon acceptance of the System Impact Study Agreement
Cost of study (partially refundable deposit)
120 30
Facilities Study Upon acceptance of the Facilities Study Agreement
Cost of study (refundable deposit)
Varies 60
Schedule of Work Upon acceptance of Interconnection Service
Agreement (ISA)
Letter of credit for upgrade costs
Varies 37
Construction (only for new generation)
Upon acceptance of Interconnection Construction
Service Agreement (ICSA)
None Varies NA
Manual 14B requires PJM to apply a commercial probability factor at the feasibility study stage to improve the accuracy of capacity and cost estimates. The commercial probability factor is based on the historical incidence of projects dropping out of the queue at the impact study stage.26 The impact and facilities studies are performed using the full amount of planned generation in the queues. The actual withdrawal rates are shown in Table 12-14 and Table 12-15.
Withdrawn ProjectsTable 12-14 shows the milestone status when projects were withdrawn, for all withdrawn projects. Of the projects withdrawn, 52.9 percent were withdrawn before the system impact study was completed. Once an Interconnection Service Agreement (ISA) or a Wholesale Market Participation Agreement (WMPA) is executed, the financial obligation for any necessary transmission upgrades cannot be retracted.27 28 Withdrawing at or beyond this point is uncommon; only 257 projects, or 12.2 percent, of all projects withdrawn were withdrawn after reaching this milestone.
Table 12-14 Last milestone at time of withdrawal: 1997 through 2017
Milestone CompletedProjects
Withdrawn PercentAverage
DaysMaximum
DaysNever Started 283 13.4% 173 1,235 Feasibility Study 832 39.5% 344 3,238 System Impact Study 468 22.2% 604 3,174 Facilities Study 266 12.6% 1,340 4,210 Construction Service Agreement (CSA) or beyond 257 12.2% 1,538 4,249 Total 2,106 100.0%
26 See PJM. “Manual 14B: PJM Region Transmission Planning Process,” Rev. 40 (Oct. 26, 2017), p.82.27 “Generators planning to connect to the local distribution systems at locations that are not under
FERC jurisdiction and wish to participate in PJM’s market need to execute a PJM Wholesale Market Participation Agreement (WMPA)…” instead of an ISA. See PJM. “Manual 14C: Generation and Transmission Interconnection Facility Construction,” Revision 12 (June 22, 2017).
28 See PJM. “Manual 14C: Generation and Transmission Interconnection Facility Construction,” Rev. 12 (June 22, 2017).
2017 State of the Market Report for PJM 551
Section 12 Planning
© 2018 Monitoring Analytics, LLC
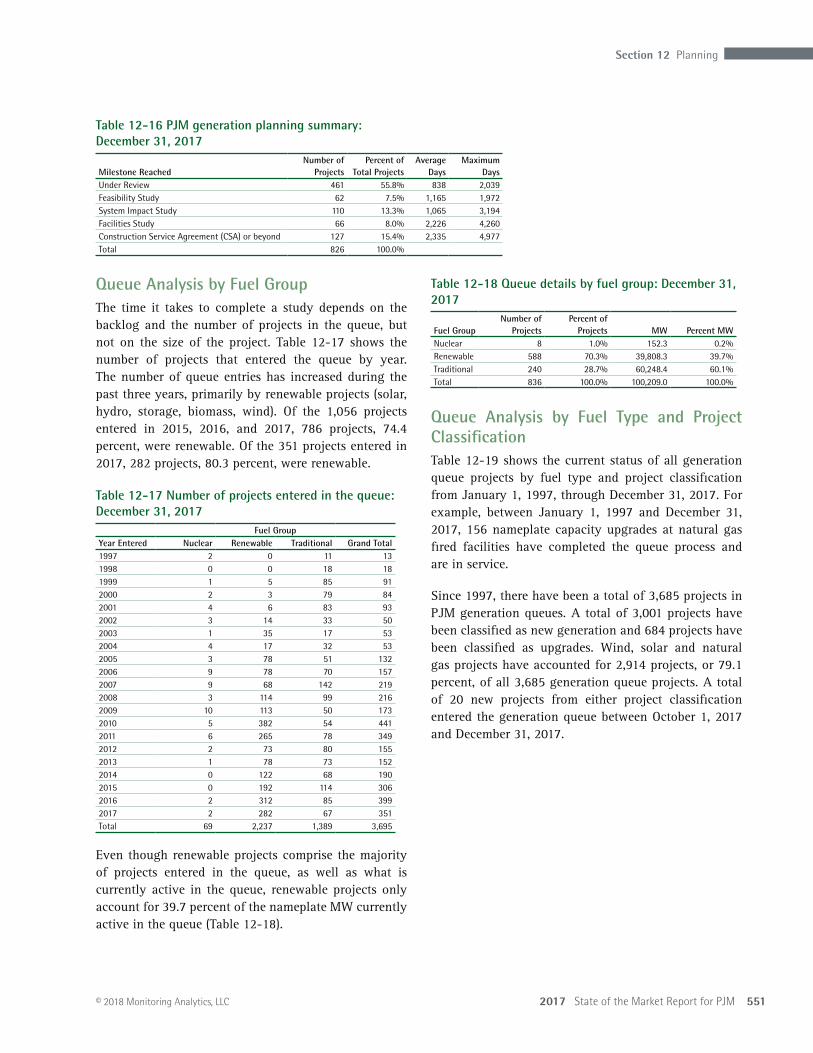
Table 12-18 Queue details by fuel group: December 31, 2017
Fuel GroupNumber of
ProjectsPercent of
Projects MW Percent MWNuclear 8 1.0% 152.3 0.2%Renewable 588 70.3% 39,808.3 39.7%Traditional 240 28.7% 60,248.4 60.1%Total 836 100.0% 100,209.0 100.0%
Queue Analysis by Fuel Type and Project ClassificationTable 12-19 shows the current status of all generation queue projects by fuel type and project classification from January 1, 1997, through December 31, 2017. For example, between January 1, 1997 and December 31, 2017, 156 nameplate capacity upgrades at natural gas fired facilities have completed the queue process and are in service.
Since 1997, there have been a total of 3,685 projects in PJM generation queues. A total of 3,001 projects have been classified as new generation and 684 projects have been classified as upgrades. Wind, solar and natural gas projects have accounted for 2,914 projects, or 79.1 percent, of all 3,685 generation queue projects. A total of 20 new projects from either project classification entered the generation queue between October 1, 2017 and December 31, 2017.
Table 12-16 PJM generation planning summary: December 31, 2017
Milestone ReachedNumber of
ProjectsPercent of
Total ProjectsAverage
DaysMaximum
DaysUnder Review 461 55.8% 838 2,039Feasibility Study 62 7.5% 1,165 1,972System Impact Study 110 13.3% 1,065 3,194Facilities Study 66 8.0% 2,226 4,260Construction Service Agreement (CSA) or beyond 127 15.4% 2,335 4,977Total 826 100.0%
Queue Analysis by Fuel GroupThe time it takes to complete a study depends on the backlog and the number of projects in the queue, but not on the size of the project. Table 12-17 shows the number of projects that entered the queue by year. The number of queue entries has increased during the past three years, primarily by renewable projects (solar, hydro, storage, biomass, wind). Of the 1,056 projects entered in 2015, 2016, and 2017, 786 projects, 74.4 percent, were renewable. Of the 351 projects entered in 2017, 282 projects, 80.3 percent, were renewable.
Table 12-17 Number of projects entered in the queue: December 31, 2017
Fuel GroupYear Entered Nuclear Renewable Traditional Grand Total1997 2 0 11 13 1998 0 0 18 18 1999 1 5 85 91 2000 2 3 79 84 2001 4 6 83 93 2002 3 14 33 50 2003 1 35 17 53 2004 4 17 32 53 2005 3 78 51 132 2006 9 78 70 157 2007 9 68 142 219 2008 3 114 99 216 2009 10 113 50 173 2010 5 382 54 441 2011 6 265 78 349 2012 2 73 80 155 2013 1 78 73 152 2014 0 122 68 190 2015 0 192 114 306 2016 2 312 85 399 2017 2 282 67 351 Total 69 2,237 1,389 3,695
Even though renewable projects comprise the majority of projects entered in the queue, as well as what is currently active in the queue, renewable projects only account for 39.7 percent of the nameplate MW currently active in the queue (Table 12-18).

552 Section 12 Planning
2017 State of the Market Report for PJM
© 2018 Monitoring Analytics, LLC
Table 12-19 Status of all generation queue projects: 1997 through 2017
Project Status Project Classification
Number of Projects
Biomass Coal Diesel Hydro LFGNatural
Gas Nuclear Oil Other Solar Storage Wind TOTAL
In ServiceNew Generation 7 9 6 11 75 95 1 4 3 122 18 64 415Upgrade 6 45 3 17 17 156 42 14 4 16 3 15 338
Under ConstructionNew Generation 0 0 0 3 2 29 0 0 0 30 23 18 105Upgrade 1 4 1 0 0 21 0 0 0 2 2 1 32
SuspendedNew Generation 1 0 0 0 0 17 0 0 0 35 6 21 80Upgrade 0 0 0 0 0 6 0 0 0 0 4 3 13
WithdrawnNew Generation 38 55 12 40 79 434 9 9 10 794 80 377 1,937Upgrade 2 13 1 2 10 80 9 13 2 13 8 16 169
ActiveNew Generation 0 0 0 1 4 74 1 0 0 316 17 51 464Upgrade 1 5 3 2 2 72 7 0 0 28 4 8 132
Total ProjectsNew Generation 46 64 18 55 160 649 11 13 13 1,297 144 531 3,001Upgrade 10 67 8 21 29 335 58 27 6 59 21 43 684
Table 12-20 shows the MW in Table 12-19 by share by classification as new generation or upgrade. Within a fuel type the shares of upgrades add to 100 percent and the shares of new generation add to 100 percent. For example, 81.0 percent of all hydro projects classified as upgrades are currently in service in PJM, 9.5 percent of hydro upgrades were withdrawn and 9.5 percent of hydro upgrades are active in the queue. From January 1, 1997, through December 31, 2017, nuclear projects have had the lowest completion rate across all technology types for projects classified as new generation and storage projects have had the lowest completion rate across all technology types for projects classified as upgrades. Landfill gas projects have had the highest completion rate across all technology types for projects classified as new generation and hydro projects have had the highest completion rate across all technology types for projects classified as upgrades.
Table 12-20 Status of all generation queue projects as a percent of total projects by classification: 1997 through 2017
Project Status Project Classification
Percent of Total Projects by Classification
Biomass Coal Diesel Hydro LFGNatural
Gas Nuclear Oil Other Solar Storage Wind
In ServiceNew Generation 15.2% 14.1% 33.3% 20.0% 46.9% 14.6% 9.1% 30.8% 23.1% 9.4% 12.5% 12.1%Upgrade 60.0% 67.2% 37.5% 81.0% 58.6% 46.6% 72.4% 51.9% 66.7% 27.1% 14.3% 34.9%
Under ConstructionNew Generation 0.0% 0.0% 0.0% 5.5% 1.3% 4.5% 0.0% 0.0% 0.0% 2.3% 16.0% 3.4%Upgrade 10.0% 6.0% 12.5% 0.0% 0.0% 6.3% 0.0% 0.0% 0.0% 3.4% 9.5% 2.3%
SuspendedNew Generation 2.2% 0.0% 0.0% 0.0% 0.0% 2.6% 0.0% 0.0% 0.0% 2.7% 4.2% 4.0%Upgrade 0.0% 0.0% 0.0% 0.0% 0.0% 1.8% 0.0% 0.0% 0.0% 0.0% 19.0% 7.0%
WithdrawnNew Generation 82.6% 85.9% 66.7% 72.7% 49.4% 66.9% 81.8% 69.2% 76.9% 61.2% 55.6% 71.0%Upgrade 20.0% 19.4% 12.5% 9.5% 34.5% 23.9% 15.5% 48.1% 33.3% 22.0% 38.1% 37.2%
ActiveNew Generation 0.0% 0.0% 0.0% 1.8% 2.5% 11.4% 9.1% 0.0% 0.0% 24.4% 11.8% 9.6%Upgrade 10.0% 7.5% 37.5% 9.5% 6.9% 21.5% 12.1% 0.0% 0.0% 47.5% 19.0% 18.6%
Table 12-21 shows the nameplate generating capacity of projects in the PJM generation queue by technology type and project classification. For example, the 377 new generation wind projects that have been withdrawn from the queue as of December 31, 2017, listed in Table 12-19 constitute 59,559.4 MW of nameplate capacity. The 514 new generation and upgrade natural gas projects that have been withdrawn in the same time period constitute 197,711.7 MW of nameplate capacity.

2017 State of the Market Report for PJM 553
Section 12 Planning
© 2018 Monitoring Analytics, LLC
Table 12-21 Status of all generation capacity (MW) in the PJM generation queue: 1997 through 2017
Project StatusProject Classification
Project MW
Biomass Coal Diesel Hydro LFGNatural
Gas Nuclear Oil Other Solar Storage Wind TOTAL
In ServiceNew Generation 225.7 1,378.0 69.5 578.1 407.0 26,919.1 9.0 607.0 50.0 1,141.4 161.4 7,009.6 38,555.7Upgrade 58.8 747.5 25.3 622.6 54.5 6,820.5 3,912.8 125.8 547.5 19.4 36.4 33.7 13,004.7
Under ConstructionNew Generation 0.0 0.0 0.0 23.1 11.2 13,707.2 0.0 0.0 0.0 510.8 40.6 3,011.3 17,304.2Upgrade 62.5 108.0 0.0 0.0 0.0 1,455.1 0.0 0.0 0.0 4.5 52.0 0.0 1,682.1
SuspendedNew Generation 16.0 0.0 0.0 0.0 0.0 4,554.5 0.0 0.0 0.0 396.4 75.8 3,657.7 8,700.4Upgrade 0.0 0.0 0.0 0.0 0.0 430.7 0.0 0.0 0.0 0.0 50.0 175.0 655.7
WithdrawnNew Generation 1,061.5 33,511.6 63.9 1,988.0 448.4 188,838.1 8,161.0 1,721.0 843.8 14,645.4 815.9 59,559.3 311,658.0Upgrade 37.1 865.0 4.0 56.0 48.7 8,873.6 916.0 589.0 24.0 169.1 142.1 384.6 12,109.2
ActiveNew Generation 0.0 0.0 0.0 15.0 29.4 34,269.7 28.0 0.0 0.0 17,770.8 276.9 11,177.4 63,567.1Upgrade 4.0 91.0 7.0 39.5 2.0 5,582.6 124.3 0.0 0.0 1,397.3 28.8 266.5 7,542.9
Total ProjectsNew Generation 1,303.2 34,889.6 133.4 2,604.2 896.0 268,288.6 8,198.0 2,328.0 893.8 34,464.8 1,370.5 84,415.4 439,785.5Upgrade 162.4 1,811.5 36.3 718.1 105.2 23,162.5 4,953.1 714.8 571.5 1,590.3 309.3 859.8 34,994.6
Figure 12-3 shows the project MW that have entered the PJM generation queue by fuel type and year of entry. In 2015 and 2016, natural gas, wind, and solar projects accounted for the majority of all new projects entering the generation queue. The increase in solar projects entering the queue in 2016 from 2015 was primarily a result of new projects in Dominion. The increase in solar projects entering the queue in 2017 was primarily a result of new projects in AEP.
Figure 12-3 Queue project MW by fuel type and queue entry year: 1997 through 2017
0
5,000
10,000
15,000
20,000
25,000
30,000
35,000
40,000
45,000
50,000
Proje
ct MW
Year of Queue Entry
Other
Wind
Storage
Solar
Oil
Nuclear
Natural Gas
LFG
Hydro
Diesel
Coal
Biomass
Table 12-22 shows the MW in Table 12-21 by share by classification as new generation or upgrade. Within a fuel type the shares of upgrades add to 100 percent and the shares of new generation add to 100 percent. For example, 70.6 percent of wind projects classified as new generation have been withdrawn from the queue between January 1, 1997, and December 31, 2017.

554 Section 12 Planning
2017 State of the Market Report for PJM
© 2018 Monitoring Analytics, LLC
Table 12-22 Status of all generation queue projects as percent of total MW in project classification: 1997 through 2017
Project StatusProject Classification
Percent of Total Project MW by Classification
Biomass Coal Diesel Hydro LFGNatural
Gas Nuclear Oil Other Solar Storage Wind
In ServiceNew Generation 17.3% 3.9% 52.1% 22.2% 45.4% 10.0% 0.1% 26.1% 5.6% 3.3% 11.8% 8.3%Upgrade 36.2% 41.3% 69.7% 86.7% 51.8% 29.4% 79.0% 17.6% 95.8% 1.2% 11.8% 3.9%
Under ConstructionNew Generation 0.0% 0.0% 0.0% 0.9% 1.2% 5.1% 0.0% 0.0% 0.0% 1.5% 3.0% 3.6%Upgrade 38.5% 6.0% 0.0% 0.0% 0.0% 6.3% 0.0% 0.0% 0.0% 0.3% 16.8% 0.0%
SuspendedNew Generation 1.2% 0.0% 0.0% 0.0% 0.0% 1.7% 0.0% 0.0% 0.0% 1.2% 5.5% 4.3%Upgrade 0.0% 0.0% 0.0% 0.0% 0.0% 1.9% 0.0% 0.0% 0.0% 0.0% 16.2% 20.4%
WithdrawnNew Generation 81.5% 96.1% 47.9% 76.3% 50.0% 70.4% 99.5% 73.9% 94.4% 42.5% 59.5% 70.6%Upgrade 22.8% 47.8% 11.0% 7.8% 46.3% 38.3% 18.5% 82.4% 4.2% 10.6% 45.9% 44.7%
ActiveNew Generation 0.0% 0.0% 0.0% 0.6% 3.3% 12.8% 0.3% 0.0% 0.0% 51.6% 20.2% 13.2%Upgrade 2.5% 5.0% 19.3% 5.5% 1.9% 24.1% 2.5% 0.0% 0.0% 87.9% 9.3% 31.0%
Natural Gas Project AnalysisTable 12-23 shows the status of all natural gas projects by number of projects that entered PJM generation queues from January 1, 1997 through December 31, 2017, by zone. Of the 134 natural gas projects classified either as new generation or upgrade currently active in the PJM generation queue, 50 projects, 37.3 percent, are located within AEP, ComEd and APS.
Table 12-23 Status of all natural gas generation queue projects: 1997 through 2017
Project StatusProject Classification
Number of ProjectsAECO AEP APS ATSI BGE ComEd DAY DEOK Dominion DPL DLCO EKPC JCPL Met-Ed PECO PENELEC Pepco PPL PSEG RECO TOTAL
In ServiceNew Generation 7 2 0 2 6 2 0 1 5 8 0 0 8 4 6 8 7 9 12 0 87Upgrade 7 15 0 1 1 12 6 0 31 15 0 0 5 2 9 5 5 6 27 0 147
Under ConstructionNew Generation 3 1 0 1 1 0 0 1 3 0 1 0 1 1 2 2 2 5 2 0 26Upgrade 0 1 0 1 0 2 0 0 2 0 0 0 1 0 5 0 1 4 3 0 20
SuspendedNew Generation 1 2 0 0 0 0 0 0 0 0 0 0 1 0 0 7 1 0 0 0 12Upgrade 0 0 0 0 0 0 0 0 0 0 0 0 1 0 0 1 2 0 0 0 4
WithdrawnNew Generation 26 18 0 13 8 10 0 1 17 17 2 3 25 25 42 50 33 40 63 2 395Upgrade 6 7 0 4 0 2 0 1 7 4 0 0 5 8 3 4 3 5 16 0 75
ActiveNew Generation 5 11 0 4 0 11 1 0 3 2 0 1 1 0 1 5 0 4 19 0 68Upgrade 4 11 0 5 0 17 0 0 11 1 0 0 3 2 1 5 1 4 1 0 66
Total ProjectsNew Generation 42 34 0 20 15 23 1 3 28 27 3 4 36 30 51 72 43 58 96 2 588Upgrade 17 34 0 11 1 33 6 1 51 20 0 0 15 12 18 15 12 19 47 0 312
Table 12-24 shows the status of all gas projects by MW that entered PJM generation queues from January 1, 1997 through December 31, 2017, by zone. Of the 36,126.7 MW of natural gas projects classified either as new generation or upgrade currently active in the PJM generation queue, 17,085.2 MW, 47.3 percent, are located within AEP, ComEd and APS.

2017 State of the Market Report for PJM 555
Section 12 Planning
© 2018 Monitoring Analytics, LLC
Table 12-24 Status of all natural gas generation capacity (MW) in the PJM generation queue: 1997 through 2017
Project StatusProject Classification
Project MWAECO AEP APS ATSI BGE ComEd DAY DEOK Dominion DPL DLCO
In ServiceNew Generation 1,016.2 1,322.0 0.0 815.5 390.0 629.0 0.0 20.0 4,011.0 1,587.2 0.0Upgrade 265.7 414.0 0.0 40.0 2.5 864.0 60.0 0.0 1,476.7 198.0 0.0
Under ConstructionNew Generation 453.5 675.0 0.0 800.0 1.3 0.0 0.0 513.0 2,855.1 0.0 205.0Upgrade 0.0 6.0 0.0 161.0 0.0 32.6 0.0 0.0 195.0 0.0 0.0
SuspendedNew Generation 235.0 1,579.0 0.0 0.0 0.0 0.0 0.0 0.0 0.0 0.0 0.0Upgrade 0.0 0.0 0.0 0.0 0.0 0.0 0.0 0.0 0.0 0.0 0.0
WithdrawnNew Generation 6,923.8 9,632.0 0.0 5,420.7 3,122.1 4,533.0 0.0 134.5 10,475.0 4,842.4 665.0Upgrade 122.8 711.0 0.0 111.0 0.0 75.0 0.0 36.0 305.3 668.0 0.0
ActiveNew Generation 1,176.4 7,203.0 0.0 4,047.0 0.0 6,779.2 1,150.0 0.0 3,544.5 1,051.0 0.0Upgrade 273.6 441.0 0.0 253.0 0.0 2,662.0 0.0 0.0 410.1 60.0 0.0
Total ProjectsNew Generation 9,805.0 20,411.0 0.0 11,083.2 3,513.4 11,941.2 1,150.0 667.5 20,885.6 7,480.6 870.0Upgrade 662.1 1,572.0 0.0 565.0 2.5 3,633.6 60.0 36.0 2,387.1 926.0 0.0
Project StatusProject Classification
Project MWEKPC JCPL Met-Ed PECO PENELEC Pepco PPL PSEG RECO TOTAL
In ServiceNew Generation 0.0 2,070.3 2,117.0 2,464.0 1,267.1 842.0 2,826.9 2,804.9 0.0 24,183.1Upgrade 0.0 224.0 44.1 780.5 87.0 121.1 327.3 1,057.9 0.0 5,962.8
Under ConstructionNew Generation 0.0 0.4 450.0 760.5 1,640.0 755.0 3,074.0 570.0 0.0 12,752.8Upgrade 0.0 0.0 0.0 241.0 0.0 64.5 524.0 231.0 0.0 1,455.1
SuspendedNew Generation 0.0 440.0 0.0 0.0 146.8 894.0 0.0 0.0 0.0 3,294.8Upgrade 0.0 200.0 0.0 0.0 1.6 144.1 0.0 0.0 0.0 345.7
WithdrawnNew Generation 991.8 11,461.2 13,001.0 23,120.0 17,030.9 20,414.2 16,795.7 23,524.0 6.9 172,094.1Upgrade 0.0 253.0 1,742.0 240.0 1,040.6 85.0 500.0 2,404.9 0.0 8,294.6
ActiveNew Generation 75.0 1,092.2 0.0 220.0 685.9 0.0 1,554.8 2,394.8 0.0 30,973.8Upgrade 0.0 109.9 65.0 88.0 328.2 75.0 336.0 51.1 0.0 5,152.9
Total ProjectsNew Generation 1,066.8 15,064.1 15,568.0 26,564.5 20,770.7 22,905.2 24,251.4 29,293.6 6.9 243,298.6Upgrade 0.0 786.9 1,851.1 1,349.5 1,457.4 489.7 1,687.3 3,744.9 0.0 21,211.1
Wind Project AnalysisTable 12-25 shows the status of all wind generation projects that entered PJM generation queues from January 1, 1997 through December 31, 2017, by zone. Of the 65 wind projects to achieve in service status, 56 projects, 86.2 percent are located within ComEd, AEP, APS and PENELEC. Of the 53 wind projects currently active in the PJM generation queue, 43 projects, 81.1 percent are located within ComEd, AEP, APS and PENELEC.
Table 12-25 Status of all wind generation queue projects: 1997 through 2017
Project StatusProject Classification
Number of ProjectsAECO AEP APS ATSI BGE ComEd DAY DEOK Dominion DPL DLCO EKPC JCPL Met-Ed PECO PENELEC Pepco PPL PSEG RECO TOTAL
In ServiceNew Generation 1 11 0 0 0 17 0 0 0 0 0 0 0 0 0 20 0 4 0 0 53Upgrade 0 0 0 0 0 2 0 0 0 0 0 0 0 0 0 6 0 4 0 0 12
Under ConstructionNew Generation 0 3 0 0 0 4 0 0 4 1 0 0 0 0 0 1 0 0 0 0 13Upgrade 0 0 0 0 0 0 0 0 0 0 0 0 0 0 0 0 0 0 0 0 0
SuspendedNew Generation 1 10 0 1 0 1 2 0 1 0 0 0 0 0 0 2 0 1 0 0 19Upgrade 1 1 0 0 0 0 0 0 0 0 0 0 0 0 0 0 0 0 0 0 2
WithdrawnNew Generation 15 83 0 6 0 95 13 0 16 7 0 1 0 0 0 61 0 40 1 0 338Upgrade 1 0 0 0 0 1 0 0 2 0 0 0 0 0 0 4 0 2 0 0 10
ActiveNew Generation 0 22 0 3 0 14 0 0 2 2 0 0 0 0 0 1 0 3 0 0 47Upgrade 0 0 0 0 0 4 0 0 0 0 0 0 0 0 0 2 0 0 0 0 6
Total ProjectsNew Generation 17 129 0 10 0 131 15 0 23 10 0 1 0 0 0 85 0 48 1 0 470Upgrade 2 1 0 0 0 7 0 0 2 0 0 0 0 0 0 12 0 6 0 0 30
Table 12-26 shows the wind project capacity in MW of all wind generation projects that have entered the PJM generation queue from January 1, 1997 through December 31, 2017, by zone. Of the 6,039.3 MW of wind generation capacity to achieve in service status, 5,805.3 MW, or 96. percent of nameplate capacity is located within ComEd, AEP, APS and PENELEC. Of the 11,066.9 MW of wind generation capacity currently active in the PJM generation queue, 9,183.6 MW of generation capacity or 83.0 percent is located within ComEd, AEP, APS and PENELEC.

556 Section 12 Planning
2017 State of the Market Report for PJM
© 2018 Monitoring Analytics, LLC
Table 12-26 Status of all wind generation capacity (MW) in the PJM generation queue: 1997 through 2017
Project StatusProject Classification
Project MWAECO AEP APS ATSI BGE ComEd DAY DEOK Dominion DPL DLCO
In ServiceNew Generation 7.5 2,390.4 0.0 0.0 0.0 2,413.5 0.0 0.0 0.0 0.0 0.0Upgrade 0.0 0.0 0.0 0.0 0.0 0.0 0.0 0.0 0.0 0.0 0.0
Under ConstructionNew Generation 0.0 499.9 0.0 0.0 0.0 978.5 0.0 0.0 740.3 150.0 0.0Upgrade 0.0 0.0 0.0 0.0 0.0 0.0 0.0 0.0 0.0 0.0 0.0
SuspendedNew Generation 20.0 1,830.0 0.0 500.0 0.0 500.0 300.0 0.0 76.6 0.0 0.0Upgrade 5.0 100.0 0.0 0.0 0.0 0.0 0.0 0.0 0.0 0.0 0.0
WithdrawnNew Generation 3,626.4 15,596.4 0.0 645.6 0.0 22,315.8 1,828.0 0.0 2,361.5 2,255.0 0.0Upgrade 0.0 0.0 0.0 0.0 0.0 4.0 0.0 0.0 82.0 0.0 0.0
ActiveNew Generation 0.0 5,853.7 0.0 816.1 0.0 2,945.5 0.0 0.0 226.6 499.6 0.0Upgrade 0.0 0.0 0.0 0.0 0.0 175.7 0.0 0.0 0.0 0.0 0.0
Total ProjectsNew Generation 3,653.9 26,170.4 0.0 1,961.7 0.0 29,153.3 2,128.0 0.0 3,405.0 2,904.6 0.0Upgrade 5.0 100.0 0.0 0.0 0.0 179.7 0.0 0.0 82.0 0.0 0.0
Project StatusProject Classification
Project MWEKPC JCPL Met-Ed PECO PENELEC Pepco PPL PSEG RECO TOTAL
In ServiceNew Generation 0.0 0.0 0.0 0.0 995.0 0.0 199.2 0.0 0.0 6,005.6Upgrade 0.0 0.0 0.0 0.0 6.4 0.0 27.3 0.0 0.0 33.7
Under ConstructionNew Generation 0.0 0.0 0.0 0.0 70.0 0.0 0.0 0.0 0.0 2,438.7Upgrade 0.0 0.0 0.0 0.0 0.0 0.0 0.0 0.0 0.0 0.0
SuspendedNew Generation 0.0 0.0 0.0 0.0 180.0 0.0 100.0 0.0 0.0 3,506.6Upgrade 0.0 0.0 0.0 0.0 0.0 0.0 0.0 0.0 0.0 105.0
WithdrawnNew Generation 150.3 0.0 0.0 0.0 5,059.0 0.0 2,766.3 20.0 0.0 56,624.3Upgrade 0.0 0.0 0.0 0.0 192.6 0.0 6.0 0.0 0.0 284.6
ActiveNew Generation 0.0 0.0 0.0 0.0 138.0 0.0 341.1 0.0 0.0 10,820.4Upgrade 0.0 0.0 0.0 0.0 70.8 0.0 0.0 0.0 0.0 246.5
Total ProjectsNew Generation 150.3 0.0 0.0 0.0 6,442.0 0.0 3,406.6 20.0 0.0 79,395.6Upgrade 0.0 0.0 0.0 0.0 269.7 0.0 33.3 0.0 0.0 669.8
Solar Project AnalysisTable 12-27 shows the status of all solar generation projects that have entered the PJM generation queue from January 1, 1997 through December 31, 2017, by zone. Of a total of 1,269 solar projects ever to enter the PJM generation queue, 515 projects, or 40.6 percent, have been located in JCPL, AECO and PSEG, all zones in New Jersey. Of these three zones, AECO has the lowest completion rates for new generation and upgrade solar projects. Excluding currently active projects, only 4.3 percent of solar projects classified as new generation or upgrades in AECO are either in service or under construction. Of these three zones, PSEG has the highest completion rates. Excluding currently active projects, 40.4 percent of solar projects classified as either new generation or upgrades in PSEG are either in service or under construction.
The number of currently active new generation solar projects is also highly concentrated in several zones. Out of 332 active new generation solar projects, 141 projects, or 42.5 percent of all currently active new generation solar projects are located in Dominion. Out of 141 active new generation solar projects, 69, or 20.8 percent of all currently active new generation solar projects are located in AEP.
Table 12-27 Status of all solar generation queue projects: 1997 through 2017
Project StatusProject Classification
Number of ProjectsAECO AEP APS ATSI BGE ComEd DAY DEOK Dominion DPL DLCO EKPC JCPL Met-Ed PECO PENELEC Pepco PPL PSEG RECO TOTAL
In ServiceNew Generation 7 4 0 0 1 1 1 0 15 9 0 0 39 0 1 0 0 2 38 0 118Upgrade 0 0 0 0 0 0 0 0 2 8 0 0 6 0 0 0 0 0 0 0 16
Under ConstructionNew Generation 0 2 0 0 2 0 1 0 5 5 0 0 8 0 0 0 0 0 6 0 29Upgrade 0 0 0 0 0 0 0 0 1 1 0 0 0 0 0 0 0 0 0 0 2
SuspendedNew Generation 0 5 0 0 0 0 1 0 1 1 0 0 6 1 0 1 0 0 2 0 18Upgrade 0 0 0 0 0 0 0 0 0 0 0 0 0 0 0 0 0 0 0 0 0
WithdrawnNew Generation 155 52 0 7 10 9 8 10 97 101 0 3 163 12 6 10 9 27 62 0 741Upgrade 1 1 0 0 0 0 0 0 5 0 0 0 5 0 0 0 0 0 1 0 13
ActiveNew Generation 4 66 0 5 0 23 10 3 125 45 1 2 2 2 1 1 4 2 9 0 305Upgrade 0 3 0 0 0 1 0 2 16 1 1 0 1 1 0 0 0 1 0 0 27
Total ProjectsNew Generation 166 129 0 12 13 33 21 13 243 161 1 5 218 15 8 12 13 31 117 0 1211Upgrade 1 4 0 0 0 1 0 2 24 10 1 0 12 1 0 0 0 1 1 0 58

2017 State of the Market Report for PJM 557
Section 12 Planning
© 2018 Monitoring Analytics, LLC
Table 12-28 shows the status of all solar generation project MW that have entered the PJM generation queue from January 1, 1997 through December 31, 2017, by zone. Of a total of 34,144.4 MW of solar nameplate capacity ever to enter the PJM generation queue, 4,260.6 MW, or 12.5 percent, have been located in JCPL, AECO and PSEG, all of which are zones in New Jersey. Solar projects in Dominion have accounted for 14,291.2 MW or 41.9 percent of all solar project nameplate capacity in the PJM queue from January 1, 1997 through December 31, 2017. Solar projects in DPL have accounted for 2,891.0 MW or 8.5 percent of all solar project nameplate capacity in the PJM queue from January 1, 1997 through December 31, 2017.
Table 12-28 Current status of all solar generation capacity (MW) in the PJM generation queue: 1997 through 2017
Project StatusProject Classification
Project MWAECO AEP APS ATSI BGE ComEd DAY DEOK Dominion DPL DLCO
In ServiceNew Generation 57.3 14.7 0.0 0.0 1.1 9.0 2.5 0.0 409.2 118.4 0.0Upgrade 0.0 0.0 0.0 0.0 0.0 0.0 0.0 0.0 3.1 0.0 0.0
Under ConstructionNew Generation 0.0 30.0 0.0 0.0 22.0 0.0 3.4 0.0 238.5 43.0 0.0Upgrade 0.0 0.0 0.0 0.0 0.0 0.0 0.0 0.0 4.5 0.0 0.0
SuspendedNew Generation 0.0 59.9 0.0 0.0 0.0 0.0 20.0 0.0 5.0 6.0 0.0Upgrade 0.0 0.0 0.0 0.0 0.0 0.0 0.0 0.0 0.0 0.0 0.0
WithdrawnNew Generation 1,664.3 2,592.9 0.0 116.1 31.3 176.8 250.5 159.4 4,236.4 1,385.9 0.0Upgrade 10.0 6.0 0.0 0.0 0.0 0.0 0.0 0.0 128.0 0.0 0.0
ActiveNew Generation 24.2 4,663.6 0.0 646.0 0.0 1,025.5 739.5 215.0 8,296.0 1,317.7 11.7Upgrade 0.0 210.0 0.0 0.0 0.0 0.0 0.0 85.0 970.5 20.0 8.3
Total ProjectsNew Generation 1,745.8 7,361.2 0.0 762.1 54.4 1,211.3 1,015.9 374.4 13,185.1 2,871.0 11.7Upgrade 10.0 216.0 0.0 0.0 0.0 0.0 0.0 85.0 1,106.1 20.0 8.3
Project StatusProject Classification
Project MWEKPC JCPL Met-Ed PECO PENELEC Pepco PPL PSEG RECO TOTAL
In ServiceNew Generation 0.0 266.9 0.0 3.3 0.0 0.0 15.0 191.0 0.0 1,088.4Upgrade 0.0 16.3 0.0 0.0 0.0 0.0 0.0 0.0 0.0 19.4
Under ConstructionNew Generation 0.0 127.4 0.0 0.0 0.0 0.0 0.0 36.6 0.0 500.8Upgrade 0.0 0.0 0.0 0.0 0.0 0.0 0.0 0.0 0.0 4.5
SuspendedNew Generation 0.0 59.1 3.0 0.0 13.5 0.0 0.0 8.4 0.0 174.9Upgrade 0.0 0.0 0.0 0.0 0.0 0.0 0.0 0.0 0.0 0.0
WithdrawnNew Generation 189.9 1,311.3 467.0 51.4 34.3 122.1 283.7 427.7 0.0 13,501.0Upgrade 0.0 23.8 0.0 0.0 0.0 0.0 0.0 1.3 0.0 169.1
ActiveNew Generation 100.0 1.8 135.0 18.0 50.0 65.3 30.0 24.8 0.0 17,364.0Upgrade 0.0 8.5 20.0 0.0 0.0 0.0 0.0 0.0 0.0 1,322.3
Total ProjectsNew Generation 289.9 1,766.4 605.0 72.7 97.8 187.3 328.7 688.6 0.0 32,629.1Upgrade 0.0 48.6 20.0 0.0 0.0 0.0 0.0 1.3 0.0 1,515.3

558 Section 12 Planning
2017 State of the Market Report for PJM
© 2018 Monitoring Analytics, LLC
Relationship Between Project Developer and Transmission OwnerTable 12-29 shows the relationship between the project developer and Transmission Owner for all project MW that have entered the PJM generation queue from January 1, 1997, through December 31, 2017, by zone and technology type. A project where the developer is or is affiliated with the Transmission Owner is classified as related. A project where the developer is not affiliated with the Transmission Owner is classified as unrelated. For example, 36.0 MW of natural gas fired generation projects that have entered the PJM generation queue in DEOK were projects developed by Duke Energy or subsidiaries of Duke Energy, the Transmission Owner for DEOK. These project MW are classified as related. There have been 154.5 MW of natural gas fired projects that have entered the PJM generation queue in DEOK by developers not affiliated with Duke Energy. These project MW are classified as “unrelated.”
Table 12-29 Relationship between project developer and Transmission Owner for all interconnection queue projects MW by fuel type: 1997 through 2017
MW by Fuel TypeParent Company
Transmission Owner
Related To Developer
Number of Projects Biomass Coal Diesel Hydro
Landfill Gas
Natural Gas Nuclear Other Solar Wind Total MW
AEP AEP Related 51 0.0 3,965.0 0.0 34.0 3.0 3,027.0 214.0 0.0 301.7 0.0 7,544.7Unrelated 413 501.1 10,292.0 7.5 448.4 83.8 24,300.0 0.0 66.0 7,658.8 26,967.0 70,324.5
AES DAY Related 17 0.0 1,347.5 0.0 0.0 0.0 51.0 0.0 0.0 74.0 0.0 1,472.5Unrelated 39 1.9 0.0 0.0 0.0 10.0 9.0 0.0 0.0 871.9 2,128.0 3,020.8
DLCO DLCO Related 0 0.0 0.0 0.0 0.0 0.0 0.0 0.0 0.0 0.0 0.0 0.0Unrelated 23 0.0 2,810.0 0.0 106.0 19.2 870.0 1,879.0 0.0 63.3 0.0 5,747.5
Dominion Dominion Related 86 64.0 301.0 0.0 340.0 0.0 13,215.0 1,944.0 0.0 496.1 142.0 16,502.1Unrelated 362 343.7 20.0 10.0 35.1 184.0 12,105.1 0.0 156.3 17,168.7 3,067.0 33,089.9
Duke DEOK Related 4 0.0 0.0 0.0 0.0 0.0 36.0 0.0 0.0 0.0 0.0 36.0Unrelated 26 0.0 120.0 0.0 112.0 4.8 154.5 0.0 0.0 509.3 0.0 900.6
EKPC EKPC Related 0 0.0 0.0 0.0 0.0 0.0 0.0 0.0 0.0 0.0 0.0 0.0Unrelated 10 0.0 0.0 0.0 0.0 0.0 2,216.8 0.0 0.0 240.0 150.3 2,607.1
Exelon AECO Related 3 0.0 0.0 0.0 0.0 0.0 730.0 0.0 0.0 0.0 0.0 730.0Unrelated 273 29.8 15.0 13.0 0.0 31.0 9,791.8 0.0 0.0 1,786.3 3,808.9 15,475.8
BGE Related 14 0.0 10.0 0.0 0.0 0.0 1,037.0 3,373.3 0.0 20.0 0.0 4,440.3Unrelated 59 0.0 0.0 29.0 140.4 9.5 4,152.9 0.0 132.0 34.4 0.0 4,498.2
ComEd Related 18 0.0 0.0 0.0 0.0 0.0 0.0 1,185.0 0.0 9.0 396.0 1,590.0Unrelated 277 90.0 1,926.0 42.0 22.7 112.9 15,669.4 0.0 20.0 1,238.3 28,784.5 47,905.8
DPL Related 10 0.0 0.0 0.0 0.0 0.0 1,716.0 0.0 0.0 31.4 0.0 1,747.4Unrelated 267 84.0 653.0 0.0 0.0 70.0 7,373.6 0.0 30.0 2,996.9 2,809.6 14,017.1
PECO Related 29 0.0 7.0 0.0 45.0 0.0 6,420.0 437.8 0.0 0.0 0.0 6,909.8Unrelated 79 0.0 0.0 12.1 220.0 18.7 21,578.8 0.0 0.0 73.4 0.0 21,903.0
Pepco Related 1 0.0 0.0 0.0 0.0 0.0 0.0 1,640.0 0.0 0.0 0.0 1,640.0Unrelated 70 0.0 0.0 0.0 0.0 12.5 22,698.9 0.0 0.0 200.3 0.0 22,911.7
First Energy APS Related 14 0.0 1,745.0 0.0 252.0 0.0 4,790.0 0.0 0.0 0.0 0.0 6,787.0Unrelated 320 177.2 4,057.0 53.8 371.3 125.8 22,588.4 0.0 96.0 2,095.7 5,522.7 35,087.8
ATSI Related 8 0.0 0.0 0.0 0.0 0.0 1,678.0 16.0 0.0 0.6 0.0 1,694.6Unrelated 57 0.0 0.0 0.0 0.0 35.3 9,154.7 0.0 135.0 564.5 1,961.7 11,851.2
JCPL Related 3 0.0 0.0 0.0 20.0 0.0 100.0 0.0 0.0 8.5 0.0 128.5Unrelated 324 30.0 0.0 0.0 1.6 24.4 15,796.0 0.0 0.0 1,828.9 90.6 17,771.4
Met-Ed Related 0 0.0 0.0 0.0 0.0 0.0 0.0 0.0 0.0 0.0 0.0 0.0Unrelated 90 90.4 0.0 8.0 0.0 57.9 16,839.6 93.0 11.0 625.0 70.0 17,794.9
PENELEC Related 8 0.0 1,860.0 0.0 32.0 0.0 1,174.0 0.0 0.0 0.0 0.0 3,066.0Unrelated 223 0.0 561.0 8.0 53.3 50.9 20,796.8 0.0 621.0 177.8 6,454.1 28,722.8
PPL PPL Related 36 0.0 139.0 0.0 0.0 7.7 2,294.0 1,988.0 0.0 0.0 0.0 4,428.7Unrelated 192 28.5 6,868.6 10.4 2.6 99.5 21,726.5 0.0 152.5 329.8 3,380.8 32,599.2
PSEG PSEG Related 104 0.0 24.0 0.0 0.0 11.7 12,802.1 381.0 0.0 142.2 0.0 13,361.0Unrelated 184 0.0 0.0 0.0 1,000.0 24.4 18,676.0 0.0 45.5 567.5 20.0 20,333.3
Consolidated Edison, Inc.
RECO Related 0 0.0 0.0 0.0 0.0 0.0 0.0 0.0 0.0 0.0 0.0 0.0Unrelated 2 0.0 0.0 0.0 0.0 0.0 7.1 0.0 0.0 0.0 0.0 7.1
TotalRelated 406 64.0 9,398.5 0.0 723.0 22.4 49,070.1 11,179.1 0.0 1,083.5 538.0 72,078.5Unrelated 3,290 1,376.6 27,322.6 193.8 2,513.4 974.6 246,505.8 1,972.0 1,465.3 39,030.6 85,215.1 406,569.7

2017 State of the Market Report for PJM 559
Section 12 Planning
© 2018 Monitoring Analytics, LLC
Table 12-30 shows the relationship between the project developer and Transmission Owner for all solar project MW that have entered the PJM generation queue from January 1, 1997 through December 31, 2017, by zone and project status. Of the 1,319.1 solar project MW that have achieved in service or under construction status during this time period, 186.9 MW, or 14.2 percent have been developed by Transmission Owners building in their own service territory. Of that 186.9 MW of solar projects, 115.8 MW or 62.0 percent have been developed by PSEG in the PSEG Zone and 20.0 MW or 10.7 percent have been developed by Dominion in the Dominion Zone.
Table 12-30 Relationship between project developer and transmission owner for all solar projects MW in PJM interconnection queue: 1997 through 2017
Parent CompanyTransmission Owner
Related To Developer
MW by Project Status
In ServiceUnder
Construction Suspended Withdrawn Active Total MWAEP AEP Related 2.5 12.2 0.0 0.0 60.0 74.7
Unrelated 0.0 20.0 51.7 1,046.5 5,505.9 6,624.1AES DAY Related 0.0 0.0 0.0 0.0 0.0 0.0
Unrelated 2.5 23.4 0.0 151.5 468.5 645.9DLCO DLCO Related 0.0 0.0 0.0 0.0 0.0 0.0
Unrelated 0.0 0.0 0.0 0.0 40.0 40.0Dominion Dominion Related 20.0 0.0 0.0 81.9 224.4 326.3
Unrelated 140.1 122.9 205.0 2,083.5 12,996.0 15,547.5Duke DEOK Related 0.0 0.0 0.0 0.0 0.0 0.0
Unrelated 0.0 0.0 0.0 159.4 290.0 449.4EKPC EKPC Related 0.0 0.0 0.0 0.0 0.0 0.0
Unrelated 0.0 0.0 0.0 80.0 160.0 240.0Exelon AECO Related 0.0 0.0 0.0 0.0 0.0 0.0
Unrelated 38.5 20.8 0.0 1,638.8 88.1 1,786.3BGE Related 0.0 20.0 0.0 0.0 0.0 20.0
Unrelated 1.1 2.0 0.0 9.2 22.1 34.4ComEd Related 9.0 0.0 0.0 0.0 0.0 9.0
Unrelated 0.0 0.0 0.0 84.8 337.0 421.8DPL Related 7.4 0.0 0.0 24.0 0.0 31.4
Unrelated 21.0 159.5 0.0 1,126.5 1,679.9 2,986.9PECO Related 0.0 0.0 0.0 0.0 0.0 0.0
Unrelated 3.3 0.0 0.0 50.1 20.0 73.4Pepco Related 0.0 0.0 0.0 0.0 0.0 0.0
Unrelated 0.0 0.0 0.0 118.1 60.0 178.1First Energy APS Related 0.0 0.0 0.0 0.0 0.0 0.0
Unrelated 34.0 32.5 38.9 806.0 839.3 1,750.7ATSI Related 0.0 0.0 0.0 0.6 0.0 0.6
Unrelated 0.0 0.0 0.0 59.5 485.0 544.5JCPL Related 0.0 0.0 0.0 0.0 8.5 8.5
Unrelated 204.1 175.5 92.9 1,266.5 89.7 1,828.7Met-Ed Related 0.0 0.0 0.0 0.0 0.0 0.0
Unrelated 0.0 0.0 3.0 367.0 255.0 625.0PENELEC Related 0.0 0.0 0.0 0.0 0.0 0.0
Unrelated 0.0 0.0 13.5 34.3 50.0 97.8PPL PPL Related 0.0 0.0 0.0 0.0 0.0 0.0
Unrelated 15.0 16.0 0.0 268.8 30.0 329.8PSEG PSEG Related 105.8 10.0 0.0 15.2 1.2 132.2
Unrelated 53.8 46.2 9.7 387.8 60.0 557.5
Consolidated Edison, Inc.RECO Related 0.0 0.0 0.0 0.0 0.0 0.0
Unrelated 0.0 0.0 0.0 0.0 0.0 0.0
TotalRelated 144.7 42.2 0.0 121.7 294.1 602.7Unrelated 513.4 618.8 414.7 9,738.1 23,476.6 34,761.6
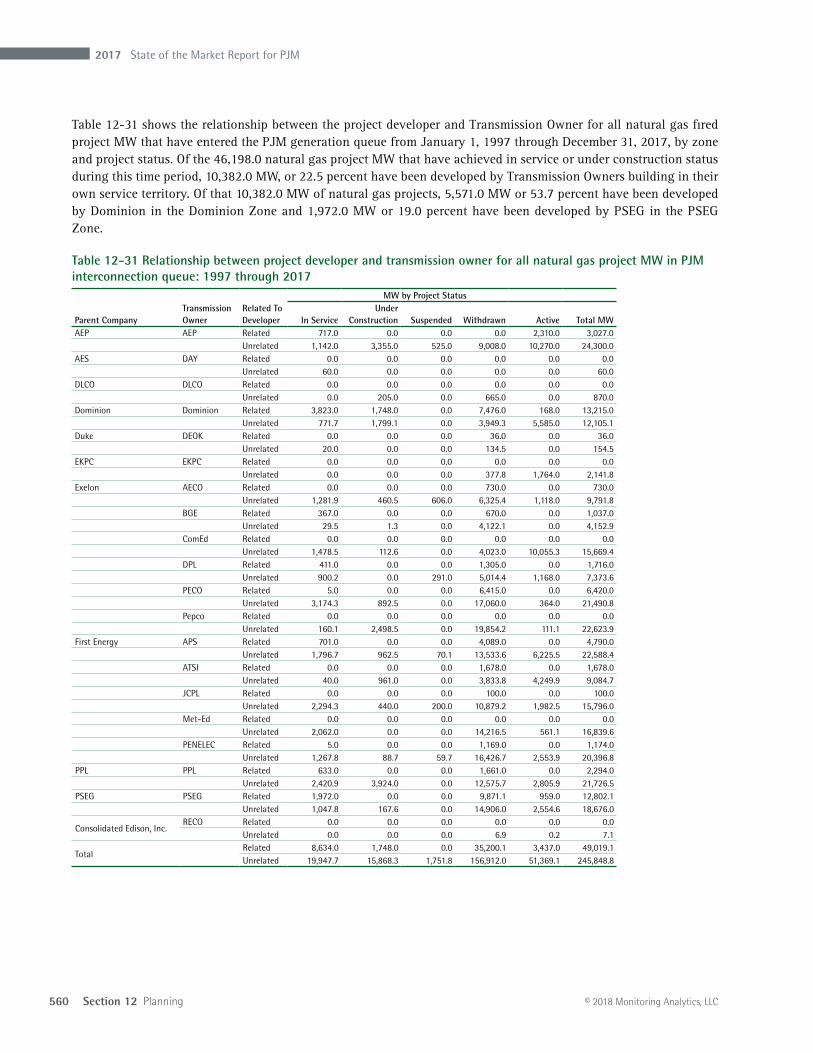
560 Section 12 Planning
2017 State of the Market Report for PJM
© 2018 Monitoring Analytics, LLC
Table 12-31 shows the relationship between the project developer and Transmission Owner for all natural gas fired project MW that have entered the PJM generation queue from January 1, 1997 through December 31, 2017, by zone and project status. Of the 46,198.0 natural gas project MW that have achieved in service or under construction status during this time period, 10,382.0 MW, or 22.5 percent have been developed by Transmission Owners building in their own service territory. Of that 10,382.0 MW of natural gas projects, 5,571.0 MW or 53.7 percent have been developed by Dominion in the Dominion Zone and 1,972.0 MW or 19.0 percent have been developed by PSEG in the PSEG Zone.
Table 12-31 Relationship between project developer and transmission owner for all natural gas project MW in PJM interconnection queue: 1997 through 2017
Parent CompanyTransmission Owner
Related To Developer
MW by Project Status
In ServiceUnder
Construction Suspended Withdrawn Active Total MWAEP AEP Related 717.0 0.0 0.0 0.0 2,310.0 3,027.0
Unrelated 1,142.0 3,355.0 525.0 9,008.0 10,270.0 24,300.0AES DAY Related 0.0 0.0 0.0 0.0 0.0 0.0
Unrelated 60.0 0.0 0.0 0.0 0.0 60.0DLCO DLCO Related 0.0 0.0 0.0 0.0 0.0 0.0
Unrelated 0.0 205.0 0.0 665.0 0.0 870.0Dominion Dominion Related 3,823.0 1,748.0 0.0 7,476.0 168.0 13,215.0
Unrelated 771.7 1,799.1 0.0 3,949.3 5,585.0 12,105.1Duke DEOK Related 0.0 0.0 0.0 36.0 0.0 36.0
Unrelated 20.0 0.0 0.0 134.5 0.0 154.5EKPC EKPC Related 0.0 0.0 0.0 0.0 0.0 0.0
Unrelated 0.0 0.0 0.0 377.8 1,764.0 2,141.8Exelon AECO Related 0.0 0.0 0.0 730.0 0.0 730.0
Unrelated 1,281.9 460.5 606.0 6,325.4 1,118.0 9,791.8BGE Related 367.0 0.0 0.0 670.0 0.0 1,037.0
Unrelated 29.5 1.3 0.0 4,122.1 0.0 4,152.9ComEd Related 0.0 0.0 0.0 0.0 0.0 0.0
Unrelated 1,478.5 112.6 0.0 4,023.0 10,055.3 15,669.4DPL Related 411.0 0.0 0.0 1,305.0 0.0 1,716.0
Unrelated 900.2 0.0 291.0 5,014.4 1,168.0 7,373.6PECO Related 5.0 0.0 0.0 6,415.0 0.0 6,420.0
Unrelated 3,174.3 892.5 0.0 17,060.0 364.0 21,490.8Pepco Related 0.0 0.0 0.0 0.0 0.0 0.0
Unrelated 160.1 2,498.5 0.0 19,854.2 111.1 22,623.9First Energy APS Related 701.0 0.0 0.0 4,089.0 0.0 4,790.0
Unrelated 1,796.7 962.5 70.1 13,533.6 6,225.5 22,588.4ATSI Related 0.0 0.0 0.0 1,678.0 0.0 1,678.0
Unrelated 40.0 961.0 0.0 3,833.8 4,249.9 9,084.7JCPL Related 0.0 0.0 0.0 100.0 0.0 100.0
Unrelated 2,294.3 440.0 200.0 10,879.2 1,982.5 15,796.0Met-Ed Related 0.0 0.0 0.0 0.0 0.0 0.0
Unrelated 2,062.0 0.0 0.0 14,216.5 561.1 16,839.6PENELEC Related 5.0 0.0 0.0 1,169.0 0.0 1,174.0
Unrelated 1,267.8 88.7 59.7 16,426.7 2,553.9 20,396.8PPL PPL Related 633.0 0.0 0.0 1,661.0 0.0 2,294.0
Unrelated 2,420.9 3,924.0 0.0 12,575.7 2,805.9 21,726.5PSEG PSEG Related 1,972.0 0.0 0.0 9,871.1 959.0 12,802.1
Unrelated 1,047.8 167.6 0.0 14,906.0 2,554.6 18,676.0
Consolidated Edison, Inc.RECO Related 0.0 0.0 0.0 0.0 0.0 0.0
Unrelated 0.0 0.0 0.0 6.9 0.2 7.1
TotalRelated 8,634.0 1,748.0 0.0 35,200.1 3,437.0 49,019.1Unrelated 19,947.7 15,868.3 1,751.8 156,912.0 51,369.1 245,848.8

2017 State of the Market Report for PJM 561
Section 12 Planning
© 2018 Monitoring Analytics, LLC
Table 12-32 shows the relationship between the project developer and Transmission Owner for all wind project MW that have entered the PJM generation queue from January 1, 1997 through December 31, 2017, by zone and project status. Of the 10,584.3 wind project MW that have achieved in service or under construction status during this time period, 408.0 MW, or 3.9 percent have been developed by Transmission Owners building in their own service territory. Of that 408.0 MW of wind projects, 396.0 MW or 97.1 percent have been developed by Exelon in the ComEd Zone.
Table 12-32 Relationship between project developer and transmission owner for all wind project MW in PJM interconnection queue: 1997 through 2017
Parent CompanyTransmission Owner
Related To Developer
MW by Project Status
In ServiceUnder
Construction Suspended Withdrawn Active Total MWAEP AEP Related 0.0 0.0 0.0 0.0 0.0 0.0
Unrelated 2,052.0 966.6 1,650.0 14,383.8 6,831.4 25,883.8AES DAY Related 0.0 0.0 0.0 0.0 0.0 0.0
Unrelated 0.0 0.0 300.0 1,828.0 0.0 2,128.0DLCO DLCO Related 0.0 0.0 0.0 0.0 0.0 0.0
Unrelated 0.0 0.0 0.0 0.0 0.0 0.0Dominion Dominion Related 0.0 12.0 0.0 130.0 0.0 142.0
Unrelated 0.0 673.9 300.0 1,880.9 212.2 3,067.0Duke DEOK Related 0.0 0.0 0.0 0.0 0.0 0.0
Unrelated 0.0 0.0 0.0 0.0 0.0 0.0EKPC EKPC Related 0.0 0.0 0.0 0.0 0.0 0.0
Unrelated 0.0 0.0 0.0 150.3 0.0 150.3Exelon AECO Related 0.0 0.0 0.0 0.0 0.0 0.0
Unrelated 7.5 150.0 25.0 3,626.4 0.0 3,808.9BGE Related 0.0 0.0 0.0 0.0 0.0 0.0
Unrelated 0.0 0.0 0.0 0.0 0.0 0.0ComEd Related 396.0 0.0 0.0 0.0 0.0 396.0
Unrelated 2,238.5 802.5 710.0 20,859.8 2,769.0 27,379.8DPL Related 0.0 0.0 0.0 0.0 0.0 0.0
Unrelated 0.0 100.0 0.0 2,210.0 499.6 2,809.6PECO Related 0.0 0.0 0.0 0.0 0.0 0.0
Unrelated 0.0 0.0 0.0 0.0 0.0 0.0Pepco Related 0.0 0.0 0.0 0.0 0.0 0.0
Unrelated 0.0 0.0 0.0 0.0 0.0 0.0First Energy AP Related 0.0 0.0 0.0 0.0 0.0 0.0
Unrelated 1,031.4 426.0 130.0 3,027.5 747.8 5,362.7ATSI Related 0.0 0.0 0.0 0.0 0.0 0.0
Unrelated 0.0 500.0 0.0 645.6 315.7 1,461.3JCPL Related 0.0 0.0 0.0 0.0 0.0 0.0
Unrelated 30.6 0.0 0.0 60.0 0.0 90.6Met-Ed Related 0.0 0.0 0.0 0.0 0.0 0.0
Unrelated 70.0 0.0 0.0 0.0 0.0 70.0PENELEC Related 0.0 0.0 0.0 0.0 0.0 0.0
Unrelated 862.5 38.3 150.0 4,927.6 475.8 6,454.1PPL PPL Related 0.0 0.0 0.0 0.0 0.0 0.0
Unrelated 226.5 0.0 100.0 2,443.8 610.5 3,380.8PSEG PSEG Related 0.0 0.0 0.0 0.0 0.0 0.0
Unrelated 0.0 0.0 0.0 20.0 0.0 20.0
Consolidated Edison, Inc.RECO Related 0.0 0.0 0.0 0.0 0.0 0.0
Unrelated 0.0 0.0 0.0 0.0 0.0 0.0
TotalRelated 396.0 12.0 0.0 130.0 0.0 538.0Unrelated 6,519.0 3,657.3 3,365.0 56,063.7 12,461.9 82,066.8

562 Section 12 Planning
2017 State of the Market Report for PJM
© 2018 Monitoring Analytics, LLC
Zone, and additional projects designed to alleviate reliability issues in northern New Jersey. Many of the individual projects cost less than $5 million.31
Backbone FacilitiesPJM baseline transmission projects are implemented to resolve reliability criteria violations. PJM backbone transmission projects are a subset of significant baseline projects, which are intended to resolve multiple reliability criteria violations and congestion issues and which may have substantial impacts on energy and capacity markets. There are currently three backbone projects under development, Surry Skiffes Creek 500kV, and the conversion of the Marion-Bayonne and Bayway-Linden lines from 138 kV to 345 kV.32
Market Efficiency Process33
PJM’s Regional Transmission Expansion Plan (RTEP) process includes a market efficiency analysis. The purpose of the market efficiency analysis is: to determine which reliability based enhancements have economic benefit if accelerated; to identify new transmission enhancements that result in economic benefits; and to identify economic benefits associated with modification to existing RTEP reliability based enhancements that when modified would relieve one or more economic constraints. PJM identifies the economic benefit of proposed transmission projects by conducting production cost analyses.34
PJM presents all of the RTEP market efficiency enhancements to the TEAC Committee for review and comment. Subsequent to TEAC review, PJM addresses the TEAC review and presents the final RTEP market efficiency plan to the PJM Board, along with the advice, comments, and recommendations of the TEAC Committee, for Board approval.
To be included in the RTEP recommended to the PJM Board of Managers for approval, the relative benefits and costs of the economic based enhancement or
31 See PJM. “PJM Board authorizes $317 million in transmission upgrades,” <http://www.pjm.com/-/media/about-pjm/newsroom/2017-releases/20171206-pjm-board-approves-rtep-updates-news-release.ashx> (December 6, 2017).
32 See PJM. “2017 RTEP Process Scope and Input Assumptions White Paper,” P 25. <http://www.pjm.com/-/media/library/reports-notices/2017-rtep/20170731-rtep-input-assumptions-and-scope-whitepaper.ashx?la=en>.
33 The material in this section is based in part on the PJM Manual 14B: PJM Region Transmission Planning Process. See PJM. “PJM Manual 14B: PJM Region Transmission Planning Process,” Rev. 40 (Oct. 26, 2017) <http://www.pjm.com/-/media/documents/manuals/m14b.ashx?la=en>.
34 See PJM. “PJM Regional Transmission Expansion Plan: 2016,” (February 28, 2017). <http://www.pjm.com/-/media/library/reports-notices/2016-rtep/2016-rtep-books-1-3.ashx?la=en>.
Regional Transmission Expansion Plan (RTEP)Authorized TEAC Transmission Upgrades The Transmission Expansion Advisory Committee (TEAC) regularly reviews internal and external proposals to improve transmission reliability throughout PJM. These proposals are periodically presented to the PJM Board of Managers for authorization.
• On July 26, 2017, the PJM Board of Managers authorized more than $417 million in electric transmission projects for reliability. The approved projects include a large substation that serves critical infrastructure customers in Newark, N.J., a $275 million PSEG Newark Switch substation project to replace aging equipment, and additional equipment upgrades and improvements in areas served by: American Electric Power; Dominion; Atlantic City Electric Company; PECO Energy Company; Pennsylvania Electric Company; American Transmission Systems, Inc.; East Kentucky Power Cooperative, Inc. and Dayton Power & Light. Most of the individual projects cost less than $5 million.29
• On October 18, 2017, the PJM Board of Managers authorized $1 billion in various electric transmission projects including reliability and market efficiency improvements. The approved projects include approximately $300 million in reliability reinforcements to several 69 kV transmission lines in New Jersey. The PJM Board approved upgrades in areas served by American Electric Power; American Transmission Systems, Inc.; Commonwealth Edison; Dominion; East Kentucky Power Cooperative, Inc.; Pennsylvania Electric Company; and Public Service Electric & Gas. Many of the individual projects cost less than $5 million.30
• On December 6, 2017, the PJM Board of Managers authorized $318 million in electric transmission projects for reliability. The approved projects include a new $20 million 138 kV transmission line substation project in the ComEd Zone, a $16.5 million rebuild of a 161 kV line in the AEP
29 See PJM. “PJM Board approves $417 million investment in transmission improvements,“ <http://www.pjm.com/-/media/about-pjm/newsroom/2017-releases/20170726-pjm-board-approves-417-million-investment-in-transmission-improvements.ashx> (July 26, 2017).
30 See PJM. “PJM Board authorizes $1 billion in transmission upgrades,” <http://www.pjm.com/-/media/about-pjm/newsroom/2017-releases/20171018-pjm-board-authorizes-1-billion-in-transmission-upgrades.ashx> (October 18, 2017).

2017 State of the Market Report for PJM 563
Section 12 Planning
© 2018 Monitoring Analytics, LLC
a cost/benefit analysis and why such a project should not be subject to competition. The MMU recommends that PJM limit the scope of supplemental projects that can obtain exceptions to the Order No. 1000 process to ensure maximum competition.
PJM MISO Interregional Targeted Market Efficiency Process (TMEP)PJM and MISO developed a process to facilitate the construction of interregional projects in response to the Commissions concerns about interregional coordination along the PJM-MISO seam, called the Targeted Market Efficiency Process (TMEP).37
The allocation of costs to each RTO for TMEPs will be in proportion to the benefits received.38
On November 2, 2017, PJM submitted a compliance filing including additional revisions the MISO-PJM JOA to include stakeholder feedback in the TMEP project selection process.39 40
The first TMEP analysis included the investigation of congestion on 50 market to market flowgates. The study resulted in the evaluation of 13 potential upgrades, resulting in the recommendation of five TMEP projects. The five projects address $59 million in historical congestion, with a TMEP benefit of $99.6 million. The projects have a total cost of $20 million, with a 5.0 average benefit/cost ratio. PJM and MISO presented the five recommended projects to their boards in December, 2017, and both boards approved all five projects.41
Artificial IslandArtificial Island is an area in southern New Jersey that includes nuclear units at Salem and at Hope Creek in the PSEG Zone. On April 29, 2013, PJM issued a request for proposal (RFP), seeking technical solutions to improve stability issues and operational performance under a range of anticipated system conditions, and the elimination of potential planning criteria violations in this area. On July 30, 2015, the PJM Board of Managers accepted PJM’s recommendation to assign the project
37 See PJM Interconnection, L.L.C, Docket No. ER17-718-000 (December 30, 2016).38 See PJM Interconnection, L.L.C, Docket No. ER17-729-000 (December 30, 2016).39 See PJM Interconnection, L.L.C, Docket No. ER17-718-000, ER17-721-000 and ER17-729-000 (Not
Consolidated) (November 2, 2017).40 161 FERC ¶ 61,005 (2017). Order accepting filings subject to condition.41 See PJM. “MISO PJM IPSAC,” (January 12, 2018) <http://www.pjm.com/-/media/committees-
groups/stakeholder-meetings/ipsac/20180112/20180112-ipsac-presentation.ashx>.
expansion must meet a benefit/cost ratio threshold of at least 1.25:1. The benefit/cost ratio is the ratio of the present value of the total annual benefit for 15 years by the present value of the total annual cost for each of the first 15 years of the life of the enhancement or expansion.
The market efficiency process is comprised of a 12 month cycle and a 24 month cycle, both of which begin and end on the calendar year. The 12 month cycle is used for analysis of modifications and accelerations to approved RTEP projects only. The 24 month cycle is used for analysis of new economic transmission upgrades for years five through 15. This long-term proposal window takes place concurrent with the long-term proposal window for reliability projects. 35
Through December 31, 2017, PJM has completed two market efficiency cycles. In the first cycle, PJM received 92 proposals for 11 identified issues. In the second market efficiency cycle, PJM received 96 proposals for four identified issues.
Supplemental ProjectsSupplemental projects are “transmission expansions or enhancements that are not required for compliance with PJM criteria and are not state public policy projects according to the PJM Operating Agreement. These projects are used as inputs to RTEP models, but are not required for reliability, economic efficiency or operational performance criteria, as determined by PJM.”36 Supplemental projects are funded wholly by the Transmission Owner and no PJM approval is needed. Supplemental projects addressed two of the four issues identified in the most recent market efficiency cycle. Because supplemental projects are considered by transmission owners to be outside the scope of FERC Order No. 1000, supplemental projects may be considered noncompetitive.
The MMU is concerned with the impact of supplemental projects on the market efficiency process. It is not clear how a supplemental project can be used to resolve market efficiency projects that have been identified based on
35 See PJM. “PJM Market Efficiency Modeling Practices,” (February 2, 2017). <http://www.pjm.com/-/media/planning/rtep-dev/market-efficiency/pjm-market-efficiency-modeling-practices.ashx?la=en>.
36 See PJM. “Transmission Construction Status,” (January 23, 2018) <http://www.pjm.com/planning/rtep-upgrades-status/construct-status.aspx>.

564 Section 12 Planning
2017 State of the Market Report for PJM
© 2018 Monitoring Analytics, LLC
could impede free flowing ties within the PJM RTO and/or adjacent areas.45 When one of the reportable transmission facilities needs to be taken out of service, the TO is required to submit an outage request as early as possible. The specific timeline is shown in Table 12-34.46
Transmission outages have significant impacts on PJM markets. There are impacts on FTR auctions, on congestion, and on expected market outcomes in the day-ahead and real-time markets. It is important for the efficient functioning of the markets that there be clear, enforceable rules governing transmission outages.
Transmission outages are categorized by duration: greater than 30 calendar days; less than or equal to 30 calendar days and greater than five calendar days; or less than or equal to five calendar days.47 Table 12-33 shows that 73.4 percent of the requested outages were planned for less than or equal to five days and 8.5 percent of requested outages were planned for greater than 30 days in the 2017/2018 planning period. It also shows that 76.9 percent of the requested outages were planned for less than or equal to five days and 7.0 percent of requested outages were planned for greater than 30 days in the 2016/2017 planning period.
All of the outage data in this section except in the analysis for the day-ahead market are for outages scheduled to occur in the planning periods 2016/2017 and 2017/2018, regardless of when they were initially submitted.48 The outage data in the analysis for the day-ahead market are for outages scheduled to occur from January 1, 2015, through December 31, 2017.
Table 12-33 Transmission facility outage request summary by planned duration: planning periods 2016/2017 and 2017/2018
2016/2017 2017/2018Planned Duration (Days)
Outage Requests Percent
Outage Requests Percent
<=5 16,440 76.9% 11,465 73.4%>5 & <=30 3,448 16.1% 2,817 18.0%>30 1,489 7.0% 1,331 8.5%Total 21,377 100.0% 15,613 100.0%
45 If a transmission facility is not modeled in the PJM EMS or the facility is not expected to significantly impact PJM system security or congestion management, it is not reportable. See PJM. “Manual 3A: Energy Management System (EMS) Model Updates and Quality Assurance (QA), Rev. 13 (September 29, 2017).
46 See PJM. “Manual 3: Transmission Operations,” Rev. 52 (Dec. 22, 2017), p.69.47 Id. p.70.48 The hotline tickets, EMS tripping tickets or test outage tickets were excluded. We only included all
the transmission outage tickets submitted by PJM internal companies which are currently active.
to LS Power, a merchant developer, PSEG, and PHI with a total cost estimate between $263M and $283M.42 43 On August 5, 2016, PJM announced that the Artificial Island project was to be suspended immediately due to unanticipated project complexities and significant cost overruns. On March 3, 2017, PJM held a special Transmission Expansion Advisory Committee (TEAC) meeting to discuss their updated analysis of the Artificial Island project. PJM staff presented updated assumptions that went into the new project analysis. In consultation with project developers and stakeholders, PJM made several major revisions to the project. These included switching the interconnection point from the Salem Substation to the Hope Creek Substation, removal of the New Freedom switched vertical circuit (SVC) from the project scope, and removal of the optical ground wire (OPGW) from the project scope. These revisions led to a revised total project cost estimate of $280 million, $140 million less than the previous $420 million project cost estimate released in February 2016. On April 6, 2017, the PJM Board lifted a suspension of the project. It is expected to be in service by June 2020.
On October 25, 2012, Schedule 12 of the tariff and Schedule 6 of the OA were changed to address FERC Order No. 1000 reforms to the cost allocation requirements for local and regional transmission planning projects that were formerly defined in Order No. 890. The new approach was applied for the first time to the 2013 RTEP. The allocation process has been upheld by FERC despite repeated challenges.44
Transmission Facility OutagesScheduling Transmission Facility Outage RequestsA transmission facility is designated as reportable by PJM if a change in its status can affect a transmission constraint on any Monitored Transmission Facility or
42 See “Artificial Island Recommendations,” presented at the TEAC meeting on April 28, 2015 at <http://www.pjm.com/~/media/committees-groups/committees/teac/20150428-ai/20150428-artificial-island-recommendations.ashx>.
43 See letter from Terry Boston concerning the Artificial Island Project at <http://www.pjm.com/-/media/library/reports-notices/special-reports/board-statement-on-artificial-island-project.ashx?la=en>.
44 See 155 FERC ¶ 61,090 (2016); 155 FERC ¶ 61,089 (2016); 155 FERC ¶ 61,088 (2016); see also Order No. 1000, FERC Stats. & Regs. ¶ 31,323 (2011), order on reh’g, Order No. 1000-A, 139 FERC ¶ 61,132, order on reh’g and clarification, Order No. 1000-B, 141 FERC ¶ 61,044 (2012), aff’d sub nom. 762 F.3d 41, 412 (D.C. Cir. 2014); 142 FERC ¶ 61,074 (2013) (accepting the proposed PJM cost allocation method, effective February 1, 2013, subject to the outcome of PJM’s Order No. 1000 regional compliance filing proceeding); 142 FERC ¶ 61,214 (2013), order on reh’g and compliance, 147 FERC ¶ 61,128 (2014), order on reh’g and compliance, 150 FERC ¶ 61,038 (2015), order on reh’g and compliance, 151 FERC ¶ 61,250 (2015).

2017 State of the Market Report for PJM 565
Section 12 Planning
© 2018 Monitoring Analytics, LLC
Table 12-35 shows a summary of requests by received status. In the 2017/2018 planning period, 43.7 percent of outage requests received were late. In the 2016/2017 planning period, 50.2 percent of outage requests received were late.
Once received, PJM processes outage requests in priority order: emergency transmission outage request; transmission outage requests submitted on time; and transmission outage request submitted late. PJM retains the right to deny all transmission outage requests that are submitted late unless the request is an emergency.
Outages with emergency status will be approved even if submitted late after PJM determines that the outage does not result in Emergency Procedures. PJM cancels or withholds approval of any outage that results in Emergency Procedures.51 Table 12-36 is a summary of outage requests by emergency status. Of all outage requests scheduled to occur in the 2017/2018 planning period, 10.9 percent were for emergency outages. Of all outage requests scheduled to occur in the 2016/2017 planning period, 13.2 percent were for emergency outages.
PJM will approve all transmission outage requests that are submitted on time and do not jeopardize the reliability of the PJM system. PJM will approve all transmission outage requests that are submitted late and are not expected to cause congestion on the PJM
system and do not jeopardize the reliability of the PJM system. Each outage is studied and if it is expected to cause a constraint to exceed a limit, PJM will flag the outage ticket as “congestion expected.”52
After PJM determines that a late request may cause congestion, PJM informs the Transmission Owner of solutions available
to eliminate the congestion. For example, if a generator planned or maintenance outage request is contributing to the congestion, PJM can request that the Generation
51 PJM. “Manual 3: Transmission Operations,” Rev. 52 (Dec. 22, 2017) at 81.52 PJM added this definition to Manual 38 in February 2017. PJM. “Manual 38: Operations Planning,”
Rev. 11 (Feb. 1, 2018) at 20.
After receiving a transmission facility outage request from a TO, PJM assigns a received status to the request based on its submission date and outage planned duration. The received status can be On Time or Late, as defined in Table 12-34.49
The purpose of the rules defined in Table 12-34 is to require the TOs to submit transmission facility outages prior to the Financial Transmission Right (FTR) auctions so that market participants have complete information about market conditions on which to base their FTR bids and so that PJM can accurately model market conditions.50
Table 12-34 PJM transmission facility outage request received status definitionPlanned Duration (Calendar Days) Request Submitted
Received Status
<=5Before the first of the month one month prior to the starting month of the outage On TimeAfter or on the first of the month one month prior to the starting month of the outage Late
> 5 & <=30Before the first of the month six months prior to the starting month of the outage On TimeAfter or on the first of the month six months prior to the starting month of the outage Late
>30
The earlier of 1) February 1, 2) the first of the month six months prior to the starting month of the outage On TimeAfter or on the earlier of 1) February 1, 2) the first of the month six months prior to the starting month of the outage Late
Table 12-35 Transmission facility outage request summary by received status: planning periods 2016/2017 and 2017/2018
2016/2017 2017/2018Planned Duration (Days)
On Time Late Total
Percent Late
On Time Late Total
Percent Late
<=5 8,471 7,969 16,440 48.5% 6,598 4,867 11,465 42.5%>5 & <=30 1,667 1,781 3,448 51.7% 1,636 1,181 2,817 41.9%>30 515 974 1,489 65.4% 554 777 1,331 58.4%Total 10,653 10,724 21,377 50.2% 8,788 6,825 15,613 43.7%
Table 12-36 Transmission facility outage request summary by emergency: planning periods 2016/2017 and 2017/2018
2016/2017 2017/2018Planned Duration (Days) Emergency
Non Emergency Total
Percent Emergency Emergency
Non Emergency Total
Percent Emergency
<=5 2,186 14,254 16,440 13.3% 1,301 10,164 11,465 11.3%>5 & <=30 433 3,015 3,448 12.6% 254 2,563 2,817 9.0%>30 199 1,290 1,489 13.4% 153 1,178 1,331 11.5%Total 2,818 18,559 21,377 13.2% 1,708 13,905 15,613 10.9%
49 See PJM. “Manual 3: Transmission Operations,” Rev. 52 (Dec. 22, 2017), at 69–70.50 See “Report of PJM Interconnection, L.L.C. on Transmission Oversight Procedures,” Docket No.
EL01-122-000 (November 2, 2001).

566 Section 12 Planning
2017 State of the Market Report for PJM
© 2018 Monitoring Analytics, LLC
Owner defer the outage. If no solutions are available, PJM may require the Transmission Owner to reschedule or cancel the outage.
Table 12-37 is a summary of outage requests by congestion status. Of all outage requests submitted to occur in the 2017/2018 planning period, 8.1 percent were expected to cause congestion. Of all the outage requests that were expected to cause congestion, 3.0 percent (38 out of 1,264) were denied by PJM in the 2017/2018 planning period and 16.4 percent (207 out of 1,264) were cancelled (Table 12-39). Of all outage requests submitted to occur in the 2016/2017 planning period, 8.9 percent were expected to cause congestion. Of all the outage requests that were expected to cause congestion, 4.1 percent (77 out of 1,893) were denied by PJM in the 2016/2017 planning period and 18.9 percent (357 out of 1,893) were cancelled (Table 12-39).
Table 12-37 Transmission facility outage request summary by congestion: planning periods 2016/2017 and 2017/2018
2016/2017 2017/2018
Planned Duration (Days)
Congestion Expected
No Congestion
Expected Total
Percent Congestion
ExpectedCongestion
Expected
No Congestion
Expected Total
Percent Congestion
Expected<=5 1,389 15,051 16,440 8.4% 807 10,658 11,465 7.0%>5 & <=30 373 3,075 3,448 10.8% 317 2,500 2,817 11.3%>30 131 1,358 1,489 8.8% 140 1,191 1,331 10.5%Total 1,893 19,484 21,377 8.9% 1,264 14,349 15,613 8.1%
Table 12-38 shows the outage requests summary by received status, congestion status and emergency status. In the 2017/2018 planning period, 32.9 percent of requests were submitted late and were nonemergency while 1.3 percent of requests (205 out of 15,613) were late, nonemergency, and expected to cause congestion. In the 2016/2017 planning period, 37.1 percent of request were submitted late and were nonemergency while 1.9 percent of requests (403 out of 21,377) were late, nonemergency, and expected to cause congestion.
Table 12-38 Transmission facility outage request summary by received status, emergency and congestion: planning periods 2016/2017 and 2017/2018
2016/2017 2017/2018
Received Status
Congestion Expected
No Congestion
Expected Total PercentCongestion
Expected
No Congestion
Expected Total PercentLate Emergency 114 2,687 2,801 13.1% 71 1,615 1,686 10.8%
Non Emergency 403 7,520 7,923 37.1% 205 4,934 5,139 32.9%On Time Emergency 2 15 17 0.1% 3 19 22 0.1%
Non Emergency 1,374 9,262 10,636 49.8% 985 7,781 8,766 56.1%Total 1,893 19,484 21,377 100.0% 1,264 14,349 15,613 100.0%
Once PJM processes an outage request, the outage request is labelled as Submitted, Received, Denied, Approved, Cancelled by Company, PJM Admin Closure, Revised, Active or Complete according to the processed stage of a request.53 Table 12-39 shows the detailed process status for outage requests only for the outage requests that are expected to cause congestion. Status Submitted and status Received are in the In Process category and status Cancelled by Company and status PJM Admin Closure are in the Cancelled category in Table 12-39. Table 12-39 shows that of all the outage requests that were expected to cause congestion, 3.0 percent (38 out of 1,264) were denied by PJM in the 2017/2018 planning period, 56.9 percent were complete and 16.4 percent (207 out of 1,264) were cancelled. Of all the outage requests that were expected to cause congestion, 4.1 percent (77 out of 1,893) were denied by PJM in the 2016/2017 planning period, 72.0 percent were complete and 18.9 percent (357 out of 1,893) were cancelled.
53 See PJM Markets & Operations, PJM Tools “Outage Information,” <http://www.pjm.com/markets-and-operations/etools/oasis/system-information/outage-info.aspx> (2017).

2017 State of the Market Report for PJM 567
Section 12 Planning
© 2018 Monitoring Analytics, LLC
Table 12-39 Transmission facility outage requests that might cause congestion status summary: planning periods 2016/2017 and 2017/2018
2016/2017 2017/2018
Submission Status Cancelled CompleteIn
Process DeniedCongestion
ExpectedPercent
Complete Cancelled CompleteIn
Process DeniedCongestion
ExpectedPercent
CompleteLate Emergency 10 103 0 1 114 90.4% 10 59 2 0 71 83.1%
Non Emergency 69 280 10 44 403 69.5% 29 129 32 13 205 62.9%On Time Emergency 0 1 0 0 2 50.0% 2 1 0 0 3 33.3%
Non Emergency 278 979 75 32 1,374 71.3% 166 530 257 25 985 53.8%Total 357 1,363 85 77 1,893 72.0% 207 719 291 38 1,264 56.9%
There are clear rules defined for assigning On Time or Late status for submitted outage requests in both the PJM Tariff and PJM Manuals.54 However, the On Time or Late status only affects the priority that PJM assigns for processing the outage request. Table 12-39 shows that in the 2016/2017 planning period, many (69.5 percent or 280 out of 403) outages that were nonemergency, expected to cause congestion, and late transmission outages were approved and completed compared to (62.9 percent or 129 out of 205) in the 2017/2018 planning period. The expected impact on congestion is the basis for PJM’s treatment of late outage requests. But there is no rule or clear definition of this congestion analysis in the PJM Manuals. The MMU recommends that PJM draft a clear definition of the congestion analysis required for transmission outage requests to include in Manual 3 after appropriate review.
Rescheduling Transmission Facility Outage RequestsA TO can reschedule or cancel an outage after initial submission. Table 12-40 is a summary of all the outage requests planned for the planning periods 2016/2017 and 2017/2018 which were approved and then cancelled or rescheduled by TOs at least once. If an outage request was submitted, approved and subsequently rescheduled at least once, the outage request will be counted as Approved and Rescheduled. If an outage request was submitted, approved and subsequently cancelled at least once, the outage request will be counted as Approved and Cancelled. In the 2017/2018 planning period, 24.2 percent of transmission outage requests were approved by PJM and then rescheduled by the TOs, and 9.2 percent of the transmission outages were approved by PJM and subsequently cancelled by the TOs. In the 2016/2017 planning period, 30.2 percent of transmission outage requests were approved by PJM and then rescheduled by the TO, and 10.8 percent of the transmission outages were approved by PJM and subsequently cancelled by the TO.
Table 12-40 Rescheduled and cancelled transmission outage request summary: planning periods 2016/2017 and 2017/2018
2016/2017 2017/2018
DaysOutage
Requests
Approved and
Rescheduled
Percent Approved and
Rescheduled
Approved and
Cancelled
Percent Approved and
CancelledOutage
Requests
Approved and
Rescheduled
Percent Approved and
Rescheduled
Approved and
Cancelled
Percent Approved and
Cancelled<=5 16,440 3,460 21.0% 2,048 12.5% 11,465 1,922 16.8% 1,252 10.9%>5 & <=30 3,448 2,008 58.2% 211 6.1% 2,817 1,192 42.3% 135 4.8%>30 1,489 990 66.5% 50 3.4% 1,331 668 50.2% 44 3.3%Total 21,377 6,458 30.2% 2,309 10.8% 15,613 3,782 24.2% 1,431 9.2%
If a requested outage is determined to be late and TO reschedules the outage, the outage will be revaluated by PJM again as On Time or Late.
A transmission outage ticket with duration of five days or less with an On Time status can retain its On Time status if the outage is rescheduled within the original scheduled month.55 This rule allows a TO to reschedule within the same month with very little notice.
54 OA Schedule 1 § 1.9.2.55 PJM. “Manual 3: Transmission Operations,” Rev. 52 (Dec. 22, 2017) at 70.

568 Section 12 Planning
2017 State of the Market Report for PJM
© 2018 Monitoring Analytics, LLC
Table 12-41 Transmission outage summary: planning periods 2016/2017 and 2017/2018
2016/2017 2017/2018
DurationDivided into
Shorter PeriodsNumber of
Outages PercentNumber of
Outages Percent> 30 Days No 1,287 10.1% 1,174 11.7%
Yes 247 1.9% 200 2.0%<= 30 Days 11,238 88.0% 8,689 86.3%Total 12,772 100.0% 10,063 100.0%
Table 12-42 shows the details of potentially long duration (> 30 days) outages when combining the duration of the outages for the same equipment. The actual duration of scheduled outages would be longer than 30 days if the duration of the outages were combined for the same equipment within a period of days. In the 2017/2018 planning period, there would have been 25 outages with a combined duration longer than 30 days that were instead scheduled to occur as shorter outages within a period of more than 31 days and less than 62 days.
Table 12-42 Summary of potentially long duration (> 30 days) outages: planning periods 2016/2017 and 2017/2018
2016/2017 2017/2018
DaysNumber of
Outages PercentNumber of
Outages Percent<=31 4 1.6% 4 2.0%>31 & <=62 28 11.3% 25 12.5%>62 & <=93 14 5.7% 20 10.0%>93 201 81.4% 151 75.5%Total 247 100.0% 200 100.0%
Transmission Facility Outage Analysis for the FTR MarketTransmission facility outages affect the price and quantity outcomes of FTR Auctions. The purpose of the rules governing outage reporting is to ensure that outages are known with enough lead time prior to FTR Auctions so that market participants can understand market conditions and so that PJM can accurately model market conditions.
There are Long Term, Annual and Monthly Balance of Planning Period auctions in the FTR Market. For each type of auction, PJM includes a set of outages to be modeled.
Annual FTR MarketThe Annual FTR Market includes the Annual ARR Allocation and the Annual FTR Auction. When determining transmission outages to be modeled in
A transmission outage ticket with a duration exceeding five days with an On Time status can retain its On Time status if the outage is rescheduled to a future month, and the revision is submitted by the first of the month prior to the revised month in which the outage will occur.56 This rescheduling rule is much less strict than the rule that applies to the first submission of outage requests with similar duration. When first submitted, the outage request with a duration exceeding five days needs to be submitted before the first of the month nine months prior to the month in which the outage was expected to occur.
The MMU recommends that PJM reevaluate all transmission outage tickets as On Time or Late as if they were new requests when an outage is rescheduled and apply the standard rules for late submissions to any such outages.
Long Duration Transmission Facility Outage RequestsPJM rules (Table 12-34) define a transmission outage request as On Time or Late based on the planned outage duration and the time of submission. The rule has stricter submission requirements for transmission outage requests planned for longer than 30 days. In order to avoid the stricter submission requirement, some transmission owners divided the duration of outage requests longer than 30 days into shorter segments for the same equipment and submitted one request for each segment. The MMU recommends that PJM not permit transmission owners to divide long duration outages into smaller segments to avoid complying with the requirements for long duration outages.
Table 12-41 shows that there were 10,063 transmission equipment planned outages in the 2017/2018 planning period, of which 1,374 were planned outages longer than 30 days, and of which 200 or 2.0 percent were scheduled longer than 30 days if the duration of the outages were combined for the same equipment. The duration of those outages could potentially be longer than 30 days, however were divided into shorter periods by transmission owners.
56 Id.

2017 State of the Market Report for PJM 569
Section 12 Planning
© 2018 Monitoring Analytics, LLC
out of 250) modeled in the Annual FTR Market for the planning period were submitted late according to outage submission rules. It also shows that 4.4 percent of the outage requests modeled in the Annual FTR Market for the 2016/2017 planning period had a planned duration of less than two weeks and that 10.4 percent of the outage requests (26 out of 249) modeled in the Annual FTR Market for the planning period were submitted late according to outage submission rules.
Table 12-44 shows the annual FTR market modeled outage requests summary by emergency status and received status. All the annual FTR market modeled outages expected to occur in the 2017/2018 planning period were nonemergency outages. Two of the modeled outages expected to occur in the 2016/2017 planning period were emergency outages.
PJM determines expected congestion for both On Time and Late outage requests. A Late outage request may be denied or cancelled if it is expected to cause congestion. Table 12-45 shows a summary of requests by expected
congestion and received status. Overall, 12.1 percent (4 out of 33) of all the annual FTR market modeled outages expected to occur in the 2017/2018 planning period and submitted late were expected to cause congestion. Of all the annual FTR market modeled outages expected to occur in the 2016/2017 planning period and submitted late, 11.5 percent (3 out of 26) were expected to cause congestion.
the simultaneous feasibility test used in the Annual FTR Market, PJM considers all outages with planned duration longer than or equal to two months and may consider outages with planned durations shorter than two months. PJM may exercise significant discretion in selecting outages to be modeled. PJM posts an FTR outage list to the FTR web page usually at least one week before the auction bidding opening day.57
In the 2017/2018 planning period, 250 outage requests were included in the annual FTR market outage list and 15,363 outage requests were not included. In the 2016/2017 planning period, 249 outage requests were included in the annual FTR market outage list and 21,128 outage requests were not included. Table 12-43, Table 12-44, Table 12-45 and Table 12-46 show the summary information on the modeled outage requests and Table 12-47 and Table 12-48 show the summary information on outages that were not included in the Annual FTR Market.
Table 12-43 Annual FTR market modeled transmission facility outage requests by received status: planning periods 2016/2017 and 2017/2018
2016/2017 2017/2018
Planned DurationOn
Time Late Total PercentOn
Time Late Total Percent<2 weeks 10 1 11 4.4% 4 2 6 2.4%>=2 weeks & <2 months 88 2 90 36.1% 87 9 96 38.4%>=2 months 125 23 148 59.4% 126 22 148 59.2%Total 223 26 249 100.0% 217 33 250 100.0%
Table 12-44 Annual FTR market modeled transmission facility outage requests by emergency and received status: planning periods 2016/2017 and 2017/2018
2016/2017 2017/2018
Planned Duration EmergencyNon
Emergency TotalPercent Non Emergency Emergency
Non Emergency Total
Percent Non Emergency
On Time <2 weeks 0 10 10 100.0% 0 4 4 100.0%>=2 weeks & <2 months 0 88 88 100.0% 0 87 87 100.0%>=2 months 0 125 125 100.0% 0 126 126 100.0%Total 0 223 223 100.0% 0 217 217 100.0%
Late <2 weeks 0 1 1 100.0% 0 2 2 100.0%>=2 weeks & <2 months 0 2 2 100.0% 0 9 9 100.0%>=2 months 2 21 23 91.3% 0 22 22 100.0%Total 2 24 26 92.3% 0 33 33 100.0%
Table 12-43 shows that 2.4 percent of the outage requests modeled in the Annual FTR Market for the 2017/2018 planning period had a planned duration of less than two weeks and that 13.2 percent of the outage requests (33
57 PJM Financial Transmission Rights, “Annual ARR Allocation and FTR Auction Transmission Outage Modeling,” <http://www.pjm.com/~/media/markets-ops/ftr/annual-ftr-auction/2017-2018/2017-2018-annual-outage-modeling.ashx> (February 21, 2017).

570 Section 12 Planning
2017 State of the Market Report for PJM
© 2018 Monitoring Analytics, LLC
Table 12-45 Annual FTR market modeled transmission facility outage requests by congestion and received status: planning periods 2016/2017 and 2017/2018
2016/2017 2017/2018
Planned DurationCongestion
Expected
No Congestion
Expected Total
Percent Congestion
ExpectedCongestion
Expected
No Congestion
Expected Total
Percent Congestion
ExpectedOn Time <2 weeks 2 8 10 20.0% 1 3 4 25.0%
>=2 weeks & <2 months 19 69 88 21.6% 20 67 87 23.0%>=2 months 29 96 125 23.2% 34 92 126 27.0%Total 50 173 223 22.4% 55 162 217 25.3%
Late <2 weeks 0 1 1 0.0% 0 2 2 0.0%>=2 weeks & <2 months 0 2 2 0.0% 1 8 9 11.1%>=2 months 3 20 23 13.0% 3 19 22 13.6%Total 3 23 26 11.5% 4 29 33 12.1%
Table 12-46 shows that 27.1 percent of outage requests modeled in the annual FTR market for the 2017/2018 planning period and with a duration of two weeks or longer but shorter than two months were cancelled, compared to 35.6 percent for the 2016/2017 planning period. Table 12-46 also shows that 10.8 percent of outages requests modeled in the Annual FTR Market for the 2017/2018 planning period and with a duration of two months or longer were cancelled, compared to 20.9 percent for the 2016/2017 planning period.
Table 12-46 Annual FTR market modeled transmission facility outage requests by processed status: planning periods 2016/2017 and 2017/2018
2016/2017 2017/2018
Planned DurationProcessed Status
Outage Requests Percent
Outage Requests Percent
<2 weeks In Progress 0 0.0% 1 16.7%Denied 0 0.0% 0 0.0%Approved 0 0.0% 0 0.0%Cancelled 1 9.1% 2 33.3%Revised 0 0.0% 0 0.0%Active 0 0.0% 0 0.0%Completed 10 90.9% 3 50.0%Total 11 100.0% 6 100.0%
>=2 weeks & <2 months In Progress 10 11.1% 31 32.3%Denied 0 0.0% 2 2.1%Approved 0 0.0% 0 0.0%Cancelled 32 35.6% 26 27.1%Revised 0 0.0% 2 2.1%Active 0 0.0% 1 1.0%Completed 48 53.3% 34 35.4%Total 90 100.0% 96 100.0%
>=2 months In Progress 23 15.5% 49 33.1%Denied 0 0.0% 0 0.0%Approved 0 0.0% 1 0.7%Cancelled 31 20.9% 16 10.8%Revised 0 0.0% 2 1.4%Active 3 2.0% 31 20.9%Completed 91 61.5% 49 33.1%Total 148 100.0% 148 100.0%
More outage requests were not modeled in the Annual FTR Market than were modeled in the Annual FTR Market. In the 2017/2018 planning period, 250 outage requests were modeled and 15,363 outage requests were not modeled in the Annual FTR Market. In the 2016/2017 planning period, 249 outage requests were modeled and 21,128 outage requests were not modeled in the Annual FTR Market.
Table 12-47 shows that 12.3 percent of outage requests not modeled in the Annual FTR Auction with duration longer than or equal to two months, labelled On Time according to the rules, were submitted after the Annual FTR Auction bidding opening date for the 2017/2018 planning period compared to 17.5 percent in the 2016/2017 planning period.

2017 State of the Market Report for PJM 571
Section 12 Planning
© 2018 Monitoring Analytics, LLC
are approved and active. The Annual FTR Auction model may consider transmission outages planned for longer than two weeks but less than two months. Those outages not only include long duration outages but also include outages shorter than 30 days. In those cases, PJM outage submission rules failed to prevent long duration transmission outages from being submitted late. The MMU recommends that PJM modify the rules to eliminate the approval of outage requests submitted or rescheduled after the opening of bidding in the Annual FTR Auction.
Monthly FTR MarketWhen determining transmission outages to be modeled
in the simultaneous feasibility test used in the Monthly Balance of Planning Period FTR Auction, PJM considers all outages with planned duration longer than five days and may consider outages with planned durations shorter than or equal to five days. PJM may exercise significant discretion in selecting outages to be modeled. PJM posts an FTR outage list to the FTR webpage usually at
least one week before the auction bidding opening day.58 Table 12-49 and Table 12-50 show the summary information on outage requests modeled in the Monthly Balance of Planning Period FTR Auction and Table 12-51 and Table 12-52 show the summary information on outage requests not modeled in the Monthly Balance of Planning Period FTR Auction.
Table 12-49 shows that on average, 29.3 percent of the outage requests modeled in the Monthly Balance of Planning Period FTR Auction were submitted late according to outage submission rules in the 2017/2018
58 PJM Financial Transmission Rights, “2015/2016 Monthly FTR Auction Transmission Outage Modeling,” <http://www.pjm.com/-/media/markets-ops/ftr/ftr-allocation/monthly-ftr-auctions/2015-2016-monthly-transmission-outages-that-may-cause-infeasibilities.ashx?la=en> (December 9, 2015).
2016/2017 2017/2018On Time Late On Time Late
Planned Duration
Before Bidding
Opening Date
After Bidding
Opening Date
Percent After
Before Bidding
Opening Date
After Bidding
Opening Date
Percent After
Before Bidding
Opening Date
After Bidding
Opening Date
Percent After
Before Bidding
Opening Date
After Bidding
Opening Date
Percent After
<2 weeks 1,486 7,988 84.3% 261 8,802 97.1% 1,405 6,056 81.2% 231 5,306 95.8%>=2 weeks & <2 months 460 376 45.0% 152 953 86.2% 603 352 36.9% 107 715 87.0%>=2 months 99 21 17.5% 185 345 65.1% 136 19 12.3% 197 236 54.5%Total 2,045 8,385 80.4% 598 10,100 94.4% 2,144 6,427 75.0% 535 6,257 92.1%
Table 12-48 shows that 42.8 percent of late outage requests which were not modeled in the Annual FTR Auction with duration longer than or equal to two months and submitted after the Annual FTR Auction bidding opening date were approved and completed in the 2017/2018 planning period. It also shows that 78.0 percent of late outage requests which were not modeled in the Annual FTR Auction with duration longer than or equal to two months and submitted after the Annual FTR Auction bidding opening date were approved and completed in the 2016/2017 planning period.
Table 12-48 Late transmission facility outage requests not modeled in Annual FTR Auction and submitted after annual bidding opening date: planning periods 2016/2017 and 2017/2018
2016/2017 2017/2018
Planned DurationCompleted
Outages Total PercentCompleted
Outages Total Percent<2 weeks 7,385 8,802 83.9% 4,128 5,306 77.8%>=2 weeks & <2 months 834 953 87.5% 485 715 67.8%>=2 months 269 345 78.0% 101 236 42.8%Total 8,488 10,100 84.0% 4,714 6,257 75.3%
Although the definition of late outages was developed in order to prevent outages for the planning period being submitted after the opening of bidding in the Annual FTR Auction, the rules have not functioned effectively because the rule has no direct connection to the date on which bidding opens for the Annual FTR Auction. By requiring all long-duration transmission outages to be submitted before February 1, PJM outage submission rules only prevent long-duration transmission outages from being submitted late. The rule does not address the situation in which long-duration transmission outages are submitted on time, but are rescheduled so that they are late. There is no rule to address the situation in which short-duration outages (duration <= 5 days) are submitted on time, but are changed to long-duration transmission outages after the outages
Table 12-47 Transmission facility outage requests not modeled in Annual FTR Auction: planning periods 2016/2017 and 2017/2018

572 Section 12 Planning
2017 State of the Market Report for PJM
© 2018 Monitoring Analytics, LLC
planning period. On average, 30.8 percent of the outage requests modeled in the Monthly Balance of Planning Period FTR Auction were submitted late according to outage submission rules in the 2016/2017 planning period.
Table 12-49 Monthly Balance of Planning Period FTR Auction modeled transmission facility outage requests by received status: planning periods 2016/2017 and 2017/2018
2016/2017 2017/2018
MonthOn
Time Late TotalLate
PercentOn
Time Late TotalLate
PercentJun 170 94 264 35.6% 134 116 250 46.4%Jul 67 57 124 46.0% 83 72 155 46.5%Aug 77 63 140 45.0% 100 73 173 42.2%Sep 367 129 496 26.0% 394 125 519 24.1%Oct 542 195 737 26.5% 598 162 760 21.3%Nov 365 172 537 32.0% 453 177 630 28.1%Dec 289 130 419 31.0% 330 142 472 30.1%Jan 162 90 252 35.7%Feb 162 89 251 35.5%Mar 310 132 442 29.9%Apr 395 162 557 29.1%May 411 165 576 28.6%Avg 276 123 400 30.8% 299 124 423 29.3%
Table 12-50 shows that on average, 18.6 percent of outage requests modeled in the Monthly Balance of Planning Period FTR Auction were cancelled in the 2017/2018 planning period. On average, 20.4 percent of outage requests modeled in the Monthly Balance of Planning Period FTR Auction were cancelled in the 2016/2017 planning period.
Table 12-50 Monthly Balance of Planning Period FTR Auction modeled transmission facility outage requests by processed status: planning periods 2016/2017 and 2017/2018 Planning Year Month
In Process Denied Approved Cancelled Revised Active Complete Total
Cancelled Percent
2016/2017 Jun 18 3 5 51 1 53 133 264 19.3%Jul 10 12 2 19 0 41 40 124 15.3%Aug 9 1 2 31 0 52 45 140 22.1%Sep 47 4 11 85 0 165 184 496 17.1%Oct 75 5 19 172 0 196 270 737 23.3%Nov 46 1 10 104 0 162 214 537 19.4%Dec 25 4 11 87 0 66 226 419 20.8%Jan 35 0 7 60 0 75 75 252 23.8%Feb 22 2 4 42 1 87 93 251 16.7%Mar 48 2 9 94 0 120 169 442 21.3%Apr 55 2 7 101 1 154 237 557 18.1%May 26 1 18 134 0 119 278 576 23.3%Avg 35 3 9 82 0 108 164 400 20.4%
2017/2018 Jun 19 5 5 52 0 64 105 250 20.8%Jul 11 2 8 25 0 54 55 155 16.1%Aug 10 0 1 27 0 64 71 173 15.6%Sep 67 8 13 100 3 161 167 519 19.3%Oct 77 2 27 142 0 201 311 760 18.7%Nov 39 5 10 121 2 177 276 630 19.2%Dec 42 4 9 97 0 74 246 472 20.6%Avg 38 4 10 81 1 114 176 423 18.6%
Table 12-51 shows that on average, 8.9 percent of outage requests not modeled in the Monthly Balance of Planning Period FTR Auction, labeled On Time according to the rules, were submitted after the monthly FTR auction bidding opening dates in the 2017/2018 planning period, compared to 10.1 percent in the 2016/2017 planning period. On average, 71.0 percent of outage requests not modeled in the Monthly Balance of Planning Period FTR Auction, labeled Late according to the rules, were submitted after the Monthly Balance of Planning Period FTR Auction bidding opening dates in the 2017/2018 planning period, compared to 70.7 percent in the 2016/2017 planning period.

2017 State of the Market Report for PJM 573
Section 12 Planning
© 2018 Monitoring Analytics, LLC
Table 12-51 Transmission facility outage requests that are not modeled in Monthly Balance of Planning Period FTR Auction: planning periods 2016/2017 and 2017/2018
2016/2017 2017/2018On Time Late On Time Late
Before Bidding
Opening Date
After Bidding
Opening Date
Percent After
Before Bidding
Opening Date
After Bidding
Opening Date
Percent After
Before Bidding
Opening Date
After Bidding
Opening Date
Percent After
Before Bidding
Opening Date
After Bidding
Opening Date
Percent After
Jun 694 103 12.9% 336 894 72.7% 642 96 13.0% 306 851 73.6%Jul 274 74 21.3% 251 698 73.6% 294 48 14.0% 245 608 71.3%Aug 413 92 18.2% 259 733 73.9% 344 25 6.8% 211 651 75.5%Sep 964 156 13.9% 292 772 72.6% 862 81 8.6% 257 598 69.9%Oct 1,092 89 7.5% 430 901 67.7% 1,000 75 7.0% 347 866 71.4%Nov 887 57 6.0% 389 832 68.1% 829 69 7.7% 367 789 68.3%Dec 601 47 7.3% 340 723 68.0% 623 55 8.1% 330 687 67.6%Jan 432 35 7.5% 243 592 70.9%Feb 462 25 5.1% 301 674 69.1%Mar 1,068 94 8.1% 357 806 69.3%Apr 1,140 103 8.3% 340 789 69.9%May 1,143 154 11.9% 356 966 73.1%Avg 764 86 10.1% 325 782 70.7% 656 64 8.9% 295 721 71.0%
Table 12-52 shows that on average, 69.5 percent of late outage requests which were not modeled in the Monthly Balance of Planning Period FTR Auction, submitted after the Monthly Balance of Planning Period FTR Auction bidding opening dates, were approved and complete in the 2017/2018 planning period, compared to 69.5 percent in the 2016/2017 planning period.
Table 12-52 Late transmission facility outage requests that are not modeled in Monthly Balance of Planning Period FTR Auction and submitted after monthly bidding opening date: planning periods 2016/2017 and 2017/2018
2016/2017 2017/2018Completed
Outages Total PercentCompleted
Outages Total PercentJun 639 894 71.5% 627 851 73.7%Jul 476 698 68.2% 410 608 67.4%Aug 523 733 71.4% 473 651 72.7%Sep 495 772 64.1% 406 598 67.9%Oct 644 901 71.5% 595 866 68.7%Nov 536 832 64.4% 490 789 62.1%Dec 534 723 73.9% 508 687 73.9%Jan 401 592 67.7%Feb 447 674 66.3%Mar 580 806 72.0%Apr 575 789 72.9%May 668 966 69.2%Avg 543 782 69.5% 501 721 69.5%
Transmission Facility Outage Analysis in the Day-Ahead Energy MarketTransmission facility outages also affect the energy market. Just as with the FTR Market, it is critical that outages that affect the operating day are known prior to the submission of offers in the Day-Ahead Energy Market so that market participants can understand market conditions and so that PJM can accurately model market conditions in the day-ahead market. PJM requires transmission owners to submit changes to outages scheduled for the next two days no later than 09:30 am. 59
In order to analyze the market impact, the outage requests that affect the operating day are compared: before the day-ahead market is closed; when the day-ahead market save cases are created; and during the operating day. The list of approved or active outage requests before the day-ahead market is closed is the view of outages available
59 PJM. “Manual 3: Transmission Operations,” Rev. 52 (Dec. 22, 2017) at 74

574 Section 12 Planning
2017 State of the Market Report for PJM
© 2018 Monitoring Analytics, LLC
Figure 12-5 compares the weekly average number of active or approved outages available to market participants prior to the close of the day-ahead market with the outages included as inputs to the day-ahead market by PJM.
Figure 12-5 Approved or active outage requests: 2015 through 2017
0
100
200
300
400
500
600
700
Numb
er of
Outa
ge R
eque
sts
Market Participant View
Day Ahead Market Model
Market Participant and Day Ahead Model
Market Participant View and Not in Day Ahead Model
Day Ahead Market Model and Not in Market Participant View
Figure 12-6 compares the weekly average number of outages included as inputs to the day-ahead market by PJM with the outages that actually occurred during the operating day.
Figure 12-6 Day-ahead market model outages: 2015 through 2017
0
100
200
300
400
500
600
Numb
er of
Outa
ge R
eque
sts
Day Ahead Market Model
Occurred
Day Ahead Market Model and Occurred
Day Ahead Market Model and Not Occurred
Occurred and Not in Day Ahead Market Model
to market participants. The day-ahead market model uses a list of outages as an input. The list of outages that actually occurred during the operating day are the outages that affect the real-time market. If the three sets of outages are the same, there is no potential impact on markets. If the three sets of outages differ, there is a potential impact on markets.
For example for the operating day of November 23, 2016, Figure 12-4 shows that: there were 421 approved or active outages seen by market participants before the day-ahead market was closed; there were 282 outage requests included in the day-ahead market model; there were 273 outage request included in both sets of outage; there were 148 outage requests approved or active before the day-ahead market was closed but not included as inputs in day-ahead market model; and there were nine outage requests included in day-ahead market model but not available to market participants prior to the day-ahead market.
Figure 12-4 Illustration of day-ahead market analysis: November 22, 2016

2017 State of the Market Report for PJM 575
Section 12 Planning
© 2018 Monitoring Analytics, LLC
Figure 12-7 compares the weekly average number of active or approved outages available to market participants prior to the close of the day-ahead market with the outages that actually occurred during the operating day.
Figure 12-7 Approved or active outage requests: 2015 through 2017
0
100
200
300
400
500
600
700
Numb
er of
Outa
ge R
eque
sts
Market Participant ViewOccurredMarket Participant View and OccurredMarket Participant View and Not OccurredOccurred and Not in Market Participant View
Figure 12-5, Figure 12-6, and Figure 12-7 show that on a weekly average basis, the active or approved outages available to day-ahead market participants, the outages included as inputs in the day-ahead market model and the outages that actually occurred in real time are not consistent. The active or approved outages available to day-ahead market participants are more consistent with the outages that actually occurred in real time than with the outages included in the day-ahead market model.

576 Section 12 Planning
2017 State of the Market Report for PJM
© 2018 Monitoring Analytics, LLC