generate flash charts with pl/sql -...
TRANSCRIPT

Generate FusionCharts Free Flash Charts with Oracle PL/SQL
(Jason Bennett’s Developer Corner (http://radio.weblogs.com/0137094/))
Since Flash charts have become the norm for delivering visual data to our end users in a browser based environment, I thought it would be cool to create a method for delivering both the physical flash object and the dataset for that chart straight from the database using PL/SQL. I chose a product called FusionCharts Free (http://www.fusioncharts.com/free/) as my Flash chart (binary object) provider. FusionCharts Free comes with 22 fully functional (free) charts of varying types from the basic chart to combination charts in both 2D and 3D formats. Each chart type requires a specifically formatted XML dataset. The PL/SQL API I have developed makes it easy for a developer to store and deploy these flash charts directly from the Oracle database and to create dynamic datasets for each chart type directly from the database. Even though the API allows for “one stop shopping” with regard to chart object loading and data set generation, developers can also use this API solely for data set generation. This makes it easy to integrate data from Oracle databases into existing applications that use FusionCharts Free.
The rest of this document is dedicated to describing the PL/SQL API and to providing a few examples. FusionCharts Free provides excellent documentation with their product, so I will not try and reproduce it in this document. Instead, I will give a brief overview of the PL/SQL API and allow you to download it and take it from there.
API Component Overview The API makes use of a PL/SQL package, several user defined object types, and two database tables. The following is a list of all of the API components and a brief description of each:
• FusionFlashCharts PL/SQL package – The FusionFlashCharts PL/SQL package provides the facilities to generate the various XML data sets required by each type of chart. It also provides the utilities that allow a developer to generate and include a chart in a web page (thru a PL/SQL DAD).
• FlashChartSetType object type – Object type represents a single <set/> data set tag and its attributes
• FlashChartGraphAttrType object type – Object type that represents the <graph/> data set tag and its attributes.
• FlashChartGraphAttrSet – Collection of FlashChartGraphAttrType objects.
1

• FlashMSCategoriesType object type – Object type that represents the <categories/> data set tag and its attributes.
• FlashMSCategoriesSet collection – Collection of FlashMSCategoriesType objects.
• FlashMSCategoryType object type – Object type that represents the <category/> data set tag and its attributes for multi-series charts.
• FlashMSCategorySet collection – Collection of FlashMSCategoryType objects.
• FlashMSDataSetType object type – Object type that represents the <dataset/> data set tag and its attributes for multi-series charts.
• FlashMSDataSet collection – Collection of FlashMSDataSetType objects.
• FlashTrendLineType object type – Object type that represents the <line/> data set tag and its attributes.
• FlashTrendLineSet collection – Collection of FlashTrendLineType objects.
• FlashChartAttrType object type – Object type that represents the <chart/> data set tag and its attributes.
• FlashChartAttrSet collection – Collection of FlashChartAttrType objects.• FLASH_CHARTS table – The FLASH_CHARTS table holds the physical
Flash object for each of the 22 charts supplied by Fusion Charts. It consists of four columns: chart_code, chart_name, chart_desc, and chart_blob. The API provides a mechanism for loading and referencing these objects.
• FLASH_JAVASCRIPT table – The FLASH_JAVASCRIPT tables holds the javascript libraries provided by Fusion Charts. The API provides a mechanism for both loading this table and for referencing the libraries.
FusionFlashCharts Package Overview The FusionFlashCharts PL/SQL package contains all of the functions, procedures, and constants required to generate flash charts. The following section details each of the package components.
Boolean ConstantsThe package contains two numeric Boolean constants that are used to populate Boolean attribute values in the chart data sets. The values are:
Constant Name ValueNUMERIC_TRUE 1NUMERIC_FALSE 0
Chart Object Constants
2

The package contains constants that represent each chart type and map to the corresponding code (primary key value) in the FLASH_CHARTS table.
Constant Name Value DescriptionArea2D AR2D 2D Area ChartBar2D BC2D 2D Bar ChartCandlestick CSTK Candlestick ChartColumn2D CL2D 2D Column ChartColumn3D CL3D 3D Column ChartDoughnut2D DN2D 2D Doughnut ChartFunnel FUNL Funnel ChartGantt GNTT Gantt ChartLine LINE Line ChartMSArea2D MA2D Multi-Series 2D Area
ChartMSBar2D MB2D Multi-Series 2D Bar ChartMSColumn2D MC2D Multi-Series 2D Column
ChartMSColumn2DLineDY MCL2 Multi-Series Column 2D +
Line – Dual Y Axis ChartMSColumn3D MC3D Multi-Series 3D Column
ChartMSColumn3DLineDY MCL3 Multi-Series Column 3D +
Line – Dual Y Axis ChartMSLine ML2D Multi-Series Line ChartPie2D PI2D 2D Pie ChartPie3D PI3D 3D Pie ChartStackedArea2D SA2D 2D Stacked Area ChartStackedBar2D SB2D 2D Stacked Bar ChartStackedColumn2D SC2D 2D Stacked Column
ChartStackedColumn3D SC3D 3D Stacked Column
Chart
Hex Color Code ConstantsVarious chart elements can be assigned a color code. The color codes are associated via data set attributes. All color codes must be expressed as hexadecimal color codes. The FusionFlashCharts package provides 24 predefined color constants (it also provides a procedure that will generate a random color code). The list of color code constants and their descriptions are provided in the table below:
Color Constant Hexadecimal ValueAQUA 00FFFF
3

BLACK FFFFFFBLUE 0000FFCRIMSON DC143CDARKBLUE 00008BDARKRED 8B0000DARKORANGE FF8C00DARKGREEN 006400DEEPPINK FF1493FORESTGREEN 228B22GREEN 008000GOLD FFD700INDIGO 4B0082LIME 00FF00MAROON 800000MEDIUMBLUE 0000CDNAVYBLUE 000080ORANGE FFA500ORANGERED FF4500PURPLE 800080RED FF0000WHITE FFFFFFYELLOW FFFF00
Package ProceduresThe FusionFlashCharts package contains six procedures that do everything load charts objects into the chart object table to streaming data sets. The following table names each procedure and gives a brief description of each:
Procedure Name Parameters PurposeuploadChartFile • p_chart_code – Chart type
code. Four character code used to reference the chart object.
• p_chart_name – Name of the chart.
• p_chart_desc – Description of the chart.
• p_directory – Name of a DIRECTORY object that points to a location containing the swf file being uploaded.
• p_file_name – The actual name of the swf file to be uploaded.
Upload a Flash Chart BLOB into the FLASH_CHARTS table.
uploadJavascriptFile • p_script_code – Four character code used to
Upload a Javascript file into the FLASH_JAVASCRIPT
4

identify the JavaScript library.
• p_script_desc – Description of JavaScript library.
• p_directory – Name of a DIRECTORY object that points to a location containing the js file being uploaded.
• p_file_name – The actual name of the js file to be uploaded.
table.
js • p_script_code - Four character code used to identify the JavaScript library.
This is the JavaScript file streaming procedure. It returns the requested JavaScript library to the web browser or other HTTP client.
swf • p_chart_code - Chart type code. Four character code used to reference the chart object.
This is the Flash Chart object streaming procedure. It returns the actual swf or flash binary to the web browser or other HTTP client. This will be called from the <object/> tag.
streamDataSet • p_data_set – Oracle XMLType representing the XML data set for a particular chart type.
This procedure streams the XML data to the chart object. It called from within the <object/> tag, but can be called via URL.
addChart • p_chart_id – Id that will be associated with the <object/> tag generated by this procedure.
• p_chart_code – Chart type code. Four character code used to reference the chart object.
• p_chart_width – Width of chart in pixels.
• p_chart_height – Height of chart in pixels.
• p_data_xml – Text string (VARCHAR2) representing XML data set for chart. This is used to embed fixed XML in the <object/> tag. Do not use this parameter if you are already using the p_data_url parameter.
• p_data_url – URL pointing to data source for chart. Do not use this parameter if you are already using the p_data_xml parameter.
Generates an OBJECT tag for loading the chart and data set in a web page.
5

Package FunctionsThe FusionFlashCharts package provides 15 functions designed to manipulate and create the XML data sets for the flash charts. The following table names each function and gives a brief description of each:
Function Name Parameters Return Type
Purpose
concatTagSets Both parameters are of type XMLType.
• p_current_set: first or current XML data set.
• p_additional_set: second XML data set to be concatenated with the first set.
XMLType Concatenate two sets of XML data (XMLType) in one XML set (XMLType).
createSingleSeriesDataSet
• p_graph_attributes: FlashChartGraphAttrType object
• p_rowset: FlashChartRowSetType object.
XMLType Generate XML data set for Single-Series charts consisting of fully constructed <graph/> element with child <set/> elements.
createCategorySet • p_categories_attr: FlashMSCategoriesType object.
• p_category_set: FlashMSCategorySet
XMLType Generate XML data set consisting of a fully constructed <categories/> element with child <category/> elements.
createMSSetData • p_dataset_attr: FlashMSDataSetType object.
• p_rowset: FlashChartRowSetType object.
XMLType Generate XML <dataset/> element with child <set/> tags.
createMultiSeriesDataSet • p_graph_attributes: FlashChartGraphAttrType object.
• p_category_set: <categories/> element set generated using the createCategorySet function.
• p_ms_data_set: <dataset/
XMLType Generate XML dataset for Multi-Series charts consisting of <graph/> element with all related child elements:
6

> element set generated using the createMSSetData function.
• p_trendline_set: FlashTrendLineSet object.
<categories/>, <dataset/>, and <trendlines/>.
createCandleStickDataSet
• p_graph_attributes: FlashChartGraphAttrType object.
• p_category_set: <categories/> element set generated using the createCategorySet function.
• p_rowset: FlashChartRowSetType object.
• p_trendline_set: FlashTrendLineSet object.
XMLType Generate XML dataset for a CandleStick chart consisting of a <graph/> element with child elements: <categories/>, <set/>, and <trendlines/>.
createFunnelDataSet • p_chart_attributes: FlashChartAttrType.
• p_rowset: FlashChartRowSetType object.
XMLType Generate XML data set for a Funnel chart consisting of fully constructed <chart/> element with child <set/> elements.
pipelineGraphData p_graph_attr: FlashChartGraphAttrType
FlashChartGraphAttrSet PIPELINED
A pipelined function that allows the FlashChartGraphAttrType object to be queried like a table. This is NOT a function that would normally be used by a developer.
pipelineSetData p_rowset: FlashChartRowSetType FlashChartRowSetType PIPELINED
A pipelined function that allows the FlashChartRowSetType object to be queried like a table. This is NOT a function that would normally be used by a
7
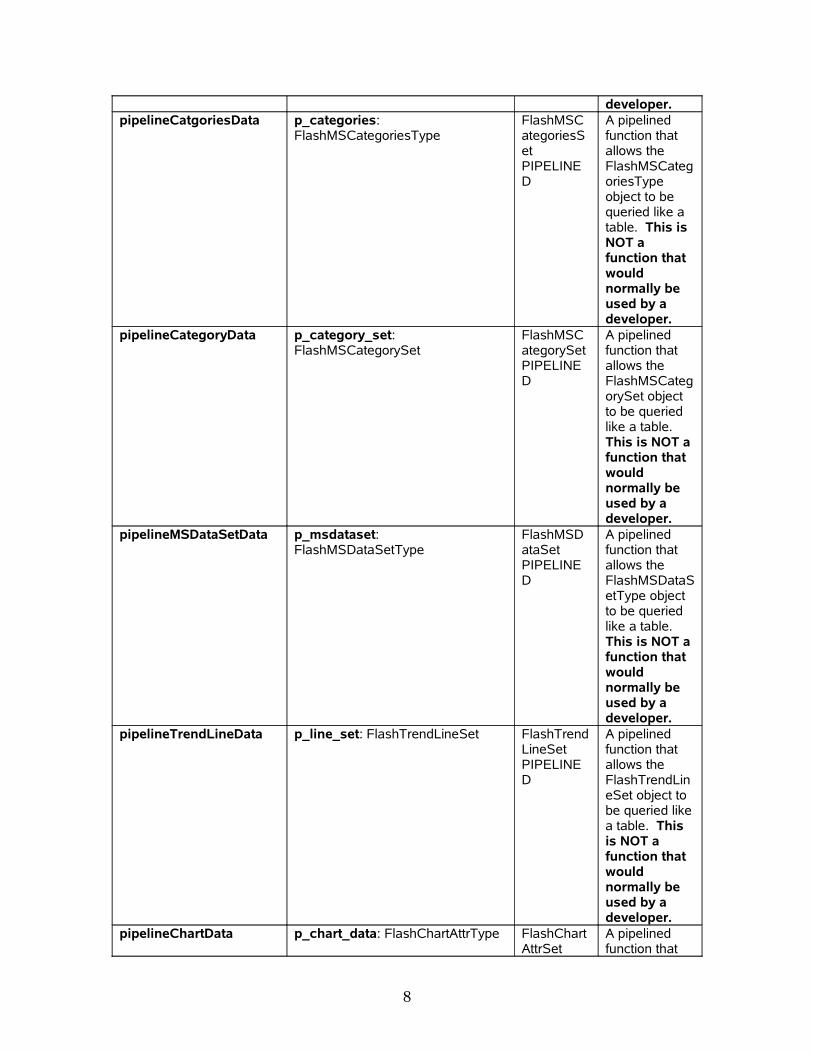
developer.pipelineCatgoriesData p_categories:
FlashMSCategoriesTypeFlashMSCategoriesSet PIPELINED
A pipelined function that allows the FlashMSCategoriesType object to be queried like a table. This is NOT a function that would normally be used by a developer.
pipelineCategoryData p_category_set: FlashMSCategorySet
FlashMSCategorySet PIPELINED
A pipelined function that allows the FlashMSCategorySet object to be queried like a table. This is NOT a function that would normally be used by a developer.
pipelineMSDataSetData p_msdataset: FlashMSDataSetType
FlashMSDataSet PIPELINED
A pipelined function that allows the FlashMSDataSetType object to be queried like a table. This is NOT a function that would normally be used by a developer.
pipelineTrendLineData p_line_set: FlashTrendLineSet FlashTrendLineSet PIPELINED
A pipelined function that allows the FlashTrendLineSet object to be queried like a table. This is NOT a function that would normally be used by a developer.
pipelineChartData p_chart_data: FlashChartAttrType FlashChartAttrSet
A pipelined function that
8

PIPELINED
allows the FlashChartAttrType object to be queried like a table. This is NOT a function that would normally be used by a developer.
generateRandomHexColor
VARCHAR2
Generates a random HEXADECIMAL color code.
Data Set Objects (User Defined Types) Overview In addition to the FusionFlashCharts PL/SQL package, the API utilizes 13 user defined types (or objects) that relate directly to XML elements that are used to construct the XML data sets for each chart type. As stated earlier in the document, Fusion Charts Free provides excellent and detailed documentation related to each of the XML data sets. Each user defined type matches an XML element and contains attributes that match the XML element attributes exactly. The following table describes each user defined type and lists it’s attributes:
Type Name Attributes DescriptionFlashChartSetType name VARCHAR2(60),
value VARCHAR2(12), color VARCHAR2(6), hoverText VARCHAR2(60), link VARCHAR2(200), alpha NUMBER(3), showName NUMBER(1), isSliced NUMBER(1), borderColor VARCHAR2(6), borderThickness NUMBER(3), borderAlpha NUMBER(3), open NUMBER(3), high NUMBER(3), low NUMBER(3), close NUMBER(3), xIndex NUMBER(3)
Relates to the <set/> data set element.
FlashChartRowSetType Collection (PL/SQL Table) of FlashChartSetType.
FlashChartGraphAttrType bgColor VARCHAR2(6),bgAlpha NUMBER(3),bgSWF VARCHAR2(60),canvasBgColor VARCHAR2(6),canvasBgAlpha NUMBER(3),canvasBorderColor VARCHAR2(6),
Relates to the <graph/> data set element
9

canvasBorderThickness NUMBER(3),caption VARCHAR2(100),subCaption VARCHAR2(100),xAxisName VARCHAR2(50),yAxisName VARCHAR2(50),yAxisMinValue VARCHAR2(12),yAxisMaxValue VARCHAR2(12),shownames NUMBER(1),showValues NUMBER(1),showLimits NUMBER(1),showSecondaryLimits NUMBER(1),rotateNames NUMBER(1),animation NUMBER(1),showLegend NUMBER(1),showColumnShadow NUMBER(1),baseFont VARCHAR2(60),baseFontSize NUMBER(3),baseFontColor VARCHAR2(6),outCnvBaseFont VARCHAR2(60),outCnvBaseFontSze NUMBER(3),outCnvBaseFontColor VARCHAR2(6),numberPrefix VARCHAR2(10),numberSuffix VARCHAR2(10),formatNumber NUMBER(1),formatNumberScale NUMBER(1),decimalSeparator VARCHAR2(1),thousandSeparator VARCHAR2(1),decimalPrecision NUMBER(3),divLineDecimalPrecision NUMBER(3),limitsDecimalPrecision NUMBER(3),zeroPlaneThickness NUMBER(3),zeroPlaneColor VARCHAR2(6),zeroPlaneAlpha NUMBER(3),numdivlines NUMBER(3),divlinecolor VARCHAR2(6),divLineThickness NUMBER(3),divLineAlpha NUMBER(3),showDivLineValue NUMBER(1),showAlternateHGridColor NUMBER(1),alternateHGridColor VARCHAR2(6),alternateHGridAlpha NUMBER(3),numVDivLines NUMBER(3),VDivlinecolor VARCHAR2(6),VDivLineThickness NUMBER(3),VDivLineAlpha NUMBER(3),showAlternateVGridColor NUMBER(1),alternateVGridColor VARCHAR2(6),alternateVGridAlpha NUMBER(3),showhovercap NUMBER(1),hoverCapBgColor VARCHAR2(6),hoverCapBorderColor VARCHAR2(6),hoverCapSepChar VARCHAR2(1),chartLeftMargin NUMBER(4),chartRightMargin NUMBER(4),
10

chartTopMargin NUMBER(4),chartBottomMargin NUMBER(4),pieRadius NUMBER(4),pieSliceDepth NUMBER(4),pieYScale NUMBER(4),pieBorderThickness NUMBER(3),pieBorderAlpha NUMBER(3),pieFillAlpha NUMBER(3),lineColor VARCHAR2(6),lineThickness NUMBER(3),lineAlpha NUMBER(3),showShadow NUMBER(1),shadowColor VARCHAR2(6),shadowThickness NUMBER(3),shadowAlpha NUMBER(3),shadowXShift NUMBER(3),shadowYShift NUMBER(3),showAnchors NUMBER(1),anchorSides NUMBER(4),anchorRadius NUMBER(3),anchorBorderColor VARCHAR2(6),anchorBorderThickness NUMBER(3),anchorBgColor VARCHAR2(6),anchorBgAlpha NUMBER(3),anchorAlpha NUMBER(3),showAreaBorder NUMBER(1),areaBorderThickness NUMBER(3),areaBorderColor VARCHAR2(6),areaBgColor VARCHAR2(6),areaAlpha NUMBER(3),nameTBDistance NUMBER(3),PYAxisName VARCHAR2(30),SYAxisName VARCHAR2(30),PYAxisMaxValue NUMBER(4),PYAxisMinValue NUMBER(4),SYAxisMaxValue NUMBER(4),SYAxisMinValue NUMBER(4),showAsBars NUMBER(1),candleWidth NUMBER(3),bearBorderColor VARCHAR2(6),bearFillColor VARCHAR2(6),bullBorderColor VARCHAR2(6),bullFillColor VARCHAR2(6)
FlashChartGraphAttrSet Collection (PL/SQL Table) of FlashChartGraphAttrType. This udt is used internally by the API to enable a pipelined function.
FlashMSCategoriesType font VARCHAR2(60),fontSize NUMBER(3),fontColor VARCHAR2(6),verticalLineColor VARCHAR2(6),verticalLineThickness NUMBER(3),verticalLineAlpha NUMBER(3)
Relates to the <categories/> data set element.
11

FlashMSCategoriesSet Collection (PL/SQL Table) of FlashMSCategoriesType
FlashMSCategoryType name VARCHAR2(60),hoverText VARCHAR2(60),showName NUMBER(1)
Relates to the <categoriy/> data set element.
FlashMSCategorySet Collection (PL/SQL Table) of FlashMSCategoryType
FlashMSDataSetType seriesName VARCHAR2(60),color VARCHAR2(6),showValues NUMBER(1),alpha NUMBER(3),parentYAxis VARCHAR2(1),numberPrefix VARCHAR2(10),numberSuffix VARCHAR2(10)
Relates to the <dataset/> data set element.
FlashMSDataSet Collection (PL/SQL Table) of FlashMSDataSetType
FlashTrendLineType startValue NUMBER(4),endValue NUMBER(4),color VARCHAR2(6),displayValue VARCHAR2(30),thickness NUMBER(3),isTrendZone NUMBER(1),showOnTop NUMBER(1),alpha NUMBER(3)
Relates to the <line/> child element of the <trendLine/> data set element.
FlashTrendLineSet Collection (PL/SQL Table) of FlashTrendLineType
FlashChartAttrType bgColor VARCHAR2(6),bgAlpha NUMBER(3),bgSWF VARCHAR2(60),shownames NUMBER(1),showValues NUMBER(1),animation NUMBER(1),fillAlpha NUMBER(3),slicingDistance NUMBER(3),funnelBaseWidth NUMBER(3),funnelBaseHeight NUMBER(3),numberPrefix VARCHAR2(10),numberSuffix VARCHAR2(10),formatNumber NUMBER(1),formatNumberScale NUMBER(1),decimalSeparator VARCHAR2(1),thousandSeparator VARCHAR2(1),baseFont VARCHAR2(60),baseFontSize NUMBER(3),baseFontColor VARCHAR2(6),showhovercap NUMBER(1),hoverCapBgColor VARCHAR2(6),hoverCapBorderColor VARCHAR2(6),hoverCapSepChar VARCHAR2(1),
Relates to the <chart/> data set element.
12

showBorder NUMBER(1),borderColor VARCHAR2(6),borderThickness NUMBER(3),borderAlpha NUMBER(3),chartLeftMargin NUMBER(4),chartRightMargin NUMBER(4),chartTopMargin NUMBER(4),chartBottomMargin NUMBER(4)
FlashChartAttrSet Collection (PL/SQL Table) of FlashChartAttrType
Creating XML Data Sets and Charts with the API This section focuses on code examples that demonstrate how to create data sets and charts using the API. Important note: All data set procedures must include a parameter named “curr” (“FCTime” in Fusion Charts v3). The flash charts created by Fusion Charts use this parameter to prevent caching. If it is not included as a parameter you will see an error generated when the chart tries to access the data set url.
Creating a Simple Data Set Using Static Data In this example, we create a simple packaged procedure that generates and streams an XML data set based on static data for a single series chart. It is designed to be called via a URL and can be utilized by any single series chart. Here is the code:
CREATE OR REPLACE PACKAGE singleSeriesChartDataAS
/* NOTE you must include curr as a parameter option. */ PROCEDURE xml(curr VARCHAR2:= NULL);
END;/sho err;
CREATE OR REPLACE PACKAGE BODY singleSeriesChartData AS
PROCEDURE XML(curr VARCHAR2:= NULL)IS
/* Create data set object for <graph/> tag */ v_graph_attr FlashChartGraphAttrType := FlashChartGraphAttrType();
/* Create data set object for </set> tag */ v_data_row FlashChartSetType := FlashChartSetType();
13

/* Create data set collection to hold collection of data sets. */ v_data_set FlashChartRowSetType := FlashChartRowSetType();
/* Create an XMLType to hold the fully constructed data set */ v_ChartData XMLType := NULL;
BEGIN
/* Adding attributes that will be associated with the <graph/> tag */ v_graph_attr.caption := 'Single Series Charts'; v_graph_attr.xAxisName := 'Month'; v_graph_attr.yAxisName := 'Units'; v_graph_attr.showNames := 1; v_graph_attr.decimalPrecision := 0; v_graph_attr.rotateNames := 1;
/* Populate a data set object with data values. */ v_data_row.name := 'Jan'; v_data_row.value := '462'; v_data_row.color := FusionFlashCharts.generateRandomHexColor;
/* Extend the data set collection and add the data set object we just populated. */ v_data_set.EXTEND; v_data_set(v_data_set.count) := v_data_row;
/* Call the FlashChartSetType constructor to reset the object and repeat the process. */
v_data_row := FlashChartSetType(); v_data_row.name := 'Feb'; v_data_row.value := '857'; v_data_row.color := FusionFlashCharts.generateRandomHexColor; v_data_set.EXTEND; v_data_set(v_data_set.count) := v_data_row;
v_data_row := FlashChartSetType(); v_data_row.name := 'Mar'; v_data_row.value := '671'; v_data_row.color := FusionFlashCharts.generateRandomHexColor; v_data_set.EXTEND; v_data_set(v_data_set.count) := v_data_row;
v_data_row := FlashChartSetType(); v_data_row.name := 'Apr'; v_data_row.value := '494'; v_data_row.color := FusionFlashCharts.generateRandomHexColor; v_data_set.EXTEND; v_data_set(v_data_set.count) := v_data_row;
v_data_row := FlashChartSetType(); v_data_row.name := 'May'; v_data_row.value := '761';
14

v_data_row.color := FusionFlashCharts.generateRandomHexColor; v_data_set.EXTEND; v_data_set(v_data_set.count) := v_data_row;
v_data_row := FlashChartSetType(); v_data_row.name := 'Jun'; v_data_row.value := '960'; v_data_row.color := FusionFlashCharts.generateRandomHexColor; v_data_set.EXTEND; v_data_set(v_data_set.count) := v_data_row;
v_data_row := FlashChartSetType(); v_data_row.name := 'Jul'; v_data_row.value := '629'; v_data_row.color := FusionFlashCharts.generateRandomHexColor; v_data_set.EXTEND; v_data_set(v_data_set.count) := v_data_row;
/* Pass the FlashChartGraphAttrType object and the collection of FlashChartSetType objects to the createSingleSeriesDataSet function. This will construct and return the data set required by the flash chart object. */
v_ChartData := FusionFlashCharts.createSingleSeriesDataSet ( v_graph_attr, v_data_set );
/* Stream the XML back to the requesting client. */ FusionFlashCharts.streamDataSet(v_chartData);
END;
END;/
The procedure above produces the following XML:
<graph caption="Single Series Charts" xAxisName="Month" yAxisName="Units" shownames="1" rotateNames="1" decimalPrecision="0"><set name="Jan" value="462" color="333333"/><set name="Feb" value="857" color="6666FF"/><set name="Mar" value="671" color="990066"/><set name="Apr" value="494" color="9933CC"/><set name="May" value="761" color="CC0066"/><set name="Jun" value="960" color="CC9933"/><set name="Jul" value="629" color="00FFCC"/></graph>
15

Add a Chart to a Web Application using the API In this example, we will create a simple web application (page) containing a flash chart using the PL/SQL API. The data source for the chart(s) will be the packaged procedure defined in the previous example. Here is the code:
/** This demo procedure creates a page with a drop down* list that lets the user switch between single series* chart types.*/
CREATE OR REPLACE PROCEDURE singleSeriesChartDemosASBEGIN
htp.htmlOpen; htp.bodyOpen;
/* Javascript function that alters the chart object tag and refreshes the chart/graph.
Notice the use of the swf streaming procedure FusionFlashCharts.swf in the JavaScript function below.
*/ htp.p('<script>');
htp.p('function changeGraphType(p_graph_id,p_type){
v_value_url = "FusionFlashCharts.swf?p_chart_code="+p_type;
v_chart_object = document.getElementById(p_graph_id);
v_movie_object = document.getElementById("movie_"+p_graph_id); v_embed_object = document.getElementById("embed_"+p_graph_id);
v_movie_object.setAttribute("value",v_value_url); v_embed_object.setAttribute("src",v_value_url);
}');
htp.p('</script>');
htp.p('<div id="switchCharts">');
htp.p('<form id="selectForm">');
htp.p('<select onchange="javascript:changeGraphType(''DemoChart'',this.value);">');
/* Create a selection list containing all types of Single Series Flash charts. */
htp.p('<option value="'||FusionFlashCharts.Area2D||'">2D Area Chart</option>');
16

htp.p('<option value="'||FusionFlashCharts.Bar2D||'">2D Bar Chart</option>'); htp.p('<option value="'||FusionFlashCharts.Column2D||'">2D Column Chart</option>'); htp.p('<option value="'||FusionFlashCharts.Column3D||'">3D Column Chart</option>'); htp.p('<option value="'||FusionFlashCharts.Doughnut2D||'">2D Doughnut Chart</option>'); htp.p('<option value="'||FusionFlashCharts.Pie2D||'">2D Pie Chart</option>'); htp.p('<option value="'||FusionFlashCharts.Pie3D||'">3D Pie Chart</option>'); htp.p('<option value="'||FusionFlashCharts.Line||'">Line Chart</option>'); htp.p('</select>');
htp.p('</form>');
htp.p('</div>');
htp.p('<div id="chartdiv">');
/* Add the <object/> tag to the page that renders the flash object. Notice the reference to singleSeriesChartData.xml! This is the Packaged procedure created in the previous example. */
FusionFlashCharts.addChart(p_chart_id =>'DemoChart', p_chart_type => FusionFlashCharts.Area2D, p_chart_width =>'800', p_chart_height =>'600', p_data_url =>'singleSeriesChartData.xml');
htp.p('</div>'); htp.bodyClose; htp.htmlClose;
END;/
The call to FusionFlashCharts.addChart produces the following HTML:
<object classid="clsid:D27CDB6E-AE6D-11cf-96B8-444553540000" codebase=http://download.macromedia.com/pub/shockwave/cabs/flash/swflash.cab#version=6,0,0,0" width="800" height="600" id="DemoChart" ><param id="movie_DemoChart" name="movie" value="FusionFlashCharts.swf?p_chart_code=AR2D" /><param id="FlashVars_DemoChart" name="FlashVars" value="&dataURL=singleSeriesChartData.xml&chartWidth=800&chartHeight=600"><param id="quality_DemoChart" name="quality" value="high" /><embed id="embed_DemoChart" src="FusionFlashCharts.swf?p_chart_code=AR2D" flashVars="&dataURL=singleSeriesChartData.xml&chartWidth=800&chartHeight=600" quality="high" width="800" height="600" name="DemoChart" type="application/x-shockwave-flash" pluginspage="http://www.macromedia.com/go/getflashplayer" /></object>
17

The procedure above produces the following results when executed via a URL through a PL/SQL DAD (Data Access Descriptor ):
Example URL (/jason/ is the PL/SQL DAD): http://127.0.0.1:8080/jason/singleSeriesChartDemos
18

19

20

21

Creating a Single Series Data Set and Chart based on a SQL Query The previous examples demonstrated how to create a chart with a static data set. The following example demonstrates how to generate a chart with data based on a SQL query. The following example uses the Oracle HR demo schema as its source of data.
The following code example creates a data set representing the average salary per employee job title:
PROCEDURE aesDataSetIS
CURSOR crsrAESData IS SELECT (select job_title from hr.jobs where job_id = emp.job_id) name, (sum(salary)/count(job_id)) value FROM hr.employees emp GROUP BY JOB_ID ORDER BY 1;
v_graph_attr FlashChartGraphAttrType := FlashChartGraphAttrType();
v_data_row FlashChartSetType := FlashChartSetType();
v_data_set FlashChartRowSetType := FlashChartRowSetType();
v_ChartData XMLType := NULL;
BEGIN
v_graph_attr.caption := 'Average Salary per Job Title'; v_graph_attr.xAxisName := 'Job Title'; v_graph_attr.yAxisName := 'Salary'; v_graph_attr.baseFontSize := '12'; v_graph_attr.animation := FusionFlashCharts.NUMERIC_TRUE; v_graph_attr.showNames := FusionFlashCharts.NUMERIC_TRUE; v_graph_attr.decimalPrecision := FusionFlashCharts.NUMERIC_FALSE; v_graph_attr.rotateNames := FusionFlashCharts.NUMERIC_TRUE;
/* Use a Cursor For-Loop to generate each data set object and place it in data set collection object. */
FOR data_rec IN crsrAESData LOOP
v_data_row := FlashChartSetType(); v_data_row.name := data_rec.name; v_data_row.value := data_rec.value; v_data_row.color := FusionFlashCharts.generateRandomHexColor; v_data_set.EXTEND;
22
v_data_set(v_data_set.count) := v_data_row;
END LOOP;
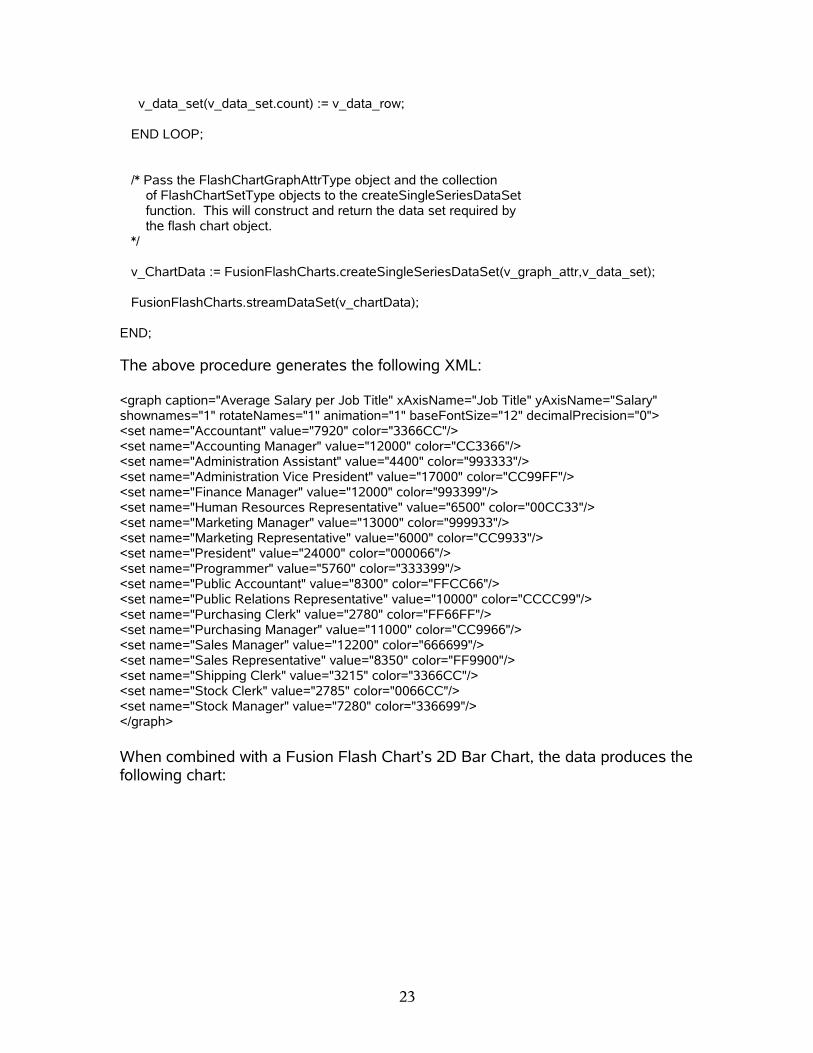
/* Pass the FlashChartGraphAttrType object and the collection of FlashChartSetType objects to the createSingleSeriesDataSet function. This will construct and return the data set required by the flash chart object. */
v_ChartData := FusionFlashCharts.createSingleSeriesDataSet(v_graph_attr,v_data_set);
FusionFlashCharts.streamDataSet(v_chartData);
END;
The above procedure generates the following XML:
<graph caption="Average Salary per Job Title" xAxisName="Job Title" yAxisName="Salary" shownames="1" rotateNames="1" animation="1" baseFontSize="12" decimalPrecision="0"><set name="Accountant" value="7920" color="3366CC"/><set name="Accounting Manager" value="12000" color="CC3366"/><set name="Administration Assistant" value="4400" color="993333"/><set name="Administration Vice President" value="17000" color="CC99FF"/><set name="Finance Manager" value="12000" color="993399"/><set name="Human Resources Representative" value="6500" color="00CC33"/><set name="Marketing Manager" value="13000" color="999933"/><set name="Marketing Representative" value="6000" color="CC9933"/><set name="President" value="24000" color="000066"/><set name="Programmer" value="5760" color="333399"/><set name="Public Accountant" value="8300" color="FFCC66"/><set name="Public Relations Representative" value="10000" color="CCCC99"/><set name="Purchasing Clerk" value="2780" color="FF66FF"/><set name="Purchasing Manager" value="11000" color="CC9966"/><set name="Sales Manager" value="12200" color="666699"/><set name="Sales Representative" value="8350" color="FF9900"/><set name="Shipping Clerk" value="3215" color="3366CC"/><set name="Stock Clerk" value="2785" color="0066CC"/><set name="Stock Manager" value="7280" color="336699"/></graph>
When combined with a Fusion Flash Chart’s 2D Bar Chart, the data produces the following chart:
23

Creating a Multi-Series Data Set and Chart based on a SQL Query The previous examples have demonstrated how to create data sets based on a single series of data. The following example demonstrates how to create a data set for a mutl-series (multiple data categories) type chart. The data for this example comes from a table created with S&P 500 stock market data (which is freely available on the internet).
The following code example creates multi-series data set representing the closing prices for seven technology companies over a two month period. Here is the code:
/*
Line Chart consisting of the Closing values for ORCL, IBM, MSFT, HPQ, SUN, INTC, DELL, AMD, and AAPL Over the three month period April 2008 thru May 2008.
*/PROCEDURE oimDataSet IS
CURSOR crsrCategories IS SELECT distinct(stock_date) stock_date FROM stock_data_mv WHERE stock_date between '01-APR-08' AND '31-MAY-08'
24

ORDER BY 1 ASC;
CURSOR crsrStockData IS SELECT ticker name, close value, stock_date FROM stock_data_mv WHERE ticker IN ('ORCL','IBM','MSFT','HPQ','SUN','INTC','DELL','AMD','AAPL') AND stock_date between '01-APR-08' AND '31-MAY-08' ORDER BY 1,3;
v_graph_attr FlashChartGraphAttrType := FlashChartGraphAttrType(); v_categorie_attr FlashMSCategoriesType := FlashMSCategoriesType();
v_category_row FlashMSCategoryType := FlashMSCategoryType(); v_category_set FlashMSCategorySet := FlashMSCategorySet();
v_data_row FlashChartSetType := FlashChartSetType();
TYPE comboMSDataSet IS RECORD( v_dataset FlashMSDataSetType, v_datarow_set FlashChartRowSetType );
TYPe dataSetArray IS TABLE OF comboMSDataSet; v_dataset_array dataSetArray := dataSetArray(); v_chartData XMLType := NULL;
v_msSetData XMLType := NULL;
v_set_name VARCHAR2(100) := NULL;
BEGIN
-- Graph Tag Attributes v_graph_attr.caption := 'Closing Prices between April 2008 and May 2008'; v_graph_attr.xAxisName := 'Closing Date'; v_graph_attr.yAxisName := 'Closing Price'; v_graph_attr.baseFontSize := '8'; v_graph_attr.animation := FusionFlashCharts.NUMERIC_TRUE; v_graph_attr.showNames := FusionFlashCharts.NUMERIC_TRUE; v_graph_attr.decimalPrecision := 2; v_graph_attr.rotateNames := FusionFlashCharts.NUMERIC_TRUE;
-- Categories Tag Attributes
FOR cat_rec IN crsrCategories LOOP
25

v_category_row := FlashMSCategoryType(); v_category_row.name := cat_rec.stock_date; v_category_row.hoverText := cat_rec.stock_date; v_category_set.EXTEND; v_category_set(v_category_set.count) := v_category_row;
END LOOP;
FOR data_rec IN crsrStockData LOOP
IF v_set_name IS NULL OR (v_set_name != data_rec.name) THEN
v_set_name := data_rec.name;
v_dataset_array.EXTEND;
v_dataset_array(v_dataset_array.count).v_dataset := FlashMSDataSetType(); v_dataset_array(v_dataset_array.count).v_datarow_set := FlashChartRowSetType();
v_dataset_array(v_dataset_array.count).v_dataset.seriesName := data_rec.name; v_dataset_array(v_dataset_array.count).v_dataset.color := FusionFlashCharts.generateRandomHexColor; END IF; v_data_row := FlashChartSetType(); v_data_row.value := data_rec.value; v_dataset_array(v_dataset_array.count).v_datarow_set.EXTEND; v_dataset_array(v_dataset_array.count).v_datarow_set(v_dataset_array(v_dataset_array.count).v_datarow_set.count) := v_data_row;
END LOOP;
/* The data set for a multi-series chart is slightly more complicated than for a single series chart */
FOR rec_cnt IN 1 .. v_dataset_array.count LOOP
v_msSetData := FusionFlashCharts.concatTagSets( FusionFlashCharts.createMSSetData(v_dataset_array(rec_cnt).v_dataset,v_dataset_array(rec_cnt).v_datarow_set),v_msSetData);
END LOOP; v_chartData := FusionFlashCharts.createMultiSeriesDataSet(v_graph_attr, FusionFlashCharts.createCategorySet(v_categorie_attr,v_category_set), v_msSetData );
FusionFlashCharts.streamDataSet(v_chartData);
26

END;
The above procedure generates the following XML:
<graph caption="Closing Prices between April 2008 and May 2008" xAxisName="Closing Date" yAxisName="Closing Price" shownames="1" rotateNames="1" animation="1" baseFontSize="8" decimalPrecision="2"><categories><category name="01-APR-08" hoverText="01-APR-08"/><category name="02-APR-08" hoverText="02-APR-08"/><category name="03-APR-08" hoverText="03-APR-08"/><category name="04-APR-08" hoverText="04-APR-08"/><category name="07-APR-08" hoverText="07-APR-08"/><category name="08-APR-08" hoverText="08-APR-08"/><category name="09-APR-08" hoverText="09-APR-08"/><category name="10-APR-08" hoverText="10-APR-08"/><category name="11-APR-08" hoverText="11-APR-08"/><category name="14-APR-08" hoverText="14-APR-08"/><category name="15-APR-08" hoverText="15-APR-08"/><category name="16-APR-08" hoverText="16-APR-08"/><category name="17-APR-08" hoverText="17-APR-08"/><category name="18-APR-08" hoverText="18-APR-08"/><category name="21-APR-08" hoverText="21-APR-08"/><category name="22-APR-08" hoverText="22-APR-08"/><category name="23-APR-08" hoverText="23-APR-08"/><category name="24-APR-08" hoverText="24-APR-08"/><category name="25-APR-08" hoverText="25-APR-08"/><category name="28-APR-08" hoverText="28-APR-08"/><category name="29-APR-08" hoverText="29-APR-08"/><category name="30-APR-08" hoverText="30-APR-08"/><category name="01-MAY-08" hoverText="01-MAY-08"/><category name="02-MAY-08" hoverText="02-MAY-08"/><category name="05-MAY-08" hoverText="05-MAY-08"/><category name="06-MAY-08" hoverText="06-MAY-08"/><category name="07-MAY-08" hoverText="07-MAY-08"/><category name="08-MAY-08" hoverText="08-MAY-08"/><category name="09-MAY-08" hoverText="09-MAY-08"/><category name="12-MAY-08" hoverText="12-MAY-08"/><category name="13-MAY-08" hoverText="13-MAY-08"/><category name="14-MAY-08" hoverText="14-MAY-08"/><category name="15-MAY-08" hoverText="15-MAY-08"/><category name="16-MAY-08" hoverText="16-MAY-08"/><category name="19-MAY-08" hoverText="19-MAY-08"/><category name="20-MAY-08" hoverText="20-MAY-08"/><category name="21-MAY-08" hoverText="21-MAY-08"/><category name="22-MAY-08" hoverText="22-MAY-08"/><category name="23-MAY-08" hoverText="23-MAY-08"/>
27

<category name="27-MAY-08" hoverText="27-MAY-08"/><category name="28-MAY-08" hoverText="28-MAY-08"/><category name="29-MAY-08" hoverText="29-MAY-08"/><category name="30-MAY-08" hoverText="30-MAY-08"/></categories><dataset seriesName="SUN" color="CC9999"><set value="54.76"/><set value="55.23"/><set value="53.5"/><set value="52.26"/><set value="52.8"/><set value="52.34"/><set value="53.62"/><set value="52.9"/><set value="51.45"/><set value="52.36"/><set value="52.05"/><set value="54.94"/><set value="55.75"/><set value="55.65"/><set value="54.68"/><set value="53.2"/><set value="52.29"/><set value="51.06"/><set value="50.87"/><set value="49.06"/><set value="47.85"/><set value="46.41"/><set value="47.79"/><set value="46.29"/><set value="46.9"/><set value="44.97"/><set value="44.63"/><set value="44.02"/><set value="43.7"/><set value="45.87"/><set value="44.69"/><set value="45.19"/><set value="45.19"/><set value="44.53"/><set value="45.22"/><set value="45.93"/><set value="44.73"/><set value="45.83"/><set value="44.65"/><set value="44.01"/><set value="45.55"/><set value="44.12"/><set value="44.47"/></dataset><dataset seriesName="ORCL" color="33CCFF"><set value="20.41"/><set value="20.49"/><set value="20.68"/><set value="20.35"/><set value="20.23"/>
28

<set value="19.92"/><set value="20.22"/><set value="20.45"/><set value="19.84"/><set value="19.86"/><set value="20.18"/><set value="20.77"/><set value="21.2"/><set value="21.8"/><set value="21.76"/><set value="21.78"/><set value="21.91"/><set value="22.01"/><set value="21.59"/><set value="21.51"/><set value="21.76"/><set value="20.85"/><set value="21.82"/><set value="21.51"/><set value="21.55"/><set value="21.5"/><set value="20.99"/><set value="21.1"/><set value="21"/><set value="21.51"/><set value="21.67"/><set value="21.78"/><set value="21.87"/><set value="21.68"/><set value="22.43"/><set value="22.16"/><set value="22.01"/><set value="22.31"/><set value="21.98"/><set value="22.66"/><set value="22.79"/><set value="22.79"/><set value="22.84"/></dataset><dataset seriesName="MSFT" color="336633"><set value="29.5"/><set value="29.16"/><set value="29"/><set value="29.16"/><set value="29.16"/><set value="28.75"/><set value="28.89"/><set value="29.11"/><set value="28.28"/><set value="28.06"/><set value="28.25"/><set value="28.95"/><set value="29.22"/><set value="30"/><set value="30.42"/><set value="30.25"/>
29

<set value="31.45"/><set value="31.8"/><set value="29.83"/><set value="28.99"/><set value="28.64"/><set value="28.52"/><set value="29.4"/><set value="29.24"/><set value="29.08"/><set value="29.7"/><set value="29.21"/><set value="29.27"/><set value="29.39"/><set value="29.99"/><set value="29.78"/><set value="29.93"/><set value="30.45"/><set value="29.99"/><set value="29.46"/><set value="28.76"/><set value="28.25"/><set value="28.47"/><set value="28.05"/><set value="28.44"/><set value="28.18"/><set value="28.31"/><set value="28.32"/></dataset><dataset seriesName="INTC" color="99CCCC"><set value="21.97"/><set value="21.85"/><set value="21.93"/><set value="21.87"/><set value="21.75"/><set value="21.08"/><set value="21.42"/><set value="22.08"/><set value="21.24"/><set value="20.69"/><set value="20.91"/><set value="22.13"/><set value="22.11"/><set value="22.55"/><set value="22.46"/><set value="21.99"/><set value="22.56"/><set value="22.69"/><set value="22.56"/><set value="22.71"/><set value="22.62"/><set value="22.26"/><set value="23.29"/><set value="23.58"/><set value="23.25"/><set value="23.58"/><set value="23.17"/>
30

<set value="23.4"/><set value="23.37"/><set value="23.64"/><set value="23.76"/><set value="23.84"/><set value="24.97"/><set value="25"/><set value="24.88"/><set value="24.09"/><set value="23.66"/><set value="23.88"/><set value="23.41"/><set value="23.6"/><set value="23.47"/><set value="23.14"/><set value="23.18"/></dataset><dataset seriesName="IBM" color="CC6699"><set value="116.49"/><set value="114.81"/><set value="116.02"/><set value="115.76"/><set value="116.31"/><set value="116.27"/><set value="116.77"/><set value="118.78"/><set value="116"/><set value="117.28"/><set value="117.17"/><set value="120.47"/><set value="123.08"/><set value="124.4"/><set value="124.35"/><set value="123.67"/><set value="123.6"/><set value="124.19"/><set value="123.08"/><set value="121.69"/><set value="122.85"/><set value="120.7"/><set value="123.61"/><set value="123.18"/><set value="122.03"/><set value="122.82"/><set value="124.14"/><set value="124.92"/><set value="124.06"/><set value="125.24"/><set value="126.58"/><set value="127.52"/><set value="128.46"/><set value="127.82"/><set value="126.49"/><set value="125.18"/><set value="123.62"/><set value="124.7"/>
31

<set value="124.2"/><set value="127.32"/><set value="129.54"/><set value="129.71"/><set value="129.43"/></dataset><dataset seriesName="HPQ" color="99FFCC"><set value="47.59"/><set value="47.23"/><set value="46.96"/><set value="46.4"/><set value="45.92"/><set value="46.07"/><set value="46.09"/><set value="46.57"/><set value="45.47"/><set value="45.82"/><set value="45.82"/><set value="47.1"/><set value="47.31"/><set value="48.18"/><set value="48.45"/><set value="48.17"/><set value="48.02"/><set value="48.35"/><set value="47.45"/><set value="47.59"/><set value="47.84"/><set value="46.35"/><set value="48.03"/><set value="48.36"/><set value="48.28"/><set value="48.64"/><set value="48.65"/><set value="49.06"/><set value="49.13"/><set value="46.83"/><set value="44.27"/><set value="45.64"/><set value="46.73"/><set value="47.29"/><set value="46.71"/><set value="46.46"/><set value="44.8"/><set value="44.9"/><set value="44.96"/><set value="45.7"/><set value="46.52"/><set value="46.91"/><set value="47.06"/></dataset><dataset seriesName="DELL" color="33FFCC"><set value="20.33"/><set value="19.95"/><set value="20.12"/><set value="19.53"/>
32

<set value="19.23"/><set value="19"/><set value="18.69"/><set value="18.77"/><set value="18.5"/><set value="18.24"/><set value="18.28"/><set value="18.72"/><set value="19.05"/><set value="19.47"/><set value="19.56"/><set value="19.05"/><set value="19.05"/><set value="19.14"/><set value="19.11"/><set value="18.87"/><set value="18.97"/><set value="18.63"/><set value="19.08"/><set value="19.32"/><set value="19.1"/><set value="19.19"/><set value="18.9"/><set value="18.84"/><set value="19.03"/><set value="19.37"/><set value="20"/><set value="20.06"/><set value="20.63"/><set value="21.31"/><set value="21.2"/><set value="20.57"/><set value="20.01"/><set value="20.89"/><set value="21.19"/><set value="21.49"/><set value="21.69"/><set value="21.81"/><set value="23.06"/></dataset><dataset seriesName="AMD" color="663366"><set value="6.07"/><set value="6.19"/><set value="6.26"/><set value="6.23"/><set value="6.34"/><set value="6.03"/><set value="6.26"/><set value="6.27"/><set value="6.01"/><set value="5.86"/><set value="5.78"/><set value="6.07"/><set value="6.19"/><set value="6.11"/><set value="6.14"/>
33

<set value="5.96"/><set value="5.92"/><set value="6.03"/><set value="6.06"/><set value="6"/><set value="6.02"/><set value="5.96"/><set value="6.22"/><set value="6.16"/><set value="6.53"/><set value="7.12"/><set value="6.91"/><set value="6.93"/><set value="6.94"/><set value="7.16"/><set value="7.19"/><set value="7.16"/><set value="7.41"/><set value="7.26"/><set value="7.1"/><set value="7.12"/><set value="7.08"/><set value="7.07"/><set value="6.88"/><set value="6.92"/><set value="6.82"/><set value="6.77"/><set value="6.88"/></dataset><dataset seriesName="AAPL" color="FF9999"><set value="149.53"/><set value="147.49"/><set value="151.61"/><set value="153.08"/><set value="155.89"/><set value="152.84"/><set value="151.44"/><set value="154.55"/><set value="147.14"/><set value="147.78"/><set value="148.38"/><set value="153.7"/><set value="154.49"/><set value="161.04"/><set value="168.16"/><set value="160.2"/><set value="162.89"/><set value="168.94"/><set value="169.73"/><set value="172.24"/><set value="175.05"/><set value="173.95"/><set value="180"/><set value="180.94"/><set value="184.73"/><set value="186.66"/>
34

<set value="182.59"/><set value="185.06"/><set value="183.45"/><set value="188.16"/><set value="189.96"/><set value="186.26"/><set value="189.73"/><set value="187.62"/><set value="183.6"/><set value="185.9"/><set value="178.19"/><set value="177.05"/><set value="181.17"/><set value="186.43"/><set value="187.01"/><set value="186.69"/><set value="188.75"/></dataset></graph>
When combined with a Fusion Flash Chart’s Multi-Series Line Chart, the data produces the following chart:
35

Installing the API Prior to installing the Fusion Flash Charts PL/SQL API, you will need to download the file FusionChartsPLSQL.zip from Jason Bennett’s Developer Corner (http://radio.weblogs.com/0137094/). All of the components for the API, once installed, will reside in an Oracle user schema. Although the API can be installed into any Oracle schema, it is recommended that it be install it in it’s own schema for ease of maintenance and development.
Step 1. Unzip the File … After downloading FusionChartsPLSQL.zip, unzip it in a location that is accessible to the Oracle instance in which the API will be installed.
The zip file contains the following files and directories:
Directory File DescriptionFusionChartsPLSQL createFlashChartUser.sql Creates flashcharts
schema to hold API components.
FusionChartsPLSQL install.sql Installs all of the API components in the API host schema.
FusionChartsPLSQL flashchartSchemaGrants.sql Creates synonyms and grants for API components in the API host schema.
FusionChartsPLSQL ChartTable.sql Creates the FLASH_CHARTS and FLASH_JAVASCRIPT tables.
FusionChartsPLSQL LoadCharts.sql Loads the Fusion Charts Free flash files (.swf files) into the FLASH_CHARTS table. The FusionFlashCharts PL/SQL package must be installed before this script can be run.
FusionChartsPLSQL FlashChartTypes.udt Creates all of the user defined types and objects required by the API.
FusionChartsPLSQL FusionFlashCharts.pkg Creates the API PL/SQL package FusionFlashCharts.pkg
FusionChartsPLSQL/ChartObjects <all of the .swf files for each chart type>
Directory containing the flash files for each chart type. These files will be loaded
36
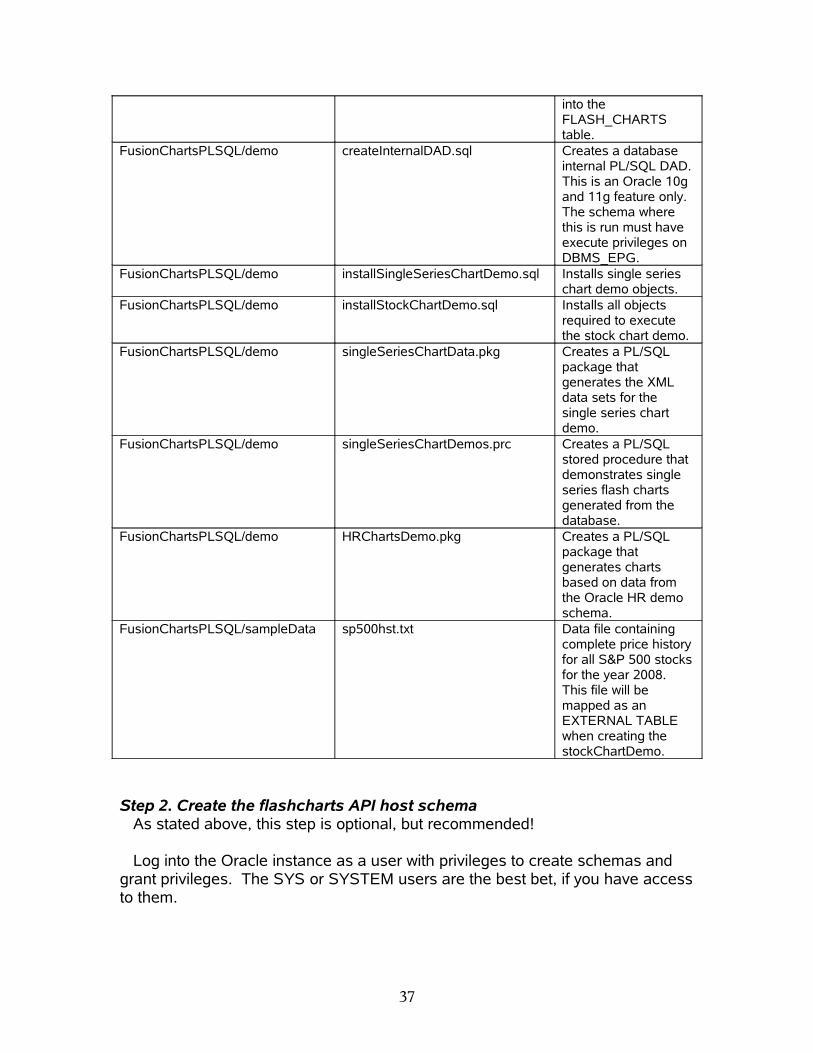
into the FLASH_CHARTS table.
FusionChartsPLSQL/demo createInternalDAD.sql Creates a database internal PL/SQL DAD. This is an Oracle 10g and 11g feature only. The schema where this is run must have execute privileges on DBMS_EPG.
FusionChartsPLSQL/demo installSingleSeriesChartDemo.sql Installs single series chart demo objects.
FusionChartsPLSQL/demo installStockChartDemo.sql Installs all objects required to execute the stock chart demo.
FusionChartsPLSQL/demo singleSeriesChartData.pkg Creates a PL/SQL package that generates the XML data sets for the single series chart demo.
FusionChartsPLSQL/demo singleSeriesChartDemos.prc Creates a PL/SQL stored procedure that demonstrates single series flash charts generated from the database.
FusionChartsPLSQL/demo HRChartsDemo.pkg Creates a PL/SQL package that generates charts based on data from the Oracle HR demo schema.
FusionChartsPLSQL/sampleData sp500hst.txt Data file containing complete price history for all S&P 500 stocks for the year 2008. This file will be mapped as an EXTERNAL TABLE when creating the stockChartDemo.
Step 2. Create the flashcharts API host schema As stated above, this step is optional, but recommended!
Log into the Oracle instance as a user with privileges to create schemas and grant privileges. The SYS or SYSTEM users are the best bet, if you have access to them.
37

Execute the createFlashChartUser.sql script (found in the root directory of the unzipped file) .
The script will create a schema called flashcharts (with password flashcharts) with the following privileges: connect, resource, execute on UTL_FILE, create any directory, create materialized view (if the demos will be installed here as well), drop any directory, and create public synonym. The default password can (and should) be changed.
Step 3. Install API components Log into the flashcharts schema (or the schema where the API components will reside) and run the install.sql script. You will need to know the path full path to the FusionChartsPLSQL directory. The script creates a DIRECTORY object in the schema that points to the location of the Fusion Charts Free .swf files in order to load them into the FLASH_CHARTS table.
The script will install all of the API components: tables (and load them), user defined types, and PL/SQL package.
Installing the Demos There are several demo procedures and packages included with the API in the /FusionChartsPLSQL/demo directory. They can be installed in any schema that has execute privileges on the API components (specifically the FusionFlashCharts PL/SQL package and all of the user defined types). If you have installed the API into the flashcharts schema, you can just run the flashchartSchemaGrants.sql script in the flashcharts schema. All of the demos are designed to be run as web PL/SQL applications using a PL/SQL DAD. If you are not familiar with the PL/SQL DAD, please see Oracle Application Server and/or Oracle 11g documentation.
Creating an Internal PL/SQL DAD with Oracle 10g (Express) and Oracle 11g Oracle 10g (Express Edition) and Oracle 11g both come bundled internal HTTP servers (listeners) and the ability to create an internal PL/SQL DAD (database access descriptor) that maps to a database schema. This allows developers to create and deploy web based applications written in PL/SQL directly from the database instance. A script, createInternalDAD.sql, is included with the API (in the demo directory) that will help you create the PL/SQL DAD. After creating a PL/SQL DAD, any of the demonstration application can be reached via a URL such as this:
http://<host>:<port>/<dadname>/<stored procedure name or synonym>
The schema in which the DAD is created must have execute privileges on the built in package DBMS_EPG.
38

Installing the Single Series Charts demo The single series charts demo consists of a PL/SQL package called singleSeriesChartData that generates a static XML data set for use with a Single Series type chart, and a PL/SQL stored procedure called singleSeriesChartDemos that presents the user with a selection list of charts that can be rendered with the data set. Run the script installSingleSeriesChartDemo.sql to install the demo code.
Installing the HR Charts Demo The HR Charts demo requires that the Oracle HR sample schema (usually installed with the Oracle database) be installed in your database instance. The code consists of a single PL/SQL package called HRChartsDemo. The code generates several types of charts based on the HR schema including single-series and combination charts. The code also demonstrates the drill down capabilities of the flash charts. Run the script HRChartsDemo.pkg to install the demo code.
Installing the Stock Chart Demo The stock chart demo makes use of 2008 S&P 500 stock market data. The data for this demo is stored in an external file called sp500hst.txt located in the /FusionChartsPLSQL/SampleData directory. The installation script will create an Oracle EXTERNAL table that maps to this file, allowing the data to be queried using SQL. A materialized view is then created based on this external table. The schema where this is installed will need the privilege to create a materialized view, and the privilege to create a DIRECTORY object. The demo code consists of a single PL/SQL package called StockDataChartDemo. The code demonstrates how to create mutli-series data set, and generates a multi-series line chart detailing the closing prices for several technology stocks over a two month period. Run the script installStockChartDemo.sql to install the demo code and create the data table.
Wrapping It Up … Please feel free to contact me thru my website, Jason Bennett’s Developer Corner (http://radio.weblogs.com/0137094/) if you have any questions about this API. If you have questions concerning FusionCharts Free, please contact the FusionCharts team via email at [email protected] or through their website http://www.fusioncharts.com .
39