general purpose water accounting report 2010-2011 · general purpose water accounting report 2010...
TRANSCRIPT

General Purpose Water Accounting Report 2010-2011
Lower Darling Catchment
www.water.nsw.gov.au

Publisher
NSW Department of Primary Industries, Office of Water.
Level 18, 227 Elizabeth Street GPO Box 3889 Sydney NSW 2001
T 02 8281 7777 F 02 8281 7799
www.water.nsw.gov.au
The NSW Office of Water manages the policy and regulatory frameworks for the state’s surface water and
groundwater resources, to provide a secure and sustainable water supply for all users. It also supports water
utilities in the provision of water and sewerage services throughout New South Wales.
General Purpose Water Accounting Report 2010 -2011 – Lower Darling Catchment
August 2012
ISBN 978 1 74256 320 6
This report may be cited as: Burrell M., Moss P., Nguyen K., Petrovic J., Ali A., (2012) General Purpose Water Accounting Report 2010-2011: Lower Darling Catchment, NSW Department of Primary Industries, Sydney
Cover photo: Darling River at Wilcannia
© State of New South Wales through the NSW Department of Trade and Investment, Regional Infrastructure and Services, 2012
This material may be reproduced in whole or in part for educational and non-commercial use, providing the meaning is unchanged and its source, publisher and authorship are clearly and correctly acknowledged.
Disclaimer: While every reasonable effort has been made to ensure that this document is correct at the time of publication, the State of New South Wales, its agents and employees, disclaim any and all liability to any person in respect of anything or the consequences of anything done or omitted to be done in reliance upon the whole or any part of this document.
Publication reference: 11409
General Purpose Water Accounting Report 2010-11 – Lower Darling catchment
Table of Contents
Table of Contents ..................................................................................................................................i
Introduction.......................................................................................................................................... 1
Contextual Statement.......................................................................................................................... 2 Accounting Extent ......................................................................................................................... 2
Surface Water ..................................................................................................................... 2 Groundwater ....................................................................................................................... 2
Summary for 2010-11.................................................................................................................... 4
Water Accounting Statements ......................................................................................................... 10 Significant water accounting policies .......................................................................................... 11 Quantification of data .................................................................................................................. 11
Physical Flows Mass Balance Diagram (2010-2011) ....................................................... 12 Water Assets and Water Liabilities ................................................................................... 13 Changes in Water Assets and Water Liabilities................................................................ 14
Note disclosures................................................................................................................................ 16 Reconciliation and future prospect descriptions ......................................................................... 17 Note 1 – Surface water storage – Combined Menindee System................................................ 19 Note 2 – River channel storage................................................................................................... 22 Note 3 – Allocation accounts....................................................................................................... 23 Note 4 – Storage inflow – Combined Menindee System ............................................................ 26 Note 5 – Storage evaporation and storage rainfall ..................................................................... 27 Note 6 – River evaporation and river rainfall............................................................................... 28 Note 7 – Talyawalka Creek Inflow............................................................................................... 29 Note 8 – Dam releases, river inflow from dam releases ............................................................. 30 Note 9 – End of system flow........................................................................................................ 31 Note 10 – Extractions .................................................................................................................. 32 Note 11 – Basic rights ................................................................................................................. 34 Note 12 – Available Water Determination (AWD) ....................................................................... 35 Note 13 – Temporary Trading/Allocation assignments ............................................................... 38 Note 14 – Unaccounted difference.............................................................................................. 40 Note 15 – Held environmental water........................................................................................... 41 Note 16 – Unregulated Effluent to Great Darling Anabranch...................................................... 44 Note 17 – Environmental provisions ........................................................................................... 45 Assurance Statement .................................................................................................................. 46
References ......................................................................................................................................... 47
i | NSW Office of Water, August 2012

General Purpose Water Accounting Report 2010-11 – Lower Darling catchment
Tables
Table 1: Water account data accuracy estimates key .................................................................. 11
Figures
Figure 1: Surface water geographical extent of the accounts.......................................................... 3
Figure 2: Total Rainfall (mm) in the Lower Darling 2010-11 ................................................................. 5
Figure 3: Monthly rainfall variation 2010-11 against historical records ................................................. 6
Figure 4: Long-term total flow (ML/year) at Wilcannia against mean and 2010-11 flow....................... 7
Figure 5: Inflows at Wilcannia against rainfall 2010-11......................................................................... 7
Figure 6: Menindee combined storage capacity volume (ML) and percent full 2010-11 ...................... 8
Figure 7: Water Availability (AWD plus carry over) ............................................................................... 8
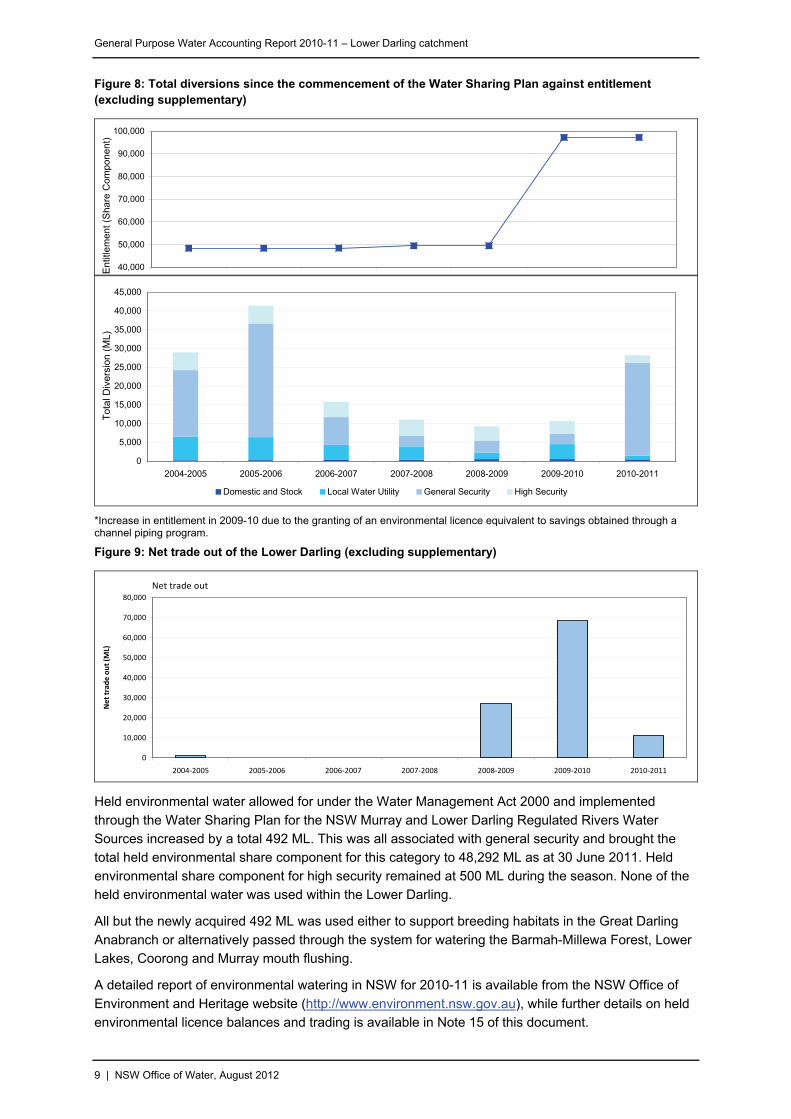
Figure 8: Total diversions since the commencement of the Water Sharing Plan against
entitlement (excluding supplementary) ............................................................................. 9
Figure 9: Net trade out of the Lower Darling (excluding supplementary).............................................. 9
ii | NSW Office of Water, August 2012

General Purpose Water Accounting Report 2010-11 – Lower Darling catchment
Abbreviations
Acronym Description
AWAS Australian Water Accounting Standard
AWD Available Water Determination
BoM Bureau of Meteorology
CAIRO Computer Aided Improvements to River Operations
ED AWAS1 Exposure Draft of the Australian Water Accounting Standards
GIS Geographic Information System
GL Gigalitres (1,000,000,000 litres)
GPWAR General Purpose Water Accounting Report
IQQM Integrated Quantity and Quality Model
MDBA Murray-Darling Basin Authority
ML Megalitres (1,000,000 litres)
NSW New South Wales
QLD Queensland
WAS Water Accounting System (Water Management Act 2000)
WASB Water Accounting Standards Board
WSP Water Sharing Plan
iii | NSW Office of Water, August 2012
General Purpose Water Accounting Report 2010-11 – Lower Darling catchment
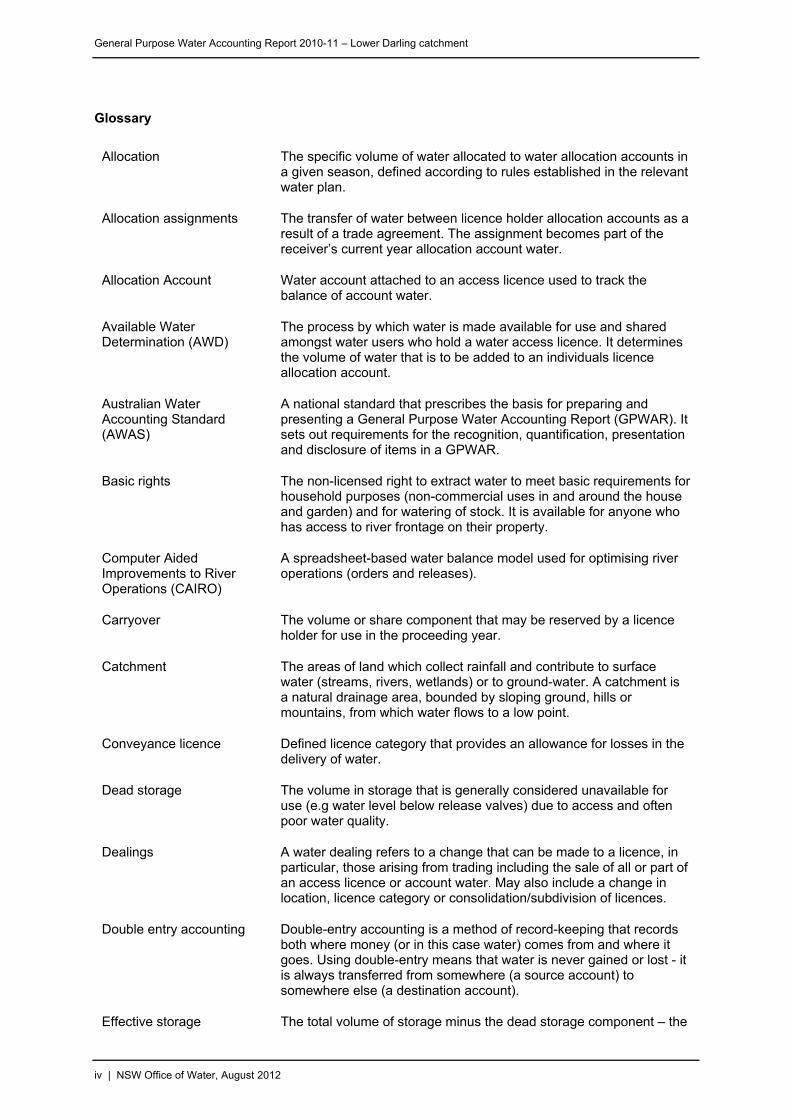
Glossary
Allocation The specific volume of water allocated to water allocation accounts in a given season, defined according to rules established in the relevant water plan.
Allocation assignments The transfer of water between licence holder allocation accounts as a result of a trade agreement. The assignment becomes part of the receiver’s current year allocation account water.
Allocation Account Water account attached to an access licence used to track the balance of account water.
Available Water Determination (AWD)
The process by which water is made available for use and shared amongst water users who hold a water access licence. It determines the volume of water that is to be added to an individuals licence allocation account.
Australian Water Accounting Standard (AWAS)
A national standard that prescribes the basis for preparing and presenting a General Purpose Water Accounting Report (GPWAR). It sets out requirements for the recognition, quantification, presentation and disclosure of items in a GPWAR.
Basic rights The non-licensed right to extract water to meet basic requirements for household purposes (non-commercial uses in and around the house and garden) and for watering of stock. It is available for anyone who has access to river frontage on their property.
Computer Aided Improvements to River Operations (CAIRO)
A spreadsheet-based water balance model used for optimising river operations (orders and releases).
Carryover The volume or share component that may be reserved by a licence holder for use in the proceeding year.
Catchment The areas of land which collect rainfall and contribute to surface water (streams, rivers, wetlands) or to ground-water. A catchment is a natural drainage area, bounded by sloping ground, hills or mountains, from which water flows to a low point.
Conveyance licence Defined licence category that provides an allowance for losses in the delivery of water.
Dead storage The volume in storage that is generally considered unavailable for use (e.g water level below release valves) due to access and often poor water quality.
Dealings A water dealing refers to a change that can be made to a licence, in particular, those arising from trading including the sale of all or part of an access licence or account water. May also include a change in location, licence category or consolidation/subdivision of licences.
Double entry accounting Double-entry accounting is a method of record-keeping that records both where money (or in this case water) comes from and where it goes. Using double-entry means that water is never gained or lost - it is always transferred from somewhere (a source account) to somewhere else (a destination account).
Effective storage The total volume of storage minus the dead storage component – the
iv | NSW Office of Water, August 2012
General Purpose Water Accounting Report 2010-11 – Lower Darling catchment
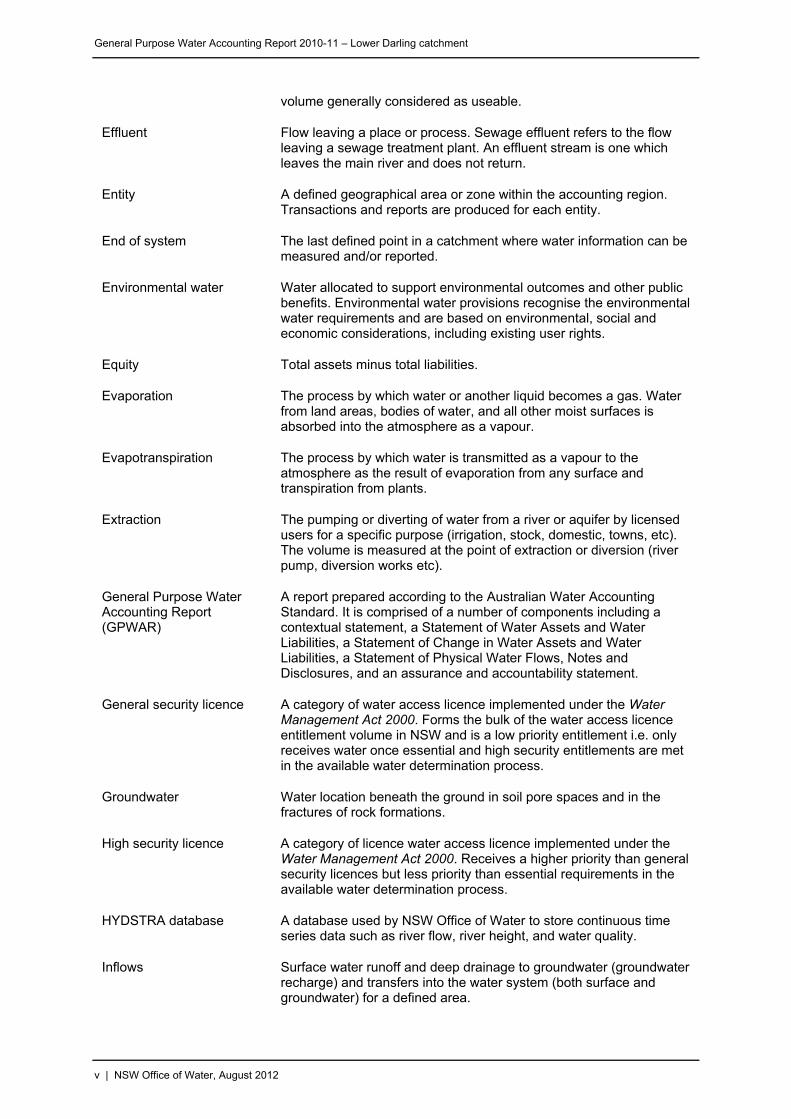
volume generally considered as useable.
Effluent Flow leaving a place or process. Sewage effluent refers to the flow leaving a sewage treatment plant. An effluent stream is one which leaves the main river and does not return.
Entity A defined geographical area or zone within the accounting region. Transactions and reports are produced for each entity.
End of system The last defined point in a catchment where water information can be measured and/or reported.
Environmental water Water allocated to support environmental outcomes and other public benefits. Environmental water provisions recognise the environmental water requirements and are based on environmental, social and economic considerations, including existing user rights.
Equity Total assets minus total liabilities.
Evaporation The process by which water or another liquid becomes a gas. Water from land areas, bodies of water, and all other moist surfaces is absorbed into the atmosphere as a vapour.
Evapotranspiration The process by which water is transmitted as a vapour to the atmosphere as the result of evaporation from any surface and transpiration from plants.
Extraction The pumping or diverting of water from a river or aquifer by licensed users for a specific purpose (irrigation, stock, domestic, towns, etc). The volume is measured at the point of extraction or diversion (river pump, diversion works etc).
General Purpose Water Accounting Report (GPWAR)
A report prepared according to the Australian Water Accounting Standard. It is comprised of a number of components including a contextual statement, a Statement of Water Assets and Water Liabilities, a Statement of Change in Water Assets and Water Liabilities, a Statement of Physical Water Flows, Notes and Disclosures, and an assurance and accountability statement.
General security licence A category of water access licence implemented under the Water Management Act 2000. Forms the bulk of the water access licence entitlement volume in NSW and is a low priority entitlement i.e. only receives water once essential and high security entitlements are met in the available water determination process.
Groundwater Water location beneath the ground in soil pore spaces and in the fractures of rock formations.
High security licence A category of licence water access licence implemented under the Water Management Act 2000. Receives a higher priority than general security licences but less priority than essential requirements in the available water determination process.
HYDSTRA database A database used by NSW Office of Water to store continuous time series data such as river flow, river height, and water quality.
Inflows Surface water runoff and deep drainage to groundwater (groundwater recharge) and transfers into the water system (both surface and groundwater) for a defined area.
v | NSW Office of Water, August 2012

General Purpose Water Accounting Report 2010-11 – Lower Darling catchment
Inter-valley trade Trade of licence holder allocation account water, via allocation assignment, from one catchment to another catchment (or state).
Intra-valley trade Trade of licence holder allocation account water, via allocation assignment, within the same catchment.
Licence Administration System (LAS)
The system used by NSW Office of Water to manage water access licence information and transaction.
Liability A legally binding obligation to settle a debt.
Median The middle point of a distribution, separating the highest half of a sample from the lowest half.
Non-physical transaction An accounting transaction representing a process that is not a component of the water cycle (e.g. an available water determination).
Physical transaction An accounting transaction representing a process of the water cycle (e.g. a extraction).
Recharge Groundwater recharge is a hydrologic process where water drains downward from surface water to groundwater. Groundwater is recharged naturally by rain, floods and snow melt and to a smaller extent by drainage directly from surface water (such as rivers and lakes).
Regulated river A river system where flow is controlled via one or more major man-made structures e.g. dams and weirs. For the purposes of the Water Management Act 2000 a regulated river is one that is declared by the Minister to be a regulated river. Within a regulated river system licence holders can order water against a held entitlement.
Replenishment flows Flows provided along effluent systems downstream of a water source to supply water for household, town use and stock.
Return inflows Water that has been diverted from a river by a water user and is then returned to the river after use (e.g. can include non-consumptive uses, such as hydropower, cooling water for industry or water for aquaculture). This water is included as an inflow to the basin because the water is available to be diverted downstream or will pass the basin outlet.
Share component An entitlement to water specified on the access licence, expressed as a unit share or in the case of specific purpose licences (eg. local water utility, major water utility and domestic and stock) a volume in megalitres. The amount of water a licence holder is allocated as a result of an available water determination and the amount they can take in any year is based on their share component.
Storage A state-owned dam, weir or other structure which is used to regulate and manage river flows in the catchment and the water bodies impounded by these structures.
Storage discharge The volume of water released from storage in a specified time frame.
Storage reserve Proportion of water in a storage reserved in the resource assessment process for future essential or high security requirements (e.g. town water).
Storage volume The total volume of water held in storage at a specified time.
vi | NSW Office of Water, August 2012

General Purpose Water Accounting Report 2010-11 – Lower Darling catchment
vii | NSW Office of Water, August 2012
Supplementary water Unregulated river flow available for extraction under a supplementary licence.
Surface water All water that occurs naturally above ground including rivers, lakes, reservoirs, creeks, wetlands and estuaries.
Tributary A smaller river or stream that flows into a larger river or stream. Usually a number of smaller tributaries merge to form a river.
Uncontrolled flow Water permitted to be extracted without debt under a general security access licence during a supplementary flow event. The extracted water may be progressively debited to the general security account if water availability exceeds predefined levels.
Water accounting The systematic process of identifying, recognising, quantifying, reporting, assuring and publishing information about water, the rights or other claims to that water, and the obligations against that water.
Water assets The physical water held in storage, as well as any claims to water that are expected to increase the future water resource (e.g. external water entering the system through intervalley trading).
Water liabilities Claims on the water assets of the water report entity including water that has been allocated to licence holder accounts or environmental accounts but yet to be taken at the end of the reporting period.
Water sharing plan A water management plan that defines the rules for sharing of water within a region under the Water Management Act 2000.
General Purpose Water Accounting Report 2010-11 – Lower Darling catchment
Introduction This document is a General Purpose Water Accounting Report for the regulated surface water component of the Lower Darling River, prepared by the NSW Office of Water under the Exposure
Draft of Australian Water Accounting Standard 1 framework. It has been prepared for the reporting period of 1 July to 2010 to 30 June 2011 and aims to provide a consolidated and informative summary of the water resource and water management that occurred within the Regulated Lower Darling for
this period.
The Water Sharing Plan for the NSW Murray and Lower Darling Regulated Rivers Water Sources was suspended for the entire reporting period with the Lower Darling water source being managed under
drought contingency arrangements. However, all efforts were made to continue to manage, where possible, in accordance with the rules as set out in the Plan.
As Commissioner of the NSW Office of Water I hereby declare:
The information presented in these accounts is a faithful representation of the management and operation of the Regulated Lower Darling in 2010-11
All data presented in this report is based on the best available information at the time of
publication.
The NSW Office of Water has to the best of its ability prepared the General Purpose Water
Accounting Report for the Lower Darling water report entity for the 2010-11 water year in accordance with the ED AWAS 1.
David Harriss Commissioner, NSW Office of Water
Dated: 31.7.2012
1 | NSW Office of Water, August 2012
General Purpose Water Accounting Report 2010-11 – Lower Darling catchment
Contextual Statement The Lower Darling River is located in the semi-arid environment of south-western New South Wales. The ‘Lower Darling’ commonly refers to that portion of the Darling River which is regulated by releases
from the Menindee Lakes Scheme, from the township of Menindee downstream to its junction with the Murray River at Wentworth 530 km downstream.
The general topography of the catchment is flat with elevations across most of the floodplain area
being less than 100 metres. Land use is dominated by grazing with small areas of cropping carried out in the southern half of the catchment and on some of the region’s lake beds.
Prior to construction of the Menindee Lakes Scheme the Lower Darling River was unregulated, and
like the unregulated portion of the catchment above Menindee, it was subject to highly variable flow conditions. With completion of the Scheme in 1960 the flow regime of the river has changed significantly, with reduced monthly flow volumes, long periods of constant low flow and reduced
frequency of small to medium sized flow events (Green et al. 1998)
A detailed description of the catchment can be found in the document Water resources and management overview – Lower Darling Catchment which is available from the NSW Office of Water
website.
Accounting Extent
Surface Water The accounted river extent is illustrated in Figure 1 and includes the Lower Darling Water Source
managed under the Water Sharing Plan for the NSW Murray and Lower Darling Water Sources. It includes the Lower Darling Regulated River System downstream of Menindee Lakes from the township of Menindee downstream to its junction with the Murray River at Wentworth. As the flow data
at Wentworth is both limited and backwater affected by flow in the Murray River however, the flow site on the Darling River at Burtundy was used as an alternative for the end of system.
While the Great Darling Anabranch is not included as part of this GPWAR, the flow leaving the defined
entity that enters the Anabranch is accounted for in order to achieve a correct mass balance. The only inflow that is considered to the Lower Darling is the return flow of Talyawalka Creek.
Groundwater No groundwater data has been included in this GPWAR
2 | NSW Office of Water, August 2012

General Purpose Water Accounting Report 2010-11 – Lower Darling catchment
Figure 1: Surface water geographical extent of the accounts
3 | NSW Office of Water, August 2012

General Purpose Water Accounting Report 2010-11 – Lower Darling catchment
Summary for 2010-11
In 2010-11 the Lower Darling River continued into a wet regime that began in 2009-10 which brought
high flows in from Queensland and brought to an end the devastating drought sequence that had lasted almost a decade.
Very high rainfalls particularly during the summer replenished water supplies available for water users
and provided for extensive flooding of important wetlands creating and maintaining native fish and bird breeding habitat. Once again the main inflows to the Menindee Lakes System were predominately sourced from Queensland and Northern NSW, with significant, flooding events arriving from the
Culgoa, Border Rivers and Namoi Catchments. In addition to this direct rainfall in the lower Darling was also significantly above average when compared to historic records.
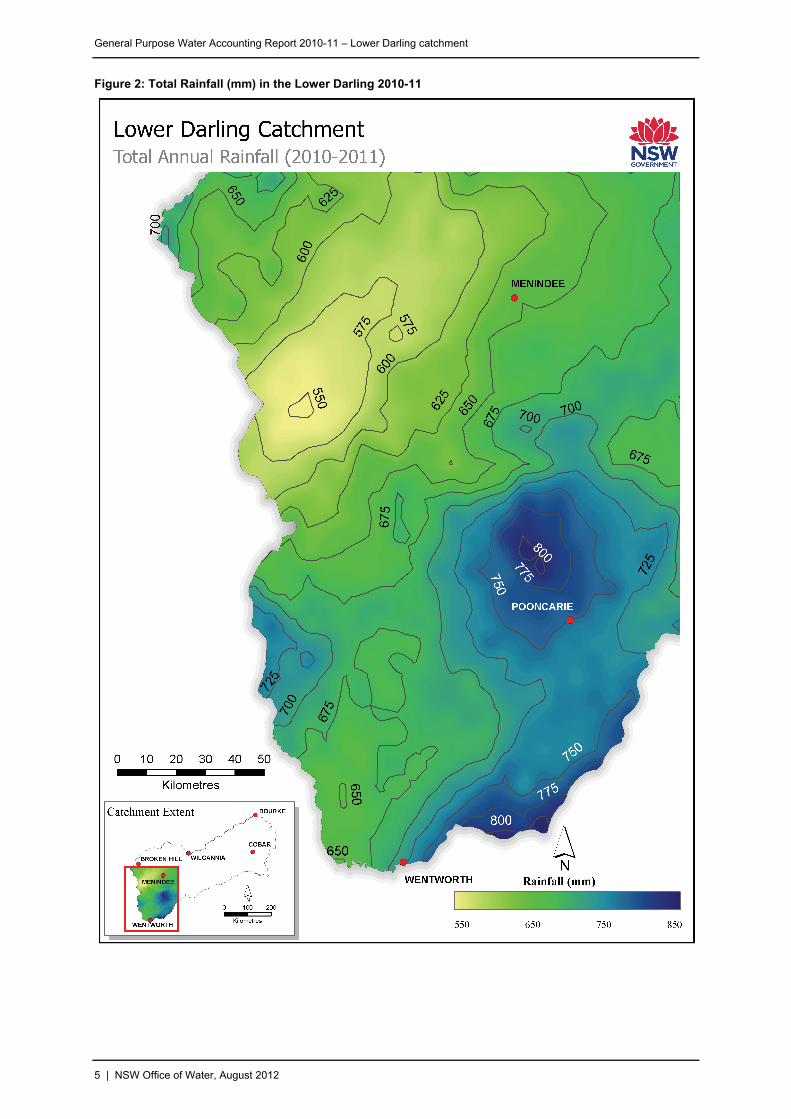
Rainfall specifically across the Lower Darling area was considerably above the average (around 230
mm/year) with some areas exceeding 800 mm (Figure 2). Significantly high rainfall across the full extent of the catchment began in October 2010 and continued right through the summer (Figure 3).
4 | NSW Office of Water, August 2012
General Purpose Water Accounting Report 2010-11 – Lower Darling catchment
Figure 2: Total Rainfall (mm) in the Lower Darling 2010-11
5 | NSW Office of Water, August 2012
General Purpose Water Accounting Report 2010-11 – Lower Darling catchment
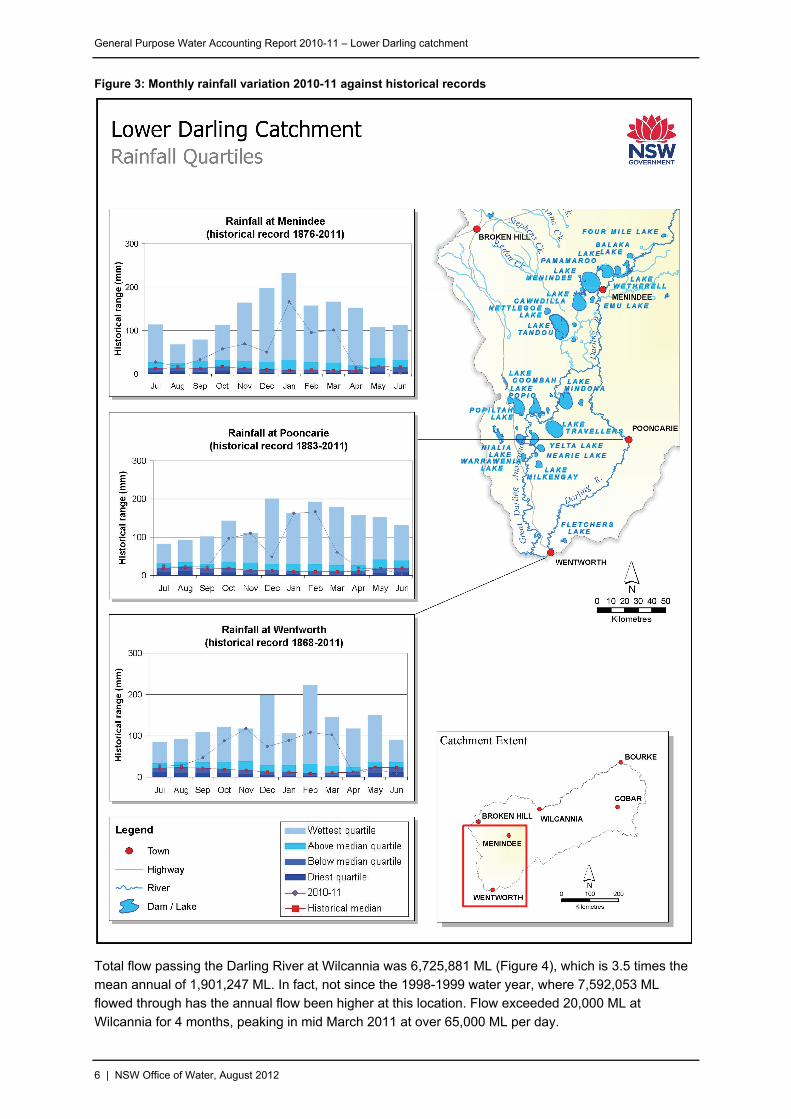
Figure 3: Monthly rainfall variation 2010-11 against historical records
Total flow passing the Darling River at Wilcannia was 6,725,881 ML (Figure 4), which is 3.5 times the mean annual of 1,901,247 ML. In fact, not since the 1998-1999 water year, where 7,592,053 ML flowed through has the annual flow been higher at this location. Flow exceeded 20,000 ML at
Wilcannia for 4 months, peaking in mid March 2011 at over 65,000 ML per day.
6 | NSW Office of Water, August 2012

General Purpose Water Accounting Report 2010-11 – Lower Darling catchment
7 | NSW Office of Water, August 2012
Figure 4: Long-term total flow (ML/year) at Wilcannia against mean and 2010-11 flow
0
2,000
4,000
6,000
8,000
10,000
12,000
14,000
16,000
18,000
1895‐1896
1900‐1901
1905‐1906
1910‐1911
1915‐1916
1920‐1921
1925‐1926
1930‐1931
1935‐1936
1940‐1941
1945‐1946
1950‐1951
1955‐1956
1960‐1961
1965‐1966
1970‐1971
1975‐1976
1980‐1981
1985‐1986
1990‐1991
1995‐1996
2000‐2001
2005‐2006
2010‐2011
Flow (ML x 1000)
1895/96 ‐ 2009/10 2010/11 Mean Annual Inflow
Figure 5: Inflows at Wilcannia against rainfall 2010-11
0
10,000
20,000
30,000
40,000
50,000
60,000
70,000
80,000
1 Jul 10
1 Aug 10
1 Sep
10
1 Oct 10
1 Nov 10
1 Dec 10
1 Jan 11
1 Feb 11
1 Mar 11
1 Apr 11
1 May 11
1 Jun 11
Flow (ML/d)
0
10
20
30
40
50
60
70
80
90
Rai
nfa
ll (m
m)
Wilcannia Rainfall Wilcannia Daily Flow
While these flows have allowed for maximum resource provisions in the Lower Darling, this water source is managed by NSW under the same water sharing plan than the NSW Regulated Murray
River. The Water Sharing Plan for the NSW Murray and Lower Darling Regulated Rivers Water Sources was suspended on 10 November 2006 and due to severe drought and a critical resource situation in both water sources. The plan remained suspended for the entire 2010-11 season due to
the ongoing resource concerns leading into the year in the NSW Regulated Murray. While this meant that the Lower Darling was therefore managed throughout 2010-11 under drought contingency water sharing plan arrangements, all efforts were made to ensure that that management of the NSW share
of the available resource mimicked the requirements that were set out in the water sharing plan. Over-arching this, and as per the agreement water sharing arrangements set in the Murray Darling Basin agreement the total resource was managed and distributed amongst the states by the Murray Darling
Management Authority (MDBA) for the entirety of 2010-11. The trigger for MDBA control occurred in April 2010 when total storage volume exceeded 640,000 ML and will only return to full NSW control when the storage falls below 480,000 ML.
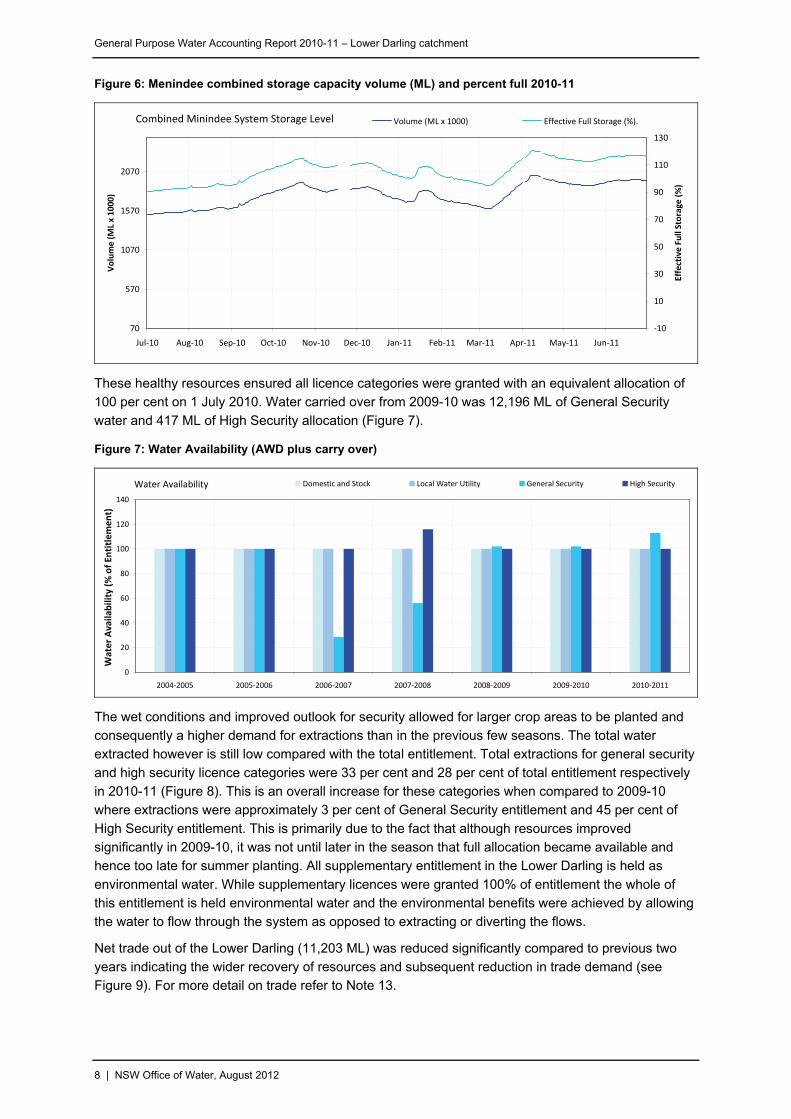
Resources held in the combined Menindee Lakes systems were approximately 90 per cent of full capacity at the beginning of 2010-11 (Figure 6) while at the close of the season they were still surcharged following the high inflows and equivalent to approximately 117 per cent of total capacity.
General Purpose Water Accounting Report 2010-11 – Lower Darling catchment
8 | NSW Office of Water, August 2012
Figure 6: Menindee combined storage capacity volume (ML) and percent full 2010-11
Combined Minindee System Storage Level
70
570
1070
1570
2070
Jul‐10 Aug‐10 Sep‐10 Oct‐10 Nov‐10 Dec‐10 Jan‐11 Feb‐11 Mar‐11 Apr‐11 May‐11 Jun‐11
Volume (ML x 1000)
‐10
10
30
50
70
90
110
130
Effective Full Storage (%)
Volume (ML x 1000) Effective Full Storage (%).
These healthy resources ensured all licence categories were granted with an equivalent allocation of 100 per cent on 1 July 2010. Water carried over from 2009-10 was 12,196 ML of General Security
water and 417 ML of High Security allocation (Figure 7).
Figure 7: Water Availability (AWD plus carry over)
Water Availability
140
0
20
40
60
80
100
2004‐2005 2005‐2006 2006‐2007 2007‐2008 2008‐2009 2009‐2010 2010‐2011
Water Availability (%
of En
titlem
120ent)
Domestic and Stock Local Water Utility General Security High Security
The wet conditions and improved outlook for security allowed for larger crop areas to be planted and consequently a higher demand for extractions than in the previous few seasons. The total water extracted however is still low compared with the total entitlement. Total extractions for general security
and high security licence categories were 33 per cent and 28 per cent of total entitlement respectively
of
allowing
in 2010-11 (Figure 8). This is an overall increase for these categories when compared to 2009-10 where extractions were approximately 3 per cent of General Security entitlement and 45 per cent
High Security entitlement. This is primarily due to the fact that although resources improved significantly in 2009-10, it was not until later in the season that full allocation became available and hence too late for summer planting. All supplementary entitlement in the Lower Darling is held as
environmental water. While supplementary licences were granted 100% of entitlement the whole of this entitlement is held environmental water and the environmental benefits were achieved bythe water to flow through the system as opposed to extracting or diverting the flows.
Net trade out of the Lower Darling (11,203 ML) was reduced significantly compared to previous two years indicating the wider recovery of resources and subsequent reduction in trade demand (see Figure 9). For more detail on trade refer to Note 13.
General Purpose Water Accounting Report 2010-11 – Lower Darling catchment
9 | NSW Office of Water, August 2012
Figure 8: Total diversions since the commencement of the Water Sharing Plan against entitlement (excluding supplementary)
40,000
50,000
60,000
70,000
80,000
are
Com
p
90,000
Ent
itlem
ent
(Sh
onen
t)
100,000
0
5,000
10,000
15,000
20,000
25,000
30,000
35,000
40,000
45,000
2004-2005 2005-2006 2006-2007 2007-2008 2008-2009 2009-2010 2010-2011
Tot
al D
iver
sion
(M
L)
Domestic and Stock Local Water Utility General Security High Security
*Increase in entitlement in 2009-10 due to the granting of an environmental licence equivalent to savings obtained through a channel piping program.
Figure 9: Net trade out of the Lower Darling (excluding supplementary)
Net trade out
0
10,000
20,000
30,000
40,000
50,000
60,000
70,000
80,000
2004‐2005 2005‐2006 2006‐2007 2007‐2008 2008‐2009 2009‐2010 2010‐2011
Net trad
e out (M
L)
Held environmental water allowed for under the Water Management Act 2000 and implemented
through the Water Sharing Plan for the NSW Murray and Lower Darling Regulated Rivers Water Sources increased by a total 492 ML. This was all associated with general security and brought the total held environmental share component for this category to 48,292 ML as at 30 June 2011. Held
environmental share component for high security remained at 500 ML during the season. None of the
r
is available from the NSW Office of
Environment and Heritage website (http://www.environment.nsw.gov.au
held environmental water was used within the Lower Darling.
All but the newly acquired 492 ML was used either to support breeding habitats in the Great Darling
Anabranch or alternatively passed through the system for watering the Barmah-Millewa Forest, LoweLakes, Coorong and Murray mouth flushing.
A detailed report of environmental watering in NSW for 2010-11
), while further details on held environmental licence balances and trading is available in Note 15 of this document.

General Purpose Water Accounting Report 2010-11 – Lower Darling catchment
10 | NSW Office of Water, August 2012
Water Accounting Statements
General Purpose Water Accounting Report 2010-11 – Lower Darling catchment
11 | NSW Office of Water, August 2012
Significant water accounting policies
The water accounting statements in this GPWAR have been prepared using an accrual basis of
accounting. All figures are in megalitres (ML).
The ‘Statement of Physical Flows’ has been excluded for this GPWAR as all transactions have been presented in the statements ‘Water Assets and Liabilities’ and ‘Changes in Water Assets and Water
Liabilities’.
The introduction of a ‘Physical Flow Diagram’ that represents the physical movements of water has been included in order to provide a clearer picture of this process.
For a detailed explanation on how to interpret the NSW Office of Water water accounting statements refer to the report Interpreting New South Wales Office of Water General Purpose Water Accounting Reports, available for download on from the NSW Office of Water website.
Quantification o
Data accuracy
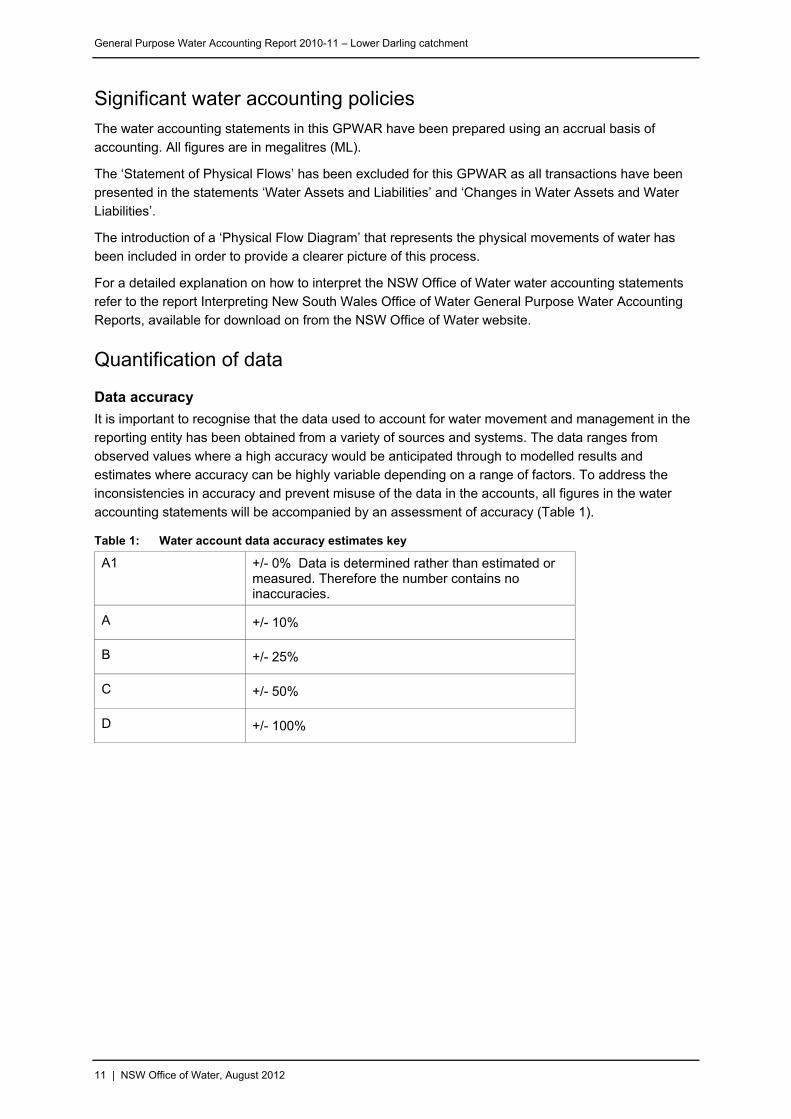
It is important to recognise that the data used to account for water movement and management in the reporting entity has been obtained from a variety of sources and systems. The data ranges from
observed values where a high accuracy would be anticipated through to modelled results and estimates where accuracy can be highly variable depending on a range of factors. To address the inconsistencies in accuracy and prevent misuse of the data in the accounts, all figures in the water
accounting statements will be accompanied by an assessment of accuracy (Table 1).
Table 1: Water account data accuracy estimates key
A1
+/- 0% Data is determined rather than estimated or measured. Therefore the number contains no inaccuracies.
f data
A +/- 10%
B +/- 25%
C +/- 50%
D +/- 100%

Gen
era
l Pur
pose
Wat
er A
ccou
ntin
g R
epor
t 20
10-1
1 –
Low
er
Dar
ling
catc
hmen
t
12 |
NS
W O
ffice
of W
ater
, Aug
ust
201
2
Phy
sica
l Flo
ws
Mas
s B
alan
ce D
iag
0
ram
(210
-21)
01
395,116
3,460,480
End of System
Darling River
Evaporati
,468
Extractions
,202
Basic Rights Extraction
3,727
on: 33
: 28
s:
River Outflow
Ra
Inflow fro
al
al
:8
s
ainf
ka Ckll: 16,
45
129
,730
m T
yaw
River Inflows
Unaccounted difference
1,246,546
All figures in megalitres
Weir
Major Storage
Outflow
Inflow
01/07/10: 2,602
30/06/11: 11,026 Ch
424
ange: 8,
01/07/
30/06/
Cha
d M
eni 10:
521,
11:
955,
nge
434,
Combine
nde
ste
1,
1,
:
e sy
512
618
106
m
Evapor
Ra
ation ll
infa
Great Darli
Lake
Meninde
Lake
Pam
ama
e
ng Anabranch
e Release
roo Releas
342,60
knd
e
0illa Releas
Lae Caw 300,710
Release
914
Wetherell
4,185,
538
262,
611,
019
617,642
Anabranch
Offtake
Inflow
6,007,965

General Purpose Water Accounting Report 2010-11 – Lower Darling catchment
13 | NSW Office of Water, August 2012
Lower Darling catchment
Water Assets and Water Liabilities
For the year ended 30 June 2011
SURFACE WATER ASSETS
1. Surface Water Storage Accuracy Notes 30 June 2011 30 June 2010
Combined Menindee System A 1 1,955,618 1,521,512
River B 2 11,026 2,602
Total Surface Water Storage (ASWS) 1,966,644 1,524,114
Change in Surface Water Storage 442,530 1,295,179
SURFACE WATER LIABILITIES
2. Allocation Account Balance Accuracy Notes 30 June 2011 30 June 2010
General Security A1 3 54,399 12,197
High Security A1 3 3,502 417
Total Allocation Account Balance (LSWS) 57,901 12,614
Change in Allocation Account Balance 45,287 7,404
3. Environmental Contingency Account Balance Accuracy Notes 30 June 2011 30 June 2010
ECA A 17 30,000 30,000
Total ECA Balance (LECA) 30,000 30,000
Change in Allocation Account Balance 0 0
Net Surface Water Assets (ASWS ‐ LSWS – LECA) 1,878,743 1,481,500
Change in Net Surface Water Assets 397,243 1,287,775
GROUNDWATER ASSETS AND GROUNDWATER LIABILITIES
Gr er components were not segmented for the Lower Darling Catchment.
oundwat

General Purpose Water Accounting Report 2010-11 – Lower Darling catchment
14 | NSW Office of Water, August 2012
Lower Darling catchment
Changes in Water Assets and Water Liabilities For the year ended 30 June 2011 (1 of 2)
1. Ch orage (Physical Water Balan
Surf Ac cy Notes
anges in Surface Water St ce)
ace Water Storage Increases cura 2010‐11 2009‐10 Combined Menindee System
Inflow A 4 6,007,965 2,247,763 Rainfall B 5 262,019 51,995
River Rainfall C 6 16,129 4,881 Inflow from Releases (Total) A 8 4,923,630 710,518 Inflow from Talyawalka Creek B 7 458,730 6,258
To S) tal Surface Water Storage Increases (ISW 11,668,473 3,021,415
Surf Decreases Ac cy Notes 20 20ace Water Storage cura 10‐11 09‐10
Combined Menindee System Evaporation B 5 6 211,538 90,678 Storage Release (Darling River) A 8
Lake W 4 21etherell 81,868 6,510 Main Weir 3,704,046 221,200 Lake Pamamaroo 342,600 257,810 Lake Menindee 395,116 14,998 Storage Release (Anabranch)
Lake Cawndilla 3A 8 00,710 5,550 River
Evaporation C 6 33,468 26,650 Flows L eaving System
Rele A 16 617,64ase to Anabranch 2 0 End of System A 9 3,460,480 574,357
Licenced Extractions A 10 Domestic and Stock (D&S) 92 120 Domestic and Stock (Domestic) 284 312 Domestic and Stock (Stock) 87 90 Local Water Utility 961 3,998 General Security 24,782 2,689 High Security 1,996 3,463
Basic Rights Extractions C 11 3,727 3,727 Total Surface Water Storage Decreases (DSWS) 9,979,397 1,622,152 Unaccounted Volume (Balancing Item) (USWS) D 14 1,246,546 104,084
Net Surface Water Storage Inflow (ISWS ‐ DSWS ‐ USWS) 442,530 1,295,179
2. Changes in allocation accounts
Allocation Account Increases Accuracy Notes 2010‐11 2009‐10 Available Water Determinations A1 12
Domestic and Stock (D&S) 349 349 Domestic and Stock (Domestic) 422 422 Domestic and Stock (Stock) 612 612 Local Water Utility 10,135 10,135 General Security 76,058 74,923 High Security 7,211 7,035
Trade from External A1 13 70,257 7,813 Internal Trade ‐ Buyers A1 13 16,217 4,341
Total Allocation Increases (Iaa) 181,261 105,630

General Purpose Water Accounting Report 2010-11 – Lower Darling catchment
15 | NSW Office of Water, August 2012
Lower Darling catchment ater Liabilities
For the year ended 30 June 2011 (2 of 2) s 2010‐11 2009‐10
Changes in Water Assets and W
Allocation Account Decreases Accuracy NoteAccount Usage (Total) A 3 28,202 10,672 Account Forfeiture A 3
Domestic and Stock (D&S) 249 229 Domestic and Stock (Domestic) 138 110 Domestic and Stock (Stock) 525 522 Local Water Utility 9,174 6,137
Licences Cancelled (Total) A 3 9 0 Trad ernal e to Ext A1 13 81,460 76,215 Inter ‐ Sellers nal Trade A1 13 16,217 4,341
To cation Decreases (Daa) 5,974 98,22tal Allo 13 6
Net rease (IAA ‐ DAA) Allocation Account Balance Inc 45,287 7,404
3. Changes in Environmental Contingency Allowance (E
ECA racy 2010‐1 2009‐1
CA)
Account Increases (IECA) Accu Notes 1 0 Acco 1unt Increase A1 7 0 0
ECA Acco unt Decreases (DECA) Account usage A 17 0 0
Net Allocation Account Balance Increase (IECA – DECA) 0 0
Change ter Assets (ISWS ‐ DSWS ‐ USWS ‐ IAA + DAA‐ IECA + DECA) in Net Surface Wa 397,243 1,287,775
General Purpose Water Accounting Report 2010-11 – Lower Darling catchment
16 | NSW Office of Water, August 2012
Note disclosures

General Purpose Water Accounting Report 2010-11 – Lower Darling catchment
17 | NSW Office of Water, August 2012
Reconciliation and future prospect descriptions
This information is included in the note disclosures for this GPWAR according to the following
requirement of the water accounting standards defined in ED AWAS 1:
‘The following information shall be disclosed in the notes:
a) A reconciliation of the change in water storage presented in the Statement of Physical Water Flows
to the change in net water assets presented in the Statement of Changes in Water Assets and Water Liabilities;
b) The items comprising both opening water storage and closing water storage presented in the
Statement of Physical Water Flows; and
c) A reconciliation of closing water storage presented in the Statement of Physical Water Flows to total water assets presented in the Statement of Water Assets and Water Liabilities’ (Paragraph 139,
ED AWAS 1, WASB, 2010).
Further to this it is requi ill assist the user to understand the future propects of the water re assets available to settle water liabilities and
future commitments within 12 months of the reporting date. This is calculated according to the formula:
SWA = WARP + WAI - WA NA - WL E – FC (All components are defined in the reconciliation of water assets available to settle water liabilities and future commitments within 12 months of reporting date).
Lower Darling Catchment: Reconciliation of change in net water asset to net change in physical water storage 2011 2010
ML ML
CHANGE IN NET SURFACE WATER ASSETS 397,243 1,287,775
Non‐physical adjustments
Net Change in Allocation Accounts 45,287 7,404
45,287 7,404
red to include information that wport entity by defining the water
NET CHANGE IN PHYSICAL SURFACE WATER STORAGE 442,530 1,295,179
Lower Darling Catchment: Reconciliation of closing water storage to total surface water assets 2011 2010
ML ML
CLOSING WATER STORAGE
Surface Water Storage 1,966,644 1,524,114
TOTAL SURFACE WATER ASSETS 1,966,644 1,524,114
Notes: All figures can be derived from or found directly in the Water Accounting Statements of the General Purpose Water Accounting Report.

General Purpose Water Accounting Report 2010-11 – Lower Darling catchment
18 | NSW Office of Water, August 2012
Water assets available to settle water liabilities and future commitments months of reporting date
within 12
(ML) Note (ML) ,966,644
TOTAL WATER ASSETS AS AT 30 June 2011 (WARP) 1
Plus: Water Asset increases within 12months of reporting date (WAI)
0 (a) 0
Minimum Usable D/S Tributaries 0 (b) 0
NA
Minimum Storage Inflow
Less: Water assets not available to be accessed and taken or delivered within 12 months of reporting date. (WA )
Storage Net Evaporation 620,000 (c)
1,850 (e)
18,823 1 738,273
Transmission Loss 30,000 (d)
Operational Loss
Future Essential Requirements 2012‐13 60,000 (f)
End of System Flows 7,600 (g)
Dead Storage
Water assets available to be accessed and taken or delivered within 12 months of reporting date. 1,228,371
Less: Wate liabilities and fu re commitments expected to be settled within 12 months of the reporting date.
Water Liabilities expected to be delivered within 12 months of
r tu
reporting date. (WLE)
Future Commitments expected to be delivered within 12 months of r orting date. (FC)
Surface Water Carryover 47,747 4
ECA 30,000 17 77,747
ep
Indicative Allocations and Basic Rights (h)
General Security 78,099 4
High Security 7,633 4
ic and Stock 1 4
Local Water Utility 10 4
Basic Rights 3,727 16 100,969
Domest ,375
,135
178,716
Surplus of available water assets over water liabilities and future commitments xpected to be settle within 12 months of the reporting date. (SWA) ( 1,049,655 e d i)
N( g term annual minimal inflow sequence to storages. For the Lower Darling this figure is zero.
(b) The statistical long term annual minimal inflow sequence downstream of the storage. For the Lo rli this figurezero.
( al impact of the net effect rainfall and evaporation on the storages.
(d) side to account for the losses encountered in the delivery litie andcommitments. It is estimated at approximately 30% of the delivered regulated water.
(e) This is the volume of ater set aside to account for the inefficiencies in the operation of the system taking into account things such as over ordering of water, water orders being met by rainfall after water release from storage (r nfa rejection) etc.
( ts aside sufficient amount of water asset to meet the essential requirements for tn year two being made up of towns, high security
basic rights, ECA and estimated loss to deliver them. This equates to 53,000ML of essential requirements and 7,000ML to r. It is assumes that the 30,000 ECA provides its own delivery loss component.
(
(h) starting allocation of 100% for all licence categories including general security, towns, domestic and stock and high security to add to the water carried over from 2010-11.
) This represents the remaining uncommitted water available to meet future requirements. The excessive amount of water remaining is due to the fact that Menindee Lakes have excessive evaporation losses and do not just provide water to Lower Darling but also the Lower Murray and South Australia when in MDBA control (see Note 1). When in NSW control water is specifically set aside for Broken Hill water supply and the Lower Darling.
otes: a) The statistical lon
wer Da ng is
c) This is an estimate of the annu
This is the volume of water set a of water liabi s future
wd ai ll
f) The Lower Darling catchment puThis figure represents the essential requirement s i
wo years. , stock and domestic,
delive
g) Summary of the daily end of system flow target for the Lower Darling River. This figure is based on 20ML/day leaving the Lower Darling River for all months except April where 30 ML/d has been allowed.
Indicative Allocation represents a
(i

General Purpose Water Accounting Report 2010-11 – Lower Darling catchment
19 | NSW Office of Water, August 2012
Note 1 – Surface water storage – Combined Menindee System
Th enindee, Lake Pamama o, ke Wetherell and L ate of reporting. The volumes provided rep en e total
volume of water in the storage, incl storage which is the volume of water whi can’t be accessed under normal operating conditions e.g. volume below low level outlet. It is assumed that the de ods e.g. syphons.
Who has the re g Menindee Lakes is shared between ffic f Water and MDBA. It falls u of Water control when the storage volume f ow 0,0 0 ML until such time a 640,000 ML at which time it falls under MDBA ol l it lls back
below 480,000
Data type
Derived from measured dat
P
Not applicable
Da
A – Estimated in the range +/- 10%
Providing agen
NSW Office of Water
Data source
N W Office of W
Methodology
Storage volume uged storage elevation th a ra g table that converts it to a es a breakdown of the stora acities and dead storages. Plots 2010-11 daily storage volu d p entages.
Capacity and dead
is is the combined physical volume of water stored in Lake M ro Laake Cawndilla at the d res t th
uding dead ch
ad storage can be accessed if required via alternative access meth
sponsibility of operatin NSW O e onder NSW Office alls bel 48 0s it rises above contr unti fa
ML.
a
olicy
ta accuracy
cy
S ater – HYDSTRA
s are calculated by processing a ga rough tinvolume. The following table provid ge capon the following page provide the mes an erc
storage summary table
Storage Capacity (ML) Dead storage (ML)
Lake Menindee 594,910 5,840
Lake Pamamaroo 269,610 583
La therell 267,080 5,830ke We
Lake Cawndilla 546,560 6,570

General Purpose Water Accounting Report 2010-11 – Lower Darling catchment
20 | NSW Office of Water, August 2012
Lake Wetherell storage level and effective full storage capacity 2010-11
Lake Wetherell Storage Level
70
120
170
Volume
10
30
Effective
220
270
320
(ML x 1000)
70
90
110
orage
(%)
Jul‐10 Aug‐10 Sep‐10 Oct‐10 Nov‐10 Dec‐10 Jan‐11 Feb‐11 Mar‐11 Apr‐11 May‐11 Jun‐11
‐10
50
Full St
Volume (ML x 1000) Dead Storage Effective Full Storage (%).
and effective full storage capacity 2010-11 Lake Pamamaroo storage level
Lake Pamamaroo Storage Level
‐10 Sep‐10 Oct‐10 Nov‐10 Dec‐10 Jan‐11 Feb‐11 Mar‐11 Apr‐11 May‐11 Jun‐11
Vol
10
0
20
40
60
80
100
120
140
Effective Full Storage
(%)
0
Jul‐10 Aug
100
200
300
ume
400
(ML x
500
00)
600
700
Volume (ML x 1000) Dead Storage Effective Full Storage (%).
Lake Menindee storage level and effective full storage capacity 2010-11
Lake Menindee Storage Level
0
100
200
300
Volume
400
(ML x
50000)
6
Jul‐10 Aug‐10 Sep‐10 Oct‐10 Nov‐10 Dec‐10 Jan‐11 Feb‐11 Mar‐11 Apr‐11 May‐11 Jun‐11
10
0
20
40
60
80
100
120
140Effective Full Storage
(%)
00
700
Volume (ML x 1000) Dead Storage Effective Full Storage (%).

General Purpose Water Accounting Report 2010-11 – Lower Darling catchment
Lake Cawndilla storage level and effective full storage capacity 2010-11
Lake Cawndilla Storage Level
0
100
200
300
400
500
600
700
Jul‐10 Aug‐10 Sep‐10 Oct‐10 Nov‐10 Dec‐10 Jan‐11 Feb‐11 Mar‐11 Apr‐11 May‐11 Jun‐11
Volume (M
L x 1000)
0
20
40
60
80
100
120
140
Effective Full Storage
(%)
Volume (ML x 1000) Dead Storage Effective Full Storage (%).
21 | NSW Office of Water, August 2012

General Purpose Water Accounting Report 2010-11 – Lower Darling catchment
22 | NSW Office of Water, August 2012
Note 2 – River channel storage
The volume of water stored in the river channel on the day of reporting.
Policy
Not applicable
Data type
Derived from measured data
Data accuracy
B – Estimated in the range +/- 25%
Providing agency
NSW Office of Water
Data sources
NSW Office of Water: HYDSTRA, CAIRO
Methodology
For each river section S(n):
V = Q x T
The river channel storage will be equal to the sum of all river section volumes.
River channel storage = S(n) V
Summary of calculation components
Symbol Variable Data Source Unit
Q Average flow in the river section. Calculated by averaging the daily
flows at the upstream and downstream river gauges.
HYDSTRA ML/d
V Volume in each river section. Calculated ML
T Average travel time for a parcel of water to travel through the river
section.
CAIRO days
Assumptions and approximations:
Travel times are estimated to the nearest day.
Daily flow change between gauging sites assumed to be linear.
Volume in the final reach between Burtundy and Wentworth is estimated as 90% of the flow
at Burtundy
General Purpose Water Accounting Report 2010-11 – Lower Darling catchment
23 | NSW Office of Water, August 2012
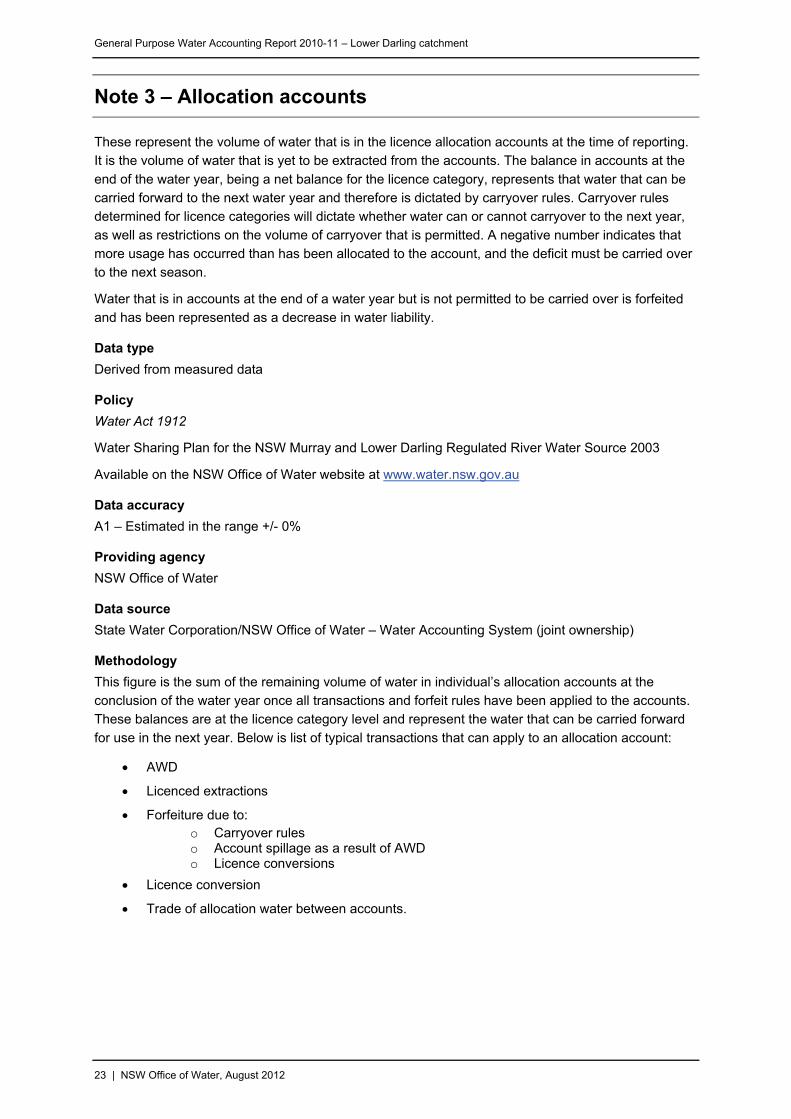
Note 3 – Allocation accounts
These represent the volume of water that is in the licence allocation accounts at the time of reporting. hat is yet to be extracted from the accounts. The balance in accounts at the
e water year, being a net balance for the licence category, represents that water that can be to the next water year and therefore is dictated by carryover rules. Carryover rules
for licence categories will dictate whether water can or cannot carryover to the next year,
r that is permitted. A negative number indicates that has been allocated to the account, and the deficit must be carried over
n.
f a water year but is not permitted to be carried over is forfeited as a decrease in water liability.
a
SW Murray and Lower Darling Regulated River Water Source 2003
Available on the NSW Office of Water website at www.water.nsw.gov.au
It is the volume of water t
end of thcarried forward determined
as well as restrictions on the volume of carryovemore usage has occurred thanto the next seaso
Water that is in accounts at the end oand has been represented
Data type
Derived from measured dat
Policy
Water Act 1912
Water Sharing Plan for the N
A1 – Es
Providing agency
D rce
State Water C oin ip)
Methodology
This figure is water in individual’s allocation t thconclusion of ap the acThese balances are at the licence category level and represent the water that can be carried forward
next year. Below is list of typical transactions that can apply to an allocation account:
Licenced extractions
Licence conversion
Trade of allocation water between accounts.
Data accuracy
timated in the range +/- 0%
NSW Office of Water
ata sou
orporation/NSW Office of Water – Water Accounting System (j
t ownersh
the sum of the remaining volume of accounts a e the water year once all transactions and forfeit rules have been plied to counts.
for use in the
AWD
Forfeiture due to: o Carryover rules o Account spillage as a result of AWD o Licence conversions

General Purpose Water Accounting Report 2010-11 – Lower Darling catchment
24 | NSW Office of Water, August 2012
Additional information
The tables on the following page provide a balanced summary of the water allocation accounts for each category of access licence. Below is a description of each of the table components.
Explanatory information for allocation account summary
Heading Description
Share This is the total volume of entitlement in the specific licence category.
Opening Balance The volume of water that has been carried forward from previous years allocation account.
AWD The total annual volume of water added to the allocation account asa result of allocation assessments.
New Increase in account water as a result of issuing new access licences Licences
Cancelled Decrease in account water as a result of licence cancellation
In Increase in account water as a result of temporary trade in. Assignments
Out Decrease in account water as a result of temporary trade out.
Extractions Accountable Volume of water that is extracted or diverted from the river undcontrolled river conditions and is accountable against a licence.
er
During Year Forfeit This is a decrease in the available account balance due to mid year forfeits that may be triggered by things such as licence subdivisions or other dealings.
End of Year Balance Account balance that is available to be taken at the conclusion of the water year.
End of Year Forfeit Account water that is forfeited at the end of the water year as a result of carryover rules that restrict the carry forward volume.
Carry Forward This represents the account water that is permitted to be carried forward into the next water year as determined by the carryover rules.

Gen
era
l Pur
pose
Wat
er A
ccou
ntin
g R
epor
t 20
10-1
1 –
Low
er
Dar
ling
catc
hmen
t
25 |
NS
W O
ffice
of W
ater
, Aug
ust
201
2
All
oca
tio
n a
cco
un
t b
alan
ce s
um
mar
y fo
r th
er
Dar
ling
Reg
ula
d R
ive
r 2
10-1
1 L
ow
ete
0
Assignments
Extractions
End of
Year
Balan
ce
Licence Category
Share
30 June 2011
Opening
Balan
ce
AWD
Licences
Can
celled
In
Out
Accountable
During
Year
Forfeit
Available
Non
Available
End of
Year
forfeit
Carry
Forw
ard
Domestic and Stock
341
0
349
8
92
0
248
0
248
0
00
Domestic and Stock [Domestic]
422
0
422
0
0
0
284
138
0
138
0
0
Domestic and Stock [Stock]
612
0
612
0
0
0
87
525
0
525
0
0
Local W
ater Utility
10,135
0
10,135
0
0
0
961
0
9,174
0
9,174
0
Regulated River (Gen
eral Security)
78,099
12,197
76,058
1
86,407
95,480
24,782
0
54,399
0
0
54,399
Regulated River (High Security)
7,633
417
7,211
0
67
2,197
1,996
0
3,501.8
0
0
3,502
General Purpose Water Accounting Report 2010-11 – Lower Darling catchment
26 | NSW Office of Water, August 2012
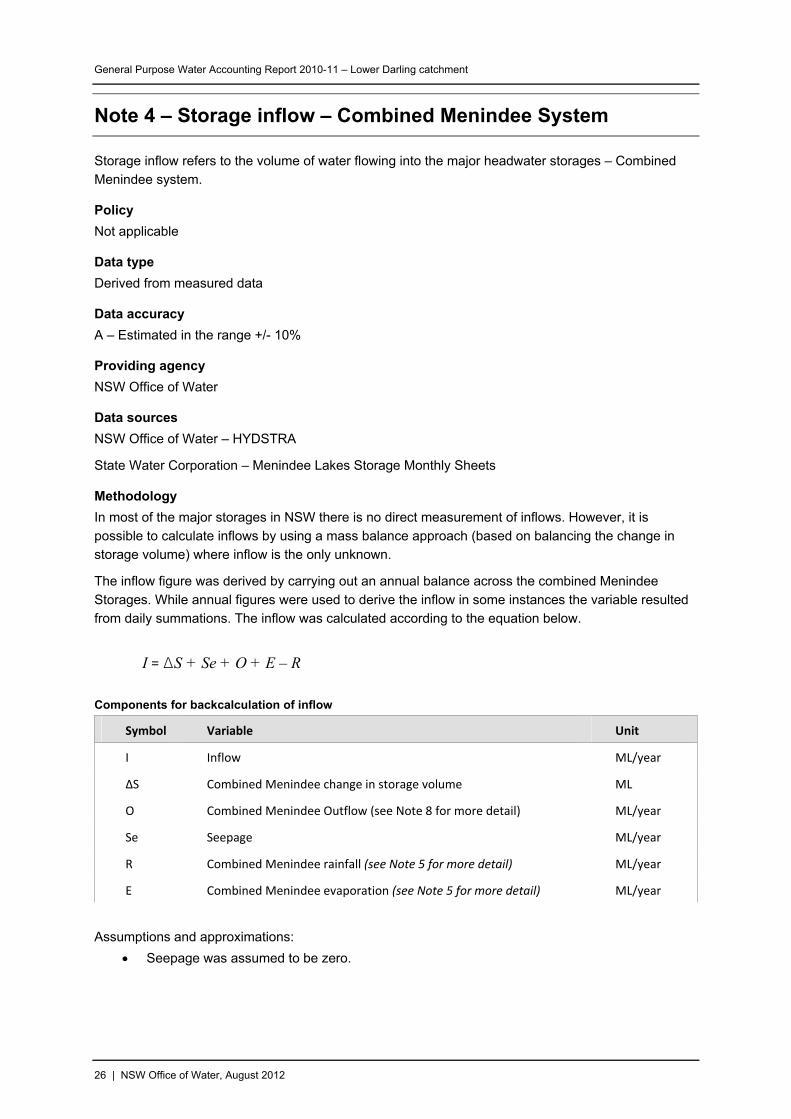
Note 4 – Storage inflow – Combined Menindee System
Storage inflo rs to the volume of water flowing into the major headwater storages – Combined Menindee system.
Polic
Not applicable
Data t
Derive from a
Data accura
A – Estimated in the range +/- 10%
Provi g a n
NSW ater
Data sources
NSW Office of Water – HY
State Water ration – Menindee Lakes Storage Monthly Sheets
Methodology
In most of the major storages in NSW there is no direct measurement of inflows. However, it is
possibl ws by using a mass balance approach (based on balancing the change in stora me) where inflow is the o ly nown.
T i w fi erived by carrying out an annual balance across the combined Menindee
Storages. While annual figures were used to derive the inflow in some instances the variable resulted from daily su cal d according to the equation below.
I = Δ + Se + O + E – R
Components f ation of
w refe
y
ype
d measured dat
cy
din ge
Office of W
cy
DSTRA
Corpo
e to cage volu
nflo
lculate inflon unk
he gure was d
mmation
S
s. The inflow was culate
or backcalcul inflow
Symbol Variable Unit
I Inflow ML/year
ΔS o in ch e in storage volume ML C mb ed Menindee ang
O Combined Me O w (see Note 8 for more detail) ML/year nindee utflo
Se Seepage ML/year
R Combined Menindee rainfall (see Note 5 for more detail) ML/year
E Co ined Menindee ev ration (see Note 5 for more detail) ML/year mb apo
Assumptions and approxim
See g
ations:
pa e was assumed to be zero.

General Purpose Water Accounting Report 2010-11 – Lower Darling catchment
27 | NSW Office of Water, August 2012
Note 5 – Storage evaporation and storage rainfall
This refers to the combined volumetric effective on Lake Wetherell, Lake Pamamaroo, Lake Menindee and Lake Cawndilla that is either lost as a result of evaporation, or gained as a result of rainfall.
easured data
ulas.
r was also applied across the combined Menindee Storage as detailed in the table below. These pan factors were de tion in an internal report prepared by J Hayes and G Wright titled
‘Menind e s – Review of Evaporation Estimates’.
Data type
Derived from m
Policy
Not applicable
Data accuracy
B – Estimated in the range +/- 25%
Providing agency
NSW Office of Water
Data source
NSW Office of Water – HYDSTRA
State Water Corporation – Menindee Lakes Storage Monthly Sheets
Methodology
The calculation of the effect of rainfall and evaporation is carried out by using the following form
Rainfall Volume (ML) = Rainfall (mm) x Area (Ha) / 100
Evaporation Volume (ML) = Pan Evaporation (mm) x Pan Factor x Area (Ha) / 100
These formulas were applied on a daily time step with daily evaporation and rainfall data applied
across the combined Menindee Storage surface area. A seasonally varied Pan Facto
rived after reviewing informa
Lakee
Pan factors utilised for calculation
Storage Pan factor
applied
Jan, Feb, Mar, Dec 0.7
Apr, May, June, July 0.9
Aug, Sep, Oct, 0.8 Nov
General Purpose Water Accounting Report 2010-11 – Lower Darling catchment
28 | NSW Office of Water, August 2012
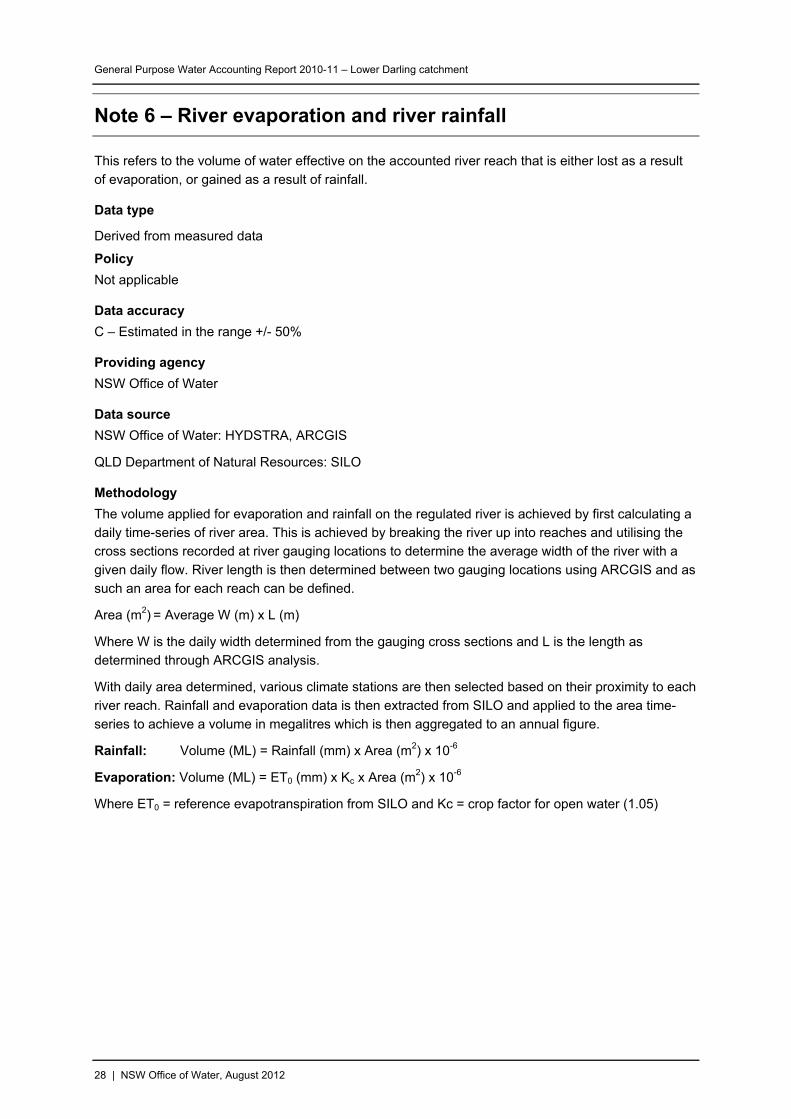
Note 6 – River evaporation and river rainfall
This refers to the volume of water effective on the accounted river reach that is either lost as a result of evaporation, or gained as a result of rainfall.
Data type
Derived from measured data
Policy
Not applicable
Data accuracy
C – Estimated in the range +/- 50%
Providing agency
NSW Office of Water
Data source
NSW Office of Water: HYDSTRA, ARCGIS
daily time-series of river area. Th ver up into reaches and utilising the cros ine the average width of the river with a
give RCGIS and as such an area for each reach can be defined.
ected based on their proximity to each
n data is then extracted from SILO and applied to the area time-series to a eve a volume in megalitres which is then aggregated to an annual figure.
Rainfall: Volume (ML) = Rainfall (mm) x Area (m2) x 10-6
Evap ML) = ET0 (mm) x Kc x Area (m2) x 10-6
Whe vapotransp on from SILO and Kc = crop factor for open water (1.05)
QLD Department of Natural Resources: SILO
Methodology
The volume applied for evaporation and rainfall on the regulated river is achieved by first calculating ais is achieved by breaking the ri
s sections recorded at river gauging locations to determ
n daily flow. River length is then determined between two gauging locations using A
Area (m2) = Average W (m) x L (m)
Where W is the daily width determined from the gauging cross sections and L is the length as determined through ARCGIS analysis.
With daily area determined, various climate stations are then sel
river reach. Rainfall and evaporatiochi
oration: Volume (
re ET0 = reference e irati

General Purpose Water Accounting Report 2010-11 – Lower Darling catchment
29 | NSW Office of Water, August 2012
Note 7 – Talyawalka Creek Inflow
This represents the inflow into the Lower Darling regulated river that occurs downstream of the headwater storages from Talyawalka Creek. This inflow has been estimated modelling as it is not
licable
range +/- 25%
Water
Summar of Talyawalka Creek at Railway Bridge inflow 2009-11
gauged.
Policy
Not app
Data type
Measured data
Data accuracy
B – Estimated in the
Providing agency
NSW Office of
Data sources
NSW Office of Water: IQQM Model
Methodology
The flows are obtained by running IQQM Model for upstream of Menindee Lakes. The model
estimates a flow leaving Talyawalka Creek at Railway Bridge and entering the Darling River downstream of the Lakes.
Additional information
y
Location Volume 2009‐10 (ML) Volume 2010‐11 (ML)
Talyawalka Creek at Railway Bridge 6,258 458,730

General Purpose Water Accounting Report 2010-11 – Lower Darling catchment
30 | NSW Office of Water, August 2012
Note 8 – Dam releases, river inflow from dam releases
The volume of water released from Lakes Wetherell, Pamamaroo, Menindee, Cawndilla. For thethree of these mentioned, in the accounting process this release is represented as both a decreaseasset (of t
first in
he dams) and an equal increase in asset (of the river). For Lake Cawndilla the release which
rling Anabranch is considered as a decrease in outflow only (The anabranch is ded in the GPWAR).
Policy
ble
Data type
Data accuracy
range +/- 10%
Providing agency
ater
Data sources
Water: HYDSTRA
easuring river heights at a gauging station downstream of the dam wall, eights through a rating table that converts them to a daily flow volume. The
sented in the Statement of Changes in Water Assets and Water Liabilities as equal volume of increase in water
asset (water rele easing the volum d ha to account
this as a transfer in asset whereby the volumes would not appear in the statements.
dditional information
Summary of releases, 1 July 2010 to 30 June 2011 (ML)
goes to the Great Danot inclu
Not applica
Measured data
A – Estimated in the
NSW Office of W
NSW Office of
Methodology
The flows are obtained by mand then passing these h
releases have been repreboth a decrease in water asset (water leaving the dam) and an
ased incr e of the river). It woul ve been also possible
A
Storage Release (ML) Increase to River Asset (ML)
Lake Cawndilla 300,710 0
Lake Pamamaroo 342,600
Lake Wetherell ‐ Outlet 481,868
Lake Wetherell – Main Weir 3,704,046
Lake Menindee 395,116
4,923,630

General Purpose Water Accounting Report 2010-11 – Lower Darling catchment
31 | NSW Office of Water, August 2012
Note 9 – End of system flow
This refers to flow that leaves the entity and does not return to the entity. The line item excludes waterleaving the defined accounting extent for replenishment purposes, or water leaving the defined extent for environment purposes supplied from allocated licenced environmental water (these have been
accounted for in separate line items). While the end of system for this GPWAR is considered to be Wentworth, there is no approp
riate data available at this site and therefore the data Burtundy has ed as a substitute.
measured data
e +/- 10%
DSTRA
ed
been us
Data type
Derived from
Policy
Not applicable
Data accuracy
A – Estimated in the rang
Providing agency
NSW Office of Water
Data source
NSW Office of Water – HY
Methodology
The end of system flow is calculated by adding the flows at the specified end of system gauging
stations and then subtracting the proportion of this outflow that can be attributed to either replenishment flow, or held environmental water. The following table summarises the calculation usto assess the end of system flow for the Darling River reporting entity.
System Gauging Station Volume (ML)
Lower Darling 425007 Darling River at Burtundy 3,460,480
End of syst for Darling Ri 1 em flow ver River 2010-1
End of System Flow
0
5,000
10,000
15,000
Jul‐10 Aug‐10 Sep‐10 Oct‐10 Nov‐10 Dec‐10 Jan‐11 Feb‐11 Mar‐11 Apr‐11 May‐11 Jun‐11
Flow (ML/d)
20,000
Darling River at Burtundy

General Purpose Water Accounting Report 2010-11 – Lower Darling catchment
32 | NSW Office of Water, August 2012
Note 10 – Extractions
This refers to the actual volume of water either pumped or diverted from the river or aquifer by
licensed users. A separate figure is given for each licence category.
Data type
Measured data
Policy
Not applicable
Data accuracy
the range +/- 10%
cy
ce of Water – Water Accounting System (Joint ownership of system).
f Water – Water Ordering and Usage database
on data is collected by either on-farm meters that measure extraction or rsion works. Meter readings are collected for individual licence holders at intervals
ed me diverted
ormation and methodologies are required to sep the various licence categ is a description of these:
on f a riods of su r announcements
extractions can be debited against the Supplementary Water Licences.
ace orders for water against an access licence nts in proportion to the orders placed.
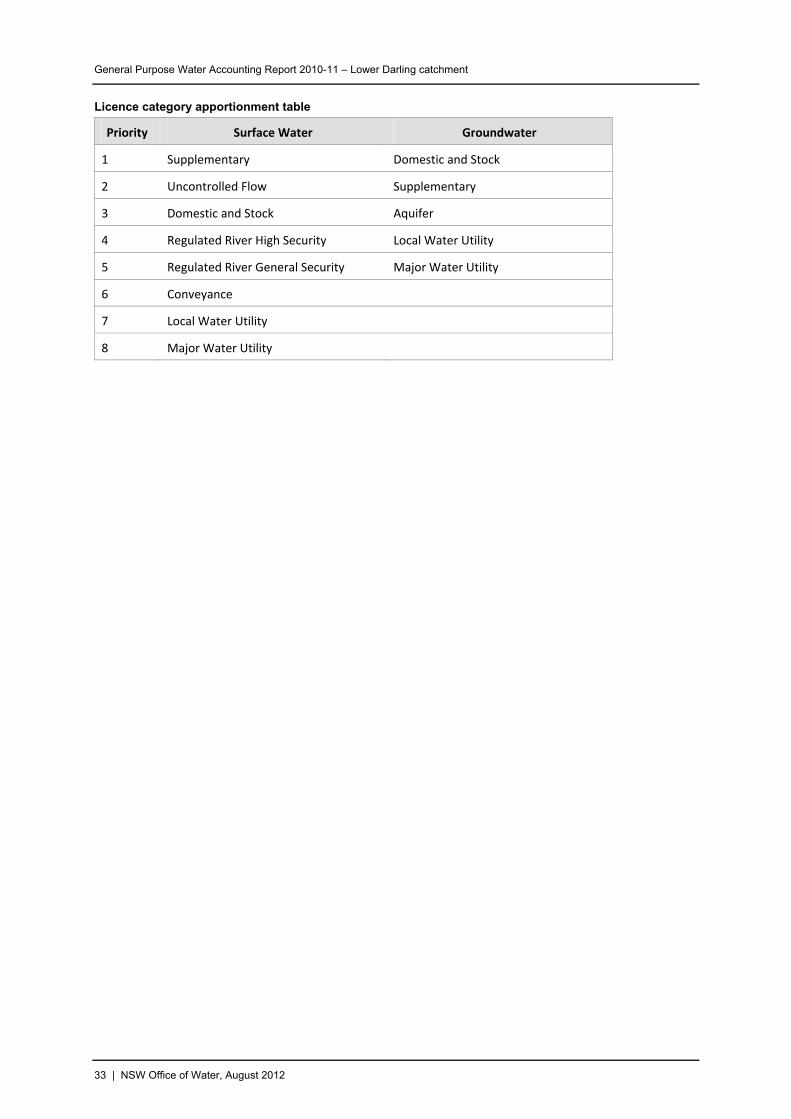
Licence Category Apportionment – if no water orders are available water extracted is
apportioned against categories of access licence in order of priority as set out in the table below. The prioritising is based on the nature and rules around each of the licence categories.
The following table provides the order in which extractions are apportioned to access licence categories. In the table following licensed extractions are apportioned in order of priority starting at
priority 1. This is a generic list where not all categories will necessarily appear in this GPWAR. There are also various sub categories of licence associated with some of the categories.
A – Estimated in
Providing agen
NSW Office of Water
Data source
State Water/NSW Offi
NSW Office o
Methodology
The extraction and diversigauges on dive
during the year and converted via a calibration factor to a volume of water extracted. Water divertfrom the river is measured by recording the height at either the gauge or weir with the volubeing derived by passing these heights through a rating table. However, with multiple categories of
access licences being extracted through the same pumps additional infarate use under ories. Below
Based periods o nnouncement – during pe pplementary wate
Extractions based on water orders – users pland extractions are debited against accou
General Purpose Water Accounting Report 2010-11 – Lower Darling catchment
33 | NSW Office of Water, August 2012
Licence category apportionment table
Priority Surface Water Groundwater
1 Supplementary Domestic and Stock
2 Uncontrolled Flow Supplementary
3 Domestic and Stock Aquifer
4 Regulated River High Security Local Water Utility
5 Regulated River General Security Major Water Utility
6 Conveyance
7 Local Water Utility
8 Major Water Utility

General Purpose Water Accounting Report 2010-11 – Lower Darling catchment
34 | NSW Office of Water, August 2012
Note 11 – Basic rights
This is the n t to extract water to me ts for household purposes (non-comme round the house an r watering of stock. It is available for anyone who has access to river frontage on their property.
This water cannot be used for irrigating crops or garden produce that will be sold or bartered, for w g dow tensive liv
I mes of l rictions domestic and stock use.
D pe
E
Policy
ater Sharing Plan for the New South Wales Murray and Lower Darling Regulated Rivers Water
ources 2003
Part 4 Basic Landholder Rights
o Clause 18 Domestic and stock rights Available on the NSW Office of Water website at www.water.nsw.gov.au
on-licensed righ et basic requiremenrcial uses in and a d garden) and fo
ashin n machinery sheds or for in estock operations.
n ti imited supply, there may be rest on taking water for
ata Ty
stimated
W
S
Data accuracy
C – Estimated in the range +/- 50%
Providing agency
NSW Office of Water
Data source
Water Sharing Plan for the New South Wales Murray and Lower Darling Regulated Rivers Water Sources 2003
Methodology
The estimation of domestic and stock rights uses a series of estimates for water usage, stocking rates,
population and property shape based on local knowledge to calculate riparian (stock and domestic) requirements in megalitres per year. The annual extraction for Domestic and Stock rights in the water accounts is assumed to be the estimated figure stated in the Water Sharing Plan for the New South
Wales Murray and Lower Darling Regulated Rivers Water Sources 2003 (3,727 ML)

General Purpose Water Accounting Report 2010-11 – Lower Darling catchment
35 | NSW Office of Water, August 2012
Note 12 – Available Water Determination (AWD)
This is the process by which the regulated surface water asset available for use within the regulatesystem is determined and shared. It determines the volume of water that is to be added to an individuals licence allocation account. Announcements of alloca
d
tions are made on a seasonal basis -
Derived from measured data.
Water Sharing Plan for the New South Wales Murray and Lower Darling Regulated Rivers Water 3.
– Limits to the availability of water
rminations.
www.water.nsw.gov.au
usually corresponding with the financial year and are updated on a regular basis or following significant inflow events.
Data type
Policy
Sources 200
Part 8
o Division 2 – Available Water Dete
Available on the NSW Office of Water website at
ata accuracy
NSW Office of Water.
State Water/NSW Office of Water – Water Accounting System (Joint ownership of system).
D
A1 – Nil inaccuracy +/- 0%
Providing agency
Data source
Available Water Determination Register - NSW Office of Water website at www.water.nsw.gov.au
ure itself is generally divided into two sections; the available water asset, and system
Methodology
The AWD procedcommitments. Once system commitments have been met the available water asset is then available
for distribution to the access licence categories in order of priority (see following table). The volume of the announced allocation is expressed as the percentage of share component of the licence.
Priority of access licence categories
Licence Category AWD Priority
General Security Low
High Security High
Conveyance Low
Domestic and Stock* Very High
Local Water Utility Very High
Note: Domestic and Stock is further broken down into three sub categories: Domestic and Stock, Domestic and Stock (Domestic) and Domestic and Stock (Stock). For the purposes of this report and the general purpose water account they were all treated as Domestic and Stock.
Available Water Asset – this is calculated by summing the water currently available in storage, future (minimum) inflows to the system, and additional volumes due to recessions of inflows from the current

General Purpose Water Accounting Report 2010-11 – Lower Darling catchment
36 | NSW Office of Water, August 2012
levels to the minimum inflow levels. Also taken into consideration is the reductiothe system for those that arrive too late in the season to be useful.
n of the total inflows to
System Commitments – this is an assessment of the existing commitments that have to be delivered
from the Available Water Asset in either the current or future years. Key components include:
essential supplies include things such as town water supplies, stock and domestic
requirements, industrial use and permanent plantings (e.g. orchards, vineyards) and environmental allowances
delivered account water is the water that is already in accounts that is yet to be provided
uirement is an estimate of the flow that to pass through the system as a result of operation of the system
losses which are estimated as the amount of water that will be lost by the system either
ce accounts is a separate process and is not depe start of the year and unless there is a
the maximum value
prescribed in the plan generally 100 per cent of share component. Therefore it is not considered to n the system and is only considered in terms of an extraction that reduces the water
tion
ntain the allocation summary reports for 2010-11. Below is a table containing
rt.
un
end of system flow req
through evaporation or in the process of delivering the water via transmission losses
It should be noted that the AWD for supplementary licenndent on water asset available. It is made once at the
management change due to the growth in use strategy it is maintained at
create a liability oasset.
Additional informa
The following pages co
report notes to help interpret the repo
Allocation Summary Report Notes
Opening Remaining allocation account balances at the conclusion of the
previous season that is allowed to be carried forward to this season.
Individual Announcement Actual announcement made to each licence category
Share Component (Entitlement) Sum of the licensed volume of water within the licence category on
the announcement date.
Announced Volume result
Volume of water credited to accounts within a licence category as a
of the announcement made.
CumulativeCum the announced volumes for the water year and
licence category. Volume
ulative total of
Percent of Sha
(Entitlement)
re Component his is the announced volume expressed as a percentage of the
applicable on the particular date.
T
entitlement
Balance Made Available Sum of water available in allocation accounts that has been made
le to be taken during the season. availab
Non Available Balance allocated that is not accessible at this point in time. Water
Supplementary Water Water that is not a stored source of water and is only made available
if an uncontrolled flow event occurs.
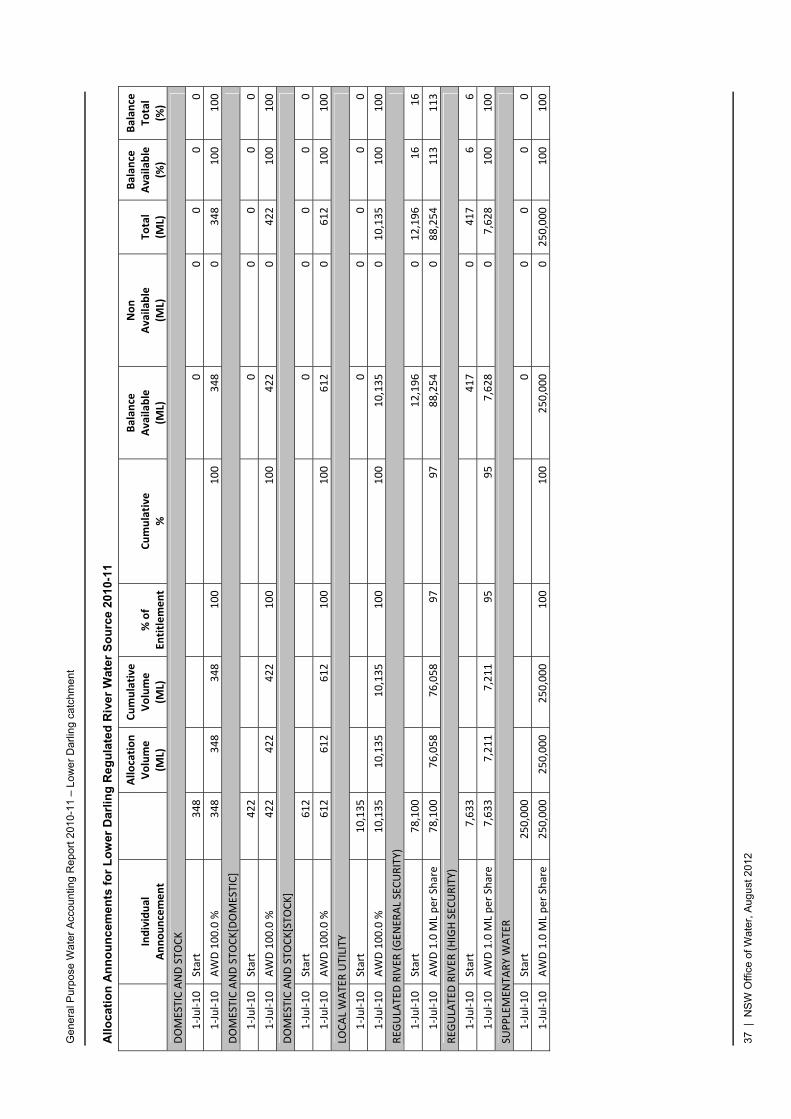
Gen
era
l Pur
pose
Wat
er A
ccou
ntin
g R
epor
t 20
10-1
1 –
Low
er
Dar
ling
catc
hmen
t
37 |
NS
W O
ffice
of W
ater
, Aug
ust
201
2
All
oc
ion
n
en
tsg
ula
d R
ivr
Wa
r S
ou
rc 2
010-
11
Indivi
l un
ent
Allo
cati
Volum
(ML)
Cu
lative e
ent
atA
no
un
c
Anno
me dua
cem
fo
r L
ow
er D
a
rlin
g R
ete on
e
e mu
Volum
(ML)
te
e
% of
Entitlem
Cumulative
%
Balan
ce
Available
(ML)
Non
lable
(ML)
Avai
Total
(ML)
Balan
ce
Available
(%)
Balan
ceTo
tal
(%)
DOMESTIC AND
STOCK
1‐Jul‐10
Start
348
0
0
0
0
0
1‐Jul‐10
AWD100.0
348
348
100
%
348
100
348
0
348
100
100
DOMESTIC AND STO
CK[DOMESTIC]
1‐Jul‐10
Start
422
0
0
0
0
0
1‐Jul‐10
AWD 100.0 %
422
422
422
100
100
422
0
422
100
100
DOMESTIC AND STO
CK[STO
CK]
1‐Jul‐10
Start
612
0
0
0
0
0
1‐Jul‐10
612
612
100
AWD 100.0 %
612
100
612
0
612
100
100
LOCAL WATER UTILITY
1‐Jul‐10
0
Start
10,135
0
0
0
0
1‐Jul‐10
100
AWD 100.0 %
10,135
10,135
10,135
100
10,135
0
10,135
100
100
REG
ULATED RIV
(GEN
ERAL
ER
SECURITY)
1‐Jul‐10
Start
78,100
12,196
0
12,196
16
16
1‐Jul‐10
ML
97
AWD 1.0
per Share
78,100
76,058
76,058
97
88,254
0
88,254
113
113
REG
ULATED RIVER
(HIGH SEC
URITY)
1‐Jul‐10
Start
7,633
417
0
417
6
6
1‐Jul‐10
ML
95
AWD 1.0
per Share
7,633
7,211
7,211
95
7,628
0
7,628
100
100
SUPPLEMEN
TARY WATER
1‐Jul‐10
Start
0
250,000
0
0
0
0
1‐Jul‐10
AWD
ML
Share
250,000
100
1.0
per
250,000
250,000
100
250,000
0
250,000
100
100

General Purpose Water Accounting Report 2010-11 – Lower Darling catchment
38 | NSW Office of Water, August 2012
Note 13 – Temporary Trading/Allocation assignments
This represents the mpora rading locatio ts) of ter eit between allocation accou hin the regulated Lower Darling system (internal trading) or trading between the southern connected valleys or the Murray Darling Basin (external). External allocation assignments may be
betwee the r so with W o
Data type
Administration
Polic
Wate g Plan for the NSW Murray and Lower Darling Regulated River Water Sources 2003
Part 10 Access licence dealing rules
o Claus ons
Avai n the NS Office Water w.water.ns . .
te ry t (al n assignmen wa hernts wit
n ano r wate urce in NS r another state
y
r Sharin
e 50 rules
W
relating to c
of
traints wi
ww
thin a water source
govlable o website at w au
Murr g Basin Agreement Protocol 2010
Schedule D — Permissible Transfers between Trading Zones
o Part 6 rict s on tr ers
Data ac cy
A1 – Nil inaccuracy +/- 0%
Providing agency
NSW Office of Water
Da
State Water/NSW Office of Water – Water Accounting System (Joint ownership of system).
Water Ord ng and Usag databa
Metho y
T nal trade for each licence category is zero for a water year. In order to display the trade information within the statements an internal trade is represented as both (sell liabili creas uyer ater).
External trading is represented by either increa g (trad into the Lower rling from an external water urce) o creasi (tradi rom th ower ling to an exter water source) the associated licence eg ilit
Additional information
The tables below shows the temporary trading figures between licence categories for the Lower
Darling. All figures represent a volume in megalitres.
ay Darlin
Rest ion ansf
cura
ta sour
he
ce
eri e se
dolog
net intera water liability decrease
er of water) and the equivalent wa
so
ter ty in
sin
e (b
ing
of w
Dar de ng ng f e L Dar nal
cat ory liab y.
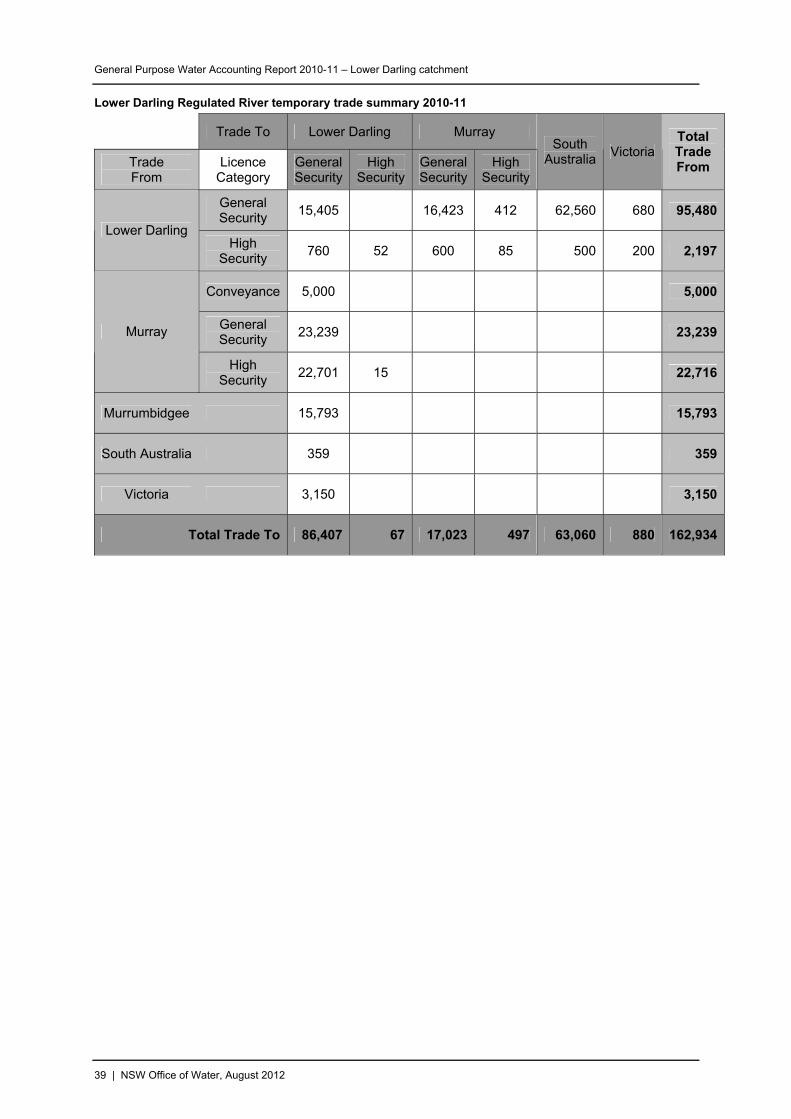
General Purpose Water Accounting Report 2010-11 – Lower Darling catchment
39 | NSW Office of Water, August 2012
Lower Darling Regulated River temporary trade summary 2010-11
Trade To Lower Darling Murray
Trade From
Licence Category
GeneralSecurity
High Security
GeneralSecurity
High Security
South Australia
VictoriaTotal Trade From
General Security
15,405 16,423 412 62,560 680 95,480
Lower Darling High
Security 760 52 600 85 500 200 2,197
Conveyance 5,000
5,000
General Security
23,239 23,239Murray
High Security
22,701 15 22,716
Murrumbidgee 15,793 15,793
South Australia 359 359
Victoria 3,150 3,150
Total Trade To 86,407 67 17,023 497 63,060 880 162,934

General Purpose Water Accounting Report 2010-11 – Lower Darling catchment
40 | NSW Office of Water, August 2012
Note 14 – Unaccounted difference
In theory if all the pro a w nc d b tely nt teddiffere uld be lit he c i f the volumes presented in the accounts, the var es from which the data has been obtained and the fact that not all
processes of the wat ave counted, the statements t ba t the f a ss. In to balance the accounts a final balancing entry is required, and this is termed the unaccoun nce. chnol progre and accuracy impr n
estimates, it is anticipated that relatively, this figure should reduce in future accounts.
Data type
Not a
Policy
Not applicable
D
D – Estimated in the range +/- 100%
P
Not applicable
Data source
Not applicable
Methodology
For surface water the unaccounted difference is equal to the amount required to obtain the correct volume in river at the end of the reporting period, after all the known physical inflows and outflows have been accounted. The double-entry accounting process attempted to represent the physical
movement of water by creating a river asset. The opening and closing balance of the river volume was estimated according to Note 2.
Surface Water Unaccounted difference
UVSW = Rs – Rc + RI ‐ Ro Where:
UVSW = Unaccounted difference for Surface Water Rs = Opening river volume estimate Rc = Closing river volume estimate Ro = Physical outflows from the river (e.g. extractions) RI = Physical inflows to the river (e.g. runoff, dam releases)
cesses ofzero. In rea
ater balay due to t
e coul large un
e accuraertainties
accoun many o
ed for the unaccoun nce wo
ious sourc
er cycle h been ac are no lanced a end o the ccounting proce order
ted differe As te ogy sses oves in the accou t
pplicable
ata accuracy
roviding agency

General Purpose Water Accounting Report 2010-11 – Lower Darling catchment
41 | NSW Office of Water, August 2012
Note 15 – Held environmental water
This represents environmental water that is held as part of a licensed volumetric entitlement. These licences are held within the same licence categories as all other water access licences hence are subject to the same operating rules. Therefore they are subject to the following key rules:
Available Water Determinations (AWD) for their share of the entitlement to be added to accounts
Carryover rules hence the forfeiting of unused water that cannot be carried over
ovide water orders prior to use.
are used to provide environmental benefit and outcomes to the catchment by either to, or supplementing water requirements of, a specific environmental events or
s.
Act 2000
s with access licences (Division 4)
1G Assignment of water allocations between access licences.
lan for the NSW Murray and Lower Darling Regulated River Water Sources 2003
NSW Office of Water website at www.water.nsw.gov.au
Pr
These licences providing water
incident
Data type
Measured
Policy
Water Management
Dealing
o 7
Water Sharing P
Available on the
State Water/ r Accounting System (Joint ownership of System).
Water Determination Register - NSW Office of Water website at www.water.nsw.gov.au
Data accuracy
A – Estimated in the range +/- 10%
Providing agency
NSW Office of Water
Data source
NSW Office of Water – Wate
Available
epresents a volume of water in corresponding allocation remaining volume of held environmental
s and forfeit rules have been applied to the accounts. These environmental balances are at the licence category level and represent the water that can be carried forward for use in the next year. Below is list of typical transactions that can apply
to an environmental allocation account:
AWD (including pro rata of AWD for new licences)
Licensed extractions
Forfeiture due to:
o Carryover rules
o Account spillage as a result of AWD
o Licence conversions
Methodology
The water held for the environment raccounts. This allocation account represents the sum of the
water at the conclusion of the water year once all transaction

General Purpose Water Accounting Report 2010-11 – Lower Darling catchment
42 | NSW Office of Water, August 2012
o Excess orders (where water order debiting is i
n place)
Licence conversion
ent of environmental entitlement both in number of entitlements, and volume.
tion
-11.
t summary
Trade of allocation water between accounts
In addition the trade and purchase of environmental water is tracked to capture the movem
Additional informa
The table on the following page provides a summary of held environmental water for 2010
Explanatory information for allocation accoun
Heading Description
Share This is the total volume of entitlement in the specific licence category.
Opening The volume of water that has been carried forward from previous years allocation account.
AWD The total annual volume of water added to the allocation account as a result of allocation assessments.
New Increase in account water as a result of issuing new access licences Licences
Cancelled Decrease in account water as a result of licence cancellation
In Increase in account water as a result of temporary trade in. Assignments
Out Decrease in account water as a result of temporary trade out.
Extractions Accountable Volume of water that is extracted or diverted from the river under controlled river conditions and is accountable against the licence.
During Year Forfeit This is a decrease in the available account balance dueto mid year forfeits that may be triggered by things such as licence subdivisions or other dealings.
End of Year Balance Account balance that is available to be taken at the conclusion of the water year.
End of Year Forfeit Account water that is forfeited at the end of the water year as a result of carryover rules that restrict the carry forward volume.
Carry Forward forward into the next water year as determined by the carryrules.
This represents the account water that is permitted to be carried over

Gen
era
l Pur
pose
Wat
er A
ccou
ntin
g R
epor
t 20
10-1
1 –
Low
er
Dar
ling
catc
hmen
t
43 |
NS
W O
ffice
of W
ater
, Aug
ust
201
2
Lo
wer
Dar
ling
Reg
ula
ted
Riv
er
En
viro
nm
enA
cco
un
t S
um
mar
y 20
1 ta
l 10
-1
Lower Darlin
g En
vironmental A
ccount
Summary Data 2010/11
Assig
men
tsn
Extractions
End of Year
Balan
ce
Licence Category
Share
30/
11
6/
CO In
AWD
Licences
Can
celled
In
Out
Accountable
During
Year
Forfeit
Available
Forfeit
End of Year
Carry
Forw
ard
REG
ULATED RIVER
(GEN
ERAL
SECURITY)
48,292
0
47,800
5,0
52,
00
0
0
00
80
0
0
0
REG
ULATED RIVER
(HIGH SEC
URITY)
500
0
500
00
0
0
0
50
0
0
0
SUPPLEMEN
TARY WATER
250,000
0
250,000
0
0
0
0
0,
0
25
000
250,000
0
Ch
ang
e in
hel
d e
nvi
ron
men
tal w
ater
201
0-1
1
As at 30/6/2010
As at 30/6/2011
Differences
No.
Licences
Volume
No.
Licences
Volume
No.
Licences
Volume
4
47,800
5
48,292
149
2
2
500
2
500
0
0
2
250,000
2
250,000
0
0
General Purpose Water Accounting Report 2010-11 – Lower Darling catchment
44 | NSW Office of Water, August 2012
Note 16 – Unregulated Effluent to Great Darling Anabranch
This figure is water that leaves the main Darling River, in high flow events via an effluent offtake approximatel half way betwe dee and Pooncarie.
Data typ
Calculated sured data
Polic
N/A
Data urac
A – Est te n the g
Provid cy
NSW Office of Water
Data source
HYDST
Methodology
Information from field obse dicates that once flow in the Darling River exceeds approximately
16,000 ML, water will begin to flow out the effluent. This volume was estimated by taking the difference between the outflow from Lake Cawndilla and the gauge on the Great Darling Anabranch at Wycot (425013), during periods where the flow at the Darling River at Great Anabranch Offtake
exceeds 16,000 ML. i.e. there is no data available measuring the direct offtake, however the effluent enters the an nch between Lake Cawndilla and the Wycot gauge.
y
e
from mea
en Menin
y
acc y
ima d i
ing agen
ran e +/- 10%
RA
rvations in
abra
General Purpose Water Accounting Report 2010-11 – Lower Darling catchment
45 | NSW Office of Water, August 2012
Note 17 – Environmental provisions
There a number of planned environmental provisions for the Lower Darling catchment implementunder the water sharing plan, with the aim of enhancing env
ed ironmental benefits.
extraction limit is set in place that ensures the growth in diversions is contained and the
ule F of the Murray Darling Basin agreement are maintained. Should ns exceed this limit provisions are in place to implement a reduction
ailable water determinations until the average diversions are bought back under the required
tes the requirement for a Lower Darling Environmental Contingency Allowance water credited at any time shall be zero if the volume stored in
Menindee Lakes is below 480,000 ML or has not risen above 640,000 ML since it last fell below ter allowing for NSW licensed requirements the account will be maintained at
usage that has occurred in that water year. The water is typically used to target
blue-green algae and other associated water quality issues in the Lower Darling
makes provisions for held environmental which has been previously detailed in note 15 R.
3
Clause 15 Planned Environmental Water
Available on the NSW Office of Water website at www.water.nsw.gov.au
A long term
requirements set out under schedlong term average annual diversioin the av
limit.
The plan also sta(Lower Darling ECA). The volume of
480,000 ML. Else af30,000 ML minus any
The plan alsoof this GPWA
Data type
Measured/Administration
Policy
Water Sharing Plan for the NSW Murray and Lower Darling Regulated River Water Sources 200
Part 3 Environmental Water Provisions
Data accuracy
A1 – Nil inaccuracy +/- 0%
Providing agency
NSW Office of Water
Data source
Not Applicable
Methodology
Based on rules in the Water Sharing Plan (as detailed in Policy above) and advice that no usage has occurred against the ECA since the Plan commenced.
Additional Information
Summary of ECA account balance (figures in ML)
Provision Water Year
Opening Balance
Water Credited
Usage Balance End of Year
2009-10 30,000 0 0 30,000 ECA
2010-11 30,000 0 0 30,000
General Purpose Water Accounting Report 2010-11 – Lower Darling catchment
46 | NSW Office of Water, August 2012
General Purpose Water Accounting Report 2010-11 – Lower Darling catchment
46 | NSW Office of Water, August 2012
Lower Darling River
Assurance Statement
water account t
ter will not be providing an Assurance Statement for the 2010-11 water account. It should be for
An Assurance Statement is required under the ED AWAS 1 for a general purposewhich states that the accounts were prepared in accordance with the ED AWAS 1. It is a requiremen
that this be provided by an appropriately qualified assurance provider independent of the water reporter and it management and governing body.
An assurance framework has yet to be provided under the ED AWAS 1 and in lieu of it the NSW Office
of Wanoted that at the time of publication WASB is in the process of developing an assurance standardwhich more details can be obtained from the WASB website.

General Purpose Water Accounting Report 2010-11 – Lower Darling catchment
47 | NSW Office of Water, August 2012
References BOM 2010, Pilot National Water Accou
WASB 2010, Exposure Draft of Au
nt, Bureau of Meteorology
stralian Water Accounting Standard 1 Preparation and Presentation of General Purpose Water Accounting Reports (ED AWAS 1), Bureau of Meteorology