general management for science, art, management - ahec
TRANSCRIPT

\
Teachers Manual
GENERAL MANAGEMENT
For
Science, Art, Management and Other Post Graduate Courses
For Department of Technical Education Govt. of Uttarakhand
ALTERNATE HYDRO ENERGY CENTRE INDIAN INSTITUTE OF TECHNOLOGYR, ROORKEE
August 2007

1
Chapter 1
GENERAL MANAGEMENT

2
GENERAL MANAGEMENT
SCOPE OF THE COURSE After reading chapter 1, you should be able to:
Understand the fundamental characteristics of organization
List the responsibility of each type of managers Understand the evolution of management Outline all approaches of management Explain the processes of management Explain the functions of management

3
INTRODUCTION 1.1 Organization
Organization defined generally as “Two or more people who work together in a
structured way to achieve a specific goal or set of goals”. For instance, colleges or
universities, hotels and your neighborhood grocery stores are all an organizations. These
are all organizations because they all share three common characteristics namely distinct
purpose, systematic structure and people.
Ref: Robbins and Coulter (2004)
Fig 1.1: Characteristics of Organizations
Any organization has a purpose to start business. This is typically expressed in terms of
goal or set of goals. Organization is totally composed of people like workers to top
managers. Fig 1.1 shows the characteristics of organizations. If people involved in the
Distinct purpose
Systematic structure
People

4
organization, assigning responsibility and authority to people arise naturally. Who will
lead the team? And who shall report to the top management? systematic structure in
organization answers these questions. It involves creating rules and regulations,
identifying some members as leader and giving them authority over other workers.
The organization refers to an entity that has a distinct purpose includes people or
members and has a systematic structure. Organizations are broadly classified into two
namely formal and informal.
A formal organization is a stable set of a description of the organization structure and the
rules like policies, regulations and procedures that make up an organization.
The army and large corporations are structured very formally for an instance.
The informal organization is a concept in management practice that denotes the network,
unrelated to the firm’s formal authority structure. It is the aggregate of personal and
social relationships that arise spontaneously as people associate with one another
environment.
The informal organization can make the formal organization more effective by providing
support to management, stability to the environment and useful communication channels.
To begin with a simple example, this kind of relationship may exist entirely within a
given institution as when a board or council elite group may have an informal, private
existence, as well as its public, official, institutionalized existence. When the councilors
of corporation , for example, meets informally at the mayor’s home or gathers for a
dinner at the hotel, this organization becomes an informal organization. The relationship
between formal and informal becomes easier to understand while introducing an
influential figure, not member of the institutional group, who come in to the lunch,
dinner, or gathering of friends and play a part in policy making, the interrelationship
begins to be more complex. Here we can say that informal groups representing
combinations of formal.

5
1.2 Goal
Goal is generally mentioned as the purpose that an organization strives to achieve.
Organizations often have more than one goal and goals are fundamental elements of
organizations.
Organizations must also acquire and allocate the resources necessary to achieve their
goals. All organizations depend on other organizations for their need. A cricket team
cannot play without the required equipment.
1.3 Management
James Stonner et.al (2003) defined the management as
“The process of planning, organizing, leading and controlling the work of organization
members and of using all available resources to reach stated organizational goals”.
All organizations have people who are responsible for helping them to achieve their
goals. These people are called managers. Managers are responsible for directing the
efforts made by all in the organization aimed at helping organizations achieving goals.
All managers in all organizations have the same basic responsibility without considering
type of organization. Manager who manages work, leads people and achieves results
through their efforts.
1.4 Management is subject to time and human relationships
Management is dealing with matters of time and human relationships. The several
elements of time in organizations are:
• Keeping in mind the past and present, management attempts to forecast the future.
• Management produces consequences and effects over time.
The importance of human relationships also involves
• Managers keep the relationships in which each one is influenced by other.
• Managers try to deal all the activities simultaneously related others.
1.5 Managerial performance

6
How successfully an organization achieves its objectives and satisfies social
responsibilities?. This is depends on its managers. If managers do their jobs well an
organization will certainly achieve its objectives or goals. This is based on the managerial
performance. It is a measure of how efficient and effective a manager is. This is
discussed in detail in the next section. And also how well managers determine and
achieve appropriate objectives.The managerial performance is often confused with
organizational performance which is a measure of how efficient and effective an
organization is and how well organization acheives its objectives.
1.6 Efficiency and Effectiveness
Efficciency, the ability to do things right- is an input-output concept. An efficient
manager is one who acheives outputs that measure up to the inputs like labor, materials
and time used to achieve them.Effecient manager who is able to minimize the cost of the
resources needed to achieve goals.
Effectiveness involves choosing right goals. A manager is called as inefficient manager
when he/she selects an inappropriate goal. For an instance, if a manager produce large
cars while small cars are in demand.
1.7 Types of managers
Typically, there are three levels of management in organizations:
• Top-level
• Middle-level
• First-level
The above three levels of managers form a hierarchy, in which they are ranked in order of
importance. In most organizations, the number of managers at each level is such that the
hierarchy resembles a pyramid, with many more first-level managers, fewer middle
managers, and the fewest managers at the top level.
Each of these management levels is described below in terms of their possible job titles
and their primary responsibilities and the paths taken to hold these positions.

7
Additionally, there are differences across the management levels as to what types of
management tasks each does and the roles that they take in their jobs.
Fig 1.2: Types of Managers
1.7.1 Top-Level Managers
Top-level managers are also called as senior management or executives. These
individuals are at the top one or two levels in an organization. The functions of the top
managers are setting goals for the organization rather directing the day-to-day activities
of the firm and direct the company to achieve them. Ultimately they are responsible for
the overall performance of the organization so their decisions affect the whole firm.
In most organizations they have a great deal of managerial experience and they have
promoted through the ranks of management within the company. An exception to this is a
top manager who is also an entrepreneur; such an individual may start a small company
and manage it until it grows enough to support several levels of management.
Some top managers may be hired from other top management positions in other
companies. Conversely, they may be promoted from within and groomed for top
management with management development activities, coaching, and mentoring.
Succession planning is very helpful to identify high potential managers for top level.

8
The well known titles of such positions are Chief Executive Officer, Chief Financial
Officer, Chief Operational Officer, Chairperson of the Board, President and Vice
president.
1.7.2 Middle-Level Managers
Middle-level managers are responsible for carrying out the goals set by top management.
They do so by setting goals for their departments and other business units. Middle
managers can motivate and assist first-line managers to achieve business objectives. They
may also communicate upward, by offering suggestions and feedback to top managers.
Because middle managers are more involved in the day-to-day workings of a company,
they may provide valuable information to top managers to help improve the
organization's bottom line. They include all levels of management between the
supervisory level and the top level of the organization.
Jobs in middle management vary widely in terms of responsibility and salary. Depending
on the size of the company and the number of middle-level managers in the firm, middle
managers may supervise only a small group of employees such as an entire business
location. Middle managers may be employees who were promoted from first-level
manager positions within the organization, or they may have been hired from outside the
firm.
The well known titles of such positions are General Manager, Plant manager, Regional
manager, and Divisional manager.
1.7.3 First-Level Managers
First-level managers are also called first-line managers or supervisors. These managers
have job titles such as: Office manager, Shift supervisor, Department manager, Store
manager. First-line managers are responsible for the daily management of line workers -
the employees who actually produce the product or offer the service. There are first-line
managers in every work unit in the organization. Although first-level managers typically
do not set goals for the organization, they have a very strong influence on the company.

9
These are the managers that most employees interact with on a daily basis and if the
managers perform poorly employees may also perform poorly may lack motivation.
In the past, most first-line managers were employees who were promoted from line
positions (such as production or clerical jobs). Rarely did these employees have formal
education beyond the high school level. However, many first-line managers are now a
three year bachelor's degree graduate. In Fig 1.2, last two levels indicate these managers.
They are many in number in an organization but authority given to them is less.
THE EVOLUTION OF MANAGEMENT The management functions planning, organizing, leading and controlling activities have
existed for thousands of years. The evidence of such organized endeavors are the
Egyptian pyramids and the Great wall of china. More than 1,00,000 people involved in
the construction of a pyramid for twenty years. Who directed each one what to do? Who
ensured there would be enough stoned at the site to keep all workers busy? Management
is the answer to such questions. Fig 1.3 shows the development of most management
theories.
1.8 THE HISTORICAL CONTEXT OF MANAGEMENT
Social forces are the norms and values that characterize a culture. Early social forces
allowed workers to be treated poorly; however, more recent social forces have provided

10
for more acceptable working conditions for workers. Social forces have influenced
management theory in areas such as motivation and leadership.
Economic forces are the ideas behind the concept of a market economy such as private
ownership of property, economic freedom, competitive markets and a limited role for
government.
Political forces such as governmental regulations play a significant role in how
organizations choose to manage themselves. Political forces have influenced management
theory in the areas of environmental analysis, planning, control, organization design, and
employee rights.
1.9 THE CLASSICAL PERSPECTIVE
1.9.1 Scientific management
Scientific management focuses on ways to improve the performance of individual
workers. Some of the major contributors are:
Frederick W. Taylor saw workers deliberately working under their potential and
designed a 4-step method to overcome this problem.
Taylor’s principles of scientific Management
• The development of a science for each element of a man's work to replace the old
rule-of-thumb methods.
• The scientific selection, training and development of workers instead of allowing
them to choose their own tasks and train themselves as best they could.
• The development of a spirit of hearty cooperation between workers and
management to ensure that work would be carried out in accordance with
scientifically devised procedures.
• The division of work between workers and the management in almost equal
shares, each group taking over the work for which it is best fitted instead of the
former condition in which responsibility largely rested with the workers. Self-
evident in this philosophy are organizations arranged in a hierarchy, systems of
abstract rules and impersonal relationships between staff.

11
Frank and Lillian Gilbreth were associates of F.W Taylor. The Gilbreths, had
experience in unionized industry. In Frank Gilbreth's early career, he was interested in
standardization and method study.
While bricklaying at construction sites, no two bricklayers used exactly the same method
or set of motions, he tried to find an improved method.
The result was that he was able to raise output from 1000 to 2700 bricks per day.
From their various studies the Gilbreths developed, the laws of human motion from
which evolved the principles of motion economy.
They coined the term 'motion study' to cover their field of research and distinguished it
with 'time study'; it is a technique that they believed should always precede method study.
The use of the camera in motion study stems from this time and the Gilbreths used micro-
motion study in order to record and examine detailed short-cycled movements as well as
inventing cyclographs and chronocycle graphs to observe rhythm and movement.
Henry Gantt, the third well-known pioneer in the early days of scientific management
worked for F.W.Taylor in USA and is to be remembered for his humanizing influence on

12
Ref: Robbins and Coulter (2004)
Fig 1.3: Development of major management theories
Development of Management Theories
The early years Classical theorists
The early years HR approach
The early years Quantitative approach
Scientific Management
Recent years Integrative approach
General administrative theorists
Early advocates
Hawthrone studies
Human relations movement
Behavioral science theorists
Operations Research
Management Science
Process
Systems
Contingency
Historical background- Preclassical contribution

12
management, emphasizing the conditions that have favorable psychological effects on the
worker.
Gantt chart
The Gantt chart is a visual display chart that shows the relationship between work
planned and completed on one axis and time elapsed on the other.
1.10 GENERAL ADMINISTRATIVE THEORISTS
Administrative management focuses on managing the total organization.
Henri Fayol was the first to identify the four management functions such as Planning,
Organizing, Leading and Controlling and he developed guidelines for managers to
follow. These guidelines form fourteen principles for effective management.
1. Division of Work. Specialization provides the individual to build up experience,
continuous improvement in skills. Thereby he can be more productive.
2. Authority. The right to issue commands, along with which must go the balanced
responsibility for its function.
3. Discipline. Employees must obey, but this is two-sided: employees will only obey
orders if management play their part by providing good leadership.
4. Unity of Command. Each worker should have only one boss with no other
conflicting lines of command.
5. Unity of Direction. People engaged in the same kind of activities must have the
same objectives in a single plan. This is essential to ensure unity and coordination
in the enterprise. Unity of command does not exist without unity of direction but
does not necessarily flows from it.
6. Subordination of individual interest (to the general interest). Management must
see that the goals of the firms are always paramount.
7. Remuneration. Payment is an important motivator although by analyzing a
number of possibilities, Fayol points out that there is no such thing as a perfect
system.
8. Centralization (or Decentralization). This is a matter of degree depending on the
condition of the business and the quality of its personnel.

13
9. Scalar chain (Line of Authority). A hierarchy is necessary for unity of direction.
But lateral communication is also fundamental, as long as superiors know that
such communication is taking place. Scalar chain refers to the number of levels in
the hierarchy from the ultimate authority to the lowest level in the organization. It
should not be over-stretched and consist of too-many levels.
10. Order. Both material order and social order are necessary. The former minimizes
lost time and useless handling of materials. The latter is achieved through
organization and selection.
11. Equity. In running a business a ‘combination of kindliness and justice’ is needed.
Treating employees well is important to achieve equity.
12. Stability of Tenure of Personnel. Employees work better if job security and
career progress are assured to them. An insecure tenure and a high rate of
employee turnover will affect the organization adversely.
13. Initiative. Allowing all personnel to show their initiative in some way is a source
of strength for the organization. Even though it may well involve a sacrifice of
‘personal vanity’ on the part of many managers.
14. Esprit de Corps. Management must foster the morale of its employees. He
further suggests that: “real talent is needed to coordinate effort, encourage
keenness, use each person’s abilities, and reward each one’s merit without
arousing possible jealousies and disturbing harmonious relations.”
Max Weber outlined the concept of bureaucracy based on a rational set of guidelines for
structuring organizations in the most efficient manner. Bureaucracy is a system
characterized by division of labor, a clearly defined hierarchy, detailed rules and
regulations and impersonal relationships.
1.11 THE HUMAN RESOURCES APPROACH
1.11.1 Early Advocates
There are four individuals recognized the importance of human factors stand out as early
advocates of this approach.

14
Robert Owen argued that money spent on improving labor was one of the best
investments that business executives could make. And he claimed that showing concern
for employees was highly profitable for management and would relieve human misery.
He proposed an ideal workplace where working hours would be regulated, child labor
would be banned, education will be provided and meals would be furnished.
Hugo Munsterberg created the industrial psychology. This is the scientific study of
individuals at work to maximize their productivity. He suggested the use of psychological
tests to improve employee selection, the study of human behavior in order to understand
what techniques are most effective for motivating workers.
Chester Barnard considers organizations as social systems which require cooperation of
human. He believed that organizations were made up of people who have interacting
social relationships. Barnard introduced a idea that managers had to examine the
environment and adjust the organization to maintain a state of equilibrium.
Mary Parker Follett thought that organizations should be based on a group ethic rather
than individual. She argued that individual potential remained only potential until
released through group association. 1.11.2 The Hawthorne studies
The Hawthorne studies were held at Western Electric and sponsored by General Electric.
Elton Mayo and his colleagues controlled the lighting in one room of workers but not in
another.
When the illumination was increased in the experimental group, productivity increased in
both groups. The increase in productivity was attributed to the fact that the workers were
having extra attention paid to them, maybe for the first time.
Other studies found that employees will not work as fast as they can when being paid
piece-rate wages. Instead, they will perform to the level informally set by the group in
order to be accepted by the group.
These two studies led Mayo to the conclusion that individual and social processes played
a major role in shaping workers attitudes and behavior at work.

15
1.11.3 The human relations movement
The human relations movement, which stemmed from the Hawthorne studies, is based on
the idea that a manager's concern for workers will lead to their increased satisfaction and
improved performance. The movement includes the need theories of motivation, such as
Maslow's hierarchy of needs, and McGregor's Theory X and Theory Y.
1.11.4 Behavioral Science Theorists
Jeffrey Pfeffer, Kenneth Thomas were contributed to the development of organizational
behavior Organizational behavior takes a holistic view of behavior by addressing
individual, group, and organization processes. Their contributions and limitations are
listed below:
Contributions
• Gave insights into interpersonal processes in organizations such as motivation and
group dynamics.
• Focused managerial attention on these processes.
• Challenged the view of employees as tools.
Limitations
• The complexity of human behavior makes difficult to predict.
• Managers may be reluctant to adopt some of the behavioral concepts.
• Contributions are often not communicated to the practicing managers in an
understandable form.
1.12 THE QUANTITATIVE APPROACH
Quantitative approach to management includes the applications of statistics, optimization
models and computer simulations. It has contributed most directly to management
decision making in planning and control. Management science and Operations Research
are specifically focused on the development of mathematical models. These models help
organizations to try out various activities with the use of a computer. Modeling can help
managers locate the best way to do things and save money and time.
Contributions
• Developed sophisticated quantitative techniques to assist in decision making.

16
• Models have increased our awareness of complex organizational processes and
has aided in the planning and controlling processes.
Limitations
• Cannot fully explain or predict behavior of people.
• Mathematical sophistication may come at the expense of other important skills.
• Models may require unrealistic or unfounded assumptions.
1.13 INTEGRATIVE APPROACH
1.13.1 The systems approach
A system is an interrelated set of elements functioning as a whole. An organization as a
system is composed of four elements:
• Inputs (material or human resources),
• Transformation processes (technological and managerial processes),
• Outputs (products or services), and
• Feedback (reactions from the environment)
The two basic types of systems are open and closed. Open systems are systems that
interact with their environment. Subsystems are systems within a broader system.
Closed systems are systems that neither influenced by nor with their environment. Fig 1.4
shows an open system perspectives in an organization. Inputs like Raw materials, Human
resources, Capital, Technology and Information are required for a business firm. The
transformation process turns these inputs into finished products or services through work
activities, management activities and operations methods.
Products & services, Financial results such as break even, profit or loss, Information,
Human results are the outputs from the system. Human results show the employees job
satisfaction. The above activities are mainly depends on other important factor
environment. It includes supplier of the organization, banks, government agencies and
customers.

17
Environment
Ref: Robbins and Coulter (2004)
Fig 1.4: The Systems Approach 1.13.2 The process approach
This approach is originally introduced by Henri Fayol based on the management
functions such as planning, organizing, leading and controlling. These are explained in
the following sections.
1.13.3 The contingency approach
Appropriate managerial behavior depends on the elements of the situation. Universal
perspectives tried to identify the "one best way" to manage organizations. Contingency
perspective argues that universal theories cannot be applied to organizations because each
is unique. The popular contingency variables are organization size, routines of task
technology, environmental uncertainty and individual differences.
System Employees work activities Management activities Technology and operations methods
Transformation Raw materials Human resources Capital Technology Information
Inputs Products & services Financial results Information Human results
Outputs
Feedback

18
MANAGEMENT PROCESS 1.14 Planning
Planning typically includes identifying goals, objectives, methods, resources needed to
carry out methods, responsibilities and dates for completion of tasks. Examples of
planning are strategic planning, business planning, project planning, staffing planning,
advertising and promotions planning, etc. Fig 1.5 shows the typical management process.
The following are phases in planning:
1. Keep in mind the mission.
Planners have in mind some overall purpose or result that the plan is to achieve during
planning. During planning, it's critical to reference the mission, or overall purpose, of the
organization.
2. Consider system environment.
It's important to conduct an environmental scan. This scan usually involves considering
various driving forces, or major influences, that might effect the organization.
3. Analyze the Situation
Planners often conduct a "SWOT analysis". (SWOT is an acronym for considering the
organization's strengths, weaknesses, opportunities and threats faced by the organization).
During this analysis, planners also can use a variety of assessments, or methods to
"measure" the health of systems.
4. Establish Goals
Based on the analysis and alignment to the overall mission of the system, planners
establish a set of goals that build on strengths to take advantage of opportunities, while
building up weaknesses and warding off threats.
5. Establish Strategies to reach goals
The particular strategies chosen depend on matters of practicality and efficiency.
6. Establish Objectives
Along the way to achieve goals, objectives are selected to be timely and indicative of
progress toward goals.

19
7. Associate Responsibilities and Time Lines with each objective
Responsibilities are assigned, including for implementation of the plan, and for achieving
various goals and objectives. Ideally, deadlines are set for meeting each responsibility.
8. Write and Communicate a Plan Document
The above information is organized and written in a document which is distributed
around the system.
9. Acknowledge Completion and Celebrate Success
This critical step is often ignored which can eventually undermine the success of many of
your future planning efforts. The purpose of a plan is to address a current problem or
pursue a development goal. It seems simplistic to assert that you should acknowledge if
the problem was solved or the goal met. However, this step in the planning process is
often ignored in lieu of moving on the next problem to solve or goal to pursue.
Fig 1.5 Management Process
1.15 Organizing
Simply say that organizing is allocating and configuring resources to accomplish the
preferred goals and objectives establishing during the planning processes. In the next
chapter this process will be explained more elaborately.

20
1.16 Leading
Leading is establishing direction and influencing people to follow that direction. In
management we deal mostly with humans. Therefore to achieve our objectives we have
to motivate and lead people who are relevant to achievement of our objectives. When we
lead people, motivate them and constantly communicate with them, they will be
interested in carrying out what had been allocated to them. Unless people are properly led
they will not do the intended task. People need to be constantly motivated and directed to
perform the intended task we expect out of them. Then achievement of our objective will
be certain.
1.17 Controlling
Controlling is that we must ensure that all our planning, organizing and leading in fact
move us towards the established objectives. This is, while planning, organizing and
leading are carried out as a process, it must be ensured that we measure the ongoing
performance of the task and compare such current performance with the established
objectives, to see whether we are heading towards the right directions.
If it is clear that our objectives may not be achieved then some corrective actions must be
taken to ensure that we are infact heading in the right directions to achieve the objectives
which were predetermined.
21
FUNCTIONS OF MANAGEMENT 1.18 Planning
Planning is concerned with the future impact of today's decisions. It is the fundamental
function of management from which the other four stem. The need for planning is often
apparent after the fact. However, planning is easy to postpone in the short-run.
The organizing, staffing, leading and controlling functions stem from the planning
function. The manager is ready to organize and staff only after plans to reach the goals.
Likewise, the leading function, influencing the behavior of people in the organization,
depends on the goals to be achieved. Finally, in the controlling function, the
determination of whether or not goals are being accomplished and standards met is based
on the planning function. The planning function provides the goals and standards that
drive the controlling function.
Planning is important at all levels of management. However, its characteristics vary by
level of management. Fig 1.6 shows the various functions of management.
1.19 Staffing
Management teams on successful organizations doing well at many human resource
management skills. Staffing (including recruiting, selecting, hiring and training of
employees) is among the skills that become more important as the complexity and overall
level of performance of organizations business increases. With increasing size and
improving performance comes people complexity: more things accomplished through
employees, more delegation to key employees and more reliance on employees to
maintain a routine that assures superiority.
The organizing function of management defines each position or category of positions on
the organization. Staffing follows with the filling and keeping filled all positions on the
organization.

22
Fig 1.6: Functions of management
Recruiting a pool of applicants for a position, selecting new employees from among the
pool of applicants, training new employees and retaining experienced employees are the
key elements of the staffing function.
Practically all organizations function without a Human Resource Department. The
organization human resource managers must deal with factors external to the company
such as labor laws and regulations, labor markets, practices of other employers. Internal
factors such as policies regarding family members entry into the business, conflict
between family and business goals and limited opportunities for promotion because of
flat organization charts must be dealt with. Staffing has both short-run and long-run
effect. In the short-run, positions must be kept filled with qualified people who can get
the work done. In the long run, development of top and middle level management
personnel for business continuity into the next generation tops the list of staffing
challenges.
Staffing success depends heavily on the planning and organizing functions of
management. In planning, both farm goals and employees' goals are considered. A
business functions best when business and employee goals are compatible. Job analysis
leads to job specifications and job descriptions. In developing job specifications, the

23
necessary knowledge, skills and abilities for each position are determined. Job
descriptions identify specific tasks for each position. Full success in staffing rarely comes
without analyzing the jobs on the farm, determining what is needed for success in each
job and writing a description of the job.
The following assumptions provide the context of staffing
1. The mission for the farm has been given careful attention by top management and
distributed to the management team and all employees, i.e., the reasons the farm is in
business are known.
2. A management team is in place and able to divide up responsibilities. Top management
is willing and able as needed to delegate responsibilities and authority.
3. Key positions like machinery person, or a full-time office person are being filled. The
process for filling key positions can be modified for part-time and temporary positions.
4. The person hired will be trained to carry out the responsibilities of the position, i.e., it
is not necessary to hire a person who already knows how to do the job.
5. No selection process can guarantee selection success. Even if the "right" person was
hired based on all the information available to the employer at the time the decision was
made, six months, a year or three years later, it may seem that the "wrong" person was
hired.
1.20 Leading
Directing or leading is influencing people's behavior through motivation, communication,
group dynamics, leadership and discipline. The purpose of directing is to channel the
behavior of all personnel to accomplish the organization's mission and objectives while
simultaneously helping them accomplish their own career objectives.
The directing function gives the manager an active rather than a passive role in
employees performance, conduct and accomplishments. Managers accomplish their
objectives through people. In blaming others for her or his human resource problems, a
manager is denying the management responsibilities inherent in the directing function.
The directing function gives managers a second responsibility: helping people in the
organization accomplish their individual career goals. Organizations do not succeed

24
while their people are failing. Helping people in the organization with career planning
and professional development is an integral part of the directing function.
The directing function in managing for success has included the motivation,
communication, performance appraisal, discipline and conflict management.
Motivation
Selection, training, evaluation and discipline cannot guarantee a high level of employee
performance. Motivation, the inner force that directs employee behavior, also plays an
important role. Highly motivated people perform better than unmotivated people.
Motivation covers up ability and skill deficiencies in employees. Such truisms about
motivation leave employers wanting to be surrounded by highly motivated people but
unequipped to motivate their employees. Employers and supervisors want easily applied
motivation models but such models are unavailable.
Motivation probably tops the list of complex activities with which labor managers deal.
Their intuition suggests an easy answer, "I want everyone around here to be motivated."
They often blame employees for their lack of motivation and performance problems.
Employees on the other hand often blame any performance problems they may have on
external factors - their supervisors, equipment, training, co-workers, weather, unrealistic
demands made on them, pressures at home, lack of recognition etc., etc. Despite the
conflicting perceptions held by employers and employees, employers must deal with
employee motivation.
Three ways of looking at motivation are: needs, rewards and effort. The needs approach
stems from the notion that peoples' unsatisfied needs drive their behavior. Figure out a
person's needs, satisfy the needs and the person will be motivated. The rewards approach
is based on the expectation that rewarded behavior is repeated. Giving a person a bonus
for excellent performance during a difficult harvest period encourages the person to make
a special effort during the next difficult harvest. The effort approach to motivation is
based on the expectation that effort brings the worker what he or she wants. The effort
approach includes a assumption that the employer is fair, i.e., effort is recognized and
rewarded. Managers cannot reduce motivation to a simple choice of one of these

25
approaches. Each of the three approaches contributes to an understanding of motivation
and how motivation varies person to person and over time.
The most effective motivation for employees comes from within each employee, i.e.,
self-motivation. Possible indicators of self-motivation include: past accomplishments in
school, sports, organizations and work; stated career goals and other kinds of goals;
expertise in one or more areas that shows evidence of craftsmanship, pride in knowledge
and abilities, and self-confidence; an evident desire to continue to learn; and a general
enthusiasm for life.
1.21 Controlling
Controlling is a four-step process of establishing performance standards based on the
firm's objectives, measuring and reporting actual performance, comparing the two, and
taking corrective or preventive action as necessary.
Performance standards come from the planning function. No matter how difficult,
standards should be established for every important task. Although the temptation may be
great, lowering standards to what has been attained is not a solution to performance
problems. On the other hand, a manager does need to lower standards when they are
found to be unattainable due to resource limitations and factors external to the business.
Corrective action is necessary when performance is below standards. If performance is
anticipated to be below standards, preventive action must be taken to ensure that the
problem does not recur. If performance is greater than or equal to standards, it is useful to
reinforce behaviors that led to the acceptable performance.
Characteristics of the Control Process
The control process is cyclical which means it is never finished. Controlling leads to
identification of new problems that in turn need to be addressed through establishment of
performance standards, measuring performance etc.
Employees often view controlling negatively. By its very nature, controlling often leads
to management expecting employee behavior to change. No matter how positive the
changes may be for the organization, employees may still view them negatively.

26
Control is both anticipatory and retrospective. The process anticipates problems and takes
preventive action. With corrective action, the process also follows up on problems.
Ideally, each person in the business views control as his or her responsibility. The
organizational culture should prevent a person walking away from a small, easily
solvable problem because "that isn't my responsibility." In customer driven businesses,
each employee cares about each customer. In quality driven dairy farms, for example,
each employee cares about the welfare of each animal and the wear and tear on each
piece of equipment. Controlling is related to each of the other functions of management.
Controlling builds on planning, organizing and leading.
SUMMARY
Management is the the process of planning, organizing, leading and controlling the work
of organization members and of using all available resources to reach stated
organizational goals. Planning, organizing, staffing, leading, and controlling are the
functions carried out by managers. At all organizational levels, organizing is an essential
activity but the skills required at the organizational level are changing nature.
Many writers and practitioners have contributed to the development of management
thought. The major contributors and their works are listed in evolution of management.
The management process approach draws from other theories of management and
integrates them into a total system of managing. The organization is an open system that
operates within and interacts with the environment. The system approach to management
includes inputs from the external environment and from claimants, the transformation
process, the communication system, external factors, outputs, and a way to reenergize the
system.

27
FOR DISCUSSION
1. How would you define management? Does your definition differ from one
offered in this material? Explain.
2. How do the required managerial skills differ in the organizational hierarchy?
3. What are the managerial functions?
4. What are the differences between productivity, effectiveness, and efficiency?
5. What are the managerial functions?
6. Identify the various approaches to management analysis. Discuss their
characteristics and contributions as well as their limitations.
SUGGESTED TEXT BOOKS
1. Stoner J.A.F, Freeman E and Daniel Gilbert, (2003) “Management”, 6th Edition,
Pearson Education, New Delhi.
2. Robbins S.P and Mary Coulter, (2004), “Management”, 5th Edition, Pearson
Education, New Delhi.
3. Weilrich, Koontz, Harold, (2001), “Management: A Global Perspective” 10th
Edition, Tata McGraw Hill, New Delhi.
4. Schmermerhorn John R., (2002), “Management”, 7th Edition, John Wiley, United
States of America.
5. Burton, G. and M. Thakur, (2001), “Management Today: Practice”, Tata McGraw
Hill, New Delhi.

28
Chapter 2
ORGANIZATIONAL DESIGN AND
STRUCTURE

29
ORGANIZATIONAL DESIGN AND
STRUCTURE
SCOPE OF THE COURSE
After reading chapter 2, you should be able to:
Draw the distinction between line and staff authority
Explain the use of organization chart Understand span of control Elaborate the horizontal dimensions of
organizations Explain types of organizational structure Understand organization design
30
BASICS OF ORGANIZATIONS
Organization is defined as a unit within a company or an entity within which many
activities are managed as a whole. All activities within an organization share common
goals. Organizing is the process of creating an organization’s structure that is a
framework expressed by its degree of complexity, formalization and centralization.
Degree of complexity refers the amount of differentiation in the organization and shows
the difficulty to coordinate the people and their activities. Directing the behavior of all
the people in an organization, certain rules and policies are to be formalized.
Centralization is the process by which the activities of an organization, particularly those
regarding decision-making, become concentrated within a particular location and/or
group. Decentralization is any of various means of more widely distributing decision-
making to bring it closer to the point of service. Organization Design is a process for
integrating people, information, and technology toward the successful achievement of
organizational outcomes. It seeks to optimize human achievement. When a manager
develops or changes an organization structure, he/she is engaged in organization design.
2.1 BUILDING THE VERTICAL DIMENSION OF ORGANIZATIONS
2.1.1 UNITY OF COMMAND

31
It refers to the principle that a subordinate should have one and only one superior to
whom he or she is directly responsible. That is no person should report to two or more
superior.
2.1.2 AUTHORITY AND RESPONSIBILITY
Organizational structure involves the designation of jobs within an organization and the
relationships among those jobs. There are so many ways to structure jobs within an
organization, but two of the most important forms are simple line structures and line and
staff structures. In a line organization, top management has complete control and the
chain of command (the authority entitles a manager to direct the work of a subordinate) is
clear and simple. The chain of command is shown in Fig 2.1 and explained more on the
following section. For an example, small business in which the top manager may be the
owner is positioned at the top of the organizational structure and has clear "lines" of
distinction between him and his subordinates.
Fig 2.1: The chain of command
The line and staff organization combines the line organization with staff departments.
These staff departments support and advise line departments. Most medium and large-
Chief Executive Officer
Executive Vice President
President Executive Vice President
Vice President
Vice President
Vice President
Vice President
Vice President
Region 1 Region 2 Region 3 Region 4 Region 5
District 1 District 2 District 3 District 4

32
sized firms comprise line and staff type organizational structures. The distinguishing
characteristic between simple line organizations and line and staff organizations is the
multiple layers of management within line and staff organizations. Several advantages
and disadvantages are present within a line and staff organization. An advantage of a line
and staff organization is
• The availability of technical specialists
• Staff experts in specific areas are incorporated into the formal chain of command.
The main disadvantage is conflict between line and staff personnel.
Line and Staff Positions
The primary and secondary positions exist within a line and staff organization. Some
positions are primary to the company's mission, whereas others are secondary in the form
of support and indirect contribution. Although positions within a line and staff
organization can be differentiated in several ways, the simplest approach classifies them
as being either line or staff. Fig 2.2 illustrates the line and staff positions.
A line position is directly involved in the day to day operations of the organization, such
as producing or selling a product. Line positions are occupied by line personnel and line
managers. Line personnel carry out the primary activities of a business and are
considered essential to the basic functioning of the organization. Line managers make the
majority of the decisions and direct line personnel to achieve company goals. Line
manager is a marketing executive, for an example.

33
Fig 2.2: Line and Staff Organization
Although a marketing executive does not actually produce the product, he or she directly
contributes to the firm's overall objectives through market forecasting and generating
product demand. Staff positions serve the organization by indirectly supporting line
functions. Staff positions consist of staff personnel and staff managers. Staff personnel
use their technical expertise to assist line personnel and aid top management in various
business activities. Staff managers provide support, advice and knowledge to other
individuals in the chain of command.
Although staff managers are not part of the chain of command related to direct
production of products, they do have authority over personnel. An example of a staff
manager is a legal adviser. He or she does not actively engage in profit-making activities,
but does provide legal support to those who do. Therefore staff positions whether
personnel or managers engage in activities that are supportive to line personnel.
Line and Staff Authority
Authority within a line-and-staff organization can be differentiated. Three types of
authority are present: line, staff, and functional. Line authority is the right to carry out
assignments and exact performance from other individuals.
Line Authority
Line authority flows down the chain of command. For example, line authority gives a
production supervisor the right to direct an employee to operate a particular machine and
it gives the vice president of finance the right to request a certain report from a
department head. Therefore, line authority gives an individual a certain degree of power
relating to the performance of an organizational task.
The line authority does not ensure effective performance and is not restricted to line
personnel. The head of a staff department has line authority over his or her employees by
virtue of authority relationships between the department head and his or her directly-
reporting employees.
Staff Authority

34
Staff authority is the right to advise line authority. For an example, human resource
department employees help other departments by selecting and developing a qualified
workforce. A quality control manager aids a production manager by determining the
acceptable quality level of products or services at a manufacturing company by initiating
quality programs and carrying out statistical analysis to ensure compliance with quality
standards. Therefore, staff authority gives staff personnel the right to offer advice in an
effort to improve line operations.
2.1.3 ORGANIZATION CHART
In a business of more than one person, unless the business has equal partners then there
are managers and subordinates. Subordinates are workers controlled by the manager. A
hierarchy describes the structure of the management from the top of the company ie., the
managing director through to the shop floor worker who reports to their foreman in a
business. The hierarchy of a business is usually best understood by drawing an
organization chart showing which levels of management and employees report to whom.
The following Fig 2.3 shows a typical organization chart.
Fig 2.3: organization Chart
2.1.4 SPAN OF CONTROL
35
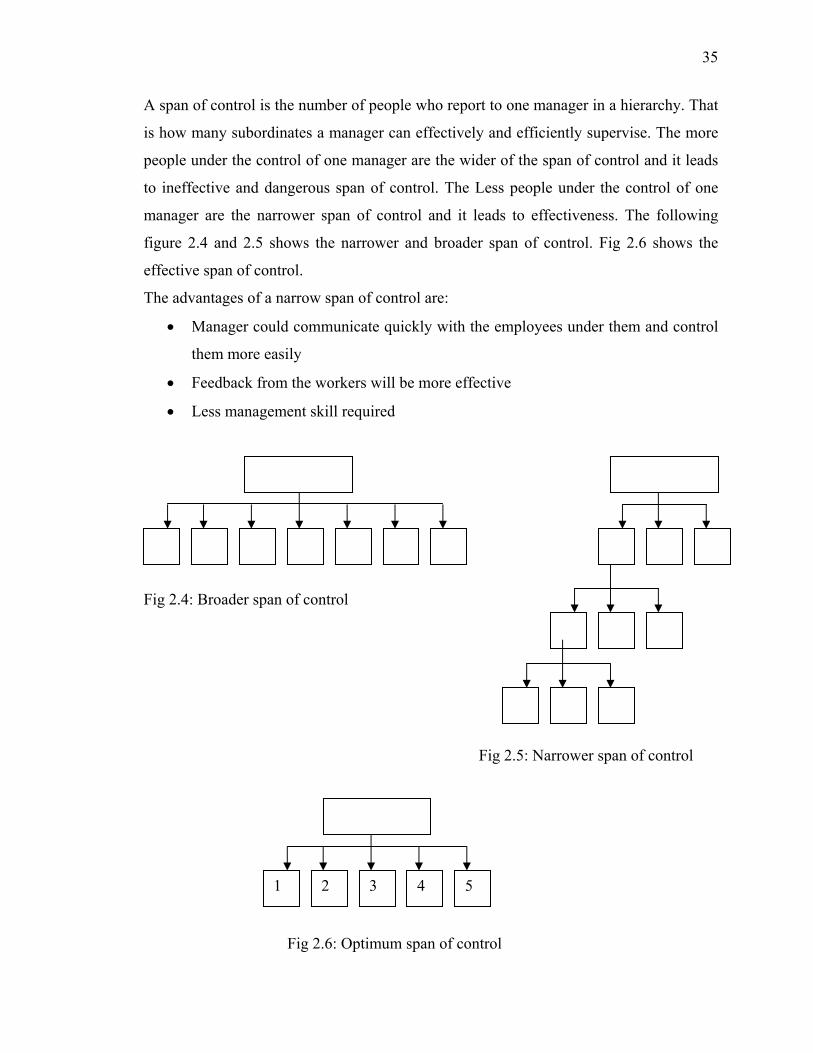
A span of control is the number of people who report to one manager in a hierarchy. That
is how many subordinates a manager can effectively and efficiently supervise. The more
people under the control of one manager are the wider of the span of control and it leads
to ineffective and dangerous span of control. The Less people under the control of one
manager are the narrower span of control and it leads to effectiveness. The following
figure 2.4 and 2.5 shows the narrower and broader span of control. Fig 2.6 shows the
effective span of control.
The advantages of a narrow span of control are:
• Manager could communicate quickly with the employees under them and control
them more easily
• Feedback from the workers will be more effective
• Less management skill required
Fig 2.4: Broader span of control
Fig 2.5: Narrower span of control
Fig 2.6: Optimum span of control
1 2 5 4 3

36
The advantages of wide span of control are:
• There are less layers of management to pass an information so the information
reaches more employees faster
• It costs less money to run a wider span of control because a business does not
need to employ as many managers
The width of the span of control depends on:
The type of product
Products which are easy to make or deliver will need less supervision and so can have a
wider span of control
Skills of managers and workers
A more skillful workforce can operate with a wider span of control because they will
need less supervision. Based on decision making organization is classified in to tall or flat
organization. A tall organization (Fig 2.4) has a larger number of managers with a narrow
span of control whilst a flat organization (Fig 2.3) has few managers with a wide span of
control. A tall organization can suffer from having too many managers and decisions can
take a long time to reach the bottom of the hierarchy. But, a tall organization can provide
good opportunities for promotion and the manager does not have to spend so much time
managing the staff
Chain of command
It is the line on which orders and decisions are passed down from top to bottom of the
hierarchy. In a hierarchy the chain of command means that a production manager may be
higher up the hierarchy but will not be able to tell a marketing person what to do.
The advantages of hierarchies are:
• Helps to create a clear communication line between the top and bottom of the
business and this improves co-ordination and motivation
• Create teams and motivation is advantage of working in teams.
The disadvantages of hierarchies are:

37
• Departments work for themselves and not the greater good of the business.
• Departments do not see the whole picture in making decisions.
• Hierarchies can be inflexible and difficult to adjust,
2.1.5 CENTRALIZATION
Organizations with a centralized structure have several layers of management that control
the organization by maintaining a high level of authority. With a centralized structure,
line and staff employees have limited authority to carry something out without prior
approval. This organizational structure tends to focus on top-down management, whereby
executives at the top communicate by telling middle managers. Then middle managers
tell first-level managers who then tell the staff what to do and how to do. Since this
organizational structure tends to be fairly bureaucratic, employees have little freedom.
Centralized organizations are known for decreased span of control which has a limited
number of employees report to a manager. And manager then reports to the next
management level (Fig 2.7).
Fig 2.7: Centralized organizational Structure
2.1.6 DECENTRALIZATION
Because of more management cost in a centralized organization, many organizations
continue to downsize into a more decentralized structure. Decentralization seeks to
eliminate the unnecessary levels of management and to place authority in the hands of
first line managers and staff. Thus it widens the span of control, with more employees
reporting to one manager. Because more employees are reporting to a single manager
than before, the managers are forced to delegate more work and to hold the employees
more accountable. Downsizing has also helped to change the flow of communication, so
that top management hears staff concerns and complaints in a more direct manner and
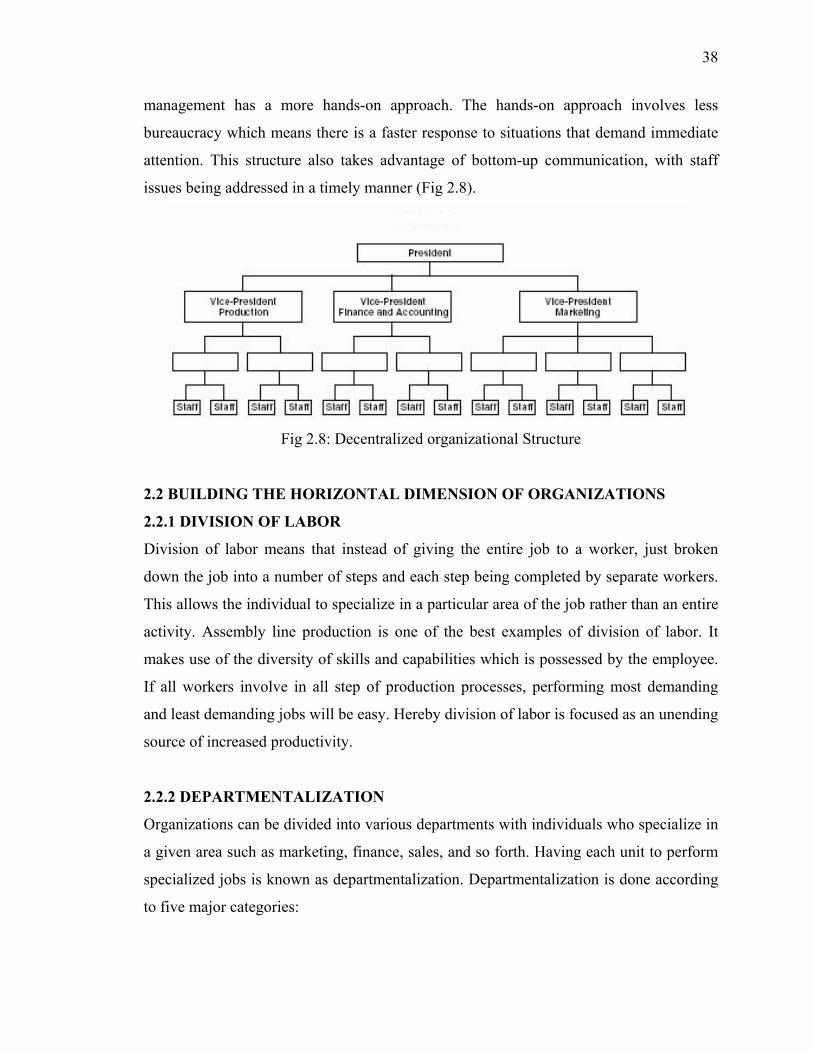
38
management has a more hands-on approach. The hands-on approach involves less
bureaucracy which means there is a faster response to situations that demand immediate
attention. This structure also takes advantage of bottom-up communication, with staff
issues being addressed in a timely manner (Fig 2.8).
Fig 2.8: Decentralized organizational Structure
2.2 BUILDING THE HORIZONTAL DIMENSION OF ORGANIZATIONS
2.2.1 DIVISION OF LABOR
Division of labor means that instead of giving the entire job to a worker, just broken
down the job into a number of steps and each step being completed by separate workers.
This allows the individual to specialize in a particular area of the job rather than an entire
activity. Assembly line production is one of the best examples of division of labor. It
makes use of the diversity of skills and capabilities which is possessed by the employee.
If all workers involve in all step of production processes, performing most demanding
and least demanding jobs will be easy. Hereby division of labor is focused as an unending
source of increased productivity.
2.2.2 DEPARTMENTALIZATION
Organizations can be divided into various departments with individuals who specialize in
a given area such as marketing, finance, sales, and so forth. Having each unit to perform
specialized jobs is known as departmentalization. Departmentalization is done according
to five major categories:

39
• Product, which requires each department to be responsible for the product being
manufactured
• Geographic, which divides the organization based on the location of stores and
offices
• Customer, which separates departments by customer type
• Functional, which breaks departments into specialty areas;
• Process, which creates departments responsible for various steps in the production
process.
All of the above categories of departmentalization are indicated in fig.2.9.
Fig 2.9: Departmentalization
Functional Departmentalization
Every organization of a given type must perform certain jobs in order do its work. For
example, key functions of a manufacturing company include production, purchasing,
marketing, accounting, and personnel. Grouping jobs that require the same knowledge,
skills, and resources allows them to be done efficiently and promotes the development of
greater expertise. A disadvantage of functional groupings is that people with the same
skills and knowledge may develop a narrow departmental focus and have difficulty in
appreciating any other view of what is important to the organization; in this case,
organizational goals may be sacrificed in favor of departmental goals. In addition,
coordination of work across functional boundaries can become a difficult management

40
challenge especially as the organization grows in size and spreads to multiple
geographical locations.
Geographic Departmentalization
Organizations that are spread over a wide area may find advantages in organizing along
geographic lines so that all the activities performed in a region are managed together. In a
large organization, simple physical separation makes centralized coordination more
difficult. Also important characteristics of a region may make it advantageous to promote
a local focus. For example, marketing a product in USA may have different requirements
than marketing the same product in Southeast Asia. Companies that market products
globally sometimes adopt a geographic structure. In addition, experience gained in a
regional division is often excellent training for management at higher levels.
Product Departmentalization
Large, diversified companies are often organized according to product. All the activities
necessary to produce and market a product or group of similar products are grouped
together. In such an arrangement, the top manager of the product group typically has
considerable autonomy over the operation. The advantage of this type of structure is that
the personnel in the group can focus on the particular needs of their product line and
become experts in its development, production, and distribution. A disadvantage, at least
in terms of larger organizations, is the duplication of resources. Each product group
requires most of the functional areas such as finance, marketing, production, and other
functions. The top leadership of the organization must decide how much redundancy it
can afford.
Customer/Market Departmentalization
An organization may find it advantageous to organize according to the types of customers
it serves. For example, a distribution company that sells to consumers, government
clients, large and small businesses may decide to base its primary divisions on these

41
different markets. Its personnel can then become proficient in meeting the needs of these
different customers. In the same way, an organization that provides services such as
accounting or consulting may group its personnel according to these types of customers.
Figure 2.10 depicts an organization grouped by customers and markets.
Fig 2.10: Types of departmentalization
2.2.3 MATRIX ORGANIZATIONAL STRUCTURE
Some organizations find that none of the afore-mentioned structures meet their needs.
One approach that attempts to overcome the inadequacies is the matrix structure, which is
the combination of two or more different structures. Functional departmentalization
commonly is combined with product groups on a project basis. For example, a product

42
group wants to develop a new addition to its line; for this project, it obtains personnel
from functional departments such as research, engineering, production, and marketing.
These personnel then work under the manager of the product group for the duration of the
project, which can vary greatly. These personnel are responsible to two managers. Fig
2.11 shows such type of organization. One advantage of a matrix structure is that it
facilitates the use of highly specialized staff and equipment.
Fig 2.11: Matrix Organizational Structure
The disadvantages of a matrix organization arise from the dual reporting structure. The
organization's top management must take particular care to establish proper procedures
for the development of projects and to keep communication channels clear so that
potential conflicts do not arise. Top management is responsible for arbitrating such
conflicts, but in practice power struggles between the functional and product manager can
prevent successful implementation of matrix structural arrangements. Besides the
product/function matrix, other bases can be related in a matrix. Large multinational
corporations that use a matrix structure most commonly combine product groups with
geographic units. Product managers have global responsibility for the development,
manufacturing, and distribution of their own product or service line, while managers of
geographic regions have responsibility for the success of the business in their regions.
2.2.4 STRATEGIC BUSINESS UNITS

43
Strategic Business Units (SBU) generally are set up like separate companies, with full
profit and loss responsibility invested in the top management of the unit often the
president of the unit of the larger corporation. This manager is responsible to the top
management of the corporation. This arrangement can be seen as taking any of the
aforementioned departmentalization schemes. The SBUs might be based on product lines,
geographic markets, or other differentiating factors. Figure 2.12 depicts SBUs organized
by geographic area.
Fig 2.12: Strategic Business Units
2.3 TYPES OF ORGANIZATIONAL STRUCTURE
I. Three main components of organizational structure
A. Complexity: degree of differentiation of activities
1. Horizontal complexity: number of units across organization
2. Vertical complexity: depth of organizational hierarchy
a. Flat structures: small number of levels, wide span of control
(# of workers each managers oversees)
b. Tall structures: many levels, narrower spans of control
3. Spatial complexity: geographical dispersion of physical and human
resources
B. Formalization: degree of standardization
C. Centralization: degree of concentration of decision-making
II. Mechanistic vs. Organic structures

44
A. Structure types
1. Mechanistic structure: high complexity and formalization; centralized
decision-making (also, rigid relationships, fixed duties, downward
communication, little participation in decision-making)
2. Organic structure: low complexity and formalization; decentralized
decision-making (also, adaptable duties, flexible relationships, horizontal
and upward communication)
B. Factors leading to structure types
Table 2.1 Factors leading to structure types
Factor Mechanistic Organic
1. Size Large Small
2. Strategy Cost-minimization,
imitation
Innovation, single product line
3. Technology Mass production, routine
tasks, well-defined
problems
Unit production, intensive
technology (combining
services tailored to customer),
non-routine tasks, ill-defined
problems
4. Environment Placid-randomized, placid-
clustered
Disturbed-reactive, turbulent
field

45
INTRODUCTION TO ORGANIZATIONAL DESIGN
2.4 ORGANIZATIONAL DESIGN
Designing an organization involves choosing an organizational structure that will enable
the company to most effectively achieve its goals. Combination of organization design
and emergent organizational behavior forms an efficient and resilient organizational-
control framework. Emergent organizational behavior is an on-line and primarily bottom-
up process in which agents look for interaction and local control decisions that have been
effective in the past and give similar decisions preference in the future.
Fig 2.13: Organizational design framework
By representing these preferences explicitly and aggregating them together, an emergent
organizational structure can be created. In contrast, designed organizations are created by
using organization-design knowledge and task-environment information to develop an
explicit organizational structure that is then elaborated by the individual agents into

46
appropriate behaviors. Coupled together, an initial designed organization can provide
ballpark organizational behavior preferences that can be refined in an emergent fashion,
and emergent organizational behavior can provide a stimulus for improved organizational
design. Significant tension between the designed organization and potential emergent
organizational behavior is an indication that the current organizational structure may have
become inappropriate and provides important information for organizational restructuring
or redesign.
Organization design is the creation of an organization's structure, traditionally functional,
divisional, and matrix. In a functional organization, authority is determined by the
relationships between group functions and activities. Functional structures group similar
or related occupational specialties or processes together under the familiar headings of
finance, manufacturing, marketing, accounts receivable, research, surgery, and photo
finishing. Economy is achieved through specialization. However, the organization risks
losing sight of its overall interests as different departments pursue their own goals.
In a divisional organization, corporate divisions operate as relatively autonomous
businesses under the larger corporate umbrella. In a conglomerate organization, divisions
may be unrelated. Divisional structures are made up of self-contained strategic business
units that each produces a single product. A central headquarters focusing on results,
coordinates and controls the activities and provides support services between divisions.
Functional departments accomplish division goals. A weakness however, is the tendency
to duplicate activities among divisions.
In a matrix organization shown in fig 2.14, teams are formed and team members report to
two or more managers. Matrix structures utilize functional and divisional chains of
command simultaneously in the same part of the organization. It is used to develop a new
product, to ensure the continuing success of a product to which several departments
directly contribute and to solve a difficult problem. By superimposing a project structure
upon the functional structure, a matrix organization is formed that allows the organization
to take advantage of new opportunities. This structure assigns specialists from different
functional departments to work on one or more projects being led by project managers.
Project managers have authority over activities geared toward achieving organizational
goals while functional managers have authority over promotion decisions and

47
performance reviews. Matrix organizations are particularly appealing to firms that want
to speed up the decision-making process. However, the matrix organization may not
allow long-term working relationships to develop. Furthermore, using multiple managers
for one employee may result in confusion as to manager evaluation and accountability.
Thus, the matrix system may elevate the conflict between product and functional
interests.
Fig 2.14: Matrix organization
Boundaries less organizations share many of the characteristics of flat organizations, with
a strong emphasis on teams. Cross-functional teams dissolve horizontal barriers and
enable the organization to respond quickly to environmental changes and to spearhead
innovation. Boundary less organizations shown in fig 2.15, can form relationships (joint
ventures, intellectual property, distribution channels, or financial resources) with
customers, suppliers, and competitors. A boundary less environment is required by
learning organizations to facilitate team collaboration and the sharing of information.
When an organization develops the continuous capacity to adapt and survive in an
increasingly competitive environment because all members take an active role in
identifying and resolving work-related issues, it has developed a learning culture. A
learning organization is one that is able to adapt and respond to change. This design
empowers employees because they acquire and share knowledge and apply this learning
to decision-making. They are pooling collective intelligence and stimulating creative
thought to improve performance. Supervisors facilitate learning by sharing and aligning

48
the organization's vision for the future and sustaining a sense of community and strong
culture.
Fig 2.15: Boundary less organization
2.4.1 Organizational Design Types
I. Functional: Grouping by task (each group does something different)
A. Advantages
• Allows task specialization and expertise to develop
• Don’t have redundancy of functions across groups that occurs in divisional design
B. Disadvantages
• Poor communication across functional areas
• Hard to identify who is responsible for failures, success (for example for poor
sales of a product)

49
II. Divisional: Grouping by product, customer, location, topic, etc. (each group does
same tasks but for a different topic, customer, product, location, etc.)
A. Advantages
• Coordination within product lines made easier
• More adaptable to changes in environment (e.g., can shut down a division when a
• a product is no longer selling)
• Responsibility for failures, successes identifiable
• Competition across divisions can serve as a motivator
B. Disadvantages
• Redundancy of functions across divisions
• Competition for resources, power
• Lack of development of expertise in functional areas
III. Hybrid: Functional at one level, divisional at another level
A. Advantages
• Functional support at top for product groups can eliminate redundancy problem of
divisional design and increase expertise available
• Can use functional groupings where need advantages of functional grouping, and
divisional groupings where need advantages of using divisional grouping
B. Disadvantages
• Difficulties in coordinating can occur across levels because of different modes of
operating
• Power struggles can develop because of non-authority of functional groups at
headquarters over product groups below
IV. Matrix: Functional and divisional simultaneously (e.g., cross-functional project
teams)
A. Advantages
• Uses human and physical resources more efficiently

50
• Increases technical quality and product integrity simultaneously
B. Disadvantage
Requires lots of communication and coordination (e.g., between functional and
divisional bosses)
V. New trends in structure
A. Networked structure: Disaggregation of organizations (use of independent
contractors, joint ventures, etc.)
1. Advantages:
• Allows organization more flexibility
• Doesn’t require as many resources (e.g., employee benefits, office space,
financing for ventures, etc.)
2. Disadvantages:
• More difficult to control quality—requires controls, e.g., in contracts
• Increases need to coordinate, communicate effectively
B. Increased use of cross-functional teams (from matrix) in conjunction with other
more traditional structures.
SUMMARY
The structural relationships in which people work, holds employee attitudes and behavior
in addition to individual and group factors. We mean that the structure has an impact on
both attitudes and behavior because it reduces ambiguity for employees and clarifies
concerns such as “What I am supposed to do?” “To whom I report?” it shapes their
attitudes and facilitates and motivates them to higher levels of performance.
Structure also constraints employees to some extent that it limits and controls what they
should do. For an instance, organizations structured around high levels of formalization
and specialization, strict adherence to the chain of command, limited delegation of
authority, and narrow spans of control give employees little autonomy. Controls in such
organization are tight, and behavior will tend to vary within narrow range. In contrast,

51
organizations that are structured around limited specialization, low formalization, wide
spans of control, and the like provide employees greater freedom and, thus will be
characterized by greater behavioral diversity.
FOR DISCUSSION
1. All things being equal, which is more efficient, a wide or narrow span of control?
Why?
2. What is SBU? When would management use it?
3. What is a matrix structure? When would management use it?
4. Explain briefly about the organizational design types.
5. What is departmentalization? Explain briefly about its types.
SUGGESTED TEXT BOOKS
1. Stoner J.A.F, Freeman E and Daniel Gilbert, (2003) “Management”, 6th Edition,
Pearson Education, New Delhi.
2. Stephen P.Robbins, Mary Coulter, (2005), “Management”, 5th Edition, Prentice
Hall of India.
3. Robbins, (2003), “Organization Behavior”, Pearson Education, New Delhi
4. Schermerhorn, Hunt, and Osborn, (2001), “Organization Behavior”, 7th Ed. John
Wiley and Sons.
5. Shukla (2003), “Organization Theory and Practice In India”, Prentice Hall of
India, New Delhi.

52
Chapter 3
HUMAN RESOURCE MANAGEMENT

53
HUMAN RESOURCE MANAGEMENT
SCOPE OF THE COURSE
After reading chapter 3, you should be able to:
Explain the constraints under which the recruitment process takes place
Understand steps in selection process

54
Understand need for training and development Outline the methods of performance appraisal Define promotion, separation, and transfer
INTRODUCTION
Human Resource Management (HRM) is the management function deals with
recruitment, placement, training and development of organizational members. This is also
dealing with performance issues and ensuring your personnel and management practices
conform to various regulations. Activities also include managing your approach to
employee benefits and compensation, employee records and personnel policies. The
HRM function and Human Resource Development (career development, organizational
development and so on) have undergone many changes over the past years. In past, large
organizations looked to the Personnel Department, mostly to manage the paperwork
around hiring and paying people. More recently, organizations consider the HR
Department as playing a major role in staffing, training and helping to manage people so
that people and the organization are performing at maximum capability in a highly
fulfilling manner. In this chapter, two types of Human Resource processes is included for
the view of its importance.
3.1 THE HRM PROCESS
The fig 3.1 shows the HRM process includes the following activities:
1. Human Resource Planning 2. Recruitment 3. Selection

55
4. Socialization 5. Training and development 6. Performance appraisal 7. Promotions, Transfers and Separations
All the above activities are explained elaborately in the following sections.

56
Ref: Stoner et.al (2003) Fig 3.1: The Human Resource Management Process
Human Resource Planning
Recruitment Selection
Training & Development
Orientation
Performance appraisal
Promotions, Transfers, Demotions & Separations

57
ASTD MODEL FOR HRM In recent years there has been relative agreement among HRM specialists as to what
constitutes the field of HRM. The model shown in fig 3.2 that provided the focus was
developed by the American Society for Training and Development (ASTD). In its study,
ASTD identified nine human resource areas:
1. Training & Development
2. Organization and Development
3. Organization/ Job Design
4. Human Resource Planning
5. Selection and Staffing
6. Personnel Research and Information systems
7. Compensation/Benefits
8. Employee Assistance
9. Union/Labor Relations
These nine areas have been termed spokes of the wheel in that each area impacts on the
human resource outputs: quality of work life, productivity, and readiness for change. Fig
is a representation of this model, and the focus of each spoke.
Quality of Work Life
Quality of work life is a multifaceted concept. The premise of quality of work life is
having a work environment where an employee’s activities become more important. This
means implementing procedures or policies that make the work less routine and more
rewarding for the employee. These procedures or policies include autonomy, recognition,
belonging, progress and development, and external rewards. Autonomy deals with the
amount of freedom that employees can exercise in their job. Recognition involves being
valued by others in the company. Belonging refers to being part of the organization.

58
Ref: De Cenzo and Robbins (2005)
Fig 3.2: ASTD Model for HRM Progress and development refer to the internal rewards available from the organization;
challenge, and accomplishment. External rewards in the form of salary and benefits but
also include promotion, rank and status.
Productivity
Productivity is the quantity or volume of the major product or service that an organization
provides. Many components constitute the productivity factor; we can condense these
HR AREAS Outputs: • Quality of life • Productivity • Readiness for
change
TRAINING & DEVELOPMENT Focus: Identifying, assessing and- through planned learning – helping develop the key competencies which enable individuals to perform current or future job.
ORGANIZATION DEVELOPMENT
Focus: assuring healthy inter and intra- unit relationships and helping groups initiate and manage change.
ORGANIZATION / JOB DESIGN
Focus: defining how tasks, authority and systems will be organized and integrated across organization units and in individual jobs.
HUMAN RESOURCE PLANNING
Focus: determining the organization’s major human resource needs, strategies and philosophies.
SELECTION & STAFFING
Focus: matching people and their career needs and capabilities with jobs and career paths.
PERSONNEL RESEARCH & INFORMATION SYSTEMS
Focus: assuring a personnel information base.
COMPENSATION/BENEFITS
Focus: assuring compensation and benefits fairness and consistency.
EMPLOYEE ASSURANCE
Focus: providing personal problem solving, counseling to individual employees.
UNION /LABOR RELATIONS
Focus: assuring healthy union/ organization relationships.
59
components into four categories- capital investment, innovation, learning, and
motivation.
Capital investment includes having the best possible machinery available that will help
improve the efficiency of the workers. This machinery or equipment can be in many
forms –from roots to word processors.
Innovation is a process whereby new and creative ideas are welcomed, studied for their
feasibility and if feasible, implemented.
Learning looks at training issues. Not only do we want individuals to work effectively but
we want them to be efficient as well. For this, employees must have the proper skills; and
in many cases, these skills have to be taught.
Productivity is contingent on an employee’s motivation. The best trained employee, one
who not only has the ability but has access to the most advanced piece of equipment, will
not be productive if he or she is unwilling to be so. Attitude plays an important role as to
whether an individual has the propensity to work. Accordingly, to increase productivity
we must in part change an employee’s attitude or in academic terms, increase his or her
morale.
Readiness for change
Change is a fact of life-in both our private and our work lives. At the work site, we must
be aware that changes will occur. The change might be subtle, such as getting a new boss.
Or it might be a major endeavor, such as an organization installing a computer system for
the first time-automating many of the manual operations. But change rarely comes easily
for everyone; in some cases it is resisted. To reduce the fear associated with change,
training is important. From an organizational perspective, employers must make changes
to remain competitive. But it is also their responsibility to communicate the forthcoming
changes to their employees, identify why the changes are necessary, and lend their total
support in ensuring that the change takes place. Through this process, employers can
create a work atmosphere that views change as a positive and progressive endeavor.

60
3.2 HUMAN RESOURCE PLANNING
Human resource planning is the planning done for the future personnel needs of an
organization taking into account both internal factors in the external environment.
Internal factors such as current and expected skill needs, vacancies and departmental
expansions and reductions are considered. Labor market is considered as the factor in the
environment.
3.2.1 Developing a Human Resources Plan
HR plan can serve as information for many purposes such as:
• Identifying HR requirements to better meet business objectives
• Promoting career planning
• Reducing the time and cost of future staffing
• Signaling potential work load and work force adjustment
• Predicting potential shortfalls in the labor force and market availability
• Highlighting retirements and resignations and developing appropriate succession
plans
• Identifying seasonal hiring patterns
For making effective planning procedures, some of the basic aspects are required. They
are planning for future needs and objective by deciding what skills of people the
organization need and by setting departmental strategic objectives for the next year and
next three years. The second aspect is planning to balance of future by comparing
forecasted supply and future demand. The organization's future supply and demand for
employees to meet the business plans involves the functions need to be performed and the
current functions evolve in the organization. The structuring the organization also leads
to forecast supply through grouping the positions and levels. Type of competencies or
qualifications is required, also used to forecast supply. Fig 3.3 shows the steps for
effective human resource planning.
The capabilities and capacities of the organization's current workforce mean that there are
existing employees who can do the work at this time. At the same time analyzing the

61
strengths and weaknesses of the existing people is significant. The most important factor
is the labor markets in which likely candidates are located to forecast supply.
The third aspect is planning for recruiting and laying off the employees in the
organization. This is sometimes called as downsizing or restructuring the organization.
HR manager at many companies helps the laid off employees to find new job. And the
final aspect is planning to develop HR plan. This is to ensure that the organization has the
steady supply of skilled personnel. 3.3 RECRUITMENT
Recruitment is the process whereby a firm attracts or finds capable individuals to apply
for employment. Of course, the objective is to find these applicants at the lowest possible
cost. This process begins when new recruits are sought and ends when applicants have
submitted application forms or resumes. The result is a pool of job-seekers from which
the firms can select the most qualified. Smart companies recruit employees they can
retain, and retention depends on getting the right people in the right job in the first place.
Before going to recruitment, the job analysis to be done (i.e. an analytical study of the
tasks to be performed to determine their essential factors) written into a job description so
that the selectors know that the applicants physical and mental characteristics. It is useful
to investigate the desirable qualities and attitudes
Selection is buying an employee (the price being the salary multiplied by probable years
of service) and bad buys can be very expensive. For that reason some firms use external
expert consultants for recruitment and selection. However, the cost of poor selection is
such that, even for the ordinary day to day jobs, those who recruit and select should be
well trained to judge the suitability of applicants. 3.3.1 Sources of Recruitment
• Internal promotion
• Employment Exchanges
• Agencies for the unemployed
• Advertising (often via agents for specialist posts)
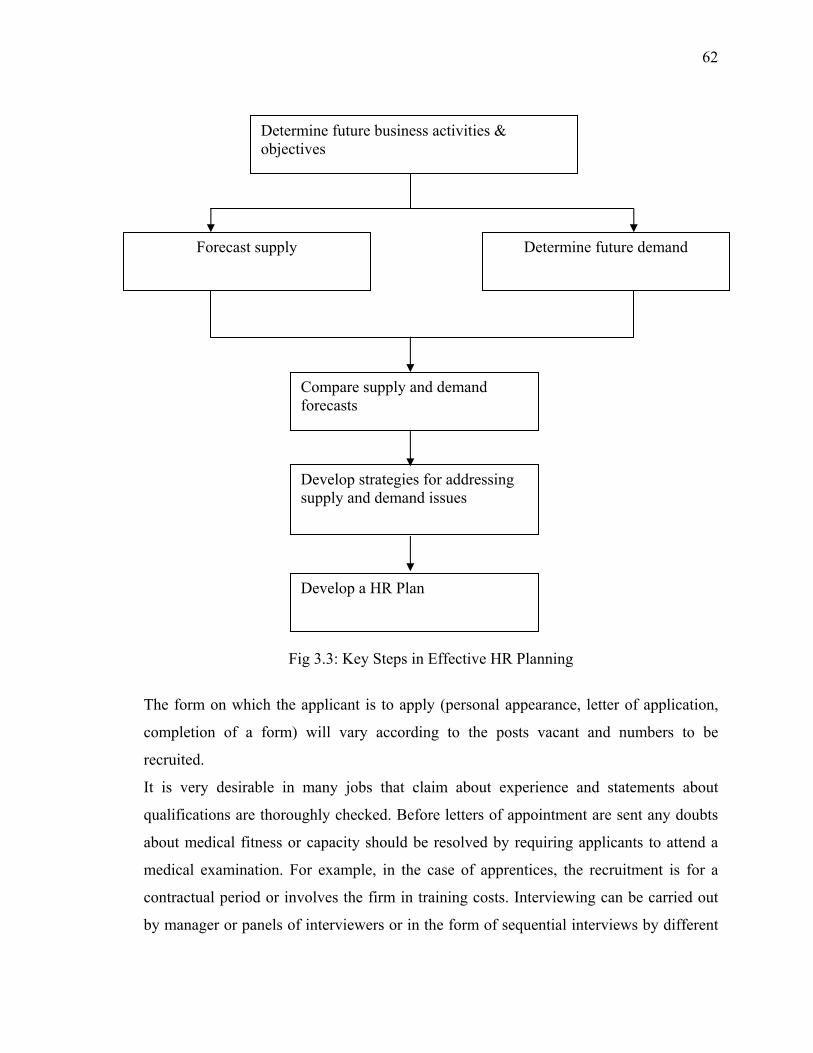
62
Fig 3.3: Key Steps in Effective HR Planning
The form on which the applicant is to apply (personal appearance, letter of application,
completion of a form) will vary according to the posts vacant and numbers to be
recruited.
It is very desirable in many jobs that claim about experience and statements about
qualifications are thoroughly checked. Before letters of appointment are sent any doubts
about medical fitness or capacity should be resolved by requiring applicants to attend a
medical examination. For example, in the case of apprentices, the recruitment is for a
contractual period or involves the firm in training costs. Interviewing can be carried out
by manager or panels of interviewers or in the form of sequential interviews by different
Determine future business activities & objectives
Forecast supply
Determine future demand
Compare supply and demand forecasts
Develop strategies for addressing supply and demand issues
Develop a HR Plan

63
experts and can vary from a five minute 'chat' to a process of several days. Ultimately
personal skills in judgment are probably the most important, but techniques to aid
judgment include selection testing for: Aptitude test, General intelligence. In more senior
posts other techniques are: Leaderless groups, Command exercises and Group problem
solving.
Training in interviewing and in appraising candidates is clearly essential to good
recruitment. For consistency rating often consists of scoring candidates for experience,
knowledge, physical or mental capabilities, intellectual levels, motivation, prospective
potential, leadership abilities. These are all according to the needs of the post. 3.3.2 Constraints on Recruitment
Firms seek to recruit give guarantees the number of qualified applicants. However there
are often some constraints on the recruitment process. They are:
• Organizational Policies
• Affirmative action Programs
• Recruiter Habits
• Environmental Conditions
• Job Requirements
Organizational Policies
An example of an organizational policy might be a promote from within policy. Such
policies are encountered in unionized firms where the collective agreement stipulates that
job openings must be posted internally prior to seeking applicants from outside the
organization.
Further, in many unionized environments, policies may restrict the number of part-time
employees working for the firm. This is clearly a recruitment constraint in so far as it
places limitations on the firm. However, it may well also limit the number of applicants
because some very highly qualified applicants may simply prefer part-time employment.

64
Affirmative action Plans
Occasionally, firms may adopt affirmative action policies in an effort to attain a
workforce that is more representative of the general public. In efforts to increase
workforce diversity, firms may choose to voluntarily hire persons with specific
characteristics. More often, such affirmative action policies are mandated by law.
Recruiter Habits
Recruiter habits may also constitute a recruitment constraint. For example, past successes
may lead to habits or preferred tendencies in recruitment. One recruiter, who had played
cricket, had considerable success recruiting other cricket enthusiasts. Whereas he had
luckily an initial success, he may seek out cricket players in his recruitment. Obviously,
cricket skills are not necessarily the indicators of job related success. Such recruiter
habits do not constitute good recruitment practices.
Environmental Conditions
The rate of unemployment in an area can have an influence on recruitment. High
unemployment or surplus of labor supply may result in a larger number of skilled
applicants for a particular job. For example firms can take advantage of layoffs in related
industries as skilled workers become available. On the other hand, the recruiting activities
of competitors can limit the supply of qualified applicants.
Changes in legislation governing the employment of certain classes of employees can
also constrain recruitment activities. If the degree of qualification necessary to do a
particular job is changed by way of legislation, then the firm's recruitment activities may
also need to change.
Job Requirements
Generally, skilled workers are more difficult to find than unskilled workers. A limited
pool of potential applicants causes firms to use different recruiting techniques. Whereas
an advertisement placed in a newspaper's classified section may serve to attract unskilled
workers, recruitment of skilled workers may require more sophisticated techniques.

65
3.3.3 Internal Recruitment
Should the recruitment process be started from internally or externally? There is nothing
inherently better about either internal or external recruitment. However, there are some
advantages to internal recruitment.
• Increased morale for employees (one promotion leads to another vacant position
and this chain effect contributes further to increased morale)
• Reward good performance or loyalty.
• Human Resource data is immediately available for any employee recruited
internally.
• Organization can save money with no orientation sessions because an internal
recruit will be familiar with the firm. This employee will be familiar with the
firm's products, clients, organizational policies, and corporate culture.
The disadvantages of this recruitment are
• Whereas the firm saves money by eliminating orientation sessions for employees
recruited internally, other training costs may go up. If company policies mandate
internal recruitment, then employees promoted from within may not have all the
requisite skills required for the job. In such cases, employees will have to be
trained for their new jobs. This can be a costly process.
• Another unintended negative consequence of internal recruitment might be
organizational politics. This may occur when more than one employee aspires to
the job vacancy. Those not getting the promotion will be disappointed and may be
unwilling to grant the new job-holder the authority required to do the job. Further,
the unsuccessful applicants co-workers may also resent the successful candidate.
3.3.4 External Recruitment
The opposite of internal recruitment is external recruitment. The most obvious advantage
of external recruitment is the availability of a greater pool of applicants. Thus, only those
applicants who have the exact qualifications will apply and be selected. This has
consequences for the organization's training budget. Whereas external recruits will
require orientation upon being hired, they will not require any extra training.

66
External recruits also bring new ideas and external contacts to the firm hiring them. Also,
if political infighting over a promotion might be a possibility, then external recruitment is
one way of eliminating that occurrence.
3.3.5 Internet Recruiting
Finding well-qualified applicants quickly at the lowest possible cost is a primary goal for
recruiters. Recent trends indicate that, if you're looking for a job in the technical field or
to fill a technical job, you need consider using the Internet. The same may well be true
for non technical jobs in the near future.
Advantages
• Internet more cost-effective
• Access to more people and a broader selection of applicants
• Ability to target the type of people needed
• Access to people with a technical background who know computers
• Convenience and Ease of use
• Quicker response
Disadvantages
• Attraction of the passive job seeker, the person who is not actively searching on
the Internet
• An increased volume of applicants
• Not everyone has access to or uses the Internet
3.4 SELECTION PROCESS
Selection is the process of making a hire or no hire decision regarding each applicant for
a job. The process typically involves determining the characteristics required for effective
job performance and then measuring applicants on those characteristics. The
characteristics required for effective job performance are typically based on a job
analysis.
Recruitment is the process of generating a pool of qualified candidates for a particular
job. The firm must announce the job’s availability to the market and attract qualified

67
candidates to apply. The firm may seek applicants from inside the organization, outside
the organization or both.
3.4.1 Steps in the selection process Formal application
The figure 3.4 shows the steps in the selection process. The purpose of the formal
application indicates applicants desired position and also provides information for
interviews. This process considers the need for the position and examines the possibility
of job redesign. Human Resource Manager must make available up-to-date position
description of the job. This process finds the deficient applicants who applied for the job.
Interview
Selection committee must be constituted by the HR department before conducting
interview. In the selection committee at least one member is trained in Staff Selection.
This committee ensures all information relevant to the selection process to be kept
confidential and equal opportunity issues are drawn to the attention of members. And all
members are involved at all stages of the selection process. The committee also provides
feedback system for unsuccessful applicants. The screening interview in this process is
conducted for quick evaluation of applicants suitability. In this process selection
committee asks questions on their experience and salary expectation. It is also the process
of evaluating the qualifications of individuals in an applicant pool against established
position qualifications to determine which applicants in the pool meet minimum
qualifications.
Testing
Firms should endeavor to act on objective data and this is true for compensation
management and performance appraisal and it is certainly true for the selection process
where firms wish to assess the match between job applicants and job requirements.

68
Fig 3.4: Steps in the selection process
Selection Process
1. Formal application
5. Physical exam
3. Testing
4. Reference checks
2. Interview
6. Analysis and decision (Job offer)
Deficient qualifications
Poor references
Poor test scores
Insufficient ability, ambition, or poor interpersonal qualities
Physically unfit for the job
Overall potential is low
68
A way to ensure that selection decisions are based on objective data used employment
tests. Employment tests provide firms with objective data for purposes of comparing
applicants. Based on these data, inability or poor interpersonal qualities of applicants
are identified. As the employment test score is related to actual performance of job, it
is necessary to validate the score. This test bear the resemblance to the job related task
a successful applicants must to do.
Reference checks
Reference check is the process of obtaining information from former employers,
supervisors, co-workers or others regarding a candidate’s work performance or
behavior. This information is used by the selection committee along with other
information collected during the selection process to determine the candidate’s
suitability for the advertised position, and ultimately to determine which candidate is
best suited for employment. If any applicant had the misbehavior in the former
organization, it is possible to account his behavior. This check identifies the kind of
the applicant and is the applicant is a reliable worker?
Physical exam
In depth selection interview will be conducted before admitting applicant to physical
test.
The following steps should be followed to conduct in depth interview:
• Conduct formal job analyses
• Write accurate job descriptions
• Interviewers review job-relatedness of potential question by consulting
appropriate job descriptions
• Interviewers write out all questions before the interviews
• Use panel interviews
• Create rating forms for the interviews
• Anchor interview questions to job behaviors
• Standardize interviews
Physical examination is followed by in depth interview to ensure effective
performance of applicant and protect other employees against diseases. Also this is
useful to maintain employee’s health record and protects firm against unjust worker’s
compensation claims.
69
For this purpose many of the company has its own medical doctor.
Analysis and decision (Job offer)
This is the end of the selection process. At this stage, successful (as well as
unsuccessful) applicants must be notified of the firm's decision. Since money and
effort has been spent on all applicants, the HR department may wish to consider even
the unsuccessful applicants for other openings in the organization.
The applications of unsuccessful applicants are often kept on file and the applications
of successful applicants will be retained in the employees' personnel files. When a job
offer is made, it should include the following information:
• The position offered
• Location of the job
• Salary
• Benefits
• Starting date
• Any papers or information that should be brought on the first day of work
• Date by which the applicant must respond to your job offer, so you can move
on to the next candidate if your first choice doesn't accept.
3.5 SOCIALIZATION
Socialization involves orienting new employees in the organization and to the units in
which they will be working. It is important that new employees become familiar with
the company’s policies, procedures, and performance expectations. Socialization can
make the difference between a new worker’s feeling like an outsider and feeling like a
member of the team. Most people are starting a new job with nervous and perhaps
concerned about performing up to their employer's expectations. And also their work
is being accepted by other employees. A thorough orientation program takes time and
effort but will increase worker productivity, decrease confusion, and provide
satisfaction for both employer and employee.
Two questions need to be answered in regards to the orientation of a new employee.
They are who will orientate the new employee? And what should be covered during
orientation? One person should be in charge of handling orientation certainly by the
HR people. Having just one individual in charge of orientation ensures a consistent

70
message to new employees. The orientation of a new employee can involve several
people even though one person has overall responsibility.
Information covered will change from organization to organization but a basic core of
material should be discussed with the new employee, including such specific
characteristics of the organization as layout of operation, other employees, history,
mission, goals, and role of the employee. This kind of information provides the big
picture of the farm to the employee. Personnel policies including probationary period,
disciplinary actions, work schedule, safety rules, and use of equipment also need to be
covered.
New employees are always interested in their benefits. Items such as pay, vacation,
sick leave, and other benefits should be covered. Discuss specific responsibilities the
new employee will be assigned, how the job relates to other work and safety rules.
Finally, be sure to introduce the new employee to management team, including family
members and other employees. It is helpful to develop an employee handbook so
policies and benefits can be accessible and clear to both employer and employee.
Answer all of the immediate questions that the new employee might have. It is
important to develop open, two-way lines of communication between the employer
and employee right from the beginning. Consider the time spent for orientation as an
investment for both you and the employee. The well-defined expectations will pay
dividends and reduce possible misunderstandings between employer and employee.
By orientating the new employee properly, a smooth transition can be made to train.
3.6 TRAINING AND DEVELOPMENT
Training program is a process designed to maintain or improve current job
performance. Development process is a process designed to develop skills necessary
for further work activities.
Within an organization training and development is necessary in order to:
• Develop workers to undertake higher-grade tasks;
• Provide the conventional training of new and young workers
• Raise efficiency and standards of performance;
• Meet legislative requirements (e.g. health and safety);
• Inform people (induction training, pre-retirement courses, etc.);

71
From time to time meet special needs arising from technical, legislative and
knowledge need changes. Meeting these needs is achieved through the training loop.
The diagnosis of other than conventional needs is complex and often depends upon
the intuition or personal experience of managers and needs revealed by deficiencies.
Group training is concerned in addition to formal courses there are:
• Lectures and talks by senior or specialist managers
• Discussion group (conference and meeting) activities
• Briefing by senior staffs
• Role-playing exercises and simulation of actual conditions
• Video and computer teaching activities
• Case studies (and discussion) tests, quizzes, games, observation exercises and
inspection and reporting techniques.
Evaluation of the effectiveness of training is done to ensure that it is cost effective, to
identify needs to modify or extend what is being provided, to reveal new needs and
redefine priorities and most of all to ensure that the objectives of the training are
being met.
The latter may not be easy to ascertain where results cannot be measured
mathematically. In the case of attitude and behavioral changes sought, leadership
abilities, drive and ambition fostered, etc., achievement is a matter of the judgment of
senior staffs. Exact validation might be impossible but unless on the whole the
judgments are favorable the cooperation of managers in identifying needs, releasing
personnel and assisting in training ventures will cease.
3.6.1 Steps in Training
The training process can be broken down into five steps each of these will assist the
employer or trainer in understanding this process.
Prepare : The first step in this process is to prepare the learner. The trainer should put
the learner at ease and explain why the skill to be learned is important. Explain any
hazards or problems that may be involved and how to deal with them. Answer any
questions that the learner may have about the task.
Tell : Explain the task thoroughly. Break it down into key parts or steps. Most
employees will find that learning several smaller tasks and putting those together is
easier than trying to learn one large skill all at once.

72
Show : Demonstrate for the employee exactly how the task or skill is to be performed.
Involve the employee by asking questions and getting feedback. Have the learner
explain the process or skill back to the trainer.
Do :The learner now has the opportunity to perform the task. The trainer needs to help
the learner develop confidence by at first carefully monitoring the learner, then
allowing him/her to work without supervision. The employee needs to make sure that
the employee performs each step correctly and avoids developing any bad habits.
Review : Provide honest feedback to the learner in terms of encouragement,
constructive criticism and additional comments. This is a great opportunity to praise
the employee or correct his/her progress. [Dr. Bernie Erven] 3.6.2 Management Development Programs
On the job methods
Coaching is the training of an employee by his/her immediate superior. The definition
of coaching is
“a process that enables learning and development to occur and thus performance to
improve. To be a successful a Coach requires a knowledge and understanding of
process as well as the variety of styles, skills and techniques that are appropriate to
the context in which the coaching takes place” [Eric Parsloe, 1999].
The coach facilitate the exploration of needs, motivations, desires, skills and thought
processes to assist the individual in making real, lasting change. He/she use
questioning techniques to facilitate subordinate own thought processes in order to
identify solutions and actions rather than takes a wholly directive approach. The other
functions of coach are
• Support the junior in setting appropriate goals and methods of assessing
progress in relation to these goals
• Observe, listen and ask questions to understand the subordinate situation
• Creatively apply tools and techniques which may include one to one training,
facilitating, counseling & networking.
• Encourage a commitment to action and the development of lasting personal
growth & change.
• Ensure that subordinates develop personal competencies and do not develop
unhealthy dependencies on the coaching or mentoring relationship.

73
• Evaluate the outcomes of the process, using objective measures wherever
possible to ensure the relationship is
• Encourage to continually improve competencies and to develop new
developmental alliances where necessary to achieve their goals.
• Work within their area of personal competence.
• Possess qualifications and experience in the areas that skills-transfer coaching
is offered.
• Manage the relationship to ensure the subordinate receives the appropriate
level of service and that programmes are neither too short, nor too long.
Job rotation involves shifting employees from position to position so that they can
broader their experiences and familiarize themselves with various aspects of firm’s
operations. For an example one day a manager may be working in one part of the
factory and the next day he/she may work in a different part. This avoids the
employee becoming bored as with job rotation they are doing different jobs all the
time and learning new skills. Multi skilling is when people have many skills so they
are able to carry out many different jobs. Multi skilling benefits the employer as if
they are short of staff in one area, they can move people across.
In training positions, trainees are given staff post under a manager as ‘assistant to’.
This is done because to create a chance to work with senior manager.
In planned work activities, trainees are given some assignments to improve their
ability and also asked them to participate in an important meeting to get develop
skills.
Off the job methods
There are many off the job methods. Two of the most important methods are
Class room instruction: Experts from inside or outside of the organization teach
trainee a particular subject. Analyzing case studies, role playing and business games
are the part of the class room instruction.
University-sponsored management development programs: This type of programs is
conducted from a week to three months or more. All IIMs are conducting such type of
programs for managers.

74
3.7 PERFORMANCE APPRAISAL
Performance appraisal may be defined as a structured formal interaction between a
subordinate and supervisor, that usually takes the form of a periodic interview (annual
or semi-annual), in which the work performance of the subordinate is examined and
discussed, with a view to identifying weaknesses and strengths as well as
opportunities for improvement and skills development.
Performance appraisal systems began as simple methods of income justification. That
is, appraisal was used to decide whether or not the salary or wage of an individual
employee was justified. The process was firmly linked to material outcomes. If an
employee's performance was found to be less than ideal, a cut in pay would follow.
On the other hand, if their performance was better than the supervisor expected, a pay
rise was in order. Little consideration, if any, was given to the developmental
possibilities of appraisal. If was felt that a cut in pay, or a rise, should provide the
only required impetus for an employee to either improve or continue to perform well.
In many organizations - but not all - appraisal results are used, either directly or
indirectly, to help determine reward outcomes. That is, the appraisal results are used
to identify the better performing employees who should get the majority of available
merit pay increases, bonuses, and promotions. These appraisal results are used to
identify the poorer performers who may require some form of counseling or in
extreme cases, dismissal or decreases in pay.
3.7.1 Basic Purposes
Performance appraisal systems contain two basic systems operating in conjunction.
• evaluation system
• feedback system
The main aim of the evaluation system is to identify the performance gap. This gap is
the shortfall that occurs when performance does not meet the standard set by the
organization as acceptable. The main aim of the feedback system is to inform the
employee about the quality of his or her performance.
3.7.2 Appraisal Methods
The three most common appraisal methods in general use are
• Rating scales

75
• Essay methods
• MBO methods
3.7.2.1 Rating Scales
The rating scale method offers a high degree of structure for appraisals. Each
employee trait or characteristic is rated on a bipolar scale that usually has several
points ranging from poor to excellent.
The traits assessed on these scales include employee attributes such as co-operation,
communications ability, initiative, punctuality and technical skills. The nature and
scope of the traits selected for inclusion is limited only by the imagination of the
scale's designer.
The one major provision in selecting traits is that they should be in some way relevant
to the appraisee's job. The traits selected by some organizations have been unwise and
have resulted in legal action on the grounds of discrimination.
Advantages
The advantage of rating scales are
• Structured and standardized.
• Encourages equality in treatment for all appraisees
• Easy to use and understand.
Disadvantages
The disadvantages of rating scales are
• Irrelevant rating-scale traits of appraises
• Assumption that all the true and best indicators of performance are included
and all false and irrelevant indicators are excluded.
• Perceptual Errors
This includes various well-known problems of selective perception as well as
problems of perceived meaning. Selective perception is the human tendency to
make private and highly subjective assessments of what a person is really like
and then seek evidence to support that view. An example is the supervisor
who believes that an employee is inherently good (halo effect) and so ignores
evidence that might suggest otherwise. Instead of correcting the slackening
employee, the supervisor covers for them and may even offer excuses for their

76
declining performance. On the other hand, a supervisor may have formed the
impression that an employee is bad (horns effect). The supervisor becomes
unreasonably harsh in their assessment of the employee, and always ready to
criticize and undermine them.
• Problems of perceived meaning
This occurs when appraisers do not share the same opinion about the meaning
of the selected traits and the language used on the rating scales.
• Rating Errors
3.7.2.2 Essay Method
In the essay method approach, the appraiser prepares a written statement about the
employee being appraised. The statement usually concentrates on describing specific
strengths and weaknesses in job performance. It also suggests courses of action to
remedy the identified problem areas. The statement may be written and edited by the
appraiser alone, or it be composed in collaboration with the appraisee.
Advantages
• Less structured than rating scale method.
• Examines relevant attribute of performance.
• freedom of expression
Disadvantages
• Time-consuming
• Difficult to administer.
• Through freedom of expression appraisers can upset and distort.
• Difficult to compare and contrast the results of individuals
3.7.2.3 MBO (Management By Objectives)
MBO methods of performance appraisal are results-oriented ie, they seek to measure
employee performance by examining the extent to which predetermined work
objectives have been met. Usually the objectives are established jointly by the
supervisor and subordinate.

77
An example of an objective for a Production manager might be: Increase the
production volume to 15000 units by 30 November.
Once an objective is agreed, the employee is usually expected to self-audit; that is, to
identify the skills needed to achieve the objective. Typically they do not rely on others
to locate and specify their strengths and weaknesses. They are expected to monitor
their own development and progress.
Advantages
• Concentrates on actual outcomes.
• Employees are judged according to real outcomes and not on their potential
for success
• Results can be observed whereas the traits and attributes of must be guessed at
or inferred.
• Recognizes the fact that it is difficult to neatly dissect all the complex and
varied elements that go to make up employee performance.
Disadvantages
• Leads to unrealistic expectations about what can and cannot be reasonably
accomplished.
• Inflexible objectives to survive by the organization.
3.8 Benefits of Appraisal
• Appraisal offers a valuable opportunity to focus on work activities and goals,
to identify and correct existing problems and to encourage better future
performance. Thus the performance of the whole organization is enhanced.
• Performance appraisal can have a profound effect on levels of employee
motivation and satisfaction for better as well as for worse.
• Performance appraisal offers an excellent opportunity perhaps the best that
will ever occur - for a supervisor and subordinate to recognize and agree upon
individual training and development needs.
• Appraisal data can be used to monitor the success of the organization's
recruitment and induction practices.

78
3.9 PROMOTIONS, TRANSFERS AND SEPARTIONS
The movement of personnel within an organization is their promotion, transfer,
demotion and separation. These are the major aspects of human resource
management.
3.9.1 PROMOTIONS
Promotion is the shift of an employee from one position to another having more
responsible duties or involving more skill (higher classification). To be promoted, the
employee must meet the qualification required by the new position. Provisions will be
made by each institution to provide opportunities for promotion. Promotions are most
significant way to recognize superior performance. So this is to be fair and based on
merit and untainted by favoritism. Even if it is fair, it creates a number of problems.
1. Employees who bypassed for promotion feel resentful which may affect their
morale and productivity.
2. Discrimination against women, older employees and minority groups in
promotion.
3.9.2 TRANSFERS
Transfer is defined as the reassignment of an employee without examination from one
position to another position in the same class or to a position in a similar or related
class with the same salary range. Transfers are used to give people to broader their job
experiences as their part of development. This is mainly done to fill vacancy. Many
times inadequately performing employees may be transferred to other jobs simply
because a senior manger is reluctant fire them. Some employees are refusing transfers
because they do not want to move their families.
3.9.3 SEPARATION
Separation means that a person is leaving active duty, but not necessarily leaving the
service entirely.
Resignation:
Employees who voluntarily resign from organization normally expected to give at
least one month prior notice. The notice is to be written and should include the
specific reason for the resignation as well as the proposed separation date.

79
Dismiss
Before dismissing an employee, employer must be aware of potential allegation of
wrongful dismissal if required, seek legal advice and advise employee of dismissal in
private with the help of witness present and provide copies of documentation, if
requested (written warnings, company policy and performance appraisals)
Lay off
Lay off is the separation from a permanent position because of lack of work or lack of
funds, or because the position has been abolished or reclassified, or because an
employee has exhausted all leave privileges after illness or injury.
SUMMARY
Employers usually find advantageously to use internal promotion and transfer to fill
vacancies because it rewards employees for past performance and send signal to other
employees that their future efforts will pay off. Outside sources for recruitment are
especially useful for filling jobs with special qualifications and to acquire individuals
with new skills, ideas, and perspectives. Interviews are customarily used in
conjunction with application forms, biographical information blanks, references,
background investigations, medical examinations, cognitive ability tests, job
knowledge tests, and work sample tests. The interviews can be unstructured, wherein
the interviewer is free to pursue whatever approach and sequence of topics might
seem appropriate.
In addition to provide training needed for effective job performance, employers offer
training in such areas as personal growth and wellness. Managers must establish a
context for training by deciding where training is needed, how it connects with
strategic goals, and how organizational resources can best be used. On-the-job and
off-the-job are used to train of non managerial personnel by apprenticeship training
and classroom training respectively.
Performance appraisal programs serve many purposes, but in general those purposes
can be clustered into two categories: administrative and developmental. The
administrative purposes include decisions about who will be promoted, transferred, or

80
laid off. Developmental decisions include those related to improving and enhancing
an individual’s capabilities.
FOR DISCUSSION
1. What are the advantages and disadvantages of filling openings from internal
sources?
2. Explain briefly about the steps for the selection process.
3. Personality tests, like other tests used in employee selection, have been under
attack for several decades. What are the some of the reasons why applicants
find personality tests objectionable? On what basis could their use for
selection purposes be justified?
4. A new employee is likely to be anxious the first two days on the job.
a. What are some possible causes of this anxiety?
b. How may the anxiety be reduced?
5. Indicate what training methods you would use for each of the following jobs.
Give reasons for your choices.
File clerk, computer operator, pizza maker
6. What are the major purposes of performance appraisal?
7. Describe the relationships among performance appraisal and selection,
training and development.
SUGGESTED TEXT BOOKS
1. Stephen P.Robbins, Mary Coulter, (2005), “Management”, 5th Edition,
Prentice Hall of India.
2. De Cenzo D and Robbins S.P, “Personnel Human Resource Management” 5th
Edition, Prentice Hall of India, New Delhi.
3. Flippo E, “Personnel Management”, 6th Edition, Tata McGraw Hill, New
Delhi.
4. Dessler G, “Human Resource Management”, Prentice Hall of India, New
Delhi.

81
Chapter 4
QUALITY MANAGEMENT

82
QUALITY MANAGEMENT
SCOPE OF THE COURSE
After reading chapter 4, you should be able to:
Explain Deming’s 14 points on quality Outline the principles of quality management Understand TQM Understand benchmarking process Understand need of ISO 9000

83
INTRODUCTION
4.1 Definition
Quality management is the policy and associated procedures, methods and standards
required for the control of projects. The purpose of quality management is to increase
certainty by reducing the risk of project failure. It also provides the opportunity for
continuous improvement.
4.2 Deming’s 14 points
Point 1: Create constancy of purpose toward improvement of the product and service
so as to become competitive, stay in business and provide jobs.
One management concern must be to deal with running the business on a day-to-day
basis and the other must be to look after the future of the business. The latter requires
constancy of purpose and dedication to improvement. Top management must spend
time to innovate, put resources into research and education, constantly improve the
design of the product and service, and put resources into maintenance of equipment,
furniture and fixtures.
In this point Deming is thus condemning 'short-termism'.
Point 2: Adopt the new philosophy. We are in a new economic age. We no longer
need live with commonly accepted levels of delay, mistake, defective material and
defective workmanship.
Deming's new philosophy is simple. The levels of error that could be tolerated
yesterday cannot be tolerated today. Deming stresses that only management is in the
position to do something about the vast majority of errors and it is management's task
to remove the obstacles that prevent the worker from doing the job correctly.
Point 3: Cease dependence on mass inspection; require, instead, statistical evidence
that quality is built in.

84
The problem with mass inspection is that it is an attempt to control the product rather
than the process, and in any case, mass inspection is frequently subject to high levels
of inaccuracy. In short, it is too late, ineffective and costly.
Point 4: Improve the quality of incoming materials. End the practice of awarding
business on the basis of a price alone. Instead, depend on meaningful measures of
quality, along with price.
Many of the problems of poor quality and low productivity are due to the poor quality
of incoming materials and the low quality of tools and machines.
Point 5: Find the problems; constantly improve the system of production and service.
There should be continual reduction of waste and continual improvement of quality in
every activity so as to yield a continual rise in productivity and a decrease in costs.
Point 6: Institute modern methods of training and education for all. Modern methods
of on-the-job training use control charts to determine whether a worker has been
properly trained and is able to perform the job correctly. Statistical methods must be
used to discover when training is complete.
Point 7: Institute modern methods of supervision. The emphasis of production
supervisors must be to help people to do a better job. Improvement of quality will
automatically improve productivity. Management must prepare to take immediate
action on response from supervisors concerning problems such as inherited defects,
lack of maintenance of machines, poor tools or fuzzy operational definitions.
It is part of a supervisor's job to coach the people that are being supervised.
Point 8: Fear is a barrier to improvement so drive out fear by encouraging effective
two-way communication and other mechanisms that will enable 'everybody to be part
of change, and to belong to it'. Fear can often be found at all levels in an organisation:
fear of change, fear of the fact that it may be necessary to learn a better way of
working and fear that their positions might be usurped frequently affect middle and
higher management, whilst on the shop-floor, workers can also fear the effects of
change on their jobs. The results of fear can be seen in inspection: operators may
record incorrectly the results of inspecting their own work for fear of exceeding the
quota of allowable defects and inspectors may falsify results to avoid the wrath of
their colleagues.
Point 9: 'Break down barriers between departments and staff areas. People in different
areas such as research, design, sales, administration and production must work in
teams to tackle problems that may be encountered with products or service'.

85
Barriers result in sub optimisation as each area tries to do what is best for itself rather
than co-operating in order to achieve what is good for the organisation as a whole.
Deming points out that one clear symptom of sub optimisation is proliferation of
paperwork. Quoting studies that show that 14 per cent of freight charges are spent on
paperwork.
Point 10: 'Eliminate the use of slogans, posters and exhortations for the work force,
demanding zero defects and new levels of productivity without providing methods.
Such exhortations only create adversarial relationships; the bulk of the causes of low
quality and low productivity belong to the system, and thus lie beyond the power of
the work force'.
Although Deming is portrayed by some authors as being against the use of all posters,
he does spell out a type of poster that he feels would be useful.
Posters that explain to everyone on the job what the management is doing month by
month to (for example) purchase better quality of incoming materials from fewer
suppliers, better maintenance, or to provide better training, or statistical aids and
better supervision to improve quality and productivity, not by working harder but by
working smarter, would be a totally different story, they would boost morale. People
would then understand that the management is taking some responsibility for hang-
ups and defects. and is trying to remove obstacles?
Point 11: 'Eliminate work standards that prescribe numerical quotas for the work
force and numerical goals for people in management. Substitute aids and helpful
leadership; use statistical methods for continual improvement of quality and
productivity'.
Joiner and Scholtes cite examples that support Deming's argument against such
schemes as management by objectives (MBO) and management by results (MBR):
An electronics firm typically ships 30% of its production on the last day of the month.
Why? In order to meet the monthly shipment quota. How? By expediting parts from
around the country, by moving partially completed instruments ahead of their place in
line and, occasionally, by letting quality standards slip.
Another firm sometimes ships incomplete instruments. A service representative then
flies around the country installing the missing parts. The shipment quota for the
month is met again. Profits, at least on paper, hold firm.
A chemical plant reports it cannot efficiently run at the mandated inventory levels, so
it keeps inventories higher until June 30 and December 31 when inventories are

86
measured. For those days, it depletes the inventories to an acceptable level, perhaps
losing two days production as a consequence.
Many managers annually negotiate safe goals and manage to exceed them, just barely.
Some managers include on their list of negotiable goals [figures] which were already
secretly accomplished prior to the negotiations.
Production which exceeds the standards is stored so it can be pulled out and used
another day.
Joiner and Scholtes also cite the following entertaining example, which we suspect
might be apocryphal:
It is interesting to note that Management by Control is widely used in the Soviet
Union. Typical is this story. Several years ago there was a surplus of large nails and a
shortage of small ones. Why? Managers were held accountable for the tons of nails
produced. Later the control was changed to the number of nails produced. This led to
a shortage of large nails, since the smaller nails gave higher counts. Neave cites an
example taken from Deming of what should be done instead of using the types of
control based on arbitrary targets which Deming claims do not work:
Christine had a job with an airline, answering the telephone to give information and to
make reservations. She had just been told to increase her number of calls to 25 per
hour... Deming [suggested] what could be done to improve matters. Christine could
classify the type of call (information, reservation, our airline, other airlines, etc.). The
times for the various types of calls could be automatically recorded. The processes
involved in these various strata could be examined to see if they were stable or not; if
not, special causes could be identified and appropriate actions taken. Once the
processes were stabilised, data could be analysed to better understand common causes
of variation, and then maybe systems (computer information systems, documented
information, etc.) could be improved so that Christine could deal with her calls more
efficiently and thus satisfy more customers per hour. This approach would be far
more effective, and it would not demoralise her or her fellow-workers. This is not
now shooting for arbitrary goals, but is shooting instead for continual improvement.
Point 12: Remove the barriers that rob hourly workers, and people in management, of
their right to pride of workmanship. This implies, abolition of the annual merit rating
(appraisal of performance) and of management by objective. Again, the responsibility
of managers, supervisors, foremen must be changed from sheer numbers to quality.

87
Deming claims that the system of reward used in many organisations is one of the
main constraints that prevent them from developing a 'win-win' culture.
Point 13: 'Institute a vigorous programme of education, and encourage self-
improvement for everyone. What an organisation needs is not just good people; it
needs people that are improving with education. Advances in competitive position
will have their roots in knowledge'.
Point 14: Top management's permanent commitment to ever-improving quality and
productivity must be clearly defined and a management structure created that will
continuously take action to follow the preceding 13 points.
Deming stresses that the emphasis must be on action by top management, not just
support.
4.3 The Quality Management Principles
With growing global competition, Quality Management is becoming increasingly
important to the leadership and management of all organizations. Quality
Management Principles provide understanding of and guidance on the application of
Quality Management. By applying following eight Quality Management Principles,
organizations will produce benefits for customers, owners, people, suppliers and
society at large. The standard could be found at ISO 9000.
Principle 1 - Customer-Focused Organization
Organizations depend on their customers and therefore should understand current and
future customer needs, meet customer requirements, and strive to exceed customer
expectations.
Principle 2 - Leadership
Leaders establish unity of purpose and direction of organization. They should create
and maintain the internal environment in which people can become fully involved in
achieving the organization's objectives.
Principle 3 - Involvement of People
People at all levels are the essence of an organization and their full involvement
enables their abilities to be used for the organization's benefit.
Principle 4 - Process Approach
A desired result is achieved more efficiently when related resources and activities are
managed as a process.
Principle 5 - System Approach to Management
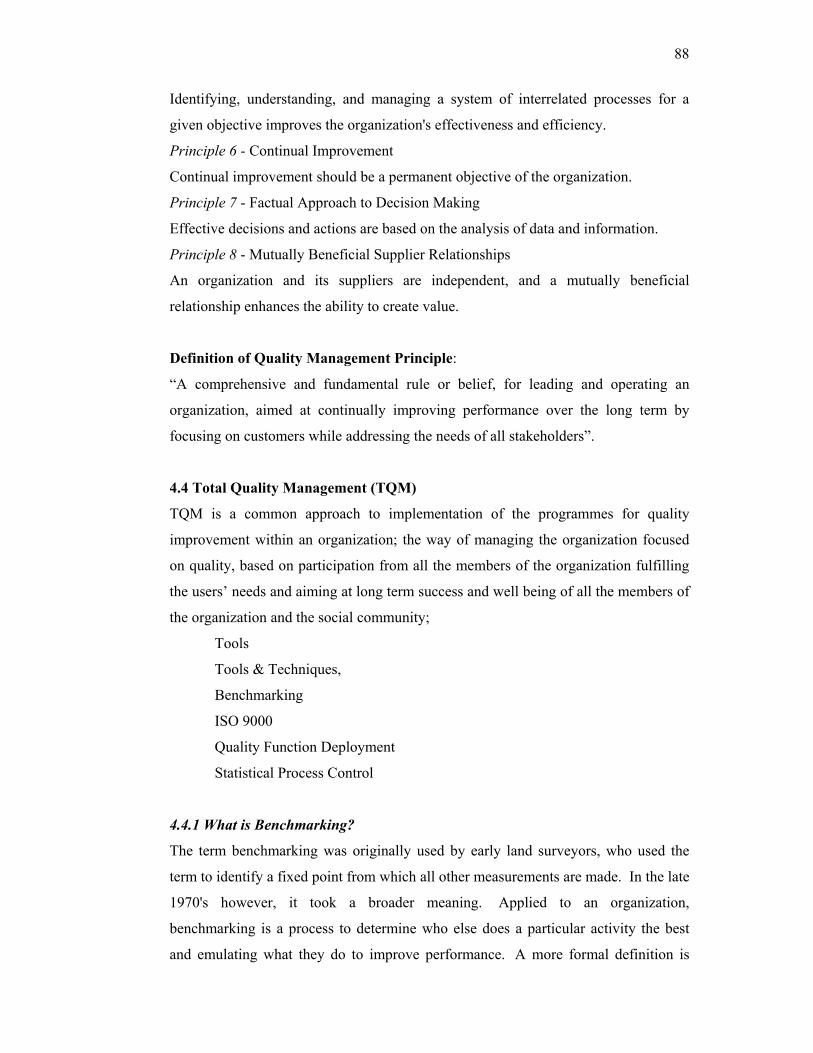
88
Identifying, understanding, and managing a system of interrelated processes for a
given objective improves the organization's effectiveness and efficiency.
Principle 6 - Continual Improvement
Continual improvement should be a permanent objective of the organization.
Principle 7 - Factual Approach to Decision Making
Effective decisions and actions are based on the analysis of data and information.
Principle 8 - Mutually Beneficial Supplier Relationships
An organization and its suppliers are independent, and a mutually beneficial
relationship enhances the ability to create value.
Definition of Quality Management Principle:
“A comprehensive and fundamental rule or belief, for leading and operating an
organization, aimed at continually improving performance over the long term by
focusing on customers while addressing the needs of all stakeholders”.
4.4 Total Quality Management (TQM)
TQM is a common approach to implementation of the programmes for quality
improvement within an organization; the way of managing the organization focused
on quality, based on participation from all the members of the organization fulfilling
the users’ needs and aiming at long term success and well being of all the members of
the organization and the social community;
Tools
Tools & Techniques,
Benchmarking
ISO 9000
Quality Function Deployment
Statistical Process Control
4.4.1 What is Benchmarking?
The term benchmarking was originally used by early land surveyors, who used the
term to identify a fixed point from which all other measurements are made. In the late
1970's however, it took a broader meaning. Applied to an organization,
benchmarking is a process to determine who else does a particular activity the best
and emulating what they do to improve performance. A more formal definition is

89
"simply the systematic process of searching for best practices, innovative ideas and
highly effective operating procedures that lead to superior performance."
Businesses such as AT&T, Motorola, Xerox, as well as most major corporations and
many smaller ones have embraced benchmarking as standard operating procedure
since the mid- to late 1980's. It has a particular significance in technology, where the
rapid change of the business climate can leave a company out in the cold. However,
governmental and non-profit organizations have begun implementing benchmarking
as late as the early 1990's.
The issue of government benchmarking was among many in Vice-President Gore's
National Partnership for Reinventing Government Report (NPR). The report states
that "federal agencies have been reinventing their operations to become more
businesslike, many have been benchmarking against worldclass private sector
companies, other organizations, and other federal agencies that have become really
good at what they do (2)." This led to the Federal Benchmarking Consortium Study
Report in February 1997. It is being used by agencies such as the EPA and NASA, as
well as the City of Reno and the Salt Lake City and various other federal, state, and
local government agencies to improve their procedures and practices.
Benchmarking is both different and similar in ways to other types of business
improvement practices. These practices include total quality management (TQM),
reengineering, and performance measurement.
Benchmarking vs. TQM
Total Quality Management, or TQM for short, consists of three main points (3). First,
collaboration with suppliers to ensure that the supplies utilized in work processes are
well designed and fit for use. Second, taking continuous employee analysis of work
processes to improve their functioning and reduce process variation. Third,
maintaining close communication with customers to identify and understand what
they want and how they define quality.
TQM works by either one of two processes, consultant-oriented TQM or project-
oriented TQM. Consultant-oriented TQM typically involves the creation of separate
quality control bodies that oversee the implementation of improvement and the
control of quality improvement procedures. This process is generally problematic in
the public-sector because the TQM bodies exist outside the chain of command,
confusing accountability. These bodies often fail to become a part of the hierarchical

90
structure of government organizations. In project-oriented TQM, some of the
shortcomings of consultant-oriented TQM are addressed. This entails including all
employees in the process and including their needs as well as the customer's, as well
as using established procedures as a foundation instead of implementing new ones.
In general, TQM uses internal methods and the ideas of people within an organization
to improve itself from the inside out. This does not include comparing one's
organization to that of another, which is critical in benchmarking. However, due to
the potential unwillingness of employees to accept ideas without understanding their
logic, both TQM and benchmarking require the input of everyone in an organization
and a general resistance to change must be overcome.
Benchmarking vs. Reengineering
Another type of method of performance review and improvement is reengineering.
Reengineering has been defined as "the fundamental rethinking and radical redesign
of business processes to achieve dramatic improvements in contemporary measures of
performance, such as cost, quality, service, and speed (4)." This generally involves
discarding old practices with completely new ones. The new practices are usually
determined from a process that requires a team and consultant to come up with,
measure, and convince others to take up new ideas.
Reengineering can be problematic in government because they are don't have profits
and completely discarding old processes and breaking down barriers between
departments run into political, trade union, or other pressures. This sometimes
results in the creation of new agencies rather than overhauling old ones.
Reengineering is very expensive and prone to failure rates in over fifty percent of
cases. It also requires TQM after its successful implementation.
While reengineering is cutting-edge and dramatic, and encourages employees to think
big, it is still an internal process. It does not involve the practices of one organization
to compare itself to those of another. While benchmarking may result in the use of
completely new ideas similar to reengineering, it often is simply improving on
existing ones. In addition, after performing reengineering, organizations often turn to
TQM, to maintain their success.
Benchmarking vs. Performance Measurement

91
“Performance Measurement is government's way of determining whether it is
providing a quality product at a reasonable cost (5).” In fact, more than half of all
U.S. cities collect performance measures of some type (6). Performance
measurement is also used in both government and the private sector for reporting to
management.
Performance measurement can be used to measure such things as productivity,
effectiveness, quality, and timeliness. When performance measures are used
extensively and consistently they can be quite effective improving an organization’s
output. Government agencies used for the following reasons (7):
• Better decision-making: it provides managers with information to perform their
management control functions;
• Performance appraisal: it links both individual and organizational performance to
aspects of personnel management and motivates public employees;
• Accountability: it fosters responsibility on the part of managers;
• Service delivery: Improvements in public service performance;
• Public participation: clear reporting of performance measures can stimulate the
public to take a greater interest in and provide more encouragement for government
employees to provide quality services; and
• Improvement of civic discourse: it helps to make public deliberations about service
delivery more factual and specific.
What benchmarking does is to use data collected as performance measures and
compare it to other organizations that perform those duties or processes. By
comparing to other organizations through benchmarking, performance measurement
becomes something other than "bean counting". However, since performance
measurement is a prerequisite to benchmarking, the two have become intertwined, but
they are not the same.
Summary Table 4.1 Comparison
TQM Performance
Measurement
Re-engg Benchmarking
Focus Internal Internal Internal External
Main
Principles
Develop dialogue
within a process to
improve it through
Take measurements for
comparison and
improvement
Develop
completely new
methods for
Compare processes with
others who do the same
and determine best

92
gradual increments obsolete or failing
processes
methods
These processes can be thought of as the following situation. An organization is
seeking improvement. First, it takes performance measures and determines what
processes need to be improved. Then, TQM can be employed to improve these
processes internally. In addition, an organization may look beyond itself to other
organizations for insight, and benchmark. If both TQM and benchmarking are not
enough of an improvement, an organization may seek re-engineering, and restructure
the whole process. In any case, performance measurement and TQM will need to be
employed to insure that the processes developed remain at the proper levels. Finally,
the whole process will need to be repeated as new improvements are needed.
4.4.1.2 The History of Benchmarking
Brief History
G.H. Watson outlines the development of benchmarking in five phases (8):
Phase 1 1950-1975 Reverse Engineering
Phase 2 1976-1986 Competitive Benchmarking
Phase 3 1982-1988 Process Benchmarking
Phase 4 1988+ Strategic Benchmarking
Phase 5 1993+ Global Benchmarking
Reverse engineering was tearing things apart, examining them, improving them, and
putting them back together. Benchmarking really began in its modern form with the
introduction of competitive benchmarking began with Rank Xerox, and its
implementation of benchmarking in beginning around 1976. This was followed by
process benchmarking which included looking for ideas outside of the direct
competition. Strategic benchmarking involves fundamentally changing the business,
not just the process (9). Global Benchmarking is the newest and involves comparing
your organization on a global scale.
The Xerox Case
In the 1970s, Xerox was the largest manufacturer of copiers in the world. However,
Japanese manufacturers were making better copiers, selling them for less, and making

93
a good profit. This prompted the company to directly compare itself with its direct
and best competitors to determine what it could do to increase productivity while
decreasing costs.
The results from their benchmarking were astonishing. They found (10):
• Xerox's ratio of indirect to direct staff was twice that of direct competition;
• It had nine times the number of production suppliers;
• Assembly line rejects were in the order of ten times worse;
• Product time to market was twice as long;
• Defects per 100 machines were seven times worse.
However, Xerox's Japanese joint venture, Fuji Xerox, was performing well. The
problem was large, and forced some changes.
Over the next five years, Xerox would have to increase productivity 18% to keep up
with its competitors. It did this through a strategy known as leadership through
quality, which became the foundation of the revival of the company. For example,
Xerox benchmarked L.L. Bean, a Maine outdoor sporting goods retailer, because of
their excellent warehouse procedures that are now the standard at most companies. It
also benchmarked almost 230 performance areas by the time it won the Malcolm
Baldridge National Quality award in 1989 (11).
Public Sector Cases
Due to the relative infancy of benchmarking in the public sector, results of many
cases are still not fully known. The demand for better for less has many taxpayer
wanting a government that acts like a business, and treats them as a paying customer.
In and age when everything is available at the click of a mouse or a swipe of a card,
no one wants a government full of red tape and long waits.
A couple of early federal examples are the Bureau of the Census and the IRS. The
Bureau of Census set up four teams that were each to do a specific task. One team
withdrew due to a lack of support from team members. Yet another withdrew
because it could not find sponsors. A third team took a very informal approach that
proved of little use. Only one team finished, but it proved difficult to even find a
room to meet and get all the team members to be there at the same time.
The IRS, however, succeeded in benchmarking its information system. The IRS hired
outside consultants. They started by speaking to top IRS executives. Then the
executives showed managers examples in benchmarking. The managers then decided

94
what to benchmark. This was followed by literature review and outside contacts.
Finally, using a method similar to Xerox’s they benchmarked four areas (12). These
included software measurement, picking and packing in form distribution centers,
personnel recruitment and retention, and assistance at walk-in taxpayer sites. As a
best-in-class performer, the Ogden, Utah site was emulated for its recognized service
record. It went so well, that they now require a benchmarking study as part of
standard methodology (13).
Successful benchmarking was done by NASA in the early 1990s as well. NASA
conducted 47 separate benchmarking studies. They have been so successful that other
federal agencies have turned to NASA for help in benchmarking.
Government benchmarking also reached state and municipal levels. States such as
Maryland and Oregon benchmark various agencies very well. Municipalities that
have benchmarked successfully include Reno, Boston, Salt Lake City, and
Indianapolis. Reno, frustrated by traffic accidents, benchmarked survey techniques
from Harrah’s Casino Hotels. After surveying residents and noting complaints, Reno
Police were able to write fewer tickets while lowering the number of accidents by
twenty percent (14). As a result, the department’s approval soared from forty percent
to ninety percent.
Growth and Demand
As mentioned earlier, benchmarking is a standard tool for most private sector
companies. However, in the case of government, it is growing very rapidly. Many
agencies and organizations nationwide and worldwide are beginning to look at
benchmarking as a tool to help them achieve better results for less. This can be much
easier in government in some cases because sharing information is "the cheapest and
most efficient, effective, and compelling means for improvement performance (15)."
Advantages:
Benchmarking has many advantages which will be discussed in this section. Rank
Xerox's experience with benchmarking led them to the following benefits (16):
• Benchmarking brings out the newness and innovative ways of managing operations.
• It is an effective team building tool.
• It has increased general awareness of costs and performance of products and
services in relation to those of competitor organizations.

95
• It brings together all the divisions and helps to develop a common front for facing
competition.
• It highlights the importance of employee involvement and, as such, encourages
recognition of individual/team efforts.
These illustrate the benefits of competitive benchmarking, which is used in both the
business sector and the public sector. Some of the advantages that will be discussed
here are team building, comprehensibility, flexibility, creativity, and evolution.
Team Building
Benchmarking cannot be successful without the full involvement of everyone in
contact with a project. It creates a united front for an organization and gives those
who work within it a common goal to accomplish. It also includes the ideas and
concerns of those affected.
Along with good work on such a project comes recognition. As mentioned there are
several awards for an organization to receive. Within an organization may be yet
more awards for individuals, teams, or agencies that have exemplary performance.
This is achieved by setting goals, then meeting, or exceeding them.
Comprehensibility
Unlike some methods, benchmarking is easy to understand. This is due largely to the
fact that benchmarking produces a direct comparison to another organization. After
determining whom to follow, you study what they do, and emulate it. There is no
misunderstanding of the overall goal of being the best.
Flexibility
Benchmarking is flexible and can be interdisciplinary. Benchmarking can be used on
almost any organization, public, private, or, non-profit. It can be fitted to a large
multinational corporation or a local shop, from a federal agency to the government of
a small village.
Identifying the best does not necessarily mean that a competitor has the best solution.
It may be a company who just does something well. When Rank Xerox needed to
make its shipping better, it relied on L.L. Bean. This sort of out-of-the-box thinking
can create new standards rather than emulating someone else's practices.
Creativity

96
Sometimes an organization might know where their goals are, but the path to meet
them is not clear. Furthermore, even if another organization is perceived to be doing
something the best, it does not mean it couldn't be done better. After clearly defining
goals, however, it can be easier to come up with new, innovative ways of getting
there. It could also create news ways of obtaining information or making
partnerships, such as Remington, a shotgun shell manufacturer, getting information on
how to make shinier shells from Maybelliene’s lip stick containers.
Evolution
Benchmarking evolves with the consumer and doesn't require a large up-front cost.
As things change in the world, so does who is the best. Because benchmarking
involves constant reiteration, evaluating and changing, it changes as the market or
consumer does. Although benchmarking is constantly in change, it isn't a big price
tag up-front. All one needs are office supplies and a list of the best performers to get
started.
Disadvantages:
Benchmarking can require a large investment in time, labor, and capital. Costs for a
large project can easily reach into the hundreds of thousands of dollars. These can be
minimized through careful, thoughtful, and deliberate planning. As Robert Graham
of Medrad notes, “Typically, there are expenses related to travel as well as indirect
costs associated with employee time devoted to trips and team meetings. With careful
planning benchmarking costs can be kept to a minimum (17).”
Size
The size and scope of a benchmarking project is related directly to the cost. An easy
way to minimize costs is to take on a stepwise approach. This minimizes the amount
of investment and risk taken concurrently.
Dividing Costs
Organizations can pool resources by taking joint benchmarking projects and dividing
costs accordingly. This is more easily done in organizations that are not directly
competing, such as government agencies. Various organizations have pooled their
resources and knowledge into benchmarking groups.
Consultants
Many consultant firms will also aid an organization in a benchmarking project. These
organizations have the technical knowledge and experience to more efficiently gather

97
and interpret data. Careful background research of a consultant must be made to
make this process more effective and it comes at a price. However, this does not
require hiring additional staff or expanding roles of current staff.
Education and Travel
Benchmarking does require education and travel costs. Once a team is chosen, they
often need to be educated on the methods of benchmarking. This is accomplished
through workshops, seminars, meetings, and courses. Then, this information must be
disseminated to others. When researching organizations, sometimes it is best to see
the organization in action and meet with the team that performed and implemented the
changes to gain first-hand knowledge of the processes involved.
Communication
One of the most important methods of keeping benchmarking costs low is effective
communication. This involves knowing what you need and where your own
deficiencies are and sharing information about yourself. Also, informing others inside
of your organization of what has been learned through reports, analyses, etc. and its
method of implementation involving flowcharts, matrices, schematics, etc. is critical.
Clear communication also lets management know how the project is going and its
status. This reduces confusion and conflicts among management and the team and
among team members themselves.
Process:
Custom Fit
As mentioned earlier, benchmarking is flexible to almost any application. The
process of how to go about benchmarking varies as much as organizations themselves
and their ideologies do. Processes vary widely by goals, philosophies, industry,
cultures, management plan, and organizational structure. This section will explain
some of the explicit processes developed by companies that have benchmarked. The
most general and best for a first-try at benchmarking is the most general process,
which is the Motorola Five-Step Process described later. An experienced
benchmarker such as Rank Xerox, use a much more detailed process.
Rank Xerox Process
Rank Xerox revolutionized business thinking with its benchmarking plan. It had a
clear goal and determined upper management team. A five-phase, twelve-step process

98
was developed by Robert C. Camp, Manager of Benchmarking Competency Quality
and Customer Satisfaction at Xerox (18):
Xerox Twelve-Step Process
Phase 1: Planning
1. Identify what to benchmark
2. Identify comparative companies
3. Determine data collection method and collect data
Phase 2: Analysis
4. Determine current performance gap
5. Project future performance levels
Phase 3: Integration
6. Communicate findings and gain acceptance
7. Establish functional goals
Phase 4: Action
8. Develop action plans
9. Implement specific actions and monitor progress
10. Recalibrate benchmarks
Phase 5: Maturity
11. Attain leadership position
12. Fully integrate practices into processes
AT&T and Other Processes
Two-time, Baldrige Award winning AT&T, an active benchmarker, has developed a
nine-step model (19):
AT&T Nine-Step Process
1. Identify what to benchmark
2. Develop a benchmarking plan
3. Choose data collection method
4. Collect data
5. Choose best-in-class companies
6. Collect data during a site visit
7. Compare processes, identify gaps, and develop recommendations
8. Implement recommendations
9. Recalibrate benchmarks

99
Other processes have been developed such as the Motorola five-step process and the
seven-step process (20).
Motorola Five-Step Process
1. Decide what to benchmark
2. Find companies to benchmark
3. Gather data
4. Analyze data and integrate results into action plans
5. Recalibrate and recycle the process
Seven-Step Process
1. Determine which function(s) to benchmark
2. Identify key performance variable to measure
3. Identify best-in-class companies
4. Measure performance of best-in-class companies
5. Measure your own performance
6. Specify programs and actions to meet and surpass
7. Implement and monitor results
SPI Five Phase Model
The model produced by the Strategic Planning Institute's (SPI) Council on
Benchmarking produced the Simple Consensus Model summarizing the five phases of
benchmarking in generic terms. This can then be mapped over the above-mentioned
processes. These fives steps are:
Step Description
1 Launch
2 Organize
3 Reach Out
4 Assimilate
5 Act
These steps can then be "mapped" onto the Motorola Five-Step Process as follows :
Table 4.2.Motorola Five-Step Process
Description Launch Organize Reach Out Assimilate Act
1. Decide what to benchmark x
2. Find companies to benchmark x

100
3. Gather the data x
4. Analyze data and integrate x
5. Recalibrate and recycle the process x
Readiness
Readiness is determining whether an organization is capable of starting and sustaining
a benchmarking process. There are five broad categories for assessing an
organization's readiness for best practices. These are (23):
• Benchmarking readiness deals with matching the benchmarking organization
and its benchmark partners on various dimensions.
• Culture readiness concerns the readiness of the benchmarking organization
and its environment for importing best practice.
• Implementation readiness covers activities that prepare the specific
organizational entity and the benchmark practice itself for implementation in
the new setting.
• Operation readiness addresses the last and most enduring issues: those that
monitor the status and insure the successful ongoing operation of the practice
once it is in place
• Technical readiness centers on the technical skills needed to conduct a
benchmarking study and to import a best practice.
Various techniques are used to determine whether an organization is ready. This can
be accomplished by asking questions or a scoring system.
4.4.2 ISO 9000
ISO 9000 - Benefits and Problems
ISO 9000 has received much publicity. Some managers see it as a prerequisite for
conducting business. For others, it substitutes for the difficulties and vagaries of Total
Quality Management (TQM). Some see only a needless bureaucratic boondoggle.
Depending on the situation, any of these views might be correct.
Sensibly applied, ISO 9000 is a qualifier for international markets or specific
domestic customers. Certification can be a valuable marketing tool. The standards are
a sound blueprint for a quality system. They can lead the way to the more difficult and
sophisticated approaches of Total Quality Management. ISO 9000 can improve a
company's cost structure by 5%-20%.

101
Approached unwisely, ISO 9000 can be costly and unproductive. It may create a
quality bureaucracy which adds to the cost structure and slows product development.
It can focus people on paperwork instead of customers. It can divert management
concentration and energy from more vital issues.
What Is ISO 9000?
The ISO 9000 standards define minimum requirements for business quality assurance
systems. These are "consensus standards" promulgated by the International Standards
Organization in Europe and the American National Standards Institute (ANSI) in the
United States. The ANSI standards are officially titled the "Q90" series. They are
identical to the ISO 9000 series and people use the names interchangeably.
Conformance is voluntary. However, many European firms use them as a requirement
for suppliers. Within the United States, some firms also use the standards for supplier
certification.
ISO 9000 (Q90) is a guideline for selection and use of quality system standards. It
provides insight for various situations and conditions as well as definitions and
explanations.
ISO 9001 (Q91) defines minimum quality system requirements for
design/development, production, installation and servicing. It is the most complete
standard. It applies to manufacturing and service businesses engaged in all these
activities.
ISO 9002 (Q92) is essentially a subset of 9001. It applies only to production and
installation activities.
ISO 9003 (Q93) applies to final inspection and test.
ISO 9004 (Q94) is a guideline for quality system elements. It is like a textbook which
describes, explains and recommends.
Requirements
The standards use proven management principles:
• Policy Definition
• Clear Responsibility & Authority
• Appropriate Documentation
• Corrective Action
• Capable People & Equipment
• Adequate Resources

102
Conformance requires that firms apply these principles to areas which impact quality.
It further requires consistent practice which is usually most difficult.
Under section 4.4, for example, ISO 9001 requires that product design projects should
be planned, that design input parameters shall be defined and at design completion,
the resulting design is confirmed as meeting the input requirements. It requires that
the design, as well as any changes, be documented. The standard also requires that
design changes be approved by the organization or persons who made the original
design.
Experienced product design engineers recognize these requirements as common
sense–– taken for granted in successful design organizations. Product design disasters
can usually be traced to violation of one or more of the above requirements.
Certification
The American Society for Quality Control has organized a Registrar Accreditation
Board (RAB). This board oversees the training and activities of assessors and certify
conformance. Certification is evidence to customers, potential customers and others
that a business meets the standard's requirements.
Assessors typically spend 1-3 days at a site. They examine documents, interview
employees and observe processes. They look for evidence to confirm compliance or
non-compliance. To obtain certification, a business may contract with an accredited
assessor. An important customer may wish to assess as part of their supplier
certification. Management may wish a self-assessment for internal evaluation.
Who Should Use ISO?
Any firm whose customers make their buying decisions on quality issues should
consider using these standards. Firms whose customers require conformance and
certification as a qualifier will need a certificate of conformance from an approved
Assessor.
Firms who perceive quality as a marketing tool may obtain certification as part of
their marketing strategy.
In markets where quality is not a dominant issue firms may use the standards as a
guide, but not attempt certification.
Firms may use the standards for their own suppliers requiring certification as a
condition of doing business.

103
Implementation
An important implementation issue is speed. Most firms require 18 months or longer
to achieve certification. Another issue is the current state of quality. Those with
severe quality problems may need a maximum effort. Is certification necessary for
your firm? Is the need urgent enough for a maximum effort? Or should the standards
be used internally for their intrinsic value?
The first step is awareness. Management must convince the organization that
conformance is important. People within the organization must know the basics.
Special purpose teams are an effective implementation tactic. They establish
procedures and practices for various parts of the organization or for certain
requirements of the standard.
An especially important requirement of the standard is ongoing self-assessment. The
authors consider self assessment and correction as essential for continuing
compliance.
Total Quality Management Fits
Total Quality Management emphasizes leadership, management, worker involvement,
low-level responsibility, process control and continuous improvement.
The standard requires clear responsibility and authority. It emphasizes decision
procedures, their documentation and implementation. The standards will enhance and
complement either TQM or conventional quality systems.
Conformance does not guarantee world-class quality. An organization can conform
and still have a mediocre output quality and a high quality cost.
Your Competitive Edge?
ISO 9000 can be many things to many organizations. For sound decisions,
management should know what it requires and, equally important, what it does not
require. The implementation should consider each firm's size, markets, and current
quality position. A knowledgeable and experienced assessor is vital.
For many firms, ISO 9000 can be part of a competitive edge. It can contribute to
marketing, reduce costs, and be a qualifier for certain markets or customers. It is a
strong foundation for Total Quality Management and Lean Manufacturing.

104
SUMMARY
Quality management is the policy and associated procedures, methods and standards
required for the control of projects. Deming’s basic message is that cause of
inefficiency and poor quality is the system, not the people, and it is management's
responsibility to correct the system to achieve desired results. Quality Management
principles provided understanding of and guidance on the application of Quality
Management. By applying eight Quality Management Principles, organizations will
produce benefits for customers, owners, people, suppliers and society at large.
Total Quality Management (TQM) is a common approach to implementation of the
programmes for quality improvement within an organization; the way of managing
the organization focused on quality, based on participation from all the members of
the organization fulfilling the users’ needs and aiming at long term success.
Benchmarking, a tool for TQM, is the systematic process of searching for best
practices, innovative ideas and highly effective operating procedures that lead to
superior performance.
FOR DISCUSSION
1. What is Quality management?
2. Explain briefly about the Deming’s view on Quality management.
3. Briefly explain about Quality management principles.
4. What is TQM?
5. What is Benchmarking? How it differs from TQM, Re-Engineering, and
performance measurement?
6. Explain briefly about ISO 9000.

105
SUGGESTED TEXT BOOKS
1. Joe Cullen and Jack, “Total Quality”, IFS.Holingum.
2. Feigenbaum, “Total Quality Control”, McGraw Hill
3. Peter J and David A, “Implementing Quality through ISO 9000”, Viva Book
Pvt Ltd, New Delhi
4. Thomason, “An Introduction to Reliability and Control”, Machinery
Publishers.
5. Grant and Leavenworth, “Statistical Quality Control”, McGraw Hill.
6. Juran J.M and Gryna Jr F.M, “Quality Planning and Analysis, Tata McGraw
Hill, New Delhi.

106
Chapter 5
STRATEGIC PLANNING

107
STRATEGIC PLANNING
SCOPE OF THE COURSE
After reading chapter 5, you should be able to:
Explain use of strategic planning Outline the steps of strategic planning Define strategic management Understand chances of increasing
strategic plan

108
INTRODUCTION
The objectives of strategic planning are including understanding the benefits of
strategic planning; understanding the products of strategic planning; and learning the
keys to successful planning and implementation. Many organizations spend most of
their time reacting to unexpected changes instead of anticipating and preparing for
them. This is called crisis management. Organizations caught off guard may spend a
great deal of time and energy "playing catch up". They use up their energy coping
with immediate problems with little energy left to anticipate and prepare for the next
challenges. This vicious cycle locks many organizations into a reactive posture.
It does not have to be that way. A sensible alternative is a well tested process called
strategic planning which provides a viable alternative to crisis management.
Strategic planning is a step by step process with definite objectives and end products
that can be implemented and evaluated. Very simply, it is a process by which we look
into the future, paint a picture of that future based on current trends, and influence the
forces that will affect us.
Strategic planning looks three to five years ahead. It charts a definite course based on
strong indicators of what the business environment will be like in those years.
Indicators include census demographic statistics, economic indicators, government
policies, and technological advances. They reveal strong trends regarding changes in
lifestyles and the economic and political climates, which are important factors
influencing the facilities planning and management industry. Some of these trends are
potential opportunities, some potential threats, and some are both. Examining the
possibilities and formulating strategies to meet the challenges can help the
organization take full advantage of opportunities and minimize threats. In short, we

109
can take control of the future. We can use our energies and resources more effectively
and conduct our business more successfully, despite changes in the environment.
5.1 Why Strategic Planning?
Besides the personal satisfaction of taking charge of the organizations future, strategic
planning offers at least five compelling reasons for its use:
Forces a look into the future and therefore provides an opportunity to
influence the future, or assume a proactive posture.
Provides better awareness of needs and of the facilities related issues and
environment.
Helps define the overall mission of the organization and focuses on the
objectives.
Provides a sense of direction, continuity, and effective staffing and leadership.
Plugs everyone into the system and provides standards of accountability for
people, programs, and allocated resources.
In summary, strategic planning is the key to helping us collectively and cooperatively
gain control of the future and the destiny of our organization.
5.2 Five Products of Strategic Planning
The overall goal of strategic planning is to produce a workable plan. Along the way,
we will develop, evaluate, and refine these five products:
Environmental issues and trends: Factors that may impact the organization and the
way it conducts business. Internal issues include staff, services, skills, resources, and
needs. External factors include such things as threats of outsourcing. A strategic
planning committee compiles an environmental scan, a body of information about the
environment. Broad issues, singled out as potentially having significant effect on the
facilities planning and management industry, are referred to as mega issues.
Needs Survey: Provides information from clients and peer institutions. The prioritized
needs and expectations resulting from the survey are crucial as a basis for setting
objectives.
Mission Statement: Defines the organization’s fundamental reason for existence and
establishes the scope of its business.
General Objectives: Broadly describe the results of what the organization wants to
achieve in light of needs and relevant issues.

110
Strategies: Specific, measurable actions and directions designed to reach the
objectives established. Strategies are fulfilled through creation, continuation, change,
or elimination of programs.
The mission statement, general objectives, and strategies are the meat of the plan. The
issues and results of the needs survey are the input into the plan, and they provide the
basic assumptions for developing a realistic and feasible plan.
5.3 Keys to Successful Implementation
Suppose our organization thoroughly develops all five products of strategic planning,
completes the process, and comes up with a strategic plan. Everyone has the best
intentions but when we get back to our units, we are overwhelmed with daily details.
Soon it's "business as usual," the plan sits on the shelf, and before we know it, another
year has passed. However, this need not happen.
The three major keys to successful strategic planning and implementation are
commitment, credibility, and communication.
Up-front commitment by the leaders must include an adherence to the full and
thorough process of strategic planning. There must also be a commitment to
implementing the strategies recommended by the strategic planning committee. The
leaders should implement programs and services and commit allocations to meet the
objectives of the strategic plan at a level that is "doable" for the organization and level
of activity. As one person has put it, "To commit to plan, is to commit to change." A
strategic planning committee researches, collects input, and makes recommendations.
But, it is up to member of the organization to implement the recommendations.
Credibility is created and maintained by following these three guidelines:
representative participation, adherence to the complete process, and clear
documentation. The strategic planning committee should have representatives from
all areas of the organization and adhere to the steps of the process. While the actual
logistics of research and implementing the plan can be tailored to the available
resources, all five products should be carefully developed and evaluated.
The committee should document all of its research and activities to serve as the basis
for the strategic plan and its background materials. It will also serve as a clear record
of the committee's activities open for all to see and evaluate. There should be nothing
exclusive or secret about strategic planning. It should be open to all for review and
input.

111
Input, feedback, and understanding are crucial at every step. A key concept to
remember is that strategic planning is a cooperative and participatory process.
Everyone should have input and, ideally, everyone should feel a sense of ownership
over the final plan. Such personal commitment will facilitate the implementation
process.
It is important to explain the principles and goals of strategic planning to everyone in
the organization. We need to assure each person that although he or she may not be on
the committee, everyone can have input and evaluate the recommendations. It is up to
the staff and committees to determine how to fulfill each objective. The strategic
planning committee makes general recommends on what they think should be done.
The leadership, operating committees, and staff determine how it will be done.
An additional aid to implement the strategic plan is to create an integrated system by
which the strategic plan becomes the "benchmark" (measuring stick) for progress in
our organization. It then becomes a system of accountability. The best way to set up
an integrated system is for the directors to accept the strategic plan and make the
mission statement part of the directives. The strategic plan can then become the
context from which programs and services flow. Strategic planning is the key to
assuring that our organization is prepared for the challenges of tomorrow.
5.4 Basic steps in a strategic planning process
Strategic Planning Model
Many books and articles describe how best to do strategic planning, and many go to
much greater lengths than this planning response sheet, but our purpose here is to
present the fundamental steps that must be taken in the strategic planning process.
Below is a brief description of the five steps in the process. These steps are a
recommendation, but not the only recipe for creating a strategic plan; other sources
may recommend entirely different steps or variations of these steps. However, the
steps outlined below describe the basic work that needs to be done and the typical
products of the process. Thoughtful and creative planners will add spice to the mix or
elegance to the presentation in order to develop a strategic plan that best suits their
organization!
Step One - Getting Ready
To get ready for strategic planning, an organization must first assess if it is ready.
While a number of issues must be addressed in assessing readiness, the determination

112
essentially comes down to whether an organization's leaders are truly committed to
the effort, and whether they are able to devote the necessary attention to the "big
picture". For example, if a funding crisis looms, the founder is about to depart, or the
environment is turbulent, then it does not make sense to take time out for strategic
planning effort at that time. An organization that determines it is indeed ready to
begin strategic planning must perform five tasks to pave the way for an organized
process:
Identify specific issues or choices that the planning process should address
Clarify roles (who does what in the process)
Create a Planning Committee
Develop an organizational profile
Identify the information that must be collected to help make sound decisions.
The product developed at the end of the Step One is a Workplan.
Step Two - Articulating Mission and Vision
A mission statement is like an introductory paragraph: it lets the reader know where
the writer is going, and it also shows that the writer knows where he or she is going.
Likewise, a mission statement must communicates the essence of an organization to
the reader. An organization's ability to articulate its mission indicates its focus and
purposefulness. A mission statement typically describes an organization in terms of
its:
Purpose - why the organization exists, and what it seeks to accomplish
Business - the main method or activity through which the organization tries it fulfill
this purpose
Values - the principles or beliefs that guide an organization's members as they pursue
the organization's purpose
Whereas the mission statement summarizes the what, how, and why of an
organization's work, a vision statement presents an image of what success will look
like. For example, the mission statement of the Support Centers of America is as
follows:
The mission of the Support Centers of America is to increase the effectiveness of the
nonprofit sector by providing management consulting, training and research. Our
guiding principles are: promote client independence, expand cultural proficiency,
collaborate with others, ensure our own competence, act as one organization.

113
We envision an ever increasing global movement to restore and revitalize the quality
of life in local communities. The Support Centers of America will be a recognized
contributor and leader in that movement.
With mission and vision statements in hand, an organization has taken an important
step towards creating a shared, coherent idea of what it is strategically planning for.
At the end of Step Two, a draft mission statement and a draft vision statement is
developed.
Step Three - Assessing the Situation
Once an organization has committed to why it exists and what it does, it must take a
clear-eyed look at its current situation. Remember, that part of strategic planning,
thinking, and management is an awareness of resources and an eye to the future
environment, so that an organization can successfully respond to changes in the
environment. Situation assessment, therefore, means obtaining current information
about the organization's strengths, weaknesses, and performance - information that
will highlight the critical issues that the organization faces and that its strategic plan
must address. These could include a variety of primary concerns, such as funding
issues, new program opportunities, changing regulations or changing needs in the
client population, and so on. The point is to choose the most important issues to
address. The Planning Committee should agree on no more than five to ten critical
issues around which to organize the strategic plan. The products of Step Three
include: a data base of quality information that can be used to make decisions; and a
list of critical issues which demand a response from the organization - the most
important issues the organization needs to deal with.
Step Four - Developing Strategies, Goals, and Objectives
Once an organization's mission has been affirmed and its critical issues identified, it is
time to figure out what to do about them: the broad approaches to be taken
(strategies), and the general and specific results to be sought (the goals and
objectives). Strategies, goals, and objectives may come from individual inspiration,
group discussion, formal decision-making techniques, and so on - but the bottom line
is that, in the end, the leadership agrees on how to address the critical issues.

114
This can take considerable time and flexibility: discussions at this stage frequently
will require additional information or a reevaluation of conclusions reached during the
situation assessment. It is even possible that new insights will emerge which change
the thrust of the mission statement. It is important that planners are not afraid to go
back to an earlier step in the process and take advantage of available information to
create the best possible plan.
The product of Step Four is an outline of the organization's strategic directions - the
general strategies, long-range goals, and specific objectives of its response to critical
issues.
Step Five - Completing the Written Plan
The mission has been articulated, the critical issues identified, and the goals and
strategies agreed upon. This step essentially involves putting all that down on paper.
Usually one member of the Planning Committee, the executive director, or even a
planning consultant will draft a final planning document and submit it for review to
all key decision makers (usually the board and senior staff). This is also the time to
consult with senior staff to determine whether the document can be translated into
operating plans (the subsequent detailed action plans for accomplishing the goals
proposed by the strategic plan) and to ensure that the plan answers key questions
about priorities and directions in sufficient detail to serve as a guide. Revisions should
not be dragged out for months, but action should be taken to answer any important
questions that are raised at this step. It would certainly be a mistake to bury conflict at
this step just to wrap up the process more quickly, because the conflict, if serious, will
inevitably undermine the potency of the strategic directions chosen by the planning
committee.
5.5 Standard Format for a Strategic Plan
A strategic plan is a simply a document that summarizes, in about ten pages of written
text, why an organization exists, what it is trying to accomplish, and how it will go
about doing so. Its "audience" is anyone who wants to know the organization's most
important ideas, issues, and priorities: board members, staff, volunteers, clients,
funders, peers at other organizations, the press, and the public. It is a document that
should offer edification and guidance - so, the more concise and ordered the
document, the greater the likelihood that it will be useful, that it will be used, and that

115
it will be helpful in guiding the operations of the organization. Below is an example
of a common format for strategic plans, as well as brief descriptions of each
component listed, which might help writers as they begin trying to organize their
thoughts and their material. This is just an example, however, not the one and only
way to go about this task. The point of the document is to allow the best possible
explanation of the organization's plan for the future, and the format should serve the
message.
The final document should include a table of contents. These are the sections
commonly included in a strategic plan:
I. Introduction by the President of the Board
A cover letter from the president of the organization's board of directors introduces
the plan to readers. The letter gives a "stamp of approval" to the plan and
demonstrates that the organization has achieved a critical level of internal agreement.
(This introduction is often combined with the Executive Summary below.)
II. Executive Summary
In one to two pages, this section should summarize the strategic plan: it should
reference the mission and vision; highlight the long-range goals (what the
organization is seeking to accomplish); and perhaps note the process for developing
the plan, as well as thank participants involved in the process. From this summary,
readers should understand what is most important about the organization.
III. Mission and Vision Statements
These statements can stand alone without any introductory text, because essentially
they introduce and define themselves.
IV. Organization Profile and History
In one or two pages, the reader should learn the story of the organization (key events,
triumphs, and changes over time) so that he or she can understand its historical
context (just as the planning committee needed to at the beginning of the planning
process).
V. Critical Issues and Strategies
Sometimes organizations omit this section, choosing instead to "cut to the chase" and
simply present goals and objectives. However, the advantage of including this section
is that it makes explicit the strategic thinking behind the plan. Board and staff leaders
may refer to this document to check their assumptions, and external readers will better

116
understand the organization's point of view. The section may be presented as a brief
outline of ideas or as a narrative that covers several pages.
VI. Program Goals and Objectives
In many ways the program goals and objectives are the heart of the strategic plan.
Mission and vision answer the big questions about why the organization exists and
how it seeks to benefit society, but the goals and objectives are the plan of action -
what the organization intends to "do" over the next few years. As such, this section
should serve as a useful guide for operational planning and a reference for evaluation.
For clarity of presentation, it makes sense to group the goals and objectives by
program unit if the organization has only a few programs; if some programs are
organized into larger program groups (e.g., Case Management Program in the Direct
Services Program Group), the goals and objectives will be delineated at both the
group level and the individual program level.
VII. Management Goals and Objectives
In this section the management functions are separated from the program functions to
emphasize the distinction between service goals and organization development goals.
This gives the reader a clearer understanding both of the difference and the
relationship between the two sets of objectives, and enhances the "guiding" function
of the plan.
VIII. Appendices
The reason to include any appendices is to provide needed documentation for
interested readers. Perhaps no appendices are truly necessary (many organizations opt
for brevity). They should be included only if they will truly enhance readers'
understanding of the plan, not just burden them with more data or complicating
factors.
5.6 Increasing chances of implementing our strategic plan
Organizations and their leadership are often reluctant to commit time and resources to
a planning process because of the fear of the plan "ending up on the shelf." This
article addresses a key question regarding the strategic plan: What can I do to ensure
the plan does not end up on the shelf? There are three areas that must be addressed to
ensure that the planning process and resulting strategic plan are valuable and useful
for the organization:

117
The process that is used to develop the plan can guarantee success or failure.
Credibility and ease of use are often direct results of how the plan was created. The
format of the plan will influence how and when people use the document in the
workplace. Complex, outdated documents are doomed to remain on the shelf.
Management's use and respect for the plan influences the acceptance for the rest of
the staff and board members. There is no reason for program directors to refer to
established goals and objectives if the executive director does not.
Ensuring the Plan Has Impact
During the strategic planning process, it is important to include the following process,
content, and usage elements to ensure the usefulness of the strategic plan to the
organization.
Process Elements
Engage leadership
Include the informal and formal organizational leaders when conducting a process.
Active involvement communicates a message of organizational importance and
priority.
Work from a common understanding
Provide training on the process and establish a list of expectations and results to
ensure that everyone is working towards the same outcomes.
Include individuals who will implement plan
Encourage all levels of staff to contribute to the process. Involving these individuals
will ensure that the plan is realistic and help motivate staff to implement the plan.
Address critical issues for the organization
Failure or unwillingness to put these critical issues on the table for discussion and
resolution might lead staff to implicitly or explicitly challenge the credibility of the
plan, its priorities, and/or its leadership.
Agree on how the plan will be operationalized
Specify who will implement which parts of the plan, scheduling routine evaluation
meetings to review progress.
Content Elements
Include an internal and external focus
Remember to address structural, board/staff development, and communication issues
in your plan.

118
Do not get too detailed
Use the strategic plan to articulate the broad framework, direction and, priorities of
the organization and its programs. Extremely specific plans become quickly outdated
and end up on the shelf.
Create a balance between the dream and reality
Ensure that your plan is grounded in the reality of what can and cannot be
accomplished.
Keep language, concepts and format simple
Make sure that the language is easy to understand, especially for those that are
unfamiliar with your organization. Structure the document so that it is user friendly.
Usage Elements
Actively use the plan as a management tool
Actively using the plan for short-term guidance and decision making will establish a
model for use.
Incorporate sections of the plan in everyday management
Formalize the usage of the plan into the day-to-day activities of the organization. For
example, one organization reads the mission statement at the opening of every
business meeting to remind the membership of the organization's focus and purpose.
In another organization, the executive director requires that all ideas for program
changes or expansion directly address how the changes relate to the organization's
mission.
Organize the work of the organization in the context of the plan
Establish operational goals and activities within the context of the strategic plan (e.g.,
include goals and objectives in individual and program evaluations or have program
directors refer to the plan to provide guidance in decision making).
Design a system for controlling the process
Ensure that there are mechanisms (e.g., evaluation meetings, monthly reports against
plan) to inform management on progress.
By employing the strategies listed above, you can be sure that the effort you put into
the strategic planning process will direct your organization and become a useful tool
to both management and staff.

119
SUMMARY
Strategic planning is a step by step process with definite objectives and end products
that can be implemented and evaluated. Very simply, it is a process by which we look
into the future, paint a picture of that future based on current trends, and influence the
forces that will affect us. Environmental issues and trends, needs Survey, mission
Statement, general Objectives, and strategies are the five products of Strategic
planning.
FOR DISCUSSION
1. What is strategic planning?
2. What is strategic management?
3. Explain about the products of strategic planning briefly.
4. What are the keys of effective implementation of strategic planning?
5. Explain the steps of strategic planning process.
SUGGESTED TEXT BOOKS 1. Johnson G and Sccholes Knowledge, “Exploring Corporate Strategy: Text and
Cases”, 3rd Edition, Prentice Hall.
2. Bontje J, “How to create a plan for successful business growth”, Amacom, New
York, 1990.
3. Dyson R.G, “Strategic Planning: Models and Analytical Techniques”, Wiley,
1990.

120
4. Hamel G and Prahalad C, “Competing for the future”, Harvard Business School
Press, 1995.
Chapter 6
MARKETING
MANAGEMENT

121
MARKETING MANAGEMENT
SCOPE OF THE COURSE After reading chapter 6, you should be able to:
Define marketing and marketing management Explain the marketing management orientations Understand market segmentation Distinguish the types of product

122
INTRODUCTION
Today's successful companies at all levels have one thing in common: they are
strongly customer focused and heavily committed to marketing. These companies
share a passion for understanding and satisfying the needs of customers in well-
defined target markets. They motivate everyone in the organization to help build
lasting customer relationships through superior customer value and satisfaction.
6.1 WHAT IS MARKETING?
Marketing, more than any other business function, deals with customers. Building
customer relationships based on customer value and satisfaction is at the very heart of
modern marketing. Although we will soon explore more detailed definitions of
marketing, perhaps the simplest definition is this one: Marketing is managing
profitable customer relationships. The twofold goal of marketing is to attract new
customers by promising superior value and to keep and grow current customers by
delivering satisfaction.
Sound marketing is critical to the success of every organization—large or small, for-
profit or not-for-profit, domestic or global.
You already know a lot about marketing—it's all around you. You see the results of
marketing in the abundance of products in your nearby shopping mall. You see
marketing in the advertisements on your TV, in your magazines, stuff in your
mailbox. At home, at school, where you work, and where you play, you see marketing
in almost everything you do. Yet, there is much more to marketing than meets the
consumer's casual eye. Behind it all is a massive network of people and activities
competing for your attention and purchases.
In this chapter, we begin by defining marketing and its core concepts.

123
6.1.1 Marketing Defined
What does the term marketing mean? Many people think of marketing only as selling
and advertising. And no wonder—every day we are bombarded with television
commercials, newspaper ads, direct-mail offers, sales calls, and Internet pitches.
However, selling and advertising are only the tip of the marketing iceberg. Although
they are important, they are only two of many marketing functions and are often not
the most important ones.
Today, marketing must be understood not in the old sense of making a sale—"telling
and selling"—but in the new sense of satisfying customer needs. If the marketer does
a good job of understanding consumer needs, develops products that provide superior
value, and prices, distributes, and promotes them effectively, these products will sell
very easily. Thus, selling and advertising are only part of a larger "marketing mix"—a
set of marketing tools that work together to affect the marketplace. We define
marketing as a social and managerial process by which individuals and groups obtain
what they need and want through creating and exchanging products and value with
others. To explain this definition, we will examine the following important core
marketing concepts: needs, wants, and demands; marketing offers (products, services,
and experiences); value and satisfaction; exchanges, transactions, and relationships;
and markets. Figure 1.1 shows that these core marketing concepts are linked, with
each concept building on the one before it.
6.1.2 Needs, Wants, and Demands
The most basic concept underlying marketing is that of human needs. Human
needs are states of felt deprivation. They include basic physical needs for food,
clothing, warmth, and safety; social needs for belonging and affection; and individual
needs for knowledge and self-expression. These needs were not created by marketers;
they are a basic part of the human makeup.
Wants are the form human needs take as they are shaped by culture and
individual personality. An American needs food but wants Big Mac, french fries, and
a soft drink. A person in Mauritius needs food but wants a mango, rice, lentils, and
beans. Wants are shaped by one's society and are described in terms of objects that
will satisfy needs. When backed by buying power, wants become demands. Given

124
their wants and resources, people demand products with benefits that add up to the
most value and satisfaction.
Outstanding marketing companies go to great lengths to learn about and
understand their customers' needs, wants, and demands. They conduct consumer
research and analyze mountains of customer sales, warranty, and service data. Their
people at all levels—including top management— stay close to customers.
6.1.3 Marketing Offers—Products, Services, and Experiences
Companies address needs by putting forth a value proposition, a set of benefits
that they promise to consumers to satisfy their needs. The value proposition is
fulfilled through a marketing offer—some combination of products, services,
information, or experiences offered to a market to satisfy a need or want. Marketing
offers are not limited to physical products. In addition to tangible products, marketing
offers include services, activities or benefits offered for sale that are essentially
intangible and do not result in the ownership of anything. Examples include banking,
airline, hotel, tax preparation, and home repair services. More broadly, marketing
offers also include other entities, such as persons, places, organizations, information,
and ideas. Many sellers make the mistake of paying more attention to the specific
products they offer than to the benefits and experiences produced by these products.
They see themselves as selling a product rather than providing a solution to a need.
A manufacturer of quarter-inch drill bits may think that the customer needs a
drill bit. But what the customer really needs is a quarter-inch hole. These sellers may
suffer from "marketing myopia." They are so taken with their products that they focus
only on existing wants and lose sight of underlying customer needs. They forget that a
product is only a tool to solve a consumer problem. These sellers will have trouble if a
new product comes along that serves the customer's need better or less expensively.
The customer with the same need will want the new product.
Thus, smart marketers look beyond the attributes of the products and services
they sell. They create brand meaning and brand experiences for consumers.
Value and Satisfaction
Consumers usually face a broad array of products and services that might
satisfy a given need. How do they choose among these many marketing offers?

125
Consumers make choices based on their perceptions of the value and satisfaction that
various products and services deliver.
Customer value is the difference between the values the customer gains from
owning and using a product and the costs of obtaining the product. Customers form
expectations about the value of various marketing offers and buy accordingly. How
do buyers form their expectations? Customer expectations are based on past buying
experiences, the opinions of friends, and marketer and competitor information and
promises.
Customer satisfaction with a purchase depends on how well the product's
performance lives up to the customer's expectations. Customer satisfaction is a key
influence on future buying behavior. Satisfied customers buy again and tell others
about their good experiences. Dissatisfied customers often switch to competitors and
disparage the product to others.
Marketers must be careful to set the right level of expectations. If they set
expectations too low, they may satisfy those who buy but fail to attract enough
buyers. If they raise expectations too high, buyers will be disappointed. Customer
value and customer satisfaction are key building blocks for developing and managing
customer relationships.
6.1.4 Exchange, Transactions, and Relationships
Marketing occurs when people decide to satisfy needs and wants through exchange.
Exchange is the act of obtaining a desired object from someone by offering
something in return. Whereas exchange is the core concept of marketing, a
transaction, in turn, is marketing's unit of measurement. A transaction consists of a
trade of values between two parties: One party gives X to another party and gets Yin
return.
In the broadest sense, the marketer tries to bring about a response to some
marketing offer. The response may be more than simply buying or trading products
and services. A political candidate, for instance, wants votes, a church wants
membership, and a social-action group wants idea acceptance.
Marketing consists of actions taken to build and maintain desirable exchange
relationships with target audiences involving a product, service, idea, or other object.
Beyond simply attracting new customers and creating transactions, the goal is to

126
retain customers and grow their business with the company. Marketers want to build
strong economic and social connections by promising and consistently delivering
superior value.
Markets
The concepts of exchange and relationships lead to the concept of a market. A
market is the set of actual and potential buyers of a product. These buyers share a
particular need or want that can be satisfied through exchange relationships. The size
of a market depends on the number of people who exhibit the need, have resources to
engage in exchange, and are willing to exchange these resources for what they want.
Originally the term market stood for the place where buyers and sellers gathered to
exchange their goods, such as a village square. Economists use the term market to
refer to a collection of buyers and sellers who transact in a particular product class, as
in the housing market or the grain market. Marketers, however, see the sellers as
constituting an industry and the buyers as constituting a market.
Marketers are keenly interested in markets. Each nation's economy and the whole
world economy consist of complex, interacting sets of markets that are linked through
exchange processes. Marketers work to understand the needs and wants of specific
markets and to select the markets that they can serve best. In turn, they develop
products and services that create value and satisfaction for customers in these
markets. The result is profitable long-term customer relationships.
Marketing
The concept of markets finally brings us full circle to the concept of marketing.
Marketing means managing markets to bring about profitable exchange relationships
by creating value and satisfying needs and wants. Thus, we return to our definition of
marketing as a process by which individuals and groups obtain what they need and
want by creating and exchanging products and value with others.
Creating exchange relationships involves work. Sellers must search for buyers,
identify their needs, design good marketing offers, set prices for them, promote them,
and store and deliver them. Activities such as product development, research,
communication, distribution, pricing, and service are core marketing activities.
Although we normally think of marketing as being carried on by sellers, buyers also
carry on marketing. Consumers do marketing when they search for the goods they

127
need at prices they can afford. Company purchasing agents do marketing when they
track down sellers and bargain for good terms.
6.2 MARKETING MANAGEMENT
We define marketing management as the art and science of choosing target
markets and building profitable relationships with them. This involves getting,
keeping, and growing customers through creating, delivering, and communicating
superior customer value. Thus, marketing management involves managing demand,
which in turn involves managing customer relationships.
6.2.1 Customer and Demand Management
Some people think of marketing management as finding enough customers for
the company's current output. But this view is too limited. Marketing management is
not concerned with serving all customers in every way. Instead, marketers want to
serve selected customers that they can serve well and profitably.
The organization has a desired level of demand for its products. At any point
in time, there may be no demand, adequate demand, irregular demand, or too much
demand. Marketing management must find ways to deal with these different demand
states. It may be concerned not only with finding and increasing demand but also with
changing or even reducing it.
For example, the Golden Gate Bridge sometimes carries an unsafe level of
traffic, and Yosemite National Park is badly overcrowded in the summer. Power
companies sometimes have trouble meeting demand during peak usage periods. In
these and other cases of excess demand, demarketing may be required to reduce the
number of customers or to shift their demand temporarily or permanently. For
example, to reduce demand for space on congested expressways in Washington, D.C.,
the Metropolitan Washington Council of Governments has set up a Web site
encouraging commuters to carpool and use mass transit. Thus, marketing
management seeks to affect the types of customers served and the level, timing, and
nature of their demand in a way that helps the organization achieve its objectives.
Simply put, marketing management is customer management and demand
management.
128
6.2.2 Marketing Management Orientations
We describe marketing management as carrying out tasks to build profitable
relationships with target consumers. What philosophy should guide these marketing
efforts? What weight should be given to the interests of the organization, customers,
and society? Very often these interests conflict. There are five alternative concepts
under which organizations conduct their marketing activities: the production, product,
selling, marketing, and societal marketing concepts.
The production concept holds that consumers will favor products that are
available and highly affordable. Therefore, management should focus on improving
production and distribution efficiency. This concept is one of the oldest orientations
that guides sellers.
The production concept is still a useful philosophy in two types of situations.
The first occurs when the demand for a product exceeds the supply. Here,
management should look for ways to increase production. The second situation occurs
when the product's cost is too high and improved productivity is needed to bring it
down. For example. Henry Ford's whole philosophy was to perfect the production of
the Model T so that its cost could be reduced and more people could afford it. He
joked about offering people a car of any color as long as it was black.
Although useful in some situations, the production concept can lead to
marketing myopia. Companies adopting this orientation run a major risk of focusing
too narrowly on their own operations and losing sight of the real objective—satisfying
customers' needs.
The product concept holds that consumers will favor products that offer the
most in quality, performance, and innovative features. Thus, an organization should
devote energy to making continuous product improvements. Some manufacturers
believe that if they can build a better mousetrap, the world will beat a path to their
door. But they are often rudely shocked. Buyers may well be looking for a better
solution to a mouse problem but not necessarily for a better mousetrap. The solution
might be a chemical spray, an exterminating service, or something that works better
than a mousetrap. Furthermore, a better mousetrap will not sell unless the manu-
facturer designs, packages, and prices it attractively; places it in convenient
distribution channels; brings it to the attention of people who need it; and convinces
buyers that it is a better product.

129
Thus, the product concept also can lead to marketing myopia. For instance,
railroad management once thought that users wanted trains rather than transportation
and overlooked the growing challenge of airlines, buses, trucks, and automobiles.
Kodak assumed that consumers wanted photographic film rather than a way to
capture and share memories and at first overlooked the challenge of digital cameras.
Although it now leads the digital camera market in sales, it has yet to make significant
profits from this business.
Many companies follow the selling concept, which holds that consumers will
not buy enough of the firm's products unless it undertakes a large-scale selling and
promotion effort. The concept is typically practiced with unsought goods—those that
buyers do not normally think of buying, such as insurance or blood donations. These
industries must be good at tracking down prospects and selling them on product
benefits.
Most firms practice the selling concept when they face overcapacity. Their
aim is to sell what they make rather than make what the market wants. Such
marketing carries high risks. It focuses on creating sales transactions rather than on
building long-term, profitable customer relationships. It assumes that customers who
are coaxed into buying the product will like it. Or, if they don't like it, they will
possibly forget their disappointment and buy it again later. These are usually poor
assumptions. Most studies show that dissatisfied customers do not buy again. Worse
yet, whereas the average satisfied customer tells three others about good experiences,
the average dissatisfied customer tells ten others about his or her bad experiences.
The marketing concept holds that achieving organizational goals depends on
knowing the needs and wants of target markets and delivering the desired
satisfactions better than competitors do. Under the marketing concept, customer focus
and value are the paths to sales and profits. Instead of a product-centered "make and
sell" philosophy, the marketing concept is a customer-centered "sense and respond"
philosophy. It views marketing not as "hunting," but as "gardening." The job is not to
find the right customers for your product, but the right products for your customers.
Instead of a product-centered "make and sell" philosophy, the marketing concept is a
customer-centered "sense and respond" philosophy. It views marketing not as
"hunting," but as "gardening." The job is not to find the right customers for your
product, but the right products for your customers.

130
The societal marketing concept holds that the organization should determine
the needs, wants, and interests of target markets. It should then deliver superior value
to customers in a way that maintains or improves the consumer's and the society's
well-being. It questions whether the pure marketing concept overlooks possible
conflicts between consumer short-run wants and consumer long-run welfare. Is a firm
that senses, serves, and satisfies individual short-term wants always doing what's best
for consumers and society in the long run?
Consider the fast-food industry. Most people see today's giant fast-food chains
as offering tasty and convenient food at reasonable prices. Yet many consumer and
environmental groups have voiced concerns. Critics point out that hamburgers, fried
chicken, french fries, and most other foods sold by fast-food restaurants are high in fat
and salt. The products are wrapped in convenient packaging, but this leads to waste
and pollution. Thus, in satisfying short-term consumer wants, the highly successful
fast-food chains may be harming consumer health and causing environmental
problems.
The societal marketing concept calls on marketers to balance three con-
siderations in setting their marketing policies: company profits, consumer wants, and
society's interests. Originally, most companies based their marketing decisions largely
on short-run company profit. Eventually, they recognized the long-run importance of
satisfying consumer wants, and the marketing concept emerged. Now many
companies are beginning to think of society's interests when making their marketing
decisions.
6.2.3 Customer Relationship Management
No matter what its orientation, marketing management's crucial task is to
create profitable relationships with customers. Until recently, customer relationship
management (CRM) has been defined narrowly as a customer database management
activity. By this definition, it involves managing detailed information about individual
customers and carefully managing customer. Companies today recognize that they
cannot appeal to all buyers in the marketplace or least not to all buyers in the same
way. Buyers are too numerous, too widely scattered, and In varied m their needs and
buying practices. Moreover, the companies themselves vary widely) their abilities to
serve different segments of the market. Rather than trying to compete in an entire

131
market, sometimes against superior competitors, each company must identify| the
market that it can serve best and most profitably.
Thus, most companies are being more choosy about the customers with whom
they wish to build relationships. Most have moved away from mass marketing and
toward market segmentation and targeting—identifying market segments, selecting
one or more of them, and develop products and marketing programs tailored to each.
Instead of scattering their marketing effort (the "shotgun" approach), firms are
focusing on the buyers who have greater interest in the values they create best (the
"rifle" approach).
Companies have not always practiced market segmentation and targeting. For
most of the past century, major consumer products companies held fast to mass
marketing—mass-producing, mass-distributing, and mass-promoting about the same
product in about the same way to all consumers. Henry Ford typified this marketing
strategy when he offered the Model T Ford to buyers; they could have the car "in any
color as long as it is black." Similarly, Coca-Cola at one time produced only one drink
for the whole market, hoping it would appeal to everyone.
These companies argued that mass marketing creates the largest potential
market, which leads to the lowest costs. This, in turn, can translate into either lower
prices or higher margins. However, many factors now make mass marketing more
difficult. For example, the world's mass markets have slowly splintered into a
profusion of smaller segments. The marketers, now find it very difficult o create a
single product or program that appeals to all of these diverse groups.
The proliferation of distribution channels and advertising media has also made
it difficult to practice "one-size-fits-all" marketing. Today's consumers can shop at
megamalls, superstores, or specialty shops; through mail catalogs, by telephone, or
from online retailers. They are bombarded with messages in media ranging from old
standards such as television, radio, magazines, newspapers, and telephone to
newcomers such as Web ads, faxes, and e-mails. No wonder some have claimed that
mass marketing is dying. Not surprisingly, many companies are retreating from mass
marketing and turning to segmented marketing.
6.3 TARGET MARKETING
There are three major steps in target marketing. The first is market segmentation—
dividing a market into smaller groups of buyers with distinct needs, characteristics, or

132
behaviors who might require separate products or marketing mixes. The company
identifies different ways to segment the market and develops profiles of the resulting
market segments. The second step is target marketing—evaluating each market
segment's attractiveness and selecting one or more of the market segments to enter.
The third step is market positioning—setting the competitive positioning for the
product and creating a detailed marketing mix. We discuss each of these steps in turn.
6.3.1 Market Segmentation
Markets consist of buyers, and buyers differ in one or more ways. They may
differ in their wants, resources, locations, buying attitudes, and buying practices.
Through market segmentation, companies divide large, heterogeneous markets into
smaller segments that can be reached more efficiently and effectively with products
and services that match their unique needs. In this section, we discuss four important
segmentation topics: segmenting consumer markets, segmenting business markets,
segmenting international markets, and requirements for effective segmentation.
Segmenting Consumer Markets
There is no single way to segment a market. A marketer has to try different
segmentation variables, alone and in combination, to find the best way to view the
market structure. Now we look at the major geographic, demographic,
psychographic, and behavioral variables, which can be used o segment the consumer
market.
Geographic Segmentation
Geographic segmentation calls for dividing the market into different geographical
units such as nations, regions, states, counties, cities, or neighborhoods. A company
may decide to operate in one or a few geographical areas, or to operate in all areas but
pay attention to geographical differences in needs and wants.
Many companies today are localizing their products, advertising, promotion, and sales
efforts to fit the needs of individual regions, cities, and even neighborhoods.
Demographic Segmentation

133
Demographic segmentation divides the market into groups based on variables such
age, gender, family size, family life cycle, income, occupation, education, religion,
race, generation, a nationality. Demographic factors are the most popular bases for
segmenting customer groups. One reason is that consumer needs, wants, and usage
rates often vary closely with demographic variables. Another is that demographic
variables are easier to measure than most other types of variables. Even when market
segments are first defined using other bases, such as benefits sought or behavior, their
demographic characteristics must be known in order to assess the size of the target
market and to reach it efficiently.
Age and Life-Cycle Stage. Consumer needs and wants change with age. Some
companies use age and life-cycle segmentation, offering different products or using
different marketing approaches for different age and life-cycle groups. For example,
McDonald's targets different age groups—from children and teens to adults and
seniors—with different ads and media. Its ads to teens feature dance-beat music,
adventure, and fast-paced cutting from scene to scene; ads to seniors are softer and
more sentimental. Procter & Gamble boldly targets its Oil of Olay Pro Vital
moisturizing creams and lotions at women over 50 years of age—it helps to improve
the elasticity and revitalize the appearance of "maturing skin.
Gender segmentation has long been used in clothing, cosmetics, toiletries, and
magazines. For example, Procter & Gamble was among the first with Secret, a brand
specially formulated for a woman's chemistry, packaged and advertised to reinforce
the female image.
Income segmentation has long been used by the marketers of products and services
such as automobiles, boats, clothing, cosmetics, financial services, and travel. Many
companies target affluent consumers with luxury goods and convenience services.
Psvchographic segmentation divides buyers into different groups based on social
class, life style or personality characteristics. People in the same demographic group
can have very different psychographic makeups.
Behavioral segmentation divides buyers into groups based on their knowledge,
attitudes, uses or responses to a product. Many marketers believe that behavior
variables are the best starting point for building market segments.
Occasions. Buyers can be grouped according to occasions when they get the idea to
buy, actually make their purchase, or use the purchased item. Occasion segmentation

134
can help firms’ build up product usage. For example, orange juice is most often
consumed at breakfast, but orange growers have promoted drinking orange juice as a
cool and refreshing drink at other times of the day.
Benefits Sought. A powerful form of segmentation is to group buyers according to
the different benefits that they seek from the product. Benefit segmentation requires
finding the major benefits people look for in the product class, the kinds of people
who look for each benefit, and the major brands that deliver each benefit. For
example, our chapter-opening example pointed out that Procter & Gamble has
identified several different laundry detergent segments. Each segment seeks a unique
combination of benefits, from cleaning and bleaching to economy, fabric softening,
fresh smell, strength or mildness, and lots of suds or only a few. User Status. Markets
can be segmented into groups of nonusers, ex-users, potential users, first-time users,
and regular users of a product. For example, one study found that blood donors are
low in self-esteem, low risk takers, and more highly concerned about their health;
nondonors tend to be the opposite on all three dimensions. This suggests that social
agencies should use different marketing approaches for keeping current donors and
attracting new ones. A company's market position also influences its focus. Market
share leaders focus on attracting potential users, whereas smaller firms focus on
attracting current users away from the market leader.
Usage Rate. Markets can also be segmented into light, medium, and heavy product
users. Heavy users are often a small percentage of the market but account for a high
percentage of total consumption. Marketers usually prefer to attract one heavy user to
their product or service rather than several light users.
Loyalty Status. A market can also be segmented by consumer loyalty. Consumers can
be loyal to brands (Tide), stores (Wal-Mart), and companies (Ford). Buyers can be
divided into groups according to their degree of loyalty. Some consumers are
completely loyal—they buy one brand all the time. Others are somewhat loyal—they
are loyal to two or three brands of a given product or favor one brand while
sometimes buying others. Still other buyers show no loyalty to any brand. They either
want something different each time they buy or they buy whatever's on sale.
A company can learn a lot by analyzing loyalty patterns in its market. It should start
by studying its own loyal customers.
By studying its less loyal buyers, the company can detect which brands are
most competitive with its own. If many Pepsi buyers also buy Coke, Pepsi can

135
attempt to improve its positioning against Coke, possibly by using direct-comparison
advertising. By looking at customers who are shifting away from its brand, the
company can learn about its marketing weaknesses. As for non-loyals, the company
may attract them by putting its brand on sale.
Target Marketing
Market segmentation reveals the firm's market segment opportunities. The firm now
has to evaluate the various segments and decide how many and which ones to target.
We now look at how companies evaluate and select target segments.
Evaluating Market Segments
In evaluating different market segments, a firm must look at three factors:
segment size and growth, segment structural attractiveness, and company objectives
and resources. The company must first collect and analyze data on current segment
sales, growth rates, and expected profitability for various segments. It will be
interested in segments that have the right size and growth characteristics. But "right
size and growth" is a relative matter. The largest, fastest-growing segments are not
always the most attractive ones for every company. Smaller companies may lack the
skills and resources needed to serve the larger segments. Or they may find these
segments too competitive. Such companies may select segments that are smaller and
less attractive, in an absolute sense, but that are potentially more profitable for them.
The company also needs to examine major structural factors that affect long-
run segment attractiveness. For example, a segment is less attractive if it already
contains many strong and aggressive competitors. The existence of many actual or
potential substitute products may limit prices and the profits that can be earned in a
segment. The relative power of buyers also affects segment attractiveness. Buyers
with strong bargaining power relative to sellers will try to force prices down, demand
more services, and set competitors against one another—all at the expense of seller
profitability. Finally, a segment may be less attractive if it contains powerful suppliers
who can control prices or reduce the quality or quantity of ordered goods and
services.

136
Even if a segment has the right size and growth and is structurally attractive,
the company must consider its own objectives and resources in relation to that
segment. Some attractive segments could be dismissed quickly because they do not
mesh with the company's long-run objectives. The company must consider whether it
possesses the skills and resources it needs to succeed in that segment. If the company
lacks the strengths needed to compete successfully in a segment and cannot readily
obtain them, it should not enter the segment. Even if the company possesses the
required strengths, it needs to employ skills and resources superior to those of the
competition in order to really win in a market segment. The company should enter
only segments in which it can offer superior value and gain advantages over
competitors.
Selecting Target Market Segments
After evaluating different segments, the company must now decide which and how
many segments it will target. A target market consists of a set of buy who share
common needs or characteristics that the company decides to serve. Because buyers
have unique needs and wants, a seller could potentially view each buyer as a separate
target market. Ideally, then, a seller might design a separate marketing program for
each buyer. However, although some companies do attempt to serve buyers
individually, most face Undifferentiated Marketing
Using an Undifferentiated marketing (or mass marketing) strategy, a firm might
decide ignore market segment differences and target the whole market with one offer.
This marketing strategy focuses on what is common in the needs of consumers rather
than on what is different. The company designs a product and a marketing program
that will appeal to all the buyers. It relies on mass distribution and mass advertising,
and it aims to give product a superior image in people's minds. Most modern
marketers have strong doubts about this strategy. Difficulties arise in developing a
product that will satisfy all consumers. Moreover, mass marketers often have trouble
competing with more-focused firms that do a better job of satisfying the needs of
specific segments and niche.
Using a differentiated marketing (or segmented marketing) strategy, a firm
decides to cater to several market segments and designs separate offers for each.

137
Genera] Motors tries to produce a car for every "purse, purpose, and personality."
Nike offers athletic shoes for a dozen or more different sports, from running, fencing,
golf, and aerobics to bicycling and baseball.
By offering product and marketing variations to segments, companies hope for
higher and a stronger position within each market segment. Developing a stronger
position within several segments creates more total sales than Undifferentiated
marketing across all segments Procter & Gamble gets more total market share with
eight brands of laundry detergent as could with only one.
But differentiated marketing also increases the costs of doing business. A firm
usually finds it more expensive to develop and produce, say, 10 units of 10 different
products than 100 of one product. Developing separate marketing plans for the
separate segments requires extra marketing research, forecasting, sales analysis,
promotion planning, and channel management trying to reach different market
segments with different advertising increases promotion. Thus, the company must
weigh increased sales against increased costs when deciding on a differentiated
marketing strategy.
6.3.2 Concentrated Marketing
A third market-coverage strategy, concentrated marketing (or niche
marketing), is especially appealing when company resources are limited. Instead of
going after a small share of a large market, the firm goes after a large share of one or
a few segments or niches. Whereas segments are fairly large and normally attract
several competitors, niches are smaller and may attract only one or a few competitors.
Through concentrated marketing, the firm achieves a strong market position because
of its greater knowledge of consumer needs in the niches it serves and the special
reputation it acquires. It can market more effectively by fine-tuning its products,
prices, and programs to the needs of carefully defined segments. It can also market
more efficiently, targeting its products or services, channels, and communications
programs toward only consumers that it can serve best and most profitably.
Niching offers smaller companies an opportunity to compete by focusing their
limited resources on serving niches that may be unimportant to or overlooked by
larger competitors.

138
Many companies start as nichers to get a foothold against larger, more
resourceful competitors, then grow into broader competitors. For example. Southwest
Airlines began by concentrating on serving intrastate, no-frills commuters in Texas
but is now one of the nation's eight largest airlines. Wal-Mart, which got its start by
bringing everyday low prices to small towns and rural areas, is now the world's
largest company.
Today, the low cost of setting up shop on the Internet makes it even more
profitable to serve seemingly minuscule niches. Small businesses, in particular, are
realizing riches from serving small niches on the Web. Here is a "Webpreneur" who
achieved astonishing results:
Whereas Internet giants like Amazon.com have yet to even realize a consistent
profit, Steve Warrington is earning a six-figure income online selling ostriches—and
every product derived from them—online.
6.3.3 Micromarketing
Differentiated and concentrated marketers tailor their offers and marketing
programs to meet the needs of various market segments and niches. At the same time,
however, they do not customize their offers to each individual customer.
Micromarketing is the practice of tailoring products and marketing programs to suit
the tastes of specific individuals and locations. Micromarketing includes local
marketing and individual marketing.
Local Marketing. Local marketing involves tailoring brands and promotions to
the needs and wants of local customer groups—cities, neighborhoods, and even
specific stores. Retailers such as Sears and Wal-Mart routinely customize each store's
merchandise and promotions to match its specific clientele. Citibank provides
different mixes of banking services in its branches, depending on neighborhood
demographics. Kraft helps supermarket chains identify the specific cheese
assortments and shelf positioning that will optimize cheese sales in low-income,
middle-income, and high-income stores and in different ethnic communities.
Local marketing has some drawbacks. It can drive up manufacturing and
marketing costs by reducing economies of scale. It can also create logistics problems
as companies try to meet the varied requirements of different regional and local
markets. Further, a brand's overall image might be diluted if the product and message

139
vary too much in different localities. Still, as companies face increasingly fragmented
markets, and as new supporting technologies develop, the advantages of local
marketing often outweigh the drawbacks. Local marketing helps a company to market
more effectively in the face of pronounced regional and local differences in
demographics and lifestyles. It also meets the needs of the company's first-line
customers—retailers—who prefer more fine-tuned product assortments for their
neighborhoods.
Individual Marketing. In the extreme, micromarketing becomes individual
marketing-tailoring products and marketing programs to the needs and preferences of
individual customers. Individual marketing has also been labeled one-to-one
marketing, customized marketing, and markets-of-one marketing.
The widespread use of mass marketing has obscured the fact that for centuries
consumers were served as individuals: The tailor custom-made the suit, the cobbler
designed shoes for the individual, the cabinetmaker made furniture to order. Today,
however, new technologies are permitting many companies to return to customized
marketing. More-powerful computers, detailed databases, robotic production and
flexible manufacturing, and immediate and interactive communication media such as
e-mail, fax, and the Internet—all have combined to foster "mass customization." Mass
customization is the process through which firms interact one-to-one with masses of
customers to create customer-unique value by designing products and services tailor-
made to individual needs.
Thus, Dell Computer delivers computers to individual customers loaded with
customer-specified hardware and software.
6.4 Positioning for Competitive Advantage
Beyond deciding which segments of the market it will target, the company
must decide what positions it wants to occupy in those segments. A product's
position is the way the product is defined by consumers on important attributes—the
place the product occupies in consumers' minds relative to competing products.
Positioning involves implanting the brand's unique benefits and differentiation in
customers' minds. Tide is positioned as a powerful, all-purpose family detergent;
Ivory Snow is positioned as the gentle detergent for fine washables and baby clothes.
In the automobile market, the Toyota Echo and Ford Focus are positioned on

140
economy, Mercedes and Cadillac on luxury, and Porsche and BMW on performance.
Volvo positions powerfully on safety. At Subway restaurants, you "Eat Fresh." At
Olive Garden restaurants, "When You're Here, You're Family."
Consumers are overloaded with information about products and services. They
cannot reevaluate products every time they make a buying decision. To simplify the
buying process, consumers organize products, services, and companies into categories
and "position" them in their minds. A product's position is the complex set of
perceptions, impressions, and feelings that consumers have for the product compared
with competing products.
Consumers position products with or without the help of marketers. But
marketers do not want to leave their products' positions to chance. They must plan
positions that will give their products the greatest advantage in selected target
markets, and they must design marketing mixes to create these planned positions.
6.5 Choosing a Positioning Strategy
Some firms find it easy to choose their positioning strategy. For example, a
firm well known for quality in certain segments will go for this position in a new
segment if there are enough buyers seeking quality. But in many cases, two or more
firms will go after the same position. Then, each will have to find other ways to set
itself apart. Each firm must differentiate its offer by building a unique bundle of
benefits that appeals to a substantial group within the segment.
The positioning task consists of three steps: identifying a set of possible
competitive advantages upon which to build a position, choosing the right competitive
advantages, and selecting an overall positioning strategy. The company must then
effectively communicate and deliver the chosen position to the market.
Identifying Possible Competitive Advantages
The key to winning and keeping target customers is to understand their needs
better than competitors do and to deliver more value. To the extent that a company
can position itself as providing superior value, it gains competitive advantage. But
solid positions cannot be built on empty promises. If a company positions its product
as offering the best quality and service, it must then deliver the promised quality and

141
service. Thus, positioning begins with actually differentiating the company's
marketing offer so that it will give consumers more value than competitors' offers do.
To find points of differentiation, marketers must think through the customer's
entire experience with the company's product or service. An alert company can find
ways to differentiate itself at every point where it comes in contact with customers. In
what specific ways can a company differentiate its offer from those of competitors? A
company or market offer can be differentiated along the lines of product, services,
channels, people, or image.
Product differentiation takes place along a continuum. At one extreme we find
physical products that allow little variation: chicken, steel, aspirin. Yet even here
some meaningful differentiation is possible. For example, Perdue claims that its
branded chickens are better—fresh and more tender—and gets a 10 percent price
premium based on this differentiation. At other extreme are products that can be
highly differentiated, such as automobiles, clothing, and furniture. Such products can
be differentiated on features, performance, or style and design.
Beyond differentiating its physical product, a firm can also differentiate the
services accompany the product. Some companies gain services differentiation
through speedy, convenient, or careful delivery. For example, BankOne has opened
full-service branches in super markets to provide location convenience along with
Saturday, Sunday, and weekday-evening hours.
Installation can also differentiate one company from another, as can repair
services. Manya automobile buyer will gladly pay a little more and travel a little
farther to buy a car from a dealer that provides top-notch repair services. Some
companies differentiate their offers by providing customer training service or
consulting services—data, information systems, and advising services. Firms that
practice channel differentiation gain competitive advantage through the way they
design their channel's coverage, expertise, and performance. Caterpillar's success in
the construction-equipment industry is based on superior channels. Its dealers
worldwide are renowned for their first-rate service. Amazon.com, Dell Computer, and
Avon distinguish themselves by their high-quality direct channels. And lams pet food
achieved success by going against tradition, distributing its products only through
veterinarians and pet stores.
Companies can gain a strong competitive advantage through people
differentiation—hiring and training better people than their competitors do. Thus,

142
Disney people are known to be friendly and upbeat. Singapore Airlines enjoys an
excellent reputation largely because of the grace of its flight attendants. IBM offers
people who make sure that the solution customers want is the solution they get:
"People Who Get It. People Who Get It Done." People differentiation requires that a
company select its customer-contact people carefully and train them well. For
example, Disney trains its theme park people thoroughly to ensure that they are
competent, courteous, and friendly—from the hotel check-in agents, to the monorail
drivers, to the ride attendants, to the people who sweep Main Street USA. Each
employee understands the importance of understanding customers, communicating
with them cheerfully, and responding quickly to their requests and problems. Each is
carefully trained to "make people happy."
Even when competing offers look the same, buyers may perceive a difference
based on company or brand image differentiation. A company or brand image should
convey the product's distinctive benefits and positioning. Developing a strong and
distinctive image calls for creativity and hard work. A company cannot plant an
image in the public's mind overnight using only a few advertisements. If Ritz-Carlton
means quality, this image must be supported by everything the company says and
does. Symbols—such as the McDonald's golden arches, the Prudential rock, the Nike
swoosh, the Intel Inside logo, or the Pillsbury doughboy—can provide strong
company or brand recognition and image differentiation. The company might build a
brand around a famous person, as Nike did with its Air Jordan basketball shoes and
Tiger Woods golfing products. Some companies even become associated with colors,
such as IBM (blue), Campbell (red and white), or UPS (brown). The chosen symbols,
characters, and other image elements must be communicated through advertising that
conveys the company's or brand's personality.
What is a Product?
A Sony DVD player, a Ford Taurus, a Costa Rican vacation, a Caffe Mocha at
Starbucks, Cha Schwab online investment services, and advice from your family
doctor—all are products. define a product as anything that can be offered to a market
for attention, acquisition, use consumption and that might satisfy a want or need.
Products include more than just tangible goods. Broadly defined, products include
physical objects, services, events, persons, places, organizations, ideas, or mixes of

143
these entities. Thus, throughout this text, we use the term product broadly to include
any or all of these entities.
Because of their importance in the world economy, we give special attention
to services. Services are a form of product that consists of activities, benefits, or
satisfactions offered for that are essentially intangible and do not result in the
ownership of anything. Examples are hotel, airline, retail, tax preparation, and home
repair services.
Products, Services, and Experiences
Product is a key element in the market offering. Marketing-mix planning
begins with formulating an offering that brings value to target customers and satisfies
their needs. This offering becomes the basis upon which the company builds
profitable relationships with customers.
A company's market offering often includes both tangible goods and services.
Each component can be a minor or a major part of the total offer. At one extreme, the
offer may consist of a pure tangible good, such as soap, toothpaste, or salt—no
services accompany the product. At the other extreme are pure services, for which the
offer consists primarily of a service. Examples include a doctor's exam or financial
services. Between these two extremes, however, many goods-and-services
combinations are possible.
Today, as products and services become more and more commoditized, many
companies are moving to a new level in creating value for their customers. To
differentiate their offers, they are developing and delivering total customer
experiences. Whereas products are tangible and services are intangible, experiences
are memorable. Whereas products and services are external, experiences are personal
and take place in the minds of individual consumers. Companies that market
experiences realize that customers are really buying much more than just products and
services. They are buying what those offers will do for them.
Levels of Product and Services
Product planners need to think about products and services on three levels.
Each level adds more customer value. The most basic level is the core benefit, which
addresses the question What is the buyer really buying? When designing products,

144
marketers must first define the core, problem-solving benefits or services that
consumers seek. A woman buying lipstick buys more than lip color. Charles Revson
of Revlon saw this early: "In the factory, we make cosmetics; in the store, we sell
hope." Charles Schwab does more than sell financial services—it promises to fulfill
customers' "financial dreams."
At the second level, product planners must turn the core benefit into an actual
product. They need to develop product and service features, design, a quality level, a
brand name, and packaging. For example, a Sony camcorder is an actual product. Its
name, parts, styling, features, packaging, and other attributes have all been combined
carefully to deliver the core benefit—a convenient, high-quality way to capture
important moments.
Finally, product planners must build an augmented product around the core
benefit and actual product by offering additional consumer services and benefits.
Sony must offer more than just a camcorder. It must provide consumers with a
complete solution to their picture-talking problems. Sony and its dealers also might
give buyes a warranty on parts and workmanship, instructions on how to use the
camcorder, quick repair services when needed, and a toll-free telephone number to
call if they have problems or questions.
Consumers see products as complex bundles of benefits that satisfy their needs. When
developing products, marketers first must identify the core consumer needs the
product will satisfy, They must then design the actual product and find ways to
augment it in order to create the bin-die of benefits that will provide the most
satisfying customer experience.
Product and Service Classifications
Products and services fall into two broad classes based on the types of
consumers that use them-consumer products and industrial products. Broadly
defined, products also include other marketable entities such as experiences,
organizations, persona, places, and ideas.
Consumer Products
Consumer products are products and services bought by final consumers for
personal consumption. Marketers usually classify these products and services further
based on how consumers go about buying them. Consumer products include

145
convenience products, shopping products, specialty products, and unsought products.
These products differ in the ways consumers buy them and therefore in how they are
marketed.
Convenience products are consumer products and services that the customer
usually buys frequently, immediately, and with a minimum of comparison and buying
effort. Examples include soap, candy, newspapers, and fast food. Convenience
products are usually low priced, and marketers place them in many locations to make
them readily available when customers need them.
Shopping products are less-frequently-purchased consumer products and
services that customers compare carefully on suitability, quality, price, and style.
When buying shopping products and services, consumers spend much time and effort
in gathering information and making comparisons. Examples include furniture,
clothing, used cars, major appliances, and hotel and airline services. Shopping
products marketers usually distribute their products through fewer outlets but provide
deeper sales support to help customers in their comparison efforts.
Specialty products are consumer products and services with unique
characteristics or brand identification for which a significant group of buyers is
willing to make a special purchase effort, Examples include specific brands and types
of cars, high-priced photographic equipment, designer clothes, and the services of
medical or legal specialists. A Lamborghini automobile, for example, is a specialty
product because buyers are usually willing to travel great distances to buy one.
Buyers normally do not compare specialty products. They invest only the time needed
to reach dealers carrying the wanted products.
Unsought products are consumer products that the consumer either does not
know about or knows about but does not normally think of buying. Most major new
innovations are unsought until the consumer becomes aware of them through
advertising. Classic examples of known but unsought products and services are life
insurance, cemetery plots, and blood donations to the Red Cross. By their very nature,
unsought products require a lot of advertising, personal selling, and other marketing
efforts.
Industrial Products
Industrial products are those purchased for further processing or for use in
conducting a business. Thus, the distinction between a consumer product and an
industrial product is based on the purpose for which the product is bought. If a

146
consumer buys a lawn mower for use around home, the lawn mower is a consumer
product. If the same consumer buys the same lawn mower for use in a landscaping
business, the lawn mower is an industrial product.
The three groups of industrial products and services include materials and
parts, capital items, and supplies and services. Materials and parts include raw
materials and manufactured materials and parts. Raw materials consist of farm
products (wheat, cotton, livestock, fruits, vegetables) and natural products (fish,
lumber, crude petroleum, iron ore). Manufactured materials and parts consist of
component materials (iron, yarn, cement, wires) and component parts (small motors,
tires, castings). Most manufactured materials and parts are sold directly to industrial
users. Price and service are the major marketing factors; branding and advertising
tend to be less important.
Capital items are industrial products that aid in the buyer's production or
operations, including installations and accessory equipment. Installations consist of
major purchases such as buildings (factories, offices) and fixed equipment
(generators, drill presses, large computer systems, and elevators). Accessory
equipment includes portable factory equipment and tools (hand tools, lift trucks) and
office equipment (computers, fax machines, desks). They have a shorter life thai
installations and simply aid in the production process.
The final group of business products is supplies and services. Supplies include
opera ting supplies (lubricants, coal, paper, pencils) and repair and maintenance
items (paint, nails, brooms). Supplies are the convenience products of the industrial
field because they are usually purchased with a minimum of effort or comparison.
Business services include maintenance and repair services (window cleaning,
computer repair) and business advisory services (legal, management consulting, and
advertising). Such services are usually supplied under contract.
Organizations, Persons, Places, and Ideas
In addition to tangible products and services, in recent years marketers have
broadened the concept of a product to include other market offerings—organizations,
persons, places, and ideas.
Organizations often carry out activities to "sell" the organization itself.
Organization marking consists of activities undertaken to create, maintain, or change
the attitudes and behavior of target consumers toward an organization. Both profit and

147
nonprofit organizations practice organization marketing. Business firms sponsor
public relations or corporate advertising campaigns to polish their images. Corporate
image advertising is a major tool companies use to market themselves to various
publics. For example. Lucent puts out ads with the tag line "We make the things that
make communications work." IBM wants to establish itself as the company to turn to
for “e-Business Solutions." And General Electric "brings good things to life."
Similarly, not-for-profit organizations, such as churches, colleges, charities,
museums, and performing arts groups, market their organizations in order to raise
funds and attract members or patrons.
People can also be thought of as products. Person marketing consists of
activities undertaken to create, maintain, or change attitudes or behavior toward
particular people. All kinds of people and organizations practice person marketing.
Today's presidents market themselves, their parties, and their platforms to get needed
votes and program support. Entertainers and sports figures use marketing to promote
their careers and improve their impact and incomes. Professionals such as doctors,
lawyers, accountants, and architects market themselves in order to build their
reputations and increase business. Businesses, charities, sports teams, fine arts groups,
religious groups, and other organizations also use person marketing. Creating or
associating with well-known personalities often helps these organizations achieve
their goals better. That's why more than a dozen different companies combined—
including Nike, Target, Buick, American Express, Disney, and Titleist—pay more
than $50 million a year to link themselves with golf superstar Tiger Woods.
Place marketing involves activities undertaken to create, maintain, or change
attitudes orj behavior toward particular places. Cities, states, regions, and even entire
nations compete to | attract tourists, new residents, conventions, and company offices
and factories. Texas advertises "It's Like a Whole Other Country," and New York
State shouts, "I Love New York!" Michigan says "Great Lakes, Great Times" to
attract tourists, "Great Lakes, Great Jobs" to attract residents, and "Great Lakes, Great
Location" to attract businesses. The Irish Development Agency has attracted more
than 1,200 companies to locate their plants in Ireland. At the same time, the Irish
Tourist Board has built a flourishing tourism business by advertising "Live a different
life: friendly, beautiful, relaxing." And the Irish Export Board has created attractive
markets for Irish exports.

148
Ideas can also be marketed. In one sense, all marketing is the marketing of an
idea, whether it be the general idea of brushing your teeth or the specific idea that
Crest toothpastes "create smiles every day." Here, however, we narrow our focus to
the marketing of social ideas. This area has been called social marketing, defined by
the Social Marketing Institute as the use of commercial marketing concepts and tools
in programs designed to influence individuals' behavior to improve their well-being
and that of society.6 Such programs include public health campaigns to reduce
smoking, alcoholism, drug abuse, and overeating. Other social marketing efforts
include environmental campaigns to promote wilderness protection, clean air, and
conservation. Still others address issues such as family planning, human rights, and
racial equality.
6.5 Product and Service Decisions
Marketers make product and services decisions at three levels: individual
product decisions, product line decisions, and product mix decisions. We discuss each
in turn.
Individual Product and Service Decisions
We will focus on decisions about product attributes, branding, packaging,
labeling, and product support services. '
Product and Service Attributes
Developing a product or service involves defining the benefits that it will
offer. These benefits are communicated and delivered by product attributes such as
quality, features, and style and design.
Product Quality
Product quality is one of the marketer's major positioning tools. Quality has a
direct impact on satisfaction. In the narrowest sense, quality can be defined as
"freedom from defects." But most customer-centered companies go beyond this
narrow definition. Instead, they define quality ii terms of customer satisfaction.
Total quality management (TQM) is an approach in which all the company's
people an involved in constantly improving the quality of products, services, and
business processes During the past two decades, companies large and small have

149
credited TQM with greatly improve their market shares and profits. Product quality
has two dimensions—level and consistency. In developing a product, the marketer
must first choose a quality level that will support the product's position in the target
market. Here, product quality means performance quality—the ability of a product to
perform its functions. For example, a Rolls-Royce provides higher performance
quality than a Chevrolet: It has a smoother ride, handles better, and lasts longer.
Companies rarely try to offer the highest possible performance quality level—few
customers want or can afford the high levels of quality offered in products such as a
Rolls-Royce automobile, a Sub-Zero refrigerator, or a Rolex watch. Instead,
companies choose a quality level that matches target market needs and the quality
levels of competing products.
Beyond quality level, high quality also can mean high levels of quality consistency.
Here, product quality means conformance quality—freedom from defects and
consistency in delivering a targeted level of performance. All companies should strive
for high levels of conformance quality. In this sense, a Chevrolet can have just as
much quality as a Rolls-Royce. Although a Chevy doesn't perform as well as a Rolls,
it can as consistently deliver the quality that customers pay for and expect.
Many companies today have turned customer-driven quality into a potent
strategic weapon. They create customer satisfaction and value by consistently and
profitably meeting customer’s needs and preferences for quality.
Product Features. A product can be offered with varying features. A stripped-down
model, one without any extras, is the starting point. The company can create higher-
level models by adding more features. Features are a competitive tool for
differentiating the company's product from competitors' products. Being the first
producer to introduce a needed and valued new feature is one of the most effective
ways to compete.
How can a company identify new features and decide which ones to add to its
product? The company should periodically survey buyers who have used the product
and ask these questions? How do you like the product? Which specific features of the
product do you like most? Which features could we add to improve the product? The
answers provide the company with a rich list of feature ideas. The company can then
assess each feature's value to customers versus its cost to the company. Features that

150
customers value little in relation to costs should be dropped; those that customers
value highly in relation to costs should be added.
Product Style and Design Another way to add customer value is through distinctive
product style and design. Design is a larger concept than style. Style simply describes
the appearance of a product. Styles can be eye-catching or yawn producing. A
sensational style may grab attention and produce pleasing aesthetics, but it does not
necessarily make the product perform better. Unlike style, design is more than skin
deep—it goes to the very heart of a product. Good design contributes to a product's
usefulness as well as to its looks.
Good style and design can attract attention, improve product performance, cut
production costs, and give the product a strong competitive advantage in the target
market.
Branding
Perhaps the most distinctive skill of professional marketers is their ability to create,
maintain, protect, and enhance brands of their products and services. A brand is a
name, term, sign, symbol, or design, or a combination of these, that identifies the
maker or seller of a product or service. Consumers view a brand as an important part
of a product, and branding can add value to a product. For example, most consumers
would perceive a bottle of White Linen perfume as a high-quality, expensive product.
But the same perfume in an unmarked bottle would likely be viewed as lower in
quality, even if the fragrance were identical.
Branding has become so strong that today hardly anything goes unbranded. Salt is
packaged in branded containers; common nuts and bolts are packaged with a
distributor's label, and automobile parts—spark plugs, tires, filters—bear brand names
that differ from those of the automakers. Even fruits, vegetables, and poultry are
branded—Sunkist oranges, Dole pineapples, Chiquita bananas, Fresh Express salad
greens, and Perdue chickens.
Branding helps buyers in many ways. Brand names help consumers identify products
that might benefit them. Brands also tell the buyer something about product quality.
Buyers who always buy the same brand know that they will get the same features,
benefits, and quality each time they buy. Branding also gives the seller several
advantages. The brand name becomes the Packaging

151
Packaging involves designing and producing the container or wrapper for a
product. The package includes a product's primary container (the tube holding Colgate
Total toothpaste). It may also include a secondary package that is thrown away when
the product is about to be used (the cardboard box containing the tube of Colgate).
Finally, it can include a shipping package necessary to store, identify, and ship the
product (a corrugated box carrying six dozen tubes of Colgate). Labeling—printed
information appearing on or with the package—is also part of packaging.
Traditionally, the primary function of the package was to contain and protect
the product. In recent times, however, numerous factors have made packaging an
important marketing tool. Increased competition and clutter on retail store shelves
means that packages must now perform many sales tasks—from attracting attention,
to describing the product, to making the sale.
Companies are realizing the power of good packaging to create instant
consumer recognition of the company or brand. For example, in an average
supermarket, which stocks 15,000 to 17,000 items, the typical shopper passes by
some 300 items per minute, and more than 60 percent of all purchases are made on
impulse. In this highly competitive environment, the package may be the seller's last
chance to influence buyers. It becomes a "five-second commercial." The Campbell
Soup Company estimates that the average shopper sees its familiar red-and-white can
76 times a year, creating the equivalent of $26 million worth of advertising.
Innovative packaging can give a company an advantage over competitors. In
contrast, poorly designed packages can cause headaches for consumers and lost sales
for the company. Developing a good package for a new product requires making
many decisions. First, the company must establish the packaging concept, which
states what the package should be or do for the product. Should it mainly offer
product protection, introduce a new dispensing method, suggest certain qualities
about the product, or do something else? Decisions then must be made on specific
elements of the package, such as size, shape, materials, color, text, and brand mark.
These elements must work together to support the product's position and marketing
strategy.
Labeling
Labels may range from simple tags attached to products to complex graphics
that are part of the package. They perform several functions. At the very least, the
label identifier the product or brand, such as the name Sunkist stamped on oranges.

152
The label might also describe several things about the product—who made it, where it
was made, when it was made, its contents, how it is to be used, and how to use it
safely. Finally, the label might promote the product through attractive graphics.
Labeling has been affected in recent times by unit pricing (stating the price per
unit of standard measure), open dating (stating the expected shelf life of the product),
and nutritional labeling (stating the nutritional values in the product). the use of
health-related terms such as low-fat, light, and high-fiber. Sellers must ensure that
their labels contain all the required information.
Product Support Services
Customer service is another element of product strategy. A company's offer to
the marketplace usually includes some support services, which can be a minor or a
major part of the total offering.
The first step is to survey customers periodically to assess the value of current
services and to obtain ideas for new ones. For example, Cadillac holds regular focus
group interviews with owners and carefully watches complaints that come into its
dealerships. From this careful monitoring, Cadillac has learned that buyers are very
upset by repairs that are not done correctly the first time.
Once the company has assessed the value of various support services to customers, it
must next assess the costs of providing these services. It can then develop a package
of services that will both delight customers and yield profits to the company. Based
on its consumer interviews, Cadillac has set up a system directly linking each
dealership with a group of 10 engineers who can help walk mechanics through
difficult repairs. Such actions helped Cadillac jump, in one year, from fourteenth to
seventh in independent rankings of service.
Many companies are now using the Internet and other modern technologies to provide
support services that were not possible before. Using the Web, 24-hour telephone help
lines, self-service kiosks, and other digital technologies, these companies are now
empowering consumers to tailor their own service and support experiences. For
example, Kaiser-Permanente, the nation's largest health maintenance organization
(HMO), has rolled out a Web site that lets members register online for office visits
and send e-mail questions to nurses and pharmacists (and get responses within 24

153
hours). Kaiser also plans to give members access to lab results and pharmaceutical
refills online.
Product Line Decisions
Beyond decisions about individual products and services, product strategy also calls
for building a product line. A product line is a group of products that are closely
related because they function in a similar manner, are sold to the same customer
groups, are marketed through the same types of outlets, or fall within given price
ranges. For example, Mike produces several lines of athletic shoes and apparel, Nokia
produces several lines of telecommunications products, and Charles Schwab produces
several lines of financial services.
The major product line decision involves product line length—the number of
items in the product line. The line is too short if the manager can increase profits by
adding items; the line is too long if the manager can increase profits by dropping
items. The company should manage its product lines carefully. Product lines tend to
lengthen over time, and most companies eventually need to prune unnecessary or
unprofitable items from their lines to increase overall profitability.
Product line length is influenced by company objectives and resources. For
example, one objective might be to allow for upselling. Thus BMW wants to move
customers up from it's 3-series models to 5- and 7-series models. Another objective
might be to allow cross-selling: Hewlett-Packard sells printers as well as cartridges.
Still another objective might be to protect against economic swings: Gap runs several
clothing-store chains (Gap, Old Navy, Banana Republic) covering different price
points.
A company can lengthen its product line in two ways: by line stretching or by
line filling. Product line stretching occurs when a company lengthens its product line
beyond its current range. The company can stretch its line downward, upward, or both
ways.
Companies located at the upper end of the market can stretch their lines
downward. A company may stretch downward to plug a market hole that otherwise
would attract a new competitor or to respond to a competitor's attack on the upper
end. Or it may add low-end products because it finds faster growth taking place in the
low-end segments. DaimlerChrysler stretched its Mercedes line downward for all
these reasons. Facing a slow-growth luxury car market and attacks by Japanese

154
automakers on its high-end positioning, it successfully introduced its Mercedes C-
Class cars. These models sell at less than $30,000 without harming the firm's ability
to sell other Mercedes for $100,000 or more. Similarly, Rolex launched its Rolex
Tudor watch retailing for about $1,350, compared with a Rolex Submariner, usually
priced at $3,875.16
Companies at the lower end of a market can stretch their product lines
upward. Sometimes, companies stretch upward in order to add prestige to their
current products. Or they may be attracted by a faster growth rate or higher margins at
the higher end. For example, each of the leading Japanese auto companies introduced
an upmarket automobile: Toyota launched Lexus, Nissan launched Infinity, and
Honda launched Acura. They used entirely new names rather than their own names.
Companies in the middle range of the market may decide to stretch their lines
in both directions. Marriott did this with its hotel product line. Along with regular
Marriott hotels, it added the Renaissance Hotels line to serve the upper end of the
market and the TownePlace Suites line to serve the moderate and lower ends. Each
branded hotel line is aimed at a different target market. Renaissance aims to attract
and please top executives; Marriotts, upper and middle managers; An alternative to
product line stretching is product line filling—adding more items within the present
range of the line. There are several reasons for product line filling: reaching for extra
profits, satisfying dealers, using excess capacity, being the leading full-line company,
and plugging holes to keep out competitors. Sony filled its Walkman line by adding
solar-powered and water- proof Walkmans, an ultralight model that attaches to a
sweatband for exercisers, the MiniDisc Walkman, the CD Walkman, and the Memory
Stick Walkman, which enables users to download tracks straight from the Net.
However, line filling is overdone if it results in cannibalization and customer
confusion. The company should ensure that new items are noticeably different)
existing ones.

155
6.6 Product Mix Decisions
An organization with several product lines has a product mix. A product mix (or
product assortment) consists of all the product lines and items that a particular seller
offers for sale. Avon's product mix consists of four major product lines: beauty products,
wellness products, jewelry and accessories and "inspirational" products (gifts, books,
music, and home accents). Each product line consists several sublines. For example, the
beauty line breaks down into makeup, skin care, bath and beai fragrance, and outdoor
protection products. Each line and subline has many individual items. Altogether, Avon's
product mix includes 1,300 items. In contrast, a typical Kmart stocks 15,000 items 3M
markets more than 60,000 products, and General Electric manufactures as many as
250,000 items.
A company's product mix has four important dimensions: width, length, depth,
and consistency. Product mix width refers to the number of different product lines the
company carries. Pro & Gamble markets a fairly wide product mix consisting of 250
brands organized into many product lines. These lines include fabric and home care, baby
care, feminine care, beauty care, health care, a food and beverage products. Product mix
length refers to the total number of items the company carries within its product lines.
P&G typically carries many brands within each line. For example, it s seven laundry
detergents, six hand soaps, five shampoos, and tour dishwashing detergents.
Product line depth refers to the number of versions offered of each product in the
line. Thus, P&G's Crest toothpaste comes in 13 varieties, ranging from Crest Multicare,
Crest Cavity Protection, and Crest Tartar Protection to Crest Sensitivity Protection, Crest
Dual Action Whitening, Crest Whitening Plus Scope, Kid's Cavity Protection, and Crest
Baking Soda & Peroxide Whitening formulations.
Finally, the consistency of the product mix refers to how closely related the various
product lines are in end use, production requirements, distribution channels, or some
other way. P&G's product lines are consistent insofar as they are consumer products that
go through the same distribution channels. The lines are less consistent insofar as they
perform different functions for buyers.

156
These product mix dimensions provide the handles for defining the company's product
strategy. The company can increase its business in four ways. It can add new product
lines, thus widening its product mix. In this way, its new lines build on the company's
reputation in its other lines. The company can lengthen its existing product lines to
become a more full-line company. Or it can add more versions of each product and thus
deepen its product mix. Finally, the company can pursue more product line consistency—
or less—depending on whether it wants to have a strong reputation in a single field or in
several fields.
SUMMARY
Marketing is a social and managerial process by which individuals and groups obtain
what they need and want through creating and exchanging products and value with oth-
ers. Significantly, companies address needs by putting forth a value proposition which is
a set of benefits that they promise to consumers to satisfy their needs. Hereby marketing
management is defined as the art and science of choosing target markets and building
profitable relationships between organizations and customers. This involves getting,
keeping, and growing customers through creating, delivering, and communicating
superior customer value. There are three major steps in target marketing. The first is
market segmentation—dividing a market into smaller groups of buyers with distinct
needs, characteristics, or behaviors who might require separate products or marketing
mixes. The company identifies different ways to segment the market and develops
profiles of the resulting market segments. The second step is target marketing—
evaluating each market segment's attractiveness and selecting one or more of the market
segments to enter. The third step is market positioning—setting the competitive
positioning for the product and creating a detailed marketing mix.

157
FOR DISCUSSION
1. Define what marketing is and discuss its core concepts.
2. Define marketing management and compare the five marketing management
orientations.
3. Discuss customer relationship management.
4. Define the three steps of target marketing: market segmentation, target marketing,
and market positioning.
5. List and discuss the major bases for segmenting markets.
6. Discuss how companies can position their products for maximum competitive
advantage in the marketplace.
7. Define product and the major classifications of products and services.
8. Describe the decisions companies make regarding their individual products and
services, product lines, and product mixes.
SUGGESTED TEXT BOOKS
1. Kotler P, “Marketing Management – Analysis, Planning, Implementation and
Control”, Prentice Hall India, 9th Edition, 2000, India.
2. Kotler P and Armstrong G, “Principles of Marketing”, Prentice hall of India, 9th
Edition, 2001.
3. Neelamegham S, “Marketing management and Indian Economy”, Vikas
Publishing House, India, 1998.

158
Chapter 7
FINANCIAL MANAGEMENT

159
FINANCIAL MANAGEMENT
SCOPE OF THE COURSE After reading chapter 7, you should be able to:
Understand the fundamentals of accounting Explain the elements of cost Understand when order would be placed to
purchase materials Know about inventory systems and wage systems Distinguish between management and cost
accounting Understand cost-volume profit analysis and break
even analysis

160
INTRODUCTION TO FINANCIAL ACCOUNTING 7.1 Definition of accounting
In 1941, the committee on terminology of the American Institute of certified public
accounts (AICPA) formulated the following definition which was widely quoted for
many years:
“Accounting is the art of recording, classifying and summering in a significant manner,
and in terms of money transactions and events which are, in part at least, of a financial
character, and interpreting the results thereof.”
In 1966, the American accounting association (AAA), in order to emphasize the broader
perspective of accounting, provided the following definition of accounting.
“Accounting is the process of identifying, measuring and communicating economic
information to permit informed judgments and decisions by users of the information.”
More recently, in 1970 the AICPA of the US defined accounting with reference to the
concept of information.”
“Accounting is a service activity. Its function is to provide quantitative information,
primarily financial in nature, and about economic activities, that is intended to be useful
in making decisions that effect the organization. Today’s accounting focuses on the
ultimate needs of those, who use accounting information, whether these users are inside
or outside the business itself.
Users of accounting information

161
Accounting provides useful information about the activities of an entity to individuals or
group a for their use in making informed judgments and decisions. The users of
accounting information can be broadly divided into categories:
1. Management if managers
2. Users with direct financial interest
3. Users with indirect financial interest
Fig. 7.1 shows different users of accounting information and different decision made by
them.
Fig. 7.1: Different Users of Accounting information
Principal Financial Statements
Management (directors, officers of the company, managers, department heads, and supervisors) Decisions: Assessing profitability financial position and actual performance in terms of plans and goals, making plans and policies.
Users with direct financial interest (present and potential creditors, employee, suppliers.) Decisions: Share investment decisions. Credit decisions, assessing company status and prospects, approving supply decisions
Users with indirect financial interest (customers, taxation authorities, regulatory agencies financial analysts and advisers, brokers, underwriters, planners, labour, unions, consumer groups, general public, press etc. Decisions: Assessing taxes, protecting investors and public interest, advising on investment decisions, setting economic policies, measuring social and environmental protection programmes, negotiating labour agreements.
Accounting

162
The end product of the financial accounting process is a set of reports that are called
financial statements. The following constitute the financial statements:
1. Profit and loss account
2. Balance Sheet
3. Statement of Changes in Financial Position (SCFP)
Profit and loss account also known as income statement, presents the results of operations
of a business enterprise for a period of time. This statement shows net profit or net
income of an entity for a period of time.
Balance sheet shows the financial position of a business on a certain date. For this reason,
it is often called the statement of financial position... Balance sheet indicates the investing
and financing activities of a business enterprise at a point of time and shows a firm’
assets, liabilities an equity capital.
A Statement of changes in Financial Position (SCFP) shows where in financial resources
(funds) have come from (sources) and where they have gone (users).
7.1 Postulates, Concepts And Principles
Postulates
Accounting postulates are basic assumptions which are generally accepted as self-evident
truths in accounting. Postulates are established or general truths which do not require any
evidence to prove them. They are the propositions taken for granted.
Concepts
Accounting concepts are also self evident Statements or truths. Accounting concepts
provide the conceptual guidelines for application in the financial accounting process. The
concepts are important because they (a) help explain the ‘why’ of accounting (b) provide
guidance when new accounting situations are encountered, and (c) significantly reduce
the need to memories accounting procedures when learning about accounting.
Accounting Postulates
1. Entity Postulate: The entity postulate assumes that the financial statements and
other accounting information are for the specific business enterprise which is

163
distinct form its owners. Attention in financial accounting is focused on the
economic activities of individual business enterprise.
2. Going Concern Postulate: An accounting entity is viewed as continuing in
operation in the absence of evidence to the contrary. Because of the relative
permanence of enterprises, financial accounting is formulated assuming that the
business will continue to operate for an indefinitely long period in the future.
3. Money measurement Postulate: A unit of exchange and measurement is necessary
to account for the transactions of business enterprises in a uniform manner. The
common denominator chosen in accounting is the monetary unit.
4. Accounting Period Postulate: Financial accounting provides information about the
economic activities of an enterprise for specified time periods that are shorter than
the life of the enterprise. Normally the time periods are of equal length to
facilitate comparison.
Accounting Concepts and Principles
1. Cost Principle: The cost principle requires that assets be recorded at the exchange
price, i.e. acquisition cost or historical cost. Historical cost is recognized as the
appropriate valuation basis for recognition of the acquisition of all goods and
services, expenses, costs and equities.
2. Dual-Aspect Principle: This principle lies at the heart of the whole accounting
process. Accounts recording systems have therefore developed so as the show two
main things; (a) the source of wealth, and (b) the form it takes.
3. Accrual Principle: Accrual accounting is based not only on cash transactions but
also on credit transactions, barter exchanges, changes in prices, changes in the
form of assets or liabilities, and other transactions, events, and circumstances that
have cash consequences for an enterprise but involve no concurrent cash
movement.
4. Conservatism Principles: The concept of accounting conservatism suggests that
when and where uncertainty and risk exposure so warrant, accounting takes a
wary and watchful stance until the appearance of evidence to the country.

164
5. Matching Principle: The matching principle in financial accounting is the process
of matching (relating) accomplishments or revenues (as measured by the selling
prices of goods and services delivered) with efforts or expenses (as measured by
the cost of goods and services used) to a particular period for which the income is
being determined.
6. Consistency Principle: This principle requires that once an organization has
decided on one method, it should use the same method for all subsequent
transactions and events of the same nature unless it has sound reason to change
methods.
7. Materiality Principle: Materiality concept implies that the transactions and events
that have immaterial or insignificant effects should not be recorded and reported
in the financial statements. It is argued that the recording of insignificant events
cannot be justified in terms of its subsequent poor utility to users.
8. Full disclosure principle: The principle of full disclosure requires that a business
enterprise should provide all relevant information to external users for the purpose
of sound economic decisions.
Basic Accounting Equation Or Model
The framework of the financial statements and the elements shown in these statements
rests on important and basic relationship, referred to as basic or fundamental accounting
equation or basic accounting model. This basic equation is expressed by the balance sheet
equation, and therefore, is known as the balance sheet equation also. The balance sheet
equation indicates that
Sources of Funds = Uses of Funds (Or) Equities = Assets
(Or) Proprietor’s Equity (Capital) + outside Liability = Assets
The above accounting equation signifies that assets of a business are always equal to the
total of outside liabilities and proprietor’s equity. Example:
On January 1, 1999, a company Super Consultants India Ltd. Was incorporated. The
following transactions occurred during January 1999.

165
January
1. Business was started with capital of Rs. 10,000 cash.
4 Equipment was rented (and paid) for the month at a cost of Rs. 1,200.
8 Paper stationery purchased on credit Rs. 800.
15. The company charged Rs. 3,000 as consulting fees from the customers during
January. This amount is due to be received next month.
20. Miscellaneous expense of Rs. 600 were paid.
29. Land was purchased by borrowing Rs. 40,000 from a bank
The loan is due to be repaid in five years. Interest payments are due at the end of
each money beginning July 31.
30. Salaries of Rs.700 for the month were paid.
31. Lesson fees were billed to customers in the amount of Rs. 2,800.
(They are due to be received next month).
Prepare a summary of the preceding transactions. Determine balances after each
transaction to show that the basic equation is in balance.
Prepare an income statement, a statement of retained earnings, balance sheet for
January 1999.
Solution: SUPER CONSULTANT INDIA LTD. SUMMARY OF TRANSACTIONS, January 1999 Assets = Liabilities + Equity Date Cash + Accounts Receivables + Land = A/cs payables + Loan Capital + Profit or Retained Earning 1 10,000 = 10,000
4 - 1,200 -1,200
8,800 10,000 - 1,200 8 = +800 - 800 8,800 800 10,000 - 2,000 15 +3,000 = +3,000 8,800 3,000 800 10,000 +1,000 20 - 600 = - 600 8,200 3,000 = 800 10,000 + 400 29 + 40,000 = + 40,000 8,200 3,000 40,000 = 800 40,000 10,000 + 400

166
30 -700 -700 7,500 3,000 40,000 = 800 40,000 10,000 - 300 31 + 2,800 + 2,800 7,500 5,800 40,000 = 800 40,000 10,000 2,500
INCOME STATEMENT FOR THE MONTH ENDED JANUARY 31, 1999 Revenues: (Rs.) Consulting fees 3,000 Lesson Fees 2,800 Total Revenues 5,800 Less: Expenses Rent expense 1,200 Paper & Stationery 800 Salaries 700 Misc. expenses 600 3,300 Net Income 2,500 STATEMENT OF RETAINED EARNINGS Retained earnings as on January 1… NIL Add: Net Income for January 2,500 Total 2,500 Less= dividends NIL Retained earnings, January 31 2,500
Accounting Records
Accounting is based on a double-entry system, which means that we record the dual
effects of a business transaction. Each transaction affects at least two accounts. For

167
example, an owner’s cash investment in the business increases both the Cash account and
the Capital account of the business. It would be incomplete to record only the increase in
the entity's cash without recording the increase in its owner's equity.
Consider a cash purchase of supplies. What are the dual effects of this transaction? The
purchase (1) decreases cash and (2) increases supplies. A purchase of supplies on credit
(1) increases supplies and (2) increases creditors. All transactions have at least two
effects on the entity.
The T-Account
The most widely used account format is called the T-account because it takes the form of
the capital letter "T." The vertical line in the T-account divides the account into its left
and right sides. The account title rests on the horizontal line. For example, the Cash
account of a business appears in the following T-account format:
CASH (Left side)
Debit (Right side)
Credit The left side of the account is called the debit side, and the right side is called the credit
side. Debit and credit are abbreviated as follows:
Dr = Debit
Cr = Credit
The account category determines how increases and decreases in it are recorded. For any
given account, all increases are recorded on one side, and all decreases are recorded on
the other side.
Rules of Debit and Credit
Increases in assets are recorded on the left (debit) side of the account.
Decreases in assets are recorded on the right (credit) side.
Conversely,
Increases in liabilities and owner's equity are recorded by credits.
Decreases in liabilities and owner's equity are recorded by debits.

168
Whether an account is increased or decreased by a debit or a credit depends on the type
of account. This pattern of recording debits and credits is based on the accounting
equation:
Assets = Liabilities + Owner's Equity
Debits = Credits
Assets are on the opposite side of the equation from liabilities and owner's equity.
Therefore, increases and decreases in assets are recorded in the opposite manner from
those in liabilities and owner's equity. And liabilities and owner's equity, which are on the
same side of the equal sign, are treated in the same way.
Cash Book
This records all receipts of and payments in cash. Usually the deposits into bank accounts
maintained by the business, withdrawals from such accounts and cheque payments are
also recorded in the Cash Book. Sometimes a separate book for recording receipts and
payments by cheques/DDs etc., is kept, known as the Bank Book. A Cash Book which is
used to record both cash and bank transactions is referred to as a Two-column Cash
Book. The format of this cash book is given below:
Table 7.1 Cash book Date Receipts Cash
(Rs.) Bank (Rs.)
Date Payments Cash (Rs.)
Bank (Rs.)
1,500 800 500
13,000 2,000 2,350
50 400 2,350
400 10,800 6,150
2000 April 1 6 7 11 20
To Balance b/d To Sales To Arvind Co To Bela Corporation To Sales
2,800
2000 April 2 5 8 15 30
By wages By electricity By Plumbing repairs
2,800 17,350 Journal
The Books of Accounts maintained by an organization other than the cash book
may be classified into Journals and Ledgers. The Journal is used as the book of first entry
for all transactions which cannot be recorded in the Cash Book. In other words, all non-
cash transactions should be recorded in the journal. For practical convenience the journal
is maintained by using a number of books called the subsidiary books. For example, the
following subsidiary books may constitute the journal for an enterprise.

169
(i) Purchase Book (ii) Purchase Returns Book (iii) Sales Book (iv) Sales Returns Book (v) Bill Receivable Book (vi) Bills Payable Book (vii) Journal Proper
Specimen formats of these books and brief explanations regarding their use are given in
the following sections.
Purchases book
Also known as the purchases Journal, this book is used to record credit purchases of
goods only. The term ‘goods’ covers only those items procured by the business for resale.
Table 7.2 Purchase Book of Johnson Co.
Date Name of Supplier Ledger Folio Inward Invoiced No.
Amount Rs.
2000 April 2 12 20
Y Limited Sharp Enterprises Best and Company
3354 401 5542
10,950 2,700 3,900
Total 17,550 Purchase Returns Books
This subsidiary book is used to record the goods purchased on credit and sent back to
suppliers as they are found not conforming to specifications or for any other reason.
Table 7.3 Purchase Returns Book of Johnson Co.
Date Name of Supplier Ledger Folio Debit Note No Amount (Rs.)
2000 April 5 25
Sharp Enterprises Best and Company
80 81
1,000 900
Total 1,900

170
Sales Book
Also known as the Sales Journal, this subsidiary book is used to record all sales of goods
on credit.
Table 7.4 Sales book
Date Name of Supplier Ledger Folio Outward Invoice No.
Amount (Rs.)
2000 April 3 5 6 15 25
Beta Corporation Zeta Company Quality Dealers Sooraj Traders Star Enterprises
1001 1002 1003 1004 1005
2,410 3,940 4,990 1,800 19,500
Total 32,550 Sales Returns Book
This book is used to record the transactions relating to goods sold on credit and received
back form the customers as not conforming to the specifications or for any other reason.
Table 7.5 Sales Returns Book
Date Name of Customer Ledger Folio Credit Note No
Amount (Rs.)
2000 April 10 27
Company Star Enterprises
10 11
540 2,000
Total 2,540 Bills Receiveable Book
The bills Receivable of an enterprise consists of all Promissory Notes is given by
customer our Bills of Exchange accepted by customers in respect of amounts due from
them the bills Receivable Book is used to record all such promissory Notes given or such
bills of Exchange accepted by customers.
Table 7.5 Bills Receivable Book of Johnson Co
Date From Whom reced.
Acceptor Date of bills
Term Date of maturity
Where payable
Amount. (Rs.)
How Disposed
April Quality Quality 8.4.95 90 10.7.95 Bank of 4,900 Discounted

171
12 18
Dealers Sooraj Traders
Dealers Sooraj Trader
16.04.95
days 60 days
10.6.95
India Central Bank of India, New Delhi
1,800
on 20.4.95
6,700 Bills Payable Book
The Bills Payable consists of all Promissory Notes given or Bills of Exchange accepted
by the business in respect of amounts owing to its suppliers. The Bills Payable Book is
used to record all such Promissory Notes given or Bills of Exchange accepted by the
business
Table 7.6 Bills Payable Book of Johnson Co N Date Name
of the drawer
Payee Date of Bills
Term Date of maturity
Where payable
Amount. Remark
1995 April 25
Best & Co.
Best & Co.
25.4.95 92 Days
27.7.95 Canara Bank, Bombay
3,000
Journal Proper
This Book is used to record all transactions which cannot be included in the cash book or
any of the other six subsidiary books, discussed above. The transactions that will be
recorded in Journal Proper are, purchase or sale of fixed assets and investments on credit,
adjusting entries, rectification entries etc.
Table 7.7 Journal Proper Date Particulars Ref. Ledger
Folio Debit (Rs.)
Credit (Rs.)
April 10 Furniture and Fitting A/c Dr. To Furniture Mart A/c (being the purchase of furniture on credit)
4,000 4000

172
April 30 Repairs to machinery A/c Dr. To Machinery A/c (being the rectification of a wrong posting of a repair expense to asset (A/c)
5,000 5,000
Ledger
An accounting system typically contains a large number of accounts. Collectively these
individual account are contained in a record know as the ledger. A ledger is simply the
grouping of the accounts that are used to prepare financial statements for a business. A
ledger account is a summary device and its simplest form is shaped like the letter and
called a T account
Relationship between Journal and Ledger
Journal and ledger are the most important books maintained in an enterprise. They are
closely interrelated. Business transactions are recorded first in Journal and other books of
original entry and then from these books that are transferred to ledger. Journal records
transaction in a chronological order while the ledger records the transactions in a
classified form.
Posting
Posting is a process of transferring debits and credits from the Journal and other books of
original entry to their respective account in the ledger. The aim of posting is to make a
classified and summarized record of business transactions in appropriate accounts.
Posting Of Different Account Books:
Cash book
Rules regarding posting of cash book are given below:
(i) Transactions recorded on the debit side of Cash Book are posted on the credit side
of accounts opened in the ledger.
(ii) Transactions recorded on the credit side of the cash book are posted on the debit
side of different account in the ledger.

173
Purchase Book
In purchases Books, credit purchases of goods in which the enterprises deals are
recorded. Accounts of all those persons who have supplied goods are to be opened and
credited with the amount of purchase made from the. Total of purchases book is to be
posted on the debit side of purchases account. This is illustrated below:
Harish Jain, Delhi Dr. Cr. Rs. Rs. 1.6.94 By Purchase a/c 10,000 Summant Prasad Dr. Rs. Rs. 31.5.94 By Purchase a/c 20,000 Purchased a/c Dr. Cr. Rs. Rs. 1.6.94 To Sundries a/c 30,000 Purchase Return Book
Purchases Return Book, also called Returns Outward Book, records returns of Purchase
made to suppliers. Personal accounts of all these persons to whom goods have returned
are debited and total of purchase returns book is credited to purchase returns account as
illustrated below
Harish Jain, Delhi Dr. Cr. Rs. Rs. 15.7.94 To Purchases Return
a/c 1,000 1-7-94 By Purchases a/c 10,000
Summant Prasad Dr. Cr.

174
Rs. Rs. 20-6-94
To Purchase return a/c 3,000 31.5.94 By Purchases a/c 20,000
Purchase Returns a/c Dr. Cr. Rs. Rs. 31.7.94 By Sundries 4,000
Sales Book
Sales Book records all credit sales. While posting Sales Book to ledger, Personal
accounts of the customers are opened and debited by the amount of sales made to them
total of Sakes us redited to Sales account. This is illustrated below.
Ram Pershad Rs. Rs. 2.7.94 To Sale a/c 15,000 Devi Prasad Rs. Rs. 25.6.94 To Sales a/c 20,000 Sales A/c Rs. Rs 31.7.94 By Sundries 15,000 Sales Returns Book/Returns Inward Book
When goods are returned by customer they are recorded in sales returns book/returns
inward book. While posting Sales Returns book to Ledger, personal accounts of the
customer are credited and total of Sales Returns Book is debited to Sakes returns a/c. this
is illustrated below:
Ram Prashad Dr. Cr. Rs. Rs.

175
2.7.94 To Sales a/c 15,000 14.7.94 By Sales returns a/c 4,000 Devi Dass Dr. Cr. Rs. Rs. 25.6.94 To Sales a/c 20,000 10.7.94 By Sales return a/c 4,000 Sales A/c Dr. Cr. Rs. Rs. 15.7.94 To Sundries 8,000 Bills Receivable Book
In bills receivable book, bills received by the enterprise are recorded. While posting Bills
receivable book, Personal accounts of the persons giving the bills are credited. Total of
Bills Receivable book is debited to Bills Receivable a/c
Sunder Kumar Dr. Cr. Rs. 1994 Rs. July 10 By B/R a/c 10,000 Suresh Chander Dr. Cr. Rs. 1994 Rs. July 7 By B/R 15,000 Bill Receivables a/c Dr. Cr. Rs. Rs. 15.7.94 To Sundries 25,000
Bills Payable Book
The enterprise may accept so many bills in the business. Acceptances given are
recorded in Bills payable book. While posting Bills payable Book acceptances given are
debited to the personal accounts of the persons to whom they have been given and total of
Bills Payable book is posted to the credit side of Bills payable a/c. This is illustrated
below:
Ram Prasad

176
Dr. Cr. Rs. Rs. 2.7.94 To B/P 8,000 Chandra Mohan Dr. Cr. Rs. Rs. 10.7.94 To B/p a/c 7,000 Dr. Cr. Rs. Rs. 15.7.94 By Sundries 15,000 Posting Of Journal
When we journalize a transaction we write out in the journal as to which account is to be
debited and which account is to be credited. The same information is transferred to
Ledger in the two concerned accounts. This is illustrated below:
Table 7.8 Posting of Journal
Particulars Rs. Rs. Furniture a/c Dr. To Jain & Co. (Being furniture bought from Jain & Co. on Credit
Depreciation a/c Dr. To Furniture a/c
70,000 7,000
70,000 7,000
Furniture a/c Dr. Cr. Rs. Rs. To Jain & Co. 70,000 By depreciation a/c 7,000 Depreciation a/c Dr. Cr. Rs. Rs. To Furniture a/c 7,000 Jain & Co. Dr. Cr. Rs. Rs.

177
To Furniture a/c 70,000 Balancing of an Account
Balancing of an account implies a process of ascertain the net balance of an
account after considering and comparing the total of both sides-viz debit side and credit
side. The Balance is put on the side which is smaller and the two totals-debit side and
credit side. The Balance is put on the side which is smaller and the two totals-debit side
and credit side are made equal. Against the balance a reference is put that is has been
carried forward (C/F). The balance of an account will be termed as debit balance if the
total of debit side is greater than the total of credit side. On the other hand, if total of
credit side is greater than total of debit side, balance will be a credit balance. This is
illustrated below:
Mohan
Table 7.9 Balancing of an Account Rs. Rs.
7,000 2,000 15,00016,000
15,000 25,000
40,000 40,000
5.5.94 6.5.94 17.5.94 31.5.94
To B/p a/c To purchase returns To Bank a/c To Balance c/d
1.5.94 16.5.94
By purchase a/c By purchase a/c By balance b/d
16,000
Furniture a/c Rs. Rs.
16,000
16,000
16,000 16,000
1.5.94 1.6.94
To Bank a/c To Balance b/d
16,000
31.5.94 By balance c/d
Trial Balance
When all accounts of the ledger are in balance, a Trial Balance is prepared. A
Trial Balance is a listing of all the accounts and their respective balances. Trial balance is

178
a statement of debit balances and credit balance extracted from ledger accounts on a
particular date. A Trial Balance is, thus, a summary of all the ledger balances outstanding
as on a particular date.
Performa of a Trial Balance is as follows:
Trial Balance as at….
Ledger accounts Debit Balance Credit Balance It must be stated here that total of debit balance column must be equal to total of
credit balances column. This is so because under double entry system, for each item of
debit there is a corresponding credit and secondly all the transactions recorded in the
books of original entry are transferred to ledger.
Objectives of Preparing a Trial Balance
The following are the objectives of preparing a Trial Balance:
1. To check the
2. Arithmetical accuracy of accounting entries posted in the ledger- When the
trail balances tallies, it is an indication of the fact that ledger accounts are
arithmetically accurate. It also indicates that: (i) For each transaction, the
debits and credits were recorded in equal amounts. (ii) The balance (debit
balances and credit balance)for each account was calculated correctly. (iii)
The balances of the various debit and credit accounts have been correctly
added together to arrive at the total equality of the debit and credits. Of course
there may be certain errors in the books of accounts inspite of the agreement
of Trial Balance. These have been discussed later in a subsequent chapter.
3. To Provide a Basic for Financial statement- Trial Balance is a first step
towards preparation of financial statement of an organization. If trail balance
is not prepared, it will be impossible to prepare the financial statement.
4. Trial Balance serves as a summary of all the ledger accounts and provides a
complete picture of each account in the ledger.
Example

179
During January 1999, Anil Kumar transacted the following business. You are required to
make journal entries for the transactions and prepare cash book and other necessary
ledger accounts based on the journal entries.
January 1999 1 2 3 4 5 6 7 8 9 10 11 12 15 18 20 22 25 28 31
Commenced business with cash Purchased goods on credit from Shyam Purchased goods for cash Paid Gopal an advance for goods ordered Received cash from Muthy as advance for goods ordered by him Purchased furniture for office use for cash Paid wages Received commission (in cash) Goods returned to Shyam Goods sold to kamal Paid for postage and telegrams Goods returned by kamal Paid for Stationery Paid into bank Good sold for cash Bought goods for cash Paid salaries Paid rent Drew cash for personal use
20,000 15,000 500 1,000 1,500 1,000 250 300 100 5,000 100 250 100 250 375 500 350 250 500
Table 7.10 Solution
Date Particulars L.F Debit
(Rs.) Credit (Rs)
1999 Jan.1
Cash account Dr. To Capital account ( Being the cash brought into business as capital)
20,000 20,000
Jan. 2 Purchase account Dr To Shyam’s account (Being the goods purchased on credit)
15,000 15,000
Jan 3 Purchase account Dr To Cash account
500 500

180
(Being the goods purchased for cash) Jan 4 Gopal account
Dr To Cash account (Being the amount paid to Gopal)
1,000 1,000
Jan 5 Cash account Dr To Murthy account (Being the cash received from Murthy)
1,500 1,500
Jan 6 Furniture account Dr To cash account (Being the furniture purchased for office use for cash)
1,000 1,000
Jan 7 Wages account Dr To cash account (Being the wages paid)
250 250
Jan 8 Cash account Dr To commission received a/c (Being the commission received)
300 300
Jan 9 Shyam account Dr To purchase returns account (Being goods returned to shyam)
100 100
Jan 10 Kamal account Dr To sales account (Being goods sold to kamal on credit)
5,000 5,000
Jan. 11 Postage and telegrams account Dr To Cash account (Being the goods returned by kamal)
100 100
Jan 12 Sales returns account Dr To Kamal account (Being the goods returned by kamal)
250 250
Jan.15 Stationary account Dr To cash account (Being the amount paid for stationary)
100 100
Jan 18 Bank account Dr To cash account (Being the amount deposited in to the bank)
250 250
Jan 20 Cash account Dr To sales account
475

181
(Being the goods sold for cash) 475 Jan 22 Purchase account Dr
To cash account (Being the goods purchased for cash)
500 500
Jan 25 Salaries account Dr To cash account ( Being the amount paid as salaries
350 350
Jan 28 Rent account Dr To cash account ( Being the rent paid)
250 250
Jan 31 Drawings account Dr To cash account (Being the cash drawn for personal use)
500 500
LEDGER ACCOUNTS Table 7.11 Cash Book
Dr Cr Date Receipts Ledg
er Folio
Cash (Rs.)
Bank (Rs)
Date Payments Ledger Folio
Cash (Rs.)
Bank (Rs)
20,000 1,500 300 375
250
500 1,000 1,000 250 100 100 250 500 350 250 500 17,375
250
1999 Jan.1 Jan.5 Jan.8 Jan.18 Jan.20
To capital a/c To Murhty a/c To commission a/c To cash a/c To sales a/c
C
22,175 250
1999 Jan.3 Jan.4 Jan.6 Jan.7 Jan.12 Jan.15 Jan.18 Jan.22 Jan.25 Jan.28 Jan.31 Jan.31
By Purchase a/c By Gopal a/c By Furniture a/c By wages a/c By postage & telegrams By stationary a/c By bank a/c By purchase a/c By salaries a/c By rent a/c By drawings a/c By balance c/d
C
22,175 250
Note : The letter ‘C’ in the Ledger Folio column denotes a contra entry. This is an entry for which the debit and credit aspects are found in the cash book itself.
Purchase Book Dr. Cr. Date Name of supplier Ledger Folio
No Inward Invoice Amount (Rs.)
1999 Jan.2
Shyam
15,000

182
Total 15,000 Purchase Returns Book Date Name of supplier Ledger Folio
No Inward Invoice Amount (Rs.)
100
1999 Jan 9
Shyam
Total 100
Sales Book Date Name of supplier Ledger Folio
No Inward Invoice Amount (Rs.)
5,000
1999 Jan.10
Kamal
Total 5,000
Sales Returns Book Date Name of supplier Ledger Folio
No Inward Invoice Amount (Rs.)
250
1999 Jan.13
Kamal
Total 250
GENERAL LEDGER Capital Account Date Rs. Date Rs.
20,000
20,000
20,000 20,000
1999 Jan.31
To balance c/d
1999 Jan. 1 Feb.1
By cash a/c By balance b/d 20,000
Shyam’s Account Date Rs. Date Rs.
100 14,900
15,000
15,000 15,000
1999 Jan.9 Jan.31
To Purchase returns To balance c/d
1999 Jan.2 Feb.1
By purchase a/c By balance b/f 14,900

183
Purchase Account Dr Cr. Date Rs. Date Rs.
15,000 500 500
16,000
16,000 16,000
1999 Jan.2 Jan.3 Jan.22 Feb.1
To Shyam a/c To cash To cash By balance b/d
16,000
1999 Jan.31
By balance c/d
16,000 Sales Account Dr Cr. Date Rs. Date Rs.
5,375
5,000 375
5.375 5,375
1999 Jan.31
To balance c/d
1999 Jan.13 Jan.20 Feb.1
By Kamal a/c By cash By balance b/d 5,375
Purchase Returns Accounts Dr Cr. Date Rs. Date Rs.
100
100
100 100
1999 Jan.31
To balance c/d
1999 Jan.9 Feb.1
By Shayam a/c By balance b/d
100
Sales Returns Account Dr Cr
Gopal’s Accounts Dr Cr. Date Rs. Date Rs.
1,000
1,000
Date Rs. Date Rs. 250
250
250 250
1999 Jan 13 Feb.1
To Kamal a/c To balance b/d
250
1999 Jan.31
By balance

184
1,000 1,000 Feb.1
To balance b/d 1,000
Wages Account .Dr Cr. Date Rs. Date Rs.
250
250
250 250
1999 Jan 6 Feb.1
To Cash a/c To balance b/d 250
1999 Jan.31
By balance c/d
Commission Received Account Dr Cr. Date Rs. Date Rs.
300
300
300 300
1999 Jan 13
To balance c/d
1999 Jan.8 Feb.1
By cash a/c By balance b/d 300
Kamal’s Account Dr Cr. Date Rs. Date Rs.
5,000
250
5,000 4,750
1999 Jan.10 Feb.1
To sales a/c
4,750
1999 Jan.31 Jan.31
By Sales returns a/c By Balance c/d 5,000
Postage and Telegrams Account Dr Cr. Date Rs. Date Rs.
100
100
100 100
1999 Jan.10 Feb.1
To cash a/c To balance b/d 100
1999 Jan.31
By Balance c/d
Stationary Account Dr Cr. Date Rs. Date Rs.
100
100
100 100
1999 Jan.10 Feb.1
To cash a/c To balance b/d 100
1999 Jan.31
By Balance c/d
Salaries Account Dr Cr. Date Rs. Date Rs.

185
350
350
350 350
1999 Jan.10 Feb.1
To cash a/c To balance b/d 350
1999 Jan.31
By Balance c/d
Rent Account Dr Cr. Date Rs. Date Rs.
250
250
250 250
1999 Jan.10 Feb.1
To cash a/c To balance b/d 250
1999 Jan.31
By Balance c/d
Drawing Account Dr Cr. Date Rs. Date Rs.
500
500
500
1999 Jan.10 Feb.1
To cash a/c To balance b/d 500
1999 Jan.31
By Balance c/d
Murthy’s Account Dr Cr. Date Rs. Date Rs.
1,500
1,500
1,500 1,500
1999 Jan.10 Feb.1
To balance b/d
1999 Jan.5 Feb.1
By Balance c/d 1,500
Furniture Account Dr Cr. Date Rs. Date Rs.
1,000
1,000
1,000 1,000
1999 Jan.10 Feb.1
To cash a/c To balance b/d 1,000
1999 Jan.31
By Balance c/d
7.2 Preparation of Financial Statements: Profit and Loss Account and Balance Sheet
Trial Balance is first step towards preparation of financial statement namely trading and
Profit and Loss Account and Balance Sheet. Trading and Profit and Loss Account are
prepared in order to determine the income earned or loss incurred during the accounting
period. Balance Sheet indicates the financial position of the enterprise. However, before

186
preparing trading account, profit and loss account and balance sheet, certain adjustment
entries are required.
Adjustment Entries
As stated earlier, financial accounting uses accrual basis of accounting which is
supported by Generally Accepted Accounting Principle (GAAP). Under accrual basis of
accounting.
1. Revenues are recognized when earned, without regard to the timing of cash
receipts.
2. Expenses are recognized either (a) in the period in which related revenues are
recognized or (b) when incurred, without regard to the riming of cash
disbursement.
When the accrual basis of accounting is used, adjusting entries are required at the end of
the period to record any previously unrecognized changes in assets, liabilities, revenues,
or expenses. Adjusting entries are made to modify certain account balances at the end of
the accounting period so that they will reflect fairly the situation as of the end of the
period.
Generally, four general types of adjustment (adjusting entries) are needed at the end of
the accounting period prior to the preparation of financial statements:
1. Reflecting unrecorded revenue earned during the accounting period.
2. Reflecting unrecorded expenses incurred during the accounting period.
3. Reflecting or aligning recorded costs with the appropriate accounting periods
i.e. considering expenditures benefiting more than one accounting period.
4. Reflecting or aligning recorded revenue with the appropriate accounting
period i.e. considering revenues received in advance.
Adjustment in the first two categories- unrecorded revenues and unrecorded expenses =-
are referred to as accruals such as salaries and wages incurred but not paid, interest
earned but nor received. Adjustments in the last to categories – reflecting recorded costs
and revenues with the appropriate periods- are referred to as deferrals such as prepaid
expenses, unearned revenue and depreciation.
Adjusting entries have following features:

187
1. Every adjusting entry affects both the profit and loss account and the balance
sheet.
2. Adjusting entries do not directly affect the cash account.
3. They are generally recorded at the end of the accounting period.
4. A profit and loss account balance (revenue or expense) is changed.
5. A balance sheet account balance (asset or liability) is changed.
Types of Adjusting Entries
The different items or situations which are subject to adjusting entries before preparing
financial statements are explained below:
1. Closing Inventory: Under the periodic verification method, the closing inventory
of every item is arrived at by physically counting the inventory available and
assigning a value to the same. In concerns adopting the periodic verification
method, the value of closing inventory will be brought into the books of account
through the following journal entry:
Closing inventory A/c Dr.
To Trading A/c
While the closing inventory appears on the credit side of the trading account to
reduce the cost of goods sold, it also appears as an asset in the Balance Sheet.
2. Outstanding or Accrued Expense: The nominal accounts record the actual
expense paid during the accounting period. However, prior to the preparation for
the financial statements, it must be ensured that all expenses which have fallen
due to be paid but which have not been paid during the accounting period are also
brought into the books to help in the proper matching of revenues and expenses.
For example, ABC Trading Company had the practice of paying the salaries of
the employees of 4th of the subsequent month. During the financial year ending
31st March 1995 the salaries account shows a debit balance of Rs.55, 000. The
salaries of Rs.6, 000 pertaining to March 1995 were paid on 4th April. 1995.
While preparing the financial statements for the year ending 31st March, 1995, the
salaries of Rs. 6,000 of March must also be included. This is done with following
adjusting journal entry:
Salaries A/c Dr. Rs. 6,000

188
To Outstanding Salaries A/c Rs. 6,000
The above journal entry increase the salaries to the correct amount of Rs. 61,000
and the Outstanding salaries of Rs. 6,000 will be shown as a liability in the
Balance Sheet.
The adjusting journal entry to record any outstanding expense is
Expense A/c Dr.
To Outstanding Expense A/c
While the amount of expense taken from the Trial Balance will be increased by the
amount Outstanding and shown in the Trading and Profit and Loss Account, the
actual amount outstanding will be shown as a liability in the Balance Sheet. In the
subsequent accounting period, the outstanding expense liability will be transferred
to the expense or nominal account and will be set off by the entry of actual
payments when it is made.
3. Prepaid Expense: Certain expenses paid may relate to more than one accounting
period. In such cases, it is necessary to identify the portion of the expenditure for
which the benefit is yet to be received by the concern and treat that part of the
expenditure as prepaid.
ABC Trading Company took an insurance cover for all assets against fire
on Ist October 1994 and paid the annual premium of Rs. 2,400 on the same day.
Since the benefit of the entire expenditure will expire only on 30th September,
1995, it is necessary to recognize this aspect while preparing the financial
statements as on 31st March, 1995.
The amount of expense prepaid on 1st October, 1994= (1/2x2, 400 = Rs. 1,200).
The adjusting entry to record the prepaid insurance is
Prepaid Insurance A/c Dr. Rs. 1,200
To Insurance A/c Rs. 1,200
This ensures that the insurance expense is reported at the correct figure of Rs.
1,200 in the profit and loss account and the prepaid amount is shown as an asset
in the balance sheet.
The journal entry to record any prepaid expense is,
Prepaid Expense A/c

189
To Expense A/c
In the subsequent accounting period, the balance in the prepaid expense account
will be transferred back to the expense account.
4. Outstanding Accured Income: An income appearing in the ledger account may
not represent the income that must have been received during the year. If a
portion of an income has not yet been received or is outstanding as at the end of
the accounting period then the outstanding amount must be brought into books.
ABC Trading Company would have received the interest of Rs. 350
[5,000x (14/100)x 1/2}] during the accounting period ending 31st march, 1993,
the interest of Rs. 350 for the next six months will be received only in the
subsequent accounting period. However, while preparing the financial statements,
the total interest revenue to be recognized is the amount of Rs. 350 actually
received plus the interest of Rs. 175 pertaining to the period Ist January, 1993 to
31st March, 1993.
The following adjusting entry will bring into books the amount of outstanding
interest:
Outstanding Income A/c Dr. Rs. 175
To Interest Received A/c Rs. 175
While the interest received will be increased to Rs. 525 and shown in the profit
and loss account, the outstanding interest account will be listed as an asset in the
Balance Sheet.
In the subsequent accounting period, the amount in the outstanding interest A/c
will be transferred to interest received A/c and the actual receipt of the interest
will offset the former transfer entry.
Outstanding Income A/c Dr.
To Income A/c
5. Income Received in Advance: While preparing the financial statements,
adjustments may be necessary in respect of any incomes received in advance.
Assume a Law publication has received subscriptions amounting to Rs. 50,000
during the financial year ending 31st December, 1992. Out of this, Rs. 2,500
represents subscriptions relating to the next financial year.
190
The entry to adjust for the income received in advance will be,
Subscription A/c Dr. Rs. 2,500
To Subscription received in Advance Rs. 2,500
With the posting of the above journal entry, the subscriptions account will be
shown in the profit and loss account at the credit figure of Rs. 47,500 and in the
balance sheet, the subscriptions received in advance as a liability. Any income
received in advance is a liability as benefits are yet to be conferred to the person
from whom the amount has been received. The journal entry to record the
adjustment of any income received in advance is
Income A/c Dr.
To Income Received in Advance A/c
6. Depreciation: Depreciation is the acquisition cost of an asset (less the expected
salvage value) spread over the economic life of that asset. The purpose of
charging depreciation over the economic life of the asset is to match the cost of
the asset over the period for which the revenue is earned by using the asset.
Preparing Profit And Loss Account
From a given trial balance, we can prepare a Profit and Loss account to determine the
profit and loss made by a business firm during a particular period. At the time of
preparation of profit and loss account, the following point may be kept in mind:
All expenses are debited to Profit and Loss Account
All incomes are credited to Profit and Loss Account
Further, we may have to give special treatment to certain adjustment also (discussed in
detail earlier in the chapter)
Balance Sheet
A balance sheet, also commonly referred to as a statement of financial positions, is a
statement of assets and liabilities of business enterprises at a particular date. The balance
sheet summarizes and reveals the financial position of enterprises on a particular date, by
showing what it owns and what is owes. Because the balance sheet is a snap shot of an
instant in time, it is a status report rather than flow report.

191
The balance sheet is a fundamental or first accounting statement in the sense that
every accounting transaction can be analyzed in terms of its dual impact on the balance
sheet. Moreover, most often, revenues and expenses are defined in terms of changes in
assets and liabilities. Thus, a thorough understanding of the nature and measurement of
assets and liabilities is needed to understand net income and its component. A Balance
Sheet has no debit and credit side. It is a prepared on a particular date and as such, it
shows the assets and liabilities of business enterprises on that date. Even a single
transaction will cause a change in the assets and liabilities of the enterprises as shown in
the Balance Sheet. Therefore, it is true only for the date on which it has been prepared. It
is called a Balance sheet because it is actually a sheet containing balances of ledger
accounts which have not been closed by transfer to trading and profit and loss a/c.
Arrangement of Assets and Liabilities Items On The Balance Sheet
In the case of a company, The Companies Act 1956 provides that balance sheet should be
prepared as per schedule VI given therein and assets and liabilities should be written in
the sequence (or order) shown in the Schedule. However, in the case of sole
proprietorship, and partnership, no rule is provided for recording assets and liabilities on
the balance sheet.
Example
On 31.12.1999 the following Trial Balance was prepared from the books of Raju:
Dr. (Rs) C. (Rs) Sundry Debtors Surndry Creditors Bills Receivable Plant & Machinery Purchases Capital Freehold Premises Salaries Wages Postage and Stationary Carriage In Carriage Out Bad debts Bad Debts Provisions General Charges Cash at Bank Cash in Hand
50,600 - 5,000 75,000 90,000 - 50,000 11,000 14,400 750 750 1,000 950 - 1,500 5,300 800
10,000 - - - 70,000 - - - - - - - - 1,000 - - -

192
Bills Payable Reserve Sales Closing Stock
- - - 29,,300
5,000 20,000 2,31,700 -
3,37,050 3,37,500 The following adjustments are required:
(1) Raju gets a salary of Rs. 9,000 p.a
(2) Allow 5% interest on capital
(3) Bad debts provision to be adjusted to 21/2% on sundry debtors.
(4) 21/2% of the net profit to be credited to Reserve.
(5) It was discovered in January 1999 that stock sheets as on 31.12.1998 were
overcast by Rs 1,000.
You are required to prepare Trading and Profit and Loss account for the year ended
31st December, 1999 and a balance Sheet as at that date.
Solutions: Table 7.12 Trading and Profit and Loss A/c for the year ending 31st December, 1999 Rs. Rs.
89,000 14,400 750 1,27,550 2,31,700 20,000 750 1,000 1,865 1,500 3,500 98,935
2,31,700 2,31,000 1,27,550
To Purchases Less: Overcast stock To Wages To Carriage inward To gross profit To Salaries Add O/S To Post & Stationary To Carriage out To Bad debts Add: New Provision Less: Old provision To General Charges To Interest On Capital To Net Profit transferred To Capital Account
90,000 1,000 11,000 9,000 950 1,265 2,,215 350
1,27,550
By Sale By Gross Sales
1,27,550
Table 7.13 Balance Sheet as at 31st December, 1999

193
Liabilities Rs. Assets Rs. 70,000.00 3,500.00 73,500.00 96,461.60
50,600.00 1,265.00
20,000.00 2,473.40
1,69,961.60 10,000.00 5,000.00 22,473.40 9,000.00
75,000.00 50,000.00 49,335.00 5,000.00 30,000.00 1,000.00 5,300.00 800.00
Capital Add: Interest on Capital Add: Net Profit Sundry Creditors Bills Payable Reserve Add: 2x1/2 % Net P. O/S Salaries
2,16,435.00
Plant & Machinery Freehold Premises Sundry Debtors Less: Provision Bills Receivable Closing Stock Overstated Stock 90 Cash In Bank Cash in Hand
2,16,435.00
COST ACCOUNTING
7.3 Important Definitions
Cost: Cost is the amount of expenditure actual (incurred) or notional (attributable)
relating to a specific thing or activity may be a product, job, service, process or any other
activity. Cost is the cash or cash equivalent values sacrificed to obtain some goods or
services. Cash equivalent means that non cash assets can be exchanged for the desire d
goods or services.
Costing: Coasting Accounting and Coasting have distinctly different meaning. Coasting
is the process of determining the cost of doing something, e.g. the cost of manufacturing
an articles, rendering a services, or performing a function. The article manufactured,
service rendered, or function performed is known as the object of coasting. Objects of
coasting are always activities. Coasting includes the techniques and processes of
ascertaimomg costs.
Cost Accounting: Cost accounting, as a tool of management, is an integral part of the
management process. Cost accounting records relevant date from production and other
activities on a regular basis and reports these data to management for managing the
undertaking. Cost accounting is the processing and evaluation of monetary and non-
monetary data to provide information for internal planning, control of business
operations, managerial decisions and special analysis, external reporting.

194
Objectives of Cost Accounting
Cost accounting aims primarily to serve the information needs of management for
planning, control and decision-making. Cost accounting has the following three important
objectives:
1. To determine product costs.
2. To facilitate planning and control of regular business activities.
3. To supply information for short-and long-run decisions.
1. Product Costing
The objectives of determining the cost of product is of prime importance in cost
accounting. The total product cost and cost per unit of product are important in making
inventory valuation, deciding price of the product, and managerial decision-making.
Product costing covers the entire cycle of accumulating manufacturing and other costs
and subsequently assigning them to work-in-progress and finished goods.
2. Planning and Control
Another important objective of cost accounting is the creation of useful cost data and
information for the purposes of planning and control by management. The cost
formulation in a well designed cost accounting system is oriented to help in planning,
control and decision-making. The different alternative plans are evaluated in terms of
respective cost and associated benefits. The management control over business operations
aims to establish balance between actual and budgeted performances. A properly
designed cost accounting system includes the following steps in the control process:
1. Comparing actual business performances with budgets and estimates.
2. Analyzing and variance between budgets and actual by causes, and management
responsibility so that corrective action may be taken.
3. Providing managers with data and reports about their individual performances and
performances of subordinates.
Cost data and information, thus, is an integral and vital part of management control.

195
3. Information for Decision
An important purpose of the cost accounting system is to provide data and special
analysis for short and long-run decisions of a non-recurring nature. These decisions
generally involve high cost commitments, such as buildings and equipments to be used
for several years. They also represent unique opportunities, such as the possibility of
developing new products and new market. Appropriate cost information must be
accumulated to facilitate a wide variety of short-and long-run decisions. The concept of
appropriate cost data is relevant to these matters in that no single type of cost information
can satisfy all decision problems facing management.
Cost Accounting Vs. Financial Accounting
Both financial and cost accounting generates information and involves the analysis and
flow of useful data. However, they differ in the following respects.
1. Nature
Basically, financial accounting classifies, records, presents and interprets, in terms
of money, transactions and events that are of a financial character, and provides
management with the facts and figures necessary for the preparation of the
periodic financial statements, the balance sheet and the income statement. In
contrast to financial accounting, cost accounting classifies records, presents and
interprets in a significant manner the material, labor and overhead costs involved
in manufacturing and selling each product or each job or rendering a service.
2. Primary users of information
The users of financial accounting statements are mainly external to the business
enterprises. External users include shareholders, creditors, financial analysts,
government authorities, stock exchange, labor unions etc.
The information generated under the cost accounting system is used by members
of management at different levels. Thus, different sets of information could be
developed under cost accounting and supplied to different person responsible for
activities in the organization.
3. Accounting Method
Financial accounting follows the double-entry system for recording, classifying
and summarizing business transactions. This accounting process results in

196
aggregate balances of all accounts maintained in a firm’s books. Cost accounting
is not based on the double-entry system. The data under cost accounting may be
gathered for small or large segments or activities of an organization and monetary
as well as other measures can be used for different activities in the firm.
4. Unit of Measurement
All information under financial accounting is in terms of money. That is,
transactions measured in terms of money have already occurred. In comparison,
cost accounting applies any measurement unit that is useful in a particular
situation. Besides a\the monetary units, that cost accounting may find it necessary
to use such measures as labor hours, machine hours and product unit for the
purpose of analysis and decision-making.
5. Time Span
Financial accounting data and statements are developed for a definite period, such
as annually, half-yearly, quarterly. It requires that financial statements be
developed and presented at regular time intervals. Company annual reports may
be prepared semi-annually or quarterly but the important point is that they are
prepared on a regular basis.
Cost accounting report and statements are prepared whenever needed. Reports
may be prepared on a monthly weekly or even daily basis. Frequency of reports is
determined by particular planning and controlling needs, objectives of cost
control and cost determination.
Cost Centres
A cost centre may be defined as a location, person or item of equipment (or group of
these) for which costs may be ascertained and sued for the purposes of cost control. A
cost centre is an organizational segment or areas of activity for which it is desirable to
accumulate costs. It is the segment that is considered to accumulate costs, but not to
generate revenues. The accounting departments are also most universally considered cost
centers as well as other staff functions. The following are the types of cost centers usually
found in a manufacturing company.

197
Impersonal Cost Centre
A cost centre which consists of a location of item or equipment (or a group of these).
Personal Cost Centre
A cost centre which consists of a person or group of persons
Operation Cost Centre
A cost centre which consists of the machine and/or persons carrying out similar
operations.
Process Cost Centre
A cost centre which consists of a specific process or a continuous sequence of operations.
Cost Unit
Cost unit is a unit of quantity of product, service or time (or a combination of these), in
relation to which cost may be ascertained or expressed.
The following are a few examples of cost units:
Industry Cost unit
Building house or square foot of area
Chemical tone, pound or kilogram
Cement tone
Automobile number
Steel tone
Transport tonne-kilometre, passenger-kilometer
Cable meter
Gas Cubic foot or cubic meter
Nuts and bolts Gross or some measure of standard weight
Power Kilo-watt hour
Paper rim
Timber Cubic foot
Elements of Cost
The cost of a product consists of the following cost components or elements:
1. Direct Material: Direct materials refer to the cost of materials which become a
major part of the finished product. They are the raw materials that become an

198
integral part of the finished product and are conveniently and economically
traceable to specific units of output. Some examples of direct materials are: raw
cotton in textiles, crude oil to make diesel, steel to make automobile bodies.
2. Direct labor: Direct labor is defined as the labour associated with workers who are
engaged in the production process. It is the labour costs for specific work
performed on products that is conveniently and economically traceable to end
products. Direct labour is expended directly upon the materials comprising the
finished product. Examples are the labour of machine operators and assemblers.
3. Direct expenses include any expenditure other than direct material and direct
labour directly incurred on a specific cost unit (product or job). Such special
necessary expenses can be identified with cost units and are charged directly to
the product as part of the prime cost. Some examples of direct expenses are: (a)
cost of special layout, designing or drawings; (b) hire of tools or equipment for a
particular production or product; (c) maintenance costs of such equipments.
The above three items: materials, labour and direct expenses constitute prime
cost. According to Official Terminology of Chartered Institute of Management
Accountant (London), Prime cost is the total cost of direct material and direct
labour. Thus, direct expenses is not included in prime cost as per CIMA defines
direct cost of the expenditure which can be economically identified with a specific
saleable cost unit.
4. Factory overhead: Factory overhead also called manufacturing expenses or
factory burden may be defined as the cost of indirect materials, indirect labour
and indirect expenses. The term “indirect materials” refers to materials that are
needed for the completion of the product but whose consumption with regard to
the product is either so small or so complex that it would not waste, hand tools,
works stationery. The term “indirect labour” is the labour cost of production
related activities that can not be associated with or conveniently and economically
traced to end products. Some examples of indirect labour are; foreman, shop
clerks, general helpers, cleaners, materials handlers, plant guards, employees
engaged in maintenance work or other service work. The term “Indirect expenses”
covers all indirect expenditure incurred by the manufacturing enterprise from the

199
time production has started to its completion and transfer to the finished goods
store. Any expenses not classified as direct expenses are known as indirect
expenses.
5. Selling and Distribution and Administrative Overhead: Selling and distribution
overhead is also known as marketing or selling overhead. Distribution expenses
usually begin when the factory costs end. Such expenses are generally incurred
when the product is in saleable condition. It covers the cost of marking sales and
delivering/dispatching products. These costs include advertising, salesmen
salaries and commissions, packing, storage, transportation, and sales
administrative costs. Administrative overhead includes costs of planning and
controlling the general policies and operations of business enterprises. Usually, all
costs which cannot be charges either to the production or sales division are
considered as administrative costs of the general accounting department.
Sometimes, some of such expenses as manger’s salary are often allocated to
manufacturing and included in factory overhead.
The sum of prime cost, factory overhead, distribution and administrative overhead
is the cost to make and sell.
Fixed, Variable And Mixed Cost
Cost can be classified into (I) fixed cost (ii) variable cost and (iii) mixed costs, in terms of
variability of cost in relation to charges in activity or volume.
Fixed Cost: Fixed cost is a cost which does not change in total for a given time period
despite wide flections in output or volume of activity. This includes expenses which must
be incurred irrespective of the changes in use of direct materials and in production.
Examples of fixed costs are rent, property taxes, supervising salaries, depreciation on
office facilities, advertising, insurance, etc. These fixed costs accrue or are incurred with
the passage of time and not with the production of the product or the job. This is the
reason why fixed costs are expressed in terms of time, such as per day, per month or per
year and not in terms of unit. It is totally illogical to say that a supervisor’s salary is so
much per unit. But it can be said that a supervisor is salary is so much per month. Fixed

200
cost per unit varies due to change in output. If production declines, fixed cost per unit
increases. In case of higher output fixed cost per unit decreases.
Fixed costs can be further classified in the following categories for the purpose of
analysis
1. Committed Costs: Such costs are primarily incurred to maintain the company’s
facilities and physical existence, and over which management has little or no
discrimination, taxes, insurance premium rate and rent charges are examples of
committed costs.
2. Managed costs: Managed costs are related to current operations which must continue
to be paid to ensure the continued operating existence of the company, e.g.,
management and staff salaries.
3. Discretionary costs: They are also known as programmed costs. Discretionary costs
are not related to current operations or activities and are subject to management
discretion and control. These costs result from special policy decisions. management
programmers, new researches,etc. Such costs can be avoided at management’s
discretion in a relatively short period of time as compared to committed costs. Some
examples of such costs are research and development costs, marketing programmes,
new system development costs.
Variable Cost: Variable costs are those costs that vary directly and proportionately with
the output. There is a constant ratio between the change in the cost and change in the
level of output. Direct materials cost and direct labour cost the costs which are generally
variable costs. For example, if direct material cost is Rs. 5 per unit, then for producing
each additional unit, direct material cost increases in direct proportion to increase in units
manufactured. However, it should be noted that it is only the total variable costs that
change as more units are produced; the per unit variable cost remains constant. Variable
costs result from the utilization of raw materials and direct labour in the production
departments. Variable manufacturing overhead like factory supplies, indirect materials,
sales commission, office supplies are some other examples of variable costs. Variable
costs accumulate because units of product are being manufactured, not because a period
of time has passed.

201
Mixed Costs: Mixes costs are made up of fixed and variable elements. They are a
combination of semi-variable costs and semi-fixed costs. Because of the variable
component, they fluctuate with volume; because of the fixed component, they do not
change in direct proportion to output. Semi-fixed costs are those costs which remain
constant unto a certain level of output after which they become variable. Semi-variable
cost is the cost which is basically variable but whose slope may change abruptly when a
certain output level is reached. An example of a mixed cost is the earnings of a worker
who is paid a salary of Rs.1, 000 per week (fixed) plus a bonus of 50 paise for each unit
completed (variable). If he increases his weekly output from 1,000 units to 1,500 units,
his earnings increases from Rs. 1,000 to Rs. 1,250. As increase of 50% in output brings
only a 25 % increase in his earnings. Mathematically, mixed cost can be expressed as
follows: Total Mixed Cost + (Units X Variable Cost per Unit)
Direct Cost and Indirect Cost: A direct cost is one that can be economically traced to a
single cost object. In manufacturing, the cost object is a unit of finished product. An
indirect cost is one that is not directly traceable to the manufactured product, is associated
with the manufacture of two or more units of finished product, or is an immaterial cost
that cannot be economically traced to single unit of finished product. A comparison of the
labour cost of an assembly man and a repairman in a cabinet shop will illustrate the
difference between direct and indirect costs. The assembly man’s salary is typically
classified as a direct cost because it is a significant portion of the cabinet’s total cost and
because it is easy to trace the assemblyman’s efforts to a particular set of cabinets. The
machine repairman’s salary would probably be classified as an indirect cost. It is
difficult, or impossible, to trace the repairman’s effort to a unit of output. The repairman
is responsible for keeping all machines running properly. Since the repairman works on
several machines and the machines work on several different cabinets each day, we
cannot trace his salary to a particular cabinet. Also, the repairman’s salary is generally
immaterial in relation to the total cost of the product. However, even if it were material,
the lack of traceability would require that it be classified as an indirect cost.

202
Example: A company manufactures and retails clothing. You are required to group the
costs which are listed below and numbered 1 to 20 in to the following classification:
(Each cost is intended to belong to only one classification).
(a) Direct Materials (b) Direct Labour (c) Direct Expenses (d) Indirect Production Overhead (e) Selling and Distribution Costs (f) Research and Development Costs (g) Finance Cost (h) Administration Costs
1. Telephone rental plus metered calls. 2. Wages of security guards for factory. 3. Parcels sent to customers. 4. Wages of operators in cutting department 5. Developing a new product in the laboratory 6. Wage of fork lift truck drovers who handle raw materials 7. Wages of storekeepers in materials store 8. Chief accountant’s salary 9. Cost of painting advertising slogans in delivery vans. 10. Auditor’s fee 11. Cost of advertising on television 12. Lubricants for sewing machines. 13. Floppy disks for general office computer. 14. Maintenance contract for office photo-copying machine. 15. Interest on bank overdraft 16. Market research undertaken prior to new product launch. 17. Carriage on purchase of raw material 18. Royalty paid on number of units of a particular product produced. 19. Road licenses for delivery vehicles. 20. Amount payable to a company for broadcasting music throughout the factory.
Solutions:
Cash Element Numbers
Direct Materials 17
Direct Labour 4
Direct Expenses 18

203
Financial Cost 15
Research and Development Expenses 5
Selling and Distribution Cost 16,19,3,11,9
Administration Cost, 13,14,1,10,8
Indirect production Costs 12, 20,2,7,6
Martial Cost accounting and control
The term “materials” generally used in manufacturing concerns, refers to raw materials
used for production, sub-assemblies and fabricated parts. The terms “materials” and
“stores” are sometimes used interchangeably. However, both the terms differ. “Stores” is
wider in meaning and comprises many other items besides raw materials, such as tools,
equipments, maintenance and repair items, factory supplies, components, jigs, fixtures.
Sometimes, finished goods and partly finished goods are also included within the scope
of this term.
Purchasing and Receiving Procedure
Purchasing procedures vary with different business firms, but all of them follow a general
pattern in the purchases and receipt of materials and payment of obligations. The
important steps may be listed as follows:
1. Purchase requisition: A from known as a purchase requisition is commonly used as a
formal request to the purchasing department to order goods or services. Usually,
purchase requisitions are prepared by the storekeepers for regular store items which
are below or approaching the minimum level of stock or to replace stock of materials
and part in stores.
The production control department can also give requisitions for the purchase of
specialized materials. A typical purchase requisition contains details, such as number,
date, and department. Quantity, description, specification, signature of the person
initiating the requisition, and signature of one or more officers approving the

204
purchase. Copies of the purchase requisition are sent to the purchasing department
and accounting department.
ABC COMPANY LIMITED
Purchase requisition
Purchase Requisition No ________________
Purchase Order No. _____________________
Date ________________________
Department __________________
Delivery Required _____________
Item No. Quality Particulars of
articles
Grade or
quality
Remarks
Required By Checked By Approved By
2. Purchase order: After the requisition is received duly approved, the purchasing
department places an order with a supplier, offering to buy certain materials at stated
prices and terms. For routine purchases, the order is placed through established
suppliers. In other cases, the purchasing department may ask for bids or send out
requests for quotation before placing the order.
3. Receiving materials: The receiving department performs the function of unloading
and unpacking materials which are received by an organization. This will need an
inspection report which is sometimes incorporated in the receiving report, indicating
the items accepted and rejected, with reason. Two functions are performed by the
receiving report:

205
(i) It determines and places initial responsibility for materials on the receiving
clerk; the receiving clerk continues to have this responsibility until
delivery is made to the storeroom. In some business firms the store
department functions as the receiving department also.
(ii) It notifies the accounting department that the materials have been received
and that
a voucher can be pre pared for payment.
4. Approval of invoices: Invoice approval indicates that good according to the purchase
order have been received and payment can now be made. However, if the goods or
equipment received are not of the type ordered, or are not in accordance with
specifications, or are damaged, the purchasing department issues a return order
indicating that the goods are to be retuned to the supplier. When the invoices of goods
are received by the purchasing department, the process of gathering the relevant
documents connected with each purchase and the preparation of the voucher begin.
5. Making Payment: After the purchase invoice total is approved, the process of making
payment begins. Payment depends on the terms agreed upon on any particular order,
and any terms which differ from normal practice should be considered individually.
When it is found that items written on the invoice qualify for payment, a remittance
advice is prepared after providing of deduction of discounts, if any.
Issues In Materials Procurement
It is generally accepted that quantities be bought in economic size so that there may not
be overstocking. If a company purchases in large quantities, the cost of carrying the
inventory would be high because of the high investment involved. Working capital which
could have been used for other productive purposes has to be diverted. Over-stocking
requires more storage space which in turn, means increases in insurance expenses,
storage cost and deterioration in quality and depreciation in quantity. In contrast, if
purchases are made in small quantities (under-stocking), frequent orders would have to
be placed for the purchase of materials. There will be danger of “stock outs” also.
Because of under-stocking, production is likely to suffer; materials have to be purchased

206
immediately at high process; low output would increase cost and decrease profit; the
other department’s work may be adversely affected.
Economic Order Quantity (EOQ) (Reorder Quantity)
The EOQ is the optimum or the most favorable quantity which should be purchased each
time the purchases are to be made. The EOQ is one where the costs of carrying inventory
are equal or almost equal to the cost of not carrying inventory (Cost of placing order).
Also at EOQ level, the total of these two costs is minimum.
The cost of carrying the inventory is the real out-of-pocket cost associated with having
inventory on hand, such as warehouse charges, insurance, heat, light, and losses due to
spoilage, breakage, pilferage. Another opportunity cost, which is not out-of-pocket cost,
is important and should be considered, i.e., cost incurred (capital used) in purchasing the
inventory. If funds have been borrowed to finance the inventory purchase, interest
payments on borrowed funds will be the direct cost. Carrying or holding costs of
inventory are explicit as well as implicit, that is, some costs are readily ascertained from
accounting records while others require extensive study to estimate them because they are
not expressly state. Insurance on inventory is an explicit cost while the cost of funds
invested in inventory is implicit cost. Generally, inventory carrying costs are considered
to be proportional to the value of inventory carried.
The costs of not carrying adequate inventory arise because of frequent placing of order at
short intervals. This includes costs, such as extra purchasing, handling and transportation
costs, higher price due to small order quantities, frequent stock-outs resulting in
disruption of production schedules, overtime and extra set up time, loss of sales and
customer goodwill, etc.
The costs of carrying the inventory and ordering costs change in the reverse order. The
costs of placing the order decrease as the size of the order increase since with a bigger
size of order, the number of the order will be lower. However, simultaneously the costs of
carrying the inventory will go up because purchases have been made in large quantities.
It may be possible to have a point which provides the lowest total cost and this point
(ideal size) is known as the EOQ. This equilibrium can be determined mathematically as
follows:

207
EOQ= )*/()*2( CIOU
Where U = Annual usage in units
O = Cost of placing an order
I = Percent cost of carrying inventory
C = Cost per unit of material
Assume
Annual usage units = 6,000
Cost of placing an order = Rs. 30
Carrying cost as a percent of inventory = 20%
Cost per unit of material = Rs.5
Then, EOQ= )%20*5/()30*6000*2( = 000,60,3 = 600 units
In the above example, the EOQ is 600 units. That is, ten orders per year are
needed. At the level of 600 units, the ordering costs and the carrying costs are equal and
also the total cost is at minimum as it is clear from Table 14.1
Table 7.14 shows that quantities of other orders resulting in more or less than ten
orders per year are not economical as they involve higher total costs.
The EOQ formula is sometimes expressed in the following manner which is not in
any way different from the formula explained earlier
EOQ = SPU /)*2(
Where U = Annual demand or consumption or purchased quantity (in units)
P = Cost of placing an order
S = Annual cost of carrying inventory per unit (Storage and
interest)
Table 7.14 Quantities of other orders
Annual
Usage
Orders
Per
Year
Units
Per
Order
Average
Inventory
(units)
Value
Per
Order
(Rs.)
Average
Inventory
Amount
(Rs.)
Order
Cost
Carrying
Cost
(20%)
Total
Cost
(Rs.)
6,000
units
1
2
6,000
3,000
3,000
1,500
30,000
15,000
15,000
7,500
30
30
3,000
1,500
2,030
1,500

208
3
4
5
6
7
8
9
10
11
12
2,000
1,500
1,200
1,000
857
750
667
600
545
500
1,000
750
600
500
429
375
334
300
273
250
10,000
7,500
6,000
5,000
4,285
3,750
3,335
3,000
2,725
2,500
5,000
3,750
3,000
2,500
2,142
1,875
1,668
1,500
1,363
1,250
90
120
150
180
210
240
270
300
330
360
1,000
750
600
500
428
376
334
300
272
250
1,090
870
750
680
638
616
604
600
602
610
When to order (Reorder Level)
The EQQ determines how much to buy at a particular time. But the question
“When to buy” is equally important for business firms. This question is easy to answer
only if we know the lead time – the time interval between placing an order and receiving
delivery – and know the EOQ, and are certain of the consumption pattern during lead
time. The order point or re-order level is a point or quantity level at which if materials in
stores reach, the order for supply of materials must be placed. This point automatically
initiates a new order. The order point is calculated from three factors:
1. The expected usage
2. The time interval between initiating an order and its receipt, referred to as the lead
time
3. The minimum inventory, or safety stock
For example, if daily usage is 400 units of material which have a lead time of 20 days
and the safety (minimum) stock is 500 units, the order point will be calculated as
follows:
Daily consumption * lead time = 400 * 20 = 8,000
Add safety stock = 500

209
Order point units = 8,500
The order point is determined after considering the worst possible expected
conditions. This only ensures that the minimum stock will always remain in the
inventory and will not be used at least in the short run. However, situations may arise
where there will be stock – out and thus, the order point may not be an absolutely
accurate forecasting.
Determinations of Safety or Minimum Stock Levels
It is advisable to carry a reserve or safety stock to prevent stock-out. The safety
should be used only in abnormal circumstances, and the working stock in ideal or normal
conditions. Therefore, for normal working conditions, the stock should not be allowed to
fall below the safety limit, kept only for emergencies. If the usage pattern is known with
certainty, and the lead time is also known accurately, then no safety stock would be
needed. However, if either usage or lead time is subject to verification then it is necessary
for a business firm to maintain safety stock levels equal to the difference between the
expected usage over lead time and the maximum usage over lead time that the firm feels
is necessary for cost minimization. The safety stock level can be computed by using the
following formula:
Safety stock level = Ordering level – (Average rate of consumption * Re-order period)
Or
Safety stock level = (Maximum rate or consumption – Average rate of consumption)
* Lead time
That is, = (425 – 400) * 20 days
= 500 units
Maximum Stock Level
The maximum level ensures that the stocks will not exceed this limit although
there may be low demand for materials or quick delivery from the suppliers. Maximum
stock level can be computed as follows:
Maximum stock level = EQQ + Minimum stock

210
Or
Maximum stock level = Re-order level + EOQ – (Minimum Consumption * Minimum
re-order period)
Danger Level
Generally the danger level of stock is indicated below the safety or minimum
stock level. Sometimes, depending on the practices of the firm and circumstances
prevailing, the danger level is determined between re-order level and minimum level. In
the second case (danger level being between re-order level and minimum level), the firm
can only take steps to ensure that materials ordered will arrive in time.
Average stock Level
Average stock level is computed in the following manner:
= Minimum stock + Maximum stock
2
Or
= Minimum level + Re-order quantity
2
The following example further illustrates the different stock levels.
Maximum usage (units) 650 per days
Minimum usage (units) 300 per days
Normal usage (units) 500 per days
Economic order quantity (units) 75000
Re-order period –lead time 25 to 30 days
Minimum level (units) 5000
(10 days at normal usage)
The different stock levels will be as follows:
Re-order level = Normal usage x Normal lead time + Minimum level

211
= (500 * 30) + 5,000
= 20000 units
Maximum level = Reorder level + EOQ –Minimum quantity used in re-order period
= 20,000 +75,000 – (300 * 25)
= 87,000 units
Average Level = Maximum +Minimum
2
= 87,500+5,000
2
=46,250 units
After placing an order, if usage goes above average or if the lead time is longer
than expected, then the stock will fall below minimum. However, stock will not be
exhausted, so long as the maximum usage and maximum re-order periods are not
exceeded. In the above example, maximum usage during the lead time would cause an
extra 4500 units (30 days X 150 units) to be consumed. Therefore, in this situation, the
purchasing officer should try to chase supplies to ensure that delivery promises are kept.
Example
The Ganges pump Company uses about 75,000 valves per year and the usage is
fairly constant at 6,250 per month. The valves cost Rs.1.50 per unit when bought in
quantities and the carrying cost is estimated to be 20 % of average inventory investment
on the annual basis. The cost to place an order and process the delivery is Rs.18.
It takes 45 days to receive from the date of an order and a safety stock of 3,250
valves is required. You are required to determine:
(i) The most economic order quantity and frequency of orders
(ii) The order point
(iii) The most economic order quantity if the valves cost Ts 4.50 each instead
of Rs.1.50 each

212
Solution
(i) EOQ = )*/()*2( CIOU
= )%20*5.1/()18*75000*2(
= 000,00,90
= 3,000 units or 25 orders per year
(ii) The order point
= Safety Stock + (Average rate of consumption x Lead time)
= 3,250 + (6,250 units’ p.m * 1.5 months)
= 3,250 + 9,375
= 12,625 units
(iii) EOQ when cost per valve is Rs.4.50
EOQ = )%20*5.4/()18*75000*2(
= 000,00,30
= 1,733 unit’s approx. or 43 order approx. per year
Example
Material X and Y are used as follows:
Minimum usage – 50 units each per week.
Maximum usage – 150 units each per week
Normal usage –100 units each per week
Ordering quantities X = 600 units
Y= 1000 units
Deliver period X= 4 to 6 weeks
Y = 2 to 4 weeks
Calculate for each material: (a) Minimum level: (b) Maximum level: and (c) Order level

213
Solution
Material X
Ordering level = Maximum usage * Maximum delivery period
= 150 * 6
= 900 units
Minimum level = Ordering level – (Normal usage * Normal delivery period)
= 900 – (100 * 5)
= 900-500
= 400 units
Maximum level = (Ordering level + Ordering quantity) –
(Minimum usage * Maximum delivery period)
= 900 + 600-(50 * 4)
= 1,500-200
= 1,300 units
Material Y
Ordering level = Maximum usage * Maximum delivery period
= 150 * 4
= 600units
Minimum level = Ordering level – (Normal usage * Normal delivery period)
= 600 – (100 * 3)
= 600-300 = 300 units
Maximum level = (Ordering level + Ordering quantity) –
(Minimum usage * Maximum delivery period)
= 600 +1,000-(50 * 2)
= 1,600-100 = 1,500 units
Notes: Normal period of delivery has been computed as follows:
Material X = (4+6) =5 weeks
2

214
Material Y = (2+4) = 3 weeks
2
7.4 INVENTORY SYSTEMS
There are two principal ways of accounting for inventories:
Perpetual Inventory System
The perpetual inventory method requires a continuous record of additions to or
reductions in materials, work-in-progress, and cost of good sold on a day-to-day basis.
Physical inventory counts are usually taken at least once a year in order to check on the
validity of the accounting records. The Institute of Cost and Management Accountant
(U.K.) has defined perpetual inventory as:
A system of records maintained by the controlling department which
reflects the physical movement of stocks and their current balance.... A
perpetual inventory is usually checked by a programme of continuous
stocktaking, and the two terms are sometimes loosely considered
synonymous. Perpetual inventory means the system of records, whereas
continuous stocktaking means the physical checking of those records with
actual stocks."
The perpetual inventory method has the following advantages:
• The stock-taking task which is long and costly is avoided under this method.
• The inventory of different items of materials in accordance with the stores ledger
can be promptly prepared for the preparation of the income statement and balance
sheet at interim periods if required without a physical inventory being taken.
• Management may be informed daily of the number of units and the value of each
kind of material on hand-information which tends to eliminate delays and
stoppage in production.
• The investment in materials and supplies may be kept 'at the lowest point in
confined with operating requirements.
• A system of internal check is always in operation and the activities of different

215
departments, such as purchasing, stores and production are continuously checked
against each other.
• It is not necessary to stop production so as to carry out a complete physical stock-
taking.
• Discrepancies and errors are promptly discovered and localized and remedial
action can be taken to avoid their occurrence in the future.
• This method has a moral effect on the staff, makes them disciplined and careful
and acts as a check against dishonest actions.
• The disadvantages of excessive stock are avoided, such as loss of interest on
capital invested in stock, loss through deterioration, risk of obsolescence.
Periodic Inventory System
Under the periodic method, the entire book inventory is verified at a given date by
an actual count of materials on hand. This physical inventory is usually taken near the
end of the accounting period. This method provides for the recording of purchases,
purchase returns and purchase allowances on a daily basis but does not provide for a
continuous inventory or for a daily computation of the cost of goods sold. At the end of
each accounting period, a physical count is made of the quantity of goods on hand and
the value of the inventory is determined by using an inventory pricing method (FIFO,
LIFO or Average Cost) and attaching cost to units counted. The cost of good sold is
computed by deducting closing inventory from the sum of opening inventory and
purchases made during the current period. It is assumed that goods not on hand at the end
of accounting period have been sold. There is no system and accounting for shrinkage,
losses, theft and waste throughout the accounting period and they can be discovered only
after the end of the period
Labour Cost Accounting and Control
Proper control and accounting for la90ur costs is one of the most important objectives of
all business firms. Cost accounting for labour has three primary objectives:
• Determining labour costs in the cost of product or service.

216
• Reporting labour costs for planning and control.
• Reporting labour costs for decision-making.
For a manufacturing business firm engaged in producing a specific product, labour costs
are accumulated and charged to the product as they are produced. Similarly, in a service
(not-for-profit) organization, total cost as well as the cost of different functions (services)
is to be determined. This helps the Organization to know what it costs them to provide a
service or perform some activities. The second objective is to provide management with
labour cost information for effective planning of the labour force in the organization and
for, adequate control of labour costs. The control process of labour cost involves a
comparison of actual labour costs with standard labour cost. The differences between the
two are then analysed and possible reasons are determined so that management can take
suitable action to control the labour cost expenditure in future periods.
Labour cost information is used for decision-making purposes also. Many managerial
decisions, such pricing decision, expansion of business, dropping a product line,
replacement of plant and equipment, entering into a new market, etc. require information
about current actual labour costs and emerging trends there in
7.5 Wage Systems
An important aspect of labour cost control is a wage system designed primarily for
exercising management control over labour. The following objectives should be
considered in the selection of a wage system:
• Acceptance by employees to avert slowdowns and work stoppages.
• Provision for flexibility.
• Provision for economy in administration.
• Supplying of labour statistics for use in industrial relations and for trade
associations, government agencies and competitors.
• Stabilisation of labour turnover.
• Minimising of absenteeism.
• Provision for incentive plans.
Basically there are two wage systems to pay for labour: (i) straight time which is by hour,
day, or week, and (ii) piece work, which is by the unit of product.

217
Straight Time
Under the time basis, the worker is paid at an hourly, daily or weekly rate and his
remuneration depends upon the time for which he is employed and not upon his
production. If a worker works for overtime, the wage agreement usually provides that all
hours worked in excess of an agreed number are paid for at a higher rate. The time basis
wage system for direct labour is found in those industries where:
• The speed of production cannot be influenced by the energy or dexterity of the
workmen
• The quality of work is of paramount importance.
• It is difficult to measure the work done by the employee.
Piece Work
Under this method, a fixed rate is paid for each unit produced, job performed or number
of operations completed, and the worker's wages thus depend upon his output and not
upon the time he spends in the factory.
Incentive Wage Plans The basic purpose of an incentive wage is to induce a worker to produce more so
that he can earn a higher wage and, at the same time, unit costs can be reduced. Incentive
wage plans aim to ensure greater output, to help control over labour costs by
minimisation of total cost for a volume of production and to have a basis for reward from
hours served to work accomplished.
Incentive wage scheme has the following objectives:
1. Un-interrupted and higher production without any dispute between the labour and
management.
2. Stability in labour turnover.
3. Reducing labour absenteeism.
4. Developing cooperation, mutual trust, attitude of team work among workers and
between workers and supervisory staff.
5. Control of labour cost and reduction in labour cost per

218
unit of output.
6. Improving administrative efficiency.
7. Accurate budgeting through reliable labour cost information.
8. Generating workers' satisfaction by avoiding work stoppage, slow down, and by
providing incentive scheme.
The following are the essentials (desirable characteristics) of a successful incentive wage
plan:
1. A wage incentive system should be based upon standards of performance - time
and motion
a. Studies, job evaluation, and merit rating.
2. The incentive plan should be understood by all employees before installation (or
hiring).
3. All direct labour tasks should be on an incentive basis.
4. Only standard or acceptable quality production should be considered while
determining the bonus.
5. Once the standard is set, it should not be changed unless the method changes.
6. The incentive. Programme must be fairly and intelligently administered.
7. It is highly desirable that indirect personnel share in the incentive plan.
8. A high reward should be paid for performance above standard.
9. Individual incentives should be used wherever it is possible to do so.
10. Minimum wage should be guaranteed to every worker.
11. The views of both employers and employees should be considered while
designing incentive schemes.
12. The cost of establishing and operating the incentive plans should be reasonable.
13. The incentive plans should help in standard cost and budgetary control
programmes.
Incentive wage plans involve wage rates based upon various combinations of output and
time and are known as "different piece-rates" and "bonus-plans' as well. Generally, the
following types of incentive plans are used:
• Taylor Differential Piece-rate System
• Merrick Differential Piece-rate System

219
• Gantt Task Bonus Plan
• Premium Bonus Plans (Halsey. Halsey-Weir. Rowan. Bedaux, Emersion, etc.)
Taylor Differential Piece-rate System
Under this system there are low wage rates, a low one for output below standard and
a higher one for above standard predominance. The system aims to discourage below
average workers by providing no guaranteed hourly wage and by setting low piece rates
for low level production, and a high rate resulting in high earnings if an efficient level of
production is attained. For example, in a factory, workers earn Rs. 24 per eight hour day
and that production averages 12 units per hour per worker or 2S paise per unit. The Taylor
system might suggest a pay of 20 paise per unit if the worker averaged 14 units or less
per hour, but 30 paise per unit to workers averaging IS units or more per hour. The main
advantages of the Taylor system are that it provides a strong incentive to the efficient
worker, and is simple to understand and operate. But the incentive level may, be set so
high that it cannot attract most workers.
Merrick Differential Piece-rate System
This is an improvement over the Taylor system and depends on using three rates
instead of two as in the Taylor system. Normal' piece-rates are paid on output, when it
does not exceed 83% of the standard output. 110% of normal price rate are paid when the
output is between 83% and 100%, and 120% of the normal piece-rate is' paid if the output
is above 100%.
The Merrick system is useful to highly efficient workers as it provides incentives for
higher production. Similarly, it takes into account the less efficient worker who can at
least achieve 83% of the standard output. This minimum output. Is probably achievable
by all workers?
Calitt Task and Bonus Plan
This system combines a guaranteed lime-rate with a bonus and piece rate plan using
the differential piece-rate principle. Remuneration under the 'plan is computed as
follows:

220
Output Payment
1. Output below standard (high task) Time-rate (guaranteed)
2. Output is standard Bonus @ 20% on the time-rate
3. Output above standard High piece-rate on worker's whole
output
This plan provides incentives and opportunities to those who reach high level
production. At the same time it provides security and encouragement to less skilled
workers. It is simple to understand and workers are also satisfied in that they receive the
total reward for their efforts. A limitation of the plan is the tendency on the part of trade
unions to demand a high fixed guaranteed time-rate. Buuhe incentive element of the plan
would be lost in case too high a rate is fixed.
Premium Bonus Plans
Under the time-rates basis, any additional production above normal levels benefits
the employer, whereas with the piece-rates system the benefit goes to the employees
(apart from indirect benefits to the employer). Bonus plans have been developed to
produce a compromise, in that any savings are shared between employer and employee.
The following are the principal schemes under premium bonus plans.
Halsey Premium Plan
The principle of the Halsey scheme is that the worker receives a fixed proportion
of any time which he can save by completing the job in less than the allowed time. The
most common fixed proportion is 50% but this can be varied. This plan ensures that the
employee receives time wages until he produces in less than standard time. For above
standard production, savings are shared with the employer with the result that the rates
of increase happen to be lower for the employee. The cost per unit decreases when
production exceeds standard.
Halsey- Weir Plan
This plan is also know as the Weir Premium Scheme and is based on a 33*1/3:66*2/3
sharing plan. Under this scheme the total enrolments of a worker are the aggregate of

221
guaranteed hourly wages for actual time worked, plus the amount of bonus at the rates of
33*1/3 % of the time saved. Bonus is allowed at the same hourly rate at which he shall be
paid for actual time worked.
Rowan Plan
This scheme is similar to the Halsey Plan in that a standard time is fixed for the
completion of a job and the bonus i~ paid in respect of the item saved. But a ceiling is
applied to the size of the bonus. The bonus hours are calculated as a proportion of the
time taken which the time saved bears to the time allowed, and is paid for at time-work
rates. The bonus may be computed as follows:
Time taken
Bonus = x Time saved x Ti me rate
Time allowed
Bedaux Point Plan
Under the Bedaux point plan a guaranteed hourly rate is paid until standard production is
attained, and a premium or additional wage is paid for units in excess of standard. Instead
of being paid as piece rate, an hour's work is converted to points by dividing a standard
hour's production in units into 60 minutes. In other words, if 10 units are standard, then
each unit is 6 points and if 15 units are standard then each unit is 4 points. At standard
performance the worker produces a point per minute and for the first 60 points produced
in an hour, the worker receives the hourly rate. For excess production, it is common
practice to pay the worker 75% of the rate, and the foremen, supervisors and the other
indirect labour personnel receive 25% of the rate.
Emerson Efficiency Plan
Under the Emerson plan a minimum daily wage is guaranteed and a standard time is
determined for each job or operation. During each payroll period a record is kept of the
hours worked and the units produced, and the efficiency of each employee is then

222
determined by dividing actual hours into the standard' time for the units produced. For
example, if the standard is 10 units per hour and a worker produces 320 units in an 80-
hour week, the standard time for his output is 32 hours and he has worked at 80%
efficiency. Below 67% efficiency, the worker is paid his hourly rate, and from 67% upto
100% efficiency, step bonus rates apply. Above 100% efficiency, an additional bonus of
1 % of the hourly rate is paid for each 1% increase in efficiency.
Labour Turnover
Labour turnover is the rate at which elll11Joyees leave employment _ at a factory and is
normally measured as the ratio of the number of persons leaving in period tie the average
number on the payroll For example, if 100 persons leave a company in a year and the
average number on the payroll is 500, labour turnover is expressed as 20% p.a. In this
calculation all persons who leave must be included, whether they leave voluntarily or are
dismissed and irrespective of whether they are replaced. There are three methods of
measurement of labour turnover.
(All employees leaving/ Average number employed) * 100
(Number of replacement in a period/ Average number employed) * 100
(All employees leaving plus new employees/ Average number employed) * 100
Among the three methods, the first method is to be preferred, as it is more appropriately a
long-term indicator. This formula is more satisfactory as management is primarily
concerned with the loss of labour, after money has been spent on training. The effects of
a high or low turnover rate should then be analysed e.g., on training costs, on production
efficiency and employees morale
Overhead Costs: Allocation and Absorption
The total or full cost of a product consists of direct costs and indirect costs. The
direct costs are easily traced or identified with the product or job without any difficulty.
In a manufacturing organization, direct materials, direct labour and direct expenses are
examples of direct costs.

223
Indirect costs or overhead* costs are not directly traceable to a product or job
because they are incurred for two or more products; their clear identification with one
product is not possible. There is no direct and observable way of determining how much
of overhead costs belongs to each product. Due to these features, overhead costs are
termed indirect costs. Indirect materials, indirect labour and indirect expenses are
examples of indirect or overhead costs. There is a need to develop methods to decide the
share of overhead costs for different products. The procedure of distributing or sharing
out overhead costs to different is known as absorption of overheads.
The stages or steps involved in the absorption of overhead costs are:
Stage I: Collection or GatheJing of Overhead Cost Information'
Stage II: Allocation and Apportionment of Overheads to Production and Service
Departments.
Stage III: Apportionment of Service Department Overheads to Production Departments
Stage IV: Calculation of Appropriate Overhead Rates.
The overhead rates obtained finally after completing the above stages are used to charge
overhead to products and jobs.
STAGE I: COLLECTION OR GATHERING OF OVERHEAD COSTS
INFORMATION
The first step in accounting and distribution of overhead costs is their collection under
proper headings Overhead costs items should be gathered and subsequently grouped
together. The groupings of overhead
Costs are done through a technique known as codification. Codification is a method of
identifvii1g and describing various overhead expenses in members or letters or in a
combination of both %", 0 that cost data can easily be collected. Codification of the entire
items is done through a 'proper coding system. Costs are done through a technique known
as codification. Codification is a method of identifying and describing various overhead
expenses in members or letters or in a combination of both %, 0 that cost data can easily
be collected. Codification of the entire items is done through a 'proper coding system.
Methods of Codification

224
Some important methods of codification are mentioned below:
Serial Numbering System
Number Blocks
Combination of Alphabets and numbers
Numerical Codes
Mnemonic Method
Sources of Overhead Collection
Different sources are available in an organization to collect overhead expenses such as:
• Stores requisitions for items like indirect materials.
• Financial accounts - A large number of items may be taken from the financial
accounts of the business enterprise.
• Wage book - Most indirect wages and labour-related costs.
• Cash book - for indirect expenses.
• Registers and reports - Plant and machinery register for depreciation, scrap, waste
and spoilage can be discovered through investigation.
STAGE II: ALLOCATION AND APPORTIONMENT OF OVERHEAD
COST TO PRODUCTION AND SERVICE DEPARTMENTS
The second stage in the charging of overhead costs is to identify overhead costs for
different production and service departments. This stage is known as primary
distribution also.
Some overhead costs can be directly identified with a particular department or cost
centre as having been included for that cost centre. These items of overhead cannot be
traced to products or jobs but can be allocated specifically to departments. Examples of
such overhead costs are repairs and maintenance expenses incurred in specific
departments, supervision, indirect labour, overtime, indirect materials and factory
supplies including equipment depreciation.
Expenses such as power, light, rent, depreciation of factory building, expenses
shared by all departments, cannot be charged directly to a department, be it producing or
service. They are incurred for all and must, therefore, be apportioned to any or all

225
departments using such items. The apportionment should be done on some rational and
equitable bases. It would be difficult to give a comprehensive list of the bases of
apportionment. However, the following bases are in common use:
• Floor area occupied - Overheads such as lighting and heating, rent and rates,
depreciation on building, building repairs, caretaking, watching and patrolling.
• Capital values - Depreciation on plant and machinery, insurance on building and
plant and machinery, maintenance of plant and machinery.
• Direct labour hours and/or machine hours - Insurance on jigs, tools and fixtures,
power, works management remuneration, repairs and maintenance cost.
• Number of workers employed - Canteen, accident insurance, medical, dental and
first aid, pensions, personnel department expenses, profit sharing payments,
recreation, supervision, time office, wages department.
• Technical estimate - Fire prevention, oil and grease, steam, water without meter.
Example
The Modem Co. is having four departments. A, Band C are the producing
departments and D is a servicing department. The actual costs for a period are as follows:
Rs.
Rent 2,000
Repair 1,200
Depreciation 900
Light 200
Supervision 3,000
Insurance 1,000
Employee's Insurance 300
Employer's liability Power 1,800
The following data are also available in respect of four departments
Dept.A Dept. B Dept.C Dept.D
Area Sq. ft
Number of workers
Total wages
Value of Plant
Value of Stock
150
24
Rs. 8,000
Rs. 24,000
Rs. 15,000
110
16
Rs.6,000
Rs. 18,000
Rs. 9,000
90
12
Rs. 4,000
Rs.12,000
Rs.6,000
50
8
Rs.2,000
Rs.6,000
-

226
Apportion the costs to the various departments on the most equitable method.
Table 7.15 Solution: Overhead Distribution Summary
Departments Name of the
Expense
Basis
A B C D
Rent
Repairs
Depreciation
Supervision
Insurance
Employee’s
Insurance
Lighting
Power
Area
Plant value
-do-
No. of workers
Value of stock
Wages
Area
Plant value
750
480
360
1,200
500
120
75
720
550
360
270
800
300
90
55
540
450
240
180
600
200
60
45
360
250
120
90
400
-
30
25
180
Total 4,205 2,965 2,135 1,095
Example
The modern company has four departments A, B, C is the production departments and D
is the servicing department. The actual costs for a period are as follows:-
Rs.
Production department A 950
B 1,200
C 200
Servicing department 1,500
Indirect wages:
Production department A 900
B 1,100
C 300
Servicing department 1,000
Rent 2,000
Repair 1,200
Depreciation 900
Light 200

227
Supervision 3,000
Insurance 1,000
Employee’s insurance (employer’s liability) 300
Power 1,800
The following data are also available in respect of four departments
Departments
A B C D
Area
No. of workers
Total Wages
Value of plant
Value of stock
150
24
Rs.8000
Rs.24000
Rs.15000
110
16
Rs.6000
Rs.18000
Rs.9000
90
12
Rs.4000
Rs.12000
Rs.6000
50
8
Rs.2000
Rs.6000
-
Apportion the above costs to the various departments on the most equitable method:
Table 7.16 Solution:
Departments Items Basis Total
A B C D
Indirect
wages
Indirect
wages
Rent
Repairs
Depreciation
Light
Supervision
Insurance
Employees
Allocation
Allocation
Area
Plant value
Plant value
Area
No. of workers
Value of stock
Wages
Plant value
3,850
3,300
2,000
1,200
900
200
3,000
1,000
300
1,800
950
950
750
480
360
75
1,200
500
120
720
1,200
1,100
550
360
270
55
800
300
90
540
200
300
450
240
180
45
600
200
60
360
1,500
1,000
250
120
90
400
-
30
25
180

228
Insurance
Power
17,550 6,055 5,265 2,635 3,595
STAGE III: APPORTIONMENT OF SERVICE DEPARTMENTS' OVERHEAD
TO PRODUCING DEPARTMENTS
In Stage III. Overhead costs of service departments are apportioned to production
departments. The logic for such apportionment is that service departments do not
themselves manufacture anything and it is the production departments which produce.
Such apportionment 'is termed as Secondary Distribution.
The general basis for apportioning service departments overheads to producing
departments are the following:
1. Service rendered (benefits obtained): This. is perhaps the most popular method of
apportioning service department costs. The services rendered to different departments,
i.e., benefits obtained by them can be a suitable basis. If a producing department has
received large benefits, it must be charged for a share of overhead costs incurred to
provide that quantity of benefits.
2. Ability to pay: This method suggests that a large share of servicing. Departments'
overhead costs should be ·assigned to those producing depal1ments whose product
contributes the most to the income of a business enterprise.
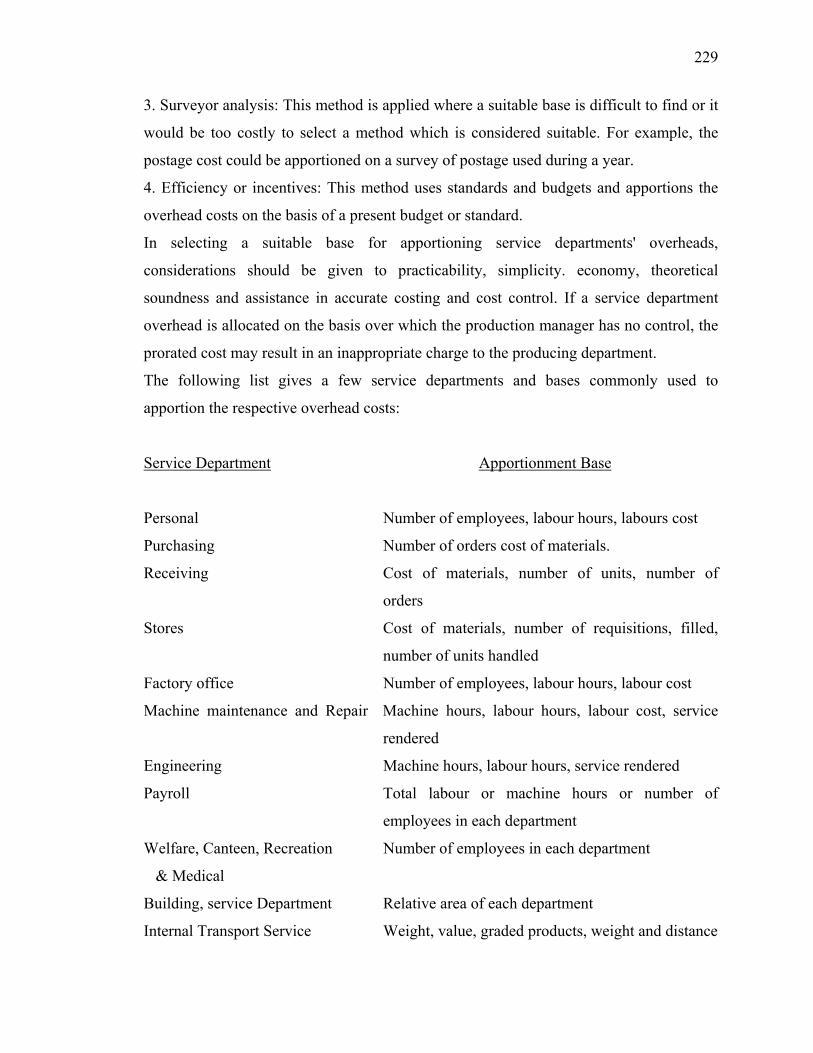
229
3. Surveyor analysis: This method is applied where a suitable base is difficult to find or it
would be too costly to select a method which is considered suitable. For example, the
postage cost could be apportioned on a survey of postage used during a year.
4. Efficiency or incentives: This method uses standards and budgets and apportions the
overhead costs on the basis of a present budget or standard.
In selecting a suitable base for apportioning service departments' overheads,
considerations should be given to practicability, simplicity. economy, theoretical
soundness and assistance in accurate costing and cost control. If a service department
overhead is allocated on the basis over which the production manager has no control, the
prorated cost may result in an inappropriate charge to the producing department.
The following list gives a few service departments and bases commonly used to
apportion the respective overhead costs:
Service Department Apportionment Base
Personal Number of employees, labour hours, labours cost
Purchasing Number of orders cost of materials.
Receiving Cost of materials, number of units, number of
orders
Stores Cost of materials, number of requisitions, filled,
number of units handled
Factory office Number of employees, labour hours, labour cost
Machine maintenance and Repair Machine hours, labour hours, labour cost, service
rendered
Engineering Machine hours, labour hours, service rendered
Payroll Total labour or machine hours or number of
employees in each department
Welfare, Canteen, Recreation Number of employees in each department
& Medical
Building, service Department Relative area of each department
Internal Transport Service Weight, value, graded products, weight and distance

230
Inter-Departmental Service
While apportioning service departments' overheads, one may notice two situations:
(i) first, the entire amount of a servicing department is to be distributed only to the
producing department. This does not involve any practical difficulty and provides the
simplest and quickest method for apportioning costs of the servicing department. (ii)
Second, service provided by some servicing departments is used partly by other servicing
departments. That is, many service departments serve each other. For example, the
payroll department in a firm prepares payroll for the entire organisation, but it depends
on the building maintenance department for repair and maintenance services. Similarly,
the building maintenance department provides services for all departments using the
building, but it gets service from departments like stores, factory office and personnel.
This second situation is known as inner-departmental services.
There are mainly two methods to deal with apportioning overheads under inter-
departmental service:
A Continuous apportionment: In this methods the. Process of apportioning service
departments' overheads is continued until the figures become immaterial or totally
exhausted. The following stages are involved in this method:
Use the given percentages to apportion the original total of the first service
department. This closes the account of the first service department and
transfers prorated amounts to other departments.
Use the given percentages of the second service department whose total is
made up of original amount plus prorated amount of service department first.
This closes the account of the second service department and assigns prorated
amounts to the other departments including service department also.
Follow the same procedure with respect to all other service departments.
Repeat a second cycle of apportionment starting with the service department
first, whose total consists, at present, only of amounts prorated from other
service departments. In this way, the service department totals become less
and less with each cycle of apportionment because each time a substantial
amount is apportioned to the producing departments.

231
Stop the above cycle at any point where it is found that the remaining figures
(to be apportioned) are too small to be of any consequence or when the figures
are totally exhausted.
Example
The overhead of a manufacturing company has been analysed to the point of primary
distribution.
Rs.
Production departments: Machine 10,000
Assembly 4,000
Service departments: Canteen 2,000
Powerhouse 3,000
The canteen is to be apportioned on the basis of employees
Employee’s %
Machine 240 60
Assembly 140 35
Powerhouse 20 5
400 100
The powerhouse is to be apportioned on the basis of electricity used:
Thousand kilowatt %
Machine 270 75
Assembly 36 10
Canteen 54 15
360 100
The apportionment would be done in the following manner

232
B. Algebraic method or Simultaneous Equation: This method helps in finding out the
amount of overhead of each service department by solving simultaneous equations. The
total expenses of service departments can be directly transferred to the production
departments.
Example
A company has there production departments, A, B and C and two service departments P
and Q. The following figures are available as per departmental distribution summary:
Rs.
Production A 3,150
B 3,700
C 1,400
Service departments P 2,250
Q 1,000
The expenses of the service departments are to be apportioned on a percentage basis as
follows:
Machine Assembly Canteen Powerhouse
10,000
1,200
2,325
279
18
2
4,000
700
310
163
2
1
Primary apportionment
Apportion : Canteen
Power house
Canteen
Powerhouse
Canteen
Total Service Dept
Total Production over
head
3,824
13,824
1,176
5,176
2,000
-2000
4,675
-465
3
-3
3,000
100
-3,100
23
-23

233
A B C P Q
Service dept P 40 % 30 % 20 % - 10 %
Service dept Q 30 % 30 % 20 % 20 % -
Solution:
Let X= total overhead of dept. P
Y= total overhead of dept Q
There fore, X = 2,250 + 20/100Y
Y = 1,000 + 10/100X
10X=22,500 + 2Y
10Y=10,000 + 1X
Multiplying equation (3) by 5
50 X – 10 Y = 1, 12,500
-X + 10Y = 10,000
49 X = 1, 22,500
X= 2,500 And Y = 1,250
Table 7.17 Secondary Distribution Summary
Production
departments
Service Department Total
A B C D P Q

234
As per summary
Service dept. P
Service dept Q
11,500
11,500
11,500
3,150
1,000
4,150
375
4,525
3,700
750
4,450
375
4,825
1,400
500
1900
250
2,150
2,250
-2,250
-
250
-
1,000
250
1,250
-1,250
-
Service department’s overheads represent the sum of the service department costs plus
the costs apportioned form other service departments. After obtaining total overhead
costs of servicing department the total of each service department is apportioned to the
producing departments on the basis of percentage or proportion ( for the services
rendered) of the specific producing departments.
Example
PH Ltd is a manufacturing company having there production departments A, B and C and
two service departments X AND Y. The following is the budget for December 1999.
Total
Rs
A
Rs.
B
Rs.
C
Rs
X
Rs
Y
Rs
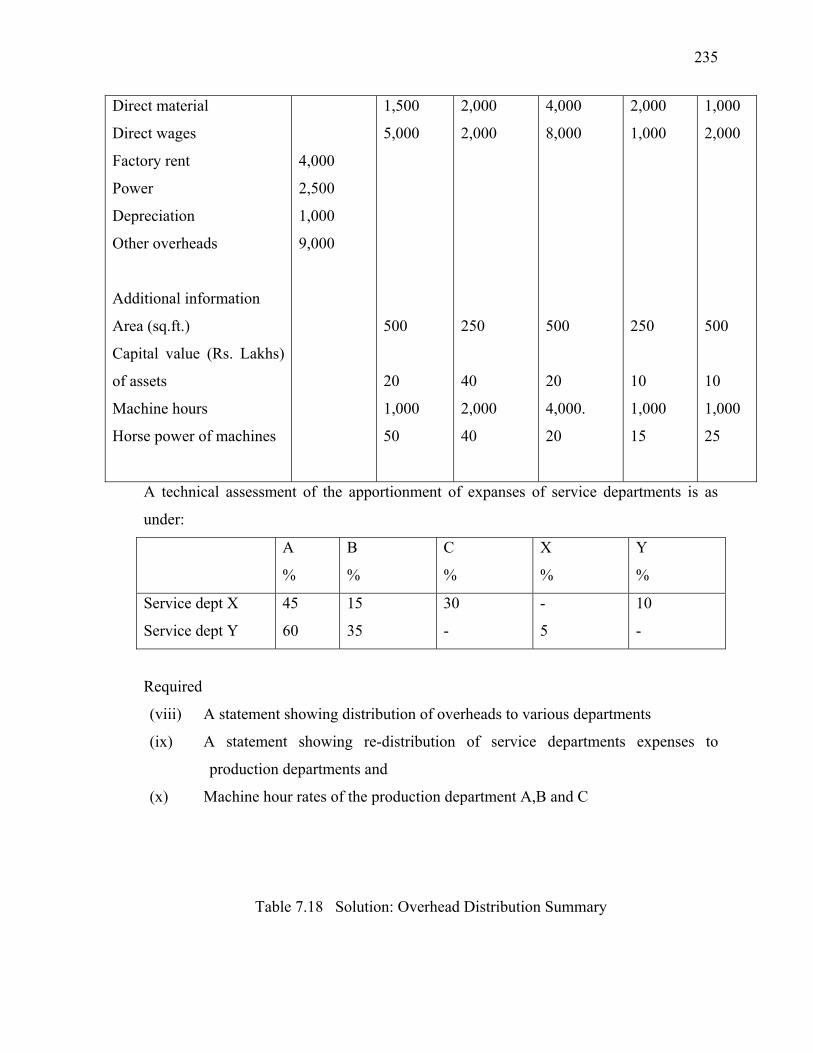
235
Direct material
Direct wages
Factory rent
Power
Depreciation
Other overheads
Additional information
Area (sq.ft.)
Capital value (Rs. Lakhs)
of assets
Machine hours
Horse power of machines
4,000
2,500
1,000
9,000
1,500
5,000
500
20
1,000
50
2,000
2,000
250
40
2,000
40
4,000
8,000
500
20
4,000.
20
2,000
1,000
250
10
1,000
15
1,000
2,000
500
10
1,000
25
A technical assessment of the apportionment of expanses of service departments is as
under:
A
%
B
%
C
%
X
%
Y
%
Service dept X
Service dept Y
45
60
15
35
30
-
-
5
10
-
Required
(viii) A statement showing distribution of overheads to various departments
(ix) A statement showing re-distribution of service departments expenses to
production departments and
(x) Machine hour rates of the production department A,B and C
Table 7.18 Solution: Overhead Distribution Summary

236
Basis Total
Rs
A
Rs.
B
Rs.
C
Rs
X
Rs
Y
Rs
Direct Material
Direct wages
Factory rent
Power
Depreciation
Cap.
Overheads
Direct
-
Area
H.P.X
M/chr
Value
M/c hr
-
-
4,000
2,500
1,000
9,000
-
-
1,000
500
200
1,000
-
-
500
800
400
2,000
-
-
1,000
800
200
4,000
2,000
1,000
500
150
100
1,000
1,000
2,000
1,000
250
100
1,000
2,700 3,700 6,000 4,750 5,250
Table 7.19 Re-distribution of Service Department’s Expenses
A
Rs.
B
Rs.
C
Rs
X
Rs
Y
Rs
Total overheads
Dept. X Overheads apportioned
In the ratio (45:15:30:10)
Dept. Y Overhead apportioned
In the ratio ( 60:35:5)
Dept. X Overheads apportioned
In the ratio (45:15:30:10)
Dept. Y Overhead apportioned
In the ratio ( 60:35:5)
Dept. X Overheads apportioned
In the ratio (45:15:30:10)
2,700
2,138
3,495
131
17
1
3,700
712
2,039
44
10
-
6,000
1,425
-
87
-
1
4,750
-4,750
291
-291
2
-2
5360
475
-5825
29
29
8,482 6,505 7,513 - -
Machine Hour Rate

237
A B C
Machine hours 1,000 2,000 4,000
Machine rate (Rs.) 8.48 3.25 1.88
STAGE IV: CALCULATION OF OVERHEAD RATES
After all services departments' overhead costs have been apportioned to the producing
departments, the next step is to spread factory overhead to different products or jobs
produced. This is termed as 'overhead absorption' in cost accounting. Known by different
names such as recovery, overhead application, overhead costing, levy, burden rate etc.
the term "absorption" implies that expenses pertaining to a producing department or cost
centre are finally charged to or absorbed in the cost of products, jobs, etc. passing through
it. As a result of absorption, the cost of each unit of product of the producing department
includes an equitable share of the total overhead of that department. Overhead rates can
be calculated by using any one of the following methods:
1. Percentage on Direct Materials
In such a case, the rate is obtained by dividing total estimated factory overhead by total
direct materials cost expected to be used in the manufacturing process. If factory
overhead is Rs. 3, 00,000 and materials cost is Rs. 2, 50,000, the absorption rate will be:
3,00,000/2,50,000 x 100 = 120%
Each job or product would be charged on the basis of 120% absorption rate. For example,
if the materials cost of a product is Rs. 5,000, the factory overhead to be charged for their
product would be Rs. 6,000 (5,000 x 120%).
Advantages
The percentage on direct material cost method is simple and easy to understand and
apply. This method will give correct overhead cost figures where the price of raw
materials do not differ significantly, where quantity and cost of materials in each product
are unit form, and where processing for the different products is also uniform. It is useful
in very simple types of small business firms.

238
Disadvantages
This method has the following disadvantages:
• There is no logical relationship between materials cost of a product and factory
overhead used in production
• Materials prices are subject to fluctuations quite often and this phenomenon leads
to high or low overhead costs, even though overhead figures remain unchanged.
• Most of the overhead expenses vary with time and not on materials consumed.
But the use of direct material cost totally ignores the time factor which is an
important factor in allocation/apportionment of overhead costs.
• The mere fact that a job consumes materials of a very expensive nature does not
imply that the overheads incurred on that job will also be heavier.
2. Percentage on Direct Wages
The direct labour cost basis is the most widely used method of applying overhead to jobs
or products.
This is computed in the following manner:
(Factory overhead/Direct labour cost) * 100
If factory overhead is Rs. 20,000 and the direct labour cost is also Rs. 20,000, then
absorption rate based on direct wages will be 100%.
20,000/ 20,000 * 100
A job or a product with a direct labour cost of Rs. 3,000 would be charged with Rs. 3,000
for factory overheads. Labour rates fluctuate but less frequently than that of prices of
materials
Advantages
• It is simple to operate and understand.
• It considers the time factor, as labour cost is computed by multiplying the number
of hours spent on work by an hourly labour rate, the more hours worked, the
higher the greater the use and therefore the charge for factory overheads.
• Labour cost and the greater the use and therefore the charge for factory overheads.

239
Disadvantages
The disadvantages are:
• It depends on the cost of direct labour which may not reflect accurately the
contribution of factory overheads in the cost of product.
• It does not consider the share of other factors of production other than direct
labour factor, for example, machinery.
• It does not take into account variations, if any, in the rates of remuneration for
different types of labour and therefore, the wages incurred on different jobs are
not necessarily in the same ratio as the hours spent.
3. Prime Cost Percentage
The prime cost basis combines the total of direct materials cost and direct labour cost and
uses this total as a basis for charging overhead. The formula used in determining the rate
is:
(Factory Overhead/ Prime cost) * 100
If in a case, the factory overhead is Rs. 4, 56,000 and prime cost is Rs. 6, 00,000, then
prime cost. Percentage rate will be:
(4, 56,000/ 6, 00,000) * 100 = 76% or prime cost
Advantages
This method is simple to operate. It considers both materials and labour in charging
overheads to each job or product. The prime cost data is easily available without any
additional problem of accumulation.
Disadvantages
The disadvantages are:
• Two items, i.e. materials and labour both of which possess many disadvantages
influence the charging of factory overheads to jobs and products.
• Where the cost of materials is a larger part of the prime cost, the time factor
(direct labour costs) will be ignored which is more related to the factory overhead.

240
• It ignores the time factor in absorbing factory overhead.
4. Unit of Production Basis
The unit of production method is the simplest and most direct method of charging factory
overhead. The unit might be a kilo, foot, a machine, a hundred pieces or whatever unit of
measure is used for the product. As a formula, the computation is as follows: Factory
overhead/ Units of Production
If factory overhead is Rs. 3,00,000 and the company intends to products 2,50,000 units
during the next period, each unit completed would be charged with Rs. 1.20(3,00,000 -7-
2,50,000 units) as its share of factory overhead. Thus, an order with 1,000 completed
units would be charged Rs. 1,200 (l, 000 units x Rs. 1.20) for factory overhead.
5. Labour Hour/Production Hour Rate
One of the most widely used methods for overhead application is the labour hour basis.
The equation for determining the overhead rate under this method is:
= Factory overhead / Direct labour hours
If factory overhead is Rs. 4,00,000 and direct labour hours are 2,00,000, then the
overhead rate based on direct labour hours would be Rs. 2 per hour of direct labour (Rs.
4,00,000 ÷2,00,000 hours). A product that requires 5,000 direct labour hours would be
charged with Rs. 10,000 (5,000 hours * Rs. 2) for factory overhead.
Advantages
The following are the advantages:
1. As long as direct labour is the chief factor in manufacturing processes, the direct
labour hour’s method is useful as the most equitable basis for charging overheads.
2. This method uses the time factor and production taking into account that the same
time is charged with the same amount of overhead, though the direct laborer may
be getting different wage rates.
Disadvantages
The disadvantages are:

241
1. The method requires accumulation of direct labour hours by job, product or
department Timekeeping should be adequate to provide this information.
2. This method cannot be used where machines are used extensively for
production. In other words, this method assumes that direct labour is only the
major factor of production.
6. Machine Hours Rate
The machine hour rate is similar to the labour hour rate method and is used where
the work is performed primarily on machines. The formula used in computing the rate is:
= Factory overhead/ Machine hours
If factory overhead is Rs. 3, 00,000 and total machine hours are 1, 50,000, the
machine hour rate is Rs. 2 per machine hour (Rs. 3, 00,000 ÷ 1, 50,000 hours).
Advantages
The method can be used advantageously where the machine is the major factor in
production. In capital-intensive industries, plants and machines are used is large
quantities and one operator may attend to several machines or several operators may
attend to a single machine. By making the machine the basis, therefore, overhead costs
can be equitably absorbed among different products.
Disadvantages
The disadvantages are:
1. Machine hour data has to be collected and therefore it requires additional
clerical work.
2. The method cannot be used universally by all business concerns. It can be used
where production is mainly through machines.
Two types of machine hour rates can be calculated:
1. Ordinary machine hour rate-This rate takes into account only those overhead
expenses which are directly attributed to the running of a machine. Such expenses are
power, fuel, repair, maintenance and depreciation. The total of all these expenses is
divided by the total machine hours.

242
2. Composite machine hours rate-This method takes into account not only expenses
directly connected with the machine as mentioned above, but also other expenses which
are known as standing or fixed charges. Such expenses are rent and rates, supervisory
labour, lighting and heating, etc. These expenses being fixed in nature are determined for
a particular period and then apportioned among different departments on some equitable
basis. The overhead expenses thus apportioned to each department are further
apportioned among the machines (machine cost centers) in that department on an
equitable basis.
7.6 MANAGERIAL ACCOUNTING Managers in all types of organizations need frequent information about business activities
to plan accurately for the future, to control business results, to direct an enterprise
towards achieving its goals and to make decisions that affect the operations of the
business. Information is vital for the management process i. e. for functions carried out by
the managers namely, planning, controlling and decision-making. In the goal of providing

243
information, managerial accounting identifies, collects, measures, classifies and reports -
information that is useful to managers in fulfilling the management process.
Managerial accounting is that field of accounting which deals with providing information
including financial accounting information to managers for their use in planning,
decision-making, performance evaluation, control, management of costs, and cost
determination for financial reporting. Managerial Accounting contains reports prepared to
fulfill the needs of managements.
The National Association of Accountants (USA), in Statement No. IA (Statements on
Management Accounting, 1982) has defined management accounting as:
“... The process of identification, measurement, accumulation, analysis,
preparation and communication of financial information used by management
to plan, evaluate, and control within the organisation and to assure appropriate use
and accountability for its resources."
The CIMA (UK) defines the term management accounting in the following manner:
"Management accounting is an integral part of management concerned with
identifying, presenting and interpreting information used for:
(1) Formulating strategy
(2) Planning and controlling activities
(3) Decision taking
(4) Optimizing the use of resources
(5) Disclosure to shareholders and others external to the entity
(6) Disclosure to employees and
(7) Safeguarding assets."
Thus, managerial accounting is concerned with data collection from internal and external
sources, analysis, processing, interpreting and communicating the information for use
within the organisation so that management can more effectively li1an, make decisions
and control operations.
COST ACCOUNTING AND MANAGERIAL ACCOUNTING

244
Cost accounting is mainly concerned with ascertainment of product costs and the
techniques of product costing and deals with only cost and price data. It is limited to
product costing procedures and related information processing. It helps management in
planning and controlling costs relating to both production and distribution activities.
Inspite of the differing parameters of cost accounting and managerial accounting,
cost accounting i generally indistinguishable from what is known as management or
managerial accounting. Both these accounting systems are closely linked as they use
common basic data and reports to a material degree. Much of the information used to
prepare accounting statements and reports in cost accounting are also used in managerial
accounting reports. Cost accounting largely uses data about production, sales, wages, and
overhead services. Managerial accounting utilises the same (and also additional) data to
prepare budgets, performance reports, and control reports and data analyses for decision-
making purposes. Special decision methods, use of highly quantitative methods,
behavioral techniques, information systems and budgeting are areas of managerial
accounting. Gray and Ricketts I illustrate the relationship between cost accounting and
managerial accounting in these words:
"The database (for cost accounting and managerial accounting) includes common data,
i.e. the same data are used, by managerial accounting and by cost accounting, but in
different ways. For example, historical data on labour costs are used by cost accounting
to determine inventory values and cost of goods sold. The historical data on labour cost
might be used to estimate the labour cost for the coming year to determine the size of
workforce needed to meet anticipated production requirements and to estimate the cash
requirements to meet weekly payrolls. This represents the use of cost accounting data to
develop managerial accounting data for planning decisions. The historical data on labour
costs might be compared with the estimated labour costs to determine if labour is being
used effectively and efficiently. This represents the use of cost accounting data to develop
managerial accounting data for control decisions. The data base also include ... special
data for cost accounting and special data for managerial accounting, obviously called
special because they are data used only be either cost accounting or by managerial
accounting."

245
MANAGEMENT PROCESS AND ROLE OF MANAGERIAL ACCOUNTING
The Management process implies the four basic functions of (I) Planning, (2)
Organizing 3) Controlling, and (4) Decision-making. Managerial accounting plays a vital
role in these managerial functions performed by managers.
(I) Planning: Planning is formulating short term and long-term plans and actions to
achieve a particular end. The long-term plan indicates management's expectation of the
future during the next three to five years or perhaps even longer. A budget is the
financial planning showing how resources are to be acquired and used over a specified
time interval. Managerial accounting is closely interwoven in planning both because it
provides information for decision-making and because the entire budgeting process is
developed around accounting-related reports. Managerial accounting helps managers in
planning by providing reports which estimate the effects of alternative actions on an
enterprise's ability to achieve desired goals. For example, if a business enterprise
determines a target profit for a year, it should also determine how to reach that target. For
example, what products are to be sold at what prices? The management accountant
develops data that help managers identify the more profitable products. Similarly, the
effects of alternative prices and selling efforts (say, what will profit be if we cut prices by
5% and increase volume by 15%, etc.) can easily be determined by the management
accountant.
(2) Organizing: Organizing is a process of establishing an organizational framework
and assigning responsibility to people working in an organisation for achieving business
goals and objectives. The type of organizational structure differs from one business
enterprise to another. Organizing requires clarity about each manager's responsibility and
lines of authority. The various departments and units are inter-related in a hierarchy, with
a formal communication structure in which information and instructions are passed
downwards to the lower level management and upwards to the top management level.
Managerial accounting helps managers in organizing by providing reports and
necessary information to regulate and adjust operations and activities in the light of
changing conditions. For example, the reports under managerial accounting can be

246
prepared on product lines on which basis managers can decide whether to add or
eliminate a product line in the current product mix. Similarly, the management
accountant can provide sales report, production report to the respective managers for
taking suitable action about the sale and production position.
(3) Controlling: Control is the process of monitoring, measuring, evaluating and
correcting actual results to ensure that a business enterprise's goals and plans are
achieved. Control is accomplished with the use of feedback. Feedback is information that
can be used to evaluate or correct the steps being taken to implement a plan. Feedback
allows managers to decide to let the operations and activity continue as they are, take
remedial actions to put some actions back in harmony with the Original plan and goals or
do some rearranging and preplanning at the midstream.
Managerial accounting helps in the control function by producing performance
reports and control reports which highlight variances between expected and actual
performances. Such reports serve as a basic for taking necessary corrective action to
control operations. The use of performance and control report follows the principle of
management by exception. In case of significant differences between budgeted and actual
results, a manager will usually investigate to determine what is going wrong and
possibly, which subordinates or units might need help.
(4) Decision-making: Decision-making is a process of choosing among competing
alternatives. Decision-making is inherent in each of three management functions
described above, namely planning. Organizing and controlling. Before knowing the role
of the management in the decision-making area. It is first necessary to understand the
decision-making process. The decision-making process includes the following steps: 2
Identifying a problem requiring managerial action.
• Specifying the objective or goal to be achieved (e.g. maximizing
return on investment).
Listing the possible alternative courses of action.
Gathering the information about the consequences of each alternative.

247
Making a decision, by selecting one of the alternatives.
Decision-Making Process
Managerial accounting plays a critical role in step 4 of the decision-making process.
Managerial Accounting. System contains a storehouse of valuable information for
predicting the results of various courses of action. The managerial accounting can assist
the management in formally structuring decision. Problems as well as placing the
alternatives and their consequences in a form that will be easier for the management to
evaluate. It should be understood that the management accountant sometimes needs to do
special analyses and develop information for some decisions which are made at relatively
infrequent intervals, such as whether, to build a new factory, introduce a new product or
enter a foreign market. The data for such decisions and analyses may be readily available
in the needed form. The management accountant in such a situation. determines what
data are needed, presents those data in an understandable form and manner and explains
the analyses and report to the managers who are to make decisions.
While developing and gathering information for decision-making purposes, the
management accountant should include qualitative information also in his report to help
managers better in their decision-making tasks. Dominiak and Londerback III observe:
"Although managers use accounting data 'extensively as they make decisions, such data
do not answer the questions that managers face. People make decision and people bring
to decision making their experience, values and knowledge which often cannot be
incorporated into quantitative analyses. An action that seems based on an analysis of the
accounting data might not be taken because of some factor not captured in those data. For
example, because the managers of a firm want the company to maintain technological
leadership, they might launch a new product that is expected to be unprofitable.
Quantifying the benefits of such leadership is not easy. It is unlikely that such
quantification would be included in the management accountant's analysis of the
desirability of bringing out the new product. It is, however, quite likely that a report of
that analysis would include a comment about the inability to quantify such benefits. That
is, reports from managerial accountants are very likely to recognize factors whose
financial implications are not incorporated in the reports."

248
7.6.1 DIFFERENCES BETWEEN MANAGERIAL ACCOUNTING AND
FINANCIAL ACCOUNTING
The accounting information system in an organisation can be divided into two
important subsystems or branches: (i) Management or Managerial Accounting and (ii)
Financial Accounting. As stated earlier, managerial accounting, also known as internal
accounting, identifies, collects, measures, classifies and reports information that is useful
to managers in planning, control and decision-making. On the other hand, financial
accounting, also known as external accounting, produces information and reports for
external users. The subject matter and scope of managerial accounting and financial
accounting are displayed in Figure 7.2.
Managerial accounting and financial accounting differ from each other in the following
respects:
(1) Primary users of information: The users of financial accounting statements are
mainly external to the business enterprise. The financial statements prepared under
financial accounting show how the resources have been used by a business enterprise
during a specific period of time and thus are useful to external users in making sound
economic decisions. These financial statements are relevant to management but are not
adequate for the purpose of planning, control and decision-making. External users
include shareholders, creditors, financial analysts, government authorities, stock
exchange, labour unions etc.
Accounting
Financial Managerial

249
Internal Interested Internal Interested Reporting Parties or Users Reporting parties Income Statement
Shareholders
Planning
Management (or Managers)
Balance Sheet Investors Decision-making Top CashFlow Statement Creditors Performance
Evaluation Middle
Government Authorities Control Lower Managers Management of
Cost
Employees Cost determination
Stock Exchange Investor’s Association Industry Association
Fig 7.2 Accounting classification
Management accounting aims at preparing reports and supplying information to the
management for planning, controlling and decision-making. The information generated
under the accounting system is used by members of the management at different levels.
The nature of internal reports and data varies for different levels of management in
conformity with their information requirements for analysing business operations and for
planning and control purposes.
(2) Accounting methods: Financial accounting follows the double-entry system for
recording classifying and summarizing business transactions. This accounting process
results in aggregate balance of all accounts maintained in a firm's books. Managerial
accountings are not based on the double-entry system. The data under managerial
accounting may be gathered for small or large segments or activities of an organisation
and monetary as well as other measures can be used for different activities in the firm.
(3) Accounting principles: Financial accounting data is primarily meant for
external users. The generally accepted accounting principles' are important in financial
accounting and are used extensively while recording, classifying, summarizing, and

250
reporting business transactions. The use of GAAP adds credibility and reliability to
financial statements and creates confidence among the financial statement users. On the
contrary, managerial accounting is not bound to use the ·generally accepted accounting
principles. It can use any accounting technique or practice which generates useful
information. Besides data developed in management accounting may be facts, estimates,
projections, analysis etc.
(4) Unit of measurement: All information under financial accounting is in terms of
money. That is transactions measured in terms of money have already occurred. In
comparison, managerial accounting applies any measurement unit that is useful in a
particular situation. Besides the monetary units, the management accountant may find it
necessary to use such measures, as number of labour hours, machine hours and product
units for the purpose of analysis and decision-making. The common objective in all
measurement, reporting and data analysis in managerial accounting is usefulness for a
particular purpose.
(5) Time Span: Financial accounting data and statements are developed for a
definite period, usually: a year or a half-year. It requires that financial statements be
developed and presented at regular time intervals. Company annual reports may be
prepared semi-annually or quarterly but the important point is that they are prepared on a
regular basis.
Managerial accounting reports and statements are prepared whenever needed.
Reports may be prepared on a monthly, weekly or even daily basis. Frequency of reports
is determined by particular planning controlling and decision-making needs.
(6) General Purpose Report vs. Specific Purpose Report: Financial accounting
produces information and reports which are general purpose reports in order to serve the
informational needs of many external users such as shareholders, creditors, potential
investors, customers, suppliers, regulatory authority’s employees and the general public.
On the contrary, the reports and data developed in managerial accounting are known as
specific purpose reports designed for a particular user (manager) or particular decision.
Managerial accounting uses internal reports to evaluate the performance of entities,

251
product lines, departments and managers.
(7) Historical vs. Futuristic Data: Financial accounting has a historical
orientation and records and reports what has happened. Financial accounting
concentrates on the results of past decisions. Managerial .accounting has a futuristic
orientation and concentrates on what is likely to happen in the future. This is due to
the fact that managerial accounting emphasizes on developing information for
planning, control and decision-making purposes. Therefore, managerial accounting
focuses on the future more than financial accounting.
(8) Detailed and aggregated information: Managerial accounting provides
detailed and disaggregated information about products, individual activities,
divisions, plants, operations, tasks or any other responsibility centers. On the other
hand, financial accounting focuses on the company as a whole. Sometimes, in
financial accounting, some information is given about different products or lines of
activity due to financial reporting requirements as provided in the Companies
Act/other rules and regulations.
(9) Use of disciplines: Managerial accounting uses other disciplines to prepare the most
useful reports and analyses for the managers. Some such disciplines are economics,
finance, management, information system, industrial engineering, operations research,
marketing, computer science, production management, statistics, psychology and
sociology etc. In this way, managerial accounting is much broader than financial
accounting.
Despite the above differences between managerial and financial accounting, there are
some similarities between the two accounting systems. Both managerial accounting and
financial accounting are part of the total accounting information system. Both deal with
economic events. Both try to quantify the results of economic activity and transaction.
Both are concerned with financial statements, revenues, expenses, assets, liabilities and
cash flows. The accounting information system that accumulates and classifies
information and generates financial statements is the same system used for many reports

252
and analysis which are prepared under managerial accounting. Further, the reports
prepared in management accounting and financial accountings are based on the same
databases which are originally created to fulfill the accounting and reporting
requirements of financial accounting. This is the reason that when the accounting system
in an organisation collects and classifies information, it does so in a manner and format
which can be appropriate for both the accounting systems. To achieve this dual purpose
in developing the database, many business enterprises expand this database so as to fulfill
adequately the informational needs of their managers and decision-makers. For example,
investors and other users are primarily interested in the overall profitability of a company.
However, the managers within the company are more interested in the profitability of
individual products. In this situation, the accounting system can be developed and
designed so as to provide both total company profits as well as profits for the individual
products. The vital point about the accounting system is the flexibility that is, the
accounting system should be flexible to provide different data to different persons for
different purposes.
Managerial and financial accounting are also similar with regard to determination
and measurement of costs, their assignment to different accounting periods and allocation
of costs to different departments and segments. The concepts and principles which are
used in the areas of financial accounting for the purposes of cost accumulation and cost
allocation may also be suitable for management accounting as well. It means any method,
principle or concept which are developed for financial accounting, can be used for
Preparing reports and analyses in management accounting if they are found useful for
managerial purposes.
7.6.2 COST-VOLUME-PROFIT ANALYSIS
Cost- Volume-Profit (CVP) analysis is an important tool that provides the
management with useful information for managerial planning and decision-making.
Profits of a business firm are the result of interaction of many factors. Such factors
determine whether we have profits or losses and whether profits increase or decrease over
time. Among the many factors influencing the level of profits, the following are
considered the key factors:
253
(i) Selling price
(ii) Volume of sales
(iii) Variable costs on a per unit basis
(iv) Total fixed costs and
(v) Sales mix (proportions or combinations in which different products are sold).
To do an effective job in planning and decision-making, the management must have
analyses which allow reasonably correct predictions of how profits will be affected by a
change in anyone of these factors. Also, management needs an understanding of how
revenues, costs and volumes interact in providing profits. All these analyses and
information are provided by cost-volume-profit analysis.
Cost- Volume-Profit analysis is a systematic method of examining the
relationships between selling price, total sales revenue, and volume of production,
expenses and profit. This analysis simplifies the real world conditions that a business
enterprise is likely to face. CVP analysis can play an important role by providing the
management with information regarding financial results if a specified level of activity or
volume fluctuates, information on relative profitability of its various products,
information on probable effects of changes i n selling price and other variables. Such
information can help the management improve the relationship between these variables.
For example, an analysis of sales and cost data can be helpful in determining the level of
sales volume necessary for the business to achieve a desired or target profit. Similarly,
CVP analysis may be used in setting selling prices, selecting the products mix to sell,
choosing among alternative marketing strategies and analysing the effects of cost
increase or decrease on the profitability of the business enterprise.
CVP analysis focuses on prices, revenues, volume, costs, profits and sales mix
and on the interrelationship between them during the short-run. The short-run is generally
considered a period of one year or less than one year during which the production of a
business enterprise cannot be increased and is limited to the available current operating
capacity of the enterprise. During the short-run, the capacity of the plant and machinery
cannot be increased (this is possible during the long-term only) and therefore, production
is limited in terms of available plant facilities. Similarly, it takes time to reduce the
capacity of plant and machinery and therefore, a business enterprise should operate

254
during the short-run relatively on a constant quantity of production resources. Besides, no
changes in cost and prices data can be generally made during the short-term as they might
have already been determined. During the short-run, however, some resources like
materials and unskilled labour can be increased at a short notice. Thus during the short
run, sales volume and short-run profitability can be the only vital area which may be
found uncertain. CVP analysis herein reveals the effect of changes in sales volume on the
level of profits. CVP analysis, in this. way, is an integral part of financial planning and
managerial decision-making.
In CVP analysis, all expenses are classified into fixed and variable. Semi-variable
expenses have to be divided into their fixed and variable elements. These steps are
important prerequisites to any CVP analysis and a proper understanding of them is
essential for reliable conclusions. Based upon a knowledge of fixed and variable cost
elements and CVP analysis, it is possible to determine break-even sales volume, to
compute the sales needed to generate desired profits and to supply answers to many
questions that arise in the course of management planning and decision-making.
TECHNIQUES OF CVP ANALYSIS
CVP analysis uses the following techniques or analyses while answering to many
questions in the area of managerial planning and decision-making:
(1) Contribution Margin Concept
(2) Break-Even Analysis
(3) Profit-Volume (P/ V) Analysis
CONTRIBUTION MARGIN CONCEPT
Contribution margin concept indicates the profit potential of a business enterprise
and also highlights the relationship between cost, sales and profit. It is a highly useful
technique for planning and decision making by the management.
Contribution margin is the excess of sales revenue over variable costs and
expenses. Under contribution margin concept, variable costs include all variable costs, i.e.
variable production costs and variable selling and administrative expenses, if any. From
the contribution margin, fixed costs and expenses are deducted giving finally operating

255
income or loss. Contribution margin is thus used to recover/cover fixed costs. Once the
fixed costs are covered, any remaining contribution margin adds directly to the operating
income of the firm. Contribution Margin Ratio (Also known as CIS ratio or P/V ratio)
The contribution margin can also be expressed in the form of a percentage. The
contribution margin ratio is also known as 'contribution to sales' (C/S) ratio or profit-
volume (PN) ratio. This ratio denotes the percentage of each sales rupee available to
cover the fixed costs and to provide operating income to a firm. Taking an example,
assume the following information in case of a company.
Sales 1, 00,000
Variable Costs 60,000
Fixed Costs 30,000
In this case, contribution margin is Rs. 40,000; profit Rs. 10,000 and contribution margin
is 40% as shown by the following computation:
(i) Sales 1, 00,000
Variable costs 60,000
Contribution margin 40,000
Fixed Costs 30,000
Profit Rs. 10,000
(ii) Contribution Margin Ration (or C/S or P/V Ration)
= Sales –Variable Costs
Sales
= Rs. 1, 00,000 – Rs 60,000
Rs.1, 00,000
= Rs.40, 000 = 40 %
Rs.1, 00,000
The P/V ratio helps in knowing the effect on income of a firm due to increase or
decrease in sales volume. For instance, in the above example, a business enterprise may

256
be interested in studying the effect of having additional sales of Rs. 40,000 on the income
of the firm. Multiplying the P/V ratio (40%) by the change in sales volume (Rs. 40,000)
indicates an increase in operating income by Rs. 16,000 if additional sales are possible.
The total income will be Rs. 26,000 as is clear from the following computation:
(Rs.)
Sales 1, 40,000
Less: Variable costs (Rs. 1, 40,000 x 60%) 84,000
Contribution margin 56,000
(Rs. 1, 40,000 x 40%)
Less: Fixed costs 30,000
Net Income 26,000
In the above example, variable costs as percentage are 60% of sales (l00 - P/V
ratio which is 40%). Thus, variable costs, as a percentage of sales are always equal to
100% minus the P/V ratio.
The P/V ratio is useful to the management in deciding whether to increase sales
volume. For example, if the P/V ratio of a business enterprise is large and the enterprise
is operating at less than 100% capacity, it will be advantageous for the firm to go for
increase in sales volume as net income will go up because of higher sales volume. On the
other hand, a firm with a small P/V ratio will not find profitable to have increase- in sales
volume much profitable. Infact, enterprises having a lower P/V ratio should aim at
reducing costs and expenses before thinking of increasing the sales volume.
The use of P/V ratio in specific analysis is based on the assumption that except sales
volume, other factors such as the unit selling price, percentage of variable cost to sales,
amount of fixed costs remain constant. If there are changes in any of these factors, the
effect of such change should be considered in making the analysis involving the P/V
ratio.
UNIT CONTRIBUTION MARGIN
Unit contribution margin or contribution margin on per unit basis is equally
useful as it also indicates the profit potential of a product or activity. The unit

257
contribution margin is the money available from sale of each unit to cover fixed costs and
provide profits to a firm. For example, if selling price of a company's product is Rs. 10
and variable costs per unit Rs. 6, the unit contribution margin will be Rs. 4 (Rs. 10 Rs. 6).
While the P/V ratio is most useful when the increase or decrease in sales volume
is measured in terms of Rupees, the unit contribution margin is most useful when
increase or decrease in sales volume is measured in sales unit (quantities). If a business
firm has been able to cover fixed costs, the net income of the firm will increase by unit
contribution margin multiplied by additional sales units.
7.6.3 BREAK-EVEN ANALYSIS
A break-even analysis is performed to identify the level of operations at which the
.entity has covered all costs but has not yet earned any profit. The break-even point
identifies the volume of activity at which total revenues equal total costs. This is an
important point to the management because it represents a minimum acceptable level of
operations and it indicates that profitable operations can only result when the level of
activity exceeds the break-even point.
Break-even Analysis in Units
Break even analysis utilizes the contribution margin approach to compute net income,
which splits costs into a fixed and variable classification. The break-even point in units
can be computed by dividing total fixed costs (F) by the contribution margin provided
by each unit.
Break-even in units = Total fixed costs = FC
Contribution margin per unit S-VC
The contribution margin per unit is sales price per unit (S) less variable cost per
unit (VC). An example will illustrate the use of this formula.
Example
SAX manufactures and sells one type of calculator called Model Q. Model Q sells for Rs.
400, and the variable expenses associated with it are Rs. 200 for manufacturing and Rs.

258
50 for selling. Fixed costs are Rs. 7, 50,000 for manufacturing and Rs. 1, 50.000 for
selling and administration. How many units must be produced and sold in order to break-
even?
Solutions:
Break-even point in units =
Fixed Cost_______________
Sale price per unit – Variable cost per unit
= Rs.9, 00,000 _ = 6,000 units
Rs.400 –Rs 2.50
When the price exceeds the variable cost, as in the example above, each unit contributes
something (Rs. 150) toward, covering fixed costs and providing a profit. The break-even
point has been reached as soon as the cumulative amount of the contribution margin
(6,000 x Rs. 150) equals the total fixed costs (Rs. 9, 00,000).
BREAK-EVEN CHARTS
A break-even chart is a graphical representation of the relationships between costs,
revenues and profits. It is developed by plotting the total cost curve and total revenue
curve on a piece of graph paper. The above example has been used to illustrate the
construction. The revenue and cost curves are:
Revenue = Rs. 400 (per unit)
Cost = Rs. 90, 0000 fixed costs + Rs. 250 (per unit variable costs)
The break-even point is the point at which the total revenue curve intersects the total cost
curve. Sales above this level will provide a profit, while sales below this level will result
in a loss. The amount of the profit or loss is shown by the vertical distance between the
total revenue and total cost curves.
BREAK-EVEN ANALYSIS IN SALES RUPEES

259
The concept of the break-even point does not change when the analysis is performed in
sales rupees. The break-even point merely identifies the amount of sales rupees required
to cover all costs but generates no profit.
Equation for Break-even point in Sales Rupees: One method of computing break-even in
sales rupees is to compute break-even in units and multiply the number of units by the
sales price per unit. However, sometimes it may not be convenient or efficient because of
the way the data is given to first compute the break-even point in units. The break-even
point in sales rupees equal to fixed costs divided by the contribution margin ratio.
Break-even point in sales Rupees =
Fixed Costs____
Contribution margin ratio
For an amount of desired profit, the following formula is used:
Fixed costs + Desired Profit
- Contribution Margin Ratio (CIS Ratio)
By definition, the contribution margin ratio is the ratio of the contribution margin to
sales. The Contribution margin is the sale price minus variable costs and the ratio is
computed by dividing contribution margin by the sales price.
Contribution margin ratio = Sales price per unit - Variable cost per unit
Sales price per unit
OR
Contribution margin ratio = Total sales - Total Variable Costs
Total Sales
Example
All time company manufactures and sells a watch at Rs. 250. Variable costs are Rs.
200 per unit and fixed costs total Rs, 100,000 per year. What is the required sales revenue
for the company to break-even? The contribution margin ratio is first computed and then
divided into the total fixed costs.
Solution:
Contribution margin ratio = Rs, 250- Rs, 200

260
Rs.250 =20%
Break-even point in sales Rs. = 1, 00,000 = Rs. 5, 00,000
20%
BREAK-EVEN ANALYSIS FOR MULTIPLE PRODUCTS
The analysis so far has assumed that only one product was being produced and sold,
which is not very realistic for most companies. Break-even analysis can still be
performed in case of multiple products using either units of production or sales rupees by
assuming that the company's sales mix will remain constant. Sales mix refers to the ratio
or relative combination of each product's sales to total sales. It is the composition of total
sales broken down among various products or product lines.
Example
Multi Products Company has three products labeled Model X, Model Y and Model
Z. Sales on a monthly basis are expected to be as follows:
Model X Model Y Model Z Total
Units 1,000 1,500 2,500 5,000
Sales Ratio 20% 30% 50% 100%
Product mix is usually stated in a ratio, such as (2: 3: 5) for models X, Y and Z
respectively. This means that for every 2 units of Model X that are sold, there are 3 units
of model Y and 5 units of model Z. Another way of viewing sales mix is to consider a
market basket that represents the average expected sales of a company. Within that
basket, representing .one product mix, multi products would have 2 units of model X, 3
units of model Y and 5 units of model Z, for a total of 10 units.
Break-even Analysis in Units for Multiple Products
A market basket approach is used to compute a break-even point in units. A market
basket representing the average sales mix is developed. The contribution margin provided
by the basket is used to compute the number of baskets that must be sold to break-even.

261
The number of individual products required to fill the baskets at the break-even point is
then determined
Example:
Multi Products Company has a sales ratio of 2: 3: 5 for models X, Y and Z
respectively. Total fixed costs for the year are Rs. 200,000. The sales price, variable
costs and contribution margin associated with each product are as follows:
Model X Model y Model Z
Sales price Rs. 50 Rs.25 Rs.10
Variable costs 30 15 8
Contribution margin Rs.20 Rs.10 Rs.2
Solution:
The average market basket is based on the sales ratio and consists of 10 units with a total
contribution margin of Rs. 80 (2 x Rs. 20) + (3 x Rs. 10) + (5 x Rs. 2). The break-even
point in market baskets is computed using the formula for break-even point in units.
X = Rs.200, 000 = 2500 baskets
Rs.80
In order to fill 2,500 baskets, it will take the following amounts for each model.
Model X 5,000 units (2,500 x 2)
Model Y 7,500 units (2,500 x 3)
Model Z 12,500 units (2,500 x 5)
This, then, is the break-even point in units as long as the sales mix stays at 2: 3: 5.
Break-even Analysis in Sales for Multiple Products
The break-even point in sales for a multiple product entity can be computed by using
an average contribution margin ratio. The average contribution margin ratio can be
computed on a per unit basis or it can be developed from the income statement. In both
cases, the fixed costs are divided by the average contribution margin ratio. The difference
is in the level of aggregation in computing the average contribution margin ratio.
When the average contribution margin ratio is computed on a unit basis, the average

262
unit sale price is divided into the average unit contribution margin.
Example:
Using the data above for Multi Products Company, the average sale price is
computed by multiplying the sales ratio by the sale price for individual products and
totaling the results. The average contribution margin is computed in a similar manner and
the contribution margin ratio is the average contribution margin divided by the average
sale price.
Average sale price = (20% x Rs. 50) + (30% x Rs. 25) + (50% x Rs. 10)
= Rs. 22.50
Average contribution margin =
(20% x Rs. 20) + (30% x Rs. 10) + (50% x Rs. 2) = Rs. 8.00
Average contribution margin ratio
(Rs. 8.00 -:- Rs. 22.50) x 100 = 35.555%
Break-even point in sales
Rs. 20,000 = Rs.5, 62,500 per year
35.555 %
Example
ABC Company has twenty products and the contents of an average market basket are not
known. They reported the following net income for January, 1999. The sales mix and
costs for January are expected to continue throughout the coming year. Management was
disappointed with the results and wants to know the sales level required to break-even.
Rs.
Sales 1, 20,000 100%
Variable costs 90,000 75%
Contribution margin 30,000
Fixed costs 40,000
Net income (loss) (10,000)

263
Solution:
The average contribution ratio is 25% (Rs. 30,000/Rs. 120,000) and the break-even points
in sales are Rs. 160,000 (Rs. 40,000/25%). Assuming the product mix and costs remain
the same as in January, ABC Company must sell Rs. 160,000 per month to break-even.
Break-even analysis in sales is generally easier to compute than break-even analysis in
units for multiple product entities because it does not require knowledge of the product
mix and the average market basket. A contribution margin ratio can be developed from
the income statement for use in the break-even analysis.
Margin of Safety
The margin of safety is the difference between budgeted (or actual) sales and break-even
sales, expressed as a percentage of budgeted sales. In equation form:
%Margin of safety = Budgeted (or actual) sales - break even sales
Budgeted sales
Assume in a company the actual sales are Rs. 60,000 and break-even sales are Rs.
48,000. Then the margin of safety is:
= 60,000 – 48,000 x 100 % = 20 %
60,000
This means that if sales volume is 20% less than the actual sales volume, the firm
would just breakeven. Managers use the margin of safety as an indication of the risk
inherent in a particular sales goal. The simple presumption is that the greater the margin
of safety, the lower the risk.
7.6.4 PROFIT-VOLUME GRAPH
A P/V graph is used in place of or along with a break-even chart. Profit and losses
are given on a vertical scale and units of products, sales revenue or percentage of activity
are given on a horizontal line. The horizontal line is drawn on the graph to separate profit
from losses. The profit and losses at various sales levels are plotted and connected by the
profit line. The break-even point is measured at the point where the profit line intersects

264
the horizontal line. P/V graph focuses entirely on the relationship between volume and
profit. A P/V graph is more useful than the break-even chart because it shows the profit
or loss directly rather than as the difference between the revenue and cost curves.
However, the P/V graph does not clearly show how costs vary with activity.
Example
Selling price per unit Rs. 40
Variable cost per unit Rs. 25
Total fixed costs Rs. 90,000
The total fixed expenses and break-even point can be used to construct the profit
volume graph. The total fixed expenses of Rs. 90,000 represent a Rs. 90,000 loss at zero
sales volume. The break-even point represents the unit sales volume at which there is no
loss and no profit-(zero profits). As you can see, the profit line begins where the fixed
expenses is shown as a loss on the vertical axis and moves upward and to the right at a
rate equal to the contribution margin per unit, Rs. 15 per unit. The contribution margin
per unit is the slope 9f the profit line. The steeper the slope/starting at the same fixed
expenses of the profit line, the lower the break-even point.
Significance of Fixed Costs on Break-Even Point
The greater the fixed expenses, the higher will be the break-even point. In the short
run, fixed costs cannot be immediately reduced to meet declining customer demands.
Certain fixed costs remain fairly constant, such as taxes, insurance, rent or lease costs,
depreciation, security and certain aspects of administration (accounting, supervision, and
marketing). Most of the fixed costs are essential in order to maintain the facilities and
environment of the organization. As sales revenue decreases and fixed costs remain fairly
constant, the earnings will naturally decline accordingly because of the fixed cost impact.
It is only logical to assume that an organization with greater fixed expenses must have
larger sales revenues to break even. If sales revenue increases, however, the organization
can increase its earnings position because the increased profit will more than offset the
fixed costs needs.

265
ASSUMPTIONS IN BREAK-EVEN ANALYSIS
The following are the important assumptions in break-even analysis and break-even
charts.
1. The total revenues of the enterprise change in direct proportion to changes in unit
sales volume.
2. This is the same as assuming that the average selling price is constant.
3. The total expenses can be separated into variable expenses and fixed expenses per
year.
4. The total variable expenses vary in direct proportion to changes in sales volume. This
is the same as assuming the variable expense per unit is constant.
5. The total fixed expenses, within a relevant range of volume, do not change as sales
volume changes.
6. For a multi-product firm, the sales mix remain constant for all volume levels under
consideration.
7. Production volume and sales volume are equal; in other words, inventory changes do
no effect profit.
ADVANTAGES OF BREAK-EVEN ANALYSIS
• Break-even analysis provides a useful tool in demonstrating the relationship and
interaction of cost, volume, and profit. If properly utilized, it aids in establishing
realistic profit objectives and operating budgets.
• It provides management with distinctive insight into the economic characteristics
of its business, not only in terms of the fixed and variable expenses at varying
sales volumes, but also of the break-even relationship and its effect on the firm
due to changes in factors likely to have impact on the profit of a business
enterprise.
• The Manager can advantageously employ 'what if' question to determine the
anticipated results from contemplated managerial decisions. The break-even
process may involve such planning questions as plant expansion,” equipment
modernization, change in product mix or sales prices and the introduction of
new product lines.

266
• Management is often confronted with the decision to increase sales volume with
an optimistic view towards enhancing profit. Profit enhancing is a possibility,
provided costs are controlled within prescribed limits. The break-even technique
can be an important tool in establishing expenditure constraints and control by
adequate supervision.
• An important influence on profit is the product sales mix with variable gross
margins. The breakeven chart can highlight problem areas requiring connective
management action.
DISADVANTAGES OF BREAK-EVEN ANALYSIS
• Break-even analysis is not a remedy for all problems faced by a business firm. It
cannot be used usefully without a thorough understanding of its concept and
limitations.
• The break-even chart generally reflects a number of estimates and judgments, and
the resultant data developed and their implication can be misleading. For
example, measuring costs and sales volume at a particular output level may be an
inaccurate method of assessment, particularly when the volume approaches the
break-even point, which can change depending on operating circumstances.
• Usually, the break-even is developed at a point that represents a static position.
Changes in relationship factors should be conectly and logically reflected in a
revised chart or a series of charts.
• The improper understanding and usage of the charts can lead to inadequate
decision making, inaccurate planning assumptions and possibly detrimental
control actions.
• Fixed and variable expenses may be inaccurately segregated with the resultant
effect on the break even position. Plotting sales as a function of production
volume can be misleading, the assumption that sales equals production may not
necessarily be true because of the build up or reduction of stocks of varying
business cycles. Extreme care is needed in compiling homogenous and
compatible data for the break-even analysis.)

267
7.7 BUDGETARY CONTROL
One of the primary objectives of management accounting is to provide information
to the management for planning and control. Budgeting acts as a tool of both planning
and control. Budgeting is formal process of financial planning using estimated financial
and accounting data. The Institute of cost and Management Accountants (UK) define a
budget as "a financial and/or quantitative statemetment prepared and approved prior to
a defined period of time, of the policy to be pursued during that period for purpose of
attaining a given objective. It may include income, expenditure and the employment of
capital.” The National Association of Accountants (USA) defines budgeting as "the
process of planning all flows of financial resources into, within, and from an entity
during some specified future period".
BUDGETING AND FORECASTING
Sometimes the terms 'budgeting' and 'forecasting' are used interchangeably. Both
terms have some similarities. For example, both relate to future events and involve
prediction of something. The basic difference between budgeting and forecasting lies in
degree of sophistication involved in the predictions used by them. According to the
National Association of Accountants (USA), "forecasting is a process of predicting or
estimating a future happening ". Forecasting is an essential part of the budgeting process.
It pertains to estimating future events and their effects on the budget. It comes to an end
after mere estimating. Budgeting is a process of preparing budgets and further control
aspects are involved in its procedure Besides, forecasting can be made by a business for
purposes other than budgeting, such as a forecast of .general business conditions. Such
forecasts are sometimes not used in budgeting.
CONCEPT OF BUDGETARY CONTROL
Budgetary control is a control measure in which the actual state of affairs is
compared with the budget so that appropriate action may be taken with regard to any
deviations before it is too late. Budgeting is thus merely a part of budgetary control. The
Institute of Cost and Management Accountants (UK) defines budgetary controls as "the
establishment of budgets relating the responsibilities of executives to the requirements

268
of a policy and the continuous comparison of actual with budgeted results either to
secure by individual action the objective of that policy or to provide a basis for its
revision." Briefly, the use of a budget to control a firm’s activities is known as
budgetary control. Budgetary control has the following main objectives.
1. To provide an organized procedure for planning. It provides a detailed plan of action
for a business over a definite period of time,
2. To coordinate all the activities of various departments of a business firm in such a
manner that the maximum profit will be achieved for the minimum use of resources.
3. To provide means of determining the responsibility for all deviations from the plan
(Budget), and to supply information on the basis of which necessary corrective
action may be taken. Thus budgetary control has the objective of controlling cost.
BUDGET PERIOD
The budget period is an important factor in developing comprehensive budgeting
programmes. This is the period for which forecasts can reasonably be made and budgets
can be formulated. The length of the budget period depends on the type of business, the
length of the manufacturing cycle from raw materials, finished products, the ease or
difficulty of forecasting future market conditions and other factors. However, a business
enterprise generally prepares a short-range budget and a long-range budget.
Short – Range Budget
Short-range budget may cover periods of three, six or twelve months depending upon the
nature of the business. Most manufacturing firms use one year as the planning period.
Wholesale and retail firms usually employ a six-month budget which is related to their
selling seasons. In determining the period of the short-range budget, the following factors
should be considered:
o The budget period should be long enough to cover complete production of various
products.
o For business of a seasonal nature, the budget period should cover at least one entire
seasonal cycle.

269
o The budget period should be long enough to allow for the financing of production
well in advance of actual needs. It should provide adequate time to arrange the
funds for production and other purposes.
o The budget period should coincide with the financial accounting period to compare
actual results with budget estimates and thus to facilitate better interpretation of the
performances.
Long-range Budget
A long-range budget or planning is defined as a systematic and formalized process
for purposefully directing and controlling future operations towards a desired objective
for periods extending beyond one year. Long-range budgets or plans are neither described
in precise terms, nor are they expected to be completely coordinated future budgets. They
cover specific areas such as, future sales, future production, long-term capital
expenditures, extensive research and development programmes, financial requirements
and profit forecast. They evaluate the future implications associated with present
decisions and help the management in making present decisions and select the most
profitable alternative. Long-range budgeting does not eliminate risk altogether; it only
reduces the risk to a level which does not hamper the production and achievement of
company objectives. A business enterprise through budgeting is prompted to take a
greater but manageable risk.
7.7.1 FIXED AND FLEXIBLE BUDGETING
Fixed Budgeting
The Institute of Costs and Management Accountants (UK) defines a fixed budget as the
budget which is designed to remain unchanged irrespective of the level of activity
actually attained. It is based on a single level of activity. A fixed budget performance
report compares data from actual operations with the single level of activity reflected in
the budget. It is based on the assumption that the company will work at some specified

270
level of activity and that a stated production will be achieved. It suggests that the budget
is not adjusted. It acts as a target for the forthcoming period. It represents a point fixed in
advance with which actual results are compared. Fixed budgets do not change when
production level changes.
However, in practice, fixed budgeting is rarely used. The main reason is that
actual output is often significantly different from the budgeted output. In such a case, the
budget cannot be used for the purpose of cost control. The performance report may be
misleading and will not contain very useful information. For example, if actual
production is 12,000 units in place of the budgeted 10,000 units, the costs incurred cannot
be compared with the budget which relates to different levels of activity. Since, in fixed
budgeting, units are overlooked, a cost to cost comparison without considering the units
may give misleading results, the performance report prepared under fixed budgeting
merely discloses whether actual costs were higher or lower than budgeted costs.
Therefore, the fixed budget is unable to provide useful information when actual output
differs significantly from expected or budgeted output. The fact that costs and expenses
are affected by fluctuations in volume limits the use of the fixed budget. If budgeted costs
are compared with the actual costs at the end of the year, it will be difficult to infer how
successful a business firm has been in keeping expenses within the allowed limits.
Clearly, the idea of comparing performance at one activity level with a plan that was
developed at some other activity level is nonsense from the viewpoint of judging how
efficiently the manager has produced any given output.
Flexible Budgeting
A flexible budget is defined in the terminology of cost accounting, issued by the Institute
of Cost and Management Association (UK) as "a budget which by recognizing the
difference between fixed, semi-fixed and variable costs, is designed to change in relation
to the level of activity attained."
A flexible budget is a budget that is prepared for a range, i.e. for more than one level of
activity. It is a set of alternative budgets to different expected levels of activity. The

271
flexible budget is also known by other names, such as variable budget, dynamic budget,
sliding scale budget, step budget, expenses formula budget and expenses control budget.
The underlying principle of a flexible budget is that every business is dynamic, ever-
changing and never static. Thus, a flexible budget might be developed that would apply
to a 'relevant range' of production, say 8,000 units to 12,000 units. Under this approach, if
actual production slips to 9,000 units from a projected 10,000 units, the manager has a
specific tool (i.e. the flexible budget) that can be used to determine budgeted cost at 9,000
units of output. The flexible budget provides a reliable basis for comparisons because it is
automatically geared to changes in a production activity.
A flexible budget provides information to managers for multiple levels of output in case
actual output is different from the expected level. The performance reports at the end of
the accounting period are compared with a budget based on the actual output attained
during the period. A flexible budget has the following important features:
(1) It covers a range of activity (output).
(2) It is flexible, i.e. easy to change with variation in production levels.
(3) It facilitates performance measurement and evaluation.
Steps in Flexible Budgeting
The following steps (stages) are involved in developing a flexible budget:
1. Decide the range of activity to which the budget is to be prepared.
2. Determining the cost behavior patterns (fixed, variable, semi-variable) for each
element of cost to be included in the budget.
3. Selecting the activity levels (generally in terms of production) to prepare budgets at
those levels.
4. Preparing the budget at each activity level selected by associating the activity level
with corresponding costs. The corresponding costs to be attached with each activity
level are determined in terms of their behavior, i.e. fixed, variable and semi-
variable.)
7.7.2 TYPES OF BUDGETS

272
Budgets are the end product of the budgeting process. The numbers and types of budgets
in a business enterprise depend on the size and nature of the business. However, in a
manufacturing concern, the following budgets are generally prepared:
(A) Operating and Functional Budgets:
1. Sales budget
2. Production budget
3. Production cost budget
a. Direct materials budget
b. Direct labour budget
c. Factory overhead budget
4. Ending inventories budget
5. Cost of goods sold budget
6. Selling expense budget
7. Administrative expense budget
8. Budgeted income statement
(B) Financial Budgets
a. Capital expenditure budget
b. Research and development budget
c. Cash budget
d. Budgeted balance sheet
e. Budgeted statement of changes in financial position
Sales Budget
The most important budget, which all other budgets are contingent upon, is the sales
budget. All budgets, such as production budget, inventory budget, personnel budget,
administration budget, selling and distribution budget and others are all affected by the
sales budget and are dependent upon the revenue derived from sales. Therefore, the sales
budget is the starting point in preparing other functional budgets. Developing a sales
budget requires forecasting future sales levels. Figure 27.1 presents a specimen of a sales
budget.
ABC Company Ltd.

273
Table. 7.20 Sales Budget for the Year Ending December 31, 1999 Products Budgeted Budgeted sales price Total
sales units (Rs.) (Rs.) A 70,000 80,000 56,00,000 B 80,000 1,20,000 96,00,000 1,50,000 1,52,00,000
Production Budget
After preparing the sales budget, the production budget is prepared. A production
budget is stated in physical units. It specifies the number of units of each product that
must be produced to satisfy the sales forecasts and to achieve the desired level of closing
finished goods inventory. Essentially, the production budget is the sales budget adjusted
for inventory changes as follows:
Units to produce = Budgeted sales + Desired closing inventory of finished goods -
Beginning inventory of finished goods.
A specimen production budget is given in Fig. 27.2.
ABC Company
Table.7.21 Total Production Budget for the Month of December, 1999
Products A B Budgeted sales (units) 70,000 80,000
Add: Desired closing finished goods inventory 20,000 30,000 90,000 1,10,000 Less: Beginning finished goods inventory 40,000 50,000 Units to be produced 50,000 60,000
The production budget deals with the scheduling of operations, the determination of
volume and the establishment of maximum and minimum quantities of raw materials and
finished goods inventory. Its summaries and details provide the basis for preparing the
budgets of materials, labour and factory overheads.
Production Cost Budget
A production cost budget summaries the materials budget, labour budget, the
factory overhead budget and may be expressed and analysed by departments and/or

274
products. A production cost budget, also known as a manufacturing budget is made up of
three budgets: (i) materials, (ii) labour and (iii) factory overhead.
Direct Materials Budget
A direct materials budget indicates the expected amount of direct materials required
to produce the budgeted units of finished goods. This budget specifies the cost of direct
materials used and the cost of the direct materials purchased. Figure 27.3 explains the
calculation of the net direct materials budget. The usage part of the direct materials
budget determines the cost of purchases of direct materials.
ABC Company
Table. 7.22 Direct Materials Budget for the Year Ending December, 1999
A. Usage Budget Products
A B Talal
Budgeted production in units 50.000 60,000 Direct materials requirements Product A 5 kg per unit x 5 Product B 8 per unit x 8
Direct materials usage (kg) 2,50,000 4,80,000 Cost per kg Rs. 1.00 1.50
Cost of direct materials used Rs. 2,50,000 Rs. 7,20,000 Rs. 9,70.000 B. Purchase Budget Direct Materials (in kg) Total A B
Direct material usage 2,50.000 4,80,000
Budgeted closing direct materials
inventory + 50,000 + 75,000
Total requirements 3,00,000 5,55,000 Beginning direct materials inventory 70,000 1,00,000
Purchase of direct materials 2,30,000 4,55,000
Cost per kg. x Rs. 1.00 x Rs. 1.50
Cost of purchase Rs. 2,30,000 Rs. 6,82,000 Rs. 9,12,000
The direct materials budget is useful in the following ways:

275
(1) It helps the purchasing department to prepare a schedule to ensure delivery of
materials when needed.
(2) It helps in fixing minimum and maximum levels of inventories in the stores
department.
(3) It helps the finance manager to determine the financial requirements to meet
production targets.
The materials budget usually deals with direct materials only. Supplies and indirect
materials are generally included in the factory overhead budget.
Direct Labour Budget
The labour budget estimates the labour, adequate in number and grades, to enable
the production budget to be achieved. It is generally preferable to prepare a separate
direct labour budget and to include indirect labour in the factory overhead budget. The
labour budget for direct and indirect labour helps the personnel or employment
department in determining the number and types of workers needed. If additional workers
are not needed, the task of the personnel department is easy. However, when workers are
to be recruited, the personnel department has to make plans in advance.
ABC Company
Direct Labour Budget for the Year Ending December, 1999
Products
A B Total
Budgeted production requirements 50,000 60,000
Direct labour hours per unit 3 2
Total direct labour hours 1, 50,000 1, 20,000 2, 70,000
Direct labour cost per hour Rs.5, 00 Rs.5.00
Total direct labour cost (Rs) 7, 50,000 6, 00,000 13, 50,000
Factory Overhead Budget
The factory overhead budget is prepared on the basis of the chart of accounts
which reflects different expenses accounts and which properly classifies expense
accounts and details of the cost centers or departments. Although expenses can be

276
classified in a different manner such as natural classification and variability, the
preparation of the factory overhead budget requires that expenses should be classified by
departments since expenses are incurred by various departments. In this way,
departmental heads should be held accountable for expenses incurred by their
departments. Generally, the department heads prepare budgets for their respective
departments for the budget period. However, they need considerable help and advice
from the budget director in order to achieve production budget. After review by the
budget committee, the departmental managers are asked to review and comment on any
revisions before the budget is made final.
The following depicts the factory overhead budget wherein overhead costs have
been classified into fixed and variable components.
ABC Company Factory Overhead Budget for the Year Ending December, 1999
(Based on budgeted capacity of 2, 70,000 direct labour hours) Items Direct labour Rate per direct Total cost Hours (Rs.) labour hour (Rs) A. Variable factory overhead: (i) Suppliers 2, 70,000 1.00 2, 70,000 (ii) Repairs 2, 70,000 0.50 1, 35,000 (iii)Indirect 2, 70,000 1.00 2, 70,000 (iv)Others 2, 70,000 0.40 1, 08,000 Total variable factory overhead cost 7, 83,000 B. Fixed factory overhead cost: (i) Super vision 4, 00,000 (ii) Depreciation 5, 50,000 (iii)Property tax 2, 50,000 (iv) Others 1, 77,000 Total fixed factory overhead cost 13, 77,000 Total factory overhead cost 21, 60,000 Predetermined overhead rate = Rs.21, 60,000

277
2, 70,000 hours = 8.00 per labour hour Ending Inventories Budget
An inventory budget can be prepared to find out the values of direct materials and
finished goods inventory as shown below
ABC Company
Ending Inventory Budget for the Year Ending December, 1999 Rs. Direct materials inventory Product A 50,000 kg x Rs.1.00 per kg 50,000 Product B 75,000 kg x Rs.1.50 per kg 1, 12,000 1, 62,500 Finished goods inventory Product A 20,000 kg x Rs.25.00 5, 00,000 Product B 30,000 kg x Rs.30.00 9, 00,000 14, 00,000
Cost of Goods sold Budget
After preparing direct materials, direct labour, factory overhead and ending
inventory budgets, the cost of goods sold budget can be prepared. The cost of goods sold
budget summaries the entire above budget as show in below
ABC Company
Cost of Goods sold Budget for the Year Ending December, 1999
Direct materials Rs Rs
Beginning inventory 2, 00,000
Purchases 9, 12,500
11, 12,500
Less: Closing inventory 1, 62,500
Cost of direct materials used 9, 50,000
Direct labour 13, 50,000
Factory overhead 21, 60,000

278
Total factory cost 44, 60,000
Beginning finished goods inventory 25, 00,000
Total goods available for sale 69, 60,000
Closing finished goods inventory 14, 00,000
Cost of goods sold 55, 60,000
Selling Expenses Budget
Closely related with the sales budget is the selling and distribution cost budget
which shows the budget costs of promoting sales for the budget period. It is also known
as the marketing expense budget. The selling cost budget is made up of a number of cost
items, some of which are fixed and some variable. The principal fixed expenses are
salaries and depreciation; the principal variable expenses are commissions, travel,
advertising and bad debts. The variable expenses vary directly with sales. A selling
expense budget consists mainly of the following major items:
1. Sales representative (salaries, commissions, entertaining and traveling)
2. Sales office (office supplies, salaries, postage, telephone, rent and rates).
3. Publicity office (salaries, office costs, press, journals, televisions, cinema,
samples, sundries). (4) Warehousing, packing and dispatch (salaries, packing
wages, drivers' wages, vehicle costs, Sundries).
The following explain an annual selling expense budget classified according to fixed
and variable expenses. The annual budget should be broken down on a monthly basis so
that actual expenses can be compared with the budget monthly. Also, separate budgets
for each of these expenses may be prepared especially in the case of a large company.
ABC Company
Selling Expenses Budget for the Year Ending December 31, 1999
Items Cost (Rs.) Total cost (Rs.)
(A) Variable selling expense
(i) Sales Commission 35,000

279
(ii) Salary and wages 40,000
(iii) Advertising 15,000
(iv) Traveling 22,000 1, 12,000
(B) Total variable selling expenses
(i) Warehousing 60,000
(ii) Advertising 30,000
(iii) Marketing Manger’s salary 60,000
(iv) Depreciation 27,000 1, 77,000
Total selling expenses 2, 89,000
Administrative Expense Budget
The administrative expense budget covers the administrative costs for non-manufacturing
business activities. Budgeting administrative expense is often difficult. Perhaps the first
difficulty is in classifying certain costs as production or administrative. For example,
costs like purchasing, engineering, personnel, research and development can be
administrative as well as production. Unless such and other expenses are properly
classified, their proper budgeting and subsequent control cannot be exercised. The second
difficulty is in determining persons responsible for the incurrence and control of these
costs. However, in order to accomplish the purpose of cost control in cost accounting, it
is necessary that each item of cost -should be under the jurisdiction and control of a
responsible person who is accountable for incurring the cost.
ABC Company
Administrative Expense Budget for the Year Ending December 31, 1999
Items Amount (Rs.) Amount (Rs)
(A) Variable administrative expenses
(i) Supplies 35,000
(ii) Clerical wages 60,000

280
Total variable administrative expenses 95,000
(B) Fixed administrative expenses
Directors remuneration 1,20,000
(i) Legal charges 20,000
(ii) Depreciation 25,000
(iii) Salaries 30,000
(iv) Rent 60,000
(v) Postage, telephone etc 32,000
Total fixed administrative 2, 87,000
Total administrative expense 3, 82,000
Budget Income Statement
Budgeted income statement summaries all the individual budgets, i.e. sales budget, cost
of goods sold budget, selling budget and administrative expense budget. No new
estimates are made; figures are taken from budgets previously prepared. This budget
determines income before taxes. If the tax rate is available, net income after taxes can
also be computed. The following exhibits a budgeted or project income statement.
ABC Company
Budgeted Income Statement for the Year Ending December, 1999
Rs
Sales 1, 52, 00,000
Cost of goods sold 55, 00,000
Gross Margin 96, 40,000
Selling expenses 2, 89,000
Administrative expenses 3, 82,000
6, 71,000
Income before taxes 89, 69,000
Income taxes (assuming 50%) 44, 84,500
Net Income 44, 84,500

281
Capital Expenditure Budget
The budgeting of capital expenditure is one of the most important areas of managerial
decisions. Large sums of money and long period of time are often involved in this budget
which therefore requires utmost care and sound judgment. Capital expenditures represent
long-term commitments. Also, the benefits of capital expenditure spread over a long
period of time. Generally, capital expenditures are relatively large in comparison with
operating expenditures and have a long-term impact on the organisation and the business
firm. The capital expenditure budget aims at minimizing errors while making capital
expenditure decisions.
Capital expenditure budgets are prepared for both short and long-range projects
depending on the requirements of the business firm. Short-range projects are
implemented during the current accounting period; therefore, these provisions should be
made in the current budget. Long-range projects are not executed in the current period;
they are expressed only in general terms. They become budget commitments only when
the time for their implementation approaches.
Cash Budgets
A cash budget contains detailed estimates of cash receipts' (cash inflows) and
disbursement (cash outflows) for the budget period or some other specific period. Cash
budgeting is extremely important since business operations require adequate cash to
acquire materials and meet various expense and loan obligations. Therefore, planning
cash flow is very useful for all types of organizations. The preparation of a cash budget
has the following objectives:
o It indicates the effect on the cash position of seasonal requirements, large
inventories, unusual receipts and slowness in collecting receivables.
o It indicates the cash requirements needed for a plant or equipment
expansion programme.
o It points the need for additional funds from sources such as bank or sale of

282
securities and the time factors involved. In this connection, it might also
exert a cautionary influence on plans for plant expansion leading to a
modification of capital expenditure decisions.
o It indicates the availability of cash for taking advantage of discounts.
o It assists in planning the financial requirements of bond retirements,
income tax installments and payments to pension and retirement funds.
o It shows the availability of excess funds for short-term or long-term
investments.
Budgeted or Projected Balance Sheet
A projected balance sheet represents the expected financial position at a particular date.
The projected balance sheet is prepared from the budgeted balance sheet at the beginning
of the budget period and the expected changes in the account balances reflected in the
operating budgets, capital expenditure budgets and cash budget. If any of the accounts or
relationships among the accounts appearing on the projected balance sheet are not
according to the management’s requirements and objectives, the operating plan might
have to be changed. For example, if a bank or financial institution requires a business
firm to maintain a certain minimum current ratio and debt-equity ratio, the operating plan
would have to be changed if these ratios are indeed too low. Furthermore, unfavorable
ratios may decrease the value of company shares in the stock exchange and lower the
credibility of the firm in the investment market. The projected balance sheet also
automatically determines the arithmetical accuracy of other budgets since they are used in
preparing the forecasted balance sheet.
Budgeted Statement of Changes in Financial Position
The projected statement of changes in financial position is usually prepared from
data in the budgeted income statement and changes between the project balance sheet at
the beginning of the budget period and projected balance sheet at the end of the budget
period. This projected statement is very useful to the management- in the financial
planning process)

283
7.7.3 MASTER BUDGET (OR COMPREHENSIVE BUDGET)
A master budget sometimes called a comprehensive budget is the summary or total
budget package for a business firm. A comprehensive budget is a set of financial
statements and other schedules showing the expected or proforma results for a future
period. A comprehensive budget normally contains an income statement, a balance sheet,
a statement of cash receipts and disbursements and schedules of production, purchases
and fixed asset acquisition. The budget packages might have other components
depending on the needs of the firm. A comprehensive budget is the end product of the
budget-making process. A master budget is a tool for coordinating all the individual
budgets of an organisation into an acceptable effective plan. It shows the budgeted profit
and loss account for the budget period and the budgeted balance sheet at the end of the
period.
Whether a business firm prepares specific operating budgets or a complete master
budget, the depends on a number of factors. The primary reason is the need of the
management at a particular time. For example, management may be more concerned with
a single or specific aspect at a time, such as adequacy of the cash position. If the cash
budget reveals that all is well, it may be the only budget needed to be prepared for the
management's use. If the cash budget reveals an inadequate or poor cash position, then
other budgets making up the master budget will have to be prepared. In this situation,
new budgets or forecasts will continue to be prepared, unless the management finds an
acceptable set of budgets
7.7.4 ZERO BASE BUDGETING (ZBB)
Zero Base Budgeting (ZBB) is a method of budgeting whereby all activities are
evaluated each time the budget is formulated and every item of expenditure in the
budget is fully justified. That is, ZBB involves starting from scratch or zero.
In traditional budgeting, departmental managers' need justify only increases over the
prior year's budget (known as incremental budgeting). This implies that what is already
being spent is automatically sanctioned. Under the ZBB concept, each department's
functions are reviewed completely and all expenditures, rather than only the increase,

284
must be approved. Also, in some departments, ascertainment of budgeted costs is easier
than other departments. For example, in production departments, it is easier to determine
costs of inputs to achieve a level of budgeted output. But, in other departments such as
accounts, personnel, research and development, it is difficult to even identify the output,
and therefore equally greater difficult to determine the cost of input to sustain
(unidentifiable) output. Consequently, the budgets of the previous year tend to be
subjectively increased as the next year's budgeted expenditure. However, the previous
year's budgets may be inefficient and merely adjusting next year's budgets to the
previous year's budget may result in wastages. ZBB overcomes this problem, to a certain
extent. ZBB rejects the traditional view on annual budgeting as an incremental process
which takes into account current expenditure plus an estimate of next year's expenditure
to arrive at the next budget. Instead, the projected expenditure for existing programmes
should start from base zero with each year's budgets being compiled as if the
programmes were being launched for the first time.
Application of ZBB
ZBB involves the following stages (steps):
a. Each separate activity of the organisation is identified and called a decision package.
A decision package is a document that identifies and describes a specific activity in
such a manner that the management can (i) evaluate it and ranks it against other
activities competing for limited resources, and (ii) decide whether to approve or
disapprove it.
b. Each decision package must be justified, i.e., it should be enquired into whether a
decision package promotes the goals of an enterprise.
c. If justified, then the cost of minimum efforts needed to sustain each decision
package is determined.
d. Alternatives for each decision packages are considered in order to select better and
cheaper options for the package.
e. Incremental decision packages are also justified and coasted in the above manner.
The incremental packages describe the costs and benefits of additional work that
could be done above that required by the base package for the minimum amount of

285
work needed to carry out the activity.
f. Managers rank their decisions package in order of priority for resource allocation.
g. Resources are allocated to the packages.
Advantages of ZBB
a. It represents a move towards allocation of resources by need and benefit and thus
results in more efficient allocation of resources.
b. It identifies and eliminates wastages and obsolete operations.
c. It ensures that the best possible methods of performing jobs are used and that new
ideas emerge.
d. It creates a questioning attitude rather than one which accepts that current
practices represent value for money.
e. It leads to increased staff involvement which may lead to improved motivation
and greater interest in the job.
f. It increases communication within the organisation.
g. Managers become more aware of the costs of inputs which help them to identify
priorities.
h. The documentation of decision packages provides management with a deep,
coordinated knowledge of all organization’s activities.
i. It is useful especially for service departments where it can be difficult to identify
output.
Disadvantages of ZBB
a. The costs involved in preparing a vast number of decision packages in a large
firm are very high.
b. It is very time-consuming and a large amount of additional paper work is
involved.
c. Managers develop fear and feel threatened by ZBB and therefore may oppose
new ideas and changes.
d. The ranking of decision packages and allocation of resources is subjective to
certain degree, which can result in departmental conflict
e. Administration and communication of ZBB process may become critical

286
problems because more managers become involved in this process than in most
budgeting and planning procedures and these problems are further compounded in
large organizations
7.8 OVERVIEW OF FINANCIAL MANAGEMENT
Suppose you are planning to start your own business. No matter what the nature of your
proposed business is and how it is organized, you will have to address the following
questions:

287
• What capital investments should you male? That is, what kinds of real estate,
machineries, and R&D programmes should you invest in?
• How will you raise money to pay for the proposed capital investments? That
is, what will be the mix of equity and debt in your financing plan?
• How will you handle the day-to-day financial activities like collecting your
receivables and paying your suppliers?
While these are not the only concerns of financial management, they are certainly the
central ones.
FINANCIAL DECISIONS
As mentioned at the outset, there are three broad areas of financial decision making, viz.
capital budgeting, capital structure, and working capital management.
Capital Budgeting
The first and perhaps the most important decision that any firm has to make is to define
the business or businesses that it wants to be in. This decision has a significant bearing on
how capital is allocated in the firm.
Once the managers of a firm choose the business or businesses they want to be in, they
have to develop a plan to invest in buildings, machineries, equipments, research and
development, godowns, showrooms, distribution network, information infrastructure,
brands, and other long-lived assets. This is the capital budgeting process.
Considerable managerial time, attention, and energy is devoted to identify, evaluate, and
implement investment projects. When you look at an investment project from the
financial point of view, you should focus on the magnitude, timing, and riskiness of cash
flows associated with it. In addition, consider the option embedded in the investment
projects.

288
Capital Structure
Once a firm has decided on the investment projects it wants to undertake, it has to figure
out ways and means of financing them. The key issues in capital structure decision are:
What is the optimal debt-equity ratio for the firm? Which specific instruments of equity
and debt finance should the firm employ? Which capital markets should the firm access?
When should the firm raise finances? At what price should the firm offer its securities?
An allied issue is the dividend decision of the firm. What is the optimal dividend payout
ratio for the firm? Should the firm buy back its own shares?
Capital structure and dividend decision should be guided by considerations of cost and
flexibility, in the main. The objective should be to minimize the cost of financing without
impairing the ability of the firm to raise finances required for value creating investment
projects.
Working Capital Management
Working capital management, also referred to as short-term financial management, refers
to the day-to-day financial activities that deal with current assets (inventories, debtors,
short-term holdings of marketable securities, and cash) and current liabilities (short-term
debt, trade creditors, accruals, and provisions).
The key issues in working capital management are: What is the optimal level of inventory
for the operations of the firm? Should the firm grant credit to its customers and, if so, on
what terms? How much cash should the firm carry on hand? Where should the firm
invest its temporary cash surpluses? What sources of short-term finance are appropriate
for the firm?
7.8.1 GOAL OF FINANCIAL MANAGEMENT

289
Finance theory rests on the premise that managers should manage their firm’s resources
with the objective of enhancing the firm’s market value.
You may ask why are we overlooking the interests of customers, employees, and
suppliers. No company can succeed unless it offers value for money to its customers,
provides satisfactory employment conditions to its employees, and treats its suppliers
fairly. Hence the question of neglecting the interests of these constituencies to promote
the welfare of shareholders simply does not arise. More value for shareholders does not
imply less value for customers, employees, or suppliers. On the contrary, only by
focusing on creating value for its shareholders can a firm ensure that it has durable and
mutually beneficial relationships with their customers, employees, and suppliers.
THE FUNDAMENTAL PRINCIPLE OF FINANCE
The key question that you have to ask before making a business decision is: Will the
decision raise the market value of the firm? To answer this question, let us look at the
fundamental principle of finance.
A business proposal- regardless of whether it is a new investment or acquisition of
another company or a restructuring initiative-raises the value of the firm only of the
present value of the future stream of net cash benefits expected from the proposal is
greater than the initial cash outlay required to implement the proposal.
The difference between the present value of future cash benefits and the initial outlay
represents the net present value or NPV of the proposal:
Net present value + Present value of future cash benefits – initial cash outlay
Note that the costs and benefits of a business proposal have to be measured in cash. As
shown in fig 7.3, investors who finance a proposal invest cash and are hence interested
only in cash returns.
Fig 7.3 Cash Alone matters

290
Investors provide the initial cash required to finance the business
The proposal generates Cash returns to investors
o convert the expected cash returns from the proposal into a present value figure an
appropriate discount rate has to be applied. The discount rate reflects the riskiness of the
proposal.
RISK-RETURN TRADEOFF
A firm has to choose between alternative courses of action. Should the firm set up a plant
which has a capacity of one million tons or two million tons? Should the debt-equity ratio
of the firm be 2:1 or 1:1? Should the firm purpose a generous credit policy or niggardly
credit policy? Should the firm carry a large inventory or a small inventory?
The alternative courses of action typically have different risk-return implications. A large
plant may have a higher expected return and a higher risk exposure, whereas a small plant
may have a lower expected return and a lower risk exposure. A higher debt-equity ratio
compared to a lower debt-equity ratio may reduce the cost of capital but expose the firm
to greater risk. A ‘hot’ stock, compared to a defensive stock, may offer a higher expected
return but also a greater possibility of loss.
In general, when you make a financial decision, you have to answer the following
questions: what is the expected return? What is the risk exposure? Given the risk-return
characteristics of the decision, how would it influence value? Fig 7.4 shows
schematically the relationship between the key financial decisions, return, risk, and
market value.
Investors Shareholders, Lenders
The business proposal

291
Fig 7.4 Decisions, return, risk, and Market value
The Time Value of Money
Money has time value. A rupee today is more valuable than a rupee a year hence. Why?
There are several reasons:
• Individuals, in general, prefer current consumption to future consumption.
• Capital can be employed productively to generate positive returns. An
investment of one rupee today would grow to (1 + r) a year hence ( r is the
rate of return earned on the investment)
• In an inflationary period, a rupee today represents a greater real purchasing
power than a rupee a year hence.
Many financial problems involve cash flows occurring at different points of time. For
evaluating such cash flows, an explicit consideration of time value of money is required.
FUTURE VALUE
Suppose you have Rs.1,000 today and you deposit ot with a financial institution which
pays 1- per cent interest compounded annually, for a period of 3 years. The deposit would
grow as follows.
Capital Budgeting Decisions
Capital Structure Decisions
Dividend Decisions
Working Capital Decisions
Return
Risk
Market value of the firm

292
First year: Principal at the beginning Interest for the year (Rs.1,000x 0.10) Principal at the end
1,000 100
1100
Second year: Principal at the beginning Interest for the year (Rs.1,100x 0.10) Principal at the end
1,100 110
1,210
Third year: Principal at the beginning interest for the year (Rs.1,000x 0.10) Principal at the end
1,210
121 1,331
Formula
The general formula for the future value of a single amount is:
Future Value = present Value (1 + r)n
Where r is the interest rate per year and n is the number of years over which
compounding is done. The factory (1 + r)n is called the future value factor, FVrn. It is very
tedious to calculate this factor unless you have a calculator. To reduce the tedium, tables
are available. Table 7.23 gives the value of this factor for several combinations of r and n.
A comprehensive table is given in Appendix A at the end of this book.
Table 7.23 Value of FVrn for various combinations of r and n
n/r 6% 8% 10% 12% 14%
2 1.124 1.166 1.210 1.254 1.300 4 1.262 1.361 1.464 1.574 1.689 6 1.419 1.587 1.772 1.974 2.195 8 1.594 1.851 2.144 2.476 2.853 10 1.791 2.518 2.594 3.106 3.707
Example If you deposit Rs.1000 today in a bank which pays 10 per cent interest,
compounded annually, how much will the deposit grow to after 8 years and 12 years?
The future value, 8 years hence will be Rs.1,000 (1.10)8 = Rs.1000 (2.144)

293
= Rs 2144
The future value, 12 years hence will be Rs 1000 (1.10)12 = Rs.1000 (3138)
= Rs.3138
Doubling Period
Investors commonly ask the question; how long would it take to double the amount at a
given rate of interest? To answer this question, we may look at the future value factor
table. Looking at exhibit 10.1, we find that when the interest rate is 12 per cent, it takes
about 6 years to double the amount,; when the interest rate is 6 per cent, it takes about 12
years to double the amount, so on and so forth. Is there a thumb rule which dispenses
with the use of the future value interest factor table? Yes, there is one and it is called the
Rule of 72. According to this thumb rule, the doubling period is obtained by dividing 72
by the interest rate. For example, if the interest rate is 8 per cent, the doubling period is
above 9 years (72/8). Likewise, if the interest rate is 4 per cent, the doubling period is
about 18 years (72/4). Though somewhat crude, it is a handy and useful thumb rule.
Shorter Compounding Periods
So far we have assumed that compounding is done annually. Now, consider the case
where compounding is done more frequently. Suppose you deposit Rs.1000 with a
finance company, which advertises that it pay 12 per cent interest semi-annually- this
means that the interest is paid every six months. Your deposit (if interest is not
withdrawn) grows as follows:
First Six Months: Principal at the beginning Interest for the 6 months (Rs.1,000x 12/2) Principal at the end
Rs.1000.0 Rs. 60.0
Rs 1,060.0
Second Six Months: Principal at the beginning Interest for the 6 months (Rs.1,060x 12/2) Principal at the end
Rs.1060.0 Rs. 63.6
Rs. 1,123.6

294
Note that if the compounding is done annually, the principal at the end of one year would
be Rs.1000 (1.12) = Rs.1120.0. The difference of Rs.3.6 (between Rs.1123.6 under semi-
annual compounding interest for the second 6 months.
The general formula for the future vale of a single cash amount when compounding ios
done more frequently than annually is:
Future Value = present Vale (1 + r /m)m x n
Where r is the nominal annual interest rate, m is the number of times compounding is
done in a year, and n is the number of years over which compounding is done.
Example; How much does a deposit of Rs.5000 grow to at the end of 6 years, if the
nominal rate of interest is 12 per cent and the frequency of compounding is 4 times a
year? The amount after 6 years will be Rs.5000 (1 + 0.12/4)4 x 6 = Rs.5000 (1.03) 24 =
Rs.5000 x 2.0328 = Rs.10,164.
Effective versus nominal Rate
We have seen above that Rs.1000 grows to Rs.1123.6 at the end of the year if the
nominal rate of interest is 12 per cent and compounding is done semi-annually. This
means that Rs1000 grows at the rate 12.36 per cent per annum. The figure of 12.36 per
cent is called the effective rate of interest – the rate of interest under annual
compounding, which produces the same results as that produced by an interest rate of 12
per cent under semi-annual compounding.
The general relationship between the effective rate of interest and the nominal rate of
interest is as follows:
R = (1 + k/m)m – 1
Where r is the effective rate of interest, k is the nominal rate of interest, and m is the
frequency of compounding per year.
Example a bank offers 8 per cent nominal rate of interest with quarterly compounding.
What is the effective rate of interest? The effective rat of interest is: (1 + 0.08/4) 4 –1 =
0.0824 = 8.24 per cent.

295
Table 7.24 gives the relationship between the nominal and effective rates of interest for
different compounding periods. In general, the effect of increasing the frequency of
compounding is not as dramatic as some would believe it to be – the additional gains
dwindle as the frequency of compounding increases.
Table 7.24 Nominal and Effective Rates of Interest Nominal rate % Effective Rate % Annual
Compounding Semi-annual
Compounding Quarterly
Compounding Monthly
Compounding 8 8.00 8.16 8.24 8.30 12 12.00 12.36 12.55 12.68
FUTURE VALUE OF ANNUITY
An annuity is a series of periodic cash flows (payments and receipts) of equal amounts.
The premium payments of a life insurance policy, for example, are an annuity. When the
cash flows occur at the end of each period, the annuity is called a regular annuity or a
deferred annuity. When the cash flows occur at the beginning of each period, the annuity
is called an annuity due. Out discussion here will focus on a regular annuity – the
formulae of course can be applied, with some modifications, to an annuity due.
Suppose you deposit Rs.1000 annually in a bank for 5 years and your deposits earn a
compound interest rate of 10 per cent. What will be the value of this series of deposits (an
annuity) at the end of 5 years? Assuming that each deposit occurs at the end of the year,
the future value of thus annuity will be:
= Rs.1000 (1.10)4 + Rs.1000 (1.10)3 + Rs.1000 (1.10)2 + Rs.1000 (1.10) + Rs 1000 = Rs.1000 (1.464) + Rs 1000 91.331) + Rs.1000 (1.21) + Rs.1000 (1.10) + Rs.1000
= Rs.6105.

296
The time line of this annuity is shown in Table 7.25
Table 7.25 Time Line for an Annuity 1 2 3 4 5
1000 1000 1000 1000 1000 (+)
1100 (+)
1210 (+)
1331 (+)
1464 (+)
Rs.6106
Formula
In general terms, the future value of an annuity is given by the formula:
Future value of an annuity = constant periodic flow (1 + r) n –1
r
where r is the interest rate per period and n, the duration of the annuity. The expression in
the bracket is the future value annuity factor, FVA r,n. Table 7.26 shows the value of this
factor for several combinations of r and n. A comprehensive table is given in appendix at
the end of this book.
Table 7.26 Value of FVA r,n for various combinations of r and n N/r 6% 8% 10% 12% 14% 2 2.060 2.080 2.100 2.120 2.140 4 4.375 4.507 4.641 4.779 4.921 6 6.975 7.336 7.716 8.115 8.536 8 9.897 10.636 11.436 12.299 12.232 10 13.181 14.487 15.937 17.548 19.337 12 16.869 18.977 21.384 24.133 27.270
Example four equal annual payments of Rs.2000 are made into a deposit account that
pays 8 percent interest year. What is the future value of this annuity at the end of 4 years?
Rs.2000 (FVA 8%, 4yrs) = Rs 2000 (4.507) = Rs.9014.

297
PRESENT VALUE
Suppose someone promised to give you Rs 1000 three years hence. What is the present
vale of this amount if the interest rate is 10 per cent? The present value can be calculated
by discounting Rs.1000 to the present point of time as follows:
Value three years hence = Rs.1000
Value two years hence = Rs.1000 (1/1,10)
Value one year hence = Rs.1000 (1/1.10) x (1/1.10)
Value now (present value) = Rs.1000 (1/1.10) x (1/1.10) x (1/1.10)
Formula
The process of discounting, used for calculating the present value, is simply the inverse
of compounding. The present value formula can be readily obtained by manipulating the
compounding formula.
Future Value = Present Value (1+r)n
Dividing both the sides of the above equation by (1+r)n, we get,
Present value = Future value * 1/((1 + r) n
The factor 1/ (1+r)n, in the above equation is called the present value factor, PVr,n. Table
7.27 gives the value of this factor for several combinations of r and n. A comprehensive
table is given in appendix A. at the end of the book.
Example: Find the present vale of Rs.1000 receivable 6 years hence, if the rate of
discount is 10 per cent.
The present value is: Rs.1000 (PV 10%, 6) = Rs.1000 (0.564) = Rs.564
Table 7.27 Value of PV r, n for various combination of r and n
n/r 6% 8% 10% 12% 14% 2 0.890 0.857 0.826 0.797 0.770 4 0.792 0.735 0.683 0.636 0.592 6 0.705 0.630 0.564 0.507 0.456 8 0.626 0.540 0.467 0.404 0.351 10 0.558 0.463 0.386 0.322 0.270 12 0.497 0.397 0.319 0.257 0.208

298
PRESENT VALUE OF ANNUITY
Suppose you expect to receive Rs.1000 annually for 3 years, each receipt occurring at the
end of the year. What is the present value of this stream of benefits if the discount rate is
10 per cent? The present value of this annuity is simply the sum of the present values of
all the inflows of this annuity.
Rs.1000 (1/1.10) + Rs.1000 (1 /1.10)2 + Rs.1000 (1/1.10)3
Rs.1000 x 0.909 + Rs.1000 x 0.826 + Rs.1000 x 0.751 = Rs.2486.
Table 7.28 Time Line of an Annuity
0 1 2 3 1000 1000 1000
909 826 751
Rs.2456 present value
Formula
In general term, the present value of an annuity is given by the formula.
Present value of an annuity = Constant periodic flow * 1- 1
(1+r)n
r
where r is the interest rate per periodic and n, the duration of the annuity. The expression
in the bracket is the present value annuity factor PVA r, n.
Table 7.29 shows the value of this factor for several combinations of r and n. A more
comprehensive table is given in Appendix A, at the end of this book.
Table 7.29 Value of PVA r,n for various combinations of r and n
N/r 6% 8% 10% 12% 14% 2 1.833 1.783 1.737 1.690 1.647 4 3.465 2.312 3.170 3.037 2.914 6 4.917 4.623 4.355 4.111 3.889 8 6.210 5.747 5.335 4.968 4.639 10 7.360 6.747 6.145 5.650 5.216 12 8.384 7.536 6.814 6.194 5.660

299
Example What is the present value of a 4 year annuity of Rs.10000 discounted at 10 per
cent?
The PVA 10%, 4 is 3.170.
Hence, the present value of the annuity is Rs.10,000 (3.170) = Rs.31,700
Loan Amortisation Schedule
Most loans are repaid in equal periodic instalments (monthly, quarterly, or annually),
which cover interest as well as principal repayment. Such loans are referred to as
amortised loans.
For an amortised loan we would like to know (a) the periodic installment payment’ and
(b) the loan amortisation schedule showing the break-up of the periodic installment
payments between the interest component and the principal repayment component. To
illustrate how these are calculated, let us look at an example.
Suppose a firm borrows Rs.1,000,000 at an interest rate of 15 per cent and the loan is to
be repaid in 5 equal installments payable at the end of each of the next 5 years. The
annual installment payment A is obtained by solving the following equation.
Loan amount = a x PVAn = 5, r = 15%
1,000,000 = A x 3.3522
Hence A = 298,312
The amortisation schedule is shown in Table 7.30. The interest component is the largest
for year 1 and progressively declines as the outstanding loan amount decreases.
Table 7.30 Loan Amortisation Schedule Year Beginning
Amount (1)
Annual Instalment
(2)
Interest (3)
Principal repayment
(2)-(3) = (4)
Remaining Balance
(10-(4) =(5) 1 1,000,000 298,312 150,000 148,312 851,688 2 851,688 298,312 127,753 170,559 681,129 3 681,129 298,312 102,169 196,143 484,986 4 484,986 298,312 727,482 225,564 259,422 5 259,422 298,312 38,913 259,399 23
a. Interest is calculated by multiplying the beginning loan balance by the interest
rate. b. Principal repayment is equal to annual instalment minus interest. c. Due to rounding off error a small balance is shown.

300
Equated Monthly Installment
In the previous illustration we considered equated annual instalments. In many cases,
such as housing loans or car loans, however, the borrower has to repay the loan with
interest in equated monthly installments (EMIs). The calculation of the EMI is analogous
to calculation of the equated annual installment, except that the unit period is one month
not one year. The calculation of EMI may be illustrated with an example. Shyam takes a
housing loan is to be repaid over 180 months What is the EMI? The EMI is obtained by
solving the following equation:
1,000,000 = A x PVA n = 180, r = 1.00%
1,000,000 = A x 1- 1 (1 + r) n
r 1,000,000 = A x 1- 1 (0.01) 180 .01 1,000,000 = A x 83.3217 A = 1,000,000
83.3217 = 12,002 Present Value of a Perpetuity
A perpetuity is an annuity of infinite duration. In general terms:
Present value of a perpetuity = constant periodic flow/ r
where r is the discount rate. The expression in the bracket is the present value perpetuity
factor. Put in words, it means that the present value perpetuity factor is simply 1 divided
by the interest rate expressed in decimal form. Hence, the present value of a perpetuity is
simply equal to the constant annual payment divided by the interest rate. For example, the
present value of a perpetuity of Rs.10,000 if the interest rate is 10 per cent is equal to
Rs.10000/0.10 = Rs.100,000. Intuitively, this is quite convincing because an initial sum
of Rs.100,000 would, if invested at the interest rate of 10 per cent, provide a constant
annual income of Rs.10,000 forever, without any impairment of the capital value.

301
14.0 Capital Budgeting
Capital budgeting is a complex process, which may be divided into the following phases:
• Identification of potential investment opportunities
• Assembling of proposals investment
• Decision making
• Preparation of capital budget and appropriations
• Implementation
• Performance review
7.9 PROJECT APPRAISAL
Project appraisal involves six broad steps as shown in Fig 7.5. A brief description of
these steps are as follows:
1. Forecast the costs and benefits A capital project involves costs and benefits
extending over a period of time. Typically, costs are incurred in the form of initial
cash outlays on fixed assets and net current assets. Benefits are derived in the form
of cash inflows from the operations of the project over its economic life, plus
terminal cash inflow from the liquidation of the project at the end of its economic
life.
2. Apply suitable investment criteria The stream of costs and benefits of the
project has to be converted into a measure indicating how worthwhile is the project.
For this purpose, several investment criteria are used. They fall into two broad
categories: discounted cash flow, criteria and non-discounted cash flow criteria.
While the former calls for discounting the future benefits using an appropriate
discount rate, the latter does not involve any discounting.
3. Assess the riskiness of the project Costs and benefits associated with a capital
project are almost invariably subject to risk. There may be a lot of variability
characterizing factors like project cost, sales quantity, selling price, material cost,
energy cost, project life, and salvage value. The actual values of these variables often
turn out to be different from their forecast values. Hence, you should try to get a

302
handle over how the variability in these factors try to get a handle over how the
variability in these factors can affect the attractiveness of the project.
Fig 7.5 Key Steps in Project Appraisal
4. Estimate the cost of capital The cost of capital is the discount rate used for
evaluating a capital project. Under appropriate conditions, it is measured as the
weighted average cost of different sources of capital employed for financing the
project. The cost of a specific source of finance is defined as the rate of discount that
equates the present value of the expected post-tax payments to that source of finance,
with the net funds received from that source.
5. Value the options The traditional approach to project appraisal calls for
judging a project on the basis of its net present value, obtained by discounting the
project cash flow stream using an appropriate cost of capital. This approach,
however, is incomplete, as it fails to capture the value of real options embedded in
the project. Hence, the traditional NPV analysis needs to be expanded to include the
value of real options inherent in the project.
Forecast costs and benefits
Select appraisal criteria
Assess risk
Estimate the cost of capital
Value the options
Consider the overall corporate perspective

303
6. Consider the overall corporate perspective
Capital investments in plant, machinery, buildings, research facilities, product
development, marketing programmes, and so on are tangible expressions of a
company’s strategy. Hence, capital investment decision must be evaluated from the
overall perspective of the firm. In such an evaluation, due consideration should be
given to general economic outlook, prospects of industries in which the firm
operates, and the competitive position and core competencies of the firm.
The following sections dwell at length on the issues involved in various steps of project
appraisal.
7.10 COSTS AND BENEFITS
Capital expenditures typically involve current and near future costs that are expected to
generate benefits in the future.
Basic Principles
While measuring the costs and benefits of a capital expenditures proposal, you must bear
in mind the following guidelines:
Focus on Cash Flows: costs and benefits must be measured in terms of cash flows-costs
are cash outflows and benefits are cash inflows. Cash flows matter because they represent
the purchasing power.
Since accounting figures are based on the accrual principle, they have to be adjusted to
derive the cash flows. For example, depreciation and other non-cash charges, which are
deducted in computing profits from the accounting point of view, have to be added back
as they do not entail cash outflows.
Estimate cash flows on a post-tax basis. Some firms look at pretax cash flows and, to
compensate that, apply a discount rate greater than the cost of capital. However there is
no reliable basis for making such adjustments. Hence, as a rule, work with post tax cash
flows.

304
Measures Cash flows on an Incremental Basis: The value of a project depends on its
incremental cash flows which are defied as the difference between “Cash flows of the
Firm with the project” and “Cash flows of the firm without the project.”
In estimating the incremental cash flows of a project, bear in mind the following sub-
guidelines:
Consider all Incidental effects: In addition to its direct cash flows, a project may have
incidental effects on the rest of the firm. It may enhance the profitability of some of
existing activities of the firm as it has a complementary relationship with them; or it may
detract from the profitability of some of the existing activities as it has a competitive
relationship with them- all these must be taken into account.
Ignore sunk Costs: Sunk costs represents past outlays that can not be recovered and,
hence, are not relevant for new investment decisions. Remember that ‘bygones are
bygones”.
Include Opportunity Costs: If a project requires the use of some resources already
available with the firm, the opportunity cost of these resources should be charged to the
project. The opportunity cost of a resource is the value of net cash flows that can be
derived from it if it were put to its best alternative use. Suppose a project requires a
vacant piece of land within the factory premises of the firm. The cost of this land
represents a sunk cost and, hence, is not relevant for the new project. But the project
should be charged with the opportunity cost of this land which represents the benefit that
can be derived b by putting it to its best alternative use, which in this case may simply be
leasing the land to another firm.
Question the allocation of Overhead Costs: Accountants normally allocate
organizational overhead costs to various divisions or projects on some basis. Hence,
when a project is proposed, apportion of the organizational overhead costs is allocated to
it. This may, however, have no relationship with the incremental organizational overhead
cost associated with. Remember that what matters is the incremental overhead costs

305
(along with other incremental costs), attributable to the project and not the allocated
overhead costs.
Do not forget Net Working Capital : Apart from investment in fixed assets like land,
building, machinery, and technical know how, a project also requires investment in
current assets like cash, receivable (debtors), and inventories. A portion of current assets
is supported by non-interest bearing current liabilities like accounts payable (creditors)
and provisions. The difference between current assets and non-interest bearing current
liabilities is the net working capital. It is financed by equity, preference, and debt. While
estimating the investment outlay of a project, do not forget the investment in net working
capital.
Exclude Financing Costs When you define project cash flows, exclude financing
costs like interest on debt and dividend on preference and equity. Why? The weighted
average cost of capital used for discounting the project cash flows reflects the cost of
debt, preference and equity capital. Hence, if interest on debt and dividend on preference
and equity are deducted in estimating project cash flows, cost of capital will be counted
twice. Guard against this error.
Treat Inflation Consistently Interest rates are usually expressed in nominal
terms, not real terms. For example, if IDBI issues a debenture carrying an interest rate of
say, 10 per cent, the 10 percent rate is a nominal rate. This means that, if you buy a
Rs.100 debenture you will get a nominal return of 10 per cent. If the inflation rate
happens to be, say 5 per cent, your real return will be correspondingly less. To figure out
your real return, use the following formula:
(1 + Real return) = ( 1+ Nominal return) ( 1 + Inflation rate) applying this to the IDBI debenture, you get (1 + Real return) = (1 + 0.10) (1 + 0.05) = 1.048 Hence, the real return is 4.8 per cent.

306
Since discount rates are usually quoted in nominal terms, you should, for reasons of
consistency, estimate the project cash flows too in nominal terms. This means that, you
must consider the trends in prices and costs in nominal terms.
You can, of course, work with real cash flows (cash flows that abstract away the impact
of inflation). If you do so, make sure that the discount rate too is stated in real terms.
Components of the Cash flow Stream
The cash flow stream of a project may be divided into three parts a follows:
Initial flows These represent the cash outflows associated with investment in
various project components. Initial flows are defined as:
Outlays on plant, machinery, and other fixed assets.
-
Tax shields relating to investment in plant, machinery, and other fixed asset
+
Outlays on net working capital
Operational flows These are cash inflows expected during the operational
phase of the project. The operational cash inflow for a given year is equal to: Profit
after tax + Depreciation and other non cash charges.
Terminal flows Cash flows expected from the disposal of assets when the project is
terminated are referred to as terminal flows. Terminal flows are defined as:
Post tax salvage value of fixed assets + Post tax salvage value of net working capital.
Illustration Naveen Enterprises is considering a capital project about which the following information is available:
• The investment outlay on the project will be Rs.100 million. This consists of
Rs.80 million on plant and machinery and Rs.20 million on net working
capital. The entire outlay will be incurred at the beginning of the project.
• The project will be financed with Rs.45 million of equity capital, Rs.5 million
of preference capital, and Rs.50 million of debt capital. Preference capital will

307
carry a dividend rate of 15 percent; debt capital will carry an interest rate of
15 percent.
• The life of the project is expected to be 5 years. At the end of 5 years, fixed
assets will fetch a net salvage value of Rs.30 million whereas net working
capital will be liquidated at its book value.
• The project is expected to increase the revenues of the firm by Rs.120 million
per year. The increase in costs on account of the project is expected to be
Rs.80 million per year (This includes all items of cost other than depreciation,
interest, and tax). The effective tax rate will be 30 per cent.
• Plant and machinery will be depreciated at the rate of 25 per cent per year as
per the written down value method. Hence, the depreciation charges will be:
First Year : Rs.20.00 million
Second Year: Rs.15.00 million
Third Year : Rs.11.25 million
Fourth Year: Rs.8.44 million
Fifth Year : Rs.6.33 million
Given the above details, the project cash flows are shown in Table 7.31.
Table 7.31 Project Cash Flows (Rs.in million)
0 1 2 3 4 5 A Fixed assets (80.00) B Net working capital (20.00) C Revenues 120 120 120 120 120 D Costs (other than
depreciation and interest 80 80 80 80 80
E Depreciation 20 15 11.25 8.44 6.33 F Profit after tax 14.0 17.5 20.12 22.09 23.57G Tax 6 7.5 8.63 9.47 10.10H Profit after tax 14.0 17.5 20.12 22.09 23.57I Net salvage value of fixed
assets 30.00
J Recovery of net working capital
20.00
K Initial outlay (100.00) L Operating cash flow (H+E) 34.0 32.5 31.37 30.53 29.90M Terminal cash flow (I+I) 50.0 N Net cash flow (K+L+M) (100.00) 34.0 32.5 31.37 30.53 79.90 Book value of investment 100 80 65 53.75 45.31

308
7.11 INVESTMENT CRITERIA
Once the stream of costs and benefits has been defined, it must be evaluated to determine
whether the project is worthwhile or not. Several criteria have been proposed for such
evaluation, of which, the important ones are:
• Payback period
• Average rate of return
• Net present value
• Internal rate of return.
Payback Period
The payback period is the length of the time required to recover the initial cash outlay on
the project. For example, a project involves a Cash outlay of Rs.600,000 and generates
cash inflows of Rs.100,000 rs.250,000, Rs.250,000, and Rs.2000,000 in the first, second,
third and fourth years, respectively. In this case, the payback period is 3 years because the
sum of cash inflows during 3 years is equal to the initial outlay. When the annual cash
inflow is a constant sum, the payback period is simply the initial outlay divided by the
annual cash inflow. For example, a project which has an initial cash outlay of Rs.1,
000,000 and a constant annual cash inflow of Rs.300,000 has a payback period of
Rs.1,000,000/ Rs.300,000 = 31/3 years.
To figure out the payback period of Naveen Enterprise’s capital project, let us look at the cumulative cash flow, till it turns positive: (Rs. In million)
Year Cash flow Cumulative cash flow 0 -100.00 -100.00 1 34.00 -66.00 2 32.50 -33.50 3 31.37 -2.13 4 30.53 +28.40
Since the cumulative cash inflow is negative at the end of year 3 bit positive at the end of
year 4, the payback period I between 3 and 4 years.
According to the payback period criterion, the shorter the payback period, the more
desirable the project. Firms using this criterion generally specify the maximum
acceptable payback period. If this is n years, only projects with a payback period of n
years or less are deemed worthwhile.

309
Evaluation A widely used investment criterion, the payback period, seems to offer the
following advantages:
• It is simply, both in concept and application. It does not use complicated
concepts or tedious calculations and has few hidden assumptions.
• It is a rough and ready method for dealing with risk. It favours projects which
generate substantial cash inflows in earlier years while discriminating against
those which bring substantial cash inflows in later years. Now, if risk trends to
increase with futurity- and in general this may be true- the payback criterion
can be helpful in weeding out risky projects.
• Since it emphasizes earlier cash inflows, it is a sensible criterion when the
firm is pressed with problems of liquidity.
The limitations of payback criterion, however, are very serious:
• It falls to consider the time value of money. In the payback calculation, cash
inflows are simply added without suitable discounting. This violates the most
basic principle of financial analysis, which stipulates that cash flows occurring
at different pints of time can be added or subtracted only after suitable
compounding or discounting.
• It ignores cash flows beyond the payback period. This lead to discrimination
against projects, which generate substantial cash inflows in later years.
• It is a measure of a project’s capital recovery, not its profitability.
• Though it measures a project’s liquidity, it does not indicate the liquidity
position of the firm as a whole, which is more important.
Average Rate of Return
The average rate of return, also called the accounting rate of return, defined as:
(Profit after tax/Book value of the investment)
The numerator of this ratio is the average annual post-tax profit over the life of the
investment; the denominator is the average book value of investment committed to the

310
project. To illustrate the calculation oif average rate of return, consider the data for the
project of Naveen Enterprises.
(Rs.in million) Year Book value of investment Profit after tax
1 100.00 14.00 2 80.00 17.5 3 65.00 20.12 4 53.75 22.09 5 45.31 23.57
The average rate of return is:
1/5 (14.0 + 17.5+20.12+22.09+23.57 1/5 (100+80+65+53.75+45.31) = 28.31 per cent.
Evaluation Traditionally, a popular investment appraisal criterion, the average rate of
return has the following virtues:
• It is simple to calculate.
• It is based on accounting information, which is readily available and familiar
to businessmen.
• It considers benefits over the entire life of the project.
• Its shortcomings, however, seem to be considerable.
• It is based on accounting profit, not cash flow.
• It does not take into account the time value of money.
Net present Value
The net present value of a project is the sum of the present value of all the cash flows
associated with it. The cash flows are discounted at an appropriate discount rate (cost of
capital). The net present value of Naveen Enterprise’s project is calculated below, using a
discount rate of 15 per cent which is the cost of capital applicable to this project. Fore
details of how the cost of capital is computed, refer to section 14.5.
Year Cash Flow Discount factor Present value 0 -100.00 1.000 -100.00 1 34.00 0.870 29.58 2 32.50 0.756 24.57

311
3 31.37 0.658 20.64 4 30.53 0.572 17.46 5 79.90 0.497 39.71 Sum = 31.96
The decision rule associated with the net present value is: accept the project, if the net present value is positive and reject the project, if the net present value is negative. A net present value of zero suggests indifference.
Discount Rate and Net Present Value For projects that have cash outflows
followed by cash inflows- most projects are like this- the net present value declines as the
discount rate increases. Typically, the relationship between the discount rate and net
present value is depicted in Fig 7.6.
Evaluation Conceptually sound, the net present value criterion has considerable
merits:
• It takes into account the time value of money.
• It considers the cash flow stream in its entirety.
• It squares neatly with the financial objectives of maximization of the wealth of
shareholders. The net present value represents the contribution of the wealth
of shareholders.
Fig 7.6 Discount Rate and Net Present Value
Discount rate While this criterion has hardly any shortcoming, a problem regarding its use may be
mentioned. The net present value is an absolute measure and not a relative measure.
Decision makers, however, are generally more comfortable with a relative measure (like
the accounting rate of return, or the internal rate of return.)
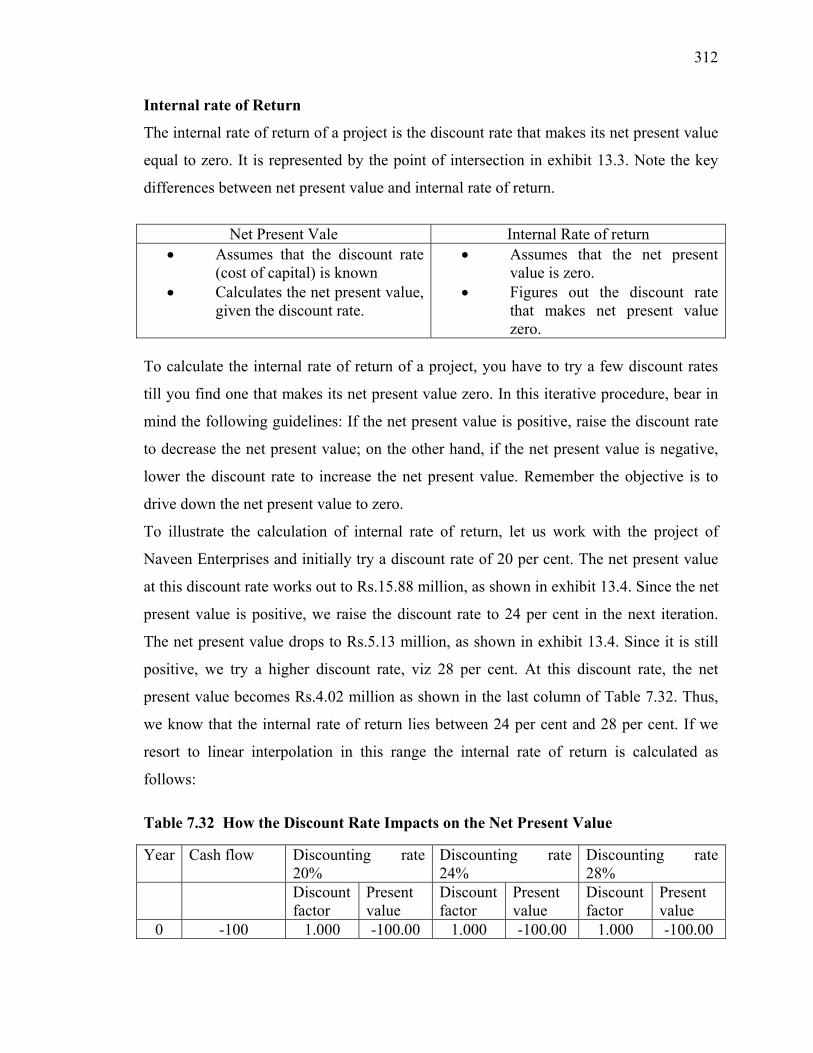
312
Internal rate of Return
The internal rate of return of a project is the discount rate that makes its net present value
equal to zero. It is represented by the point of intersection in exhibit 13.3. Note the key
differences between net present value and internal rate of return.
Net Present Vale Internal Rate of return
• Assumes that the discount rate (cost of capital) is known
• Calculates the net present value, given the discount rate.
• Assumes that the net present value is zero.
• Figures out the discount rate that makes net present value zero.
To calculate the internal rate of return of a project, you have to try a few discount rates
till you find one that makes its net present value zero. In this iterative procedure, bear in
mind the following guidelines: If the net present value is positive, raise the discount rate
to decrease the net present value; on the other hand, if the net present value is negative,
lower the discount rate to increase the net present value. Remember the objective is to
drive down the net present value to zero.
To illustrate the calculation of internal rate of return, let us work with the project of
Naveen Enterprises and initially try a discount rate of 20 per cent. The net present value
at this discount rate works out to Rs.15.88 million, as shown in exhibit 13.4. Since the net
present value is positive, we raise the discount rate to 24 per cent in the next iteration.
The net present value drops to Rs.5.13 million, as shown in exhibit 13.4. Since it is still
positive, we try a higher discount rate, viz 28 per cent. At this discount rate, the net
present value becomes Rs.4.02 million as shown in the last column of Table 7.32. Thus,
we know that the internal rate of return lies between 24 per cent and 28 per cent. If we
resort to linear interpolation in this range the internal rate of return is calculated as
follows:
Table 7.32 How the Discount Rate Impacts on the Net Present Value
Year Cash flow Discounting rate 20%
Discounting rate 24%
Discounting rate 28%
Discount factor
Present value
Discount factor
Present value
Discount factor
Present value
0 -100 1.000 -100.00 1.000 -100.00 1.000 -100.00

313
1 34.00 0.833 28.3332 0.806 27.40 0.781 26.55 2 32.50 0.694 22.56 0.650 21.13 0.610 19.55 3 31.37 0.579 18.16 0.524 16.44 0.477 14.96 4 39.53 0.482 14.72 0.423 12.91 0.373 11.39 5 79.90 0.402 32.12 0.341 27.25 0.291 23.25 NPV = 15.88 NPV = 5.13 NPV =4.02
- Smaller discount rate + NPV at the smaller rate Sum of the absolute values of x The NPV at the smaller and the Bigger discount rates (Bigger discount rate – smaller discount rate) 24% + 5.13 (28% - 24%) = 26.24 per cent 5.13 + 4.02
Evaluation A popular discounted cash flow method, the internal rate of return
criterion has several virtues:
• It takes into account the time value of money.
• It considers the cash flow stream in it entirety.
• It makes sense to businessmen who are wonted to think in terms of rate of
return ad find an absolute quantity such as net present value, somewhat
difficult to work with.
The internal rate of return criterion, however, has its own limitations:
• There may be multiple rates of return. If the cash flow stream of a project has
more than one change in sign, there is possibility of multiple rates of return.
• The internal rate of return criterion can be misleading when the choice is
between mutually exclusive projects that have substantially different outlays.
Consider projects P and Q.
Cash flow 0 | 1
Internal rate of return
Net present value (at 12%)
P - 10,000 +20,000 100% 7857 Q - 50,000 +75,000 50% 16,964

314
Both the projects are good, but Q with its higher net present value contributes more to the
wealth of the shareholders. Yet, from an internal rate of return point of view, P looks
better than Q. Hence, the internal rate of return criterion seems unsuitable for ranking
projects of different scales.
COST OF CAPITAL
The cost of capital of any investment (project, business, or company) is the rate of return
the supplier of capital would expect to receive if the capital were invested elsewhere in an
investment (project, business or company) of comparable risk. Before discussing the
technical details of how the cost of capital is computed, let us reiterate two points.
• The cost of capital reflects expected returns, not historical returns.
• The cost of capital represents an opportunity cost. It reflects the returns
investors expect from investments of similar risk.
To illustrate the calculation of the marginal cost of capital, let us look at the financing
plan for the project of Naveen Enterprises.
Equity capital (2 million equity shares are proposed to be issued to fetch a net price of Rs.22.5. while the issue price will be Rs.25 per share, the issue expenses will be 10 per cent. The expected dividend per share for the following year is Rs.1.8)
Rs.45 million
Preference capital (50,000 preference shares of Rs.100 each are proposed to be issued to an institutional investor at part. The preference shares will carry a dividend of 15 per cent)
Rs.5 million
Debt capital (0.5 million non-convertible debentures of Rs.100 each will be privately placed with a mutual fund. The debentures will carry an interest rate of 15 per cent)
Rs.50 million
For our present discussion we assume that the risk of the project of Naveen Enterprises is
comparable to the risk of the firm as a whole; further, the financing pattern of the project
is comparable to the financing pattern of the firm as a whole.

315
Cost of Debt
The cost of debt is the return required by the creditors of the firm on new borrowings.
You can observe the cost of debt, directly or indirectly. Since it is the interest rate the
firm must pay on its new borrowings, you can estimate it by looking at the interest rates
prevailing in the financial markets. For example, if the firm has outstanding bonds, you
can use the yield to maturity on these bonds as a proxy for the cost of new borrowings.
Alternatively, if you know that the new bonds of the firm would have a rating of say,
AAA, you can look at the interest rate on recently issued AAA bonds. While figuring out
the cost of debt, remember that the coupon rate on the firm’s outstanding debt is
irrelevant. It merely represents a historical cost, not the current cost of debt. What matters
is the cost of debt today and this is reflected in the yield prevailing in today’s market. The
return required by the suppliers of debt capital to Naveen enterprises is 15 per cent.
Hence, this represents the pre-tax cost of debt. Since the interest paid on debt capital is a
tax deductible expense, the post tax cost of debt is equal to:
Pre-tax cost of debt (1-tax rate) = 15% (1-.3) = 10.5%.
Cost of preference
Since preference capital carries a fixed rate of dividend, the cost of preference capital can
be determined fairly easily. It is the dividend rate the firm must pay on a new issue of
preference capital. Alternatively, it can be estimated by looking at the yields on
outstanding preference shares that are similarly rated. The cost of preference capital for
Naveen Enterprises is 15 per cent. Note that the preference dividend, unlike the interest
on debt, is not a tax deductible payment. Hence, there is no tax adjustment here.
Cost of Equity
Theoretically, the cost of equity is the return expected by capital providers from
investments of similar risk. So you can argue that the cost of equity can be found out by
asking equity investors how much return they expect. This is not feasible because the
number of equity shareholders for most companies is fairly large, sometimes running into

316
hundreds of thousands. Further, even if you could ask them, they may not be able to
define their expectation the way seasoned bankers or investors do. Many of them may
simply say “ I want a high return”. This is not helpful in arriving at a concrete estimate of
the cost of equity. Given the practical difficulties in directly ascertaining the return
expected by equity shareholders, financial analysts try to deduce investor expectation by
indirect ways. Three methods are commonly employed in practice.
• CAPM approach
• Bond yield plus risk premium approach
• Dividend discount model approach.
CAPM Approach according to the capital asset pricing model (which was
introduced in chapter 11), risk and return are related as follows:
E( R ) = Rf + β[E(RM)-R]
In words, Expected return = risk-free
On a risky asset rate return
Beta of (Expected return Risk-free rate
The asset on market portfolio of return
To illustrate the CAPM approach, let us assume that Rf= 10 per cent and E (RM) = 18
per cent. The expected return on equity stocks of companies with different betas is
given below.
Beta Expected return = Rf + β[E(RM)-R] 0.5 10+0.5 (18-10) = 14% 1.0 10 + 1.0 (18-10) = 18% 1.5 10 + 1.5 (18-10) = 22%
To apply the CAPM approach, the following inputs are required: Rf, the risk-free rate
[E(RM) –Rf], the market risk premium, and β the beta of he stock.

317
While there is a disagreement among finance practitioners as to how these inputs
have to be estimated, for our purposes the following will suffice:
• The risk-free rate may be estimated as the yield on a long-term government
bond that has a maturity of 10 years or more.
• The market risk premium may be estimated as the difference between the
average return on the market portfolio and the average risk-free rate over the
past 10 to 30 years- the longer the period, the better it is.
• The beta of the stock may be calculated by regressing the monthly returns on
the stock over the monthly returns on the market index over the past 60
months or more.
The CAPM is regarded by many as a fairly rigorous and objective approach to
determine the required return on equity. This approach, however, is based on the
assumption that investors eliminate unsystematic risk by efficient diversification and
hence require compensation only for systematic risk which is reflected in beta.
Market imperfections may impede efficient diversification by investors, exposing
them to unsystematic risk. When this occurs, investors will require compensation for
unsystematic risk, a factor which is not found in the standard CAPM relationship.
Another shortcoming of the CAPM relates to the instability of the betas of individual
securities. Studies have shown that individual securities have unstable betas. This
makes the use of a historical beta as a proxy for the future beta somewhat
questionable. Notwithstanding, these shortcomings, the CAPM approach is a useful
approach for estimating the required rate of return of equity stocks.
Bond Yield Plus risk Premium Approach Analyst who do not have faith in the
CAPM approach often resort to a subjective procedure to eliminate the cost of equity.
They add a judgmental risk premium to the observed yield on the long-term bonds of
the firm to get the cost of equity:
Cost of equity = Yield on long-term bonds + Risk premium.

318
The logic of this approach is fairly simple. Firms that have risky and consequently
high cost debt will also have risky and consequently high cost equity. So it makes
sense to base the cost of equity on a readily observable cost of debt.
The problem with this approach is how to determine the risk premium. Should it be 2
per cent, 4 per cent, or n per cent? There seems to be no objective way of determining
it. Most analysts look at the operating and financial risks of the business and arrive at
a subjectively determined risk premium that normally ranges between 2 per cent and
6 per cent. While this approach may not produce a precise cost of equity, it will give a
reasonable ballpark estimate.
Dividend discount Model Approach In chapter 10 we learnt that the price of an
equity share is equal to the present vale of the dividends expected from it. If we
assume that the dividend per share grows at a constant rate , the price of the equity
share is:
P0 = D1/ (r-g)
where P0 is price, D1 is the dividend expected a year from now, r is the return
expected by shareholders, and g is the growth rate in dividends. Solving the above
equation for r, we get.
r = D1
+ g
P0
Thus, the expected return of shareholders, which in equilibrium is also the required
return, is equal to the dividend yield plus the expected growth rate. For a publicity traded
company, it is fairly easy to determine the dividend yield. However, estimating the
expected growth rate, g, is difficult. You can estimate g by using the following methods.

319
1. You can get a handle over g by relying on analysts forecasts for the future
growth rates. Analysts’ forecasts may be available from a variety of sources.
Since different sources are likely to give different estimates, s simple
approach may be to obtain multiple estimates and then average them.
2. you can look at dividends for the preceding 5-10 years, calculate the annual
growth rates, and average them. Suppose you observe the following divides
for some stock.
Year Dividend Rupee change
Growth 1
1 Rs.3.00 ------ ------ 2 Rs.3.50 Rs.0.50 16.7 3 Rs.4.00 Rs.0.50 14.3 4 Rs.4.25 Rs.0.25 6.3 5 Rs.4.75 Rs.0.50 11.8
If you average the four growth rates, the result is 12.3 per cent, so you can use this as
an estimate of the expected growth rate.
3. You can use the retention growth rate method. Here, you first forecast the
firm’s average retention rate (this is simply 1 minus the dividend payout rate)
and then multiply it by the firm’s expected future return on equity (ROE).
g = (Retention rate) (Return on equity)
For example, if the forecasted retention rate and return on equity are 0.60 and
15 per cent, the expected growth rate is:
g = (0.6) (15%) = 9 per cent.
The dividend growth model is simple. It is easy to understand and easy to apply.
However, there are some problems associated with it.

320
• First, it cannot be applied to companies that do not pay dividend or to
companies that are not listed on the stock market. Even for companies that pay
dividends, the assumption that dividends will grow at a constant rate may not
be valid.
• Second, it does not explicitly consider risk. There is no direct adjustment for
the risk associated with the estimated growth. Of course, there is an implicit
adjustment for risk as the current stock price is used.
Average Cost of Capital
Once the specific costs of debt, preference, and equity capital are determined, the average
cost of capital is calculated as the weighted arithmetic average of these specific costs.
For Naveen Enterprises, the weights applicable to the various sources of finance are as
follows:
> Equity capital 45/100
> Preference capital 5/100
. Debt capital 50/100
The average cost of capital is calculated as follows:
Source of finance Component cost (per cent)
Weight ‘Product of component cost
and weight Equity capital 20.00 0.45 9.00 Preference capital 15.00 0.05 0.75 Debt capital 10.50 0.50 5.25 15.00

321
FINANCING STRATEGY
7.12 CAPITAL STRUCTURE
The two broad sources of finance available to a firm are: shareholders’ funds and loan
funds. Shareholders’ funds come mainly in the form of equity capital and retained
earnings and secondarily in the form of preference capital. Loan funds come in a variety
of ways like debenture capital, term loans, deferred credit, fixed deposit, and working
capital advance. Ignoring preference capital (which is of minor significance) the basic
differences between shareholders’ funds (referred to as equity) and loan funds (referred to
as debt) are as follow:
Equity Debt • equity shareholders have a residual
claim on the income and wealth of the firm.
• Dividend paid to equity shareholders is not a tax deductible payment.
• Lenders have affixed claim in the form of interest and principal amount.
• Interest paid to lenders is a tax deductible payment.
What are the key considerations in determining the debt equity ratio (the capital
structure) of the firm? The important considerations in planning the capital structure are:
• Earnings per share
• Risk
• Control
• Flexibility
• Nature of assets
Earnings per Share
Earnings per share, which is simply equity earnings divided by the number of outstanding
equity shares, is regarded as an important financial number that firms would like to
improve. Hence we need to understand how sensitive is earning per share (EPS) to
changes in profit before interest and tax (PBIT) under different financing alternatives.

322
To illustrate the relationship between PBIT and EPS under alternative financing plans, let
us consider the following data for Falcon Limited.
Existing capital structure: 10 million equity shares, per value Rs.10 each
Tax rate 50 per cent
Falcon Limited plans to raise additional capital of Rs.100 million for financing an
expansion project. In this context, it is evaluating two alternatives financing plans; (i)
issue of equity shares (10 million equity shares of Rs.10 per share), and (ii) issue of
debentures carrying 14 per cent interest.
What will be the EPS under the two alternative financing plans for two levels for PBIT,
say Rs.20 million and rs.40 million? Table 7.33 shows the value of EPS at these two
levels of PBIT under the alternative financing plans.
Table 7.33 Earnings per Earnings per Share under alternative Financing Plans
Equity Financing Debt Financing PBIT
20,000,000
PBIT
40,000,000
PBIT
20,000,000
PBIT
40,000,000 Interest 14,000,000 14,000,000 Profit before tax
20,000,000 40,000,000 6,000,000 26,000,000
Tax 10,000,000 20,000,000 3,000,000 13,000,000 Profit after tax 10,000,000 20,000,000 3,000,000 13,000,000 No. of equity shares
20,000,000 20,000,000 10,000,000 10,000,000
EPS 0.50 1.00 0.30 1.30
In general, the relationship between profit before interest and taxes and earnings per share
is as follows:
Earnings per share + [ PBIT – interest] (1-Tax rate) – Preference dividend
______________________________________
Number of equity shares

323
The break-even PBIT for the two alternative financing plans is the level of PBIT at which
EPS is the same under both the financing plans. It can be graphically obtained by plotting
the relationship between PBIT and EPS under the two alternatives and nothing the point
of intersection. This is shown in Fig 7.7 for the example of Falcon limited. From this
figure we find that the break-even level of PBIT is Rs.28 million. If PBIT is below Rs 28
million equity financing is preferable to debenture financing; if PBIT is higher than Rs.28
million, the opposite holds.
Risk
The two principal sources of risk in a firm are business risk and financial risk.
Fig 7.7 Break-even PBIT Level
EPS (Rs)
7- PBIT (Rs in million)
28
Business risk refers to the variability of profit before interest and taxes. It is influenced,
inter alia, by the following factors.
• Demand Variability Other things being equal, the higher the variability of demand
for the products manufactured by the firm, the higher is its business risk.
• Price Variability A firm which is exposed to a higher degree of cterised by a
higher degree of business risk in comparison with similar firms which are exposed
to lesser volatility for the prices of their products.
• Variability of Input Prices When input prices are highly variable; business risk
tends to be high.

324
• Proportion of Fixed Costs If fixed costs represent a substantial proportion of total
costs, other being equal, business risk is likely to be high. This is because when
fixed costs are high, PBIT is more sensitive to variations in demand.
Financial risk represents the risk emanating from financial leverage. When a firm
employs a high proportion of debt in its capital structure, i.e. when it has a high degree of
financial leverage, it carries a high burden of fixed financial commitment. Equity
shareholders, who have a residual interest in the income and wealth of the firm, are
naturally exposed to the risk arising from such fixed commitments. Equity shareholders
face this risk, also referred to as financial risk, in addition to business risk.Generally, the
affairs of the firm are, or should be, managed in such a way that the total risk borne by
equity shareholders, which consists of business risk plus financial risk, is not unduly
high. This implies that if the firm is exposed to a high degree of business risk, its
financial risk should be kept low. On the other hand, if the firm has a low business risk
profile, it can assume more financial risk.
Control
Consider the case of a firm which presently has an equity capital of 1000 owned entirely
by the original promoters. If the firm wants to raise additional capital, say another 1000,
it may go for debt finance, or a rights issue of equity capital, or a public issue of equity
capital, or a combination of two or more of these. The pros and cons of the three basic
ways of raising additional finance are shown below:
Pros Cons Rights issue of equity capital
No dilution of control Severe limits on financing
Debt capital No financial risk
No dilution of control
Lower cost
Higher cost
Financial risk
Public issue of equity capital
No financial risk Dilution of control Higher cost

325
Since the rights issue option severely limits the financing ability of the firm – the present
owners may lack resources or inclination or both – the options which may merit serious
considerations are debt capital and public issue of equity capital. In evaluating these
options, among other things, the issue of control is important.
Flexibility
Flexibility refers to the ability of a firm to raise capital from any source it wishes to tap. It
provides manipulability to the finance manager. Generally, if the return earned on equity
is satisfactory, the firm can raise further equity capital as there is no restriction on the
amount of equity capital a firm can raise. However, as the debt equity ratio is normally
not permitted to exceed a certain level (which may be specified by some regulatory
authority, or determined by financial institutions, or indicated by the capital market), the
firm cannot presume that it can always raise further capital by issuing debt securities.
Hence, flexibility for practical purposes may mean that the firm does not exhaust fully its
debt capacity. Put differently, it implies that the firm maintains reserve-borrowing power
to enable it to raise debt capital to fund unforeseen needs.
Nature of Assets
The nature of a firm’s assets has an important bearing on its capital structure. If the assets
are primarily tangible (plant and machinery and buildings), debt finance is used more.
For example, electric utility companies use more debt because their assets are mainly
tangible, physical in nature. On the other hand, if the assets are primarily intangible
(brands and technical know-how) debt finance is used less. For example, software
companies use very little debt as their assets are mainly intangible. What explains the link
between the nature of assets and the use of debt finance? The major explanation is that
lenders are more willing to lend against tangible assets and less inclined to lend against
intangible assets.

326
A Checklist
When should the firm use more equity and when should the firm use more debt. Here is a
checklist:
Use more equity when Use more debt when • The corporate tax rate applicable to
the firm is negligible • Business risk exposure is high • Dilution of control is not an
important issue. • The assets of the firm are mostly
intangible. • The firm has many valuable growth
options.
• The corporate tax rate applicable to the firm is high.
• Business risk exposure is low. • Dilution of control is an important
issue. • The assets of the firm are mostly
tangible. • The firm has few growth options.
FINANCING INSTRUMENTS
Equity and debt come in a variety of forms and are raised in different ways. The
important forms are given in Fig 7.8 which shows the menu of financing available to a
firm. The various forms of financing have been discussed in greater detail in the
following chapter.
Public and Private Sources of Capital
A firm can raise equity and debt capital from both public and private sources. Capital
raised from public sources is in the form of

327
Fig 7.8 Menu of Financing
Equity Capital
Preference Capital Equity
Internal Accruals
Sources of capital
Debentures
Term Loans
Working Capital Advance
Misc.Sources
Debt

328
securities offered to public through an offer document filed with the Securities Exchange
Board of India. These securities can be traded on public secondary markets like the
national Stock Exchange or the Bombay Stock Exchange, which are recognized stock
exchanges that facilitate the trading of public securities. Private capital comes either in
the form of loans given by banks and financial institutions or in the form of securities like
equity shares, preference shares, and debentures which are privately placed with a small
group of sophisticated inventors like venture capital firms, financial institutions,
insurance companies, mutual funds, and wealthy individuals.
The Typical Pattern of Financing
When a company is formed, it first issues equity shares to the promoters (founders) and
also, in most cases, raises loans from banks, financial institutions, and other sources. As
the need for financing increases the company may issue shares and debentures privately
to promoters’ relatives, friends, business partners, employees, financial institutions,
banks, mutual funds, venture capital funds, and others-venture capital funds are likely to
be an important source of finance for a nascent venture. Such investors are specific and
small in number.As the company grows further, it may have to raise capital from the
public. Once the company decides to go public, its options, in terms of markets, widen. It
can access the domestic market, international market, and foreign market. Apart from
equity shares, a firm may issue preference shares and debentures to the general
investment public through a public issue.
METHODS FOR RAISING FINANCES
The market for financial securities may be divided into two segments: the primary market
and the secondary market. New issues are made in the primary market whereas
outstanding issues are traded in the secondary market. There are three ways in which a
company may raise finances in the primary market: (a) public issue, (b) rights issue, and
(c) private placement or preferential allotment.
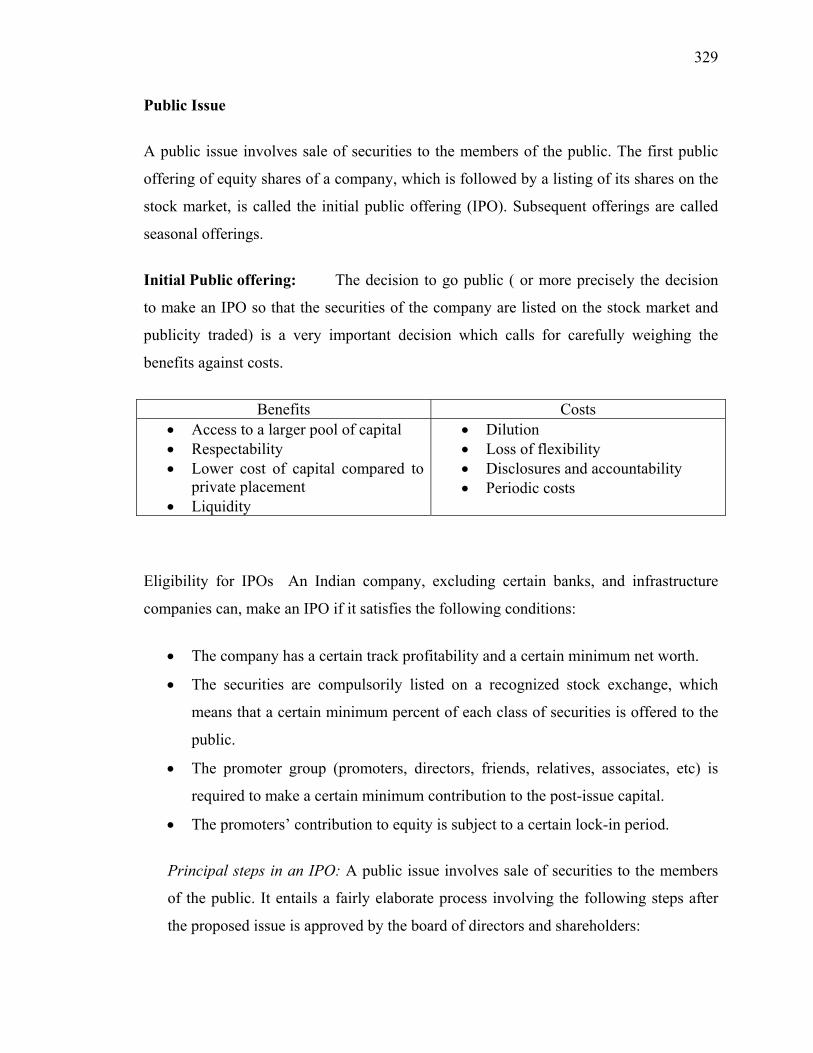
329
Public Issue
A public issue involves sale of securities to the members of the public. The first public
offering of equity shares of a company, which is followed by a listing of its shares on the
stock market, is called the initial public offering (IPO). Subsequent offerings are called
seasonal offerings.
Initial Public offering: The decision to go public ( or more precisely the decision
to make an IPO so that the securities of the company are listed on the stock market and
publicity traded) is a very important decision which calls for carefully weighing the
benefits against costs.
Benefits Costs • Access to a larger pool of capital • Respectability • Lower cost of capital compared to
private placement • Liquidity
• Dilution • Loss of flexibility • Disclosures and accountability • Periodic costs
Eligibility for IPOs An Indian company, excluding certain banks, and infrastructure
companies can, make an IPO if it satisfies the following conditions:
• The company has a certain track profitability and a certain minimum net worth.
• The securities are compulsorily listed on a recognized stock exchange, which
means that a certain minimum percent of each class of securities is offered to the
public.
• The promoter group (promoters, directors, friends, relatives, associates, etc) is
required to make a certain minimum contribution to the post-issue capital.
• The promoters’ contribution to equity is subject to a certain lock-in period.
Principal steps in an IPO: A public issue involves sale of securities to the members
of the public. It entails a fairly elaborate process involving the following steps after
the proposed issue is approved by the board of directors and shareholders:

330
• Appoint the lead manager / s.
• Appoint other intermediaries like co-managers, underwriters, bankers, brokers,
and registrars.
• Prepare the prospectus and file the same with the Registrar of Companies and
SEBI.
• Print the prospectus and dispatch the same to brokers.
• Make the statutory announcements.
• Collect and process the applications.
• Establish the liability of underwriters.
• Allot shares.
• Get the issue listed.
Cost The cost of an IPO is normally between 6 and 12 per cent depending on the size
of the issue and the level of marketing effort. The important expenses incurred for public
issue are: underwriting expenses, brokerage, fees for the managers and registrars, printing
and postage expenses, advertising and publicity expenses, listing fees, and stamp duty.
Seasoned Offering For most companies their IPO is seldom their last public issue. As
companies grow, they are likely to make further trips to the capital market with issues of
debt and equity. These issues are likely to be public issues offered to investors at large or
rights issues or private placement or preferential allotment.
The procedure for a public issue by a listed company (seasoned offering) is similar to that
of an IPO. Hence all the steps involved in an IPO are applicable to a public issue by a
listed company. However, a public issue by a listed company is subject of fewer
regulations when compared to an IPO (expect when the post-issue net worth grows to
more than five times the pre-issue net worth). This is evident from the following:
• A public issue by a company which has been listed on a stock exchange for at
least three years and has a track record of dividend payment for at least three
immediate preceding years does not require the promoters’ contribution, provided
the relevant information is disclosed in the offer document.

331
Rights Issue
A rights issue involves selling securities in the primary market by issuing rights to the
existing shareholders. When a company issues additional equity capital, it has to be
offered in the first instance to the existing shareholders on a pro-rata basis. This is
required under section 81 of the Companies Act, 1956. The shareholders, however, may
by a special resolution forfeit this right, partially or fully, to enable a company to issue
additional capital to the public.
Procedure for Rights Issue A company making a rights issue sends a letter of offer
along with a composite application form consisting of four forms (A, B, C and D) to the
shareholders. Form A is meant for the acceptance of the rights and application of
additional shares. This form also shows the number of rights shares the shareholder is
entitled to. It also has a column through which a request for additional shares may be
made. Form B is to be used if the shareholder wants to renounce the rights in favour of
someone else. Form C is meant for application by the renounces in whose favour the
rights have been renounced, by the original allottee, through Form B. Form D is to be
issued to make a request for split forms. The composite application form must be mailed
to the company within a specific period, which is usually 30 days.
Private Placement or Preferential Allotment
In a private placement, funds are raised in the primary market by issuing securities
privately to some investors without resorting to underwriting. The investors in this case
may be financial institutions, commercial banks, other companies, and shareholders of
promoting companies, and friends and associates of the promoters. The merits of private
placement are: (a) The process of raising funds is fairly simple. The elaborate procedure
required in the case of a public issue is more or less bypassed. (b) The issue cost is
minimal. (c) In the case of a debenture issue, negotiated directly between the issuing
company and the few investors, there may be greater flexibility with respect to terms and
conditions. The disadvantages of private placement are: (a) The quantum of funds that

332
can be raised may be rather limited. (b) The cost of capital of funds raised by way of
private placement may be somewhat higher.
Private Placement of Debentures Private placement of debentures has become very
popular in recent years. The principal buyers of such debentures have been mutual funds,
insurance companies, and financial institutions. Army group Insurance, Navy Group
insurance, Air Group Insurance, and so on. The phenomenal growth of private placement
of debentures may be attributed to the following factors:
Accessibility Almost every company can use the private placement route. There is no
need for credit rating.
Flexibility In a private placement, there is greater flexibility in working out the terms of
issue.
Speed A private placement requires much less time than a public issue.
Lower issue costs: The issue costs of a private placement are substantially less.
How Do the Three Methods compare
How do the three methods compare broadly in terms of the amount that can be raised, the
cost of issue, dilution of control, degree of under-pricing, and market perception. Table
7.34 presents a summary comparison for equity issue. As far as a debt issue is concerned,
dilution of control is a non-issue and the market perception is positive under all the
methods.
Table 7.34 Summary comparison of the Three Methods
Public issue Rights Issue Private Placement Amount that can be raised
Large Moderate Moderate
Cost of issue High Negligible Negligible Dilution of control Yes No Yes Degree of under pricing
Large Irrelevant Small
Market Perception Negative Neutral Neutral

333
MARKETS
A firm planning to raise finances may tap one or more of the following capital markets:
Indian capital Market A firm accessing the Indian capital market has to conform
to the regulations of the Securities and Exchange Board of India (SEBI).
Euro Capital market The euro capital market is a global market beyond the
purview of any national regulatory body. Many firms in India have accessed this market
since the early 1990s using instruments like Global depository Receipts (GDRs) and Euro
Convertible Bonds (ECBs). Firms interested in accessing this market have to take the
approvals of Ministry of Finance, foreign Investment Promotion Board, and Reserve
bank of India.
Foreign domestic Capital Market Some Indian firms have accessed or are in the
process of accessing the domestic capital market of US (through instruments like Yankee
bonds and American Depository Receipts), U.K, and Japan. Obviously, an Indian firm
interested in accessing a foreign domestic capital market has to obtain clearances from
Indian authorities as well as the regulatory bodies of the foreign country.
How do the three markets compare in terms of access, market size, cost of issue,
disclosure and transparency requirements, and prices/rates? Table 7.35 provides a
summary comparison of the three markets.
Table 7.35 A Summary Comparison of the Three Markets
Indian Capital Market
Euro Capital Market Foreign Domestic market
Access Easy Restricted Highly restricted Market Small Large Large Cost of Issue High Low Low Disclosure and transparency
Less onerous Onerous Highly onerous
Prices / Rates Not so attractive Attractive More attractive

334
PRICING AND TIMING
Along with the choice of instrument, market, and mode, the firm has to determine when
and at what price should its issue be made. Since pricing and timing are closely inter-
related they may be discussed together.
If the capital market is efficient in the sense that the market price is always equal to the
intrinsic value, the simple guideline with respect to pricing and timing would be: “ Raise
finances whenever they are required by issuing securities at prevailing market prices”.
Since the market price and intrinsic value may diverge in real life situations, pricing and
timing are important issues. Bear in mind the following guidelines while resolving these
issues.
Decouple Financing and Investment Decisions Opportunities for smart moves on
investment and financing side of the business often do not synchronies. Hence financing
decisions should be decoupled from investment decisions, As Warren Buffett says:
“Therefore, we simply borrow when conditions seem non-oppressive and hope that we
will later find intelligent expansion or acquisition opportunities, which as we have said
are more likely to pop up when conditions in the debt market are clearly oppressive. Out
basic principle ins that if you want to shoot rare, fast moving, elephants, you should
always carry a loaded gun”.
Never Be Greedy If present conditions are favourable for a certain type of financing,
take advantage of it. Driven by greed, do not wait for an even better possible tomorrow.
The advice of Bernard Baruch formulated for the stock market investor applies equally
well to the participant in financial market: “Leave the first 1p per cent and the last 10 per
cent of someone else.”
Ensure Inter-generational Fairness Tapping the equity market when it is buoyant does
not mean that the firm should price its equity issue far above its intrinsic value. If it does
so, existing shareholders will benefit at the expense of new shareholders. While it may
appear alluring in the short run, it may not be advisable in the long run. Firms which

335
succumb to such a temptation for immediate gains may eventually alienate new investors
and lose credibility in the capital market. To ensure inter-generational fairness among
equity shareholders, the firm should price its issue at more or less the intrinsic value and
to more or less guarantee an encouraging response to its issue, the firm should approach
the market when it feels that the market price is higher than the intrinsic value by a
margin of say 20 per cent.
DIVIDEND POLICY
Very broadly, the distribution policy is concerned with issues like how much of its
earnings should a firm pay by way of dividends, what are the implications of bonus issues
and stock-splits, and when does it make sense to buy back shares.
Key Considerations Influencing Dividend Policy
The key considerations influencing a firm’s dividend policy are as follows:
Earnings Prospects If the firm expects its earnings to grow in future it may be inclined
to pay more by way of dividends. On the other hand, if it is uncertain about its earnings
prospects it may pay less by way of dividends.
Funding Requirements An important factor influencing the payout ratio of a firm is
its requirement for funds in the foreseeable future. This is usually assessed with the help
of financial forecasts prepared in the context of long range planning. Generally, firms
which have substantial investment opportunities and consequently considerable funding
needs tend to keep the dividend payout ratio low to conserve resources for growth.
Dividend Record The past dividend record of a firm has a bearing on its current
dividend payment. Firms generally pursue a policy of gradually varying (this mostly
implies increasing but occasionally means decreasing) the rupee level of dividend over
time.

336
Liquidity Position Dividends entail cash payment. Hence, the liquidity position of the
firm has a bearing on its dividend decision. A firm may be unable to distribute more than
a small fraction of its earnings, despite its desire to do so, if it is hard pressed for
liquidity.
Shareholder Preference The preference of shareholders may influence the dividend
payout ratio of the firm. When equity shareholders have greater interest in current
dividend vis-à-vis capital gains, the firm may be inclined to follow a liberal dividend
payout policy. On the other hand, if equity shareholders have a strong preference for
capital gains, the firm may plough back a larger proportion of its earnings.
Control External financing, unless it is through a rights issue, involves dilution of
control. If external finances are raised through a public issue of equity capital, the
existing shareholders will have to share control with the new shareholders. Internal
financing by way of retained earnings, on the other hand, leads to no dilution of control.
Hence, if the shareholders and management of the firm are averse to dilution of control,
the firm should rely more on retained earnings.
Bonus Shares
Share issued to existing shareholders as a result of the capitalization of reserves are called
bonus shares. Table 7.36 illustrates the nature of this capitalization.

337
Table 7.36 Effect of a Bonus issue on the Equity Portion of the Balance Sheet
Part A: Equity Portion before the Bonus Issue
Paid up Share Capital Rs.10,000,000
(1,000,000 shares of Rs.10 each fully paid)
Reserves and Surplus Rs.30,000,000
Part B: Equity Portion after the Bonus Issue in the Ratio 1:1
Paid up Share Capital Rs.20,000,000
(2,000,000 shares of Rs.10 each fully paid)
Reserves and Surplus Rs.20,000,000
In the wake of the bonus issue:
• The shareholders’ proportional ownership remains uncharged.
• The book value per share, the earnings per share, and the market price per share
decrease, but the number of shares increases.
From the above it appears that the issue of bonus shares is more or less a financial
gimmick without any real impact of the welfare of equity shareholders. Yet, firms do
issue bonus shares and shareholders eagerly look forward to such issues. Why? The
primary reason is that shareholders regard a bonus issue as a firm indication that the
prospects of the company have brightened. Further, they feel reassured that the

338
management is investor friendly. A secondary reason is that the bonus issue brings the
price of the share in a more popular trading range.
Stock Splits
In a stock split, the par value per share is reduced and the number of shares is increased
proportionately. Table 7.37 illustrates the nature of this change.
Table 7.37 Effects of a Stock Split on the Equity Portion of the Balance Sheet.
Part A: Equity Portion of the Balance Sheet
Paid up Share Capital Rs.5,000,000
(1,000,000 shares of Rs.50 each fully paid)
Reserves and Surplus Rs.10,000,000
Part B: Equity Portion after Stock Split in the Ratio 5:1
Paid up Share Capital Rs.5,000,000
(5,000,000 shares of Rs.10 each fully paid)
Reserves and Surplus Rs.10,000,000

339
Comparison between Bonus Issue and Stock Split
A comparison between a bonus issue and a stock split given below:
Bonus Issue Stock Split • The par value of the stock remains
constant. • A part of reserves is capitalized. • The shareholders’ proportional
ownership remains unchanged. • The book value per share, the
earnings per share, and the market price per share decline.
• The market price per share is brought within a more popular trading range.
• The par value of the stock is reduced.
• There is no capitalization of reserves.
• The shareholders’ proportional ownership remains unchanged.
• The book value per share, the earnings per share, and market price per share decline.
• The market price per share is brought within a more popular trading range.

340
SUMMARY
Accounting is the process of identifying, measuring and communicating economic
information to permit informed judgments and decisions by users of the information.
Nowadays, Profit and loss account, Balance Sheet, and Statement of Changes in
Financial Position are important in the accounting process. Accounting, especially, cost
accounting, as a tool of management, is an integral part of the management process. Cost
accounting records relevant date from production and other activities on a regular basis
and reports these data to management for managing the undertaking. Cost accounting is
the processing and evaluation of monetary and non-monetary data to provide information
for internal planning, control of business operations, managerial decisions and special
analysis, external reporting. Economic Order Quantity and Re order level make ease
accountants and financial managers in the process of placing an order with the answer of
questions when and how many.
The two types of inventory systems, perpetual inventory method requires a continuous
record of additions to or reductions in materials, work-in-progress, and cost of good sold
on a day-to-day basis and the stock-taking task which is long and costly is avoided under
this method; Under the periodic method, the entire book inventory is verified at a given
date by an actual count of materials on hand and this physical inventory is usually taken
near the end of the accounting period. The difference between Cost accounting and
Managerial accounting makes clear its usages. Cost accounting largely uses data about
production, sales, wages, and overhead services. Managerial accounting utilizes the same
(and also additional) data to prepare budgets, performance reports, and control reports
and data analyses for decision-making purposes. Cost- Volume-Profit (CVP) analysis is
an important tool that provides the management with useful information for managerial
planning and decision-making. A break-even analysis is performed to identify the level of
operations at which the .entity has covered all costs but has not yet earned any profit. The
break-even point identifies the volume of activity at which total revenues equal total
costs. This is an important point to the management because it represents a minimum

341
acceptable level of operations and it indicates that profitable operations can only result
when the level of activity exceeds the break-even point.
FOR DISCUSSION
1. Explain briefly about the accounting concepts and principles.
2. What are the objectives of cost accounting?
3. Briefly explain the elements of cost.
4. Define Economic Order Quantity.
5. What are the types of inventory systems? Summarize the concepts and advantages
of each with distinguishable form.
6. Explain the types of wage systems briefly.
7. What are the differences between cost accounting and managerial accounting?
8. Explain the role of management process on managerial accounting.
9. What are the differences between financial accounting and managerial
accounting?
10. What is CVP analysis? Explain its different techniques.
11. What is break even analysis? In what circumstances its useful is unavoidable in
decision making process? Explain its advantages and disadvantages.
12. Explain briefly about the fixed and flexible budgeting.
13. What are the types of budgets?
14. What is zero base budgeting? Explain its advantages and disadvantages.
15. What is cost of capital?

342
REFERENCES
1. Lal Jawahar, “Accounting for Management,” 2nd Revised Edition, Himalaya
Publishing House, Mumbai, India.
2. Chandra Prasanna, “Financial Management: Theory and Practice,” 6th Edition, Tata
McGraw-Hill Publishing Co. Ltd., New Delhi, India.
3. Robert N.Anthony and Reece J.S, “Accounting Principles”, 7th Edition, IRWIN.
4. Horngreen, Charles T and Surdern G.L, “Introduction to Financial Accounting”,
Prentice Hall International, Englewood Cliffs, New Jersy, 2003.
5. Beirman H Jr and Drebin, “Financial Accounting: An Introduction”, W.B.Saunden
Company.
6. Belvard E Needles Jr, “Financial Accoutning”, 5th Edition, Houghton Mifflin
Company, 2003, USA.
7. Van Horne J.C, “Financial Management and Policy” Prentice hall of India, New
Delhi.
8. Van Horne J.C, “Fundamentals of Financial Management” Prentice hall of India,
New Delhi.
9. Solomon E and Pringle J, “An Introduction to Financial Management”, Prentice hall
of India, New Delhi.
10. Prasanna Chandra, “Financial Management”, Tata McGraw Hill, New Delhi.
11. Hampton J, “Financial Decision Making”, Eaglewood Cliffs, New Jersy.

343
Chapter 8
PROJECT MANAGEMENT

344
PROJECT MANAGEMENT
SCOPE OF THE COURSE After reading chapter 8, you should be able to:
Understand the basic needs for project planning Explain the characteristics of project planning Understand Critical Path Method Understand PERT

345
INTRODUCTION
8.1 WHAT IS A PROJECT?
“A project is a temporary endeavor undertaken to achieve a particular aim. Every
project has a definite beginning and a definite end.”
From the Project Management Institute
www.pmi.com
What is Project Management?
Project management is the application of knowledge, skills, tools and techniques …
in order to meet the requirements of the particular project.
From A Guide to the Project Management Body of Knowledge (2000 Edition, Project
Management Institute (PMI®) December 2000)
8.2 WHAT IS PROJECT PLANNING
Project Planning in general can best be described as the function of selecting the
enterprise objectives and establishing the policies, procedures and programs
necessary for achieving them.
Characteristics of Project Planning
Project Planning must be systematic,flexible, enough to handle unique activities,
disciplined through reviews and controls and capable of accepting multifunctional
inputs.
Task is required to be well understood prior to being performed, much of the
work can be preplanned

346
During the actual task execution more knowledge is learned that in turn leads to
changes in resources allocations schedules and priorities.
The more uncertain the task the greater the amount of information that must be
processed in order to ensure effective performance.
Poor Project Planning
• Project initiation
• Wild Enthusiasm
• Chaos
• Search for the guilty
• Punishment of the innocent
• Promotion of the nonparticipants
• Unclear definition of the requirements
Basic need for Project Planning
• To eliminate or reduce uncertainty
• To improve efficiency of the operation
• To obtain better understanding of the objectives
• To provide a basis for monitoring and controlling work
• The competitive situation in the area like
• Marketing, Research and Development
• Production, Financing and Personnel
• Management Structure etc.
• Agreement on purpose
• Assignment and acceptance of individual responsibilities
• Coordination of work activities
• Increased commitmen to group goals
• Lateral Communications
• Assignment and acceptance of group responsibilities

347
The statement of work (SOW)
• The SOW is a narrative description of the work required for the project. It
includes the objectives of the project A brief description of the work the funding
constraint if one exists and the specifications and schedule.
• It includes: Start date, End Date, Major Milestones,Written reports (data items).
• Common causes of misinterpretation:
• Mixing tasks, specifications, approvals and special instructions
• Using imprecise language (nearly, optimum, approximately etc.)
• No pattern,structure or chronological order
• Wide variation in size of tasks
• Wide variation in how to describe details of the work
• Failing to get third –party review
The project manager or his designees should review the document that authorize the
project and define its objectives. As a convenience a related studies should be
prepared together with samples of any Similar SOW’S and related coding should be
used. A copy of the Work Breakdown Structure (WBS) should be obtained.
Coordination between Contract work breakdown structure (CWBS) elements and the
SOW should commence. Each task element of the preliminary CWBS should be
explained in SOW. The project manager should establish a SOW preparation team
consisting of personnel from he deems appropriate.
Or experts in the area of technical, financial fabrication test, logistic, configuration
management operations safety, reliability and quality assurance. Before work has start
on SOW, project manager should brief CWBS and the nature of the contemplated
SOW. This Is the baseline to proceed further. The identified tasks may be assigned to
team members. Team members should develop specifications and Technical
requirements documentation that may apply to various elements of the proposed
procurement.
Checklist for SOW Preparation:

348
Is the SOW specific enough to permit a contractor to Make a tabulation and
summary of manpower and resources needed to accomplish each SOW task
element.
Are specific duties of the contractor stated so he will know what is required?
Are all parts of the SOW so written that it is clear to both the parties.
Is proper reference of document is described?
Are any specifications or exhibits applicable in whole or in part? If so are they
cited and referred to the appropriate SOW element.
Are directions clearly distinguishable from general information.
Is there a time–phased data requirement for each deliverable item? If elapsed time
is used does it specify calender or work days?
Are proper quantities shown?Have headings been checked for format and
grammer? Are subheadings are comparable?
Have appropriate portions of procurement regulations been followed?
Can SOW task or /contract line items and configuration item breakouts at lower
level so they can be summarized to CWBS elements.
Have all requirements for data been specified separately in a data requirements
appendix or its equivalent? Have all extraneous data requirements been
eliminated?
Are security requirements adequately covered if required?
Has its availablity to contractors been specified.
Finally, there should be management review of the SOW preparation and
interpretation
8.3 WORK BREAKDOWN STRUCTURE (WBS)
The project manager must structure the work into small elements that are:
• Manageable, in that specific authority and responsibility can be assigned
• Independent or with minimum interfacing with and dependence on other ongoing
elements.
• Integratable, so that the total package can be seen
• Measurable in terms of progress

349
The first major step in the planning process after project requirements definition is the
development of the work breakdown structure(WBS). The WBS is the single most
important element because it provides a common framework from which:
• The total program can be described as a summation of subdivided elements
• Planning can be performed
• Costs and budgets can be established
• Time,cost and performance can be tracked
• Objectives can be linked to company
• resources in a logical manner
• Schedules and status-reporting procedures can be established
• Network construction and control planning can be initiated
• The responsibility assignments for each element can be established.
• A copy of the WBS should be obtained .
• Coordination between CWBS elements and the sow should commence.
• Each task element of the preliminary CWBS should be explained in SOW.
• The project manager should establish a SOW preparation team consisting of
personnel from he deems appropriate.
Check List for Effective Work Breakdown Structure (WBS)
• Has WBS developed by subdividing the total effort into discrete and logical
supplements.
• Check the proposed WBS satisfies both functional engineering-manufacturing-
test)and program / project (hardware,services etc.) requirements including
recurring and nonrecurring costs.
• Check to determine if the WBS provides for logical subdivision of all project
work.
• Establish assignment of responsibilities for all identified effort to specific
organizations.
PROJECT SPECIFICATIONS
Project specification is a part of statement of work. Specifications are used for man-hour,
equipment and material estimates. Small changes in a specification can cause large cost

350
overrun. It avoids surprises for the customer downstream. The specifications must be
most current revision. It is not uncommon for a customer to hire outside agencies to
evaluate the specifications. Specifications are in fact standards for pricing out a proposal
MILESTONE SCHEDULES
Milestone schedules contain such information as:
• Project start date
• Project end date
• Other major milestones
• Data items
8.4 ESTIMATING PROJECTS
There will be higher degree of uncertainity and more inputs to the estimates have to be
treated as variable rather then constants.
The changes that have the greatest effects can be discussed in terms of the systems model
of project activities.
NAME NATURE ROLE ACCURACY
Rough/finger-in-
the air/ballpark
Much uncertainty
As what is involved
Early check on
feasibility of
brief
+or-25
As-buts As was carried out
previously with
Some Amendment
With an
appropriate
contingency
factor
+ or
- 15
Detailed
Estimates
Some solid initial work
is carried out
proposals +or-10

351
To finish At ending stage Additional
fund
+or-
5
COSTING PROPOSAL
There are two types of approaches to the preparation of costing:
1.Ground –up-costing
2.Top-down-Costing.
Ground-up-Costing: The estimate of each level in the work breakdown structure are
compiled and added together by each level of supervision in the project hierarchy
Top-down-costing: The amount of money is allocated to complete the project
activities and this has to be split between the sub-projects. The allocation is either
based on senior management estimates or through the use of target costing.
Top Down Ground-up
Project Manager Project manager collects Estimates.
Allocates budgets
To sub projects
TYPES OF ESTIMATES
• Definitive
• Capital Cost
• Appropriation(with capital cost)
• Appropriation
• Feasibility
• Order of magnitude
ACTIVITY LEVEL COST
Time: The direct input of labor into activities

352
Materials: Consumables and other items used in the process
Capital Equipment
Indirect Expenses: Transportation, Training
Overheads: Provision of an office financial and legal support and staff cost.
TECHNIQUES FOR TIME DETERMINATION
1. DIRECT WORK MEASUREMENT
2. WORK SAMPLING
3. SYNTHETIC ESTIMATION
4. LEARNING CURVE CALCULATIONS
ELEMENTS OF COST
Price =direct material+direct labour+ projects overheads+general overheads + profit
BUDGET
A written statement of money:where it is drawn from, its amount how it is to be spent
-Collins English Dictionary
Category of Budgets:Labour, materials, consumables, capital expenditure, travel -
Subsitance, etc.
Resource Analysis
-Crashing
-Resource allocation and smoothing
CRASHING
It is part of the project how to carried out the project in less time .Shortening one or
more project activities.
-Provide an incentive for work to be completed early eg.road work.
- Add additional resources such as extra people or machine capacity provide over
time additional contract etc.
- Parallel activities

353
- Reduce the level of technological change
- Compromise in terms of time or specifications or to commit extra resource
How to do ?
-Personal supervision of one or more activities which ensures an early completion
- Find out absolute latest time required
- -Discussion with the members of the projects
8.5 RESOURCE ALLOCATION AND SMOOTHING
-Resources are to be properly utilized
-Use responsibility matrix and responsibility matrix with resource loading
CPM/PERT
Critical Path Method (CPM)
Designed to provide intense micro-control
The system is dynamic; it continues to provide periodic reports as the project
progresses
It involves three Basic Steps:
It defines the job to be done
It integrates them in a logical sequence
It controls the progress of project plan.
Manager’s View of CPM
Activity
– A task or a certain amount of work required in the project
– Requires time to complete
– Represented by an arrow
Parallel activity
– Activities that start after a particular activity and progresses along with it
but finishes only after that activity is over.(E.g. Construction of a wall
and Plastering)

354
Dummy Activity
– Indicates only precedence relationships
– Does not require any time of effort
Event
– Signals the beginning or ending of an activity
– Designates a point in time
– Represented by a circle (node)
Network
– Shows the sequential relationships among activities using nodes and
arrows
Loops and Dangling
– Looping:Avoid looping by checking the precedence relationship of
activities by numbering them in logical order(Non Cyclic)
–
– Dangling: activities other then initial and final don’t have successor
events.

355
CPM Terminology
Path
– A connected sequence of activities leading from the starting event to the
ending event
Critical Path
– The longest path (time);
– determines the project duration
– Sequence of activities along which there is no free time.
Critical Activities
– All of the activities that make up the critical path
Earliest Start (ES)
– The earliest that an activity can begin; assumes all preceding activities
have been completed
Earliest Finish (EF)
– ES + activity time
Latest Finish (LF)
– The latest that an activity can finish and not change the project completion
time
Latest Start (LS)
– LF – activity time
Steps in CPM Analysis
Draw the CPM network
– A graphic view of the relationships among the required activities

356
Analyze the paths through the network
– Determine the length of each path (the time required to complete each
path)
– Starting at the beginning of the network and working toward the end (from
left to right), determine the ES and the EF for each activity
Path analysis (continued)
– Identify the critical path(s) (the longest path[s] through the network)
– The critical path(s) determines how long the project will take
Determine the slack for each activity
– Working from the end of the project network (from right to left), find the
LF and the LS for each activity
– Compute the activity’s slack
slack = LS – ES = LF – EF
– Slack is the maximum amount of time that this activity can be delay in its
completion before it becomes a critical activity, i.e., delays completion of
the project
– – – – – – – – – – CPM Network

357
Paths Enumerated Path Length of Path a-f-h 6 + 15 + 9 = 30 a-g-I 6 + 17 + 6 = 29 b-d-j 8 + 13 + 12 = 33* c-e-j 5 + 9 + 12 = 26
*Critical path
ES and EF Times
aa,, 66
ff,, 1155
bb,, 88
cc,, 55 ee,, 99
dd,, 1133
hh,, 99
ii,, 66
jj,, 1122
gg,, 1177

358
Program Evaluation and Review Technique (PERT)
The technique is based on the assumption that an activity’s duration follows a
probability distribution instead of being a single value.
The probabilistic information about the activities is translated into probabilistic
information about the project.
Three time estimates are required to compute the parameters of an activity’s
duration distribution:
– pessimistic time (tp ) – the time the activity would take if things did not go
well
– most likely time (tm ) – the consensus best estimate of the activity’s
duration
– optimistic time (to ) – the time the activity would take if things did go well
Steps in PERT Analysis
aa,, 66
ff,, 1155
bb,, 88
cc,, 55 ee,, 99
gg,, 1177 hh,, 99
0 6
0 5 5 14
8 21 21 33
21 30
6 21
jj,, 1122 d-13
ii 66 6
23 29
PPrroojjeecctt’’ss EEFF == 3333

359
Draw the network.
Analyze the paths through the network and find the critical path.
The length of the critical path is the mean of the project duration probability
distribution which is assumed to be normal.
The standard deviation of the project duration probability distribution is computed
by adding the variances of the critical activities (all of the activities that make up
the critical path) and taking the square root of that sum
Probability computations can now be made using the normal distribution table.
PERT Example
Activity Cost-Time Tradeoffs
Project managers may have the option or requirement to crash the project, or
accelerate the completion of the project.
This is accomplished by reducing the length of the critical path(s).
The length of the critical path is reduced by reducing the duration of the activities
on the critical path.
Cost-Time Tradeoffs
Immed. Optimistic Most Likely Pessimistic Activity Predec. Time (Hr.) Time (Hr.) Time (Hr.) A -- 4 6 8 B -- 1 4.5 5 C A 3 3 3 D A 4 5 6 E A 0.5 1 1.5 F B,C 3 4 5 G B,C 1 1.5 5 H E,F 5 6 7 I E,F 2 5 8 J D,H 2.5 2.75 4.5 K G,I 3 5 7

360
If each activity requires the expenditure of an amount of money to reduce its
duration by one unit of time, then the project manager selects the least cost critical
activity, reduces it by one time unit, and traces that change through the remainder
of the network.
As a result of a reduction in an activity’s time, a new critical path may be created.
When there is more than one critical path, each of the critical paths must be
reduced.
If the length of the project needs to be reduced further, the process is repeated.
8.6 COMPUTER SOFTWARE FOR PROJECT MANAGEMENT
Artemis Views (Artemis Management Systems)
FastTrack Schedule (AEC Software)
Microsoft Project (Microsoft Corp.)
Oracle Projects (Oracle Corp.)
PowerProject (ASTA Development)
Primavera Project Planner (Primavera Systems)SuperProject (Computer
Associates international)
Turbo Project (IMSI)
Evaluation of CPM/PERT
Activities are assumed to be independent.
It is assumed that there is a precise breaking point where one activity ends and
another begins.
Initially-critical activities might not receive the attention they deserve until it is
too late.
Activity time estimates might be biased.
The cost of CPM/PERT might not be justified by the value of the information it
provides.
Personnel might not understand the statistical underpinnings of PERT.
Wrap-Up: World-Class Practice

361
The project organizations are flexible enough to respond aggressively to business
opportunities.
Personnel are selected and trained to be flexible in moving from department to
department and project to project as needed.
Scheduling and control charts are frequently used because of their simplicity,
flexibility , low cost, and effectiveness as communication devices.
CPM, PERT, and PERT/Cost are also used to provide computerized activity-by-activity planning and control.
Project Feasibility Study According to P Gopal Krishnan and VE RAma Moorthy The project feasibility study is to be conceived of following point to avoid incomplete and inadequate preparation.
1. Executive Summary 2. project background and history 3. Demand and Market Study 4. Demand Projections 5. Forecasting Techniques 6. Export Projections 7. Market Penetration 8. Sensitivity Analysis 9. Sales forecast and Marketing 10. Production program 11. Plant Capacity 12. Materials and Inputs 13. Supply Program 14. Project Location 15. Plant Site within the location 16. Local Conditions 17. Layout and Physical Coverage of project 18. Technology and Equipment 19. Civil Engineering 20. Plant Organizations 21. Overhead Costs 22. Labor 23. Staff 24. Implementation Scheduling 25. Financial Evaluation 26. Economic Evaluation
Technical Feasibility :
1. Technology Considered and rationale for the ultimate choice of Technology

362
2. The cost of technology in terms of investment or lump sum payment of technology fees or royalty or annualized payments have to be determined and detailed.
3. Equipments have to be categorized as belonging to the production infrastructure or other categories the basis of their choice elaborated and their cost estimated with appropriate details of quantities and rates.
Economic and Commercial evaluation:
1. The nature of project should contribute to the national economy. 2. Raising of aggregate consumption could be one of the basic objectives in project
evaluation. 3. Prepare comparative Return Analysis and defined return analysis 4. Estimate total investment 5. Direct Capital Investment 6. Offsite facilities and Supporting Utilities 7. transfer of existing Capital item,Preliminary Project engineering expenses,
Working Capital Return on Investment 8. General Facities
Project Risk Analysis
1. Identifying Critical Sources of Risk 2. Measuring the quantum of risk 3. Incorporating risk in decision making
Project Monitoring and Controlling Process
1. Monitoring the Progress of Project Activities
2. Monitoring Consumption of Resources
3. Revision/Updating Of A Project Schedule
4. Reallocate (Addition/Shifting) Resources Among Activities.

363
Three Types of Time Based Control
1. Establishes Standards to Prevent Problems
2. Measures Activities When Performed
3. Measures Final Activity
Control of Major Constraints
• Time
• Cost
• Quality
• Environmental
• HR management
• Risk management
Time Management
• Purpose: Create a realistic schedule with the team
• Identify the activities (tasks)
– Activities are action steps (HOW) and different from deliverables that are
tangible results (WHAT)
– Use the WBS and scope statement
– Develop activity lists and revise the WBS
Feed forward Control and anticipate problems
Examples • Pre-employment drug testing •Inspect raw materials •Hire only college graduates
Focus is on
Inputs
Concurrent Control Solve Problems as They Happen
Examples •Adaptive culture •Total quality management •Employee self-control
Focus is on
Ongoing Processes
Feedback Control Solves Problems After They Occur
Examples •Analyze sales per employee •Final quality inspection •Survey customers
Focus is on
Outputs

364
• Sequence activities
– Consider dependencies
• Estimate durations (time)
– Top down, bottom up estimates, Monte Carlo simulations
– Estimating formulae (PERT estimates)
– Expert opinion
– Consider resource capabilities
– Look at similar projects
• Develop the schedule (Gantt chart)
– Document assumptions and decisions
– Use project management scheduling software e.g. MS Project
• Control the schedule
– Performance reports, change requests, time management plan, corrective
action, lessons learned
• E.g. baseline Gantt chart and then update
– Frequency
– Roles and responsibilities
– Control techniques e.g. meetings.
Cost Management
• Plan resources (people, equipment, materials)
– Consider WBS, scope statement, organizational policies, staff pool
– Identify resource requirements
• Cost centers at Your company?
– Time is money
• Cost budgeting
– Resource leveling
– Cost baseline
• Control costs

365
– Performance reports, change requests, cost management plan, corrective
action, lessons learned
• e.g. budgeted, actual, variance (with explanation)
Cost Variance = ACWP-BCWP
• ACWP= Actual cost of work performed
• BCWP= Budgeted cost of work performed
• ECAC= Total Budget +Cost Variance.
• ECAC= Estimated cost at completion.
BUDGETARY CONTROL
• Cost Standards
• Master Budget
• Production Budgets
• Project Budgets
• Human Resources Budget
• Financial Ratios
Quality
The totality of features and characteristics of a product or services which bear on its
ability to satisfy a stated or implied need”
Objective:
To provide a formalized system within the project system which ensures that the needs
of the customer or the stated objectives of the system are continually being met.
The process of implementing quality system
• Establishing the reason for wanting a system
Cash Budget • Estimates and reports cash flow on a daily or weekly basis to ensure that the company has sufficient cash.
Capital Budget • Lists planned investments in major assets. • Not only have a large impact on future expenses, they are investments designed to enhance profits .

366
• Train people and prepare for documentation
• Create documentation
• System for internal audit
• System for external audit
Quality Management
• Plan for quality
– Quality product and quality project management practices
– Quality standards
• Conform to specifications (project produces what it said it would)
• Fitness for use (satisfy needs)
• Prevention vs. inspection
• Plan, do, check, act
• Benchmark, checklists, flow charts, cause/effect diagrams
• Quality management plan
– Organizational structure, processes, resources, procedures, responsibilities
to ensure quality plan is implemented
– Quality metrics
• Checklists
• Quality Assurance
– Follow the quality management plan, audits, improvements
• Quality control
– Process and product results
– Control charts, Pareto diagrams, trend analysis
Quality Tips
• Start with a clear view of quality in mind
• What is quality?
• Implications for ALL knowledge areas
Total Quality Management (TQM)

367
• Commitment to infusing quality into every activity.
• Focuses on teamwork, increasing customer satisfaction, and lowering costs.
• Means a shift from a bureaucratic to a decentralized approach to control.
• Has a target of zero defects.
Most companies that have adopted TQM have incorporated.
• Quality
• Empowerment
• Benchmarking
• Outsourcing
• Standard for reduced cycle time
• Continuous improvement
Statistical Quality Control Steps
1. Define the characteristics of a high-quality output.
2. Breakdown work activities into separate elements required for producing a
high-quality output.
3. Have current and reasonable standards.
4. Discuss specific performance expectations for every job with workers.
5. Make check sheets and collect data for each task.
6. Evaluate employee progress at frequent intervals.
Requirements of environmental systems
• Commitment
• Environmental policy
• Environmental review
• Authority and responsibility
• Maintaining of relevant records
• Objectives and goals
• Plan of action

368
Drafting a Detailed Project Report. While drafting a Detailed Project Report following points are to be considered:
1. Product, Capacity and Applications 2. Market, Competition and Demand – Supply estimate 3. Production Process and Technical Arrangement 4. Plant and Machinery, Capacity and Cost, Equipments, the suppliers of machinery,
price delivery. 5. Land and Building 6. Electricity, fuel, water and steam are required to produce at full capacity, cost to
arrange for supply of these in the first instance and later for consuming these. 7. Project entail liquid effluent or air-pollution? What is the type of equipment to be
installed and process to be carried out to cope with the problem? 8. Location 9. Raw material, Working Capital, Manpower 10. Project Cost, Financial Incentives 11. What re the various sources from which money will be raised to meet the project
cost? How much money will be raised from each source? 12. Capacity Utilization, Income Expenditure and Profitability Projection. 13. Cash flow Projection, Debt Service. 14. What is the break-even level of operation –level at which enterprise will make
neither profit nor loss? 15. What will happen to profitability if some critical assumptions do not come true? 16. What will be a realistic time schedule for carrying out individual tasks pertaining
to project-implementation (setting up of enterprise)? 17. What will be the total time frame for implementation? 18. What are the important statutory formalities, which the enterprise must fulfill
prior to commencement of production? 19. What are the major factors, which will determine the enterprise performance? 20. What are the requirements of information to establish implement commission and
run the project? Where are they available? How are you going to manage these inputs of information?

369
Guidelines for micro/mini/small hydro electric power projects
Component of the Project The nature of projects can be reservoir, run of river or canal based. The projects can be divided in two parts civil and Electrical. The civil projects include various activities such as construction of Dam/Diversion weir, reservoir, and power channel. In-take tank, feeder channel, Fore bay Spillways, Pen Stroke and Tail race channel etc. Electrical Components covers turbine, Alternate controls, Transformation, Evaluation of Power etc. Project Design A small Hydro Power generating project design is based on availability of hydro potential and sufficient head to utilize potential energy which is used to generate electricity.
Design criteria further requires survey and investigation for selection of Land /site on topographical /geological and Hydrological grounds.
Details required for Mini/Micro/Small Power Generation projects.
1. Brief proposal indicating type of plant, availability of rate of flow of water and
head i.e. Run off river based or stored water type. 2. Availability of Land 3. Environmental and Rehabilitation Constraints, if any 4. Economics of Power generation 5. Peak Load existing and in Horizon Year 6. Connected Load 7. Demand Factor 8. Load Factor 9. Utilization Factor 10. Plant Factor 11. Whether proposed plant is of base load plant or stand by reserved plant 12. Proximity of load 13. Generation Voltage and Frequency 14. Transmission/distribution voltage and frequency 15. Specifications of equipments 16. Selection of Type and Turbine and alternator/with techno –commercial reasons 17. Tariff Calculations and Market (consumers) 18. Present Tariff Structure and expected increase in horizon year

370
The Broad Guidelines for Power Projects are provided by NABARD.
SUMMARY

371
Project Planning in general can best be described as the function of selecting the
enterprise objectives and establishing the policies, procedures and programs necessary for
achieving them. Characteristics of Project Planning are: project planning must be
systematic, flexible, enough to handle unique activities, disciplined through reviews and
controls and capable of accepting multifunctional inputs; task is required to be well
understood prior to being performed, much of the work can be preplanned; during the
actual task execution more knowledge is learned that in turn leads to changes in resources
allocations schedules and priorities. PERT is the technique based on the assumption that
an activity’s duration follows a probability distribution instead of being a single value,
the probabilistic information about the activities is translated into probabilistic
information about the project, and three time estimates are required to compute the
parameters of an activity’s duration distribution:
FOR DISCUSSION
1. What is project planning?
2. What are the characteristics of project planning?
3. Explain briefly about CPM.
4. What is PERT?
5. What are the differences between CPM and PERT?
6. Draft A project Report.
SUGGESTED BOOK READINGS

372
1. James P. Lewis, (2002), “Fundamentals of Project Management: developing core
competencies to help outperform the competition”, AMACOM Division,
American Management Association, USA.
2. Trevor Leonard Young, (2003), “The Handbook of Project Management: A
Practical Guide to Effective Policies and Procedures”, Kogan Page, USA.
3. Lauren Keller Johnson and Richard Luecke, (2006), “The Essentials of Project
Management”, Harvard Business School Press, USA.
4. P Gopalkrishnan and VE Rama Moorthy (1993). “Text Book of Project
Management.” Macmillan India Limited.Delhi.
5. Arun Kumar, Mp Sharma, Deepak Mathur (2003)Small Hydro Power : Initiatives
and Private Sector Participation. 3rd Edition. Publication by AHEC,IIT
Roorkee.Roorkee.