general field and office procedures … field and office procedures indirect discharge measurements...
TRANSCRIPT
Techniques of Water-Resources Investigations
of the United States Geological Survey
Chapter Ai
GENERAL FIELD AND OFFICE PROCEDURES
INDIRECT DISCHARGE MEASUREMENTS
By M. A. Benson and Tate Dalrymple
Book 3
APPLICATIONS OF HYDRAULICS
DEPARTMENT OF THE INTERIOR
WILLIAM P. CLARK, Secretary
U.S. GEOLOGICAL FURVEY
Dallas L. Peck, Director
First printing 1967 Second printing 1968 Third printing 1976 Fourth printing 1984
UNITED STATES GOVERNMENT PRINTING OFFICE, WASHINGTON : 1967
For sale by the Dlstributlon Branch, U.S. Geological Survey 604 South Ptckett Street, Alexandria, VA 22304

PREFACE
The series of manuals on techniques describes procedures for planning and executing specialized work in water-resources investigations. The material is grouped under major subject headings called books and further subdivided into sections and chapters; Section A of Book 3 is on surface water.
Provisional drafts of chapters are distributed to field offices of the U.S. Geological Survey for their use. These drafts are subject to revision because of experience in use or because of advancement in knowledge, techniques, or equipment. After the technique described in a chapter is sufficiently developed, the chapter is published and is sold by the U.S. Geological Survey, 1200 South Eads Street, Arlington, VA 22202 (authorized agent of Superintendent of Documents, Government Printing Office).

CONTENTS
Place,-,-,,,,,,,,,,-,,,,,-------,-,,,,,, Symbols and units- _________________________ Abstract-- __ _ _ _ __ _ _ _ _ _ _ _ _ _ _ _ _ _ _ _ - _ _ _ _ _ _ _ _ __ Introduction, _ ____ __ _ __ _--____-___ _ __ _ ___ _ _ Acknowledgmente ____ ._ _ _ _ -_ -__ _- -_ - _ -_ _ _-_ - Collection of field data- _ _ ___________________ Selection of site ____ ________-________________ Field survey- __ _ ___________________________
Vertioal control ____ _ _ _ __ ____ ____ _ __ ____ _ Peg~t--.,,----,,-,,,-,,-,,,,,,,, Adjustment of instrument- _ - _ _-_-___
Horieontal aontrol- _ __ __ ____ _____ _ _____ _ Field notes _____________ ________________ Surveying equipment--- -_ __ __ __-_ __ ____ _ Hints on surveying ______________________ Ground plan- _ _________________________
High-vater marks- _ _ _ ____ _ _ __ _ ___ -__ - _____ _ Surge _ _ _ _ _ _ _ _ _ _ _ _ _ _ _ _ _, _ _ _ _ _ _ _ _ _ _ _ _ _ _ _ _ Identification and rating of high-water
marke.----,,,,,,-,-~,,,,,,-------,----- Types of high-water marks _______________ Determination of gage height ____ __-_-_-__
Cross se&ions- ______________-______________ Survey--,,-,,----,-,-,-----,---,,,--,, SOUdiUgi3, _ - - me--e-----*------e----w--
scour--,-.--,-,-------,--,-,,,-,--,,,,
Measurement of horisontal distances _ __ _ _ _ Field notes_---------,-,----,,----,-,,-,
Photographs------------------------------, HietorilXl data----,-,,,,,,,,,----,,-,,--,,, Sampling streambed material ----------------
Definition____---,,---,,-------,,,,,,
PM0
III VI 1 1 2 2 3 3 3 4 5 7 7 8
10 10 11 11
11 11 12 13 13 13 14 15 15 15 17 17 18
Sampling streambed material-Continued Sampling of fine to moderately aoarse bed
material--,,-,,,,,,_,_,,_,,__,,,,,,,, Sampling of ooarse bed material- _________ Problem reaches ________________________ Analysis of data--,,,-,---,,,,,,,,,,,--,
Seleotion of roughness ooefficient--- _-_-__-_-__ Stable channels- _______________________
Base value ain------,,,,,,,,,,,-,,, Cross-seotion irregularities- _ _- __----- Depth of flow- _____________________ Vegetation-, _ _ _ _ _ _ _ _ _ _ _ _ _ _ _ _ _ _ _ _ _ _ _ Alinement----,,,---,-----,,,------ Example___,,,,,,__,,,,,,,_,,--,,--------
Sand channels--,,,,,--,,,,,---,,,,-,-,, Office procedures- _ _ _ __ ________ ____ _ __-_-_ - _ Order of oomputations ____ ___-_-_--_--------- Plan----,,,---,,,,,,,,,_,,,,,,,,,,,,,,_,---
Plotting methods- _ _____________________ Base line for stationing --_--_-___-_---~--
Listing of high-water marks- _____________-_-_ High-water profiles __________________________ Cross seotions- _____ __ _ ___ ___ ______ ___ _ _ _ _- _
Cross-section properties __________________ Computation of discharge-,- __ ___-_ __ - _ _ _ -- --
Conveyance----,-,,-----,-,-,-,----,,,, Friction loss __________________-_________ Velocity head- _ _ _______________________ Final discharge _________________________
Measurement summary___-,,,,,_-,,,--,--,,, Assembly of computations-, ____---_-__------ Seleoted references, _ __ __ _ ____ ___ __ _ _ __- _ - ---
18 19 19 20 20 20 20 21 21 21 21 21 22 24 25 25 25 26 28 26 27 27 28 28 28 28 29 30 30 30
FIGURES
1. Sample field notes illustrating system of horizontal and vertical control, with no inatrumenterror-------------------------------------------------------
2. Sample field notes illustrating system of horizontal and vertical control, with errorininetrument-------------------,,----------------------------------
3. Sample correotion curve to determine corrections applicable to elevations--- _ __ _ _ 4. Sample field notea illustrating sketches of reach and cross sections ____ ___ _ _ _ ____ 5. Sample field notes illustrating cross-section survey ____________________________ 5. Idealieed diagram of bed and surface configuration of alluvial streams with vari-
ouaregimesofflow------------,--------------------------------________ 7. Graph showing relation of stream power and medbn grain size to form of bed
roughnese-,-,,,,-,---,---,,,,,,,,-,,,,,,-------------------------------
TABLE
1. Increase of slope distanoe over horieontal diitance fo computing wetted perimeter--- ---------_----__________________________-----------.,------
PM.
5
6 6 8
16
23
24
PNtC
29 V

SYMBOLS AND UNITS
A ai B h/ h. H.I. K K, la Q R S V V
1. 2
f E
VI
Dcllnf#on Allea. Area of subsection. Gravitational constant (acceleration). Head loss due to friction. Velooity head at a section. Height of htrumezit. Conveyanoe of a section. Weighted oonveyanoe for a reach. Manning roughness coefficient. Total discharge. Hydraulio radius. Water-surfsae slope. Mean velocity of flow in a se&ion. Mean velocity of small subarea. Subscripta which denote the location of cross sections or section
properties in downstream order. Velocity-head coe5cient. DiBerence in values, as Ah ia the differenoe iu head; part of total. Summation of values.
vnu fb ft’ ft#/sec’ ft ft ft f9/sec ft’/sec fty’ ft’/sec ft ft ft/sec ft/sec

GENERAL FIELD AND OFFICE PROCEDURES FOR INDIRECT DISCHARGE MEASUREMENTS
By M. A. Benson and Tate Dalrymple
Abstract
The discharge of streams is usually measured by the current-meter method. During flood periods, how- ever, it is frequently impossible or impractical to measure the discharges by this method when they occur. Consequently, many peak discharges must be determined after t,he passage of the flood by indirect methods, such as slope-area, contracted-opening, tlow- over-dam, and flow-through-culvert, rather than by direct current-meter measurement.
Indirect methods of determining peak discharge are based on hydraulic equations which relate the dis- charge to the watergurface profile and the geometry of the charmeL A fleld survey is made after the flood to determine the location and elevation of high-water marks and the characteristics of the channel.
Detailed descriptions of the general procedures used in collecting the field data and in computing the dis- charge are given in this report. Each of the methods requires special procedures described in subsequent Ch&@?rS.
Introduction
The discharge of streams is usually measured by means of a current meter. Techniques of making current-meter measurements are stand- ardized and well known. During floods, how- ever, it is frequently impossible or imprac- tical to measure the peak discharges when they occur, because of conditions beyond control. Roads may be impassable; structures from which current-meter measurements might have been made may be nonexistent, not suitably located, or destroyed ; knowledge of the flood rise may not be available su&iently in advance to permit reaching the site near the time of the peak ; the peak may be so sharp that a satisfac- tory current-meter measurement could not be made even with an engineer present at the time ; the flow of debris or ice may be such as to bare- A a vent use of a current met&; or limitations of
personnel might make it impossible to obtain direct measurements of high-stage discharge at numerous locations during a short flood period. Consequently, many peak discharges must be determined after the passage of the flood by indirect methods, such as slope-area, contracted- opening, flow-over-dam, flow-through-culvert, critical-depth, or others, rather than by direct current-meter measurement.
A knowledge of peak discharges or volumes of flood runoff is extremely important for the design of flood-control works or other struc- tures along river channels. The discharges as obtained from stage-discharge relation curves at gaging stations are used generally without question of accuracy. Because the upper por- tions of many such rating curves are necessarily defined by indirect measurements, it is impor- tant that the methods used in these measure- ments should be based on the proper data and should make use of the best procedures known, in order that the highest possible accuracy be obtained.
This manual describes the general field and office procedures for making indirect measure- ments as done by the Geological Survey, Water Resources Division. The methods are the re- sult of integrated experience over a period of years, of past investigations, snd of recent re- search, in both the field and in the laboratory, designed to improve the general knowledge and accuracy of such methods. Practices peculiar to each method will be found in four subsequent chapters, A2-AS, of Book 3, Techniques of Water-Resources Inve$igations.
In order to evaluate the accuracy of indirect methods, comparisons have been made at every opportunity. Where it has been possible to compare peak discharge computed by indirect
1

TECHNIQUES OF WATER-RESOURCES INVESTI~A~ONS
means with peak discharge measured by current meter or other direct means, the agreement, in general, has supported confidence in the reliabil- ity of the a,uxiliary methods. During the floods of May-June 1948 in the Columbia River basin, comparative studies using the slope-area method were made for 22 locations, where the discharge was known.. One computation showed a differ- ence of 25 percent between the known and the computed discharges. Of the other 21 measure- ments, the maximum divergence was 15.6 per- cent; the average divergence was 6.7 percent. This study shed some light on the nature of conditions which lead to large inaccuracies, and, together with succeeding investigations, should help to avoid unfavorable conditions and thereby increase the accuracy of indirect methods in the future.
Since 1953, when the most recent method was adopted for computing discharge through con- tractions, a, program of field verification of the method has been carried on, with favorable results. Surveys have been obtained to date at 22 sites where discharges were known. Of these, about 80 percent gave results within 10 percent of known discharges; all were within 20 percent.
Other verification studies have confirmed the reliability of computations over dams and through culverts.
The Columbia River basin studies have been made the basis of a reference library of verified values of Manning’s n, obtained by starting with the known peak discharge and computing the value of n. Color stereophotographs of the slope-area reaches were taken so that channel conditions corresponding to the computed n values could be identified. This so-called veri- fication program is continuing with the object of expanding the range of illustrated roughness conditions.
Indirect measurements make use of the energy equation for computing discharge. The spe- cific equations differ for different types of flow, such as open-channel flow, flow over dams, and flow through culverts. However, all the meth- ods involve these general factors: 1. Physical characteristics of the channel:
dimensions and conformation of channel within reach used, and boundary condi- tiOIlS.
Water-surface elevations at tim0 of peak stage to define the upper limit of the croBs- sectional areas and the difference in eleva- tion between two significant points.
3. Hydraulic factors based on physical char- acteristics, water-surface elevations, and discharge, such as roughness coefllcients and discharge coefficients.
Acknowledgments
Many engineers in the Geological Survey,con- tributed to the development of the methods described in this report. The original develop- ment of field techniques which Hollister John- son began was continued by Tate Dalrymple, M. A. Benson, R. H. Tice, H. H. Barnes, Jr., G. L. Bodhaine, Harry Hulsing, H. F. Matthai, W. P. Somers, R. E. Oltman, and many others. Many of the methods are based on extensive laboratory investigations by the Survey con- ducted by R. W. Carter, H. J. Tracy, Jacob Davidian, D. B. Simons, and E. V. Richardson. Professor C. E. Kindsvater, Georgia Institute of Technology, played a major role in the lab- oratory investigations while serving as a con- sultant to the Survey.
Collection of Field Data
The data required for computation of dis- charge ,by indirect methods are obtained in a field survey of a reach of channel. The survey includes the elevation and location of high- water marks corresponding to the peak stage, cross sections of the channel along the reach, selection of a roughness coefficient, and descrip- tion of the geometry of dams, culverts, or bridges if this type of measurement is to be made. The selection of a suitable site is prob- ably the most important element in the applica- tion of the indirect method of discharge meas- urement.
Selection of Site
A thorough reconnaissance of the flood area is necessary for selection of sites at which de-

GENERAL FIELD AND OFFICE PROCEDURES FOR INDIRECT DISCHARQE MEASUREMENTS 3
termination of the flow cau be made. Every site is a distinct hydraulic problem, and a thorough knowledge of hydraulic principles is essential to proper selection. Ideal conditions for such determinations rarely exist, and judg- ment must ,be used in choosing the most favor- able of the possible sites by weighing advan- tages and disadvantages of each.
It is possible sometimes to preselect indirect- measurement sites for gaging stations. The possible sites might differ depending upon the flood stage. A listing of these sites on the field- station description would keep this information in the most easily accessible place. By such a procedure vital time would be saved following a major flood. Unless it is known that favorable conditions for indirect measurement exist near the gage, preliminary selection of sites can usually be most easily made from either topo- graphic maps or aerial photographs.
After preliminary selections have been made from maps or aerial photographs, or if the avail- able maps show no definite choice of sites, then field reconnaissance is necessary for making the selection. Under poor conditions, it may be necessary to explore miles of river channel to find a favorable reach. The final selection of site should always be dependent on field in- spection.
Where extensive flooding occurs, reconnais- sance by air has been used to locate indirect- measurement sites. As the terrain is viewed from the air, likely sites and access routes may be marked on a map.
It is important that no major tributaries enter between the measuring site and the point at which the discharge is desired. Minor tribu- taries may carry negligible flow at the time of the mainstream peak and thus not affect the result. If the measuring site is at some distance from the gaged point, then even with no ap- preciable inflow there may be a significant channel-storage correction. If the storm pro- ducing the flood covers the basin, the peak may increase in a downstream direction; if the storm covers only the upstream part of the basin, the peak may decrease in the main channel. Dis- tance from the gaging point becomes more im- portant for smaller drainage areas and for
sudden floods of short duration. Adjustments can be made, but unless detailed information of the flood wave or inflow rate is recorded, the ad- justments are necessarily arbitrary. Because of these uncertainties, it is desirable to keep the measuring site close to the point at which the discharge is wanted, and it is sometimes prefer- able to accept less favorable conditions at a site nearer to the gage.
Field Survey
The field survey should be made with a high degree of care, giving particular attention to using all possible checks to avoid error.
Various instruments have been used for making the field survey, but experience has shown that an engineer’s transit is best suited for the job. It is recommended that a transit be used to make a “transit-stadia” survey. This method combines vertical and horizontal con- trol surveys in one operation, is accurate, simple, and speedy.
Surveys have been made by level-and-tape and by planetable, but these are not recom- mended. The first does not provide the exact locations of high-water marks and channel features that are necessary, and the second is not suited for work in rough terrain, in high wind, or in rain. Also, in any one office indirect measurements are made at infrequent intervals and personnel cannot maintain expertness in all types of instruments and surveys. As the transit-strdia method is believed best, only this type is recommended.
Vertical control
If the measuring site is near a gaging station, the survey datum should be gage datum, or gage datum plus a convenient constant, such as 10.00,20.00 or 100.00 feet, to avoid possible neg- ative elevations. Otherwise, an arbitrary ele- vation may be assumed either for a reference mark, the first hub, or the first E.Z. If the sur- vey datum is not gage datum, reference marks of a permanent nature should be established to permit recovery of the datum years later, if necessary.

4 TECHNIQUES OF WATER-RESOURCES INVESTIGATIONS
The system of vertical control corresponds to what is sometimes described as “reciprocal leveling.” This method maintains balanced ele- (I vations throughout the course of the survey in moving from one transit setup to another. A long sight and a short sight are taken from each of two successive hubs (stakes over which transit is set). The shont sight consists of measuring up from the hub to the level of the eyepiece of the instrument, using either a level rod, an engineer’s folding rule, or a tape. The meas- urement can be made within 0.01 foot and is therefore equal in accuracy t 1 other observa- tions. The method of “reciprocal leveling” is equivalent to making a “peg test” between each of two successive hubs. The differences in elevation o’btained (when averaged) are there- fore a cont’inuous record of the error in adjust- ment of the telescope level. If the differences are plotted against the (doubled) distances be- tween hubs and an average line drawn, the elevation correction for any distance thus deter- mined may be used to adjust the elevations on side shots. If the error is over 0.03 foot per 100 feet, the instrument should be adjusted.
The field notes shown on figure 1 illustrate the start of a survey using the prescribed method of vertical control. The differences in the eleva- tion of iY.Z.‘s represent random, not instru- mental, errors. Figure 2 is a replica of the same set of notes, with an instrumental error of 0.03 foot per 100 feet in the rod reading (rod read- ings are too low). Note that despite the instru- mental error, the elevations of the E.Z.‘s and of the hubs used under each transit setup are exactly the same as in the first set of figure 1. The method of deterfnining the corrections to elevations is illustrated on figure 3. In the notes, the H.Z. determined from the preceding hub is always entered first, then the E.Z. com- puted from the hub on which the instrument is set. The second 19.1. is subtracted from the first, and the difference plotted against the sum of the two distances read between the hubs, as on figure 3. An average straight line is drawn through the plotted points, starting from the origin. [Nom.-The line should go through the origin unless a systematic error is being
made in measuringwp from the hub.] Correc- tions based on this line are applied to elevations of only the side shots, using the algebraic sign as detarmined from the correction curve. Nota that these balanced elevations agree with cor- responding elevations of the notes of figure 1.
Elevations of hubs, reference marks, and high-water marks are read to hundredths of a foot; elevations of cross sections are generally read to’ tenths of a foot, except those of dam crests, culverts, and paved highways, where hundredths are used. Stadia readings with ver- tical angles should not be used for determining elevations, except in unusual cases for cross sec- tions. If used, the adjustment of the vertical circle should first be checked.
Where the rod held on high-water marks or other features is above or below the horizontal line of sight, or where a reading of the hori- zontal crosshair is obstructed, time may be saved with no appreciable loss of accuracy by use of the “interval” or “stepping” method. Whole or half stadia intervals may be used, for as many as 3 intervals. By holding the number of intervals to a maximum of 3, the error from this source will be a maximum of 0.002 foot vertically per 100 feet of horizontal distance. The method is usually limited to side shots, but with extreme care it may, if necessary, be used between hubs.
Where a small fall in water surface is in- volved, every effort should be made to keep the instrument in good adjustment and to adjust the elevations of high-water marks.
If the area covered by the survey is small, and all shots are made from one instrument setup, no evidence of instrument error is available; a peg test should then be made and shown in the notes, or a peg test made on the same day should be referred to. An alternative would be to use a minimum of two hubs on each survey, so that the notes would automatically contain a test of the instrument.
Peg test
Establish two points, A and B, near ground level, 200-300 feet apart. The test may be run between’ these points or stakes in either of two ways.

GENERAL FIELD AND OFFICE PROCEDURES FOR INDIRECT DISCHARGE MEASUREMENTS 5
I I I 17.38+6 62=24 0 196/+440=~4 1=24. 0
10
/Goose River near Mmha ffan, Term. ’
3
3
3
3
3
3
Figure 1 .-Sample field notes illustrating system of horizontal and vertical control, with no instrument enor.
1. Set up exactly halfway between A and B. Take a rod reading a on stake B and a rod reading b on stake B. The computed ele- vation difference, a-b, is the true differ- ence, regardless of instrument error. Set up close enough to B so that a rod reading can be obtained either by reading through the telescope in reverse or by measuring up to the horizontal axis of the telescope by steel tape. Take a rod reading c on stake A and a reading d on stake B. If the in- strument is in adjustment, (o-d) will equal (a- 6). If the instrument is out of adjustment, compute what the correct rod reading e on B should be (e= b +~--a) and adjust the instrument to obtain that reading.
2. Set up close to A on a line perpendicular to line 8-B, assume an elevation for a, take backsight on A and foresight on B, and compute elevation at B. Set up close to B on a line perpendicular to line 8-23, take
backsight on B and foresight on 8. The closure difference represents the instru- ment error in twice the distance between B and B. Compute the balanced elevation at B and the required foresight at A to ob- tain the correct starting elevation. Adjust the instrument to obtain the required foresight.
Adjustment of instrument
All surveying instruments should be main- tained in good adjustment. Full testing and ad- justment is best done before taking the instru- ment into the field. Some highly specialized or delicate instruments may require a skilled tech- nician for major adjustment. Proper care and handling will reduce the need for adjustment in the field. The transitman should know the characteristics of the particular instrument he uses and be familiar with the routine adjust- ments that can be made in the field. Keep the manufacturer’s handbook or an adequate sur-

6 TECHNIQUES OF WATER-RESOUBCES INVESTIQATIONS
Figure I.-Sample field notes illustrating system of horizontal and vertical control, with error in instrument.
I River new Monhaffan Tenn.
3
3
3
3
3
0
-0.35
-0.30
-0.25
-0.20
-0.15
-0.10
-0.05
0
IIMII~ I/III (11 /IIIIIII I I i
I I I I I I II 11 1 , 0 200 400 600 800 1000
DISTANCE, IN FEET
Figure 3.4ample correction curve to determine corrections applicable to elevations.

QENERATJ FIELD AND OFFICE PROCEDURES FOR INDIRECT DISCHARGE MEASUREMENTS 7 veyiug text readily available. Detailed proper sequence are important because of the interrelation of the various adjustments that might be required.
The p?escribed method of keeping field notes compensates for constant instrumental errors. However, keeping errors within appropriate limits reduces the need for note corrections, reduces the chance for mistakes, and saves money.
Horizontal control
Begin horizontal control by referring the survey to magnetic north. After establishing zero azimuth, observe a distant point as a check point for use later in the survey or in the future if the survey has to be recovered. Read stadia distance and azimuth for each surveyed point. Read angles to the nearest minute of arc for all hubs and reference points, to the nearest 5 minutes for high-water marks and other side shots. When moving from one hub to another, read the stadia distance again from the second point to the first; take a backsight (for setting azimuth) on the preceding station either (1) with telescope plunged and upper plate clamped at the forward azimuth, or (2) with a telescope normal and uptier plate clamped at the forward azimuth plus 180”. After the first setup, read the magnetic bearing at each successive setup as a check on the computed azimuth. Remem- ber that steeel bridges, powerlines, and other metal kbjects may affect the magnetic bearing. If these procedures are followed, there is ordi- narily no need for closure of the horizontal traverse. At times, however, surveys may cover large flooded areas, and the terrain may be so rough that short distances between hubs and many transit points are needed. Under such conditions, the cumulative error in posi- tion may become large enough to require some supplementary means of avoiding large errors of horizontal closure. It may be necessary to use triangulation to establish firmly the principal traverse corners.
Locate the site on a map and refer it to the gaging station and to roads, tributaries, or other landmarks in order to deEne the location. Tie iu and describe the location of permanent or semipermanent marks so that the horizontal
control can be recovered some years later, if necessary.
Field notes
An example of the recommended form of keeping field notes is shown on figures 1 and 4. A step-by-step explanation of the procedure covering both the horizontal and vertical controls, follows : A. Set transit o& station 1 (a solidly set
stake or the equivalent). 1. Clamp upper plate at zero; with lower
plate unclamped, point telescope to magnetic north as indicated by compass needle. Clamp lower plate and loosen upper clamp. Angle readings will now represent azimuth from magnetic north. The azimuth of magnetic north as 0’00’ is recorded on line 1 (see sample notes, fig. 1).
2. Read azimuth, stadia distance, and rod on reference mark RP2 and record on line 2 ; compute H.Z. and record on line 4.
3. Measure distance from top of hub at station 1 to telescope horizontal axis as 5.14 ; record in parentheses (denoting reading not obtained by transit) and compute elevation of station 1 as 20.08 (line 5).
4. Read azimuth, stadia distances, and rod on all side shots ; repeat reading on RP2 as check.
5. Read azimuth, stadia distance, and rod on station 2 ; tighten upper clamp on azimuth to station 2 ; loosen lower clamp; com- pute preliminary elevation of 17.37 for hub 2 (line 11). B. Set transit over station 2.
1. Check vernier reading to see that no slippage has occurred while moving and that reading checks azimuth from station 1 to 2. Plunge telescope and sight on station 1. (Wheu Zeiss level or theodolite-type instruments are used, telescope cannot be plunged ; azimuth at station 2 and succeeding stations is transferred by setting upper plate to read forward azimuth plus 1800, then backsighting on preceding station.) Tighten lower clamp and loosen upper clamp. Plunge telescope back to nor- mal position; read azimuth of magnetic north and record on line 14.

8 TECHNIQUES OF WATER-RESOURCES INVTGSTIQATIONS
Photo s 4 S/n Tfh of ted. /
Phofc.“S Smifh Of eCf: 4 0
/ \ Snake creek neur Conneld Wash.
Figure 4.-Sample field notes illustrating sketches of reach and cross sections.
2. Measure distance from hub 2 to Me- scope horizontal axis as 4.34 (record on line 15). Sight on station 1, read back azimuth, stadia distance, and rod (line 16).
3. Compute elevation of B.Z. (1) by adding premiously determined elevation of hub 1 (20.08) and backsight on hub 1 (1.65) ; (2) by adding previously determined elevation of hub 2 (17.37) and distance above hub 2 (4.34). Average of 2 computad EJ.‘s is 21.71 feet (lme 13),.-which is balanced elevation. Com- pute balanced elevation of hub 2 from H.Z. of 21.72 as 17.38 (line 15).
4. Take readings on all side shots, then on next setup location, transit station 3. Tighten upper clamp on azimuth to station 3, loosen lower clamp, move to station 3.
Surveying equipment
Standard types of surveying equipment are most commonly used. For most work, the usual
engineer’s transit, with a telescope of 13-24 magnification, is satisfactory. Light mountain transits have been used extensively for this work. On large-scale surveys, involving long traverses, it may save time and expense to obtain the use of a high-powered instrument which allows much longer sight distances. The Zeiss Opton level is being used in regulation indirect- measurement work. This is a high-powered rugged compact level with an automatic self- leveling feature which speeds up leveling work; it also has a horizontal circle which is read through an auxiliary eyepiece. The enclosed optical system does not fog up when working in the rain. The one major disadvantage is the inability to turn the telescope vertically, as in using the “stepping method,” or in orienting on a distant point. Another disadvantage is lack of a compass.
Standard 1eveI rods of either the Philadel- phia or Chicago types are usually used. A 16- foot rod has been found advantageous. A

GENERAL FIELD AND OFFICE PROCEDURES FOR INDIRECT DISCHARGE MEASUREMENTS
hinged stadia rod may also be used. A rod level for plumbii the rod is recommended for accuracy as well as speed. Range poles are not necessary but they are often useful for obtain- ing alinement, for taping, or for locating cross sections in photographs. A steel tape and engi- neer’s folding rule graduate in hundredths of a foot are needed. A hand level is useful in re- connaissance.
All surveying instruments are precision in- struments which must be handled with cam. Give particular care to protecting the transit while enrouto in an automobile. Wrap or set the carrying case in some soft material to pro- tect the instrument from shock. A mauled and dented carrying case is a sign of abuse. In brush or woods, carry the tripod under an arm with the instrument forward where it can be watched. Do not drive stakes with level rods. Set aside an old level rod for sounding in water. Use graphite in the slip joints of the three- section Chicago rod. Clean and oil steel tapes a&r use. Check and keep all instruments in good adjustment at all times Level rods and engineer’s rules are subject to error, particu- larly at the joints. Check them periodically.
A boat is needed at times for stream crossings or soundings. Desirable materials are marine plywood, aluminum or fibre glass. A boat should preferably be at least 14 feet long. A light boat may be carried on top of the car, using a rack; a heavier <boat requires the use of a trailer. A motor of at least 10 horsepower should be used and kept in good condition.
A hand level, plastic tape (for flagging), a taping weight, an axe, and plenty of stakes, are needed ; also nails, cloth measuring tape, crayon, paint, and chisels for marking high-water marks and reference points.
A weight should be available for sounding from bridges ; standard sounding weights may be used. The standard stream-gager’s tagline or a heavier boat tagline is ideal for cross-sec- tioning. For soundings from a boat a wading rod, range pole, or an old level rod may be used.
Camera equipment is a necessary part of the field equipment ; stereocameras are recom- mended. It is also desirable to have a small drawing board and drafting machine, or at least
9
some triangles and a protractor, for field draft- ing*
Special equipment is occasionally needed for unusual circumstances. Where high-water marks are high in trees or on a steep bank, a ladder has ~been found to be timesaving. When necessary to work in rainy weather, a tractor- type umbrella can be held in a &foot pipe driven in the ground beside the instrument. In dark woods a trashlight is useful for lighting up the level rod and reading the transit vernier. On large-scale surveys where the men may be some distanw away or across a wide r&r, two-way “waJkie-talkie” radios, or transceivers, have sbeen used advantageously. Short-range l+$- watt output transceivers weighing less than 2 pounds serve well. Flexible antennas, recharge- able batteries with charger, and carrying cases are useful acceseories.
Boots and waders are usually needed, and wet-weather equipment such as raincoat and hat, add to the engineer’s comfort. If both the rodman and the instrumentman wear distinc- tive type clothing, such as red coats, shirts, hats, or vests, they can locate each other in a mini- mum of time in heavy woods. Life jackets should always be worn in boats. The kapok type is preferred to inflatable vests.
The following is a suggested checklist for items which may be included when assembling equipment for an indirect-measurement trip. Preparalmy :
Reconnai8annce not.43 Notes on high-water mark locatlone Meld notea of prevloua survey Beviews of previous -0ntn Maw Station deecrlptlona Bench-mark deecrlptlona
survey : !l!ransit mpod Lavel rvda Level-rod level Hand level Englneer’e folding rule or 6f t steel tape Notebook and nvte paper Stakes Hatchet, are Machete, brwh cutter marking equipment :
Nails, tape, -won, paint, chieel Field drafting equipment

10 TEcIwlQuES OF WATER-RESOURCES INYESTIQATIONS
cross sectlonr~ : Tagline Wading rod, old level rod Boat, oar6, motor, fuel Sounding Une, weight, reel Boota Waders Metal1442 tape
Photographa : Stereocamera Color fllm Light meter Trim
Yiacellaneomt : ‘&ream-gaging equipment Packboard, knapsack Rope, sMng Two-way radios 3-e carpentfs% Ied Drinking-water container First-aid kit Life Jackets Ladder
Hints on surveying
In indirect-measurement work, the vertical survey requires a higher degree of precision than the horizontal. When setting up over a hub, a plumb bob% not ordinarily necessary 89 the instrument may be placed with sufiicient ac- curacy by dropping a pebble. However, it is wise to use a plumb bob and tack at one hub, say the first, so that a resurvey can more readily be accomplished. Short sights in a large survey require plumbing and sighting to tack points on the two hubs. For levels involving only one in- strument positioxi and run to arbitrary datum, an assumed HJ. of 99.99 has merit in that sub- traction of foresight is made very simple.
When taking stadia readings, it is simpler to set the lower crosshair on the nearest footmark (with the telescope thumbscrew) than to at- tempt to subtract the lower reading from the upper while the telescope is level. To save time of releveling, note the reading of the middle crosshair before moving the telescope, then re- set to the same reading with the telescope thumbscrew after noting the stadia distance. Check the bubble ; if level, the instrument must have remained level during readings.
If part of a cross section is low enough for the top of the extended level rod to be below
the horizontal line of sight, hold the rod bottom at belt level or some othe+point 01: the body and add the distance from that point to the ground to the rod reading. This frequently saves mak- ing an additional setup and is s&ciently ac- curate on cross-section elevations which are being determined to the nearest 0.1 foot.
In taking side shots to high-water marks, the transitman can save time by reading the rod for elevation and stadia, then waving the rodman on and reading ‘the azimuth while the rodman is moving to the next high-water mark.
Ground plan
A plan sketch is needed showing all natural feature of the site which are pertinent to the measurement. Show channel for some distance upstream and downstream from the actual reach, so that the flow pattern and its effect on the high-water profiles can be judged. Show direction of the flow in the channel with an ar- row. If the high-water lines do not d&e the channel alinement, as when a low-water chan- nel meanders in a flood plain, take some shots to locate the lower-water channel. Locate trib- utaries or any minor bypass channels. Indi- cate any high ground, ridges, G&s, or other features which would affect the distribution or type of flow. Describe details of the ground cover, such as the extant of open fields, land un- der cultivation, brush, and wooded areas.
Locate buildings, roads, fences, or other such manmade features for their relation to the problem, to identify the reach, or to help orient photographs of the site. On the sketch show position and direction of the camera for each picture.
AIways make a field sketch in the notes to show all the important items, both natural and cultural. Many of the features need not be located exactly by the survey. Make the field sketch carefully, because it may be a suEicient basis for transferring details, such as ground cover, extent of trees, and other features, onto the final plan. Show detailed dimensions of structures, such as bridges, culverts, and dams, by auxiliary sketches.

GENERAL FIELD AND OFFICE PROCEDURES FOR INDIRECT DISCHARGE MEASUREMENTS 11
High-Water Marks
High-water marks are the evidence of the highest stage reached by the flood. There are many different types of marks, and the proper identification of them is that part of the work which requires the most experience: For this reason the most experienced man in the field party should act as rodman and locate the high- water marks.
High-water marks tend to disappear rapidly after the flood peak, particularly in humid regions where rain is frequent. For this reason start the work of surveying as soon as possible after the peak. If enough field parties are not available, locating the high-water marks at the desired sites before making the complete sur- veys may be worth while. Identify the marks by means of stakes, cloth tags, paint, paint sticks, nails, or crayon. Make field sketches showing t.he approximate locations of these marks for the benefit of the survey party. Be- cause it is difficult to stake out sufficient marks in this manner, the field party should attempt to survey all additional marks necessary to define the profiles well.
Locate many high-water marks on both banks through the reach and for a considerable dis- tance above and below, in order to aid in inter- pretation of the pro&s. The slope as deter- mined by these marks is probably very nearly parallel to that of t.he water surface prevailing at the time of the crest stage.
Select high-water marks on surfaces parallel to the line of flow so that they represent the water surface and not the energy grade line of the stream. However, there may be times when ponded elevations representing the total energy head are desirable, such as in dam, bridge, or culvert computations. High-water marks on the ground where wave action and runup from surge are at a minimum are generally prefer- able to those in bushes and trees as defined by debris which has been carried up, by wave ac- tion or the velocity of the current, to a level above the prevailing water surface. Even along the banks, the upstream sides of project.ions into the stream will tend to show higher marks be- cause of runup or velocity-head recovery, where- as embayments may have lower elevations.
Under such conditions, obtaining of more close- ly spaced marks is advisable, to show the shape c f the water’s edge and to aid in interpretation.
Surge
The effect of surge on the high-water marks found on the banks is an important point to be considered. Observation and photographs of floodflow in natural channels show that, al- though there may be extensive wave action in the middle of a fast-flowing stream, at the sides, velocities are low and the water surface quiet. Although there undoubtedly is some effect from surge, the high-water marks should be used as found and no adjustments attempted for surge. Any adjustments would necessarily be subjec- tive and would lead to questionable results. This is justified by the fact that roughness values as determined from “verification” studies are determined from high-water marks on the banks, and any effect of surge is contained in the n values determined ; if similar n values are applied for like conditions using the same meth- ods, then the effect of surge would be minimized.
Identification and rating of high-water marks
In the field notes, describe the type of high- water mark, such as “drift on bank,” “wash line,” “drift on upstream side of tree.” Also rate each mark as “excellent,” “good,” “fair,” or “poor.” All this information will help in interpreting the high-water profile.
Types of high-water marks
Many kinds of material which float, chiefly vegetative, are left stranded at the high-water line (and at lower elevations) when the water subsides. The finer material produces more definite and better marks and is apt to repre- sent the highest elevation that the water at- tained than would some scattered clumps of large drift. Leaves or cornstalks are apt to become waterlogged, and at the very edge in slow velocities they will not rise with a slight rise of the water surface. In this manner, a

12 TECHNIQUES OF WATER-RESOURCES INVESTIGATIONS
mound of .material, sometimes a foot or more in height, will form at the edge of the channel. Where this occurs, the elevation found by hold- ing rod on. the top of the mound would be the proper high-water elevation if the material is consolidated; if the material is loose, the shore- ward toe would be the correct elevation.
Much drift usually will be found on bushes or trees within the channel. Such marks are not generally as dependable as those on the banks. In swift water, varying amounts of pileup duel to velocity will affect the marks at the upstream side of such objects. Marks at the downstream sides of large objects may be lower than normal. Brush in fast velocities often will be bent downstream by the flow, and drift will be caught on the upper limbs. When the veloci- ties slow down, the brush becomes erect once more, and the drift will appear to be at an ele- vation much higher than that of the actual water surface. In quiet water on overflow plains, the highest drift in brush or trees may be relia.ble,.
Often the small seeds of various plants will provide excellent high-water marks, remaining in the crevices of bark or in the cracks in fence posts or utility poles. The highest of such particles should be used. At times, seeds will adhere to smooth surfaces and encircle trees, poles, metal posts, or guy wires. When present, seeds are an excellent source of high-water data.
In arid regions, or where sandy soil or steep- ness of banks prevent vegetative growth, the water surface may lap against bare banks. Soil will be washed away by the moving water and under some conditions will show “wash lines” which may be reliable high-water indicators. Good marks are indicators by the straightness of the top of the wash line. Where the bank is steep or the soil unstable, the material may slough to elevations above the water surface. This condition may be recognized by the uneven ragged line at the top edge of the washing- such marks should be avoided. Usually wash lines are poor.
Water carrying mud or silt will at times leave easily recognizable lines along banks, on trees, brush, rocks, and buildings. If there is only a slight difference in color, the mud line may be more readily visible from a distance.
Foam lines are common on bridge abutments, wingwalls, riprap, poles, and trees. They may be affected by velocity head pileup.
Buildings within the flood plain should be investigated; they sometimes are an excellent source of high-water marks. Even relatively clean water will leave stain marks within build- ings. Excellent marks may be found on windowpanes or screens. Use car0 to select marks that are not affected by velocity head, as are marks on the upstream side of buildings in an area where velocities were high. The ex- posure of flood-water entrances into buildings should be noted in order to judge drawdown or pileup.
High-water marks on snow are not reliable. The flood debris may be deposited on snow which partially cmelts before a survey is made, leaving marks at a false elevation.
Even though high-water marks around houses have been cleaned up or destroyed by rain, valuable information may be available from residents of the flood area. The information is usually reliable where .the water has come into a dwelling place, particularly if the family re- mained there at the time or returned shortly after. Information about flood heights away from dwellings, such as on trees, fences, or slop- ing ground, are frequently not reliable, par- ticularly if much time has elapsed or the facts are secondhand. All such data should be con- firmed independently, if possible. Photographs taken at time of flood crest by local residents may be helpful in guiding the search for flood. marks.
Determination of gage height
A series of high-water marks to define the water-surface elevation at the gage site should be obtained. Large differences, as much as 3 feet or more, between river elevations and those recorded in gage wells have been observed. This points up the necessity, in routine gaging-sta- tion operation, for establishing the relation between outside and inside gages at all stages, and the desirability of defining stage-discharge relations with reference to an outside gage, if at all practicable. High-water marks should also

GENERAL FIELD AND OFFICE PROCEDURES
be obtained in the gage well if the recorder was not operating during the flood.
It is often important to obtain high-water marks at sites where gaging stations have been discontinued. This may make it possible to ex- amine the consistency of a computed discharge at another location with respect to the old stage- discharge relation. It may also provide an additional figure of peak discharge at the dis- continued site, if the rating curve is defined to that stage.
Cross Sections
Cross sections should be identified as section 1,2, 3,4, etc., in downstream order.
Locate cross sections as nearly as possible at right angles to the direction of flow. On large streams it may be necessary to break the cross section at one or more points to maintain the se&ion roughly perpendicular to the flow.
In slope-area measurements, the conveyance is assumed to vary uniformly between cross sections ; therefore take cross sections at major breaks in the high-water profiles. Plot the high- water marks and the profile in the field before surveying the sections. Rough plotting is ade- quate for this purpose providing high-water marks have been surveyed separately on each bank along lines roughly parallel to the flow. A better method is to use a field drafting ma- chine for making the plan and either to plot the profiles by simple projection or, as for the final plotting, to refer the stationing to a base line.
If the profiles appear to represent a series of somewhat regular waves, locate the cross sec- tions at each end of the selected reach at com- parable parts of the waves--both at the crest or both at the trough.
It is important that enough high-water marks be available near the ends of cross sections to define the high-water elevations there. Plot- ting profiles in the field will assure that sections are located where the profiles are well defined. It may be possible to obtain additional marks, if needed, where the plottings indicate sections to be desirable.
In extremely rough channels, locate the cross se&ions so as to represent average or typical conditions. Where large scattered boulders are
FOR INDIRECT DISCHARGE MEASUREMENTS 13
present, the cross sections should not wholly avoid them or include a disproportionate num- ber of them.
Survey
The first step in defining cross sections is to drive stakes to be used as auxiliary hubs, at both ends of a cross section, and to tie the eleva- tions and locations of these hubs into previously established transit stations. In surveying the cross section, set up the transit over a hub at one end and measure the distance from the top of the stake to the horizontal axis of the tele- scope to compute the 19.1. The line of sight is fixed by a sight on the hub at the opposite bank. Take rod reading to tenths of a foot at interme- diate points to define the cross section, establish- ing temporary turning points on the other side. If the cross section is short enough that a tag- line may be stretched across it, determine the depths by setting up on one of the transit sta- tions in the regular traverse, rather than by setting up over a hub on the cross section. A tsgline should be used whenever possible.
Take enough readings to defme the major breaks in the bottom, with a minimum spacing such that not more than about 5 percent of the total area will be between any 2 sounding points. Only a few depth observations are needed in shallow overflow portions containing only a small percentage of the total area and discharge. At the edges of the stream, take rod readings to hundredths of a foot on the water surface. Determine elevations of the streambed either (1) by direct rod readings on the bottom, (2) by sounding down from the water surface and adding these distances to the average rod read- ings to water surface, or (3) by deducting the soundings from t,he water-surface elevation.
Soundings
Soundings from the water surface may be made from a boat by using a weighted line, a wading rod, or an old level or stadia rod. When sounding a rough or boulder-bed stream, do noi set the rod consistently either at the top ok boulders or between them at each point. Be- cause the average bed elevation is required, set,

14 TECHPNIQUES OF WATER-RESOURCES INVESTIGATIONS
the rod down at random at the predetermined spacing. The degree of definition of nontypical large obstructions, such as scattered large-sized boulders, is a matter of judgment. If the sec- tion contains a typical number of such obstruc- tions, then define each fairly closely, providing the cross-sectional area involved is significant.
Hold a boat in place by a tagline while sound- ings are made, or position it by sighting from the boat to two range poles placed on the cross section. For wide streams, locate a boat at sounding points by triangulation, sighting from a transit located at a known position on the bank.
If the stream is too deep to wade and if no boat is available, there are various methods for obtaining soundings. One simple and effective method commonly used is termed “diddling.” A stadia :rod or a marked board 6-12 feet long is used on which the footmarks are numbered. Attach a rope or tagged line to the top by means of a drilled hole, a hook, or staple. One man on each bank holds an end of the line, both walk upstream a short distance with the line taut and the board floating on the water with the loose end pointing downstream, then both turn down- stream and at the same time lift the end of the line. Or, both men stand in one place, let the pole float downstream a few feet, swing it up- stream, lift the line, then pull down. The loose end of the board will plunge to the bottom, and the upper end will pivot around the lower end. At the moment the board is vertical, read the depth of the water on the board. Tenths be- tween the footmarks are easily estimated. Pull the tagline from one bank and feed it from the other until reaching the next sounding point in the section.
A varia,tion of this method is the use of a 12- foot steel range pole which is heavy enough for the lower end to drop to the bottom in ordinary velocities. Swinging the line at the top will bring it to a vertical position.
Another method which has been used suc- cessfully is to stretch a I/-inch cable across the stream between trees, with a carrier pulley rid- ing on the cable. Place the carrier on the cable at one bank with a tagline fastened to it. From the other bank a line is passed over the pulley for sounding. The man with the tagline keeps
track of the stations and the man on the oppo- si!te bank sounds the stream. A IO-pound weight is convenient for sounding with this arrangement.
These methods necessitate getting a line across the river, and the first two require the presence of a second man on the opposite bank. A man may cross at a ford or bridge upstream or downstream from the section, or he may even swim across. Getting the line across is some- times a difficult problem. A small weight at one end of a fine line may be thrown across by twirling; the other end of the fine line is at- tached to the tagline. The initial fine line may also be thrown across by using either a casting rod or a bow and arrow.
S tour
Because of scour and fill, the beds of streams composed of loose silt, sand, or gravel may be unstable during flood periods. The mean eleva- tion of a channel bed after the flood, when the survey is made, may not be the same as at the time of the peak stage. This is particularly true at natural contractions of stream channels or at contractions caused by bridge construction. These conditions may limit the use of certain indirect methods, and therefore should be con- sidered in the choice of a site or method. A general knowledge of the scour-and-fill regime of streams in a given region should be used as the basis for determining whether a particular method is applicable at a given site.
Sand channel streams do not scour appre- ciably in a fairly uniform reach of river chan- nel. As shown by Beckman and Furness (1962) the bed elevation at any one point in the cross section is continually changing by scour-and- fill action, but the mean elevation of the bed re- mains virtually constant. Similar results were reported by Culbertson and Dawdy (19M). The cross sections obtained by survey after the flood should represent conditions at the time of the peak in this type of reach.
A thin mantle of sand lying on bed rock or other hard material will probably be thrown into suspension during flood flow. If filling has occurred after the peak, it is sometimes pos- sible to determine the bed elevation at the time

GENERAL FIELD AND OFFICE PROCEDURES FOR INDIRECT DISCHARGE MEASUREMENTS 15
of the peak by measuring the thiclmess of the sand layer. This is done by pushing a small rod through the sand to the hard bottom. Re- cord in the field notes the elevation of both the top and bottom of the sand.
The bed elevation at the time of the peak at contractions on sand channel streams cannot be determined by postflood surveys. Avoid these sites.
Measurement of horizontal distances
Measurement of horizontal distances along a cross section usually is by stadia. For a small stream, however, it. may be done by using a steel tape or a tagline. A tagline across a stream can be used for horizontal stationing as well as a means for holding a boat in place.
On a long cross section the stadia method may be used. The azimuth is fixed and need not be read at intermediate shots. Read stadia distances and rod readings at each point. It is possible to read the stationing of observation points directly on the level rod by the following procedure :
If the instrument is set on the left section-hub, which is used as station 0, then obtain the sta- tioning for any point along the section by setting the lower crosshair on 0 of the level rod. The upper crosshair reading ( X 100) equals the station distance. If a turning point is taken at, for example, station 150 and the instrument is set over that station, then in proceeding forward, set the lower crosshair on 1.50 for each succeeding shot and again read the station at the upper crosshair. This can be done in reverse. If the transit is first set up on the right-bank hub, which is determined by stadia to be, say, 350 feet away from the left hub (station 0) , then read directly the stationing of any point along the line by setting the upper crosshair at 3.50 and reading the station on the lower crosshair. Show the method used in the notes.
Field notes
The field notes regarding cross sections should provide the following information : 1. Location and stationing of two stations,
usually at ends, of cross sections.
2. ‘Stationing and elevation of all intermediate cross-section points.
3. Stationing and elevation (to hundredths) of water surface on both banks at time of survey.
4. Types of ground cover along the sections and stationing where cover changes (to aid in subdivision and assigning of n values).
The recommended form for cross-section notes is shown on figure 5. A single line is used for each observation of depth. This allows more room for notes regarding cover and is easier to follow when turning points are taken along a section.
A field sketch of each cross section should be made a part of the field notes. The sketch should indicate shape of the cross section, the types of material along the bottom, the probable subdivision points, and the values of Manning’s n assigned to the subdivided portions. (See fig. 4.)
Photographs
Photographs should be taken at the time of the field survey. Adequate photographs will allow review and appraisal of the site conditions by those who have not seen the site. They make possible a comparison in the office with reference photographs illustrating values of Manning’s roughness coefficient. A minimum of 4-6 pictures is recommended. Stereophotographic transparencies in color are preferred.
Flat black-and-white pictures are better than none at all, but they do not come close to de- picting actual conditions. Stereophotographs in black-and-white recover some of the relief which is lost in the single image picture, but they do not help the loss of detail caused by the lack of color. Color photographs (single slides) are superior even to black-and-white stereopictures in showing detail, and give some depth. However, looking at good color stereo- photographs is almost the equivalent of being at t,he scene.
Seasonal changes in vegetation can very rapidly alter conditions in a channel. Often maintenance work or dredging is done follow- ing major floods. It is therefore essential that photographs be obtained as soon as possible after

16 TECBNIQUES OF WATER-RESOURCES INVESTIGATIONS
,, -
t ,I
48 18.4
59 21.42
88 22.9
12s 23.0
I39 21.93
156 17.4
226 /4.6
294 15.2
314 13. I 355 Il. 4
39 7 10.5
466 9.0
53s 70
610 443
610 5.1
0
0
/ Armoho River mot- CXop,ae f, Tex. \
0
0
0
Figure S.-Sample field notes illustmting cross-sedion survey.
the occurrence of a flood peak. There is one ex- ception to this. The channel bed is important in influencing the roughness. If the water is high when pictures are taken, the bottom can- not be adequately depicted. It may be neces- sary to return for pictures of the bed at a later date, when the water is low or the channel dry.
Pictures should show some general field con- ditions and the channel layout, if possible. They should also show details either of ground cover, which influences the friction co&cients, or of artificial features, such as bridge abut- ments, piers, dams, roadway crests, and culverts, which influence the determination of contrac- tion or discharge coefllcients. In a slope-area reach, general views upstream and downstream through the main channel are the most impor- tant. Values of Manning’s rc are assigned to the channel as a whole for trapezoidal channels, so that views showing the whole channel are needed. Closeups are required of important details, such as those showing the channel bot-
tom and roughness on both banks. Details of overflow portions will require many pictures to show all the pertinent features.
When a stream has either a rough boulder or a ledge bottom, it is important that pictures be taken looking both upstream and down- stream. In many places, boulders are arranged like shingles so that their flatter sides are facing upstream, and the shorter sides facing down- stream. Ledge rock is sometimes stepped in the same general manner. Views looking down- stream will show a much smoother appearing bed than will those looking upstream, so that both aspects are needed.
Some means of identifying the location of cross sections and the height of the peak stage in the pictures should be used. A man may stand on a cross section and hold a level rod horizontally at the elevation of the peak. Colored. flags large enough to show in the pic- tures may be posted at the ends of cross sections. Range poles driven into the ban& have been

- GENERAL FIELD AND OFFICE PROCEDURES FOR INDIRECT DISCHARGE IvIEASUREMENTS 17
used to identify sections and flood stages. Photoidentification frames are also useful. These are clamped on a level rod and accom- modate cards which identify both the cross sec- tion (by number) and the number of the photo- graph. The frame may be moved up or down on the level rod to indicate the water-surface height. Another scheme is to place a small blackboard in the frame of the picture, on which both the station name and the picture number may be marked.
At the time of taking the photographs it is necessary to make notes describing the location of each shot, and what is pictured. This de- scription can Ibe made a part of the field notes. For small channels a short description of the view makes the location self-evident. For large-area complicated sites, it sometimes helps to show, by an identifying number and arrow on the field sketch, the camera location and the direction of each photograph.
Information on the label of the stereophoto- graph should include : 1. Ident&ng rmmber of picture. 2. Name of stream, location, and State. 3. A brief description of the tiew, such ae “down-
stream view through reach from 50 ft above Sec. 1” “along Sec. 2 from right bank,” “upstream &TV from rt. overflow, SM!. 3, &a. 60,” “d.8. view along left bank,” etc.
4. Date of taking the picture-this 1s important be- cause of changes in vegetation or other changes which may take *place between the date of the flood and that of taking ,the picture.
Historical Data
When indirect measurements are made fol- lowing major floods, information concerning the relative magnitude of the current and past floods should be obtained. Information on old flood stages will probably have been obtained previously, if the measurement is at a regular gaging station. However, if the site is one pre- viously ungaged, information on past floods should be sought from nearby residents. Fre- quently, the local residents can supply informa- tion on the stages reached by older floods of definite dates. Such information is obtained
most easily following an extreme flood, when interest in floods is high. Samples of pertinent information that might be obtained are listed below : 1. Highest flood since 1912, according to Henry WiIke,
who is oldest nearby resident. This flood is 1.4 it higher than stage of 1923 flood (previous high), on porch roof+, Ipointed out by him.
2. This flood is 2.1 ft lower than that of 1945 and 1.3 ft lower rthan that of 1896, which were the two highest previously known floods, according l&o the local newspaper. The previous stagea are marked on the northeast corner of the city hall, and flood- ma& for .this peak were still visible.
It is of little value to say that a flood is the highest known, unless the period of flood knowl- edge can be determined.
Sampling Streambed Material
The hydraulic resistance to flow in a stream channel is partly governed by the size of the bed material. This information is also useful in studies of the behavior of rivers. It is thus rec- ommended that the median size and the size distribution of the bed material be determined as a part of all slope-area surveys.
To obtain this information the bed material has to be sampled and a decision has to be mad8 on how to sample, Two methods can be used. One requires the removal of a bulk sample of bed material and the separation of the sample into portions wherein the material is of a given size class. The other method requires the meas- urement of selected individual particles at various points on the bed, and the partition of their total number into size classes by counting the number of particles within each class. The former is a volumetric method, pcihereas the l&t,- ter is an area1 one; hence the results obtained by the two methods may show some disagree- ment. The applicability of one or the other of the two methods will usually be governed by the bed material. Where the bed particles are very large, it is clear that a volumetric sample would be prohibitive. On tile other hand, where the bed particles are very small, the area1 counting and measuring of single particles will be practically impossible.

18 TECHNIQUES OF
Definition
wATFdz-REsolJRcEs
classes
A particle of bed material is usually de- scribed b,y the lengths of its axes. The three mutually orthogonal axes are the long, the in- termedi+, and the short axis. Throughout this paper the term “particle size” will refer to the length of the intermediate axis, which is the axis that governs the passage of a particle through the opening of a grid such as is used in sieve screens.
Sampling of fine to moderately coarse bed material
characterizing the sample. If the material is composed of a mixture of silt and clay (as large as l/is mm), the sample must be analyzed by methods which relate the fall velocities of the particles to their diameters, and the analysis of this sample will have to be done in a well- equipped laboratory. If, however, the sample is composed of sands (l&-2 mm), granules (2- 4 mm), or pebbles (ss large as 50 mm), or of a mixture of these, the analysis of the particle sizes of the sample can be done directly in the field.
If the bed surface material at a given reach of a river is. composed of a mixture of silt-sand and larger particles which do not exceed 2 in- ches (about 50 mm) in size, the volumetric method should be used. The procedure for ob- taining the sample is as follows: If the composition of the bed material is uni-
form throughout the reach, and if the reach can be waded, obtain the sample with a flour scoop by scraping the bed material at about 5-10 random points within the reach and compounding all the point samples in- to one. If the reach cannot be waded, ob- tain the sample from a boat by using a drag bucke,t and collecting in a downstream direction. In this way the mouth of the bucket stays in contact with the bed material. Dragging in an upstream direc- tion may help the water currents lift the bucket from the bed.
The size, of the sample is governed by the size of the largest particles, but the following criteria can be used in practice (the volumes indicated apply to the composite sample) :
-Silt and clays Volume (IA56 to l/is mm)----- _____ 250 cc or 1/z pt
Sand (j/is to 2 mm)-------- 500 cc or 1 pt Granules (2 to 4 mm) __-___ 1,000 cc or 2 pt Pebbles (4 to 64 mm) ________ ‘1/2 to2gal
1 Mlnimnms depending on prevalent &es.
After the point samples have been gathered into one large sample which is assumed to reflect the distribut,ion of the bed-material sizes within the IWWII, the sample has to be divided into size
The equipment necessary for the analysis con- sists of sieves and graduated glass cylinders. The sizes of the sieves required depends on the sizes of the particles in the sample, and the number or sieves to be used depends on the num- ber of size classes into which the sample should be divided. However, 9 or 10 sieves are prob- ably sufficient to obtain acceptable results and handling them in the field is not particularly difficult.
The screen sizes manufactured grade from openings as small as 0.037 mm (400 sieve num- ber) up to openings of 2 inches (50 mm). However, because wet sieving is used in field- work, the smallest suitable screen opening is 0.21 mm. Material passing through this screen size can be collected in a pan and classified as “smaller than 0.21 mm.” For average bed materials that range in particle sizes from clny- silt to pebbles of 50 mm or so, the following sieve sizes should give reliable results : Pan, 0.21 mm, 0.42 mm, 0.84 mm, 1.68 mm, 3.36 mm, 6.35 mm, 12.70 mm, 25 mm, 50 mm. 1
1
1
1
1 1 I I E Ii 1 S
t
If the range of particle sizes is smaller addi- tional sieve sizes will have to be added between the given ones to obtain more accurate results.
Begin the sieving by stacking the sieves with Lhe largest screen on top. Introduce the sam- ple in the top sieve and pour water on top of ;he sample so that the material is washed down tnd separated into different size classes by the sieve screens. While the water is being poured, hake the sieves in n lateral vertical motion to lacilitate the passage of mnterinl. If the sam- >le is large, and especially if there is a sub- itantis amount of fine particles, take care not o overload the sieve stack because material can
lNVWI!IWl'IONS
to compute the statistical parameters

QENERAL FIELD AND OFFICE PROCEDURES FOR INDIRECT DISCHARGE MEASUREMENTS 19
-
clog the fine screen. In these occurrences it is suggested that the sample be divided into a number of subsamples (none more than 2 pt) and that each subsample be sieved separately. The material retained on each screen from each sieving can be collected together afterwards. Use a small steel brush to remove the particles which become entrenched in the screens.
men the total sample has been separated into size classes by sieving, the volume of each size class can also be measured in the field by the water-displacement method. For this, grad- uated glass cylinders can be used. If the sample does not exceed 2 pints of sand and (or) granules, two l,OOO-cc plastic cylinders with graduations every 10 cc can be used. If the sample is larger and pebbles as large as 50 mm are present in the sample, two 2,000-cc glass cylinders with graduations every 20 cc can be used. A glass or plastic funnel with a wide short stem to fit the graduates will also be necessary.
The procedure for determining the volumes by the water displacement method is simple and is as follows : Fill the graduates halfway with water; read
and record the volume in each graduate. Drain all ‘sieves for a few minutes and decant as much water as practicable from the bottom pan without losing the fines. Introduce the material collected in the bot- tom pan to a graduate; read and record the new gross volume. Introduce the material retained on the finest screen to the grad- uate; read and record the,new gross volume. Continue these steps for each progressively larger screen until each size class has been measured. Determine the volume of mate- rial in each size class by subtracting the volume readings before and after each ad- dition of material to a graduate. After all the volumes thus recorded are listed by increasing size classes, the data are ready for statistical treatment.
Sampling OF coarse bed material
Where the bed material contains particles that measure 50 mm (2 in.) or more, an area1 sam- pling of the reach is indicated. For the applica-
tion of this method, only a tape (preferably graduated in millimeters) is necessary. Unlike the other method, the collection and the anal- ysis of the sample can be done continuously in one operation.
The method is extremely simple and very rapid. If the reach can be waded and if the bed material size range is similar everywhere, one person selects and measures the intermedi- ate axis of particles at various random points in the reach. Record the values.
Sample at least 100 particles in a reach when using the area1 sampling method. If the bed material covers a wide range of sizes, include 300-400 particles in the sample. To space the sampling points randomly, begin at one end of the reach at the quarter point of the channel width. Proceed to the other end of the reach along a line at the locus of quarter points of channel width, taking a sample at regular paced intervals to provide a third of the total. Re- turn along the locus of midpoints of channel width, taking a sample at the same paced inter- vals. Make the final course along the locus of the three-quarter points in the same manner to complete the sampling.
The physical picking of particles at each point is done by reaching down with the hand and removing (if the particle is too heavy, it can be measured directly under the water) the first particle that comes into contact with a finger. To obtain a more nearly random sample, take care not to look at the material when sampling in clear waters. Unless the actual measurements are of interest, tally them directly under prede- termined-size classes. The derivation of the pertinent statistics can be carried out on the data obtained by adding the number in each size class.
Problem reaches
Some reaches of rivers may not exhibit a uniform distribution of particle sizes. In fact, if the reach is fairly long, chances are that pools and ritlles may be present and that the particle sizes at the riffles are larger than in pools. Bends and meanders in rivers also pro- duce lateral changes in bed-material sizes. In these occurrences, the random sampling of the

20 TECHNfQlJES OF WATER-RESOURCES INVESTIGATIONS
entire reach by either of the two given methods has to be mod&d to take into account the dif- ference in the sizes of the particles. This is done by considering the proportional areas of riBles and pools with respect to the area of the entire reach and by collecting the sample correspond- ingly. Similar considerations apply whenever part of the reach has particles decidedly smaller or larger than the particles throughout the rest of the reach on the average.
Another Ijroblem occurs when bedrock is ex- posed within part of the reach and a measure of roughness, regardless of its source, is desired. Here the grid spacing is determined as before, and if a sampling point falls on the bedrock, the roughness is measured as the height of any protrusion present in the bedrock at that point.
Another problem exists where the reach can- not be waded and the bed material is coarse. Here, in the absence of specialized equipment with which single particles can be moved ,from the bottom or be measured in place with diving equipment, no easy solution is possible. If the reach can be waded at some points, it is sug- gested that a measure of the bed-material sizes can be obtained at those points; assume that the rest of the bed material is similar in size distribution.
Analysis of data
The data recorded from the sieving or the counting can be arranged to yield the pertinent statistical parameters that characterize a given sample by the following procedure.
Arrange size classifications in ascending order and reduce the volume or number of particles in each class to a percentage of the total. Ac- cumulate the percentages and plot them against the respective class sizes on log-probability paper. The percentage of the total sample which is finer than any given size can be deter- mined from the graph. Particle sizes corre- sponding to 84,50, and 16 percent are commonly used in studies of roughness and sediment transport.
Selection OF Roughness CoeH icient
Stable channels
Three-quarters of a century after the intro- duction of the Manning’s n, the selection of roughness coefficients in natural channels re- mains essentially an art. Consequently, the ability to evaluate the resistance factor in nat- ural channels representing a wide range of con- ditions must be developed through experience.
The Geological Survey’s continuing program to define values of n for streams over the country has resulted in a comprehensive photographic slide library in 3-dimensional color covering a wide variety of channels. These n value verifi- cations represent a wide range of size and aline- ment of channel, size of bed material, vegetation, and cross-section irregularities. These photo- graphic reference files which are available in each Survey office enables the less experienced engineer to select an n value for a channel under consideration by a near-realistic and visual com- parison of that channel with similar channels having defined coefficients. Values of n ranging from 0.024 to 0.170 are presently included in this reference slide file.
The factors which exert the greatest influence upon the coefficient of roughness are the char- acter of the bed material, cross-section irregu- larities, depth of flow, vegetation, and alinement of the channe1.l These factors are interdepend- ent to a certain extent, and consideration of one factor must take cognizance of other factors. The roughness coefficients for a given channel may be selected by first choosing a basic value for a straight uniformly shaped channel reach in the natural material involved and then in- creasing the basic value by increments to ac- count for deviations from the base condition.
Base value of n
The base values of n for the bed material forming the wetted perimeter range in value from about 0.025 for firm earth to about 0.070
‘Bnmes, H. H., Jr., 1965, Roughness charocterlstlcs of natural channels : written communication to be published as U.S. Geol. Survey Water-Supply Paper.

GENERAL FIELD AND OFFICE PROCEDURES FOR INDIRECT DISCELUGE MEASUREMENTS 21
for large boulders. A tabulation of roughness coefficients for the basic channels is given below.
Bed material sizr
(mm) (hchw) Concrete ________ ______ __________ 0. OK!J. 018 Firm earth------ ______ __________ 025- .032 Sand----------- l- 2 __________ : 026- .036 Gravel- _ _ _ _ _ _ _ _ 2- 64 0.078- 2. 5 .028- .035 Cobbles- _ _ _ __ __ 6k-256 2.5 -10.5 .030- .050 Boulders--- _ _ _ _ _ >256 >lO .040- .070
Cross-section irregularities
Irregularities in the channel cross section, such as rock outcrops or scalloped banks, will increase the basic value of n by as much as 0.020. A gradual change in cross-section shape throughout the reach is considered to have a negligible effect on n.
Depth of flow
Based on comparisons with logarithmic equa- tions which employ the relative roughness con- cept, the basic value of n in a uniform channel would not vary with depth of flow, if the ratio of depth to size of the roughness elements were greater than 5 and less than 276, provided either that the width were large relative to the depth, or that the bed and bank materials were the same. This ratio usually is within the range of 5 to 276 for conditions encountered in slope- area measurements. The verified values of n in the photographic slide file also represent con- ditions within this range of relative roughness with the exception of those for streams with large boulders.
However, verified values of n in several natural channels at varied depths within banks have shown in most streams a decrease of n with an increase in stage, because bank roughness is usually less than bed roughness. In other in- stances the bank conditions (brush or overhang- ing trees) may cause an increase in n as the stage increases. Abrupt changes in cross-sectional shape may change n values. A composite n may decrease abruptly with stage where wide shallow overtlow sections become effective, with large decrease in the hydraulic radius and small in- crease in discharge. Such situations are best handled by subdivision of the cross section in main-channel and overflow sections and by assigning of separate n values to each sub- division.
The depth of flow should always be con- sidered in selecting a vaQe of n. However, the evaluation of the effect of depth on the rough- ness coefficient must be based on experience and the verification photographs.
Vegetation
Vegetation, such as trees, bushes, and weeds, may cause an increase in n as much as 0.04, depending on the degree to which the cross sec- tion is occupied, type and density of growth, and height of growth in relation to depth of flow.
Experience indicates that for boulder-bedded channels with small ratios of depth to width, the influence of vegetation is usually minor. On the other hand, for relatively steep-banked nar- row channels often found in flat humid areas, the dense lush vegetation covering the banks and overhanging the channel may cause a large increase in n.
Alinement
The increase in roughness coefficients due to curves and bends is generally considered to be less than 0.003. For relatively sharp bends caused by heteromorphic formations, the in- fluence may be greater and is more difficult to evaluate. This is the principal reason for recommending that bends of this type represent a relatively small portion of the reach to be considered, if they cannot be avoided altogether.
For cases when floods in meandering channels are out of banks, and flow across the meanders following the general direction of the valley, the value of n is subject to large increases, de- pending on intervening overbank conditions.
Example
The basic value of n for the cross section is selected by considering the length of the channel half way to each adjacent cross section. An ap- propriate amount for each pertinent factor is added to the basic value. 1. Basic R: channel is composed of well-graded
material with maximum diameter 6 in., mean depth about 6 ft ____________________ 0.038
2. Bank irregularities : deep scallops, irregularly spaced, but banks make up less than 6 per- cent of wetted perimeter -_-----_-___--_-_ .062

TECHNIQUES OF WATER-RESOURCES INVESTIQATIONS
depth-discharge relationships evident in a given 3. Vegetation : winter season, no leaves ; dense wlllov~ along both banks, few scattered trees, about 10 percent of area affected---- 0.001
4. Alinemeat of channel: very sl.igh.t curvature to le.& no effect ____--__------------------ 0
nforreatk ----------------------- -- .ou
The value of n selected by this procedure is usually subject to review by more experienced personnel on the basis of a description of the bed material and comparisons of photographs of the reach with those of a similar stream for which the value of IL is known. If significant changes are indkated, experienced personnel should select new values of rc at the site. Arbitrary changes ‘on other bases are not recommended.
channel. The sequence of con@uratio~ de- scribed is arranged d developed by continually increasing discharge. Ihe lower regime ocours with low discharges, the upper regime with high discharges ; an unstable discontinuity in the depth-discharge relationships appears between the two more stable regimes.
The roughness co&cient for the three bed forms in the upper regime of flow depends pri- marily qn the size of the bed material, but in the lower regime of flow the form roughness of the dunes greatly increases the value of the rou&.ness coefficient.
Sand channels
A sandl-channel stream is defined as one which has an unlimited supply of sand in the channel bed. Sand by definition has a size range from 0.062 to 2 mm, but the procedures given in this section apply only to streams with a median size of bed material less than 1 mm.
Resistance to flow in sand-channel streams varies between wide limits because the con- figuration of the channel is a function of the velocity, grain size, shear, temperature, and other variables. Laboratory and field studies by the Geological Survey have defined the six primary types of bed configurations listed in the table below and illustrated on figure 6.
The forms of bed roughness are grouped below according to two separate conditions of
Slope-area measurements in the sand-channel streams should be limited to the upper regime of flow at this time because of lack of de&i- tion of roughness co&cients for the lower regime. Fortunately, major flood peaks on most streams of this type occur when the bed configuration is in the upper regime.
Values of Manning’s n for upper regime flow may be selected from the following table which shows the relation between median grain size and the roughness coefficient.
Median flrah &a Mannhi n 0.2 mm 0.012
.3 .017
.4 .020
.6 .022
.6 .m3
.3 .026 1.0 .023
Type of t?mafgmtion
Lowe;l~n~~dof flow: . _-_-_---------
Ripplea----------------
Dunes- _ _ _ _ _ _ _ _ _ _ _ _ _ _ _ _
7Jpperrn$xnndof flow: _--m------m---
Standing waves _________
A&dunes-- _ _ _ _ _ _ _ _ _ _ _ _
T --
-
-
DesarIpth
Bed
Plane; no sediment movement- _ _ _---. Small uniform waves; no sediment
movement. Large irregular saw-toothed waves
formed by sediment moving down- stream; waves move slowly down- stream.
Dunes smoothed out to plane bed- _ - - Sm~s~~ofmmsoidal waves m fixed
Symmetrical sinusoidal waves pro- gressing upstream and increasing in amplitude; suddenl
B collapse into
suspension then gra ually reform.
Flow
Planvonface; little turbulence.
Very turbulent; large boii.
Plane surface; little turbulence. Standing sinusoidal waves in phase with
bed waves; termed “sand waves.” Symmetrical sand waves progressing
upstream in phase with bed waves; amplitude increases until wave breaks, whvhzystem collapses then gradually
.

GENERAL FIELD AND OFFICE PROCEDWES FOB INDIRECT DISCHARGE MEASUREMENTS 23
- Flow +
PLANE-BED REGIME PRIOR TO MOVEMENT
RIPPLE REGIME
DUNE REGIME
PLANE-BED TRANSITION REGIME
STANDING-WAVE REGIME
ANTIDUNE REGIME
Figure 6.-ldealised diagram of bed and surface configuration of alluvial streams with various regimes of flow.

24 TECHNIQUES OF WATER-RESOURCES INVESTIGATIONS
0 0.2 0.4 0.6 0.8 1.0 1.2
MEDIAN SIZE. IN MILLIMETERS
Figure 7.-Relation of stream power and median grain size to form of bed roughness.
The values in .this table are based on labora- tory and. field data obtained by the Geological Survey. The expected standard error of this relation is about 20 percent. These are con- sidered ‘base values in the sense described in the preceding section and must be increased to account for the effect of alinement, vegetation, or braiding.
After the discharge and velocity are com- puted from the Manning equation it must be shown that the bed configuration was in the upper regime. Figure 7 developed by Bimons and Richardson (1966) may be used for this purpose. Stream power is computed as 62rzSV, where
62=:Specific weight of water, R = Hydraulic radius, S=‘Wat.er-surface slope, and V-Mean velocity.
If the value 62RxV plots above the upper line bounding the transition zone, it may he as> aumed that the bed configuration was in the upper regime.
Off ice Procedures
An indirect measurement is made in order to fill an important need. One such measurement may be the basis for defining the entire upper portion of a stage-discharge relation curve, as compared to the lower and middle portions which may be defined by numerous current- meter measurements. For this reason, every in- direct measurement is deserving of careful methodical work, performed with high engi- neering standards. All work should be checked independently. This includes the plotting of the plan and profiles as well as the computa- tions, since all affect the results.
The use of standard methods makes review a simple matter, because each element of the somewhat involved computations can easily be located. These computations, moreover, will become a part of the permanent files which may be consulted at some time in the future. All the work, therefore, should be in such form that every part of the computations may be under-

GENERAL FIELD AND OFFICE PROCEDURES FOR INDIRECT DISCHARGE MEASUREMENTS 25
a -
a
stood, and any information sought should be easy to locate.
Procedures recommended have been devel- oped and standardized over a period of years and have been designed to increase the proba- bility of obtaining reliable results and to simplify the work of the original computer, the checker, and the reviewers.
Label all computation sheets with the name of the station and State and the date of the flood. The original computer and checker initials each sheet.
Drafting and lettering need not be done by machine methods, except where they make the work easier ; the drawings may be best in pencil, unless they are to be reproduced for some special purpose. However, all the drawings should be neat, clear, and accurate.
Title maps and sketches completely and prop- erly, make computations systematically on suitable forms, arrange pertinent information neatly and logically, and mount pictures with appropriate titles. The appearance of the notes and records are an indication of thoroughness and workmanship and exert a favorable or un- favorable impression upon the users.
Order of Computations
The nature of the computations is such that there is a logical order for performing the work. After the field notes have been checked and ad- justed, do the computations and checking in the following order :
1. Plan 2. Listing of high-water marks 3. Bigh-water proflles 4. Check 1.2, and 3 6. Cross-section plota ; subdivision 6. Cross-s&ion proper&a 7. Check5,6 8. Computation of discharge 9. Check 8
Plan
Plot the plan from the field notes using a scale between 1 inch=20 feet and 1 inch=200 feet, according to the size of the area covered and the amount of detail.
Show the location of all high-water marks on the plan. The plotting convention is to plot the exact position as a dot and to write the elevation of each mark around the dot as the decimal point. This procedure is more useful than assigning identifying numbers to the marks and showing only those numbers on the plan. Show ratings of the marks by letter sym- bols (E, G, P, P, for excellent, good, fair, poor).
Include in the plan all structures, roads, fence lines, or any cultural features pertinent to the problem. Show all the natural features which have any bearing, such as ground cover, low- water channel, woods, crops, and ridges.
Also show the location of cross sections, but do not plot cross-section elevations, for they are apt to confuse the picture. If roadway eleva- tions are given, use color to distinguish them from high-water marks. Give locations of transit stations, bench marks, and reference marks. Sketch the location of the high-water line through the high-water marks on the bank, and elsewhere in approximate position based on the field sketch.
Use arrows to show the direction of flow and magnetic north. Note the scale of the plan.
Plotting methods
Make a rough preliminary plot of transit points, extreme points, and azimuth to aid optimum positioning of the plan on the final sheet. Use sketch form O-213-C or 9-213-D (double) for the final plot, unless the plan re- quires a larger sheet.
If other equipment is not available, plot the field data by means of a protractor and an engineer’s scale. Plot azimuths in the same manner as recorded in the field by starting from north as O”. At each successive transit station, draw a line parallel to the first north line and use for plotting azimuths.
A second method of plotting is by laying the plan sheet over a sheet of polar coordinate paper. No auxiliary tools are needed for plotting, be- cause angles and distance scales are on the coordinate paper. A light table helps make this a simple and rapid method of plotting.
The most satisfactory method is to use a draft- ing machine mounted on a drawing board. Set

26 TECHNIQUES OF WATER-RESOURCES INVESTIGATIONS
the protractor with magnetic north as O”, and mount the appropriate engineer’s scale on the arm. Then use machine to plot points, starting from a reference station anywhere on the board. A small drafting machine has been adapted for field use. It is useful in the field because of its small size, but it is an accurate machine suited for ofice use. This drafting machine with a 16-inch arm adapted to Survey use by a pro- tractor specially graduated from O” to 360° and a special “mid-anchor” clamp is screwed or bolted to the board. Some companies list such machines as “detail drafting machine with civil engineer head.”
Base line for stationing
One of the principal factors in the discharge computations for any type of flow is the drop in water-surface elevation from one cross section to another. This is best computed by drawing continuous high-water profiles through the measurement reach. To draw high-water pro- files, it is necessary to adopt some system of sta- tion for referring the high-water marks to a base line Twhich represents the mean path of the water. This is not a simple problem where the channel is curved, the banks not parallel, or the high-wamr marks scattered throughout the channel. Draw the base line perpendicular to the cross sections where they intersect. Locate the zero for stationing along a channel slightly upstream from the most upstream high-water mark so that all stationing is positive and in- creases in the downstream direction.
If the channel is reasonably straight, even though the banks are not parallel, draw a straight b’ase line through the approximate cen- ter of the channel. The station of any mark is obtained by a right angle projection from the base line. A simple method of obtaining sta- tioning with a straight base line is to erect a perpendicular at the 0 mark and to measure distance back perpendicular to that line.
If a channel is only slightly curving, draw the base line either as a series of broken straight lines or as a curve through the center of the channel. If the series of straight lines are drawn perpendicular to the cross sections and broken between the sections, the results will be
as good for all practical purposes as though a curved base line were used, and the stationing of high-water marks will be simpler.
If the channel is very curved, either a curved base line in the center of the channel or, in ex- treme cases, a separate curved base line on each bank may be necessary.
In a wide channel, separate base lines on each bank are preferable.
If a channel cross section is such that the deep main-channel portion is on one side of the chan- nel, then draw the base line along the center of the main channel. If considerable flow is over- bank, draw it from center of gravity or center of flow, of each cross section.
For culverts or bridges, where high-water marks are obtained along the embankment, the base line along the stream is of little help in analyzing the high-water profiles along the em- bankment. Under such conditions, use an auxiliary base line along the embankment for stationing the high-water marks around the opening. It may be that in the same problem one base line along the channel will be used to determine the elevations at the approach section and another along the embankment will be used to determine elevations at the downstream side of the opening.
It is preferable to express stations as distances in feet, such as “315 ft,” rather than using the highway engineer’s method of expressing them as “03+ 15 ft?’
Listing of High-Water Marks
List high-water marks, by station and eleva- tion, with appropriate station numbers and rat- ing symbols. Make separate listings for each bank, in downstream order. Include on the list the gage readings if a gage is within the reach. At the proper places, include stationing for the ends of the cross sections.
High-Water Profiles
From the listing previously made, plot the high-water marks on cross-section forms 2-213- E or 9-213-F. By convention the stationing increases from left to right, so that the pro&

GENERAL FIELD AND OFFICE PROCEDURES FOR INDIRECT DISCHAROE MEASUREMENTS 27
slopes downward to the right. The vertical scale should be such that. hundredths of a foot may easily be read, usually either 0.2,0.5,1 or 2 feet to the inch, with a horizontal scale selected so that the average slope of the profile will be about 1 vertical to 4 horizontal. Show locations of the ends of cross section by vertical lines. Indicate the accuracy rating of each mark either by letter symbol or color. Make a separate plot for each bank by offsetting the vertical scales The pattern or elevations of profiles on both banks rarely coincide, and better results are ob- tained by analyzing each bank separately.
The water-surface profiles are used ,to com- pute the fall between two cross sections in order to compute the discharge. The profiles should therefore represent the effective elevation for the channel as a whole. In drawing profiles, consider the location and the accuracy rating of each mark. Avoid following small irregular- ities representing purely local conditions. Marks on projections into Ihe stream are apt to be higher, and those within embayments which are subject to eddies lower than the general water surface. Marks on trees or poles within the fast-moving current may be affected by pileup on the upstream side or drawdown on the downstream side. In general, marks on the banks along a line parallel to the flow are less subject to local influence; give them the most weight.
Draw profiles as a smooth curve or a series of smooth curves following the trend of the higher points. Neglect single marks higher than the general average if unsupported. Give no weight to the lower marks deposited on the recession. Straight-line profiles are the rare exception rather than the rule, and could be ex- pected only under ideal conditions of perfectly straight channels with uniform cross section.
After the profiles are drawn, choose and note the elevations at each end of all the cross set- Cons. A simple summary table, on the sheet showing elevations and stations for each cross section provides a convenient method of record- ing and computing lengths and falls between sections.
Cross Sections
Plot each cross section separately, using arithmetic coordinate scale. Have the left bank at the left of the sheet, the stationing proceeding from left to right. Show the upstream section at the top of the sheet, and other sections below in downstream order.
Large-size plots are not needed. Three or four sections may be included on a single page- size form. Use the same scale for each section.
The plotting scales are usually distorted; the most commonly used horizontal to vertical scale ratio is 5 : 1 (for example, a horizontal scale of 60 ft to the inch and a vertical scale of 10 ft to the inch). This appears to give a picture most nearly like the visual impression received when looking at a cross section in the field, since to the eye vertical distances appear naturally to be exaggerated compared to horizontal distances. For very wide cross sections, scale ratios of 10 to 1 or even 20 to 1 may be necessary. Small or narrow cross sections may require scale ratios as low as 1 to 1.
With a straight line, connect the left- and right-bank water-surface elevations at the peak (from the profile sheet), and at the time of the survey on the cross sections, with proper identi- fication. Print notes on the character of the channel bed or banks.
Cross-section properties
A special form is used for computation of section propertiearea, wetted perimeter, and hydraulic radius. Begin the listing of stations at the left bank. If necessary, interpolate the stationing of the ends, where water and ground elevations are equal.
For vertical parts of the section, such as piers, abutments, walls, and steep banks, repeat the stationing and list two elevations, top and bottom in appropriate order.
Compute water-surface elevations as a straight-line interpolation between elevations on each bank. Use elevations and depths ordi- narily to the nearest tenth of a foot, although at times, as in computing low heads over dams or paved highways, hundredths of a foot may be justified.
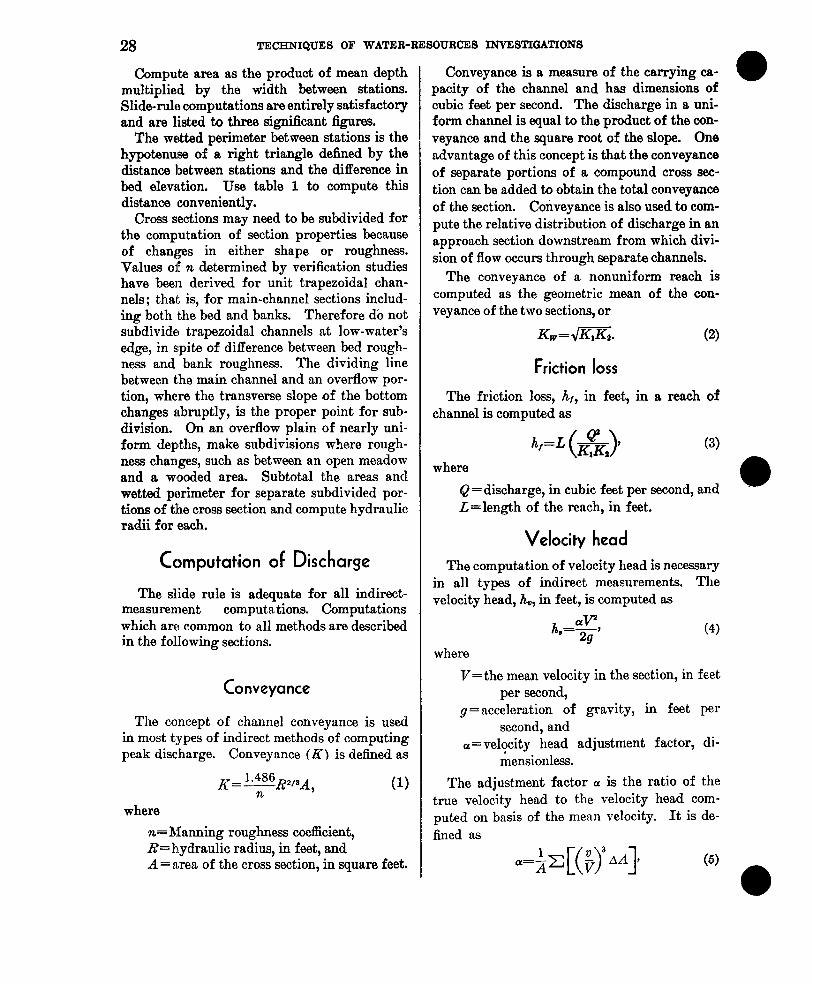
28 TECHNIQUES OF WATER-RESOURCES INVESTIQATIONS
Compute area as the product of mean depth multiplied by the width between stations. Slide-rule computations are entirely satisfactory and are listed to three significant figures.
The wetted perimeter between stations is the hypotenuse of a right triangle defined by the distance between stations and the difference in bed elevation. Use table 1 to compute this distance 8conveniently.
Cross sections may need to be subdivided for the computation of section properties because of changes in eit.her shape or roughness. Values of n determined by verification studies have been derived for unit trapezoidal chan- nels; that is, for main-channel sections includ- ing both the bed and banks. Therefore do not subdivide trapezoidal channels at low-water’s edge, in spite of difference between bed rough- ness and bank roughness. The dividing line between the main channel and an overflow por- tion, where the transverse slope of the bottom changes abruptly, is the proper point for sub- division. On an overflow plain of nearly uni- form depths, make subdivisions where rough- ness changes, such as between an open meadow and a wooded area. Subtotal the areas and wetted perimeter for separate subdivided por- tions of the cross section and compute hydraulic radii for each.
Computation of Discharge
The slide rule is adequate for all indirect- measurement computations. Computations which are common to all methods are described in the following sections.
Conveyance
The concept of channel conveyance is used in most types of indirect methods of computing peak discharge. Conveyance (Kl is defined as
where n=Manning roughness coefficient, R=hydraulic radius, in feet, and A = area of the cross section, in square feet.
Conveyance is a measure of the carrying ca- pacity of the channel and has dimensions of cubic feet per second. The discharge in a uni- form channel is equal to the product of the con- veyance and the square root of the slope. One advantage of this concept is that the conveyance of separate portions of a compound cross sec- tion can be added to obtain the total conveyance of the section. Conveyance is also used to com- pute the relative distribution of discharge in an appr0ac.h section downstream from which divi- sion of flow occurs through separate channels.
The conveyance of a nonuniform reach is computed as the geometric mean of the con- veyance of the two sections, or
K,=,lm.
Friction loss
The friction loss, ht, in feet, in a reach of channel is computed as
(3) where
&=discharge, in cubic feet per second, and L=length of the reach, in feet.
Velocity head
The computation of velocity head is necessary in all types of indirect measurements. The velocity head, &, in feet, is computed as
h$$$
where
I’= the mean velocity in the section, in feet per second,
g=acceleration of gravity, in feet per second, and
a=vel#ty head adjustment factor, di- mensionless.
The adjustment factor (L is the ratio of the true velocity head to the velocity head com- puted on basis of the mean velocity. It is de- fined as
(5)

GENERAL FIELD AND OFFICE PROCEDURES FOR INDIRECT DISCHARGE MEASUREMENTS 29
Table 1 .-Increase of slope distance over horizontal distance for computing wetted perimeter
[To obtain wetted perimeter, add value from table to width]
WIDTH OF SECTION. IN FEET
1 2 3 4 6 6 7 3 9 10 11 12 13 14 15 16 17 13 19 20
0. 4 .5
.;
.: 1. 0
:. :: 1: 3 1. 4 1. 5
1. 6 1. 7 1. s 1. 9 2. 0
2. 1
;: i
;: ;
2. 6 2. 7 2. 8
x: i
3. 1
I: :
3”: %
3. 6 f ;
3: 9 4. 0 ~
0. 1 .l 0.1
:; 1 :1
0.1 . 1 0.1
.3 .2 .l .l 0.1
.: .2 2
1 :1
1 .2 :1
0. 1 . 1 0. 1 0. 1 .l .l .lO.l
3 .2 .x :3 .2 .
1 .f :1 : :
1 0. 1
:1 . : . : 1 :1
1 .l 1 .l
:; . .4 . .: : : :
.2
:P
.2 .2 :B .l
. .2 2 :2 2 .2 ::: .i r 13.2.2.2 3 .2 .2 .2
1. 1 . 1 0. .l . .l . .l .
1 0. 1 1 . 1 0. I 0. 1 1 .l .l .l 1 .l .l .l
.6 .4 .3 .2 .2
.i : t 1: .3 .2 .2 .2
1:: : z .4 .4 : i .2 .3
:.: 1:2
: i -i : t : I .8 16 .5 .4
1. 3
1. 4 1:
i ::
:
: .4
1.5 1.0 .8 .6 : z 1.6 1.1 .8 .7 .5 1.7 1.2 .9 .7 .6
1.8 1.3 1.0 .8 .6 1. 9 1. 4 1. 0 . 8 . 7 2.0 1.4 1.1 .9 .7
2. 1 1. 5 1. 2 2. 2 1. 6 1. 2 1: i : s”
2.3 1.7 1.3 1.1 .9
2. 4 1. 8 1. 4 1. 1 2. 4 1. 9 1. 5 1. 2 1: ; 2. 5 1. 9 1. 5 1. 2 1. 0 2. 6 2. 0 1. 6 1. 3 1. 1
2.7 2.1 1.7 1.4 1.2 2. s 2. 2 1. 8 1. 4 1. 2 2. 9 2. 3 1. 8 1. 5 1. 3 3. 0 2. 4 I. 9 1. 6 1. 3 3. 1 2. 5 2. 0 1. 7 1. 4
0. 1 . 1 0. 1 0. 1 0. 1 .l .l .l .lO.l
.l .l .l .l .l
.l .l .l .l .I
12 : :I :: :: :: .2 .2 .I .l
1 .l .l .l .l I 1
: :1 :1. : : : : 1 .i .l .I .l 1 .l .l .l .J
.2 .2 .2 .2 .l
.2 .2 2 .2 .2
.2 .2 12 .2 .2
.3 .2 .2 . 2 .2
.3 .3 .2 .2 .2
.l .l .l .l .I
.f : ; :: . :
:i .2 .2 :a 2 :2 .2
: :
. .f
.4 .3 .3 .2 .2
.4 .3 .3 .3 .2
.t 14 4 14 3 .p 3 .3
.5 .4 .4 :3 : i
.5 .5 .4 .4 .3
.6 .5 .4 .4 .4
.F : 6” : : 1: 14 4
.7 .6 .5 .5 .4
.: 17. 7.6 6 :G 5 :5 5
.i : 8’ 17 7 .G .5
.9 .8.7? i
1.0 .9 .8 .7 .G
:q 1:2
1.; :g 8 ‘8 7 .; l:o .9 :s :7
1.2 1.1 .9 .s .8
.3 3 .3 .2 .2
.3 :i
.3 . 3 :i: .3 .2
3 .x .4 .3 3 : 3 .3 .4 .4 :i .3 .3
:5 4 :4 4 :4 4.3.3
.5 .4 . 4 :t ::
.z :5 5 :5 4 : 4 4 :::
.6 .5 .6 .G ::, :: :::
.t : G 6 . .5 G .5 . 5 .5 . 5
.7 .6 .ti .\’ .5
.2 .2 .2 .2 .2
.z
:;
:;
.f
.x .2
9 3 . .
.3
. 3
.3
.s .3 .3
.4
.4
.4 .4 .4 3 .:3 1 . 4 4 :i .3
.4 . 4 14 .4
.I 5 . 4 .‘I .4 ::
.5 . 5 .4 .i .4
where v= the mean velocity of a small subarea
(6)
AA, A = the total area of the cross section, and V=the mean velocity in tlkc total cross
section. Uecnuso t.lie velocity clist,ribution for the clian-
nels used in indirect measuremrnts is unknown, the value of n is computed in these applicat,ions considering only the variation in mean velocity in the separate portions into which a compound channel is normally subdivided. Because these velocities are not known during the process of computing the discharge, ~ is computed as
where the subscript i refers to the conveyance or area of the subsect,ions and T to the convey- ance or area of the entire cross section. This expression is based on the assumpt,ion that the discharge jn a subsect ion is proportional to the conve?-:l ncc.
Final discharge
If several computations arc made by trial- am-error method to reach the final result, the computation to be used should be clearly in- dicated.

30 TECHNIQUES OF WATER-RESOURCES INVESTIGATIONS
If two or more methods of indirect measure- ments are used at nearby sites to determine the same peak discharge, the final result may be determined by equal weighing, using an aver- age; by unequal weighing, where one computa- tion is considered superior to another based on its intrinsic merits; or by disregarding one or the other of alternate measurements. Only a single result, however, should be shown for the final discharge.
Measurement Summary
A summary describing the various features of the measurement which might affect its re- liability is desirable. This may include material not otherwise included in the field notes or com- putations, such as a general description or evaluation of field conditions, high-water marks, and reasons for various assumptions and in- terpretations made in the course of the computa- tions. An accuracy rating should be estimated for the final results. A measurement which is rated “good” would be expected to be within 10 percent,; this would represent a case where the conditions were favorable and the field data, including high-water marks, adequate and de- fined within narrow limits. A “fair” measure- ment would represent a 15 percent possible error, with neither natural conditions nor field d&ta favorable. A “poor” measurement is one where the error might possibly be 25 percent or greater. Ratings of “good to fair” or “fair to poor” may also be used.
Assembly OF Computations
Arrange computation sheet in the sequence of steps suggested on page 25. In addition, in- clude the summary sheet and a print or a plot, preferably on log-log scale,, of the latest rating
curve, if the measurement is made at the gagin station. Number each sheet in proper sequence; identify each for location and date of the flood peak and have both computer and checker initial and date each sheet. Number the field notes separately. The descriptive summary should precede the computations. If the com- putations are long and complex, add a table of contents.
After assembly, place the computation in an enclosed folder or envelope, or preferably bind them in flexible paper cover. Memorandum of review can be added and bound later. Field notes and photographs can all be contained in the same folder, in envelopes attached to the inside of the covers. If photographs are filed separately, refer to the file numbers on the
_
computation or summary sheets. If the measurement is used to help define a
rating curve for a gaging station, file a sheet with current-meter measurements to insure that the correct measurement number is used when station records are computed.
Selected References
Beckman, E. W., and Furness, L. W., 1962, Flow char- acteristics of Elkhorn River near Waterloo, Nebr. : US. Geol. Survey Water-Supply Paper 1493-B.
Culbertson, J. K., and Dawdy, D. R., 1964, A study of fluvial characteristics and hydraulic variables, middle Rio Grande, N. Mex.: U.S. Geol. Survey Water-Supply Paper 1493-F.
Davis, R. E., and Foote, F. S., 1953, Surveying: New York, McGraw-Hill Book Co.
Dawdy, D. R., 1961, Depth-discharge relations in alluvial streams-discontinuous rating curves : U.S. Geol. Survey Water-Supply Paper 1493-C.
Ramser, C. E., 1929, Flow of water in drainage chan- nels: U.S. Dept. Agriculture Tech. Bull. 129.
Seobey, F. C., 1939, Flow of water in drainage chan- nels : U.S. Dept. Agriculture Tech. Bull. 652.
Simons, D. B., and Ricbrdson, E. V., 1966, Resistance to flow in alluvial channels: U.S. Geol. Survey Prof. Paper 422-J.