general aviation and the ntsb most wanted...
TRANSCRIPT

General Aviation and
the NTSB
Most Wanted List
Earl F. Weener, Ph.D.
Member, NTSB AirVenture Forum
July 20, 2015

2
N6529R - B36TC Bonanza
2

3
The NTSB is an independent US federal agency
charged with determining the probable cause(s)
of transportation accidents, making
recommendations to prevent their recurrence,
conducting special studies and investigations,
and coordinating resources to assist victims and
their families after an accident.
NTSB Mission

4
Topics
• General Aviation Accident Trends
• Most Wanted List – 2015
– Distractions
– Substance Impairment
– Fitness for Duty
– Procedural Compliance
– Loss of Control

5
All GA Accidents
1492 1402 1371 1389
1305 1350 1215
1366 1292 1205 1169 1202 1198
1001 968
345
325 345 352
314 321
308
288 277
275 271 268 273
221 253
0
200
400
600
800
1000
1200
1400
1600
1800
2000
2000 2001 2002 2003 2004 2005 2006 2007 2008 2009 2010 2011 2012 2013 2014
Non-Fatal Fatal Accidents
Nu
mb
er
of
ac
cid
en
ts
6
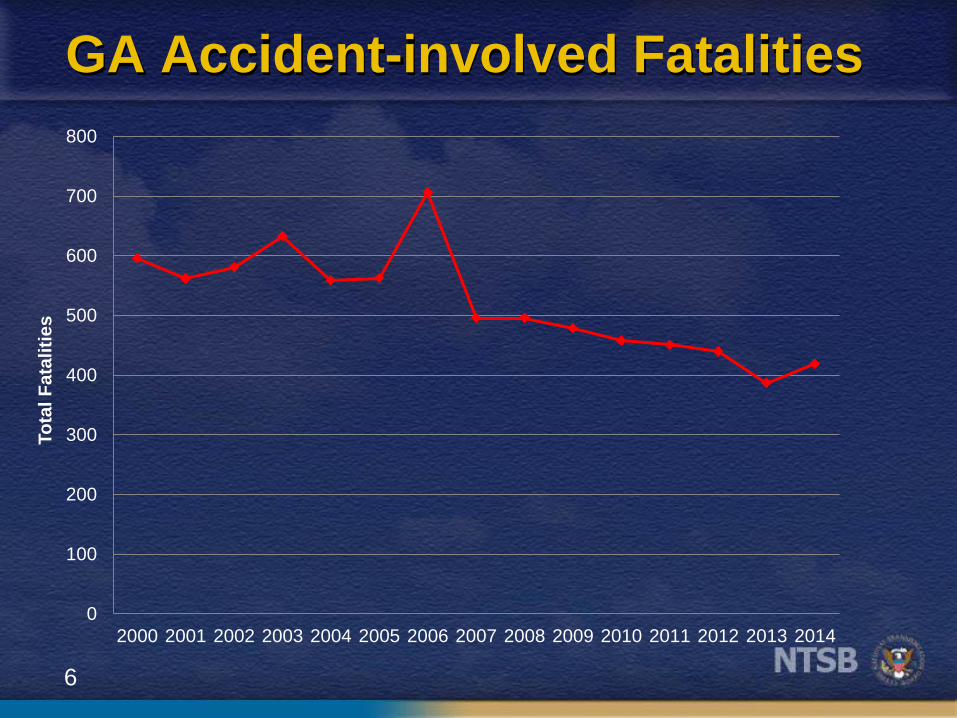
GA Accident-involved Fatalities
0
100
200
300
400
500
600
700
800
2000 2001 2002 2003 2004 2005 2006 2007 2008 2009 2010 2011 2012 2013 2014
To
tal
Fata
liti
es

7
GA Accident Rates
1.00
2.00
3.00
4.00
5.00
6.00
7.00
8.00
9.00
2000 2001 2002 2003 2004 2005 2006 2007 2008 2009 2010 2011 2012 2013 2014
Accid
en
ts p
er
100
k F
lig
ht
Ho
urs
Fatal Total
*The 2011 GA Survey is currently not available. FAA is actively engaged in
re-calibration efforts and expect to have validated 2011 data published at a later date..
8
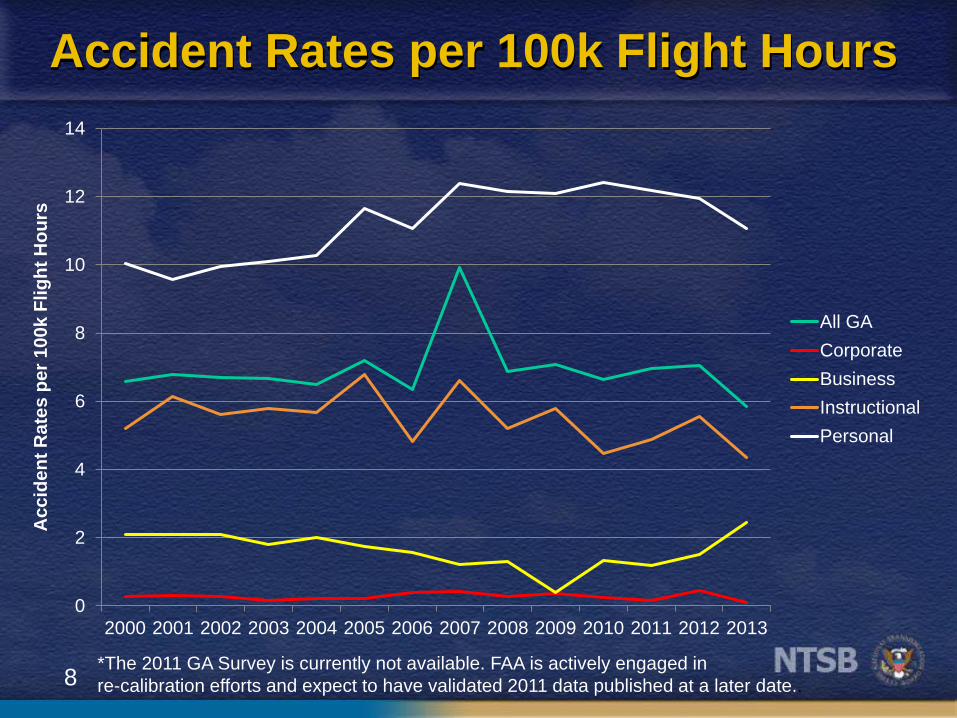
Accident Rates per 100k Flight Hours
*The 2011 GA Survey is currently not available. FAA is actively engaged in
re-calibration efforts and expect to have validated 2011 data published at a later date..
0
2
4
6
8
10
12
14
2000 2001 2002 2003 2004 2005 2006 2007 2008 2009 2010 2011 2012 2013
All GA
Corporate
Business
Instructional
Personal
Accid
en
t R
ate
s p
er
100
k F
lig
ht
Ho
urs
9
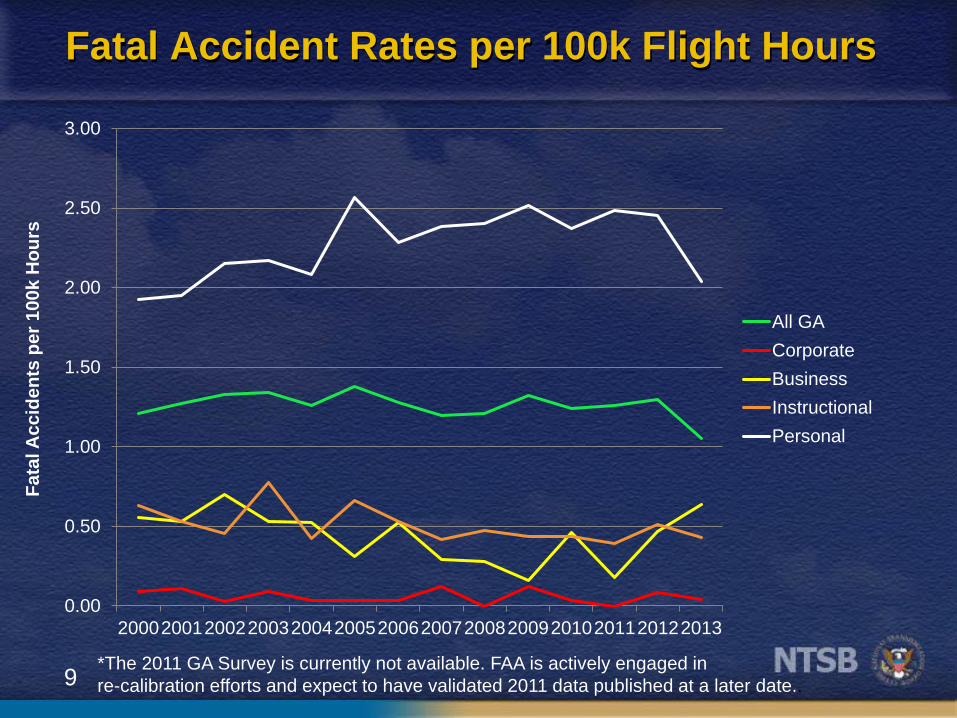
Fatal Accident Rates per 100k Flight Hours
*The 2011 GA Survey is currently not available. FAA is actively engaged in
re-calibration efforts and expect to have validated 2011 data published at a later date..
0.00
0.50
1.00
1.50
2.00
2.50
3.00
20002001200220032004200520062007200820092010201120122013
All GA
Corporate
Business
Instructional
Personal
Fata
l A
ccid
en
ts p
er
100
k H
ou
rs

10
Defining Fatal Accident Events
All Part 91 GA 2008-2014
• Maneuvering
• Initial Climb
• Maneuvering-Low-alt Flying
• Takeoff
• Enroute-Cruise

11
Why GA on the Most Wanted List?
• NTSB investigates approximately 1500 GA
accidents per year over the last decade
• Overall GA accident rate flat
– Has improved little over the last decade
– Airline accident rate decreased more than 80%
• Personal flying accident rate
– Increased 20% over last 10 years
– Fatal rate increased 25% over that period
• GA safety needs attention

12
NTSB 2015 Most Wanted List
• Disconnect from Deadly Distractions
• End Substance Impairment in
Transportation
• Enhance Public Helicopter Safety
• Implement Positive Train Control in
2015
• Improve Rail Tank Car Safety
• Make Mass Transit Safer
• Prevent Loss of Control in Flight in
General Aviation
• Require Medical Fitness for Duty
• Strengthen Commercial Trucking Safety
• Strengthen Procedural Compliance
13
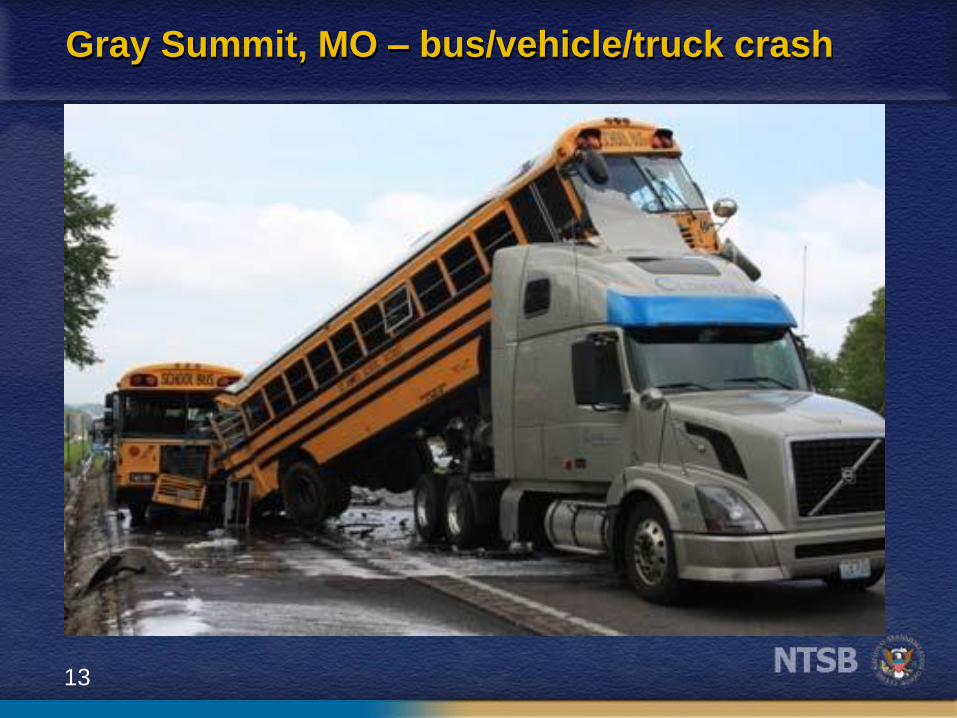
Gray Summit, MO – bus/vehicle/truck crash
14
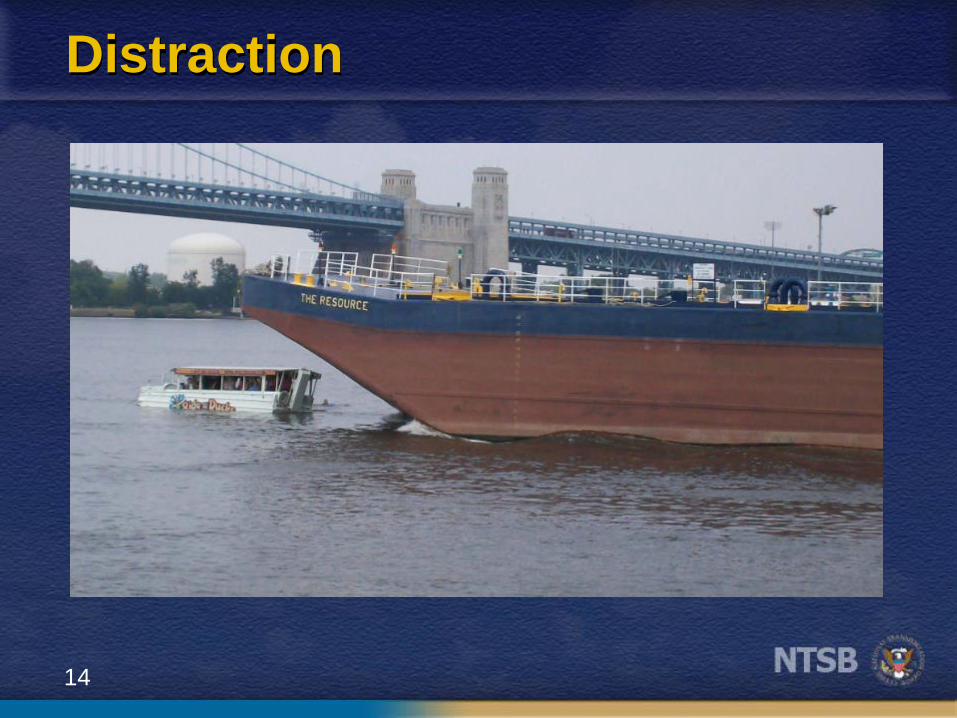
Distraction

15
Distraction
16
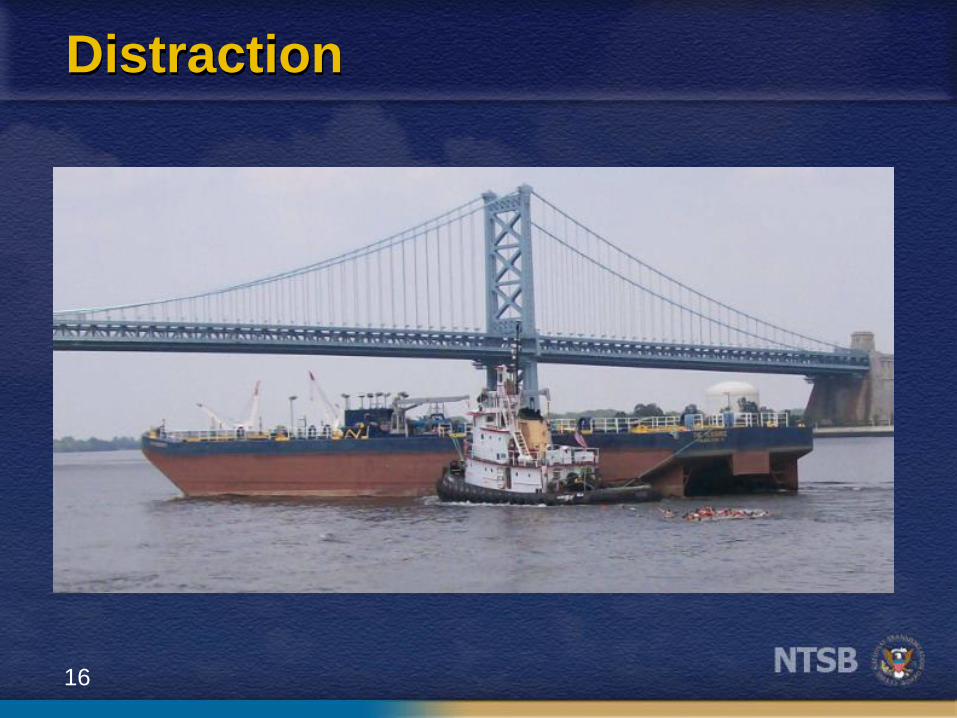
Distraction

17
2015 MWL - Distractions
• Disconnect from Deadly
Distractions
– A factor in all modes of transportation
• Aviation emphasis • Sterile Cockpit
• Appropriate use of PEDs
• Manage distractions

18
2015 MWL - Impairment
• End Substance Impairment in
Transportation
– A factor in all modes
• Fatally injured pilots - potentially
impairing drugs
– 11% average 1990 - 1997
– 23% average 2008 - 2012

19
Toxicology Findings by Category, 1990-2012
0%
5%
10%
15%
20%
25%
1990-1997 1998-2002 2003-2007 2008-2012
Pe
rce
nt
of
Stu
dy
Pil
ots
wit
h P
osi
tiv
e
Fin
din
gs
PotentiallyImpairing Drugs
PotentiallyImpairingCondition
ControlledSubstances
Illicit Drugs

20
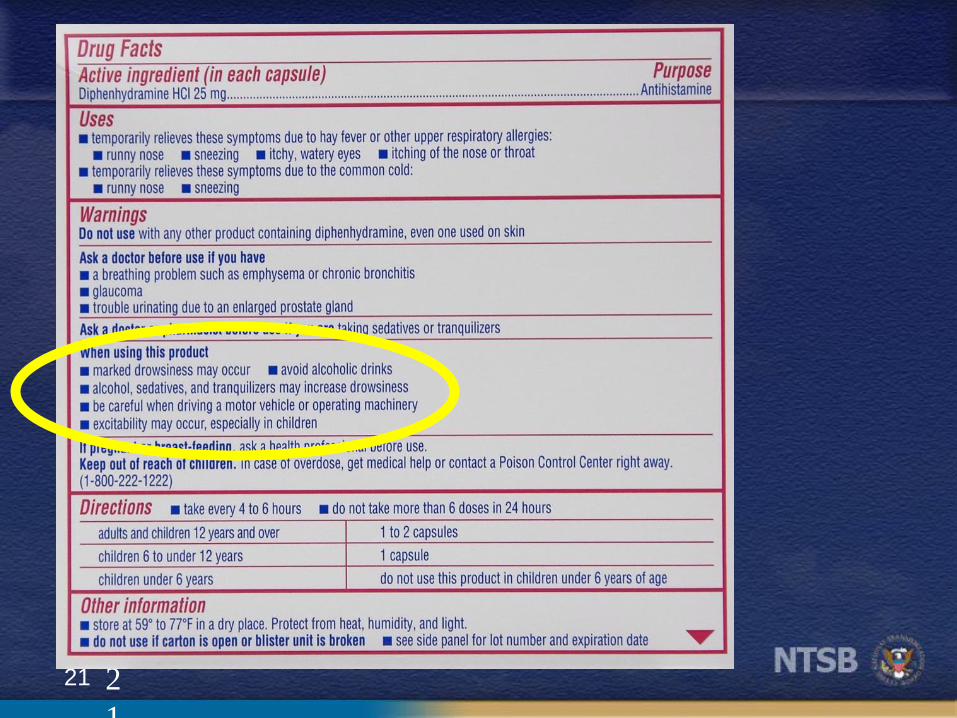
Most Common Drugs
• Sedating antihistamines
– Most common category
• Diphenhydramine
– Most common individual drug
– Most common potentially impairing drug
– Use INCREASING
21
2
1

Toxicology Findings by Certificate, 2005-2012
0%
10%
20%
30%
40%
ATP Commercial Private Sport
Pe
rce
nt
of
Stu
dy
Pil
ots
Highest Airman Certificate Held
Potentially Impairing Drugs Potentially Impairing ConditionControlled Substances Illicit
(n = 272) (n = 610) (n = 955) (n = 30)

Toxicology Findings by Medical, 2005-2012
0%
10%
20%
30%
40%
FAA Medical Within Duration ofThird Class
Expired / No Medical
Pe
rce
nt
of
Stu
dy
Pil
ots
wit
h P
osi
tiv
e
Fin
din
gs
by
Ca
teg
ory
Potentially Impairing Drugs Potentially Impairing ConditionControlled Substances Illicit
(n = 1,676) (n = 260)

24
Medical Resources for Pilots
• FAA Publications
– Medications and Flying
– Guide for Aviation Medical Examiners
• Aircraft Owners and Pilots Association
(AOPA)
– Member resources

25
Medical Resources for Pilots
• General Aviation Joint Steering
Committee (GAJSC)
– 2013 Letter to pilots
– 2014 Initiatives
• Drug database
• Training course

26
Fitness for Duty
27
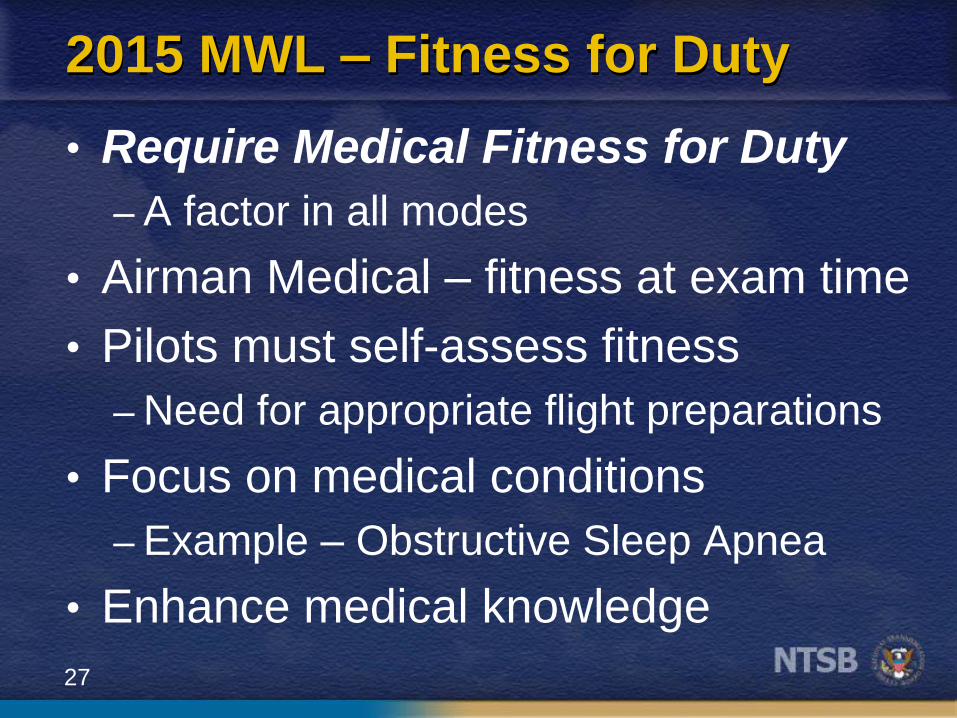
2015 MWL – Fitness for Duty
• Require Medical Fitness for Duty
– A factor in all modes
• Airman Medical – fitness at exam time
• Pilots must self-assess fitness
– Need for appropriate flight preparations
• Focus on medical conditions
– Example – Obstructive Sleep Apnea
• Enhance medical knowledge

28
Lubbock, TX – ATR 42-320 Cargo Aircraft

29
Procedural Compliance

30
2015 MWL – Procedural Compliance
• Strengthen Procedural Compliance
– More than a dozen related commercial
aircraft accidents in last ten years
– Equally applicable to corporate and
business operations
• Implement well developed procedures
• Train to the procedures
• Emphasize and reinforce operations to the
procedures

31
Loss of Control

32
Loss of Control

33
2015 MWL – Loss of Control
• Prevent Loss of Control in Flight
in General Aviation
• More than 40% GA accidents were
LOC during 2004 – 2014
• Most deadly flight phases
– Approach to landing
– Maneuvering
– Climb
34
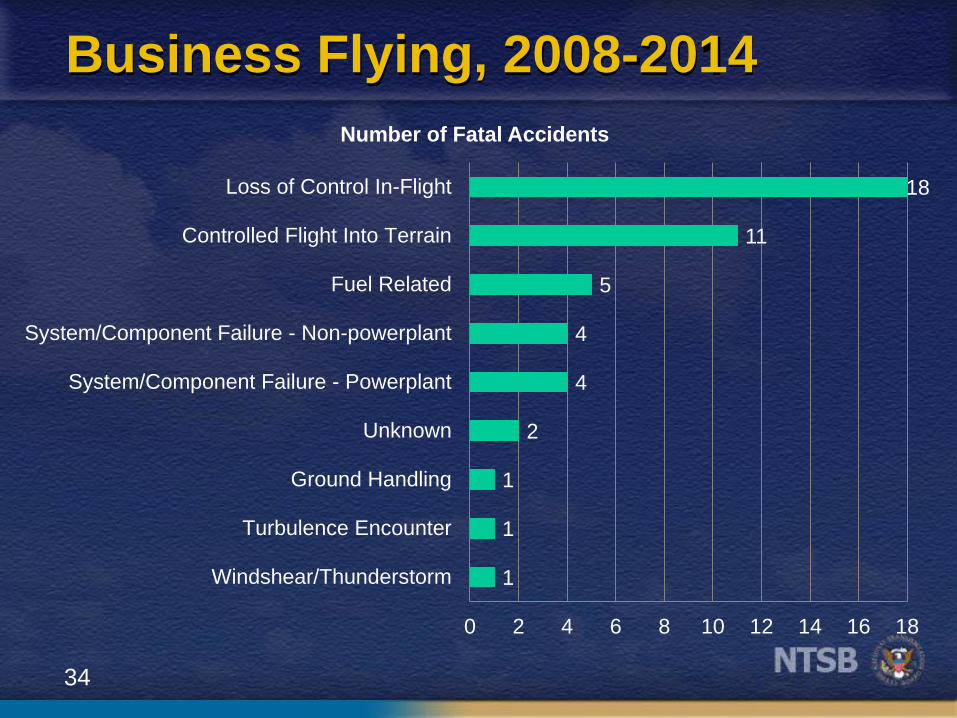
Business Flying, 2008-2014
1
1
1
2
4
4
5
11
18
0 2 4 6 8 10 12 14 16 18
Windshear/Thunderstorm
Turbulence Encounter
Ground Handling
Unknown
System/Component Failure - Powerplant
System/Component Failure - Non-powerplant
Fuel Related
Controlled Flight Into Terrain
Loss of Control In-Flight
Number of Fatal Accidents

35
Instructional Flying, 2008-2014
1
1
1
2
2
2
3
3
4
4
5
7
8
10
0 10 20 30 40 50 60
Unintended Flight Into IMC
Simulated/training event
Fuel Related
Loss of control on Ground
Ground Handling
Abnormal Runway Contact
Unknown
Collision on Takeoff or Landing
Low Altitude Operation
Abrupt Maneuver
Other
Controlled Flight Into Terrain
System/Component Failure-Powerplant
Midair
Loss of Control In-Flight
Number of Fatal Accidents

36
Personal Flying, 2008-2014
11
15
19
19
27
33
39
47
60
62
66
116
149
601
0 100 200 300 400 500 600 700
Loss of Control on Ground
Abnormal Runway Contact
Collision on Takeoff or Landing
Abrupt Maneuver
Midair
Low Altitude Operation
Fuel Related
Unknown
Unintended Flight Into IMC
System/Component Failure - Non-…
Other
Controlled Flight Into Terrain
System/Component Failure - Powerplant
Loss of Control In-Flight
Number of Fatal Accidents

37
Loss of Control In-Flight, 2008-2014
5
18
69
601
0 100 200 300 400 500 600 700
Corporate Flying
Business Flying
Instructional Flying
Personal Flying
Number of Fatal Accidents

38
Boeing Annual Statistical Summery

39
Primary category of accidents
Personal flying
Instructional flying
Business flying
Corporate flying
Airline flying
– LOC
– LOC
– LOC
– LOC
– LOC

40
Fatal Airport LOC 2008-2014
41
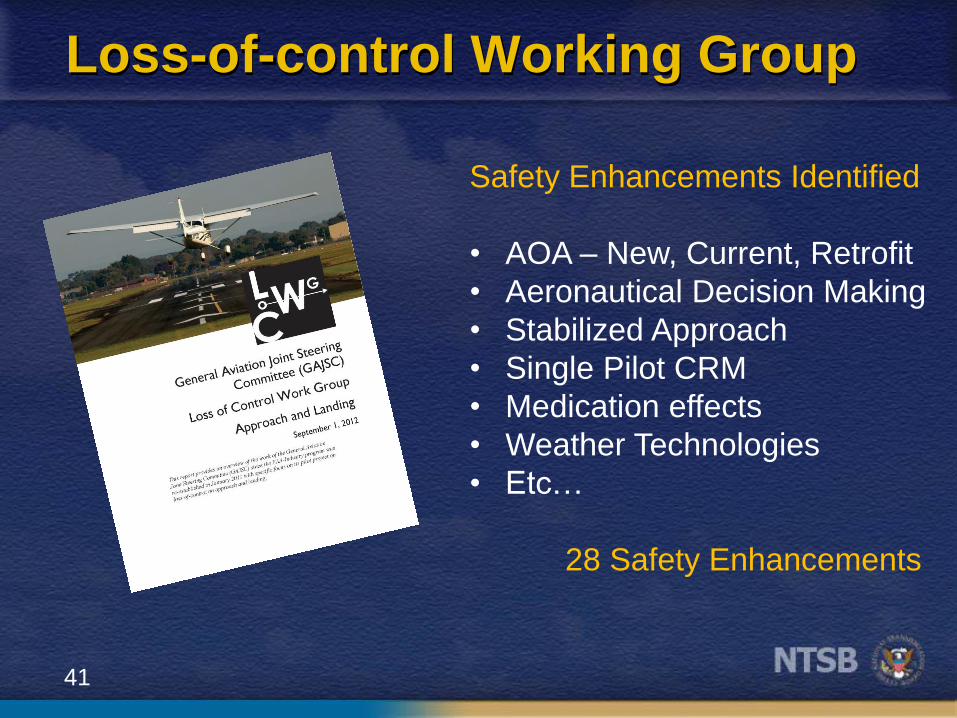
Loss-of-control Working Group
Safety Enhancements Identified
• AOA – New, Current, Retrofit
• Aeronautical Decision Making
• Stabilized Approach
• Single Pilot CRM
• Medication effects
• Weather Technologies
• Etc…
28 Safety Enhancements

42
Lower Cost AOA Displays
• Stall occurs at a specific
Angle-of-Attack
– But not necessarily at the same
airspeed
FAA
installation
policy changed
First of AOA
indicators built
to ASTM stds
and installed
as a minor mod

43
Stall Recovery
• Reduce the angle-of-attack below
stall AOA (Max CL)
– Push over to eliminate stall warning
• Level wings
• Adjust thrust
– Avoid overspeed and high G levels
• Pitch back to level flight
• Don’t try to “Power out of a stall”

44
NTSB Safety Alerts
Preventing Aerodynamic Stalls
Reduced Visual References
Is Your Aircraft Talking to You
Risk Management for Pilots
Risk Management for
Mechanics
Available on www.NTSB.gov

45
Alfred Sheinwold
“Learn all you can from the mistakes
of others. You won’t have time to
make them all yourself”

46
Accident Investigations
• NTSB accident files
are on-line
• Many recent accident
Dockets are on-line
– Factual reports,
– Interviews
– Photographs
• www.ntsb.gov
http://www.ntsb.gov/doclib/reports/2011/ARA1101.pdf
47
Douglas Adams
“Human beings, who are almost
unique in having ability to learn from
the experience of others, are also
remarkable for their apparent
disinclination to do so.”

48
49
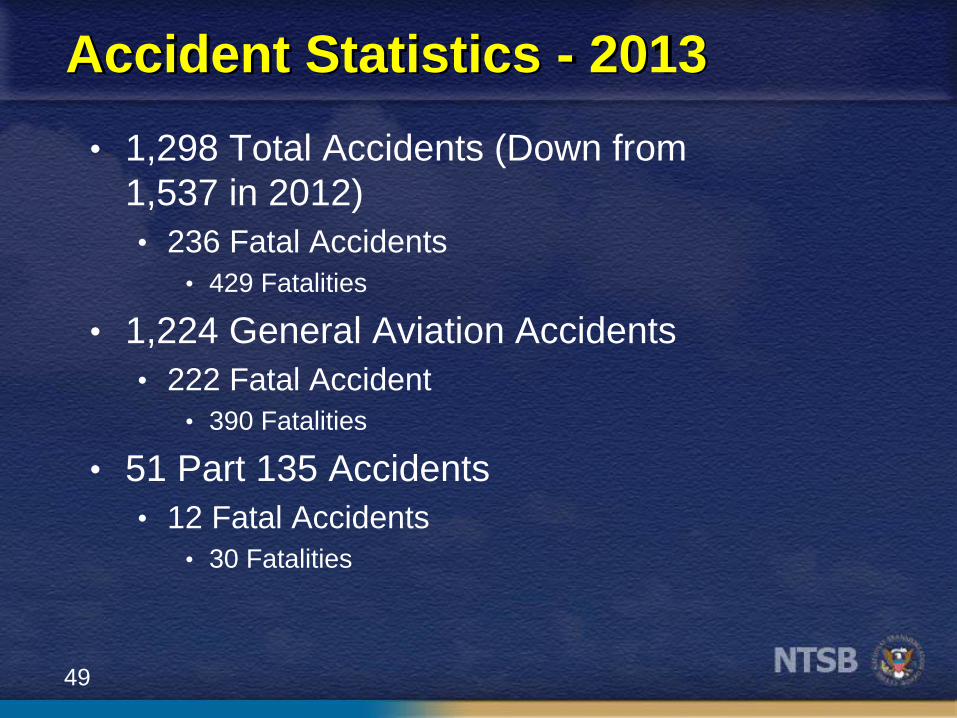
Accident Statistics - 2013
• 1,298 Total Accidents (Down from
1,537 in 2012)
• 236 Fatal Accidents
• 429 Fatalities
• 1,224 General Aviation Accidents
• 222 Fatal Accident
• 390 Fatalities
• 51 Part 135 Accidents
• 12 Fatal Accidents
• 30 Fatalities
50
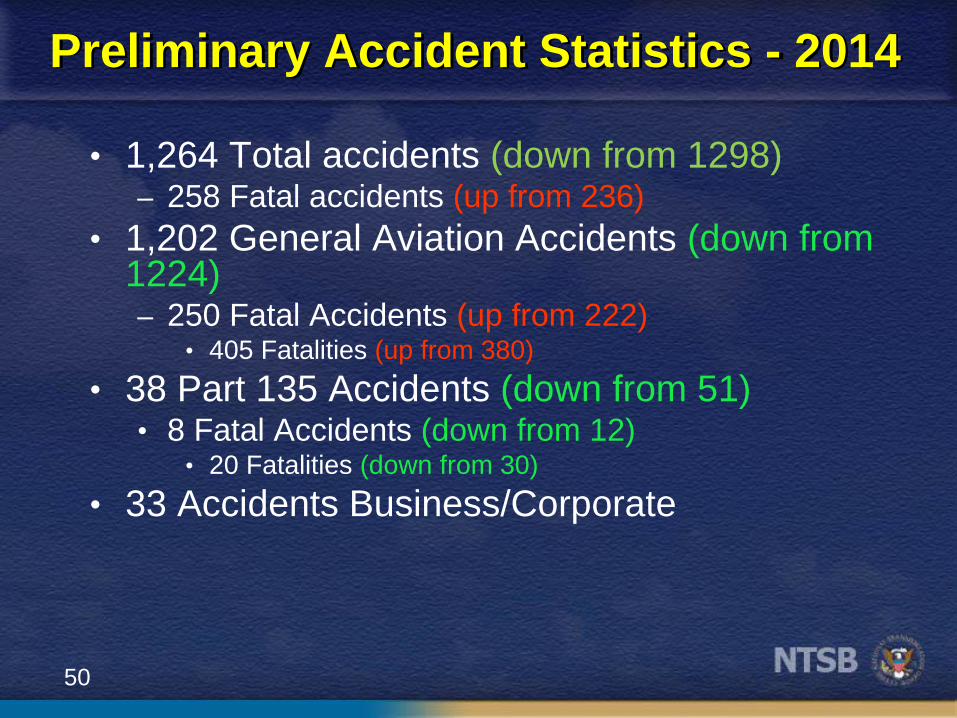
Preliminary Accident Statistics - 2014
• 1,264 Total accidents (down from 1298) – 258 Fatal accidents (up from 236)
• 1,202 General Aviation Accidents (down from 1224) – 250 Fatal Accidents (up from 222)
• 405 Fatalities (up from 380)
• 38 Part 135 Accidents (down from 51) • 8 Fatal Accidents (down from 12)
• 20 Fatalities (down from 30)
• 33 Accidents Business/Corporate