gene regulation and metabolism
DESCRIPTION
TRANSCRIPT

Gene Regulation and Metabolism
Computational Molecular Biology
Sorin Istrail, Pavel Pevzner, and Michael Waterman, editors
Computational Methods for Modeling Biochemical Networks
James M. Bower and Hamid Bolouri, editors, 2000
Computational Molecular Biology: An Algorithmic Approach
Pavel A. Pevzner, 2000
Current Topics in Computational Molecular Biology
Tao Jiang, Ying Xu, and Michael Q. Zhang, editors, 2002
Gene Regulation and Metabolism: Postgenomic Computational Approaches
Julio Collado-Vides and Ralf Hofestadt, editors, 2002
Microarrays for an Integrative Genomics
Isaac S. Kohane, Alvin Kho, and Atul J. Butte, 2002

Gene Regulation and Metabolism
Postgenomic Computational Approaches
edited by Julio Collado-Vides and Ralf Hofestadt
A Bradford Book
The MIT Press
Cambridge, Massachusetts
London, England
( 2002 Massachusetts Institute of Technology
All rights reserved. No part of this book may be reproduced in any form by any electronic
or mechanical means (including photocopying, recording, or information storage and re-
trieval) without permission in writing from the publisher.
This book was set in Palatino on 3B2 by Asco Typesetters, Hong Kong and was printed
and bound in the United States of America.
Library of Congress Cataloging-in-Publication Data
Gene regulation and metabolism : postgenomic computational approaches/edited by
Julio Collado-Vides & Ralf Hofestadt.
p. cm. — (Computational molecular biology)
Includes bibliographical references and index.
ISBN 0-262-03297-X (hc. : alk. paper)
1. Genetics—Mathematical models. 2. Molecular biology—Mathematical models.
I. Collado-Vides, Julio. II. Hofestadt, Ralf. III. Series.
QH438.4.M3 G46 2002
572.8 001 05118—dc21 2001056247
Contents
Preface vii
1 Are the Eyes Homologous? 1
Jeremy C. Ahouse
I Information and Knowledge Representation 17
2 Automation of Protein Sequence Characterization and Its
Application in Whole Proteome Analysis 19
Rolf Apweiler, Margaret Biswas, Wolfgang Fleischmann, Evgenia
V. Kriventseva, and Nicola Mulder
3 Information Fusion and Metabolic Network Control 49
Andreas Freier, Ralf Hofestadt, Matthias Lange, and Uwe Scholz
II Gene Regulation: From Sequence to Networks 85
4 Specificity of Protein-DNA Interactions 87
Gary D. Stormo
5 Genomics of Gene Regulation: The View from Escherichia coli 103
Julio Collado-Vides, Gabriel Moreno-Hagelsieb, Ernesto
Perez-Rueda, Heladia Salgado, Araceli M. Huerta, Rosa Marıa
Gutierrez, David A. Rosenblueth, Andres Christen, Esperanza
Benıtez-Bellon, Arturo Medrano-Soto, Socorro Gama-Castro,
Alberto Santos-Zavaleta, Cesar Bonavides-Martınez, Edgar
Dıaz-Peredo, Fabiola Sanchez-Solano, and Dulce Marıa Millan
6 Discovery of DNA Regulatory Motifs 129
Abigail Manson McGuire and George M. Church
7 Gene Networks Description and Modeling in the GeneNet
System 149
Nikolay A. Kolchanov, Elena A. Ananko, Vitali A. Likhoshvai,
Olga A. Podkolodnaya, Elena V. Ignatieva, Alexander V.
Ratushny, and Yuri G. Matushkin
8 Regulation of Cellular States in Mammalian Cells from a
Genomewide View 181
Sui Huang
III Postgenomic Approaches 221
9 Predicting Protein Function and Networks on a
Genomewide Scale 223
Edward M. Marcotte
10 Metabolic Pathways 251
Steffen Schmidt and Thomas Dandekar
11 Toward Computer Simulation of the Whole Cell 273
Masaru Tomita
Glossary 289
Corresponding Authors 297
Index 299
vi Contents
Preface
We are in the middle of a genome period marked by the full sequencing
of complete genomes. Last year (2001) will be identified in the history
of biology by the publication of the first draft of the complete sequence
of the human genome. Much work still lies ahead to achieve the goal of
fully finishing many of these eukaryotic and prokaryotic genomes that,
as published, still contain gaps.
At a first glance, genomics has not produced a strong conceptual
change in biology. The fundamental problems remain: understanding
the origin of life, the complex organization of a cell, the pathways of
differentiation, aging, and the molecular and cellular bases for the
capabilities of the brain. What has happened is an explosion of molec-
ular information; genomic sequences will be followed in the near future
by exhaustive catalogs of protein interactions and protein function (as
proteomics takes the lead). This wealth of information can be analyzed,
visualized, and manipulated only with the help of computers. This
basic contribution of computers was initially not recognized by biolo-
gists. Certainly, by the time of the beginning of GenBank, in the 1980s,
the experimentalist could imagine an institute where computational bi-
ology was merely technical support for databases and access to Gen-
Bank, and maybe a classic Bohering metabolic chart hung on the wall
(initiated in the 1960s by G. Michal). The influence of genomes is such
that today what Francois Jacob conceived as the Mouse Institute would
do much better having on staff experimentalists, computer scientists,
statisticians, mathematicians, and computational biologists. We have
reached a point where biology articles are published with contributions
from researchers who recently were, for instance, computer scientists
working in logic programming.
This is no small change if we remember the place of theoretical and
mathematical biology as an activity that could be fascinating, but to
a large extent was done in isolation, having little influence on main-
stream experimental molecular biology. Today, the student, post-
doctoral fellow, or even young professor who is knowledgeable both in
biology and in computer science has much broader opportunities. Gen-
omics may really be opening the door to a more profound conceptual
change in the way we study living systems in the laboratory.
With a foot in sequence analysis, this book is centered on current
computational approaches to metabolism and gene regulation. This is
an area of computational biology that welcomes new methods, ideas,
and approaches with the goal of generating a better understanding of
the complex networks of metabolic and regulatory capabilities of the
cell. Classical concepts have to be redefined or clarified to address the
study of the genetics of populations and of the biochemical interactions
and regulatory networks organizing a living system. Given the con-
stant and pervading importance of comparative genomics, these con-
cepts must be precise when comparing genes, proteins, and systems
across different species.
The first chapter, by Jeremy Ahouse, is an exercise in thinking about
the concept of homology (the common origin of similarities) in order to
use it adequately when considering homologous networks of gene reg-
ulation between species.
Currently, DNA sequence data is the most abundant material with
which to begin a project in computational biology. Raw sequences from
genomes have to be analyzed and annotated, in ways that improve
continuously as the databases expand and sharper methods are used.
The second chapter, by Rolf Apweiler and colleagues, describes an
integrated system for this task. Databases centering on specific signals,
motifs, or structures have exploded in number in the last years. The
databases describe those pieces of macromolecules whose function we
know, and therefore are essential for algorithmic analyses. The third
chapter, by the team of Ralf Hofestadt, shows a system capable of in-
tegrating data from different databases, and its subsequent use in the
integration and modeling of metabolic pathways using a rule-based
system.
Once the computational and basic annotations are in place, we can
move from sequences to networks of gene regulation and cell differen-
viii Preface

tiation. The second part of the book begins with chapter 4, by Gary
Stormo, who describes the foundations of weight matrices and their
biophysical interpretation in protein-DNA interactions. In a way, this
method and its variants are for regulatory motifs what the Smith-
Waterman algorithm was for coding sequence comparisons. Defining
the best matrix is based on the problem of defining the best multiple
alignment, given the constraints of no gaps, symmetry, and other prop-
erties describing most protein-DNA binding sites in upstream regions.
Abigail McGuire and George Church, in chapter 6, show how the inte-
gration of gene regulation has to be supported by experimental studies
of transcriptome analyses combined with computational motif searches.
Chapter 5, by Julio Collado-Vides and colleagues, is devoted to com-
putational studies of gene regulation in E. coli in which different pieces
are put together, making it feasible to think of a global computational
study of a complete network of transcription initiation in a cell. A
pair of chapters illustrate the complexity of these issues when studying
eukaryotes, as seen in the signal transduction modeling by Nikolay
Kolchanov and colleagues (chapter 7), and by the Boolean network
methodology and its plausible application to modeling the network of
factors involved in the biology of asthma by Sui Huang (chapter 8).
In chapter 9 Edward Marcotte presents a relatively novel approach
using phylogenetic profiles to define a quantitative definition of func-
tion in genomics. This is a powerful method that does not require
homology among genes to identify groups of genes involved in the
same function. Metabolic flux analysis as well as the comparison of
pathways in different genomes is illustrated in chapter 11, by Steffen
Schmidt and Thomas Dandekar. The book ends with a chapter by
Masaru Tomita that describes a more ambitious modeling that inte-
grates metabolism, regulation, translation, and membrane transport. A
comprehensive in silico complete cell model is still in its infancy, but
Tomita points to what lies ahead. Still more important is evaluating the
predictive capability of all these computational modeling and simula-
tion projects.
This book does not attempt to provide a complete account of
this expanding and exciting area of research. Many other databases,
algorithms, and mathematical approaches are enriching postgenomic
computational research. In 1995 and 1998 we participated in the
organization of two Dagstuhl seminars centered on modeling and
ix Preface

simulation of metabolism and gene regulation. This book is the out-
growth of a summer school following the Dagstuhl seminars that we
organized in Magdeburg in the summer of 1999. We acknowledge the
sponsorship of the Volkswagen Foundation for these activities. We also
acknowledge Alberto Santos-Zavaleta and Cesar Bonavides-Martınez
for their help in editing the book. Last but not least, we are both grate-
ful to our families for their support during the compilation of this book.
x Preface

Gene Regulation and Metabolism

This page intentionally left blank
1 Are the Eyes Homologous?
Jeremy C. Ahouse
Since the 1990s research in developmental genetics has followed the
approach of borrowing pathways described in one context and testing
to see if the members of a pathway or genetic regulatory circuit can be
found in a new context. This approach has raised questions of how the
concept of homology should be used when comparing genetic regula-
tory circuits. One particularly cautious response has been to claim that
gene expression patterns are informative for the understanding of mor-
phological evolution only when coupled with a detailed understand-
ing of comparative anatomy and embryology.
This reflects the concern that recruitment can lead to a situation where
orthologous genes are expressed in novel contexts during development,
thus suggesting that these similarities in gene expression patterns were
not derived from a common ancestor with the structure of interest. De-
fining homology as a property of structures, genetic networks, or genes,
rather than viewing homology as a particular way to explain observed
similarities, is confusing. Specifying the similarities first and then enter-
taining hypotheses to explain them (including appealing to common
ancestry, i.e., homology) allows us to dispense with tortured discussions
of levels of biological organization at which the concept of homology
may be applied.
Other chapters in this book address specific questions of gene reg-
ulation and metabolism without explicit mention of the connection
between networks and the phenotype. One of the challenges, compu-
tationally, in understanding gene regulation is finding, capturing, and
leveraging the information in better-studied networks. It is standard
practice to apply conclusions from well-studied proteins to similar,
but less well-understood, proteins. This is done when annotating for
function and even when trying to predict structure (see the cautions in
chapter 2 in this volume). This practice of borrowing annotations and
setting expectations relies on tacit assumptions about the transitive
nature of these attributes once homology has been established. It is
my goal in this essay to clarify what hypotheses of homology actually
are in the context of borrowing network and gene regulatory informa-
tion from one (well-described) regulatory circuit to another (less well-
understood).
To make the case for homology of regulatory circuits, and using what
is known in one context and applying it to another, we will have to
examine homology and the emergence of phenotype from regulatory
circuits. This is the current challenge in computational biology. As
genomes are sequenced, there comes the realization that interpreting
the genome sequence is not straightforward. Coding regions are inter-
spersed with noncoding regions, and an individual locus may give rise
to multiple gene products. This has stimulated experimental approaches
to identify the full spectrum of messenger RNAs (the transcriptome) and
their corresponding protein products (the proteome) (RIKEN, 2001). If
we now ask about the many modifications of proteins, and the numer-
ous interactions and the detailed biophysics of protein-protein, protein-
DNA, protein-RNA, and protein-lipid interactions (see chapter 9 in this
volume), we quickly see why sequence-based computational biology
hits a snag.
Part of the enthusiasm for moving to descriptions at the network
level is the hope (or intuition) that there will be regularities that allow
us to offer useful descriptions without losing the emergent biological
narrative in a fog of biophysical details. In addition, the increasing
availability of transcription profiles and the need to interpret them has
encouraged researchers to use known regulatory networks to establish
expectations against which profiling experiments can be statistically
compared. I will offer an operational definition of homology, watch it
at work in a current example of gene regulation (eye development), and
endorse hypotheses of gene regulatory homology that push experi-
mental work and set expectations for establishing statistical significance.
HOMOLOGY
Since evolution was championed in the mid-1800s, it has been possible
to define homologies as similarities due to shared ancestry (Lankester,
2 Jeremy Ahouse
1870; Donoghue, 1992; Patterson, 1987; Patterson, 1988). To understand
the use of this concept when thinking about developmental regulatory
circuits or pathways, it is worth reflecting on the use of the term
‘‘homology.’’ There is general agreement that attributions of homology
are shorthand for the claim that particular similarities are best ex-
plained by common ancestry (Abouheif et al., 1997; Bolker and Raff,
1997; de Beer, 1971; Hall, 1995; Roth, 1984; Roth, 1988; Wagner, 1989a;
Wagner, 1989b). There is still some confusion that flows from conflat-
ing ‘‘homology as an explanation for similarity’’ (as hypothesis) with
treating homology as if it were a (discernible) property of individual
things.
As more and more developmental pathway information becomes
available, comparative work becomes of particular interest. I will try to
provide the framework within which concepts of homology can be
based in these cases. My goal is to reciprocally illuminate the compari-
son of regulatory pathways and those explanations that rest on homol-
ogy. I will use examples from spatiotemporal gene expression patterns
in developmental biology because these are the best studied. But I think
much of the argument carries easily to gene regulatory circuits or met-
abolic pathways (see Burian, 1997 for tensions between developmental
and genetic descriptions).
Here is an example. The eyespots on the wings of butterflies in the
genera Precis and Bicyclus look very similar. In both species, eyespot
foci are established in the larval stage. However, at the pupal stage
things look quite different. The pattern of engrailed expression corre-
lates with the development of eyespot rings. Engrailed is a transcription
factor that is also involved in establishing body segments by activating
the secreted protein hedgehog. In Precis, engrailed expression extends
out to the second ring by 24 hours after pupation and then collapses
to the center of the ring by 48–72 hours. In Bicyclus, it is expressed at
the third ring but not in the second. Whereas both butterflies may use
the same mechanism to place eyespots, the ways in which they specify
the developing rings of the eyespot appear to be different, though the
adult pattern appears similar again (Keys et al., 1999). Given the prof-
ligate reuse of transcription factors in development, we have a real chal-
lenge in applying notions of homology and in borrowing annotations
from one situation to the next.
Reactions to complicated (i.e., actual) examples include the claim that
homology at one level does not require homology at another, or that
3 Are the Eyes Homologous?
homology means nothing more than shared expression patterns of im-
portant regulatory genes during development, or that any assignment
of homology must specify a level in order to be meaningful. Although
homology may apply to (developmental) mechanisms per se (‘‘process
homology’’), rather than to their structural end products, there is ten-
sion in the possibility that homology at one level of organization
may not imply homology at another. For example, nonhomologous
wings are said to have evolved from homologous forelimbs. Pterosaurs,
bats, and birds share the underlying pattern of homologous forelimb
bones of their tetrapod ancestor, but their wings have evolved inde-
pendently. The problem is that because there is no clear way to assign
levels unambiguously, one may conclude, unnecessarily, that gene
expression patterns should not be used as a primary criterion of
homology.
In addition to rejecting hypotheses of homology using gene expres-
sion patterns because they may disagree with each other at varying
levels of organization, some critics cite specific errors that have come
from using expression patterns (Abouheif et al., 1997; Bolker and Raff,
1997). These include the failure to distinguish between orthology and
paralogy,1 the confusion of analogy (convergence) and homology (not-
ing that gene-swapping experiments do not resolve this question), the
failure to notice that orthologous genes can be recruited and expressed
in structures whose similarities may not be due to common ancestry.
So, for example, the distal-less gene (the transcription factor that is the
first genetic signal for limb formation to occur in the developing zygote)
may be homologous in different animals, but its cis regulation may be
convergent in different lineages, so that finding distal-less expression in
different outgrowths does not, by itself, warrant the claim that the re-
sultant limbs are homologous.
These concerns all seem reasonable, and might chill our enthusiasm
for recognizing and borrowing knowledge gleaned from develop-
mental regulatory circuits in different contexts. Must any hypothesis of
morphological homology based on gene expression include, at a mini-
mum, a robust phylogeny, a reconstructed evolutionary history of the
gene, extensive taxonomic sampling, and a detailed understanding of
comparative anatomy and embryology? Or are these requirements
unnecessarily cumbersome? To untangle these issues I will return to a
definition of homology.
4 Jeremy Ahouse
HOMOLOGY: A DEFINITION
The use of the term ‘‘homology’’ implies that a given similarity is a
result of common ancestry. This definition has a critical requirement:
similarity comes first. There are many cases in which the similarity is
cryptic, but this should not fool us into thinking that we are explaining
something other than the similarity.
There are some instructive examples of structures that are not at first
glance similar, but are more obviously so once the hypothesis of com-
mon ancestry is considered seriously, as in studies of insect wing
evolution (Kukalova-Peck, 1983) and wing venation patterns (Kukalova-
Peck, 1985). But we generally begin with the perception of similarity
and then explain the similarities by appealing to a short list of possi-
bilities. Biologists usually consider similarity to be the result of shared
ancestry (homology), chance, convergence (homoplasy), or parallelism
(including repeated co-optation of the same regulatory genes), or an
intricate mix of these. Explanations that posit horizontal transfer are
still appealing to homology to explain similarity, even though they re-
lax the requirement for a unbroken shared lineage.
We should not appeal to homology to explain dissimilarity. And,
importantly, it is not at all clear what the claim that dissimilar objects
are ‘‘nonhomologous’’ would mean. Homology as I have defined it is
coherent only when we begin with similarity. Nonhomologous simi-
larity does make sense, however. Claiming that similarity is not due to
shared ancestry sends us to the other possibilities (convergence, chance,
and biomechanical constraint).
There are other uses of ‘‘homology’’ that we will set aside. There is
the unfortunate use of the word to refer to the degree of DNA sequence
identity or similarity (e.g., 30% homology). This use does not make
particular claims about the origin or process that gives rise to the
similarity.
Then there is the interesting phenomenon of serial homology, as
in the forelimbs and hind limbs of quadrupeds, the repeated segments
of a millipede, or the petals of a flower. A similar situation arises in
developmental genetic terms when, for example, the expression of
apterous in dorsal cells and engrailed in posterior cells in both wing and
haltere discs has been taken as evidence that these two appendages are
built on a ‘‘homologous groundplan’’ (Akam, 1998). Serial homology
5 Are the Eyes Homologous?
does not imply the existence of a common ancestor with just one seg-
ment, limb, or other structure; rather, it gives us insight into how
a structure develops. Sometimes paralogy is assumed to be ‘‘serial
homology’’ at the level of genes. However, paralogy of open reading
frames does imply a common ancestor with just one copy.
HOMOLOGY AS HYPOTHESIS
As biologists, when we give ourselves the task to explain similarity, we
have a limited list of options:
1. Mistaken perception: the similarity is solely in the eye of the be-
holder (flightlessness, an outgrowth, the coelom)
2. Shared ancestor had the anatomical structure, gene, regulatory
network, behavior, temporal and spatial protein distribution, or other
component (homology or horizontal transfer, developmental con-
straints)
3. Convergence, parallelism (adaptation)
4. Chance (drift, contingency, historical constraints)
5. Physical principles (biomechanics).
These options are not mutually exclusive. The claim that the percep-
tion of similarity itself is illusory is an epistemological question (and
not unique to biologists), so I will put it aside. Physical constraints have
been in vogue as an explanation of similarity periodically since the
work of D’Arcy Thompson. Contemporary practitioners who focus on
biomechanics (e.g., Mimi Koehl and Steven Vogel) are part of this tra-
dition, as are the recent wave of neostructuralists (Webster and Good-
win, 1996; Depew and Weber, 1996). The clearest examples of this kind
of similarity are in chemistry (ice crystals look similar due to the phys-
ical processes involved, not shared ancestor relationship between indi-
vidual water molecules).
Physical and chemical constraints do not play a large part in most
biologists’ explanations, so explanations involve appeals to the other
three. Much of the discussion of homology as structural, or dependent
on the relative position of surrounding parts or on the percent of iden-
tical bases or amino acids comes down to questions of the relative
merits of attributing overall similarity to common ancestors, not argu-
ments about the definition of homology.
6 Jeremy Ahouse
The job of explaining similarities is one of partitioning credit. Take
two gene sequences that can be aligned. There will be certain positions
where the residues are shared (i.e., the same). As we move along the
alignment, we can imagine that some of the shared residues reflect a
shared ancestor, whereas others have mutated since the common an-
cestor and have secondarily returned to the same residue thanks to
either drift (there are only four bases possible) or to convergence (the
protein works better if a particular residue is coded for at a particular
position). Clearly the observation of the similarity depends strongly on
the alignment (already an important hypothesis that privileges the idea
that shared residues are due to homology). It should be clear that
understanding what percent of the identities are due to homology,
chance, and convergence may be difficult, but it is at least formally
possible. Many biologists take identical residues to indicate common
ancestry in combination with stabilizing selection.
Sequence comparison allows us to partition credit, at least in princi-
ple. Doing the same thing when we are discussing morphology or gene
regulatory circuits is more difficult. This is both because it is much
harder to atomize the trait unambiguously and because the explana-
tions are deeply intertwined. This difficulty does not have to block
inquiry.
Focusing on convergence is the traditional way to gain insight into
the selectionist forces at work. Lineages are assumed to be independent
trials in a natural experiment, so convergence suggests similar selection
pressures (Losos et al., 1998). Alternatively, attention to the underlying
homologies2 offers insight into possible origins, and relationships
among and constraints on the evolution of forms in the taxa under
consideration (see Amundson, 1998 for a discussion of the structuralist
tradition). Devotion to chance events has been used to good effect in
both understanding the distribution and abundance of lineages and in
inferring times of divergence by using background mutation rates of
DNA sequences. The importance of contingent events in the history of
life is well described by Gould’s review of the Burgess shale fossils and
his discussion of which lineages got to participate in the Cambrian ex-
plosion (Gould, 1990). These three accounts are not mutually exclusive;
rather, they are the strands from which evolutionary explanations are
braided.3
Can gene circuits and spatial and temporal expression patterns be
perceived as similar? Certainly. Are they candidates for hypotheses of
7 Are the Eyes Homologous?
homology? I would say, absolutely yes! Now the question of diagnosis
is open and difficult—but the appeals to homology, chance, and con-
vergence as parts of an explanation are not especially problematic for
developmental genetics (see also Gilbert et al., 1996; Gilbert and Bolker,
2001). Due to changes in developmental timing, it is often a real chal-
lenge to identify the equivalent developmental stages across lineages.
Correlating equivalent developmental stages in different organisms is
much like testing multiple alignment hypotheses in sequence-based
comparison, though the criteria for identity are less obvious. However,
if we are comparing which regulatory elements are upstream or down-
stream in a circuit, we can anchor our particular questions to the circuit
under consideration, even before we have full resolution of the stage
problem.
Can regulatory genes be homologous if the structures they produce
are not? Again, I would answer this with an enthusiastic yes. I suspect
that what is usually meant by ‘‘not homologous’’ is that the structures
produced are not similar (or the part of the structures we are trying
to explain are not the similarities). I find it less likely, but formally
possible, that someone could convince us that the similarities of the
structures are best explained by an appeal to convergence or chance or
physical constraint even if the regulatory genes’ similarities were best
explained by their sharing a common ancestor (i.e., they are homolo-
gous). Are tissues homologous if similarity is cryptic and apparent only
at level of genes? We are constantly increasing the number of ways that
we can probe and understand a tissue. As should be clear by now, I
would prefer to reserve assertions of homology for the actual simi-
larities (the noncryptic gene similarities).
THE EVOLUTION OF THE EYE
The evolution of the eye stood for years as a paradigmatic example of
independent evolutionary paths fulfilling the same need. Vertebrates
and mollusks have single-lens eyes (though the photoreceptive cells
under the lens have opposite orientation), whereas insects have com-
pound eyes. These differences had been taken to imply that the eye
evolved (independently) numerous times. We now know that the large
morphological differences share a common developmental pathway of
elements for optic morphogenesis. The evidence for commonality in
these developmental pathways comes from looking at similar proteins
8 Jeremy Ahouse
in mammals and flies (the Pax proteins) (Gehring, 1999). A particular
protein, called eyeless for its mutant phenotype in fruit flies, was shown
to produce eye structures on wings and legs of flies when ectopically
expressed in those locations. It seems reasonable to conclude that it must
be near the top of the developmental hierarchy for eye development.
A mutation in a similar protein in mammals (Pax6, the eyeless
homologue, based on sequence and motif similarities) results in abnor-
mal formations of the eye. The mouse protein, when expressed in un-
usual locations in the fly, also results in production of ectopic fly eyes.
Whether Pax6 recruits native eyeless, which then auto-upregulates more
eyeless, or does the job itself is not known. But in either case, these two
proteins have very similar functions. This finding also suggests that ei-
ther (a) the common ancestor of flies and mice also had working eyes
whose development used this protein (i.e., the common ancestor of
Pax6 and eyeless) or (b) whatever this protein was doing in the common
ancestor, it facilitated the evolution of eyes in other lineages (a Pax6-
like protein is found in squid and octopus, too).
So are the eyes homologous? If we begin with similarities, we can
avoid a fruitless argument. The differences between compound fly eyes
and single-lens vertebrate eyes cannot support a hypothesis of homol-
ogy because they are differences. This allows us to focus on the simi-
larities; bilateral symmetry, positioning on the head, the expression
patterns of regulatory genes, the pathway itself (eyeless, twin of eyeless,
sine oculis, eyes absent, dachshund . . .). All of these similarities do seem to
be homologous; or, more carefully, we would credit those similarities
to shared ancestry.
It is relevant to point out that work on the regulation of chick muscle
development has shown that homologues of genes involved in mouse
eye development (Dach2, Eya2 and Six1) are involved in vertebrate
somite (muscle) development (Heanue et al., 1999). Again by focusing
on the similarities, in this case the regulatory feedback loops, we might
appeal to homology while simultaneously avoiding the question of
whether eyes are homologous to the segmentally organized meso-
dermal structures that are the embryonic precursors of skeletal muscle.
Do we need a new word for homologous gene circuits (e.g., true
homology, deep homology, homoiology), or should we talk about
homology at different levels? I have been arguing that attribution of
similarity to historical relatedness is an appeal to homology, whenever it
is made. The additional adjectives (‘‘true’’ or ‘‘deep’’) do not add much.
9 Are the Eyes Homologous?
Contingency, homology, selection (functional convergence), and physi-
cal constraints are constitutive parts of any explanation for a trait,
whether it is a gene sequence, a gene expression pattern, or an adult
tissue.
METHOD
While similarity surely results from a mix of explanations, a method-
ological preference for homology can still be defended. Looking for
and highlighting homology when discussing developmental regulation
serves us by generating hypotheses that inspire tests in ways that con-
tingency and convergence do not. This does not mean that the hypoth-
esis of homology will be supported by those tests, but we know what to
do next in the laboratory.
I would like to contrast the kinds of hypotheses that are generated
when we focus on differences attributed to selection rather than on
similarities attributed to homology. C. J. Lowe and G. A. Wray studied
several homeobox genes and concluded that they were recruited into
new roles: ‘‘Each of these cases [orthodenticle, distal-less, engrailed ex-
pression in brittle stars, sea urchins, and sea stars] represents recruit-
ment (co-option) of a homeobox gene to a new developmental role. . . .
Role recruitment implies that the downstream targets are different from
those in other phyla.’’ This assessment—that if the genes were recruited
into new roles, their downstream targets would be different—presents
a significant experimental challenge. Where to go next? What if, in-
stead, Lowe and Wray had asserted that the upstream and downstream
factors were what had been found previously in other organisms? They
would then have known which genes (and expression patterns) to hunt
for. This suggests that it may be methodologically useful to hypothe-
size homologies, especially when looking at pathways and develop-
mental circuits, since previously characterized networks provide a list
of candidates that might be involved in the new situation.
Most evolutionists recognize that explaining every feature of an or-
ganism as an adaptation can become mere storytelling. This is why
nonhomologous similarities are of special interest (i.e., distinct clades
that share the feature of interest). With multiple clades, if we have
ruled out homology, chance, and physical constraint, we can then look
to commonalities in the respective environments to suggest that there
may have been similar selection regimes. Dispensing with the compar-
10 Jeremy Ahouse
ative step can result in an uncritical adaptationism that explains (by an
appeal to natural selection) the existence of a trait that is unique or
novel in our lineage of interest. Without multiple lineages for compari-
son (focusing just on the autapomorphy) we are free to assert that the
population faced whatever challenges could select for the structures
under consideration.
These selectionist accounts are too difficult to challenge and can be
produced at will. Flying, for example, has arisen numerous times from
flightless ancestors. Should every structure that makes flight possible
be treated as a complete novelty in each lineage? Because of the possi-
bilities of finding developmental and structural homologies, there are
certain parts of the explanation of flight in these lineages that will be
better examined by restricting our inquiry to the three vertebrate clades
that had flight (pterosaurs, birds, and bats) as distinct from the flying
insects. It should be clear that comparative work is critical, and for-
tunately the sequencing projects and advances in transcript and protein
profiling make comparative work ever easier. And the information that
can be gleaned from comparative work (borrowing annotations and
candidates justified by hypotheses of homology) should motivate ever
more comparative studies.
From a methodological standpoint, then, identifying homologies
has salutary effects. First, it demands an actual comparison. Second, in
comparing across clades we can easily generate hypotheses. If our trait
of interest stands in particular relations to other features in one organ-
ism—a given regulatory gene, for example—we can hypothesize that it
will also do so in another. We still may not find the targets, but
hypotheses of homology can tell us what to test initially.
As we move from the initial wave of genome sequencing to the
wonderfully more complicated problems of understanding what pro-
teins do, how they interact, and how they are regulated, we will need
principled ways to interpret profiling information, generate network
hypotheses, and annotate myriad functions. In that project, homology
plays a useful role both in giving a methodological starting point for
generating candidate interactions and in reminding us that inference
from similarity is difficult. The use of comparative developmental
genetics to generate hypotheses of homology should be embraced. Ex-
pression patterns and regulatory networks are legitimate foci for hy-
potheses of homology, because they help us understand the origin and
evolution of structure. Finally, attributions of homology should be
11 Are the Eyes Homologous?
sought, solely on methodological grounds, because they offer us spe-
cific testable hypotheses.
ACKNOWLEDGMENTS
I would like to acknowledge pivotal conversations with Georg Halder,
John True, and Jen Grenier during my postdoctoral work with Sean
Carroll in the Laboratory of Molecular Biology, Howard Hughes Med-
ical Institute, Madison, Wisconsin, and very useful comments from
Kevin Padian at the Museum of Paleontology, UC Berkeley, and Scott
Gilbert at Swarthmore College.
NOTES
1. The paralogy and orthology distinction was introduced to distinguish two kinds of
homology in proteins (Fitch, 1970). Paralogy is meant to cover those situations when a
gene duplication allows related proteins to evolve independently within the same lineage.
Orthologues are found in different individuals, and paralogues can be found in the same
individual (reviewed in Patterson, 1987).
2. ‘‘The importance of the science of Homology rests in its giving us the key-note of the
possible amount of difference in plan within any group; it allows us to class under proper
heads the most diversified organs; it shows us gradations which would otherwise have
been overlooked, and thus aids us in our classification; it explains many monstrosities; it
leads to the detection of obscure and hidden parts, or mere vestiges of parts, and shows
us the meaning of rudiments. Besides these practical uses, to the naturalist who believes
in the gradual modification of organic beings, the science of Homology clears away the
mist from such terms as the scheme of nature, ideal types, archetypal patterns or ideas,
&c.; for these terms come to express real facts.
The naturalist, thus guided, sees that all homological parts or organs, however much
diversified, are modifications of one and the same ancestral organ; in tracing existing
gradations he gains a clue in tracing, as far as that is possible, the probable course of
modification during a long line of generations. He may feel assured that, whether he fol-
lows embryological development, or searches for the merest rudiments, or traces grada-
tions between the most different beings, he is pursuing the same object by different routes,
and is tending towards the knowledge of the actual progenitor of the group, as it once
grew and lived. Thus the subject of Homology gains largely in interest’’ Charles Darwin,
On the Various Contrivances by Which British and Foreign Orchids Are Fertilised by Insects,
2nd ed. (London: John Murray, 1877), pp. 233–234.
3. This insistence on a pluralistic account (including homology, selection, and chance) is
not meant to defend claims of percent homologue. A particular similarity either is or is
not homologous. The use of ‘‘homology’’ with respect to gene sequences to indicate per-
cent similarity should be avoided. I am only making the uncontroversial claim that any
comparison of particular traits in toto will be require an appeal to homology, conver-
gence, and chance.
12 Jeremy Ahouse
REFERENCES
Abouheif, E., Akam, M., Dickinson, W. J., Holland, P. W. H., Meyer, A., Patel, N. H., Raff,
R. A., Roth, V. L., and Wray, G. A. (1997). Homology and developmental genes. TIG 13:
432–433.
Akam, M. (1998). Hox genes, homeosis and the evolution of segment identity: No need
for hopeless monsters. Int. J. Dev. Biol. 42: 445–451.
Amundson, Ron (1998). Typology reconsidered: Two doctrines on the history of evolu-
tionary biology. Biol. Philos. 13(2): 153–177.
Bolker, J. A., and Raff, R. A. (1997). Developmental genetics and traditional homology.
BioEssays 18: 489–494.
Burian, R. M. (1997). On conflicts between genetic and developmental viewpoints—and
their attempted resolution in molecular biology. In M. L. Dalla Chiara (ed.), Structures
and Norms in Science. Dordrecht, The Netherlands: Kluwer Academic Publishers, pp.
243–264.
de Beer, S. G. (1971). Homology, an Unsolved Problem. London: Oxford University Press.
Depew, D. J., and Weber, B. (1996). Darwinism Evolving: Systems Dynamics and the Geneal-
ogy of Natural Selection. Cambridge, Mass.: MIT Press.
Donoghue, M. J. (1992). Homology. In E. F. Keller and E. A. Lloyd (eds.), Keywords in
Evolutionary Biology, Cambridge, Mass.: Harvard University Press, pp. 170–179.
Fitch, W. M. (1970). Distinguishing homologous from analogous proteins. Syst. Zool. 19:
99–113.
Gehring, W. J. (1999). Pax 6 mastering eye morphogenesis and eye evolution. TIG 15(9):
371–377.
Gilbert, S. F., and Bolker, J. A. (2001). Homologies of process: Modular elements of em-
bryonic construction. In G. Wagner (ed.), The Character Concept in Evolutionary Biology.
New Haven, Conn.: Yale University Press, pp. 435–454.
Gilbert, S. F., Opitz, J., and Raff, R. A. (1996). Resynthesizing evolutionary and devel-
opmental biology. Dev. Biol. 173: 357–372.
Gould, Stephen Jay. (1990). Wonderful Life: The Burgess Shale and the Nature of History. New
York: W. W. Norton.
Hall, B. K. (1995). Homology and embryonic development. Evol. Biol. 28: 1–37.
Heanue, T. A., Reshef, R., Davis, R. J., Mardon, G., Oliver, G., Tomarev, S., Lassar, A. B.,
and Tabin, C. J. (1999). Synergistic regulation of vertebrate muscle development by
Dach2, Eya2, and Six1, homologs of genes required for Drosophila eye formation. Genes
and Dev. 13: 3231–3243.
Keys, D. N., Lewis, D. L., Selegue, J. E., and Carroll, S. B. (1999). Recruitment of a hedgehog
regulatory circuit in butterfly eyespot evolution. Science 283: 532–534.
13 Are the Eyes Homologous?
Kukalova-Peck, J. (1983). Origin of the insect wing and wing articulation from the
arthropodan leg. Can. J. Zool. 61: 1618–1669.
Kukalova-Peck, J. (1985). Ephemeroid wing venation based upon new gigantic Carbonif-
erous mayflies and basic morphology, phylogeny, and metapmorphosis of pterygote
insects (Insecta, Ephemerida). Can. J. Zool. 63: 933–955.
Lankester, E. R. (1870). On the use of the term homology in modern zoology. Annu. Mag.
Nat. Hist. ser. 4, 6: 34–43.
Losos, J. B., et al. (1998). Contingency and determinism in replicated adaptive radiations
of island lizards. Science 279 (March 27): 2115–2118.
Lowe, C. J., and Wray, G. A. (1997). Radical alterations in the roles of homeobox genes
during echinoderm evolution. Nature 389: 718–721.
Patterson, C. (1982). Morphological characters and homology. In K. A. Joysey and A. E.
Friday (eds.), Problems of Phylogenetic Reconstruction. London: Academic Press, pp. 21–74.
Patterson, C. (1987). Introduction. In C. Patterson (ed.), Molecules and Morphology in Evo-
lution: Conflict or Compromise?. Cambridge: Cambridge University Press.
Patterson, C. (1988). Homology in classical andmolecular biology.Mol. Biol. Evol. 5: 603–625.
RIKEN Genome Exploration Research Group Phase II Team and the FANTOM Consor-
tium. (2001). Functional annotation of a full-length mouse cDNA collection. Nature 409:
685–690.
Roth, V. L. (1984). On homology. Biol. J. Linnaean Soc. 22: 13–29.
Roth, V. L. (1988). The biological basis of homology. In C. J. Humphries (ed.), Ontogeny
and Systematics. New York: Columbia University Press, pp. 1–26.
Wagner, G. P. (1986). The systems approach: An interface between development and
population genetic aspects of evolution. In D. M. Raup and D. Jablonski (eds.), Patterns
and Processes in the History of Life. Berlin: Springer-Verlag, pp. 149–165.
Wagner, G. P. (1989a). The biological homology concept. Annu. Rev. Ecol. Systemat. 20:
51–69.
Wagner, G. P. (1989b). The origin of morphological character and the biological basis of
homology. Evolution 43: 1157–1171.
Webster, G., and Goodwin, B. (1996). Form and Transformation: Generative and Relational
Principles in Biology. Cambridge: Cambridge University Press.
SUGGESTED READING
Carroll, Sean B., Grenier, Jennifer K., and Weatherbee, Scott D. (2001). From DNA to
Diversity: Molecular Genetics and the Evolution of Animal Design. Oxford: Blackwell Science.
Davidson, Eric H. (2001). Genomic Regulatory Systems: Development and Evolution. London:
Academic Press.
14 Jeremy Ahouse
Gehring, Walter J., and Ruddle, Frank. (1998). Master Control Genes in Development and
Evolution: The Homeobox Story. New Haven, Conn.: Yale University Press. (Terry Lectures).
Gerhart, John, and Kirschner, Marc W. (1997). Cells, Embryos, and Evolution: Toward a Cel-
lular and Developmental Understanding of Phenotypic Variation and Evolutionary Adaptability.
Oxford: Blackwell Science.
Gilbert, Scott F. (2000). Developmental Biology. 6th ed. Sunderland, Mass.: Sinauer Asso-
ciates.
Hall, Brian K. (1998). Evolutionary Developmental Biology. London: Chapman & Hall.
Hall, Brian K. (2000). Homology: The Hierarchical Basis of Comparative Biology. London:
Academic Press.
Lawrence, Peter A. (1992). The Making of a Fly: The Genetics of Animal Design. Oxford:
Blackwell Science.
Owen, Richard, and Sloan, Phillip Reid (eds.). (1992). The Hunterian Lectures in Compara-
tive Anatomy, May–June, 1837. Chicago: University of Chicago Press.
Raff, Rudolf A. (1996). The Shape of Life: Genes, Development, and the Evolution of Animal
Form. Chicago: University of Chicago Press.
Sober, E. (1988). Reconstructing the Past. Cambridge, Mass.: MIT Press.
Wiley, E. O., Siegel-Causey, D., Brooks, D. R., and Funk, V. A. (1991). The Compleat Clad-
ist: A Primer of Phylogenetic Procedures. Lawrence: University of Kansas, Museum of Nat-
ural History.
URLs FOR RELEVANT SITES
Flybase: The Interactive Fly describes fly proteins and their actions and interac-
tions. http://flybase.harvard.edu:7081/allied-data/lk/interactive-fly/
aimain/1aahome.htm
The Hennig Society. If your work with homologies brings you to constructing trees, you
will want to explore cladistics. http://www.cladistics.org/education.html
Kyoto Encyclopedia of Genes and Genomes (KE66) is an effort to capture molecular and
cellular biology in terms of the information pathways that consist of interacting proteins.
http://www.genome.ad.jp/kegg/
Virtual Embryo is a collection of developmental biology tutorials and links.
http://www.ucalgary.ca/UofC/eduweb/virtualembryo
15 Are the Eyes Homologous?

This page intentionally left blank

I Information and KnowledgeRepresentation

This page intentionally left blank
2 Automation of Protein SequenceCharacterization and Its Application inWhole Proteome Analysis
Rolf Apweiler, Margaret Biswas, Wolfgang
Fleischmann, Evgenia V. Kriventseva, and Nicola
Mulder
The first complete genome sequence of an organism, the five-kilobase
sequence of the bacterial virus phi-X174, was achieved by Fred Sanger
and coworkers in Cambridge (Sanger et al., 1978). Only more recently,
however, has the technology developed to a stage where the sequenc-
ing of the complete genome of a living organism can be contemplated
as a practical and routine possibility. A major breakthrough was the
sequencing of the first complete eukaryote chromosome, chromosome
III of Saccharomyces cerevisiae, in 1992 by a European Union-funded
consortium (Oliver et al., 1992). In 1995 the TIGR group published the
first complete sequence of a bacterial genome, that of Haemophilus in-
fluenzae (Fleischmann et al., 1995).
Since those dramatic events the complete sequences of more than 40
bacterial genomes have been published and at least 70 more are known
to be nearing completion. The sequencing of five eukaryotic genome
sequences—those of Saccharomyces cerevisiae (Goffeau et al., 1997), the
nematode Caenorhabditis elegans (The C. elegans Consortium, 1998), the
fruit fly Drosophila melanogaster (Adams et al., 2000), the plant Arabi-
dopsis thaliana (The Arabidopsis Initiative, 2000), and the alga Guillardia
theta (Douglas and Penny, 1999) has been achieved and the sequences
of other model eukaryotes are nearing completion. Large-scale sequenc-
ing of the genome of the laboratory mouse is well under way in the
United States, Japan, and Europe. The sequences of several important
protozoan parasites are close to being finished. In addition, the com-
plete genomes of many mitochondria and plastids have been deter-
mined. The ‘‘Holy Grail’’ of large-scale sequencing is, however, the
determination of the sequence of the human genome, estimated at
around 3 billion base pairs. The completion of the ‘‘first draft’’ of this
sequence was announced on 26 June 2000 by an international consor-
tium of public laboratories.
Various proteomics and large-scale functional characterization proj-
ects in Europe, Japan and the United States complement the large-scale
nucleotide sequencing efforts. These projects have all produced large
amounts of sequence data lacking experimental determination of the
biological function. To cope with such large data volumes and to
provide meaningful information, new approaches to characterize and
annotate the biological data in a faster and more effective way are
required. One promising but still error-prone approach is automatic
functional analysis, which is generated with limited human interaction.
AUTOMATIC ANNOTATION
The Pitfalls of Automatic Functional Analysis
Several solutions of automatic functional characterization of unknown
proteins are based on high-level sequence similarity searches against
known proteins. Other methods collect the results of different pre-
diction tools in a simple (http://pedant.gsf.de/; Frishman andMewes, 1997) or a more elaborate (http://jura.ebi.ac.uk:8765/ext-genequiz/; Tamames et al., 1998; Hoersch et al., 2000) manner.However, some of the currently used approaches have several draw-
backs, including the following:
. Since many proteins are multifunctional, the assignment of a singlefunction, which is still common in genome projects, results in the loss
of information and outright errors.
. Since the best hit in pairwise sequence similarity searches is fre-quently a hypothetical protein, a poorly annotated protein, or simply a
protein that has a different function, the propagation of wrong annota-
tion is widespread.
. There is no coverage of position-specific annotation, such as activesites.
. The annotation is not constantly updated, and thus is quickly
outdated.
It is also important to emphasize that a single sentence describing
some predicted properties of an unknown protein should not be re-
20 Rolf Apweiler et al.
garded as annotation. It may be regarded as an attempt to characterize
a protein, but not as an attempt to annotate the protein. Annotation
means the addition to a protein sequence of as much reliable and up-to-
date information as possible describing properties such as function(s)
of the protein, domains and sites, catalytic activity, cofactors, regulation,
induction, subcellular location, quaternary structure, diseases associated
with deficiencies in the protein, the tissue specificity of a protein, de-
velopmental stages in which the protein is expressed, pathways and
processes in which the protein may be involved, similarities to other
proteins, and so on.
The Annotation Concept of SWISS-PROT and TrEMBL
The SWISS-PROT protein sequence database (Bairoch and Apweiler,
2000) strives to provide extensive annotation as defined above. The
increased data flow from genome projects to the protein sequence
databases, however, challenges this time- and labor-intensive method
of database annotation. Maintaining the high quality of annotation
in SWISS-PROT requires the careful and detailed annotation of every
entry with information retrieved from the scientific literature and from
rigorous sequence analysis. This is the rate-limiting step in the produc-
tion of SWISS-PROT. It is of paramount importance to maintain the
high editorial standards of SWISS-PROT because the exploitation of the
sequence avalanche is heavily dependent on reliable data sources as the
basis for automatic large-scale functional characterization and annota-
tion by comparative analysis. This, then, sets a limit on how much the
SWISS-PROT annotation procedures can be accelerated. Recognizing
that it is also vital to make new sequences available as quickly as pos-
sible, in 1996 the European Bioinformatics Institute (EBI) introduced
TrEMBL (Translation of EMBL nucleotide sequence database). TrEMBL
consists of computer-annotated entries derived from the translation of
all coding sequences (CDS) in the EMBL database, except for CDS al-
ready included in SWISS-PROT.
To enhance the annotation of uncharacterized protein sequences
in TrEMBL, the SWISS-PROT/TrEMBL group at the EBI developed
a novel method for automatic and reliable functional annotation
(Fleischmann et al., 1999). This method selects proteins in the SWISS-
PROT protein sequence database that belong to the same group of
proteins as a given unannotated protein, extracts the annotation shared
21 Automation of Protein Sequence Characterization
by all functionally characterized proteins of this group, and assigns this
common annotation to the unannotated protein.
Automatic Annotation of TrEMBL
To implement this methodology for the automated large-scale functional
annotation of proteins, three major components are required. First, a
reference database must serve as the source of annotation. SWISS-PROT
makes an excellent reference database due to its highly reliable, well-
annotated, and standardized information. Second, a highly reliable, di-
agnostic protein family signature database must provide the means to
assign proteins to groups. Initially, PROSITE (Hofmann et al., 1999) was
used, and in future, InterPro, described below, will be used. The third
component needed for the implementation of the automated large-scale
functional annotation methodology is a database (RuleBase) that stores
and manages the annotation rules, their sources, and their usage.
The Reference Database The basis for the automatic annotation
of TrEMBL is the functional information in the SWISS-PROT protein
sequence database. Many other annotation approaches try to predict
functions by comparative analysis with SWISS-PROT and other protein
databases like TrEMBL and Genpept. There are three main reasons for
using only SWISS-PROT annotation in automatic approaches.
First, SWISS-PROT is a comprehensive protein sequence database.
This may seem surprising, since as of October 2000 SWISS-PROT con-
tains only 88,000 proteins. Although these sequences represent—taking
redundancy into account—less than one-third of all known protein
sequences, SWISS-PROT contains around 60% of all proteins found
in comprehensive protein sequence databases (like SWISS-PROTþTrEMBL [SPTR] or protein entries in Entrez) with annotation of at least
basic experimentally derived functional characterization. This percent-
age was estimated from the number of papers (70,000) cited in SWISS-
PROT records compared with the number of papers in all SPTR or
Entrez protein entries (110,000) together. The calculation was based on
the assumption that the proportion of papers reporting sequencing to
papers reporting characterization is the same in SWISS-PROT records
as in TrEMBL records or in non–SWISS-PROT Entrez protein records.
However, an inspection of citations from SWISS-PROT compared with
citations from TrEMBL shows that SWISS-PROT contains a higher pro-
22 Rolf Apweiler et al.
portion of papers representing biochemical citation than do TrEMBL
papers.
This observation, together with the sequence redundancy in TrEMBL
and the non–SWISS-PROT records of Entrez proteins, indicates that
SWISS-PROT probably contains more than 60% of all annotated pro-
teins with at least basic biochemical characterization. Even more strik-
ing is the fact that more than 80% of all functional annotation found in
the comprehensive protein sequence database records (such as SPTR or
protein entries in Entrez) is SWISS-PROT annotation. SWISS-PROT an-
notation is, for the most part, stored in the CC (Comment), FT (Feature
Table), KW (Keyword) and DE (Description) lines. As of August 2000,
there are more than 410,000 CC lines, 460,000 FT lines, and 110,000 DE
lines in SWISS-PROT. This information in SWISS-PROT is abstracted
from more than 70,000 literature citations reporting sequencing and/or
characterization.
Another important reason is the standardization of annotation in
SWISS-PROT. This unique feature of SWISS-PROT allows the extrac-
tion of the ‘‘common annotation’’ described above. Using the stan-
dardized SWISS-PROT annotation leads eventually to the standardized
annotation of TrEMBL.
The last and perhaps most important reason is the fact that SWISS-
PROT distinguishes experimentally determined functions from those
determined computationally.
InterPro InterPro (Apweiler et al., 2001) is an integrated resource
for protein families, domains, and functional sites, developed as an in-
tegrative layer on top of the PROSITE, PRINTS (Attwood et al., 2000),
Pfam (Bateman et al., 2000), and ProDom (Corpet et al., 2000) data-
bases. The different approaches integrated in InterPro (hidden Markov
models [HMMs], profiles, fingerprints, regular expressions, etc.) have
different strengths and weaknesses. The combination of the strengths of
the different signature recognition methods, coupled with a statistical
and biological significance test, overcomes drawbacks of the individual
methods. InterPro reliably classifies proteins into families and recog-
nizes the domain structure of multidomain proteins. The use of In-
terPro should facilitate increased coverage of target sequences with
enhanced reliability (reduction of false positives and false negatives).
InterPro can currently classify around 60% of all known protein
sequences.
23 Automation of Protein Sequence Characterization
RuleBase RuleBase stores the common annotation extracted from a
group of SWISS-PROT entries. The common annotation is linked to the
conditions and to the set of proteins from which the annotation was
derived. The concept of a rule is used so that every rule has one or
more conditions and one or more actions associated with it. If the con-
ditions hold for a target TrEMBL entry, then all the actions are applied
to that entry (Fleischmann et al., 1999).
Implementation The actual flow of information during automatic
annotation can be divided into five steps.
1. Use InterPro and additional a priori knowledge to extract the infor-
mation necessary to assign proteins to groups (conditions) and store
the conditions in RuleBase.
2. Group the proteins in SWISS-PROT by the stored conditions.
3. Extract from SWISS-PROT the common annotation shared by all
functionally characterized proteins from each group. Store this com-
mon annotation together with its conditions in RuleBase. Every rule
consists of conditions and the annotation common to all proteins of the
group characterized by these conditions.
4. Group the unannotated, target TrEMBL entries by the conditions
stored in RuleBase.
5. Add the common annotation to the unannotated TrEMBL entries.
The predicted annotation will be flagged with evidence tags, which will
allow users to recognize the predicted nature of the annotation as well
as the original source of the inferred annotation.
Because the reliability of the conditions is crucial to the reliability
of the methodology, measures are taken to minimize false-positive
automatic annotation. The InterPro database that is used to extract
conditions and to assign proteins to groups integrates different com-
putational techniques for the recognition of signatures that are diag-
nostic for different protein families or domains. In addition, every rule
ensures that the taxonomic classification of the unannotated protein
sequences lies within the known taxonomic range of the experimentally
characterized proteins.
This automatic annotation approach should overcome some limi-
tations of some existing automatic annotation methods in the following
ways:
24 Rolf Apweiler et al.
. By using only the annotation from a reliable reference database for
the predictions, the propagation of wrong annotation, one of the core
problems in functional annotation, is drastically reduced (Bork and
Koonin, 1998).
. By using the ‘‘common annotation’’ of multiple entries, the imple-mented methodology will produce a significantly lower number of
overpredictions than methods based on the best hit of a sequence simi-
larity search.
. Using the ‘‘common annotation’’ from a reliable reference database
with standardized annotation and nomenclature ensures the stan-
dardized annotation of uncharacterized, target proteins by avoiding the
use of wrong nomenclature and of different descriptions for the same
biological fact.
. Since the method takes all potential annotation available in the refer-ence database into account, a much higher level of annotation, includ-
ing position-specific annotation such as active sites, is possible.
. The ‘‘common annotation’’ approach can be used not only with pro-tein families but also with conditions aiming at a higher level in the
protein family hierarchy. Only the annotation common to all members
of this (for instance) superfamily will be copied over.
. Our methodology is independent of the multidomain organization ofproteins. If a certain condition aims at a single domain that occurs with
various other domains, it can be expected that only the annotation re-
ferring to this single domain will be found in all relevant characterized
proteins. On the other hand, if the single domain always occurs with
another domain, the information for the other domain will be picked
up as well.
. Evidence tags will allow the automatic update of the predicted an-
notation if the underlying conditions or the ‘‘common annotation’’ in
RuleBase changes.
WHOLE PROTEOME ANALYSIS
A Four-Layer Approach to Whole Proteome Analysis
It is no longer ludicrous to envisage collecting vast amounts of genomic
data, although it remains a massive task. The challenge is in developing
the tools and methods required to analyze the data. In the sections
25 Automation of Protein Sequence Characterization
above, we described how the SWISS-PROT group at the EBI combines
manual annotation and sequence analysis of SWISS-PROT entries with
rule-based automatic annotation of TrEMBL entries to provide a com-
prehensive, reliable, and up-to-date protein sequence database. With
existing methodology we are able to improve the annotation of ap-
proximately 25% of the incoming data. Exploiting this approach to the
full will enable us to annotate approximately 40–50% of the new and
existing sequence data in a reasonable way within a few years. How-
ever, tools developed by our group and by others make possible the
preliminary classification and characterization of many more sequences.
Capitalizing on these achievements, we developed a new four-layer
strategy for protein analysis:
1. Automatic protein classification
2. Automatic protein characterization
3. Rule-based automatic annotation
4. SWISS-PROT-style manual annotation.
From level 1 to level 4 there is an increase in the manual intervention
required and a decrease in both the computational power needed and
the number of protein sequences affected. The rule-based automatic
annotation of TrEMBL entries and the SWISS-PROT-style manual
annotation (levels 3 and 4) were described above. In the following
sections we will describe automatic protein classification and charac-
terization, and their application to provide statistical and compara-
tive analysis, as well as structural and other information, for complete
proteome sequences.
Whole Proteome Analysis at EBI
The EBI proteome analysis initiative aims to provide comprehensive,
easily accessible information as quickly as possible to the user commu-
nity. Proteome analysis data have been produced for all the completely
sequenced organisms spanning archaea, bacteria, and eukaryotes. Com-
plete proteome sets for each organism have been assembled from the
SPTR (SWISS-PROTþTrEMBLþTrEMBLnew) database (Apweiler, 2000)to be wholly nonredundant at the sequence level. These proteome data
have been used in the analysis, and are easily accessible and down-
loadable from the proteome analysis pages (http://www.ebi.ac.uk/proteome/).
26 Rolf Apweiler et al.
Automatic Protein Classification
For the automatic classification of proteins, InterPro (Apweiler et al.,
2001), CluSTr, HSSP (Sander and Schneider, 1991), TMHMM (Sonn-
hammer et al., 1998), and SignalP (Nielsen et al., 1999) are used. Sig-
nalP is used for the prediction of signal peptides and their cleavage
sites in eukaryotes and prokaryotes in order to classify secreted pro-
teins and transmembrane proteins with signal sequences. TMHMM
predicts transmembrane helices in proteins and is used for the iden-
tification and classification of transmembrane proteins. A list of
nonredundant proteins from the reference proteome with HSSP
(homology-derived secondary structure of proteins) links has been
generated from current releases of SWISS-PROT and TrEMBL. These
proteins, together with those having a corresponding PDB (Berman et
al., 2000) entry, represent the proteins with structural classification.
The resources with the highest information content are InterPro and
CluSTr. InterPro (http://www.ebi.ac.uk/interpro/) classifies50–70% of all proteins in a proteome into distinct families. In addition,
InterPro provides insights into the domain composition of the classified
proteins. The proteome analysis pages (http://www.ebi.ac.uk/proteome/) make available InterPro-based statistical analysis that
includes the following, among other information:
. General statistics—lists all InterPro entries with matches to the refer-ence proteome. The matches per genome and the number of proteins
matched for each InterPro entry are displayed.
. Top 30 entries—lists the 30 InterPro entries with the highest numberof protein matches for the reference proteome.
. 15 most common domains—lists the InterPro entries with the largestnumber of Pfam and profile matches (defined as domains) for the ref-
erence proteome. The matches per genome and the number of proteins
matched for each InterPro entry are shown.
ClusTr
There are several databases that focus on the analysis of complete pro-
tein sequences. The COG database (Clusters of Orthologous Groups
of proteins) is a phylogenetic classification of proteins encoded in
21 complete genomes of bacteria, archaea, and eukaryotes (http://
27 Automation of Protein Sequence Characterization
www.ncbi.nlm.nih.gov/COG; Tatusov, 2000). ProtoMap offers a
hierarchical classification of proteins in the SWISS-PROT and TrEMBL
databases (http://www.protomap.cs.huji.ac.il/; Yona et al.,2000) based on analysis of all pairwise similarities among the pro-
tein sequences. The searching algorithm SYSTERS (SYSTEmatic Re-
Searching) applies an iterative method for database searching to
cluster sequences from a number of databases that store protein
sequences (http://www.dkfz-heidelberg.de/tbi/services/cluster/systersform; Krause et al., 2000).CluSTr (http://www.ebi.ac.uk/clustr/), the database of clus-
ters of SWISS-PROT and TrEMBL proteins developed at EBI, will be
discussed in some detail in this chapter. It offers an automatic classifi-
cation of SWISS-PROTþTrEMBL (SPTR) proteins into groups of relatedproteins. The clustering is based on analysis of all pairwise compar-
isons between protein sequences. Analysis has been carried out for dif-
ferent levels of protein similarity, yielding a hierarchical organization
of clusters.
Methodology
The clustering approach is based on two steps. First, a similarity matrix
of ‘‘all-against-all’’ protein sequences is built. The similarity matrix is
computed using the Smith-Waterman algorithm (Smith and Waterman,
1981). A Monte Carlo simulation, resulting in a Z-score (Comet et al.,
1999), is used to estimate the statistical significance of similarity be-
tween potentially related proteins. Initially, a Smith-Waterman score
between sequences A and B is calculated. If this score is higher than a
certain threshold, sequence A is compared with N shuffled sequences of
B (B�). Sequences B� have the same length and amino acid compositionas the initial sequence B. The Z-score is calculated as
ZðA;BÞ ¼ SWðA;BÞ � M
s;
where, SWðA;BÞ is the initial Smith-Waterman score, M is the average
Smith-Waterman score between sequence A and sequences B�, and s is
the standard deviation. Sequence B is then compared with N shuffled
sequences of A (A�) and ZðB;AÞ is calculated. The final Z-score is
Z-score ¼ minðZðA;BÞ;ZðB;AÞÞ:
28 Rolf Apweiler et al.
The Z-score depends only on the compared sequences, not on the size
and composition of the sequence database. By storing all the scores
of unchanged sequences and calculating only ‘‘new-against-new’’ and
‘‘new-against-unchanged,’’ the CluSTr database can be updated incre-
mentally, avoiding time-consuming recalculations.
Second, clusters are built using a single linkage algorithm (Sneath
and Sokal, 1973) for different levels of protein similarity. There are two
major complications in automatic clustering procedures: different pro-
tein families have different levels of sequence similarity, and clusters of
proteins with different domains get pulled together by multidomain
proteins. One of the approaches to tackling these problems uses hier-
archical clustering that works with clusters at different levels of se-
quence similarity. The LASSAP package (Glemet and Codani, 1997) has
been used to calculate similarities and to build clusters.
Data Structure
Clusters for mammalian proteins, plant proteins, and the three com-
plete eukaryotic genomes (Caenorhabditis elegans, Saccharomyces cere-
visiae, and Drosophila melanogaster) have been built. The CluSTr data are
stored in a relational database that comfortably handles large amounts
of data and facilitates comprehensive data updates. Multiple users have
direct access to the database via Java servlets.
The main building blocks of the schema underlying the CluSTr
are Proteins, Groups, Similarities, and Clusters. The Proteins table de-
scribes SPTR entries, Groups describes protein sets for which clusters
were built and the history of comparison runs, Similarities contains the
pairwise scores between proteins, and Clusters represents the informa-
tion about and relationships between different clusters.
Keeping the data up-to-date has been another big challenge in the
design and implementation of the CluSTr database. The aim is to up-
date the CluSTr data incrementally, in a synchronized manner with the
weekly updates of SPTR. There are additional Oracle tables to facilitate
this. The Protein_New table gets populated with new protein data.
New, changed, and deleted proteins are checked for, using SPTR ac-
cession numbers and the circular redundancy check sum (CRC64). An
algorithm to compute the CRC64 is described in the ISO-3309 standard
(ISO-3309, 1993). While, in theory, two different sequences could have
the same CRC64 value, the likelihood that this would happen is quite
29 Automation of Protein Sequence Characterization
low. A list of new and changed proteins is created, and the calculation
of similarities for this new set against itself and against unchanged
proteins is carried out.
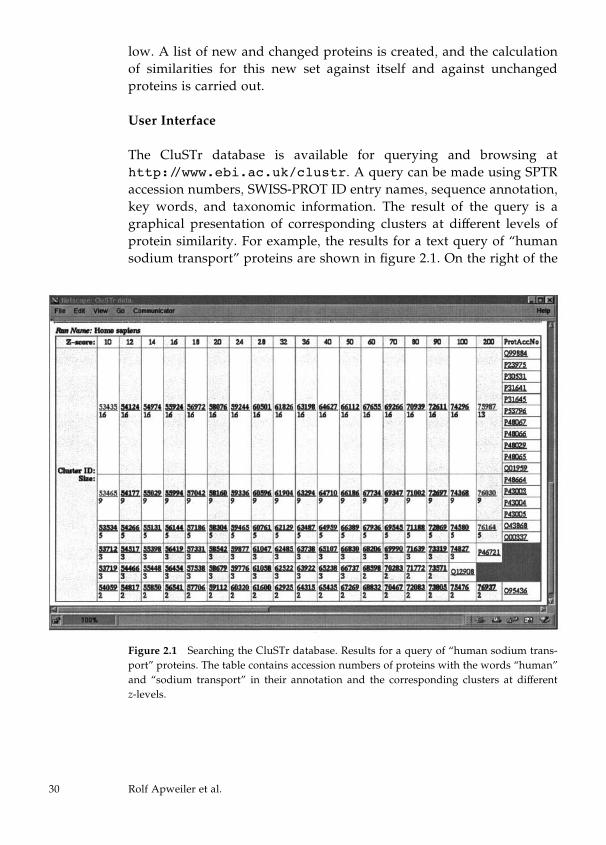
User Interface
The CluSTr database is available for querying and browsing at
http://www.ebi.ac.uk/clustr. A query can be made using SPTRaccession numbers, SWISS-PROT ID entry names, sequence annotation,
key words, and taxonomic information. The result of the query is a
graphical presentation of corresponding clusters at different levels of
protein similarity. For example, the results for a text query of ‘‘human
sodium transport’’ proteins are shown in figure 2.1. On the right of the
Figure 2.1 Searching the CluSTr database. Results for a query of ‘‘human sodium trans-
port’’ proteins. The table contains accession numbers of proteins with the words ‘‘human’’
and ‘‘sodium transport’’ in their annotation and the corresponding clusters at different
z-levels.
30 Rolf Apweiler et al.
table are accession numbers of proteins with the words ‘‘human’’ and
‘‘sodium transport’’ in their annotation, and on the left is the cluster
structure which these proteins form at different Z-levels. Bigger groups
of clusters of size 16, 9, and 5 correspond to Sodium:neurotransmitter
symporter family (IPR000175), Sodium:dicarboxylate symporter family
(IPR001991) and Naþ dependent nucleoside transporter (IPR002668),
respectively. The next group of proteins is not well described. At
the bottom of the table are the sodium bile acid symporter family
(IPR002657) and sodium-dependent phosphate transport proteins.
A cluster of interest can be further investigated by clicking on its ID
number. For each cluster the list of proteins, their descriptions, and the
domain composition is provided (figure 2.2). Links to the Sequence
Retrieval System (SRS) (Etzold et al., 1996) allow users to download the
list of proteins from a cluster. The domain composition is defined using
InterPro. Links to the InterPro graphical view allow users to see at a
glance whether proteins from a particular cluster share common
domains or functional sites (figure 2.3). For each cluster a list of sec-
ondary structure cross-references from the Homology-derived Second-
ary Structure of Proteins (HSSP) database (Sander and Schneider, 1991)
is generated dynamically. The database also provides links to the Pro-
tein Data Bank (PDB) (Berman et al., 2000).
It has already been mentioned that the clusters are built for specific
taxonomic groups. For each of the organisms that have been studied,
the following information is displayed:
. General statistics—the number of clusters with two or more proteins,the total number of proteins in these clusters, the number of singletons,
and the number of distinct families at different levels of protein simi-
larity.
. List of singletons—proteins that form clusters of size 1 at the lowest
studied protein similarity level.
. 30 biggest clusters—the 30 biggest protein clusters and their InterPro-based functional classification.
. Clusters without InterPro links—clusters of size 5 or more whichhave no matching InterPro families, domains, or functional sites.
. Clusters without HSSP links—clusters of size 5 or more for whichthere are no HSSP matches.
31 Automation of Protein Sequence Characterization
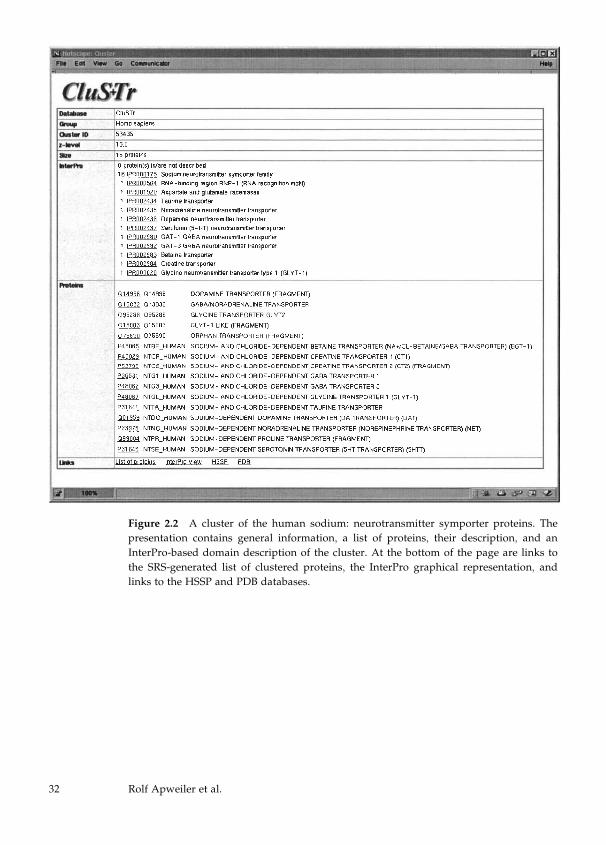
Figure 2.2 A cluster of the human sodium: neurotransmitter symporter proteins. The
presentation contains general information, a list of proteins, their description, and an
InterPro-based domain description of the cluster. At the bottom of the page are links to
the SRS-generated list of clustered proteins, the InterPro graphical representation, and
links to the HSSP and PDB databases.
32 Rolf Apweiler et al.
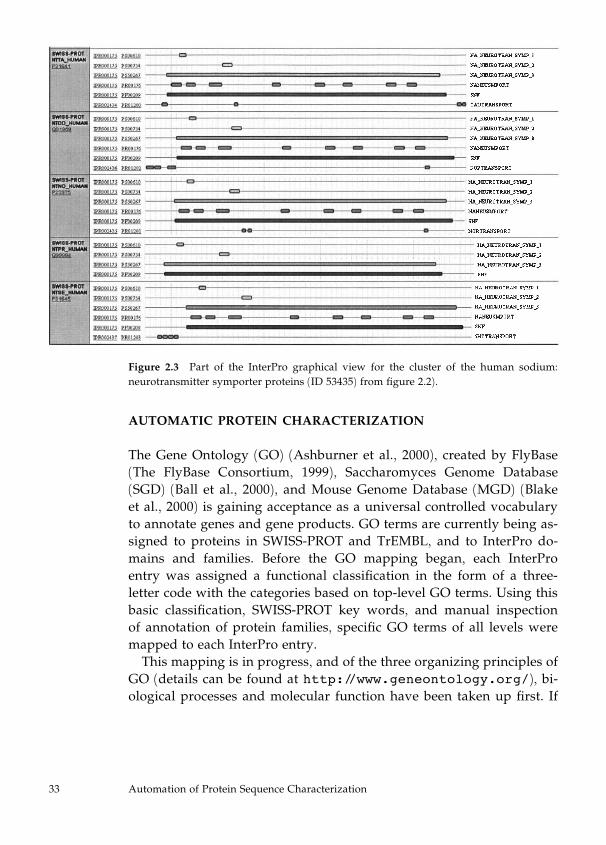
AUTOMATIC PROTEIN CHARACTERIZATION
The Gene Ontology (GO) (Ashburner et al., 2000), created by FlyBase
(The FlyBase Consortium, 1999), Saccharomyces Genome Database
(SGD) (Ball et al., 2000), and Mouse Genome Database (MGD) (Blake
et al., 2000) is gaining acceptance as a universal controlled vocabulary
to annotate genes and gene products. GO terms are currently being as-
signed to proteins in SWISS-PROT and TrEMBL, and to InterPro do-
mains and families. Before the GO mapping began, each InterPro
entry was assigned a functional classification in the form of a three-
letter code with the categories based on top-level GO terms. Using this
basic classification, SWISS-PROT key words, and manual inspection
of annotation of protein families, specific GO terms of all levels were
mapped to each InterPro entry.
This mapping is in progress, and of the three organizing principles of
GO (details can be found at http://www.geneontology.org/), bi-ological processes and molecular function have been taken up first. If
Figure 2.3 Part of the InterPro graphical view for the cluster of the human sodium:
neurotransmitter symporter proteins (ID 53435) from figure 2.2).
33 Automation of Protein Sequence Characterization
the number of proteins with a known or reliably predicted subcellular
location becomes significant, the cellular component of GO will also be
included in the classification. There are cases where InterPro entries
describe nonspecific protein domains or families that cannot be assigned
a specific GO term, and in addition there are cases where GO terms do
not yet exist (e.g., when the domain or family is specific to prokaryotes).
These InterPro entries, however, still contain the three-letter functional
classification code, which may be more general and includes the cate-
gories Unknown Function and Multifunctional Proteins.
Using the classification data and selecting only the top-level terms
in the GO hierarchy, a table has been created for each completed pro-
teome that lists the GO terms and the number of proteins mapped to
each term. These tables can be found through links from the proteome
analysis pages for each organism. For Drosophila melanogaster, for ex-
ample, the page is located at http://www.ebi.ac.uk/proteome/DROME/go/function.html. A functional classification of the pro-
teins within each proteome set has thus been generated to show the
percentage of proteins involved in, for example, metabolism, transcrip-
tion, and so on. This is represented graphically for three eukaryotes in
figure 2.4. The functional classification and mapping to GO of InterPro
families and domains is a simple method for determining whole pro-
teome composition and provides a basis for comparative analysis. It
also provides a framework for the mapping to GO of all proteins in
SWISS-PROT and TrEMBL that have matches in InterPro, and for any
new or previously uncharacterized protein sequences searched for in
InterPro. In addition, the CluSTr database has links to InterPro, and
from there to the corresponding functional classification codes and GO
terms, thus making it possible to identify protein functions within
clusters.
COMPARATIVE PROTEOME ANALYSIS
Some of what are likely to be the most frequently requested compari-
sons are available from the index page for each of the reference pro-
teomes. Comparisons of the proteomes are based on InterPro statistics
and are precomputed. The proteomes for which such comparisons are
currently available are the archaea; Pyrococcus abyssi and Pyrococcus
horikoshii; various groups of bacteria: Bacillus subtilis and Escherichia
coli; Chlamydia pneumoniae, Chlamydia trachomatis, and Chlamydia mur-
34 Rolf Apweiler et al.
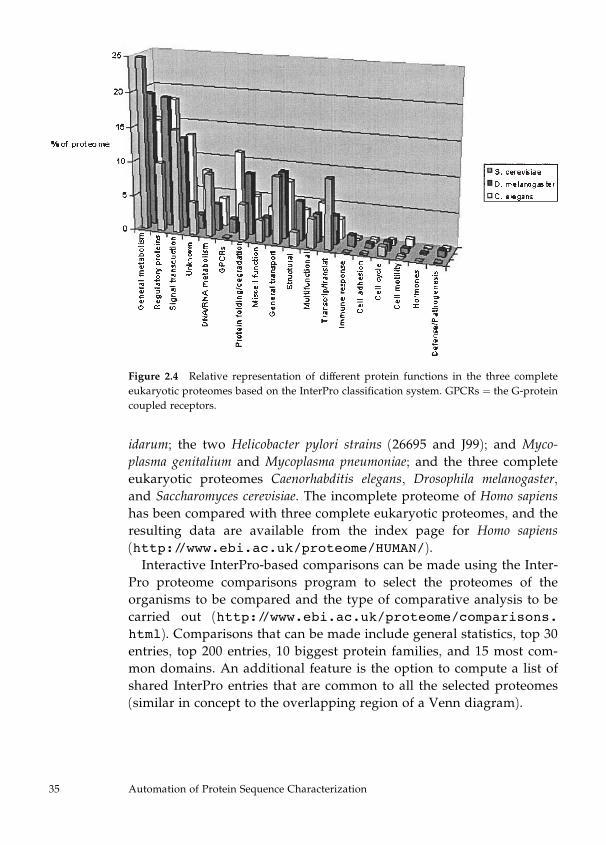
idarum; the two Helicobacter pylori strains (26695 and J99); and Myco-
plasma genitalium and Mycoplasma pneumoniae; and the three complete
eukaryotic proteomes Caenorhabditis elegans, Drosophila melanogaster,
and Saccharomyces cerevisiae. The incomplete proteome of Homo sapiens
has been compared with three complete eukaryotic proteomes, and the
resulting data are available from the index page for Homo sapiens
(http://www.ebi.ac.uk/proteome/HUMAN/).Interactive InterPro-based comparisons can be made using the Inter-
Pro proteome comparisons program to select the proteomes of the
organisms to be compared and the type of comparative analysis to be
carried out (http://www.ebi.ac.uk/proteome/comparisons.html). Comparisons that can be made include general statistics, top 30entries, top 200 entries, 10 biggest protein families, and 15 most com-
mon domains. An additional feature is the option to compute a list of
shared InterPro entries that are common to all the selected proteomes
(similar in concept to the overlapping region of a Venn diagram).
Figure 2.4 Relative representation of different protein functions in the three complete
eukaryotic proteomes based on the InterPro classification system. GPCRs ¼ the G-proteincoupled receptors.
35 Automation of Protein Sequence Characterization
SOME OBSERVATIONS FROM THE COMPARATIVE PROTEOME
ANALYSIS OF CAENORHABDITIS ELEGANS, DROSOPHILA
MELANOGASTER, AND SACCHAROMYCES CEREVISIAE
A comparative analysis of the three complete eukaryotic proteomes
was the first application of some of the resources described here. The
InterPro analysis plus manual data inspection enabled the assignment
of just over 50% of the proteins of the proteomes of Drosophila mela-
nogaster, Caenorhabditis elegans, and Saccharomyces cerevisiae (Rubin et al.,
2000). The Proteome Analysis Database (http://www.ebi.ac.uk/proteome/) now contains the comparative analysis of all complete
proteomes. The analysis is carried out using complete nonredundant
proteome sets that comprise records taken from the SWISS-PROT,
TrEMBL, and TrEMBLnew databases (Apweiler, 2000) corresponding
to the complete proteome. The proteome sets are wholly nonredundant
at the sequence level (http://www.ebi.ac.uk/proteome/CPhelp.html). The average protein length and size range of full-length proteins(excluding fragments) for each of the three eukaryotic proteomes are
presented in table 2.1. The average length of the proteins is similar in
all three organisms, and higher than the average length of bacterial
proteins (unpublished observation).
The smallest proteins in Saccharomyces cerevisiae are the 60S ribosomal
protein L41 (P05746) and the leader peptide CPA1 (P08521), while the
largest is a hypothetical 560 kDa protein (Q12019). The largest protein
from Caenorhabditis elegans is a 1368.6 kDa uncharacterized protein
(Q09165) that contains several domains and motifs, including fibro-
nectin type III repeats, a Von Willebrand factor type A domain,
and EGF-like domains. The smallest Drosophila melanogaster protein
Table 2.1 A comparison of the average protein length and size range of full-length pro-
teins for each of the three eukaryotic proteomes
Number of amino acid residues
Proteome Average protein length Size range
Saccharomyces cerevisiae 476.69G 375.13 25 to 4910
Caenorhabditis elegans 434.76G 384.38 20 to 13,055
Drosophila melanogaster 486.91G 451.66 8 to 7182
36 Rolf Apweiler et al.
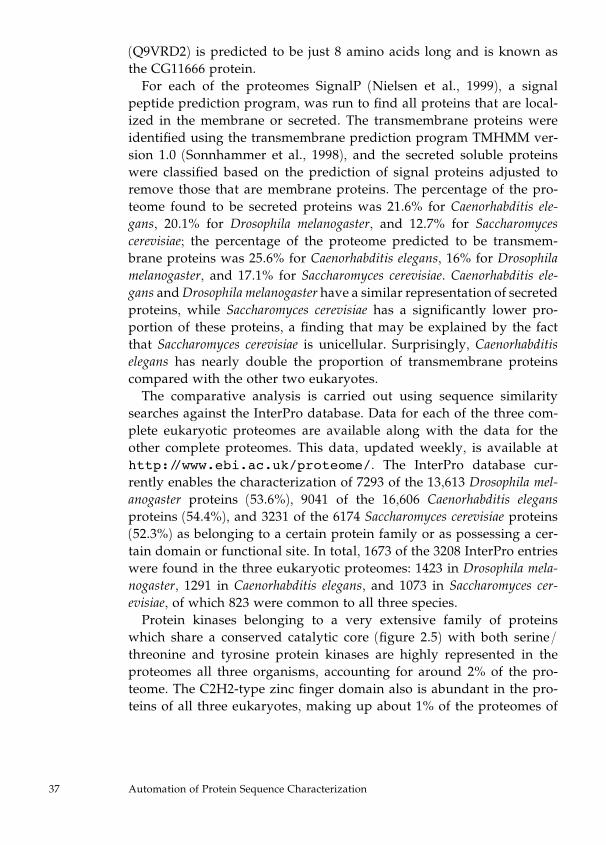
(Q9VRD2) is predicted to be just 8 amino acids long and is known as
the CG11666 protein.
For each of the proteomes SignalP (Nielsen et al., 1999), a signal
peptide prediction program, was run to find all proteins that are local-
ized in the membrane or secreted. The transmembrane proteins were
identified using the transmembrane prediction program TMHMM ver-
sion 1.0 (Sonnhammer et al., 1998), and the secreted soluble proteins
were classified based on the prediction of signal proteins adjusted to
remove those that are membrane proteins. The percentage of the pro-
teome found to be secreted proteins was 21.6% for Caenorhabditis ele-
gans, 20.1% for Drosophila melanogaster, and 12.7% for Saccharomyces
cerevisiae; the percentage of the proteome predicted to be transmem-
brane proteins was 25.6% for Caenorhabditis elegans, 16% for Drosophila
melanogaster, and 17.1% for Saccharomyces cerevisiae. Caenorhabditis ele-
gans andDrosophila melanogaster have a similar representation of secreted
proteins, while Saccharomyces cerevisiae has a significantly lower pro-
portion of these proteins, a finding that may be explained by the fact
that Saccharomyces cerevisiae is unicellular. Surprisingly, Caenorhabditis
elegans has nearly double the proportion of transmembrane proteins
compared with the other two eukaryotes.
The comparative analysis is carried out using sequence similarity
searches against the InterPro database. Data for each of the three com-
plete eukaryotic proteomes are available along with the data for the
other complete proteomes. This data, updated weekly, is available at
http://www.ebi.ac.uk/proteome/. The InterPro database cur-
rently enables the characterization of 7293 of the 13,613 Drosophila mel-
anogaster proteins (53.6%), 9041 of the 16,606 Caenorhabditis elegans
proteins (54.4%), and 3231 of the 6174 Saccharomyces cerevisiae proteins
(52.3%) as belonging to a certain protein family or as possessing a cer-
tain domain or functional site. In total, 1673 of the 3208 InterPro entries
were found in the three eukaryotic proteomes: 1423 in Drosophila mela-
nogaster, 1291 in Caenorhabditis elegans, and 1073 in Saccharomyces cer-
evisiae, of which 823 were common to all three species.
Protein kinases belonging to a very extensive family of proteins
which share a conserved catalytic core (figure 2.5) with both serine/
threonine and tyrosine protein kinases are highly represented in the
proteomes all three organisms, accounting for around 2% of the pro-
teome. The C2H2-type zinc finger domain also is abundant in the pro-
teins of all three eukaryotes, making up about 1% of the proteomes of
37 Automation of Protein Sequence Characterization
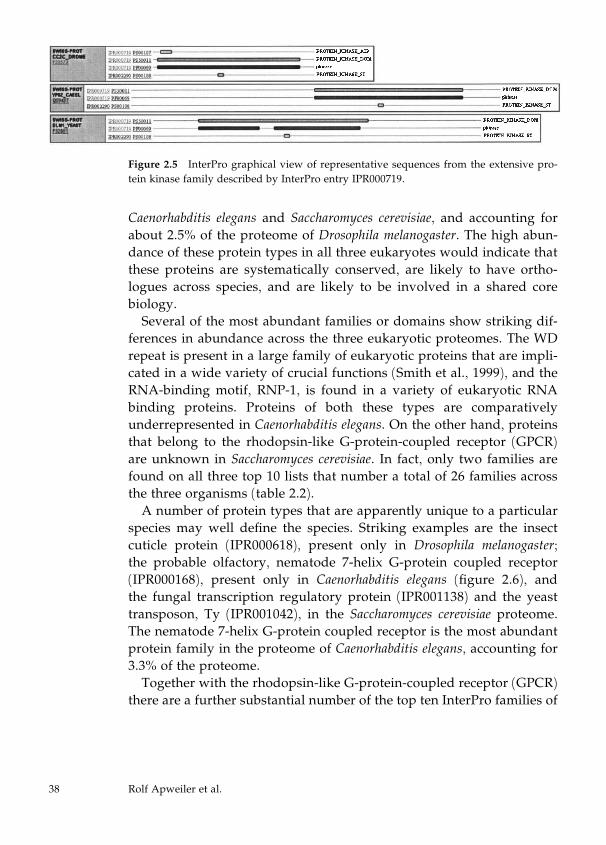
Caenorhabditis elegans and Saccharomyces cerevisiae, and accounting for
about 2.5% of the proteome of Drosophila melanogaster. The high abun-
dance of these protein types in all three eukaryotes would indicate that
these proteins are systematically conserved, are likely to have ortho-
logues across species, and are likely to be involved in a shared core
biology.
Several of the most abundant families or domains show striking dif-
ferences in abundance across the three eukaryotic proteomes. The WD
repeat is present in a large family of eukaryotic proteins that are impli-
cated in a wide variety of crucial functions (Smith et al., 1999), and the
RNA-binding motif, RNP-1, is found in a variety of eukaryotic RNA
binding proteins. Proteins of both these types are comparatively
underrepresented in Caenorhabditis elegans. On the other hand, proteins
that belong to the rhodopsin-like G-protein-coupled receptor (GPCR)
are unknown in Saccharomyces cerevisiae. In fact, only two families are
found on all three top 10 lists that number a total of 26 families across
the three organisms (table 2.2).
A number of protein types that are apparently unique to a particular
species may well define the species. Striking examples are the insect
cuticle protein (IPR000618), present only in Drosophila melanogaster;
the probable olfactory, nematode 7-helix G-protein coupled receptor
(IPR000168), present only in Caenorhabditis elegans (figure 2.6), and
the fungal transcription regulatory protein (IPR001138) and the yeast
transposon, Ty (IPR001042), in the Saccharomyces cerevisiae proteome.
The nematode 7-helix G-protein coupled receptor is the most abundant
protein family in the proteome of Caenorhabditis elegans, accounting for
3.3% of the proteome.
Together with the rhodopsin-like G-protein-coupled receptor (GPCR)
there are a further substantial number of the top ten InterPro families of
Figure 2.5 InterPro graphical view of representative sequences from the extensive pro-
tein kinase family described by InterPro entry IPR000719.
38 Rolf Apweiler et al.
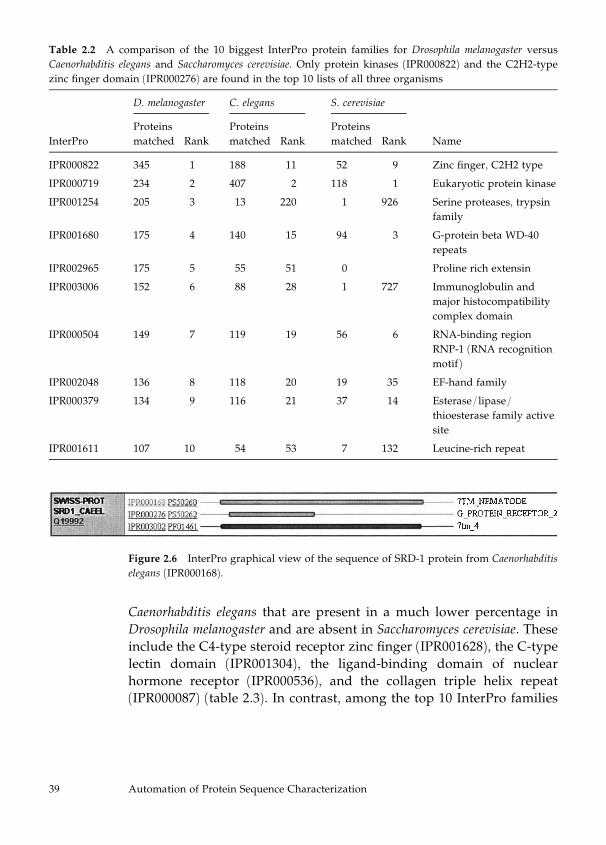
Caenorhabditis elegans that are present in a much lower percentage in
Drosophila melanogaster and are absent in Saccharomyces cerevisiae. These
include the C4-type steroid receptor zinc finger (IPR001628), the C-type
lectin domain (IPR001304), the ligand-binding domain of nuclear
hormone receptor (IPR000536), and the collagen triple helix repeat
(IPR000087) (table 2.3). In contrast, among the top 10 InterPro families
Table 2.2 A comparison of the 10 biggest InterPro protein families for Drosophila melanogaster versus
Caenorhabditis elegans and Saccharomyces cerevisiae. Only protein kinases (IPR000822) and the C2H2-type
zinc finger domain (IPR000276) are found in the top 10 lists of all three organisms
D. melanogaster C. elegans S. cerevisiae
InterPro
Proteins
matched Rank
Proteins
matched Rank
Proteins
matched Rank Name
IPR000822 345 1 188 11 52 9 Zinc finger, C2H2 type
IPR000719 234 2 407 2 118 1 Eukaryotic protein kinase
IPR001254 205 3 13 220 1 926 Serine proteases, trypsin
family
IPR001680 175 4 140 15 94 3 G-protein beta WD-40
repeats
IPR002965 175 5 55 51 0 Proline rich extensin
IPR003006 152 6 88 28 1 727 Immunoglobulin and
major histocompatibility
complex domain
IPR000504 149 7 119 19 56 6 RNA-binding region
RNP-1 (RNA recognition
motif)
IPR002048 136 8 118 20 19 35 EF-hand family
IPR000379 134 9 116 21 37 14 Esterase/lipase/
thioesterase family active
site
IPR001611 107 10 54 53 7 132 Leucine-rich repeat
Figure 2.6 InterPro graphical view of the sequence of SRD-1 protein from Caenorhabditis
elegans (IPR000168).
39 Automation of Protein Sequence Characterization
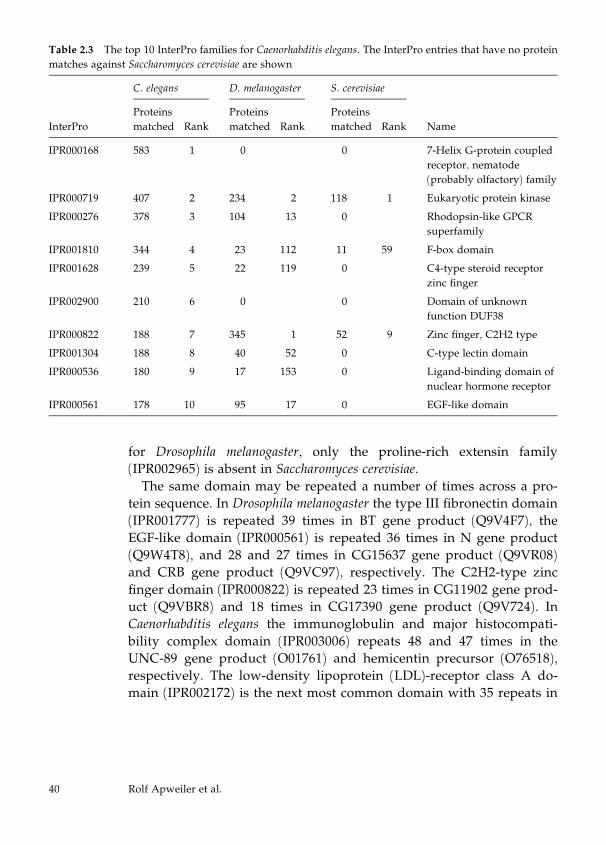
for Drosophila melanogaster, only the proline-rich extensin family
(IPR002965) is absent in Saccharomyces cerevisiae.
The same domain may be repeated a number of times across a pro-
tein sequence. In Drosophila melanogaster the type III fibronectin domain
(IPR001777) is repeated 39 times in BT gene product (Q9V4F7), the
EGF-like domain (IPR000561) is repeated 36 times in N gene product
(Q9W4T8), and 28 and 27 times in CG15637 gene product (Q9VR08)
and CRB gene product (Q9VC97), respectively. The C2H2-type zinc
finger domain (IPR000822) is repeated 23 times in CG11902 gene prod-
uct (Q9VBR8) and 18 times in CG17390 gene product (Q9V724). In
Caenorhabditis elegans the immunoglobulin and major histocompati-
bility complex domain (IPR003006) repeats 48 and 47 times in the
UNC-89 gene product (O01761) and hemicentin precursor (O76518),
respectively. The low-density lipoprotein (LDL)-receptor class A do-
main (IPR002172) is the next most common domain with 35 repeats in
Table 2.3 The top 10 InterPro families for Caenorhabditis elegans. The InterPro entries that have no protein
matches against Saccharomyces cerevisiae are shown
C. elegans D. melanogaster S. cerevisiae
InterPro
Proteins
matched Rank
Proteins
matched Rank
Proteins
matched Rank Name
IPR000168 583 1 0 0 7-Helix G-protein coupled
receptor, nematode
(probably olfactory) family
IPR000719 407 2 234 2 118 1 Eukaryotic protein kinase
IPR000276 378 3 104 13 0 Rhodopsin-like GPCR
superfamily
IPR001810 344 4 23 112 11 59 F-box domain
IPR001628 239 5 22 119 0 C4-type steroid receptor
zinc finger
IPR002900 210 6 0 0 Domain of unknown
function DUF38
IPR000822 188 7 345 1 52 9 Zinc finger, C2H2 type
IPR001304 188 8 40 52 0 C-type lectin domain
IPR000536 180 9 17 153 0 Ligand-binding domain of
nuclear hormone receptor
IPR000561 178 10 95 17 0 EGF-like domain
40 Rolf Apweiler et al.
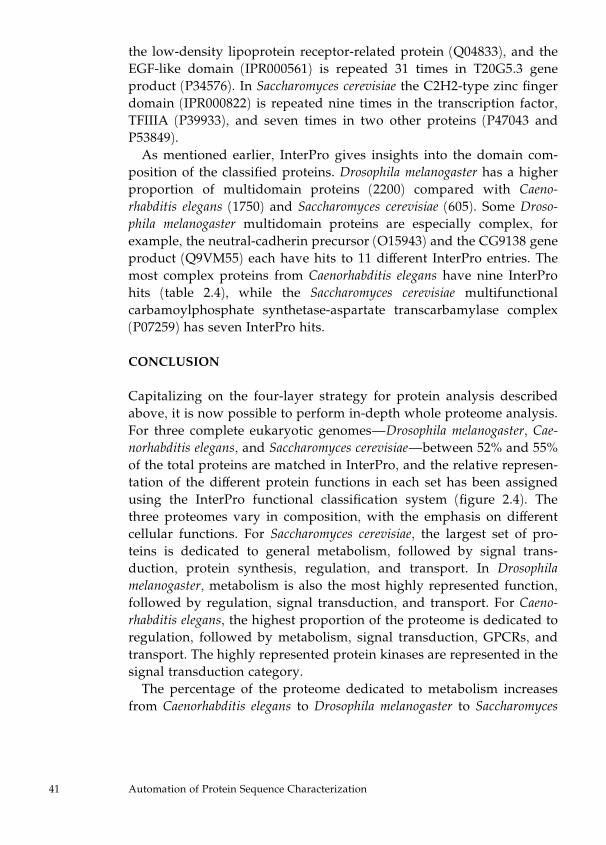
the low-density lipoprotein receptor-related protein (Q04833), and the
EGF-like domain (IPR000561) is repeated 31 times in T20G5.3 gene
product (P34576). In Saccharomyces cerevisiae the C2H2-type zinc finger
domain (IPR000822) is repeated nine times in the transcription factor,
TFIIIA (P39933), and seven times in two other proteins (P47043 and
P53849).
As mentioned earlier, InterPro gives insights into the domain com-
position of the classified proteins. Drosophila melanogaster has a higher
proportion of multidomain proteins (2200) compared with Caeno-
rhabditis elegans (1750) and Saccharomyces cerevisiae (605). Some Droso-
phila melanogaster multidomain proteins are especially complex, for
example, the neutral-cadherin precursor (O15943) and the CG9138 gene
product (Q9VM55) each have hits to 11 different InterPro entries. The
most complex proteins from Caenorhabditis elegans have nine InterPro
hits (table 2.4), while the Saccharomyces cerevisiae multifunctional
carbamoylphosphate synthetase-aspartate transcarbamylase complex
(P07259) has seven InterPro hits.
CONCLUSION
Capitalizing on the four-layer strategy for protein analysis described
above, it is now possible to perform in-depth whole proteome analysis.
For three complete eukaryotic genomes—Drosophila melanogaster, Cae-
norhabditis elegans, and Saccharomyces cerevisiae—between 52% and 55%
of the total proteins are matched in InterPro, and the relative represen-
tation of the different protein functions in each set has been assigned
using the InterPro functional classification system (figure 2.4). The
three proteomes vary in composition, with the emphasis on different
cellular functions. For Saccharomyces cerevisiae, the largest set of pro-
teins is dedicated to general metabolism, followed by signal trans-
duction, protein synthesis, regulation, and transport. In Drosophila
melanogaster, metabolism is also the most highly represented function,
followed by regulation, signal transduction, and transport. For Caeno-
rhabditis elegans, the highest proportion of the proteome is dedicated to
regulation, followed by metabolism, signal transduction, GPCRs, and
transport. The highly represented protein kinases are represented in the
signal transduction category.
The percentage of the proteome dedicated to metabolism increases
from Caenorhabditis elegans to Drosophila melanogaster to Saccharomyces
41 Automation of Protein Sequence Characterization
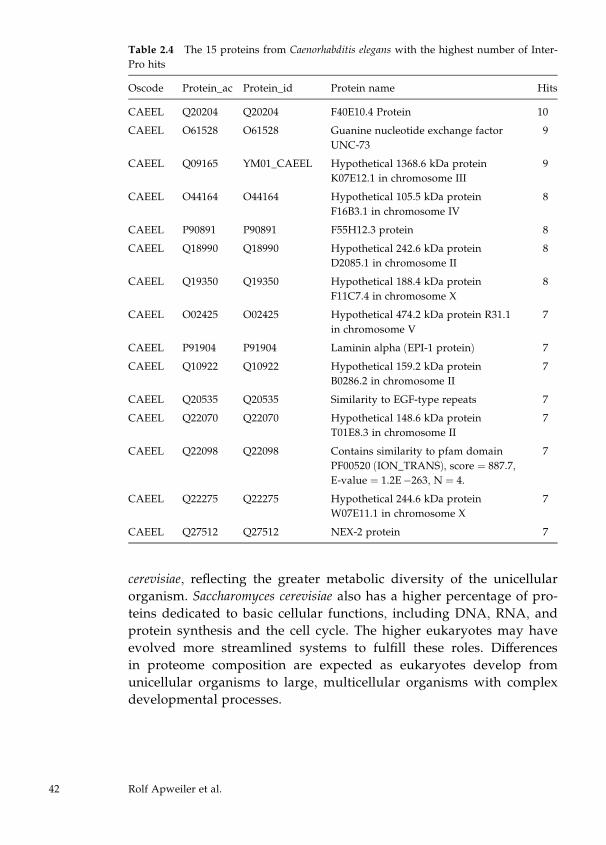
cerevisiae, reflecting the greater metabolic diversity of the unicellular
organism. Saccharomyces cerevisiae also has a higher percentage of pro-
teins dedicated to basic cellular functions, including DNA, RNA, and
protein synthesis and the cell cycle. The higher eukaryotes may have
evolved more streamlined systems to fulfill these roles. Differences
in proteome composition are expected as eukaryotes develop from
unicellular organisms to large, multicellular organisms with complex
developmental processes.
Table 2.4 The 15 proteins from Caenorhabditis elegans with the highest number of Inter-
Pro hits
Oscode Protein_ac Protein_id Protein name Hits
CAEEL Q20204 Q20204 F40E10.4 Protein 10
CAEEL O61528 O61528 Guanine nucleotide exchange factor
UNC-73
9
CAEEL Q09165 YM01_CAEEL Hypothetical 1368.6 kDa protein
K07E12.1 in chromosome III
9
CAEEL O44164 O44164 Hypothetical 105.5 kDa protein
F16B3.1 in chromosome IV
8
CAEEL P90891 P90891 F55H12.3 protein 8
CAEEL Q18990 Q18990 Hypothetical 242.6 kDa protein
D2085.1 in chromosome II
8
CAEEL Q19350 Q19350 Hypothetical 188.4 kDa protein
F11C7.4 in chromosome X
8
CAEEL O02425 O02425 Hypothetical 474.2 kDa protein R31.1
in chromosome V
7
CAEEL P91904 P91904 Laminin alpha (EPI-1 protein) 7
CAEEL Q10922 Q10922 Hypothetical 159.2 kDa protein
B0286.2 in chromosome II
7
CAEEL Q20535 Q20535 Similarity to EGF-type repeats 7
CAEEL Q22070 Q22070 Hypothetical 148.6 kDa protein
T01E8.3 in chromosome II
7
CAEEL Q22098 Q22098 Contains similarity to pfam domain
PF00520 (ION_TRANS), score ¼ 887.7,E-value ¼ 1.2E�263, N ¼ 4.
7
CAEEL Q22275 Q22275 Hypothetical 244.6 kDa protein
W07E11.1 in chromosome X
7
CAEEL Q27512 Q27512 NEX-2 protein 7
42 Rolf Apweiler et al.
REFERENCES
Adams, M. D., Celniker, S. E., Holt, R. A., Evans, C. A., Gocayne, J. D., Amanatides, P. G.,
Scherer, S. E., Li, P. W., Hoskins, R. A., Galle, R. F., et al. (2000). The genome sequence of
Drosophila melanogaster. Science 287: 2185–2195.
The Arabidopsis Initiative (2000). Analysis of the genome sequence of the flowering plant
Arabidopsis thaliana. Nature 408: 796–815.
Apweiler, R. (2000). Protein sequence databases. In P. Bork (ed.), Advances in Protein
Chemistry, vol. 54. San Diego and London: Academic Press, pp. 31–71.
Apweiler, R., Attwood, T. K., Bairoch, A., Bateman, A., Birney, E., Biswas, M., Bucher, P.,
Cerutti, L., Corpet, F., Croning, M. D., Durbin, R., Falquet, L., Fleischmann, W., Gouzy, J.,
Hermjakob, H., Hulo, N., Jonassen, I., Kahn, D., Kanapin, A., Karavidopoulou, Y., Lopez,
R., Marx, B., Mulder, N. J., Oinn, T. M., Pagni, M., Servant, F., Sigrist, C. J., and Zdobnov,
E. M. (2001). The InterPro database, an integrated documentation resource for protein
families, domains and functional sites. Nucleic Acids Res. 29: 37–40.
Ashburner, M., Ball, C. A., Blake, J. A., Botstein, D., Butler, H., Cherry, J. M., Davis, A. P.,
Dolinski, K., Dwight, S. S., Eppig, J. T., et al. (2000). Gene ontology: Tool for the unifica-
tion of biology. The Gene Ontology Consortium. Nat. Genetics 25: 25–29.
Attwood, T. K., Croning, M. D. R., Flower, D. R., Lewis, A. P., Mabey, J. E., Scordis, P.,
Selley, J. N., and Wright, W. (2000). PRINTS-S: The database formerly known as PRINTS.
Nucleic Acids Res. 28: 225–227.
Bairoch, A., and Apweiler, R. (2000). The SWISS-PROT protein sequence database and its
supplement TrEMBL in 2000. Nucleic Acids Res. 28: 45–48.
Ball, C. A., Dolinski, K., Dwight, S. S., Harris, M. A., Issel-Tarver, L., Kasarskis, A., Scafe,
C. R., Sherlock, G., Binkley, G., Jin, H., et al. (2000). Integrating functional genomic infor-
mation into the Saccharomyces Genome Database. Nucleic Acids Res. 28: 77–80.
Bateman, A., Birney, E., Durbin, R., Eddy, S. R., Howe, K. L., and Sonnhammer, E. L. L.
(2000). The Pfam Protein Families Database. Nucleic Acids Res. 28: 263–266.
Berman, H. M., Westbrook, J., Feng, Z., Gilliland, G., Bhat, T. N., Weissig, H.,
Shindyalov, I. N., and Bourne, P. E. (2000). The Protein Data Bank. Nucleic Acids Res. 28:
235–242.
Blake, J. A., Eppig, J. T., Richardson, J. E., Davisson, M. T., and the Mouse Genome Data-
base Group. (2000). The Mouse Genome Database (MGD): Expanding genetic and
genomic resources for the laboratory mouse. Nucleic Acids Res. 28: 108–111.
Bork, P., and Koonin, E. V. (1998). Predicting functions from protein sequences—where
are the bottlenecks? Nat. Genetics 18: 313–318.
The C. elegans Sequencing Consortium. (1998). Genome sequence of the nematode C. ele-
gans: A platform for investigating biology. Science 282: 2012–2018.
43 Automation of Protein Sequence Characterization
Comet, J. P., Aude, J. C., Glemet, E., Risler, J. L., Henaut, A., Slonimski, P. P., and Codani,
J. J. (1999). Significance of Z-value statistics of Smith-Waterman scores for protein align-
ments. Comput. Chem. 23: 317–331.
Corpet, F., Servant, F., Gouzy, J., and Kahn, D. (2000). ProDom and ProDom-CG: Tools for
protein domain analysis and whole genome comparisons. Nucleic Acids Res. 28: 267–269.
Douglas, S. E., and Penny, S. L. (1999). The plastid genome of the cryptophyte alga, Guil-
lardia theta: Complete sequence and conserved synteny groups confirm its common an-
cestry with red algae. J. Mol. Evol. 48: 236–244.
Etzold, T., Ulyanov, A., and Argos, P. (1996). SRS: Information retrieval system for mo-
lecular biology data banks. Methods Enzymol. 266: 114–128.
Fleischmann, R. D., Adams, M. D., White, O., Clayton, R. A., Kirkness, E. F., Kerlavage,
A. R., Bult, C. J., Tomb, J. F., Dougherty, B. A., Merrick, J. M., et al. (1995). Whole-genome
random sequencing and assembly of Haemophilus influenzae Rd. Science 269: 496–512.
Fleischmann, W., Moeller, S., Gateau, A., and Apweiler, R. (1999). A novel method for
automatic and reliable functional annotation. Bioinfomatics 15: 228–233.
The FlyBase Consortium. (1999). The FlyBase Database of the Drosophila Genome Proj-
ects and community literature. Nucleic Acids Res. 27: 85–88.
Frishman, D., and Mewes, H. W. (1997). PEDANTic genome analysis. Trends in Genetics
13(10): 415–416.
Glemet, E., and Codani, J. J. (1997). LASSAP, a LArge Scale Sequence compArison Pack-
age. Comput. Appl. Biosci. 13: 1317–1343.
Goffeau, A., Aert, R., Agostini-Carbone, M. L., Ahmed, A., Aigle, M., Alberghina, L.,
Albermann, K., Albers, M., Aldea, M., Alexandraki, D., et al. (1997). The Yeast Genome
Directory. Nature 387 (suppl.): 5–105.
Hoersch, S., Leroy, C., Brown, N. P., Andrade, M. A., and Sander, C. (2000). The Gene-
Quiz Web server: Protein functional analysis through the Web. Trends Biochem. Sci. 25:
33–35.
Hofmann, K., Bucher, P., Falquet, L., and Bairoch, A. (1999). The PROSITE database, its
status in 1999. Nucleic Acids Res. 27: 215–219.
ISO-3309. (1993). Information technology—Telecommunications and information be-
tween systems—High-level data link control (HDLC) procedures—Frame structure. In
International Organization for Standardization, http://www.iso.ch/ 5th ed.
Krause, A., Stoye, J., and Vingron, M. (2000). The SYSTERS protein sequence cluster set.
Nucleic Acids Res. 28: 270–272.
Nielsen, H., Brunak, S., and von Heijne, G. (1999). Machine learning approaches for the
prediction of signal peptides and other protein sorting signals. Protein Eng. 12: 3–9.
Oliver, S. G., van der Aart, Q. J., Agostoni-Carbone, M. L., Aigle, M., Alberghina, L.,
Alexandraki, D., Antoine, G., Anwar, R., Ballesta, J. P., Benit, P., et al. (1992). The com-
plete DNA sequence of yeast chromosome III. Nature 357: 38–46.
44 Rolf Apweiler et al.
Rubin, G. M., Yandell, M. D., Wortman, J. R., Gabor Miklos, G. L., Nelson, C. R., Har-
iharan, I. K., Fortini, M. E., Li, P. W., Apweiler, R., Fleischmann, W., et al. (2000). Com-
parative genomics of the eukaryotes. Science 287: 2204–2215.
Sander, C., and Schneider, R. (1991). Database of homology derived protein structures
and the structural meaning of sequence alignment. Proteins 9: 56–68.
Sanger, F., Coulson, A. R., Friedmann, T., Air, G. M., Barrell, B. G., Brown, N. L., Fiddes,
J. C., Hutchison, C. A., Slocombe, P. M., and Smith, M. (1978). The nucleotide sequence of
bacteriophage phi-X174. J. Mol. Biol. 125: 225–246.
Scharf, M., Schneider, R., Casari, G., Bork, P., Valencia, A., Ouzounis, C., and Sander, C.
(1994). GeneQuiz: A workbench for sequence analysis. In R. Altman, D. Brutlag, P. Karp,
R. Lathrop, and D. Searls (eds.), Proceedings of the Second International Conference on Intel-
ligent Systems for Molecular Biology. Menlo Park, Calif.: AAAI Press, pp. 348–353.
Smith, T. F., Gaitatzes, C., Saxena, K., and Neer, E. J. (1999). The WD repeat: A common
architecture for diverse functions. Trends Biochem. Sci. 24: 181–185.
Smith, T. F., and Waterman, M. S. (1981). Identification of common molecular sub-
sequences. J. Mol. Biol. 147: 195–197.
Sneath, P. H. A., and Sokal, R. R. (1973). Numerical Taxonomy, San Francisco: W. H. Free-
man.
Sonnhammer, E. L. L., von Heijne, G., and Krogh, A. (1998). A hidden Markov model
for predicting transmembrane helices in protein sequences. In J. Glasgow, T. Littlejohn,
F. Major, R. Lathrop, D. Sankoff, and C. Sensen (eds.), Proceedings of the Sixth International
Conference on Intelligent Systems for Molecular Biology. Vol. 6. Menlo Park, Calif.: AAAI
Press, pp. 175–182.
Tamames, J., Ouzounis, C., Casari, G., and Valencia, A. (1998). Automatic classification of
proteins in functional classes using database annotations. CABIOS 14: 542–543.
Tatusov, R. L., Galperin, M. Y., Natale, D. A., and Koonin, E. V. (2000). The COG data-
base: A tool for genome-scale analysis of protein functions and evolution. Nucleic Acids
Res. 28: 33–36.
Yona, G., Linial, N., and Linial, M. (2000). ProtoMap: Automatic classification of protein
sequences hierarchy of protein families. Nucleic Acids Res. 28: 49–55.
SUGGESTED READING
Attwood, T. K. (2000). The role of pattern databases in sequence analysis. Briefings in Bio-
informatics 1: 45–59. A well-written review focusing on databases of protein signatures for
families and domains. Provides an excellent overview of the current status of these data-
bases, outlines the methods behind them, and discusses their diagnostic strengths and
weaknesses.
Apweiler, R. (2001). Functional information in SWISS-PROT: The basis for large-scale
characterisation of protein sequences. Briefings in Bioinformatics 2: 9–18. Describes the
45 Automation of Protein Sequence Characterization
essential role that the SWISS-PROT protein sequence database plays in automatic large-
scale functional characterization and annotation due to its high level of functional infor-
mation.
Apweiler, R., Attwood, T. K., Bairoch, A., Bateman, A., Birney, E., Biswas, M., Bucher, P.,
Cerutti, L., Corpet, F., Croning, M. D. R., Durbin, R., Falquet, L., Fleischmann, W., Gouzy,
J., Hermjakob, H., Hulo, N., Jonassen, I., Kahn, D., Kanapin, A., Karavidopoulou, Y.,
Lopez, R., Marx, B., Mulder, N. J., Oinn, T. M., Pagni, M., Servant, F., Sigrist, C. J. A., and
Zdobnov, E. M. (2001). Nucleıc Acids Res. 29: 37–40. This paper describes InterPro, the
integrated documentation resource of protein families, domains, and functional sites that
currently combines the complementary efforts of the PROSITE, PRINTS, Pfam, ProDom,
and SMART database projects. InterPro contains manually curated documentation, com-
bined with diagnostic signatures from different databases allowing users to see at a
glance whether a particular family or domain has associated patterns, profiles, finger-
prints, etc. In the task of sequence characterization, InterPro will provide a more reliable,
concerted method for identifying protein family traits and for inheriting functional anno-
tation. This is especially important given the dependence on automatic methods for
assigning functions to the raw sequence data issuing from genome projects.
Apweiler, R., Biswas, M., Fleischmann, W., Kanapin, A., Karavidopoulou, Y., Kersey, P.,
Kriventseva, E. V., Mittard, V., Mulder, N., Phan, I., and Zdobnov, E. (2001). Proteome
Analysis Database: Online application of InterPro and CluSTr for the functional classifi-
cation of proteins in whole genomes. Nucleic Acids Res. 29: 44–48. A description of the
Proteome Analysis Database (http://www.ebi.ac.uk/proteome/), which provides
comprehensive statistical and comparative analyses of the predicted proteomes of fully
sequenced organisms. The analysis is compiled using InterPro (http://www.ebi.ac.
uk/interpro/), CluSTr (http://www.ebi.ac.uk/clustr/), and GO (http://
www.geneontology.org/), and is performed on nonredundant sets of SWISS-PROT
and TrEMBL entries representing each complete proteome. The Proteome Analysis Data-
base currently contains statistical and analytical data for the proteins from 45 complete
genomes, including five eukaryotes: Arabidopsis thaliana, Caenorhabditis elegans, Drosophila
melanogaster, Homo sapiens, and Saccharomyces cerevisiae.
Ashburner, M., Ball, C. A., Blake, J. A., Botstein, D., Butler, H., Cherry, J. M., Davis, A. P.,
Dolinski, K., Dwight, S. S., Eppig, J. T., Harris, M. A., Hill, D. P., Issel-Tarver, L., Kasar-
skis, A., Lewis, S., Matese, J. C., Richardson, J. E., Ringwald, M., Rubin, G. M., and Sher-
lock, G. (2000). Gene ontology: Tool for the unification of biology. The Gene Ontology
Consortium. Nat. Genetics 25: 25–29. The authors describe the creation of a dynamic, con-
trolled vocabulary that can be applied to all eukaryotes even as knowledge of gene and
protein roles in cells is accumulating and changing. To this end, the Gene Ontology (GO)
Consortium has constructed three independent ontologies: biological process, molecular
function, and cellular component. The GO concept is intended to make possible, in a
flexible and dynamic way, the annotation of homologous gene and protein sequences in
multiple organisms, using a common vocabulary that results in the ability to query and
retrieve genes and proteins based on their shared biology. The GO ontologies produce a
controlled vocabulary that can be used for dynamic maintenance and interoperability be-
tween genome databases.
46 Rolf Apweiler et al.
URLs FOR RELEVANT SITES
EBI home page. http://www.ebi.ac.uk/
SWISS-PROT and TrEMBL protein sequence databases.
http://www.ebi.ac.uk/swissprot
Sequence Retrieval System (SRS). http://srs.ebi.ac.uk/
InterPro. http://www.ebi.ac.uk/interpro/
CluSTr. http://www.ebi.ac.uk/clustr/
Proteome Analysis Database. http://www.ebi.ac.uk/proteome/
Proteome analysis data for human. http://www.ebi.ac.uk/proteome/HUMAN/
Program to run interactive proteome analysis for user-selected organisms.
http://www.ebi.ac.uk/proteome/comparisons.html
Information on and how do download the nonredundant complete proteome sets main-
tained at the EBI. http://www.ebi.ac.uk/proteome/CPhelp.html
PDB-Protein Data Bank. http://pdb-browsers.ebi.ac.uk/
OTHER USEFUL URLs
GO (the Gene Ontology Consortium). http://www.geneontology.org/
Methods for protein annotation.
http://jura.ebi.ac.uk:8765/ext-genequiz/
http://pedant.gsf.de/
Clustering methods. http://www.ncbi.nlm.nih.gov/COG/
http://www.protomap.cs.huji.ac.il/
http://www.dkfz-heidelberg.de/tbi/services/cluster/systersform
HSSP database, a database of homology-derived secondary structure of proteins for clas-
sification purposes. http://www.sander.ebi.ac.uk/hssp/
SignalP, which predicts the presence and location of signal peptide cleavage sites in
amino acid sequences. http://www.cbs.dtu.dk/services/SignalP/
TMHMM, for prediction of transmembrane helices in proteins.
http://www.cbs.dtu.dk/services/TMHMM-2.0/
47 Automation of Protein Sequence Characterization

This page intentionally left blank
3 Information Fusion and MetabolicNetwork Control
Andreas Freier, Ralf Hofestadt, Matthias Lange,
and Uwe Scholz
Molecular biology, biotechnology, and bioinformatics have started to
focus on the problem of gene-regulated metabolic network control. This
problem cannot be circumvented, because no open reading frame can
be expressed without the appropriate regulatory sequences. Moreover,
some genes code for proteins that turn other genes on and off. Groups
of these genes constitute networks with complex behaviors. These net-
works control other genes whose protein products catalyze specific
biochemical reactions. Hence the small molecules that are substrates or
products of these reactions can in turn activate or deactivate proteins
that control transcription or translation. Therefore, gene regulation can
be said to indirectly control biochemical reactions in cellular metabo-
lism, and cellular metabolism to exert control of gene expression.
For these reasons, the interdependent biochemical processes of me-
tabolism and gene expression can, and should, be interpreted and ana-
lyzed in terms of complex dynamical networks. Therefore modeling
and simulation are necessary. To solve this problem, we have to bring
together information from gene regulation and metabolic pathways.
These data have been, and will be, stored systematically in specific
databases that are accessible via the Internet. Recently many firms have
been established that provide essential data for the solution of scientific
and industrial problems and, even more important, the corresponding
infrastructure. As a result, there are more than 200 databases available
via the Internet for all known sequenced genes (e.g., EMBL), proteins
(e.g., SWISS-PROT, PIR, BRENDA), transcription factors (e.g., TRANS-
FAC), biochemical reactions (KEGG), and signal induction reactions
(e.g., TRANSPATH, GeneNet). Besides databases, simulators for meta-
bolic networks, which employ most of the currently popular modeling
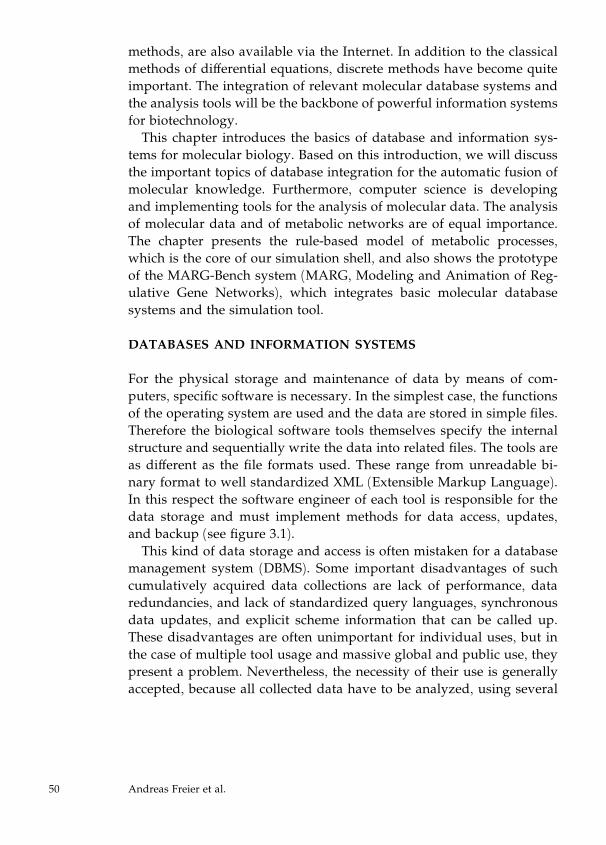
methods, are also available via the Internet. In addition to the classical
methods of differential equations, discrete methods have become quite
important. The integration of relevant molecular database systems and
the analysis tools will be the backbone of powerful information systems
for biotechnology.
This chapter introduces the basics of database and information sys-
tems for molecular biology. Based on this introduction, we will discuss
the important topics of database integration for the automatic fusion of
molecular knowledge. Furthermore, computer science is developing
and implementing tools for the analysis of molecular data. The analysis
of molecular data and of metabolic networks are of equal importance.
The chapter presents the rule-based model of metabolic processes,
which is the core of our simulation shell, and also shows the prototype
of the MARG-Bench system (MARG, Modeling and Animation of Reg-
ulative Gene Networks), which integrates basic molecular database
systems and the simulation tool.
DATABASES AND INFORMATION SYSTEMS
For the physical storage and maintenance of data by means of com-
puters, specific software is necessary. In the simplest case, the functions
of the operating system are used and the data are stored in simple files.
Therefore the biological software tools themselves specify the internal
structure and sequentially write the data into related files. The tools are
as different as the file formats used. These range from unreadable bi-
nary format to well standardized XML (Extensible Markup Language).
In this respect the software engineer of each tool is responsible for the
data storage and must implement methods for data access, updates,
and backup (see figure 3.1).
This kind of data storage and access is often mistaken for a database
management system (DBMS). Some important disadvantages of such
cumulatively acquired data collections are lack of performance, data
redundancies, and lack of standardized query languages, synchronous
data updates, and explicit scheme information that can be called up.
These disadvantages are often unimportant for individual uses, but in
the case of multiple tool usage and massive global and public use, they
present a problem. Nevertheless, the necessity of their use is generally
accepted, because all collected data have to be analyzed, using several
50 Andreas Freier et al.
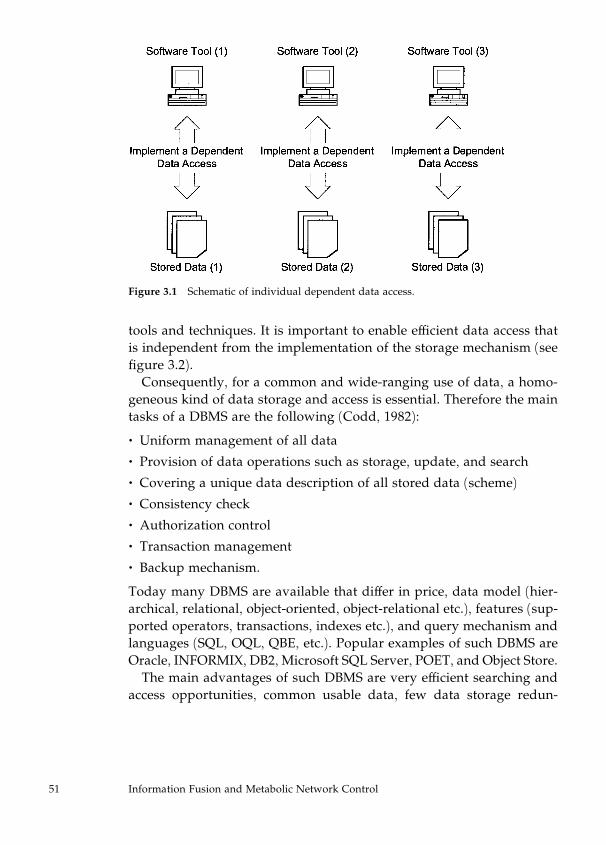
tools and techniques. It is important to enable efficient data access that
is independent from the implementation of the storage mechanism (see
figure 3.2).
Consequently, for a common and wide-ranging use of data, a homo-
geneous kind of data storage and access is essential. Therefore the main
tasks of a DBMS are the following (Codd, 1982):
. Uniform management of all data
. Provision of data operations such as storage, update, and search
. Covering a unique data description of all stored data (scheme)
. Consistency check
. Authorization control
. Transaction management
. Backup mechanism.
Today many DBMS are available that differ in price, data model (hier-
archical, relational, object-oriented, object-relational etc.), features (sup-
ported operators, transactions, indexes etc.), and query mechanism and
languages (SQL, OQL, QBE, etc.). Popular examples of such DBMS are
Oracle, INFORMIX, DB2, Microsoft SQL Server, POET, and Object Store.
The main advantages of such DBMS are very efficient searching and
access opportunities, common usable data, few data storage redun-
Figure 3.1 Schematic of individual dependent data access.
51 Information Fusion and Metabolic Network Control
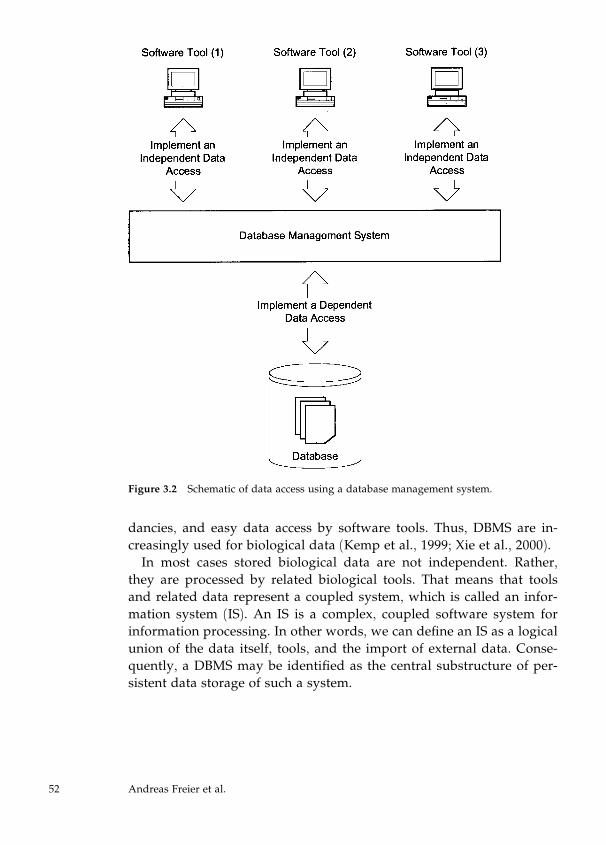
dancies, and easy data access by software tools. Thus, DBMS are in-
creasingly used for biological data (Kemp et al., 1999; Xie et al., 2000).
In most cases stored biological data are not independent. Rather,
they are processed by related biological tools. That means that tools
and related data represent a coupled system, which is called an infor-
mation system (IS). An IS is a complex, coupled software system for
information processing. In other words, we can define an IS as a logical
union of the data itself, tools, and the import of external data. Conse-
quently, a DBMS may be identified as the central substructure of per-
sistent data storage of such a system.
Figure 3.2 Schematic of data access using a database management system.
52 Andreas Freier et al.
MOLECULAR DATABASES
In molecular biology a large number of research projects are currently
producing an exponentially increasing amount of data. A popular
example is the Human Genome Project. In this context alone about
3� 109 base pairs and mapping data must be stored (see http://www.ornl.gov/hgmis/project/progress.html). The most pop-ular public sequence database, EMBL, includes 4.7 million entries of
primary nucleotide sequences and related data (Baker et al., 2000). If
these databases are set in relation to the count of molecular databases,
an impression of the data volume may be given. These data are often
published in publicly accessible sources. Often the categories are very
different. One investigation has divided sequence and related data into
16 categories (Burks, 1999). In correspondence with this, about 200
WWW-based data sources are listed. This is meant to be only a fraction
of the overall number of databases available. In most cases these data
are stored for processing, analyzing, and other functions. A common
approach is to collect all available data, then decide which are dis-
pensable. However, storage capacity is not a problem today.
Nowadays the majority of the molecular database providers store
their research results in ‘‘quick-and-imperfect’’ systems. In most cases
simple flat files are used, which are managed by the directory and file
system structures of the operating system. Data access is achieved with
software that can handle the individual file format. As an interface for
external access, use of the WWW is popular. In those cases HTML
forms coupled with CGI scripts are used, and the data obtained by this
method are presented in HTML pages, using tables or other formats. A
popular example is the KEGG system (Ogata et al., 1999).
One of the reasons why the content of these databases constantly
increases is clarified in a special issue of Nucleic Acids Research that is
published annually in January and gives an overview of databases as
well as presenting selected systems in more detail. In order to pro-
vide a rough picture of the extent of currently available databases, a
selection of important databases is listed in the appendix. A quite de-
tailed collection on this topic has been compiled under the following
URL: http://www-bm.cs.uni-magdeburg.de/iti_bm/marg/dataacquisition/data_sources.html. The most important sys-tems in the field of molecular network control are listed below.
53 Information Fusion and Metabolic Network Control
Genes
. EMBL (http://www.ebi.ac.uk)
. GDB (http://gdbwww.gdb.org/)
. GenBank (http://www.ncbi.nlm.nih.gov)
Proteins and Enzymes
. ENZYME (http://www.expasy.ch)
. LIGAND (http://www.genome.ad.jp)
. PDB (http://www.pdb.bnl.gov/)
. PIR (http://pir.georgetown.edu)
. SWISS-PROT (http://expasy.hcuge.ch/sprot/sprot-top.html)
Pathways
. ExPASy (http://www.expasy.ch)
. KEGG (http://www.genome.ad.jp)
. WIT (http://wit.mcs.anl.gov/WIT2)
Gene Regulation
. EPD (ftp://ftp.ebi.ac.uk/pub/databases/epd/)
. RegulonDB (http://www.cifn.unam.mx/Computational_Genomics/regulondb/)
. TRANSFAC (http://transfac.gbf.de/)
. TRRD (http://www.bionet.nsc.ru/SRCG/index.html)
DATABASE INTEGRATION AND INFORMATION FUSION
In order to use these special databases, the user has to connect to each
database separately. However, the integration of databases can help in
detection of new information. An example is the interaction between
aligned gene sequences of an organism to supplement an unknown
part of a metabolism or suggest and predict alternative pathways
54 Andreas Freier et al.
(Luttgen et al., 2000). At first sight, two basic problems may arise when
handling such a distributed data retrieval:
. How does the user access each relevant database?
. How can the several query results be merged into a joined data set?
These problems lead directly to the field of database integration. The
integration of databases has several parts.
Data merging is the overcoming of the distributed data storage. On
the one hand, the data overlap between the several databases, and on
the other hand, the data are totally different. To produce a global data
set, it becomes necessary to implement a unique global data store.
There are two different ways to achieve this: copying all needed data
into one large database (materialized) and leaving the data where they
are and merging them virtually (nonmaterialized).
Derivation of an integrated scheme starts from the fact that every
local database provides its own data scheme. But in the case of global
access, a unique scheme over all databases is needed. The method used
to solve this problem specifies the degree of scheme integration. Con-
sequently, it is possible to define one global scheme over all local
schemes, meaning that all locally modeled data are integrated into a
global scheme (bottom up). The other kind of scheme integration is to
specify which data are needed by individual application scenarios, thus
making it possible to model several partly integrated global schemes
(top down).
For adequate access to the integrated data, a unique data access and
querying method is needed. For this, the mapping of local data models
and access methods to global ones has to be carried out. In the case of
read-only data access, this is no problem, but for writing operations,
problems occur that include transactions of global management meth-
ods for simultaneous writing on the same object, data consistency
mechanisms, and global integrity policies.
Besides the data retrieval, the quality of the integrated data is im-
portant. Therefore, it must be determined how reliable the data actually
are (Bork and Bairoch, 1996). It is generally accepted that databases in-
clude faulty or low-quality entries such as incorrect sequences, missed
annotation, and wrongly assigned enzyme numbers. Consequently,
these quality problems are propagated during the database integration
to the global data set. Hence, a mechanism for quality control of the
databases and their entries must be established.
55 Information Fusion and Metabolic Network Control
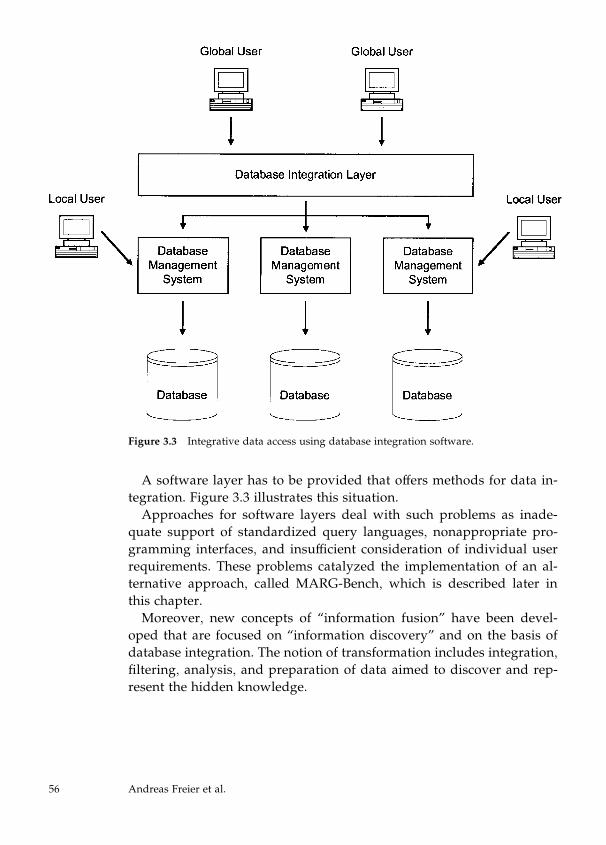
A software layer has to be provided that offers methods for data in-
tegration. Figure 3.3 illustrates this situation.
Approaches for software layers deal with such problems as inade-
quate support of standardized query languages, nonappropriate pro-
gramming interfaces, and insufficient consideration of individual user
requirements. These problems catalyzed the implementation of an al-
ternative approach, called MARG-Bench, which is described later in
this chapter.
Moreover, new concepts of ‘‘information fusion’’ have been devel-
oped that are focused on ‘‘information discovery’’ and on the basis of
database integration. The notion of transformation includes integration,
filtering, analysis, and preparation of data aimed to discover and rep-
resent the hidden knowledge.
Figure 3.3 Integrative data access using database integration software.
56 Andreas Freier et al.
Related Work
The main difficulties are the unique access to proprietary flat files,
Internet interfaces, and the large amount of data. Several ways of real-
izing database integration for biological data exist and are currently in
use:
. Hypertext Navigation: KEGG (Ogata et al., 1999)
. Data Warehouse: SRS (Etzold et al., 1996), PEDANT (Frishman andMewes, 1997), HUSAR (Senger et al., 1995)
. Multi Database Queries: BioKleisli (Davidson et al., 1997), OPM
(Topaloglou et al., 1999).
. Mediator techniques: Multiagents (Matsuda et al., 1999).
One of the most developed technologies of web integration of mo-
lecular databases uses SRS (Sequence Retrieval System (Etzold et al.,
1996). It is based on local copies of each component database, which
have to be provided in a text-based format. The results of the query are
sets of Internet links through which the user can navigate. As of 2000,
more than 100 databases on molecular biology are integrated under
SRS. However, within the limitations of this approach, data fusion is
still the task of the user. Real data fusion (i.e., data for one real-life ob-
ject, such as an enzyme) from two different databases (e.g., KEGG and
BRENDA) is not found to be represented twice by different web pages.
Therefore, research groups try to integrate molecular databases on
a higher level than the SRS approach. Results of current database re-
search, including federated database systems, data warehousing archi-
tectures, and data mining techniques (Conrad, 1997), are applied. Many
problems in bioinformatics require the following:
1. Access to data sources that are large in volume, highly heteroge-
neous and complex, constantly evolving, and geographically dispersed
2. Solutions that involve multiple, carefully sequenced steps
3. Smooth passing of information between the steps
4. An increasing amount of computation
5. An increasing amount of visualization.
BioKleisli (Davidson et al., 1997) is an advanced technology designed
to handle the first three requirements directly. In particular, it provides
57 Information Fusion and Metabolic Network Control
the high-level query language, CPL, that can be used to express
complicated transformation across multiple data sources clearly and
simply. In addition, while BioKleisli does not handle the last two
requirements directly, it is capable of distributing computation to ap-
propriate servers and initiating visualization programs.
The Idea of the Integration Approach
In consideration of the advantages of integrative data access and the
existence of inflexible approaches, a new system for database integra-
tion was developed (see http://www-bm.cs.uni-magdeburg.de/iti_bm/marg/). According to the latest findings, the system offers a
scalable and flexible approach. This is achieved by the concept of wide-
ranging database access by a wrapper (adapter) technology. The data
merging is nonmaterialized, using set operations. Specific data integra-
tion-related schemes for the user can be defined, and the standardized
access to the integrated data can be performed by an SQL-like lan-
guage. For comfortable use, a JDBC driver is available.
MODELING OF METABOLIC NETWORKS
Using the rule-based modeling of metabolic processes, the simulation
environment MetabSim for the analysis and visualization of gene-
controlled metabolic processes was implemented. The advantage of this
concept is the integration of relevant molecular database systems that
are available via the Internet.
Related Work
The availability of the rapidly increasing volume of molecular data on
genes, proteins, and metabolic pathways improves the capability to
study cell behavior. To understand the molecular logic of cells, it must
be possible to analyze metabolic processes and gene networks in quali-
tative and quantitative terms. Therefore, modeling and simulation are
important methods.
Mathematical models may be subdivided into two categories: ana-
lytical and discrete. Analytical models perform the processes of ele-
ments, acting as functional relations (algebraic, integral-differential,
finite-differential, etc.) or logical conditions. An analytical model may
58 Andreas Freier et al.
be studied by qualitative, analytical, or numerical methods. Analytical
models are generally based on integral and differential systems of
equations. The paper published by Waser et al. (1983) presents a com-
puter simulation of phosphofructokinase. This enzyme is a part of the
glycolysis pathway. Waser and coworkers model all kinetic features of
the metabolic reaction, using computer simulation. This computer pro-
gram is based on the rules of chemical reaction, which are described
by differential equations. Franco and Canelas (1984) simulate purine
metabolism by differential equations; each reaction is described by the
relevant substances and the catalytic enzymes, using the Michaelis con-
stant of each enzyme.
Discrete models are based on state transition diagrams. Simple mod-
els of this class are based on simple production units, which can be
combined. Overbeek (1992) presented an amino acid production sys-
tem. A black box with an input set and an output set displays a specific
production. The graphical model of Kohn and Letzkus (1982), which
allows the discussion of metabolic regulation processes, is representa-
tive for the class of graph theoretical approaches. Kohn and Letzkus
expand the graph theory by a specific function that allows the model-
ing of dynamic processes. In this case, the approach of Petri nets is a
new method. Reddy et al. (1993) presented the first application of Petri
nets in molecular biology. This formalism is able to model metabolic
pathways (Hofestadt and Thelen, 1998). The highest abstraction level of
this model class is represented by expert systems and object-oriented
systems (Brutlag et al., 1991; Stoffers et al., 1992). Expert systems and
object-oriented systems are developed by higher programming lan-
guages (Lisp, Cþþ) and allow the modeling of metabolic processes
by facts/classes (protein and enzymes) and rules/classes (chemical
reactions).
The grammatical formalization is able to model complex metabolic
networks. Within this class of models one may consider the cell model
(E-CELL), developed by Tomita et al. E-CELL is the generic computer
software environment for modeling and simulation of whole cell
systems (see Tomita et al., 1999; see also chapter 11). It is an object-
oriented environment for the simulation of molecular processes in user-
definable models, equipped with interfaces that allow observation and
intervention, and written in Cþþ. Using E-CELL, one could construct ahypothetical cell with a definite number of genes sufficient for tran-
scription, translation, energy production, and phospholipid synthesis.
59 Information Fusion and Metabolic Network Control
Rule-Based Modeling
The model is an extension of the Semi-Thue system. Using a universal
rule, this formalization allows the representation of genetic, biosyn-
thetic, and cell communication processes. Furthermore, it is necessary
to expand this discrete model by adding concentration rates for each
metabolite. Metabolites are substances or substance concentrations that
can be modified by biochemical reactions. Enzymes are specific pro-
teins that catalyze biochemical reactions. Inducers and repressors are
metabolites that can accelerate or slow down/prevent biochemical
reactions. The biochemical space (cell state) of a cell is a mixture of
these components. The set of all cell states will be denoted by Z. By
these definitions the abstract metabolism is defined by the actual cell
state and the biochemical reaction rules. The metabolic rule is the basic
unit of the metabolic system.
Let Z be a finite set of cell states. A 5-tuple ðB;A;E; I; pÞ withp A ½0; 1�Q and B;A;E; I A Z is called a metabolic rule. p is rule probabil-
ity; B (Before) is a set of preconditions; A (After) is a set of post-
conditions; E (Enzyme) is a set of catalyzed conditions; and I (Inhibitor)
a set of inhibitor conditions.
Example 1 The reversible biosynthesis product glucose-6-phosphate
$ fructose-6-phosphate will be catalyzed by the enzyme glucosepho-
spat-isomerase. This process can be described by two rules:
. (fglucose-6-phosphateg, ffructose-6-phosphateg, fglucosephosphate-isomeraseg, f g, p)
. (ffructose-6-phosphateg, fglucose-6-phosphateg, fglucosephosphate-isomeraseg, f g, p).
On the basis of the metabolic rule, the basic model can be defined.
G ¼ ðZ;RÞ is a metabolic system. Z is a finite set of cell states, S A Z is
the start state, and R is the metabolic rule set.
In the following paragraph, the semantics of the metabolic system are
defined. The integration of the analyzed metabolic features is the basis
of this formalization and is the reason for specifying a stochastic paral-
lel derivation mechanism that will describe the change of actual cell
states, depending on the specified rule set. Therefore, the set of all acti-
vated rules must be fixed. This is the first step of the derivation process.
A rule is ‘‘activated’’ if its preconditions are elements of the actual state
60 Andreas Freier et al.
z A Z. Moreover, effects of inducer and inhibitor elements must be con-
sidered. If such metabolites are elements of the actual state z, then the
probability of this rule will be modified by inhibitor and inducer
effects. The special function CALCULATEðz; rÞ will determine the ab-solute probability value as rule r depending on state z. A random gen-
erator (RANDOM), using the absolute probability value of the input,
works as a Boolean function and will produce either positive or nega-
tive results (true or false). Once the Boolean value is true (false), rule
r A R is described as activated (deactivated) and goes into action.
Let G ¼ ðZ;RÞ be a metabolic system, r ¼ ðB;A;E; I; pÞ A R a rule, and
z A Z a cellular state. r will be activated by z ðrzÞ, iff Ex A B; x A z. AðzÞ ¼fr A R : r is activated by zg is the set of rules activated by z.
Example 2 Let G ¼ ðZ;R; z0Þ be a metabolic system and z0 ¼ fS;Dgand R ¼ fr1; r2g withr1 ¼ ðfSg; fH; Sg; fDg; fLg; 0:8Þr2 ¼ ðfDg; fXg; fEg; fDg; 0:6ÞFor the configuration z0 Aðz0Þ ¼ fr1g the rule r2 is not activated because
the repressor is available.
Any activated rule r A R can go into action. The action of r will mod-
ify the actual cellular state of the metabolic system. Elements of the
actual cellular state, which are elements of the Before set of rule r, will
be eliminated in z and all elements of the After component will be
added to z. Therefore, the action of rule r can produce a new state,
z 0 A Z.
Let G ¼ ðZ;RÞ be a metabolic system, z A Z the actual cellular
state, and rz ¼ ðB;A;E; I; pÞ A R. The action of rz is defined thus: If
RANDOMðCALCULATEðz; rÞÞ ¼ true, then z 0 ¼ ðz � BÞWA. The action
of rz will be written as z !r z 0.According to the metabolic system defined in example 2, the action of
r1 will produce the state z 0 ¼ fH; S;Dg.The one-step derivation of a metabolic system is defined by the
(quasi) simultaneous action of all activated rules. Therefore, the set of
all activated rules is considered and two new sets are determined: the
Before set and the After set. The Before set includes all B elements of
the activated rules. The definition of the After set is analogous. Using
these sets, the one-step derivation can be interpreted as an addition and
subtraction of elements.
61 Information Fusion and Metabolic Network Control
Example 3 Let G ¼ ðZ;R; z0Þ be a metabolic system and z0 ¼ fB;C;Egand R ¼ fr1; r2; r3g, withr1 ¼ ðfBg; fS;Bg; fCg; f g; 0:9Þr2 ¼ ðfCg; fF;Cg; fEg; f g; 0:3Þr3 ¼ ðfC; Fg; fB;Cg; fEg; f g; 0:3Þ:Aðz0Þ ¼ fr1; r2g is the set of activated rules. For z0 we can identify one-
step derivations that will produce the following states:
fB;C;E; Sg (action of r1)
fB;C;E; Fg (action of r2)
fB;C;E; S; Fg (action of r1 and r2)
fB;C;Eg (empty action).Let G ¼ ðZ;RÞ be a metabolic system, z A Z the actual cellular
state, AðzÞ the set of all activated rules under z, and Bz ¼fB : br A AðzÞ5B A rzg and Az ¼ fA : br A AðzÞ5A A rzg. The simulta-neous action of AðzÞ is called one-step derivation if z 0 ¼ ðz � BzÞWAz. It
is written z ) z 0.Each action can be interpreted as an independent event. Therefore,
the probability of each one-step derivation can be calculated in terms of
the absolute probability values of all activated and deactivated rules. In
the simulation system, this will be done by multiplying these values.
However, based on the one-step derivation, the derivation can
be defined inductively, and a probability for any derivation can be
calculated.
Let G ¼ ðZ;RÞ be a metabolic system. x A Zþ is a derivation in G iff
jxj ¼ 1 or jxj > 1; by 0 A Z�z 0, z 00 A Z : x ¼ z 0z 00 y and z 00 y is a derivation;and z 0 > z 00.
Example 4 Let be G the metabolic system defined in example 3. The
following sequence of cellular states describes a derivation:
fB;C;Eg ) T fB;C;E; Sg ) T 0 fB;C;E; S;Fg ) T 00 ) fB;C;E; S; Fg . . .
where T ¼ fr1g, T 0 ¼ fr1; r2g, and T 00 ¼ fr2; r3g.In the case of analytical modeling, it is necessary to expand the
model, using abstract concentration rates. To realize this requirement
for each component (metabolite), specific integer values must be
assigned. These values can be interpreted as abstract concentration
rates. Since these impacts can be included in the metabolic system, us-
62 Andreas Freier et al.
ing the formalization of multi-sets, the definition of the metabolic sys-
tem must be modified. Regarding the rule activation, the concentration
rate of any Before component must be satisfied in regard to corre-
sponding metabolites of the actual state. The concentration rate of these
metabolites must be higher than or equal to the corresponding Before
component of this metabolic rule.
Moreover, the function CALCULATE must be modified. In this case,
the influence of all concentration rates of inductor and repressor
metabolites will determine the absolute rule probability. All activated
rules can go into action simultaneously. With regard to corresponding
metabolites of the actual state (integer values), the addition and sub-
traction of the concentration rates of all Before and After components is
necessary. In this chapter, only the fundamental part of this formaliza-
tion is presented.
Let z A Z be a state. The multi-set k : z ! Z0 is metabolic concentra-tion. K denotes the set of all metabolic concentrations.
Example 5 Let z ¼ fglucose, lactose, RNA-polymeraseg. [34 glucose,lactose, 15 RNA-polymerase] defines a metabolic concentration of
34 molecules glucose, one molecule lactose, and 15 molecules RNA-
polymerase.
Based on the formalization of multi-sets, the analytical metabolic
system, which enables the discussion of kinetic effects, can be defined.
G ¼ ðZ;R; kÞ with A A Z the start state, k A K a multi-set ðK : A ! NÞ,and R a finite set of metabolic rules, where r ¼ ðB;A;E; I; pÞ A R with
p A ½0; 1�Q and B;A;E; I are metabolic concentrations, is the metabolic
system.
The definition of activation is necessary. Regarding multi-sets, the
activation of any rule r A R depends on the specified concentration rates
of each rule component, the concentration rates of the actual state, and
the absolute rule probability.
Let G ¼ ðZ;R; kÞ be an analytical metabolic system, r A R a rule, and
z A Z a cellular state. r is activated by z (rz), iff Ex A B, x A z, and kðxÞakðzxÞ. AðzÞ ¼ fr A R : r is activated by zg is the set of rules activated by z.
Based on this definition, the one-step derivation can be modified. All
activated metabolic rules can go into action simultaneously. Regarding
the set of activated rules, all After concentration rates must be added to
the actual state and all Before concentration rates must be subtracted
from the actual state.
63 Information Fusion and Metabolic Network Control
G ¼ ðZ;R; kÞ is an analytical metabolic system; z, the actual cellular
state; AðzÞ, the set of all activated rules under z; and
Bz ¼ fB : br A AðzÞ B A rzg and jBzj :¼Xb AB
kðbÞ
Az ¼ fA : br A AðzÞ A A rzg and jAzj :¼Xa AA
kðaÞ:
The simultaneous action of AðzÞ is called one-step derivation iff
z 0 ¼ fx : x A Az or Ex A z; y A Bzx ¼ y and kðxÞ � kðyÞ > 0g. The one-stepderivation is written z ! z 0.Using the one-step derivation operator, one can define the derivation
of an analytical metabolic system inductively.
Example 6 Let G be an analytical metabolic system with k ¼½6A; 8B; 3E� and the rule set R with
r1 ¼ ð½2A�; ½3B�; ½E�; ½X�; 0:8Þr2 ¼ ð½2B�; ½3D�; ½E�; ½X�; 0:5Þ:AðkÞ ¼ fr1; r2g and the set f½6A; 8B; 3E�; ½4A; 11B; 3E�; ½6A; 6B; 3D; 3E�;½4A; 9B; 3D; 3E�g describes the different one-step derivations.
Application
The implemented universal metabolic rule allows the formalization of
biosynthesis, gene expression, gene regulation, and cell communication
processes. Regarding biosynthetic processes, the before, after, inducer,
and repressor components are used. For example, Enzyme E1 will cat-
alyze the biochemical process S1 into S2. This can be expressed by B ¼S1, A ¼ S2, and E ¼ E1. Moreover, one can add any concentration rates.
For example, B ¼ 15S1, A ¼ 12S2, E ¼ 2E1. The probability value willmodel the flux of this biochemical rule, which can be influenced by
specific inducer and repressor metabolites, depending on their concen-
tration rates.
In the case of simple cell communication processes, only the before
or after component will be used. From this, we obtain the following
interpretation: Substance A enters the cell by endocytotic processes.
Therefore, a rule must be defined in which only the after component
will be assigned specific substances. Moreover, such processes can be
64 Andreas Freier et al.
influenced by specific events that can be formulated regarding inducer
and repressor components.
Normally, metabolites will disintegrate after a specific time interval.
This can be expressed by a rule that represents only the specific before
component. Moreover, concentration rates and specific influence com-
ponents can be defined.
In the case of gene regulation, the activity of operons can easily be
modeled. If we choose an operon that represents two structure genes
ðS1; S2Þ, two operator genes ðO1;O2Þ, and one enhancer sequence, thenthis can be expressed by
B ¼ ½RNA-polymerase; ribosome; amino acid; tRNA�A ¼ ½S1; S2�; E ¼ ½IO1; IO2� and I ¼ ½O1;O2�:However, this model allows the simulation of complex metabolic
networks, and the grammatical formalization allows the definition and
implementation of different languages. These languages represent spe-
cific biological aspects. For example, it is possible to produce the set of
all possible pathways, to produce metabolic pathways depending on
specific conditions (for example, the probability value), to search for the
appearance of specific substances (for example, toxic substances), and
so on.
Theoretical Aspects
The set of the attainable configurations is an infinite set, and the set of
all derivations is enumerable. Moreover, the set of all configurations is
undecidable (Hofestadt, 1996). Use of concentrations (multi-sets) is the
main reason for the undecidability. However, this result implies that
no interesting question can be solved in the field of biotechnology
research.
In practice, biochemical systems are restricted. In the model, the
depth and width of the derivation process can be restricted. Therefore,
important questions are decidable, and the complexity of the derivation
algorithm must be discussed. If the derivation depth is restricted, the
language LðG; iÞ is decidable. LðG; iÞ is the set of all configurations thatcan be produced from the start configuration by the application of up
to i derivation steps. Hence, for a metabolic system with the generation
depth i, it is decidable if k is a member of LðG; iÞ. Based on the expo-
65 Information Fusion and Metabolic Network Control
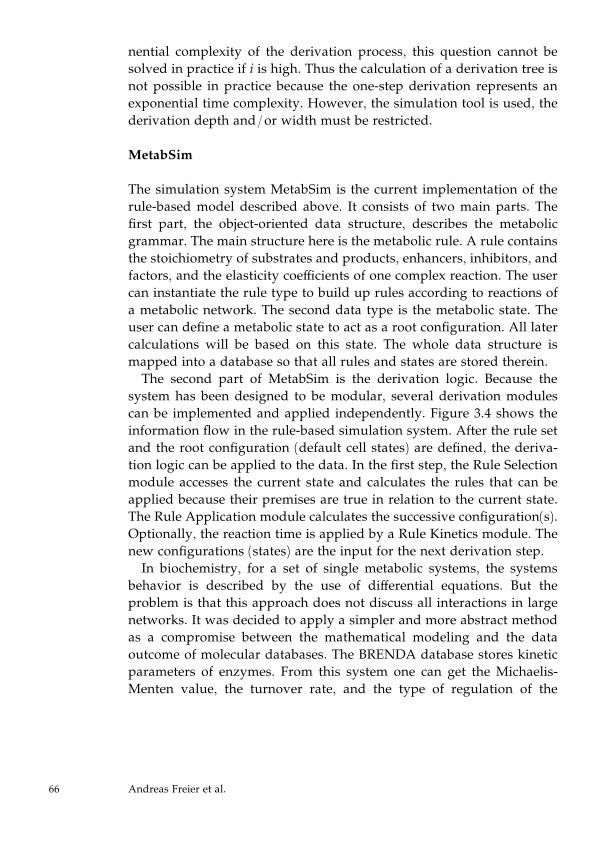
nential complexity of the derivation process, this question cannot be
solved in practice if i is high. Thus the calculation of a derivation tree is
not possible in practice because the one-step derivation represents an
exponential time complexity. However, the simulation tool is used, the
derivation depth and/or width must be restricted.
MetabSim
The simulation system MetabSim is the current implementation of the
rule-based model described above. It consists of two main parts. The
first part, the object-oriented data structure, describes the metabolic
grammar. The main structure here is the metabolic rule. A rule contains
the stoichiometry of substrates and products, enhancers, inhibitors, and
factors, and the elasticity coefficients of one complex reaction. The user
can instantiate the rule type to build up rules according to reactions of
a metabolic network. The second data type is the metabolic state. The
user can define a metabolic state to act as a root configuration. All later
calculations will be based on this state. The whole data structure is
mapped into a database so that all rules and states are stored therein.
The second part of MetabSim is the derivation logic. Because the
system has been designed to be modular, several derivation modules
can be implemented and applied independently. Figure 3.4 shows the
information flow in the rule-based simulation system. After the rule set
and the root configuration (default cell states) are defined, the deriva-
tion logic can be applied to the data. In the first step, the Rule Selection
module accesses the current state and calculates the rules that can be
applied because their premises are true in relation to the current state.
The Rule Application module calculates the successive configuration(s).
Optionally, the reaction time is applied by a Rule Kinetics module. The
new configurations (states) are the input for the next derivation step.
In biochemistry, for a set of single metabolic systems, the systems
behavior is described by the use of differential equations. But the
problem is that this approach does not discuss all interactions in large
networks. It was decided to apply a simpler and more abstract method
as a compromise between the mathematical modeling and the data
outcome of molecular databases. The BRENDA database stores kinetic
parameters of enzymes. From this system one can get the Michaelis-
Menten value, the turnover rate, and the type of regulation of the
66 Andreas Freier et al.
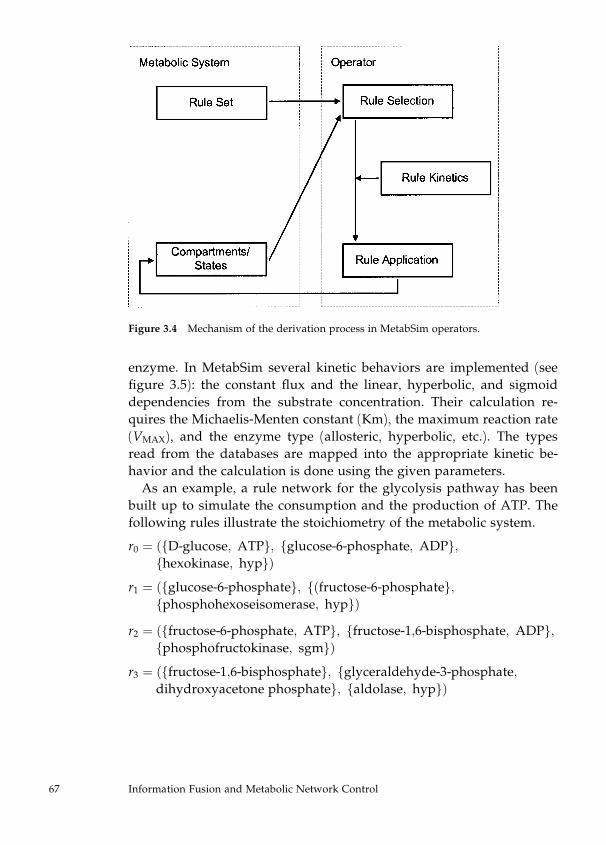
enzyme. In MetabSim several kinetic behaviors are implemented (see
figure 3.5): the constant flux and the linear, hyperbolic, and sigmoid
dependencies from the substrate concentration. Their calculation re-
quires the Michaelis-Menten constant (Km), the maximum reaction rate
(VMAX), and the enzyme type (allosteric, hyperbolic, etc.). The types
read from the databases are mapped into the appropriate kinetic be-
havior and the calculation is done using the given parameters.
As an example, a rule network for the glycolysis pathway has been
built up to simulate the consumption and the production of ATP. The
following rules illustrate the stoichiometry of the metabolic system.
r0 ¼ ðfD-glucose; ATPg; fglucose-6-phosphate; ADPg;fhexokinase; hypgÞ
r1 ¼ ðfglucose-6-phosphateg; fðfructose-6-phosphateg;fphosphohexoseisomerase; hypgÞ
r2 ¼ ðffructose-6-phosphate; ATPg; ffructose-1;6-bisphosphate; ADPg;fphosphofructokinase; sgmgÞ
r3 ¼ ðffructose-1;6-bisphosphateg; fglyceraldehyde-3-phosphate;dihydroxyacetone phosphateg; faldolase; hypgÞ
Figure 3.4 Mechanism of the derivation process in MetabSim operators.
67 Information Fusion and Metabolic Network Control
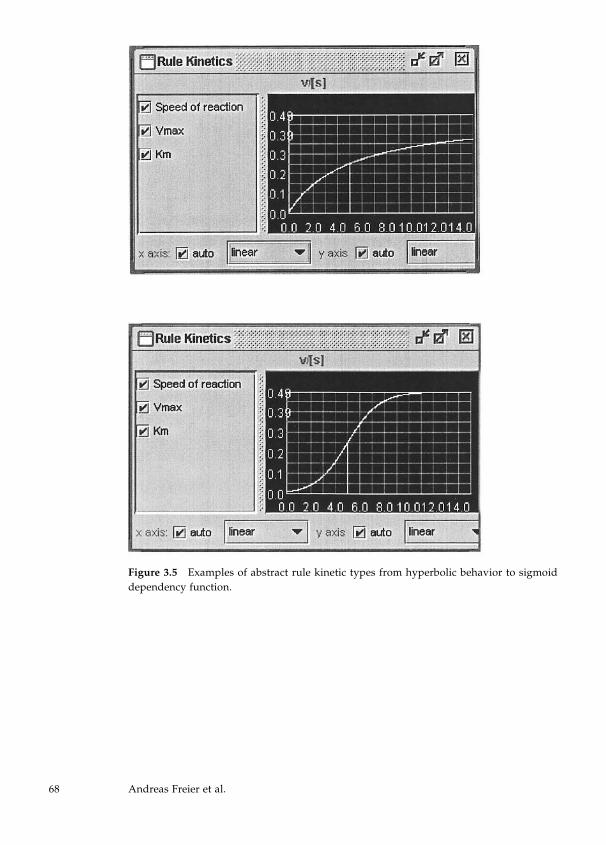
Figure 3.5 Examples of abstract rule kinetic types from hyperbolic behavior to sigmoid
dependency function.
68 Andreas Freier et al.
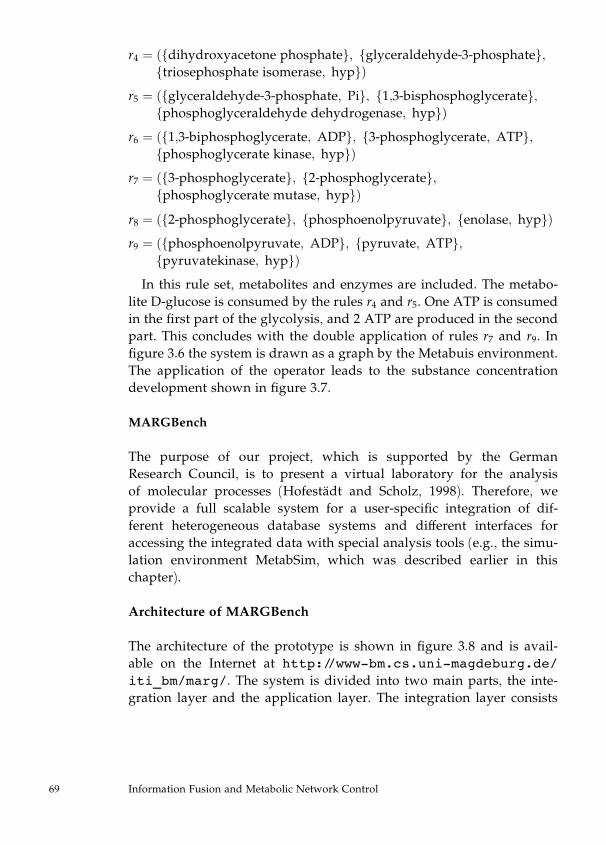
r4 ¼ ðfdihydroxyacetone phosphateg; fglyceraldehyde-3-phosphateg;ftriosephosphate isomerase; hypgÞ
r5 ¼ ðfglyceraldehyde-3-phosphate; Pig; f1;3-bisphosphoglycerateg;fphosphoglyceraldehyde dehydrogenase; hypgÞ
r6 ¼ ðf1;3-biphosphoglycerate; ADPg; f3-phosphoglycerate; ATPg;fphosphoglycerate kinase; hypgÞ
r7 ¼ ðf3-phosphoglycerateg; f2-phosphoglycerateg;fphosphoglycerate mutase; hypgÞ
r8 ¼ ðf2-phosphoglycerateg; fphosphoenolpyruvateg; fenolase; hypgÞr9 ¼ ðfphosphoenolpyruvate; ADPg; fpyruvate; ATPg;
fpyruvatekinase; hypgÞIn this rule set, metabolites and enzymes are included. The metabo-
lite D-glucose is consumed by the rules r4 and r5. One ATP is consumed
in the first part of the glycolysis, and 2 ATP are produced in the second
part. This concludes with the double application of rules r7 and r9. In
figure 3.6 the system is drawn as a graph by the Metabuis environment.
The application of the operator leads to the substance concentration
development shown in figure 3.7.
MARGBench
The purpose of our project, which is supported by the German
Research Council, is to present a virtual laboratory for the analysis
of molecular processes (Hofestadt and Scholz, 1998). Therefore, we
provide a full scalable system for a user-specific integration of dif-
ferent heterogeneous database systems and different interfaces for
accessing the integrated data with special analysis tools (e.g., the simu-
lation environment MetabSim, which was described earlier in this
chapter).
Architecture of MARGBench
The architecture of the prototype is shown in figure 3.8 and is avail-
able on the Internet at http://www-bm.cs.uni-magdeburg.de/iti_bm/marg/. The system is divided into two main parts, the inte-
gration layer and the application layer. The integration layer consists
69 Information Fusion and Metabolic Network Control
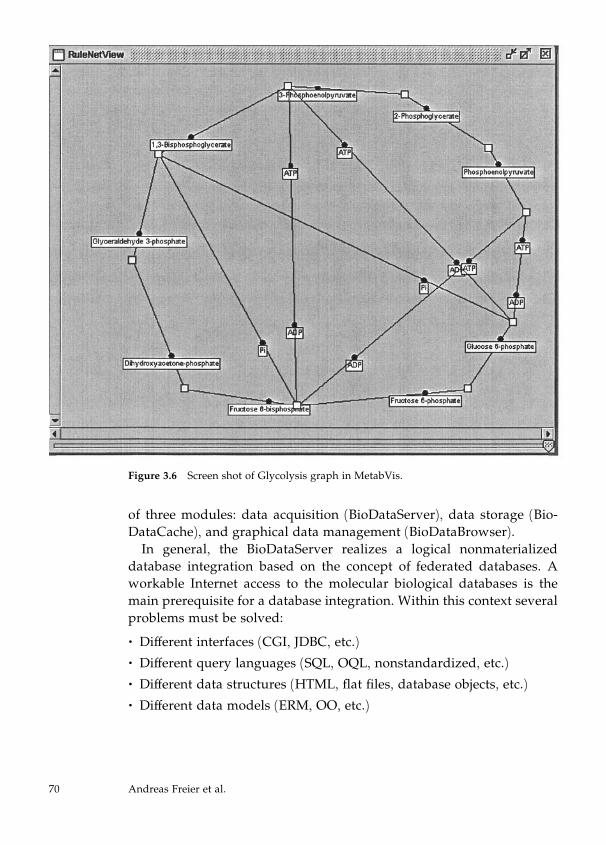
of three modules: data acquisition (BioDataServer), data storage (Bio-
DataCache), and graphical data management (BioDataBrowser).
In general, the BioDataServer realizes a logical nonmaterialized
database integration based on the concept of federated databases. A
workable Internet access to the molecular biological databases is the
main prerequisite for a database integration. Within this context several
problems must be solved:
. Different interfaces (CGI, JDBC, etc.)
. Different query languages (SQL, OQL, nonstandardized, etc.)
. Different data structures (HTML, flat files, database objects, etc.)
. Different data models (ERM, OO, etc.)
Figure 3.6 Screen shot of Glycolysis graph in MetabVis.
70 Andreas Freier et al.
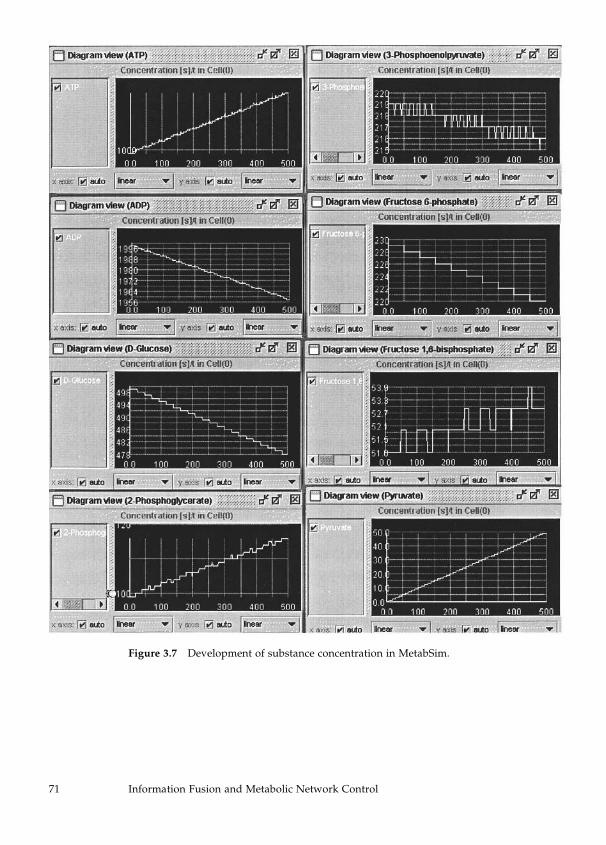
Figure 3.7 Development of substance concentration in MetabSim.
71 Information Fusion and Metabolic Network Control
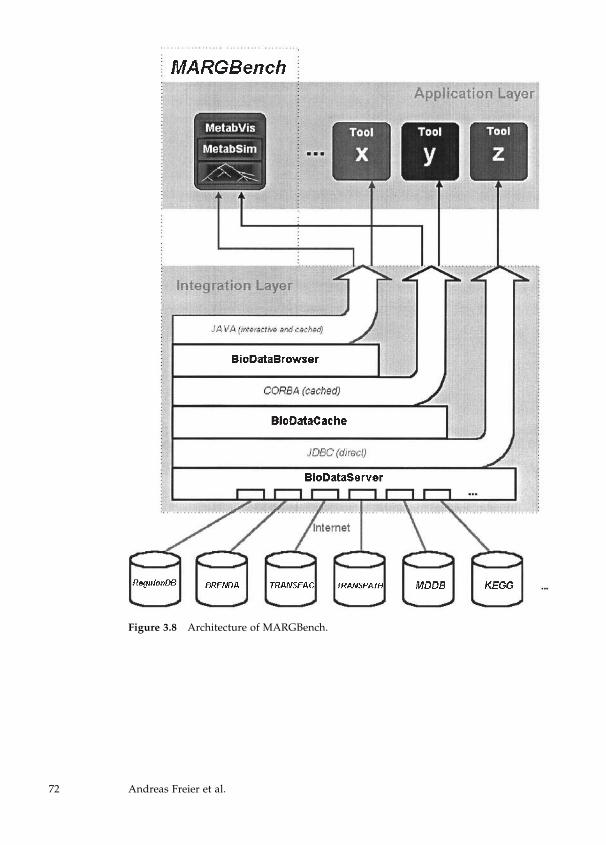
Figure 3.8 Architecture of MARGBench.
72 Andreas Freier et al.
For such a homogeneous access to the several data sources, a func-
tional interface was defined that is implemented by special software
modules, called adapters. Using semiautomatic adapter generation, it
will be possible to dynamically connect relevant data sources. In the
case of an HTML data source, the adapter accesses the specific URL and
parses the resulting HTML page. For this generation a description file is
necessary. Such a description file contains structure and syntax infor-
mation about the data source, which should be integrated into our sys-
tem. This information enables a mapping between the data fields of the
docked data sources and the attributes of an integrated user scheme.
Regarding the user requirements to the integrated data, it is possible
to specify integrated data schemes. These schemes can be defined or
manipulated, using a special language. They describe the accessible
attributes of integrated data sources in transparent form.
In order to obtain a complete and wide spectrum of data, integration
of as many databases as possible is recommended. Using this special
integrated user scheme, the BioDataServer combines the outcomes of
adapter queries into integrated global results, known as information
fusion. The scheme is relational and defines the source for each attri-
bute and its internal dependencies. This is the basis for performing
logical data integration and provides a relational view of the fused
data. Thus it is possible to retrieve integrated data by a subset of SQL
queries.
As can be seen, an automatic mechanism is necessary to merge the
partitioned data values from the various databases. This is one task of
the BioDataServer, and can be solved using mathematical set operations.
The prerequisite to access the database integration server by com-
puter programs is the definition of an interface. Because the server
should be accessible via the Internet, a communication protocol and a
query language must be specified. Many database systems support a
subset of SQL as query language, which in turn is based on the relation
model and is well standardized. This was the reason for supporting
SQL elements by the BioDataServer. Different techniques in the field of
interfaces for remote database access have been established (e.g., JDBC
and ODBC). ODBC is supported only by Microsoft platforms. There-
fore, the BioDataServer currently offers a JDBC driver, which provides
a standardized database access to JAVA applications. Consequently,
any JAVA platform can access the BioDataServer by related JAVA pro-
grams.
73 Information Fusion and Metabolic Network Control
The main advantages of this BioDataServer are the transparent physi-
cal database access, the dynamic building of new nonmaterialized,
logical integrated databases, a standardized access interface, a client-
server capability, and platform independence. With the implemented
JDBC driver the integration service of the BioDataServer is also in-
dependently useful for other external JAVA applications. A demon-
stration of the BioDataServer is available at http://www-bm.cs.uni-magdeburg.de/BDSDemo/.The next level in the integration layer is the BioDataCache, which
handles the local storage of the fused data in a user-specific integration
database. Thus it is possible to build individual integrated databases
that reflect the individual user’s application requirements, and to per-
form data analysis, cleaning, improvements, and enrichment. The user
is able to interactively specify and create the integration database in
interface definition language (IDL) syntax. If the IDL is ready, the ser-
vice modules will be generated automatically. The individual data im-
port is based on specific, integrated user schemes of the BioDataServer,
which must be defined previously. The access to these integration
databases is possible by the Common Object Request Broker Architec-
ture (CORBA) (OMG, 1991) and OQL (Cattell, 1994).
The BioDataCache provides the materialized layer for the data
integration that is based on CORBA. The access for importing inte-
grated data from the BioDataServer is possible using the JBDC driver
of the integration layer. Furthermore, the BioDataCache has an in-
tegrated user scheme for the selection of attributes that should be inte-
grated. An empty database related to the integrated scheme is generated
automatically.
Once data from the integration service are read, they are stored in the
underlying standard object-oriented database.
By storing the fused information in the cache, an separate new data
source will be created. This new user-specific integration database rep-
resents a metadatabase and is comparable to a data warehouse. The
offered CORBA interface, similar to the BioDataServer, enables other
software tools to access the BioDataCache.
The third part in the integration layer is represented by the Bio-
DataBrowser. It is automatically generated during the generation of
an integration database. This module allows the user to graphically
manage and browse the fused data. Its functions are similar to a Win-
dows file browser. Furthermore, a JAVA interface is offered to access
74 Andreas Freier et al.
this component within JAVA applications. The development of DBMS-
supported applications forces the programming of database-related
user-interactive components to establish database connections, query
the data, transmit the results, store the data, and so forth. The Bio-
DataBrowser provides this feature and can be included as a component
in different JAVA applications.
Application of MARGBench
The application of MARGBench is done at different levels, because the
system consists of plugable components. Every user is able to access the
components that are essential for his or her specific integration problem.
One possibility is the use of the online integration provided by the
BioDataServer component. Here a uniform SQL interface with client/
server and multiuser/multiclient feature is available. A case study for
this kind of data analysis tool is available at http://www-bm.cs.uni-magdeburg.de/phpMetaTool.The software METATOOL (Pfeiffer et al., 1999) is an independent
system that has been written in the C programming language. Separate
programs are necessary to generate the input file and to read the output
files. The input for the integration architecture is obtained by the Bio-
DataServer. This client program has been implemented using the PHP
programming language, and enables the program to be used via the
Internet.
The second way to use MARGBench is to access automatically gen-
erated integration databases. Once the integration database (BioData-
Cache) has been established, the user can load his or her integration
database with integrated data. For coupling application programs, the
CORBA interface and the BioDataBrowser can be used.
As a reference application, MARGBench is used with the simulation
tool MetabSim. It accesses a specially configured BioDataCache to ob-
tain data and to build the rule network. First, a BioDataCache for stor-
ing information about metabolic networks is configured. After the data
structures for the cache are established, the BioDataCache installation
tool is used to compile and install an integration database (cache) called
MetabNets. From the tool a CORBA interface is obtained for accessing
the data structures previously defined. This interface can be used to
submit database queries and to operate on cache objects by creating,
modifying, and deleting operations. Data structures of MetabNets are,
75 Information Fusion and Metabolic Network Control
for instance, the classes metabolism, pathway, reaction, and enzyme.
Once the cache scheme is defined, the user can start the integration
procedure. During this process the BioDataServer is queried and ob-
jects of MetabNets are instantiated with the query results.
The data structures in the MetabSim program are also defined in
CORBA. Now it is necessary to implement a mapping algorithm to
produce rules out of the MetabNets objects. The program containing
this algorithm accesses the BioDataBrowser and the BioDataCache. In
this context, the browser is used for the interactive selection of meta-
bolic pathways and single reactions. An example of enzyme informa-
tion viewed with the BioDataBrowser is shown in figure 3.9. An active
interface for the data exchange between BioDataBrowser and applica-
tion is available. The application program (MetabSim) implements this
data exchange interface. When the user selects one or more objects from
the cache, the data exchange interface is called and the algorithm in
MetabSim processes the transformation into MetabSim rules.
In order to handle large networks, all entities of the MetabSim simu-
lation model are stored in a standard object-oriented database system.
The MetabVis program is the front end of the simulation. With this
graphical user interface, one can initiate the import of MetabNets data,
modify the rule, run the simulation, and display the results. As an ex-
ample of the result of access to different databases, figure 3.10 presents
the gene regulation system of the CRP operon in E. coli.
DISCUSSION
The scientific world is at the beginning of the century of biotechnology.
The progress of this new technology depends on the application of
methods and concepts of computer science, because the exponential
growth of experimental data must be handled. In other words, mo-
lecular database systems and analysis tools must be implemented.
Apweiler et al. show in chapter 2 that more than 200 molecular data-
base systems and hundreds of analysis tools are available via the In-
ternet. For the analysis and synthesis of molecular processes, the
integration of database systems is important. Therefore, the main goal
of bioinformatics is to develop and implement the information techno-
logical infrastructure for molecular biology.
Various companies have already entered the market. The most im-
portant are Human Genome Sciences (USA), Celera Genomics (USA),
76 Andreas Freier et al.
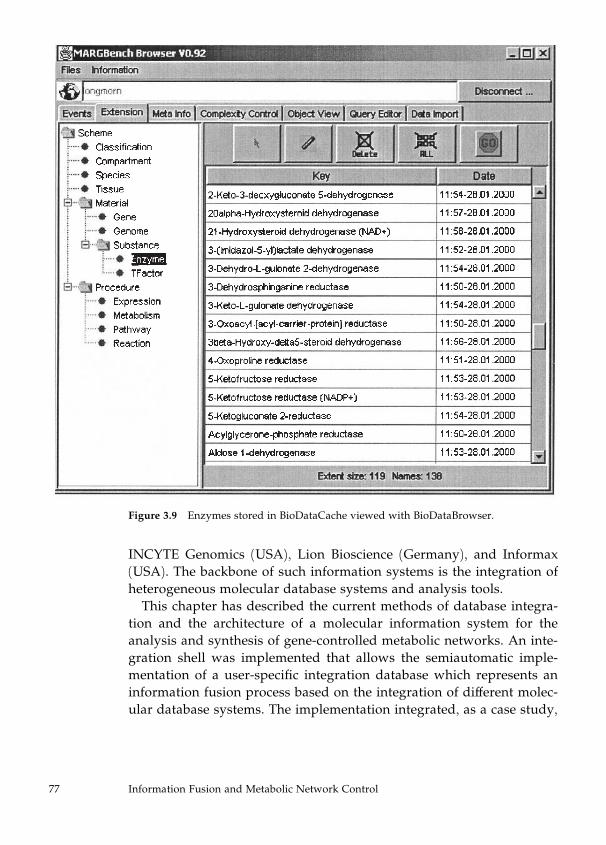
INCYTE Genomics (USA), Lion Bioscience (Germany), and Informax
(USA). The backbone of such information systems is the integration of
heterogeneous molecular database systems and analysis tools.
This chapter has described the current methods of database integra-
tion and the architecture of a molecular information system for the
analysis and synthesis of gene-controlled metabolic networks. An inte-
gration shell was implemented that allows the semiautomatic imple-
mentation of a user-specific integration database which represents an
information fusion process based on the integration of different molec-
ular database systems. The implementation integrated, as a case study,
Figure 3.9 Enzymes stored in BioDataCache viewed with BioDataBrowser.
77 Information Fusion and Metabolic Network Control
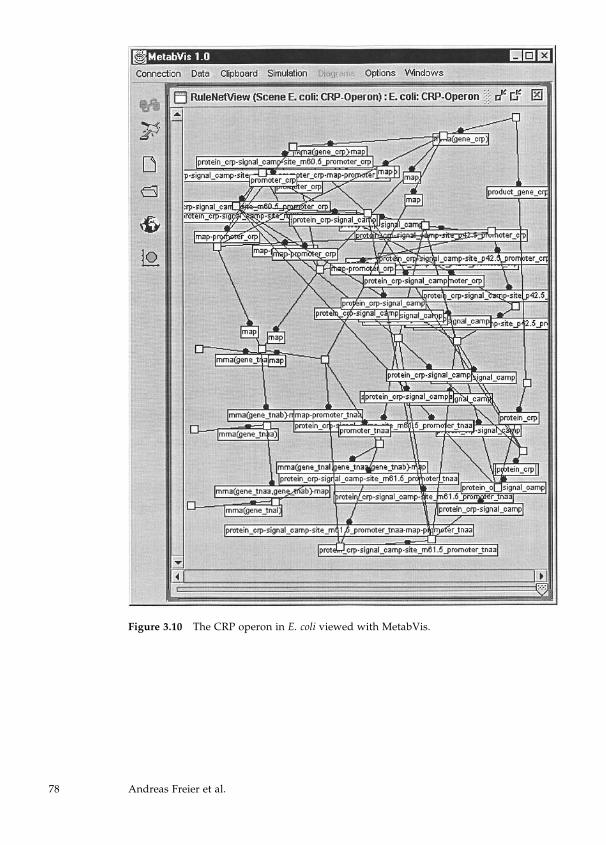
Figure 3.10 The CRP operon in E. coli viewed with MetabVis.
78 Andreas Freier et al.
seven different molecular database systems and the rule-based simula-
tion tool MetabSim, which allows the simulation of gene-controlled
metabolic networks.
The rule-based method is easy to handle and also allows the abstract
simulation of analytical effects. It does not have the vision of the virtual
cell like Tomita (see chapter 11), because the theoretical results show
that the complexity of the simulation of the complete metabolic pro-
cesses is exponential. That means that only parts of the metabolism can
be calculated. However, simulation is, and will be, one important point
in understanding the function of gene-regulated metabolic pathways.
Moreover, the algorithmic analysis of metabolic networks must be
achieved. Chapters 10 and 7 show the state of the art of the algorith-
mic analysis of metabolic networks. To understand the logic of life,
algorithms for the calculation of alignments of metabolic pathways or
for the prediction of metabolic pathways based on rudimentary knowl-
edge must be developed. Finally, the analysis process needs informa-
tion systems that integrate analysis tools and simulation environments
based on the integration of molecular database systems.
ACKNOWLEDGMENTS
This work was supported by the German Research Council and by the
German Volkswagen Foundation.
REFERENCES
Baker, W., van den Broek, A., Camon, E., Hingamp, P., Sterk, P., Stoesser, G., and Tuli, M.
A. (2000). The EMBL Nucleotide Sequence Database. Nucleic Acids Res. 28(1): 19–23.
Bork, P., and Bairoch, A. (1996). Go hunting in sequence databases but watch out for the
traps. Trends in Genetics 12(10): 425–427.
Brutlag, D. L., Galpher, A. R., and Millis, D. H. (1991). Knowledge-based simulation of
DNA metabolism: Prediction of enzyme action. CABIOS 7(1): 9–19.
Burks, C. (1999). Molecular biology database list. Bioinformatics 27(1): 1–9.
Cattell, R. G. (1994). The Object Database Standard: ODMG-93. San Mateo, Calif.: Morgan
Kaufmann.
Codd, E. F. (1982). Relational database: A practical foundation for productivity. Commun.
ACM 25(2): 109–113.
79 Information Fusion and Metabolic Network Control
Conrad, S. (1997). Foderierte Datenbanksysteme: Konzepte der Datenintegration. ( Fed-
erated Database Systems: Concepts of Data Integration). Berlin and Heidelberg: Springer-
Verlag.
Davidson, S. B., Overton, C., Tannen, V., and Wong, V. (1997). BioKleisli: A digital library
for biomedical researchers. Int. J. Digit. Libr. 1: 36–53.
Etzold, T., Ulyanov, A., and Argos, P. (1996). SRS: Information retrieval system for mo-
lecular biology data banks. Methods Enzymol. 266: 114–128.
Franco, R., and Canela, E. (1984). Computer simulation of purine metabolism. Eur. J. Bio-
chem. 144: 305–315.
Frishman, D., and Mewes, H. W. (1997). PEDANTic genome analysis. Trends in Genetics
13(10): 415–416.
Hofestadt, R. (1996). Theorie der regelbasierten Modellierung des Zellstoffwechsels. Aachen:
Shaker.
Hofestadt, R., and Scholz, U. (1998). Information processing for the analysis of metabolic
pathways and inborn errors. BioSystems 47(1–2): 91–102.
Hofestadt, R., and Thelen, S. (1998). Quantitative modeling of biochemical networks. In
Silico Biol. 1(1): 39–53.
Kemp, G. J., Robertson, C. J., and Gray, P. M. (1999). Efficient access to biological data-
bases using CORBA. CCP11 Newsletter 3.1(7); http://www.dl.ac.uk/CCP/CCP11/
newsletter/vol3_1/.
Kohn, M. C., and Letzkus, W. (1982). A graph-theoretical analysis of metabolic regulation.
J. Theor. Biol. 100: 293–304.
Luttgen, H., Rohdich, F., Herz, S., Wungsintaweekul, J., Hecht, S., Schuhr, C. A., Feller-
meier, M., Sagner, S., Zenk, M. H., Bacher, A., and Eisenreich, W. (2000). Biosynthesis
of terpenoids: YchB protein of Escherichia coli phosphorylates the 2-hydroxy group of 4-
diphosphocytidyl-2C-methyl-D-erythritol. Proc. Natl. Acad. Sci. USA 97(3): 1062–1067.
Matsuda, H., Imai, T., Nakanishi, M., and Hashimoto, A. (1999). Querying molecular
biology databases by integration using multiagents. IEICE Trans. Inf. & Syst. E82-D(1):
199–207.
Object Management Group (OMG). (1991). The Common Object Request Broker: Architecture
and specification. OMG Document no 91.12.1. Framingham, Mass.: OMG.
Ogata, H., Goto, S., Sato, K., Fujibuchi, W., Bono, H., and Kanehisa, M. (1999). KEGG:
Kyoto Encyclopedia of Genes and Genomes. Nucleic Acids Res. 27(1): 29–34.
Overbeek, R. (1992). Logic programming and genetic sequence analysis: A tutorial. In
Krzysztof Apt (ed.), Proceedings of Logic Programming. Cambridge, Mass.: MIT Press.
Pfeiffer, T., Sanchez-Valdenebro, I., Nuno, J. C., Montero, F., and Schuster, S. (1999).
METATOOL: For studying metabolic networks. Bioinformatics 15(3): 251–257.
Reddy, V. N., Mavrovouniotis, M. L., and Liebmann, M. N. (1993). Petri net representa-
tions in metabolic pathways. In L. Hunter, D. Searls, and J. Shavlik (eds.), ISMB-93 Pro-
80 Andreas Freier et al.
ceedings: First International Conference on Intelligent Systems for Molecular Biology. Menlo
Park, Calif.: AAAI Press; Cambridge, Mass.: MIT Press, pp. 328–336.
Senger, M., Glatting, K.-H., Ritter, O., and Suhai, S. (1995). X-Husar, an X-based graphical
interface for the analysis of genomic sequences. Comput. Methods Programs in Biomedicine
46(2): 131–142.
Stoffers, H. J., Sonnhammer, E. L., Blommestijn, G. J., Raat, N. J., and Westerhoff, H. V.
(1992). METASIM: Object-oriented modeling of cell regulation. CABIOS 8(5): 443–449.
Tomita, M., Hashimoto, K., Takahashi, K., Shimizu, T. S., Matsuzaki, Y., Miyoshi, F.,
Saito, K., Tanida, S., Yugi, K., Venter, J. C., and Hutchison, C. A. (1999). E-CELL: Software
environment for whole-cell simulation. Bioinformatics 15(1): 72–84.
Topaloglou, T., Kosky, A., and Markowitz, V. (1999). Seamless integration of biological
applications within a database framework. In T. Lengauer, R. Schneider, D. Boork, D.
Brutlag, J. Glasgow, H.-W. Mewes, and R. Zimmer (eds.), The Seventh International Con-
ference on Intelligent Systems for Molecular Biology (ISMB ’99), Heidelberg, Germany, August
6–10. Menlo Park, Calif.: AAAI Press, pp. 272–281.
Waser, M., Garfinkel, L., Kohn, C., and Garfinkel, D. (1983). Computer modeling of mus-
cle phosphofructokinase. J. Theor. Biol. 103: 295–312.
Xie, G., DeMarco, R., Blevis, R., and Wang, Y. (2000). Storing biological sequence data-
bases in relational form. Bioinformatics 16(3): 288–289.
SUGGESTED READING
Bell, D., and Grimson, J. (1992). Distributed Database Systems. Reading, Mass.: Addison-
Wesley.
Elmasri, R., and Navathe, S. B. (2000). Fundamentals of Database Systems. 3rd ed. Reading,
Mass.: Addison-Wesley.
Middleton, J., Jones, M. L., and Pande, G. N. (1996). Computer Methods in Biomechanics &
Biomedical Engineering. Amsterdam: Gordon and Breach.
Stephanopoulos, G. N., Aristidou, A. A., and Nielsen, J. (1998). Metabolic Engineering:
Principles and Methodologies. London: Academic Press.
URLs FOR RELEVANT SITES
General Data CollectionsEntrez. Entrez allows retrieval of molecular biology data and bibliographic citations from
the NCBI’s integrated databases. http://www.ncbi.nlm.nih.gov
SRS. The Sequence Retrieval System (SRS) is a huge, systematic collection of molecular
databases and analysis tools that are uniquely formatted and accessible.
http://srs6.ebi.ac.uk
81 Information Fusion and Metabolic Network Control
GenesCEPH. This is a database of genotypes for all genetic markers that have been typed in the
CEPH and for reference families for linkage mapping of human chromosomes.
http://www.cephb.fr
EMBL. The EMBL Nucleotide Sequence Database is a framed compilation of all known
DNA and RNA sequences. http://www.ebi.ac.uk
GDB. The GDB is the offical central database for all information that is collected in the
Human Genome Project. http://gdbwww.gdb.org/
GenBank. GenBank is the NIH genetic sequence database. It is an annotated collection of
all publicly available DNA sequences. http://www.ncbi.nlm.nih.gov
GeneCards. This database covers data of human genes, their products, and their involve-
ment in diseases. http://bioinfo.weizmann.ac.il/cards/
HGMD. The Human Gene Mutation Database represents an attempt to collate known
(published) gene lesions responsible for human inherited disease.
http://www.uwcm.ac.uk
MGD. The Mouse Genome Database contains information on mouse genetic markers,
molecular segments, phenotypes, comparative mapping data, etc.
http://www.informatics.jax.org
MKMD. Mouse Knockout and Mutation Database is a regularly updated database of
mouse genetic knockouts and mutations. References are directly linked to Evaluated
Medline. Published by Current Biology. http://www.biomednet.com
MTIR. Data about the expression of muscle-specific genes are available in this database.
http://agave.humgen.upenn.edu
PAHdb. Database that provides access to up-to-date information about mutations at
the phenylalanine hydroxylase locus, including additional data.
http://blizzard.cc.mcgill.ca
SCPD. This is a specialized promoter database of Saccharomyces cerevisiae.
http://cgsigma.cshl.org/jian
VBASE. VBASE is a comprehensive directory of all human germ line variable region
sequences compiled from over a thousand published sequences.
http://www.mrc-cpe.cam.ac.uk
Proteins and EnzymesCATH. CATH is a hierarchical classification of protein domains. A lexicon that includes
text and pictures describing protein class and architecture is available.
http://www.biochem.ucl.ac.uk
ENZYME. ENZYME is a repository of information relative to the nomenclature of
enzymes. http://www.expasy.ch
82 Andreas Freier et al.
LIGAND. The Ligand Chemical Database for Enzyme Reactions is designed to provide
the linkage between chemical and biological aspects of life in light of enzymatic reactions.
http://www.genome.ad.jp
PDB. PDB is the single international repository for the processing and distribution of 3-D
macromolecular structure data primarily determined experimentally by X-ray crystallog-
raphy and NMR. http://www.pdb.bnl.gov/
PIR. This database is a comprehensive, annotated, and nonredundant set of protein se-
quence databases in which entries are classified into family groups and alignments of
each group are available. http://pir.georgetown.edu
PMD. The Protein Mutant Database will be valuable as a basis of protein engineering. It is
based on literature (not on proteins); that is, each entry corresponds to an article that
describes protein mutations. http://www.genome.ad.jp
PRF. The Peptide Institute, Protein Research Foundation, collects information related to
amino acids, peptides, and proteins: articles from scientific journals, peptide/protein
sequence data, data on synthetic compounds, and molecular aspects of proteins.
http://www.prf.or.jp
PRINTS. PRINTS is a compendium of protein fingerprints. A fingerprint is a group
of conserved motives used to characterize a protein family.
http://www.biochem.ucl.ac.uk
PROSITE. PROSITE is a database of protein families and domains. It consists of bio-
logically significant sites, patterns, and profiles that help to reliably identify to which
known protein family (if any) a new sequence belongs.
http://www.expasy.ch/ prosite/
REBASE. REBASE, the Restriction Enzyme data BASE is a collection of information about
restriction enzymes (methylases), the microorganisms from which they have been iso-
lated, recognition sequences, cleavage sites, etc. http://rebase.neb.com
SWISS-PROT. SWISS-PROT is a curated protein sequence database that strives to provide
a high level of annotations, a minimal level of redundancy, and a high level of integration
with other databases. http://expasy.hcuge.ch/sprot/sprot_top.html
PathwaysCSNDB. The Cell Signaling Networks DataBase is a data and knowledge base for signal-
ing pathways of human cells. http://geo.nihs.go.jp
ExPASy. This database contains links to the ENZYME Database and, for each entry, also
contains links to all maps of Boehringer Biochemical Pathways in which this entry
appears. http://www.expasy.ch
KEGG. The Kyoto Encyclopedia of Genes and Genomes is an effort to computerize cur-
rent knowledge of molecular and cellular biology in terms of the information pathways
that consist of interacting molecules or genes. http://www.genome.ad.jp/kegg
WIT. WIT is a web-based system to support the curation of function assignments made to
genes and the development of metabolic models. http://wit.mcs.anl.gov/WIT2
83 Information Fusion and Metabolic Network Control
Gene RegulationEPD. The Eukaryotic Promoter Database is a collection of eukaryotic promoters in form of
DNA sequences. ftp://ftp.ebi.ac.uk/pub/databases/epd/
GRBase. The Growth Regulation Database contains information about proteins, genes,
and sequences in the field of gene regulation. http://www.access.digex.net
RegulonDB. This is a database on transcriptional regulation in E. coli.
http://www.cifn.unam.mx.unam.mx/Computational_Genomics/regulondb
TRANSFAC. This database compiles data about gene regulatory DNA sequences and
protein factors binding to and acting through them. http://transfac.gbf.de
TRRD. The Transcription Regulatory Regions Database is a curated database designed for
accumulation of experimental data on extended regulatory regions of eukaryotic genes.
http://www.bionet.nsc.ru/SRCG/index.html
Metabolic DiseasesBIOMDB. This consists of collected data on mutations causing tetrahydrobiopterin defi-
ciencies. http://www.unizh.ch
NORD. The NORD Resource Guide is an invaluable resource for families, health care
professionals, and libraries. http://www.stepstn.com
OMIM. The OMIM (Online Mendelian Inheritance in Man) database is a catalog of human
genes and genetic disorders written and edited by Dr. Victor A. McKusick and his col-
leagues. http://www3.ncbi.nlm.nih.gov
PATHWAY. PATHWAY, a database of inherited metabolic diseases, is divided into two
sections: substances and diseases. http://oxmedinfo.jr2.ox.ac.uk
PEDBASE. PEDBASE is a database of pediatric disorders. Entries are listed alphabetically
by disease or condition name. http://www.gretmar.com
RDB. The Rare Disease Database is a system for delivery of understandable medical in-
formation to the public, including patients, families, physicians, medical institutions, and
support organizations. http://www.rarediseases.org
84 Andreas Freier et al.

II Gene Regulation: From Sequence toNetworks

This page intentionally left blank
4 Specificity of Protein-DNA Interactions
Gary D. Stormo
Gene expression is often regulated transcriptionally through the action
of protein factors that bind to DNA and affect the rate of initiation of
the (usually) nearby promoter, either increasing it (activators) or de-
creasing it (repressors). In order for this process to be promoter-specific,
rather than affecting the expression of all genes, at least some of the
transcription factors must recognize and bind to specific DNA se-
quences. The purpose of this article is to define a quantitative measure
of specificity and describe various models to represent the specificity of
a particular protein that can be used to predict binding sites in genomic
DNA. It also briefly describes how those models can be used in pattern
recognition methods to identify regulatory sites from sets of coregu-
lated genes.
QUANTITATIVE SPECIFICITY
Consider a DNA-binding protein that binds to sites that are l-long.
There are 4 l such sequences, and we refer to each one as Si with
1a ia 4 l (i and l are integers). Each sequence binds to the protein with
some free energy, denoted by Hi. Of course that will depend on the
binding conditions, but for simplicity it is assumed there is some stan-
dard condition that is always used. (It is very interesting to study
changes in Hi as a function of the reaction conditions, but that issue is
not addressed in this article.) Figure 4.1a represents the list of all 4-long
sequences and the binding energy to each one for some hypothetical
protein. The energies are shown relative to a sequence with average
affinity, so that those with negative values are preferred and those with
positive values are discriminated against by the protein. In general we
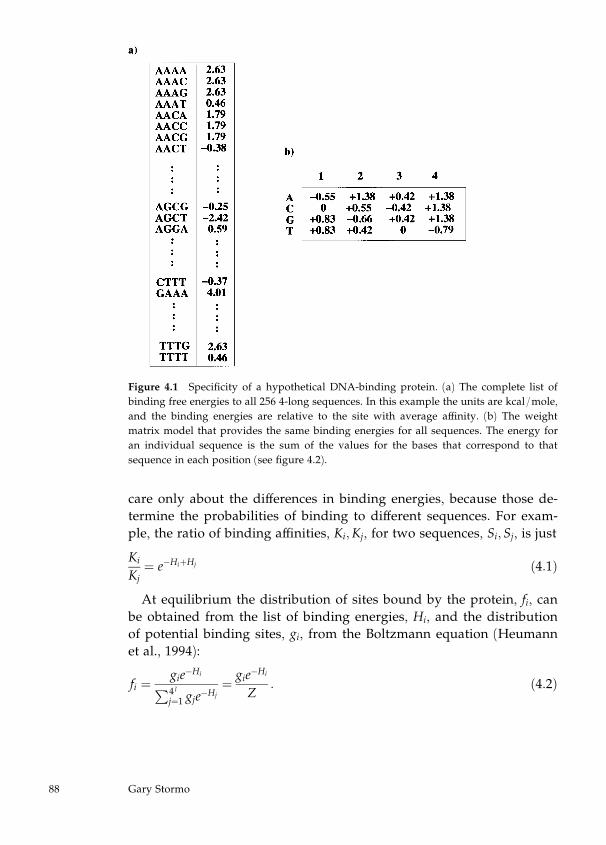
care only about the differences in binding energies, because those de-
termine the probabilities of binding to different sequences. For exam-
ple, the ratio of binding affinities, Ki;Kj, for two sequences, Si; Sj, is just
Ki
Kj¼ e�HiþHj ð4:1Þ
At equilibrium the distribution of sites bound by the protein, fi, can
be obtained from the list of binding energies, Hi, and the distribution
of potential binding sites, gi, from the Boltzmann equation (Heumann
et al., 1994):
fi ¼ gie�HiP4 l
j¼1 gje�Hj
¼ gie�Hi
Z: ð4:2Þ
Figure 4.1 Specificity of a hypothetical DNA-binding protein. (a) The complete list of
binding free energies to all 256 4-long sequences. In this example the units are kcal/mole,
and the binding energies are relative to the site with average affinity. (b) The weight
matrix model that provides the same binding energies for all sequences. The energy for
an individual sequence is the sum of the values for the bases that correspond to that
sequence in each position (see figure 4.2).
88 Gary Stormo
Z is the partition function and assures thatP
i fi ¼ 1. The temperature isnot included because it is assumed to be one of the conditions that is
held constant. gi is the number of occurrences of each sequence, Si, in
the set of possible binding sites. In vivo, gi would be the composition of
the genome in words of length l, or at least the composition of sites that
are available for binding to the protein. As stated above, it is only the
difference in binding energies that matters, because fi is unaffected by
replacing all values of Hi by Hi þ c.
One common choice for the baseline of energy is to set the energy for
the preferred sequence to 0, so that all other sequences have positive
energy (Berg and von Hippel, 1987). We often choose the average af-
finity as the baseline for the energy, such that Z ¼ G, the total number
of possible binding sites, which is the total number of available sites in
the genome when considering the in vivo situation. We can substitute
pi ¼ gi=G, where pi represents the probability of each sequence Si in the
set of possible binding sites.
Rearranging equation 4.2 provides a conceptually simple, but tech-
nically difficult, method to determine the binding energies of each
sequence:
Hi ¼ �ln fipi
ð4:3Þ
That is, you can imagine mixing all possible sequences together in
known amounts, pi, and then measuring the fraction of each sequence
bound to the protein at equilibrium, fi. The logarithms of those ratios
give exactly the energy values desired. Furthermore, at equilibrium the
average binding energy is simply
hHii ¼ �X
i
fi lnfipi; ð4:4Þ
which is the relative entropy, or Kullbach-Leibler distance, between the
two distributions of the potential binding sites and the bound sites. The
derivation of this simple, but useful, relationship has been achieved
through the use of the Boltzmann equation, but there is an equivalent
derivation using Bayes’s theorem for conditional probabilities (Heu-
mann et al., 1994).
89 Specificity of Protein-DNA Interactions
MODELS FOR SPECIFICITY
While in theory we could measure Hi for every sequence and simply
put the measurement into a lookup table to use whenever needed, as in
figure 4.1(a), the task is impractical for typical sizes of l. Instead, one
usually employs some sort of model that provides an estimate of Hi for
all sequences. The simplest model is to assume that the protein binds to
some set of sequences (perhaps only one) and not at all (or at least very
much worse) to any other sequence. If it binds equally well to all of its
binding sites, each site gets some energy x, and every other sequence
has energy þy (or some large increase over the energy of the sites). For
example, the specificity shown in figure 4.1a could be modeled as
a negative free energy for the preferred sequence, AGCT, and a large
positive value for all other sequences, using the assumption that only
AGCT shows significant binding to the protein. Such an assumption
might be valid for some proteins, such as restriction and modification
enzymes that are extremely sequence-specific in their activities. How-
ever, most regulatory proteins are much less specific and show signifi-
cant binding to sequences other than their preferred sites. The model
could be modified to allow for binding to sequences similar to AGCT,
perhaps those sequences with one mismatch (there are 12 such se-
quences). Any method that searches for binding sites using a consensus
sequence, even allowing for some number of mismatches, implicitly
assumes such a model for binding energies.
The next, more complicated model employs a ‘‘weight matrix’’
Hðb;mÞ that contains an energy for each base, b A fA;C;G;Tg, at eachposition, 1ama l, in the site (Stormo, 1990, 2000). Figure 4.1b shows
such a model for the hypothetical protein. The binding energy to any
sequence is Hi ¼ Hðb;mÞ � Si. In this notation Si is a matrix with 1 for the
base that occurs at each position and 0 elsewhere, so the dot product
selects the energies that correspond to the sequence, as shown in figure
4.2. The main advantage of weight matrix methods over consensus se-
quence methods is that they allow different mismatches from the pre-
ferred sequence to have different effects on the binding site predictions.
For the protein in figure 4.1, mismatches to the T at position 4 would
have dramatic effects on binding, whereas all other mismatches would
have smaller effects. In fact, many double mismatches and even the tri-
ply mismatched sequence CTTT bind with higher affinity than a single
90 Gary Stormo
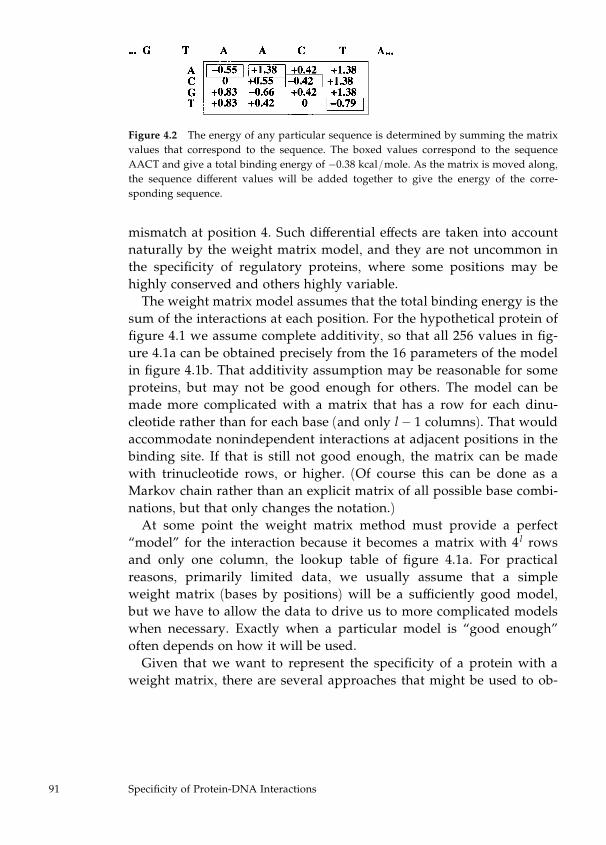
mismatch at position 4. Such differential effects are taken into account
naturally by the weight matrix model, and they are not uncommon in
the specificity of regulatory proteins, where some positions may be
highly conserved and others highly variable.
The weight matrix model assumes that the total binding energy is the
sum of the interactions at each position. For the hypothetical protein of
figure 4.1 we assume complete additivity, so that all 256 values in fig-
ure 4.1a can be obtained precisely from the 16 parameters of the model
in figure 4.1b. That additivity assumption may be reasonable for some
proteins, but may not be good enough for others. The model can be
made more complicated with a matrix that has a row for each dinu-
cleotide rather than for each base (and only l � 1 columns). That wouldaccommodate nonindependent interactions at adjacent positions in the
binding site. If that is still not good enough, the matrix can be made
with trinucleotide rows, or higher. (Of course this can be done as a
Markov chain rather than an explicit matrix of all possible base combi-
nations, but that only changes the notation.)
At some point the weight matrix method must provide a perfect
‘‘model’’ for the interaction because it becomes a matrix with 4 l rows
and only one column, the lookup table of figure 4.1a. For practical
reasons, primarily limited data, we usually assume that a simple
weight matrix (bases by positions) will be a sufficiently good model,
but we have to allow the data to drive us to more complicated models
when necessary. Exactly when a particular model is ‘‘good enough’’
often depends on how it will be used.
Given that we want to represent the specificity of a protein with a
weight matrix, there are several approaches that might be used to ob-
Figure 4.2 The energy of any particular sequence is determined by summing the matrix
values that correspond to the sequence. The boxed values correspond to the sequence
AACT and give a total binding energy of �0.38 kcal/mole. As the matrix is moved along,the sequence different values will be added together to give the energy of the corre-
sponding sequence.
91 Specificity of Protein-DNA Interactions
tain one. Since the weight matrix has only 4l parameters (and since we
care only about the differences in each column, just 3l degrees of free-
dom), one might simply measure the change in binding energy to all
single base changes from the preferred sequence (Sarai and Takeda,
1989; Takeda et al., 1989; Fields et al., 1997). Alternatively, given a col-
lection of sequences with known binding energy, one could find the
matrix that provides the best fit to that quantitative data (Stormo et al.,
1986; Barrick et al., 1994). This latter approach has the advantage of
indicating whether the weight matrix provides a sufficiently good
model of the interaction. If not, even the best fit will be fairly poor and
more complicated models will be necessary (Stormo et al., 1986).
Probably the easiest and most common method is to collect a set of
known binding sites and develop the matrix from a statistical analysis
of those sites. The known sites may be naturally occurring or they may
be selected from a random pool (Schneider et al., 1986; Fields et al.,
1997). Because we assume a binding energy model of the form Hðb;mÞ,we can treat the positions independently and convert the aligned col-
lection of known sites into a frequency matrix Fðb;mÞ that counts thefraction of each base at each position in the aligned sites, as in figure
4.3. If we make the further assumption that the probability of a se-
quence, pi, is determined by its composition, and each base b has prob-
ability PðbÞ, then the best estimate of the energy matrix is
Hðb;mÞ ¼ �ln Fðb;mÞPðbÞ : ð4:5Þ
This method of estimating the binding energy for a protein based
on a collection of known sequences originated with Staden (1984), ex-
cept that he set PðbÞ ¼ 1. Schneider (1997) uses the same form with
PðbÞ ¼ 0:25. Berg and von Hippel (1987) substituted maxb Fðb;mÞ forPðbÞ at each position m, so that the most common base is assigned en-
ergy 0 and all other bases get positive energy.
All of these approaches are equivalent if the PðbÞ are all approxi-mately equal, but can be inappropriate if they are not or if the pi are not
well approximated by their composition. It is easy to show that if the pi
are well approximated by the composition, then the formula of equa-
tion 4.5 provides the values of Hðb;mÞ that maximize the probability ofbinding to the known sites (Heumann et al., 1994). Then the average
binding energy to the known sites at equilibrium is
92 Gary Stormo
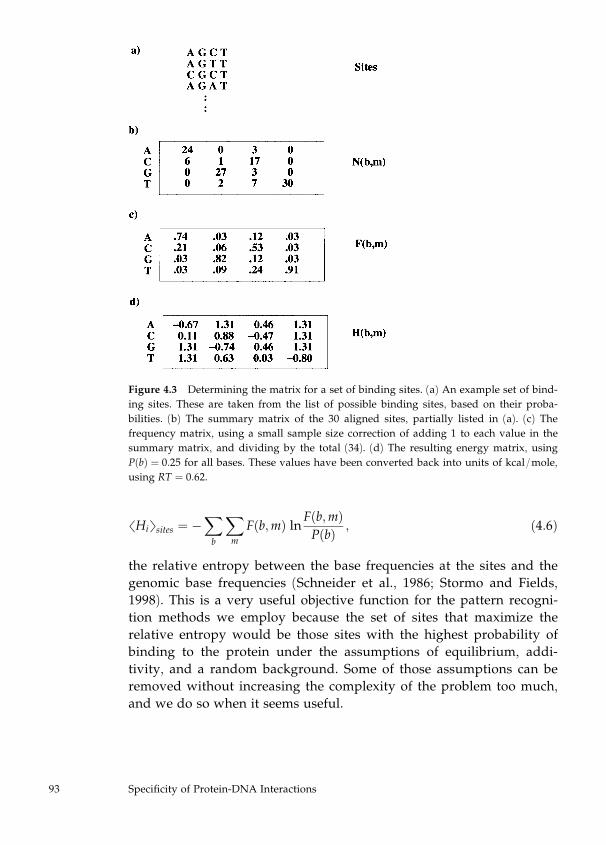
hHiisites ¼ �X
b
Xm
Fðb;mÞ ln Fðb;mÞPðbÞ ; ð4:6Þ
the relative entropy between the base frequencies at the sites and the
genomic base frequencies (Schneider et al., 1986; Stormo and Fields,
1998). This is a very useful objective function for the pattern recogni-
tion methods we employ because the set of sites that maximize the
relative entropy would be those sites with the highest probability of
binding to the protein under the assumptions of equilibrium, addi-
tivity, and a random background. Some of those assumptions can be
removed without increasing the complexity of the problem too much,
and we do so when it seems useful.
Figure 4.3 Determining the matrix for a set of binding sites. (a) An example set of bind-
ing sites. These are taken from the list of possible binding sites, based on their proba-
bilities. (b) The summary matrix of the 30 aligned sites, partially listed in (a). (c) The
frequency matrix, using a small sample size correction of adding 1 to each value in the
summary matrix, and dividing by the total (34). (d) The resulting energy matrix, using
PðbÞ ¼ 0:25 for all bases. These values have been converted back into units of kcal/mole,using RT ¼ 0:62.
93 Specificity of Protein-DNA Interactions
DISCOVERING BINDING SITES
The previous section described how we can represent the specificity of
a DNA-binding protein as a weight (or energy) matrix, and how we can
obtain the best estimate for that matrix, given a collection of known
sites. However, often the problem of interest is how to discover the
binding site pattern (energy matrix) for a transcription factor, given
only a collection of genes that are known to be regulated by it. For
example, an expression array experiment can indicate sets of genes
that apparently are coordinately regulated (Spellman et al., 1998), and
therefore may each have a binding site for a common transcription fac-
tor. We don’t know the energy matrix for the protein, or where the
binding sites are, except that they are most likely to be in the promoter
regions for the genes. The goal then is to find an energy matrix such
that each of the coregulated sequences has at least one high-probability
binding site.
Several approaches now exist to find such sites. There are word-
based methods that try to find overrepresented words in promoter
regions. This approach was first presented by Galas et al. (1985), has
been modified several times, and most recently has been used ef-
fectively on sets of coregulated yeast genes (van Helden et al., 1998;
Brazma et al., 1998). Although the algorithms don’t work this way, it
is possible to think of them as dividing all potential binding sites into
two classes, those that bind (with some energy x) and those that don’t
(energy þy). Their objective is to maximize the probability of bindingto the coregulated promoter regions, which will increase if they have
more of the words that bind to the protein.
These methods can take the background probabilities, pi, into ac-
count by comparing the frequencies of the words identified to their
frequencies in other promoters (van Helden et al., 1998). These methods
don’t really produce an accurate binding energy description, because
most proteins do not bind with ‘‘all or nothing’’ affinities. But they can
still be effective at identifying the regulatory sites, which can then be
analyzed in other ways. This is especially true if the binding sites are
relatively short and highly conserved. However, in general, matrix-
based methods tend to be more reliable because they can also identify
the short, highly conserved sites and can allow for more variability in
the sites.
94 Gary Stormo
There are four general methods, and several specific programs, for
identifying sites via weight matrix approaches: a greedy algorithm,
expectation-maximization (EM), a Gibbs’s sampling method, and a
network method for maximizing specificity. The goal in each case is
the same, so they often return the same solution. However, all of the
methods are heuristic and may not find the true maximum of their ob-
jective. Each algorithm attempts to maximize the objective in a different
way, and so may be susceptible to different local optima. It is usually
advisable to try multiple methods to see if consistent results are ob-
tained. Furthermore, there is usually a variety of parameters that can be
set which affect how the programs run, and exploring various parame-
ter values may be worthwhile.
Our CONSENSUS program is a greedy algorithm that builds up the
total alignment of sites by adding new ones at each iteration (Stormo
and Hartzell, 1989; Hertz et al., 1990; Hertz and Stormo, 1999). It is
somewhat similar to CLUSTAL (Higgins et al., 1996) in that it develops
the full multiple alignment of sites progressively, but has several im-
portant differences. First, it is specifically searching for ungapped local
alignments of length l. (The version WCONSENSUS does not require
the length to be specified, and will search for the optimum length dur-
ing the run.) Second, the program does not rely on a single best align-
ment at any step, but at each iteration keeps many (a user-defined
parameter, typically set to 1000 or more) potential multiple alignments
to be compared against the remaining sequences.
Third, the alignments are ranked by either their information content
or their p-values. Originally we ranked alignments based on their in-
formation content because of its relationship to the average binding
energy of the predicted sites. However, information content is always
nonnegative and, by itself, not directly related to the significance of an
alignment. But by taking into account the length and composition of
the promoter regions, as well as some other relevant parameters, it is
possible to compute the probability of finding by chance an alignment
with an information content above some value, which gives us the p-
value for each alignment (Hertz and Stormo, 1999). Ranking by p-value
allows direct comparison of the significance of alignments of different
lengths, different number of sites included, and even determination
of whether a particular pattern is symmetric or not. This last issue,
whether a binding site is a symmetric pattern, can indicate whether a
95 Specificity of Protein-DNA Interactions
regulatory protein binds as a homodimer, as is fairly common. Given
an alignment of sites that are intrinsically symmetric, it is always pos-
sible to obtain an asymmetric alignment with greater (or equal) in-
formation content, because each individual site has two ways to be
aligned. Only by considering the reduced number of degrees of free-
dom imposed by the symmetry of the pattern is its symmetry apparent.
Thus use of the p-value can provide improved estimates of the optimal
binding energy parameters.
The EM algorithm and the Gibbs’s sampling method are similar
overall, but have one important difference (Lawrence and Reilly, 1990;
Lawrence et al., 1993). Both are iterative algorithms that alternate be-
tween the two steps shown in figures 4.2 and 4.3. They usually start
with an arbitrary alignment of sites, but can also start with an arbitrary
matrix. Given a set of sites, a matrix is produced using the method in
figure 4.3. Then, using the matrix, the probability of the protein binding
to every site is determined from its predicted energy, as in figure 4.2.
This procedure is iterated and is guaranteed to converge in the case of
EM, and tends to higher values of information content with Gibbs’s
sampling.
The main difference is in how the sites from which the matrix is
made are chosen. In EM, every site contributes to the alignment but
is weighted by its probability. In Gibbs’s sampling, only one site is
selected in one sequence, using the matrix derived from the predicted
sites in the other sequences. The site chosen is based on its probability;
the higher the probability, the more likely it is to be chosen, but any site
may be chosen at each iteration. This stochastic aspect of the Gibbs’s
sampling procedure makes it able to escape from local optima, and
therefore it is more robust than EM. The objective used in the Gibbs’s
sampling method is identical to information content, using a small size
correction, as in figure 4.3 (see equations 1 and 2 in Lawrence et al.,
1993). The EM algorithm has been implemented in the MEME package
of programs (Bailey and Elkan, 1994; Grundy et al., 1996). Several newer
versions of Gibbs’s sampling algorithm exist (Spellman et al., 1998;
Roth et al., 1998; Wasserman et al., 2000).
Each of the weight matrix methods described thus far considers only
the promoters from the coregulated genes, although potential binding
sites from the rest of the genome influence the probability of those sites
being bound (equation 4.2). They assume that the rest of the genome
can be modeled as a random sequence with a given composition, PðbÞ.
96 Gary Stormo
However, for many sets of coregulated promoters this assumption can
be misleading. For example, yeast promoters often contain strings of
A/T-rich sequences that occur much more often than expected, even
given the A/T-rich genome. Such patterns clearly are statistically sig-
nificant, given the random genome assumption, but they are not spe-
cific to the set of coregulated genes. Rather, they are patterns that are
common in many promoters, and so cannot be the sought-after binding
sites responsible for the coregulation.
To address this issue we developed an alternative algorithm, imple-
mented in the program ANN-Spec (Heumann et al., 1994; Workman
and Stormo, 2000). It still uses a weight matrix model for the binding
energy, but it determines the partition function explicitly using the en-
tire genome, or at least all of the promoter regions for eukaryotic organ-
isms. It starts with an arbitrary matrix and then selects binding sites
from each sequence using Gibbs’s sampling approach. It also calculates
the partition function and then determines the gradient of the site
probabilities as a function of the weight matrix parameters. It follows
this gradient until convergence.
This method is still heuristic, but tends to work as well as the
other methods we’ve tried on both simulated sequences (Workman and
Stormo, 2000) and real promoters from yeast and other eukaryotes
(unpublished results). When the background is approximately random,
its objective function is the same as information content (Heumann
et al., 1994), so it should give the same results as the other methods. But
its advantage is that it specifically identifies patterns that are able to
distinguish the coregulated genes from other promoters, and therefore
does not find the A/T-rich patterns that the other methods might
(Workman and Stormo, 2000).
Of course there are other methods to avoid those common patterns in
postprocessing steps. The AlignACE version of Gibbs’s sampling algo-
rithm identifies many potentially significant patterns and then filters
out the uninteresting ones based on a variety of criteria, including the
frequencies of the pattern in the coregulated genes and the rest of the
genome (Hughes et al., 2000).
FUTURE DIRECTIONS
One of the limitations of the approaches described is that they tend
to view proteins binding independently of one another. It is easy to
97 Specificity of Protein-DNA Interactions
accommodate situations in which two or more proteins compete for
binding to mutually exclusive sites. More problematic are situations
where proteins bind cooperatively. It is known that eukaryotic pro-
moters are not usually regulated by the binding of a single transcrip-
tion factor, as often happens in prokaryotes. Rather, it is common for
multiple factors binding to multiple sites to be involved in regulating
transcription. Provided each protein shows sufficient specificity on its
own to be identified, the methods already described should be able to
find all of the binding sites, either simultaneously or through iterated
application of the program. But if the patterns themselves are signifi-
cant only through their joint occurrence, then alternative methods are
necessary that can specifically look for composite patterns that are sig-
nificant jointly, even if not individually. Once combinations of individ-
ual patterns that lead to specific regulatory responses are identified,
then the combinatorial network of gene regulation can be more fully
modeled.
There has been some work in the area of defining complete, multi-
component regulatory patterns (Frech et al., 1997; Hu et al., 2000; Liu et
al., 2001; GuhaThakurta and Stormo, 2001), but more work is needed.
Additional extensions would include knowledge of operon organiza-
tion and regulatory proteins, as well as transcriptome experiments.
ACKNOWLEDGMENT
The work described from my lab has been supported by NIH grant
HG00249.
REFERENCES
Bailey, T. L., and Elkan, C. P. (1994). Fitting a mixture model by expectation maximization
to discover motifs in biopolymers. Proc. Int. Conf. Intell. Sys. Mol. Biol. 2: 28–36.
Barrick, D., Villanueba, K., Childs, J., Kalil, R., Schneider, T. D., Lawrence, C. E., Gold, L.,
and Stormo, G. D. (1994). Quantitative analysis of ribosome binding sites in E. coli. Nucleic
Acids Res. 22: 1287–1295.
Berg, O. G., and von Hippel, P. H. (1987). Selection of DNA binding sites by regulatory
proteins. Statistical-mechanical theory and application to operators and promoters. J. Mol.
Biol. 193: 723–750.
Brazma, A., Jonassen, I., Vilo, J., and Ukkonen, E. (1998). Predicting gene regulatory ele-
ments in silico on a genomic scale. Genome Res. 8: 1202–1215.
98 Gary Stormo
Fields, D. S., Yi-yuan, H., Al-Uzri, A., and Stormo, G. D. (1997). Specificity of the Mnt
repressor determined by quantitative DNA sequencing. J. Mol. Biol. 271: 178–194.
Frech, K., Danescu-Mayer, J., and Werner, T. (1997). A novel method to develop highly
specific models for regulatory units detects a new LTR in GenBank which contains a
functional promoter. J. Mol. Biol. 270: 674–687.
Galas, D. J., Eggert, M., and Waterman, M. S. (1985). Rigorous pattern-recognition meth-
ods for DNA sequences. Analysis of promoter sequences from Escherichia coli. J. Mol. Biol.
186: 117–128.
Grundy, W. N., Bailey, T. L., and Elkan, C. P. (1996). ParaMEME: A parallel implementa-
tion and a web interface for a DNA and protein motif discovery tool. Comput. Appl. Biosci.
12: 303–310.
GuhaThakurta, D., and Stormo, G. D. (2001). Identifying target sites for cooperatively
binding factors. Bioinformatics 17: 608–621.
Hertz, G. Z., Hartzell, G. W. III, and Stormo, G. D. (1990). Identification of consensus
patterns in unaligned DNA sequences known to be functionally related. Comput. Appl.
Biosci. 6: 81–92.
Hertz, G. Z., and Stormo, G. D. (1999). Identifying DNA and protein patterns with statis-
tically significant alignments of multiple sequences. Bioinformatics 15: 563–577.
Heumann, J. M., Lapedes, A. S., and Stormo, G. D. (1994). Neural networks for deter-
mining protein specificity and multiple alignment of binding sites. Intell. Sys. Mol. Biol. 2:
188–194.
Higgins, D. G., Thompson, J. D., and Gibson, T. J. (1996). Using CLUSTAL for multiple
sequence alignments. Methods Enzymol. 266: 383–402.
Hu, Y.-J., Sandmeyer, S., McLaughlin, C., and Kibler, D. (2000). Combinatorial motif
analysis and hypothesis generation on a genomic scale. Bioinformatics 16: 222–232.
Hughes, J. D., Estep, P. W., Tavazoie, S., and Church, G. M. (2000). Computational iden-
tification of cis-regulatory elements associated with groups of functionally related genes
in Saccharomyces cerevisiae. J. Mol. Biol. 296: 1205–1214.
Lawrence, C. E., Altschul, S. F., Boguski, M. S., Liu, J. S., Neuwald, A. F., and Wootton, J.
C. (1993). Detecting subtle sequence signals: A Gibbs sampling strategy for multiple
alignment. Science 262: 208–214.
Lawrence, C. E., and Reilly, A. A. (1990). An expectation maximization (EM) algorithm
for the identification and characterization of common sites in unaligned biopolymer
sequences. Proteins 7: 41–51.
Liu, X., Brutlag, D. L., and Liu, J. S. (2001). Bioprospector: Discovering conserved DNA
motifs in upstream regulatory regions of co-expressed genes. Pac. Symp. Biocomput. 6:
127–138.
Roth, F. P., Hughes, J. D., Estep, P. W., and Church, G. M. (1998). Finding DNA regula-
tory motifs within unaligned noncoding sequences clustered by whole-genome mRNA
quantitation. Nat. Biotechnol. 16: 939–945.
99 Specificity of Protein-DNA Interactions
Sarai, A., and Takeda, Y. (1989). Lambda repressor recognizes the approximately 2-fold
symmetric half-operator sequences asymmetrically. Proc. Natl. Acad. Sci. USA 86: 6513–
6517.
Schneider, T. D. (1997). Information content of individual genetic sequences. J. Theor. Biol.
189: 427–441.
Schneider, T. D., Stormo, G. D., Gold, L., and Ehrenfeucht, A. (1986). Information content
of binding sites on nucleotide sequences. J. Mol. Biol. 188: 415–431.
Spellman, P. T., Sherlock, G., Zhang, M. Q., Iyer, V. R., Anders, K., Eisen, M. B., Brown,
P. O., Botstein, D., and Futcher, B. (1998). Comprehensive identification of cell cycle-
regulated genes of the yeast Saccharomyces cerevisiae by microarray hybridization. Mol.
Biol. Cell 9: 3273–3297.
Staden, R. (1984). Computer methods to locate signals in nucleic acid sequences. Nucleic
Acids Res. 12: 505–519.
Stormo, G. D. (1990). Consensus patterns in DNA. Methods Enzymol. 183: 211–221.
Stormo, G. D. (2000). DNA binding sites: Representation and discovery. Bioinformatics 16:
16–23.
Stormo, G. D., and Fields, D. S. (1998). Specificity, free energy and information content in
protein-DNA interactions. Trends Biochem. Sci. 23: 109–113.
Stormo, G. D., and Hartzell, G. W. III. (1989). Identifying protein-binding sites from un-
aligned DNA fragments. Proc. Natl. Acad. Sci. USA 86: 1183–1187.
Stormo, G. D., Schneider, T. D., and Gold, L. (1986). Quantitative analysis of the relation-
ship between nucleotide sequence and functional activity. Nucleic Acids Res. 14: 6661–6679.
Takeda, Y., Sarai, A., and Rivera, V. M. (1989). Analysis of the sequence-specific inter-
actions between Cro repressor and operator DNA by systematic base substitution experi-
ments. Proc. Natl. Acad. Sci. USA 86: 439–443.
van Helden, J., Andre, B., and Collado-Vides, J. (1998). Extracting regulatory sites from
the upstream region of yeast genes by computational analysis of oligonucleotide fre-
quencies. J. Mol. Biol. 281: 827–842.
Wasserman, W. W., Palumbo, M., Thompson, W., Fickett, J. W., and Lawrence, C. E.
(2000). Human-mouse genome comparisons to locate regulatory sites. Nat. Genetics 26:
225–228.
Workman, C. T., and Stormo, G. D. (2000). ANN-Spec: A method for discovering tran-
scription factor binding sites with improved specificity. Pac. Symp. Biocomput. 5: 464–475.
SUGGESTED READING
Ptashne, M. (1986). A Genetic Switch. 2nd ed. Palo Alto, Calif.: Cell Press Blackwell Scien-
tific Publications. Highlights the importance of multiple proteins competing for the same
binding sites and the contribution of cooperative binding to regulation.
100 Gary Stormo
Stormo, G. D. (1991). Probing the information content of DNA binding sites. Methods
Enzymol. 208: 458–468. Connects experimental methods for determining specificity with
computational models and analyses.
Von Hippel, P. H. (1979). On the molecular bases of the specificity of interaction of tran-
scriptional proteins with genome DNA. In Biological Regulation and Development, vol. 1. R.
F. Goldberger (ed.). New York: Plenum, pp. 279–347. A great introduction to protein-
DNA specificity and the information necessary in regulatory systems.
URLs FOR RELEVANT SITES
AlignACE. http://atlas.med.harvard.edu/cgi-bin/alignace.pl
CONSENSUS. http://ural.wustl.edu/consensus
Gibbs’s sampler. http://bayesweb.wadsworth.org/gibbs/gibbs.html
MEME. http://meme.sdsc.edu/meme/website
101 Specificity of Protein-DNA Interactions

This page intentionally left blank
5 Genomics of Gene Regulation: The Viewfrom Escherichia coli
Julio Collado-Vides, Gabriel Moreno-Hagelsieb,
Ernesto Perez-Rueda, Heladia Salgado, Araceli M.
Huerta, Rosa Marıa Gutierrez, David A.
Rosenblueth, Andres Christen, Esperanza Benıtez-
Bellon, Arturo Medrano-Soto, Socorro Gama-
Castro, Alberto Santos-Zavaleta, Cesar Bonavides-
Martınez, Edgar Dıaz-Peredo, Fabiola Sanchez-
Solano, and Dulce Marıa Millan
The first genome sequence from a free-living organism was completed
in 1995. We do not know yet which will be the first genome to be com-
pletely deciphered, but Escherichia coli is a natural candidate for such a
feat. Certainly E. coli has been the most studied cell since the early days
of molecular biology. Fred Neidhardt, a well-known microbiologist,
said once that every biologist knows about at least two cells: the one he
is studying and working with, and—even if he is not aware of it—E.
coli. Nonetheless, there is a large amount of information still missing
about the genome of E. coli. For instance, currently there is functional
information for about half of its 4290 genes. While we know the tran-
scription unit (TU) organization of a third of such genes (around 1400
genes), only about 600 promoters have been experimentally mapped.
Despite being incomplete, the information gathered on E. coli, in a
sense, offers a benchmark for computational biology. Consider the an-
notation process of a new genome. This process consists in associating
the known and predicted biological properties of segments of DNA,
and their products, in the case of genes, with the corresponding region
in the genomic sequence. A first step is guessing genes by methods that
take into account the statistics of small oligonucleotide distributions
based on an initial set of genes. This ‘‘seed’’ is either a group of experi-
mentally known genes or a set of large ORFs (open reading frame, a
continuous region of DNA coding for a protein or a fraction of it) found
in the genome that by some evidence are likely to be genes.
Typically the seed is obtained by the use of a computer program de-
signed to translate the whole DNA sequence into all possible proteins,
then compare them against the database or repository of experimen-
tally known or predicted protein products (see chapter 2). It is here
that E. coli contributes a large number of experimentally characterized
genes and gene products. This chapter shows that in bioinformatics the
knowledge accumulated on E. coli extends to other goals in the in silico
description of the biology of gene regulation.
As a result of an initial review of transcriptional regulation in E.
coli (Collado-Vides et al., 1991), our laboratory has for years been
gathering data from the literature and organizing it into a database,
RegulonDB (for a detailed description of this database, see Salgado
et al., 2001). A relational structure supports its availability on the Web
(see http:/www.cifn.unam.mx/Computational_Genomics/regulondb/). RegulonDB contains information on transcription initi-ation as well as operon organization in E. coli K-12. Thus, the infor-
mation it contains can be mapped with its precise coordinate in the
chromosome. Table 5.1 summarizes the current contents of the data-
base.
Using the information gathered in RegulonDB, we have implemented
several methods to enlarge the known cases and complement them
with computational predictions. In this way a complete description of
genes in TUs and their associated regulatory elements can be proposed.
In this chapter we illustrate how this information can be used in the
analysis of global gene expression profiles in E. coli grown in different
conditions. This implies generating predictions of steady states of a
given regulatory network structure. Furthermore, some methods are
illustrated that use the experimentally determined transcriptome pro-
files to generate predictions of the structure of the network. Certainly,
we do not yet know all of the interacting molecules defining the net-
work and its dynamics. Finally, we discuss how these methods can be
extended to analyze other microbial genomes.
In the first part of this chapter we describe the methods used to pre-
dict the structure of the regulatory network using sequence infor-
mation. We also discuss the use of Bayesian methods to enrich some
of these predictions. Next we give some examples of the use of the
104 Julio Collado-Vides et al.
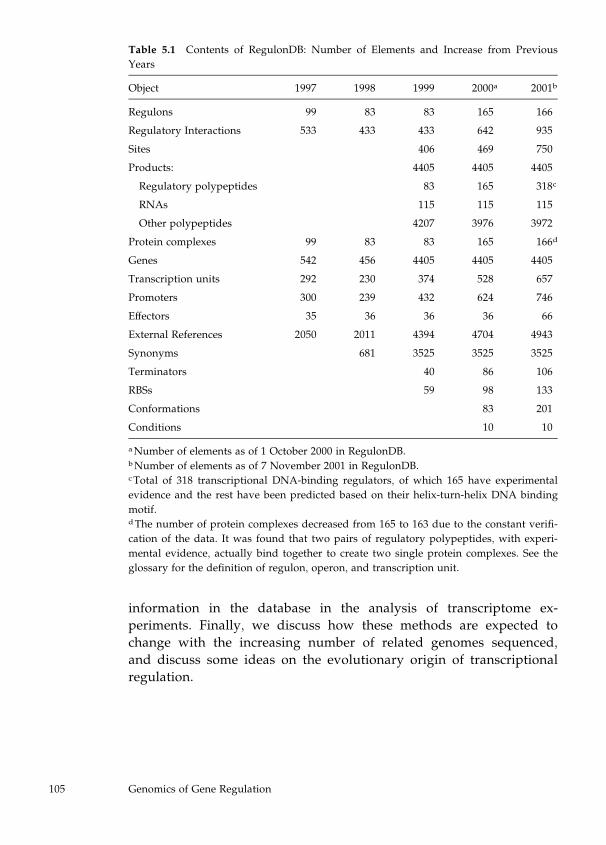
information in the database in the analysis of transcriptome ex-
periments. Finally, we discuss how these methods are expected to
change with the increasing number of related genomes sequenced,
and discuss some ideas on the evolutionary origin of transcriptional
regulation.
Table 5.1 Contents of RegulonDB: Number of Elements and Increase from Previous
Years
Object 1997 1998 1999 2000a 2001b
Regulons 99 83 83 165 166
Regulatory Interactions 533 433 433 642 935
Sites 406 469 750
Products: 4405 4405 4405
Regulatory polypeptides 83 165 318c
RNAs 115 115 115
Other polypeptides 4207 3976 3972
Protein complexes 99 83 83 165 166d
Genes 542 456 4405 4405 4405
Transcription units 292 230 374 528 657
Promoters 300 239 432 624 746
Effectors 35 36 36 36 66
External References 2050 2011 4394 4704 4943
Synonyms 681 3525 3525 3525
Terminators 40 86 106
RBSs 59 98 133
Conformations 83 201
Conditions 10 10
aNumber of elements as of 1 October 2000 in RegulonDB.bNumber of elements as of 7 November 2001 in RegulonDB.cTotal of 318 transcriptional DNA-binding regulators, of which 165 have experimental
evidence and the rest have been predicted based on their helix-turn-helix DNA binding
motif.dThe number of protein complexes decreased from 165 to 163 due to the constant verifi-
cation of the data. It was found that two pairs of regulatory polypeptides, with experi-
mental evidence, actually bind together to create two single protein complexes. See the
glossary for the definition of regulon, operon, and transcription unit.
105 Genomics of Gene Regulation
METHODS FOR COMPUTING GENOMIC ELEMENTS OF GENE
REGULATION
Regulatory Signals: Promoters and Regulatory Binding Sites
Transcriptional regulatory proteins affect the binding of the RNA pol-
ymerase (RNAP) to the promoter, that is, the binding sites of RNAP
located upstream of genes. By means of various mechanisms, regula-
tory proteins can alter any step in the transition involving the binding
and the subsequent steps leading to the initiation of a stable elongation
complex. Once the RNAP binds to the DNA, it undergoes conforma-
tional changes from the so-called closed complex to a conformation that
separates the DNA strands into an open complex. Transcription of the
first two to seven nucleotides initiates, in a process that can be aborted,
causing the unbinding of RNAP from the DNA and the liberation of
short oligonucleotides. If transcription continues, RNAP forms a stable
elongation complex that will proceed to termination of an mRNA tran-
script containing one or several genes (for a detailed review of this pro-
cess, see Mooney et al., 1998).
The amount of mRNA produced depends on the regulation of all
possible biochemical transitions involved in the complete process
(Gralla, 1990). We limit the discussion here to the regulation at the level
of transcription initiation, which depends on both intrinsic factors—
strength of RNAP binding to the promoter, speed of transcription ini-
tiation—and extrinsic factors. The latter basically consist of regulatory
proteins that bind to DNA around the promoter region and either fa-
cilitate or prevent transcription initiation.
Transcription initiation is highly specific. The RNAP holoenzyme
(RNAP core plus a sigma factor) recognizes the precise site of tran-
scription initiation. In the absence of the sigma factor, the RNAP binds
to DNA in a much less specific manner. While molecules are capable of
such exact recognition, the challenge is to generate mathematical and
computational methods that can mimic this high resolution of recogni-
tion. We are far from anything similar. Computational methods to pre-
dict promoters and other protein-binding sites, such as operator sites,
are known to generate a high number of false positives. Although one
can solve this problem by limiting the search to a threshold equal to the
average score of known sites, or to the average of such scores minus
106 Julio Collado-Vides et al.
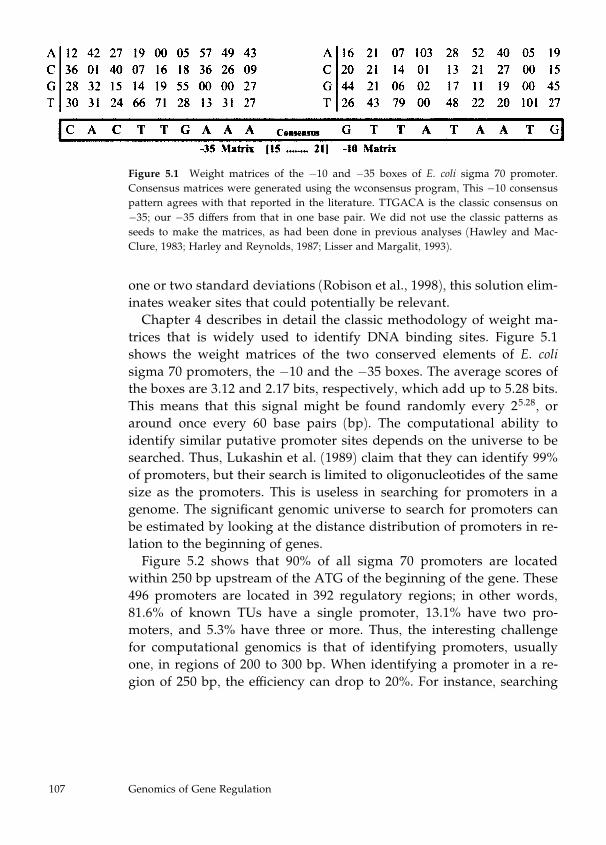
one or two standard deviations (Robison et al., 1998), this solution elim-
inates weaker sites that could potentially be relevant.
Chapter 4 describes in detail the classic methodology of weight ma-
trices that is widely used to identify DNA binding sites. Figure 5.1
shows the weight matrices of the two conserved elements of E. coli
sigma 70 promoters, the �10 and the �35 boxes. The average scores ofthe boxes are 3.12 and 2.17 bits, respectively, which add up to 5.28 bits.
This means that this signal might be found randomly every 25:28, or
around once every 60 base pairs (bp). The computational ability to
identify similar putative promoter sites depends on the universe to be
searched. Thus, Lukashin et al. (1989) claim that they can identify 99%
of promoters, but their search is limited to oligonucleotides of the same
size as the promoters. This is useless in searching for promoters in a
genome. The significant genomic universe to search for promoters can
be estimated by looking at the distance distribution of promoters in re-
lation to the beginning of genes.
Figure 5.2 shows that 90% of all sigma 70 promoters are located
within 250 bp upstream of the ATG of the beginning of the gene. These
496 promoters are located in 392 regulatory regions; in other words,
81.6% of known TUs have a single promoter, 13.1% have two pro-
moters, and 5.3% have three or more. Thus, the interesting challenge
for computational genomics is that of identifying promoters, usually
one, in regions of 200 to 300 bp. When identifying a promoter in a re-
gion of 250 bp, the efficiency can drop to 20%. For instance, searching
Figure 5.1 Weight matrices of the �10 and �35 boxes of E. coli sigma 70 promoter.
Consensus matrices were generated using the wconsensus program, This �10 consensuspattern agrees with that reported in the literature. TTGACA is the classic consensus on
�35; our �35 differs from that in one base pair. We did not use the classic patterns as
seeds to make the matrices, as had been done in previous analyses (Hawley and Mac-
Clure, 1983; Harley and Reynolds, 1987; Lisser and Margalit, 1993).
107 Genomics of Gene Regulation
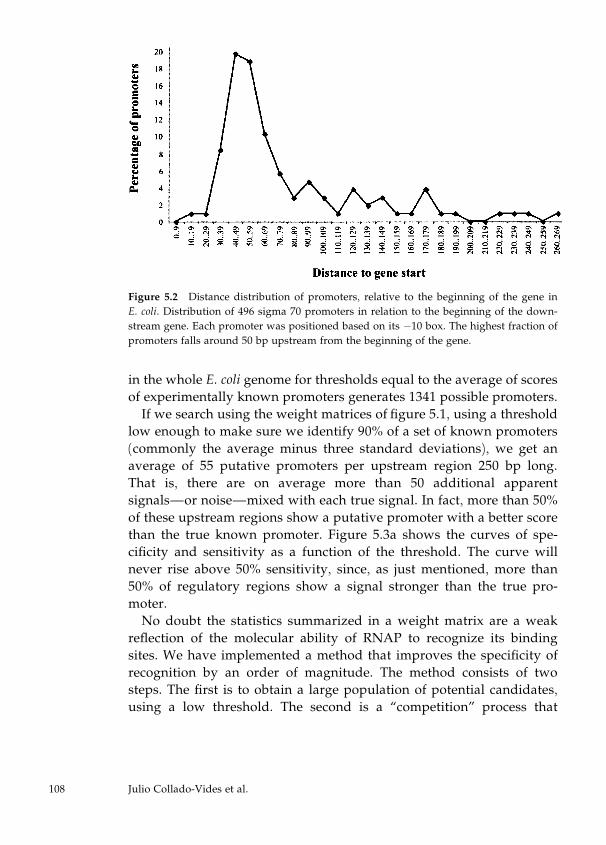
in the whole E. coli genome for thresholds equal to the average of scores
of experimentally known promoters generates 1341 possible promoters.
If we search using the weight matrices of figure 5.1, using a threshold
low enough to make sure we identify 90% of a set of known promoters
(commonly the average minus three standard deviations), we get an
average of 55 putative promoters per upstream region 250 bp long.
That is, there are on average more than 50 additional apparent
signals—or noise—mixed with each true signal. In fact, more than 50%
of these upstream regions show a putative promoter with a better score
than the true known promoter. Figure 5.3a shows the curves of spe-
cificity and sensitivity as a function of the threshold. The curve will
never rise above 50% sensitivity, since, as just mentioned, more than
50% of regulatory regions show a signal stronger than the true pro-
moter.
No doubt the statistics summarized in a weight matrix are a weak
reflection of the molecular ability of RNAP to recognize its binding
sites. We have implemented a method that improves the specificity of
recognition by an order of magnitude. The method consists of two
steps. The first is to obtain a large population of potential candidates,
using a low threshold. The second is a ‘‘competition’’ process that
Figure 5.2 Distance distribution of promoters, relative to the beginning of the gene in
E. coli. Distribution of 496 sigma 70 promoters in relation to the beginning of the down-
stream gene. Each promoter was positioned based on its �10 box. The highest fraction ofpromoters falls around 50 bp upstream from the beginning of the gene.
108 Julio Collado-Vides et al.
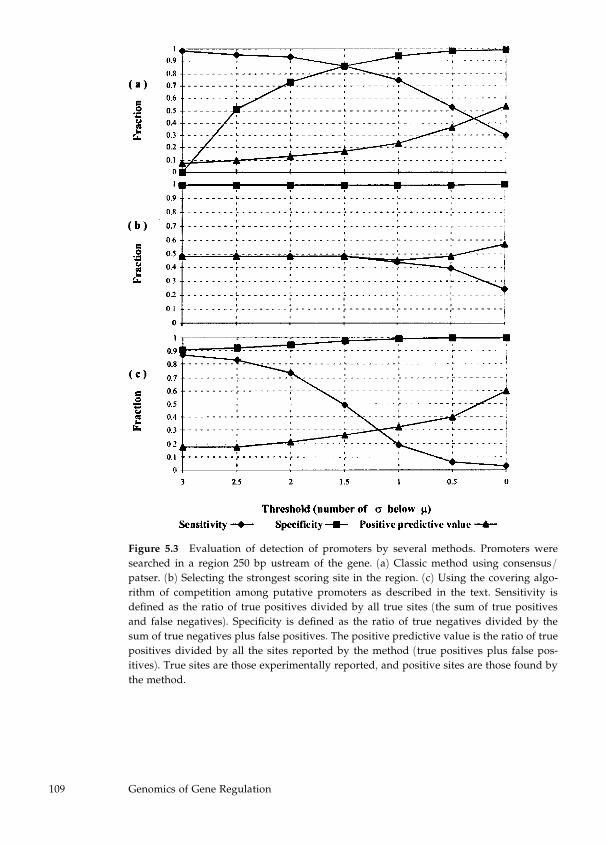
Figure 5.3 Evaluation of detection of promoters by several methods. Promoters were
searched in a region 250 bp ustream of the gene. (a) Classic method using consensus/
patser. (b) Selecting the strongest scoring site in the region. (c) Using the covering algo-
rithm of competition among putative promoters as described in the text. Sensitivity is
defined as the ratio of true positives divided by all true sites (the sum of true positives
and false negatives). Specificity is defined as the ratio of true negatives divided by the
sum of true negatives plus false positives. The positive predictive value is the ratio of true
positives divided by all the sites reported by the method (true positives plus false pos-
itives). True sites are those experimentally reported, and positive sites are those found by
the method.
109 Genomics of Gene Regulation
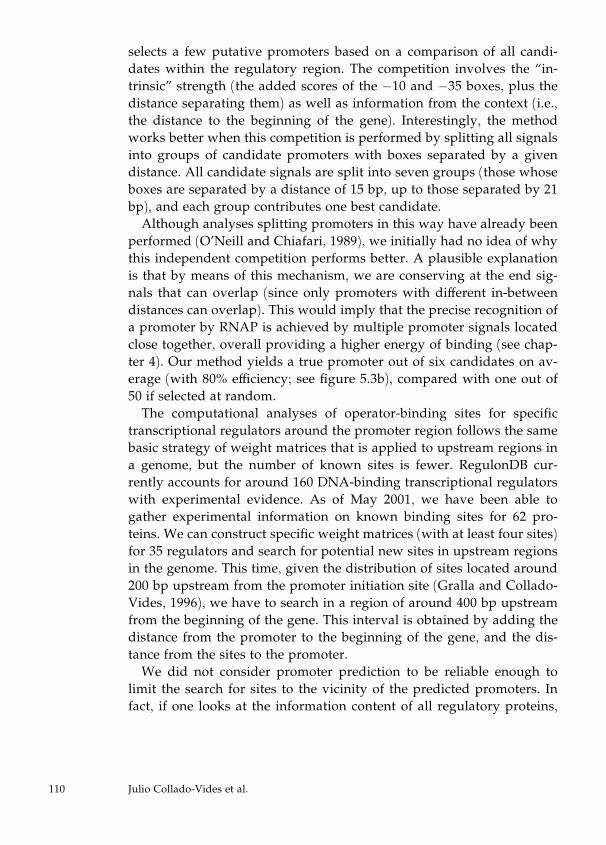
selects a few putative promoters based on a comparison of all candi-
dates within the regulatory region. The competition involves the ‘‘in-
trinsic’’ strength (the added scores of the �10 and �35 boxes, plus thedistance separating them) as well as information from the context (i.e.,
the distance to the beginning of the gene). Interestingly, the method
works better when this competition is performed by splitting all signals
into groups of candidate promoters with boxes separated by a given
distance. All candidate signals are split into seven groups (those whose
boxes are separated by a distance of 15 bp, up to those separated by 21
bp), and each group contributes one best candidate.
Although analyses splitting promoters in this way have already been
performed (O’Neill and Chiafari, 1989), we initially had no idea of why
this independent competition performs better. A plausible explanation
is that by means of this mechanism, we are conserving at the end sig-
nals that can overlap (since only promoters with different in-between
distances can overlap). This would imply that the precise recognition of
a promoter by RNAP is achieved by multiple promoter signals located
close together, overall providing a higher energy of binding (see chap-
ter 4). Our method yields a true promoter out of six candidates on av-
erage (with 80% efficiency; see figure 5.3b), compared with one out of
50 if selected at random.
The computational analyses of operator-binding sites for specific
transcriptional regulators around the promoter region follows the same
basic strategy of weight matrices that is applied to upstream regions in
a genome, but the number of known sites is fewer. RegulonDB cur-
rently accounts for around 160 DNA-binding transcriptional regulators
with experimental evidence. As of May 2001, we have been able to
gather experimental information on known binding sites for 62 pro-
teins. We can construct specific weight matrices (with at least four sites)
for 35 regulators and search for potential new sites in upstream regions
in the genome. This time, given the distribution of sites located around
200 bp upstream from the promoter initiation site (Gralla and Collado-
Vides, 1996), we have to search in a region of around 400 bp upstream
from the beginning of the gene. This interval is obtained by adding the
distance from the promoter to the beginning of the gene, and the dis-
tance from the sites to the promoter.
We did not consider promoter prediction to be reliable enough to
limit the search for sites to the vicinity of the predicted promoters. In
fact, if one looks at the information content of all regulatory proteins,
110 Julio Collado-Vides et al.
the gradient goes from around 6 to 28 bits (figure 5.4). This indicates
that the promoter site (�35 plus �10), with around six bits, is on thelower range of information content, compared with sites for transcrip-
tional regulators. Assuming that this information content reflects the
energy of binding, and therefore the equilibrium constant of the asso-
ciation between the protein and the DNA sites, it would make sense to
see a lower constant for RNAP, given the greater abundance of RNAP
compared with that of specific regulators (Robison et al., 1998).
Searching in the set of upstream regions of all genes in the genome, we
find more than 44,000 putative CRP sites, whereas for LexA we find
Figure 5.4 Information content of weight matrices for specific regulators in RegulonDB.
The information content was obtained using consensus with the reported binding sites of
35 regulatory proteins. The values were adjusted against the sample size. For instance,
two of the matrices obtained had less than 6 bits of information, and only one, corre-
sponding to ArcA, has 30 bits of information.
111 Genomics of Gene Regulation
only 160 sites (Thieffry, Salgado, et al., 1998). These numbers illustrate
the problem of high false positives or poor specificity in the search for
operator sites for transcriptional regulators. Furthermore, as mentioned
before, we have sites for only around one sixth of all transcriptional
regulators. A way to considerably diminish the false positives is by
restricting the predicted sites to those located at positions relative to the
beginning of transcription similar to positions of known sites. This can
be achieved by detailed analysis of the combination of sites into mod-
ules or ‘‘phrases’’ (Rosenblueth et al., 1996; Frech et al., 1997).
So far we have focused on methods that deal with sensors that are
built from a set of known binding sites for a given protein. The avail-
ability of transcriptome data has motivated the implementation of dif-
ferent types of methods aimed at identifying common motifs in sets of
regulatory regions of genes observed to be coexpressed (Goffeau, 1998).
Although programs in this direction were implemented years ago
(Waterman et al., 1984; Stormo, 1990), the recent boom of transcriptome
and chip methodologies has motivated new methodologies such as
Gibbs sampling (Lawrence et al., 1993) and others (see chapter 6). We
have implemented a method that searches exhaustively in all the space
of sequences, and identifies ‘‘words’’ or oligonucleotides up to seven
bases long that are overrepresented in a given family of upstream re-
gions (van Helden et al., 1998). Its performance has been similar to
several other methods when analyzing a set of coexpressed genes in
yeast. Later, a variation of this basic idea was implemented that allows
for the search for words with internal symmetry, with direct or inverted
repeats, or palindromes. This program is called dyad-detector (van
Helden et al., 2000).
More recently we have tested the performance of dyad-detector
against sets of coregulated genes obtained from RegulonDB. An inter-
esting observation in the first results enabled us to develop a strategy
that improves the accuracy of the method in detecting genes regulated
by a given protein, and to identify the binding site. This method starts
with a family of upstream regions containing the set of binding sites
for the known or unknown protein (if the set comes from coexpressed
genes, for instance). We then use the dyad-detector to identify the
overrepresented words. Most of these significant words accumulate
near true binding sites (figure 5.5). Focusing on islands of overlapping
words or motifs offers an additional step to increase the specificity of
the method.
112 Julio Collado-Vides et al.
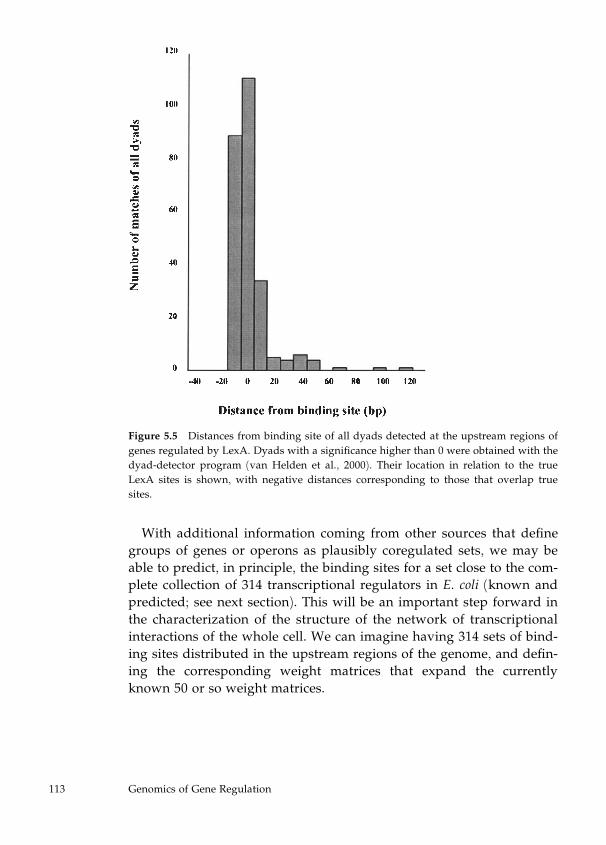
With additional information coming from other sources that define
groups of genes or operons as plausibly coregulated sets, we may be
able to predict, in principle, the binding sites for a set close to the com-
plete collection of 314 transcriptional regulators in E. coli (known and
predicted; see next section). This will be an important step forward in
the characterization of the structure of the network of transcriptional
interactions of the whole cell. We can imagine having 314 sets of bind-
ing sites distributed in the upstream regions of the genome, and defin-
ing the corresponding weight matrices that expand the currently
known 50 or so weight matrices.
Figure 5.5 Distances from binding site of all dyads detected at the upstream regions of
genes regulated by LexA. Dyads with a significance higher than 0 were obtained with the
dyad-detector program (van Helden et al., 2000). Their location in relation to the true
LexA sites is shown, with negative distances corresponding to those that overlap true
sites.
113 Genomics of Gene Regulation
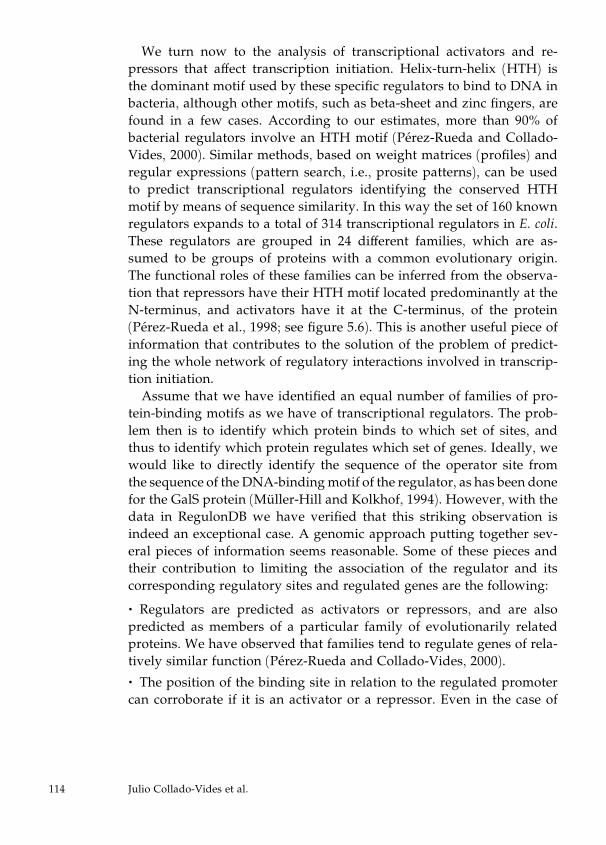
We turn now to the analysis of transcriptional activators and re-
pressors that affect transcription initiation. Helix-turn-helix (HTH) is
the dominant motif used by these specific regulators to bind to DNA in
bacteria, although other motifs, such as beta-sheet and zinc fingers, are
found in a few cases. According to our estimates, more than 90% of
bacterial regulators involve an HTH motif (Perez-Rueda and Collado-
Vides, 2000). Similar methods, based on weight matrices (profiles) and
regular expressions (pattern search, i.e., prosite patterns), can be used
to predict transcriptional regulators identifying the conserved HTH
motif by means of sequence similarity. In this way the set of 160 known
regulators expands to a total of 314 transcriptional regulators in E. coli.
These regulators are grouped in 24 different families, which are as-
sumed to be groups of proteins with a common evolutionary origin.
The functional roles of these families can be inferred from the observa-
tion that repressors have their HTH motif located predominantly at the
N-terminus, and activators have it at the C-terminus, of the protein
(Perez-Rueda et al., 1998; see figure 5.6). This is another useful piece of
information that contributes to the solution of the problem of predict-
ing the whole network of regulatory interactions involved in transcrip-
tion initiation.
Assume that we have identified an equal number of families of pro-
tein-binding motifs as we have of transcriptional regulators. The prob-
lem then is to identify which protein binds to which set of sites, and
thus to identify which protein regulates which set of genes. Ideally, we
would like to directly identify the sequence of the operator site from
the sequence of the DNA-binding motif of the regulator, as has been done
for the GalS protein (Muller-Hill and Kolkhof, 1994). However, with the
data in RegulonDB we have verified that this striking observation is
indeed an exceptional case. A genomic approach putting together sev-
eral pieces of information seems reasonable. Some of these pieces and
their contribution to limiting the association of the regulator and its
corresponding regulatory sites and regulated genes are the following:
. Regulators are predicted as activators or repressors, and are also
predicted as members of a particular family of evolutionarily related
proteins. We have observed that families tend to regulate genes of rela-
tively similar function (Perez-Rueda and Collado-Vides, 2000).
. The position of the binding site in relation to the regulated promotercan corroborate if it is an activator or a repressor. Even in the case of
114 Julio Collado-Vides et al.
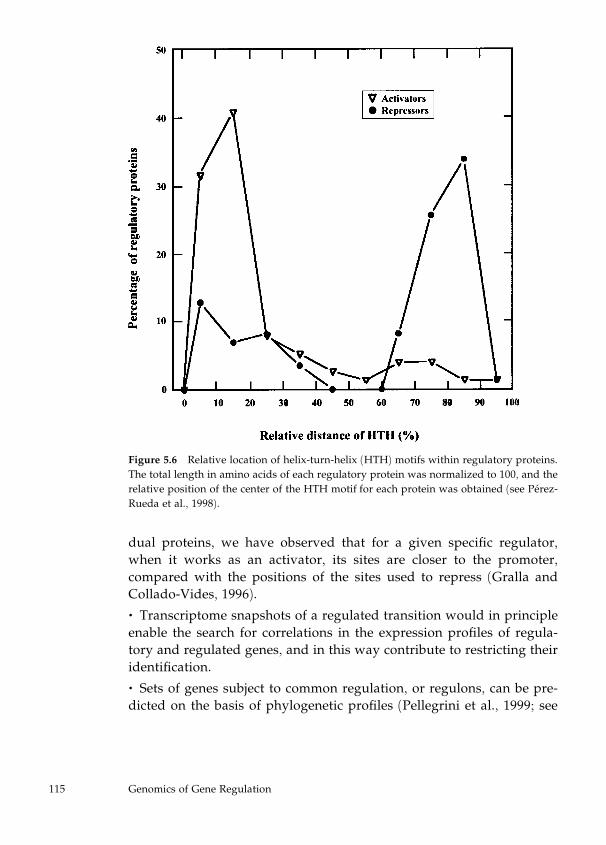
dual proteins, we have observed that for a given specific regulator,
when it works as an activator, its sites are closer to the promoter,
compared with the positions of the sites used to repress (Gralla and
Collado-Vides, 1996).
. Transcriptome snapshots of a regulated transition would in principleenable the search for correlations in the expression profiles of regula-
tory and regulated genes, and in this way contribute to restricting their
identification.
. Sets of genes subject to common regulation, or regulons, can be pre-dicted on the basis of phylogenetic profiles (Pellegrini et al., 1999; see
Figure 5.6 Relative location of helix-turn-helix (HTH) motifs within regulatory proteins.
The total length in amino acids of each regulatory protein was normalized to 100, and the
relative position of the center of the HTH motif for each protein was obtained (see Perez-
Rueda et al., 1998).
115 Genomics of Gene Regulation
also chapter 6), and on the basis of expanding the method of operon
prediction described below.
. We know that regulatory proteins are autoregulated in a good num-
ber of cases (Thieffry, Huerta, et al., 1998). Thus, finding a motif present
upstream of a regulatory protein gene would suggest that all genes
having similar sites are targets of the regulator.
A clustering approach can be implemented that uses all this informa-
tion and that is capable of grouping genes on the basis of both knowl-
edge from the database and data from transcriptome experiments. We
have implemented, and are currently evaluating, a clustering method
based on Bayesian statistics that is able to perform such tasks.
Operons
In bacteria, genes are clustered in monocistronic and polycistronic
(operons) TUs. The information available in RegulonDB for more than
400 TUs with experimental evidence enabled us to implement a method
that can predict operons. This method is based on the clearly different
distribution of intergenic distances of pairs of genes in the same operon,
as opposed to pairs at the boundaries of TUs. It also uses the conser-
vation of functional class of genes within an operon to predict operons
in the rest of the genome (Salgado et al., 2000).
The organization of all genes into TUs has motivated the definition of
the set of ‘‘minimal upstream regions’’ (MURs) of the genome as the set
of upstream regions of all TUs in the genome. This clustering simplifies
the problems of motif searching and of the architecture of the network
of interactions. Forty-two hundred genes and ORFs cluster in around
2600 TUs, and thus there are 2600 MURs.
We have shown that the set of TUs in a given regulon can be ex-
panded by the use of comparative genomics combined with evidence of
upstream regulatory motifs (Tan et al., 2001). In this example we show
that ‘‘orthologue TUs,’’ found in E. coli and Haemophilus influenzae, can
be added to a regulon if such TUs have a similar binding site. An ex-
pansion of this idea, as suggested by Galperin and Koonin (2000), takes
advantage of the high frequency of rearrangement of operons. It is
expected that such rearrangements of the gene elements of operons oc-
cur among related TUs (regulons). Starting with a set of genes known
to be part of a regulon in E. coli, one would need to find the orthologues
116 Julio Collado-Vides et al.
in other genomes. If such orthologues are associated in an operon with
another gene, and that gene is also present in E. coli, there would be a
chance that this gene is part of the same regulon. Some evidence that
the rearrangements occur among related operons has been published
(Lathe et al., 2000).
A complete analysis would need TU predictions, in different genomes,
to start with. We have expanded the method originally developed in E.
coli and have found evidence suggesting that it works well in any pro-
karyotic genome. It will be very interesting to extrapolate some of these
pieces of the puzzle of genomic regulation and apply them to different
bacterial genomes. Certainly the role of E. coli as an oasis of annota-
tions, compared with much less studied related microorganisms, must
be extrapolated further (see more about these predictions in the section
‘‘Comparative Genomics and Evolution of Gene Regulation’’).
TRANSCRIPTOME ANALYSES
All the accumulated experimental knowledge and computational pre-
dictions of gene clustering in operons and gene regulation provide val-
uable information for analyzing expression profiles from transcriptome
experiments in E. coli. The analysis of any given condition requires
the identification of the function of the set of affected—induced or
repressed—genes, the organization of such genes into operons, their
regulatory regions with promoters and regulatory sites; that is, the
gathering of all known information on such genes. There is also a need
to have at hand methods that can organize and manipulate the in-
formation. We have implemented interfaces that integrate outputs of
programs that search in RegulonDB and display integrated informa-
tion about the regulation of gene expression of a given set of genes
(see http://www.cifn.unam.mx/Computational_Genomics/GETools).Several interesting questions can be raised when comparing the data
that have accumulated through years of experimentation with data
obtained in a single transcriptome. One question is to evaluate and
understand howcongruent the observedprofile is towhatwe knowabout
the network of interactions. At a first, broad level of analysis, statistical
evaluations of such congruence can be obtained. Genes grouped in
operons tend to be subject to a common mechanism of regulation.
Thus, most of the time one would expect that under any growth con-
117 Genomics of Gene Regulation
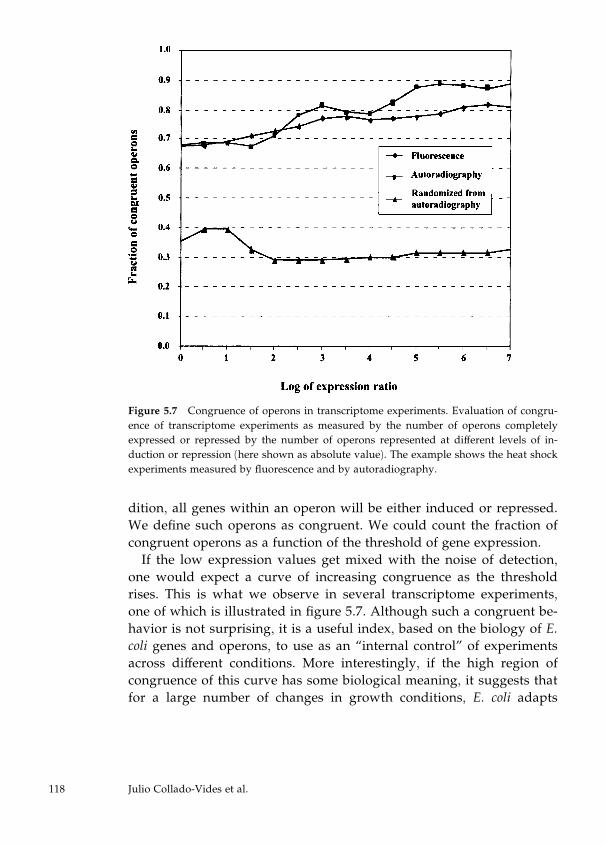
dition, all genes within an operon will be either induced or repressed.
We define such operons as congruent. We could count the fraction of
congruent operons as a function of the threshold of gene expression.
If the low expression values get mixed with the noise of detection,
one would expect a curve of increasing congruence as the threshold
rises. This is what we observe in several transcriptome experiments,
one of which is illustrated in figure 5.7. Although such a congruent be-
havior is not surprising, it is a useful index, based on the biology of E.
coli genes and operons, to use as an ‘‘internal control’’ of experiments
across different conditions. More interestingly, if the high region of
congruence of this curve has some biological meaning, it suggests that
for a large number of changes in growth conditions, E. coli adapts
Figure 5.7 Congruence of operons in transcriptome experiments. Evaluation of congru-
ence of transcriptome experiments as measured by the number of operons completely
expressed or repressed by the number of operons represented at different levels of in-
duction or repression (here shown as absolute value). The example shows the heat shock
experiments measured by fluorescence and by autoradiography.
118 Julio Collado-Vides et al.
through the regulation of an important number of genes, no fewer than
100 or 150. This clearly suggests mechanisms for concerted regulation
of a number of genes that is well beyond the average number of genes
in a single known regulon.
There is enough information to analyze the congruence of cell be-
havior in more detail and from a different perspective. Snapshots of the
expression flexibility of the cell are like photographs taken from a boat
at high speed—the picture can easily be blurred. The set of regulatory
interactions in a cell forms a network in which the level of expression of
one gene can easily affect that of others, either directly or indirectly. In
order to evaluate the congruence of genes within such networks, we
need to consider all known interactions. This type of analysis, at a
given moment in time, can be called ‘‘internal congruence’’ or ‘‘syn-
chronous congruence’’—as opposed to the analysis of a transition of
the cell when changing the conditions of growth.
We investigated whether groups of genes known to be precisely cor-
egulated (by one or several proteins, but exactly the same set) show
homogeneous patterns of expression in transcriptome data. We con-
centrated on the study of absolute levels of expression of E. coli grown
at 37 �C in minimal medium, since we have data from the experiment
performed four times. These experiments were performed in the labo-
ratory of Fred Blattner at the University of Wisconsin, Madison. Defin-
ing expression levels as either on or off, based on their absolute values,
we can identify subsets of coregulated genes that behave in a homoge-
neous way—either on or off. A binomial analysis with a priori proba-
bilities p and (1� p) for on and off, based on their frequency in the
complete set of genes in the experiments, shows the statistical signifi-
cance of these results. A set of genes coregulated by a single protein
and with a statistically significant behavior is shown in table 5.2. This
may not be the case for all coregulated groups. More elaborated
analyses will surely be required to deal with the flexible response of
regulons.
In order to perform similar analyses, this time comparing tran-
scriptome experiments on E. coli in different conditions, we need to
employ a computational machinery that will simulate direct and indi-
rect effects and their state transitions. In a way, the ideas presented
here are rather simple in terms of simulation of networks. The recent
literature addressing the analysis of transcriptome data and modeling
of regulatory networks is growing very fast. (See, for instance, the
119 Genomics of Gene Regulation
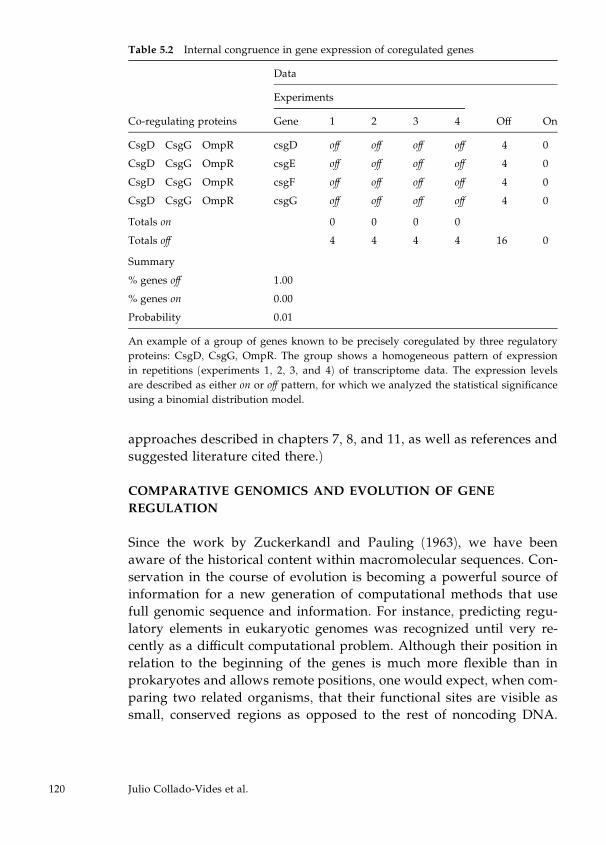
approaches described in chapters 7, 8, and 11, as well as references and
suggested literature cited there.)
COMPARATIVE GENOMICS AND EVOLUTION OF GENE
REGULATION
Since the work by Zuckerkandl and Pauling (1963), we have been
aware of the historical content within macromolecular sequences. Con-
servation in the course of evolution is becoming a powerful source of
information for a new generation of computational methods that use
full genomic sequence and information. For instance, predicting regu-
latory elements in eukaryotic genomes was recognized until very re-
cently as a difficult computational problem. Although their position in
relation to the beginning of the genes is much more flexible than in
prokaryotes and allows remote positions, one would expect, when com-
paring two related organisms, that their functional sites are visible as
small, conserved regions as opposed to the rest of noncoding DNA.
Table 5.2 Internal congruence in gene expression of coregulated genes
Data
Experiments
Co-regulating proteins Gene 1 2 3 4 Off On
CsgD CsgG OmpR csgD off off off off 4 0
CsgD CsgG OmpR csgE off off off off 4 0
CsgD CsgG OmpR csgF off off off off 4 0
CsgD CsgG OmpR csgG off off off off 4 0
Totals on 0 0 0 0
Totals off 4 4 4 4 16 0
Summary
% genes off 1.00
% genes on 0.00
Probability 0.01
An example of a group of genes known to be precisely coregulated by three regulatory
proteins: CsgD, CsgG, OmpR. The group shows a homogeneous pattern of expression
in repetitions (experiments 1, 2, 3, and 4) of transcriptome data. The expression levels
are described as either on or off pattern, for which we analyzed the statistical significance
using a binomial distribution model.
120 Julio Collado-Vides et al.
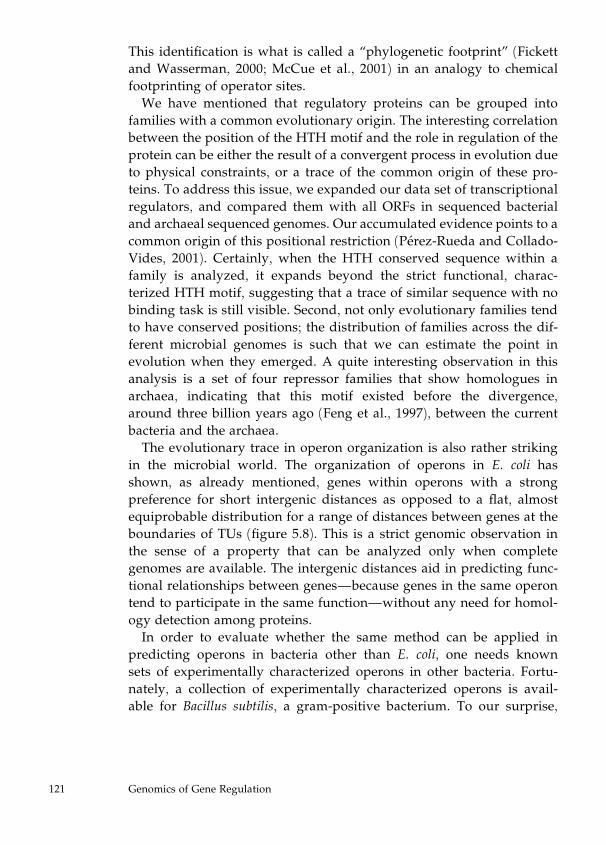
This identification is what is called a ‘‘phylogenetic footprint’’ (Fickett
and Wasserman, 2000; McCue et al., 2001) in an analogy to chemical
footprinting of operator sites.
We have mentioned that regulatory proteins can be grouped into
families with a common evolutionary origin. The interesting correlation
between the position of the HTH motif and the role in regulation of the
protein can be either the result of a convergent process in evolution due
to physical constraints, or a trace of the common origin of these pro-
teins. To address this issue, we expanded our data set of transcriptional
regulators, and compared them with all ORFs in sequenced bacterial
and archaeal sequenced genomes. Our accumulated evidence points to a
common origin of this positional restriction (Perez-Rueda and Collado-
Vides, 2001). Certainly, when the HTH conserved sequence within a
family is analyzed, it expands beyond the strict functional, charac-
terized HTH motif, suggesting that a trace of similar sequence with no
binding task is still visible. Second, not only evolutionary families tend
to have conserved positions; the distribution of families across the dif-
ferent microbial genomes is such that we can estimate the point in
evolution when they emerged. A quite interesting observation in this
analysis is a set of four repressor families that show homologues in
archaea, indicating that this motif existed before the divergence,
around three billion years ago (Feng et al., 1997), between the current
bacteria and the archaea.
The evolutionary trace in operon organization is also rather striking
in the microbial world. The organization of operons in E. coli has
shown, as already mentioned, genes within operons with a strong
preference for short intergenic distances as opposed to a flat, almost
equiprobable distribution for a range of distances between genes at the
boundaries of TUs (figure 5.8). This is a strict genomic observation in
the sense of a property that can be analyzed only when complete
genomes are available. The intergenic distances aid in predicting func-
tional relationships between genes—because genes in the same operon
tend to participate in the same function—without any need for homol-
ogy detection among proteins.
In order to evaluate whether the same method can be applied in
predicting operons in bacteria other than E. coli, one needs known
sets of experimentally characterized operons in other bacteria. Fortu-
nately, a collection of experimentally characterized operons is avail-
able for Bacillus subtilis, a gram-positive bacterium. To our surprise,
121 Genomics of Gene Regulation
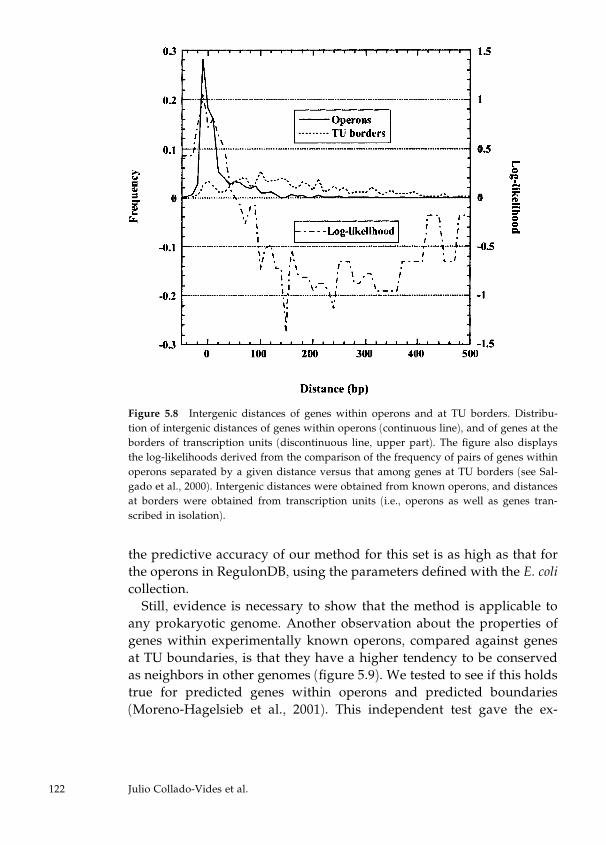
the predictive accuracy of our method for this set is as high as that for
the operons in RegulonDB, using the parameters defined with the E. coli
collection.
Still, evidence is necessary to show that the method is applicable to
any prokaryotic genome. Another observation about the properties of
genes within experimentally known operons, compared against genes
at TU boundaries, is that they have a higher tendency to be conserved
as neighbors in other genomes (figure 5.9). We tested to see if this holds
true for predicted genes within operons and predicted boundaries
(Moreno-Hagelsieb et al., 2001). This independent test gave the ex-
Figure 5.8 Intergenic distances of genes within operons and at TU borders. Distribu-
tion of intergenic distances of genes within operons (continuous line), and of genes at the
borders of transcription units (discontinuous line, upper part). The figure also displays
the log-likelihoods derived from the comparison of the frequency of pairs of genes within
operons separated by a given distance versus that among genes at TU borders (see Sal-
gado et al., 2000). Intergenic distances were obtained from known operons, and distances
at borders were obtained from transcription units (i.e., operons as well as genes tran-
scribed in isolation).
122 Julio Collado-Vides et al.
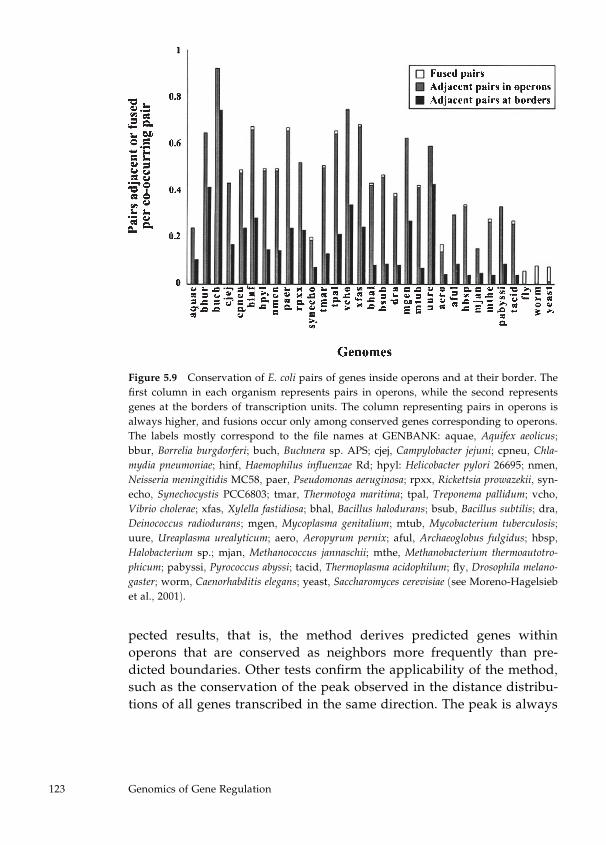
pected results, that is, the method derives predicted genes within
operons that are conserved as neighbors more frequently than pre-
dicted boundaries. Other tests confirm the applicability of the method,
such as the conservation of the peak observed in the distance distribu-
tions of all genes transcribed in the same direction. The peak is always
Figure 5.9 Conservation of E. coli pairs of genes inside operons and at their border. The
first column in each organism represents pairs in operons, while the second represents
genes at the borders of transcription units. The column representing pairs in operons is
always higher, and fusions occur only among conserved genes corresponding to operons.
The labels mostly correspond to the file names at GENBANK: aquae, Aquifex aeolicus;
bbur, Borrelia burgdorferi; buch, Buchnera sp. APS; cjej, Campylobacter jejuni; cpneu, Chla-
mydia pneumoniae; hinf, Haemophilus influenzae Rd; hpyl: Helicobacter pylori 26695; nmen,
Neisseria meningitidis MC58, paer, Pseudomonas aeruginosa; rpxx, Rickettsia prowazekii, syn-
echo, Synechocystis PCC6803; tmar, Thermotoga maritima; tpal, Treponema pallidum; vcho,
Vibrio cholerae; xfas, Xylella fastidiosa; bhal, Bacillus halodurans; bsub, Bacillus subtilis; dra,
Deinococcus radiodurans; mgen, Mycoplasma genitalium; mtub, Mycobacterium tuberculosis;
uure, Ureaplasma urealyticum; aero, Aeropyrum pernix; aful, Archaeoglobus fulgidus; hbsp,
Halobacterium sp.; mjan, Methanococcus jannaschii; mthe, Methanobacterium thermoautotro-
phicum; pabyssi, Pyrococcus abyssi; tacid, Thermoplasma acidophilum; fly, Drosophila melano-
gaster; worm, Caenorhabditis elegans; yeast, Saccharomyces cerevisiae (see Moreno-Hagelsieb
et al., 2001).
123 Genomics of Gene Regulation
located at the same place, and it is a reflection of the abundance of
operons of each genome. This information on abundance can be used to
adjust the predictions for greatest accuracy, but in principle the method
performs surprisingly well in any prokaryotic genome.
In summary, we started with an expected observation: that pairs of
genes in the same operon tend to be close to each other, in contrast to
pairs of genes at the boundaries between two neighboring TUs. The
difference in the distribution is so clear that this single parameter suffi-
ces to predict operons with an accuracy higher than 80% in E. coli. A
similar accuracy in the set of known operons in Bacillus is rather sur-
prising, given the evolutionary distance between these organisms. Also
important is the different evolutionary conservation of pairs of genes in
operons, as opposed to genes at the boundaries of TUs. The resulting
methodology enables a quite accurate prediction of TUs in all microbial
genomes. This computational ability is based on a universal conserva-
tion of the basic architecture of operons within the microbial world.
CONCLUSIONS
Many questions are open, and some of them may remain mysteries for a
long time. Transcription regulation as a network of interactions clearly
illustrates the complexity of biological architectures. We do not know
how deeply we will be able to understand such networks with current
scientific approaches. There is no clear quantitative method to address
the emergent properties of complex biological systems. These limi-
tations bring a healthy skepticism to what we will be able to do
(Krischner et al., 2000). However, the defined phenotypes of individual
mutations in complex differentiation pathways, such as aging, suggests
that complex as biology may be, it is decomposable and subject to
analysis.
Transcriptional regulation and operon organization in bacteria bring
us to a different point in the history of the biological complexity, the
one of the origin of life, or at least the origin of cellular life and its early
speciation in what became the archaeal, bacterial, and eukaryotic
domains of life. E. coli or another bacterium may be the first completely
annotated genome in the near future.
It is true that in several aspects bacteria are simpler systems, com-
pared to higher organisms. But this simplicity does not prevent novel
methods and representations that can integrate the biology of a bacte-
124 Julio Collado-Vides et al.
rial cell from being equally useful when studying eukaryotic cells. One
further step will be to study gene regulation and the associated meta-
bolic capabilities of the regulated genes in a single integrated model.
ACKNOWLEDGMENTS
We acknowledge Vıctor del Moral’s computational support in the lab-
oratory. The research summarized here was supported by grant 0028
from Conacyt.
REFERENCES
Blattner, F. R., Plunkett, G. III, Bloch, C. A., Perna, N. T., Burland, V., Riley, M., Collado-
Vides, J., Glasner, J. D., Rode, C. K., Mayhew, G., Gregor, J., Davis, N. W., Kirkpatrick, H.
A., Goeden, M. A., Rose, D. J., Mau, B., and Shao, Y. (1997). The complete genome se-
quence of Escherichia coli K-12. Science 277: 1453–1462.
Collado-Vides, J., Magasanik, B., and Gralla, J. D. (1991). Control site location and tran-
scriptional regulation in Escherichia coli. Microbiol. Rev. 55: 371–394.
Feng, D. F., Cho, G., and Doolittle, R. F. (1997). Determining divergence times with a
protein clock: Update and reevaluation. Proc. Natl. Acad. Sci. USA 94: 13028–13033.
Fickett, J. W., and Wasserman, W. W. (2000). Discovery and modeling of transcriptional
regulatory regions. Curr. Opinion Biotechnol. 11: 19–24.
Frech, K., Danescu-Mayer, J., and Werner, T. (1997). A novel method to develop highly
specific models for regulatory units detects a new LTR in GenBank which contains a
functional promoter. J. Mol. Biol. 270: 674–687.
Galperin, M. Y., and Koonin, E. V. (2000). Who’s your neighbor? New computational
approaches for functional genomics. Nat. Biotechnol. 18(6): 609–613.
Goffeau, A. (1998). Genomic-scale analysis goes upstream? Nat. Biotechnol. 16: 907–908.
Gralla, J. D. (1990). Promoter recognition and mRNA initiation by Escherichia coli E sigma
70. Methods Enzymol. 185: 37–54.
Gralla, J. D., and Collado-Vides, J. (1996). Organization and function of transcription reg-
ulatory elements. In F. C. Neidhardt, R. Curtiss III, J. Ingraham, E. C. C. Lin, K. B. Low, B.
Magasanik, W. Reznikoff, M. Schaechter, H. E. Umbarger, and M. Riley (eds.), Cellular and
Molecular Biology: Escherichia coli and Salmonella. 2nd ed. Washington, D.C.: American So-
ciety for Microbiology, pp. 1232–1245.
Harley, C. B., and Reynolds, R. P. (1987). Analysis of E. coli promoter sequences. Nucleic
Acids Res. 15(5): 2343–2361.
Hawley, D. K., and McClure, W. R. (1983). Compilation and analysis of Escherichia coli
promoter DNA sequences. Nucleic Acids Res. 11(8): 2237–2255.
125 Genomics of Gene Regulation
Hertz, G. Z., Hartzell, G. W. III, and Stormo, G. D. (1990). Identification of consensus
patterns in unaligned DNA sequences known to be functionally related. Comput. Appl.
Biosci. 6: 81–92.
Hertz, G. Z., and Stormo, G. D. (1999). Identifying DNA and protein patterns with statis-
tically significant alignments of multiple sequences. Bioinformatics 15: 563–577.
Krischner, M., Gerhart, J., and Mitchison, T. (2000). Molecular ‘‘vitalism.’’ Cell 100: 79–
88.
Lathe, W. C., Snel, B., and Bork, P. (2000). Gene context conservation of a higher order
than operons. Trends Biochem. Sci. 25(10): 474–479.
Lawrence, C. E., Altschul, S. F., Boguski, M. S., Liu, J. S., Neuwald, A. F., and Wootton, J.
C. (1993). Detecting subtle sequence signals: A Gibbs sampling strategy for multiple
alignment. Science 262: 208–214.
Lisser, S., and Margalit, H. (1993). Compilation of E. coli mRNA promoter sequences.
Nucleic Acids Res. 21(7): 1507–1516.
Lukashin, A. V., Anshelevich, V. V., Amirikyan, B. R., Graverov, A. I., and Frank-
Kamenetskii, M. D. (1989). Neural network models for promoter recognition. J. Biomol.
Struct. Dynamics 6: 1123–1133.
McCue, L. A., Thompson, W., Carmack, C. S., Ryan, M. P., Liu, J. S., Derbyshire, V., and
Lawrence, C. E. (2001). Phylogenetic footprinting of transcription factor binding sites in
proteobacterial genomes. Nucleic Acids Res. 29: 774–782.
Mooney, R. A., Artsimovitch, I., and Landick, R. (1998). Information processing by RNA
polymerase: Recognition of regulatory signals during RNA chain elongation. J. Bacteriol.
180: 3265–3275.
Moreno-Hagelsieb, G., Trevino, V., Perez-Rueda, E., Smith, T. E., and Collado-Vides, J.
(2001). Transcription unit conservation in the three domains of life: A perspective from
Escherichia coli. Trends in Genetics 17: 175–177.
Muller-Hill, B., and Kolkhof, P. (1994). DNA recognition and the code. Nature 369: 614.
Neidhardt, F. C., et al. (eds.). (1987). Escherichia coli and Salmonella typhimurium. Cellular
and Molecular Biology. Washington, D.C.: American Society for Microbiology.
Neidhardt, F. C., et al. (eds.). (1996). Escherichia coli and Salmonella typhimurium. Cellular
and Molecular Biology. 2nd ed. Washington, D.C.: American Society for Microbiology.
O’Neill, M. C., and Chiafari F. (1989). Escherichia coli promoters. II. A spacing class-
dependent promoter search protocol. J. Biol. Chem. 264: 5531–5534.
Pellegrini, M., Marcotte, E. M., Thompson, M. J., Eisenberg, D., and Yeates, T. O. (1999).
Assigning protein functions by comparative genome analysis: Protein phylogenetic pro-
files. Proc. Natl. Acad. Sci. USA 96: 4285–4288.
Perez-Rueda, E., and Collado-Vides, J. (2000). The repertoire of DNA-binding transcrip-
tional regulators in Escherichia coli. Nucleic Acids Res. 28: 1838–1847.
126 Julio Collado-Vides et al.
Perez-Rueda, E., and Collado-Vides, J. (2001). Common history at the origin of the
position-function correlation in transcriptional regulators in archaea and bacteria. J. Mol.
Evol. 53: 172–179.
Perez-Rueda, E., Gralla, J. D., and Collado-Vides, J. (1998). Genome analysis and the
transcription machinery. J. Mol. Biol. 275(2): 165–170.
Robison, K., McGuire, A. M., and Church, G. M. (1998). A comprehensive library of DNA-
binding site matrices for 55 proteins applied to the complete Escherichia coli K-12 genome.
J. Mol. Biol. 284: 241–254.
Rosenblueth, D. A., Thieffry, D., Huerta, A. M., Salgado, H., and Collado-Vides, J. (1996).
Syntactic recognition of regulatory regions in Escherichia coli. Comput. Appl. Biosci. 12:
415–422.
Salgado, H., Moreno-Hagelsieb, G., Smith, T. F., and Collado-Vides, J. (2000). Operons in
Escherichia coli: Genomic analyses and predictions. Proc. Natl. Acad. Sci. USA 97: 6652–
6657.
Salgado, H., Santos-Zavaleta, A., Gama-Castro, S., Millan-Zarate, D., Dıaz-Peredo, E.,
Sanchez-Solano, F., Perez-Rueda, E., Bonavides-Martınez, C., and Collado-Vides, J. (2001).
RegulonDB (version 3.2): Transcriptional regulation and operon organization in Escher-
ichia coli K-12. Nucleic Acids Res. 29: 72–74.
Stormo, G. (1990). Consensus patterns in DNA. Methods Enzymol. 183: 211–221.
Tan, K., Moreno-Hagelsieb, G., Collado-Vides, J., and Stormo, G. D. (2001). A compara-
tive genomics approach to prediction of new members of regulons. Genome Res. 11: 566–
584.
Thieffry, D., Huerta, A. M., Perez-Rueda, E., and Collado-Vides, J. (1998). From specific
gene regulation to genomic networks: A global analysis of transcriptional regulation in
Escherichia coli. BioEssays 20: 433–440.
Thieffry, D., Salgado, H., Huerta, A. M., and Collado-Vides, J. (1998). Prediction of tran-
scription regulatory sites in the complete genome of Escherichia coli. Bioinformatics 14: 391–
400.
van Helden, J., Andre, B., and Collado-Vides, J. (1998). Extracting regulatory sites from
the upstream region of yeast genes by computational analysis of oligonucleotide fre-
quencies. J. Mol. Biol. 281(5): 827–842.
van Helden, J., Rıos, A. F., and Collado-Vides, J. (2000). Discovering regulatory ele-
ments in non-coding sequences by analysis of spaced dyads. Nucleic Acids Res. 28(8):
1808–1818.
Waterman, M., Arratia, R., and Galas, D. J. (1984). Pattern recognition in several se-
quences: Consensus and alignment. Bull. Math. Biol. 46: 515–527.
Zuckerkandl, E., and Pauling, L. (1963). Molecules as documents of evolutionary history.
J. Theor. Biol. 8: 357–366.
127 Genomics of Gene Regulation
SUGGESTED READING
Coe, M. (1992). Breaking the Maya Code. New York: Thames and Hudson. A summary of
lessons from anthropologists drawn from deciphering ancient human languages. Deci-
phering genomes is not that different, is it?
Collado-Vides, J., Magasanik, B., and Smith, T. F. (eds.). (1996). Integrative Approaches to
Molecular Biology: Cambridge, Mass.: MIT Press. A book that expands from databases to
regulation, metabolism, and evolution.
Jacob, F. (1997). La Souris, la Mouche, et l’ Homme. Paris: Editions Odile Jacob. We do not
know if there is an English version of this update of La Logique du Vivant by the same
author, summarizing his view of the recent history of molecular biology. It is worth
reading.
URLs FOR RELEVANT SITES
E. coli genome project in Madison, Wisconsin. http://www.genome.wisc.edu
RegulonDB access site and also access site laboratory of Program of Computational
Genomics, UNAM.
http://www.cifn.unam.mx/Computational_Genomics/regulondb
128 Julio Collado-Vides et al.
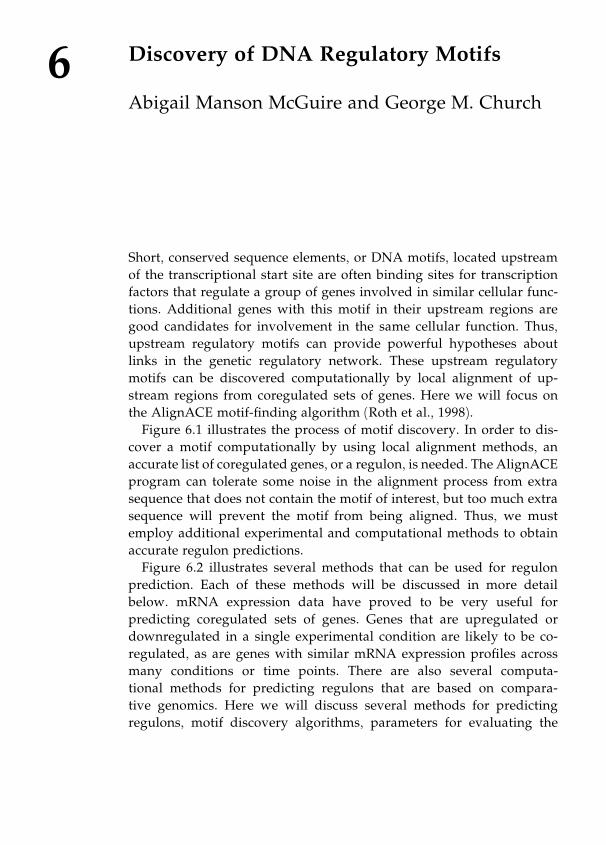
6 Discovery of DNA Regulatory Motifs
Abigail Manson McGuire and George M. Church
Short, conserved sequence elements, or DNA motifs, located upstream
of the transcriptional start site are often binding sites for transcription
factors that regulate a group of genes involved in similar cellular func-
tions. Additional genes with this motif in their upstream regions are
good candidates for involvement in the same cellular function. Thus,
upstream regulatory motifs can provide powerful hypotheses about
links in the genetic regulatory network. These upstream regulatory
motifs can be discovered computationally by local alignment of up-
stream regions from coregulated sets of genes. Here we will focus on
the AlignACE motif-finding algorithm (Roth et al., 1998).
Figure 6.1 illustrates the process of motif discovery. In order to dis-
cover a motif computationally by using local alignment methods, an
accurate list of coregulated genes, or a regulon, is needed. The AlignACE
program can tolerate some noise in the alignment process from extra
sequence that does not contain the motif of interest, but too much extra
sequence will prevent the motif from being aligned. Thus, we must
employ additional experimental and computational methods to obtain
accurate regulon predictions.
Figure 6.2 illustrates several methods that can be used for regulon
prediction. Each of these methods will be discussed in more detail
below. mRNA expression data have proved to be very useful for
predicting coregulated sets of genes. Genes that are upregulated or
downregulated in a single experimental condition are likely to be co-
regulated, as are genes with similar mRNA expression profiles across
many conditions or time points. There are also several computa-
tional methods for predicting regulons that are based on compara-
tive genomics. Here we will discuss several methods for predicting
regulons, motif discovery algorithms, parameters for evaluating the
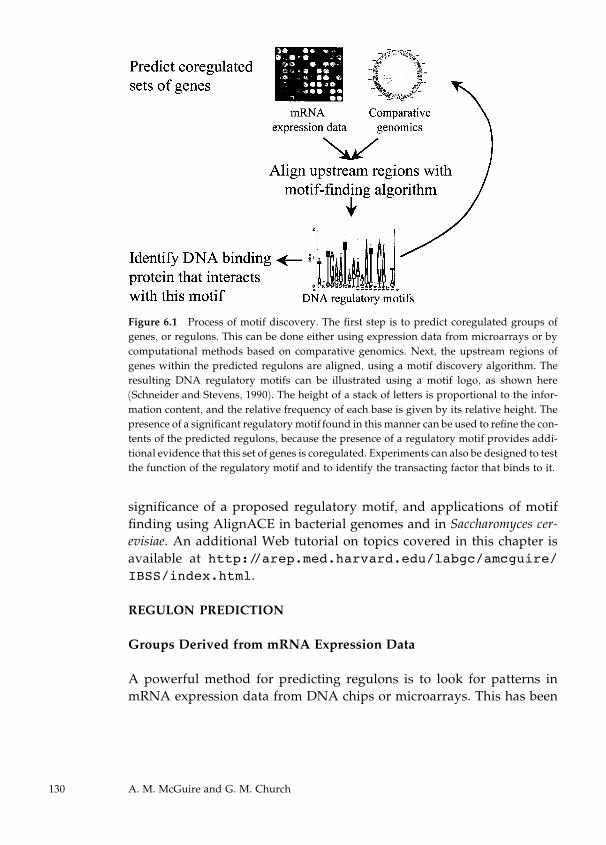
significance of a proposed regulatory motif, and applications of motif
finding using AlignACE in bacterial genomes and in Saccharomyces cer-
evisiae. An additional Web tutorial on topics covered in this chapter is
available at http://arep.med.harvard.edu/labgc/amcguire/IBSS/index.html.
REGULON PREDICTION
Groups Derived from mRNA Expression Data
A powerful method for predicting regulons is to look for patterns in
mRNA expression data from DNA chips or microarrays. This has been
Figure 6.1 Process of motif discovery. The first step is to predict coregulated groups of
genes, or regulons. This can be done either using expression data from microarrays or by
computational methods based on comparative genomics. Next, the upstream regions of
genes within the predicted regulons are aligned, using a motif discovery algorithm. The
resulting DNA regulatory motifs can be illustrated using a motif logo, as shown here
(Schneider and Stevens, 1990). The height of a stack of letters is proportional to the infor-
mation content, and the relative frequency of each base is given by its relative height. The
presence of a significant regulatory motif found in this manner can be used to refine the con-
tents of the predicted regulons, because the presence of a regulatory motif provides addi-
tional evidence that this set of genes is coregulated. Experiments can also be designed to test
the function of the regulatory motif and to identify the transacting factor that binds to it.
130 A. M. McGuire and G. M. Church
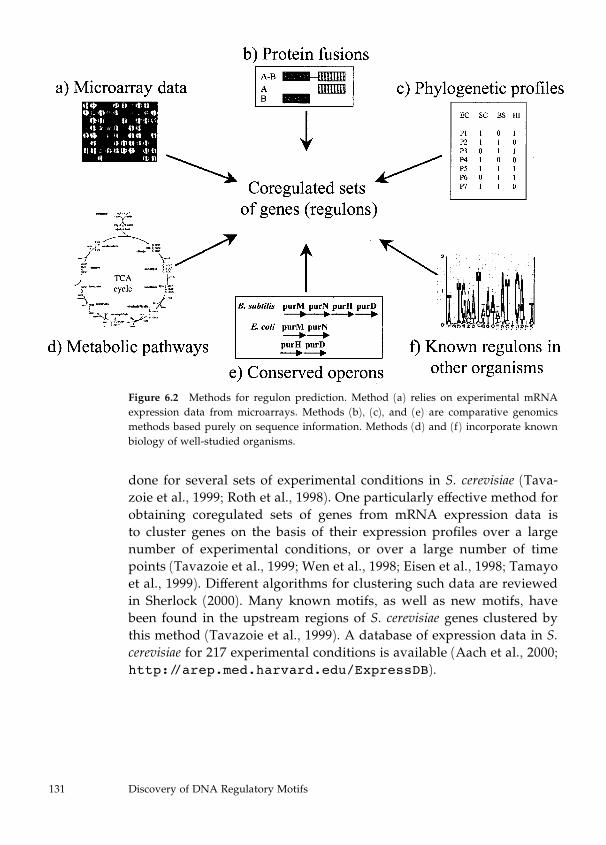
done for several sets of experimental conditions in S. cerevisiae (Tava-
zoie et al., 1999; Roth et al., 1998). One particularly effective method for
obtaining coregulated sets of genes from mRNA expression data is
to cluster genes on the basis of their expression profiles over a large
number of experimental conditions, or over a large number of time
points (Tavazoie et al., 1999; Wen et al., 1998; Eisen et al., 1998; Tamayo
et al., 1999). Different algorithms for clustering such data are reviewed
in Sherlock (2000). Many known motifs, as well as new motifs, have
been found in the upstream regions of S. cerevisiae genes clustered by
this method (Tavazoie et al., 1999). A database of expression data in S.
cerevisiae for 217 experimental conditions is available (Aach et al., 2000;
http://arep.med.harvard.edu/ExpressDB).
Figure 6.2 Methods for regulon prediction. Method (a) relies on experimental mRNA
expression data from microarrays. Methods (b), (c), and (e) are comparative genomics
methods based purely on sequence information. Methods (d) and (f) incorporate known
biology of well-studied organisms.
131 Discovery of DNA Regulatory Motifs
Groups Derived from Conserved Operons
Operons (tandem genes, usually functionally related, that are tran-
scribed onto a single mRNA) are the main transcriptional regulatory
units in bacteria. Often several bacterial operons that share an up-
stream binding site for a common transcription factor are coregulated
to form a higher-order regulatory unit (a regulon). In different micro-
bial organisms the genes that make up a regulon are often assorted into
operons in different combinations. Two genes that are spatially sepa-
rated on the chromosome in one organism, but spatially close in several
other microbial species, are good candidates for being coregulated or
functionally related (Dandekar et al., 1998; Overbeek et al., 1998, 1999).
Such pairings between genes have been used to construct larger groups
of genes that are predicted to be functionally coupled (Overbeek et al.,
1999). Thus regulons can often be reconstructed by looking at con-
served operon composition across other genomes. Figure 6.3 shows a
simple example illustrating this method.
Figure 6.3 Predicting the E. coli purine biosynthesis regulon based on conserved oper-
ons. In B. subtilis, C. acetobutylicum, and several other bacteria, a large group of genes
involved in purine biosynthesis is found together in a single operon. In E. coli these genes
are split into seven different operons that are coordinately regulated by binding of the
transcription factor PurR to a specific DNA motif found in the upstream region of each
operon. Each color (not shown here) represents a separate but coregulated operon in
E. coli.
132 A. M. McGuire and G. M. Church
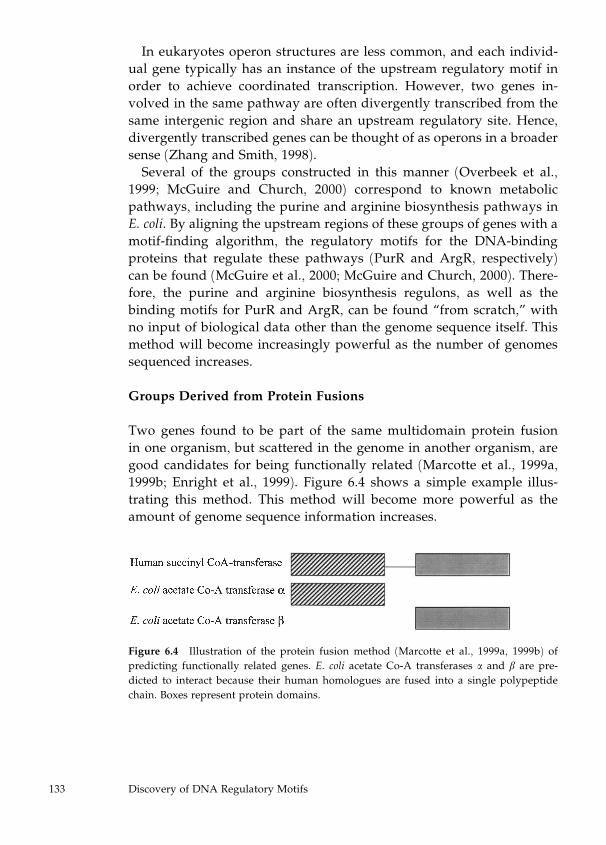
In eukaryotes operon structures are less common, and each individ-
ual gene typically has an instance of the upstream regulatory motif in
order to achieve coordinated transcription. However, two genes in-
volved in the same pathway are often divergently transcribed from the
same intergenic region and share an upstream regulatory site. Hence,
divergently transcribed genes can be thought of as operons in a broader
sense (Zhang and Smith, 1998).
Several of the groups constructed in this manner (Overbeek et al.,
1999; McGuire and Church, 2000) correspond to known metabolic
pathways, including the purine and arginine biosynthesis pathways in
E. coli. By aligning the upstream regions of these groups of genes with a
motif-finding algorithm, the regulatory motifs for the DNA-binding
proteins that regulate these pathways (PurR and ArgR, respectively)
can be found (McGuire et al., 2000; McGuire and Church, 2000). There-
fore, the purine and arginine biosynthesis regulons, as well as the
binding motifs for PurR and ArgR, can be found ‘‘from scratch,’’ with
no input of biological data other than the genome sequence itself. This
method will become increasingly powerful as the number of genomes
sequenced increases.
Groups Derived from Protein Fusions
Two genes found to be part of the same multidomain protein fusion
in one organism, but scattered in the genome in another organism, are
good candidates for being functionally related (Marcotte et al., 1999a,
1999b; Enright et al., 1999). Figure 6.4 shows a simple example illus-
trating this method. This method will become more powerful as the
amount of genome sequence information increases.
Figure 6.4 Illustration of the protein fusion method (Marcotte et al., 1999a, 1999b) of
predicting functionally related genes. E. coli acetate Co-A transferases a and b are pre-
dicted to interact because their human homologues are fused into a single polypeptide
chain. Boxes represent protein domains.
133 Discovery of DNA Regulatory Motifs
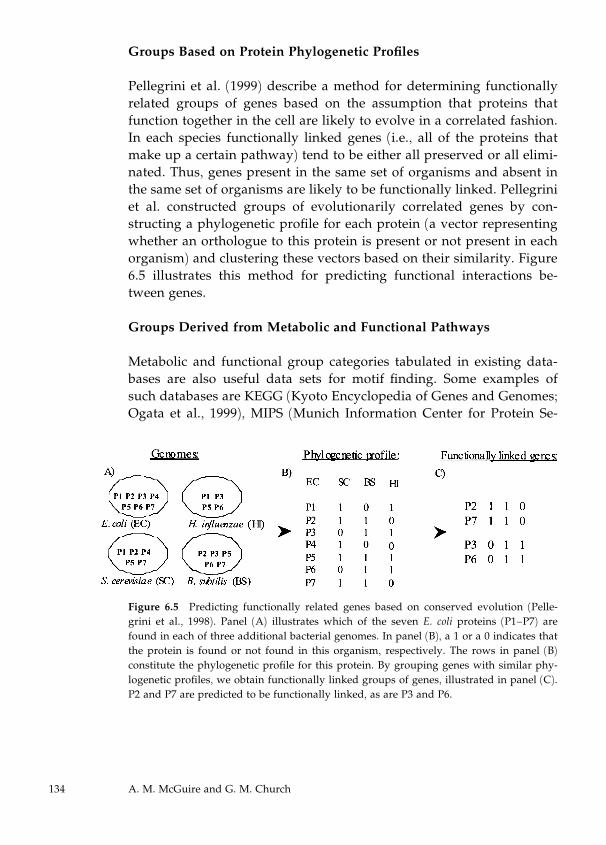
Groups Based on Protein Phylogenetic Profiles
Pellegrini et al. (1999) describe a method for determining functionally
related groups of genes based on the assumption that proteins that
function together in the cell are likely to evolve in a correlated fashion.
In each species functionally linked genes (i.e., all of the proteins that
make up a certain pathway) tend to be either all preserved or all elimi-
nated. Thus, genes present in the same set of organisms and absent in
the same set of organisms are likely to be functionally linked. Pellegrini
et al. constructed groups of evolutionarily correlated genes by con-
structing a phylogenetic profile for each protein (a vector representing
whether an orthologue to this protein is present or not present in each
organism) and clustering these vectors based on their similarity. Figure
6.5 illustrates this method for predicting functional interactions be-
tween genes.
Groups Derived from Metabolic and Functional Pathways
Metabolic and functional group categories tabulated in existing data-
bases are also useful data sets for motif finding. Some examples of
such databases are KEGG (Kyoto Encyclopedia of Genes and Genomes;
Ogata et al., 1999), MIPS (Munich Information Center for Protein Se-
Figure 6.5 Predicting functionally related genes based on conserved evolution (Pelle-
grini et al., 1998). Panel (A) illustrates which of the seven E. coli proteins (P1–P7) are
found in each of three additional bacterial genomes. In panel (B), a 1 or a 0 indicates that
the protein is found or not found in this organism, respectively. The rows in panel (B)
constitute the phylogenetic profile for this protein. By grouping genes with similar phy-
logenetic profiles, we obtain functionally linked groups of genes, illustrated in panel (C).
P2 and P7 are predicted to be functionally linked, as are P3 and P6.
134 A. M. McGuire and G. M. Church
quences; Heinemeyer et al., 1998), and YPD (yeast protein database;
Hodges et al., 1999). Since these groups are based on a compilation of
experimental data in these organisms, the motifs found within these
groups are biased toward known motifs. However, new motifs have
also been found in the upstream regions of these groups. Hughes et al.
(2000) used the MIPS and YPD groups to search for motifs in S. cer-
evisiae, and McGuire et al. (2000) used the KEGG groups to search for
motifs in 17 complete prokaryotic genomes.
Groups Derived from Homologues to Footprinted Regulons in
Other Species
Groups based on known regulons in other organisms, such as ortho-
logues to the E. coli genes known to be regulated by 55 DNA-binding
proteins (http://arep.med.harvard.edu/ecoli_matrices/;Robison et al., 1998), can also be used to search for upstream regulatory
motifs. Such methods have been used to identify known regulatory
motifs that are conserved in other organisms, as well as different motifs
that could regulate orthologous sets of genes in different organisms
(McGuire et al., 2000).
Combining Several Methods
Information obtained from a combination of the above methods can be
used to obtain better predicted regulons. For example, McGuire and
Church (2000) combined the three methods described above that rely
only on information derived from comparative genomics (methods
based on conserved operons, protein fusions, and phylogenetic pro-
files) to predict regulons in 24 complete genomes. These regulons were
then used to search for new regulatory motifs.
MOTIF-FINDING ALGORITHMS
Once a group of genes believed to be coregulated (a predicted regulon)
has been obtained by one of the methods described above, DNA regu-
latory motifs can be discovered by local alignment of the upstream
regions of this set of genes (Roth et al., 1998). Several different algo-
rithms have been used for motif discovery within DNA sequences. Only
135 Discovery of DNA Regulatory Motifs
a sampling of the large number of motif-finding algorithms available
will be mentioned here.
The Gibbs sampling algorithm is based on the statistical method of
iterative sampling (Liu et al., 1995; Lawrence et al., 1993). This algo-
rithm has been optimized for use with DNA sequence alignments
in the program AlignACE (Roth et al., 1998; http://atlas.med.harvard.edu). The AlignACE algorithm, along with applications ofAlignACE in bacterial genomes and in S. cerevisiae, will be discussed in
more detail below.
MEME (Multiple EM for Motif Elicitation) is a motif-finding algo-
rithm that uses an expectation maximization algorithm to locate one or
more repeated patterns in the input sequence (Bailey and Elkan, 1995;
Grundy et al., 1996; http://meme.sdsc.edu/meme/website/).MEME searches by building statistical models of motifs (matrices of
discrete probability distributions) and maximizing the posterior proba-
bility of these models, given the data. MACAW (Multiple Alignment
Construction and Analysis Workbench) is a motif-finding algorithm
that allows the user to construct multiple alignments by locating, ana-
lyzing, editing, and combining blocks of aligned sequence segments
(Schuler et al., 1991). Several methods based on detection of over-
represented oligonucleotide frequencies have been proposed, including
a method by van Helden et al. (1998; http://embnet.cifn.unam.mx/@jvanheld/rsa-tools). This simple and fast motif-finding
method defines the statistical significance of a site based on tables
of oligonucleotide frequencies in noncoding regions. However, this
method is limited to short, highly conserved motifs.
AlignACE Algorithm
For clarity in describing the Gibbs sampling algorithm used in Align-
ACE, we will present the simple case of searching for a single pattern of
fixed width W within each of N input sequences (S1 . . . SN). However,
the AlignACE algorithm allows for automatic detection of variable
pattern widths as well as multiple motif instances per input sequence.
The pattern is described by a probabilistic model of residue frequencies
at each position, qij, where i ranges from 1 to W and j ranges from 1 to 4
(A;C;T, and G). We also consider the background frequencies for each
base, pj, where j ranges from 1 to 4. The pij are different for each or-
136 A. M. McGuire and G. M. Church
ganism. The start site for the motif within each input sequence is des-
ignated by a set of positions ak, where k ranges from 1 to N. To choose
the best pattern, the algorithm must choose values of ak that maximize
the ratio of the pattern probability to the background probability.
The first step is to choose random start positions (ak). The next step
(the predictive update step) is to choose one of the N sequences at ran-
dom (z), and calculate the qij for the current positions, excluding z. The
qij are calculated using the equation
qij ¼cij þ bj
N � 1þ B; ð6:1Þ
where cij is the count of nucleotide j at position i, bj is a residue-
dependent ‘‘pseudocount’’ suggested by Bayesian statistical analysis for
the purpose of pattern estimation, and B is the sum of the Bj.
The next step (the sampling step) is to consider every possible seg-
ment x of length W within z, and to calculate the probability Qx of
generating each such segment x according to the current pattern prob-
abilities qij, and the probability Px of generating each segment accord-
ing to the background probabilities pj. A weight equal to Ax ¼ Qx=Px is
assigned to segment x, and with each segment so weighted, a random
position is selected. This new position becomes the new value for az,
and the algorithm is iterated. The most probable alignment is the one
that maximizes the equation
F ¼XW
i¼1
X4j¼1
cij logqij
pj; ð6:2Þ
where cij is the count of nucleotide j at position i. As the pattern
description calculated in the predictive update step becomes more ac-
curate, the determination of the location in the sampling step also
becomes more accurate.
Several optimizations of the Gibbs sampler algorithm were added in
the AlignACE program for use in finding DNA motifs (Roth et al.,
1998; Hughes et al., 2000): both strands of DNA are now considered;
the near-optimum sampling method was improved in order to obtain
higher scoring alignments; simultaneous multiple motif searching was
replaced with an iterative masking approach; and the model for base
background frequencies was set to equal the background nucleotide
frequencies in the genome being considered.
137 Discovery of DNA Regulatory Motifs
INDICES FOR EVALUATING THE SIGNIFICANCE OF A MOTIF
When using a motif discovery algorithm such as AlignACE, often a
large number of motifs are identified. Additional indices are necessary
to assess these motifs and identify those most likely to correspond to
specific regulatory motifs that are biologically relevant. Highly con-
served and common genomic elements, such as repetitive elements and
ribosome binding sites, are also found by AlignACE and must be sep-
arated from potential binding sites for specific transcription factors.
Several indices used in assessing newly discovered motifs are described
below.
MAP Score
The MAP score is the index used by AlignACE to determine the statis-
tical significance of alignments sampled, given the composition of the
input sequence (Liu et al., 1995). MAP scores are normalized so that the
score for an alignment of zero sites is assigned a score of 0. The MAP
score is higher for similar motifs with greater numbers of aligned sites
and for more tightly conserved motifs, and lower for an identical align-
ment of sites derived from a larger set of input sequences, motifs with
more dispersed information content, and motifs rich in nucleotides
more prevalent in the genome. The MAP score is useful for ruling out
alignments that are not statistically significant, but this score is not very
useful in discriminating real regulatory motifs from other statistically
significant motifs found by AlignACE because many nonspecific chro-
mosomal features have high MAP scores (i.e., ribosome binding sites
and repetitive elements).
Specificity Score
The specificity score is a measure of how specific a motif is for the se-
quence in which it was aligned, compared to the genome as a whole.
This is the most useful index for selecting functional motifs. Two dif-
ferent specificity score measures have been described: the specificity
score (S) is more useful for yeast and eukaryotes (Hughes et al., 2000),
while the site specificity score (Ssite) is more useful for bacterial se-
quences and genomes containing operons and multiple copies of a
motif within a single upstream region (McGuire et al., 2000). The main
difference between these two specificity scores is that S is a measure
138 A. M. McGuire and G. M. Church
of how many of the top predicted ORF targets in the genome were used
to align the motif originally, whereas Ssite measures the probability
of obtaining the observed fraction of the top motif instances in the
genome within the sequence input to AlignACE.
For each motif a position-specific weight matrix is constructed and
the whole genome is searched for additional instances of the motif
(Hughes et al., 2000; McGuire et al., 2000). The Berg and von Hippel
weight matrix (Berg and von Hippel, 1987), implemented in the Scan-
ACE program (Hughes et al., 2000), is used to perform this search. To
calculate Ssite, the top 200 ScanACE hits are considered, and the number
of these sites located within the upstream regions used to align the
motif is calculated. The probability of obtaining this number of sites
within this subset of the genomic sequence by random means is calcu-
lated using the following equation (the hypergeometric distribution):
Ssite ¼Xminðs1; s2Þ
i¼x
s1
i
� �N � s1
s2 � i
� �
N
s2
� � : ð6:3Þ
N is the total number of possible sites (equal to the number of base
pairs in the genome), s1 is the number of ScanACE hits considered
(200), s2 is the total number of possible sites in the set of upstream
regions used to align the motif (equal to the number of base pairs in the
sequence input to AlignACE), and i is the intersection of s1 and s2. To
calculate S, the 100 ORFs that are the most likely targets for the factor
binding the motif are selected (the ORFs with the strongest sites in the
region between �100 and 500 bp upstream of the translational start).
This list of gene targets is compared against the list of genes in the
group used to find the motif, using the same equation as above; how-
ever, now N is the total number of ORFs in the genome, s1 and s2 are
the numbers of ORFs in the group used to find the motif and in the list
of target genes, respectively, and x is the number of ORFs in the inter-
section of the two lists.
Positional Bias
This is a measure of bias in the locations of the top ScanACE hits in the
genome relative to the start codon of the closest gene. The subset of the
top 200 ScanACE hits that fall within a certain distance s of the start
codon (300 bp for bacteria and 600 bp for S. cerevisiae) are considered. A
139 Discovery of DNA Regulatory Motifs
smaller window w (30 bp for bacteria and 50 bp for S. cerevisiae) is then
chosen such that it contains the maximum number of hits within s. The
probability of seeing the observed number of sites or greater in a win-
dow of size w, out of a sample space of size s, is calculated as follows
(Hughes et al., 2000):
P ¼Xt
i¼m
s1
i
� �w
s
� �i
1� w
s
� �t�i
ð6:4Þ
Similarities Between Motifs
The CompareACE program (Hughes et al., 2000), used to compare two
motifs by finding the best alignment, calculates the Pearson correlation
between position-specific scoring matrices (Pietrokovski, 1996). Two
motifs with a CompareACE score greater than 0.7 are considered
similar (Hughes et al., 2000; McGuire et al., 2000). New motifs can be
compared against databases of known motifs using CompareACE,
including a database of footprinted E. coli motifs (Robison et al., 1998).
CompareACE scores can also be used as a metric to cluster motifs.
After calculating a matrix of pairwise CompareACE scores, motifs can
be clustered using a simple joining algorithm (Hartigan, 1975). Often
when a large set of motifs is analyzed, multiple instances of similar
motifs will be present, and clustering will reduce the set of motifs to
unique clusters.
Palindromicity
Many known bacterial motifs are palindromic. To identify palindromic
motifs, the CompareACE program can be used to compare a motif and
its reverse complement. The same CompareACE cutoff score as for com-
paring motifs to one other (0.7) has been used (McGuire et al., 2000).
ALIGNACE APPLICATIONS
Applications of AlignACE in Complete Bacterial Genomes
AlignACE has been applied to several kinds of potentially coregulated
groups of genes in prokaryotic genomes. McGuire et al. (2000) used
groups derived from conserved operons in the WIT database, groups
140 A. M. McGuire and G. M. Church
derived from metabolic pathways in the KEGG database, and groups
derived from homologues in other species to members of known E. coli
regulons (Robison et al., 1998) to search for regulatory motifs in 17
prokaryotic genomes. Specific, new motifs were found using each
grouping method and in each organism. McGuire and Church (2000)
combined and compared three techniques for predicting functional
interactions based on comparative genomics (methods based on con-
served operons, protein fusions, and correlated evolution) in order to
construct predicted regulons in 22 complete prokaryotic genomes.
These predicted regulons were then used to find a large number of new
motifs using AlignACE.
Identifying motifs in bacterial genomes is complicated by the pres-
ence of operons. It is difficult to locate the regulatory region for a gene
within an operon. If the gene of interest lies within an operon, its pro-
moter could lie several genes upstream. Thus, we must include several
possible intergenic regions to ensure that we have included the seg-
ment containing the regulatory region (McGuire et al., 2000). This is
possible in bacteria because regulatory regions are shorter; hence, we
can include several intergenic regions without adding so much extra
sequence that the motif-finding algorithm will no longer be able to
align the regulatory motif.
An additional problem associated with motif finding in bacteria is
that there are fewer instances of most regulatory motifs because there is
usually only one instance per operon instead of one instance per gene.
Motif conservation can used to aid in finding new motifs by group-
ing upstream regions from closely related bacteria, thus increasing
the number of instances of each motif in the sequence to be aligned
(McGuire et al., 2000).
The effectiveness of AlignACE in finding known E. coli motifs was
analyzed. Of the 32 E. coli footprinted regulons in our database with 5–
100 known binding sites (Robison et al., 1998), 26 have motifs that can
be found by AlignACE (81%). The groups obtained from homologues
in other species to members of known E. coli regulons were used to
study conservation of E. coli DNA motifs in other organisms, as well as
to identify potential new mechanisms for regulating the same cellular
process in more distantly related organisms. At least 30% of the known
E. coli DNA regulatory motifs were found to be conserved in closely
related bacteria. A new motif can indicate either a different mechanism
for regulating a similar cellular process or divergence of binding site
residues in a conserved DNA-binding protein.
141 Discovery of DNA Regulatory Motifs
Applications of AlignACE in Saccharomyces cerevisiae
AlignACE has been used for motif finding in S. cerevisiae with mRNA
expression data (Roth et al., 1998; Tavazoie et al., 1999), as well as with
functional group categories (Hughes et al., 2000). Selecting upstream
regions is more straightforward in yeast because there are no operons.
Because intergenic regions are longer in yeast, and regulatory elements
are often found farther upstream than in bacteria, longer stretches of
noncoding sequence have been used for motif finding (up to 600 bp).
Roth et al. (1998) first used AlignACE to find motifs, employing reg-
ulons derived from experiments employing Affymetrix GeneChips in
the following three systems: galactose utilization, mating type, and
heat shock response. By aligning the groups of genes with the largest
fold changes in these conditions, using AlignACE, they were able to
find the binding sites for many of the factors known to be involved in
these processes.
Tavazoie et al. (1999) looked at a time series of mRNA abundance
data measured over two synchronized S. cerevisiae cell cycles. These
data were used to group 3000 yeast genes into 30 clusters with similar
temporal expression profiles. These groups were highly enriched with
genes involved in the same cellular processes. By aligning the genes
making up these clusters with AlignACE, they were able to find many
known motifs as well as several new ones.
Hughes et al. (2000) used AlignACE to search for motifs upstream
of the genes making up the MIPS and YPD (yeast protein database)
functional groups. Many known and new motifs were found in this
analysis, including a new motif found upstream of genes involved in
proteasome formation. This motif has been independently identified as
the binding site for Rpn4 in Church’s lab as well as by Mannhaupt et al.
(1999). Several other potentially functional new S. cerevisiae motifs are
being experimentally tested.
CONCLUSIONS
The use of motif-finding algorithms to discover new regulatory motifs
is a powerful method for understanding the interconnections in genetic
regulatory networks. Groups of genes (predicted regulons) obtained
from mRNA expression data can be extremely powerful in this regard,
though such groups of genes have the drawback that they are depen-
142 A. M. McGuire and G. M. Church
dent on the experimental conditions chosen. These groups can be com-
plemented by theoretically obtained predicted regulons that are less
dependent on the experimental conditions chosen. The presence of a
significant regulatory motif shared by the members of a predicted reg-
ulon provides additional evidence that this group of genes is actually
coregulated.
The motif-finding program AlignACE has been used successfully
to predict new motifs in S. cerevisiae, as well as in over 20 complete
bacterial genomes. A new motif discovered by AlignACE upstream of
proteasome subunits in S. cerevisiae has been confirmed experimentally,
and numerous other new motifs should be verified as well. AlignACE
has also been used to analyze conservation and divergence of regula-
tory mechanisms between microbial genomes.
The methods that we have described here for predicting regulons
and their cis-regulatory motifs will become increasingly powerful as
the size of the sequence database and the number of complete genomes
grows. The discovery of DNA regulatory motifs will be facilitated
by having complete genomes for a greater number of closely related
organisms, since sequences from closely related organisms can be
pooled to find conserved motifs that are found in only a few copies in
each genome. In addition, regulon-prediction methods based on com-
parative genomics (including the methods described here that involve
conserved operons, protein fusions, and phylogenetic profiles) will
yield more information about each organism as more complete and
partial genome sequences become available. Several complete genomes
have recently been made available, including Drosophila, C. elegans, and
several human chromosomes. As many as 50 additional bacterial
genomes could become available by 2002, along with the human
genome sequence. The framework described here for predicting reg-
ulons and their cis-regulatory motifs will soon become increasingly
powerful.
ACKNOWLEDGMENTS
We would like to thank Jason Hughes, Jason Johnson, Martha Bulyk,
Saeed Tavazoie, Pete Estep, John Aach, Jong Park, Adnan Derti, Tzachi
Pilpel, and Jeremy Edwards for help and discussions, as well as all of
the other members of George Church’s lab. Abigail Manson McGuire is
a Howard Hughes Medical Institute predoctoral fellow.
143 Discovery of DNA Regulatory Motifs
REFERENCES
Aach, J., Rindone, W., and Church, G. M. (2000). Systematic management and analysis of
yeast gene expression data. Genome Res. 10: 431–445.
Bailey, T. L., and Elkan, C. (1995). The value of prior knowledge in discovering motifs
with MEME. In Proceedings of the Third International Conference in Intelligent Systems for
Molecular Biology. Cambridge, UK: AAAI Press, pp. 21–29.
Berg, O. G., and von Hippel, P. H. (1987). Selection of DNA binding sites by regulatory
proteins. Statistical-mechanical theory and application to operators and promoters. J. Mol.
Biol. 193: 723–750.
Dandekar, T., Snel, B., Huynen, M., and Bork, P. (1998). Conservation of gene order: A
fingerprint of proteins that physically interact. Trends Biochem. Sci. 23(9): 324–328.
Eisen, M. B., Spellman, P. T., Brown, P. O., and Botstein, D. (1998). Cluster analysis
and display of genome-wide expression patterns. Proc. Natl. Acad. Sci. USA 95: 14863–
14868.
Enright, A. J., Iliopoulos, I., Kyrpides, N. C., and Ouzounis, C. A. (1999). Protein interac-
tion maps for complete genomes based on gene fusion events. Nature 402: 86–90.
Grundy, W. N., Bailey, T. L., and Elkan, C. P. (1996). ParaMEME: A parallel implementa-
tion and a web interface for a DNA and protein motif discovery tool. Comput. Appl. Biosci.
12: 303–310.
Hartigan, J. A. (1975). Clustering Algorithms. New York: Wiley.
Heinemeyer, T., Wingender, E., Reuter, I., Hermjakob, H., Kel, A. E., Kel, O. V., Ignatieva,
E. V., Ananko, E. A., Podkolodnaya, O. A., Kolpakov, F. A., Podkolodny, F. A., and Kol-
chanov, N. A. (1998). A database on transcription regulation: TRANSFAC, TRRD, and
COMPEL. Nucleic Acids Res. 26: 364–370.
Hodges, P., McKee, A., Davis, B., Payne, W., and Garrels, J. (1999). Yeast protein database
(YPD): A model for the organization and presentation of genome-wide functional data.
Nucleic Acids Res. 27: 69–73.
Hughes, J. D., Estep, P. W., Tavazoie, S., and Church, G. M. (2000). Computational iden-
tification of cis-regulatory elements associated with groups of functionally related genes
in Saccharomyces cerevisiae. J. Mol. Biol. 296: 1205–1214.
Lawrence, C. E., Altschul, S. F., Boguski, M. S., Liu, J. S., Neuwald, A. F., and Wootton, J.
C. (1993). Detecting subtle sequence signals: A Gibbs sampling strategy for multiple
alignment. Science 262: 208–214.
Liu, S. J., Neuwald, A. F., and Lawrence, C. E. (1995). Bayesian models for multiple local
sequence alignment and Gibbs sampling strategies. J. Am. Stat. Assoc. 90: 1156–1170.
Mannhaupt, G., Schnall, R., Karpov, V., Vetter, I., and Feldmann, H. (1999). Rpn4 acts as a
transcription factor by binding to PACE, a nonamer box found upstream of 26S protea-
somal and other genes in yeast. FEBS Lett. 450: 27–34.
144 A. M. McGuire and G. M. Church
Marcotte, E. M., Pellegrini, M., Ng, H. L., Rice, D. W., Yeates, T. O., and Eisenberg, D.
(1999). Detecting protein function and protein-protein interactions from genome se-
quences. Science 285: 751–753.
Marcotte, E. M., Pellegrini, M., Thompson, M. J., Yeates, T. O., and Eisenberg, D. (1999). A
combined algorithm for genome-wide prediction of protein function. Nature 402: 83–86.
McGuire, A. M., and Church, G. M. (2000). Predicting regulons and their cis-regulatory
motifs by comparative genomics. Nucleic Acids Res. 28(22): 4523–4530.
McGuire, A. M., Hughes, J. D., and Church, G. M. (2000). Conservation of DNA regula-
tory motifs and discovery of new motifs in microbial genomes. Genome Res. 10: 744–757.
Ogata, H., Goto, S., Sato, K., Fujibuchi, W., Bono, H., and Kanehisa, M. (1999). KEGG:
Kyoto Encyclopedia of Genes and Genomes. Nucleic Acids Res. 27(1): 29–34.
Overbeek, R., Fonstein, M., D’Souza, M., Pusch, G., and Maltsev, N. (1998). In silico biol-
ogy, 1:0009. http://www.bioinfo.de/isb/1998/01/0009.
Overbeek, R., Fonstein, M., D’Souza, M., Pusch, G. D., and Maltsev, N. (1999). The use of
gene clusters to infer functional coupling. Proc. Natl. Acad. Sci. USA 96: 2896–2901.
Pellegrini, M., Marcotte, E. M., Thompson, M. J., Eisenberg, D., and Yeates, T. O. (1999).
Assigning protein functions by comparative genome analysis: Protein phylogenetic pro-
files. Proc. Natl. Acad. Sci. USA 96: 4285–4288.
Pietrokovski, S. (1996). Searching databases of conserved sequence regions by aligning
protein multiple-alignments. Nucleic Acids Res. 24: 3836–3845.
Robison, K., McGuire, A. M., and Church, G. M. (1998). Comprehensive library of DNA-
binding site matrices for 55 proteins applied to the complete Escherichia coli K-12 genome.
J. Mol. Biol. 284: 241–254.
Roth, F. P., Hughes, J. D., Estep, P. W., and Church, G. M. (1998). Finding DNA regula-
tory motifs within unaligned noncoding sequences clustered by whole-genome mRNA
quantitation. Nat. Biotechnol. 16: 939–945.
Schneider, T. D., and Stephens, R. M. (1990). Sequence logos: A new way to display con-
sensus sequence. Nucleic Acids Res. 18: 6097–6100.
Schuler, G. D., Altschul, S. F., and Lipman, D. J. (1991). A workbench for multiple align-
ment construction and analysis. Proteins: Struct. Funct. Genet. 9: 180–190.
Sherlock, G. (2000). Analysis of large-scale gene expression data. Curr. Opinion Immunol.
12: 201–205.
Tamayo, P., Slonim, D., Mesirov, J., Zhu, Q., Kitareewan, S., Dmitrovsky, E., Lander, E. S.,
and Golub, T. R. (1999). Interpreting patterns of gene expression with self-organizing
maps: Methods and application to hematopoietic differentiation. Proc. Natl. Acad. Sci. USA
96: 2907–2912.
Tavazoie, S., Hughes, J. D., Campbell, M. J., Cho, R. J., and Church, G. M. (1999). Sys-
tematic determination of genetic network architecture. Nat. Genetics 22: 281–285.
145 Discovery of DNA Regulatory Motifs
Van Helden, J., Andre, B., and Collado-Vides, J. (1998). Extracting regulatory sites from
the upstream region of yeast genes by computational analysis of oligonucleotide fre-
quencies. J. Mol. Biol. 281: 827–842.
Wen, X., Fuhrman, S., Michaels, G. S., Carr, D. B., Smith, S., Barker, J. L., and Somogyi, R.
(1998). Large-scale temporal gene expression mapping of central nervous system devel-
opment. Proc. Natl. Acad. Sci. USA 95: 334–339.
Zhang, X., and Smith, T. F. (1998). Yeast ‘‘operons.’’ Microb. Comp. Genomics 3: 133–
140.
SUGGESTED READING
Brazma, A., Jonassen, I., Eidhammer, I., and Gilbert, D. (1998). Approaches to the auto-
matic discovery of patterns in biosequences. J. Comput. Biol. 5(2): 279–305. Survey of some
other types of pattern discovery algorithms.
Brown, P. O., and Botstein, D. (1999). Exploring the new world of the genome with DNA
microarrays. Nat. Genetics 21: 33–37. Review on microarray technology.
Eisenberg, D., Marcotte, E. M., Xenarios, I., and Yeates, T. O. (2000). Protein function in
the post-genomic era. Nature 405: 823–826. Review of methods for predicting interactions
between nonhomologous genes.
Gralla, J. D., and Collado-Vides, J. (1996). Organization and function of transcription
regulatory elements. In F. C. Neidhardt (ed.), Escherichia coli and Salmonella: Cellular and
Molecular Biology, 2nd ed. Washington, D.C.: American Society for Microbiology, pp.
1232–1245. Review on bacterial transcriptional regulatory motifs.
Sherlock, G. (2000). Analysis of large-scale gene expression data. Curr. Opinion Immunol.
12: 201–205. Review of methods for cluster analysis of microarray data.
URLs FOR RELEVANT SITES
Church lab web page. http://arep.med.harvard.edu
Course Web page for IBSS.
http://arep.med.harvard.edu/labgc/amcguire/IBSS/index.html
Motif Discovery SoftwareGibbsDNA (another Gibbs sampling program available on the Web).
http://argon.cshl.org/ioschikz/gibbsDNA/
Home page for AlignACE; AlignACE and accessory programs can be downloaded here.
http://atlas.med.harvard.edu/
MEME (Multiple EM for Motif Elicitation).
http://meme.sdsc.edu/meme/website/
146 A. M. McGuire and G. M. Church
PRATT program for pattern discovery.
http://www.ii.uib.no/@inge/Pratt.html
Regulatory sequence analysis tools at UNAM.
http://copan.cifn.unam.mx/@jvanheld/rsa-tools/
Regulon PredictionDNA binding-site matrices for 59 known E. coli DNA regulatory motifs.
http://arep.med.harvard.edu/ecoli_matrices/
ExpressDB RNA expression database.
http://arep.med.harvard.edu/cgi-bin/ExpressDByeast/EXDStart
KEGG (Kyoto Encyclopedia of Genes and Genomes) database (metabolic pathways and
functionally related groups of genes). http://star.scl.genome.ad.jp/kegg/
WIT (What Is There?) database (contains database of conserved operons).
http://wit.mcs.anl.gov/WIT2/
Yeast protein function assignment, using phylogenetic profiles and domain fusions.
http://www.doe-mbi.ucla.edu/people/marcotte/yeast.html
147 Discovery of DNA Regulatory Motifs

This page intentionally left blank
7 Gene Networks Description and Modelingin the GeneNet System
Nikolay A. Kolchanov, Elena A. Ananko, Vitali A.
Likhoshvai, Olga A. Podkolodnaya, Elena V.
Ignatieva, Alexander V. Ratushny, and Yuri G.
Matushkin
The molecular genetic systems that control the processes occurring in
organisms on the basis of the hereditary information contained in their
genomes are called gene networks.
Numerous biological, biochemical, and physiological molecular pro-
cesses occur simultaneously in humans, animals, and plants, as well as
in prokaryotes, eukaryotes, and archaea. Cells divide and differentiate,
tissues and organs are formed. Organisms enter into complex inter-
actions with the environment while consuming matter, energy, and in-
formation flows during their growth, development, and reproduction.
All of these diverse processes are regulated genetically. Gene networks,
with groups of genes functioning in concert as their central elements,
are the backbone of this regulation.
Theoretical studies of gene networks commenced in the 1960s. They
considered general organization patterns of molecular genetic systems
controlling functions of prokaryotes (Ratner, 1966) and described the
dynamics of gene networks within the simplest logic schemes (Kauff-
man, 1969; Sugita, 1961). Further studies involved approaches based on
differential equations (Thomas, 1973; Savageau, 1985; Bazhan et al.,
1995; Belova et al., 1995; Likhoshvai et al., 2000) and stochastic models
(McAdams and Arkin, 1997). Numerous methods for mathematical
simulation have been developed, including (1) Boolean networks (San-
chez et al., 1997) allowing gene networks to be reconstructed from
experimental data (Wahde and Hertz, 2000); (2) the logical approach
(Thieffry and Thomas, 1995; Sanchez et al., 1997); (3) Petri nets (Hofes-
tadt and Meineke, 1995); and (4) threshold models (Tchuraev, 1991).
However, insufficient experimental data limited the development of
the theory of gene networks until the mid-1980s. During the 1990s, the
appearance of efficient methods for studying molecular mechanisms
that regulate gene expression and successful research in structural-
functional organizations of various genomes triggered an explosive ac-
cumulation of experimental data on functions of gene networks. This
accumulation led to a wide diversity of databases on various features
of the gene network functions, genetic regulation of metabolic pro-
cesses, morphogenesis, development, and so on. It was a powerful
stimulus for developing both new and earlier methods, approaches,
and algorithms designed to detect functional regularities of biological
systems at all levels of organization.
The search for regularities based on contextual analysis of nucleotide
sequences is considered by McGuire and Church in chapter 6 of this
volume. In chapter 8 of this volume, Huang introduces the application
of logical approaches to the development of multicellular organisms. In
this chapter we consider the problems connected with regularities of
gene network function and point out two aspects of the question: (1)
developing methods for storing and preserving the information accu-
mulated both in experiments and by means of numeric analysis of
mathematical models; (2) working out the methods of compiling and
analyzing mathematical models of gene network functioning.
The databases listed here and many other databases are an impor-
tant source of information for both the experimental study and the
computer analysis of gene networks, genetically controlled metabolic
processes, physiological systems, and other items. The role and signifi-
cance of such databases will grow with the amount of experimental
information on functions of gene networks and genetically controlled
systems and processes. Consequently development of efficient tech-
nologies for accumulating this information in computer databases is of
the utmost importance.
Detailed here is the technology we have developed for computer-
assisted description of gene networks and the database GeneNet, con-
structed using this technology. Analysis of a variety of actual gene
networks (Ananko et al., 1997; Ignatieva et al., 1997; Podkolodnaya and
Stepanenko, 1997; Merkulova et al., 1997) suggested us two impor-
tant methodological principles for development of the technology in
question:
1. The function of any gene network in either a unicellular or a multi-
cellular organism involves a limited set of elementary structures and
150 N. A. Kolchanov et al.
events of their interactions at different hierarchical levels of organiza-
tion (genes, cell nucleus, cytoplasm, nuclear membrane, intercellular
space, tissue, or organ). The specific combination of elementary units and
events generates a tremendous diversity of gene networks with typical
patterns of structural-functional organization and functional modes.
2. In any genetically controlled organism system, it is impossible to
separate in a pure form the genetic component itself (i.e., the compo-
nent that performs the control) and the controlled component (which
provides for a particular biochemical, physiological, or other elemen-
tary function). This means that description of a gene network implies
simultaneous consideration of these components.
This chapter details the technology of gene network description; the
GeneNet database (http://wwwmgs.bionet.nsc.ru/systems/mgl/genenet/), created using this technology and containing the in-formation on more than 20 gene networks of multicellular organisms;
and basic principles of the gene network organization and functions.
We also describe mathematical simulation of biological systems and
illustrate the method used by particular models of gene network
dynamics.
TECHNOLOGY FOR DESCRIBING GENE NETWORKS
Object-Oriented Approach
In the object-oriented approach (Schweigert et al., 1995) the compo-
nents of gene networks in the GeneNet database are divided into ele-
mentary structures (entities) and elementary events (relationships
between the entities). The hierarchy of GeneNet object classes is shown
in figure 7.1.
Elementary Structures We consider the following elementary struc-
tures to be significant for the function of gene networks: gene, RNA,
protein, and nonproteinaceous substance (figure 7.1). This list can be
extended, if necessary, with other elementary structures.
Each object class is described in a separate table, using a specialized
data representation format that takes into account the peculiarities of
each class. The database contains the following tables: GENE, RNA,
PROTEIN, and SUBSTANCE.
151 The GeneNet System
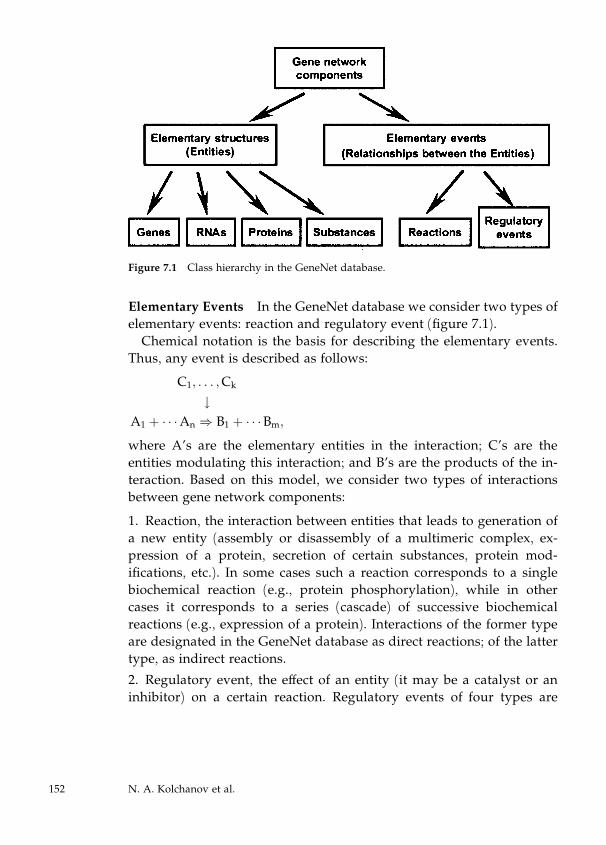
Elementary Events In the GeneNet database we consider two types of
elementary events: reaction and regulatory event (figure 7.1).
Chemical notation is the basis for describing the elementary events.
Thus, any event is described as follows:
C1; . . . ;Ck
#A1 þ � � �An ) B1 þ � � �Bm;where A’s are the elementary entities in the interaction; C’s are the
entities modulating this interaction; and B’s are the products of the in-
teraction. Based on this model, we consider two types of interactions
between gene network components:
1. Reaction, the interaction between entities that leads to generation of
a new entity (assembly or disassembly of a multimeric complex, ex-
pression of a protein, secretion of certain substances, protein mod-
ifications, etc.). In some cases such a reaction corresponds to a single
biochemical reaction (e.g., protein phosphorylation), while in other
cases it corresponds to a series (cascade) of successive biochemical
reactions (e.g., expression of a protein). Interactions of the former type
are designated in the GeneNet database as direct reactions; of the latter
type, as indirect reactions.
2. Regulatory event, the effect of an entity (it may be a catalyst or an
inhibitor) on a certain reaction. Regulatory events of four types are
Figure 7.1 Class hierarchy in the GeneNet database.
152 N. A. Kolchanov et al.
distinguished, depending on their effect on the reaction: switching on,
switching off, positive effect, and negative effect. Regulatory events
described in the GeneNet database are induction of gene expression,
repression of gene expression, activation of signal transduction path-
way by effector molecules, enzymatic catalysis etc.
Levels of Gene Network Representation
The GeneNet system allows the fact that gene network components
may be distributed in various organs, tissues, cells, and cell compart-
ments to be taken into account. As a first approximation, three main
hierarchical levels (organism, cell, and gene) are considered in the de-
scription of the gene network.
Organism Level The entities described at this level are organs, tis-
sues, particular types of cells, and secreted proteins and substances
affecting other organs, tissues, and cells. The description at this level
enables the spatial order of gene network components in the organism
to be considered.
Cell Level The entities described at this level are cell compartments
(for example, cytoplasm, nucleus, and mitochondria), proteins, RNAs,
genes, and substances (e.g., steroids, lipids, energy-stored mole-
cules, metabolites). The description at this level enables distribution of
the gene network components throughout cell compartments to be
considered.
Gene Level Regulation of gene expression is described in detail at
this level employing the information from the TRRD database (Kolcha-
nov et al., 2000).
FORMAT FOR DESCRIBING ELEMENTARY STRUCTURES AND
ELEMENTARY EVENTS
Elementary Structures
The elementary structures essential for the function of gene networks in
the GeneNet database are described in the tables GENE, PROTEIN,
153 The GeneNet System
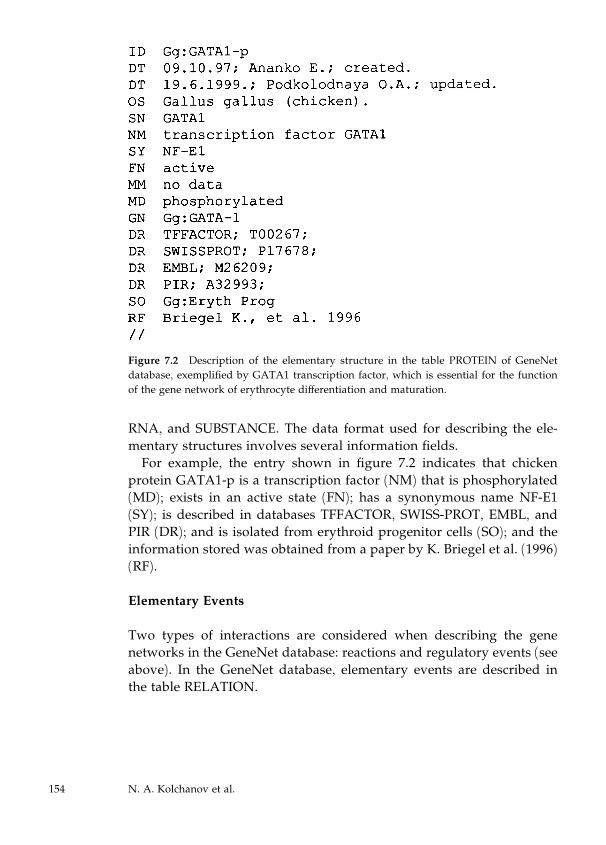
RNA, and SUBSTANCE. The data format used for describing the ele-
mentary structures involves several information fields.
For example, the entry shown in figure 7.2 indicates that chicken
protein GATA1-p is a transcription factor (NM) that is phosphorylated
(MD); exists in an active state (FN); has a synonymous name NF-E1
(SY); is described in databases TFFACTOR, SWISS-PROT, EMBL, and
PIR (DR); and is isolated from erythroid progenitor cells (SO); and the
information stored was obtained from a paper by K. Briegel et al. (1996)
(RF).
Elementary Events
Two types of interactions are considered when describing the gene
networks in the GeneNet database: reactions and regulatory events (see
above). In the GeneNet database, elementary events are described in
the table RELATION.
Figure 7.2 Description of the elementary structure in the table PROTEIN of GeneNet
database, exemplified by GATA1 transcription factor, which is essential for the function
of the gene network of erythrocyte differentiation and maturation.
154 N. A. Kolchanov et al.
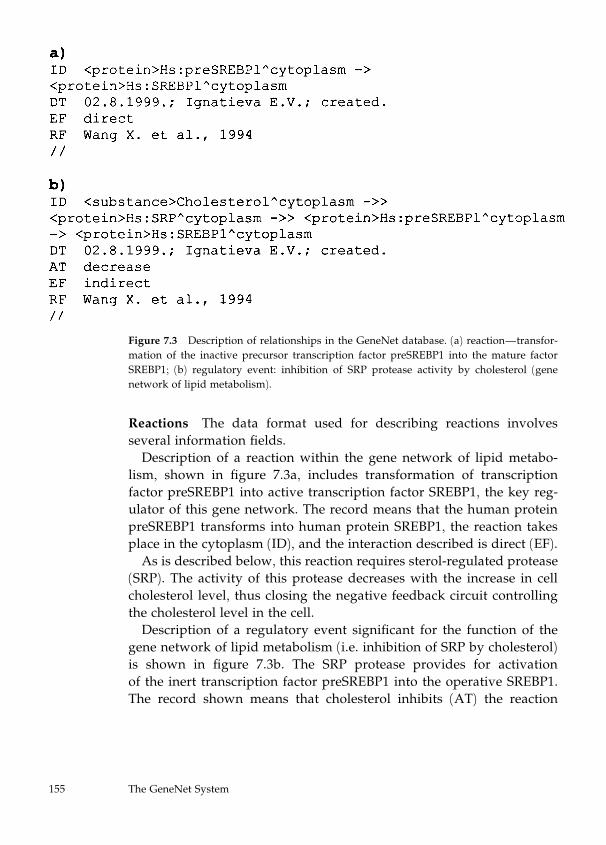
Reactions The data format used for describing reactions involves
several information fields.
Description of a reaction within the gene network of lipid metabo-
lism, shown in figure 7.3a, includes transformation of transcription
factor preSREBP1 into active transcription factor SREBP1, the key reg-
ulator of this gene network. The record means that the human protein
preSREBP1 transforms into human protein SREBP1, the reaction takes
place in the cytoplasm (ID), and the interaction described is direct (EF).
As is described below, this reaction requires sterol-regulated protease
(SRP). The activity of this protease decreases with the increase in cell
cholesterol level, thus closing the negative feedback circuit controlling
the cholesterol level in the cell.
Description of a regulatory event significant for the function of the
gene network of lipid metabolism (i.e. inhibition of SRP by cholesterol)
is shown in figure 7.3b. The SRP protease provides for activation
of the inert transcription factor preSREBP1 into the operative SREBP1.
The record shown means that cholesterol inhibits (AT) the reaction
Figure 7.3 Description of relationships in the GeneNet database. (a) reaction—transfor-
mation of the inactive precursor transcription factor preSREBP1 into the mature factor
SREBP1; (b) regulatory event: inhibition of SRP protease activity by cholesterol (gene
network of lipid metabolism).
155 The GeneNet System
transforming preSREBP1 into active SREBP1, which requires SRP (ID).
The reaction takes place in the cytoplasm and is described as indirect
(EF).
DATA INPUT AND VISUALIZATION OF GENE NETWORK
STRUCTURE
Since the language described is rather complex, the user deals only
with a specially developed graphic interface (GeneNet Data Input GUI)
that generates and interprets the code of the language (Kolpakov and
Ananko, 1999).
With the help of this program, the user can input the data into the
GeneNet database, operating with concepts of molecular biology asso-
ciated with the expression of genes. The input interface automatically
translates the input information into a standard GeneNet format,
examples of which were considered above.
A specialized JAVA program, GeneNet Viewer, processes the for-
malized data accumulated in the GeneNet database and presents it to
the user as a graphic diagram (Kolpakov et al., 1998). The Viewer
allows the GeneNet database to be explored and visualized through the
Internet and includes tools for automated generation of gene network
diagrams, a system of filters, tools for data navigation, on-line help,
interactive cross-references within the GeneNet database, and refer-
ences to other databases (figure 7.4). A standard set of images corre-
sponding to elementary structures and events is used for gene network
visualization. Figure 7.5 demonstrates standard GeneNet graphical
representation of the elementary structures and events, some of which
(figure 7.5c,d) are described in figure 7.3.
TYPICAL EXAMPLES OF GENE NETWORKS DESCRIBED IN THE
GENENET DATABASE
Analysis of the information contained in the GeneNet database and the
available literature suggests several basic types of gene networks.
1. Gene networks controlling cyclic processes, such as the cell cycle
and the cycle of heart muscle contraction
2. Gene networks underlying cell growth and differentiation, morpho-
genesis of tissues and organs, growth and development of the organism
156 N. A. Kolchanov et al.
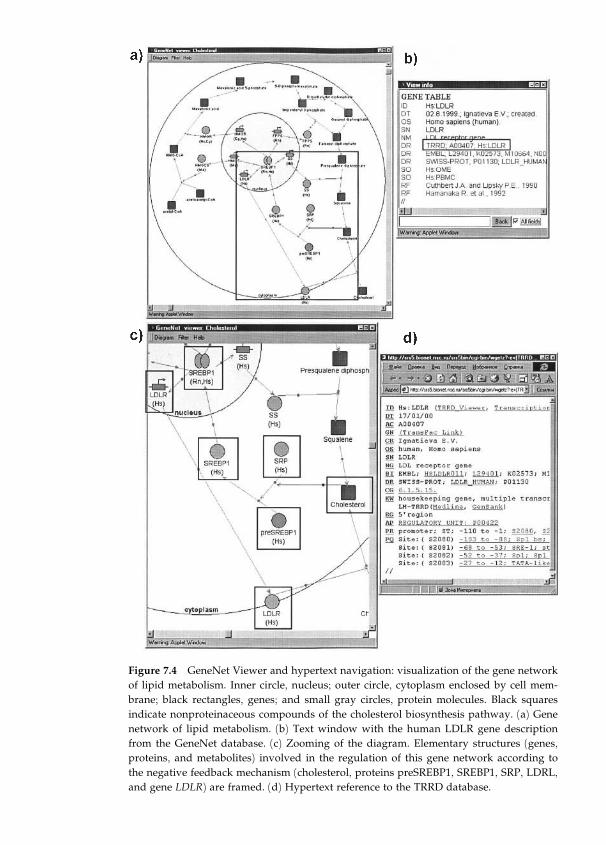
Figure 7.4 GeneNet Viewer and hypertext navigation: visualization of the gene network
of lipid metabolism. Inner circle, nucleus; outer circle, cytoplasm enclosed by cell mem-
brane; black rectangles, genes; and small gray circles, protein molecules. Black squares
indicate nonproteinaceous compounds of the cholesterol biosynthesis pathway. (a) Gene
network of lipid metabolism. (b) Text window with the human LDLR gene description
from the GeneNet database. (c) Zooming of the diagram. Elementary structures (genes,
proteins, and metabolites) involved in the regulation of this gene network according to
the negative feedback mechanism (cholesterol, proteins preSREBP1, SREBP1, SRP, LDRL,
and gene LDLR) are framed. (d) Hypertext reference to the TRRD database.
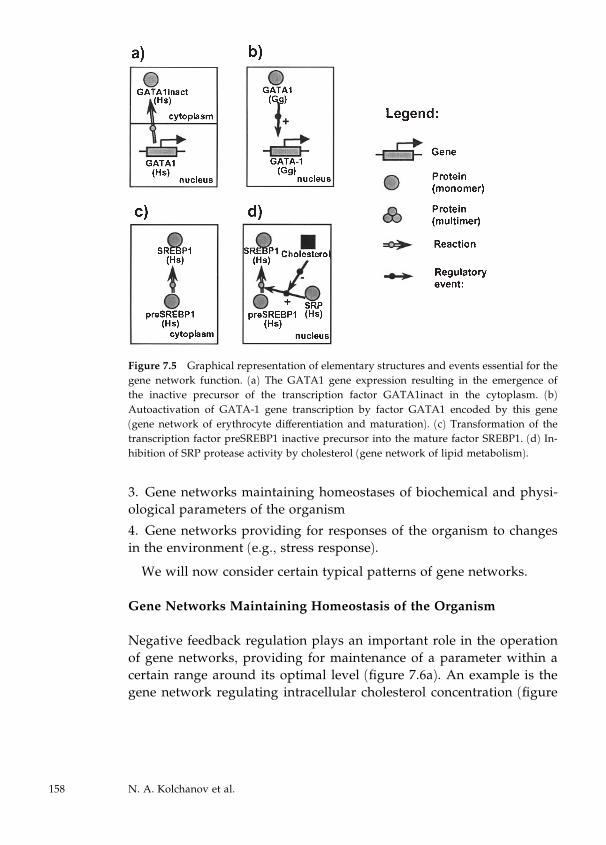
3. Gene networks maintaining homeostases of biochemical and physi-
ological parameters of the organism
4. Gene networks providing for responses of the organism to changes
in the environment (e.g., stress response).
We will now consider certain typical patterns of gene networks.
Gene Networks Maintaining Homeostasis of the Organism
Negative feedback regulation plays an important role in the operation
of gene networks, providing for maintenance of a parameter within a
certain range around its optimal level (figure 7.6a). An example is the
gene network regulating intracellular cholesterol concentration (figure
Figure 7.5 Graphical representation of elementary structures and events essential for the
gene network function. (a) The GATA1 gene expression resulting in the emergence of
the inactive precursor of the transcription factor GATA1inact in the cytoplasm. (b)
Autoactivation of GATA-1 gene transcription by factor GATA1 encoded by this gene
(gene network of erythrocyte differentiation and maturation). (c) Transformation of the
transcription factor preSREBP1 inactive precursor into the mature factor SREBP1. (d) In-
hibition of SRP protease activity by cholesterol (gene network of lipid metabolism).
158 N. A. Kolchanov et al.
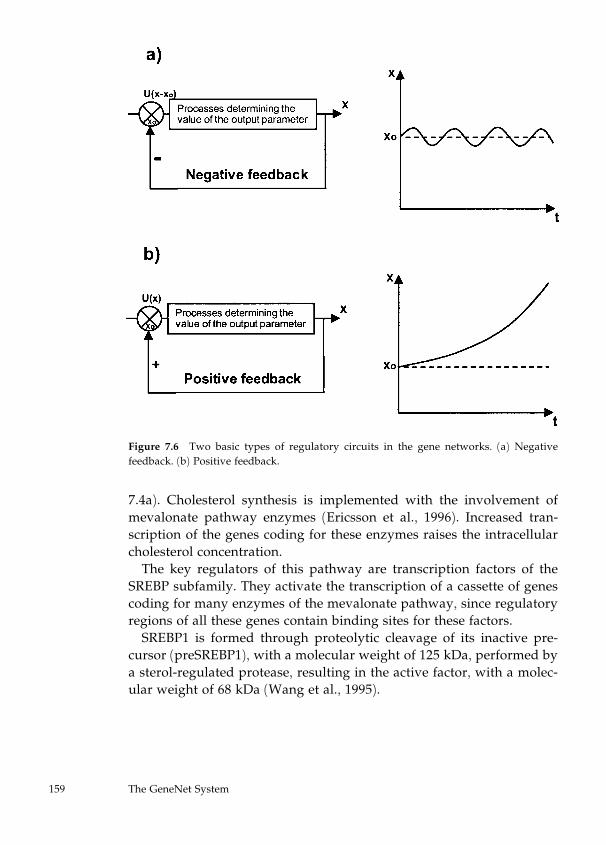
7.4a). Cholesterol synthesis is implemented with the involvement of
mevalonate pathway enzymes (Ericsson et al., 1996). Increased tran-
scription of the genes coding for these enzymes raises the intracellular
cholesterol concentration.
The key regulators of this pathway are transcription factors of the
SREBP subfamily. They activate the transcription of a cassette of genes
coding for many enzymes of the mevalonate pathway, since regulatory
regions of all these genes contain binding sites for these factors.
SREBP1 is formed through proteolytic cleavage of its inactive pre-
cursor (preSREBP1), with a molecular weight of 125 kDa, performed by
a sterol-regulated protease, resulting in the active factor, with a molec-
ular weight of 68 kDa (Wang et al., 1995).
Figure 7.6 Two basic types of regulatory circuits in the gene networks. (a) Negative
feedback. (b) Positive feedback.
159 The GeneNet System
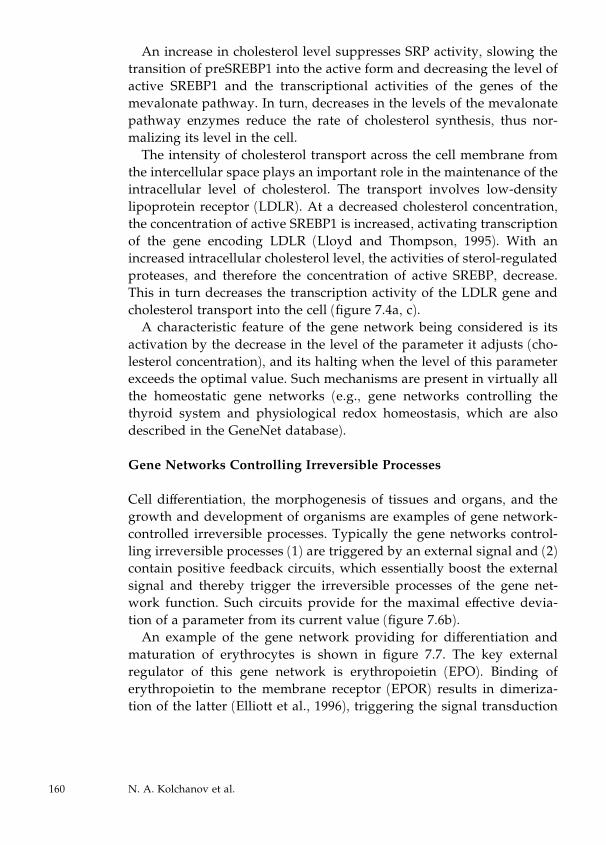
An increase in cholesterol level suppresses SRP activity, slowing the
transition of preSREBP1 into the active form and decreasing the level of
active SREBP1 and the transcriptional activities of the genes of the
mevalonate pathway. In turn, decreases in the levels of the mevalonate
pathway enzymes reduce the rate of cholesterol synthesis, thus nor-
malizing its level in the cell.
The intensity of cholesterol transport across the cell membrane from
the intercellular space plays an important role in the maintenance of the
intracellular level of cholesterol. The transport involves low-density
lipoprotein receptor (LDLR). At a decreased cholesterol concentration,
the concentration of active SREBP1 is increased, activating transcription
of the gene encoding LDLR (Lloyd and Thompson, 1995). With an
increased intracellular cholesterol level, the activities of sterol-regulated
proteases, and therefore the concentration of active SREBP, decrease.
This in turn decreases the transcription activity of the LDLR gene and
cholesterol transport into the cell (figure 7.4a, c).
A characteristic feature of the gene network being considered is its
activation by the decrease in the level of the parameter it adjusts (cho-
lesterol concentration), and its halting when the level of this parameter
exceeds the optimal value. Such mechanisms are present in virtually all
the homeostatic gene networks (e.g., gene networks controlling the
thyroid system and physiological redox homeostasis, which are also
described in the GeneNet database).
Gene Networks Controlling Irreversible Processes
Cell differentiation, the morphogenesis of tissues and organs, and the
growth and development of organisms are examples of gene network-
controlled irreversible processes. Typically the gene networks control-
ling irreversible processes (1) are triggered by an external signal and (2)
contain positive feedback circuits, which essentially boost the external
signal and thereby trigger the irreversible processes of the gene net-
work function. Such circuits provide for the maximal effective devia-
tion of a parameter from its current value (figure 7.6b).
An example of the gene network providing for differentiation and
maturation of erythrocytes is shown in figure 7.7. The key external
regulator of this gene network is erythropoietin (EPO). Binding of
erythropoietin to the membrane receptor (EPOR) results in dimeriza-
tion of the latter (Elliott et al., 1996), triggering the signal transduction
160 N. A. Kolchanov et al.
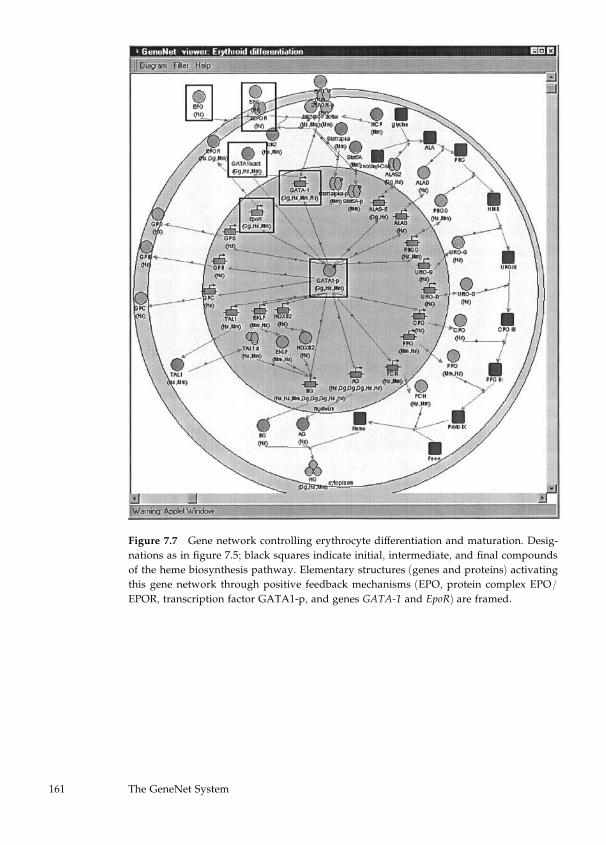
Figure 7.7 Gene network controlling erythrocyte differentiation and maturation. Desig-
nations as in figure 7.5; black squares indicate initial, intermediate, and final compounds
of the heme biosynthesis pathway. Elementary structures (genes and proteins) activating
this gene network through positive feedback mechanisms (EPO, protein complex EPO/
EPOR, transcription factor GATA1-p, and genes GATA-1 and EpoR) are framed.
161 The GeneNet System
pathway implemented by cell protein kinases. As a result, certain tran-
scription factors are phosphorylated, transferred to the nucleus, and
acetylated (Boyes et al., 1998; Zhang et al., 1998). They activate tran-
scription of several genes, including the gene coding for transcription
factor GATA1 (figure 7.7) (Dalyot et al., 1993).
Transcription factor GATA1 is the key regulator of erythrocyte dif-
ferentiation and maturation. The presence of GATA1 binding sites in
regulatory regions of virtually all the genes constituting this gene net-
work underlies its key regulatory role.
The transcription factor GATA1 provides two positive feedback cir-
cuits that boost the initial differentiation signal received by the eryth-
ropoietin receptor through its interaction with erythropoietin, and
conveyed to the cell nucleus by the signal transduction pathway.
The first circuit functions as follows. Expression of the gene GATA1
results in the appearance of the inactive transcription factor precursor
GATA1inact in the cytoplasm (figure 7.5a). This precursor enters the
cell nucleus and acts there in a phosphorylated form (GATA1-p) with
its binding site in the promoter of the GATA1 gene. The presence of
GATA1 binding sites in the promoter of its own gene results in a rapid
self-enhancement of its transcription (figure 7.5b) according to the posi-
tive feedback mechanism (Tsai et al., 1991). This positive feedback is
very efficient and rapid because no other mediator genes are involved
in its function.
The second positive feedback circuit, enhancing the GATA1 gene
transcription, functions in the following way. The GATA1 binding site
is present in the promoter of the erythropoietin receptor (EPOR) gene
(Chin et al., 1995). Transcription activation of this gene increases the
number of erythropoietin receptor molecules on the cell membrane
and, correspondingly, the intensity of signal transduction from eryth-
ropoietin via its receptor to the gene GATA1. Thus, this positive feed-
back circuit is closed, providing for additional self-enhancement of the
GATA1 gene transcription.
When this positive feedback brings the level of transcription factor
GATA1-p to a threshold value, transcription of a cassette of genes is
activated simultaneously. This cassette includes genes coding for (1) a-
and b-subunits of hemoglobin (BG and AG in figure 7.7) (Gourdon et
al., 1992; Jackson et al., 1995) and (2) heme biosynthesis enzymes
(ALAS-E, ALAD, PBGD, URO-S, CPO, and FCH in figure 7.7) (Surinya
162 N. A. Kolchanov et al.
et al., 1997; Kaya et al., 1994; Mignotte et al., 1989; Tanabe et al., 1997;
Tugores et al., 1994). Transcription of the cassette of genes encoding cell
surface antigens (GPD, GPB, and GPC) is also activated (Gregory et al.,
1996; Colin et al., 1990; Iwamoto et al., 1996). Finally, transcription of
the cassette of genes encoding transcription factors (HOXB2, TAL1, and
EKLF in figure 7.7), particularly important for switching to differentia-
tion, is activated (Lecointe et al., 1994; Vieille-Grosjean and Huber,
1995; Crossley et al., 1994). These factors provide for an additional
stimulation of erythroid-specific genes. In this way a cascade of pro-
cesses ensuring the terminal differentiation and maturation of the
erythrocyte is triggered.
The cassette-like activation of genes, positive regulatory effects, and
the key activators are observed in virtually all the gene networks
described in the GeneNet database that trigger irreversible processes in
the organism.
MATHEMATICAL SIMULATION OF GENE NETWORK
FUNCTIONAL DYNAMICS
Before considering the main body of results, some introductory
remarks on specifics of the objects simulated are necessary because they
essentially determined our selection of the simulation tools.
First, even the simplest gene networks comprise dozens of physical
components and interactions between them. Typically, gene networks
are composed of hundreds of elements and more. Structural-functional
organizations of many gene networks have been clarified in sufficient
detail. Of the utmost importance is the fact that, despite their great di-
versity, the structural-functional organization of gene networks permits
them to be directly and graphically represented by means of chemical
kinetic description of elementary events constituting the gene network
function.
Second, gene networks as actual objects exist simultaneously in a
variety of different physical (material) forms due to such natural phe-
nomena as gene polyallelism, genetic rearrangements, and performance
of similar functions in different organisms. The more complex a gene
network is, the wider the permissible diversity range of its variants.
The number of variants is increased considerably by construction of
artificial systems (such as expression vectors). In addition, gene net-
works themselves are elements of more complex biological systems.
163 The GeneNet System
Thus, the methods used for formalization should allow not only
analysis of the initial gene networks and their minor modifications
(mutations), but also calculation of the dynamics of virtually any
genetic variants constructed from them. In other words, any model
of a gene network should potentially contain models of many gene
networks, including those drastically different from the initial one. A
generalized chemical kinetic method, developed earlier and already
applied to simulation of various gene networks (Bazhan et al., 1995;
Belova et al., 1995; Likhoshvai et al., 2000), meets all these require-
ments. This method provides a precise and effective simulation of the
gene network performance patterns because its computer realization
adequately reflects the basic properties of biological systems.
BRIEF DESCRIPTION OF GENERALIZED CHEMICAL KINETIC
SIMULATION METHOD
The generalized chemical kinetic simulation method is oriented to a
formalized, primarily portrait, description of the performance patterns
of arbitrary biological systems. Formalization is performed according
to a block principle: a simulated system is divided into elementary
subsystems in order to describe each subsystem individually. Ele-
mentary subsystems are described in terms of formal blocks. A formal
block is uniquely characterized by an ordered list of formal dynamic
variables X, an ordered list of formal parameters P, and the law of in-
formation transformation F (figure 7.8). The law of information trans-
formation F can be uninterrupted, discrete, logical, or stochastic. The
choice of elementary process description is determined by the nature of
a biological process, the task to be solved, and the preference of a
model’s author. Therefore the models worked out within the general-
ized kinetic simulation method are generally hybrid (i.e., they can have
uninterrupted, discrete, logical, and other blocks). The models that be-
long to the systems of common differential equations with a rational
right-hand side are an important class of models for successful
descriptions of gene network functioning. Such models appear when
elementary blocks with differential equations expressing the immediate
rate of concentration changes through immediate values of component
concentration changes (mRNA, proteins, nonproteinaceous substrates,
their complexes, etc.) in a simulated system are used as a law of infor-
mation transformation.
164 N. A. Kolchanov et al.
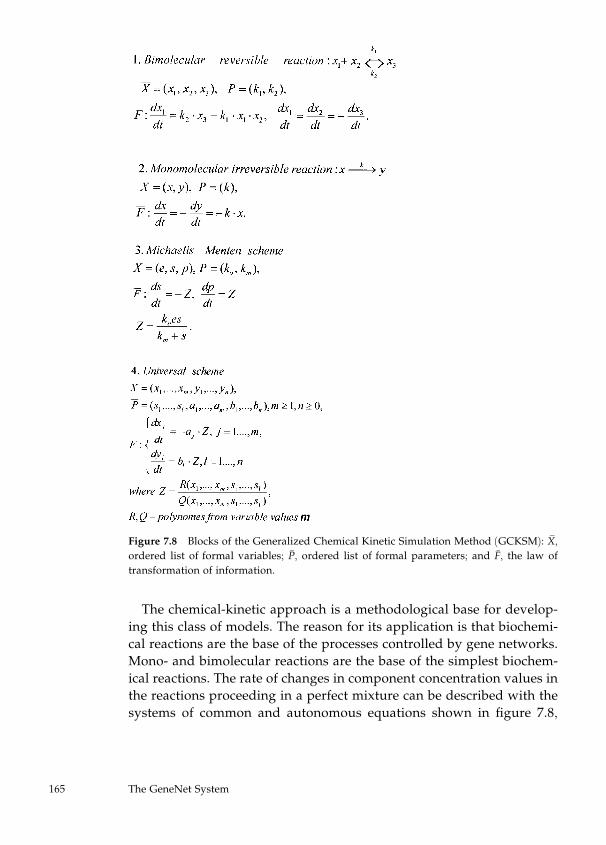
The chemical-kinetic approach is a methodological base for develop-
ing this class of models. The reason for its application is that biochemi-
cal reactions are the base of the processes controlled by gene networks.
Mono- and bimolecular reactions are the base of the simplest biochem-
ical reactions. The rate of changes in component concentration values in
the reactions proceeding in a perfect mixture can be described with the
systems of common and autonomous equations shown in figure 7.8,
Figure 7.8 Blocks of the Generalized Chemical Kinetic Simulation Method (GCKSM): X,
ordered list of formal variables; P, ordered list of formal parameters; and F, the law of
transformation of information.
165 The GeneNet System
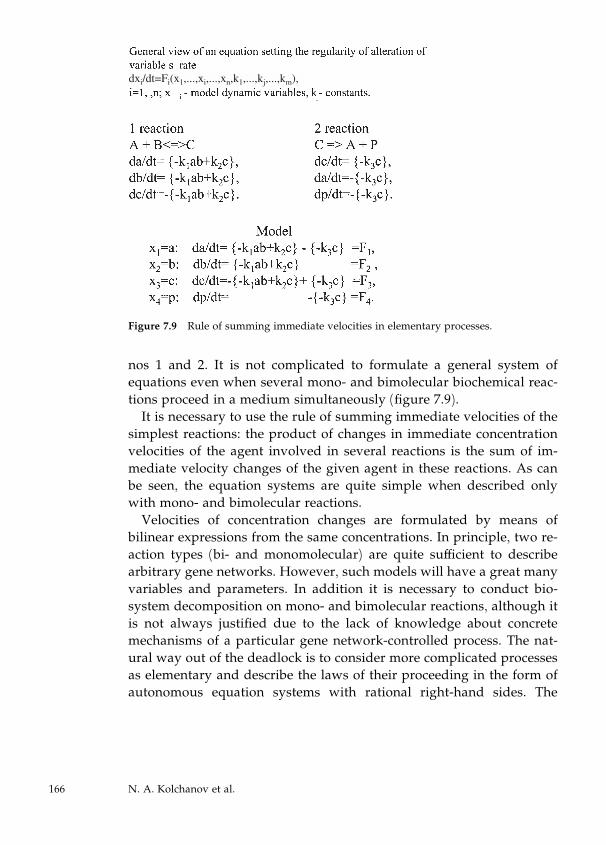
nos 1 and 2. It is not complicated to formulate a general system of
equations even when several mono- and bimolecular biochemical reac-
tions proceed in a medium simultaneously (figure 7.9).
It is necessary to use the rule of summing immediate velocities of the
simplest reactions: the product of changes in immediate concentration
velocities of the agent involved in several reactions is the sum of im-
mediate velocity changes of the given agent in these reactions. As can
be seen, the equation systems are quite simple when described only
with mono- and bimolecular reactions.
Velocities of concentration changes are formulated by means of
bilinear expressions from the same concentrations. In principle, two re-
action types (bi- and monomolecular) are quite sufficient to describe
arbitrary gene networks. However, such models will have a great many
variables and parameters. In addition it is necessary to conduct bio-
system decomposition on mono- and bimolecular reactions, although it
is not always justified due to the lack of knowledge about concrete
mechanisms of a particular gene network-controlled process. The nat-
ural way out of the deadlock is to consider more complicated processes
as elementary and describe the laws of their proceeding in the form of
autonomous equation systems with rational right-hand sides. The
Figure 7.9 Rule of summing immediate velocities in elementary processes.
166 N. A. Kolchanov et al.
Michaelis-Menten equation, frequently used in approximate descrip-
tions of enzyme synthesis, is one of the most famous examples (figure
7.8, no. 3). More complicated reactions will be described with more
complicated equations. The right-hand sides can be arbitrarily rational
in a general case (figure 7.8, no. 4).
Since the rule of summing up immediate velocities does not depend
on the internal complexity of elementary processes, it does not make
the procedure of formulating a complete equation system more com-
plicated. The total of agent concentration velocity changes is still the
sum of the velocity changes in all elementary processes. It allows us
to formulate a common approach to the description of regularities in
the functioning of biological systems, particularly gene networks. The
simulated system splits into simpler parts that will be considered ele-
mentary. Further on, elementary processes will be the building blocks
used to develop the models not only of initial systems but also of their
various modifications.
A great number of other models can be developed out of elementary
processes in general, since any integration of an elementary process is a
potential model. In particular it is possible to construct the models of
practically arbitrary genetic variants of the initial network. There is no
need to construct all the models at once; each particular model is con-
structed as required. Our method in its most general realization
(Likhoshvai et al., 2000) implies the possibility of simulation not only of
trans-interactions but also of cis-interactions. The latter should be taken
into account in cases where patterns of gene network performance de-
pend not only on the functions, but also on relative location, of the
genes involved.
MATHEMATICAL MODEL OF REGULATION OF CHOLESTEROL
BIOSYNTHESIS IN THE CELL
Cholesterol, an amphiphilic lipid, is an essential structural component
of the cell membrane and the outer layer of the lipoproteins of blood
plasma. Simultaneously it is a precursor of corticosteroids, sex hor-
mones, bile acids, and vitamin D. Cholesterol is synthesized from ace-
tyl-CoA, and its major fraction in the blood plasma is in the low-
density lipoproteins (LDL). Cholesterol is removed from tissues with
involvement of high-density lipoproteins (HDL) to be transported to
the liver and transformed there into bile acids. In pathology, cholesterol
167 The GeneNet System
is a factor causing atherosclerosis of vital cerebral arteries, heart mus-
cle, and other organs. A high ratio of LDL cholesterol to HDL choles-
terol in the plasma is observed in coronary atherosclerosis. This reveals
the great biomedical and applied importance of studying cholesterol
turnover in the organism.
The gene network regulating intracellular cholesterol biosynthesis
has now been studied in sufficient detail. Data on its performance pat-
terns are accumulated in the GeneNet database (http://wwwmgs.bionet.nsc.ru/systems/mgl/genenet/). Acetyl-CoA is the
source of all the carbon atoms of the cholesterol molecule. The choles-
terol biosynthesis pathway has numerous stages and is controlled
by a variety of enzymes, including HMG-CoA reductase, farnesyl
diphosphate synthetase, and squalene synthetase. Syntheses of these
enzymes are activated by SREBP. The activity of SREBP depends, in
turn, on the intracellular cholesterol concentration in a negative feed-
back mode: the lower the concentration of metabolically active choles-
terol in the cell, the higher the SREBP activity.
We have developed a model of functional dynamics of this gene net-
work. It describes all the stages of cholesterol biosynthesis shown in
figure 7.4a as edges with adjacent nodes. In addition, the model
describes the mechanisms underlying the interchange of intracellular
and blood cholesterol. Negative feedbacks whereby cholesterol controls
its own synthesis and the synthesis of LDL receptors at the transcrip-
tion level (Wang et al., 1994) are also considered. The model fragment
that consists of three equations describing the cycle of molecules acetyl-
CoA, acetoacetyl-CoA, and HMG-CoA—three cholesterol precursors—
is presented in figure 7.10. The equations are based on considering six
processes in which they are agents. Right-hand equation members cor-
responding to one process are in braces and accompanied by indexes,
displayed as subscripts, following the right brace: 1, entry of acetyl-
CoA into the medium of the gene network functioning; 2, tiolase-cata-
lyzed synthesis of acetoacetyl-CoA from two molecules of acetyl-CoA;
3 and 4, withdrawal of acetyl-CoA and acetoacetyl-CoA from the me-
dium; 5, HMG-CoA synthase (HMGCS)-catalyzed synthesis of HMG-
CoA from acetoacetyl-CoA and acetyl-CoA; 6, HMG reductase
(HMGR)-catalyzed synthesis of mevalonic acid from HMG-CoA.
In totally, the model comprises 65 elementary processes. The model
of performance dynamics of this gene network described in the Gene-
Net database contains 40 products (dynamic variables) and 93 con-
stants. Values of a number of constants were assessed using the
168 N. A. Kolchanov et al.
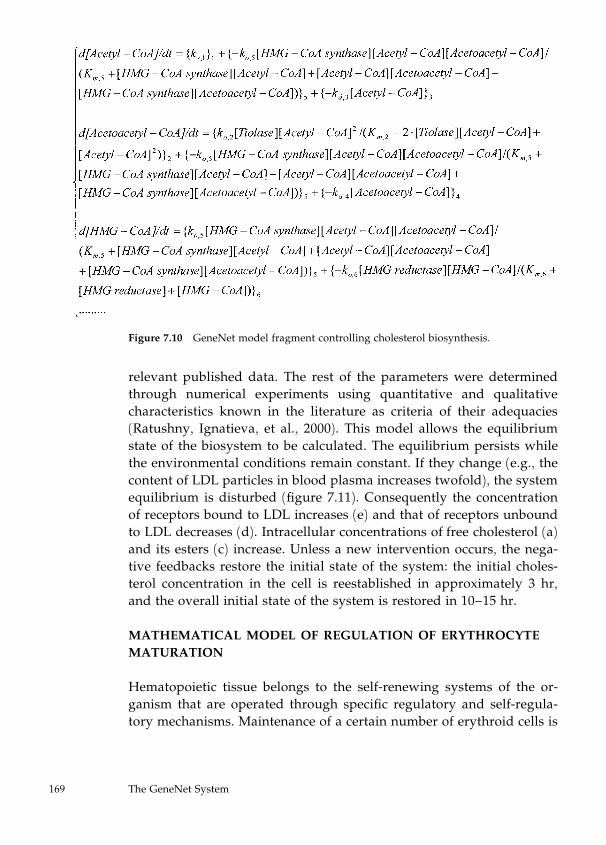
relevant published data. The rest of the parameters were determined
through numerical experiments using quantitative and qualitative
characteristics known in the literature as criteria of their adequacies
(Ratushny, Ignatieva, et al., 2000). This model allows the equilibrium
state of the biosystem to be calculated. The equilibrium persists while
the environmental conditions remain constant. If they change (e.g., the
content of LDL particles in blood plasma increases twofold), the system
equilibrium is disturbed (figure 7.11). Consequently the concentration
of receptors bound to LDL increases (e) and that of receptors unbound
to LDL decreases (d). Intracellular concentrations of free cholesterol (a)
and its esters (c) increase. Unless a new intervention occurs, the nega-
tive feedbacks restore the initial state of the system: the initial choles-
terol concentration in the cell is reestablished in approximately 3 hr,
and the overall initial state of the system is restored in 10–15 hr.
MATHEMATICAL MODEL OF REGULATION OF ERYTHROCYTE
MATURATION
Hematopoietic tissue belongs to the self-renewing systems of the or-
ganism that are operated through specific regulatory and self-regula-
tory mechanisms. Maintenance of a certain number of erythroid cells is
Figure 7.10 GeneNet model fragment controlling cholesterol biosynthesis.
169 The GeneNet System
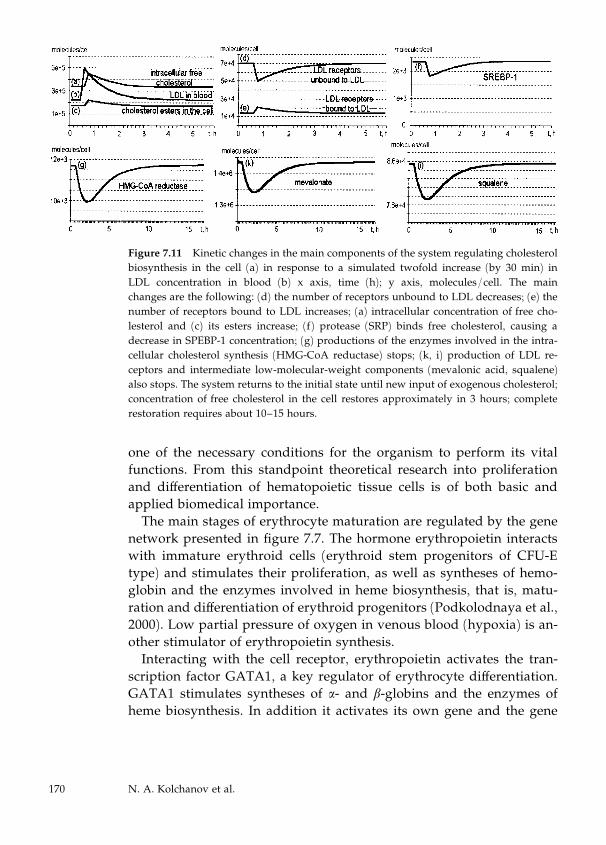
one of the necessary conditions for the organism to perform its vital
functions. From this standpoint theoretical research into proliferation
and differentiation of hematopoietic tissue cells is of both basic and
applied biomedical importance.
The main stages of erythrocyte maturation are regulated by the gene
network presented in figure 7.7. The hormone erythropoietin interacts
with immature erythroid cells (erythroid stem progenitors of CFU-E
type) and stimulates their proliferation, as well as syntheses of hemo-
globin and the enzymes involved in heme biosynthesis, that is, matu-
ration and differentiation of erythroid progenitors (Podkolodnaya et al.,
2000). Low partial pressure of oxygen in venous blood (hypoxia) is an-
other stimulator of erythropoietin synthesis.
Interacting with the cell receptor, erythropoietin activates the tran-
scription factor GATA1, a key regulator of erythrocyte differentiation.
GATA1 stimulates syntheses of a- and b-globins and the enzymes of
heme biosynthesis. In addition it activates its own gene and the gene
Figure 7.11 Kinetic changes in the main components of the system regulating cholesterol
biosynthesis in the cell (a) in response to a simulated twofold increase (by 30 min) in
LDL concentration in blood (b) x axis, time (h); y axis, molecules/cell. The main
changes are the following: (d) the number of receptors unbound to LDL decreases; (e) the
number of receptors bound to LDL increases; (a) intracellular concentration of free cho-
lesterol and (c) its esters increase; (f) protease (SRP) binds free cholesterol, causing a
decrease in SPEBP-1 concentration; (g) productions of the enzymes involved in the intra-
cellular cholesterol synthesis (HMG-CoA reductase) stops; (k, i) production of LDL re-
ceptors and intermediate low-molecular-weight components (mevalonic acid, squalene)
also stops. The system returns to the initial state until new input of exogenous cholesterol;
concentration of free cholesterol in the cell restores approximately in 3 hours; complete
restoration requires about 10–15 hours.
170 N. A. Kolchanov et al.
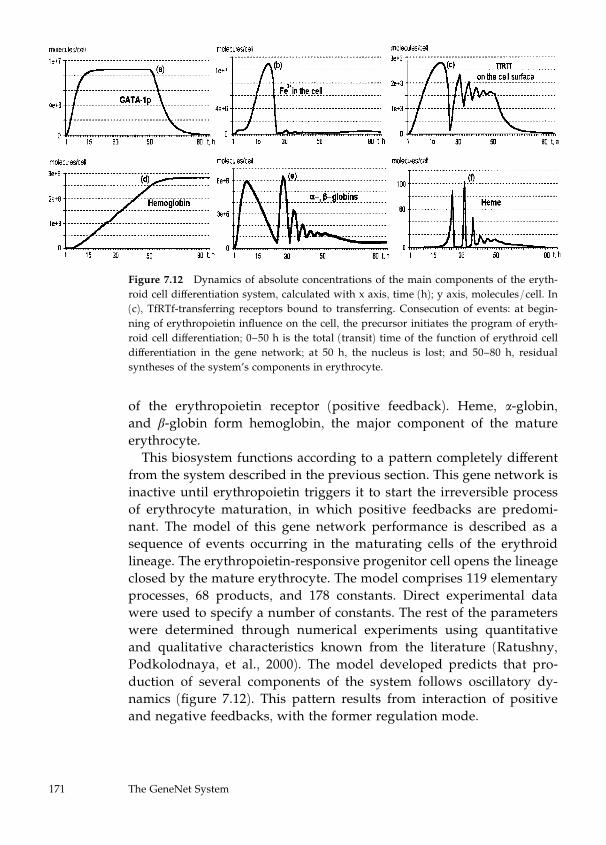
of the erythropoietin receptor (positive feedback). Heme, a-globin,
and b-globin form hemoglobin, the major component of the mature
erythrocyte.
This biosystem functions according to a pattern completely different
from the system described in the previous section. This gene network is
inactive until erythropoietin triggers it to start the irreversible process
of erythrocyte maturation, in which positive feedbacks are predomi-
nant. The model of this gene network performance is described as a
sequence of events occurring in the maturating cells of the erythroid
lineage. The erythropoietin-responsive progenitor cell opens the lineage
closed by the mature erythrocyte. The model comprises 119 elementary
processes, 68 products, and 178 constants. Direct experimental data
were used to specify a number of constants. The rest of the parameters
were determined through numerical experiments using quantitative
and qualitative characteristics known from the literature (Ratushny,
Podkolodnaya, et al., 2000). The model developed predicts that pro-
duction of several components of the system follows oscillatory dy-
namics (figure 7.12). This pattern results from interaction of positive
and negative feedbacks, with the former regulation mode.
Figure 7.12 Dynamics of absolute concentrations of the main components of the eryth-
roid cell differentiation system, calculated with x axis, time (h); y axis, molecules/cell. In
(c), TfRTf-transferring receptors bound to transferring. Consecution of events: at begin-
ning of erythropoietin influence on the cell, the precursor initiates the program of eryth-
roid cell differentiation; 0–50 h is the total (transit) time of the function of erythroid cell
differentiation in the gene network; at 50 h, the nucleus is lost; and 50–80 h, residual
syntheses of the system’s components in erythrocyte.
171 The GeneNet System
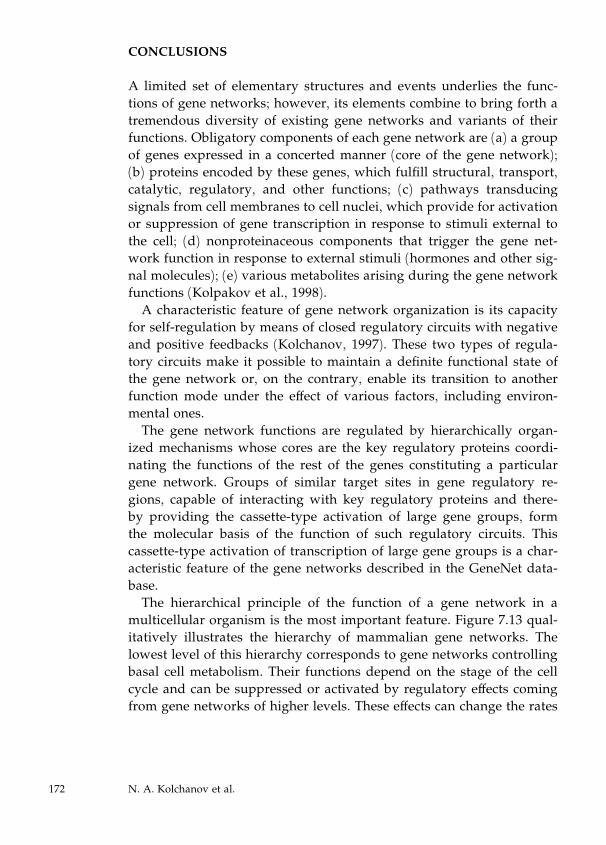
CONCLUSIONS
A limited set of elementary structures and events underlies the func-
tions of gene networks; however, its elements combine to bring forth a
tremendous diversity of existing gene networks and variants of their
functions. Obligatory components of each gene network are (a) a group
of genes expressed in a concerted manner (core of the gene network);
(b) proteins encoded by these genes, which fulfill structural, transport,
catalytic, regulatory, and other functions; (c) pathways transducing
signals from cell membranes to cell nuclei, which provide for activation
or suppression of gene transcription in response to stimuli external to
the cell; (d) nonproteinaceous components that trigger the gene net-
work function in response to external stimuli (hormones and other sig-
nal molecules); (e) various metabolites arising during the gene network
functions (Kolpakov et al., 1998).
A characteristic feature of gene network organization is its capacity
for self-regulation by means of closed regulatory circuits with negative
and positive feedbacks (Kolchanov, 1997). These two types of regula-
tory circuits make it possible to maintain a definite functional state of
the gene network or, on the contrary, enable its transition to another
function mode under the effect of various factors, including environ-
mental ones.
The gene network functions are regulated by hierarchically organ-
ized mechanisms whose cores are the key regulatory proteins coordi-
nating the functions of the rest of the genes constituting a particular
gene network. Groups of similar target sites in gene regulatory re-
gions, capable of interacting with key regulatory proteins and there-
by providing the cassette-type activation of large gene groups, form
the molecular basis of the function of such regulatory circuits. This
cassette-type activation of transcription of large gene groups is a char-
acteristic feature of the gene networks described in the GeneNet data-
base.
The hierarchical principle of the function of a gene network in a
multicellular organism is the most important feature. Figure 7.13 qual-
itatively illustrates the hierarchy of mammalian gene networks. The
lowest level of this hierarchy corresponds to gene networks controlling
basal cell metabolism. Their functions depend on the stage of the cell
cycle and can be suppressed or activated by regulatory effects coming
from gene networks of higher levels. These effects can change the rates
172 N. A. Kolchanov et al.
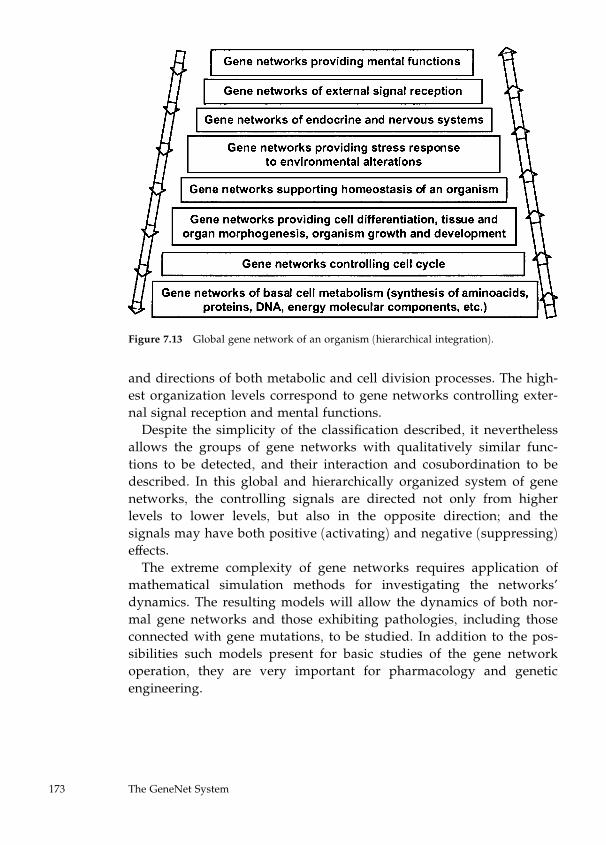
and directions of both metabolic and cell division processes. The high-
est organization levels correspond to gene networks controlling exter-
nal signal reception and mental functions.
Despite the simplicity of the classification described, it nevertheless
allows the groups of gene networks with qualitatively similar func-
tions to be detected, and their interaction and cosubordination to be
described. In this global and hierarchically organized system of gene
networks, the controlling signals are directed not only from higher
levels to lower levels, but also in the opposite direction; and the
signals may have both positive (activating) and negative (suppressing)
effects.
The extreme complexity of gene networks requires application of
mathematical simulation methods for investigating the networks’
dynamics. The resulting models will allow the dynamics of both nor-
mal gene networks and those exhibiting pathologies, including those
connected with gene mutations, to be studied. In addition to the pos-
sibilities such models present for basic studies of the gene network
operation, they are very important for pharmacology and genetic
engineering.
Figure 7.13 Global gene network of an organism (hierarchical integration).
173 The GeneNet System
REFERENCES
Anan’ko, E. A., Bazhan, S. I., Belova, O. E., and Kel’, A. E. (1997). Mechanisms of tran-
scription of the interferon-induced genes: A description in the IIG-TRRD information
system. Molec. Biol. (Mosk) 31: 592–605.
Bazhan, S. I., Likhoshvai, V. A., and Belova, O. E. (1995). Theoretical analysis of the reg-
ulation of interferon expression during priming and blocking. J. Theor. Biol. 175: 149–160.
Belova, O. E., Likhoshvai, V. A., Bazhan, S. I., and Kulichkov, V. A. (1995). Computer
system for investigation and integrated description of molecular-genetic system regula-
tion of interferon induction and action. CABIOS 11: 213–218.
Boyes, J., Byfield, P., Nakatani, Y., and Ogryzko, V. (1998). Regulation of activity of the
transcription factor GATA-1 by acetylation. Nature 396: 594–598.
Briegel, K., Bartunek, P., Stengl, G., Lim, K. C., Beug, H., Engel, J. D., and Zenke, M.
(1996). Regulation and function of transcription factor GATA-1 during red blood cell dif-
ferentiation. Development 122: 3839–3850.
Chin, K., Oda, N., Shen, K., and Noguchi, C. T. (1995). Regulation of transcription of the
human erythropoietin receptor gene by proteins binding to GATA-1 and Sp1 motifs.
Nucleic Acids Res. 23: 3041–3049.
Colin, Y., Joulin, V., Le Van Kim, C., Romeo, P. H., and Cartron, J.-P. (1990). Character-
ization of a new erythroid/megakaryocyte-specific nuclear factor that binds the promoter
of the housekeeping human glycophorin C gene. J. Biol. Chem. 265: 16729–16732.
Crossley, M., Tsang, A. P., Bieker, J., and Orkin, S. H. (1994). Regulation of the erythroid
Kruppel-like factor (EKLF) gene promoter by the erythroid transcription factor GATA-1.
J. Biol. Chem. 269: 15440–15444.
Dalyot, N., Fibach, E., Ronchi, A., Rachmilewitz, E. A., Ottolenghi, S., and Oppenheim, A.
(1993). Erythropoietin triggers a burst of GATA-1 in normal human erythroid cells differ-
entiating in tissue culture. Nucleic Acids Res. 21: 4031–4037.
Elliott, S., Lorenzini, T., Yanagihara, D., Chang, D., and Elliott, G. (1996). Activation of the
erythropoietin (EPO) receptor by bivalent anti-EPO receptor antibodies. J. Biol. Chem. 271:
24691–24697.
Ericsson, J., Jackson, S. M., Lee, B. C., and Edwards, P. A. (1996). Sterol regulatory ele-
ment binding protein binds to a cis element in the TI promoter of the farnesyl diphos-
phate synthase gene. Proc. Natl. Acad. Sci. USA 93: 945–950.
Gourdon, G., Morle, F., Roche, J., Tourneur, N., Joulain, V., and Godet, J. (1992). Iden-
tification of GATA-1 and NF-E2 binding sites in the flanking region of the human
alpha-globin genes. Acta Haematol. 87: 136–144.
Gregory, R. C., Taxman, D. J., Seshasayee, D., Kensinger, M. H., Bieker, J. J., and Woj-
chowski, D. M. (1996). Functional interaction of GATA1 with erythroid Kruppel-like fac-
tor and Sp1 at defined erythroid promoters. Blood 87: 1793–1801.
174 N. A. Kolchanov et al.
Hofestadt, R., and Meineke, F. (1995). Interactive modelling and simulation of biochemi-
cal networks. Comput. Biol. Med. 25: 321–334.
Ignatieva, E. V., Merkulova, T. I., Vishnevskii, O. V., Kel’, A. E. (1997). Transcriptional
regulation of lipid metabolism genes: description in the TRDD database. Molec. Biol.
(Mosk) 31: 575–591.
Iwamoto, S., Li, J., Sugimoto, N., Okuda, H., and Kajii, E. (1996). Characterization of the
Duffy gene promoter: Evidence for tissue-specific abolishment of expression in Fy(a-b-) of
black individuals. Biochem. Biophys. Res. Comm. 222: 852–859.
Jackson, C. E., O’Neill, D., and Bank, A. (1995). Nuclear factor binding sites in human
beta globin IVS2. J. Biol. Chem. 270: 28448–28456.
Kauffman, S. A. (1969). Metabolic stability and epigenesis in randomly constructed ge-
netic net. J. Theor. Biol. 22: 437–467.
Kaya, A. H., Plewinska, M., Wong, D. M., Desnick, R. J., and Wetmur, J. G. (1994). Human
delta-aminolevulinate dehydratase (ALAD) gene: Structure and alternative splicing of the
erythroid and housekeeping mRNAs. Genomics 19: 242–248.
Kolchanov, N. A. (1997). Regulation of the eukaryotic gene transcription: Databases and
computer analysis. Mol. Biol. 31: 481–482.
Kolchanov, N. A., Podkolodnaya, O. A., Ananko, E. A., Ignatieva, E. V., Stepanenko, I. L.,
Kel-Margoulis, O. V., Kel’, A. E., Merkulova, T. I., Goryachkovskaya, T. N., Busygina, T.
V., Kolpakov, F. A., Podkolodny, N. L., Naumochkin, A. N., Korostishevskaya, I. M.,
Romashchenko, A. G., and Overton, G. C. (2000). Transcription Regulatory Regions
Database (TRRD): Its status in 2000. Nucleic Acids Res. 28: 298–301.
Kolpakov, F. A., and Ananko, E. A. (1999). Interactive data input into the GeneNet data-
base. Bioinformatics 15: 713–714.
Kolpakov, F. A., Ananko, E. A., Kolesov, G. B., and Kolchanov, N. A. (1998). GeneNet: A
database for gene networks and its automated visualization. Bioinformatics 14: 529–537.
Lecointe, N., Bernard, O., Naert, K., Joulin, V., Larsen, C. J., Romeo, P. H., and Mathieu-
Mahul, D. (1994). GATA- and SP1-binding sites are required for the full activity of the
tissue-specific promoter of the tal-1 gene. Oncogene 9: 2623–2632.
Likhoshvai, V. A., Matushkin, Yu. G., Vatolin, Yu. N., and Bazhan, S. I. (2000). A gener-
alized chemical kinetic method for simulating complex biological systems. A computer
model of l phage ontogenesis. Computational Technol. 5(2): 87–99.
Lloyd, D. B., and Thompson, J. F. (1995). Transcriptional modulators affect in vivo protein
binding to the low density lipoprotein receptor and 3-hydroxy-3-methylglutaryl coen-
zyme A reductase promoters. J. Biol. Chem. 270: 25812–25818.
McAdams, H. H., and Arkin, A. (1997). Stochastic mechanism in gene expression. Proc.
Natl. Acad. Sci. USA 94: 814–819.
Merkulova, T. I., Merkulov, V. M., and Mitina, R. L. (1997). Mechanisms of glucocorticoid
regulation and regulatory regions of genes, controlled by glucocorticoids: description in
the TRDD database. Molec. Biol. (Mosk) 31: 714–725.
175 The GeneNet System
Mignotte, V., Wall, L., deBoer, E., Grosveld, F., and Romeo, P. H. (1989). Two tissue-
specific factors bind the erythroid promoter of the human porphobilinogen deaminase
gene. Nucleic Acids Res. 17: 37–54.
Podkolodnaya, O. A., and Stepanenko, I. L. (1997). Mechanisms of transcriptional regu-
lation of erythroid specific genes. Molec. Biol. (Mosk) 31: 562–574.
Podkolodnaya, O. A., Stepanenko, I. L., Ananko, E. A., and Vorobiev, D. G. (2000). Rep-
resentation of information on erythroid gene expression regulation in the Geneexpress
system. In proceedings of the Second International conference on Bioinformatics or
genome Regulation and Structure. Novosibirsk: ICG, pp. 34–36.
Ratner, V. A. (1966). Genentical Controlling Systems. Novosibirsk: Nauka.
Ratushny, A. V., Ignatieva, E. V., Matushkin, Yu. G., and Likhoshvai, V. A. (2000). Math-
ematical model of cholesterol biosynthesis regulation in the cell. In proceedings of the
Second International Conference on Bioinformatics or Genome Regulation and Structure.
Novosibirsk: ICG, pp. 199–202.
Ratushny, A. V., Podkolodnaya, O. A., Ananko, E. A., and Likhoshvai, V. A. (2000).
Mathematical model of erythroid cell differentiation regulation. Proceeding of the second
international conference on bioinformatics or genome regulation and structure. Novosi-
birsk: ICG, pp. 203–206.
Sanchez, L., van Helden, J., and Thieffry, D. (1997). Establishement of the dorso-ventral
pattern during embryonic development of Drosophila melanogaster: A logical analysis. J.
Theor. Biol. 189: 377–389.
Savageau, M. A. (1985). A theory of alternative designs for biochemical control systems.
Biomed. Biochim. Acta. 44: 875–880.
Schweigert, S., Herde, P. V., and Sibbald, P. R. (1995). Issues in incorporation of semantic
integrity in molecular biological object-oriented databases. Comput. Appl. Biosci. 11: 339–
347.
Sugita, M. (1961). Functional analysis of chemical systems in vivo using a logical circuit
equivalent. J. Mol. Biol. 1: 415–430.
Surinya, K. H., Cox, T. C., and May, B. K. (1997). Transcriptional regulation of the human
erythroid 5-aminolevulinate synthase gene. Identification of promoter elements and role
of regulatory proteins. J. Biol. Chem. 272: 26585–26594.
Tanabe, A., Furukawa, T., Ogawa, Y., Yamamoto, M., Hayashi, N., Tokunaga, R., and
Taketani, S. (1997). Involvement of the transcriptional factor GATA-1 in regulation of ex-
pression of coproporphyrinogen oxidase in mouse erythroleukemia cells. Biochem. Bio-
phys. Res. Comm. 233: 729–736.
Tchuraev, R. N. (1991). A new method for the analysis of the dynamics of the molecular
genetic control systems. I. Description of the method of generalized threshold models. J.
Theor. Biol. 151: 71–87.
Thieffry, D., and Thomas, R. (1995). Dynamical behaviour of biological regulatory net-
works—II. Immunity control in bacteriophage lambda. Bull. Math. Biol. 57: 277–297.
176 N. A. Kolchanov et al.
Thomas, R. (1973). Boolean formalization of genetic control circuits. J. Theor. Biol. 42: 563–
585.
Tsai, S.-F., Strauss, E., and Orkin, S. H. (1991). Functional analysis and in vivo foot-
printing implicate the erythroid transcription factor GATA-1 as a positive regulator of its
own promoter. Genes Dev. 5: 919–931.
Tugores, A., Magness, S. T., and Brenner, D. A. (1994). A single promoter directs both
housekeeping and erythroid preferential expression of the human ferrochelatase gene. J.
Biol. Chem. 269: 30789–30797.
Vieille-Grosjean, I., and Huber, P. (1995). Transcription factor GATA-1 regulates human
HOXB2 gene expression in erythroid cells. J. Biol. Chem. 270: 4544–4550.
Wahde, M., and Hertz, J. (2000). Coarse-grained reverse engineering of genetic regulatory
networks. Biosystems 55: 129–136.
Wang, X., Pai, J.-T., Wiedenfeld, E. A., Medina, J. C., Slaughter, C. A., Goldstein, J. L., and
Brown, M. S. (1995). Purification of an interleukin-1 beta converting enzyme-related cys-
teine protease that cleaves sterol regulatory element-binding proteins between the leucine
zipper and transmembrane domains. J. Biol. Chem. 270: 18044–18050.
Wang, X., Sato, R., Brown, M. S., Hua, X., and Goldstein, J. L. (1994). SREBP-1, a mem-
brane-bound transcription factor released by sterol regulated proteolysis. Cell 77: 53–62.
Zhang, W., and Bieker, J. J. (1998). Acetylation and modulation of erythroid Kruppel-like
factor (EKLF) activity by interaction with histone acetyltransferases. Proc. Natl. Acad. Sci.
USA 95: 9855–9860.
SUGGESTED READINGS
Kanehisa, M. (2000). Post-Genome Informatics. Oxford: Institute for Chemical Research,
Kyoto University, and Oxford University Press.
Kohn, K. W. (1999). Molecular interaction map of the mammalian cell cycle control and
DNA repair systems. Mol. Biol. Cell 10: 2703–2734.
Savageau, M. A. (1991). Biochemical systems theory: Operational differences among vari-
ant representations and their significance. J. Theor. Biol. 151: 509–530.
Smolen, P., Baxter, D. A., and Byrne, J. H. (2000). Modeling transcriptional control in gene
networks—methods, recent results, and future directions. Bull. Math. Biol. 62: 247–292.
Thomas, R., Thieffry, D., and Kaufman, M. (1995). Dynamical behaviour of biological
regulatory networks—I. Biological role of feedback loops and practical use of the concept
of the loop-characteristic state. Bull. Math. Biol. 57: 247–276.
URLs FOR RELEVANT SITES
Cell Signaling Networks Database (CSNDB) is a data- and knowledge base for signaling
pathways of human cells. It compiles the information on biological molecules, sequences,
177 The GeneNet System
structures, functions, and reactions that transfer the cellular signals. Signaling pathways
are compiled as binary relationships of biomolecules and are represented by automati-
cally drawn graphs. http://geo.nihs.go.jp/csndb/
EcoCyc, the Encyclopedia of E. coli Genes and Metabolism, is a bioinformatics database
that describes the genome and the biochemical machinery of E. coli. The long-term goal of
the project is to describe the molecular catalog of the E. coli cell, as well as the functions of
each of its molecular parts, in order to facilitate a system-level understanding of E. coli.
http://ecocyc.pangeasystems.com/ecocyc/
ERGO is a curated database of genomic DNA with connected similarities, functions,
pathways, functional models, clusters, and more. Users may annotate and comment on
genes and pathways, but currently cannot edit sequences.
http://igweb.integratedgenomics.com/IGwit/
GeNet contains the information on functional organization of regulatory gene networks
acting at embryogenesis. The regulatory genes play a crucial role in embryogenesis, con-
trolling both activity of downstream regulatory genes (cross-regulation) and their own
activity (autoregulation). These are the autoregulatory and cross-regulatory functional
links, which unite the regulatory genes in gene networks.
http://www.csa.ru/Inst/gorb_dep/inbios/genet/genet.htm
Kyoto Encyclopedia of Genes and Genomes (KEGG) is an effort to computerize current
knowledge of molecular and cellular biology in terms of the information pathways that
consist of interacting molecules or genes, and to provide links from the gene catalogs
produced by genome sequencing projects. http://www.genome.ad.jp/kegg/
The Ligand Chemical Database for Enzyme Reactions (LIGAND) is designed to provide
the linkage between chemical and biological aspects of life in the light of enzymatic re-
actions. The database consists of three sections: ENZYME, COMPOUND, and the
REACTION. The PATHWAY data item contains the link information to the KEGG (see
above) metabolic pathway database: the pathway map accession number, followed by the
description. http://www.genome.ad.jp/dbget/ligand.html
MetaCyc, the metabolic Encyclopedia, is a meta-metabolic database because it contains
pathways from a variety of different organisms. It describes metabolic pathways, reac-
tions, enzymes, and substrate compounds. The MetaCyc data were gathered from a vari-
ety of literature and on-line sources, and contain citations to the source of each pathway.
MetaCyc employs the same database schema as EcoCyc and provides the same rich an-
notation for many of the pathways, based on the biomedical literature. Unlike EcoCyc,
MetaCyc does not provide genomic data. It is also based on the same retrieval and visu-
alization software as EcoCyc, the Pathway Tools.
http://ecocyc.pangeasystems.com/ecocyc/metacyc.html
The Signaling PAthway Database (SPAD) is an integrated database for genetic informa-
tion and signal transduction systems. SPAD is divided into four categories based on
extracellular signal molecules—(growth factor, cytokine, and hormone) and stress—that
initiate the intracellular signaling pathway. SPAD is compiled in order to describe infor-
178 N. A. Kolchanov et al.

mation on interaction between protein and protein, and protein and DNA, as well as in-
formation on sequences of DNA and proteins.
http://www.grt.kyushu-u.ac.jp/spad/
The University of Minnesota Biocatalysis/Biodegradation Database contains information
about microbial biocatalytic reactions and biodegradation pathways primarily for xeno-
biotic, chemical compounds. http://umbbd.ahc.umn.edu/
WIT is a Web-based system to support the curation of function assignments made to
genes and the development of metabolic models. http://wit.mcs.anl.gov/WIT2
179 The GeneNet System

This page intentionally left blank
8 Regulation of Cellular States inMammalian Cells from a GenomewideView
Sui Huang
INTRODUCTION
The development from a single fertilized oocyte to a mature multi-
cellular organism, as well as the maintenance of the complex adult tis-
sue architecture consisting of cells of distinct characteristics, requires a
tight temporal and spatial regulation of the ‘‘fate’’ of each cell, such as
division, differentiation, and death. That the fate of an individual cell is
subordinated to the needs of the collective is most impressively mani-
fest in the finding that the majority of cells in the mature tissue are not
in the proliferation mode despite the abundance of nutrients and the
optimal physicochemical conditions. Only in regenerative tissues such
as skin, intestinal epithelium, and bone marrow can a subset of cells
switch to the proliferation mode. Disturbance of the balance between
cell proliferation, differentiation, and death can lead to tumor forma-
tion.
Signal Transduction in a Multicellular Organism as Information
Processing
What tells a cell in a multicellular organism when to divide, differenti-
ate, or die? The signals involved in higher multicellular organisms are
fundamentally different from those in single-cell organisms, such as
bacteria and yeast, which have traditionally served as model systems
for the study of molecular control circuits. In the microorganisms, reg-
ulation is geared toward optimizing material and energy utilization
and stimulation of cell division, thus propagating the organism when-
ever environmental conditions are favorable. There is no subordination
to the needs of the whole organism. A well-studied control mechanism
is the lactose operon system in E. coli, which allows the bacterial cell to
switch its metabolism from glucose to lactose as the source of free en-
ergy (for a review see Reznikoff, 1992).
In contrast to free-living microorganisms, cells of multicellular
organisms in situ do not face the problem of having to adapt to fluctu-
ating environmental conditions and varying types of energy sources. A
liver cell, for instance, always sits in an environment in which temper-
ature, pH, and concentration of nutrients (e.g., glucose) stay within
narrow ranges. Here regulation serves tissue homeostasis (i.e., the
maintenance of the intricate tissue microarchitecture that is the basis of
organ function). Therefore, the regulated variable is the individual
cell’s decision between cell proliferation, differentiation, and death.
While a lactose molecule acts in E. coli both as nutrient and as signal to
activate the appropriate genetic program, messenger molecules for
mammalian cells are complex peptides (e.g., ‘‘growth factors’’) that
serve solely to convey a regulatory signal (e.g., to stimulate the cell to
differentiate or divide).
The cell is not interested in the free energy present in the peptide
bonds and amino acids of the growth factor. For a mammalian cell in
situ, free energy is not rate-limiting, and the task of acquiring energy is
delegated to a hierarchically higher level, the organism. Therefore, we
should speak of a regulatory network instead of a metabolic network
when referring to the network of genes and enzymes that governs cell
fate in multicellular organisms. As with other complex systems, such as
computers (as opposed to combustion engines) or modern societies (as
opposed to agricultural societies), with increasing complexity the cur-
rency on which the system operates shifts from energy to information
when the former is in abundant supply. Therefore, in a first abstraction,
the web of information exchange can be studied as a separate network,
although it is ultimately connected to the energy-supplying system.
Cell Fates as Cell States
In a simplified picture that will suffice for our discussion, we consider
only cell proliferation, differentiation, and death as the cell fates. From
a formal viewpoint we shall treat these cell fates as cell states rather
than processes: ‘‘Proliferation’’ (or growth) is the state of biochemical
competence for repeated cell divisions (an oscillatory state). ‘‘Differen-
182 Sui Huang
tiation’’ is the state in which the cell maintains its specialized, type-
characteristic features and engages in tissue-specific tasks. A cell can
have multiple differentiation states (e.g., the resting and the activated
states of a lymphocyte), but for simplicity we will deal with just one.
Although differentiated cells typically withdraw from the cell division
cycle, and thus are in a quiescent state, we sometimes use the term
‘‘quiescence’’ separately to describe the state when considering exit
from the proliferation mode independent of a differentiation process
(e.g., dormancy, or arrest at a cell-cycle checkpoint for DNA repair).
Finally, ‘‘programmed cell death’’ (or apoptosis) describes the state of
commitment to apoptosis with the ensuing processes being merely a
stepwise execution of cell death. The term ‘‘state’’ captures the essential
features of physiological cell fates because they are stable, qualitatively
distinct, and mutually exclusive, and can undergo transitions from one
to another under the influence of regulatory inputs.
Interestingly, unlike bacteria, for mammalian cells in culture, sup-
plying basic nutrients such as amino acids, fatty acids, and glucose, and
keeping temperature, osmolarity, and pH within the physiological
range, is not sufficient for the maintenance of viability and continued
cell division. In addition, the culture medium needs to be supple-
mented with 2–20% serum to keep the cells alive and proliferating. We
now know that this requirement for serum is essentially due to the
presence of growth factors in the serum. The need for growth factors to
keep cells alive and proliferating again illustrates the fact that regula-
tion in mammalian cells takes place at the level of information pro-
cessing and not of energy utilization.
Taken together, for the study of regulatory networks in cells of
higher organisms we can in a first approximation regard cells as open
(nonequilibrium) systems with a continuous supply of free energy, and
thus focus on the regulatory events as information processing that
leads to the decision either to maintain or to switch a cell state.
Traditional Paradigm of Cell Fate Regulation: A Pathway-centered
View
The advent of molecular biology techniques has stimulated unprece-
dented progress in the biochemical analysis of cell fate regulation that
started with the molecular cloning of growth factors and their recep-
tors, and led to today’s bewildering, complex picture of the molecular
183 Regulation of Cellular States in Mammalian Cells
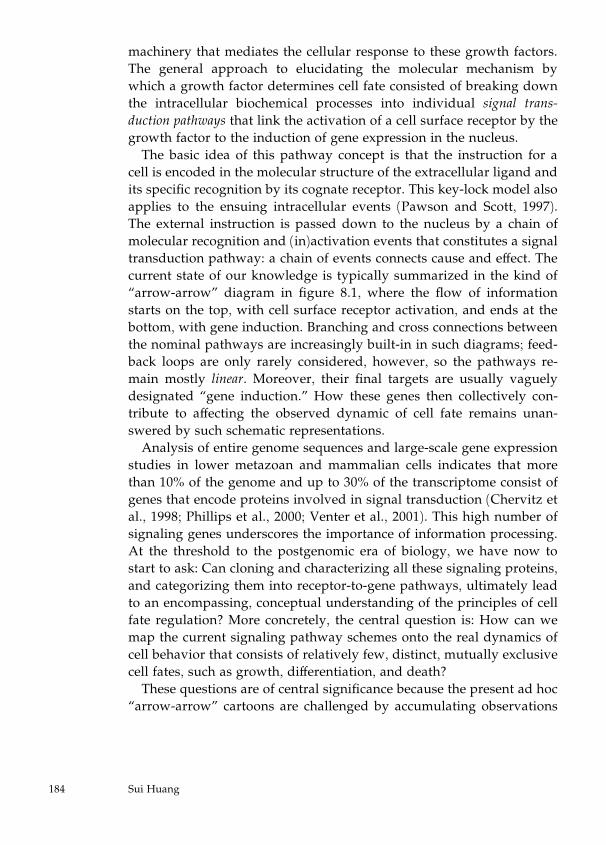
machinery that mediates the cellular response to these growth factors.
The general approach to elucidating the molecular mechanism by
which a growth factor determines cell fate consisted of breaking down
the intracellular biochemical processes into individual signal trans-
duction pathways that link the activation of a cell surface receptor by the
growth factor to the induction of gene expression in the nucleus.
The basic idea of this pathway concept is that the instruction for a
cell is encoded in the molecular structure of the extracellular ligand and
its specific recognition by its cognate receptor. This key-lock model also
applies to the ensuing intracellular events (Pawson and Scott, 1997).
The external instruction is passed down to the nucleus by a chain of
molecular recognition and (in)activation events that constitutes a signal
transduction pathway: a chain of events connects cause and effect. The
current state of our knowledge is typically summarized in the kind of
‘‘arrow-arrow’’ diagram in figure 8.1, where the flow of information
starts on the top, with cell surface receptor activation, and ends at the
bottom, with gene induction. Branching and cross connections between
the nominal pathways are increasingly built-in in such diagrams; feed-
back loops are only rarely considered, however, so the pathways re-
main mostly linear. Moreover, their final targets are usually vaguely
designated ‘‘gene induction.’’ How these genes then collectively con-
tribute to affecting the observed dynamic of cell fate remains unan-
swered by such schematic representations.
Analysis of entire genome sequences and large-scale gene expression
studies in lower metazoan and mammalian cells indicates that more
than 10% of the genome and up to 30% of the transcriptome consist of
genes that encode proteins involved in signal transduction (Chervitz et
al., 1998; Phillips et al., 2000; Venter et al., 2001). This high number of
signaling genes underscores the importance of information processing.
At the threshold to the postgenomic era of biology, we have now to
start to ask: Can cloning and characterizing all these signaling proteins,
and categorizing them into receptor-to-gene pathways, ultimately lead
to an encompassing, conceptual understanding of the principles of cell
fate regulation? More concretely, the central question is: How can we
map the current signaling pathway schemes onto the real dynamics of
cell behavior that consists of relatively few, distinct, mutually exclusive
cell fates, such as growth, differentiation, and death?
These questions are of central significance because the present ad hoc
‘‘arrow-arrow’’ cartoons are challenged by accumulating observations
184 Sui Huang
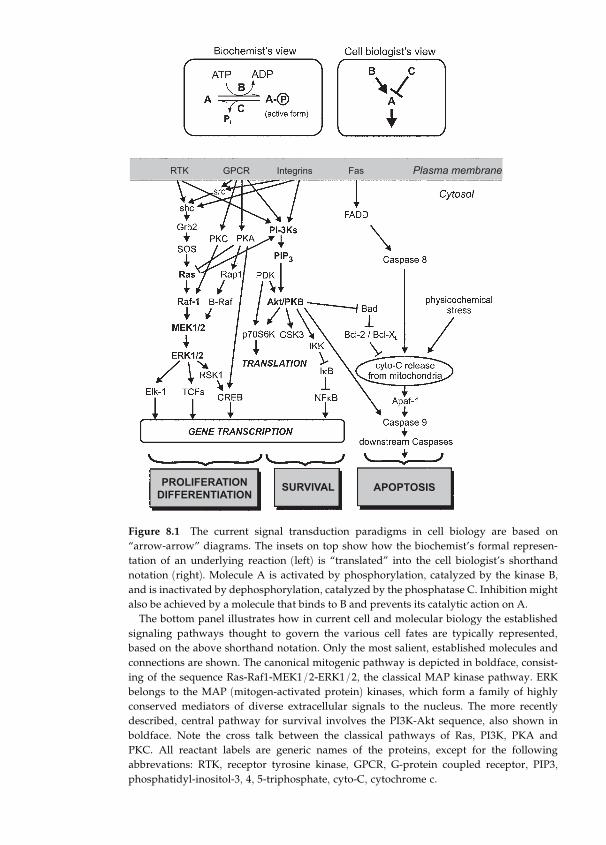
Figure 8.1 The current signal transduction paradigms in cell biology are based on
‘‘arrow-arrow’’ diagrams. The insets on top show how the biochemist’s formal represen-
tation of an underlying reaction (left) is ‘‘translated’’ into the cell biologist’s shorthand
notation (right). Molecule A is activated by phosphorylation, catalyzed by the kinase B,
and is inactivated by dephosphorylation, catalyzed by the phosphatase C. Inhibition might
also be achieved by a molecule that binds to B and prevents its catalytic action on A.
The bottom panel illustrates how in current cell and molecular biology the established
signaling pathways thought to govern the various cell fates are typically represented,
based on the above shorthand notation. Only the most salient, established molecules and
connections are shown. The canonical mitogenic pathway is depicted in boldface, consist-
ing of the sequence Ras-Raf1-MEK1/2-ERK1/2, the classical MAP kinase pathway. ERK
belongs to the MAP (mitogen-activated protein) kinases, which form a family of highly
conserved mediators of diverse extracellular signals to the nucleus. The more recently
described, central pathway for survival involves the PI3K-Akt sequence, also shown in
boldface. Note the cross talk between the classical pathways of Ras, PI3K, PKA and
PKC. All reactant labels are generic names of the proteins, except for the following
abbrevations: RTK, receptor tyrosine kinase, GPCR, G-protein coupled receptor, PIP3,
phosphatidyl-inositol-3, 4, 5-triphosphate, cyto-C, cytochrome c.
that cannot be accommodated by such complicated collections of indi-
vidual pathways. These findings indicate that there are regulatory
principles that can be conceived only in the broader picture of global
cellular regulation. One such principle is what can be summarized as
‘‘distributed information’’ in signaling, and is manifest in the intense
cross talk between the nominal pathways, in the pleiotropic effects of
signaling molecules, and in the fact that regulatory cellular proteins
often have multiple, opposing effects on cell fate (see below). These
phenomena, albeit found ubiquitously, are presently discussed as com-
plications or even paradoxes within our mental framework of linear,
point-to-point pathways.
In this chapter we briefly review the limitations of the current path-
way paradigm and demonstrate how the concept of Boolean networks
can serve as a simple modeling language to formalize the emergence of
cell fates as collective behavior of signaling molecules and to predict
the functional consequences. Thus, we will introduce the idea of Boo-
lean networks and their fundamental properties as far as it pertains to
cell fate regulation, but will then put emphasis on building the bridge
between the dynamics of the modeled network and the observed be-
havior of the real cell.
DISTRIBUTED INFORMATION PROCESSING IN CELL FATE
REGULATION
The habit of assigning ‘‘functions’’ to biological molecules and path-
ways, as exemplified by terms like ‘‘fibroblast growth factor’’ and
‘‘mitogenic pathway,’’ which has culminated in the creation of ‘‘func-
tional genomics,’’ needs to be contrasted with accumulating evidence
that the information conveyed by the signal transduction machinery
cannot always be localized to a particular pathway, let alone a mole-
cule, but is distributed among numerous pathways that collectively
form a genome–wide regulatory network. This has important implica-
tions for functional annotation of protein databases (as discussed in
chapter 2). While assigning biochemical functions based on sequence
analysis is relatively straightforward, many higher-order biological
functions, such as ‘‘growth promotion,’’ are often not intrinsic proper-
ties of individual proteins but depend on the cellular and tissue context
(as discussed below). Such ‘‘conditional functions’’ might require an
additional layer in protein function annotations, but certainly suggest
186 Sui Huang
that manual annotation based on experimental data will remain an im-
portant aspect of database annotation.
Cross Talk Between Pathways: Convergence and Pleiotropy
As the collection of known biochemical pathways has grown, it has
become clear that an intense cross talk takes place between the histori-
cally defined pathways. New physical interactions between known
genes or proteins, often from apparently unrelated ‘‘pathway systems,’’
are published almost weekly. With regard to the scheme of interactions
between nominal pathways, two forms of cross communication can be
distinguished: convergence and pleiotropy (figure 8.2).
Convergence describes the finding that different pathways impinge on
a same key target molecule. For instance, mitogenic signals from the
cell’s environment converge on the activation of the Ras-Raf-ERK
pathway (figure 8.1), which plays a critical role in the activation of
genes that stimulate entry into the cell cycle and drive progression of
the G1 phase into the S phase (DNA synthesis phase) (Lavoie et al.,
1996; Taylor and Shalloway, 1996). Similarly, signals from a variety of
stimuli necessary for cell survival (prevention of cell death) utilize the
PI3K-akt/PKB pathway (Franke et al., 1997; Downward, 1998; Kra-
silnikov, 2000). One important functional consequence of convergence
is redundancy, in that the activation of a key molecule, such as the
mitogen-activated protein kinase (MAPK) ERK, can be achieved by
various signals and that has been viewed as molecular basis for the
robustness of signal transmission. However, the fact that multiple non–
identical input signals impinge on the very same mediator has raised
the question of how signal specificity is maintained (Chao, 1992; Brunet
and Pouyssegur, 1997; Tan and Kim, 1999).
Pleiotropy, on the other hand, refers to the finding that activation of
one molecule results in the fanning out of the biochemical signal,
resulting in the induction of a large array of genes. For instance, mon-
itoring of >6000 genes with DNA microarrays showed that activated
receptors for the growth factors FGF and PDGF induce the expression
of at least 60 genes (Fambrough et al., 1999) and that the Myc tran-
scription factor activates at least 27 genes (Coller et al., 2000). The
functional meaning of pleiotropy is not immediately plausible, since it
also tends to lessen signal specificity through overlap of the responses
of different input signals. However, because of their prevalence, con-
187 Regulation of Cellular States in Mammalian Cells
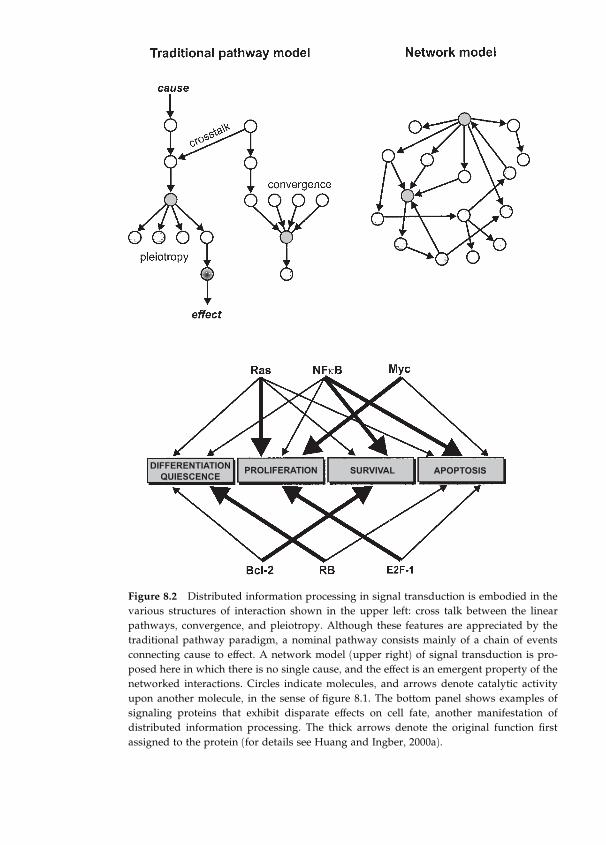
Figure 8.2 Distributed information processing in signal transduction is embodied in the
various structures of interaction shown in the upper left: cross talk between the linear
pathways, convergence, and pleiotropy. Although these features are appreciated by the
traditional pathway paradigm, a nominal pathway consists mainly of a chain of events
connecting cause to effect. A network model (upper right) of signal transduction is pro-
posed here in which there is no single cause, and the effect is an emergent property of the
networked interactions. Circles indicate molecules, and arrows denote catalytic activity
upon another molecule, in the sense of figure 8.1. The bottom panel shows examples of
signaling proteins that exhibit disparate effects on cell fate, another manifestation of
distributed information processing. The thick arrows denote the original function first
assigned to the protein (for details see Huang and Ingber, 2000a).
vergence and pleiotropy appear to represent basic design principles of
signal transduction in cell fate regulation, and will be discussed in the
context of regulatory networks later in this chapter.
Regulatory Proteins with Multiple Disparate Functions
The continuing analysis of key signaling molecules has revealed that
many of them exert multiple, often disparate effects on cell fate. For in-
stance, the protein Ras, originally discovered on the basis of its trans-
forming (tumor-inducing) effect (Barbacid et al., 1987), not only
promotes growth but also induces apoptosis and quiescence—an ap-
parent paradox (figure 8.2). Ras promotes growth via the MAP kinase
ERK, but, in the absence of the proteins NF�B and PI3K, its activationinduces programmed cell death (Mayo et al., 1997; Kauffmann-Zeh et
al., 1997; Gire et al., 2000).
The transforming activity of Ras requires cooperation with other
immortalizing alterations, such as activation of the protein Myc (Wein-
berg, 1989). The notion of Ras being a growth-promoting protein stems
from the use of immortalized cell lines during its initial characterization.
In primary cells Ras fails to stimulate growth, but instead induces accu-
mulation of the cell cycle-inhibiting proteins p16 and p53 and puts cells
into quiescence (Serrano et al., 1997). Another known example is Myc,
also first characterized as an oncogene. Myc protein promotes cell
growth in the presence of serum or growth factors but triggers p53-de-
pendent apoptosis in their absence (Evan and Littlewood, 1998). Figure
8.2 shows some other selected examples of proteins with disparate
effects on cell fate (for details see Huang and Ingber, 2000a).
Multiple-Target or Nonspecific Perturbation
A third line of observation advocating a global (genomewide) approach
to cell fate regulation is the readiness with which a specific cell fate can
be induced, using an experimental perturbation that affects multiple
proteins across several nominal pathways. This contrasts with the cur-
rent paradigm of simple pathways, which is derived from the idea of
instructive regulation: the extracellular factor acts as a messenger that
carries in its unique three-dimensional structure the specific instruction
to be delivered to the cell by docking to the complementary receptor.
However, many small-molecule chemicals that do not act on one spe-
189 Regulation of Cellular States in Mammalian Cells
cific receptor, but on multiple targets, are equally able to cause a dis-
tinct cell state switch—not just by triggering apoptosis, which one
could attribute to ‘‘nonspecific cytotoxicity,’’ but also by inducing full
differentiation with all the intricate cellular features.
Small organic molecules such as dimethylsulfoxide (DMSO), ethanol,
beta-mercaptoethanol, benzene, and genistein (a general tyrosine kin-
ase inhibitor) have been reported, for a large number of cell culture
systems, to switch cells from growth to differentiation (Yu and Quinn,
1994; Kulyk and Hoffman, 1996; Woodbury et al., 2000; Kalf and
O’Connor, 1993; Constantinou and Huberman, 1995). It appears that in
all these examples a simultaneous perturbation of multiple targets in
different pathways results in the cell’s channeling the biochemical re-
sponse in such a way that a well-orchestrated pattern of biochemical
activity arises that drives the cell toward a distinct cell fate.
Even external signals as ‘‘nonspecific’’ as physical inputs, such as ex-
ternally enforced change of cell shape, can regulate the choice of cell
fate, switching the cell between quiescence, growth, differentiation, and
apoptosis (Mooney et al., 1992; Chen et al., 1997; Huang and Ingber,
1999). The view held by most molecular biologists—that the cell is
instructed on how to behave by the message encoded in the structure of
regulatory molecules—cannot explain how these physical influences,
devoid of molecular specificity, can trigger a distinct cell fate.
Toward an Integrative View Based on Genomewide Networks
From the above examples it is clear that dissecting cell fate regulation
into individual pathways is problematic because the functional effects
of individual regulatory proteins are not intrinsic properties of the
proteins themselves, but instead depend on the cellular context (i.e., the
presence and activity of other cellular components). Hence, information
is distributed. It is the cell that integrates it into a distinct cell fate.
In recent attempts to bring some order to the richly intertwined web
of signal transduction pathways, the concept of modularity has been
proposed (Hartwell et al., 2000). Moreover, it has been suggested that
protein modules (multiprotein complexes) with multiple inputs and
outputs act as information processors (Bray, 1995). These suggestions
preserve the convenient and intuitively strong notion of individual,
separable pathways to which ‘‘functions’’ can be attributed without
embracing a global view. Whether or not there is a physical basis for an
190 Sui Huang
a priori assumption of functional modules beyond the subjective, oper-
ational definition by the investigator remains open.
One could envisage that the generally sparse interconnections (see
below) and the heterogeneity of cross-talk density throughout the
genomic regulatory network might justify the idea of modularity.
However, given the prevalence of unaccounted-for cross communica-
tion between ‘‘pathways,’’ we propose here an approach to cellular
regulation without an a priori notion of ‘‘functions’’ and modules, but
with a neutral assumption of a global network with distributed informa-
tion in which modularity emerges as a secondary entity—depending
on the ‘‘function’’ we are looking at. Further, we will show in this
chapter how the network approach can help resolve the questions on
cross talk, disparate effects of proteins, nonspecific stimuli, and the
preservation, despite convergence and pleiotropy, of signal specificity.
BOOLEAN NETWORKS AS A MODEL FOR CELLULAR
REGULATORY NETWORKS
A Qualitative Modeling Language
With the recent explosion of biological data on cell regulation, it has
become clear even to experimentalists that the counterintuitive, often
paradoxical features and the network nature of cellular regulation ex-
ceed the explanatory capacity of the current ad hoc, schematic models
used in cell and molecular biology. Mathematical models, or at least
more formal methods, will be necessary to support our efforts to make
sense of the continuing spate of experimental data. Traditional mathe-
matical modeling approaches typically aim at recapitulating the precise
kinetics of rather small regulatory circuitries using sets of differential
equations. Other approaches pursue the simulation of the living or-
ganism (or parts of it) as realistically as possible at various scales of
description, down to using stochastic methods to track individual mol-
ecules. All these modeling approaches have provided valuable insight
into many nonintuitive behaviors that are typical for nonlinear sys-
tems, such as oscillations, multistability, and hysteresis. A motivation
behind these approaches is that detailed simulations may one day
serve as prediction tools that could replace experimentation (McAdams
and Arkin, 1996; Tyson, 1999; Weng et al., 1999; Endy and Brent,
2001).
191 Regulation of Cellular States in Mammalian Cells
However, these approaches do not aim at understanding basic de-
sign principles of regulation, and the problems discussed in the previ-
ous section have not been addressed. To study the regulation of cell
fate as a collective behavior mediated by distributed information proc-
essing, we have to deal with a massively parallel, genome wide system
of interacting parts and learn to describe how they give rise to the dis-
tinct, emergent behavior apparent at a higher level of organization—an
endeavor that lies beyond the possibilities of traditional modeling
paradigms.
The lack of knowledge of quantitative biochemical details and the
mathematical difficulties of accurately describing such complex systems
of networked interactions necessitates the use of very simple models, in
which certain abstractions have to be made, as well as aiming, in the
first place, at learning about general principles. The hope behind this
strategy is that some fundamental principles of regulation are typical
properties of the systems under study and are robust to theoretical
idealization, such that they are preserved in the simplifying model. In
fact, it turned out that the idealization and simplifications are not only
necessary but also sufficient for studying the generic, qualitative
dynamics of a cellular regulatory system as a whole (rather than to
predict specific quantitative responses).
A powerful model in this sense is the Boolean genetic networks in
which time and values of activity levels of the genes are made discrete.
Boolean networks were first proposed by Kauffman as a tool to address
the fundamental problem of spontaneous generation of order in com-
plex systems, in particular in metabolic and genetic networks (Kauff-
man, 1969, 1993). Here we will use the Boolean genetic network model
as a simple modeling language to illustrate how the global dynamics of
cell fate regulation can be understood as resulting from the interaction
of signaling molecules organized as a network.
Sigmoidal Kinetics and Discretization of Molecular Interactions
In a Boolean network an element of the network represents a gene or
a protein and can take only two values, ON (¼1) and OFF (¼0). Theidealization of a gene or protein activity as an ON-OFF switch (‘‘dis-
cretization’’) is based on the use of a step function to approximate a
steep sigmoidal function (ultrasensitivity) for the function that maps
the regulatory signal (input; e.g., level of a stimulating protein) to the
192 Sui Huang
response (output; e.g., the enzyme activity of the target) (Thomas et al.,
1995).
However, the observed switchlike behavior can be more than just an
approximation based on the limit of a steep sigmoidal input-output re-
lation. From the analysis of nonlinear dynamic systems we know that
sigmoidal functions can give rise to bistability in simple control circuits,
for example, mutual inhibition between two proteins, A and B, given
appropriate parameters. In such a feedback circuit only two states of
the system will be stable, one in which protein A is low and B is high,
and one in which A is high and B is low. Which state is taken by the
system depends on the initial protein activities relative to threshold
values (Glass and Kauffman, 1973).
The occurrence of sigmoidal input-output functions justifies the
discretization. But why can we assume the presence of sigmoidal,
ultrasensitivity functions for molecular interactions at all? Classical
Michaelis-Menten enzyme kinetics gives rise to hyperbolic functions
that exhibit saturation (flattening of the curve for high input signals)
but not the sigmoid behavior at the low level of input signals necessary
for bi- or multistability. The generation of sigmoidal threshold kinetics
depends on how the underlying kinetic mechanism is capable of sensi-
tivity amplification, and thus of generating ultrasensitivity (Koshland
et al., 1982). The best-known situation that generates a sigmoidal be-
havior is cooperativity, as classically studied for multimeric proteins
like hemoglobin. High cooperativity leads to ultrasensitivity. A cascade
in a signaling pathway can also produce an all-or-nothing response, as
has been shown for the MAP kinase signaling pathway (Ferrell and
Machleder, 1998).
However, even without these rather complicated control structures it
has been proposed that alone the particular nature of intracellular bio-
chemical reactions, which involves reaction on surfaces rather than in
free three-dimensional space (dimension restriction), and the relative
stability of ‘‘transition complexes’’ (e.g., protein-protein complexes)
contribute to a deviation from hyperbolic Michaelis-Menten kinetics
toward sigmoidal kinetics (Savageau, 1995). Moreover, it has been
suggested that stochastic fluctuations due to the low number of copies
of reactants in the cell will promote sensitivity amplification (i.e., cause
a gradual response to sharpen and behave like a threshold mechanism),
even in the absence of more complicated control circuits (Paulsson et
al., 2000).
193 Regulation of Cellular States in Mammalian Cells
The discretization now allows the use of logical functions as a simple
way to directly capture the qualitative relationship between the inputs
inter se and their joint effect on the target, for which information is
readily available from common cell biology experiments. Molecular in-
formation processing that displays the basic features of logical gates in
fact takes place at promoter elements or in multiprotein complexes
(Yuh et al., 1997; Bray, 1995). Figure 8.3 shows two examples of the
encoding of molecular interactions into Boolean functions.
A common criticism of this digitalization is that the assumption of
ON/OFF states disregards the continuous nature of gene or protein
levels in the cell. It should therefore be emphasized that the ON/OFF
idealization is not an arbitrary coarsening, achieved by simply sub-
dividing a gradual response into two qualities, nor does it represent an
elementary molecular ON/OFF switch; rather, it reflects an ensemble
behavior of molecules in biochemical reactions that gives rise to bist-
ability. Therefore, an intermediate activity value of the enzymes around
the threshold will be unstable, and the activity will move toward one of
the two stable extremes, either maximal activity (corresponding to the
ON state) or minimal activity (OFF state). The essence of the approxi-
mation thus lies in the equating of potentially differing threshold
values across the network. Time discretization, on the other hand, reflects
the two situations before and after a threshold has been crossed. Here
the departure from reality lies in the synchrony of updating between all
network elements and the simultaneous passage of multiple proteins
through their threshold values within the same time interval.
Besides the theoretical justification, the discretization is also sup-
ported by the frequent experience of cell biologists that in dose-response
experiments monitored at the single-cell level, the cellular response typ-
ically exhibits an all-or-none behavior (Ferrell and Machleder, 1998).
Gradual responses, on the other hand, are mostly seen in ‘‘bulk’’ bio-
chemical studies where the response is averaged over an ensemble of
cells in which the respective threshold has a statistical distribution.
Basic Structure of Boolean Networks
We briefly review here the basic concepts of Boolean networks before
discussing how they provide new insights into cell fate regulation. (For
an introduction see also Somogyi and Sniegoski, 1996; Kaplan and
Glass, 1997; Huang, 1999.) For the sake of simplicity and concreteness,
194 Sui Huang
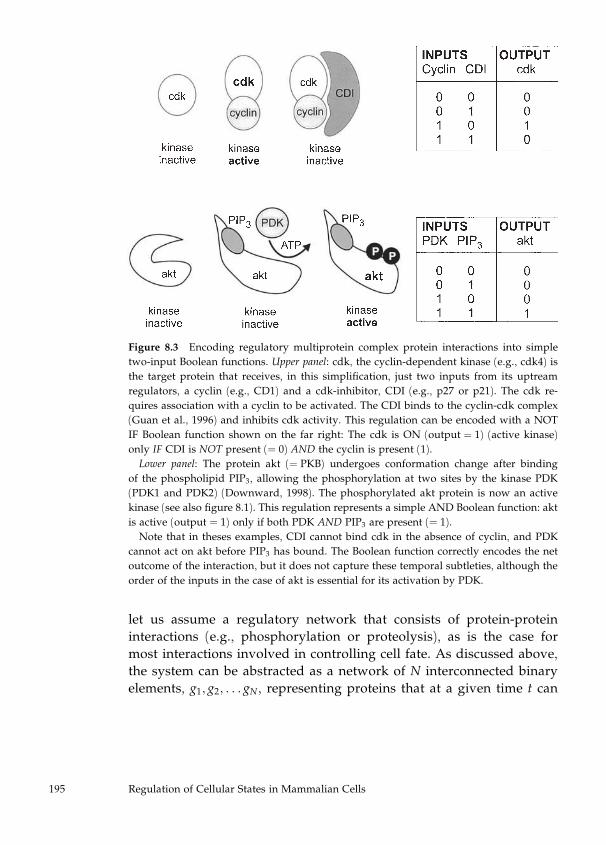
let us assume a regulatory network that consists of protein-protein
interactions (e.g., phosphorylation or proteolysis), as is the case for
most interactions involved in controlling cell fate. As discussed above,
the system can be abstracted as a network of N interconnected binary
elements, g1; g2; . . . gN , representing proteins that at a given time t can
Figure 8.3 Encoding regulatory multiprotein complex protein interactions into simple
two-input Boolean functions. Upper panel: cdk, the cyclin-dependent kinase (e.g., cdk4) is
the target protein that receives, in this simplification, just two inputs from its uptream
regulators, a cyclin (e.g., CD1) and a cdk-inhibitor, CDI (e.g., p27 or p21). The cdk re-
quires association with a cyclin to be activated. The CDI binds to the cyclin-cdk complex
(Guan et al., 1996) and inhibits cdk activity. This regulation can be encoded with a NOT
IF Boolean function shown on the far right: The cdk is ON (output ¼ 1) (active kinase)only IF CDI is NOT present (¼ 0) AND the cyclin is present (1).
Lower panel: The protein akt (¼ PKB) undergoes conformation change after bindingof the phospholipid PIP3, allowing the phosphorylation at two sites by the kinase PDK
(PDK1 and PDK2) (Downward, 1998). The phosphorylated akt protein is now an active
kinase (see also figure 8.1). This regulation represents a simple AND Boolean function: akt
is active (output ¼ 1) only if both PDK AND PIP3 are present (¼ 1).Note that in theses examples, CDI cannot bind cdk in the absence of cyclin, and PDK
cannot act on akt before PIP3 has bound. The Boolean function correctly encodes the net
outcome of the interaction, but it does not capture these temporal subtleties, although the
order of the inputs in the case of akt is essential for its activation by PDK.
195 Regulation of Cellular States in Mammalian Cells
take the values ON : giðtÞ ¼ 1 or OFF :giðtÞ ¼ 0. The ON value repre-
sents, for example, a kinase that is expressed and activated in a suffi-
cient amount such that the total activity of all molecules is above the
relevant threshold, whereas the OFF value represents the kinase whose
activity is below the threshold or that is not expressed. Each network
element gi receives a number of ki inputs, and is assigned a Boolean
function that defines how the set of inputs affects the activity state of
that element, which represents the output. Figure 8.4 shows an example
of a network with N ¼ 4 elements. For simplicity we restrict ourselvesin this discussion to a subset of networks of low connectivity (kfN)
and constant ki ¼ k for all elements gi.
A Boolean function represents the multiprotein complex in which
specific protein-protein interactions determine the activity of the target
protein (figure 8.3). The connections of the network are defined by the
specificity of the interactions encoded in the molecular structure of the
proteins (key-lock principle), and collectively specify a precise connec-
tion diagram of the network. The network architecture thus consists of
the topology of the interactions (the wiring) and the logical function
assigned to each network element (for instance, ‘‘or,’’ ‘‘and,’’ ‘‘not if ’’ in
figure 8.4). Since, in a first approximation, protein structure and its en-
zymatic function are determined by the gene sequence, the architecture
of the network is ‘‘hardwired’’ in the genome and does not change un-
less affected by mutations (discussed later). What changes with time is
the activity status of all network elements giðtÞ at a given time, whichcollectively form a pattern that represents the network state S at that
time point:
SðtÞ ¼ ½ g1ðtÞ; g2ðtÞ . . . gNðtÞ�:
The Dynamic Behavior of the Network: Constraints Imposed by the
Interactions
We are interested in the global dynamics of the regulatory network
(i.e., in how the pattern of protein activity, or the network state SðtÞ,changes over time and governs cell behavior). Since the pattern of
activity of all the proteins across the genome determines the cellular
phenotype, every cell state corresponds to a distinct pattern of protein
activity and, therefore, to a network state in the model. Thus, the
dynamics of the network state determines the dynamics of the cell
state, and hence of cell behavior and fate.
196 Sui Huang
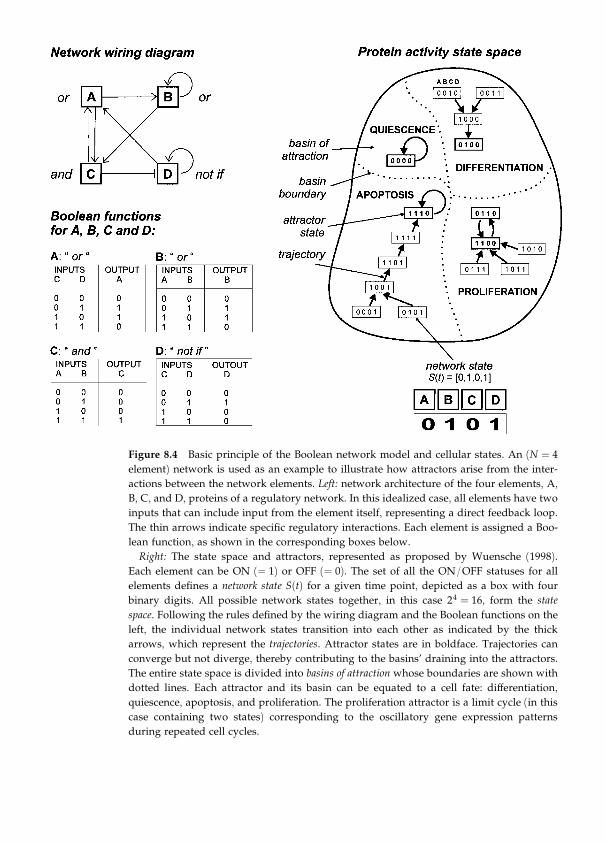
Figure 8.4 Basic principle of the Boolean network model and cellular states. An (N ¼ 4element) network is used as an example to illustrate how attractors arise from the inter-
actions between the network elements. Left: network architecture of the four elements, A,
B, C, and D, proteins of a regulatory network. In this idealized case, all elements have two
inputs that can include input from the element itself, representing a direct feedback loop.
The thin arrows indicate specific regulatory interactions. Each element is assigned a Boo-
lean function, as shown in the corresponding boxes below.
Right: The state space and attractors, represented as proposed by Wuensche (1998).
Each element can be ON (¼ 1) or OFF (¼ 0). The set of all the ON/OFF statuses for allelements defines a network state SðtÞ for a given time point, depicted as a box with fourbinary digits. All possible network states together, in this case 24 ¼ 16, form the state
space. Following the rules defined by the wiring diagram and the Boolean functions on the
left, the individual network states transition into each other as indicated by the thick
arrows, which represent the trajectories. Attractor states are in boldface. Trajectories can
converge but not diverge, thereby contributing to the basins’ draining into the attractors.
The entire state space is divided into basins of attraction whose boundaries are shown with
dotted lines. Each attractor and its basin can be equated to a cell fate: differentiation,
quiescence, apoptosis, and proliferation. The proliferation attractor is a limit cycle (in this
case containing two states) corresponding to the oscillatory gene expression patterns
during repeated cell cycles.
Now, because of the interaction between the proteins, the network
state can change only according to the wiring diagram and the logical
rules for the interactions. For instance, if the wiring and rules are such
that protein A is an input on protein B, and unconditionally inhibits
protein B, then a network state with protein A being stably ON can
only transition into the subset of network states where B is OFF. All
network states in which both A and B are simultaneously ON would be
logically forbidden (i.e., would correspond to unstable activity patterns
that would transition into a stable one). Thus the dynamics of the net-
work state is severely restricted. Therefore, cell behavior is channeled
along the possibilities dictated by the wiring diagram. The constraints
of global cell behavior reflect the constraints of the dynamics of the
network state imposed by the network architecture. It is precisely in the
analysis of these constraints that our chance lies to understand how
cellular biochemistry, represented as a schematic diagram of signaling
pathways, translates into a global, ‘‘observable’’ behavior of the cell.
State Space and Trajectories, Attractors and Basins of Attraction
An important concept for the description of network dynamics is the
state space (figure 8.4). Briefly, in our binary approximation each net-
work state SðtÞ can be written as a string of length N of 1s and 0s, such
as [111000111. . . .]. A network state represents a point in the state space,
the N-dimensional space that contains all possible network states. Fig-
ure 8.4 (right panel) shows a graphical representation of a state space of
16 states as a projection into two dimensions. Similar states that differ
in the activity status of just a few proteins would be located close to-
gether in the state space (e.g., 111000 and 111001). The number of all
possible states is immense because of combinatorial explosion: for a
network of 10,000 distinct proteins (as estimated for a given mamma-
lian cell), there would be a theoretical number of 210000A 103000 differ-
ent states. However, because of the restrictions discussed above, not all
states are equally stable: a network state that is logically forbidden, and
hence unstable, will transition to neighboring states when the Boolean
function is executed.
Remember that the cellular regulatory network is an open system:
under physiological conditions, the cell is submerged in a bath of free
energy that is continuously replenished (e.g., available in the form of
198 Sui Huang
the molecule ATP, which is used for protein phosphorylation that
drives the regulatory reactions represented by the Boolean functions).
Thus, in a first approximation we can neglect energy considerations,
and assume that execution of the Boolean functions for all the proteins
of a network, also referred to as updating of the network, is therefore a
spontaneous (exergonic) process under physiologic conditions, such
that the network continuously updates itself. Consecutive updating of
the network state causes the cellular regulatory network to travel along
a chain of unstable states in the state space, thereby defining trajectories
(figure 8.4).
Because of the logical constraints and the ensuing dynamics of the
network state, the state space is not homogeneous: instead, unstable
states are forced to migrate along trajectories into stable states as the
Boolean rules are executed. Since the protein-protein interactions in the
multiprotein complexes have unambiguous biochemical effects (which
has allowed the representation as deterministic Boolean functions), a
network state can have only one successor state while it can have mul-
tiple predecessor states. Thus, trajectories in the protein activity state
space can converge but not diverge, and a network state does not have
a memory of where it came from. This property is fundamental to cel-
lular regulatory networks and gives rise to directionality and robust-
ness of cellular behavior. In the absence of any regulatory interactions,
all network states would be equally likely, and there would be no tra-
jectories and driving force.
Since the state space is finite, trajectories will eventually hit upon
states the network has already visited before, and because of the deter-
ministic nature of updating, it will reenter the same succession of state
transitions, thus forming loops in the state space. Of interest here are
the cases where the loop of succeeding states consists of just a few
states (a tiny fraction of the state space). In the extreme case, trajectories
end at network states that, when updated, yield the same state (i.e.,
Sðt þ 1Þ ¼ SðtÞ). These asymptomatic states, which occupy either a small
number of looping states in the state space or just one network state,
are called the attractor states of the state space, since they attract the
trajectories.1 Thus, attractors can either be oscillatory (limit-cycle attrac-
tors) or stationary (fixed-point attractor). The small example network in
figure 8.4 has one two-state limit cycle. The set of network states in the
state space that will end up in the same attractor forms the basin of
199 Regulation of Cellular States in Mammalian Cells
attraction of the respective attractor. Basin boundaries divide the state
space into the basins of attraction. The state space thus has a struc-
ture: it is compartmentalized, and trajectories do not cross the basin
boundaries. This imposes a restriction on the dynamics of the global
protein activity patterns that is reflected in the rulelike behavior of the
cell.
The restricted, attractor-driven dynamics of the network can be pic-
tured as a marble on a landscape with valleys and pits that force the
marble to follow a certain path that ends in one of the pits—these local
minima would correspond to attractor states. The position of the mar-
ble at a given time represents a transient protein activity pattern, or
network state, that displays an urge to move along a given trajectory.
The choice of the destination attractor state depends on the marble’s
position (initial state), the ‘‘shape of the attractor landscape,’’ and ex-
ternal perturbations. We now move on to confront the model’s
dynamics with experimental observations in real cells.
CELL STATES IN REAL CELLS AS ATTRACTORS
Since every cellular state corresponds to a distinct protein activity pat-
tern, and the latter maps into a network state in the model, we have
now placed cell fate dynamics into the conceptual framework of regu-
latory networks in which we have driving forces, directionality of pro-
cesses, and stable, qualitatively distinct attractor states.
It has long been proposed that metabolic states or differentiated cell
types represent stable, stationary states in genetic circuits that exhibit
multistability or attractor states in genetic networks (Delbruck, 1949;
Monod and Jakob, 1961; Kauffman, 1973; Thomas, 1998). In view of the
enormous progress in our understanding of details of cell regulation in
the past few years, we present here a refined picture of the meaning of
attractor states as the most elementary emergent feature generated by
the interaction of network elements. Based on the distinct dynamic
features of cell fate regulation, we propose that phenotypic cell states
(i.e., the various cell fates) are attractor states of the underlying regulatory
network (Huang, 1999). In this model, the proliferating state, with its
recurring succession of distinct protein activation patterns during re-
peated cell division cycles, would correspond precisely to a limit cycle
attractor, while other cell states, such as differentiation, quiescence, or
200 Sui Huang
programmed cell death, would correspond to fixed-point attractors
(figure 8.4, right side).
Equating real cellular states to attractor states of the network model
allows us to address some aspects of real cell behavior from an inte-
grative viewpoint, and to describe the relation between cell fate regu-
lation and molecular pathways with a formal language instead of
resorting to intuitive, ad hoc explanations based on arrow-arrow
schemes (Figure 8.1).
We discuss in the following section some basic properties of real cell
states in the light of the network model, and show how some phenom-
ena that currently are described with an anthropomorphic verbiage,
including terms like ‘‘decision,’’ ‘‘switch of cell fates,’’ ‘‘balance of sig-
nals,’’ and the idea of ‘‘conflicting signals’’ (Raff, 1992; Evan and Little-
wood, 1998), can be put on a formal foundation.
Discreteness and Mutual Exclusiveness of Cell Fate
In response to a set of heterogeneous and often opposing stimuli, cells
have to make an all-or-nothing decision as to which fate to take: to di-
vide, to differentiate, or to die. This has raised the question of how the
cell shuts down, say, the multitude of biochemical pathways known to
promote apoptosis when it ‘‘decides’’ to enter the growth state. The
combination of cell states being attractors and the concept of attractor
basins now predicts that cellular states are a priori mutually exclusive,
since the network state can be in only one attractor at a time. This
would also agree with the all-or-none nature of transitions between cell
states and justify the use of the term ‘‘switch’’ to indicate transition be-
tween states. It has long been known that proliferation and differen-
tiation are reciprocal (Goss, 1967). In fact, removing cells from the
proliferating state by withdrawing the mitogenic factor from the me-
dium not only arrests the cell cycle in pluripotent precursor cells but
also very often triggers differentiation into the corresponding post-
mitotic mature cell, such as myocyte, adipocyte, or neuron (Olson,
1992; Harrison et al., 1985; Brustle et al., 1999).
Even arresting the cell cycle by molecular manipulation of the regu-
latory network—for example, by overexpressing the cyclin-dependent
kinase inhibitor p21 (a cell-cycle inhibitor)—induces differentiation in
many cellular systems (Steinmann, 1994; Parker et al., 1995; Liu et al.,
201 Regulation of Cellular States in Mammalian Cells
1996; Erhardt and Pittman, 1998). In all these cases no differentiative
instruction is given to the cell, just a signal that destabilizes the pro-
liferative state, following which the network falls into the attractor of
the differentiation state. In some cases, and depending on other factors
(growth condition, cell type), a growth arrest can also result in activa-
tion of cell death.
Of logical necessity the regulatory network’s wiring diagram not
only establishes the attractor states but also determines the changes of
the patterns of protein activity that occur in the cell as it travels along a
trajectory into a given attractor state (figure 8.4). Such changes of the
protein activity pattern then appear a posteriori in the traditional
pathway-centered view as an amazingly well-orchestrated, target-
oriented, and unlikely complicated process, when in fact these tem-
poral changes of protein activity pattern are ‘‘hardwired’’ into the
regulatory network that defines the basin of attraction and reflects the
self-driven execution of the Boolean rules.
Robustness of Cell States
Equating cell states with attractor states implies that the trajectories of
such states or the states themselves are intrinsically robust. Robustness
is stability against a wide variety of perturbations. In simulation of
networks, small perturbations consist of a ‘‘bit-flip’’ (changing the ON/
OFF status of just a few proteins), and will kick the network into a
nearby ‘‘forbidden’’ state. For minimal perturbations that hit only one
network element at a time, the system will flow back along trajectories
to the original attractor 80–90% of the time, as shown in computer
simulations (Kauffman, 1993). This robustness represents an important
buffer against biological noise, which is unavoidable, given the high
local fluctuations of protein activity levels due to the spatially hetero-
geneous intracellular milieu with just a few thousands of copies of each
distinct regulatory protein.
The observation that the same cell fate can be induced by treatment
with different, unrelated chemicals—as impressively demonstrated by
the ability of a variety of agents, including dimethylsulfoxide, retinoic
acid, flavones, and benzene, among others, to induce the process of
myeloid differentiation in promyelocytes (Birnie, 1988; Kalf and
O’Connor, 1993)—supports the picture of robust attractors with con-
verging trajectories.
202 Sui Huang
Compartmentalization of the State Space: Classification of
Environmental Inputs
Every major environmental input that perturbs the activity of one or
more proteins will displace the network state from the current attractor
state and place it at another spot somewhere in the state space, from
which it will relax into the respective attractor. The state space is com-
partmentalized by the boundaries of basins of attraction. Thus, the cell
classifies its environment into a few categories that correspond to the
attractors, and maps every environmental perturbation of the network
state into a distinct cell fate. This would explain why agents that do not
bind to a specific receptor but instead directly affect the activity of
many proteins, or why even physical perturbations can trigger a dis-
tinct cellular response as complex as differentiation, which is normally
thought to be induced by a specific physiological signal and requires a
concerted change of the activity of a large set of regulatory proteins.
The compartmentalization of the state space implies that the ‘‘deci-
sion’’ to take a cell fate is an inevitable process, and that the cell in a
given attractor state has only a few possible choices. The state of un-
decidedness is dynamically unstable because a network state at the
boundary between two attractor basins itself is unstable and has to
move toward one of the two attractors. It is the protein activity pattern
after the perturbation as such—no matter whether it was caused by one
specific signal or multiple, disparate external signals—that will deter-
mine in which particular basin the cell will fall, since the activity profile
as a whole determines the position of a network state relative to the
basin boundaries. This explains why nominally opposing signals, such
as the simultaneous stimulation to proliferate and to differentiate, still
result in one distinct cell fate, such as apoptosis. The widely used pic-
tures of ‘‘balance of signals’’ and ‘‘conflicting signals’’ inappropriately
compress the multidimensionality of the decision-making process at the
basin boundaries of the N-dimensional state space into a one-dimen-
sional weighing event.
Physical Inputs and Attractor States
The self-organized nature of distinct cell states not only allows for
nonbiological, ‘‘nonspecific’’ chemicals to elicit biologically coherent
responses, but also brings cell fate regulation into the realm of physical
203 Regulation of Cellular States in Mammalian Cells
influences present in the cell’s environment. Experiments using micro-
patterning technology to manipulate cell shape have shown that dis-
tinct cell fates can be induced by purely physical perturbations, such as
change of cell shape and mechanical distortion of the cell (Chen et al.,
1997; Huang and Ingber, 1999). These physical signals lack the ability
to directly and specifically interact with molecular components of the
regulatory machinery, although at some point they have to be trans-
duced into a coherent protein activity pattern. The experimental find-
ing that change of cell shape induces the same alterations of protein
activity patterns as do specific growth factors provides experimental
support for the idea that cell fates can be represented by attractor states
of protein activity patterns (Huang et al., 1998; Huang and Ingber,
2000b).
The existence of attractors and their basins of attraction representing
cell fates enables physical factors, such as cell geometry and distortion,
to harness the molecular machinery of cell fate regulation. This will
massively increase the odds for evolutionary linking of the intricate
biochemistry of cell fate regulation with the physical world that lacks
specific, molecularly encoded information, which may thereby have
facilitated the evolution of larger organisms whose development and
function are subject to the laws of macroscopic physics, yet are gov-
erned by genes and proteins (Huang and Ingber, 2000b).
CELL FATE REGULATION AS TRANSITIONS BETWEEN
ATTRACTORS
How does the traditional description of cell fate regulation by serial
molecular interactions, organized in signal transduction pathways, fit
into the concept of network attractors? Cellular signaling triggered by
the treatment with growth factors promotes the switching of the cell
into another cell state, and hence must correspond to the switching of
attractor states of the network. Therefore, a signaling cascade repre-
sents a perturbation that results in the transition between attractor
states.
Signaling Events as Perturbation of Large Sets of Cellular Proteins
A transition between cell states requires a jump of the network state
from one attractor state into the basin of another attractor state. Since
204 Sui Huang
attractor states are intrinsically robust, most such transitions will
require the perturbation (change of activity status) of a large number
of proteins. The network architecture determines size and composi-
tion of the set of network elements whose joint perturbation can cause
a transition between attractor states, and which therefore form a
transition-causing set. The optimal size of such transition-causing sets
of perturbation targets can vary considerably.
This is illustrated in a network simulation, shown in figure 8.5, for a
small regulatory network (N ¼ 12, k ¼ 2), in which perturbations of setsof m randomly chosen proteins were tested for their ability to cause the
network to switch the attractor (measured as the number of occur-
rences of a specified transition). m is the size of the perturbation set, or
the number of randomly chosen elements of the network that receive a
bit-flip perturbation; thus, m can be thought of as perturbation strength.
The results show a rich, nonmonotonic behavior of transition fre-
quencies as a function of the perturbation strength m. A high transition
frequency for a given m indicates that many perturbation sets of size m
exist that can cause that specified transition, and is a measure of ‘‘ease’’
and robustness of that transition. Thus, much as with attractor states,
the transition-causing sets themselves can display a characteristic
robustness. Each distinct transition (defined by origin and target
attractor) exhibits a different pattern of robustness. For instance, some
transitions occur rarely and only at perturbation strengths above a
minimal value, while for other transitions there is an optimal pertur-
bation strength.
This brings us back to the question of biochemical pleiotropy in sig-
nal transduction. The large number of proteins and genes whose activ-
ity is affected in the signal transduction cascades triggered by the
activation of a cell surface receptor may precisely reflect the need for a
perturbation set of a certain size in order to push the cell into another
basin of attraction. Thus, during evolution of the regulatory network
architecture, the ‘‘design’’ of signal transduction cascades and attractor
landscape must be tightly coupled to produce networks in which a
defined set of proteins needs to be turned ON/OFF to cause a certain
transition between attractors. Such characteristic sets of perturbation
targets can be likened to a code or password that provides access to a
specific attractor from another specific attractor. The extent of bio-
chemical pleiotropy in signal transduction thus might reflect evo-
lution’s fine-tuning of the m value, which in turn determines the
205 Regulation of Cellular States in Mammalian Cells
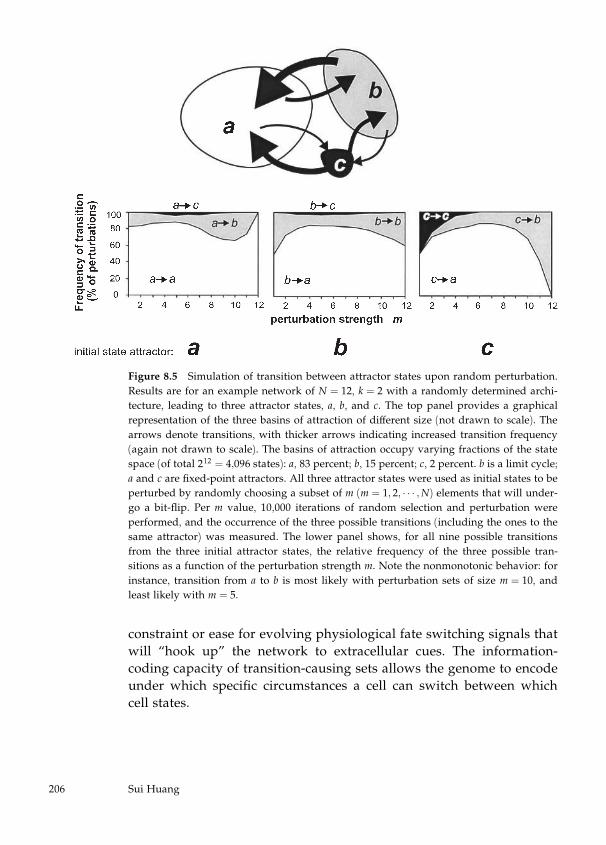
constraint or ease for evolving physiological fate switching signals that
will ‘‘hook up’’ the network to extracellular cues. The information-
coding capacity of transition-causing sets allows the genome to encode
under which specific circumstances a cell can switch between which
cell states.
Figure 8.5 Simulation of transition between attractor states upon random perturbation.
Results are for an example network of N ¼ 12, k ¼ 2 with a randomly determined archi-tecture, leading to three attractor states, a, b, and c. The top panel provides a graphical
representation of the three basins of attraction of different size (not drawn to scale). The
arrows denote transitions, with thicker arrows indicating increased transition frequency
(again not drawn to scale). The basins of attraction occupy varying fractions of the state
space (of total 212 ¼ 4;096 states): a, 83 percent; b, 15 percent; c, 2 percent. b is a limit cycle;
a and c are fixed-point attractors. All three attractor states were used as initial states to be
perturbed by randomly choosing a subset of m (m ¼ 1; 2; � � � ;N) elements that will under-go a bit-flip. Per m value, 10,000 iterations of random selection and perturbation were
performed, and the occurrence of the three possible transitions (including the ones to the
same attractor) was measured. The lower panel shows, for all nine possible transitions
from the three initial attractor states, the relative frequency of the three possible tran-
sitions as a function of the perturbation strength m. Note the nonmonotonic behavior: for
instance, transition from a to b is most likely with perturbation sets of size m ¼ 10, andleast likely with m ¼ 5.
206 Sui Huang
The restriction imposed on transition events, as manifested in the re-
quirement for a pleiotropic response to signals, solves a fundamental
dilemma of systems with multiple attractor states that are all intrinsi-
cally stable. Without barriers to transitions, in the noisy cellular micro-
environment the cell would randomly bounce between the attracting
states. Too robust attractors would prevent any change of cell state. The
‘‘code-dependent’’ restriction of transitions allows the regulatory net-
work to maintain cell fates as robust, self-stabilizing entities in the form
of attractors, and yet to allow (tightly controlled) switches between
them.
Thus, the architecture of the regulatory network is poised to unite
local stability and global flexibility. Specifically, the transitions from the
differentiation or quiescence attractor into the growth or the apoptosis
attractor can so be restricted to a narrow range of specific external
conditions. In this sense, the biochemical pleiotropy acts as an epi-
genetic safeguard against uncontrolled growth or death. Pleiotropy is a
blessing for tightness of regulation, not a harm to signal specificity.
Analysis of gene expression with microarrays reveals groups of
‘‘coregulated’’ genes, which form regulons. As discussed in chapter 6,
such sets of genes have common upstream regulatory motifs. It is often
simply assumed that such genes ‘‘share the same or a similar function.’’
One reason why a single ‘‘function’’ is controlled by a whole group of
genes that are hardwired by the genomic sequence to be coregulated
might be precisely the necessity for having jointly acting genes (transi-
tion-causing sets) to trigger phenotypic changes of the cell. For in-
stance, stimulating fibroblasts with growth factors to undergo the
transition from the quiescence state to the growth state activates a set of
over 60 genes (Fambrough et al., 1999). This set of ‘‘immediate early
response genes’’ might represent the specific transition-causing pertur-
bation set that encodes the key to the growth state. In fact, activation of
growth via the bFGF receptor or the PDGF receptor elicits almost an
identical set of genes, although the immediate postreceptor biochemical
events for these two growth factors are different.
Overlapping Perturbation Sets, Multiple-function Proteins, and
Master Proteins
Since a given transition requires the activity change of a large, defined
set of proteins, control of cell fate is distributed among a large number
207 Regulation of Cellular States in Mammalian Cells
of proteins. The profile of protein presence and activity of the cell
determines whether a given transition-causing set can be recruited.
Thus, the effect of a molecular signal is a function of the ‘‘cellular con-
text’’ defined by culture conditions, cell type, treatments, and so on. In
network simulations, signaling proteins that are part of more than one
(different) transition-causing set are readily found, indicating that
transition-causing sets often overlap. This translates directly into the
notion that regulatory proteins, such as Ras and Myc, can be part of
different perturbation sets that cause different transitions. This in turn
would explain the frequent but counterintuitive observation that signal
transduction proteins can have opposing effects on cell fate—depend-
ing on the cellular context (figure 8.2).
The proteins that are part of a transition-causing set can be viewed as
forming a rather loose functional module. The concerted activation of
such a set would be achieved most efficiently by a wiring diagram in
which a ‘‘master protein’’ would have as its downstream targets pre-
cisely such a set of proteins (or a portion of it). Cell surface receptors
obviously are such master switches. Inside the cell the Ras protein, the
ERK kinases, PI3K, or the Myc transcription factor might represent
such master proteins that have downstream effects that ramify broadly,
yet serve the same ‘‘function,’’ as represented in the concept of regulons
(Tavazoie et al., 1999). This gives rise to the appearance of functional
modules that appear to be ‘‘prewired’’ for switching cell states and
would explain the evolutionary conservation of entire pathways from
yeast to mammals, such as the MAPK- cascades, although they serve
different ‘‘functions’’ in these species (Waskiewicz and Cooper, 1995).
Environmental Cues: Epigenetic Modification of Attractor Landscape
and Pseudo Attractors
Imagine now that in the model network, one would keep some network
elements chronically in a given activity status, say ON. Although this
can be seen as a change of the cellular context discussed above, we can
express such changes in a more formal way. A persistent fixation of the
value of some network elements will obviously alter the attractor
landscape to some extent. Some attractor basins could shrink or even
disappear, and others could enlarge. The requirement for a transition
between attractors could be affected (i.e., the accessibility to certain
attractors might increase or decrease, or the ‘‘access code’’ to a specific
208 Sui Huang
attractor could become ‘‘invalid’’). New attractors could be created if
the chronic perturbations affect certain network elements. Thus, the
network architecture, inscribed in the genomic sequence, is not the sole
determinant of the ‘‘effective’’ structure of the attractor landscape; (re-
versible) environmental factors help in the fine sculpting of its final
shape.
The attractor landscape undergoes epigenetic modification. To distin-
guish the effective attractors that depend on continuous, external influ-
ence from the ‘‘true,’’ nominal attractors determined by the regulatory
network’s hardwired architecture, we use the term pseudo attractor. This
term should imply that these attractors exist only as long as the exter-
nal cues persist, and are not an intrinsic property of the network. On
the other hand, the genome can express the hardwired, nominal attrac-
tors only if all network elements are free to flip between ON and OFF.
The concept of pseudo attractors in regulatory networks is important
because real cells are also exposed to continuous signals from their tis-
sue environment, such as those originating from paracrine and juxta-
crine (cell-cell) interactions or from interaction with the extracellular
matrix. These contextual influences are thought to account for many of
the characteristic features of the differentiated phenotype that are often
lost when cells are removed from their natural tissue microenviron-
ment and grown in culture.
The picture of a (pseudo) attractor landscape allows formulation of
the biochemical effects of a regulatory input in a more general way.
While we have discussed the capability of signaling molecules to
switch cell fate, the epigenetic modification of the attractor landscape
as it is defined in the network architecture stored in the genome will
also influence the capacity of the external signals to switch cell state.
This brings together genetic determination and environmental modu-
lation. In a more encompassing category of thinking, one could envis-
age using the idea of pseudoattractor as a conceptual framework for
describing the riddle of the relationship among genes, environment,
and noise in determining the phenotype of an organism.
EXTENSION OF THE MODEL: CELL TYPES AND CANCER
Since we are focusing on cell fate regulation as the basis for tissue de-
velopment and homeostasis, we have so far discussed the regulation
within one tissue (i.e., within just one cell type) by equating attractor
209 Regulation of Cellular States in Mammalian Cells
states with the various states that a cell can take. When the whole
organism is considered, we have to deal with different cell types and
the development of pluripotent cells into variously differentiated cells.
As mentioned earlier, it has long been suggested that differentiated
cell types correspond to attractor states. Kauffman refined this idea
and placed it into the framework of genetic Boolean networks (Kauff-
man, 1973; 1993). He went further proposing that a cancer cell can be
equated with a cell type: one that is abnormal and corresponds to an
attractor that is normally not visited by the organism. We briefly dis-
cuss here how the model of cell fate regulation presented in this chapter
can be extended to the whole-organism level in order to embrace the
diversity of cell types and the origin of cancer, which, as alluded to in
the introduction to this chapter, can be triggered by a disruption of cell
fate regulation.
Cell Types as Sets of Attractors
Since every cell type has a distinct (although overlapping) protein
activity pattern and can undergo the analogous cell fates, the extended
model would be that each tissue occupies a region of the protein activ-
ity state space that consists of several attractors representing the vari-
ous alternative cell states of that cell type. The growth attractor would
correspond to the self-renewing stem cell of that tissue, which upon an
appropriate stimulus can transition either into a differentiation attrac-
tor, representing a terminally differentiated cell, or into a quiescence
attractor, representing the ‘‘dormant,’’ pluripotent state characteristic of
stem cells (Fuchs and Segre, 2000). An important aspect of this view is
the varying accessibility to the cell state attractors in different tissues,
which is the basis for the differences of tissue dynamics. For example,
the terminally differentiated neural tissues have large differentiation
attractors but normally almost inaccessible growth or apoptosis attrac-
tors, whereas in intestinal, blood, and skin cells, which represent high
turnover, self-renewing tissues, the latter attractors are large and easily
accessible.
Since many proteins are expressed only during embryonic develop-
ment and organogenesis, one will have to assume that in the entire
genomic protein activity state space, regions exist with attractors that
correspond to embryonic cell types not present in the mature organism.
These attractors are occupied only during development, and are no
210 Sui Huang
longer accessible due to a different set of tissue cues in the adult or-
ganism that, via epigenetic modification of the attractor landscape, es-
tablish barriers that prevent access to the embryonic attractors. These
‘‘archaic attractors,’’ however, are still lurking somewhere in the state
space and might play a role in the origin of tumors.
Cancer: Reactivation of Embryonic Attractors and Enlargement of
the Basin of the Growth Attractor
In contrast to the epigenetic cues from the environment discussed so
far, mutations cause permanent changes to the wiring diagram of the
genome: they can affect the activity of a regulatory protein (perma-
nently shutting it off or turning it on) or its interaction properties, (e.g.,
disrupt an interaction or change target specificity). This rewiring of the
network can result in the permanent distortion of the attractor land-
scape such that novel attractors are created or existing ones that are
inaccessible in a given adult tissue become accessible in response to an
appropriate set of external stimuli. Based on this model, tumorigenic
mutations would lead to an enlargement of the basin of the growth
attractor in which the cell would be trapped. This increased robustness
of the growth state would result in cell proliferation in a broader range
of conditions (up to full independence of mitogenic signals), thus con-
tributing to cellular fitness in the microevolutionary development of
tumors. The most likely way for mutations to achieve an enlarged
growth attractor would be to co-opt a nearby ‘‘archaic attractor’’ repre-
senting an embryonic version of the same cell type, by making it (or a
distorted version of it) accessible from within an adult cell type.
Unlike cells in the tissue of mature organisms, in which the differen-
tiation attractor is dominant such that proliferating cells are rare, in the
embryo bulk cell proliferation is required for tissue expansion; thus this
embryonic attractor would be expected to be a large and robust growth
attractor. In fact, hallmarks of tumor cells are not only the increased
stability of the proliferative state, as manifested in the reduced re-
quirement for growth factors to proliferate, but also the features of im-
maturity in terms of differentiation characteristics. Tumor cells often
express embryonic proteins, such as alpha-fetoprotein, placental alka-
line phosphatase, or carcino-embryonic protein (Jacobs and Haskell,
1991). Moreover, phenotypes such as cell migration, tissue invasion,
and stimulation of blood vessel growth, which contribute to the
211 Regulation of Cellular States in Mammalian Cells
malignancy of tumor cells, are all normal features of embryonic cells.
Numerous other generic properties of malignant cells—such as the
initially increased tendency to apoptosis, the occurrence of trans-
differentiation, and the existence of a few but distinct subtypes of a
given cancer type—are consistent with the concept of attractors, but are
beyond the scope of this chapter.
CONCLUSION AND OUTLOOK
In the wake of the unprecedented success of genomic technologies,
scholars of biology have criticized the reductionist nature of ‘‘big biol-
ogy’’ and its use of large-scale, high-throughput procedures to dissect
and discover—rather than to understand. They have advocated an
integrative view of living systems, in particular through the optics of
the emerging science of complex systems (Strohman, 1997; Coffey,
1998; Rose, 1998; Lewontin, 2000; Huang, 2000).
As a concrete case of such an integrative approach, we have focused
in this chapter on the problem of cell fate regulation in mammals as
first level of integration of gene effects into a higher-level functionality.
We have introduced the established ideas of Boolean networks as a ge-
neric model for signal transduction in cell fate regulation, and have
demonstrated how the collective behavior of the members of an inter-
action network can give rise to a rich and complex, but ordered, be-
havior restricted by rules.
However, we need to stress here that the Boolean network model is
no doubt an oversimplification, more of a symbolic modeling language
that serves as a tool to study—with the necessary coarse graining and
abstraction—the behavior of large systems of interacting molecules in
an integrated manner. Modifications and refinements of the theoretical
model system will be necessary to consider additional features of bio-
chemical reality, such as the temporal succession of inputs (including
differential affinity of interactions), asynchrony of network updating
(including differential kinetics), and multiple thresholds for enzymatic
activities.
We have also treated cells as homogeneous entities, though it is in-
creasingly appreciated that signal transduction takes place on sub-
cellular compartments that involve scaffold proteins (Tsunoda et al.,
1998; Burack and Shaw, 2000). The spatial organization of the interact-
ing partners could be encoded in more complex Boolean functions.
212 Sui Huang
Moreover, to achieve a complete picture of regulatory networks, one
will have to extend the model beyond the single layer of a protein in-
teraction network and include the protein-gene network (which com-
prises the interaction between transcription factors and cis-regulatory
elements) for which gene expression profiling is already providing ex-
perimental data (Tavazoie et al., 1999; Bucher, 1999).
The discrete network model should by no means obviate the need for
a detailed quantitative analysis of molecular machineries of cell regu-
lation. However, Boolean networks are at the moment one of the sim-
plest formalisms that can capture a wide range of properties of cell
regulation into a coherent, formal framework that does justice to our
mostly qualitative knowledge of molecular interactions, and, as such,
can reveal some basic principles for a truly integrative approach in
postgenomic biology.
It is obvious that beyond the generic model with anonymous genes
and proteins, we will have to incorporate the specifics of existing mo-
lecular networks into our model. The spate of gene-specific data trig-
gered by recent advances in genomic technologies, notably DNA
microarray-based gene expression profiling (Young, 2000; van Hal et
al., 2000) and proteomics (Dutt and Lee, 2000), hold promise of en-
abling this. However, profiling data are currently analyzed at a de-
scriptive level (e.g., by clustering of genes or conditions based on
similarities of expression patterns).
A first step beyond the descriptive interpretation of such functional
profile data, although still in the embryonic stage, is the efforts to ‘‘re-
verse engineer’’ the complete network architecture based on gene ex-
pression profiles. Algorithms have been proposed that—at least in
simple, idealized theoretical network models—can infer from series of
gene activation profiles on to the underlying network architecture
(Liang et al., 1998; Akutsu et al., 2000). Perhaps more practicable are
the recently initiated collaborative efforts to build signal transduction
pathway databases based on published, experimentally confirmed mo-
lecular interactions of the regulatory network (e.g., Biopathways Con-
sortium and Cell Signaling Networks Database). Such electronic
databases will ultimately lead to a map of the complete wiring archi-
tecture of regulatory networks of mammalian cells, similar to the clas-
sical charts of metabolic networks. These regulatory maps should serve
to organize and graphically represent the accumulated knowledge of
pathways and their relationships, and can also teach valuable lessons
213 Regulation of Cellular States in Mammalian Cells
about universal, large-scale design principles of biological networks
(Jeong et al., 2000).
However, such knowledge databases of regulatory networks will be
mere static graphs of pathways if one does not breathe life into these
maps by simulating their dynamic behavior, as demonstrated in this
chapter with theoretical, anonymous networks. Given the intrinsic
robustness of biological networks (Alon et al., 1999; Salazar-Ciudad et
al., 2000), it is likely that an exhaustive knowledge of all the quantita-
tive parameters might not be necessary. Validation of the network
structure will be possible by comparing the simulated dynamic be-
havior with real data obtained from specific perturbation experiments
in which, using current and future technologies, gene expression pro-
files (transcriptome), and protein expression and activity profiles (pro-
teome, phosphorylome, activome, etc.), are monitored (MacBeath and
Schreiber, 2000).
This should launch the next big (postgenomic) endeavor of analyzing
the structure of the gene activity state space of real cellular systems, map-
ping the real attractor landscape of the human genome, and studying
its biological significance. The information on the dynamics might be
more valuable than the static network architecture map, since it links
directly to global cellular behavior. Knowledge of the state space
structure could pave the way toward developing the predictive capa-
bilities in cell fate regulation that one will need to understand regu-
lative disorders, such as cancer, and to explore the differentiation
potential (neighboring, accessible attractors) of somatic stem cells in
order to design therapeutics for a wide variety of diseases.
NOTE
1. Having few attractors that are either fixed points or small cycles is a property that
belongs to only a subset of possible network architectures, namely those that are sparsely
connected (kfN), as is the case in real cellular regulatory networks, and exhibit a bias
toward a subset of Boolean functions that is most likely to be implemented by molecular
interactions (high internal homogeneity). (For details see Kauffman, 1993.) Hereafter we
will deal with this subset of biologically reasonable network architectures.
REFERENCES
Akutsu, T., Miyano, S., and Kuhara, S. (2000). Algorithms for inferring qualitative models
of biological networks. Pac. Symp. Biocomput. 293–304.
214 Sui Huang
Alon, U., Surette, M. G., Barkai, N., and Leibler, S. (1999). Robustness in bacterial che-
motaxis. Nature 397: 168–171.
Barbacid, M. (1987). Ras genes. Annu. Rev. Biochem. 56: 779–827.
Birnie, G. D. (1988). The HL60 cell line: A model system for studying human myeloid cell
differentiation. Br. J. Cancer 9: 41–45.
Bray, D. (1995). Protein molecules as computational elements in living cells. Nature 376:
307–312.
Brunet, A., and Pouyssegur, J. (1997). Mammalian MAP kinase modules: How to trans-
duce specific signals. Essays Biochem. 32: 1–16.
Brustle, O., Jones, K. N., Learish, R. D., Karram, K., Choudhary, K., Wiestler, O. D., Dun-
can, I. D., and McKay, R. D. (1999). Embryonic stem cell-derived glial precursors: A
source of myelinating transplants. Science 285: 754–756.
Bucher, P. (1999). Regulatory elements and expression profiles. Curr. Opinion Struct. Biol.
9: 400–407.
Burack, W. R., and Shaw, A. S. (2000). Signal transduction: Hanging on a scaffold. Curr.
Opinion Cell Biol. 12: 211–216.
Chao, M. V. (1992). Growth factor signaling: Where is the specificity? Cell 68: 995–997.
Chen, C. S., Mrksich, M., Huang, S., Whitesides, G. M., and Ingber, D. E. (1997). Geomet-
ric control of cell life and death. Science 276: 1425–1428.
Chervitz, S. A., Aravind, L., Sherlock, G., Ball, C. A., Koonin, E. V., Dwight, S. S., Harris,
M. A., Dolinski, K., Mohr, S., Smith, T., Weng, S., Cherry, J. M., and Botstein, D. (1998).
Comparison of the complete protein sets of worm and yeast: Orthology and divergence.
Science 282: 2022–2028.
Coffey, D. S. (1998). Self-organization, complexity and chaos: The new biology for medi-
cine. Nat. Med. 4: 882–885.
Coller, H. A., Grandori, C., Tamayo, P., Colbert, T., Lander, E. S., Eisenman, R. N., and
Golub, T. R. (2000). Expression analysis with oligonucleotide microarrays reveals that
MYC regulates genes involved in growth, cell cycle, signaling, and adhesion. Proc. Natl.
Acad. Sci. USA 97: 3260–3265.
Constantinou, A., and Huberman, E. (1995). Genistein as an inducer of tumor cell differ-
entiation: Possible mechanisms of action. Proc. Soc. Exp. Biol. Med. 208: 109–115.
Delbruck, M. (1949). Discussion. In CNRS (ed.), Colloques internationaux du Centre national
de la recherche scientifique. Unites biologiques douees de continuite genetique. Paris, CNRS.
Di Cunto, F., Topley, G., Calautti, E., Hsiao, J., Ong, L., Seth, P. K., and Dotto, G. P.
(1998). Inhibitory function of p21Cip1/WAF1 in differentiation of primary mouse kerati-
nocytes independent of cell cycle control. Science 280: 1069–1072.
Downward, J. (1998). Lipid-regulated kinases: Some common themes at last. Science 279:
673–674.
215 Regulation of Cellular States in Mammalian Cells
Dutt, M. J., and Lee, K. H. (2000). Proteomic analysis. Curr. Opinion Biotechnol. 11: 176–
179.
Endy, D., and Brent, R. (2001). Modelling cellular behaviour. Nature 409 (suppl.): 391–395.
Erhardt, J. A., and Pittman, R. N. (1998). Ectopic p21(WAF1) expression induces differen-
tiation-specific cell cycle changes in PC12 cells characteristic of nerve growth factor treat-
ment. J. Biol. Chem. 273: 23517–23523.
Evan, G., and Littlewood, T. (1998). A matter of life and cell death. Science 281: 1317–1322.
Fambrough, D., McClure, K., Kazlauskas, A., and Lander, E. S. (1999). Diverse signaling
pathways activated by growth factor receptors induce broadly overlapping, rather than
independent, sets of genes. Cell 97: 727–741.
Ferrell, J. E., Jr., and Machleder, E. M. (1998). The biochemical basis of an all-or-none cell
fate switch in Xenopus oocytes. Science 280: 895–898.
Franke, T., Kaplan, D. R., Cantley, L. C., and Toker, A. (1997). Direct regulation of the akt
proto-oncogene product by phosphatidylinositol-3,4-bisphosphate. Science 275: 665–668.
Fuchs, E., and Segre, J. A. (2000). Stem cells: A new lease on life. Cell 100: 143–155.
Gire, V., Marshall, C., and Wynford-Thomas, D. (2000). PI-3-kinase is an essential anti-
apoptotic effector in the proliferative response of primary human epithelial cells to mu-
tant RAS. Oncogene 19: 2269–22676.
Glass, L., and Kauffman, S. A. (1973). The logical analysis of continuous, non-linear bio-
chemical control networks. J. Theor. Biol. 39: 103–129.
Goss, R. J. (1967). The strategy of growth. In H. Teir and T. Rytomaa (eds.), Control of
Cellular Growth in the Adult Organism. London: Academic Press.
Guan, K. L., Jenkins, C. W., Li, Y., O’Keefe, C. L., Noh, S., Wu, X., Zariwala, M., Matera,
A. G., and Xiong, Y. (1996). Isolation and characterization of p19INK4d, a p16-related in-
hibitor specific to CDK6 and CDK4. Mol. Biol. Cell. 7: 57–70.
Harrison, J. J., Soudry, E., and Sager, R. (1985). Adipocyte conversion of CHEF cells in
serum-free medium. J. Cell. Biol. 100: 429–434.
Hartwell, L. H., Hopfield, J. J., Leibler, S., and Murray, A. W. (1999). From molecular to
modular cell biology. Nature 402(6761 suppl): C47–C52.
Huang, S. (1999). Gene expression profiling, genetic networks and cellular states: An
integrating concept for tumorigenesis and drug discovery. J. Mol. Med. 77: 469–480.
Huang, S. (2000). The practical problems of post-genomic biology. Nat. Biotechnol. 18:
471–472.
Huang, S., Chen, S. C., Whitesides, G. M., and Ingber, D. E. (1998). Cell-shape-dependent
control of p27Kip and cell cycle progression in human capillary endothelial cells. Mol.
Biol. Cell 9: 3179–3193.
Huang, S., and Ingber, D. E. (1999). The structural and mechanical complexity of cell-
growth control. Nat. Cell. Biol. 1: E131–E138.
216 Sui Huang
Huang, S., and Ingber, D. E. (2000a). Shape-dependent control of cell growth, differentia-
tion and apoptosis: Switching between attractors in cell regulatory networks. Exp. Cell.
Res. 261: 91–103.
Huang, S., and Ingber, D. E. (2000b). Regulation of cell cycle and gene activity patterns by
cell shape: Evidence for attractors in real regulatory networks and the selective mode of
cellular control. InterJ. Genet. 238.
Jacobs, E. L., and Haskell, C. M. (1991). Clinical use of tumor markers in oncology. Curr.
Problems Cancer 15: 299–360.
Jeong, H., Tombor, B., Albert, R., Oltvai, Z. N., and Barabasi, A. L. (2000). The large-scale
organization of metabolic networks. Nature 407: 651–654.
Kalf, G. F., and O’Connor, A. (1993). The effects of benzene and hydroquinone on myeloid
differentiation of HL-60 promyelocytic leukemia cells. Leukemig Lymphoma 11: 331–338.
Kaplan, D., and Glass, L. (1995). Understanding Nonlinear Dynamics. New York: Springer-
Verlag.
Kauffman, S. A. (1969). Metabolic stability and epigenesis in randomly constructed ge-
netic nets. J. Theor. Biol. 22: 437–467.
Kauffman, S. A. (1973). Control circuits for determination and transdetermination. Science
181: 310–318.
Kauffman, S. A. (1993). The Origins of Order. New York: Oxford University Press.
Kauffmann-Zeh, A., Rodriguez-Viciana, P., Ulrich, E., Gilbert, C., Coffer, P., Downward,
J., and Evan, G. (1997). Suppression of c-Myc-induced apoptosis by Ras signalling
through PI(3)K and PKB. Nature 385: 544–548.
Keverne, E. B. (1997). An evaluation of what the mouse knockout experiments are telling
us about mammalian behaviour. Bioessays 19: 1091–1098.
Knudson, A. G. (1996). Hereditary cancer: Two hits revisited. J. Cancer Res. Clin. Oncol.
122: 135–140.
Koshland, D. E., Goldbeter, A., and Stock, J. B. (1982). Amplification and adaptation in
regulatory and sensory systems. Science 217: 220–225.
Krasilnikov, M. A. (2000). Phosphatidylinositol-3 kinase dependent pathways: The role in
control of cell growth, survival, and malignant transformation. Biochemistry (Moscow) 65:
59–67.
Kulyk, W. M., and Hoffman, L. M. (1996). Ethanol exposure stimulates cartilage differen-
tiation by embryonic limb mesenchyme cells. Exp. Cell. Res. 223: 290–300.
Lavoie, J. N., L’Allemain, G., Brunet, A., Muller, R., and Pouyssegur, J. (1996). Cyclin D1
expression is regulated positively by the p42/p44MAPK and negatively by the p38/
HOGMAPK pathway. J. Biol. Chem. 271: 20608–20616.
Lewontin, R. C. (2000). The Triple Helix: Gene, Organism, and Environment. Cambridge,
Mass.: Harvard University Press.
217 Regulation of Cellular States in Mammalian Cells
Liang, S., Fuhrmann, S., and Somogyi, R. (1998). REVEAL, a general reverse engineering
algorithm for inference of genetic network architecture. Pac. Symp. Biocomput. 3: 18–29.
Liu, M., Lee, M. H., Cohen, M., Bommakanti, M., and Freedman, L. P. (1996). Transcrip-
tional activation of the Cdk inhibitor p21 by vitamin D3 leads to the induced differentia-
tion of the myelomonocytic cell line U937. Genes Dev. 10: 142–153.
MacBeath, G., and Schreiber, S. L. (2000). Printing proteins as microarrays for high-
throughput function determination. Science 289: 1760–1763.
Mayo, M. W., Wang, C. Y., Cogswell, P. C., Rogers-Graham, K. S., Lowe, S. W., Der, C. J.,
and Baldwin, A. S. Jr. (1997). Requirement of NF-kappaB activation to suppress p53-in-
dependent apoptosis induced by oncogenic Ras. Science 278: 1812–1815.
McAdams, H. H., and Arkin, A. (1998). Simulation of prokaryotic genetic circuits. Annu.
Rev. Biopohys. Biomol. Struct. 27: 199–224.
Melton, D. W. (1994). Gene targeting in the mouse. Bioessays 16: 633–638.
Monod, J., and Jakob, F. (1961). General conclusions: Teleonomic mechanisms in cellular
metabolism, growth and differentiation. Cold Spring Harbor Symp. Quant. Biol. 26: 389–401.
Mooney, D. J., Hansen, L. K., Vacanti, J. P., Langer, R., Farmer, S. R., and Ingber, D. E.
(1992). Switching from differentiation to growth in hepatocytes: Control by extracellular
matrix. J. Cell. Phys. 151: 497–505.
Olson, E. N. (1992). Interplay between proliferation and differentiation within the myo-
genic lineage. Dev. Biol. 154: 261–272.
Pardee, A. B. (1989). G1 events and regulation of cell proliferation. Science 246: 603–608.
Parker, S. B., Eichele G., Zhang P., Rawls A., Sands A. T., Bradley A., Olson E. N., Harper
J. W., and Elledge S. J. (1995). p53-independent expression of p21Cip1 in muscle and other
terminally differentiating cells. Science 267: 1024–1027.
Paulsson, J., Berg, O. G., and Ehrenberg, M. (2000). Stochastic focusing: Fluctuation-
enhanced sensitivity of intracellular regulation. Proc. Natl. Acad. Sci. USA 97: 7148–7153.
Pawson, T., and Scott, J. D. (1997). Signaling through scaffold, anchoring, and adaptor
proteins. Science 278: 2075–2080.
Phillips, R. L., Ernst, R. E., Brunk, B., Ivanova, N., Mahan, M. A., Deanehan, J. K., Moore,
K. A., Overton, G. C., and Lemischka, I. R. (2000). The genetic program of hematopoietic
stem cells. Science 288: 1635–1640.
Raff, M. C. (1992). Social controls on cell survival and cell death. Nature 356: 397–399.
Reznikoff, W. S. (1992). The lactose operon-controlling elements: A complex paradigm.
Mol. Microbiol. 6: 2419–2422.
Rose, S. (1998). Lifelines: Biology Beyond Determinism. Oxford: Oxford University Press.
Rovera, G., O’Brien, T. G., and Diamond, L. (1979). Induction of differentiation in human
promyelocytic leukemia cells by tumor promoters. Science 204: 868–870.
218 Sui Huang
Salazar-Ciudad, I., Garcia-Fernandez, J., and Sole, R. V. (2000). Gene networks capable of
pattern formation: From induction to reaction-diffusion. J. Theor. Biol. 205: 587–603.
Savageau, M. A. (1995). Michaelis-Menten mechanism reconsidered: Implications of frac-
tal kinetics. J. Theor. Biol. 176: 115–124.
Sawyers, C. L., Denny, C. T., and Witte, O. N. (1991). Leukemia and the disruption of
normal hematopoiesis. Cell 64: 337–350.
Serrano, M., Lin, A. W., McCurrach, M. E., Beach, D., and Lowe, S. W. (1997). Oncogenic
ras provokes premature cell senescence associated with accumulation of p53 and p16
lNK4a. Cell 88: 593–602.
Shastry, B. S. (1994). More to learn from gene knockouts. Mol. Cell Biochem. 136: 171–182.
Somogyi, R., and Sniegoski, C. A. (1996). Modelling the complexity of genetic networks:
Understanding multigenic and pleiotropic regulation. Complexity 1: 45–63.
Steinman, R. A., Hoffman, B., Iro, A., Guillouf, C., Liebermann, D. A., and el-Houseini, M.
E. (1994). Induction of p21 (WAF-1/CIP1) during differentiation. Oncogene 9: 3389–3396.
Strohman, R. C. (1997). The coming Kuhnian revolution in biology. Nat. Biotechnol. 15:
194–200.
Tan, P. B., and Kim, S. K. (1999). Signaling specificity: The RTK/RAS/MAP kinase path-
way in metazoans. Trends Genet. 15: 145–149.
Tavazoie, S., Hughes, J. D., Campbell, M. J., Cho, R. J., and Church, G. M. (1999). Sys-
tematic determination of genetic network architecture. Nat. Genetics 22: 281–285.
Taylor, S. J., and Shalloway, D. (1996). Cell cycle-dependent activation of Ras. Curr. Biol.
6: 1621–1627.
Thomas, R. (1998). Laws for the dynamics of regulatory networks. Int. J. Dev. Biol. 42 (3,
spec no): 479–485.
Thomas, R., Thieffry, D., and Kaufman, M. (1995). Dynamical behaviour of biological
regulatory networks. I. Biological role of feedback loops and practical use of the concept
of loop-characteristic state. Bull. Math. Biol. 57: 247–276.
Tsunoda, S., Sierralta, J., and Zuker, C. S. (1998). Specificity in signaling pathways: As-
sembly into multimolecular signaling complexes. Curr. Opinion Genet. Dev. 8: 419–422.
Tyson, J. J. (1999). Models of cell cycle control in eukaryotes. J. Biotechnol. 71: 239–244.
van Hal, N. L., Vorst, O., van Houwelingen, A. M., Kok, E. J., Peijnenburg, A., Aharoni,
A., van Tunen, A. J., and Keijer, J. (2000). The application of DNA microarrays in gene
expression analysis. J. Biotechnol. 78: 271–280.
Venter, J. C., Adams, M. D., Myers, E. W., et al. (2001). The sequence of the human
genome. Science 291: 1304–1351.
Waskiewicz, A. J., and Cooper, J. A. (1995). Mitogen and stress response pathways: MAP
kinase cascades and phosphatase regulation in mammals and yeast. Curr. Opinion Cell.
Biol. 7: 798–805.
219 Regulation of Cellular States in Mammalian Cells
Weinberg, R. A. (1989). Oncogenes, antioncogenes, and the molecular bases of multistep
carcinogenesis. Cancer Res. 49: 3713–3721.
Weng, G., Bhalla, U. S., and Iyengar, R. (1999). Complexity in biological signaling sys-
tems. Science 284: 92–96.
Woodbury, D., Schwarz, E. J., Prockop, D. J., and Black, I. B. (2000). Adult rat and human
bone marrow stromal cells differentiate into neurons. J. Neurosci. Res. 61: 364–370.
Wuensche, A. (1998). Genomic regulation modeled as a network with basins of attraction.
Pac. Symp. Biocomput. 3: 89–102.
Young, R. A. (2000). Biomedical discovery with DNA arrays. Cell 102: 9–15.
Yu, Z. W., and Quinn, P. J. (1994). Dimethyl sulphoxide: A review of its applications in
cell biology. Biosci. Rep. 14: 259–281.
Yuh, C.-H., Bolouri, H., and Davidson, E. H. (1997). Genomic cis-regulatory logic: Exper-
imental and computational analysis of a sea urchin gene. Science 279: 1896–1902.
SUGGESTED READINGS
Huang, S. (1999). Gene expression profiling, genetic networks and cellular states: An
integrating concept for tumorigenesis and drug discovery. J. Mol. Med. 77: 469–480.
Lewontin, R. C. (2000). The Triple Helix: Gene, Organism, and Environment. Cambridge,
Mass.: Harvard University Press. An elegantly written, concise, and accessible text that
addresses the limits of the gene-centered view of modern molecular biology, and con-
fronts it with the questions concerning the relationship between genotype and phenotype,
genetic and environmental influences, parts and wholes.
Somogyi, R., and Sniegolski, C. A. (1996). Modelling the complexity of genetic networks:
Understanding multigenic and pleiotropic regulation. Complexity 1: 45–63.
URLs FOR RELEVANT SITES
Public initiatives to compile protein interaction into database for cell signaling pathways
and network:
Cell Signaling Networks Database maintained by National Institute of Health Sciences
(NIHS) (Japan). http://geo.nihs.go.jp/csndb/
The BioPathways Consortium. http://www.biopathways.or/
Tool for research in discrete dynamical networks:
Discrete Dynamics Lab. http://www.santafe.edu/@wuensch/ddlab.html
220 Sui Huang

III Postgenomic Approaches

This page intentionally left blank
9 Predicting Protein Function and Networkson a Genomewide Scale
Edward M. Marcotte
WHAT IS PROTEIN FUNCTION?
Perhaps the most significant finding from the more than 80 genomes
that have been sequenced as of 2002 has been the extent of our igno-
rance about the constituents of cells. In virtually every genome
sequenced, the majority of genes have never been studied directly. In
spite of this, for about half of the genes at least one near or distant rel-
ative has been studied, so we glean our knowledge from the activities
of these relatives. Until recently such methods for extending informa-
tion to proteins with similar sequences or structures (homology-based
methods) have been the only form of inference about protein function.
Homology-based annotation, with algorithms such as BLAST (Alt-
schul et al., 1997; http://www.ncbi.nlm.nih.gov/BLAST), hasbeen wildly successful in extending knowledge from the small set of
experimentally characterized proteins to the tens of thousands of pro-
teins found in genome sequencing projects. However, these methods
perform as one might expect: they provide information only for pro-
teins with very closely related functions. They reveal little about pro-
teins that work together but typically have unrelated sequences or
structures. Thus, the homology-based methods cannot be used to re-
construct metabolic or signaling pathways or other protein interaction
networks. That such a bias exists shows that there are different aspects
to protein function; methods that reveal one aspect do not necessarily
reveal others.
The two most important aspects of protein function, defined in figure
9.1, will be referred to as the molecular function and the cellular function
of proteins. The homology-based methods tend to find only the molec-
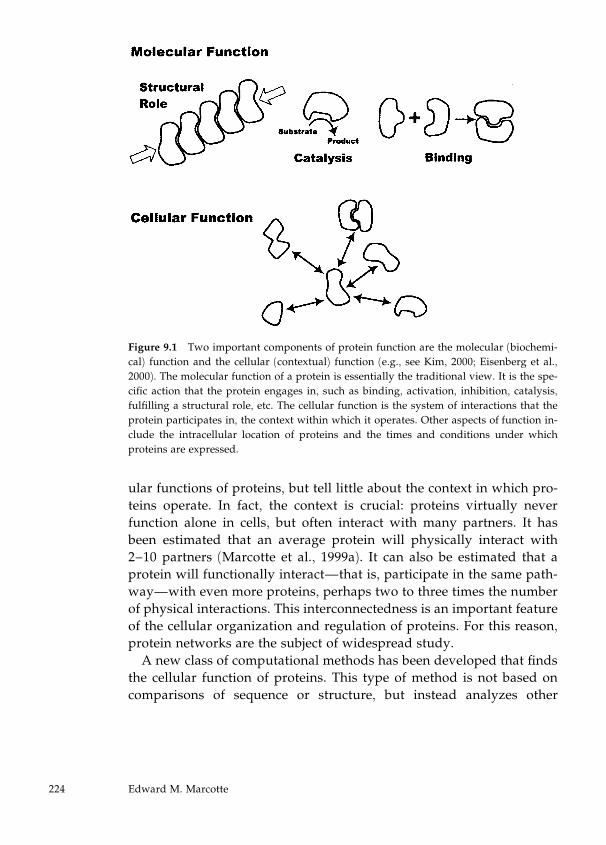
ular functions of proteins, but tell little about the context in which pro-
teins operate. In fact, the context is crucial: proteins virtually never
function alone in cells, but often interact with many partners. It has
been estimated that an average protein will physically interact with
2–10 partners (Marcotte et al., 1999a). It can also be estimated that a
protein will functionally interact—that is, participate in the same path-
way—with even more proteins, perhaps two to three times the number
of physical interactions. This interconnectedness is an important feature
of the cellular organization and regulation of proteins. For this reason,
protein networks are the subject of widespread study.
A new class of computational methods has been developed that finds
the cellular function of proteins. This type of method is not based on
comparisons of sequence or structure, but instead analyzes other
Figure 9.1 Two important components of protein function are the molecular (biochemi-
cal) function and the cellular (contextual) function (e.g., see Kim, 2000; Eisenberg et al.,
2000). The molecular function of a protein is essentially the traditional view. It is the spe-
cific action that the protein engages in, such as binding, activation, inhibition, catalysis,
fulfilling a structural role, etc. The cellular function is the system of interactions that the
protein participates in, the context within which it operates. Other aspects of function in-
clude the intracellular location of proteins and the times and conditions under which
proteins are expressed.
224 Edward M. Marcotte
attributes associated with genes. Broadly speaking, these nonhomology
methods draw inferences about relationships between genes by ana-
lyzing the context in which the genes are found. This chapter will
present an overview of these methods, along with a discussion of their
applications for finding protein function, reconstructing cellular path-
ways, revealing new metabolic systems, and even revealing physical
properties of proteins, such as their locations in cells.
GENOMES CONTAIN CONSIDERABLE INFORMATION ABOUT
PROTEIN FUNCTION
It is easy to think only of the coding potential of genes, since that seems
most immediately important for producing a protein. However, genes
have many different properties besides their coding potential, and in-
formation about the relationships between genes is often encoded in
these other properties. Important contextual properties of genes include
their position and order on the chromosome, the flanking control
regions, the distribution of homologues in other species, the occurrence
of fusions between genes, and so on. Table 9.1 summarizes many such
genomic sources of functional data and lists data derived from meas-
urements of protein and mRNA expression patterns.
Just as homology-based methods analyze conserved sequences or
structures to find proteins with related molecular function, so non-
homology methods analyze conserved contextual properties to find
proteins with related cellular function. At the heart of nonhomology
methods is the fact that proteins working together in the cell have
shared constraints—they must be encoded by the same genome, they
often are coregulated, they occasionally are fused into a single gene,
they must at some point be coexpressed, and so on. Nonhomology
methods exploit these constraints to identify proteins working together.
DISCOVERING PROTEIN FUNCTION FROM GENOMIC DATA
Finding Function from Domain Fusions
One of the most straightforward nonhomology methods needs large
numbers of protein sequences but does not require complete genomes.
It has been known for years that proteins encoded as separate genes in
one organism often are found in another organism fused into a single
225 Predicting Protein Function and Networks
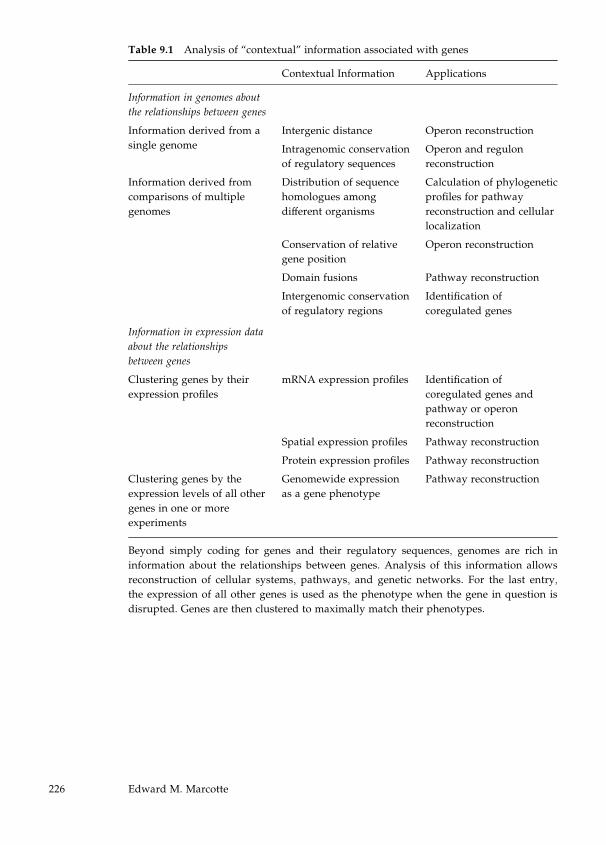
Table 9.1 Analysis of ‘‘contextual’’ information associated with genes
Contextual Information Applications
Information in genomes about
the relationships between genes
Information derived from a
single genome
Intergenic distance
Intragenomic conservation
of regulatory sequences
Operon reconstruction
Operon and regulon
reconstruction
Information derived from
comparisons of multiple
genomes
Distribution of sequence
homologues among
different organisms
Calculation of phylogenetic
profiles for pathway
reconstruction and cellular
localization
Conservation of relative
gene position
Operon reconstruction
Domain fusions Pathway reconstruction
Intergenomic conservation
of regulatory regions
Identification of
coregulated genes
Information in expression data
about the relationships
between genes
Clustering genes by their
expression profiles
mRNA expression profiles Identification of
coregulated genes and
pathway or operon
reconstruction
Spatial expression profiles Pathway reconstruction
Protein expression profiles Pathway reconstruction
Clustering genes by the
expression levels of all other
genes in one or more
experiments
Genomewide expression
as a gene phenotype
Pathway reconstruction
Beyond simply coding for genes and their regulatory sequences, genomes are rich in
information about the relationships between genes. Analysis of this information allows
reconstruction of cellular systems, pathways, and genetic networks. For the last entry,
the expression of all other genes is used as the phenotype when the gene in question is
disrupted. Genes are then clustered to maximally match their phenotypes.
226 Edward M. Marcotte
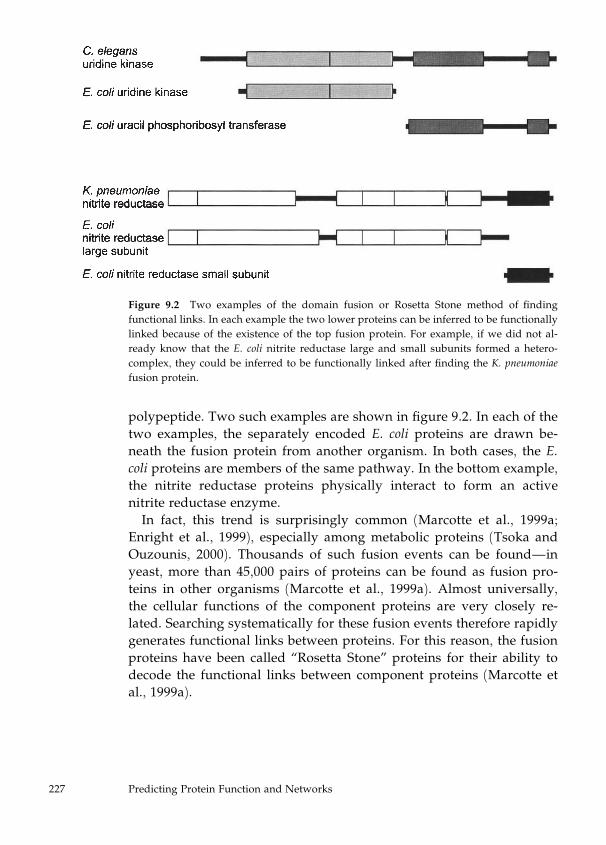
polypeptide. Two such examples are shown in figure 9.2. In each of the
two examples, the separately encoded E. coli proteins are drawn be-
neath the fusion protein from another organism. In both cases, the E.
coli proteins are members of the same pathway. In the bottom example,
the nitrite reductase proteins physically interact to form an active
nitrite reductase enzyme.
In fact, this trend is surprisingly common (Marcotte et al., 1999a;
Enright et al., 1999), especially among metabolic proteins (Tsoka and
Ouzounis, 2000). Thousands of such fusion events can be found—in
yeast, more than 45,000 pairs of proteins can be found as fusion pro-
teins in other organisms (Marcotte et al., 1999a). Almost universally,
the cellular functions of the component proteins are very closely re-
lated. Searching systematically for these fusion events therefore rapidly
generates functional links between proteins. For this reason, the fusion
proteins have been called ‘‘Rosetta Stone’’ proteins for their ability to
decode the functional links between component proteins (Marcotte et
al., 1999a).
Figure 9.2 Two examples of the domain fusion or Rosetta Stone method of finding
functional links. In each example the two lower proteins can be inferred to be functionally
linked because of the existence of the top fusion protein. For example, if we did not al-
ready know that the E. coli nitrite reductase large and small subunits formed a hetero-
complex, they could be inferred to be functionally linked after finding the K. pneumoniae
fusion protein.
227 Predicting Protein Function and Networks
Rosetta Stone links are found by aligning a query protein’s amino
acid sequence against protein sequences from genomes or a large se-
quence database such as GenBank. The statistically significant hits from
this search include sequence homologues and candidate Rosetta Stone
proteins. These hits are then used as the query proteins for a second set
of searches against the sequence database. The statistically significant
hits from this second round of searches are then tested for similarity to
the original query protein. Those second-round hits without sequence
similarity to the original query protein are proteins with Rosetta Stone
links to the original query protein.
Not all fusions convey the same degree of confidence in the resulting
functional linkage. Individual domains have different propensities to
participate in these gene fusion events, and many cell signaling
domains, such as SH3 or tyrosine kinase domains, can be found fused
into literally hundreds of different genes. These promiscuous domains
still can be used to generate functional linkages, but it has been found
that limiting the Rosetta Stone analysis to nonpromiscuous domains
increases the functional similarity of the linked proteins. This filtering
step can be performed either by explicitly forbidding links generated
by promiscuous domains (Marcotte et al., 1999a; http://www.doe-mbi.ucla.edu) or by requiring strong sequence homology or evenorthology between the individual proteins and the Rosetta Stone pro-
tein (Enright et al., 1999; Enright and Ouzounis, 2000). Regardless, it is
possible to generate thousands of significant links between pairs of
proteins in a genome by this method.
Finding Function from Coinheritance
One important consequence of the genomic revolution is the finding
that genomes have mosaic compositions, containing genes with widely
varying phylogenetic origins. This trend is especially strong among
prokaryotes due to processes such as horizontal gene transfer (Jain et
al., 1999; Koonin and Galperin, 1997), but is true to a considerable ex-
tent in eukaryotes as well (Marcotte et al., 2000). These variable phylo-
genetic origins of genes are another aspect of gene context for use in
these analyses.
This phylogenetic diversity can be explicitly described for each gene
by calculating its phylogenetic profile (Pellegrini et al., 1999, with related
228 Edward M. Marcotte
concepts in Gaasterland and Ragan, 1998; Huynen et al., 1998; Ouzou-
nis and Kyrpides, 1996; and Tatusov et al., 2001). A phylogenetic pro-
file describes the presence or absence of a gene across a set of
organisms with sequenced genomes. Genes with similar phylogenetic
profiles are therefore always inherited together or absent from the same
organisms. This similarity is unlikely to happen by chance if enough
species are examined, and such proteins are thus extremely likely to
function together. For 30 genomes, there are about 230, or 109, possible
phylogenetic profiles, making random matches of profiles unlikely.
When enough different species are examined to be statistically signifi-
cant, genes with similar phylogenetic profiles are inferred to be func-
tionally linked.
Constructing a phylogenetic profile for a gene requires performing
sequence alignments between that gene and all genes from each of the
fully sequenced genomes. Because thousands of sequence alignments
must be calculated, rapid alignment algorithms like BLAST (Altschul et
al., 1997) are typically used. The phylogenetic profile of a gene is then
calculated as a vector in which each entry represents a measure of se-
quence similarity between that gene and the most similar sequence
match in a given genome. This measure of sequence similarity Si; j can
be as simple as a binary code: Si; j ¼ 1 if a sequence homologue of gene i
is present in genome j and Si; j ¼ 0 if no homologue exists. Alter-natively, the measure of sequence similarity can be a real, valued mea-
surement reflecting the degree of sequence similarity present. One such
measure that has empirically been shown to work satisfactorily is
Si; j ¼ �1=logðEÞ, where E represents the expectation value from the se-
quence alignment between gene i and the top-scoring sequence match
in genome j (Marcotte, 2000). Real-valued phylogenetic profiles calcu-
lated in this fashion are shown in figure 9.3.
Once a phylogenetic profile is calculated for each of the genes in
a genome, functional links can then be inferred between genes with
similar phylogenetic profiles. The simplest approach is to treat phylo-
genetic profiles as coordinate vectors positioning genes in a high-
dimensional space, then calculating distances between genes, using such
distance metrics as the Manhattan, Euclidean, or Mahalonobis distance.
Genes positioned close together in space can be inferred to be coin-
herited, and therefore functionally linked. Another approach is to apply
a statistical test such as a Fisher exact test on the binary phylogenetic
profile vectors to identify coinherited genes.
229 Predicting Protein Function and Networks
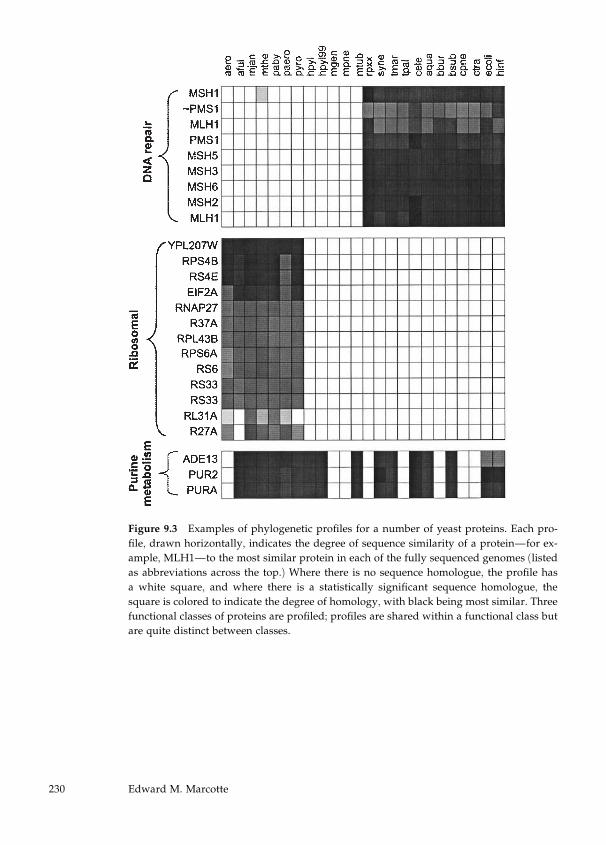
Figure 9.3 Examples of phylogenetic profiles for a number of yeast proteins. Each pro-
file, drawn horizontally, indicates the degree of sequence similarity of a protein—for ex-
ample, MLH1—to the most similar protein in each of the fully sequenced genomes (listed
as abbreviations across the top.) Where there is no sequence homologue, the profile has
a white square, and where there is a statistically significant sequence homologue, the
square is colored to indicate the degree of homology, with black being most similar. Three
functional classes of proteins are profiled; profiles are shared within a functional class but
are quite distinct between classes.
230 Edward M. Marcotte
As an alternative to calculating pairwise links, the genes can simply
be clustered into coinheritance groups on the basis of similarity be-
tween their phylogenetic profiles. Many such clustering approaches
have been developed in computer science and statistics for clustering
points in high-dimensional spaces, such as k-means clustering, which
are appropriate for this task.
Finding Function from Relative Gene Position
Another powerful method for finding functionally linked genes comes
from examining the conservation of relative positions of genes in
genomes (Dandekar et al., 1998; Tamames et al., 1997; Overbeek et al.,
1999). As with the two previous methods, this aspect of gene context
can be analyzed in a straightforward fashion. The essence of the
method is that the order of genes in genomes tends to randomize over
time. Therefore, if two genes have similar positions relative to one an-
other in several genomes, the genes are likely to be functionally linked.
In the simplest case, this means that the genes are immediate neighbors
in several genomes, but the method could theoretically be extended to
any separation between the genes. On-line tools for investigating the
genomic neighbors of a gene include the Entrez genome (http://www.ncbi.nlm.nih.gov/entrez/query.fcgi?db=Genome) andWIT (http://wit.mcs.anl.gov/WIT2) databases.This method exploits the trend for prokaryotic genes to be organized
into operons, in which genes with a related function are clustered close
together on the genome to allow coordinate transcription and transla-
tion of the genes. Operons seem to be uncommon in most eukaryotes,
occurring mainly in unusual gene families such as the cadherins (Wu
and Maniatis, 1999). However, in prokaryotes, operons are virtually the
norm, and where genes from an operon are conserved in multiple spe-
cies, this method allows very reliable functional links to be inferred. In
fact, it has been shown that the observation of two genes as immediate
neighbors in two reasonably unrelated organisms is sufficiently statis-
tically significant to infer a functional link between the proteins (Over-
beek et al., 1999), as diagrammed in figure 9.4A and B.
A rough calculation of significance goes as follows. Given two adja-
cent genes in a genome, we would expect by random chance to find the
genes adjacent in a second genome of n genes, with all genes, but not
gene order, conserved between the two genomes, only two times out of
231 Predicting Protein Function and Networks
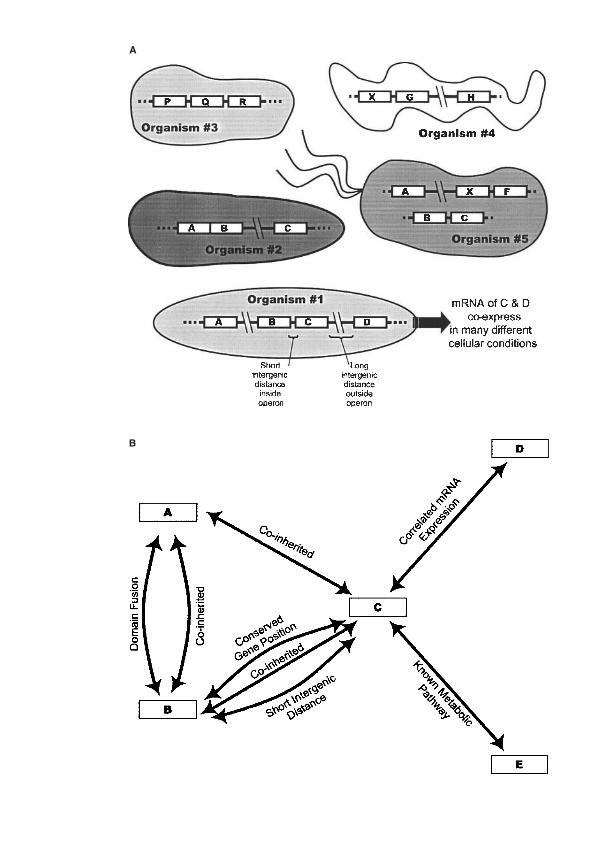
n � 1. So, given a typical bacterial genome of n ¼ 4000 genes, we wouldexpect to find the two genes adjacent with a random probability
p ¼ 2=ð3999Þ, or 5� 10�4. Because of the ubiquity of operons and thelow random likelihood of conserved neighbors, the coverage of this
method can be quite high, and thousands of pairwise functional links
can be generated (Huynen et al., 2000a).
Finding Function from Intergenic Distances
A second promising method has been described that analyzes gene
position to find functional links between proteins. This method is
explicitly formulated to detect operons and works by analyzing the
number of nucleotides separating neighboring genes (Salgado et al.,
2000). Genes organized in bacterial operons are cotranscribed on a sin-
gle mRNA and translated in a coordinated fashion. This coordination
of transcription and translation for the genes in an operon probably
places a selective pressure on keeping genes close together, as com-
pared to an absence of selection for adjacent genes not in the same
operon. Thus, adjacent genes with short intergenic distances tend to be
in the same operon; adjacent genes with long intergenic distances tend
not to be.
One advantage of this method is that it can be performed for genes
unique to a genome—no gene conservation is required for the method
to operate. This ability to work on ORFans, the genes found only in a
Figure 9.4 (A) Comparing the genome of organisma1 with the genomes of several other
organisms allows a number of inferences to be drawn about the relationships between the
genes of organism a1. In the figure, genes, depicted as labeled white boxes, are arranged
on the genomes, drawn as heavy black horizontal lines. First, the genes A and B can be
found fused in organisma2, suggesting that A and B are functionally linked. Second, the
genes A, B, and C are found in the same set of organisms (a1, 2, and 5) and are absent
from the same set of organisms (a3 and 4). This coinheritance suggests A, B, and C are
functionally linked. Third, genes B and C are neighbors in more than one genome, sug-
gesting a selective pressure to maintain their relative positions. Likewise, the intergenic
distance between genes B and C is much smaller than the typical intergenic distance,
suggesting that B and C may belong to an operon. Fifth, the mRNA of genes C and D are
coexpressed in many different experiments, suggesting C and D are coregulated or func-
tion together. Each of these inferences can be conceptualized as generating a functional
linkage between two proteins. (B) The resultant network of functional links. Predicted
networks can be compared can complemented by experimental networks, such as the ex-
perimentally derived link between C and E.
233 Predicting Protein Function and Networks
single genome (Fischer and Eisenberg, 1999), sets this method apart
from the other genomic methods described above. In this respect, the
analysis of intergenic distance has more in common with analysis of
expression data, which can also provide functional links for ORFans.
Finding Function from Regulatory Regions
The last obvious contextual property of genes useful for assigning pro-
tein function is the presence of regulatory regions found outside of
gene coding regions. These regulatory sites in DNA are recognized and
bound by transcription factors, enhancers, and repressors to control the
transcription of the neighboring genes. Because genes with related
functions are often coregulated, it would seem reasonable to create
functional links between genes with similar regulatory regions.
Unfortunately, regulatory regions are notoriously difficult to identify.
Judging the similarity between them is equally difficult. Although con-
sensus sequences have been identified for most major regulatory sites
(e.g., see the Eukaryotic Promoter Database, http://www.epd.isb-sib.ch), the sites recognized by a given transcription factor or poly-merase are often quite varied. Nonetheless, progress has been made in
identifying shared regulatory regions upstream of coexpressed genes
(Roth et al., 1998) and upstream of coinherited genes, Rosetta Stone
linked genes, and genes coconserved in operons (Manson McGuire and
Church, 2000). Since genes in these categories are often functionally re-
lated, it seems likely that the inverse process, clustering genes by their
regulatory regions, will also yield functional information. An attempt
at this process (Pavlidis et al., 2001) shows that such functional infor-
mation is available, although the method is not currently as powerful
as methods exploiting other sorts of contextual information. However,
such analyses of regulatory regions are likely to improve dramatically
with the explicit knowledge of transcription factor binding sites gen-
erated from DNA microarray mapping of transcription factor specific-
ities (Iyer et al., 2001).
DISCOVERING PROTEIN FUNCTION FROM EXPRESSION DATA
The genomic analyses discussed above examine static genomes and
draw inferences from the state of the genomes at one point in time.
However, genomes and cells are dynamic systems, and considerable
234 Edward M. Marcotte
information can be gleaned about cellular systems by analyzing these
dynamics. Wemight argue that genomes are dynamic on two time scales:
the evolutionary and the immediate. The methods discussed above an-
alyze events on the evolutionary time scale. Now we turn to events on
the more immediate time scale.
Finding Function from mRNA Expression Patterns
DNA microarrays and EST sequencing have produced literally millions
of discrete measurements of gene expression. This flood of data has in
turn stimulated many analyses of gene expression profiles. In general,
the analyses share the following form: A set of measurements of the
expression of a number of genes under different conditions is available,
from DNA microarrays (e.g., as in Lashkari et al., 1997), serial analysis
of gene expression (SAGE; Velculescu et al., 1995), or expressed se-
quence tags (EST; Adams et al., 1991). Expression vectors are then con-
structed for the genes, each vector describing the expression of a given
gene under a range of cellular conditions, cell types, genetic back-
grounds, and so on. These expression vectors are then clustered to find
genes with similar expression patterns (Eisen et al., 1998). Given
enough independent experiments (>100) with sufficient variation in the
conditions, genes clustered in this fashion tend to be functionally re-
lated (Marcotte et al., 1999b). Fortunately, unlike complete genome
sequences, data of this sort are readily generated. It is possible to per-
form large numbers of microarray experiments, producing enough ex-
pression data to find statistically significant functional links. Many
expression data sets are publicly available from sites such as the Stan-
ford Microarray Database (http://genome-www4.stanford.edu/MicroArray/SMD).A variation of this approach involves analysis of SAGE or EST libra-
ries collected from various tissues and cell conditions (e.g., the dbEST
database: http://www.ncbi.nlm.nih.gov/dbEST/index.html).In this approach, mRNAs from cells are reverse transcribed into cDNAs
and sequenced. Since many thousands of mRNAs are typically se-
quenced, the EST or SAGE library is a fairly representative selection
of the mRNAs present under those cellular conditions, and thus can
serve in a fashion analogous to microarray expression measurements.
EST and SAGE libraries vary widely in size and completeness, so
calculations of expression vectors with their data are not entirely
235 Predicting Protein Function and Networks
straightforward. However, related analysis can be performed, such as
Guilt-by-Association, which essentially creates functional links between
genes based on their copresence and coabsence from EST libraries
(Walker et al., 1999).
Coexpression analyses have advantages and disadvantages in regard
to genomic data for functional predictions. The primary disadvantage,
beyond having to collect additional data, is that the functional infer-
ences from coexpression are relatively weak until a large body of ex-
pression data is collected (Marcotte et al., 1999b). However, this is more
than compensated for by the advantage of learning information about
any gene for which expression can be detected, regardless of its con-
servation in other species. Coexpression analysis and the prediction of
operons using intergenic distances (Salgado et al., 2000) are currently
the only two computational methods capable of generating functional
information for ORFans (Fischer and Eisenberg, 1999).
Finding Function from Spatial Expression Profiles
The expression methods discussed above typically give no information
about the intracellular location of the expressed molecules. However,
spatial expression data should be useful for pathway reconstruction,
since we expect functionally linked proteins to be found at similar
subcellular locations. Therefore, the converse will often be true: pro-
teins that are always expressed at the same locations probably function
together. This approach to finding protein function is quite technically
demanding, but in spite of the difficulty, one group has collected such
spatial expression data for more than 1750 genes expressed in Xenopus
oocytes (Gawantka et al., 1998). More recently, the data have been in-
corporated into a database and methods to measure similarity between
mRNA spatial expression patterns have been developed (Pollet et al.,
2001). Although considerable work remains, this work establishes the
viability of this method for generating functional information.
Finding Function from Protein Expression Profiles
Gathering expression data for an entire proteome, or all of the proteins
encoded by a genome, is only now becoming feasible, due largely to the
development of high-throughput mass spectrometric analyses of pro-
236 Edward M. Marcotte
teins (Shevchenko et al., 1996; Hunt et al., 1986; Gygi et al., 1999; Jensen
et al., 2000). Although such protein expression data are not yet widely
available, they will be a valuable complement to the mRNA expression
data from EST libraries and chips. What is not yet clear is how well
protein expression data will correlate with mRNA expression data.
Early results comparing protein expression by mass spectrometry
and mRNA expression by SAGE suggested that mRNA and protein
expression patterns are quite different (Gygi et al., 1999). Recent devel-
opments with DNA chips have allowed quantification of mRNAs being
actively translated through analysis of polysomal mRNA fractions.
These chip-based measurements of protein expression show strong
correlation with chip-based measurements of mRNA expression (Joe
DeRisi, personal communication). Nonetheless, it is likely that the pro-
tein expression patterns will hold considerable value for inferring pro-
tein function.
In theory, protein expression data can be analyzed similarly to
mRNA expression data. It is likely that expression data will be col-
lected for many of the proteins in a proteome over many different
cellular conditions. As with mRNA expression data, these protein
expression data will compose expression vectors that can be clustered
and analyzed much as the mRNA data are.
However, protein expression data may contain an additional element
absent from mRNA expression data: mass-spectrometric methods have
the capability not only to measure protein expression levels but also to
identify protein modifications. Posttranslational modifications of pro-
teins are widespread in cells, both spontaneous unregulated events
such as oxidation, and enzymatic modifications such as lipidation,
phosphorylation, and ADP ribosylation. Such modifications often
modify the activity or localization of the proteins. Thus, it seems likely
that protein expression profiles will catalog not only expression pat-
terns but also protein states, such as on, off, activated, repressed, and so
on. These protein state vectors will provide a rich source of data for
protein function prediction.
MEASURING PROTEIN FUNCTION AND TESTING PREDICTIONS
Before testing any of these predictive methods, one must develop a
metric for measuring protein function. At first glance, protein function
237 Predicting Protein Function and Networks
would seem difficult to quantify. However, several metrics have been
developed that perform quite well, allowing optimization and calibra-
tion of the methods.
Perhaps the most obvious metric is that of testing that the methods
recover known functional relationships. Using a database of known
pathways, such as the KEGG (Kanehisa and Goto, 2000; http://www.genome.ad.jp/kegg/kegg2.html) or EcoCyc (Karp et al.,
2000; http://ecocyc.pangeasystems.com/ecocyc) database ofmetabolic pathways, or the DIP database of protein interactions
(Xenarios et al., 2001; http://dip.doe-mbi.ucla.edu), each
method is evaluated by its coverage, the fraction of experimental links
correctly predicted by the algorithm, and by its accuracy, the fraction of
predicted links that are verified by an experimental link.
Unfortunately, the measurement of accuracy cannot be very exact,
since our knowledge of experimental pathways is limited and few
pathways are known completely. Thus, absence of a link from the ex-
perimental database does not necessarily mean the link is wrong. Due
to this limited knowledge, we can measure false negative predictions
accurately (failure to predict an experimental link), but cannot evaluate
false positive predictions (prediction of a functional link where none
exists). To some extent, the accuracy measurement, while not correct in
an absolute sense, can be treated as a relative value for optimization
and for comparisons between algorithms.
A second metric that performs well in practice is that of key word re-
covery or category matching (Marcotte et al., 1999b). For this approach,
genes of known function are first classified into a limited set of func-
tional categories. Many databases have such categorizations incorpo-
rated, sometimes explicitly (as in the MIPS database of yeast proteins;
Mewes et al., 1998) and sometimes implicitly (as in the key words
associated with proteins in the SWISSPROT protein sequence database;
Bairoch and Apweiler, 2000). Testing predictions is then reduced to
checking for agreement between the predicted and known key words
or categories for each characterized protein, and finding the average
agreement over all characterized proteins. An example is calculating
hkey word recoveryi ¼ 1
A
XA
i¼1
Xx
j¼1
nj
N;
where x is the number of key words known for the protein i being
238 Edward M. Marcotte
tested, N is the number of key words predicted for the protein, and nj is
the number of times key word j from the protein’s known annotation
appears in the predicted key word list. The average key word recovery
is calculated for all A characterized proteins.
For many of the predictive methods, the prediction is not of a given
functional category but of a link between two proteins. In these cases,
for all predicted protein pairs involving proteins of known function, the
overlap between the key words or categories of the two proteins can be
calculated with a function such as the Jaccard coefficient:
hkey word overlapi ¼ 1
P
XP
i¼1
k1X k2k1W k2
� �;
where for each of the P pairs of linked, characterized proteins, the k1key words of one protein are compared against the k2 key words of the
linked protein partner. The number of key words in the intersection is
divided by the number of key words in the union to give a normalized
measure of the overlap between the two sets of key words. The value of
this overlap averaged over all P pairs gives a measure of the accuracy
of the prediction algorithm. To optimize and compare prediction algo-
rithms, this measurement of method accuracy can be combined with
the measured coverage of known pathways.
ASSIGNING PROTEINS TO FUNCTIONAL CATEGORIES
One simple way to implement these methods is to test if proteins be-
long to given functional categories (Pavlidis et al., 2001; Marcotte et al.,
2000). To do this, an algorithm is trained to recognize the characteristics
of proteins in a given functional category. Such a discrimination algo-
rithm requires a set of quantitative features for each protein. Effec-
tively, these features are treated as coordinates mapping the protein
into a high-dimensional feature space. When the features are chosen
appropriately, proteins belonging to a given functional category fall in
a distinct region of this feature space and proteins from other func-
tional categories fall in other regions.
Many of the contextual properties of genes can be interpreted as fea-
tures. For example, the phylogenetic profile of a protein is a vector in
which each element describes the degree of similarity of the protein to
the most similar sequence in a given genome. When interpreted as a list
239 Predicting Protein Function and Networks
of features, the phylogenetic profile describes the mapping of a protein
into a phylogenetic space. The attributes of this space are the following: It
is an n-dimensional space, where n is the number of genomes used to
calculate the phylogenetic profile. The axes of the space are not
orthogonal—some genomes are quite similar to each other, so some
axes are more correlated than others. (If we choose, we can orthogon-
alize the space—for example, by applying a whitening transformation.)
Last, proteins are not evenly distributed in this space. Certain system-
atic biases occur in the types of proteins encoded by a genome, and
these in turn introduce biases in the genes’ locations in phylogenetic
space. For example, each genome contains a fraction of genes unique to
that species; these genes all map to the same region of phylogenetic
space. Likewise, certain genes are broadly conserved among only
eukaryotes or prokaryotes—again, these genes all map to the same
general region of phylogenetic space. However, proteins with a related
function cluster in this space, as do eukaryotic proteins localized to
similar cellular compartments (Marcotte et al., 2000).
A discrimination algorithm defines a set of boundaries in this high-
dimensional space that separate proteins with the desired function
from all other proteins. Numerous algorithms have been adapted from
statistics and computer science for this purpose, including Bayesian
classifiers (elegantly described in Mosteller and Wallace, 1984), support
vector machines (Pavlidis et al., 2001), neural network discriminators,
and linear discrimination functions (Marcotte et al., 2000). The advan-
tage of this method of predicting function is that one can test for very
specific functions, as well as calculate the degree of confidence in the
results.
INTEGRATING METHODS TO DISCOVER PROTEIN FUNCTIONAL
AND INTERACTION NETWORKS
The discrimination algorithms described above work under the as-
sumption that a set of functionally related proteins is known, and more
proteins with the same function are desired. In this approach, the
algorithms must be trained on a set of positive examples, proteins
whose functions are known to match the desired function, as well as on
a set of negative examples.
However, a naive approach can be useful to discover what trends are
in the data and to look for naturally occurring clusters. The naive
240 Edward M. Marcotte
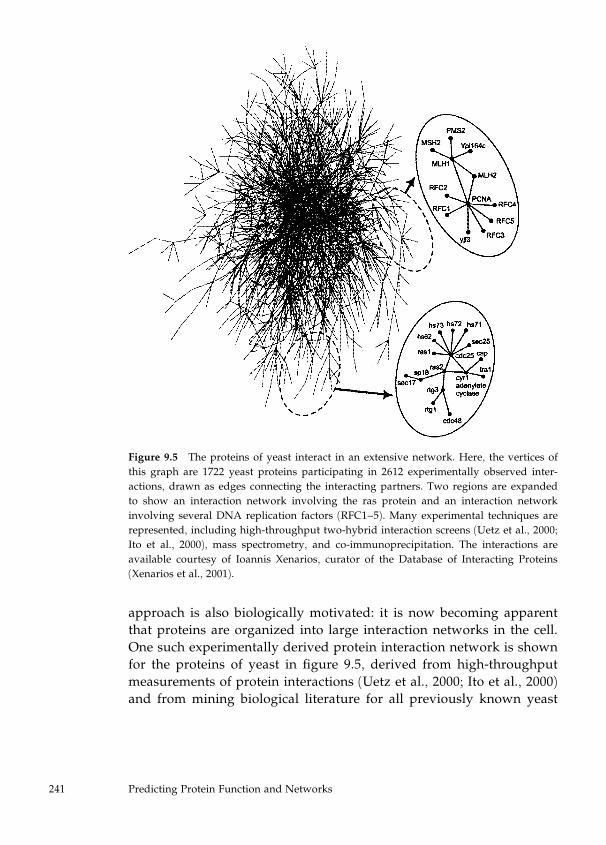
approach is also biologically motivated: it is now becoming apparent
that proteins are organized into large interaction networks in the cell.
One such experimentally derived protein interaction network is shown
for the proteins of yeast in figure 9.5, derived from high-throughput
measurements of protein interactions (Uetz et al., 2000; Ito et al., 2000)
and from mining biological literature for all previously known yeast
Figure 9.5 The proteins of yeast interact in an extensive network. Here, the vertices of
this graph are 1722 yeast proteins participating in 2612 experimentally observed inter-
actions, drawn as edges connecting the interacting partners. Two regions are expanded
to show an interaction network involving the ras protein and an interaction network
involving several DNA replication factors (RFC1–5). Many experimental techniques are
represented, including high-throughput two-hybrid interaction screens (Uetz et al., 2000;
Ito et al., 2000), mass spectrometry, and co-immunoprecipitation. The interactions are
available courtesy of Ioannis Xenarios, curator of the Database of Interacting Proteins
(Xenarios et al., 2001).
241 Predicting Protein Function and Networks
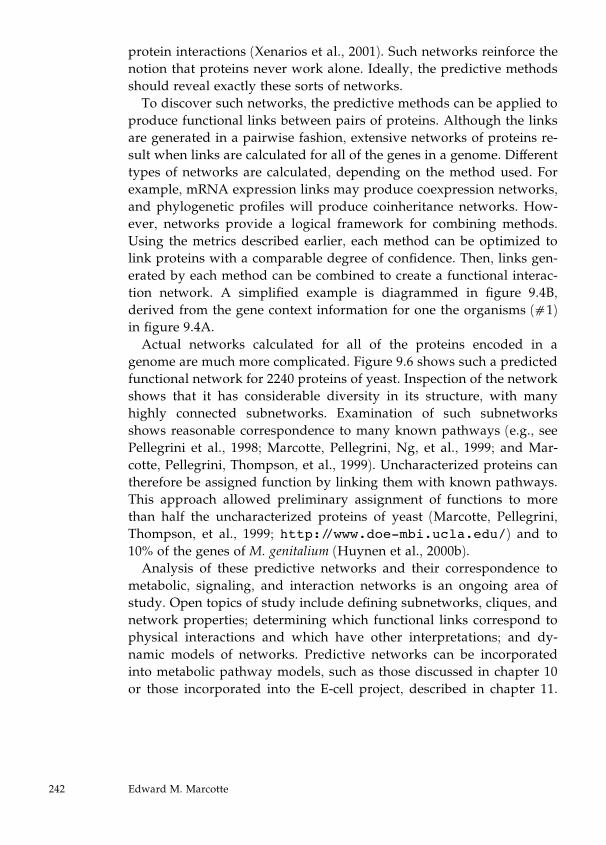
protein interactions (Xenarios et al., 2001). Such networks reinforce the
notion that proteins never work alone. Ideally, the predictive methods
should reveal exactly these sorts of networks.
To discover such networks, the predictive methods can be applied to
produce functional links between pairs of proteins. Although the links
are generated in a pairwise fashion, extensive networks of proteins re-
sult when links are calculated for all of the genes in a genome. Different
types of networks are calculated, depending on the method used. For
example, mRNA expression links may produce coexpression networks,
and phylogenetic profiles will produce coinheritance networks. How-
ever, networks provide a logical framework for combining methods.
Using the metrics described earlier, each method can be optimized to
link proteins with a comparable degree of confidence. Then, links gen-
erated by each method can be combined to create a functional interac-
tion network. A simplified example is diagrammed in figure 9.4B,
derived from the gene context information for one the organisms (a1)in figure 9.4A.
Actual networks calculated for all of the proteins encoded in a
genome are much more complicated. Figure 9.6 shows such a predicted
functional network for 2240 proteins of yeast. Inspection of the network
shows that it has considerable diversity in its structure, with many
highly connected subnetworks. Examination of such subnetworks
shows reasonable correspondence to many known pathways (e.g., see
Pellegrini et al., 1998; Marcotte, Pellegrini, Ng, et al., 1999; and Mar-
cotte, Pellegrini, Thompson, et al., 1999). Uncharacterized proteins can
therefore be assigned function by linking them with known pathways.
This approach allowed preliminary assignment of functions to more
than half the uncharacterized proteins of yeast (Marcotte, Pellegrini,
Thompson, et al., 1999; http://www.doe-mbi.ucla.edu/) and to10% of the genes of M. genitalium (Huynen et al., 2000b).
Analysis of these predictive networks and their correspondence to
metabolic, signaling, and interaction networks is an ongoing area of
study. Open topics of study include defining subnetworks, cliques, and
network properties; determining which functional links correspond to
physical interactions and which have other interpretations; and dy-
namic models of networks. Predictive networks can be incorporated
into metabolic pathway models, such as those discussed in chapter 10
or those incorporated into the E-cell project, described in chapter 11.
242 Edward M. Marcotte
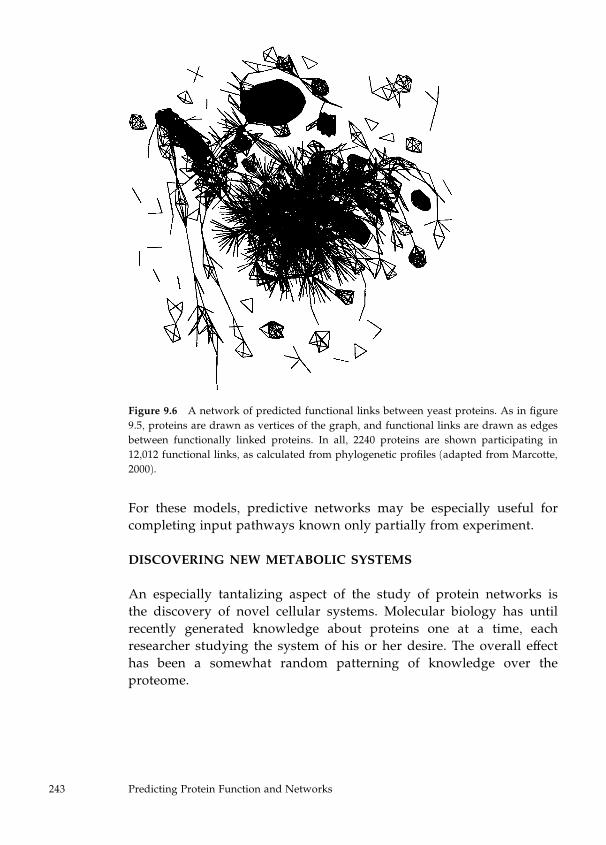
For these models, predictive networks may be especially useful for
completing input pathways known only partially from experiment.
DISCOVERING NEW METABOLIC SYSTEMS
An especially tantalizing aspect of the study of protein networks is
the discovery of novel cellular systems. Molecular biology has until
recently generated knowledge about proteins one at a time, each
researcher studying the system of his or her desire. The overall effect
has been a somewhat random patterning of knowledge over the
proteome.
Figure 9.6 A network of predicted functional links between yeast proteins. As in figure
9.5, proteins are drawn as vertices of the graph, and functional links are drawn as edges
between functionally linked proteins. In all, 2240 proteins are shown participating in
12,012 functional links, as calculated from phylogenetic profiles (adapted from Marcotte,
2000).
243 Predicting Protein Function and Networks
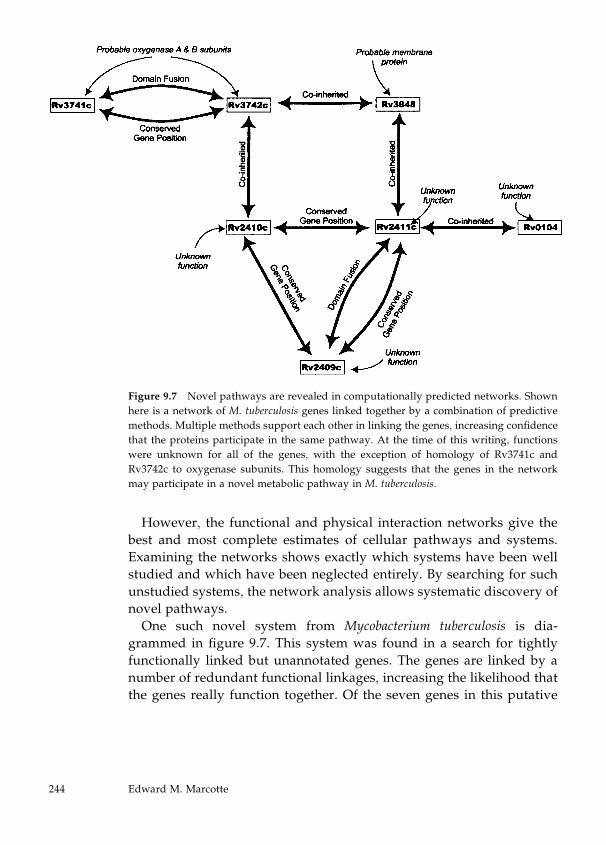
However, the functional and physical interaction networks give the
best and most complete estimates of cellular pathways and systems.
Examining the networks shows exactly which systems have been well
studied and which have been neglected entirely. By searching for such
unstudied systems, the network analysis allows systematic discovery of
novel pathways.
One such novel system from Mycobacterium tuberculosis is dia-
grammed in figure 9.7. This system was found in a search for tightly
functionally linked but unannotated genes. The genes are linked by a
number of redundant functional linkages, increasing the likelihood that
the genes really function together. Of the seven genes in this putative
Figure 9.7 Novel pathways are revealed in computationally predicted networks. Shown
here is a network of M. tuberculosis genes linked together by a combination of predictive
methods. Multiple methods support each other in linking the genes, increasing confidence
that the proteins participate in the same pathway. At the time of this writing, functions
were unknown for all of the genes, with the exception of homology of Rv3741c and
Rv3742c to oxygenase subunits. This homology suggests that the genes in the network
may participate in a novel metabolic pathway in M. tuberculosis.
244 Edward M. Marcotte
pathway, none have a known function, although two are estimated
from sequence homology to be subunits of an uncharacterized oxygen-
ase. Here, the network analysis reveals only the cellular functions, but
not the molecular functions, of the proteins. We can only speculate,
based upon the oxygenase proteins, that this system is a novel meta-
bolic pathway in M. tuberculosis. Defining all such new systems is the
first step; what follows is perhaps the harder work of characterizing
and understanding the new systems.
REFERENCES
Adams, M. D., Kelley, J. M., Gocayne, J. D., Dubnick, M., Polymeropoulous, M. H., Xiao,
H., Merril, C. R., Wu, A., Olde, B., Moreno, R. F., et al. (1991). Complementary DNA
sequencing: Expressed sequence tags and human genome project. Science 252: 1651–1656.
Altschul, S. F., Madden, T. L., Schaffer, A. A., Zhang, J., Zhang, Z., Miller, W., and
Lipman, D. J. (1997). Gapped BLAST and PSI-BLAST: A new generation of protein data-
base search programs. Nucleic Acids Res. 25: 3389–3402.
Bairoch, A., and Apweiler, R. (2000). The SWISS-PROT protein sequence database and its
supplement TrEMBL in 2000. Nucleic Acids Res. 28: 45–48.
Dandekar, T., Snel, B., Huynen, M., and Bork, P. (1998). Conservation of gene order: A
fingerprint of genes that physically interact. Trends Biochem. Sci. 23(9): 324–328.
Eisen, M. B., Spellman, P. T., Brown, P. O., and Botstein, D. (1998). Cluster analysis and
display of genome-wide expression patterns. Proc. Natl. Acad. Sci. USA 95: 14863–14868.
Eisenberg, D., Marcotte, E. M., Xenarios, I., and Yeates, T. O. (2000). Protein function in
the post-genomic era. Nature 405: 823–826.
Enright, A. J., Iliopoulos, I., Kyrpides, N. C., and Ouzounis, C. A. (1999). Protein interac-
tion maps for complete genomes based on gene fusion events. Nature 402: 86–90.
Enright, A. J., and Ouzounis, C. A. (2000). GeneRAGE: A robust algorithm for sequence
clustering and domain detection. Bioinformatics 16: 451–457.
Fischer, D., and Eisenberg, D. (1999). Finding families for genomic ORFans. Bioinformatics
15: 759–762.
Gaasterland, T., and Ragan, M. A. (1998). Constructing multigenome views of whole mi-
crobial genomes. Microb. Comp. Genomics 3: 177–192.
Gawantka, V., Pollet, N., Delius, H., Vingron, M., Pfister, R., Nitsch, R., Blumenstock, C.,
and Niehrs, C. (1998). Gene expression screening in Xenopus identifies molecular path-
ways, predicts gene function and provides a global view of embryonic patterning. Mech.
Dev. 77: 95–141.
Gygi, S. P., Rochon, Y., Franza, B. R., and Aebersold, R. (1999). Correlation between pro-
tein and mRNA abundance in yeast. Mol. Cell. Biol. 19: 1720–1730.
245 Predicting Protein Function and Networks
Hunt, D. F., Yates, J. R. III, Shabanowitz, J., Winston, S., and Hauer, C. R. (1986). Protein
sequencing by tandem mass spectrometry. Proc. Natl. Acad. Sci. USA 83: 6233–6237.
Huynen, M., Dandekar, T., and Bork, P. (1998). Differential genome analysis applied to
the species-specific features of Helicobacter pylori. FEBS Lett. 426: 1–5.
Huynen, M., Snel, B., Lathe, W. III, and Bork, P. (2000a). Exploitation of gene context.
Curr. Opinion Struct. Biol. 10: 366–370.
Huynen, M., Snel, B., Lathe, W. III, and Bork, P. (2000b). Predicting protein function by
genomic context: Quantitative evaluation and qualitative inferences. Genome Res. 10:
1204–1210.
Ito, T., Tashiro, K., Muta, S., Ozawa, R., Chiba, T., Nishizawa, M., Yamamoto, K., Kuhara,
S., and Sakaki, Y. (2000). Toward a protein-protein interaction map of the budding yeast:
A comprehensive system to examine two-hybrid interactions in all possible combinations
between the yeast proteins. Proc. Natl. Acad. Sci. USA 97: 1143–1147.
Iyer, V. R., Horak, C. E., Scafe, C. S., Botstein, D., Snyder, M., and Brown, P. O. (2001).
Genomic binding sites of the yeast cell-cycle transcription factors SBF and MBF. Nature
409: 533–538.
Jain, R., Rivera, M. C., and Lake, J. A. (1999). Horizontal gene transfer among genomes:
The complexity hypothesis. Proc. Natl. Acad. Sci. USA 96: 3801–3806.
Jensen, P. K., Pasa-Tolic, L., Peden, K. K., Martinovic, S., Lipton, M. S., Anderson, G. A.,
Tolic, N., Wong, K. K., and Smith, R. D. (2000). Mass spectrometric detection for capillary
isoelectric focusing separations of complex protein mixtures. Electrophoresis 21: 1372–1380.
Kanehisa, M., and Goto, S. (2000). KEGG: Kyoto Encyclopedia of Genes and Genomes.
Nucleic Acids Res. 28: 27–30.
Karp, P. D., Riley, M., Saier, M., Paulsen, I. T., Paley, S. M., and Pellegrini-Toole, A.
(2000). The EcoCyc and MetaCyc databases. Nucleic Acids Res. 28: 56–59.
Kim, S. H. (2000). Structural genomics of microbes: An objective. Curr. Opinion Struct.
Biol. 10: 380–383.
Koonin, E. V., and Galperin, M. Y. (1997). Prokaryotic genomes: The emerging paradigm
of genome-based microbiology. Curr. Opinion Genet. Dev. 7: 757–763.
Lashkari, D. A., De Risi, J. L., McCusker, J. H., Namath, A. F., Gentile, C., Hwang, S. Y.,
Brown, P. O., and Davis, R. W. (1997). Yeast microarrays for genome wide parallel genetic
and gene expression analysis. Proc. Natl. Acad. Sci. USA 94: 13057–13062.
Manson McGuire, A., and Church, G. M. (2000). Predicting regulons and their cis-regula-
tory motifs by comparative genomics. Nucleic Acids Res. 28: 4523–4530.
Marcotte, E. M. (2000). Computational genetics: Finding protein function by non-
homology methods. Curr. Opinion Struct. Biol. 10: 359–365.
Marcotte, E. M., Pellegrini, M., Ng, H. L., Rice, D. W., Yeates, T. O., and Eisenberg, D.
(1999). Detecting protein function and protein-protein interactions from genome se-
quences. Science 285: 751–753.
246 Edward M. Marcotte
Marcotte, E. M., Pellegrini, M., Thompson, M. J., Yeates, T. O., and Eisenberg, D. (1999). A
combined algorithm for genome-wide prediction of protein function. Nature 402: 83–86.
Marcotte, E. M., Xenarios, I., van der Bliek, A. M., and Eisenberg, D. (2000). Localizing
proteins in the cell from the phylogenetic profiles. Proc. Natl. Acad. Sci. USA 97: 12115–
12120.
Mewes, H. W., Hani, J., Pfeiffer, F., and Frishman, D. (1998). MIPS: A database for protein
sequences and complete genomes. Nucleic Acids Res. 26: 33–37.
Mosteller, F., and Wallace, D. L. (1984). Applied Bayesian and Classical Inference: The Case of
the Federalist Papers. New York: Springer-Verlag.
Ouzounis, C., and Kyrpides, N. (1996). The emergence of major cellular processes in evo-
lution. FEBS Lett. 426: 1–5.
Overbeek, R., Fonstein, M., D’Souza, M., Pusch, G. D., and Maltsev, N. (1999). The use of
gene clusters to infer functional coupling. Proc. Natl. Acad. Sci. USA 96: 2896–2901.
Pavlidis, P., Furey, T. S., Liberto, M., Haussler, D., and Grundy, W. N. (2001). Promoter
region-based classification of genes. Proc. Pac. Symp. Biocomput. 6: 151–163.
Pavlidis, P., Weston, J., Cai, J., and Grundy, W. N. (2001). Gene functional classification
from heterogeneous data. Proceedings of the Fifth International Conference on Computational
Molecular Biology. pp. 242–248.
Pellegrini, M., Marcotte, E. M., Thompson, M. J., Eisenberg, D., and Yeates, T. O. (1999).
Assigning protein functions by comparative genome analysis: Protein phylogenetic pro-
files. Proc. Natl. Acad. Sci. USA 96: 4285–4288.
Pollet, N., Schmidt, H. A., Gawantka, V., Niehrs, C., and Vingron, M. (2000). In silico
analysis of gene expression patterns during early development of Xenopus laevis. Proc. Pac.
Symp. Biocomput. 5: 443–454.
Roth, F. P., Hughes, J. D., Estep, P. W., and Church, G. M. (1998). Finding DNA regula-
tory motifs within unaligned noncoding sequences clustered by whole-genome mRNA
quantitation. Nat. Biotechnol. 16: 939–945.
Salgado, H., Moreno-Hagelsieb, G., Smith, T. F., and Collado-Vides, J. (2000). Operons in
Escherichia coli: Genomic analyses and predictions. Proc. Natl. Acad. Sci. USA 97: 6652–6657.
Shevchenko, A., Jensen, O. N., Podtelejnikov, A. V., Sagliocco, F., Wilm, M., Vorm, O.,
Mortensen, P., Shevchenko, A., Boucherie, H., and Mann, M. (1996). Linking genome and
proteome by mass spectrometry: Large-scale identification of yeast proteins from two-
dimensional gels. Proc. Natl. Acad. Sci. USA 93: 14440–14445.
Tamames, J., Casari, G., Ouzounis, C., and Valencia, A. (1997). Conserved clusters of
functionally related genes in two bacterial genomes. J. Mol. Evol. 44: 66–73.
Tatusov, R. L., Natale, D. A., Garkavtsev, I. V., Tatusova, T. A., Shankavaram, U. T., Rao,
B. S., Kiryutin, B., Galperin, M. Y., Fedorova, N. D., and Koonin, E. V. (2001). The COG
database: New developments in phylogenetic classification of proteins from complete
genomes. Nucleic Acids Res. 29: 22–28.
247 Predicting Protein Function and Networks

Figure 5.3 Evaluation of detection of promoters by several methods. Promoters were
searched in a region 250 bp ustream of the gene. (a) Classic method using consensus/
patser. (b) Selecting the strongest scoring site in the region. (c) Using the covering algo-
rithm of competition among putative promoters as described in the text. Sensitivity is
defined as the ratio of true positives divided by all true sites (the sum of true positives
and false negatives). Specificity is defined as the ratio of true negatives divided by the
sum of true negatives plus false positives. The positive predictive value is the ratio of true
positives divided by all the sites reported by the method (true positives plus false pos-
itives). True sites are those experimentally reported, and positive sites are those found by
the method.
109 Genomics of Gene Regulation
Tools for investigating the genomic neighborhood of a gene include the Entrez genome
web site: http://ww.ncbi.nlm.nih.gov/entrez/query.fcgi?db=Genome and
the WIT database: http://wit.mcs.anl.gov/WIT2
The Eukaryotic Promotor database lists the consensus regulatory sequences derived from
promotors of many eukaryotic genes: http://www.epd.isb-sib.ch
DNA microarray protocols, numerous experiments, and data are available from the
Stanford Microarray Database:
http://genome-www4.stanford.edu/MicroArray/SMD
Additional measurements of gene expression are available in Expressed Sequence Tag
databases such as dbEST: http://www.ncbi.nlm.nih.gov/dbEST/index.html
Many known metabolic pathways and networks have been characterized in the KEGG
database: http://www.genome.ad.jp/kegg/kegg2.html
EcoCyc database: http://ecocyc.pangeasystems.com/ecocyc
Database of Interacting Proteins: http://dip.doe-mbi.ucla.edu
Last, several sequence databases also provide functional annotation of the genes that can
be used in benchmarking programs that predict gene function. Among these annotated
databases are
MIPS: http://www.mips.biochem.mpg.de/
Swiss-Prot: http://ca.expasy.org/sprot/
Gene Ontology Consortium: http://www.geneontology.org
249 Predicting Protein Function and Networks

This page intentionally left blank
10 Metabolic Pathways
Steffen Schmidt and Thomas Dandekar
ENZYMATIC REACTIONS
Life is a process far from thermodynamic equilibrium. Different enzy-
matic chains and networks have to operate continuously to prevent
chemical or thermodynamic equilibrium from occurring, for that would
mean the death of the organism. The analysis of metabolic pathways
tries to understand and investigate the enzyme chains involved in this
process.
A qualitative focus considers which enzymes are involved, which
pathways are possible in a complex network (a nontrivial question),
and what happens if one enzyme is knocked out or a new one is added
to the set. Techniques developed in our laboratory to analyze metabolic
pathways qualitatively will be the focus of this chapter. It should be
noted, however, that there is also a detailed quantitative perspective
from which to analyze metabolic pathways in their conversions and
transitions—but it needs much more experimental data on the con-
sidered enzymes. It includes metabolite concentrations, substrate and
product affinities, and kinetic data on enzymes such as their turnover
number.
Isotope labeling of metabolites and NMR are advanced tools to pro-
vide experimental data for such studies (Christensen and Nielsen,
2000). These questions are only briefly discussed in this chapter. The
interested reader is referred to the excellent textbooks and reviews on
these questions (e.g., Fell, 1997; Hatzimanikatis, 1999; Stefanopoulos,
1999). Dynamics of metabolites may also be tackled in comprehensive
cellular simulations (e.g., Womble and Rownd, 1986). (This rapidly
developing area is discussed in chapter 11.)
Another aspect of all enzymatic reactions is that they can be divided
into two types. There are biochemical reactions, that can proceed from
substrate to product and vice versa: these are reversible reactions.
There are also reactions that proceed in only one direction: these are
irreversible reactions. In most cases the latter is achieved as the product
is either moved from the cell into outer compartments or by rapid con-
version of the product further down the enzymatic chain. There are over
2000 known biochemical reactions. Good references are the ENZYME
database (http://www.expasy.ch/enzyme/index.html) and theBRENDA database (http://www.brenda.uni-koeln.de).If there is a pathway of enzymatic reactions, the flow through the
system is called the metabolic flux (e.g., the rate of flow in micromoles
per minute) of substrates converted into products.
Another very general division of enzymes is between energy-
producing (exergonic reactions) and energy-consuming (endergonic
reactions). Similarly, on the metabolic level, metabolic pathways can
conveniently be divided into catabolic (metabolite degrading; any type
of metabolic ‘‘digestion’’) and anabolic (producing more complex bio-
logical metabolites). Anabolic pathways usually contain many ender-
gonic reactions because they require a great deal of energy to create the
more complex metabolites. They are generally more extensive in their
network and enzymatic reactions, and occur more often in all auto-
trophic organisms (such as plants, where the required energy is sup-
plied by photosynthesis). Relatively few metabolites serve as starting
materials for a variety of products.
In contrast, all animals (including man), as well as fungi, parasites,
and saprophytic organisms, rely for their energy supply on catabolic
pathways, which usually contain more exergonic enzymatic reactions.
Few common intermediates are produced from a large number of sub-
strates. An important first end product is often acetyl-CoA, and ulti-
mately, via oxidative pathways, oxidative phosphorylation of all
available reduction equivalents (NADH, FAD, etc.) to generate a maxi-
mum of ATP. Similarly, NADPH and ATP serve as major high-energy
components in transfer reactions in between.
A metabolic pathway is thus a series of connected enzymatic reac-
tions that produce a specific product. Ample examples are provided by
the KEGG metabolic database (http://www.genome.ad.jp/kegg/pathway/map/map01100.html). Furthermore, pathways may be
branched or interconnected. Delineating a pathway from the metabolic
252 S. Schmidt and T. Dandekar
network has until now mainly been done using traditional or chemical
knowledge. Algorithms are very helpful in gaining rationality and pre-
cision. The abundance of enzymes varies with the kind of organism,
cell type, nutrient status, and developmental stage. Another aspect,
which can be partly revealed by meticulous genome comparison and
annotation, is the detection of isoenzymes: the same enzyme is present
in different varieties, depending on tissue or developmental state; in
prokaryotes, even in the same cell. Different regulatory domains often
confer different regulation of isoenzymes, and thus tissue-specific or
condition-specific metabolization for the same type of reaction can be
achieved. An example is lactate dehydrogenase, in which heart-specific
and muscle-specific varieties exist, allowing for optimal adaptation of
the metabolism in the two different types of tissues.
Problems we will discuss are pathway identification and complete-
ness, identification of alternative pathways and all possible fluxes
through a given metabolic network, and better understanding of
the importance and the specific biological significance of pathway
variations.
Pathways are the next level of complexity after the protein reading
frame. On the other hand, they are only an abstraction, because in re-
ality there are always metabolic networks. In that respect, it is impor-
tant to have tools for their analysis as well as their synthesis.
FINDING THE ROUTE THROUGH THE METABOLIC NETWORK
Defining Metabolic Pathways
Cellular reactions are highly connected and entangled (figure 10.1;
Jeong et al., 2000). In order to get a good overview of the complexity of
metabolism, one can use standard literature and databases available on
the Internet (e.g., KEGG, EcoCyc, Boehringer Mannheim Map). How-
ever, metabolism is much more flexible than the well-known set of
pathways available from biochemistry textbooks. Using known infor-
mation about metabolism, computational calculations can help to find
new possible routes in the biochemical network that can then be proven
by experimental approaches such as isotope labeling of metabolites,
use of metabolic inhibitors, and knocking out of enzymes. Through
chemical reasoning or tradition, standard pathways such as glycolysis
are known for well-known metabolites. However, given the network
253 Metabolic Pathways
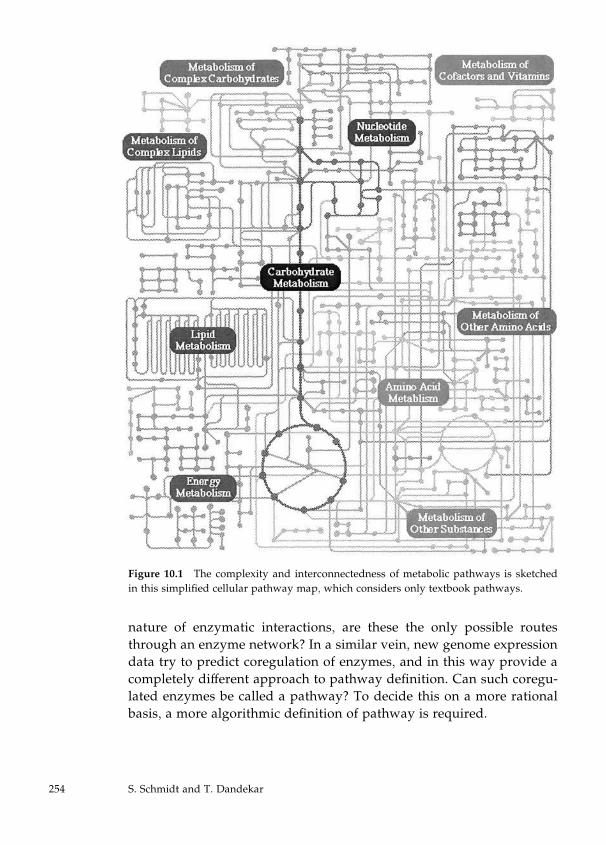
nature of enzymatic interactions, are these the only possible routes
through an enzyme network? In a similar vein, new genome expression
data try to predict coregulation of enzymes, and in this way provide a
completely different approach to pathway definition. Can such coregu-
lated enzymes be called a pathway? To decide this on a more rational
basis, a more algorithmic definition of pathway is required.
Figure 10.1 The complexity and interconnectedness of metabolic pathways is sketched
in this simplified cellular pathway map, which considers only textbook pathways.
254 S. Schmidt and T. Dandekar
Three different approaches are generally used to map the pathways
in a biochemical network from scratch. They do not require information
about enzyme kinetics, affinity, or metabolite concentrations—but this
means each of them is only stating whether a certain metabolic route (a
set of enzymes working together) is accessible to the set of enzymes
present in the cell. It does not give information on the extent to which
a certain metabolic path is used in the cell under a given metabolic
condition.
A first way to identify a pathway is by synthesis. Transformation
routes from a substrate to a product are found by successive addition
of reactions, very similar to the way in which the major, well-known
pathways were found by chemists. This can be done systematically,
and details of this type of analysis are available in Seressiotis and Bai-
ley (1986).
Elementary Mode Analysis
A powerful tool is the use of elementary flux modes (Schuster and Hil-
getag, 1994). This will be examined now in more detail.
An elementary mode is the minimal set of enzymes that can operate
at steady state, with the enzymes weighted by the relative flux they
carry. ‘‘Minimal’’ is to be understood in the sense that if only the
enzymes belonging to this set are operating, complete inhibition of a
further enzyme of this set would lead to cessation of any steady-state
flux in the system. With the help of the elementary modes, it can be
determined whether a stoichiometrically balanced path exists between
a particular set of substrates and products—no matter how complex
and entangled a metabolic network may be. Actually, it is not sufficient
to construct linear pathways just by following different metabolites,
because by-products that cannot be excreted by the cell would then
have to be balanced by additional reactions that produce further by-
products, and so on. After this the full set of nondecomposable steady-
state flows that the network can show, including cyclic flows (Leiser
and Blum, 1987), is enumerated. An actual steady-state flux pattern
such as measured by an experiment, will always be a non-negative lin-
ear combination of these modes. Thus the living cell is described as a
mixture of pure states of these elementary modes that form a unique set.
The stoichiometry of the network is critical for identifying the ele-
mentary flux modes (Clarke, 1981), the nondecomposable modes that
255 Metabolic Pathways
allow a steady-state flux from substrates to products. At first the
enyzmes involved are abbreviated as is convenient, and from bio-
chemical knowledge it is determined in which direction the reactions
catalyzed would proceed. For example, in modeling a central part of
the metabolism involving glycolysis and the pentose phosphate cycle,
one could write
—ENZREVPGI ALD TPI . . . (for phosphoglucoseisomerase, aldolase, and triose-phosphate isomerase, etc.)
—ENZIRREVHK PFK . . . (hexokinase, phosphofructokinase, etc., these are irrever-sible)
Next the external and internal metabolites are defined. For an exter-
nal metabolite it is assumed that there is sufficient buffering capacity
either in the cell or in the enviroment so that the steady-state condition
is always fulfilled for this metabolite. In contrast, for any internal
metabolite all reactions have to be properly represented by stoichio-
metric equations in the model because it has to be properly supplied in
stable flux from the enzymes modeled in the system. For our example
this would be
—METINTE4P S7P . . . (erythrose 4-phosphate, seduheptulose 7-phosphate, and soon are internal; the example metabolites are internally created by thepentose phosohate cycle)
—METEXTCO2 NADP NADPH . . . (and so on; for example cofactors are involvedin so many other cellular reactions that they may be considered to beexternally created and buffered)
Finally, all enyzmatic reactions involved in the transformation are
written down:
—CATHK: GLC þATP ¼ G6P þADPPGI: G6P ¼ F6PPFK: F6P þATP ¼ FDP þADP
. . .(the enzymatic reactions of hexokinase, phosphoglucose isomerase,phosphofructokianse, and so forth)
The algorithm calculating the elementary modes from this informa-
tion is now briefly sketched. (A detailed computational protocol is at
256 S. Schmidt and T. Dandekar
http://bms-mudshark.brookes.ac.uk/algorithm.pdf; exam-ples and application to complex networks are described in Schuster et
al., 2000). The algorithm has been implemented as computer programs
in Smalltalk (program EMPATH, John Woods, Oxford) and C (program
METATOOL, Pfeiffer et al., 1999). Both are available from ftp://bmshuxley.brookes.ac.uk/pub/mca/software/ibmpc. The
programs start from a list of reaction equations and a declaration of
reversible and irreversible reactions, and of internal and external
metabolites. As in several other metabolic simulators, this list is auto-
matically translated into a stoichiometric matrix (for an explanation of
this and related terms, see http://www.biologie.hu-berlin.de/biophysics/Theory/tpfeiffer/metatool.html). This matrix isthen transposed and augmented with the identity matrix, to give a
matrix called the initial tableau. From this, further tableaux are consec-
utively computed by pairwise linear combination of rows so that the
columns of the transposed stoichiometric matrix successively become
null vectors. This procedure corresponds to ensuring that the steady-
state constraint is satisfied for each metabolite in turn.
Different metabolic pathways can be analyzed in this way. This
assumes that there has already been a detailed stocktaking of the
available enzymes. This will be explained by two methods, pathway
alignment and pathway completion by genome annotation.
Apart from just enumerating paths, applications of elementary mode
analysis include the following:
—Testing whether a set of enzymes allows production of a desired
product
—Detecting nonredundant pathways and enzyme activities (important
for drug design)
—Detecting pathways with maximal molar yields (important for bio-
technology and metabolic engineering) as well as alternatives with
nearly maximal yields
—Genome comparisons—it rapidly summarizes whether pathways are
complete, and detects gaps and inconsistencies in the annotation
—Medical or pathophysiological assessment of the impact of enzyme
deficiencies.
However, for several pharmacological applications, elementary mode
analysis is quite interesting:
257 Metabolic Pathways
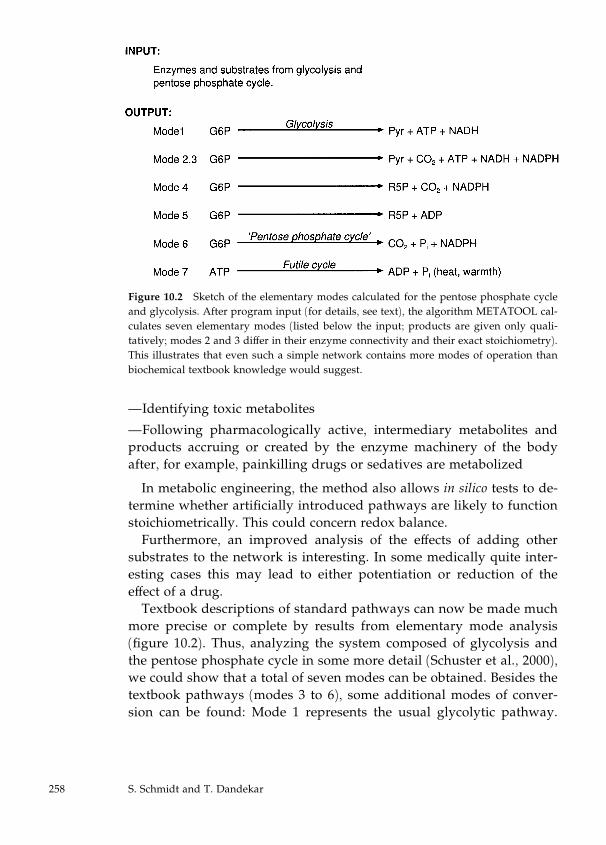
—Identifying toxic metabolites
—Following pharmacologically active, intermediary metabolites and
products accruing or created by the enzyme machinery of the body
after, for example, painkilling drugs or sedatives are metabolized
In metabolic engineering, the method also allows in silico tests to de-
termine whether artificially introduced pathways are likely to function
stoichiometrically. This could concern redox balance.
Furthermore, an improved analysis of the effects of adding other
substrates to the network is interesting. In some medically quite inter-
esting cases this may lead to either potentiation or reduction of the
effect of a drug.
Textbook descriptions of standard pathways can now be made much
more precise or complete by results from elementary mode analysis
(figure 10.2). Thus, analyzing the system composed of glycolysis and
the pentose phosphate cycle in some more detail (Schuster et al., 2000),
we could show that a total of seven modes can be obtained. Besides the
textbook pathways (modes 3 to 6), some additional modes of conver-
sion can be found: Mode 1 represents the usual glycolytic pathway.
Figure 10.2 Sketch of the elementary modes calculated for the pentose phosphate cycle
and glycolysis. After program input (for details, see text), the algorithm METATOOL cal-
culates seven elementary modes (listed below the input; products are given only quali-
tatively; modes 2 and 3 differ in their enzyme connectivity and their exact stoichiometry).
This illustrates that even such a simple network contains more modes of operation than
biochemical textbook knowledge would suggest.
258 S. Schmidt and T. Dandekar
Modes 2 and 3 degrade G6P to pyruvate and CO2, producing ATP,
NADPH, and NADH. Mode 4 converts G6P into ribose-5-phosphate
(R5P) and CO2. It is of importance when the metabolic needs for
reducing power for biosynthetic purposes and for R5P in nucleotide
biosynthesis are balanced. In mode 5, five hexoses are converted into
six pentoses. This is important when the need for R5P exceeds that for
NADPH. Note that, depending on which type of utilization of R5P is
considered, additional ATP consumption may occur in modes 4 and 5.
The term ‘‘pentose phosphate cycle’’ applies to mode 6 best, because
carbons are cycled several times before ending up in CO2. Like modes 2
and 3, it is relevant when much more NADPH than R5P is required,
but does not lead to NADH and ATP production. Mode 7 is a futile
cycle formed by phosphofructokinase and fructose biphosphatase. The
futile cycle is biochemically relevant because it generates additional
heat in the organism—if required by environmental conditions. Further
complexities include various modes that arise if genome-specific varia-
tions are analyzed or the reversibility of reactions is changed. Further-
more, from the start a smaller or larger network can be considered.
Further details, descriptions, and conclusions on all these questions are
found in Schuster et al. (2000).
An alternative to elementary mode analysis is to think of all possible
metabolic fluxes as a type of space, the metabolic flux space. As in an-
alytical geometry, one may then ask how this space is set up by vectors.
These are the so-called basis vectors of flux space (Schilling and Pals-
son, 2000; Simpson et al., 1995; Fell, 1993). This has a problem, how-
ever: there are many possible solutions for the set of vectors defining
the flux space. Nevertheless, very nice studies have been done using
such flux balance studies—for example, investigating the comparative
robustness of the E. coli metabolic network to supply cell growth over a
wide range of different flux conditions (Edwards and Palsson, 2000a) or
the effect of E. coli gene mutants (Edwards and Palsson, 2000b), as well
as assessing the metabolic capabilities of Haemophilus influenza Rd
(Schilling and Palsson, 2000). The different methods are further com-
pared and discussed in detail in Schilling et al. (1999).
ANALYZING SPECIFIC PATHWAYS
We will now compare pathways in different genomes. This yields im-
portant information on their evolution, on pharmacological targets, and
on biotechnological applications. We will discuss a pathway alignment
259 Metabolic Pathways
approach in which three methods are combined: (1) analysis and com-
parison of biochemical data, (2) pathway analysis based on the concept
of elementary modes, and (3) comparative genome analysis. For the
last, the rapid increase of completely sequenced genomes is very help-
ful (e.g., see the available genomes under http://www.tigr.org/tdb). Comparing 17 completely sequenced genomes for their conser-vation of the glycolytic pathway could reveal a surprising plasticity of
this very central pathway. This concerns both presence and absence of
key enzymes as well as specific patterns of isoenzymes in different
species. More deviations than previously thought from the textbook
standard become apparent. Pathway alignment opens up new routes
for potential pharmacological targets and reveals interesting bypasses
such as the Entner-Doudoroff pathway. In a similar vein, archaean-,
bacterial-, and parasite-specific adaptations can be rapidly identified
and described.
Sequence alignment is a well-estalished tool for investigating and
comparing nucleic acid and protein sequences from different species
and for identifying characteristic gaps, insertions, and dissimilarities.
The availability of full genomic sequences and the increasing amount of
biochemical data open up higher-order possibilities for comparative
analysis (Bork et al., 1998). Alignment of biochemical pathways from
different species is an important step toward a more global physiologi-
cal comparison.
Recognition of such differences is interesting for biotechnology
(identification of alternative enzymes) and pharmacology (difference in
drug targets). Biochemical data are extended and compared with ele-
mentary mode analysis of substrate fluxes, comparative genome analy-
sis, and pathway alignment. Other valuable methods to consider and
include for large-scale comparisons of genomic data and pathways in-
clude clusters of orthologous sequences (COGs; Tatusov et al., 2000)
and the application of related enzyme clusters (Goto et al., 1997).
Pathway Alignment and Involved Bioinformatics Tools
The concept of this approach is to compare a range of organisms for
one specific pathway, indicate the presence or absence of the involved
enzymes by two different letters (or zeroes and ones), and then com-
pare the enzyme sets in the same way as sequences are normally
compared, marking well and less well conserved regions. Pathway
260 S. Schmidt and T. Dandekar

alignment focuses on the biochemical capacity of the organisms com-
pared. The utilization of complementary data and tools extends the
biochemical approach and improves the predictive power of such
efforts. A solid knowledge basis from literature and experimental data
is established. Extensive use of sequence and genome analysis allows
the characterization of the full repertoire of enzymes present in the
analyzed organisms in regard to the analyzed pathway. The availabil-
ity of full genomic sequences is exploited, and pathway fluxes and
bypasses regarding the identified enzymes are tested for consistency by
elementary mode analysis. Also, the determination of futile cycles in
the different organism-specific enzyme sets is an indicator for allosteric
regulation of key enzymes involved.
The collection of biochemical and genomic data required to establish
presence or lack of enzymes prior to pathway alignment is greatly
facilitated by the availability of databases on the World Wide Web
(e.g., TIGR, http://www.tigr.org/tdb/; ExPASY, http://www.expasy.ch/enzyme/index.html; KEGG, http://www.genome.ad.jp/kegg/kegg2.html; WIT, http://wit.mcs.anl.gov/WIT2/). These systems are continously developed further (e.g.,
the orthologue group tables for KEGG; Bono et al., 1998). Differential
metabolic display, another helpful pathway visualization and explora-
tion tool, is based on petri nets to generate all pathways satisfying cer-
tain constraints (Kuffner et al., 2000; http://cartan.gmd.de/ToPL/ign.html). However, since databases are based on automated meth-ods, including preformed pathway charts, these automated predictions
are further refined for an accurate analysis.
Available completely sequenced genomes should be extensively
cross-compared to better identify all encoded enzymes in these organ-
isms, because in different genomes, different nonorthologous sequences
may encode the same enzyme. Each of these families can be recognized
only if at least one member has been biochemicaly characterized, a fact
that stresses again the need for both genomic and biochemical data-
bases and data. Genomic information is particularly valuable for
organisms that are difficult to analyze biochemically. For genome cross-
comparisons we recommend the extensive use of differential genome
analysis, using assigned reading frames from one genome to com-
pare its protein content against that of another genome and using
application-specific chips for rapid sequence-to-sequence comparisons
(Huynen et al., 1998). Gene duplications, replacement by unrelated
261 Metabolic Pathways
sequences (nonorthologous displacement; see Bork et al., 1998), and
gene neighborhoods also have to be taken into account. Phylogenetic
analysis has to be applied in order to further analyze gene duplication
events and clarify substrate specificities of the encoded enzymes.
Biochemical functions, sequence-based enzyme comparisons, and
detailed enzyme specificities are made more accurate by a careful
comparison of domain architecture and detection of duplication and
gene displacement events, operon organization, and gene families. This
is more exact than database overviews with a splendid amount of
genome data that rely strongly on an automated assignment of enzyme
functions by reciprocal gene similarities. As a medical application,
identified enzymes from parasite-specific pathway variants may po-
tentially be blocked pharmacologically.
Examples from Glycolysis
Applying pathway alignment for the analysis of glycolysis, the meta-
bolic flow and corresponding enzymes from glucose 6-phosphate on-
ward present a relatively well conserved region of the glycolytic
pathway. However, in a number of organisms several glycolytic
enzymes are missing, according to comparative sequence analysis and/
or biochemical data. For example, phosphofructokinase and aldolase
activity are absent in Mycoplasma hominis (Pollack et al., 1997). Simi-
larly, phosphofructokinase and pyruvate kinase seem to be lacking in
Helicobacter pylori.
Different alternatives to processing glucose to pyruvate become ap-
parent. In glycolysis two molecules of triose are derived from one hex-
ose, and the energy yield is 2 moles of ATP per mole of glucose. The
complete glycolytic pathway is present in E. coli. This is also the case in
most eukaryotic (including human) cells. However, a first variation
concerns the route of transfer of glucose into the cell. In contrast to
higher organisms, the major E. coli pathway for glucose transport uses
the PTS glucose transporter, which utilizes phosphoenolpyruvate as
an energy-rich compound to directly phosphorylate glucose to glucose
6-phosphate.
The connections of pathways to other parts of metabolism, such as
the connection of glycolysis to the pentose phosphate pathway, allow
for further plasticity (e.g., the Entner-Doudoroff pathway is used in-
stead of glycolysis in some bacteria; Danson and Hough, 1992). The
ATP yield is only 1 mole per mole of glucose.
262 S. Schmidt and T. Dandekar
Furthermore, in Methanococcus jannaschii, all enzymes of the non-
oxidative PPP were identified (Selkov et al., 1997). In contrast, the two
dehydrogenases required for the oxidative PPP could be identified nei-
ther in the genome nor by biochemical assays. Glycolysis appears to be
operative although hexokinase, phosphofructokinase, aldolase, and
phosphoglycerate mutase could not be identified in the genome (Selkov
et al., 1997). Assuming that these enzymes or other enzymes are pres-
ent (for instance, there are some indications of ADP-dependent sugar
kinases in archaea; Selkov et al., 1997; Kengen et al., 1995). The ele-
mentary modes for this system can then be calculated (Dandekar et al.,
1999). One of these modes in fact allows the transformation of glucose
6-phosphate into ribose 5-phosphate, which is required for nucleotide
biosynthesis. Thus, the oxidative PPP is not needed for converting
hexoses into pentoses under steady-state conditions. This is in agree-
ment with results of Pandolfi et al. (1995) on glucose 6-phosphate
dehydrogenase deficiencies. A further tool for this type of analysis is
enzyme hierarchies to find common patterns between pathways based
on the EC classification (Tohsato et al., 2000)—which should be criti-
cally further classified by biochemical knowledge and comparisons.
Pathway alignment reveals species-specific pecularities and can be-
come particularly powerful if coupled to metabolic engineering. Exam-
ples, would be engineering Corynebacterium glutamicum mutants to
demonstrate two independent pathways not only for lysine but also for
DL-diaminopimelate as an important building block of the murein cell
wall of this bacterium (Sahm et al., 2000), or to better understand ace-
tate production in E. coli by comparing it against other species and
reducing its acetate synthesis by expressing a B. subtilis acetolactate
synthase (Yang et al., 1999). Planning criteria for such projects that take
results of metabolic flux analysis and a modular perturbation method
into account are explained by Kholodenko et al. (1998); experimental
suggestions for isotope labeling are given by Roscher et al. (2000).
PATHWAYS REVEALED BY GENOME ANALYSIS
Genome Annotation
Genome analysis is a complex and continuous process because the in-
terpretation of the original genome sequence available after a major
sequencing project and the experimental data available change during
subsequent years. Therefore, before discussing additional techniques,
263 Metabolic Pathways
we will illustrate pathway identification in the process of genome an-
notation and, with more information becoming available, subsequent
reannotation.
For analysis the sequence has first to be available in electronic for-
mat. For a new sequencing project this is a rather cumbersome process
and requires a great deal of technology. However, for studying and
other purposes, many full genomic sequences and continuing public
sequencing projects are deposited in public Web sites such as TIGR
(http://www.tigr.org/tdb/).In the next step, determining the position of potential reading frames,
one has to keep in mind the need to distinguish between protein-coding
and RNA-coding reading frames. This step is far from trivial. Impor-
tant enzyme reading frames necessary to identify a complete pathway
may, for example, escape detection because an extension of a reading
frame escaped detection or an important enzyme activity is encoded on
the opposite strand—not to mention notorious complications, particu-
larly in higher eukaryotes, from alternative splicing or even editing of
the mRNA.
If reading frames have been established and translated (note whether
the proper genetic translation table has been used), a function has to be
identified for the reading frame. Bioinformatics allows rapid compari-
son against existing data to achieve this. Thus protein reading frames
can be assigned a putative function by sensitive sequence similarity
comparisons. For detailed protocols and methodology the reader is re-
ferred to Bork et al. (1998) and Bork and Gibson (1996). However, to
illustrate how this process allows completion of pathways, including
identification of previously unnoted enzymatic activities, we will re-
view some examples from a recent genome reannotation effort we con-
ducted for Mycoplasma pneumoniae (Dandekar et al., 2000).
Pathway Completion by Reannotation
The reannotation of molecular functions can potentially provide some
answers regarding higher levels of cellular interactions, such as metab-
olism (but also, for example, regarding pathogenicity factors).
Mycoplasma pneumoniae is a pathogen with a compact genome that
causes atypical pneumonia in man. We analyzed the complete genome
of M. pneumoniae five years after the original sequence was published
(Himmelreich et al., 1996). The reannotation could rely on more data, in
264 S. Schmidt and T. Dandekar
particular from molecular and biochemical analysis of M. pneumoniae
during the intervening five years as well as better software for se-
quence analysis developed during that time. A well known example is
PSI-BLAST, an iterative sequence search algorithm including sequence
alignment information from similar sequences found during the search
(Altschul et al., 1997).
In this way all individual reading frames of M. pneunmoniae were
reexamined (Dandekar et al., 2000). We will review here some exam-
ples regarding better pathway identification or completion during the
effort.
For example, the reading frame MPN547ðMP295Þ [the new MP genome
identifier is given first, followed by the (old MP genome identifier)] was
originally annotated as a homologue of MG369, a conserved hypotheti-
cal protein of unknown function. This function was also indicated in
the update of the M. genitalium genome sequence in December 1999.
However, detailed sequence analysis in the meantime revealed more
about the function. For example, there was a sequence similarity ap-
parent in PSI-BLAST searches (see above). The expected odds of
observing a similarity of this extent by chance was estimated to be 1 in
10 million (nevertheless, such expected values, E-values for short, are
nontrivial to estimate and should be taken only as an indication for
stronger confidence and for finding a biological confirmatory context
for the much higher than chance similarity detected between the two
sequences by the algorithm). There was similarity of the N-terminal 300
amino acids to experimentally characterized dihydroxyacetone kinases
from different bacteria and fungi. Another way to show this relies on
clusters of orthologous genes, COGs for short (Tatusov et al., 2000). The
M. pneumoniae sequence can be shown to be a member of such a cluster
of orthologous genes in which biochemically characterized members
are dihydroxyacetone kinases.
In M. pneumoniae, the dihydroxyacetone kinase domain could yield
ATP by transforming dihydroxyacetone phosphate and ADP into
dihydroxyacetone and ATP. This finding should be interpreted in the
context of other reading frames. Thus the predicted activity can be
metabolically connected to the remaining phospholipid metabolism
predicted for Mycoplasma pneumoniae. It could provide the necessary
supply of dihydroxyacetone phosphate via MPN051ðMP103Þ (glycerol 3-phosphate dehydrogenase reading frame, confirmed in reannotation).
In addition, the remaining sequence of the MPN547ðMP295Þ reading
265 Metabolic Pathways
frame (total length 558 amino acids) may in addition regulate or add to
this predicted enzyme activity.
To give another example, a ribulose uptake pathway is apparent from
the reannotation. Small operons had been known previously for fruc-
tose (MPN078ðMP077Þ, to MPN079ðMP076Þ) and mannitol (MPN651ðMP191Þto MPN653ðMP189Þ). Ribulose was now found to be transported
(MPN496ðMP346Þ, MPN494ðMP347Þ) and channeled via D-arabinose
6-hexulose 3-phosphate synthase (MPN493ðMP348Þ) and D-arabinose
6-hexulose 3-phosphate isomerase (MPN492ðMP349Þ) into fructose 6-
phosphate and glycolysis. Of these proteins, MPN496 and MPN493 had
not been functionally annotated before. MPN494 had been annotated as
a hypothetical phosphotransferase. These new functional assignments
can also be made apparent by integrating data from SWISS-PROT
annotations (the well-known large database of protein reading frames)
with further direct experimental data published for homologous pro-
teins. In addition, we could now add the description of and direct
experimental data (including mass-spectroscopy and sequence deter-
mination) for a small pentitol BC subunit of the ribulose transporter
(MPN495ðMP346:1Þ) not included previously.An example of a more complex and nonmetabolic pathway identified
by genome reannotation in this study was the protein secretion system
in M. pneumoniae. Himmelreich et al. (1996) noted that they had identi-
fied the trigger factor, DnaK, SRP and FtsY as well as SecA, whereas
from the channel-forming proteins only SecY could be assigned, leav-
ing the secretion pathway incomplete. Now using extensive sequence
analysis methods, and integrating recent literature, bioinformtics, and
biochemical data, the reannotation identified the reading frames similar
to SecD, SecE, and SecG, yielding a new, more complete picture of this
secretory pathway in M. pneumoniae. Since several pathogenicity factors
are secreted, the respective protein channels are potential drug targets.
Similar analyses have been done on a number of different genomes,
for example, a reannotation of the Thermotoga maritima genome (Kyr-
pides et al., 2000). Another aspect is the inclusion of structure and
structural genomics, allowing analysis of structure-function relation-
ships. This can be done either in a more summary way for whole
genomes (e.g., comparing the spirochetes T. pallidum and B. burgdorferi.
These lack, among other things, several parts of lipid biosynthesis and
abundantly use, as is common in many other bacteria, TIM barrels and
P-loop NTP hydrolases (Das et al., 2000). In addition, detailed exami-
266 S. Schmidt and T. Dandekar
nation of the enzymatic function, structure, and evolution of the differ-
ent TIM barrel families, comparing all available data (Copley and Bork,
2000), shows widespread recruitment of enzymes between the central
metabolic pathways.
PERSPECTIVE
We have given some examples of bioinformatic analysis of metabolic
pathways, focusing on qualitative analyses; the detailed examples pre-
sented were mostly from our own work. The additional references
given should make it clear that similar efforts have occurred in many
laboratories around the world, and this chapter should serve as an in-
centive for further pathway analysis.
Pathway analysis has become more and more important because
sequencing, and in particular the number of newly sequenced genomes,
is rapidly increasing. Genome content is biologically meaningless
unless interpreted in biological terms, and the metabolic pathways
present an important part of this information. The description of the
enzymatic capabilities based on functional genomics (e.g., via a tool
such as pathway alignment) makes it possible to classify the great
variety of organisms according to their different biochemical makeup.
Medical aspects can now be tackled in unprecedented detail (e.g., ana-
lyzing metabolic changes in the liver, such as strong induction of the
citric acid cycle and gluconeogenesis after major burns, which seem to
be deranged mainly by a strong induction of the liver antioxidant de-
fense pathways; Lee et al., 2000).
Missing enzyme activities and functional misassignment can happen
all too easily (Kyrpides and Ouzounis, 1999). If possible, several tools
(e.g., not only PSI-BLAST but also domain analysis, COGs, etc.) should
be combined. Chapter 9 explains how several indications for protein
function from genomics, in particular regarding interactions, are com-
bined for better predictions, including involved pathways. Similarly,
different lines of evidence should be combined (e.g., not only the
genome sequence but also biological data). It should also be taken into
account that any interpretation of biological data may change over time
as more knowledge becomes available. Experimental data for metabolic
pathway analysis are almost always incomplete. An interesting study
by de Atauri et al. (2000) predicts the effect of uncertain boundary
values in modeling a metabolic pathway. Such limitations and errors
267 Metabolic Pathways
increase with integration to networks, cellular processes, or even the
complete cell. In consequence, most models of this sort (see chapter 11)
have to be interpreted with even more care.
The large-scale structure of metabolic networks has been investigated
by several authors (Jeong et al., 2000; Fell and Wagner, 2000). A fasci-
nating observation is that metabolic networks are connected as scale-
free networks, meaning an exponential decrease in the number of more
highly connected central metabolites. More complex organisms are
more strongly connected than less complex ones. This improves adapt-
ability to changing environmental conditions. The ‘‘diameter’’ of reac-
tions (i.e., the number of enzymatic conversions connecting one
enzymatic reaction of the network to a randomly chosen other one is
kept close to the theoretically smallest possible number. In this way
environmental perturbations rapidly spread over the network and are
optimally buffered by the different enzyme activities. The effect is thus
a ‘‘small world’’ way of connecting. Scale-free networks also apply to
Internet hyperlinks or the U.S. power grid and to the ‘‘small world’’
everyday experience that human relations are surprisingly well con-
nected via common friends or acquaintances.
The analysis of metabolic pathways is an overture to higher levels of
simulation, not only the fascinating regulation of the metabolic path-
ways (level þ 1, so to speak), but ultimately the whole cell (see chapter11). A further valuable effort to bridge this gap while learning (or at
least speculating) about prebiotic evolution is the analysis by Segre et
al. (2000), modeling kinetically enhanced recruitment of simple amphi-
philic molecules leading to evolving and splitting catalytic noncovalent
assemblies.
The road to exploring the full metabolic network of the cell is open,
and there are a number of very useful tools to analyze metabolic path-
ways. Nevertheless, there is still a very long way to travel before we
can grasp the bewildering complexities of living cells.
REFERENCES
Altschul, S. F., Madden, T. L., Schaffer, A. A., Zhang, J., Zhang, Z., Miller, W., and
Lipman, D. J. (1997). Gapped BLAST and PSI-BLAST: A new generation of protein data-
base search programs. Nucleic Acids Res. 25: 3389–3402.
Bork, P., and Gibson, T. J. (1996). Applying motif and profile searches. Methods Enzymol.
266: 162–184.
268 S. Schmidt and T. Dandekar
Bono, H., Goto, S., Fujibuchi, W., Ogata, H., and Kanehisa, M. (1998). Systematic predic-
tion of orthologous units of genes in the complete genomes. Genome Inform. Ser. Workshop
Genome Inform. 9: 32–40.
Bork, P., Dandekar, T., Diaz-Lazcoz, Y., Eisenhaber, F., Huynen, M., and Yuan, Y. (1998).
Predicting function: From genes to genomes and back. J. Mol. Biol. 283: 707–725.
Christensen, B., and Nielsen, J. (2000). Metabolic network analysis: A powerful tool in
metabolic engineering. Adv. Biochem. Eng. Biotechnol. 66: 209–231.
Clarke, B. L. (1981). Complete set of steady states for the general stoichiometric dynamical
system. J. Chem. Phys. 75: 4970–4979.
Copley, R. R., and Bork, P. (2000). Homology among (betaalpha) (8) barrels: Implications
for the evolution of metabolic pathways. J. Mol. Biol. 303: 627–641.
Dandekar, T., et al. (2000). Re-annotating the Mycoplasma pneumoniae genome sequence:
Adding value, function and reading frames. Nucleic Acids Res. 28: 3278–3288.
Dandekar, T., Schuster, S., Snel, B., Huynen, M., and Bork, P. (1999). Pathway align-
ment: Application to the comparative analysis of glycolytic enzymes. Biochem. J. 343: 115–
124.
Danson, M. J., and Hough, D. W. (1992). The enzymology of archaebacterial pathways of
central metabolism. Biochem. Soc. Symp. 58: 7–21.
Das, R., Hegyi, H., and Gerstein, M. (2000). Genome analyses of spirochetes: A study of
the protein structures, functions and metabolic pathways in Treponema pallidum and Bor-
relia burgdorferi. J. Mol. Microbiol. Biotechnol. 2: 387–392.
de Atauri, P., Sorribas, A., and Cascante, M. (2000). Analysis and prediction of the effect
of uncertain boundary values in modeling a metabolic pathway. Biotechnol. Bioeng. 68: 18–
30.
Edwards, J. S., and Palsson, B. O. (2000a). Robustness analysis of the Escherichia coli met-
abolic network. Biotechnol Prog. 16: 927–939.
Edwards, J. S., and Palsson, B. O. (2000b). Metabolic flux balance analysis and the in silico
analysis of Escherichia coli K-12 gene deletions. BMC Bioinformatics 1: 1.
Fell, D. A. (1993). In S. Schuster, M. Rigoulet, R. Ouhabi, and J.-P. Mazat (eds.), Modern
Trends in Biothermokinetics. New York: Plenum Press, pp. 97–101.
Fell, D. A., and Wagner, A. (2000). The small world of metabolism. Nat. Biotechnol. 18:
1121–1122.
Galperin, M. Y., and Brenner, S. E. (1998). Using metabolic pathway databases for func-
tional annotation. Trends Genetics 14: 332–333.
Goto, S., Bono, H., Ogata, H., Fujibuchi, W., Nishioka, T., Sato, K., and Kanehisa, M.
(1997). Organizing and computing metabolic pathway data in terms of binary relations.
Pac. Symp. Biocomput. 1997: 175–186.
Hatzimanikatis, V. (1999). Nonlinear metabolic control analysis. Metab. Eng. 1: 75–87.
269 Metabolic Pathways
Himmelreich, R., Hilbert, H., Plagens, H., Pirkl, E., Li, B. C., and Herrmann, R. (1996).
Complete sequence analysis of the genome of the bacterium Mycoplasma pneumoniae. Nu-
cleic Acids Res. 24: 4420–4449.
Huynen, M., Dandekar, T., and Bork, P. (1998). Differential genome analysis: Rapid iden-
tification of genes encoding species-specific phenotypes. FEBS Lett. 426: 1–5.
Jeong, H., Tombor, B., Albert, R., Oltvai, Z. N., and Barabasi, A. L. (2000). The large-scale
organization of metabolic networks. Nature 407: 651–654.
Kengen, S. W., Tuininga, J. E., de Bok, F. A., Stams, A. J., and de Vos, W. M. (1995). Puri-
fication and characterization of a novel ADP-dependent glucokinase from the hyper-
thermophilic archaeon Pyrococcus furiosus. J. Biol. Chem. 270: 30453–30457.
Kholodenko, B. N., Cascante, M., Hoek, J. B., Westerhoff, H. V., and Schwaber, J. (1998).
Metabolic design: How to engineer a living cell to desired metabolite concentrations and
fluxes. Biotechnol. Bioeng. 59: 239–247.
Kuffner, R., Zimmer, R., and Lengauer, T. (2000). Pathway analysis in metabolic databases
via differential metabolic display. Bioinformatics 16: 825–836.
Kyrpides, N. C., and Ouzounis, C. A. (1999). Whole-genome sequence annotation: ‘‘Going
wrong with confidence.’’ Mol. Microbiol. 32: 886–887.
Kyrpides, N. C., Ouzounis, C. A., Iliopoulos, I., Vonstein, V., and Overbeek, R. (2000).
Analysis of the Thermotoga maritima genome combining a variety of sequence similarity
and genome context tools. Nucleic Acids Res. 28: 4573–4576.
Laufs, S., Kim, S. H., Kim, S., Blau, N., and Thony, B. (2000). Reconstitution of a metabolic
pathway with triple-cistronic IRES-containing retroviral vectors for correction of tetra-
hydrobiopterin deficiency. J. Gene Med. 2: 22–31.
Lee, K., Berthiaume, F., Stephanopoulos, G. N., Yarmush, D. M., and Yarmush, M. L.
(2000). Metabolic flux analysis of postburn hepatic hypermetabolism. Metab. Eng. 2: 312–
327.
Pandolfi, P. P., Sonati, F., Rivi, R., Mason, P., Grosveld, F., and Luzzatto, L. (1995). Tar-
geted disruption of the housekeeping gene encoding glucose 6-phosphate dehydrogenase
(G6PD): G6PD is dispensable for pentose synthesis but essential for defense against oxi-
dative stress. EMBO J. 14: 5209–5215.
Pfeiffer, T., Sanchez-Valdenebro, I., Nuno, J. C., Montero, F., and Schuster, S. (1999).
METATOOL: For studying metabolic networks. Bioinformatics 15(3): 251–257.
Pollack, J. D., Williams, M. V., and McElhaney, R. N. (1997). The comparative metabolism
of the mollicutes (Mycoplasmas): the utility for taxonomic classification and the relation-
ship of putative gene annotation and phylogeny to enzymatic function in the smallest
free-living cells. Crit. Rev. Microbiol. 23: 269–354.
Roscher, A., Kruger, N. J., and Ratcliffe, R. G. (2000). Strategies for metabolic flux analysis
in plants using isotope labelling. J. Biotechnol. 77: 81–102.
270 S. Schmidt and T. Dandekar
Sahm, H., Eggeling, L., and de Graaf, A. A. (2000). Pathway analysis and metabolic engi-
neering in Corynebacterium glutamicum. Biol. Chem. 381: 899–910.
Schilling, C. H., Letscher, D., and Palsson, B. O. (2000). Theory for the systemic definition
of metabolic pathways and their use in interpreting metabolic function from a pathway-
oriented perspective. J. Theor. Biol. 203: 229–248.
Schilling, C. H., and Palsson, B. O. (2000). Assessment of the metabolic capabilities of
Haemophilus influenzae Rd through a genome-scale pathway analysis. J. Theor. Biol. 203:
249–283.
Schilling, C. H., Schuster, S., Palsson, B. O., and Heinrich, R. (1999). Metabolic pathway
analysis: Basic concepts and scientific applications in the post-genomic era. Biotechnol.
Prog. 15: 296–303.
Schuster, S., and Hilgetag, C. (1994). On elementary flux modes in biochemical reaction
systems at steady state. J. Biol. Syst. 2: 165–182.
Schuster, R. and Schuster, S. (1993) Refined algorithm and computer program for calcu-
lating all non-negative fluxes admissible in steady states of biochemical reaction systems
with or without some flux rates fixed. Comp. Appl. Biosci. 9: 79–85.
Schuster, S., Fell, D., and Dandekar, T. (2000). A general definition of metabolic pathways
useful for systematic organization and analysis of complex metabolic networks. Nat. Bio-
technol. 18: 326–332.
Segre, D., Ben-Eli, D., and Lancet, D. (2000). Compositional genomes: Prebiotic informa-
tion transfer in mutually catalytic noncovalent assemblies. Proc. Natl. Acad. Sci. USA 97:
4112–4117.
Selkov, E., Maltsev, N., Olsen, G. J., Overbeek, R., and Whitman, W. B. (1997). A recon-
struction of the metabolism of Methanococcus jannaschii from sequence data. Gene 197:
GC11–26.
Seressiotis, A., and Bailey, J. E. (1986). MPS: An algorithm and data base for metabolic
pathway synthesis. Biotechnol. Lett. 8: 837–842.
Simpson, T. W., Colon, G. E., and Stephanopoulos, G. (1995). Two paradigms of metabolic
engineering applied to amino acid biosynthesis. Biochem. Soc. Trans. 23: 381–387.
Stephanopoulos, G. (1999). Metabolic fluxes and metabolic engineering. Metab. Eng. 1: 1–
11.
Tatusov, R. L., Galperin, M. Y., Natale, D. A., and Koonin, E. V. (2000). The COG data-
base: A tool for genome-scale analysis of protein functions and evolution. Nucleic Acids
Res. 28: 33–36.
Tohsato, Y., Matsuda, H., and Hashimoto, H. (2000). A multiple alignment algorithm for
metabolic pathway analysis using enzyme hierarchy. ISMB 8: 376–383.
Vallino, J. J., and Stephanopoulos, G. (1993). Metabolic flux distributions in Coryne-
bacterium glutamicum during growth and lysine overproduction. Biotechnol. Bioeng. 41:
633–646.
271 Metabolic Pathways
Womble, D. D., and Rownd, R. H. (1986). Regulation of lambda dv plasmid DNA repli-
cation. A quantitative model for control of plasmid lambda dv replication in the bacterial
cell division cycle. J. Mol. Biol. 191: 367–382.
Yang, Y. T., Aristidou, A. A., San, K. Y., and Bennett, G. N. (1999). Metabolic flux analysis
of Escherichia coli deficient in the acetate production pathway and expressing the Bacillus
subtilis acetolactate synthase. Metab. Eng. 1: 26–34.
SUGGESTED READING
Cornish-Bowden, A., and Cardenas, M. L. (2000). From genome to cellular phenotype—a
role for metabolic flux analysis? Nat. Biotechnol. 18: 267–268.
Dandekar, T., Schuster, S., Snel, B., Huynen, M., and Bork, P. (1999). Pathway alignment:
Application to the comparative analysis of glycolytic enzymes. Biochem. J. 343: 115–124.
Fell, D. A. (1997). Understanding the Control of Metabolism. London: Portland Press.
Schuster, S. Dandekar, T., and Fell, D. A. (1999). Detection of elementary flux modes in
biochemical networks: A promising tool for pathway analysis and metabolic engineering.
Trends Biotechnol. 17: 53–60.
URLs FOR RELEVANT SITES
BRENDA, A collection of enzyme functional data including kinetic parameters and spe-
cificity. http://www.brenda.uni-koeln.de/
A detailed description of an algorithm for computing elementary flux modes.
http://bms-mudshark.brookes.ac.uk/algorithm.pdf
Download site for EMPATH and METATOOL, two implementations of the elementary
flux mode calculation algorithm described in this chapter.
ftp://bmshuxley.brookes.ac.uk/pub/mca/software/ibmpc
ENZYME, A database containing information relative to the nomenclature and classifica-
tion of enzymes. http://www.expasy.ch/enzyme/index.html
KEGG (Kyoto Encyclopedia of Genes and Genomes), a collection of computerized meta-
bolic pathways with extensive links to other databases.
http://www.genome.ad.jp/kegg
The Institute for Genomic Research (TIGR) provides a list of genome sequencing proj-
ects—a wealth of genomic information. http://www.tigr.org/tdb/
Further explanation of the program METATOOL. http://www.biologie.hu-
berlin.de/biophysics/Theory/tpfeiffer/metatool.html
WIT, a project seeking to reconstruct metabolism for sequenced genomes that contains
many metabolic pathway maps and enzyme lists. http://wit.mcs.anl.gov/WIT2/
272 S. Schmidt and T. Dandekar
11 Toward Computer Simulation of theWhole Cell
Masaru Tomita
It is still an open question whether or not computer simulation of a
whole cell by modeling all its metabolic pathways and other machi-
neries is feasible. Yet the time has come that we can begin working to-
ward this ultimate goal. The E-CELL project (Tomita et al., 1999) was
launched in 1996 at Keio University in order to model and simulate
various cellular processes, with the ultimate goal of simulating the cell
as a whole. The E-CELL simulation system is a generic software pack-
age for cell modeling, and its first version was completed in 1997. E-
CELL simulates the behavior of a model cell by computing interactions
among molecular species it contains. E-CELL allows the user to define
chemically discrete compartments such as membranes, chromosomes,
and cytoplasm. The total amounts of substances in all of the cellular
compartments comprise the internal representation of the cell state,
which can be monitored and/or manipulated by means of various
graphical user interfaces (figure 11.1).
The E-CELL system enables us to model not only metabolic path-
ways but also other higher-order cellular processes, such as protein
synthesis and membrane transport, within the same framework. E-
CELL also attempts to provide a framework for higher-order cellular
phenomena such as the gene regulation network, DNA replication, and
other events in the cell cycle. These various processes can then be inte-
grated into a single simulation model. A major challenge of the proj-
ect is to develop a method of modeling that is sufficiently robust to
accommodate a realistically large scale model consisting of hundreds
and thousands of processes with drastic differences in behavior and
time scale among them.
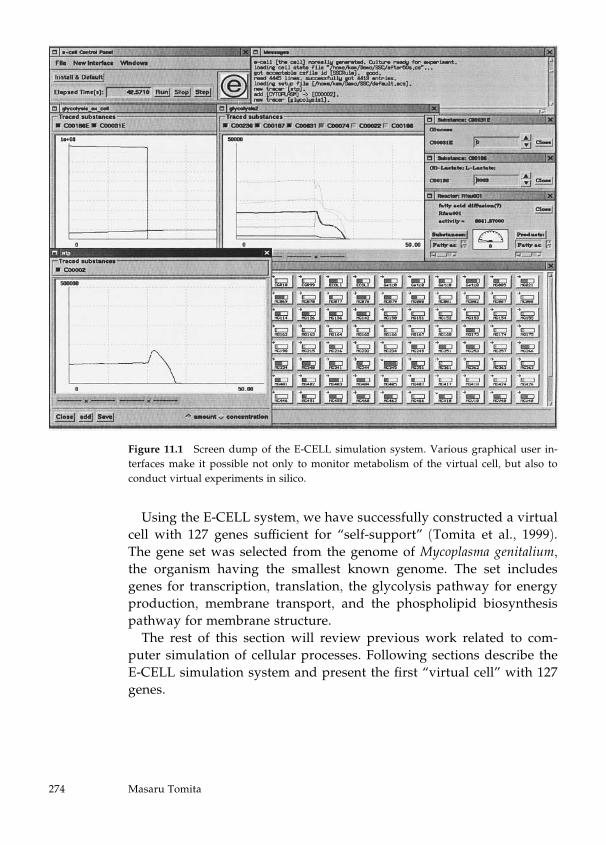
Using the E-CELL system, we have successfully constructed a virtual
cell with 127 genes sufficient for ‘‘self-support’’ (Tomita et al., 1999).
The gene set was selected from the genome of Mycoplasma genitalium,
the organism having the smallest known genome. The set includes
genes for transcription, translation, the glycolysis pathway for energy
production, membrane transport, and the phospholipid biosynthesis
pathway for membrane structure.
The rest of this section will review previous work related to com-
puter simulation of cellular processes. Following sections describe the
E-CELL simulation system and present the first ‘‘virtual cell’’ with 127
genes.
Figure 11.1 Screen dump of the E-CELL simulation system. Various graphical user in-
terfaces make it possible not only to monitor metabolism of the virtual cell, but also to
conduct virtual experiments in silico.
274 Masaru Tomita
The following cell models are currently being constructed using the
E-CELL system:
. Kinetic model of a human erythrocyte
. Signal transduction for bacterial chemotaxis
. Gene regulation network for E. coli’s lac and ara operons and the lytic-
lysogenic switch network of bacteriophage lambda
. Energy metabolism in mitochondria.
These models are presented in later sections of the chapter.
Many attempts have been made to simulate molecular processes in
both cellular and viral systems. Perhaps the most active area of cellular
simulation is the kinetics of metabolic pathways. Software packages for
quantitative simulation of cellular processes, based on numerical inte-
gration of rate equations, have been developed. KINSIM (Barshop et
al., 1983; Dang and Frieden, 1997), MetaModel (Cornish-Bowden and
Hofmeyr, 1991), SCAMP (Sauro, 1993), and MIST (Ehlde and Zacchi,
1995) deal with steady states and their metabolic control analysis
(MCA) coefficients. GEPASI (Mendes, 1993, 1997) calculates steady
states as well as reaction time behavior and characterizes the steady
state with MCA. SIMFIT (Holzhutter and Colosimo, 1990) and KINSIM
(Barshop et al., 1983; Dang and Frieden, 1997) integrate the simulation
of dynamic models and the parameter fitting program. V-Cell is a
solver for nonlinear PDE/ODE/algebraic systems, and can represent
the cellular geometry. Dbsolve (Goryanin et al., 1999) combines contin-
uation and bifurcation analysis. Several groups have proposed and
analyzed gene regulation and expression models by simulation (Mey-
ers and Friedland, 1984; Koile and Overton, 1989; Karp, 1993; Arita et
al., 1994; McAdams and Shapiro, 1995). The cell division cycle (Tyson,
1991; Novak and Tyson, 1995) and signal transduction mechanisms
(Bray et al., 1993) have also been areas of research for biological mod-
eling and simulation.
Previous work in biochemical and genetic simulations has usually
limited its models to focus on only one of the several levels of the time-
scale hierarchy in cellular processes. Bridging the gaps between the
various levels of this hierarchy is an extremely challenging problem
that has yet to be adequately addressed. We present a step toward
integrative simulation of large-scale cellular processes.
275 Toward Computer Simulation of the Whole Cell
THE E-CELL SOFTWARE ARCHITECTURE
The E-CELL software employs a structured substance-reactor model to
construct and simulate the cell model. The structured substance-reactor
model consists of three classes of objects—Substance, Reactor, and Sys-
tem—representing molecular species, reactions, and functional/physi-
cal compartments, respectively. To model chromosomes and other
genetic materials, the system also has sophisticated data structures
such as Genome, GenomicElement, and Gene.
Assuming rapid equilibrium in each compartment, the state of the
cell at a point in time and its dynamics are represented as a set of con-
centration vectors and reaction kinetics. Therefore, simulation of the
cell can be viewed as integration of ordinary differential equations
(ODEs). The numerical integration is performed in distributed form
with Stepper and Integrator class objects in the system. With this design,
the system can be extended to handle multicompartment, multischeme,
and multiphase numerical integration. In other words, time-step sizes
and integration algorithms can vary among different compartments,
and therefore parallel computation can be applied to cope with the
stiffness problem. The problem of stiffness occurs in a system like a cell
where there are very different scales of the time variable on which the
dependent variables are changing. The stiffness often results in various
kinds of numerical errors, some of which are fatal for the simulation.
The E-CELL system is written in Cþþ and designed with the object-
oriented MVC (model, view, and control) model, which facilitates in-
dependent development of the reaction rules (Model), user interfaces
(View), and simulation engine (Control). The kinetics of each reaction is
encapsulated into the Reactor class objects. In addition to general reac-
tion schemes provided by the system, task-specific reaction schemes
can be defined by a user without detailed knowledge of implementa-
tion of the other parts of the system.
The E-CELL simulation environment consists of several software
components: the core simulation system (E-CELL system), the E-CELL
manager, the rule file compiler, and other data converters/processors.
Besides the system-specific E-CELL rule format, the user can write
simulation rules using any commercially/publicly available spread-
sheet software. The rules are compiled into .eri (E-CELL Rule Inter-
mediate) format, which can be interpreted by the simulation system.
The core system reads a compiled rule, starts simulation, and outputs
276 Masaru Tomita
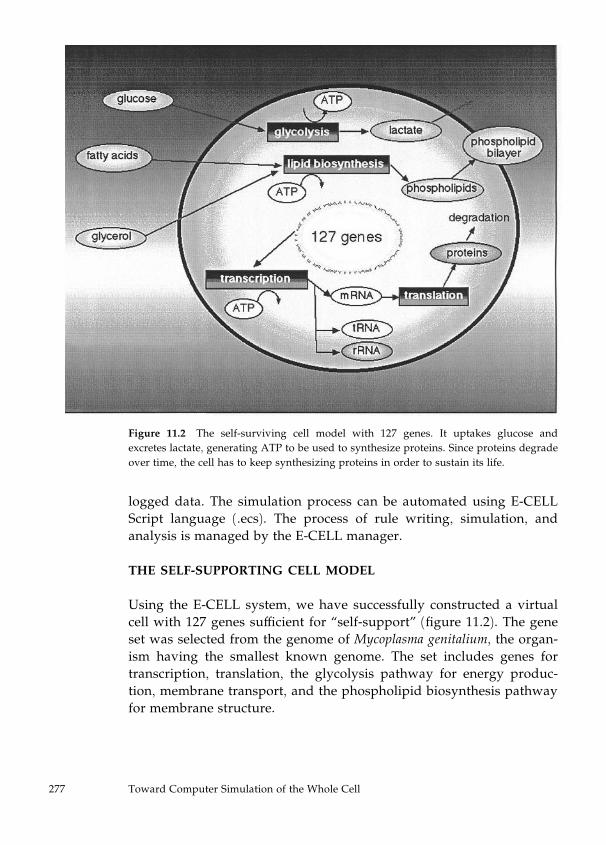
logged data. The simulation process can be automated using E-CELL
Script language (.ecs). The process of rule writing, simulation, and
analysis is managed by the E-CELL manager.
THE SELF-SUPPORTING CELL MODEL
Using the E-CELL system, we have successfully constructed a virtual
cell with 127 genes sufficient for ‘‘self-support’’ (figure 11.2). The gene
set was selected from the genome of Mycoplasma genitalium, the organ-
ism having the smallest known genome. The set includes genes for
transcription, translation, the glycolysis pathway for energy produc-
tion, membrane transport, and the phospholipid biosynthesis pathway
for membrane structure.
Figure 11.2 The self-surviving cell model with 127 genes. It uptakes glucose and
excretes lactate, generating ATP to be used to synthesize proteins. Since proteins degrade
over time, the cell has to keep synthesizing proteins in order to sustain its life.
277 Toward Computer Simulation of the Whole Cell
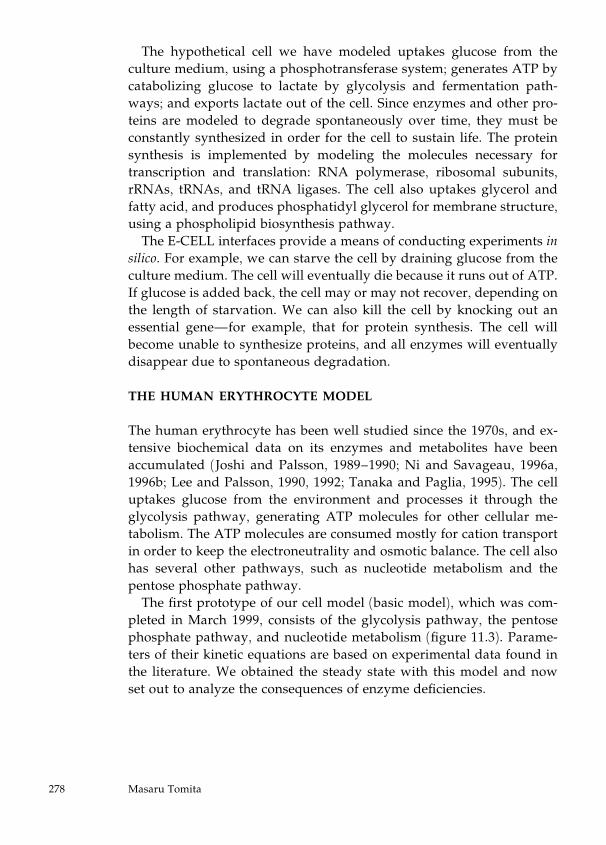
The hypothetical cell we have modeled uptakes glucose from the
culture medium, using a phosphotransferase system; generates ATP by
catabolizing glucose to lactate by glycolysis and fermentation path-
ways; and exports lactate out of the cell. Since enzymes and other pro-
teins are modeled to degrade spontaneously over time, they must be
constantly synthesized in order for the cell to sustain life. The protein
synthesis is implemented by modeling the molecules necessary for
transcription and translation: RNA polymerase, ribosomal subunits,
rRNAs, tRNAs, and tRNA ligases. The cell also uptakes glycerol and
fatty acid, and produces phosphatidyl glycerol for membrane structure,
using a phospholipid biosynthesis pathway.
The E-CELL interfaces provide a means of conducting experiments in
silico. For example, we can starve the cell by draining glucose from the
culture medium. The cell will eventually die because it runs out of ATP.
If glucose is added back, the cell may or may not recover, depending on
the length of starvation. We can also kill the cell by knocking out an
essential gene—for example, that for protein synthesis. The cell will
become unable to synthesize proteins, and all enzymes will eventually
disappear due to spontaneous degradation.
THE HUMAN ERYTHROCYTE MODEL
The human erythrocyte has been well studied since the 1970s, and ex-
tensive biochemical data on its enzymes and metabolites have been
accumulated (Joshi and Palsson, 1989–1990; Ni and Savageau, 1996a,
1996b; Lee and Palsson, 1990, 1992; Tanaka and Paglia, 1995). The cell
uptakes glucose from the environment and processes it through the
glycolysis pathway, generating ATP molecules for other cellular me-
tabolism. The ATP molecules are consumed mostly for cation transport
in order to keep the electroneutrality and osmotic balance. The cell also
has several other pathways, such as nucleotide metabolism and the
pentose phosphate pathway.
The first prototype of our cell model (basic model), which was com-
pleted in March 1999, consists of the glycolysis pathway, the pentose
phosphate pathway, and nucleotide metabolism (figure 11.3). Parame-
ters of their kinetic equations are based on experimental data found in
the literature. We obtained the steady state with this model and now
set out to analyze the consequences of enzyme deficiencies.
278 Masaru Tomita
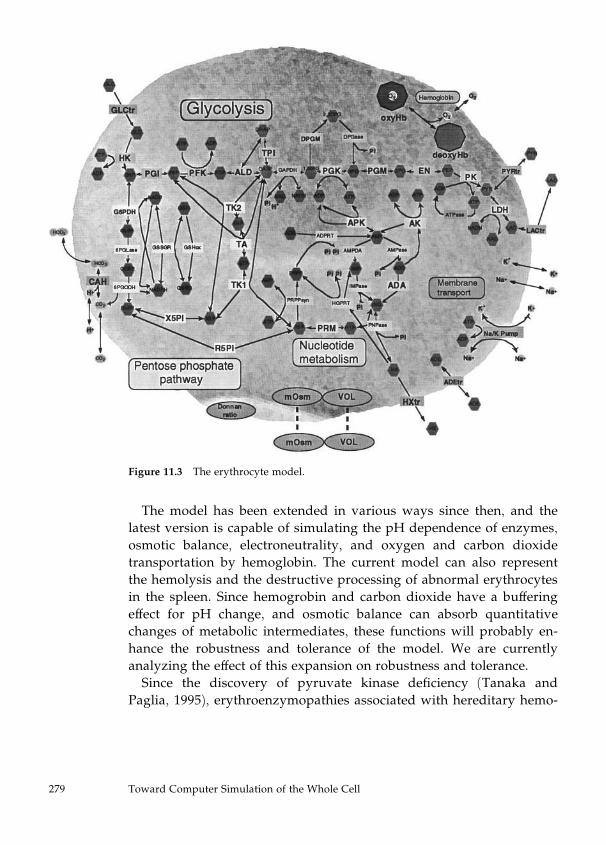
The model has been extended in various ways since then, and the
latest version is capable of simulating the pH dependence of enzymes,
osmotic balance, electroneutrality, and oxygen and carbon dioxide
transportation by hemoglobin. The current model can also represent
the hemolysis and the destructive processing of abnormal erythrocytes
in the spleen. Since hemogrobin and carbon dioxide have a buffering
effect for pH change, and osmotic balance can absorb quantitative
changes of metabolic intermediates, these functions will probably en-
hance the robustness and tolerance of the model. We are currently
analyzing the effect of this expansion on robustness and tolerance.
Since the discovery of pyruvate kinase deficiency (Tanaka and
Paglia, 1995), erythroenzymopathies associated with hereditary hemo-
Figure 11.3 The erythrocyte model.
279 Toward Computer Simulation of the Whole Cell
lytic anemia have been extensively investigated. We are currently
trying to reconstruct the erythrocyte model with these deficiencies.
Simulation experiments using the basic model of the human eryth-
rocyte were carried out. Pyruvate kinase activity was set to zero at 2000
seconds. The ATP production rate became lower, and ATP was even-
tually exhausted. Increases of 2-phosphoglycerate, 3-phosphoglycerate,
and phosphoenolpyruvate were observed (figure 11.4). These phenom-
ena were reported in human erythrocytes from patients with PK (pyru-
vate kinase) deficiency. We plan to use the kinetic parameters of the
PK mutant to obtain the steady state of the defective erythrocyte.
SIGNAL TRANSDUCTION FOR BACTERIAL CHEMOTAXIS
Chemotaxis is the orientation of an organism in relation to the presence
of a particular chemical. The chemotactic response of E. coli depends on
the ability to modulate the flagellar motor in response to external stim-
uli. The flagellar motor has a switch protein that interacts with proteins
called CheY. The CheY protein in a phosphorylated form is known to
bind with the motor up to 20 times more frequently than that in an
Figure 11.4 Simulation of pyruvate kinase deficiency. Pi, inorganic phosphates; Mg, free
magnesium; tAMP, total AMP; tADP, total ADP; tATP, total ATP; T23 DPG, total 2,3-
diphosphoglycerate; 3PG, 3-phosphoglycerate; 2G, 2-phosphoglycerate; PEP, phosphoe-
nol pyruvate; LACi, lactate.
280 Masaru Tomita
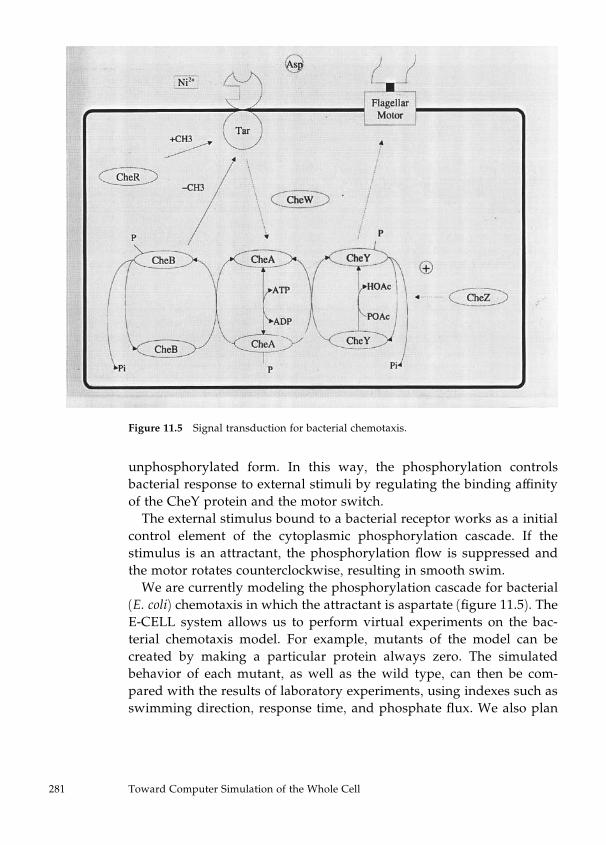
unphosphorylated form. In this way, the phosphorylation controls
bacterial response to external stimuli by regulating the binding affinity
of the CheY protein and the motor switch.
The external stimulus bound to a bacterial receptor works as a initial
control element of the cytoplasmic phosphorylation cascade. If the
stimulus is an attractant, the phosphorylation flow is suppressed and
the motor rotates counterclockwise, resulting in smooth swim.
We are currently modeling the phosphorylation cascade for bacterial
(E. coli) chemotaxis in which the attractant is aspartate (figure 11.5). The
E-CELL system allows us to perform virtual experiments on the bac-
terial chemotaxis model. For example, mutants of the model can be
created by making a particular protein always zero. The simulated
behavior of each mutant, as well as the wild type, can then be com-
pared with the results of laboratory experiments, using indexes such as
swimming direction, response time, and phosphate flux. We also plan
Figure 11.5 Signal transduction for bacterial chemotaxis.
281 Toward Computer Simulation of the Whole Cell
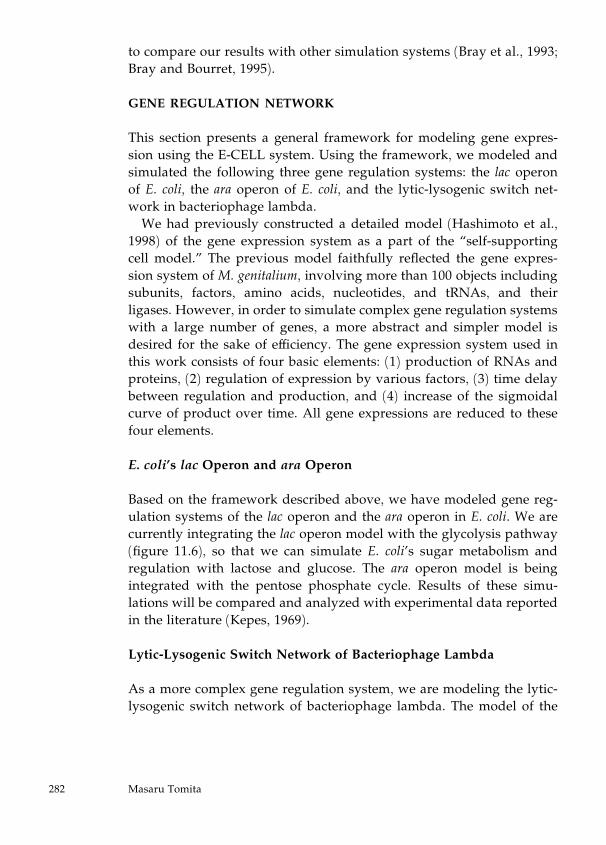
to compare our results with other simulation systems (Bray et al., 1993;
Bray and Bourret, 1995).
GENE REGULATION NETWORK
This section presents a general framework for modeling gene expres-
sion using the E-CELL system. Using the framework, we modeled and
simulated the following three gene regulation systems: the lac operon
of E. coli, the ara operon of E. coli, and the lytic-lysogenic switch net-
work in bacteriophage lambda.
We had previously constructed a detailed model (Hashimoto et al.,
1998) of the gene expression system as a part of the ‘‘self-supporting
cell model.’’ The previous model faithfully reflected the gene expres-
sion system of M. genitalium, involving more than 100 objects including
subunits, factors, amino acids, nucleotides, and tRNAs, and their
ligases. However, in order to simulate complex gene regulation systems
with a large number of genes, a more abstract and simpler model is
desired for the sake of efficiency. The gene expression system used in
this work consists of four basic elements: (1) production of RNAs and
proteins, (2) regulation of expression by various factors, (3) time delay
between regulation and production, and (4) increase of the sigmoidal
curve of product over time. All gene expressions are reduced to these
four elements.
E. coli’s lac Operon and ara Operon
Based on the framework described above, we have modeled gene reg-
ulation systems of the lac operon and the ara operon in E. coli. We are
currently integrating the lac operon model with the glycolysis pathway
(figure 11.6), so that we can simulate E. coli’s sugar metabolism and
regulation with lactose and glucose. The ara operon model is being
integrated with the pentose phosphate cycle. Results of these simu-
lations will be compared and analyzed with experimental data reported
in the literature (Kepes, 1969).
Lytic-Lysogenic Switch Network of Bacteriophage Lambda
As a more complex gene regulation system, we are modeling the lytic-
lysogenic switch network of bacteriophage lambda. The model of the
282 Masaru Tomita
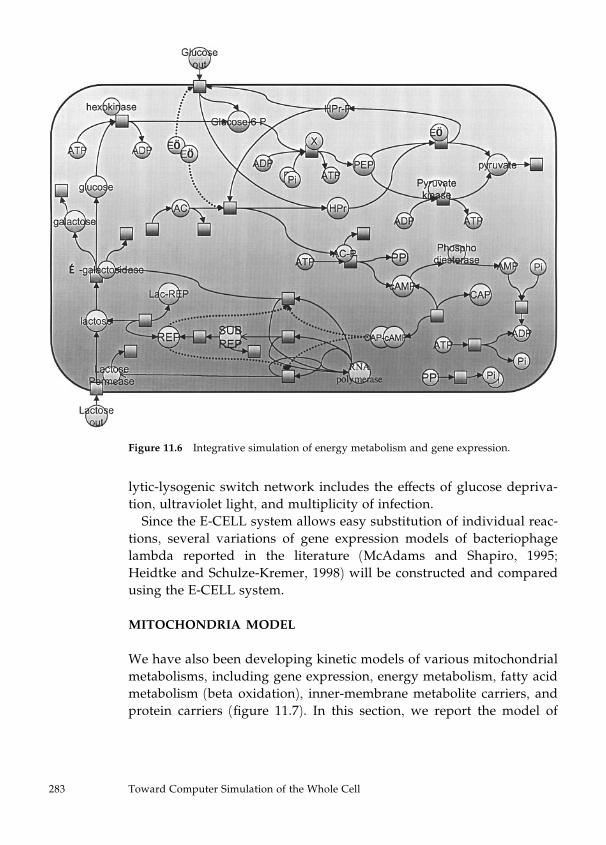
lytic-lysogenic switch network includes the effects of glucose depriva-
tion, ultraviolet light, and multiplicity of infection.
Since the E-CELL system allows easy substitution of individual reac-
tions, several variations of gene expression models of bacteriophage
lambda reported in the literature (McAdams and Shapiro, 1995;
Heidtke and Schulze-Kremer, 1998) will be constructed and compared
using the E-CELL system.
MITOCHONDRIA MODEL
We have also been developing kinetic models of various mitochondrial
metabolisms, including gene expression, energy metabolism, fatty acid
metabolism (beta oxidation), inner-membrane metabolite carriers, and
protein carriers (figure 11.7). In this section, we report the model of
Figure 11.6 Integrative simulation of energy metabolism and gene expression.
283 Toward Computer Simulation of the Whole Cell
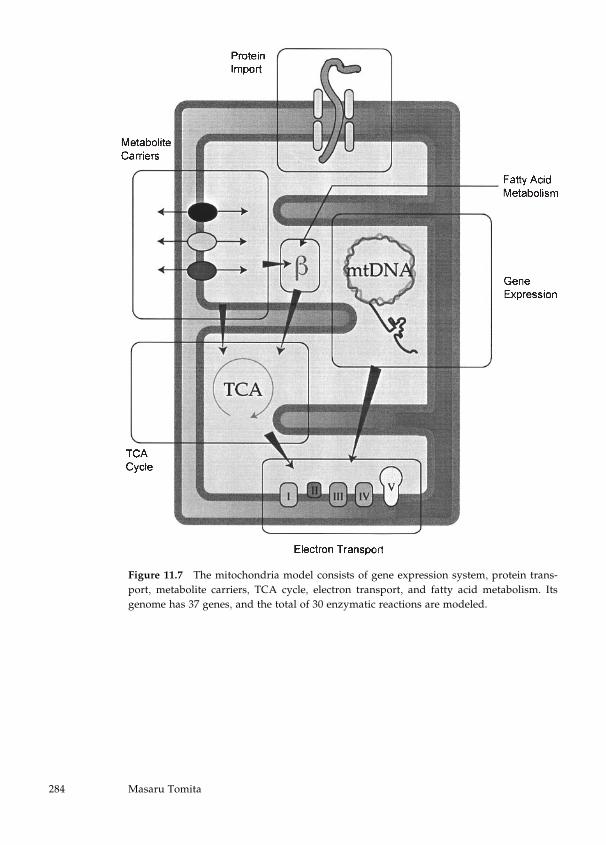
Figure 11.7 The mitochondria model consists of gene expression system, protein trans-
port, metabolite carriers, TCA cycle, electron transport, and fatty acid metabolism. Its
genome has 37 genes, and the total of 30 enzymatic reactions are modeled.
284 Masaru Tomita
pathways for energy metabolism that was recently completed using the
E-CELL system.
A mitochondrion has three major energy metabolic pathways: elec-
tron transport, TCA cycle, and beta oxidation. The basic steps of energy
metabolism are listed below.
. Inner-membrane metabolite carriers transport pyruvate, fatty acid,ADP, and Pi.
. Acetyl-CoA is produced from pyruvate by pyruvate dehydrogenase.
. Acetyl-CoA is made from fatty acid by beta oxidation.
. The TCA cycle oxidizes acetyl-CoA to produce NADH, the substrateof electron transport.
. The four enzymes of electron transport oxidize NADH.
. At the end of electron transport, ATP synthase generates ATP.
There are five enzymatic reactions for electron transport, eleven en-
zymatic reactions, and nine other reactions for the TCA cycle, five en-
zymatic reactions for beta oxidation, and eight enzymatic reactions for
the metabolite carrier system. All the enzymatic reactions are modeled
on the basis of kinetic parameters found in the literature.
We will continue to enhance this mitochondrial model, adding other
major part of metabolism, including gene expression, fatty acid metab-
olism, and DNA replication. Our eventual goal is to apply this model to
pathological analyses of mitochondrial diseases such as Leigh syn-
drome, mitochondrial myopathy and encephalopathy, lactic acidosis,
and strokelike episodes.
CONCLUDING REMARKS
The E-CELL system has been available since July 1999 from our Web
site (http://www.e-cell.org). Some of the models described in thischapter can be downloaded from this Web site. Our simulation work
with E-CELL has shown that large-scale modeling of various cellular
metabolisms using the same framework appears feasible.
One of the major problems in constructing large-scale cell models is
lack of quantitative data. Most of the biological knowledge available
is qualitative (e.g., functions of genes, pathway maps, which proteins
interact with what, etc.). For simulation, however, quantitative data
such as concentrations of metabolites and enzymes, flux rates, kinetic
285 Toward Computer Simulation of the Whole Cell
parameters, and dissociation constants are essential. A major challenge
is to develop high-throughput technologies for measurement of inner-
cellular metabolites. A great deal of data for a variety of cell states
can then be collected with the technologies to construct quantitative
models, and the models can be refined iteratively until the simulation
results match the data.
For this new type of simulation-oriented biology, Keio University
has established the Institute for Advanced Biosciences (http://www.bioinfo.sfc.keio.ac.jp/IAB/). The institute consists of
centers for metabolome research, bioinformatics, and genome engi-
neering. The ultimate goal of this international research institute is to
construct a whole-cell model in silico, based on a large amount of data
generated by high-throughput metabolome analyses, then design a
novel genome based on the computer simulation and create real cells
with the novel genome by means of genome engineering.
As mentioned at the beginning of this chapter, whether or not com-
plete living cells can be modeled and simulated at the molecular level is
still an open question. However, the rapidly accumulating information
on cellular metabolism increases the likelihood that whole-cell simula-
tion of real organisms will be feasible in the near future.
ACKNOWLEDGMENTS
I would like to thank all the E-CELL project members of the Laboratory
for Bioinformatics, Keio University, including Kenta Hashimoto, Koichi
Takahashi, Yoichi Nakayama, Yuri Matsuzaki, Fumihiko Miyoshi, Kat-
suyuki Yugi, and Yusuke Saito. The E-CELL project is funded in part
by Japan Science and Technology Corporation and a grant-in-aid for
scientific research on priority areas from the Ministry of Education,
Science, Sports, and Culture of Japan.
REFERENCES
Arita, M., Hagiya, M., and Shiratori, T. (1994). GEISHA SYSTEM: An environment for
simulating protein interaction. In T. Takagi (ed.), Proceedings, Genome Informatics Workshop
1994. Tokyo: Universal Academy Press, pp. 81–89.
Barshop, B. A., Wrenn, R. F., and Frieden, C. (1983). Analysis of numerical methods for
computer simulation of kinetic processes: Development of KINSIM—a flexible, portable
system. Anal. Biochem. 130: 134–145.
286 Masaru Tomita
Bray, D., and Bourret, R. B. (1995). Computer analysis of the binding reactions leading to
a transmembrane receptor-linked multiprotein complex involved in bacterial chemotaxis.
Mol. Biol. Cell 6: 1367–1380.
Bray, D., Bourret, R. B., and Simon, M. I. (1993). Computer simulation of the phosphor-
ylation cascade controlling bacterial chemotaxis. Mol. Biol. Cell 4: 469–482.
Cornish-Bowden, A., and Hofmeyr, J. H. (1991). MetaModel: A program for modeling and
control analysis of metabolic pathways on the IBM PC and compatibles. Comput. Appl.
Biosci. 7: 89–93.
Dang, Q., and Frieden, C. (1997). New PC versions of the kinetic-simulation and fitting
programs, KINSIM and FITSIM. Trends Biochem. Sci. 22 (8): 317.
Ehlde, M., and Zacchi, G. (1995). MIST: A user-friendly metabolic simulator. Comput.
Appl. Biosci. 11: 201–207.
Goryanin, I., Hodgman, T. C., and Selkov, E. (1999). Mathematical simulation and analy-
sis of cellular metabolism and regulation. Bioinformatics 15: 749–758.
Hashimoto, K., Miyoshi, F., Shimizu, T. S., Satoyoshi, T., and Tomita, M. (1998). Model-
ling of transcription and DNA replication using the E-CELL simulation system. In Genome
Informatics 1998. Tokyo: Universal Academy Press, pp. 244–245.
Heidtke, K. R., and Schulze-Kremer, S. (1998). Design and implementation of a qualitative
simulation model of lambda phage infection. Bioinformatics 14 (1): 81–91.
Holzhutter, H. G., and Colosimo, A. (1990). SIMFIT: A microcomputer software toolkit for
modelistic studies in biochemistry. Comput. Appl. Biosci. 6: 23–28.
Joshi, A., and Palsson, B. O. (1989–1990). Metabolic dynamics in the human red cell. Part
I—A comprehensive kinetic model. J. Theor. Biol. 141, no. 4 (Dec. 19, 1989): 515–528; Part
II—Interactions with the environment. J. Theor. Biol. 141, no. 4 (Dec. 19, 1989): 529–545;
Part III—Metabolic reaction rates. J. Theor. Biol. 142, no. 1 (Jan. 9, 1990): 41–68; Part IV—
Data prediction and somemodel computations. J. Theor. Biol. 142, no. 1 (Jan. 9, 1990): 69–85.
Karp, P. D. (1993). A qualitative biochemistry and its application to the regulation of the
tryptophan operon. In L. Hunter (ed.), Artificial Intelligence and Molecular Biology. Menlo
Park Calif.: AAAI Press; Cambridge, Mass.: MIT Press, pp. 289–324.
Kepes, A. (1969). Transcription and translation in the lactose operon of Escherichia coli
studied by in vivo kinetics. Prog. Biophys. Mol. Biol. 19 (1): 199–236.
Koile, K., and Overton, G. C. (1989). A qualitative model for gene expression. In Proceed-
ings of the 1989 Summer Computer Simulation Conference. pp. 415–421.
Lee, I. D., and Palsson, B. O. (1990). A comprehensive model of human erythrocyte me-
tabolism: Extensions to include pH effects. Biomed. Biochem. 49 (8–9): 771–789.
Lee, I. D., and Palsson, B. O. (1992). A Macintosh software package for simulation of hu-
man red blood cell metabolism. Comput. Methods Programs Biomed. 38 (4): 195–226.
McAdams, H. H., and Shapiro, L. (1995). Circuit simulation of genetic networks. Science
269: 650–656.
287 Toward Computer Simulation of the Whole Cell
Mendes, P. (1993). GEPASI: A software package for modeling the dynamics, steady states
and control of biochemical and other systems. Comput. Appl. Biosci. 9: 563–571.
Mendes, P. (1997). Biochemistry by numbers: Simulation of biochemical pathways with
Gepasi 3. Trends Biochem. Sci. 22: 361–363.
Meyers, S., and Friedland, P. (1984). Knowledge-based simulation of genetic regulation in
bacteriophage lambda. Nucleic Acids Res. 12: 1–9.
Ni, T. C., and Savageau, M. A. (1996a). Application of biochemical systems theory to
metabolism in human red blood cells. Signal propagation and accuracy of representation.
J. Biol. Chem. 271 (14): 7927–7941.
Ni, T. C., and Savageau, M. A. (1996b). Model assessment and refinement using strategies
from biochemical systems theory: Application to metabolism in human red blood cells. J.
Theor. Biol. 179 (4): 329–368.
Novak, B., and Tyson, J. J. (1995). Quantitative analysis of a molecular model of mitotic
control in fission yeast. J. Theor. Biol. 173: 283–305.
Palsson, B. O., Narang, A., and Joshi, A. (1989). Computer model of human erythrocyte
metabolism. Prog. Clin. Biol. Res. 319: 133–150; discussion, 151–154.
Sauro, H. M. (1993). SCAMP: A general-purpose simulator and metabolic control analysis
program. Comput. Appl. Biosci. 9: 441–450.
Tanaka, K. R., and Paglia, D. E. (1995). Pyruvate kinase and other enzymopathies of the
erythrocyte. In The Metabolic and Molecular Basis of Inherited Disease, 7th ed. New York:
McGraw-Hill, pp. 3485–3511.
Tomita, M., Hashimoto, K., Takahashi, K., Shimizu, T. S., Matsuzaki, Y., Miyoshi, F.,
Saito, K., Tanida, S., Yugi, K., Venter, J. C., and Hutchison, C. A. (1999). E-CELL: Software
environment for whole cell simulation. Bioinformatics 15 (1): 72–84.
Tyson, J. J. (1991). Modeling the cell division cycle: cdc2 and cyclin interactions. Proc. Natl.
Acad. Sci. USA 88: 7328–7332.
SUGGESTED READING
Service, R. F. (1999). Complex systems. Exploring the systems of life. Science 284: 80–81,
83. General article on various aspects of systems biology, including computer simulation
of the cell.
Tomita, M. (2001). Whole-cell simulation: A grand challenge of the 21st century. Trends
Biotechnol. 19: 205–210. General article on cell simulation that focuses on whole-cell
models and their potential practical applications.
URLs FOR RELEVANT SITES
Institute for Advanced Biosciences, Keio University.
http://www.bioinfo.sfc.keio.ac.jp/IAB
E-CELL Project. http://www.e-cell.org
288 Masaru Tomita
Glossary
Annotation The process of associating knowledge to macromolecule sequences, usually
genomes. This includes assigning all encoded protein activities, among them the pre-
dicted enzymes of a genome.
Apoptosis (also termed ‘‘programmed cell death,’’ PCD) Regulated, active, morpholog-
ically and biochemically distinct process during development and tissue homeostasis in
which a cell dies without causing inflammatory reaction in the surrounding tissue.
Autapomorphy A derived character state (apomorphy) that is unique to a particular
species or lineage in the group under consideration. For example, within a set of taxa
including fish, turtles, birds, and mammals, hair is a unique character, or autapomorphy,
of mammals.
Boltzmann distribution The probability distribution at equilibrium for the occupancy of
various states, each with a particular energy.
Cellular function The context of a protein; its interactions with other proteins in the
cell.
Chemotaxis The orientation of an organism in relation to the presence of a particular
chemical. The chemotactic response of E. coli, for example, depends on the ability to
modulate their flagellar motor in response to external stimuli.
Cholesterol An amphipathic lipid that is an essential structural component of the cell
membrane and outer layer of lipoproteins of blood plasma.
Clustering A process of grouping objects into classes of similar objects.
CluSTr A database that offers an automatic classification of SWISS-PROT and TrEMBL
proteins into groups of related sequences.
CORBA Common Object Request Broker Architecture. An open vendor-independent
architecture and infrastructure that computers use to work together over networks. It
uses the Interchange Interorb protocol for communication in the operation between
CORBA programs.
DBMS Database Management System. It is a computerized record-keeping system that
stores, maintains, and provides access to information. A database system involves four
major components: data, hardware, software, and users. The main advantage of using a
DBMS is that the formalism of the data model underlying the DBMS is imposed upon the
data set to yield a logical and structured organization. Given a fuzzy, real-world data set,
when a model’s formalism is imposed on that data set, the result is easier to manage, de-
fine, and manipulate. Different data models lead to different organizations. In general the
relational model is the most popular because it is the most abstract and the easiest to
apply to data while still being powerful.
Differentiation Process or state in multicellular organisms (although one can also envi-
sion differentiation in bacteria) in which a cell acquires or maintains its functional spe-
cialization. Differentiated cells exhibit specific cell-type features and frequently lose their
proliferative capacity.
Domains Protein domains are the separate and independent folding units of a protein.
In sequence analysis these are in most cases consecutive stretches of sequence carrying a
specific function, separated by small stretches of sequence with biased amino acid com-
position (low complexity regions). Enzymatic function can be better assigned if the dif-
ferent domains of the complete protein are considered.
Elementary mode Minimal set of enzymes that can operate at steady state with all ir-
reversible reactions proceeding in the appropriate direction.
Entrez A retrieval system for searching several linked databases (http://www.
ncbi.nlm.nih.gov/Entrez/).
Erythropoietin (EPO) A glycoprotein growth factor that regulates red cell production
and adapts the red cell mass to the oxygen needs of the tissues.
Eukaryote An organism formed by cells containing a nucleus that has one or several
chromosomes. Eukaryotic cells have a compartmentalized internal structure in which
different cellular functions are carried out in membrane-bounded organelles, such as
mitochondria, chloroplasts, endoplasmic reticulum, and Golgi apparatus. All multi-
cellular, and many single-cell, organisms are eukaryotes; bacteria are prokaryotes (cells
with no nucleus).
Expression array Method using DNA chips to simultaneously measure the mRNA ex-
pression levels of a large number of genes, usually all genes for a given organism.
External metabolites Metabolites that are buffered as they are connected to a reservoir.
Nutrients would be sources; waste products would be sinks.
Feedback Feedback occurs when the output of a process influences its own subsquent
states.
Formal language A formal language L over the alphabet A is a subset of A*, where *
denotes the star operator. Production systems are used to describe formal languages.
Gene network The molecular genetic system that controls the processes occurring in the
organism on the basis of hereditary information contained in its genome.
Genpept A database of translated protein-coding sequences derived from entries in the
GenBank nucleotide sequence data bank.
Glycolysis Primary energy metabolism in cytosol in which sugars are degraded and
ATP is produced.
290 Glossary
Growth, growth factors In microbiology the term ‘‘growth’’ is used to describe the pro-
cess by which a single-cell organism increases its size (cell volume). Often, cell growth is
coupled to cell division, in that cells double their size before undergoing mitosis. In con-
trast, in conjunction with mammalian biology, ‘‘cell growth’’ is used interchangeably with
cell proliferation (i.e., the process of increasing cell numbers and tissue mass by cell divi-
sion. ‘‘Growth factors’’ are natural, mostly proteinaceous molecules that bind with high
specificity to cellular targets and stimulate cell division. ‘‘Growth factors’’ are often used
interchangeably with ‘‘cytokines,’’ which comprise a large family of proteins that have
diverse effects on cells, including the stimulation of proliferation, migration, and differ-
entiation.
Homology From the Greek for ‘‘study of sameness.’’ In biology, ‘‘homology’’ refers to
similarities that are due to common ancestors having possessed the similar feature.
Homologies are the basis of inferences about the nested relationships among taxa and are
commonly used to motivate borrowing annotations in one biological context and apply-
ing them in another.
HSSP A database of Homology-derived Secondary Structure of Proteins.
IDL Interface Definition Language is the language for describing interfaces of CORBA
programs. For every CORBA implementation (binding), there is a precompiler to produce
client and server interfaces for a given document written in IDL.
Internal metabolites Metabolites participate only in reactions that are explicitly taken
into account in the pathway model. The formation of each internal metabolite has to be
exactly balanced by its consumption (steady-state assumption).
InterPro An integrated documentation resource for protein families, domains, and sites
(http://www.ebi.ac.uk/interpro/).
Irreversible reaction A reaction in which the rate of the forward reaction is so much
higher than the rate of the reversible reaction that the latter is relatively negligible.
IS An information system (IS) describes a coupling between a data storage system
and further data-processing applications. Such an IS can be characterized by its main
functions: data storage, information retrieval, data interconnection, and analysis of
information.
JAVA JAVA (TM) is a programming language designed for the development of com-
puter platform–independent software. To execute programmed applications in JAVA, an
interpreter (virtual machine) is required. JAVA programs are frequently used to imple-
ment Web pages.
JDBC The JDBC (TM) technology is an application programming interface that permits
access to any relational data source from the JAVA (TM) programming language. It pro-
vides cross-DBMS connectivity to a wide range of SQL databases.
Kinase An enzyme that catalyzes the transfer of a phosphate group from ATP or other
nucleoside triphosphate to a substrate.
Kullbach-Leibler distance Also known as relative entropy, this is a measure of the dis-
similarity between two probability distributions. The distance is 0 for identical dis-
tributions and increases as the distributions diverge.
291 Glossary
Markov chain A series of states in which the probability of a state depends on previous
states. In a zero-order Markov chain, the states are independent. In a first-order Markov
chain, the probability of the current state depends on the previous state. In a second-order
Markov chain the probability of the current state depends on the previous two states, and
so on.
Metric A quantitative measure of similarity or dissimilarity.
Molecular function The specific biochemical function of a protein: its catalytic, struc-
tural, or binding activities.
Negative feedback This occurs when the output of a process weakens its intensiveness.
Negative feedback can maintain automatic stability (homeostasis) of the regulated
parameters at the level required.
Operon A transcribed polycistronic unit (group of genes) with its associated regulatory
sites. An operon has to have at least two cotranscribed genes, as opposed to a transcrip-
tion unit, which can be a monocystronic unit. The definition used here implies that a gene
can belong only to a single operon but to several transcription units. Operons are often
found in prokaryotic genomes, and the genes within an operon are often functionally re-
lated. See Transcription unit.
OQL Object Query Language is a query language comparable with SQL that supports
the data model of the Object Database Management Group.
ORF The Open Reading Frame is a continuous region of DNA coding for a protein, or a
fraction of it, found in the genome. ORF is usually distinguished from a gene in that the
ORF is a predicted gene based on computer analyses.
Orthologous genes Two homologous genes in two different organisms that have
evolved from a common ancestor.
Orthology Homology of genes between lineages (contrast paralogy).
Palindromicity A measure of the similarity of a sequence element to its reverse com-
plement.
Paralogous genes Two homologous genes that diverged from a duplication event in the
same organism.
Paralogy Homology in which a gene duplication allows related proteins to evolve
independently within the same lineage (contrast orthology). Paralogues can be found in
the same individual. The orthologue/paralogue distinction is relevant when trying to
compare proteins across lineages.
PDB The Protein Data Bank is a repository for the processing and distribution of 3-D
macromolecular structure data primarily determined experimentally by X-ray crystallog-
raphy and NMR.
Pfam A collection of protein family sequence alignments that are constructed semi-
automatically, using hidden Markov models.
PHP PHP, which stands for ‘‘PHP: Hypertext Preprocessor,’’ is an HTML-embedded
scripting language. Much of its syntax is borrowed from C, JAVA, and Perl with some
unique PHP-specific features included. The goal of the language is to allow Web devel-
opers to write dynamically generated pages quickly.
292 Glossary
Phylogenetic profile A vector constructed for a given gene in a particular organism,
representing whether an orthologue to a particular protein is present or absent in each
additional genome sequence. It forms the basis for a computational method of predicting
protein function.
Positive feedback This occurs when the output of a process enhances its own activities.
Positive feedback leads to the system’s deviation from its stationary state.
PRINTS A compendium of protein fingerprints. A fingerprint is a group of conserved
motifs used to characterize a protein family.
ProDom A protein domain database that consists of an automatic compilation of ho-
mologous domains.
Production system A production system is defined by a finite set of production rules
and a finite alphabet A. Production rules are pairs of words over the alphabet A* that
define the derivation of the production system. A word w over A* will be derived by a
production rule (u, v) if the first component of the production rule (u), which will be a
subword of w, will be replaced by v. The rule is to be read as ‘‘rewrite u by v.’’
Prokaryote An organism, usually single-celled, formed by cells with no nucleus; it has a
simple internal organization lacking organelles.
PROSITE A database of biologically significant sites and patterns formulated in such a
way that, with appropriate computational tools, it can rapidly and reliably identify to
which known protein family, if any, the new sequence belongs.
Protease An enzyme that degrades proteins by hydrolyzing peptide bonds between
amino acid residues.
Protein fusion A protein containing two or more domains that appear separated in
other instances.
Protein kinase Enzyme that catalyzes phosphorylation of (transfers of a phosphate
group from ATP to) the hydroxyl groups of tyrosine, serine, and threonine residues of
proteins. Phosphorylation of proteins often regulates their enzymatic activity or their
affinity to other proteins. Signal transduction events typically consist of protein phos-
phorylation reactions in which protein kinases act both as substrates and as enzymes
whose kinase activity itself is induced by phosphorylation, thereby forming a cascade.
Proteome The complete set of proteins encoded by a genome.
QBE This nonprocedural language developed by IBM(TM) was designed for textual
querying and manipulating of relational DBS. QBE means ‘‘Query by Example’’ and is
implemented as an intuitive query construction using tables.
Regulatory motif (in DNA) A short conserved sequence element (usually 10–20 base-
pairs long) that is specifically recognized by a regulatory transcription factor.
Regulon A group of operons or genes controlled by one regulator. The initial definition
was the result of studies of the ArgR regulon in E. coli. It is common to find a relaxed
notion of a regulon as a group of operons or transcription units that are controlled by a
common regulator, independently of additional regulators affecting each operon or tran-
scription unit of the regulon differently.
Relative entropy Measures the difference between two probability distributions. Also
known as Kullbach-Leibler distance.
293 Glossary
Rosetta Stone protein A protein composed of two or more domains, each of which can
be found as an independent protein; used to find functional links between the indepen-
dent proteins.
RuleBase A database that stores and manages annotation rules derived from SWISS-
PROT and InterPro for the automatic annotation of TrEMBL.
Semi-Thue System A Semi-Thue system is a specific production system that is equiva-
lent to the Chomsky type-0 grammar.
Sequence search Comparison of a reading frame for significant (nonrandom) similarity
against any or some of the reading frames stored in a large database, using a sequence
similarity search algorithm.
Serial homology Repetitive structures of the same organism. The arms and legs of
tetrapods, mammalian cervical vertebrae, and the leaves and the branches of a tree are all
serial homologues. Crayfish have 19 pairs of appendages. These jointed appendages all
reflect the same basic morphological pattern but serve different functions, from chewing
to food handling to walking to mating. Serial homologies are not used to reconstruct
phylogenies, but they are relevant to understanding development.
Sigma factor Bacterial proteins that interact with RNA polymerase and dictate pro-
moter specificity.
SignalP A signal peptide prediction program.
Signal transduction pathway The process by which the information contained in an
extracellular physical or chemical signal (e.g., a hormone or growth factor) is received at
the cell by the activation of specific receptors, then conveyed across the plasma membrane
and along an intracellular chain of signaling molecules, to stimulate the appropriate cel-
lular response.
SPTR A comprehensive, nonredundant database composed of SWISS-PROT, TrEMBL,
and TrEMBLnew sequences.
SQL Structured Query Language is a nonprocedural language for interacting with a
relational DBMS. It allows the user to query, manipulate, and define data.
SRS Sequence Retrieval System is a specific system that incorporates tables from many
different biological databases.
Stiffness problem The problem of stiffness occurs in a simulation system where there
are very different scales of the time variable on which the dependent variables are
changing.
Structured substance-reactor model Framework for object—oriented cell simulation
used in the E-CELL system. It consists of three classes of objects, Substance, Reactor, and
System, representing molecular species, reactions, and functional/physical compart-
ments, respectively.
SWISS-PROT An annotated protein sequence database. It contains high-quality anno-
tation, is nonredundant, and is cross-referenced to many other databases.
Symplesiomorphy Ancestral (or primitive) character state that is shared by two or more
taxa. Shared ancestral character states are not helpful in grouping taxa when producing
the nested clades in a phylogenetic tree.
294 Glossary
Synapomorphy Derived character states (apomorphies) shared by two or more taxa
(i.e., the features have a common derivation). If the two groups share a character state
that is not the primitive one, it is plausible that they share a more recent common ancestor
than the one shared by the out-group (which defines the ancestral state). Synapomorphic
character states are used as evidence to group taxa into nested groups. Phylogenetic trees
are built by grouping taxa united by synapomorphies.
TMHMM A transmembrane prediction program.
Topology of a metabolic network This is a set of enzymes and metabolites, their con-
nections, and the stochiometry and directionality of the reactions.
Transcription factor Regulatory protein that binds specifically to short DNA sequences
(5–20 nucleotides) and interacts with RNA polymerase enzyme in order to modulate
transcription.
Transcription unit One or more genes that are cotranscribed. More precisely, we have
limited its use to one or more cotranscribed genes from a single promoter. The main dif-
ferences between a transcription unit and an operon as here defined are (1) operons must
have at least two genes, and (2) a gene can belong to one or more transcription units but
to only one operon. See Operon.
TrEMBL A computer-annotated supplement to SWISS-PROT. TrEMBL contains the
translations of all coding sequences (CDS) present in the EMBL Nucleotide Sequence
Database that are not yet integrated into SWISS-PROT.
XML Extensible Markup Language is a format for structured documents and data. It is
well defined by the World Wide Web Consortium (W3C) and has become a standard for
text-based data exchange.
295 Glossary

This page intentionally left blank

Corresponding Authors
Jeremy C. Ahouse
Millennium Pharmaceuticals, Inc.
Cambridge, Massachusetts
Rolf Apweiler
EMBL Outstation—European
Bioinformatics Institute Wellcome
Trust
Hinxton, Cambridge, UK
Julio Collado-Vides
Centro de Investigacion sobre
Fijacion de Nitrogeno, UNAM
Cuernavaca, Morelos, Mexico
Thomas Dandekar
Institute for Molecular Medicina
AG Biocomputing and Biological
Structures
Heidelberg, Germany
Ralf Hofestadt
Bioinformatics/Medical
Informatics
University of Bielefeld
Bielefeld, Germany
Sui Huang
Harvard Medical School
Surgery Research Laboratory
Children’s Hospital Medical
Center
Boston, Massachusetts
Nikolay A. Kolchanov
Institute of Cytology and
Genetics SB RAS
Novosibirsk, Russia
Abigail Manson McGuire
Department of Genetics
Harvard Medical School
Boston, Massachusetts
Edward M. Marcotte
Department of Chemistry and
Biochemistry
Institute of Cell and Molecular
Biology
University of Texas at Austin
Austin, Texas

Gary D. Stormo
Department of Genetics
Washington University School of
Medicine
St. Louis, Missouri
Masaru Tomita
Institute for Advanced
Biosciences
Keio University
Fujisawa, Japan
298 Corresponding Authors
Index
Acetolactate synthase, 263
Acetyl-CoA, 168, 252, 285
Activation, cassette-type, 172
Adaptation, 10–11
Affymetrix GeneChips, 142
Aldolase, 262
Algorithms
alignment, 229
elementary mode analysis, 256–257
MACAW, 136
for motif discovery, 135–140
for protein categories, 239
sequence alignment, 265
AlignACE, 129, 136–142
Alignment
algorithms, 229
of metabolic pathways, 259–263, 265
Amino acid production, 59
Amphiphilic molecules, 268
Ancestry, and homology, 6, 7
Anemia, hemolytic, 279–280
Annotation
five step approach, 24
of new genome (E. coli), 103–104
of pathways, in genomes, 263–267
pitfalls, 20–21
specific systems, 21–24
vocabulary, 33
Antigens, cell surface, 163
Apoptosis
and Boolean network, 197, 201–202
and cancer cells, 212
as cell state, 183
and Ras, 189
Archaea
glycolysis, 263
proteomes, 26, 34
Arginine biosynthesis, 133
Arrays. See Microarrays
Attraction, basins of
and cancer, 211
and cell state change, 201, 203, 204–205
description, 197, 199–200
Attractor states, 199–202, 203–205
and cancer, 210–212
pseudo, 208–209
B. burgdorferi, 266–267
B. subtilis, 121, 124
purine biosynthesis, 132
Bacteria. See also specific bacteria
chemotaxis, 280–281
DNA-binding regulators, 114
DNA regulatory motifs, 139–142
glycolysis, 262–263
operon prediction, 121–124
proteomes, 26–27, 34–35
transcriptional units, 116–117
Bacteriophage lamda, 282–283
Basic Local Alignment Search Tool
(BLAST), 223, 229
Bayes theorem, 89
Binding sites
predicting, 87
for transcription factors, 94, 98, 129
Biochemical analysis, 260–263
BioKleisli, 57–58
Biological noise, 208–209
Biomechanics, 6
Biopathways Consortium, 213
Biosynthesis
cholesterol, 167–169
heme, 162–163
modeling, 64
nucleotide, 263
purine, 132
Birds, wings, 4
BLAST. See Basic Local Alignment Search
Tool
Boltzmann equation, 88–89
Boolean networks
architecture, 194–196, 205–207
attractor states, 199–202, 203–205, 208–
209, 210–212
basins of attraction, 197, 199–200, 201,
203, 204–205
and cancer, 181, 189, 209–212
and cell states, 196–198, 200–209
directionality, 199
dynamics, 196–198
and expression profiles, 213
limitations, 212–213
on-off switching, 192–194
pleiotropy, 205–207
protein-gene interaction, 213
proteolysis, 195–196
state space, 197, 198–200, 203, 214
trajectories, 199–200, 202
unstable states, 198, 199, 203
updating, 199
BRENDA, 49, 57, 66, 252
Burns, 267
Butterflies, eyespots on, 3
C. acetobutylicum, 132
C. glutamicum, 263
Cadherins, 231
Caenorhabditis elegans
comparative analysis, 36–41
repeating domains, 40
Cancer, and Boolean networks, 181, 189,
209–212
Carbon dioxide transport, 279
Cassette-type activation, 172
Catalysts, 268
Celera Genomics, 76
Cell membrane
and cholesterol, 160
in simulated cell, 274, 278, 279
Cell(s)
construction of, 59
virtual, 277–280 (see also E-CELL)
Cell Signaling Networks Database, 213
Cell states. See also Differentiation; Signal
transduction pathways
in Boolean network, 196–198, 200–209
and cancer, 209–212
and context, 208–209
definitions, 182–183
and gene network hierarchy, 172–173
perturbations, 189–190, 201–209
robustness, 202
in rule-based model, 60
Cell surface antigens, 163
Chance, 6, 7, 8
Chemical kinetic simulation, 164–167
Chemotaxis, 280–282
Cholesterol, 155–156, 158–160
mathematical model, 167–169
Cleavage sites, predicting, 27
Clustering
as analysis approach, 27–32
coinheritance groups, 231
databases, 27–28
DNA regulatory motifs, 140
and expression profiling, 213
hierarchical, 29
on mRNA expression, 131
by regulatory region, 234
of related enzymes, 260
and transcription regulation, 116
Clusters of Orthologous Groups (COGs),
27–30, 260, 265
CluSTr, 27–32, 34
Co-A transferase, 133
Coinheritance groups, 228–231
Communication processes, 64–65. See also
Signal transduction pathways
Comparative analysis
and elementary modes, 257, 263
300 Index
on eukaryotic proteomes, 34–42
of genomes, 103–104, 232, 233
and RNAP binding, 110–117
Concentration rates, in models, 63, 65
velocities, 166–167
Congruence, 117–120
Conservation
of DNA regulatory motifs, 141
of genes in operons, 122–124
and phylogenetic space, 240
Context
and cell states, 208–209
and protein function, 223–224, 225, 226–
234, 239–240
Contingent events, 7
Convergence
and homology, 6, 7, 8
in signal transduction, 187–189
Cooperativity, 193
CORBA (Common Object Request Broker
Architecture), 74, 76
Database Management Systems (DBMS),
51–52
Database of Interacting Proteins (DIP), 238
Databases
biochemical, 49, 252, 261
classification, 29–32
for clustering, 27–28
vs. DBMS, 50–52
enzymes, 54
EST, 235
for functional groups, 134–135
gene network, 150
gene regulation, 54
genomic neighbors, 231
integrating, 54–58, 69–76
listing, 54
microarray, 235
pathways, 49, 54, 213–214, 238
promoters, 234
protein interactions, 238
quality control, 55
redundancy, 29–30
remote access, 73
Saccharomyces, 33
search algorithms, 28
sequence annotation, 20–25
sequences, 27–28, 49, 53, 54, 228, 264
transcription factors, 49
transcriptome experiments, 105
user queries, 30–32
Data merging, 55
Data Warehouse, 57
DBMS. See Database Management Systems
Differentiation
and Boolean network, 197, 200–202
as cell state, 182–183
gene network control, 160–163
induced, in culture, 190
vs. quiescence, 183
Digitalization. See Boolean Networks
Dihydroxyacetone kinase, 265
DIP. See Database of Interacting Proteins
Distal-less gene, 4, 10
Distance, intergenic
and coinheritance, 229
and functional relatedness, 116, 121, 122,
124, 132, 229, 233–234
in regulatory motif search, 139–140
in S. cerevisiae, 142
from start codon, 139–140
Distribution, hypergeometric, 139
DL-diaminopimelate, 263
DNA-binding proteins, 87–93, 98. See also
Weight matrices
DNA microarrays, 235
DNA regulatory motifs, 139
DNA replication factors, 241
DNA sequences
motif discovery within, 135–140
similarity, and homology, 5
Domain fusions, 225–228
Domains
annotation, 25, 34
C2H2-type zinc finger, 37–38, 40, 41
classification, 29
collagen triple helix repeat, 39
comparative distribution, 38
composition, 41
C-type lectin, 39
C4-type steroid receptor zinc finger, 39
EGF-like, 40, 41
fibronectin type III, 40
301 Index
Domains (cont.)
immunoglobulin, 40
LDL-receptor, 40–41
ligand-binding, of nuclear hormone
receptor, 39
major histocompatibility complex, 40
nonspecific, 34
repeated across sequence, 40
Rosetta Stone links, 225–228
Drosophila melanogaster
comparative analysis, 36–41
domain repetition, 40–41
Dyad-detector method, 112
E-CELL
cell models, 277–280
gene regulation model, 282–283
mitochondria model, 283–285
scope, 273–275
signal transduction model, 280–282
software, 59
EcoCyc, 238
Electroneutrality, 279
Elementary modes, 255–259, 263
EMBL. See European Molecular Biology
Laboratory
EMPATH, 257
Encephalopathy, mitochondrial, 285
Energy. See also Glycolysis
binding, 87–89, 90–93
and Boolean networks, 198–199
and enzyme types, 252
and mitochondria, 285
multicellular organisms, 181–182, 198–
199
Engrailed expression, 3, 10
Entner-Doudoroff pathway, 262
Entrez, 22–23, 231
Entropy, relative, 89, 93
Environmental modulation, 208–209
ENZYME database, 54, 252
Enzymes. See also specific enzymes
and cholesterol, 159–160, 168
databases, 54
defined, 60
elementary modes, 255–259, 263
heme biosynthesis, 162–163
hierarchies, 263
Michaelis-Menten kinetics, 193
modeling, 59, 66–67
nitrite reductase, 227
pH dependence, 279
types, 252–253
EPD. See Eukaryotic Promoter Database
Erythrocytes
as irreversible process, 160–163
models, 169–171, 278–280
and pyruvate kinase deficiency, 279–280
Erythroid progenitor cells, 154
Erythropoietin, 160, 170–171
Escherichia coli
acetate Co-A transferase, 133
acetate synthesis, 263
adaptation, and congruence, 118–119
chemotactic response, 280
coregulated genes, 112–113, 119–120
DNA regulatory motifs, 141
and domain fusion, 227
flux conditions, 259
gene conservation, 123
gene regulation simulation, 282
glycolysis, 262, 282
lactose, 182
metabolic model, 78
phosphorylation, 281
promoters, 107–116
purine biosynthesis, 132
transcription, 104, 113–114, 116–117
EST. See Expressed Sequence Tags
Eukaryotes
and operons, 133
phylogenetic diversity, 228
Eukaryotic Promoter Database (EPD), 54,
234
Eukaryotic proteomes
cluster data, 29
comparative analysis, 35–41
complete sets, 26–27
domain distribution, 38
phylogenetic classification, 27–28
RNA binding, 38
European Molecular Biology Laboratory
(EMBL), 49, 53, 54
E-values, 265
302 Index
Events, reaction vs. regulatory, 152–153,
155–156
Evolution. See also Phylogenetic profiles
and Boolean network, 205–207, 208
and transcription regulation, 105, 121,
124
ExPASy. See Expert Protein Analysis
System
Expectation-maximization (EM) method,
96
Expected values (E-values), 256
Expert Protein Analysis System (ExPASy),
54, 261
Expert systems, 59
Expressed Sequence Tags (EST), 235
Expression
basic elements, 282
of distal-less gene, 4, 10
E-CELL model, 282–283
mRNA, 130–131, 142–143, 235–236
profiling, 213
and promoter specificity, 87
and protein function, 234–237
from proteomes, 236–237
RegulonDB search, 117
Eye, homology, 8–9
Eyespots, of butterflies, 3
False positives, 106, 109, 111–112
Feedback
and Boolean network, 193
cholesterol, 158–160, 168–169
erythrocytes, 161, 162, 171
positive and negative, 172
Flight, 11
Flowers, petals of, 5
FlyBase, 33
Footprinting, 120, 135, 140
Fossils, Burgess shale, 7
Functional dynamics, 163–167
Function(s). See also Protein functions
and DNA motifs, 129
of network types, 156–163
relatedness, 133–135
and transcription regulation, 114
Fungal protein, 38
Fusion, domain, 225–228
Galactose utilization, 142
GATA1, 170–171
GATA1-p, 154, 158, 161, 162
GDB. See Genome Database
GenBank, 54, 228
GeneNet, 49, 150–158, 168
Gene Ontology (GO), 33, 34
Genes. See also Expression
coexpression, 112
context, 225, 226–234, 239–240
coregulated, 112–113, 119–120, 140–141
(see also Regulons)
distal-less, 4, 10
distance between, 116, 121, 122, 124, 132,
229, 233–234
functionally related, 133–135
homeobox, 10
homology, 8
within operons, 117–118, 121, 122–123
regulatory, 8
relative positions, 231–233
signaling, 184
transition-initiating, 207
Genomes. See also Proteomes
comparative analysis, 35
human, 35
pathway annotation, 263–267
and protein function, 225–234
protein networks in, 240–243
relative positions in, 231–233
signal transduction portion, 184
starting new, 103–104
Genome Database (GDB), 54
Gibbs’ sampling, 96–97, 112, 136
in AlignACE, 136–137
Gluconeogenesis, 267
Glucose, lactose, RNA-polymerase,
63–64
Glucose-6-phosphate, 60–61
Glycolysis
E. coli simulation, 282
elementary modes, 258–259
pathway alignment, 262–263
rule network, 67–68
in simulated cells, 278–279
G-protein coupled receptor, 38
Greedy algorithms, 95
303 Index
Growth and development, 160–163
Growth factors, 183–184, 189
Haemophilus influenzae, 116, 259
Heat shock response, 142
Hedgehog protein, 3
Helicobacter pylori, 262
Helix-turn-helix, 114, 121
Hemoglobin, 193, 279
Hemolysis, 279
Hemolytic anemia, 279–280
Hidden Markov Models (HMMs), 23
Homeobox genes, 10
Homeostasis, 158–160, 167–169
Homology
benefits, 11–12
definitions, 2–3, 5–6
at differing levels, 3–4, 9–10
and dissimilarity, 5
distal-less gene, 4, 10
DNA sequences, 5
gene expression patterns, 4
of gene vs. end product, 8–10
as hypothesis, 3, 6–8
limitations, 223–224
vs. paralogy, 6
of regulatory circuits, 1–2
serial, 5–6
and surrounding parts, 6
Homology-derived secondary structure of
proteins (HSSP), 27, 31
HTML. See HyperText Markup Language
Human genome, 35
Human Genome Project, 53
Human Genome Sciences, 76
HUSAR, 57
Hypergeometric distribution, 139
HyperText Markup Language (HTML), 53,
73
Immunoglobulin domain, 40
INCYTE Genomics, 77
Information fusion, 56, 74
Information system(s)
defined, 52
signal transduction as, 181–182, 186–188,
205–206
Informax, 77
Insect cuticle protein, 38
Internal congruence, 119
InterPro
and CluSTr, 34
for comparative analysis, 35, 37–41
controlled vocabulary, 33–34
description, 23
and domain composition, 41
and GO, 34
protein analysis, 27
user interface, 33
Jaccard coefficient, 239
JAVA, 73–75, 156
JDBC (Java DataBase Connectivity), 58,
73–74
KEGG. See Kyoto Encyclopedia of Genes
and Genomes
Key word recovery, 238–239
Kullbach-Liebler distance, 89, 93
Kyoto Encyclopedia of Genes and
Genomes (KEGG)
and database integration, 57
and DNA regulatory motifs, 141
and functional relationships, 238
interface, 53
and metabolic pathways, 49, 134–135,
252, 261
url, 54
Lactate dehydrogenase, 253
Lactic acidosis, 285
Lactose, 63–64, 182
LASSAP, 29
Leigh syndrome, 285
LexA, 111–112, 113
LIGAND database, 54
Limbs, 4, 5
Lion Bioscience, 77
Lipidation, 237
Lipids
biosynthesis, 266–267
metabolism, 155–156
Liver, 267
Low-density lipoproteins (LDLs)
304 Index
domain, 40–41
role, 160, 167–168
Lysine, 263
Lytic-lysogenic switch, 282–283
MACAW. See Multiple Alignment
Construction and Analysis Workbench
Major histocompatibility domain, 40
Mammals, 172–173
MAP (mitogen-activated protein) kinase,
185, 187, 193
cascades, 208
MAP score, 138
MARGBench. See Modeling and
Animation of Regulatory Gene
Networks
Markov models, hidden (HMMs), 23
Mating type, 142
Matrices. See Elementary modes; Weight
matrices
MEME. See Multiple EM for Motif
Elicitation
Metabolic flux space, 259
Metabolic networks
diagrams, 59
glucose-6-phosphate, 60–61
glycolysis pathway, 67–69
and homology, 223
MARGBench example, 56, 69–76
mathematical models, 58–59
Metab-Sim simulation, 58, 66–69, 71
in multicellular organisms, 182
rule-based modeling, 60–66, 76–79
simulators, 163–167
Metabolic pathways
alignment, 259–263, 265
boundaries, uncertain, 267
branched and interconnected, 252–253
catabolic and anabolic, 252
defined, 252–253
genome analysis, 263–267
identification
elementary modes, 255–259, 263
by synthesis, 255
and organism complexity, 268
Metabolism
comparative analysis, 41–42
proteome proportion, 41–42
Metabolites
identification, 257–258
in models, 60, 62–63, 65
MetabSim, 58, 66–69, 71
and MARGBench, 75–76
Methanococcus jannaschii, 263
Metrics, of protein function, 238
Mevalonate pathway, 159–160
MGD. See Mouse Genome Database
Michaelis-Menten kinetics, 66–67, 165, 167,
193
Microarrays, 235
Millipedes, 5
Minimal upstream regions, 116
MIPS. See Munich Information Centre for
Protein Sequences
Mitochondria, 283–285
Modeling and Animation of Regulatory
Gene Networks, 56, 69–75
application, 75–76
Models. See also Boolean networks;
Simulation
chemical-kinetic, 164–167
of cholesterol biosynthesis, 167–169
gene regulation, 65
mathematical, 150, 191–192
of metabolic pathways, 267–268 (see also
Metabolic pathways)
rule-based, 60–66
Modularity, 190–191
Molecular databases, 53–58
Morphogenesis, 160–163
Motifs
common, 112
discovery process, 129, 130
DNA-binding, 114
DNA regulatory, 135–140
overlapping, 112–113
palindromic, 140
RNA-binding, 38
Mouse Genome Database (MGD), 33
mRNA expression, 130–131, 142–143, 235–
236
Multiagents, 57
Multicellular organisms, 181–182, 209–
212
305 Index
Multiple Alignment Construction and
Analysis Workbench (MACAW), 136
Multiple EM for Motif Elicitation (MEME),
136
Munich Information Centre for Protein
Sequences (MIPS), 134–135, 142, 238
MURS. See Minimal Upstream Regions
Muscle development, 9
Mutations
and Boolean networks, 210–212
in simulated cell, 281
Myc, 189, 208
Mycobacterium tuberculosis, 244–245
Mycoplasma genitalium, 265, 277–280, 282
Mycoplasma hominis, 262
Mycoplasma pneumoniae, 264–265, 266
Myopathy, mitochondrial, 285
Nematodes, 38
Neostructuralists, 6
Network(s). See also Metabolic networks
cholesterol biosynthesis, 167–169
components, 172
congruence, 119
control, 152
defined, 49, 149
diversity, 163–164
elementary structures, 151
functional dynamics, 163–167
functional types, 156–158
gene regulation, 282
homeostasis-maintaining, 158–160
and irreversible processes, 160–163, 169–
171
lytic-lysogenic, 282–283
mammalian, 172–173
in multicellular organisms, 182
object oriented analysis, 151–158
organization, 150–151, 163, 172–173
protein interaction, 240–243
signal transduction, 188, 190–191 (see also
Boolean networks)
transcription initiation, 104, 106–117, 124
Nitrite reductase, 227
Noise, biological, 208–209
Nucleotides, 263, 278
Object-oriented systems, 59, 66
for gene networks, 151, 163, 164–167, 172
Object Query Language (OQL), 74
ODBC. See Open Database Connectivity
Oligonucleotides, 136
Open Database Connectivity (ODBC), 73
Open Reading Frame (ORF), 103–104, 139
Operator sites, 106–107
Operons
in bacteria, 121–124, 132, 141
in E. coli, 104, 116–117
in eukaryotes, 133, 231
and evolution, 122–124
genes within, 117–118, 121, 122–124
lac and ara, in E. coli, 282
and protein function, 231–233
and regulatory motifs, 141
OPM, 57
OQL. See Object Query Language
ORF, ORFs. See Open Reading Frame
Organisms, multicellular, 181–182, 209–
212
Organs, morphogenesis, 160–163
Orthologues, 38, 116. See also Clusters of
Orthologous Groups (COGs)
Osmosis, 279
Oxidation, 237
Oxygen transport, 279
Palindromes, 140
Paralogy, 6
Pathways. See also Signal transduction
pathways
databases, 54
liver antioxidant, 267
MAP kinase, 185, 187, 193
metabolic (see Metabolic pathways)
modeling, 65
novel, 244–245, 253
ribulose, 266
PDB. See Protein Data Bank
Pearson correlation, 140
PEDANT, 57
Pentose phosphate cycle, 258–259, 262,
278, 282
Peptides, signal, 27
306 Index
Petri nets, 59
pH, 279
Phosphofructokinase, 59, 262
Phospholipid biosynthesis, 274, 278
Phosphorylation
and Boolean networks, 195–196, 198–199
and external stimuli, 280–282
and metabolic pathway, 252
and protein modification, 237
Phylogenetic footprints, 120, 135, 140
Phylogenetic profiles, 115, 134, 228–231
Phylogenetic space, 240
PIR. See Protein Information Resource
P13K-Akt sequence, 185
Pleiotropy, 187–189, 205–207
Prediction
of cell regulative disorders, 214
of protein-binding sites, 106
of protein functions, 237–239
of regulatory network, 104, 106–117
of regulons, 130–135
of signal peptides, 27
Predictive value, 109
Profiling, gene expression, 213
Proliferation, 181
Proliferation, cellular, 197, 211–212
Promoters
and discretization, 194
in E. coli, 103, 107–117
predicting, 106–107, 109
and RNAP, 106–117
specificity, 87, 94, 98
PROSITE database, 22
Protease, sterol-regulated, 155, 160
Protein Data Bank (PDB), 31, 54
Protein functions
categories, 34, 41, 239–240
and expression, 234–237
and gene position, 231–233
measuring, 237–239
metrics, 238
molecular vs. cellular, 224
phylogenetic profiles, 228–231
Rosetta Stone approach, 225–227
structure-function relationship, 266
Protein fusion, 225–228
Protein-gene interactions, 114, 213
Protein Information Resource (PIR), 49, 54
Protein interaction networks, 241–243
Protein kinases, 37–38
Protein-protein interactions
in Boolean networks, 195–198, 199
and homology, 223–224
Proteins. See also Yeast
annotation, 20–25
chicken, 154
classification, 26–34, 41
constraint sharing, 225
DNA-binding, 87–89
eukaryotic (see Eukaryotic proteomes)
fungal transcription, 38
fusion, 225–228
Hedgehog, 3
human, 155
insect cuticle, 38
lengths, 36–37
master, 208
modifications, 237
multidomain, 41
Myc, 189, 208
Ras, 189, 208, 241
reading frames, 264
regulatory, 106, 189
rhodopsin-like, 38
RNA-binding, 38
secreted, 27, 37
species-unique, 38
SREBP, 155, 159–160, 168
synthesis simulation, 278
transition-causing, 208
transmembrane, 27, 37
Proteolysis, 195–196
Proteomes. See also Comparative analysis;
Eukaryotic proteomes
analysis, 25–33
annotation, 20–25
of bacteria, 26–27, 34–35
classification, 25–33
comparative analysis, 34–41
expression profiles, 236–237
functional analysis, 34, 41
sequencing history, 19–20
307 Index
ProtoMap database, 28
Pseudo attractors, 208–209
PSI-BLAST, 265
Purine biosynthesis, 132, 133
Purine metabolism, 59
Pyruvate kinase, 262, 279–280
Quality, of data, 55
Queries, 30–33, 55, 57–58. See also Searches
Ras, 189, 208, 241
Reaction events, 152, 155
Reading frames
protein- vs. RNA-coding, 264
reannotating, 265
Reannotation, 264–267
Receptors, 7-helix G-protein coupled, 38
Redox balance, 257–258
Redundancy
in databases, 29–30, 51–52
in signaling, 187
Regulation, in multicell organism, 182. See
also Feedback; Transcription factors
Regulatory circuits, 1–2, 172
Regulatory events, 152–153, 155–156
Regulatory genes, 8
Regulatory regions, 234
RegulonDB database, 54, 105, 110
expression regulation, 117
and protein gene regulation, 112
and transcriptional units, 104
Regulons
and Boolean networks, 207–208
defined, 132
prediction methods, 130–135
purine biosynthesis, 133
and transcriptional units, 116–117
Replication factors, 241
Reverse engineering, 213
RFC1-5, 241
Rhodopsin-like G-protein-coupled
receptor (GPCR), 38
Ribosylation, 237
Ribulose uptake pathway, 266
RNA-binding motif, 38
RNA-polymerase (RNAP), 63–64, 106–117
RNP-1, 38
Rosetta Stone method, 225–228
RuleBase, 22, 24, 25
Rule-based modeling, 60–66
Saccharomyces cerevisiae. See also Yeast
comparative analysis, 36–41
DNA regulatory motifs, 139–140, 142
mRNA expression, 131
repeated domains, 41
Saccharomyces Genome Database (SGD),
33
SAGE, 237
Searches, 30–33, 55, 57–58
RegulonDB, 117
SQL, 73, 75
SYSTER, 28
Semi-Thue system, 60
Sensitivity amplification, 193
Sequence Retrieval System (SRS), 57
Sequences. See also DNA sequences
alignment, 260
annotation, 20–25
binding specificity (see Specificity)
coding regions, 2
databases, 49
DNA, 5, 135–140
domain repetition, 40
P13K-Akt, 185
regulatory network, 104, 106–117
similarities, 229, 265
specific, 87
Serum, growth factors in, 183
Sigma factor, 106
SignalP, 27, 37
Signal transduction pathways
annotation, 185, 186, 188
basic concept, 184
as Boolean network, 204–209
cascades, 193, 204–205, 208
for chemotaxis, 280–282
conflicting signals, 203
and context, 208–209
convergence, 187
cooperativity, 193
erythrocytes, 160–162
308 Index
homology, 223
modularity, 190–191
perturbations, 189–190
simulation, 280–282
subcellular, 212–213
Similarities
explanations, 6–8
nonhomologous, 5
in phylogenetic profiles, 229
statistical significance, 28–29, 265
Simulation. See also Models
of cell (see E-CELL)
chemical kinetic, 164–167
E. coli chemotaxis, 281
essential data, 285–286
metabolic pathways, 268
of networks, 163–167
signal transduction, 191–192, 214
software for, 275–277
stiffness problem, 276
Simulators, 49–50, 58
Size, of proteins, 36–37
Sodium transport query, 30–32
Software, simulation, 275–277
Specificity
definition, 109
of DNA-binding protein
quantitative aspect, 87–89
weight matrix models, 89–97
RNAP transcription, 106–107, 110–117
to species, 263
Specificity score, 138–139
SPTR database, 26, 28
SQL. See Structured Query Language
SREBP proteins, 155, 159–160, 168
Stanford Microarray Database, 235
State space, 197, 198–200, 203, 214
Statistical analysis, 27, 31
Statistical significance
of similarities, 28–29
Sterol-regulated protease, 155–156, 160
Stiffness, 276
Structure-function relationships, 266
Structured Query Language (SQL), 73, 75
SWISS-PROT
annotation, 21–23, 24
and clustering, 28
and GO, 34
and protein functions, 238, 266
and proteome analysis, 26
controlled vocabulary, 33
database, 54
Synchronous congruence, 119
SYSTERS (SYSTEmatic Re-Searching), 28
T. pallidum, 266
Thermotoga maritima, 266
TIGR. (The Institute for Genomic
Research), 261, 264
TIM barrels, 266–267
Tissue dynamics, 210
Tissues, morphogenesis, 160–163
TMHMM, 27, 37
Transcriptional units (TUs)
in bacteria, 116–117
boundary genes, 116, 121, 122, 124
Transcription factors
binding sites, 94, 98, 129
and Boolean networks, 208, 213
and cholesterol, 155, 159
and cis-regulators, 213
of erythrocyte differentiation, 162
Gene-Net depiction, 154, 155
for purine biosynthesis, 132
site recognition, 234
Transcription regulation
activators vs. suppressors, 114–115
in bacteria, 114
evolutionary origin, 105, 121
false positives, 106, 109, 111–112
and gene function, 114
initiation, 104, 106
Transcription Regulatory Regions
Database (TRRD), 54
Transcriptomes, 2
TRANSFAC database, 54
Transition complexes, 193
Transmembrane proteins, 27
TRANSPATH, 49
TrEMBL
annotation, 21–23, 24
and clustering, 28
309 Index
controlled vocabulary, 33
and GO, 34
and proteome analysis, 26
TRRD. See Transcription Regulatory
Regions Database
Tus. See Transcriptional Units
Von Willebrand factor, 36
WD repeat, 38
Weight matrices
and DNA regulatory motifs, 139
of E. coli promoter, 107, 108–110, 113
expectation-maximization (EM), 96
Gibbs’ sampling, 96–97
greedy algorithms, 95
limitations, 110
network method, 97
in RegulonDB, 111
as specificity model, 90–93
Wings, 4, 5
WIT database, 54, 140–141, 231, 261
Yeast. See also Saccharomyces cerevisiae
and domain fusion, 227
in network, 241–242, 243
phylogenetic profile, 230
Yeast Protein Database (YPD), 135, 142
310 Index