gene-gene interactions in coronary artery disease
TRANSCRIPT
Gene-gene interaction in coronary artery disease
M D Musameh, W Y S Wang, C P Nelson,
C Lluís-Ganella, G Lucas, A J Balmforth, S G. Ball,
A S Hall, J Thompson, R Elosua,
M Tomaszewski, N J Samani
Department of Cardiovascular Sciences, University of Leicester, Leicester, UK

I have nothing to disclose.
Background
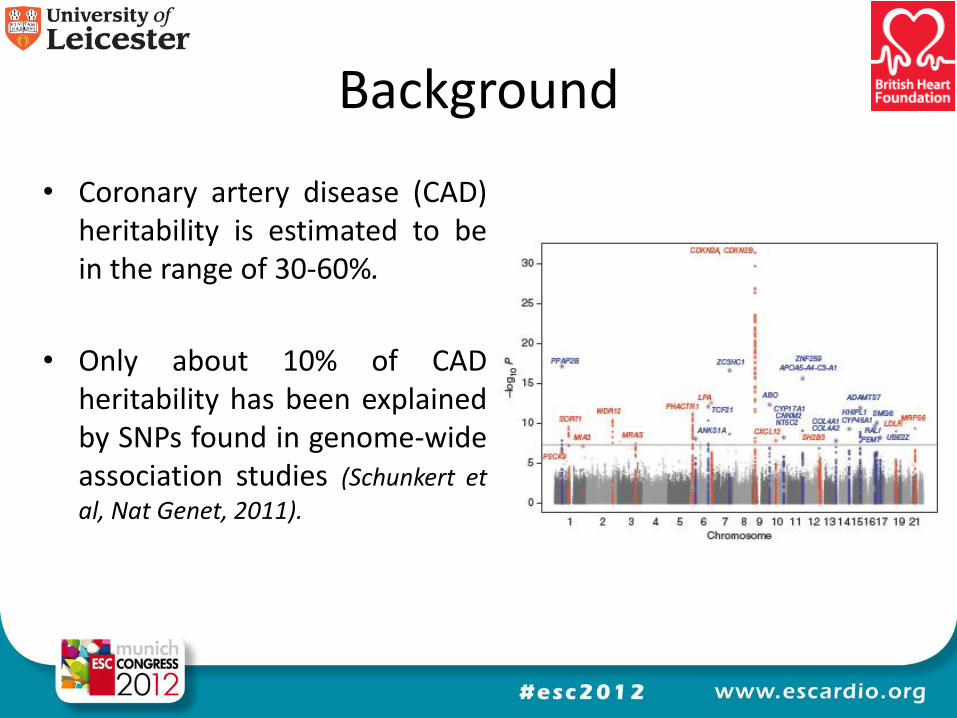
• Coronary artery disease (CAD) heritability is estimated to be in the range of 30-60%.
• Only about 10% of CAD heritability has been explained by SNPs found in genome-wide association studies (Schunkert et
al, Nat Genet, 2011).
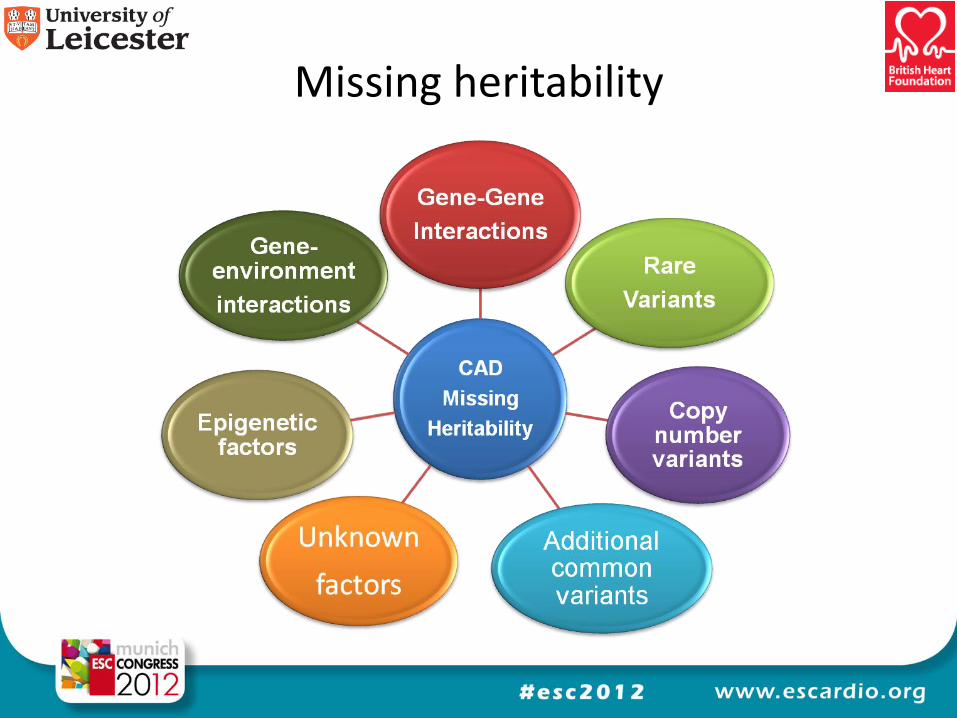
Missing heritability
Challenges in detecting gene-gene interactions
• SNP selection
• Multiple testing
• Model of interaction
• Interpretation
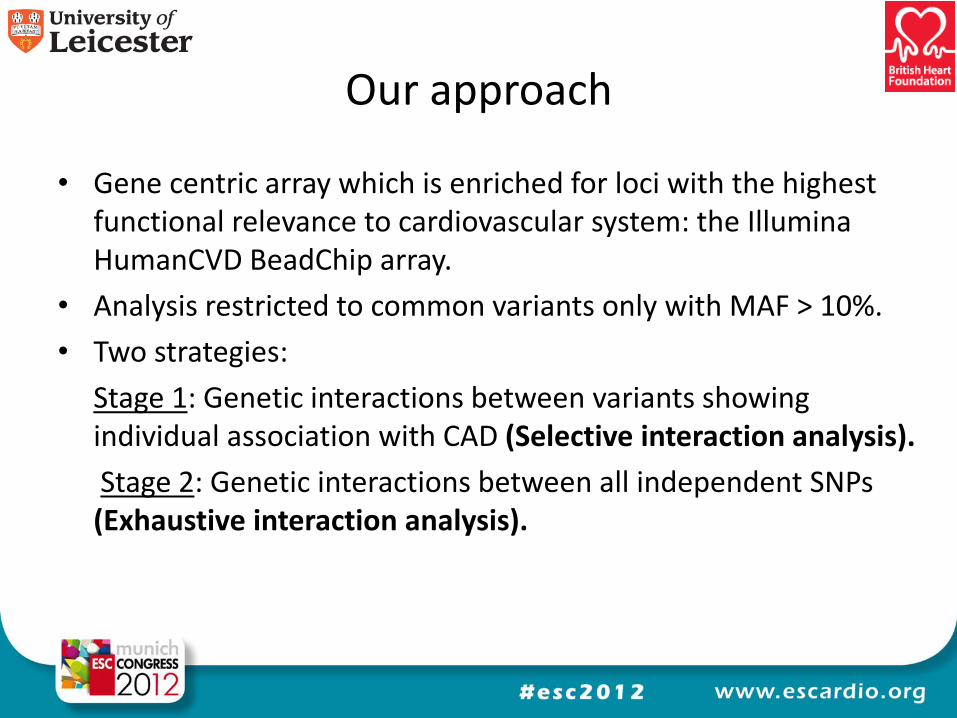
Our approach
• Gene centric array which is enriched for loci with the highest functional relevance to cardiovascular system: the Illumina HumanCVD BeadChip array.
• Analysis restricted to common variants only with MAF > 10%.
• Two strategies:
Stage 1: Genetic interactions between variants showing individual association with CAD (Selective interaction analysis).
Stage 2: Genetic interactions between all independent SNPs (Exhaustive interaction analysis).
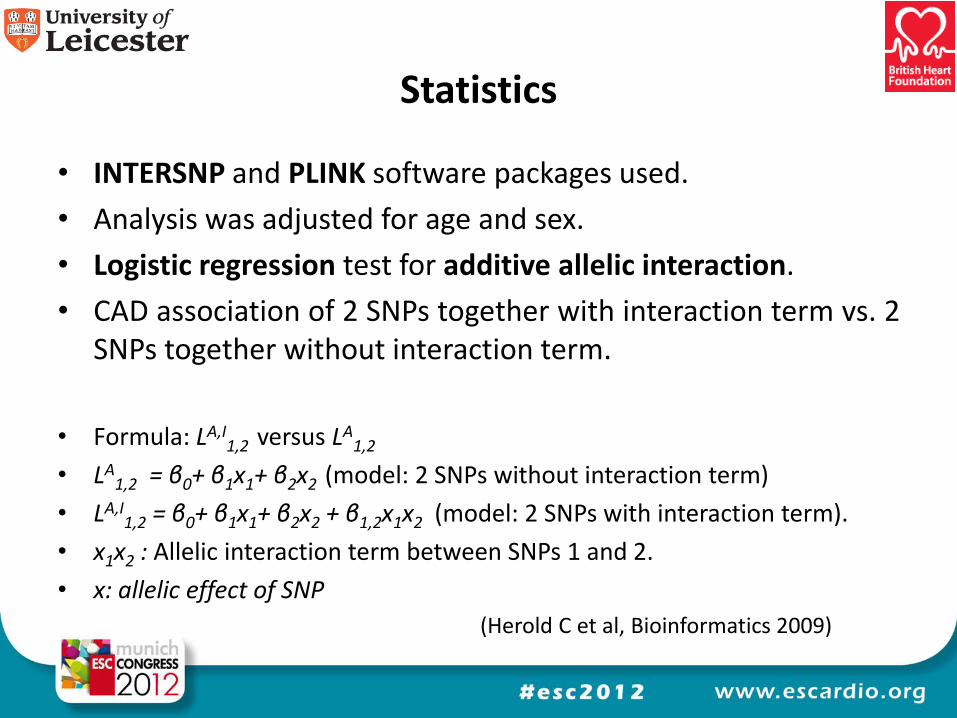
Statistics
• INTERSNP and PLINK software packages used.
• Analysis was adjusted for age and sex.
• Logistic regression test for additive allelic interaction.
• CAD association of 2 SNPs together with interaction term vs. 2 SNPs together without interaction term.
• Formula: LA,I
1,2 versus LA1,2
• LA1,2 = β0+ β1x1+ β2x2 (model: 2 SNPs without interaction term)
• LA,I1,2 = β0+ β1x1+ β2x2 + β1,2x1x2 (model: 2 SNPs with interaction term).
• x1x2 : Allelic interaction term between SNPs 1 and 2.
• x: allelic effect of SNP
(Herold C et al, Bioinformatics 2009)
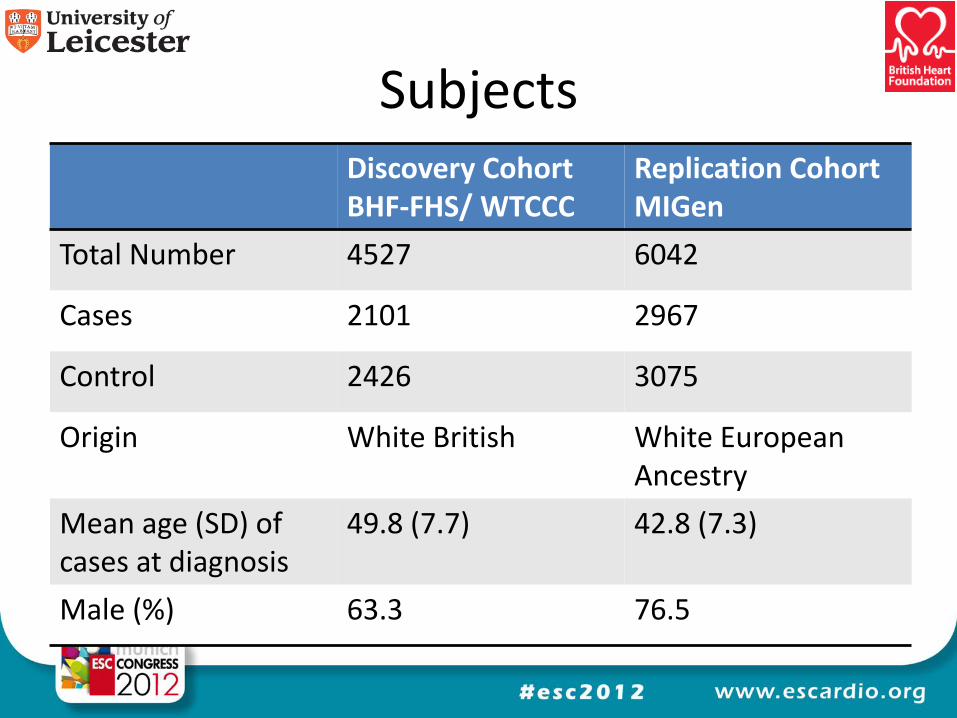
Subjects Discovery Cohort BHF-FHS/ WTCCC
Replication Cohort MIGen
Total Number 4527 6042
Cases 2101 2967
Control 2426 3075
Origin White British White European Ancestry
Mean age (SD) of cases at diagnosis
49.8 (7.7) 42.8 (7.3)
Male (%) 63.3 76.5
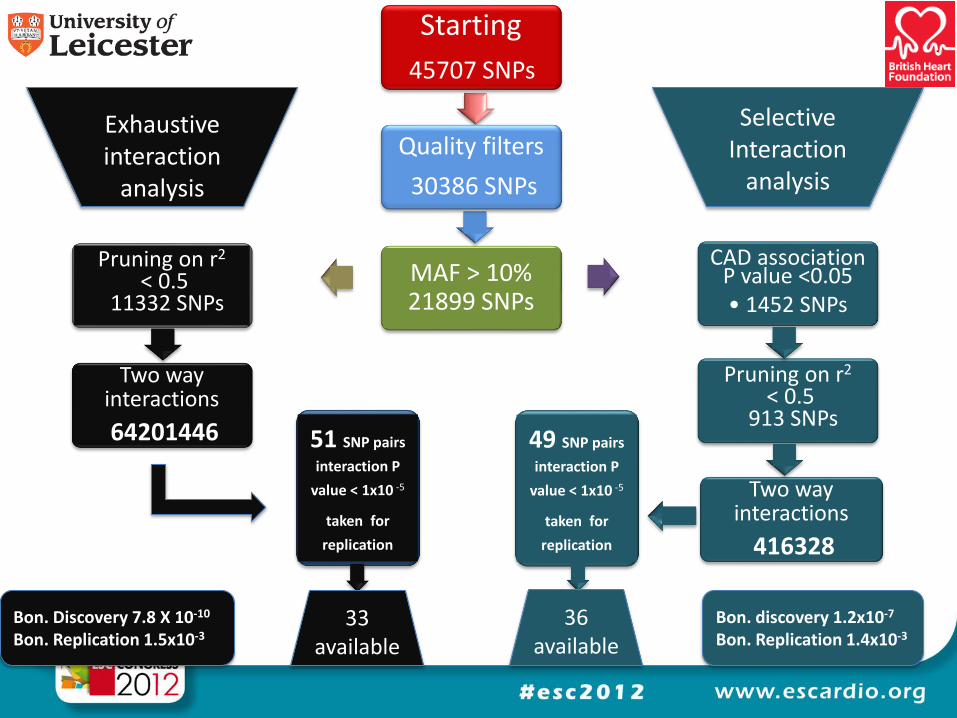
MAF > 10% 21899 SNPs
Starting
45707 SNPs
Quality filters
30386 SNPs
CAD association P value <0.05 • 1452 SNPs
Pruning on r2 < 0.5
11332 SNPs
Pruning on r2 < 0.5
913 SNPs
Two way interactions
64201446
Two way interactions
416328
Selective
Interaction analysis
Exhaustive interaction
analysis
49 SNP pairs
interaction P
value < 1x10 -5
taken for
replication
51 SNP pairs
interaction P
value < 1x10 -5
taken for
replication
36
available 33
available
Bon. discovery 1.2x10⁻⁷ Bon. Replication 1.4x10⁻³
Bon. Discovery 7.8 X 10⁻¹⁰ Bon. Replication 1.5x10⁻³
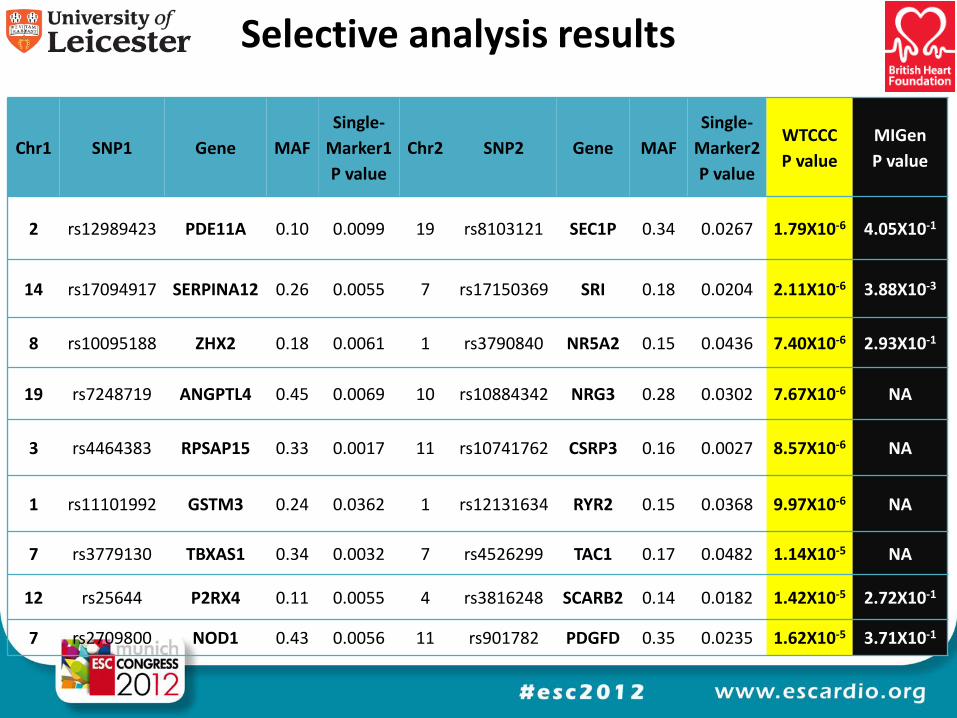
Selective analysis results
Chr1 SNP1 Gene MAF
Single-
Marker1
P value
Chr2 SNP2 Gene MAF
Single-
Marker2
P value
WTCCC
P value
MIGen
P value
2 rs12989423 PDE11A 0.10 0.0099 19 rs8103121 SEC1P 0.34 0.0267 1.79X10⁻⁶ 4.05X10⁻¹
14 rs17094917 SERPINA12 0.26 0.0055 7 rs17150369 SRI 0.18 0.0204 2.11X10⁻⁶ 3.88X10⁻³
8 rs10095188 ZHX2 0.18 0.0061 1 rs3790840 NR5A2 0.15 0.0436 7.40X10⁻⁶ 2.93X10⁻¹
19 rs7248719 ANGPTL4 0.45 0.0069 10 rs10884342 NRG3 0.28 0.0302 7.67X10⁻⁶ NA
3 rs4464383 RPSAP15 0.33 0.0017 11 rs10741762 CSRP3 0.16 0.0027 8.57X10⁻⁶ NA
1 rs11101992 GSTM3 0.24 0.0362 1 rs12131634 RYR2 0.15 0.0368 9.97X10⁻⁶ NA
7 rs3779130 TBXAS1 0.34 0.0032 7 rs4526299 TAC1 0.17 0.0482 1.14X10⁻⁵ NA
12 rs25644 P2RX4 0.11 0.0055 4 rs3816248 SCARB2 0.14 0.0182 1.42X10⁻⁵ 2.72X10⁻¹
7 rs2709800 NOD1 0.43 0.0056 11 rs901782 PDGFD 0.35 0.0235 1.62X10⁻⁵ 3.71X10⁻¹
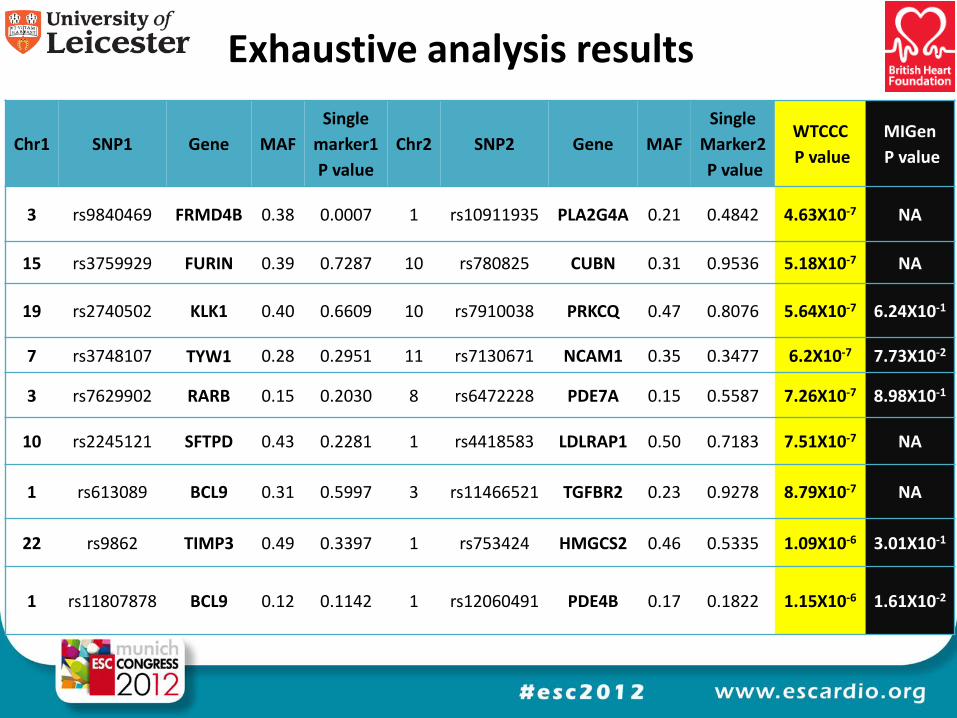
Exhaustive analysis results
Chr1 SNP1 Gene MAF
Single
marker1
P value
Chr2 SNP2 Gene MAF
Single
Marker2
P value
WTCCC
P value
MIGen
P value
3 rs9840469 FRMD4B 0.38 0.0007 1 rs10911935 PLA2G4A 0.21 0.4842 4.63X10⁻⁷ NA
15 rs3759929 FURIN 0.39 0.7287 10 rs780825 CUBN 0.31 0.9536 5.18X10⁻⁷ NA
19 rs2740502 KLK1 0.40 0.6609 10 rs7910038 PRKCQ 0.47 0.8076 5.64X10⁻⁷ 6.24X10⁻¹
7 rs3748107 TYW1 0.28 0.2951 11 rs7130671 NCAM1 0.35 0.3477 6.2X10⁻⁷ 7.73X10⁻²
3 rs7629902 RARB 0.15 0.2030 8 rs6472228 PDE7A 0.15 0.5587 7.26X10⁻⁷ 8.98X10⁻¹
10 rs2245121 SFTPD 0.43 0.2281 1 rs4418583 LDLRAP1 0.50 0.7183 7.51X10⁻⁷ NA
1 rs613089 BCL9 0.31 0.5997 3 rs11466521 TGFBR2 0.23 0.9278 8.79X10⁻⁷ NA
22 rs9862 TIMP3 0.49 0.3397 1 rs753424 HMGCS2 0.46 0.5335 1.09X10⁻⁶ 3.01X10⁻¹
1 rs11807878 BCL9 0.12 0.1142 1 rs12060491 PDE4B 0.17 0.1822 1.15X10⁻⁶ 1.61X10⁻²
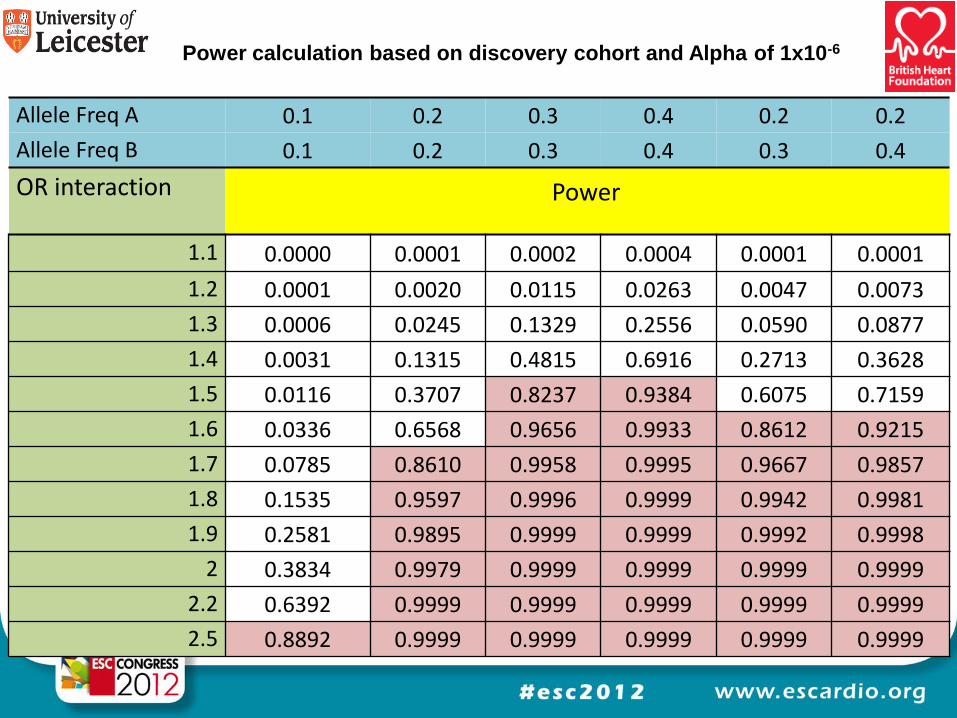
Power calculation based on discovery cohort and Alpha of 1x10⁻⁶
Allele Freq A 0.1 0.2 0.3 0.4 0.2 0.2
Allele Freq B 0.1 0.2 0.3 0.4 0.3 0.4
OR interaction Power
1.1 0.0000 0.0001 0.0002 0.0004 0.0001 0.0001
1.2 0.0001 0.0020 0.0115 0.0263 0.0047 0.0073
1.3 0.0006 0.0245 0.1329 0.2556 0.0590 0.0877
1.4 0.0031 0.1315 0.4815 0.6916 0.2713 0.3628
1.5 0.0116 0.3707 0.8237 0.9384 0.6075 0.7159
1.6 0.0336 0.6568 0.9656 0.9933 0.8612 0.9215
1.7 0.0785 0.8610 0.9958 0.9995 0.9667 0.9857
1.8 0.1535 0.9597 0.9996 0.9999 0.9942 0.9981
1.9 0.2581 0.9895 0.9999 0.9999 0.9992 0.9998
2 0.3834 0.9979 0.9999 0.9999 0.9999 0.9999
2.2 0.6392 0.9999 0.9999 0.9999 0.9999 0.9999
2.5 0.8892 0.9999 0.9999 0.9999 0.9999 0.9999
Conclusions
Our findings do not suggest that strong interactions between common SNPs in genes of cardiovascular
relevance contribute to CAD risk or explain a significant part of the missing heritability of CAD.
Future considerations
1. Using data from much larger cohorts.
2. Interactions between rarer variants and non gene based variants.
3. Locus based interaction analysis.
4. Prioritising loci within pathways for interaction analysis.
5. Better understanding of statistical versus biological meaning of interactions.

Acknowledgements
• The British Heart Foundation
• NIHR Leicester Cardiovascular Biomedical Research Unit
• WTCCC and BHF-FHS and MIGen contributors