gene ezell, ed.d., ches professor, hhp, univ. of tennessee/chattanooga
TRANSCRIPT

Gene Ezell, Ed.D., CHESProfessor, HHP, Univ. of Tennessee/Chattanooga
The Road to
Complete Streets
Quality of Life & Economic Impact
through Active Transportationin Chattanooga

Vision
Livability in TransportationFreedom of Choice
Sustainability

30%don’t drive
United States Census - USDOT

Americans Want Safe Alternatives

52% want to bike more
NHTSA - National Survey of Pedestrian and Bicyclist Attitudes and Behaviors

55%
would prefer to drive less and walk more
Surface Transportation Policy Project

How Do We Get
There From Here?

Policy
Practice
Research

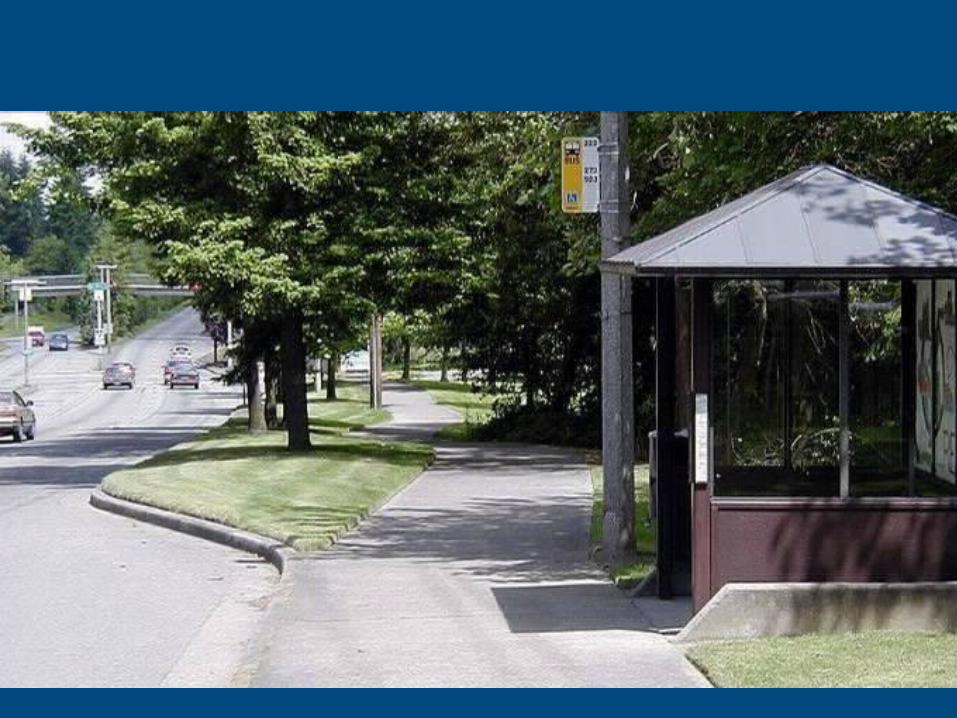
A Complete Street is safe, comfortable and convenient
for travel via automobile, foot, bicycle, and transit and
accommodates those of differing ages and abilities
Policy

The many types of Complete Streets


14

16


Benefits of Complete Streets
Promote healthy lifestyles

5%Shift in populationphysical activitybehavior
2010 Hamlton County Health Plan2004 HEALTHY EATING & PHYSICAL ACTIVITY:A COMMUNITY APPROACH

$11M
Savings in countyhealth care costs
2010 Hamlton County Health Plan2004 HEALTHY EATING & PHYSICAL ACTIVITY:A COMMUNITY APPROACH


Benefits of Complete Streets
Encourage walking and bicycling

Benefits of Complete Streets
Improve air quality

Benefits of Complete Streets
Better mobility

Benefits of Complete Streets
Economic revitalization


Practice
Provide a public bicycle share system within urban boundaries to improve air quality, public health, quality of life, and community connectivity
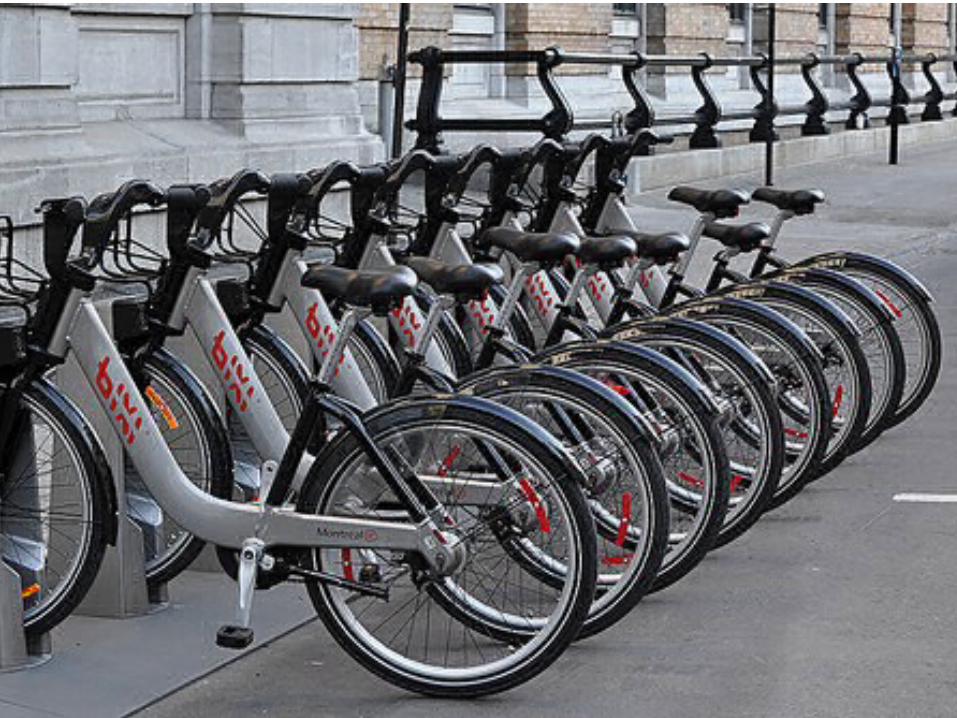


Launched Summer 2012
30 Stations / 300 Bicycles
On-board GPS System
Secondary Lock
7-speed Hub


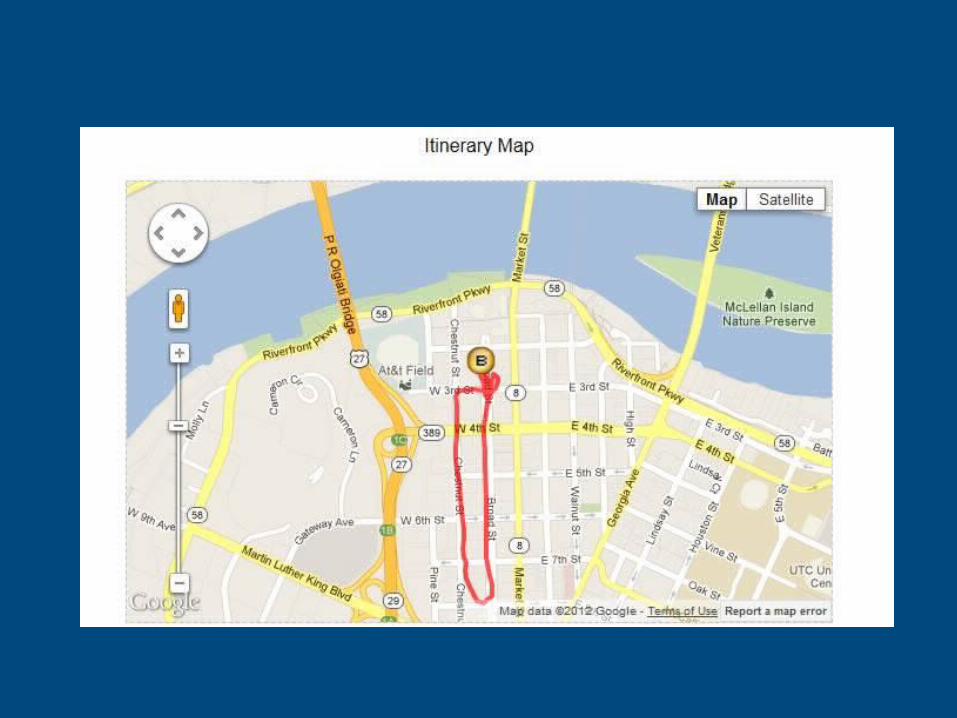
Station Locations


350+ Annual Members1,675+ Daily Users
0
500
1000
1500
2000
2500
24-hr Access Pass
Annual Members

Statistics July 23 – October 10, 2012
Total # of Trips: +7,000
Avg. # of Trips / Day: 88
Busiest Day: 298 tripsAvg. Trip Time: 25 minTotal Miles Traveled:
+7,000Total Travel Time: +210,000 min

Initial Impact
700,000 calories burned
Over 4,478 lbs of CO2 offset

2004 Greenway Collection ProjectCARTA Bike on Bus Data
2008-2011 Riverpark Data Collection Automated collection tools
2011-2012 Bike Share Survey
Research

Factors Affecting Bicycling Usage
at the University of Tennessee at Chattanooga: A Precursor Evaluation for Bike Share
Implementation
Research

Trends in Active Transportation
Pucher and Renne, 2003 Source: NHTS and NPTS

Health Impacts

Methods
Cross-sectional evaluation of current travel behavior
Screen-line cordon survey basedon National Bicycle and Pedestrian
Documentation Project
Random pedestrian intercept survey

Count and Survey
LocationsData will be collected at 7 locations that form a perimeter around the campus core:
Loc 1: E. 5th St. at the UC entrance
Loc 2: E. 5th St. at the UTC Bookstore
Loc 3: Palmetto at Vine St.
Loc 4: Palmetto at Oak St.
Loc 5: McCallie at Baldwin
Loc 6: Douglas at Oak
Loc 7: Douglas at Vine


Bicycle Counts
Identify bicycle traffic volumes
Behavior and demographic information
Create benchmark data

Pedestrian Intercept Survey
Demographic questions
Travel behavior questions
Health questions

Definitely Not
Probably not
Probably / Maybe
Yes, definitely
0 100 200 300 400 500 600 700 800
10.5%
15.2%
33.4%
40.5%
Fall 2011Spring 2012
If you had easy access to a bicycle and did not need to worry about theft or maintenance,
would you ride a bicycle more often?

Poor
Good
Very Good
Excellent
0 100 200 300 400 500 600 700 800
1.7%
32.7%
37.8%
26.8%
Fall 2011Spring 2012
Would you say that in general your health is:

How important do you think it is for the University to provide for walking, bicycling, and public transportation?
Not important at all
Somewhat important
Important
Extremely important
0 50 100 150 200 250 300 350 400 450 500
2.6%
14.7%
34.5%
48.2%
Fall 2011

What the Fall 2011/Spring 2012 Data Tell Us
• Using the Chi Square statistic, statistically significant relationships (p < 0.05) were found for the following relationships:
– Potential Users and Bike Confidence– Potential Users and General Health– Potential Users and Mode of Transportation Downtown

0
50
100
150
200
250
300
350
400
450
Bike Riding Confidence and Identification of Potential Users
YesNoMaybeDon't Know
Freq
uenc
y of
Res
pond
ents

Confident Somewhat confident Not confident at all DK/Not sure0
10
20
30
40
50
60
Bike Riding Confidence and Identification of Potential Users
Percent YesPercent NoPercent MaybePercent DK
Perc
ent o
f Res
pond
ents

Excellent Very Good Good Poor DK/Not Sure0
5
10
15
20
25
30
35
40
45General Health Reported by Potential Users
Percent YesPercent NoPercent MaybePercent DK
Perc
ent o
f Res
pond
ents

Bicycle Car Carpool Public Transport
Walk DK0
10
20
30
40
50
60
70
Mode of Transportation Downtown by Potential Users
Percent YesPercent NoPercent MaybePercent DK
Perc
ent o
f Res
pond
ents

I am a member Cost Less More Knowledge Friends/Family More stations No interest0
5
10
15
20
25
30
35
40
1.60
33.36
15.1317.48
11.75
20.68
Membership MotivationFall 2012
Perc
ent o
f Res
pond
ents
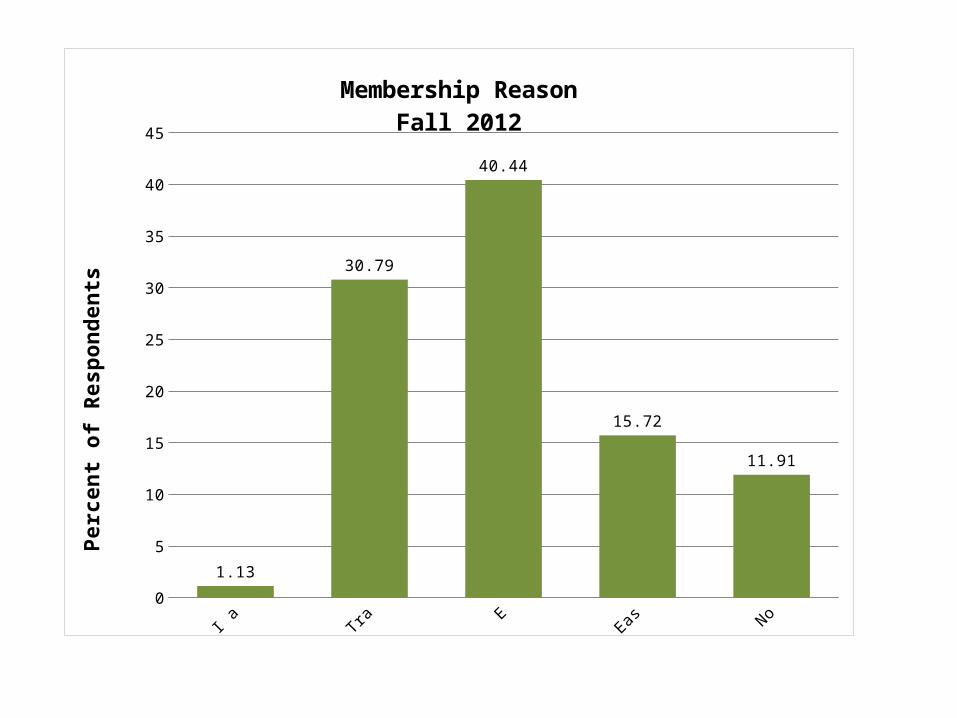
I am a member Transportation Exercise Ease of parking No interest0
5
10
15
20
25
30
35
40
45
1.13
30.79
40.44
15.72
11.91
Membership ReasonFall 2012
Perc
ent o
f Res
pond
ents

7%
92%
1%
Used Bike Chattanooga BikesFall 2012
YesNoNA

Yes27%
No73%
Knowledge of Student RateFall 2012

Yes32%
No68%
Access to a Working BikeFall 2012

Philip Pugliese, MBABicycle CoordinatorCity of Chattanooga
Stefanie deOlloqui, MS, MCHESAssociate DirectorActive Living & Transportation Network
Gene Ezell, Ed.D., CHESProfessor, HHP, Univ. of Tennessee/Chattanooga

ReferencesAlliance for Biking and Walking. (2010). Bicycling and walking in the United States: 2010 benchmarking report. Retrieved from http://www.peoplepoweredmovement.org/site/index.php/site/benchmarkingdownload/Alta Planning + Design. (2011). National bicycle and pedestrian documentation project. Retrieved from http://bikepeddocumentation.org/American Public Health Association. (2007). American Public Health Association policy statement 2007-9. Addressing the urgent threat of global climate change to public health and the environment. Washington, DC: American Public Health Association. Aultman-Hall, L. (1999). Bicycle cordon count pilot study. Lexington, KY: University
of Kentucky, Department of Civil Engineering and the Kentucky Transportation Center. Retrieved from http://www.chem.uky.edu/bikes/PDFs/UKBikecount.pdfBassett, D., Pucher, J., Buehler, R., Thompson, D., & Crouter, S. (2011). Active transportation and obesity in Europe, North America, and Australia. Institute of Transportation Engineers. ITE Journal, 81(8), 24-28.Chattanooga/Hamilton County Health Department. (2004). Healthy eating & physical activity: A community approach. Retrieved from http://hcstep1.org/docs/A%20Community%20Approach.pdfChattanooga/Hamilton County Health Department. (2010). Picture of our health – Hamilton County, Tennessee: 2010 community health data profile. Retrieved from http://rhc.hamiltontn.org/2010%20Health%20Plan.pdfChattanooga-Hamilton County Regional Planning Agency (CHCRPA). (2010). 2035 Long Range Transportation Plan. Retrieved from www.chcrpa.org

ReferencesCity of Toronto. (2010). 2010 Bicycle count report. Toronto, ON, Canada. Cycling
Infrastructure & Programs Transportation Services. Retrieved from http://www.toronto.ca/cycling/reports/pdf/bicycle_count_report_2010.pdf
Davidov, E. (2007). Explaining habits in a new context: The case of travel-mode choice. Rationality and Society, 19(3), 315 -334. doi:10.1177/1043463107077392DeMaio, P. (n.d). The Bike-sharing blog. Retrieved from http://bike-sharing.blogspot.com/DeMaio, P. (2009) Bike-sharing: History, impacts, models of provision, and future. Journal of Public Transportation, 12(4), 41-56.Dill, J., & Gliebe, J. (2008). Understanding and measuring bicycling behavior: A focus on travel time and route choice. Final report OTREC-RR-08-03. Retrieved from http://www.ibpi.usp.pdx.edu/media/OTREC_Dill_BikeGPS_Report.pdfFederal Highway Administration. (2000). Addendum to the 1997 federal highway cost allocation study final report, May 2000. Retrieved from http://www.fhwa.dot.gov/policy/hcas/addendum.htmForsyth, A., Krizek, K., & Agrawal, A. (2010). Measuring walking and cycling using the PABS (pedestrian and bicycling survey) approach: A low-cost survey method for local communities. Mineta Transportation Institute, San Jose State University.IPEDS Human Resources Submission. (2011). University of Tennessee at Chattanooga.
Retrieved from http://www.utc.edu/Administration/PlanningEvaluationAndInstitutionalResearch/documents/TotalEmployees2010.xls.pdf

ReferencesKrizek K J, Handy S L, & Forsyth A. (2009). Explaining changes in walking and bicycling behavior: challenges for transportation research. Environment and Planning B: Planning and Design 36(4) 725 – 740.Litman, T. (2010). Evaluating public transportation health benefits. Victoria Transport Policy Institute. Retrieved from http://apta.com/resources/reportsandpublications/Documents/
APTA_Health_Benefits_Litman.pdfOBIS. (2011). Optimizing bike sharing in European cities: A handbook. Retrieved from http://www.obisproject.com/palio/html.wmedia?_Instance=obis&_Connector=data&_ID=779&_CheckSum=1882085425Pucher, J., & Buehler, R. (2010). Walking and cycling for healthy cities. Built
Environment, 36(4), 391-414.Pucher, J., Buehler, R., Bassett, D., & Dannenberg, A. (2010). Walking and cycling to health: A comparative analysis of city, state, and international data. American Journal of Public Health, 100(10), 1986-92.Pucher, J., Dill, J., & Handy, S. (2010). Infrastructure, programs, and policies to increase bicycling: An international review. Preventive Medicine, 50, Supplement(0), S106-S125. doi:10.1016/j.ypmed.2009.07.028Rails-to-Trails Conservancy (2008). Active transportation for America: the case for increased federal investment in bicycling and walking. Retrieved from http://www.railstotrails.org/resources/documents/whatwedo/atfa/ATFA_20081020.pdfSchneider, R. (2011). Understanding sustainable transportation choices: Shifting routine automobile travel to walking and bicycling (Doctoral dissertation, University of

ReferencesCalifornia, Berkeley). ProQuest Dissertations and Theses, Retrieved from http://search.proquest.com/docview/893018748?accountid=14767Tennesse Department of Transportation (TDOT). 2010. Bicycle and Pedestrian Policy. Retrieved from http://www.tdot.state.tn.us/bikeped/pdfs/policy.pdfThe United Stated Conference of Mayors. (2008). U.S. Conference of Mayors climate protection agreement. Retrieved from http://www.usmayors.org/climateprotection/agreement.htmTitze, S., Stronegger, W., Janschitz, S., & Oja, P. (2007). Environmental, social and personal correlates of cycling for transportation in a student population. Journal of Physical Activity and Health, 4 (66-79).United Health Foundation. (2010). America’s health rankings. Retrieved from http://www.americashealthrankings.org/United States Department of Transportation (USDOT), Federal Highway Administration. (1999). Guidebook on methods to estimate non-motorized travel. Retrieved from
http://www.fhwa.dot.gov/publications/research/safety/pedbike/98166/index.cfmUnited States Department of Transportation (USDOT), Federal Highway Administration. (2001). 2001 national household transportation survey. Retrieved from http://nhts.ornl.gov/U.S. Department of Transportation (USDOT), Federal Highway Administration. (2005). SAFETEA-LU. Retrieved from http://www.fhwa.dot.gov/safetealu/U.S. Department of Transportation (USDOT), Federal Highway Administration. (2010). United States Department of Transportation policy statement on bicycle and pedestrian accommodation: Regulations and recommendations. Retrieved from http://www.fhwa.dot.gov/environment/bikeped/policy_accom.htm

ReferencesU.S. Department of Transportation(USDOT), Federal Highway Administration. (2011). Summary of travel trends: 2009 national household travel survey. Retrieved from http://nhts.ornl.gov/2009/pub/stt.pdfUniversity of Kentucky. (2009). Parking and transportation services annual report:
Fiscal year 2008-2009. Lexington, KY. University of Kentucky. Retrieved from http://www.uky.edu/pts/sites/www.uky.edu.pts/files/pdfs/
Annual_Report_08-09.pdfUniversity of Tennessee at Chattanooga. (2011). 2011 Climate Action Plan. Retrieved from http://www.utc.edu/Administration/StrategicPlan/Year3/
RecommendedActionsfromCAPWorkinRecomm.pdfWinters, M. (2011). Improving public health through active transportation: understanding the influence of the built environment on decisions to travel by bicycle (Doctoral dissertation). Retrieved from https://circle.ubc.ca/handle/2429/33377Winters, M., Davidson, G., Kao, D., & Teschke, K. (2011). Motivators and deterrents of
bicycling: comparing influences on decisions to ride. Transportation, 38(1), 153-168. doi:10.1007/s11116-010-9284-y