gene expression profiling differentiates germ cell tumors from other
TRANSCRIPT
Gene expression profiling differentiates germ celltumors from other cancers and definessubtype-specific signaturesDejan Juric*, Sanja Sale*, Robert A. Hromas†, Ron Yu*‡, Yan Wang*, George E. Duran*, Robert Tibshirani‡,Lawrence H. Einhorn§¶, and Branimir I. Sikic*�
*Oncology Division, Department of Medicine, and ‡Department of Health Research and Policy, Stanford University School of Medicine, Stanford, CA 94305;†Cancer Research and Treatment Center, University of New Mexico, Albuquerque, NM 87131; and §Department of Medicine, Indiana University School ofMedicine, Indianapolis, IN 46202
Contributed by Lawrence H. Einhorn, October 18, 2005
Germ cell tumors (GCTs) of the testis are the predominant canceramong young men. We analyzed gene expression profiles of 50GCTs of various subtypes, and we compared them with 443 othercommon malignant tumors of epithelial, mesenchymal, and lym-phoid origins. Significant differences in gene expression werefound among major histological subtypes of GCTs, and betweenthem and other malignancies. We identified 511 genes, belongingto several critical functional groups such as cell cycle progression,cell proliferation, and apoptosis, to be significantly differentiallyexpressed in GCTs compared with other tumor types. Sixty-fivegenes were sufficient for the construction of a GCT class predictorof high predictive accuracy (100% training set, 96% test set), whichmight be useful in the diagnosis of tumors of unknown primaryorigin. Previously described diagnostic and prognostic markerswere found to be expressed by the appropriate GCT subtype (AFP,POU5F1, POV1, CCND2, and KIT). Several additional differentiallyexpressed genes were identified in teratomas (EGR1 and MMP7),yolk sac tumors (PTPN13 and FN1), and seminomas (NR6A1, DPPA4,and IRX1). Dynamic computation of interaction networks andmapping to existing pathways knowledge databases revealed apotential role of EGR1 in p21-induced cell cycle arrest and intrinsicchemotherapy resistance of mature teratomas.
testicular cancer � unknown primary tumors � DNA microarrays � molecularinteraction networks
Human germ cell tumors (GCTs) are a diverse group ofneoplasms that most commonly arise in the gonads, particu-
larly in the testis. They account for up to 60% of all malignanciesdiagnosed in men between 20 and 40 years of age. Their incidence(6–11 per 100,000) has increased among Caucasians in recentdecades, with an annual increase of 3–6% (1).
The histopathological classification of GCTs has been contro-versial because of the different concepts of histogenesis of theseneoplasms, as well as the pluripotent nature of transformed pri-mordial germ cells. GCTs can mimic normal patterns of embryonicsegregation and differentiation, giving rise to structures resemblingembryonic (endoderm, mesoderm, ectoderm) and extra-embryonic(yolk sac, trophoblast) derivatives. On the basis of the presence ofthose elements, they are further divided into pure GCTs (semi-noma, embryonal carcinoma, teratoma, choriocarcinoma, and yolksac tumor) or mixed GCTs, if more than one element is present.
Compared with most cancers of adults, GCTs are highly sensitiveto chemotherapy (2). Even with metastases, 80% of GCT patientscan be cured by cisplatin-based combination chemotherapy, fol-lowed by secondary resection of residual tumor lesions, which cancontain necrotic cells, viable malignant cells, or mature teratoma.In contrast to the other histological subtypes, mature teratomasshow a less aggressive clinical behavior, but are unresponsive tochemotherapy. The biological bases for the chemosensitivity ofGCTs and the clinical behavior of mature teratomas are unclear (3).
In this study, we have performed a comparative analysis ofgenome-wide gene expression profiles of GCTs. In addition to theanalysis of different histological subtypes of GCTs, we sought toidentify molecular profiles that distinguished these tumors fromother human malignancies, and to further our knowledge aboutgenes involved in GCT development and progression, their inter-action partners, and their regulatory modules.
MethodsTumor Specimens. A total of 23 specimens (21 testicular and twomediastinal GCTs) were collected under Institutional ReviewBoard-approved guidelines from patients diagnosed with GCTswho underwent surgery at Indiana University Cancer Centerbetween 1998 and 2000. Three of these specimens were fromprimary tumors (one testicular, two mediastinal) and 20 were fromresidual tumor resections of metastases after chemotherapy fortesticular GCTs. Following their excision, samples were immedi-ately frozen in liquid nitrogen and stored at �80°C until use. Theseincluded 13 teratomas, 2 seminomas, 2 yolk sac tumors, 3 teratomaswith transformation into sarcoma, and 3 mixed tumors (teratomawith the elements of yolk sac tumor). Data from an additional 27GCTs from the public Stanford Microarray Database (SMD) (4),comprising 23 seminomas, 2 yolk sac tumors, and 2 embryonal cellcarcinomas, were reanalyzed together with the 23 new specimens,for a total of 50 GCTs. Finally, data from 443 other commonmalignant tumors in the SMD (71 prostate, 103 gastric, 17 pancre-atic, 38 renal, 82 liver, 41 soft tissue, 67 lung, and 24 lymphoma),were used for a comparative analysis of GCT vs. other malignancies(Table 2, which is published as supporting information on the PNASweb site).
Microarray Preparation. Total RNA was isolated by using TRIzol(Invitrogen) followed by mRNA purification using an OligotexMidi mRNA Isolation kit (Qiagen). Cy5-labeled cDNA, synthe-sized by using tumor sample mRNA as a template, and Cy3-labeledcommon reference cDNA, synthesized by using a pool of mRNAsderived from a panel of 11 cell lines (5), were hybridized to cDNAmicroarrays printed at the Stanford Functional Genomics Facility,consisting of 42,174 elements representing 25,672 unique UniGenecluster IDs. Microarrays were scanned with GenePix 4000 (AxonInstruments), and raw data were archived in the SMD.
Conflict of interest statement: No conflicts declared.
Abbreviations: GCT, germ cell tumor; PAM, Prediction Analysis of Microarrays; SAM,Significance Analysis of Microarrays; SMD, Stanford Microarray Database.
¶To whom correspondence may be addressed. E-mail: [email protected].
�To whom correspondence may be addressed at: Division of Oncology, Department ofMedicine, Stanford University School of Medicine, CCSR 1120, 269 Campus Drive, Stanford,CA 94305-5151. E-mail: [email protected].
© 2005 by The National Academy of Sciences of the USA
www.pnas.org�cgi�doi�10.1073�pnas.0509082102 PNAS � December 6, 2005 � vol. 102 � no. 49 � 17763–17768
MED
ICA
LSC
IEN
CES
Data Filtering and Transformation. Nonflagged elements with signal-to-noise ratio of at least 1.2 in both channels were included insubsequent analysis. The same criteria were used for the retrievalof the raw data from the already published data sets available inSMD. Data normalization was performed essentially as describedin ref. 6, with some modifications. Global intensity normalized datafor each array were renormalized by fitting a LOWESS curve to thedata points corresponding to the housekeeping gene set consistingof 269 clones (Table 3, which is published as supporting informationon the PNAS web site). These clones were selected from the single115-array set representing 35 normal human tissues (7). Localintensity-based normalization was applied first to each of thesearrays. After dividing the average fluorescence range into 30segments, a maximum of 10 housekeeping genes with the smallestvariance were chosen from each segment by computing the meanand its 95% confidence interval, and selecting only those genes forwhich the confidence interval encompasses zero. The normalizeddata matrix was further mean centered by columns and rows, andclones with at least 80% good data across all of the samples wereselected for further analysis. This selection resulted in 11,921 clones,used in subsequent comparisons.
Unsupervised and Supervised Analysis. Unsupervised hierarchicalclustering was performed in CLUSTER and visualized in TREEVIEW(8). Multidimensional scaling was done in MATLAB (The Math-Works, Natick, MA). Two statistical software packages, Signifi-cance Analysis of Microarrays (SAM) (9), and Prediction Analysisof Microarrays (PAM) (10), were used for the supervised dataanalysis.
Interaction Networks and Functional Analysis. These data weregenerated through the use of Ingenuity Pathways Analysis, aweb-delivered application that enables discovery, visualization, andexploration of biological interaction networks. Detailed informa-tion about this analysis software can be found at www.ingenuity-.com. Gene ontology analysis was also executed by using IngenuityPathways Analysis tools, and significance for the enrichment of thegenes with particular biological function was determined by right-tailed Fisher’s exact test with � � 0.05 and the whole database asa reference set. Functional information and virtual tissue Northernblot data, representing the mRNA expression of the gene throughrelative frequencies of ESTs from cDNA libraries from varioustissues, were also obtained from SOURCE (11).
Real-Time RT-PCR. Expression of MMP7, EGR1, AFP, FN1,POU5F1, IRX1, and NR6A1 were confirmed in 12 specimens forwhich sufficient amount and quality of RNA was available, by usingthe Applied Biosystems Prism 7900HT Sequence Detection Systemand SYBR Green PCR Master Mix according to manufacturer’sinstructions. For primer sequences and reaction conditions see Fig.4, which is published as supporting information on the PNASweb site.
Results and DiscussionGCT Class Predictors. DNA microarrays are widely used to studygene expression signatures of human neoplasms. However, suchstudies are typically organ-specific and do not address variationsbetween different types of tumors. Here we present an integratedgene expression analysis of 50 GCTs and 443 other malignanttumors, corresponding to eight additional common tumor types.Several recent large-scale microarray meta-analyses have demon-strated the robustness of critical gene expression patterns (12, 13).The fact that all analyzed arrays in this study were produced by theStanford Functional Genomics Facility, and hybridized accordingto the same experimental protocol using essentially the samecommon reference RNA, further supports the feasibility of ourapproach.
Using two-class, unpaired SAM, we have identified 683 clones as
being differentially expressed in GCTs as compared with the eightother tumor types (304 overexpressed and 379 underexpressed),when a 2-fold change cutoff and minimal false discovery rate(median number of falsely discovered genes �1) are selected (thecomplete list is available as Table 4, which is published as supportinginformation on the PNAS web site). To determine the biologicalrelevance of the identified genes, and to provide a framework forthe prioritization of numerous molecular alterations evident inGCT transcriptome, we have systematically explored the functionsof these 683 clones, mapped to 511 unique UniGene Cluster IDs,by using the gene ontology analysis feature of the Ingenuity PathwayAnalysis tools. The most dominant cellular functions in the analyzedgene list are cell cycle progression (42 genes, P � 0.008), cellproliferation (66 genes, P � 0.019), and cell death (73 genes,P � 0.008).
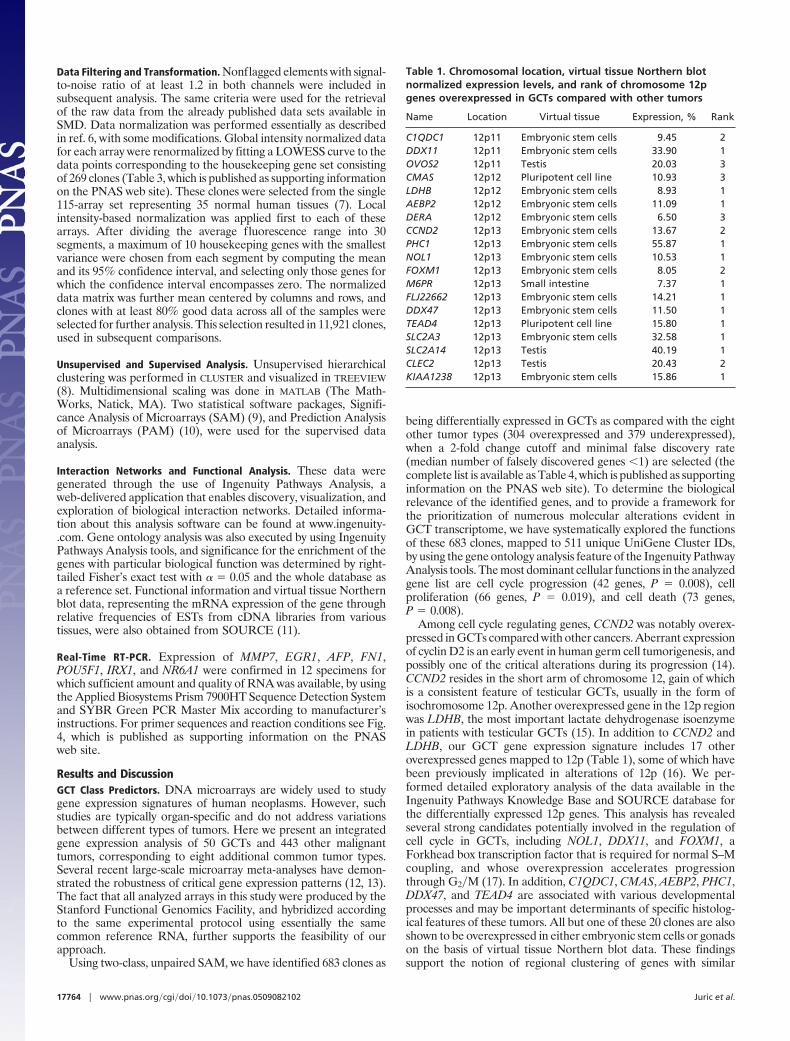
Among cell cycle regulating genes, CCND2 was notably overex-pressed in GCTs compared with other cancers. Aberrant expressionof cyclin D2 is an early event in human germ cell tumorigenesis, andpossibly one of the critical alterations during its progression (14).CCND2 resides in the short arm of chromosome 12, gain of whichis a consistent feature of testicular GCTs, usually in the form ofisochromosome 12p. Another overexpressed gene in the 12p regionwas LDHB, the most important lactate dehydrogenase isoenzymein patients with testicular GCTs (15). In addition to CCND2 andLDHB, our GCT gene expression signature includes 17 otheroverexpressed genes mapped to 12p (Table 1), some of which havebeen previously implicated in alterations of 12p (16). We per-formed detailed exploratory analysis of the data available in theIngenuity Pathways Knowledge Base and SOURCE database forthe differentially expressed 12p genes. This analysis has revealedseveral strong candidates potentially involved in the regulation ofcell cycle in GCTs, including NOL1, DDX11, and FOXM1, aForkhead box transcription factor that is required for normal S–Mcoupling, and whose overexpression accelerates progressionthrough G2�M (17). In addition, C1QDC1, CMAS, AEBP2, PHC1,DDX47, and TEAD4 are associated with various developmentalprocesses and may be important determinants of specific histolog-ical features of these tumors. All but one of these 20 clones are alsoshown to be overexpressed in either embryonic stem cells or gonadson the basis of virtual tissue Northern blot data. These findingssupport the notion of regional clustering of genes with similar
Table 1. Chromosomal location, virtual tissue Northern blotnormalized expression levels, and rank of chromosome 12pgenes overexpressed in GCTs compared with other tumors
Name Location Virtual tissue Expression, % Rank
C1QDC1 12p11 Embryonic stem cells 9.45 2DDX11 12p11 Embryonic stem cells 33.90 1OVOS2 12p11 Testis 20.03 3CMAS 12p12 Pluripotent cell line 10.93 3LDHB 12p12 Embryonic stem cells 8.93 1AEBP2 12p12 Embryonic stem cells 11.09 1DERA 12p12 Embryonic stem cells 6.50 3CCND2 12p13 Embryonic stem cells 13.67 2PHC1 12p13 Embryonic stem cells 55.87 1NOL1 12p13 Embryonic stem cells 10.53 1FOXM1 12p13 Embryonic stem cells 8.05 2M6PR 12p13 Small intestine 7.37 1FLJ22662 12p13 Embryonic stem cells 14.21 1DDX47 12p13 Embryonic stem cells 11.50 1TEAD4 12p13 Pluripotent cell line 15.80 1SLC2A3 12p13 Embryonic stem cells 32.58 1SLC2A14 12p13 Testis 40.19 1CLEC2 12p13 Testis 20.43 2KIAA1238 12p13 Embryonic stem cells 15.86 1
17764 � www.pnas.org�cgi�doi�10.1073�pnas.0509082102 Juric et al.
functions in the human genome, and they suggest that numericaland structural alterations of chromosomes contribute to tumorbehavior not just by affecting the expression of a few key oncogenesand tumor suppressor genes, but also by altering the expressionlevels of multiple co-localized genes, some of which may act in asynergistic fashion. Similar effects are widespread in the genomesof other tumor types and can be exemplified by coamplification andcoexpression of multiple genes involved in the ERBB2 amplicon inbreast cancers (18).
Gene expression changes of multiple other genes (MYCN, KIT,MYBL2, AFP) among the GCTs are consistent with previouslypublished reports (19) and support the biological relevance of thegene expression signature that we have ascertained. Newly identi-fied associations involve genes regulating various cellular functions,of which global transcription factors and DNA-modifying enzymes(MCM5, MCM6, RECQL4, DNMT3A, RIF1) deserve particularattention.
We further explored the differential gene expression of GCTsrelative to a group of eight other tumor types, by using the nearestshrunken centroid classifier implemented in the PAM package(10). This analysis was motivated by the clinical importance of GCTin the differential diagnosis of unknown primary cancers (UPC).UPCs are biopsy-proved malignancies for which the anatomicorigin remains unidentified after history, physical examination, andstandard laboratory studies. The reported incidence of UPC ranges
from 2% to 5% of all patients who are diagnosed with cancer (20).Males with the extragonadal germ cell syndrome represent a highlytreatable subset of UPC, and development of molecular markers forthe identification of that subset is an important ongoing effort.
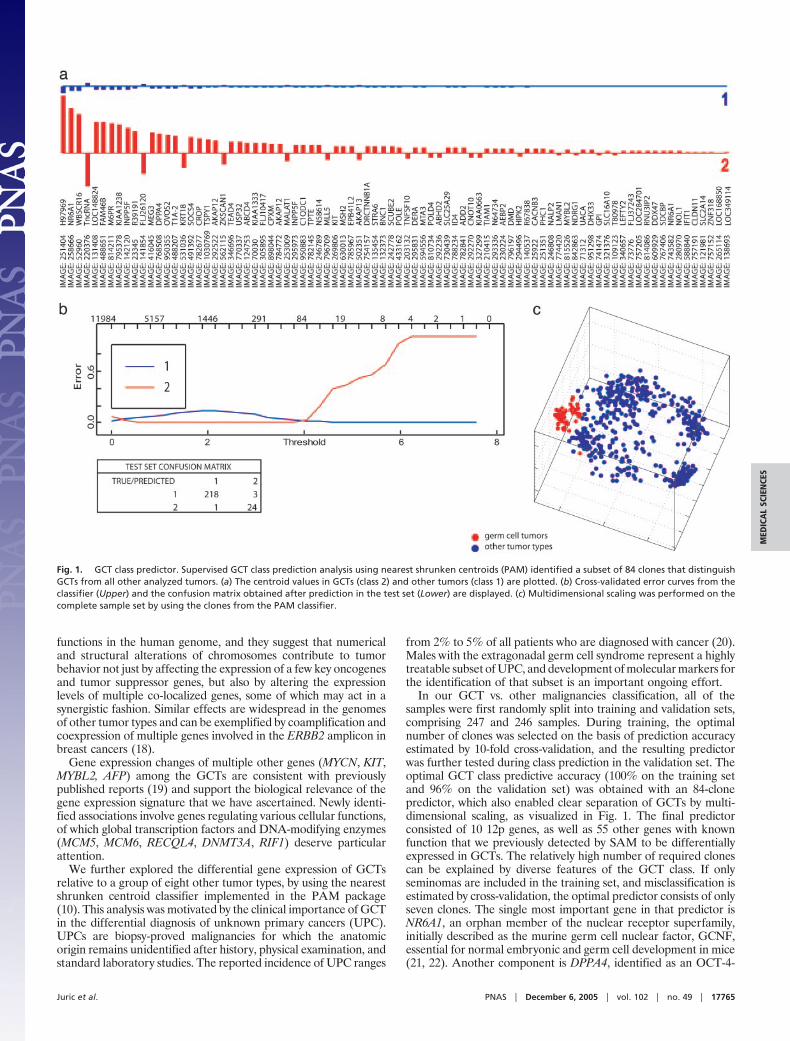
In our GCT vs. other malignancies classification, all of thesamples were first randomly split into training and validation sets,comprising 247 and 246 samples. During training, the optimalnumber of clones was selected on the basis of prediction accuracyestimated by 10-fold cross-validation, and the resulting predictorwas further tested during class prediction in the validation set. Theoptimal GCT class predictive accuracy (100% on the training setand 96% on the validation set) was obtained with an 84-clonepredictor, which also enabled clear separation of GCTs by multi-dimensional scaling, as visualized in Fig. 1. The final predictorconsisted of 10 12p genes, as well as 55 other genes with knownfunction that we previously detected by SAM to be differentiallyexpressed in GCTs. The relatively high number of required clonescan be explained by diverse features of the GCT class. If onlyseminomas are included in the training set, and misclassification isestimated by cross-validation, the optimal predictor consists of onlyseven clones. The single most important gene in that predictor isNR6A1, an orphan member of the nuclear receptor superfamily,initially described as the murine germ cell nuclear factor, GCNF,essential for normal embryonic and germ cell development in mice(21, 22). Another component is DPPA4, identified as an OCT-4-
Fig. 1. GCT class predictor. Supervised GCT class prediction analysis using nearest shrunken centroids (PAM) identified a subset of 84 clones that distinguishGCTs from all other analyzed tumors. (a) The centroid values in GCTs (class 2) and other tumors (class 1) are plotted. (b) Cross-validated error curves from theclassifier (Upper) and the confusion matrix obtained after prediction in the test set (Lower) are displayed. (c) Multidimensional scaling was performed on thecomplete sample set by using the clones from the PAM classifier.
Juric et al. PNAS � December 6, 2005 � vol. 102 � no. 49 � 17765
MED
ICA
LSC
IEN
CES
related gene necessary for the establishment of developmentalpluripotency in mouse embryos (23). Although limited data existabout the functional properties of these genes, their germ cellrestricted expression pattern, as well as particularly high scores inthe identified predictors, warrant the performance of additionalvalidation studies of these potentially useful diagnostic markers.
Gene Expression Signatures of Histological Subtypes of GCT. Al-though germ cell tumors represent a unique pathological andclinical entity with a common cell of origin, they vary in theirphenotypic characteristics and are further subdivided into severalsubtypes based on the line of differentiation of the transformedprimordial germ cell. Gene expression profiling approaches havealready been applied to the study of underlying transcriptomicalterations in GCTs. However, these studies were mainly performedon a limited number of samples, with only one GCT subtypedominating the whole data set (24, 25). In contrast, our analysis wasperformed on a dataset with a balanced number of seminomas andnonseminomas, which enables more accurate determination ofdifferentially expressed genes across these two groups.
Pearson correlation-based hierarchical clustering of 5,808
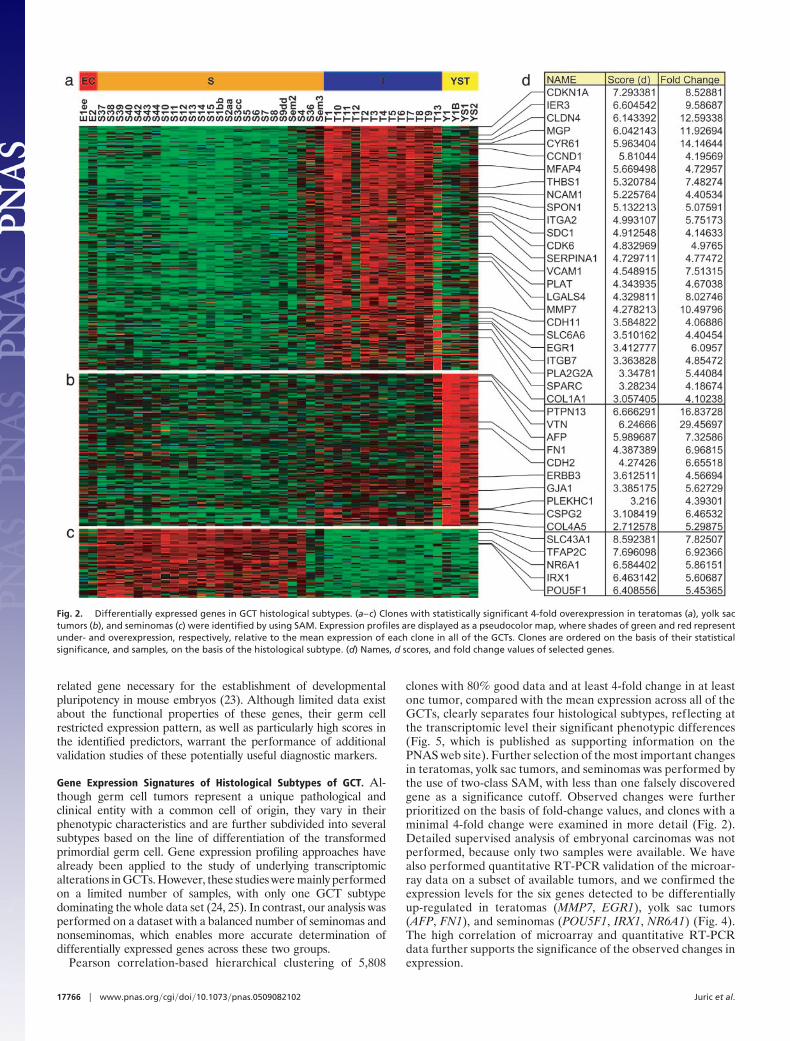
clones with 80% good data and at least 4-fold change in at leastone tumor, compared with the mean expression across all of theGCTs, clearly separates four histological subtypes, reflecting atthe transcriptomic level their significant phenotypic differences(Fig. 5, which is published as supporting information on thePNAS web site). Further selection of the most important changesin teratomas, yolk sac tumors, and seminomas was performed bythe use of two-class SAM, with less than one falsely discoveredgene as a significance cutoff. Observed changes were furtherprioritized on the basis of fold-change values, and clones with aminimal 4-fold change were examined in more detail (Fig. 2).Detailed supervised analysis of embryonal carcinomas was notperformed, because only two samples were available. We havealso performed quantitative RT-PCR validation of the microar-ray data on a subset of available tumors, and we confirmed theexpression levels for the six genes detected to be differentiallyup-regulated in teratomas (MMP7, EGR1), yolk sac tumors(AFP, FN1), and seminomas (POU5F1, IRX1, NR6A1) (Fig. 4).The high correlation of microarray and quantitative RT-PCRdata further supports the significance of the observed changes inexpression.
Fig. 2. Differentially expressed genes in GCT histological subtypes. (a–c) Clones with statistically significant 4-fold overexpression in teratomas (a), yolk sactumors (b), and seminomas (c) were identified by using SAM. Expression profiles are displayed as a pseudocolor map, where shades of green and red representunder- and overexpression, respectively, relative to the mean expression of each clone in all of the GCTs. Clones are ordered on the basis of their statisticalsignificance, and samples, on the basis of the histological subtype. (d) Names, d scores, and fold change values of selected genes.
17766 � www.pnas.org�cgi�doi�10.1073�pnas.0509082102 Juric et al.
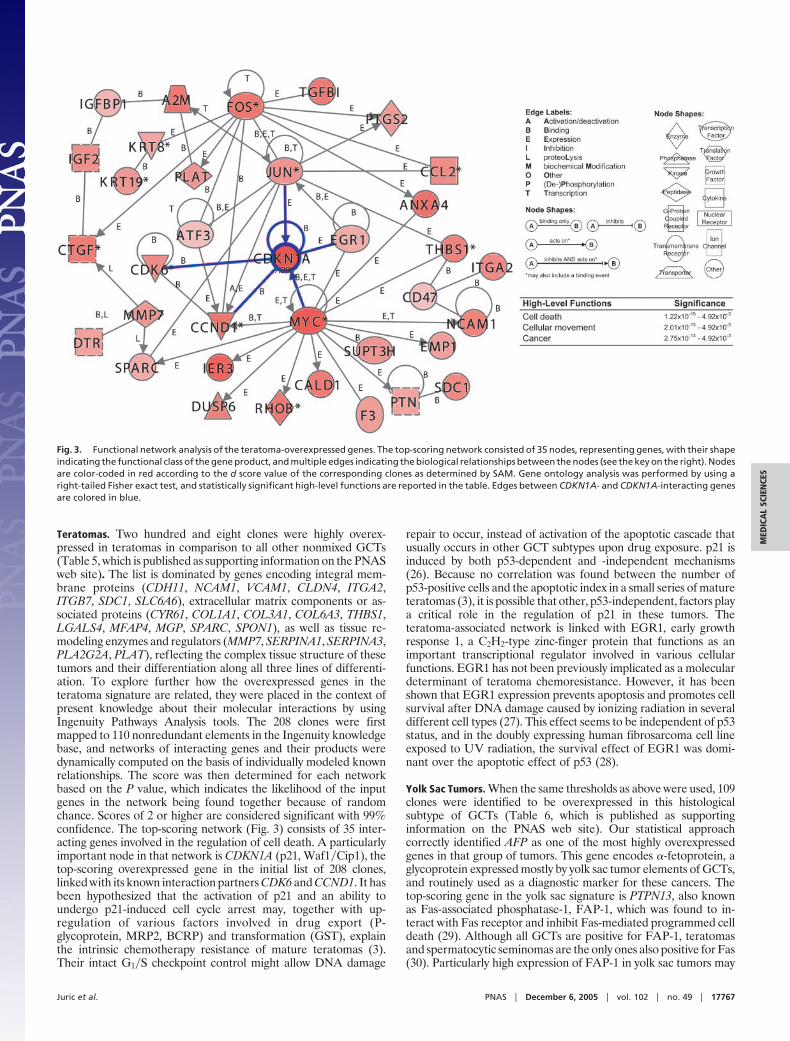
Teratomas. Two hundred and eight clones were highly overex-pressed in teratomas in comparison to all other nonmixed GCTs(Table 5, which is published as supporting information on the PNASweb site). The list is dominated by genes encoding integral mem-brane proteins (CDH11, NCAM1, VCAM1, CLDN4, ITGA2,ITGB7, SDC1, SLC6A6), extracellular matrix components or as-sociated proteins (CYR61, COL1A1, COL3A1, COL6A3, THBS1,LGALS4, MFAP4, MGP, SPARC, SPON1), as well as tissue re-modeling enzymes and regulators (MMP7, SERPINA1, SERPINA3,PLA2G2A, PLAT), reflecting the complex tissue structure of thesetumors and their differentiation along all three lines of differenti-ation. To explore further how the overexpressed genes in theteratoma signature are related, they were placed in the context ofpresent knowledge about their molecular interactions by usingIngenuity Pathways Analysis tools. The 208 clones were firstmapped to 110 nonredundant elements in the Ingenuity knowledgebase, and networks of interacting genes and their products weredynamically computed on the basis of individually modeled knownrelationships. The score was then determined for each networkbased on the P value, which indicates the likelihood of the inputgenes in the network being found together because of randomchance. Scores of 2 or higher are considered significant with 99%confidence. The top-scoring network (Fig. 3) consists of 35 inter-acting genes involved in the regulation of cell death. A particularlyimportant node in that network is CDKN1A (p21, Waf1�Cip1), thetop-scoring overexpressed gene in the initial list of 208 clones,linked with its known interaction partners CDK6 and CCND1. It hasbeen hypothesized that the activation of p21 and an ability toundergo p21-induced cell cycle arrest may, together with up-regulation of various factors involved in drug export (P-glycoprotein, MRP2, BCRP) and transformation (GST), explainthe intrinsic chemotherapy resistance of mature teratomas (3).Their intact G1�S checkpoint control might allow DNA damage
repair to occur, instead of activation of the apoptotic cascade thatusually occurs in other GCT subtypes upon drug exposure. p21 isinduced by both p53-dependent and -independent mechanisms(26). Because no correlation was found between the number ofp53-positive cells and the apoptotic index in a small series of matureteratomas (3), it is possible that other, p53-independent, factors playa critical role in the regulation of p21 in these tumors. Theteratoma-associated network is linked with EGR1, early growthresponse 1, a C2H2-type zinc-finger protein that functions as animportant transcriptional regulator involved in various cellularfunctions. EGR1 has not been previously implicated as a moleculardeterminant of teratoma chemoresistance. However, it has beenshown that EGR1 expression prevents apoptosis and promotes cellsurvival after DNA damage caused by ionizing radiation in severaldifferent cell types (27). This effect seems to be independent of p53status, and in the doubly expressing human fibrosarcoma cell lineexposed to UV radiation, the survival effect of EGR1 was domi-nant over the apoptotic effect of p53 (28).
Yolk Sac Tumors. When the same thresholds as above were used, 109clones were identified to be overexpressed in this histologicalsubtype of GCTs (Table 6, which is published as supportinginformation on the PNAS web site). Our statistical approachcorrectly identified AFP as one of the most highly overexpressedgenes in that group of tumors. This gene encodes �-fetoprotein, aglycoprotein expressed mostly by yolk sac tumor elements of GCTs,and routinely used as a diagnostic marker for these cancers. Thetop-scoring gene in the yolk sac signature is PTPN13, also knownas Fas-associated phosphatase-1, FAP-1, which was found to in-teract with Fas receptor and inhibit Fas-mediated programmed celldeath (29). Although all GCTs are positive for FAP-1, teratomasand spermatocytic seminomas are the only ones also positive for Fas(30). Particularly high expression of FAP-1 in yolk sac tumors may
Fig. 3. Functional network analysis of the teratoma-overexpressed genes. The top-scoring network consisted of 35 nodes, representing genes, with their shapeindicating the functional class of the gene product, and multiple edges indicating the biological relationships between the nodes (see the key on the right). Nodesare color-coded in red according to the d score value of the corresponding clones as determined by SAM. Gene ontology analysis was performed by using aright-tailed Fisher exact test, and statistically significant high-level functions are reported in the table. Edges between CDKN1A- and CDKN1A-interacting genesare colored in blue.
Juric et al. PNAS � December 6, 2005 � vol. 102 � no. 49 � 17767
MED
ICA
LSC
IEN
CES
have other effects, because this protein was also shown to have a keyrole in the apoptotic process in human breast cancer cells indepen-dent of Fas (31), and to interact with GTPase-activating proteins(32), and thus may function as a regulator of the Rho signalingpathway, involved in signal transduction processes leading to cy-toskeletal-dependent responses, including cell migration, invasion,and metastasis. Several other genes directly involved in cell adhe-sion processes are highly expressed in yolk sac tumors (FN1, VTN,CSPG2, COL4A5, PLEKHC1, CDH2, GJA1). Interestingly, thesetumors also show overexpression of ERBB3. Members of the ErbBreceptor tyrosine kinases, especially ERBB2, ERBB3, and theirligand neuregulin-�, control the growth and survival of primordialgerm cells in genital ridges of developing mouse, and their specifictime-dependent expression pattern is necessary for normal devel-opment of gonads (33).
Seminomas. Fifty-one clones were highly overexpressed in semino-mas (Table 7, which is published as supporting information on thePNAS web site). The highest significance was observed forSLC43A1, also known as prostate cancer overexpressed gene 1,POV1. Very limited data exist about the function of this gene. It wasoriginally described in clinically aggressive prostate cancers (34) andwas recently implicated as an early-onset gene in the developmentof seminomas (35). Other interesting genes with high expression inseminomas include the transcription factors POU5F1, TFAP2C,NR6A1, and IRX1. POU5F1 (OCT3�4) was previously reported asa master regulator of pluripotency, with increased expressioncontrolling embryonic differentiation into primitive endoderm andmesoderm. In contrast, repression of POU5F1 induces loss ofpluripotency and dedifferentiation to trophectoderm. This gene hasalso been suggested as a marker of pluripotent human germ celltumors, expressed in seminomas and embryonal carcinomas, butnot in the various types of differentiated nonseminomas (36). Asimilar pattern of expression in GCTs has been described foranother gene in our seminoma signature, TFAP2C (37), transcrip-
tion factor AP-2-�, a member of the AP-2 transcription factorfamily, which plays important roles in the development and differ-entiation of the neural tube, neural crest derivatives, skin, heart, andurogenital tissues (38). Two genes have not been previously impli-cated in the development and progression of GCTs, but they havecritical roles in various developmental processes. These includeNR6A1, the single most important gene in the seven-clone semi-noma predictor, as well as IRX1, one of the Iro homeobox tran-scription factors required at early stages of development to definelarge territories and to further subdivide neural tube and heart (39).Their altered pattern of expression could be a characteristic ofseminomas and could be involved in the determination of theirpluripotent nature.
ConclusionsGCTs have many unique properties in comparison with other solidtumors, and limited data exist about molecular mechanisms un-derlying such unique biology. In this study, we have analyzedtranscriptomic changes in a set of 50 GCTs. Key alterationspreviously described in the literature as GCT-specific, includingroutinely used diagnostic and prognostic markers, were confirmedas highly expressed by the appropriate GCT subtypes in our study.In addition, we have developed a gene expression-based GCT classpredictor of high predictive accuracy and identified a set of genesthat could potentially be used in the diagnosis of tumors of unknownprimary origin. We have also detected a set of genes highlyoverexpressed in teratomas, yolk sac tumors, and seminomas, andhave further explored their most important functional interactionsand expression modules. These findings may be useful in studyingthe biology of GCTs, and in developing novel therapeutic targets ordiagnostic markers for these diseases.
We thank Brian Francisco and Christianna Stuber for their excellenttechnical assistance and the Stanford Functional Genomics Facility forits support. This research was supported by National Institutes of HealthGrants R33 CA 89830 (to B.I.S.), R01 CA 102283 (to R.A.H.), and P01CA 74295 (to L.H.E.) from the U.S. Public Health Service.
1. Oosterhuis, J. W. & Looijenga, L. H. (2005) Nat. Rev. Cancer 5, 210–222.2. Einhorn, L. H. (2002) Proc. Natl. Acad. Sci. USA 99, 4592–4595.3. Mayer, F., Stoop, H., Scheffer, G. L., Scheper, R., Oosterhuis, J. W., Looijenga, L. H.
& Bokemeyer, C. (2003) Clin. Cancer Res. 9, 767–773.4. Gollub, J., Ball, C. A., Binkley, G., Demeter, J., Finkelstein, D. B., Hebert, J. M.,
Hernandez-Boussard, T., Jin, H., Kaloper, M., Matese, J. C., et al. (2003) NucleicAcids Res. 31, 94–96.
5. Perou, C. M., Jeffrey, S. S., van de Rijn, M., Rees, C. A., Eisen, M. B., Ross, D. T.,Pergamenschikov, A., Williams, C. F., Zhu, S. X., Lee, J. C., et al. (1999) Proc. Natl.Acad. Sci. USA 96, 9212–9217.
6. Wilson, D. L., Buckley, M. J., Helliwell, C. A. & Wilson, I. W. (2003) Bioinformatics19, 1325–1332.
7. Shyamsundar, R., Kim, Y. H., Higgins, J. P., Montgomery, K., Jorden, M., Sethura-man, A., van de Rijn, M., Botstein, D., Brown, P. O. & Pollack, J. R. (2005) GenomeBiol. 6, R22.
8. Eisen, M. B., Spellman, P. T., Brown, P. O. & Botstein, D. (1998) Proc. Natl. Acad.Sci. USA 95, 14863–14868.
9. Tusher, V. G., Tibshirani, R. & Chu, G. (2001) Proc. Natl. Acad. Sci. USA 98,5116–5121.
10. Tibshirani, R., Hastie, T., Narasimhan, B. & Chu, G. (2002) Proc. Natl. Acad. Sci.USA 99, 6567–6572.
11. Diehn, M., Sherlock, G., Binkley, G., Jin, H., Matese, J. C., Hernandez-Boussard, T.,Rees, C. A., Cherry, J. M., Botstein, D., Brown, P. O. & Alizadeh, A. A. (2003)Nucleic Acids Res. 31, 219–223.
12. Rhodes, D. R., Yu, J., Shanker, K., Deshpande, N., Varambally, R., Ghosh, D.,Barrette, T., Pandey, A. & Chinnaiyan, A. M. (2004) Proc. Natl. Acad. Sci. USA 101,9309–9314.
13. Segal, E., Friedman, N., Koller, D. & Regev, A. (2004) Nat. Genet. 36, 1090–1098.14. Houldsworth, J., Reuter, V., Bosl, G. J. & Chaganti, R. S. (1997) Cell Growth Differ.
8, 293–299.15. von Eyben, F. E., Liu, F. J., Amato, R. J. & Fritsche, H. A. (2000) Acta Oncol. 39,
509–517.16. Rodriguez, S., Jafer, O., Goker, H., Summersgill, B. M., Zafarana, G., Gillis, A. J.,
van Gurp, R. J., Oosterhuis, J. W., Lu, Y. J., Huddart, R., et al. (2003) Oncogene 22,1880–1891.
17. Leung, T. W., Lin, S. S., Tsang, A. C., Tong, C. S., Ching, J. C., Leung, W. Y., Gimlich,R., Wong, G. G. & Yao, K. M. (2001) FEBS Lett. 507, 59–66.
18. Kauraniemi, P., Barlund, M., Monni, O. & Kallioniemi, A. (2001) Cancer Res. 61,8235–8240.
19. Skotheim, R. I. & Lothe, R. A. (2003) APMIS 111, 136–151.
20. Glover, K. Y., Varadhachary, G. R., Lenzi, R., Raber, M. N. & Abbruzzese, J. L.(2004) in Clinical Oncology, ed. Abeloff, M. D. (Elsevier Churchill Livingstone,Philadelphia), pp. 2627–2643.
21. Chen, F., Cooney, A. J., Wang, Y., Law, S. W. & O’Malley, B. W. (1994) Mol.Endocrinol. 8, 1434–1444.
22. Chung, A. C., Katz, D., Pereira, F. A., Jackson, K. J., DeMayo, F. J., Cooney, A. J.& O’Malley, B. W. (2001) Mol. Cell. Biol. 21, 663–677.
23. Bortvin, A., Eggan, K., Skaletsky, H., Akutsu, H., Berry, D. L., Yanagimachi, R.,Page, D. C. & Jaenisch, R. (2003) Development (Cambridge, U.K.) 130, 1673–1680.
24. Sugimura, J., Foster, R. S., Cummings, O. W., Kort, E. J., Takahashi, M., Lavery,T. T., Furge, K. A., Einhorn, L. H. & Teh, B. T. (2004) Clin. Cancer Res. 10,2368–2378.
25. Sperger, J. M., Chen, X., Draper, J. S., Antosiewicz, J. E., Chon, C. H., Jones, S. B.,Brooks, J. D., Andrews, P. W., Brown, P. O. & Thomson, J. A. (2003) Proc. Natl.Acad. Sci. USA 100, 13350–13355.
26. Gartel, A. L. & Tyner, A. L. (2002) Mol. Cancer Ther. 1, 639–649.27. Hallahan, D. E., Dunphy, E., Virudachalam, S., Sukhatme, V. P., Kufe, D. W. &
Weichselbaum, R. R. (1995) J. Biol. Chem. 270, 30303–30309.28. de Belle, I., Huang, R. P., Fan, Y., Liu, C., Mercola, D. & Adamson, E. D. (1999)
Oncogene 18, 3633–3642.29. Sato, T., Irie, S., Kitada, S. & Reed, J. C. (1995) Science 268, 411–415.30. Kersemaekers, A. M., van Weeren, P. C., Oosterhuis, J. W. & Looijenga, L. H. (2002)
J. Pathol. 196, 423–429.31. Bompard, G., Puech, C., Prebois, C., Vignon, F. & Freiss, G. (2002) J. Biol. Chem.
277, 47861–47869.32. Saras, J., Franzen, P., Aspenstrom, P., Hellman, U., Gonez, L. J. & Heldin, C. H.
(1997) J. Biol. Chem. 272, 24333–24338.33. Toyoda-Ohno, H., Obinata, M. & Matsui, Y. (1999) Dev. Biol. 215, 399–406.34. Chuaqui, R. F., Englert, C. R., Strup, S. E., Vocke, C. D., Zhuang, Z., Duray, P. H.,
Bostwick, D. G., Linehan, W. M., Liotta, L. A. & Emmert-Buck, M. R. (1997) Urology50, 302–307.
35. Skotheim, R. I., Monni, O., Mousses, S., Fossa, S. D., Kallioniemi, O. P., Lothe, R. A.& Kallioniemi, A. (2002) Cancer Res. 62, 2359–2364.
36. Looijenga, L. H., Stoop, H., de Leeuw, H. P., de Gouveia Brazao, C. A., Gillis, A. J.,van Roozendaal, K. E., van Zoelen, E. J., Weber, R. F., Wolffenbuttel, K. P., vanDekken, H., et al. (2003) Cancer Res. 63, 2244–2250.
37. Hoei-Hansen, C. E., Nielsen, J. E., Almstrup, K., Sonne, S. B., Graem, N.,Skakkebaek, N. E., Leffers, H. & Meyts, E. R. (2004) Clin. Cancer Res. 10, 8521–8530.
38. Hilger-Eversheim, K., Moser, M., Schorle, H. & Buettner, R. (2000) Gene 260, 1–12.39. Cavodeassi, F., Modolell, J. & Gomez-Skarmeta, J. L. (2001) Development (Cam-
bridge, U.K.) 128, 2847–2855.
17768 � www.pnas.org�cgi�doi�10.1073�pnas.0509082102 Juric et al.