gene expression microarrays for dummies
TRANSCRIPT
Gene Expression Microarrays forDummies
What We Learned this SummerMonnie McGee & Zhongxue Chen
Department of Statistical Science
Southern Methodist University
SMU Seminar September 9, 2005 – p.1/42
Acknowledgments
SMU Microarray Analysis Group (SMUMAG)
Faculty StudentsJing Cao Zhongxue ChenTony Ng Kinfe GedifWilliam Schucany Drew HardinXinlei Wang Jobayer Hossain
Ariful IslamJulia Kozlitina
Data supplied by Boland Lab at Baylor.
SMU Seminar September 9, 2005 – p.2/42
Outline
Motivation
Central Dogma of Biology
Types of Microarrays
Central Dogma of Microarray Analysis
Robust Multi-Chip Average
Improvements (?) to RMA
Future Work
SMU Seminar September 9, 2005 – p.3/42
Colon Cancer Cell Line DataMicroarrays of four cell lines
HCT116: Microsatellite Instability Model
HCT111 Plus 3: MSI plus a corrective gene
SW48: CIMP line (silencing of genes)
SW480: Chromosomal Instability (CIN) line
Four treatments to each line (including no treatment)
Two “control” cell lines (RKO & HT29)
Total of 18 microarrays
SMU Seminar September 9, 2005 – p.4/42

Colon Cancer Cell Line DataMicroarrays of four cell lines
HCT116: Microsatellite Instability Model
HCT111 Plus 3: MSI plus a corrective gene
SW48: CIMP line (silencing of genes)
SW480: Chromosomal Instability (CIN) line
Four treatments to each line (including no treatment)
Two “control” cell lines (RKO & HT29)
Total of 18 microarrays
Question: What genes are differentially expressed among thevarious cell lines?
SMU Seminar September 9, 2005 – p.4/42
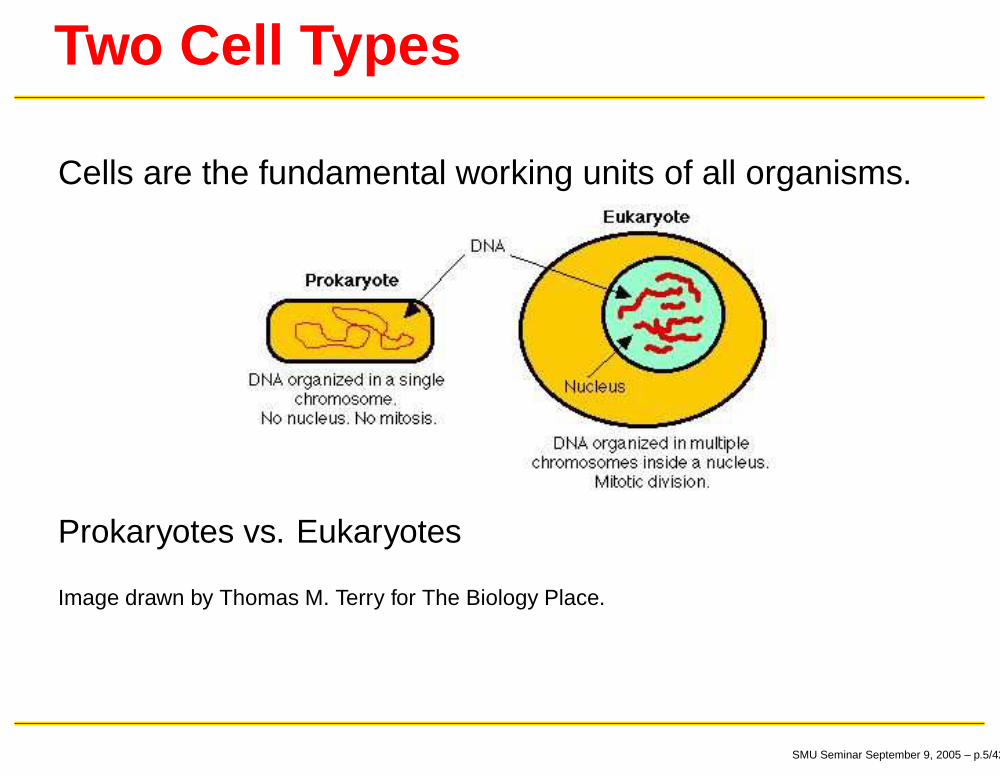
Two Cell Types
Cells are the fundamental working units of all organisms.
Prokaryotes vs. Eukaryotes
Image drawn by Thomas M. Terry for The Biology Place.
SMU Seminar September 9, 2005 – p.5/42
Key Macromolecules
LipidsMostly structural in functionConstruct compartments that separate inside fromoutside
DNAEncodes hereditary information
ProteinsDo most of the work in the cellForm 3D structure and complexes critical for function
SMU Seminar September 9, 2005 – p.6/42
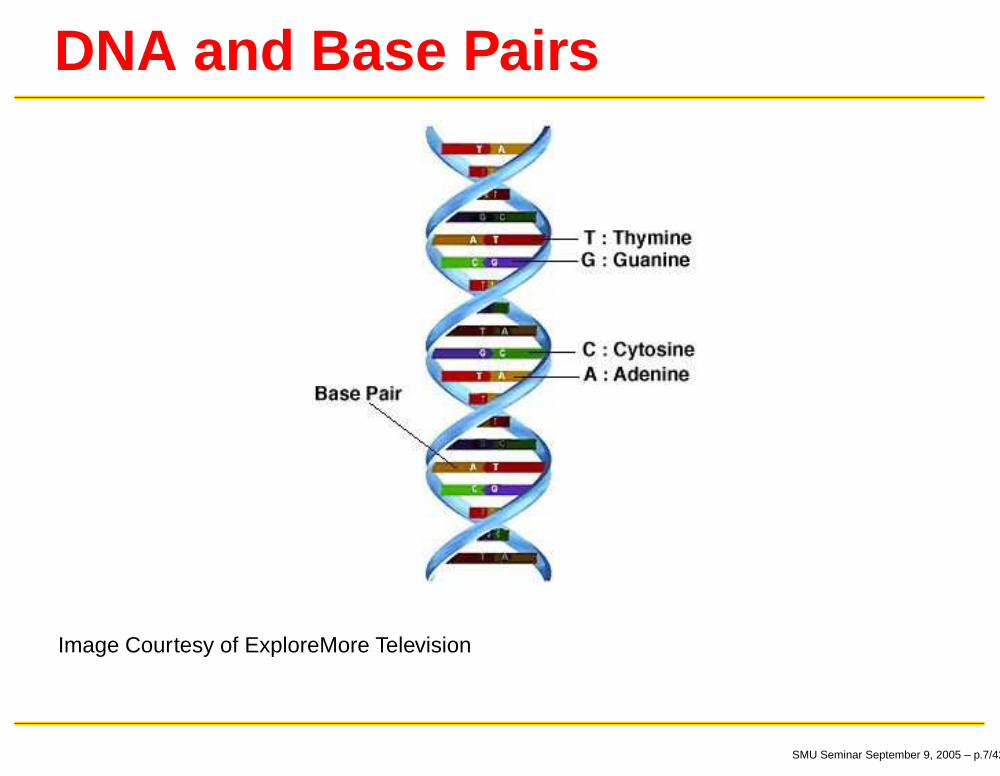
DNA and Base Pairs
Image Courtesy of ExploreMore Television
SMU Seminar September 9, 2005 – p.7/42

Central Dogma of Biology
Image Courtesy of BioCoach
SMU Seminar September 9, 2005 – p.8/42
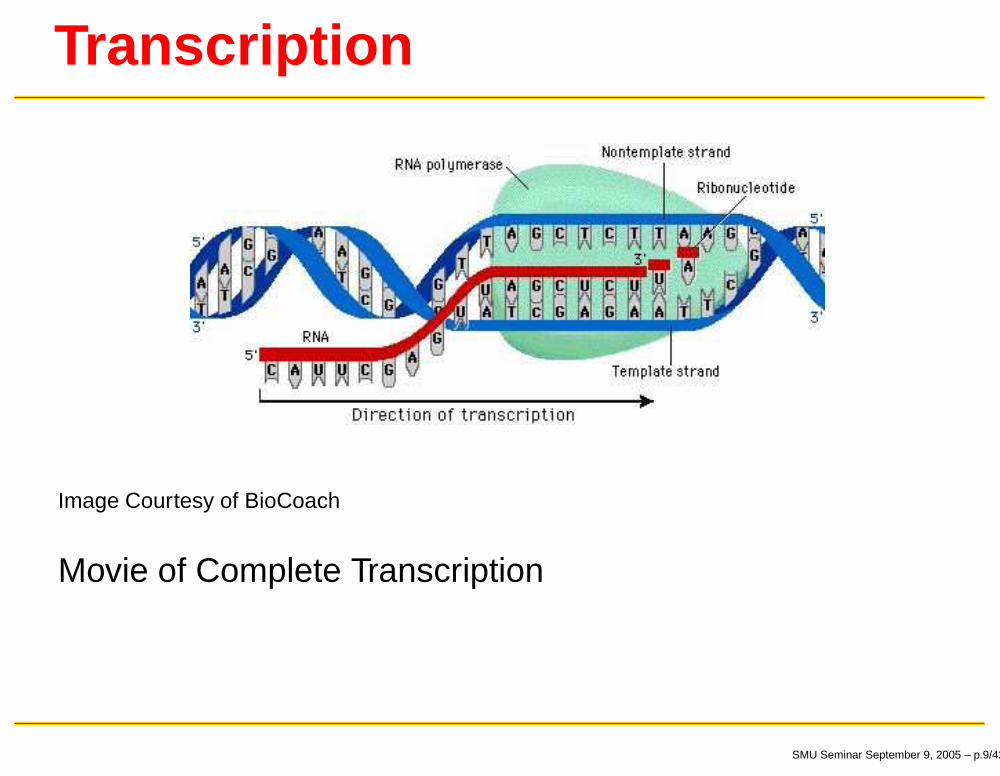
Transcription
Image Courtesy of BioCoach
Movie of Complete Transcription
SMU Seminar September 9, 2005 – p.9/42
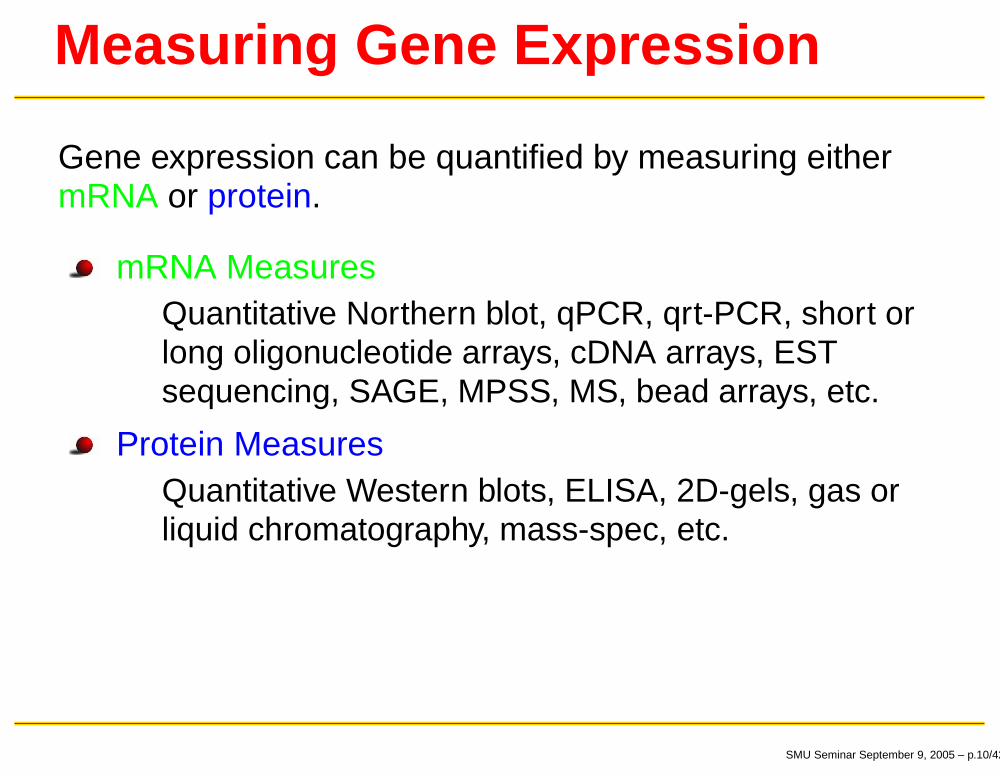
Measuring Gene Expression
Gene expression can be quantified by measuring eithermRNA or protein.
mRNA MeasuresQuantitative Northern blot, qPCR, qrt-PCR, short orlong oligonucleotide arrays, cDNA arrays, ESTsequencing, SAGE, MPSS, MS, bead arrays, etc.
Protein MeasuresQuantitative Western blots, ELISA, 2D-gels, gas orliquid chromatography, mass-spec, etc.
SMU Seminar September 9, 2005 – p.10/42
Why Microarray Analysis?
Large-scale study of biological processes
Activity in cell at a certain point in time
Account for differences in phenotypes on a large-scalegenetic level
Sequences are important, but genes have effectthrough expression
SMU Seminar September 9, 2005 – p.11/42
Why Microarray Analysis?
Large-scale study of biological processes
Activity in cell at a certain point in time
Account for differences in phenotypes on a large-scalegenetic level
Sequences are important, but genes have effectthrough expression
Rough measurement on a grand scale which has utility
SMU Seminar September 9, 2005 – p.11/42
Measuring Gene Expression
Basic idea: Quantify concentration of a gene’s mRNAtranscript in a cell at a given time
SMU Seminar September 9, 2005 – p.12/42
Measuring Gene Expression
Basic idea: Quantify concentration of a gene’s mRNAtranscript in a cell at a given time
How?
Immobilize DNA probes onto glass (or other medium)
Hybridize labeled target mRNA with probes
Measure how much binds to each probe (i.e. formsDNA)
SMU Seminar September 9, 2005 – p.12/42
Microarray Measurements
All raw measurements are fluorescence intensities
Target cDNA (or mRNA) is radioactively labeled
Molecules in dye are excited using a laser
Measurement is a count of the photons emitted
Entire slide or chip is scanned, and the result is a digitalimage
Image is processed to locate probes and assignintensity measurements to each probe
SMU Seminar September 9, 2005 – p.13/42
Microarray Technologies
Two Channel Spotted ArraysRobotic MicrospottingProbes are 300 to 3000 base pairs in lengthLong-oligo arrays: probes are uniformly 60 to 90 bpCommerical arrays using inkjet technology
Single-channel ArraysHigh-density short oligo (25 bp) arrays (Affymetrix,Nimblegen)
SMU Seminar September 9, 2005 – p.14/42
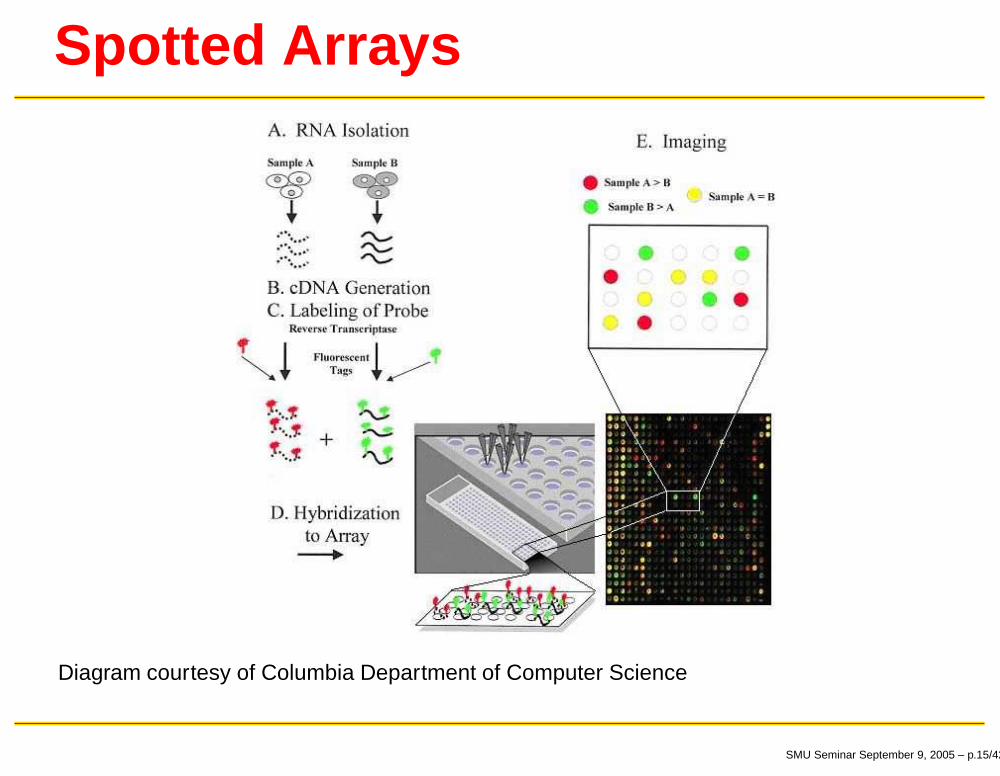
Spotted Arrays
Diagram courtesy of Columbia Department of Computer Science
SMU Seminar September 9, 2005 – p.15/42
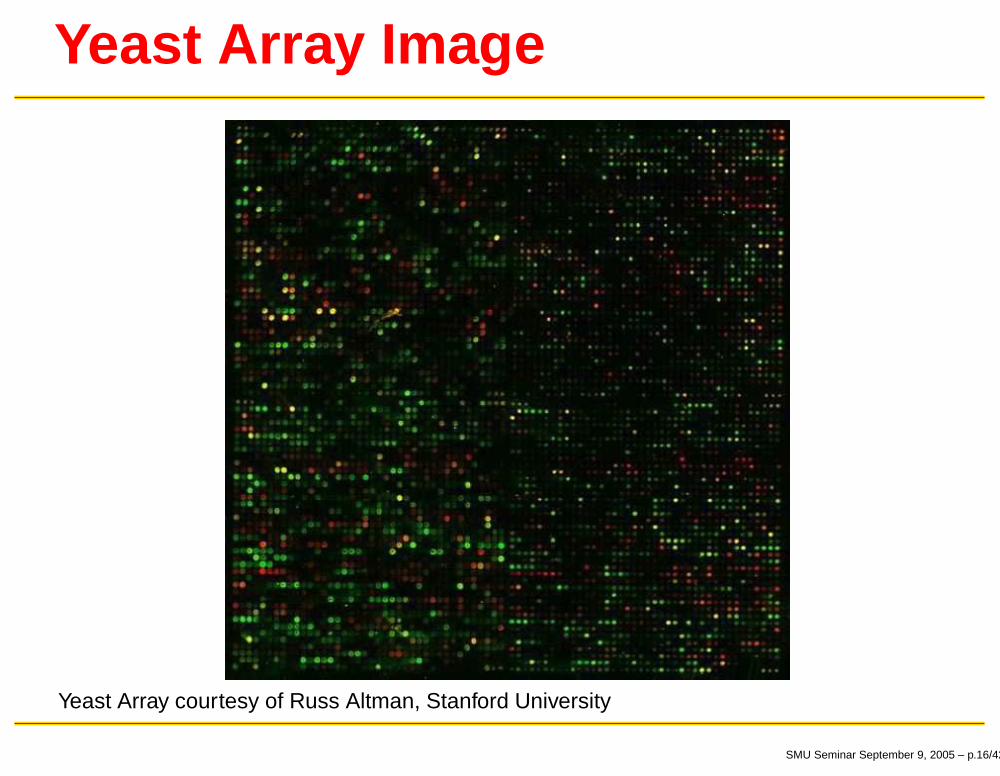
Yeast Array Image
Yeast Array courtesy of Russ Altman, Stanford University
SMU Seminar September 9, 2005 – p.16/42
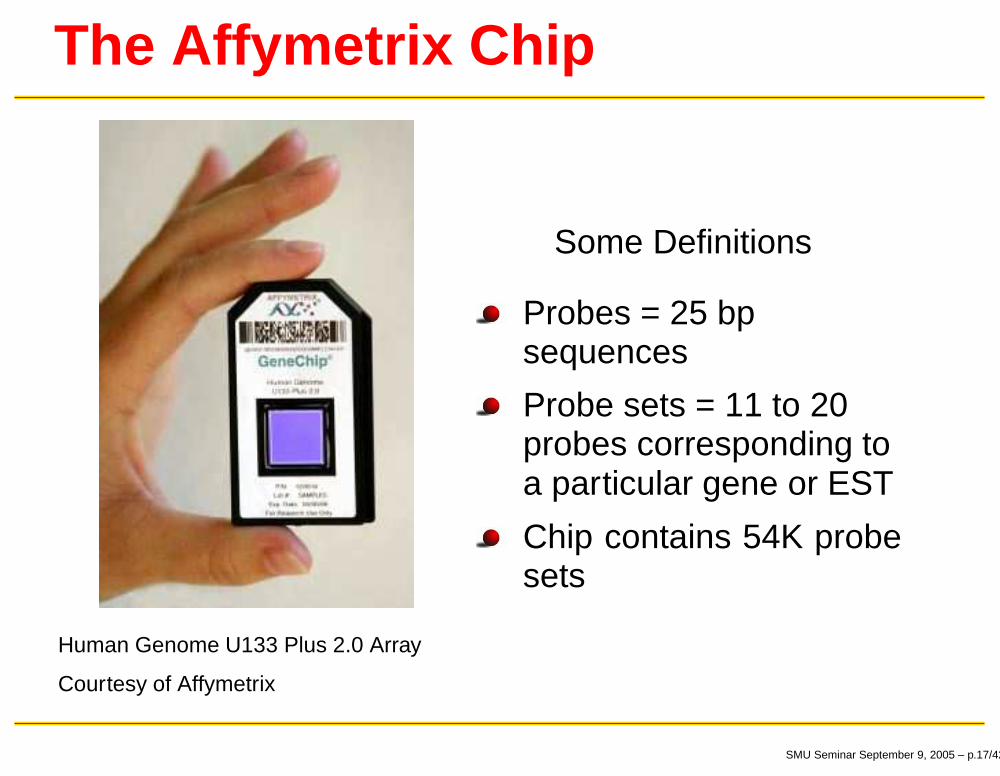
The Affymetrix Chip
Human Genome U133 Plus 2.0 Array
Courtesy of Affymetrix
Some Definitions
Probes = 25 bpsequences
Probe sets = 11 to 20probes corresponding toa particular gene or EST
Chip contains 54K probesets
SMU Seminar September 9, 2005 – p.17/42
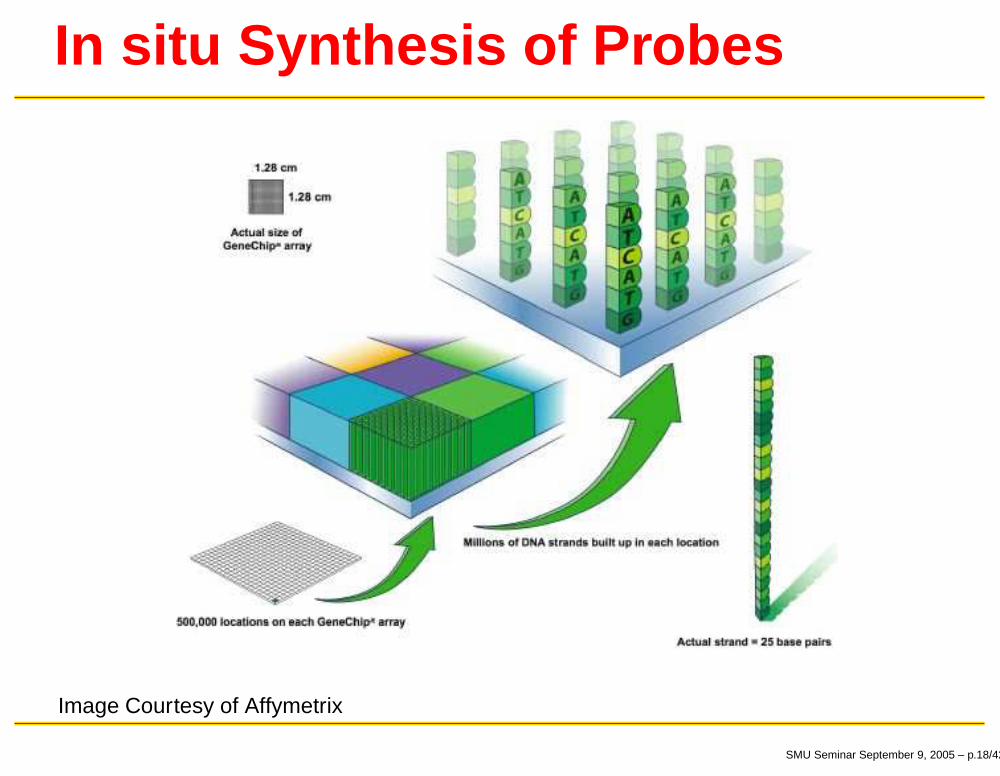
In situ Synthesis of Probes
Image Courtesy of Affymetrix
SMU Seminar September 9, 2005 – p.18/42
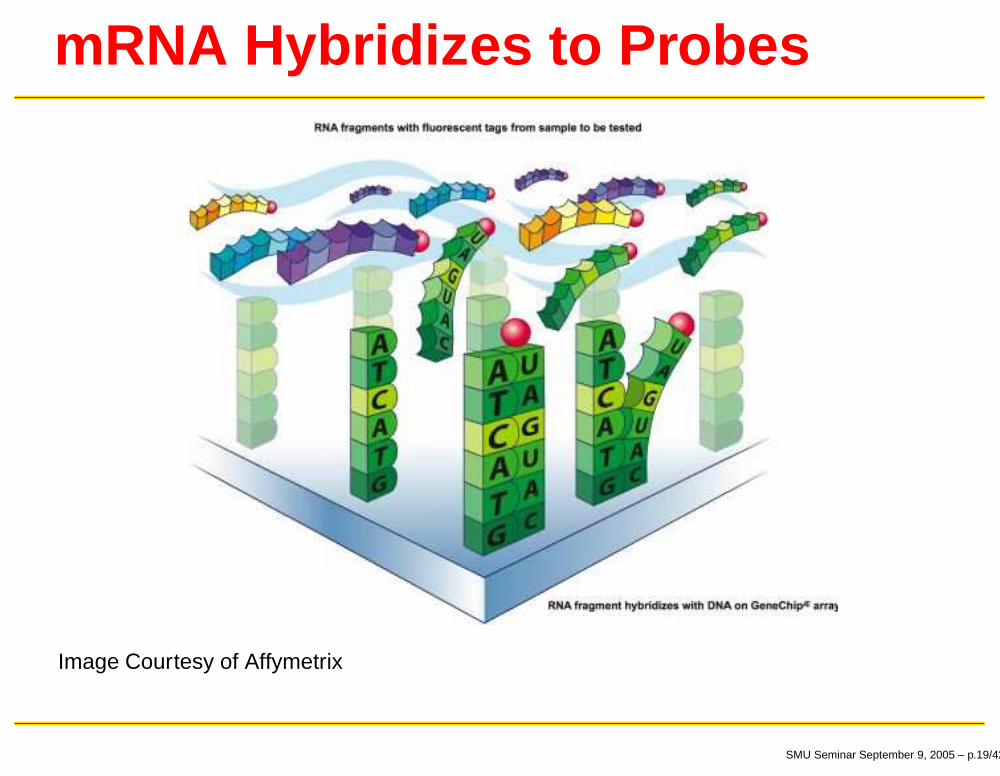
mRNA Hybridizes to Probes
Image Courtesy of Affymetrix
SMU Seminar September 9, 2005 – p.19/42
Perfect Match vs. Mismatch
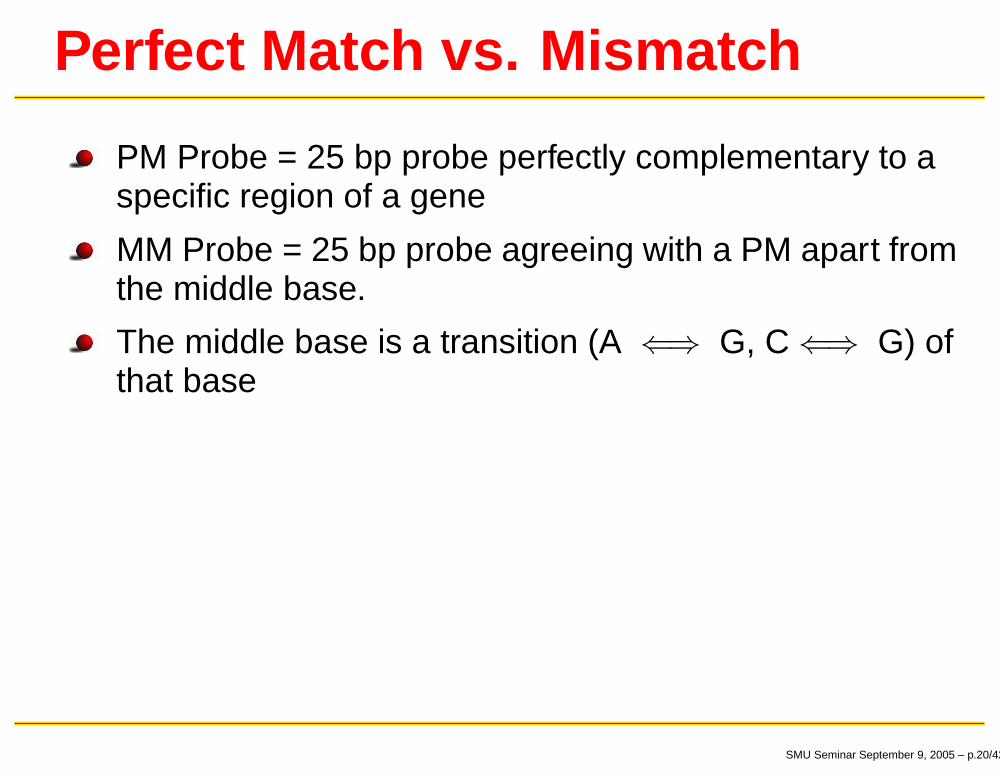
PM Probe = 25 bp probe perfectly complementary to aspecific region of a gene
MM Probe = 25 bp probe agreeing with a PM apart fromthe middle base.
The middle base is a transition (A ⇐⇒ G, C ⇐⇒ G) ofthat base
SMU Seminar September 9, 2005 – p.20/42
Perfect Match vs. Mismatch
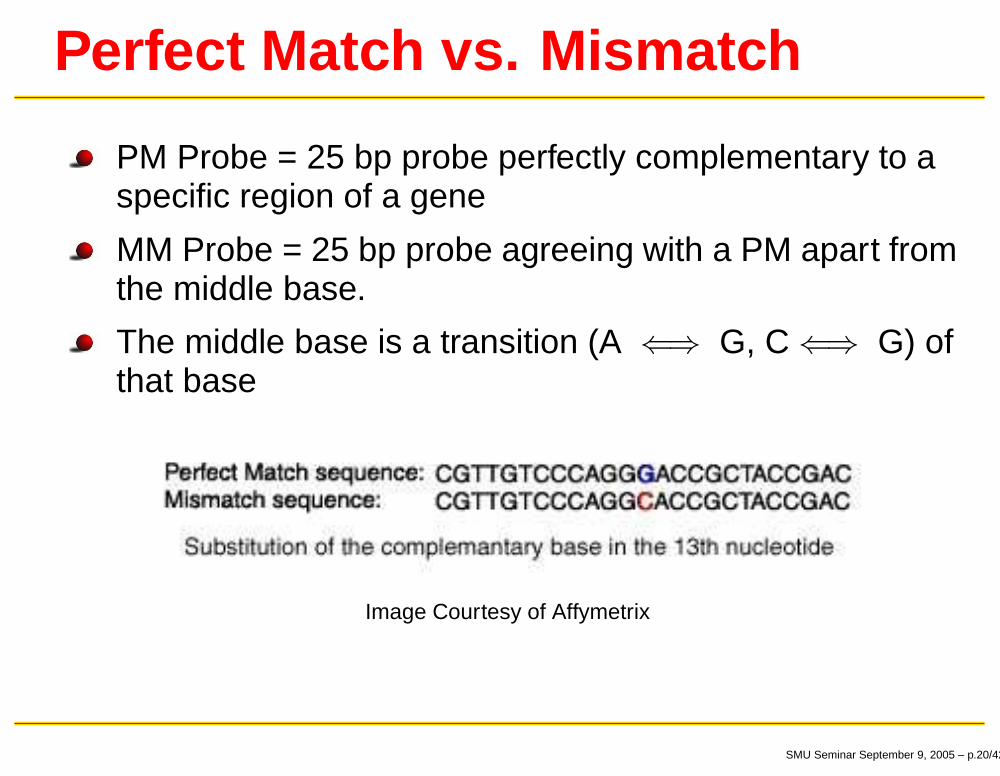
PM Probe = 25 bp probe perfectly complementary to aspecific region of a gene
MM Probe = 25 bp probe agreeing with a PM apart fromthe middle base.
The middle base is a transition (A ⇐⇒ G, C ⇐⇒ G) ofthat base
Image Courtesy of Affymetrix
SMU Seminar September 9, 2005 – p.20/42
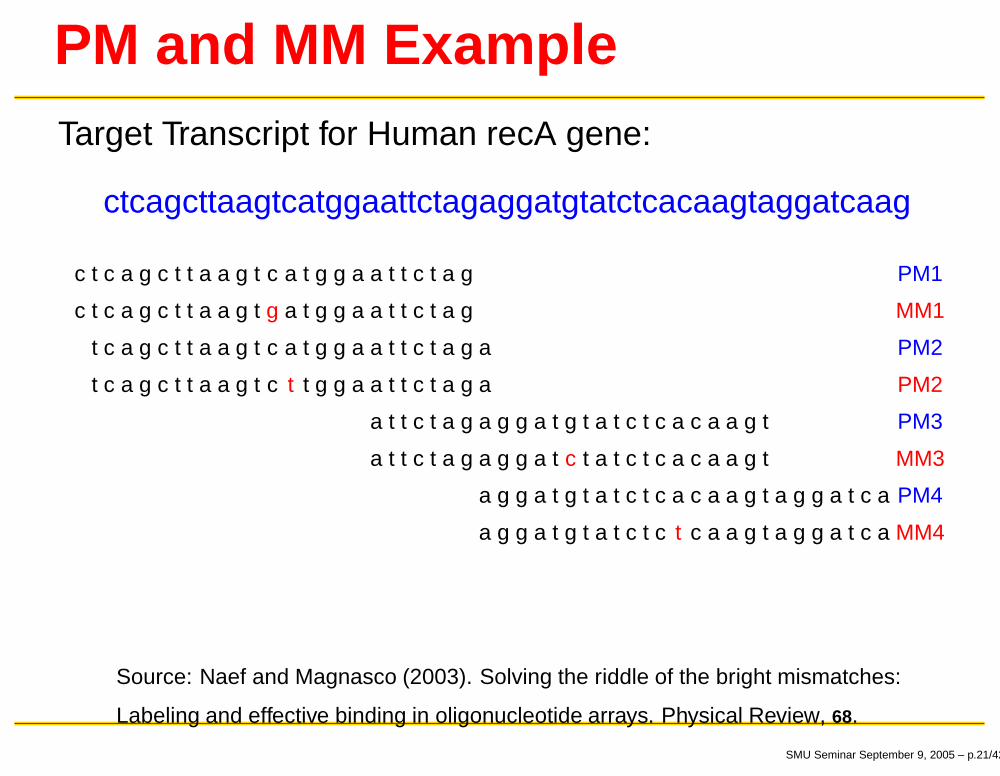
PM and MM ExampleTarget Transcript for Human recA gene:
ctcagcttaagtcatggaattctagaggatgtatctcacaagtaggatcaag
c t c a g c t t a a g t c a t g g a a t t c t a g PM1
c t c a g c t t a a g t g a t g g a a t t c t a g MM1
t c a g c t t a a g t c a t g g a a t t c t a g a PM2
t c a g c t t a a g t c t t g g a a t t c t a g a PM2
a t t c t a g a g g a t g t a t c t c a c a a g t PM3
a t t c t a g a g g a t c t a t c t c a c a a g t MM3
a g g a t g t a t c t c a c a a g t a g g a t c a PM4
a g g a t g t a t c t c t c a a g t a g g a t c a MM4
Source: Naef and Magnasco (2003). Solving the riddle of the bright mismatches:
Labeling and effective binding in oligonucleotide arrays. Physical Review, 68.
SMU Seminar September 9, 2005 – p.21/42
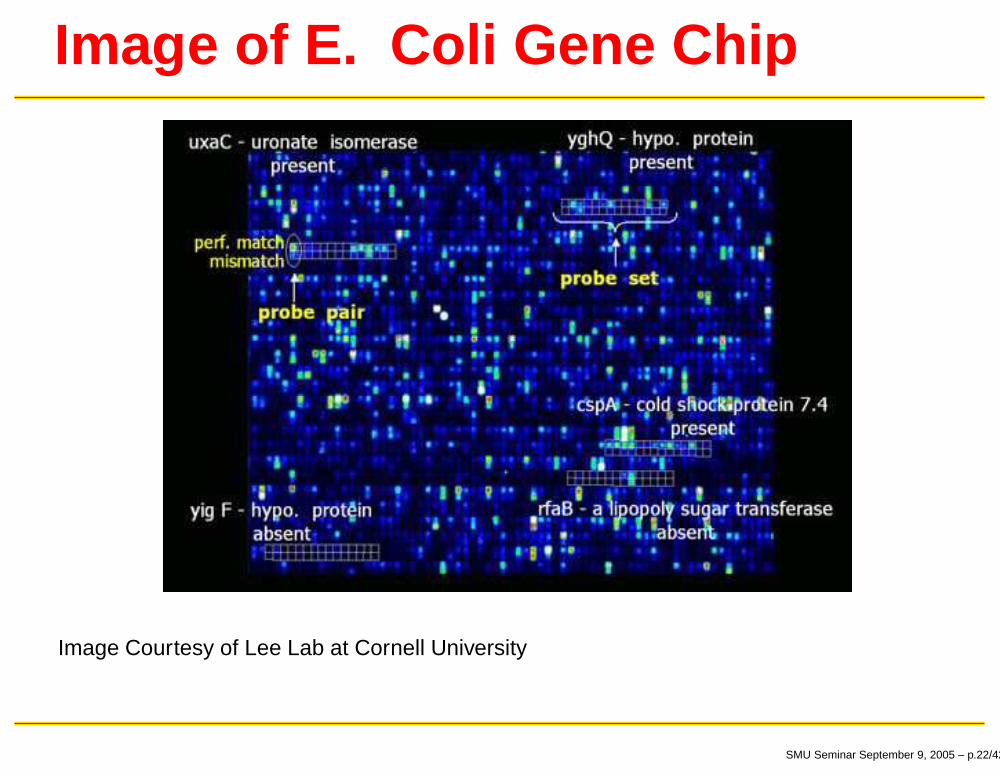
Image of E. Coli Gene Chip
Image Courtesy of Lee Lab at Cornell University
SMU Seminar September 9, 2005 – p.22/42
Analysis Tasks
Identify up- and down-regulated genes.
Find groups of genes with similar expression profiles.
Find groups of experiments (tissues) with similarexpression profiles.
Find genes that explain observed differences amongtissues (feature selection).
SMU Seminar September 9, 2005 – p.23/42
Central Dogma of MA Analysis
Computing Expression Values for each probe set requiresthree steps:
Background correction (image correction for cDNA)
Normalization
Summarization
SMU Seminar September 9, 2005 – p.24/42
Central Dogma of MA Analysis
Computing Expression Values for each probe set requiresthree steps:
Background correction (image correction for cDNA)
Normalization
Summarization
One Approach: Robust Multichip Analysis (RMA)Irizarry et. al., Nucleic Acids Research, 2003
SMU Seminar September 9, 2005 – p.24/42
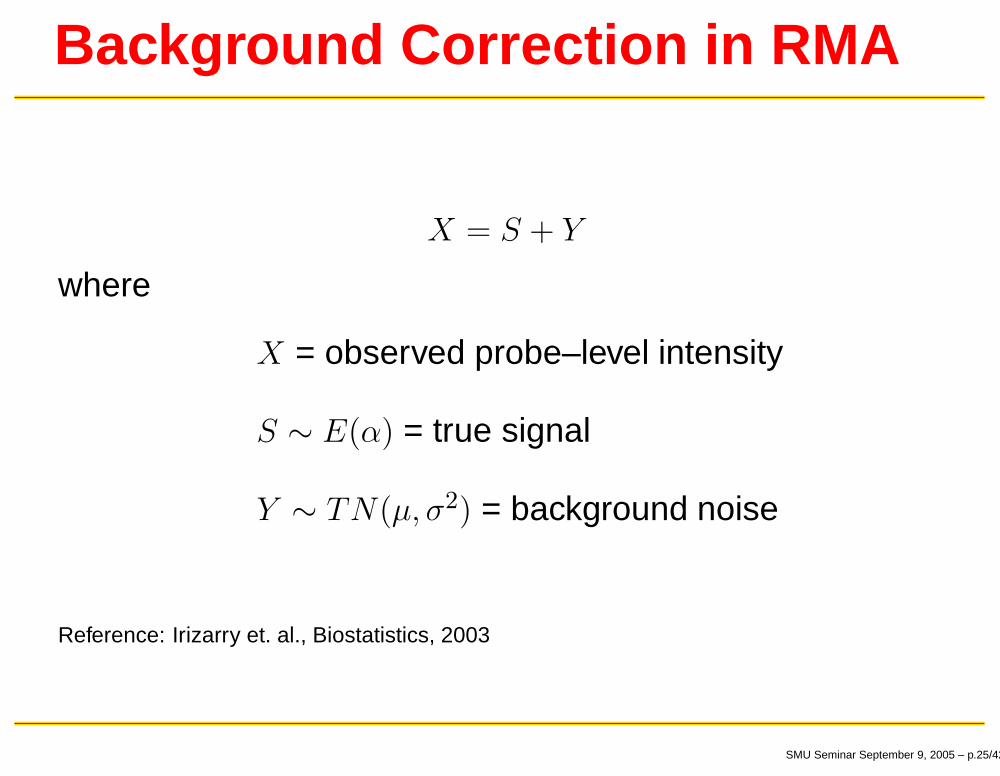
Background Correction in RMA
X = S + Y
where
X = observed probe–level intensity
S ∼ E(α) = true signal
Y ∼ TN(µ, σ2) = background noise
Reference: Irizarry et. al., Biostatistics, 2003
SMU Seminar September 9, 2005 – p.25/42
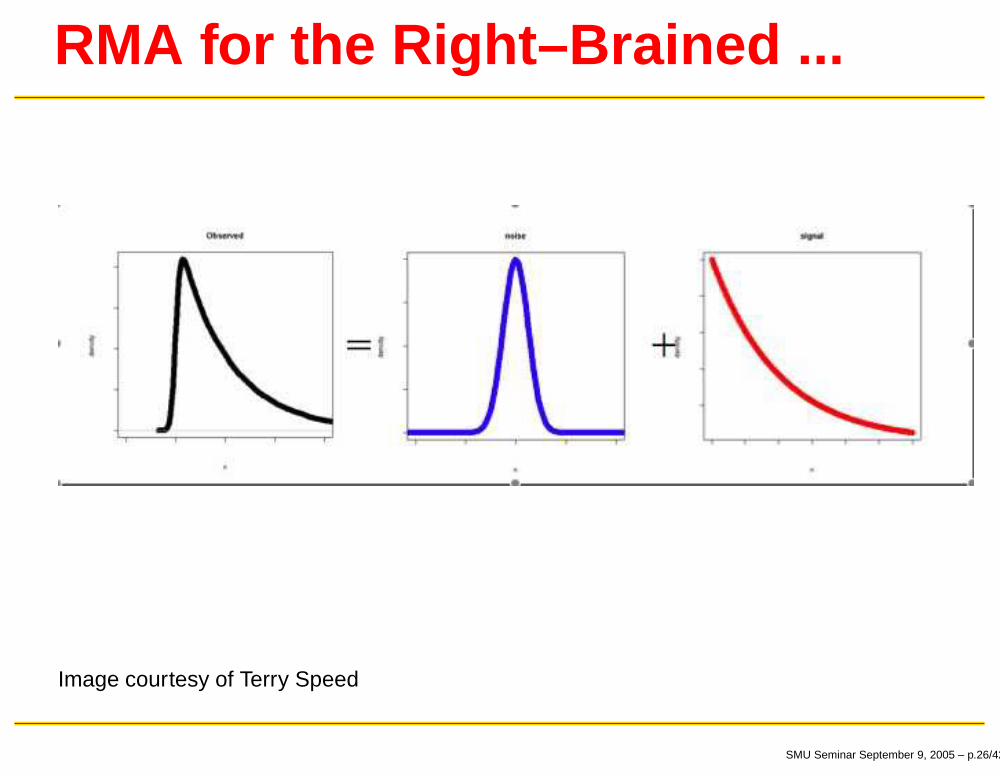
RMA for the Right–Brained ...
Image courtesy of Terry Speed
SMU Seminar September 9, 2005 – p.26/42

Colon Cancer Cell Line DataMicroarrays of four cell lines
HCT116: Microsatellite Instability Model
HCT111 Plus 3: MSI plus a corrective gene
SW48: CIMP line (silencing of genes)
SW480: Chromosomal Instability (CIN) line
Four treatments to each line (including no treatment)
Two “control” cell lines (RKO & HT29)
Total of 18 microarrays
SMU Seminar September 9, 2005 – p.27/42
Colon Cancer Cell Line DataMicroarrays of four cell lines
HCT116: Microsatellite Instability Model
HCT111 Plus 3: MSI plus a corrective gene
SW48: CIMP line (silencing of genes)
SW480: Chromosomal Instability (CIN) line
Four treatments to each line (including no treatment)
Two “control” cell lines (RKO & HT29)
Total of 18 microarrays
Question: What genes are differentially expressed among thevarious cell lines?
SMU Seminar September 9, 2005 – p.27/42
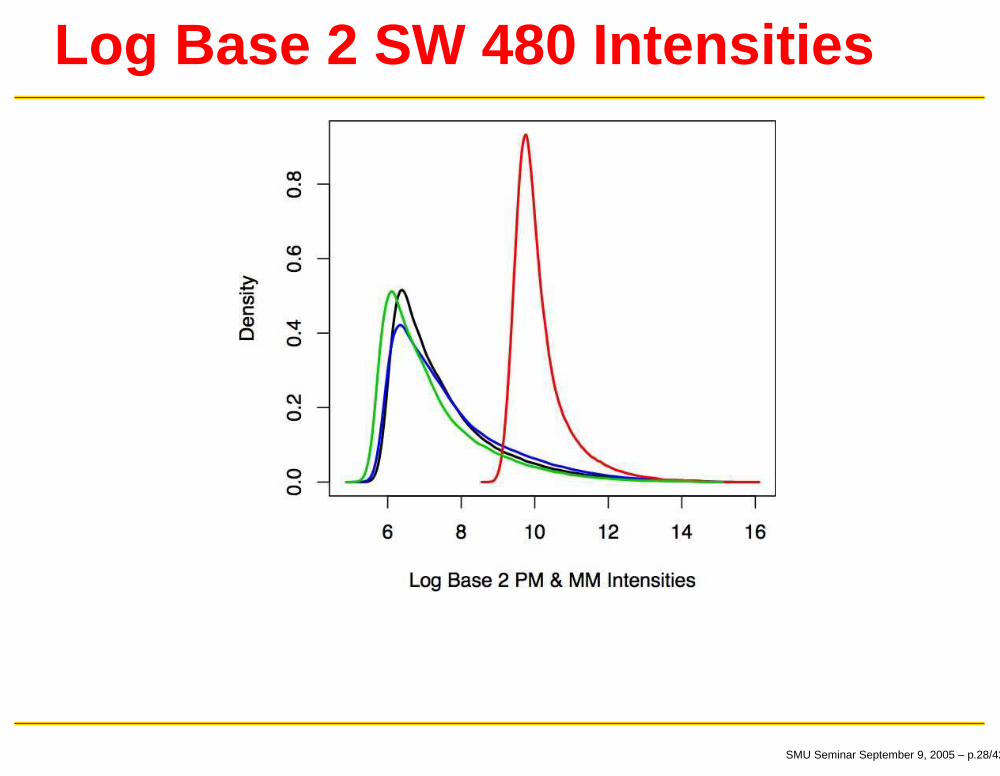
Log Base 2 SW 480 Intensities
SMU Seminar September 9, 2005 – p.28/42
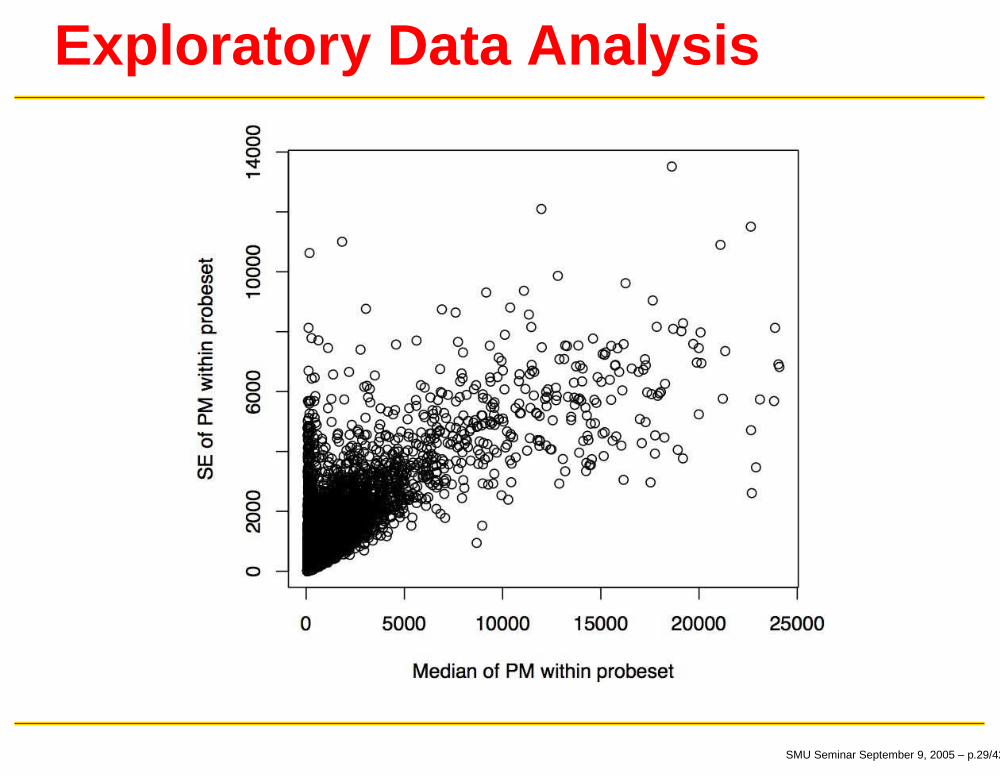
Exploratory Data Analysis
SMU Seminar September 9, 2005 – p.29/42
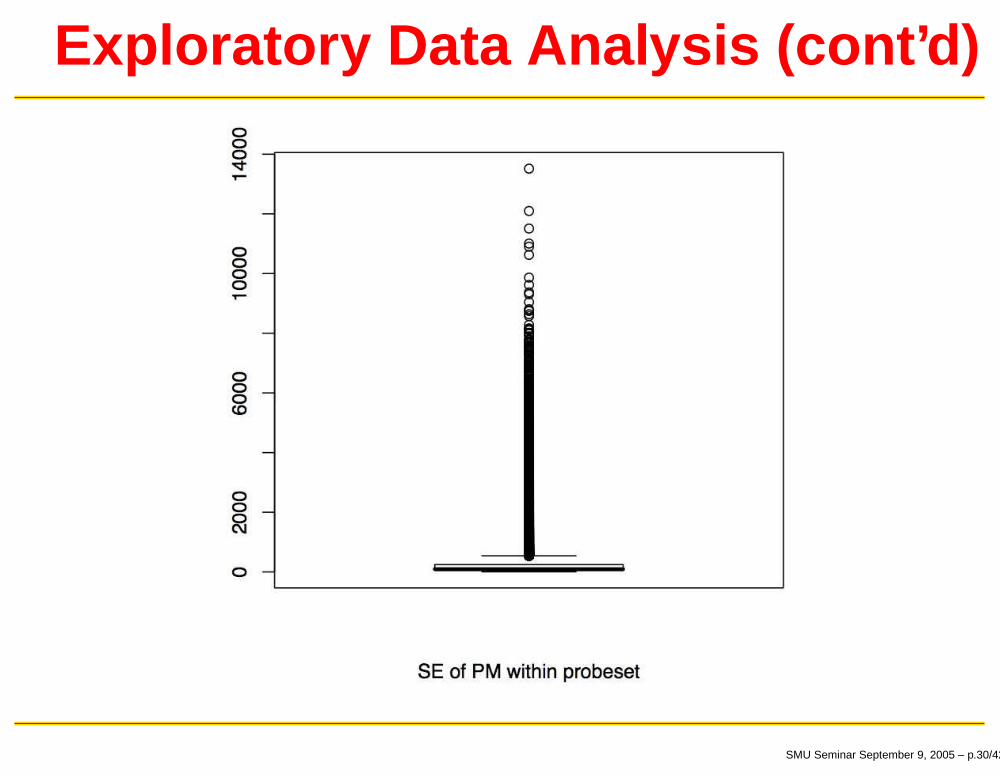
Exploratory Data Analysis (cont’d)
SMU Seminar September 9, 2005 – p.30/42
Parameter EstimationBackground Corrected intensity is Eij = E(Sij|Xij),where i = 1 . . . G, and j = 1, . . . , J .
We need to estimate µ, σ, and α.
SMU Seminar September 9, 2005 – p.31/42
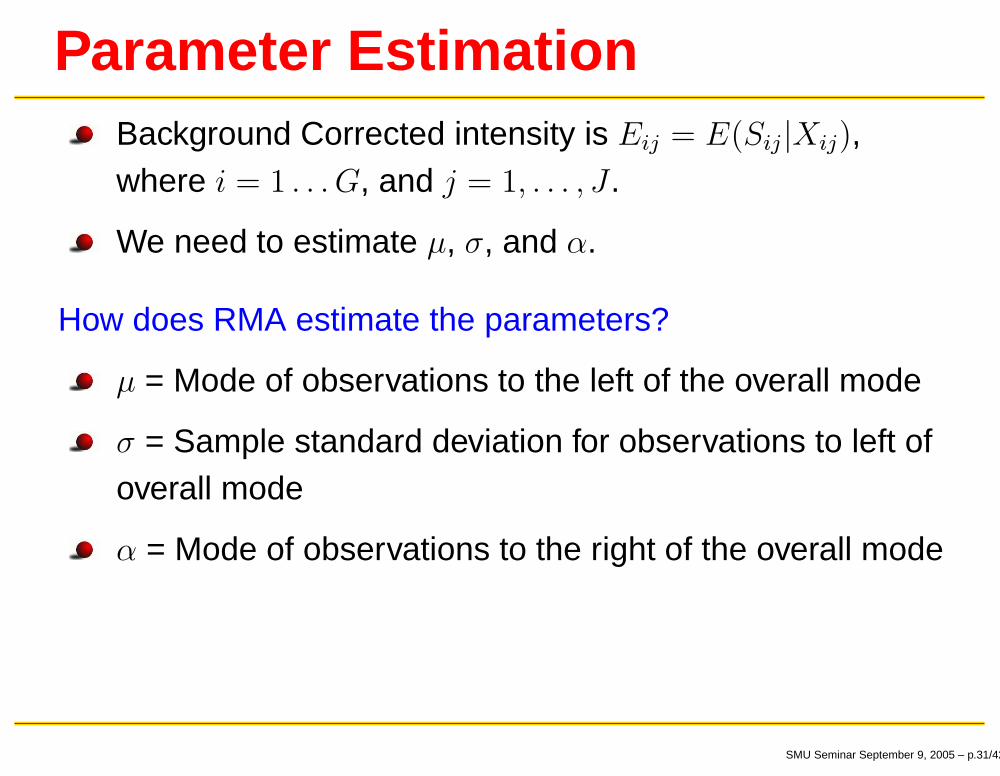
Parameter EstimationBackground Corrected intensity is Eij = E(Sij|Xij),where i = 1 . . . G, and j = 1, . . . , J .
We need to estimate µ, σ, and α.
How does RMA estimate the parameters?
µ = Mode of observations to the left of the overall mode
σ = Sample standard deviation for observations to left ofoverall mode
α = Mode of observations to the right of the overall mode
SMU Seminar September 9, 2005 – p.31/42
Simulation Experiment
100 replications for n = 100, 000.
True parameter values of µ = 50, 100, σ = 10, 20, andα = 50, 250.
Estimate of σ is the same as RMA
Four methods for estimating α: Mean, Median, 75th
percentile, and 99.95th percentile of PM values largerthan overall mode
Five methods of estimating µ
SMU Seminar September 9, 2005 – p.32/42
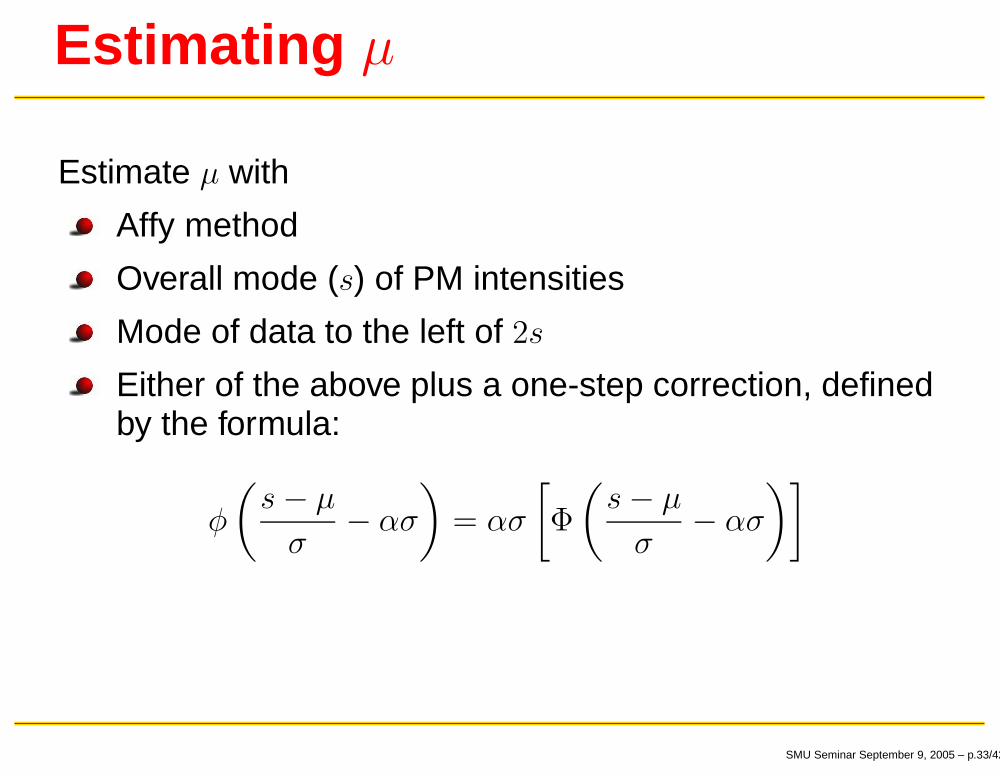
Estimating µ
Estimate µ with
Affy method
Overall mode (s) of PM intensities
Mode of data to the left of 2s
Either of the above plus a one-step correction, definedby the formula:
φ
(
s − µ
σ− ασ
)
= ασ
[
Φ
(
s − µ
σ− ασ
)]
SMU Seminar September 9, 2005 – p.33/42

Results
MSE for α, when µ = 50, σ = 10, α = 50
Using RMA: 1754
SMU Seminar September 9, 2005 – p.34/42
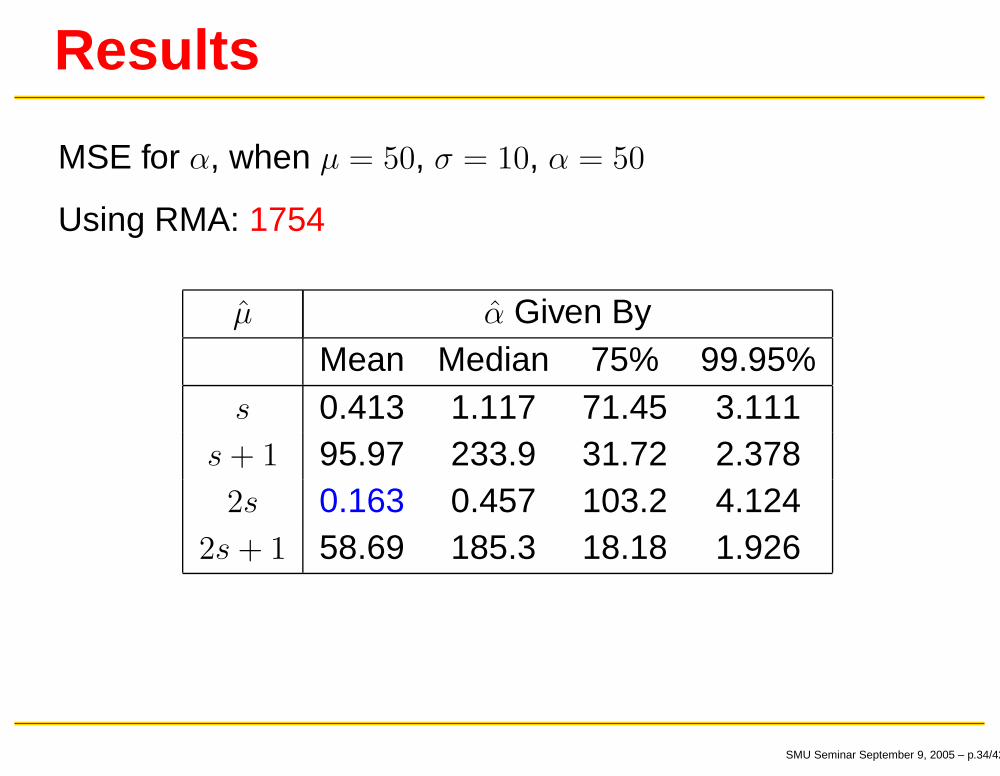
Results
MSE for α, when µ = 50, σ = 10, α = 50
Using RMA: 1754
µ̂ α̂ Given ByMean Median 75% 99.95%
s 0.413 1.117 71.45 3.111s + 1 95.97 233.9 31.72 2.3782s 0.163 0.457 103.2 4.124
2s + 1 58.69 185.3 18.18 1.926
SMU Seminar September 9, 2005 – p.34/42
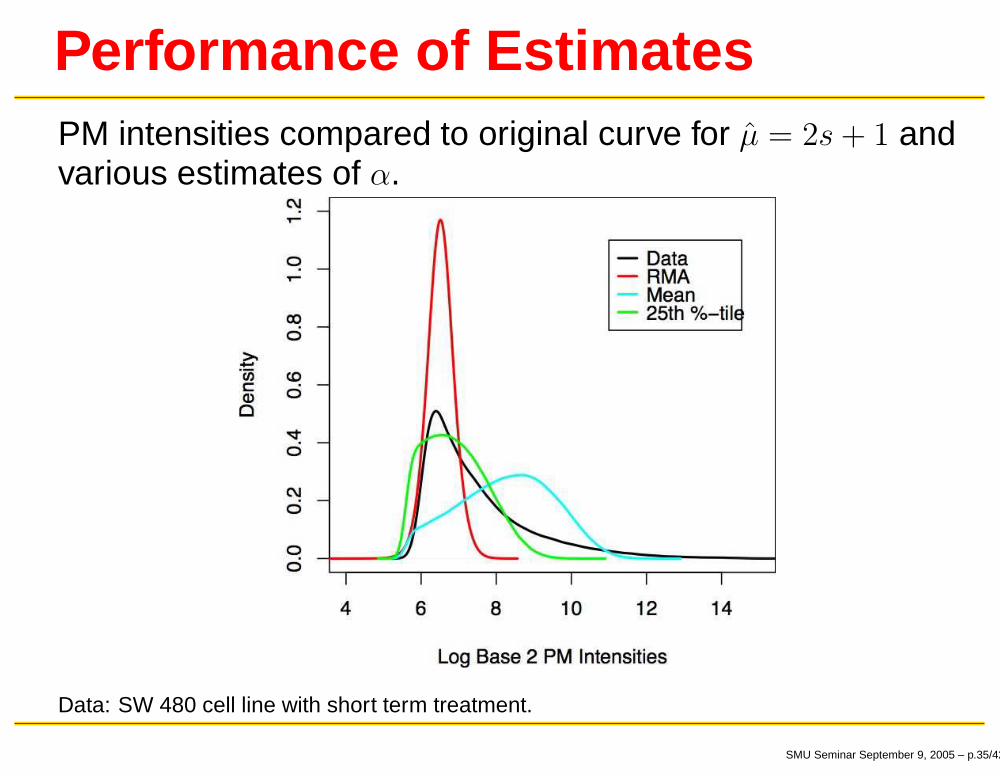
Performance of EstimatesPM intensities compared to original curve for µ̂ = 2s + 1 andvarious estimates of α.
Data: SW 480 cell line with short term treatment.
SMU Seminar September 9, 2005 – p.35/42
An Aside on RMA
RMA has been shown to give results which are
More precise
More accurate
compared to more principled approaches.
Hein, et. al. BGX: a fully Bayesian integrated approach tothe analysis of Affymetrix GeneChip data, Biostatistics,2005
SMU Seminar September 9, 2005 – p.36/42

Other Ideas Yet Untried
Fourier or Bootstrap Deconvolution(Hall & Qiu 2005, Cordy & Thomas 1997)
SMU Seminar September 9, 2005 – p.37/42

Other Ideas Yet Untried
Fourier or Bootstrap Deconvolution(Hall & Qiu 2005, Cordy & Thomas 1997)
Nonparametric Approach
SMU Seminar September 9, 2005 – p.37/42
Other Ideas Yet Untried
Fourier or Bootstrap Deconvolution(Hall & Qiu 2005, Cordy & Thomas 1997)
Nonparametric ApproachFind smallest k1% of PM intensities
SMU Seminar September 9, 2005 – p.37/42
Other Ideas Yet Untried
Fourier or Bootstrap Deconvolution(Hall & Qiu 2005, Cordy & Thomas 1997)
Nonparametric ApproachFind smallest k1% of PM intensitiesObtain k2% of corresponding MM intensities
SMU Seminar September 9, 2005 – p.37/42
Other Ideas Yet Untried
Fourier or Bootstrap Deconvolution(Hall & Qiu 2005, Cordy & Thomas 1997)
Nonparametric ApproachFind smallest k1% of PM intensitiesObtain k2% of corresponding MM intensitiesMM intensities are an estimate of background noise
SMU Seminar September 9, 2005 – p.37/42
Other Ideas Yet Untried
Fourier or Bootstrap Deconvolution(Hall & Qiu 2005, Cordy & Thomas 1997)
Nonparametric ApproachFind smallest k1% of PM intensitiesObtain k2% of corresponding MM intensitiesMM intensities are an estimate of background noise
Model PM intensities as Nonstandard Mixtures(Statistical Science, 1989)
SMU Seminar September 9, 2005 – p.37/42
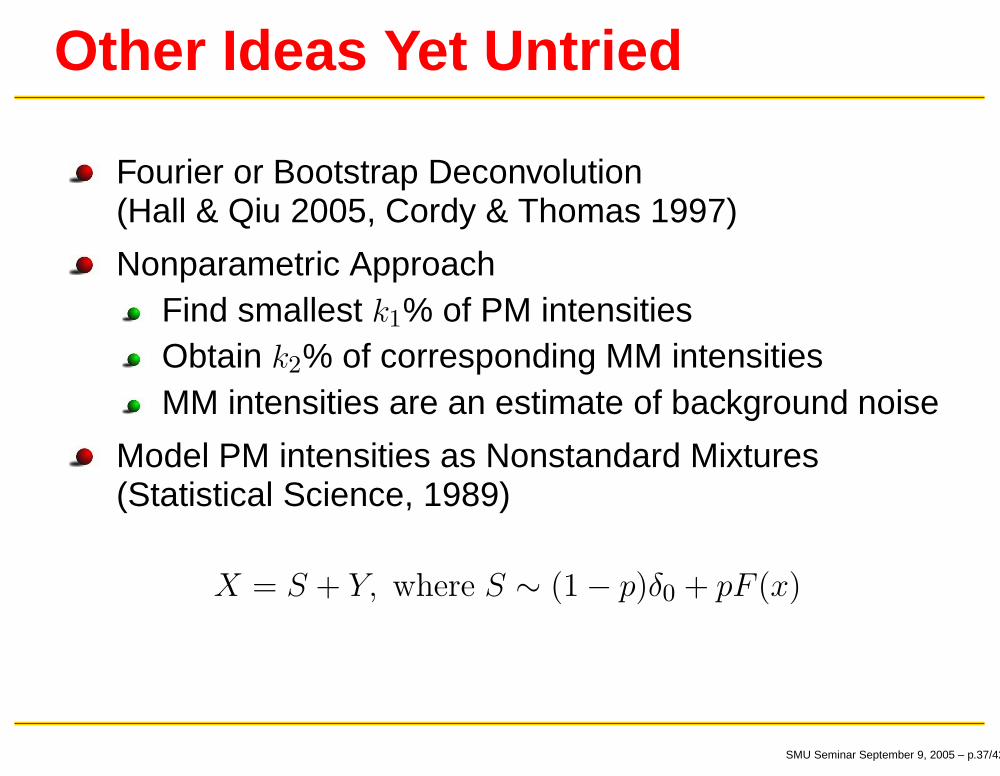
Other Ideas Yet Untried
Fourier or Bootstrap Deconvolution(Hall & Qiu 2005, Cordy & Thomas 1997)
Nonparametric ApproachFind smallest k1% of PM intensitiesObtain k2% of corresponding MM intensitiesMM intensities are an estimate of background noise
Model PM intensities as Nonstandard Mixtures(Statistical Science, 1989)
X = S + Y, where S ∼ (1 − p)δ0 + pF (x)
SMU Seminar September 9, 2005 – p.37/42
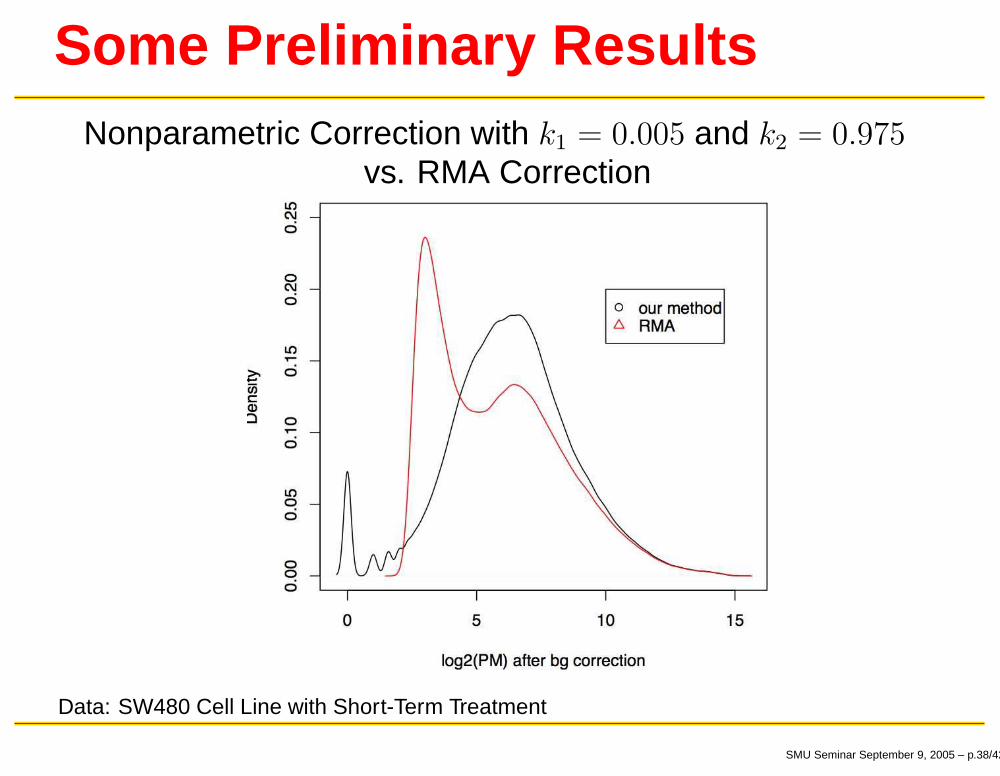
Some Preliminary ResultsNonparametric Correction with k1 = 0.005 and k2 = 0.975
vs. RMA Correction
Data: SW480 Cell Line with Short-Term Treatment
SMU Seminar September 9, 2005 – p.38/42
More Work To Do ...
Does our background correction method result in the“right” answers?
Analyze Spike-In DataROCs
Methods of Simulating Microarray Data
Estimating background with non-differentially expressed(or control) genes
Spatial Correlation in Affymetrix GeneChip Arrays
Modeling Intensities with a Compound Mixture ofNormal Distributions
Creating pseudo-replicate arrays
SMU Seminar September 9, 2005 – p.39/42
Unanswered Biological Questions
Gene function annotation30,000 genes in human genome
Biological networks: protein interactionDynamic data of variable quality
Comparative genomicsMapping concepts from organism to organism on a
large scale
SMU Seminar September 9, 2005 – p.40/42

Statistical Challenges
Enormous amount of Data
SMU Seminar September 9, 2005 – p.41/42

Statistical Challenges
Enormous amount of Data
Current methods are somewhat ad-hoc
SMU Seminar September 9, 2005 – p.41/42
Statistical Challenges
Enormous amount of Data
Current methods are somewhat ad-hoc
Data integration and visualization
SMU Seminar September 9, 2005 – p.41/42
Statistical Challenges
Enormous amount of Data
Current methods are somewhat ad-hoc
Data integration and visualization
Data has variable specificity
SMU Seminar September 9, 2005 – p.41/42
Statistical Challenges
Enormous amount of Data
Current methods are somewhat ad-hoc
Data integration and visualization
Data has variable specificity
Dynamic nature of data
SMU Seminar September 9, 2005 – p.41/42
Statistical Challenges
Enormous amount of Data
Current methods are somewhat ad-hoc
Data integration and visualization
Data has variable specificity
Dynamic nature of data
Multiple Comparisons
SMU Seminar September 9, 2005 – p.41/42
References1. Affymetrix Technical Note: Design and Performance of the GeneChip Human Genome
U133 Puls 2.0 and Human Genome U133A Plus 2.0 Arrays (2003).www.affymetrix.com .
2. Cordy, C. B. and Thomas, D. R. (1997). Deconvolution of a distribution function.Journal of the American Statistical Association, 92, 1459–65.
3. Hall, Peter and Qiu, Peihua (2005). Discrete-transform approach to deconvolutionproblems. Biometrika, 92, 135–148.
4. Hein, A. K., Richardson, S., Causton, H., Ambler, G. K., and Green, P. J. (2005). BGX:a fully Bayesian integrated approach to the analysis of Affymetrix GeneChip data.Biostatistics, 6, 349–373.
5. Irizarry, R. A. , Bolstad, B. M. , Collin, F., Cope, L. M., Hobbs, B., and Speed, T. P.(2003). Summaries of Affymetrix GeneChip probe level data. Nucleic Acids Research,31 (4) e15.
6. Irizarry, R. A. , Hobbs, B., Collin, F., Beazer-Barclay, Y. D., Antonellis, K. J., Scherf, U.,and Speed, T. P. (2003). Exploration, normalization, and summaries of high densityoligonucleotide array probe level data. Biostatistics, 4, 249–264.
7. Panel on Nonstandard Mixtures of Distributions (1989). Statistical Models andAnalysis in Auditing. Statistical Science, 4, 2-33.
SMU Seminar September 9, 2005 – p.42/42