gender matters - diva portal
TRANSCRIPT
Gender Matters DIFFERENCES AND CHANGE IN DISABILITY AND HEALTH AMONG OUR
OLDEST WOMEN AND MEN
Pär Schön
Stockholm Studies in Social Work 29 • 2011
© Pär Schön, Stockholm 2011
ISSN 0281-2851
ISBN 978-91-7447-253-0
Cover photo: © Inka Schön
Printed in Sweden by US-AB Print Center, City 2011
Distributor: Department of Social Work, Stockholm University

Put me back on my bike
(Tom Simpson)

Abstract
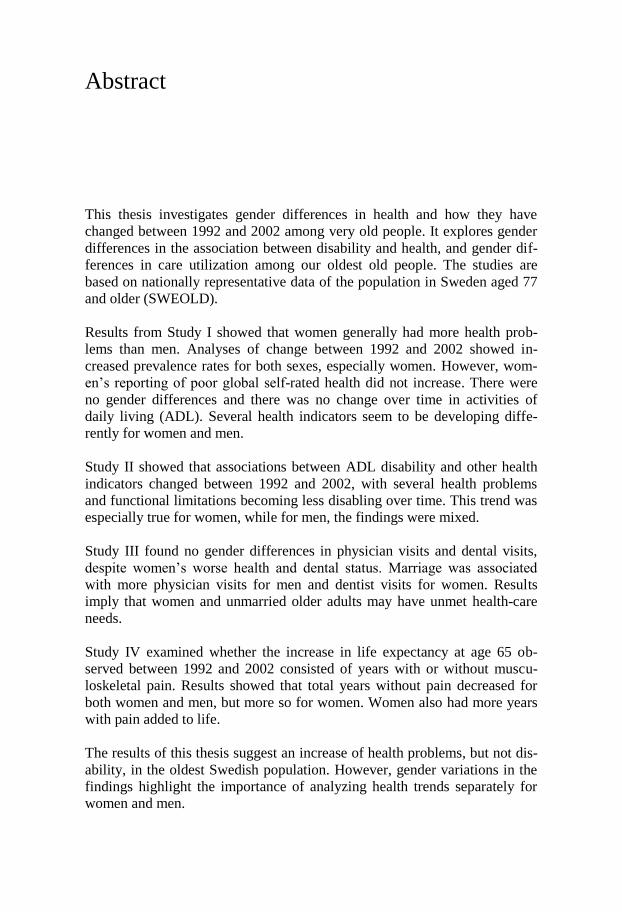
This thesis investigates gender differences in health and how they have
changed between 1992 and 2002 among very old people. It explores gender
differences in the association between disability and health, and gender dif-
ferences in care utilization among our oldest old people. The studies are
based on nationally representative data of the population in Sweden aged 77
and older (SWEOLD).
Results from Study I showed that women generally had more health prob-
lems than men. Analyses of change between 1992 and 2002 showed in-
creased prevalence rates for both sexes, especially women. However, wom-
en’s reporting of poor global self-rated health did not increase. There were
no gender differences and there was no change over time in activities of
daily living (ADL). Several health indicators seem to be developing diffe-
rently for women and men.
Study II showed that associations between ADL disability and other health
indicators changed between 1992 and 2002, with several health problems
and functional limitations becoming less disabling over time. This trend was
especially true for women, while for men, the findings were mixed.
Study III found no gender differences in physician visits and dental visits,
despite women’s worse health and dental status. Marriage was associated
with more physician visits for men and dentist visits for women. Results
imply that women and unmarried older adults may have unmet health-care
needs.
Study IV examined whether the increase in life expectancy at age 65 ob-
served between 1992 and 2002 consisted of years with or without muscu-
loskeletal pain. Results showed that total years without pain decreased for
both women and men, but more so for women. Women also had more years
with pain added to life.
The results of this thesis suggest an increase of health problems, but not dis-
ability, in the oldest Swedish population. However, gender variations in the
findings highlight the importance of analyzing health trends separately for
women and men.


Sammanfattning
Kvinnor lever längre än män. Trots det har kvinnor i många avseenden säm-
re hälsa än män. Detta fenomen brukar kallas för könsparadoxen. Under de
senaste 20 åren har könsskillnaden i förväntad livslängd minskat, mäns för-
väntade livslängd har ökat i snabbare takt än kvinnors. Betydligt mindre är
känt om hur könsskillnaderna i hälsa och funktionsförmåga har utvecklats
över tid.
Det övergripande syftet med denna avhandling är att studera könsskillnader i
hälsa och funktionsförmåga hos den allra äldsta befolkningen, samt om dessa
könsskillnader har förändrats över tid. Ett annat syfte är att studera köns-
skillnader i vårdutnyttjande i form av läkarbesök och tandläkarbesök.
Samtliga delstudier baseras på SWEOLD, som är en riksrepresentativ studie
av levnadsförhållanden bland personer 77 år och äldre. Intervjuer genomför-
des 1992 och 2002 av professionella intervjuare. I studie IV inkluderades
även de äldsta åldersgrupperna (65-75 år) från Levnadsnivåundersökningen
(LNU) 1991 och 2000. Både de äldres subjektiva självrapporterade mått på
hälsa, funktionsförmåga och vårdutnyttjande, samt objektiva tester av deras
funktion (t.ex. fysisk, kognitiv, syn, lungfunktion) analyserades. I samtliga
delstudier gjordes separata analyser för kvinnor och män.
I den första delstudien undersöktes könsskillnader utifrån ett stort antal indi-
katorer på hälsa och funktionsförmåga, samt förändringar i könsskillnader
mellan 1992 och 2002. Resultaten visade att kvinnor generellt rapporterade
mer hälsoproblem och presterade sämre på funktionstesterna än män både
1992 och 2002. Analyser av förändringar över tid visade att hälsan och funk-
tionsförmågan försämrades i de flesta avseenden för både kvinnor och män
mellan 1992 och 2002. De största försämringarna återfanns bland kvinnorna.
Trots kvinnors generellt sämre hälsa och deras större hälsoförsämringar över
tid försämrades däremot inte deras globala självskattade hälsa mellan 1992
och 2002. Resultaten visade inte heller några könsskillnader i förmågan att
utföra aktiviteter i det dagliga livet (ADL, t.ex. att bada, klara toalettbesök,
äta och klä på sig) och instrumentella aktiviteter i det dagliga livet (IADL,
t.ex. att klara städning, matinköp och matlagning). Resultaten i Studie I an-
tyder att sambandet mellan hälsa och förmågan att klara aktiviteter i det dag-
liga livet (ADL och IADL) har förändrats över tid.
Mot bakgrund av dessa resultat undersöktes i Studie II könsskillnader i sam-
bandet mellan funktionshinder (i form av ADL och IADL) och andra indika-
torer på hälsa, samt om dessa könsskillnader förändrades mellan 1992 och
2002. Resultaten visade att sambanden mellan ADL/IADL och andra hälso-
indikatorer var starkare för män än för kvinnor. Det generella mönstret för
kvinnor var att sambanden försvagades mellan 1992 och 2002. För män var
mönstret inte lika entydigt, vissa samband förstärktes medan andra försvaga-
des. Resultaten från Studie II pekar på att ADL och IADL speglar olika di-
mensioner av hälsa för kvinnor och män.
En central fråga inom socialgerontologisk forskning är om den ökande livs-
längden kan kopplas till ett förbättrat hälsotillstånd eller om de år som läggs
till livet består av år med ohälsa och funktionsnedsättning. I Studie IV analy-
serades förekomsten av muskel- och ledvärk för att undersöka om den ökade
livslängden mellan 1992 och 2002 bestod av år med eller utan smärta och
huruvida det fanns skillnader mellan kvinnor och män. Resultaten visade att
för 65-åriga kvinnor bestod den återstående livslängden av en större andel
(och antal) år med smärta än för 65-åriga män, både 1992 och 2002. Den
ökade livslängden mellan 1992 och 2002 bestod av år med smärta både för
kvinnor och för män, för kvinnorna minskade dessutom antalet år utan smär-
ta. Med andra ord, de år som lagts till livet mellan 1992 och 2002 var år med
smärta.
De övergripande målen i både hälso- och sjukvårdslagen och tandvårdslagen
är god hälsa och vård på lika villkor för hela befolkningen. I Studie III ana-
lyserades könsskillnader i vårdutnyttjande gällande besök till läkare och
tandläkare. Trots kvinnors generellt sämre hälsa visade resultaten inga köns-
skillnader i läkarbesök under de senaste 12 månaderna. Däremot var det
vanligare bland män än kvinnor att besöka tandläkare. När hänsyn tagits till
skillnader i civilstånd och tandstatus var det dock ingen skillnad mellan kö-
nen i tandläkarbesök. Civilstånd hade större betydelse för vårdutnyttjande
för män än för kvinnor. Gifta män var mer benägna att besöka både läkare
och tandläkare jämfört med ogifta män.
Sammanfattningsvis visar avhandlingens resultat att kvinnors sämre hälsa
består upp i de allra högsta åldrarna. Resultaten ger inget stöd för att hälsan
bland de allra äldsta skulle ha förbättrats mellan 1992 och 2002, varken för
kvinnor eller för män. Hälsoutvecklingen, för flera av de studerade hälsoin-
dikatorerna, skiljer sig dock åt mellan kvinnor och män under perioden 1992
och 2002. Resultaten visar även på förändringar i sambandet mellan ohälsa
och funktionshinder (ADL och IADL), som dessutom skiljer sig åt beroende
på kön, under perioden. Sammantaget pekar dessa resultat på att det blir allt
viktigare att välja rätt hälsoindikatorer beroende på syfte och användnings-
område. Kunskap om olika hälsoindikatorers utveckling över tid är betydel-
sefull av flera olika skäl; till exempel vid biståndsbedömning av aktuella
behov och vid planering av den framtida inriktningen av vård och omsorg.
List of Original Publications
The thesis is based on the following studies referred to in the text by their
respective roman numerals.
I Schön, P. & Parker, M.G. (2009). Sex differences in health in 1992
and 2002 among very old Swedes. Journal of Population Ageing,
1(2), 107–123.
II Schön, P., Parker, M.G., Kåreholt, I. & Thorslund, M. (in press).
Gender differences in associations between ADL and other health
indicators in 1992 and 2002. Aging Clinical and Experimental Re-
search, 23(2).
III Schön, P., Parker, M.G. & Thorslund, M. (Manuscript). Gender dif-
ferences in physician and dental visits among very old persons. Ka-
rolinska Institutet & Stockholm University.
IV Schön, P., Agahi, N., Thorslund, M., Kåreholt, I. & Parker, M.G.
(Submitted). The pains of a longer life: Gender differences in life
expectancy free from musculoskeletal pain at age 65 in Sweden. Ka-
rolinska Institutet & Stockholm University.
Study I and Study II are reproduced with the permission of the publishers.
Study I © Springer Science and Business Media
Study II © Editrice Kurtis
Abbreviations
Databases
LNU Swedish Level of Living Survey
SWEOLD Swedish Panel Study of the Oldest Old
Health indicators
ADL Activities of daily living, such as bathing/showering, dressing,
toileting, moving around, or eating
IADL Instrumental activities of daily living, such as cleaning house,
shopping for groceries, using public transport, preparing food,
and doing laundry
LE Life expectancy
MCI Myocardial infarction
MMSE Mini-Mental State Examination
Peak flow Peak expiratory flow
PFLE Pain-free life expectancy
SRH Global self-rated health
Other
ICF International Classification of Functioning, Disability, and
Health
OR Odds ratio
SEP Socioeconomic position
WHO World Health Organization
Contents
1 Introduction ....................................................................................... 13 1.1 Population aging ........................................................................................... 13 1.2 Population aging and gender ...................................................................... 14 1.3 Gender and health determinants ............................................................... 15 1.4 Health, disability, and care needs?............................................................ 16 1.5 Population aging and the welfare state .................................................... 18
2 Aims .................................................................................................... 20 2.1 Specific aims .................................................................................................. 20
3 Conceptual issues and explanatory models for gender
differences in mortality and morbidity .................................................. 22 3.1 Health indicators ........................................................................................... 22 3.2 Sex and gender ............................................................................................. 23 3.3 The gender paradox in health .................................................................... 24 3.4 Explanatory models of gender differences in health and mortality ..... 25
3.4.1 Biological explanations ...................................................................... 26 3.4.2 Social explanations ............................................................................ 27
3.5 Historical context .......................................................................................... 30 3.6 Differences in men’s and women’s health and mortality – biological,
social, or both? ........................................................................................................ 33
4 Gender and health trends .............................................................. 34 4.1 Increased life expectancy ............................................................................ 34
4.1.1 The development of life expectancy for women and men .......... 34 4.1.2 Old age is dominated by women ..................................................... 36
4.2 Health trends matter .................................................................................... 37 4.3 Increased life expectancy – more years of good or poor health? ........ 37
4.3.1 Hypotheses about years in good or poor health .......................... 38 4.4 Both improved and worsened health – mixed trends ............................ 40
4.4.1 Positive trends from 1970 to the mid-1990s – thereafter unclear
.............................................................................................................. 40 4.4.2 Compression and expansion of morbidity – why diverging
results? .............................................................................................................. 41 4.4.3 The gender gap in health among the oldest old people: getting
bigger or smaller? .............................................................................................. 42
5 Gender equity in the utilization of care services ....................... 43 5.1 The objectives of care services – equal access for equal need ............ 43 5.2 Fair care – inequality and inequity regarding utilization of care
services ..................................................................................................................... 44 5.3 Factors affecting utilization of care services ............................................ 45
5.3.1 How does gender affect services and care utilization?................ 46 5.4 Different care services ................................................................................. 47
5.4.1 Medical care ........................................................................................ 48 5.4.2 Dental care .......................................................................................... 49
6 Material and methods ...................................................................... 51 6.1 Data ................................................................................................................. 51
6.1.1 The Swedish Level of Living Survey ............................................... 51 6.1.2 The Swedish Panel Study of Living Conditions of the Oldest Old ..
.............................................................................................................. 51 6.2 Measurements ............................................................................................... 52
6.2.1 Indicators of health and disability ................................................... 52 6.2.2 Indicators of care utilization............................................................. 56
7 Overview of the studies .................................................................. 57 7.1 Study I: Sex differences in health in 1992 and 2002 among very old
Swedes ...................................................................................................................... 57 7.2 Study II: Gender differences in associations between ADL and other
health indicators in 1992 and 2002 ..................................................................... 58 7.3 Study III: Gender differences in visits to the physician and dentist
among very old persons ......................................................................................... 59 7.4 Study IV: The pains of a longer life: Gender differences in life
expectancy free from musculoskeletal pain at age 65 in Sweden ................. 60
8 Discussion .......................................................................................... 62 8.1 Worsening of health for women and men, especially women .............. 62 8.2 Expansion of morbidity and compression of disability ........................... 64 8.3 Changing relationships between health indicators ................................. 66 8.4 Gender differences in care utilization........................................................ 67 8.5 Methodological considerations .................................................................... 69
8.5.1 Representativity ................................................................................. 69 8.5.2 Capturing change ............................................................................... 70 8.5.3 Other concerns ................................................................................... 71
8.6 Concluding remarks and recommendations for future research .......... 72
9 Acknowledgements .......................................................................... 75
10 References ......................................................................................... 78
13
1 Introduction
1.1 Population aging
The twentieth century witnessed a revolution in regard to aging, with dra-
matic increases in life expectancy by as many as 30 years in many countries.
This development has mainly been driven by improved living conditions and
medical advancements. Both increased longevity and decreased fertility are
to a large extent influenced by the remarkable social and economic devel-
opment of the past century. Since the increases in life expectancy have been
accompanied by decreases in fertility rates, both the absolute number and the
proportion of elderly people have increased, thus resulting in an aging popu-
lation. Population aging implies a shift in age distribution in a society to-
wards older ages (Bengtsson & Scott, 2010).
Population aging is often called one of humanity’s greatest triumphs but also
one of our greatest societal challenges of the future. There are no signs of
stagnation in this demographic development; facing the twenty-first century,
aging populations all over the world could lead to economic and social
strains (WHO, 2002a). Right now the populous baby boom generation of the
1940s is entering retirement. According to demographic projections of popu-
lation for the European Union, the number of persons aged 65 years and
older is expected to increase by 70 percent from year 2000 to 2050 (Eurostat,
2005). Today, the fastest growing segment of the population in Europe and
many other countries is the very oldest of old people, a segment referred to
as the oldest old.
Sweden is often described as a forerunner in regard to population aging.
During the twentieth century the proportion of people aged 65 and older
increased from 8 percent to 17 percent (Bengtsson & Scott, 2010). In the
year 2000, Sweden became the first country in the world with more than
5 percent of the total population aged 80 years and older. According to Sta-
tistic Sweden’s population forecast, the number of people aged 80 years and
older in Sweden is going to double in the first half of this century, from
453,000 in year 2000 to 903,000 in year 2050. This demographic challenge
will certainly put the Swedish welfare state to test, with presumed severe
strains on old-age care, health care, and the pension system.
14
The prevalence of most health problems increases steeply with age, com-
monly accompanied by increased needs for medical and social services. The
aging of the population, and the numerical increase of elderly people, leads
to the inevitable question of whether the years added to life are characterized
by good health and independence or by health problems and disability.
Population-based studies of health trends among the oldest old are of impor-
tance from a planning perspective when estimating future demands and
needs for care resources.
1.2 Population aging and gender
The likelihood of living a healthy life is not evenly distributed in the popula-
tion. Patterns of morbidity and mortality vary among subgroups in society,
as exemplified by the considerable discrepancy in health and survival be-
tween women and men. It is well documented that women live longer than
men all over the world, but they tend to be sicker and report higher rates of
morbidity. That is, in terms of mortality, women are healthier than men, but
not in regard to morbidity. This is the so-called gender paradox in health
(Oksuzyan et al., 2008; Rieker & Bird, 2005).
Although the main causes of death are similar for women and men (cardi-
ovascular disease, cancer, and stroke), there are substantial gender difference
in both the disease pattern and manifestation of symptoms. In general, men
have a higher risk of acute lethal disease, while women experience more
nonfatal conditions and disability (Oksuzyan, et al., 2008; Rieker & Bird,
2005; Verbrugge, 1987, 1989b). Mental health problems provide a good
example of the gender-specific manifestations of symptoms, with women
having considerably higher rates of depression and anxiety (internalizing
disorders), while men have higher rates of substance abuse, antisocial beha-
vior, and suicide (externalizing disorders) (Bird & Rieker, 2008; Directorate-
General Health and Consumer Protection, 2004).
Many factors other than gender influence the likelihood of living a long and
healthy life, such as socioeconomic position, genetics, health behavior, and
access to care. These factors are, however, interrelated with gender.
Because of gender differences in health and mortality, it is likely that, as life
expectancy increases, the added years of life will be experienced differently
by women and men. However, not much is currently known about the spe-
cific nature of gender differences in health and health care utilization among
the oldest old, or how these differences have evolved over time. Developing
a clearer understanding of the health experiences of women and men during
their final years of life is important for being able to anticipate and manage
the care needs of the aging population more effectively.
15
1.3 Gender and health determinants
Health is important in all aspects of life, both on individual and societal le-
vels. Health is an important component of quality of life and the key deter-
minant of independence in old age. Good health is a central resource needed
for managing daily life as well as for participating in social life and leisure
activities (Arber & Ginn, 1993; Gunnarsson, 2009; Lahelma et al., 2002).
Health and disability among older persons depends on a range of factors or
determinants that have surrounded the individual and have accumulated
throughout life (Walters, 2004). Gender is an important determinant of
health and disability that permeates all aspects of life, cutting across other
determinants (Arber & Thomas, 2001). Gender has a great impact on factors
such as socioeconomic position, access to care and services, and health be-
havior (WHO, 2001). The importance of gender as a health determinant has
been summarized as follows.
Because gender is embedded in the major social organizations of socie-
ty, such as the economy, the family, politics, and the medical and legal
systems, it has a major impact on how the women and men of different
social groups are treated in all sectors of life, including health and ill-
ness, getting born and dying (Lorber & Moore, 2002, p. 5).
During the last decades there have been dramatic changes in gender roles
and many other social factors that affect women’s and men’s health and
mortality in different ways (for a historical context, see chapter 3, 3.5).
A range of social factors is associated with health. For example, education is
associated with both mortality (Erikson, 2001; Zajacova, 2006) and morbidi-
ty (Buckley et al., 2005). Another such health related factor is the labor mar-
ket, both in regard to rates of participation and working conditions.
There have been substantial changes in educational level over time. In Swe-
den, more recent cohorts of elderly people have a higher educational level
than previous cohorts. This has led to a structural increase in socioeconomic
status in the elderly population. The greatest increases in education have
been made by women. The compositional change to a higher socioeconomic
status of the elderly population may influence both mortality and health sta-
tus as well as utilization of health and social care services in old age (Batljan
& Thorslund, 2009; Crimmins, 2004).
Labor force participation has also changed over time. The labor market is
gender segregated and affects women’s and men’s health differently. Wom-
en are often disadvantaged in regard to work compensation (in money and
status), career opportunities, and the physical and psychosocial work envi-

16
ronment. Domestic work is another area of importance for gender-related
health. Despite great changes, women still perform the major share of do-
mestic work (Hammarström et al., 2001). Paid employment is generally
good for both women’s and men’s health, but women’s increased labor force
participation has contributed to role conflicts and a higher total workload (U.
Lundberg, 2002).
Understanding the evidence on health determinants over the life course will
assist greatly in designing policies and programs that facilitate good health
(WHO, 2001). Therefore, when studying gender differences in health it is
important to consider earlier life course factors that change over time and
that are likely to affect women and men differently.
1.4 Health, disability, and care needs?
Health problems are strong determinants of disability. For example, stroke is
a medical condition that requires extensive medical care and often leads to
disability. Stroke incidence increases steeply with age (Feigin et al., 2003).
Due to gender differences in a range of risk factors, both social and biologi-
cal, there are clear gender differences in incidence as well as in the conse-
quences of stroke (Appelros et al., 2009).
The Disablement Process model, developed by Verbrugge and Jette (1994),
outlines the causal main pathway from pathology, via impairments and func-
tional limitations, to disability.
1. Pathology includes biochemical and physiological abnormalities (disease,
injury and innate or developmental conditions) and could be chronic (pro-
gressive diseases) or acute (short-term diseases and injuries). Pathology is
often detected through impairment.
2. Impairment refers to dysfunctions and structural abnormalities in specific
body systems that can have consequences for physical, psychological, and
social functioning.
3. Functional limitations are restrictions in basic everyday actions that are
physical (walking, mobility, hearing and seeing problems, and communicat-
ing) and/or psychological (cognitive and emotional functions such as short-
term memory, comprehensible speech, and orientation in time and space).
4. Disability is difficulties in performing activities as a consequence of
health or a physical problem. Studies of older people most often focus on
disability in ADL and IADL There are several ways to measure disability.
The standard procedure is through interviews (self-reports or proxy reports).
Another way to measure disability is by observation.
Verbrugge and Jette (1994) defined disability as the gap between an individ-
ual’s capability – physical, psychological, and cognitive – and the activity’s
17
demand. This means that disability is a contextual concept rather than a per-
sonal characteristic. Thus, functional limitations (action) are an individual’s
capability without respect to situational demand, while disability (activity) is
a social process (Verbrugge & Jette, 1994).
Disability arises from an interaction between an individual’s functional sta-
tus and a wide range of contextual factors that surround the individual – risk
factors, extra-individual factors, and intra-individual factors. Most of these
are affected by gender in the form of social factors (education, social policy,
and gender norms), personal factors (biology and personality), health and
social services (the welfare system), physical environment (housing stan-
dards and access to public buildings, transportation, and microwave ovens),
economic factors, and behavioral factors (smoking, alcohol, and physical
activity).
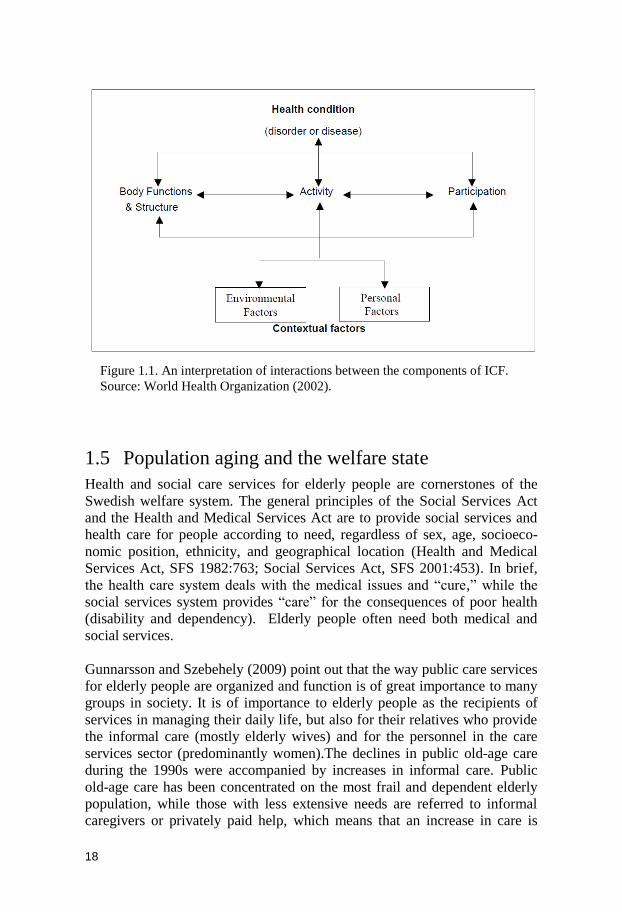
Disability is, in turn, strongly associated with needs for social services and
care. The association between health and disability is illustrated by the Inter-
national Classification of Function, Disability, and Health (ICF), which is a
framework for health and disability developed by WHO. Figure 1.1 shows a
representation of the model of disability, the basis for ICF. Similar to the
Verbrugge and Jette model, the ICF model proposes that disability and func-
tioning are the results of interactions between health conditions and contex-
tual factors. The ICF model classifies health and disability from body, indi-
vidual, and societal perspectives and differentiates between four components
of health and function: body structure, body function, activities, and partici-
pation. The ICF model suggests that these components have different impli-
cations for the interventions of care and services that are needed. For in-
stance, diseases and symptoms (body structure and function) call for medical
care. Limitations in activities, on the other hand, imply a need for social
services, rehabilitation, therapy, assistive devices, and housing adaptations.
Participation restrictions might call for interventions on both individual and
societal levels in the form of accommodation and other environmental
changes, as well as public education and antidiscrimination legislation
(WHO, 2002b).
Diseases and symptoms are commonly used health indicators in population
based studies of elderly people. But without information of severity and con-
sequences, these measures do not tell us much about the need for different
types of social services (home care or institution). Persons with ischemic
heart disease or degenerative disorders such as Parkinson’s disease might
have a need for institutional living, but they could also live a completely
independent life. Therefore, many studies include indicators of functional
limitations and disability (Parker & Thorslund, 2007). These measures re-
flect the cumulative effect of pathology, impairment, and function.
18
1.5 Population aging and the welfare state
Health and social care services for elderly people are cornerstones of the
Swedish welfare system. The general principles of the Social Services Act
and the Health and Medical Services Act are to provide social services and
health care for people according to need, regardless of sex, age, socioeco-
nomic position, ethnicity, and geographical location (Health and Medical
Services Act, SFS 1982:763; Social Services Act, SFS 2001:453). In brief,
the health care system deals with the medical issues and ―cure,‖ while the
social services system provides ―care‖ for the consequences of poor health
(disability and dependency). Elderly people often need both medical and
social services.
Gunnarsson and Szebehely (2009) point out that the way public care services
for elderly people are organized and function is of great importance to many
groups in society. It is of importance to elderly people as the recipients of
services in managing their daily life, but also for their relatives who provide
the informal care (mostly elderly wives) and for the personnel in the care
services sector (predominantly women).The declines in public old-age care
during the 1990s were accompanied by increases in informal care. Public
old-age care has been concentrated on the most frail and dependent elderly
population, while those with less extensive needs are referred to informal
caregivers or privately paid help, which means that an increase in care is
Figure 1.1. An interpretation of interactions between the components of ICF.
Source: World Health Organization (2002).

19
often provided by middle-aged daughters and elderly wives (Szebehely,
2003).
The care of elderly people has a high priority on the social policy agenda,
and is of great concern to many people. Municipal old-age care is the largest
part of the Swedish social services budget (National Board of Health and
Welfare, 2011). In 2009 the cost of the municipal old-age care was estimated
at 53 percent of the total cost of social services. The largest part of old-age
care is financed through municipal taxes and government grants.
Social work regarding old-age care takes place on different levels: individu-
al, family, organizational, and societal. National, municipal, and private pro-
viders are involved. The work of this dissertation has implications in one
way or another at several levels. The main outcomes studied, and the chang-
ing associations between them, are of importance when considering future
needs for care and services in the population.
20
2 Aims
There are two general aims of this thesis: One objective is to describe and
analyze gender differences as well as changes over time in health, physical
function, and disability among the oldest old people in Sweden. To this end,
a wide range of both self-reported and test-based health indicators were ana-
lyzed. A second objective is to study whether there are any gender differenc-
es in the utilization of care services regarding visits to physicians and dent-
ists. In this thesis, we have not attempted to distinguish between sex (biolog-
ical) and gender (social and cultural) differences. As explained in 3.2, we use
the terms interchangeably.
2.1 Specific aims
To describe sex differences in health and disability in 1992 and 2002 among
the oldest old people in Sweden (Study I).
To analyze whether any changes in the sex differences in health occurred
between 1992 and 2002 (Study I).
To examine gender differences in the association between disability, as
measured by ADL and IADL, and other health indicators (Study II).
To analyze whether any changes in the gender differences of the associations
between disability and other health indicators occurred between 1992 and
2002 (Study II).
To explore gender differences in care utilization, regarding visits to physi-
cians and dentists, in a sample of very old community-dwelling persons
(Study III).
To describe gender differences in the proportion of years free from muscu-
loskeletal pain in relation to life expectancy at 65 in 1991/1992 and
2000/2002 (Study IV).
21
To examine whether the increased life expectancy between 1991/1992 and
2000/2002 consists of years with or without musculoskeletal pain for women
and men (Study IV).

22
3 Conceptual issues and explanatory models for gender differences in mortality and morbidity
Gender definitely matters. The chance to live a long life in good health is not
evenly distributed between men and women. The sex of a newborn baby has
profound influences on what her or his future life has to offer. Gender struc-
tures an individual’s opportunities and life chances (Ginn & Arber, 1995;
Walters, 2004).
3.1 Health indicators
There are many ways to measure health and functioning in the older popula-
tion, and there is no consensus about which way is best. One way of moni-
toring health and health trends is to measure mortality rates. Mortality is a
dichotomous and valid variable that is relatively easy to measure and follow
over time when we have accurate vital statistics.
Measuring morbidity is a more complicated issue, and there are many ways
to do it, such as self-reports of general and specific diseases, symptoms, or
number of medications. In contrast to mortality, morbidity is a more ambi-
guous concept that encompasses many aspects of physical, cognitive, and
mental health as well as social and environmental factors (Parker &
Thorslund, 2007). Morbidity has shown to be a strong predictor of both mor-
tality and functional status (Manton, 1990) and indicates a need for medical
care.
Many population-based health surveys among elderly people include both
self-reported indicators and ―objective‖ tests that measure physical and cog-
nitive functions, such as the ability to walk, climb stairs, lift, reach, grasp,
see, and hear. Mobility (walking ability) is an oft-included indicator of func-
tioning in studies of older people because of its close association with inde-
pendent living.
23
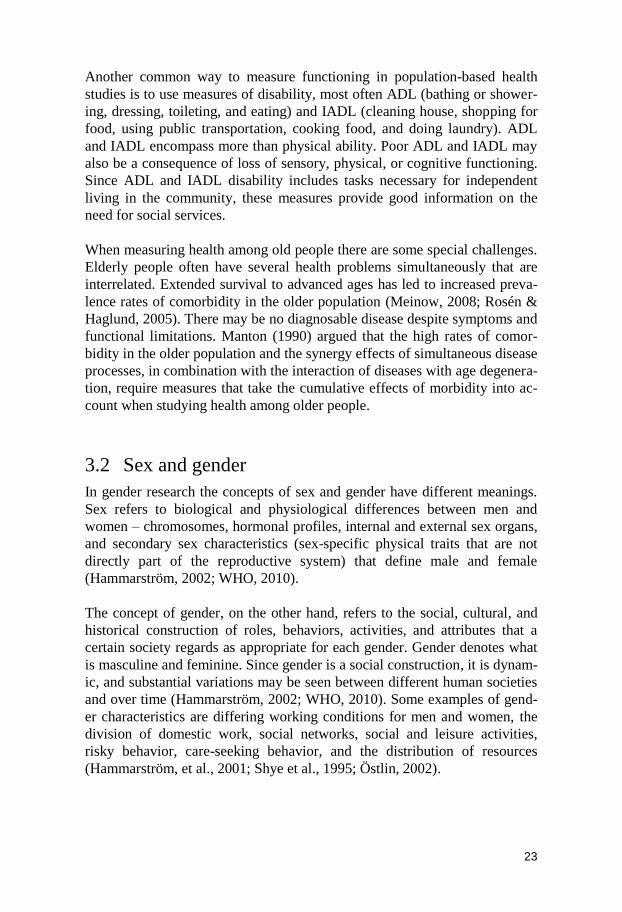
Another common way to measure functioning in population-based health
studies is to use measures of disability, most often ADL (bathing or shower-
ing, dressing, toileting, and eating) and IADL (cleaning house, shopping for
food, using public transportation, cooking food, and doing laundry). ADL
and IADL encompass more than physical ability. Poor ADL and IADL may
also be a consequence of loss of sensory, physical, or cognitive functioning.
Since ADL and IADL disability includes tasks necessary for independent
living in the community, these measures provide good information on the
need for social services.
When measuring health among old people there are some special challenges.
Elderly people often have several health problems simultaneously that are
interrelated. Extended survival to advanced ages has led to increased preva-
lence rates of comorbidity in the older population (Meinow, 2008; Rosén &
Haglund, 2005). There may be no diagnosable disease despite symptoms and
functional limitations. Manton (1990) argued that the high rates of comor-
bidity in the older population and the synergy effects of simultaneous disease
processes, in combination with the interaction of diseases with age degenera-
tion, require measures that take the cumulative effects of morbidity into ac-
count when studying health among older people.
3.2 Sex and gender
In gender research the concepts of sex and gender have different meanings.
Sex refers to biological and physiological differences between men and
women – chromosomes, hormonal profiles, internal and external sex organs,
and secondary sex characteristics (sex-specific physical traits that are not
directly part of the reproductive system) that define male and female
(Hammarström, 2002; WHO, 2010).
The concept of gender, on the other hand, refers to the social, cultural, and
historical construction of roles, behaviors, activities, and attributes that a
certain society regards as appropriate for each gender. Gender denotes what
is masculine and feminine. Since gender is a social construction, it is dynam-
ic, and substantial variations may be seen between different human societies
and over time (Hammarström, 2002; WHO, 2010). Some examples of gend-
er characteristics are differing working conditions for men and women, the
division of domestic work, social networks, social and leisure activities,
risky behavior, care-seeking behavior, and the distribution of resources
(Hammarström, et al., 2001; Shye et al., 1995; Östlin, 2002).
24
In the studies included in this thesis (with the data used) it was not possible
to differentiate between sex and gender. Indeed, the effects of biological and
social factors are interrelated. Therefore, we use the terms interchangeably.
3.3 The gender paradox in health
The gender paradox in health refers to women’s greater life expectancy
compared to men’s while reporting higher rates of morbidity, disability, and
health care consumption (Nathanson, 1977; Oksuzyan, et al., 2008; Rieker &
Bird, 2005; Verbrugge, 1989a; Verbrugge & Wingard, 1987; Wingard,
1984). Although the gender and health paradox is well documented and has
been studied for a long time, neither its reasons nor its mechanisms are com-
pletely understood. Nor do we understand to what extent these differences
are the result of biology (sex) or social roles (gender) (Austad, 2006; Bird &
Rieker, 2008; Oksuzyan, 2009).
It is an established fact that women live longer than men and have lower
mortality rates at all ages, even in utero (Austad, 2006; Kalben, 2000). Pre-
viously there were exceptions among some very poor countries (Pakistan,
India, Afghanistan, and Bangladesh), where girls and women were severely
disadvantaged. But since 2006 women outlive men all over the world
(Barford et al., 2006; Oksuzyan, et al., 2008). Hence, it seems that women
have an advantage over men regarding longevity.
Although women live longer than men, they tend to, on average, report
poorer health. There are pronounced sex differences both in the illness pano-
rama (the prevalence and incidence of disease) and in the types of disease
processes men and women have. Men experience more acute lethal disease
(myocardial infarction and many types of cancer) and die younger, while
women live longer but have a higher risk of nonfatal conditions and chronic
degenerative processes (rheumatoid arthritis, osteoporosis, and diabetes) and
disability (Arber & Cooper, 1999; O. Lundberg, 1990; Macintyre et al.,
1999; Rieker & Bird, 2005; Verbrugge & Wingard, 1987).
During recent decades the gender paradox in health has been challenged by
various studies suggesting that gender differences in morbidity might be
smaller than previously assumed (Arber & Cooper, 1999; Danielsson &
Lindberg, 2001; Gold et al., 2002; Lahelma et al., 1999; Lahelma &
Rahkonen, 1997; Macintyre et al., 1996). These studies imply that the tradi-
tional gender paradox in health is oversimplified.
Some researchers refer to ―new‖ paradoxes. In a British study (age 60+)
Arber and Cooper (1999) argue that women’s substantially higher disability
25
rates, despite negligible gender differences in self-assessed health, constitute
a new gender and health paradox. It has also been argued that women’s low-
er mortality rates all over the world do not indicate that women are more
privileged than men. On the contrary, Danielsson and Lindberg (2001) sug-
gest that women live longer despite having fewer resources, less control over
their lives, and a greater likelihood of being economically, socially, and ma-
terially disadvantaged than men.
3.4 Explanatory models of gender differences in health and mortality
The association between gender and health (function and disability) has
shown to be a very complex research field. The pathways to poor health and
disability are often gender specific and include a number of determinants of
biological and social character (WHO, 2001). A range of possible explana-
tions of gender differences in health, disability, and mortality have been
suggested in the scientific literature. Basically, they could be divided into
two broad categories – biological and social models.
Biological and genetic models. These models focus on sex differences in
biological composition (genes, hormones, and physiology) that might result
in differences in men’s and women’s health and mortality. Biological factors
are primarily universal in nature and change very slowly.
Social, cultural, environmental, and behavioral models. These models high-
light gender differences in socially determined factors (social position, work-
ing conditions, family life, health behavior, care-seeking behavior, and re-
porting differences) that might affect men’s and women’s health differently.
Social factors can, and often do, change over time (Austad, 2006; Bird &
Rieker, 2008; Hammarström, et al., 2001; Kalben, 2000).
A growing body of research suggests that these models cannot alone provide
a complete framework for analyzing causes of gender differences in health.
Many researchers see the need to synthesize biological and social models
when explaining the gender gap in mortality and morbidity (Bird & Rieker,
2008; Hammarström, et al., 2001; Rieker & Bird, 2005; Verbrugge &
Wingard, 1987).
26
3.4.1 Biological explanations
Most biological explanations of gender differences in health and mortality
stem from physiological processes that are associated with pregnancy and
childbirth. There are some fundamental biological differences between men
and women, for instance, in genes, hormones, immune system response, as
well as in disease patterns, and disease processes that can lead to sex differ-
ences in morbidity and mortality (Austad, 2006; Bird & Rieker, 1999).
3.4.1.1 Sex hormones
Sex hormones have attracted much attention for explaining gender differenc-
es in health and mortality. The estrogen hypothesis suggests that estrogen
has a protective effect on cardiovascular disease for women of reproductive
age (Hemström, 2001a; Oksuzyan, et al., 2008; Waldron, 1983).
3.4.1.2 Immune system
Another widespread hypothesis, based on the assumption that longevity pri-
marily is determined by the immune function, is that women live longer
because, throughout their lives, they have a more active immune system than
men. The female sex hormone (estrogen) stimulates the immune system,
while the male sex hormone (testosterone) has an attenuating effect. That is,
because of women’s better immune system, they are more resistant to infec-
tion and therefore live longer. However, it has also been put forward that
women are more likely to have autoimmune diseases, due to an overactive
immune response. That is, women’s more active immune system might lead
to a greater risk of having some diseases (autoimmune thyroid, rheumatoid
arthritis, and systemic lupus erythematosus) (Austad, 2006; Bird & Rieker,
1999; Oksuzyan, et al., 2008).
3.4.1.3 X chromosome hypothesis
An individual’s sex is determined by the sex chromosomes, thus creating the
fundamental difference between men and women. Women have two X
chromosomes, while men have one X chromosome and one Y chromosome.
The Y chromosome is decisive for the development of the male sex. The X
chromosome hypothesis proposes that women’s double set of X chromo-
somes is associated with longer life spans. In short, this means that woman
have two cell lines, one X chromosome from the father and one from the
mother. Women’s double set of X chromosomes seems to be protective and
prevents the expression of most X-linked diseases (hemophilia and Du-
chenne muscular dystrophy). In the aging process, the existence of two X
chromosomes means that the ―stronger‖ of the two will gradually predomi-
nate, and thereby contributing to lower mortality late in life (Austad, 2006;
Christensen et al., 2001; Waldron, 1983).

27
3.4.2 Social explanations
The conditions in which people live and work during their life have an influ-
ence on their health (Kuh et al., 2003). In contrast to biological factors,
which change very slowly, external determinants to ill health, such as social
factors, personal factors, behavioral factors, health and social services, phys-
ical environment, and economic factors, change more rapidly. As shown in
figure 4.1 (see chapter 4), gender differences in mortality change over time.
Substantial variations between nations have also been observed. This sug-
gests that social factors are influential. Social factors seem to affect both
morbidity and mortality differently for men and women, and the impact may
vary over time.
Differences in life circumstances between women and men have been sug-
gested to contribute to gender differences in health. How society is struc-
tured is of importance; the different conditions for men and women at work,
in family life, in social networks, and in social activities all have an impact
on men’s and women’s health (Hammarström, et al., 2001).
3.4.2.1 Labor market participation and socioeconomic position
Sweden has a long tradition of striving against gender inequalities in many
areas. A strong welfare state and policies have facilitated women’s participa-
tion in the labor market. In Sweden today, women’s labor force participation
is one of the highest in the world (Statistics Sweden, 2006b). However, this
has not always been the case. The cohorts of women included in this thesis,
for example, were often housewives or only partially in the labor force. The
Swedish housewife era peaked around 1950, and after 1960, women’s labor
force participation increased dramatically (Nermo, 1999).
Today, the Swedish labor market is highly sex segregated. Women are more
likely to work in lower status jobs with lower wages and more likely to work
part time; as a consequence, they have lower pensions.
Working outside home has shown to be beneficial for women’s health, a
finding which is partly a result of healthy selection into the labor force
(Hemström, 2001b). It has also been shown that men are more likely to relax
at the end of the workday, while women’s levels of stress hormones rises as
they move on to the next ―shift‖ at home. Swedish women are at a high risk
of double exposure when combining paid and unpaid work (U. Lundberg &
Frankenhaeuser, 1999).
Socioeconomic position (SEP), including education, income, and previous
occupation, is associated with health, even among older people. It is well
established that lower SEP is associated with higher mortality risk and poor-

28
er health and functional status (Erikson, 2001; Fors, 2007; Galobardes et al.,
2007; George, 1996; Kunst et al., 2005; Marmot, 2004). The composition of
the population in regard to SEP is changing over time. For example, women
in older cohorts generally have fewer years of education compared to men, a
condition that is changing. The association between SEP and health has been
shown to be weaker among older women than men (Parker et al., 1994).
Results from the United States have shown that educational differences in
healthy life expectancy have increased over time due to a widening gap in
mortality and morbidity (Crimmins & Saito, 2001). Gender differences in
disability and disability-free life expectancy are greater among persons with
low SEP than persons with high SEP (Crimmins & Saito, 2000).
3.4.2.2 Civil status
Another social factor that might contribute to gender differences in health is
civil status. Marriage has been shown to be associated with health benefits,
with better health and lower mortality risk for married persons compared to
unmarried persons. Moreover, marriage seems to benefit men in regard to
health, while its main benefit for women is in socioeconomic conditions (Hu
& Goldman, 1990; Lennartsson & Lundberg, 2007). This association can
primarily be explained by two mechanisms: either marriage is good for
health, or healthier persons are selected into marriage. Empirical evidence
has been found for both explanations (Goldman, 1993).
Younger and middle-aged women are more likely to become single parents
(Rieker & Bird, 2005) and informal caregivers to their elderly parents, while
elderly women more often are caregivers to their older husbands (Szebehely,
2009). Conflicts between working life and family commitments, which in
turn could lead to decreases in income and increases in expenses, seem to
affect women to a greater extent than men. Hence, women are more likely to
experience economic hardship over the life course than men. This is espe-
cially true in older ages as women outlive their men and are therefore more
likely to suffer both from poor economy and support (Bird & Rieker, 1999).
3.4.2.3 Lifestyle and behavior
It is often proposed that men’s lifestyles kill. Research has consistently
shown that there are gender differences in lifestyle and health-related beha-
vior. A range of unhealthy behaviors is more prevalent among men. Men are,
for example, more likely to engage in competitive behavior and risk-taking
such as smoking, alcohol consumption, and less safe driving habits than
women. Men are also more exposed to occupational hazards, which include
both toxins and accidents (Hammarström, et al., 2001; Rieker & Bird, 2005;
Waldron, 1993). These factors contribute to men’s higher risks of cardiovas-

29
cular diseases, lung cancer, chronic obstructive pulmonary diseases, cirrhosis
of the liver, and accidents (Oksuzyan, et al., 2008; Waldron, 1993).
Smoking has received a great deal of attention as a health-related behavior.
Diseases of the respiratory system are increasing rapidly among women due
to changing gender patterns in smoking, with women increasing their rates
of smoking while men have decreased theirs. Over the past twenty-year pe-
riod, women’s lung cancer rates have more than doubled, while men’s have
diminished (Danielsson & Talbäck, 2009). New cohorts of elderly women in
Sweden have higher smoking rates than their predecessors (Ahacic et al.,
2008; J. Persson et al., 2004). This means that upcoming cohorts of elderly
women will have experienced greater participation in the labor force, consi-
derably higher smoking rates, and other patterns of alcohol consumption
than previous cohorts.
3.4.2.4 Reporting behavior and care-seeking behavior
A common explanation for women’s higher levels of morbidity is that there
are gender differences in the way that symptoms are perceived, evaluated,
and acted upon. It is often proposed that women are more likely to report
illness, are more prone to seek help, and have more flexibility in their lives
to accommodate illness. The results of the few studies that have examined
men and women with similar states of health or symptoms are inconsistent,
and they give little support to this assumed greater tendency (Macintyre, et
al., 1999). Arber and Cooper (1999) examined health among British men and
women aged 60 years and older. They found that, for a given level of disa-
bility, it was men rather than women who assessed their health as poor.
Most studies show that women in the general population consume more
medical care and medication than men. A common explanation for women’s
higher care utilization is that, in general, they are socialized to pay attention
to pain and discomfort, while men are socialized to ignore physical discom-
fort (Merrill et al., 1997). Another contributing factor is that women often
have a stronger social network that may encourage them to seek help. On the
other hand, women generally have fewer economic resources than men, and
elderly men are more likely to have a wife to encourage and facilitate seek-
ing help.

30
3.5 Historical context
The health and survival of older women and men are affected by experiences
accumulated throughout their lives. Biological, social, and psychosocial
processes operating throughout life, from childhood through adulthood, af-
fect health in later life. Persons who were born around the same time period
(a birth cohort) share similar working conditions, health behavior, and social
norms (Agahi, 2008; Fors, 2010; Kuh & Hardy, 2002). Periods of starvation,
war, and epidemics also set their imprint on a cohort. The impact of the ex-
perience varies depending on age at exposure. Impact varies also by social
class. And circumstances often affect women and men differently.
Today, Sweden is a wealthy modern welfare state. This has not always been
the case. The Swedish welfare state is a post-World War II phenomenon
(Thorslund & Silverstein, 2009). The cohorts studied in the present thesis
were born in the late nineteenth and early twentieth century, when Sweden
was a largely rural and poor agricultural country. These cohorts were mid-
dle-aged by the time the welfare state began to emerge.
Industrialization occurred relatively late in Sweden (around 1870–1920)
compared to many other European countries. The oldest persons in the
SWEOLD studies were born during the transition from a rural agricultural
country to an urban industrial one. The living areas in the urban districts
were overcrowded, with poor housing and sanitary conditions, and water-
and airborne infections spread easily. There were open, stinking drainage
ditches in the middle of the housing areas. Diarrhea, diphtheria, scarlet fever
and other epidemics were common among children, while adults often suf-
fered from tuberculosis. The living conditions were similar in the northern
parts of Sweden, with primitive shanty towns around the mines and saw-
mills. Working conditions were harsh and working days were long. Exces-
sive alcohol consumption was common among men. For women working at
home, domestic conditions could also be difficult due to a lack of indoor
plumbing, large families, and restriction of space. A typical apartment
among working-class families consisted of one room and a kitchen or kit-
chenette. Families often housed one or more lodgers in order to get extra
income (Sundin & Willner, 2007).
During the period between the wars, 1920–1945, the idea of the welfare state
took shape but conditions were still poor. In a speech to the Swedish Parlia-
ment in 1928, the leader of the Social Democratic Party, Per Albin Hansson,
used the metaphor of ―the people’s home‖ (folkhemmet) for a well-
functioning society. The vision was a system based on equal suffrage, de-
mocracy, and collective security (Sundin & Willner, 2007). Universal suf-
frage in government elections was introduced in 1909 for men, while women

31
were not entitled to vote before 1921. Access to health care services began to
increase during this period but was still not widely available.
The postwar era, when SWEOLD participants were adults, was characterized
by rapid economic growth. The welfare state was developed, with low un-
employment and steadily increasing wages, and the public sector expanded
with improved public health service and social security safety nets (Sundin
& Willner, 2007). This societal development seemed to affect women and
men differently in terms of health and mortality. For example, Hemström
(2001a) found that the increases in material and economic resources ap-
peared to have been accompanied by increased alcohol and cigarette con-
sumption among men, and that economic growth since the 1950s has been
more beneficial for women than men in regard to survival.
During the postwar economic prosperity, many families were able to live on
one salary, in a male-breadwinner–female-housewife model. Therefore, the
1950s and 1960s sometimes are described as the ―housewife era.‖ However,
the housewife era was a historical parenthesis that was followed by a dra-
matic increase in women’s labor force participation. Over the course of two
decades (1960s and 1970s) more than half a million married Swedish women
entered the labor force; by the beginning of the 1980s, the housewife era was
definitely over.
The circumstances of women’s occupations changed from agricultural socie-
ty through industrialization to modern-day Sweden, a postindustrial service
society. During this transition, the organization of care work was of particu-
lar importance to women’s occupations (Axelsson, 1992). Agriculture was
the dominating occupational sector in preindustrial society. At that stage, the
family was the production unit; women combined agricultural productive
work with care work, which led to a double load of domestic and agricultural
work for women.
As a consequence of urbanization and industrialization, productive work was
moved from the family to the factory, while the care work remained in the
family. It was thereby no longer possible for families to combine productive
work and care work. Men became wage workers in a workplace outside the
home, while women became housewives and worked unpaid in the home. In
the postindustrial form of social organization, paid work has moved to the
service sector. Women are employed in the public sector and care work is a
part of the labor market. That is, care work became a part of production.
Successive cohorts of older people have had very different living situations
and housing standards. A report on living conditions and care needs of elder-
ly people in Uppsala County in the late 1950s revealed that most of the pen-
sioners (67 years and older) lived in rented apartments. Around 80 percent of
32
the apartments were equipped with electric or gas stoves, central heating,
sewers and water supply, and toilets. Less than 50 percent of the pensioners
had refrigerators, bathrooms, or telephones. There were, however, great so-
cial-class differences. Nearly all persons from the upper classes, but only
60 percent from the lower classes, had access to these conveniences
(Berfenstam & Hedqvist, 1960).
In a historical overview of aging in a long-term perspective in Sweden,
Sundström and Thorslund (2011) used surveys covering more than fifty
years, from 1954 until today, to describe living conditions and health among
older Swedes. They found substantial improvements over time in health and
living conditions and a dramatic expansion of public services. They also
found that more recent cohorts of older people have totally different life-
styles from earlier cohorts regarding partner choices, time use, and finances.
Today’s older people often own their modern residence, country houses, and
cars, and holiday abroad; more than 90 percent have a cell phone, and more
than half of them have an email address.
The period changes in housing standards can be illustrated by the questions
included on the living-condition surveys. For example, in LNU 1968, partic-
ipants were asked if they had hot water, sewers, shower/bath, indoor toilet,
central heating, stove, refrigerator, telephone, radio, or TV. Many of these
questions have been excluded, concurrent with improved housing standards.
In addition to the extensive social changes of the mid-century, there have
been great developments in medical technologies to diagnose, monitor, or
treat diseases and chronic conditions (even in old age) during the late twen-
tieth century. Medicine, surgery (cataract, hip, and knee), and assistive tech-
nology (hearing aids and walking frames) contribute to cure and manage
health problems in the population. Improved housing standards and adapta-
tions, accessibility in public spaces, public transportation, microwave ovens
and ready-made dinners have facilitated activities and participation in every-
day life for older people even if their function is limited.
During the twentieth century there have been extensive structural changes in
general living and working conditions that have benefited the health of the
older population. Different birth cohorts reaching old age have experienced
very different living conditions during childhood and middle age.
The long-term effects of these rapid changes can be seen in successive co-
horts of elderly people. Even between the SWEOLD samples of 1992 and
2002, we can see changes in a number of factors, which can be seen as re-
sources in regard to health. For example, higher educational levels are asso-
ciated with better health. Earlier cohorts of older people were dominated by
persons with elementary schooling, which is now changing rapidly. Accord-

33
ing to SWEOLD 1992, 23 percent of older persons (aged 77+) had education
higher than elementary school. Corresponding figures in 2002 were 32 per-
cent, and preliminary results from the 2010 survey wave indicate an increase
to more than 50 percent. The proportion of women that had been active in
the labor market increased from 75 percent in 1992 to 82 percent in 2002.
Accordingly, the proportion that had mainly been housewives decreased
from 26 percent in 1992 to 19 percent in 2002.
Great changes have also been observed in successive cohorts approaching
retirement age. Parker and colleagues (2010) used LNU to analyze four dif-
ferent cohorts between 1968 and 2000 aged 50–64 years in regard to health
and other health-related variables. Between 1968 and 2000, the proportion of
people in white-collar occupations and educational level increased. Smoking
increased among women and decreased among men. Utilization of medical
and dental care increased for both women and men. The average BMI in-
creased for both women and men, but most among men. The ability to ap-
peal a decision by a public authority improved for both women and men,
which may reflect a person’s likelihood to actively seek services and demand
entitlements.
SWEOLD participants were born, grew up, and lived their lives under cir-
cumstances very different from those that exist in Sweden today. The
changes that occurred during the twentieth century were so rapid and exten-
sive that the effects of these changes are discernible between the cohorts
studied in 1992 and 2002.
3.6 Differences in men’s and women’s health and mortality – biological, social, or both?
As described above, differences in health and mortality between men and
women are paradoxical and complex. Men and women obviously have some
different biological features that lead to advantages and disadvantages over
the other sex regarding health and mortality. Considerable variations within
the sexes have also been observed, which in turn differ by social and cultural
circumstances. Furthermore, gender differences in health and mortality vary
between societies and countries, as well as between time periods. Taken
together, this implies that gender differences in health and mortality to a
great extent are influenced by social conditions. Therefore, neither biological
nor social models can alone provide sufficient explanations of gender differ-
ences in health and mortality (Bird & Rieker, 2008).
34
4 Gender and health trends
4.1 Increased life expectancy
Sweden has a very long tradition of statistic production with excellent de-
mographic data from the middle of the eighteenth century. These unique data
offer an opportunity to analyze (even for men and women separately) the
dramatic changes of Sweden transforming from a poor agricultural society
into a wealthy industrialized welfare state. These revolutionary changes have
most likely affected men’s and women’s lives in different ways.
During the second half of the eighteenth century, life expectancy at birth was
36.6 years for women and 33.7 years for men in Sweden. From then to to-
day, life expectancy has more than doubled. Today, Sweden has one of the
highest life expectancies in the world, 79.5 years for men and 83.3 years for
women in 2009 (Statistics Sweden, 2010).
Many countries have experienced a remarkable increase in life expectancy
by about 30 years during the twentieth century. The increase in life expec-
tancy has been virtually linear with no signs of stagnation. During the first
half of the twentieth century, gains in life expectancy were mainly due to
decreases in infant and young-age mortality. There was a shift in mortality
patterns from infectious diseases to cardiovascular diseases as the major
cause of death. After World War II, the increase in life expectancy has main-
ly been driven by falling mortality rates in the ages 65 years and older
(Christensen et al., 2009).
4.1.1 The development of life expectancy for women and men
Today, women outlive men in all countries of the world (Barford, et al.,
2006; Oksuzyan, et al., 2008). Since data have been available, the sex differ-
ences in life expectancy, though small, have been in favor of women. In the
early twentieth century, the sex gap in life expectancy started to grow in the
developed world. It is interesting to note that the widening of the sex gap in
life expectancy occurred at different time points in different countries. For
example, in countries like England, Wales, and France, the widening of the
gap emerged around 1890, while it emerged around 1950 in Scandinavia.
Around 1980, the sex gap began to narrow, about the same time point in
most countries.
35
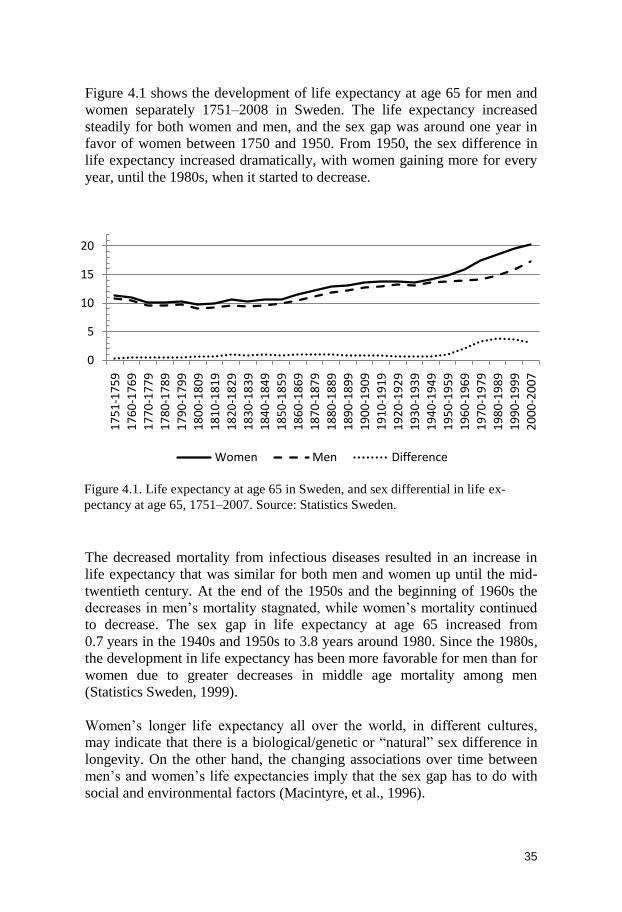
Figure 4.1 shows the development of life expectancy at age 65 for men and
women separately 1751–2008 in Sweden. The life expectancy increased
steadily for both women and men, and the sex gap was around one year in
favor of women between 1750 and 1950. From 1950, the sex difference in
life expectancy increased dramatically, with women gaining more for every
year, until the 1980s, when it started to decrease.
The decreased mortality from infectious diseases resulted in an increase in
life expectancy that was similar for both men and women up until the mid-
twentieth century. At the end of the 1950s and the beginning of 1960s the
decreases in men’s mortality stagnated, while women’s mortality continued
to decrease. The sex gap in life expectancy at age 65 increased from
0.7 years in the 1940s and 1950s to 3.8 years around 1980. Since the 1980s,
the development in life expectancy has been more favorable for men than for
women due to greater decreases in middle age mortality among men
(Statistics Sweden, 1999).
Women’s longer life expectancy all over the world, in different cultures,
may indicate that there is a biological/genetic or ―natural‖ sex difference in
longevity. On the other hand, the changing associations over time between
men’s and women’s life expectancies imply that the sex gap has to do with
social and environmental factors (Macintyre, et al., 1996).
0
5
10
15
20
17
51
-17
59
17
60
-17
69
17
70
-17
79
17
80
-17
89
17
90
-17
99
18
00
-18
09
18
10
-18
19
18
20
-18
29
18
30
-18
39
18
40
-18
49
18
50
-18
59
18
60
-18
69
18
70
-18
79
18
80
-18
89
18
90
-18
99
19
00
-19
09
19
10
-19
19
19
20
-19
29
19
30
-19
39
19
40
-19
49
19
50
-19
59
19
60
-19
69
19
70
-19
79
19
80
-19
89
19
90
-19
99
20
00
-20
07
Women Men Difference
Figure 4.1. Life expectancy at age 65 in Sweden, and sex differential in life ex-
pectancy at age 65, 1751–2007. Source: Statistics Sweden.

36
The widening of the sex gap in mortality that emerged during the 1950s was
due to stagnation in the decrease of men’s mortality. The two most common
causes of death among men were cardiovascular diseases and accidents. This
increased mortality was not evenly distributed in the population; it was re-
stricted to male industrial workers. For male white collar employees, the
mortality rates continued to decline. Among women, the mortality rates de-
clined for both groups of workers. The narrowing of the gender gap in life
expectancy that began during the 1980s was mainly due to men’s greater
decrease in cardiovascular mortality compared to women. Today, it is pri-
marily the decrease in mortality among elderly people that is driving the
increase in life expectancy (Danielsson & Lindberg, 2001; Statistics Sweden,
2007).
4.1.2 Old age is dominated by women
Worldwide, more boys are born than girls. With increasing age, the number
of males versus females converges and reverses due to men’s higher mortali-
ty risk in all ages. Therefore, the older ages are dominated by women. The
female surplus in old age is smaller in Sweden than in many other countries,
because of Swedish men’s relatively low mortality.
Today, there are 24 percent more women than men in Sweden aged 65 years
and older, and the numerical gender difference increases with age. In the age
group 85+ there are twice as many women as men (Statistics Sweden, 2010).
Figure 4.2. Surplus of females in Sweden 2008 and projections for 2018 and 2060.
Number of women minus number of men. Source Statistics Sweden (2009).
37
Figure 4.2 shows the absolute numbers of women minus men in Sweden in
2008, and projections for 2018 and 2060. It is clear that older ages are domi-
nated by women. According to the prognosis, the relationship between the
number of men and women is going to change. The female surplus in older
ages is projected to decrease in upcoming decades due to greater expected
mortality decreases among men than women (Statistics Sweden, 2009). This
could imply that more people can expect to live longer with a spouse.
4.2 Health trends matter
Changes in life expectancy are rather easy to follow over time when valid
data are available. Less is known about gender differences in health over
time, especially among the oldest old people. The fact that men have
―gained‖ more in life expectancy does not necessarily imply improvements
in men’s health compared to women. ―Gain‖ in survival can be at the ―cost‖
of health. If more and more sick men survive into higher ages (sick survi-
vors), will that also lead to a closing of the gender gap in morbidity? Moreo-
ver, since health late in life is mainly what drives life expectancy today, it is
of particular interest to follow health trends separately for women and men.
Studying gender differences in health over time might also help to get better
knowledge about factors that affect health and disability in old age.
Health trends among the oldest old, which is the fastest growing sector of the
population, has become of great interest in recent times, partly because of
the rising costs of medical care and social services. Future demand and need
of care and services will to a large extent depend on the health development
among the oldest part of the population.
As men and women have different patterns of both mortality and morbidity,
gender differences in health trends in the older population are of great con-
cern, both from the perspective of the individuals and of their families.
Health problems cause pain and suffering and reduce quality of life and the
ability to live an independent life.
4.3 Increased life expectancy – more years of good or poor health?
As described above, average life expectancy increased considerably during
the twentieth century. A consequence of the reduced mortality rates is that
elderly people survive longer, which means that the association between
poor health and mortality has changed over time. Old people with severe
38
disease (stroke, myocardial infarction) have higher survival rates than ever
before (albeit often with impaired health) (Crimmins, 2004; Crimmins &
Saito, 2000; Rosén & Haglund, 2005). This leads to the inevitable question:
do elderly people survive only to spend the rest of their lives in poor health?
4.3.1 Hypotheses about years in good or poor health
Increased life expectancy raises several questions. One of them is whether
the years added to life consist of years in relatively good health and indepen-
dence or in poor health with functional impairments and care and service
needs (Parker & Thorslund, 2007). The changing association between in-
creased life expectancy and health status has been vividly discussed and has
generated three primary hypotheses. One of the reasons why the association
between life expectancy and health status has caused a debate is because it is
possible to find empirical evidence for all hypotheses proposed in the litera-
ture.
4.3.1.1 Compression of morbidity
The compression of morbidity hypothesis, originally introduced by James
Fries (1980, 1983, 1986), suggests that improved living conditions and heal-
thier lifestyles lead to a postponement of the onset of chronic disease to
higher ages. According to the original version, humankind has a genetically
determined biological maximum age. Thus, morbidity would then be ―com-
pressed‖ into the last years of life.
Because of the constantly increasing mean life expectancy in most countries
(Christensen, et al., 2009; Oeppen & Vaupel, 2002), Fries refined his origi-
nal theory, without the assumption of a biological maximum age. In this
version, declines in morbidity are greater than increases in life expectancy.
This hypothesis implies that future resource needs per capita will decrease,
since the overall morbidity in the population will decrease, as will the need
for care and services, and the period of dependency will become shorter
(Fries, 2003).
4.3.1.2 Expansion of morbidity
According to the expansion of morbidity hypothesis, medical advancements
lead to a higher proportion of people in poor health surviving with their
health problems into advanced age (Gruenberg, 1977; Olshansky et al.,
1991). That is, years in good health without disability remain more or less
unchanged despite increased life expectancy. The years added to life consist
of years in poor health and disability. This leads to the so-called medical
paradox, suggesting that as more lives are saved with medical intervention,
there are higher rates of health problems in the population. Expansion of
morbidity would imply a greater need for care resources per capita.

39
4.3.1.3 Dynamic equilibrium – postponement of severe morbidity
The hypothesis of dynamic equilibrium (sometimes also referred to as post-
ponement of severe morbidity) proposes that the proportion of years spent in
poor health and disability will remain more or less constant as life expectan-
cy increases (Manton, 1982). Improvements in both medical treatment and
lifestyle will slow down the progression of chronic disease. For example, the
increase of surgical interventions (cataract, knee, and hip joint), even at high
ages, may have improved functional ability among groups in the elderly
population. As a result the years added to life consist of both healthy years
and years of moderate and severe morbidity/disability.
Years without morbidity/disability Years with morbidity/disability
Current status
Compression of morbidity with biological maximum age
Expansion of morbidity
Dynamic equilibrium/postponement of severe morbidity
Years with moderate
morbidity/disability
Years with severe
morbidity/disability
Compression of morbidity without biological maximum age
Figure 4.3. Hypotheses about the relation of mortality and morbidity/disability
40
4.4 Both improved and worsened health – mixed trends
4.4.1 Positive trends from 1970 to the mid-1990s – thereafter
unclear
During the 1970s, 1980s, and early 1990s, many studies showed improve-
ments in a number of health measures. One of the first epidemiological stu-
dies of older people, the Gerontological and Geriatric Population Study in
Gothenburg, also known as H-70, showed improvements in diseases, symp-
toms, and physical function among 70-year-old persons living in the 1970s
(Wilhelmson et al., 2002). Results from the Swedish Level of Living Survey
(ULF) (ages 65–84) also showed improvements in most measures of health,
physical function, and disability between 1980 and the middle of the 1990s
(G. Persson et al., 2001).
Most of the health trend studies during this period used health indicators
based on physical function and disability. The general trend between 1980
and the early 1990s was improvements in physical function and disability,
both in Sweden and many other countries (Ahacic et al., 2000; Freedman et
al., 2002; Manton & Gu, 2001; Rosén & Haglund, 2005).
Since the 1990s, both international and Swedish studies of health trends
among elderly populations have shown diverging, and even conflicting, re-
sults. Several components of health and disability have followed different
trends over time. While disability measures (ADL and IADL), often showed
no change or improvement over time, there was a simultaneous increase in
chronic disease and functional impairment (Crimmins, 2004; Freedman &
Martin, 2000; Freedman, et al., 2002; Freedman et al., 2007; Jacobzone et
al., 2000; Kramarow et al., 2007; Parker et al., 2005; Parker & Thorslund,
2007; Robine & Michel, 2004; Spillman, 2004; Wolf et al., 2005). If these
trends originating in the mid-1990s continue, they will imply future needs
for medical care that are greater than expected, while needs for social servic-
es may be smaller than expected.
Analyses of the Swedish Level of Living Survey (SWEOLD) showed an
increase in the prevalence of several health problems among very old people
between 1992 and 2002 (Parker, et al., 2005). The increases in just one dec-
ade of health problems, both reported disease and symptoms as well as ob-
jective tests of functional ability, raise the question of whether these changes
are due to structural changes (environment, threshold to institutions, educa-
tional level, and behavioral factors). Exploratory analysis of the SWEOLD
data for possible causes of the health declines between 1992 and 2002 re-
vealed that the worsening could not be explained by changes in age and sex
composition, different smoking habits, drinking habits, change in economic
41
resources, nervous and sleeping problems, earlier work situations, socioeco-
nomic positions, nonresponse rates, or study design. Other possible factors
that might have affected the health declines are changing associations be-
tween health and control variables between 1992 and 2002 (the association
between health and socioeconomic position), changes in survival patterns,
and effects of the large cutbacks in Swedish health care, old-age care, and
welfare policy during the 1990s. The cutbacks in the old-age care and the
welfare policy might not have affected the oldest old to the same degree that
it affected their younger counterparts (Kåreholt et al., 2004).
A study of functional ability (walking and running ability, vision and hear-
ing, and disability) covering the whole time period from 1980 to 2005 based
on the ULF data demonstrated that different function indicators showed dif-
ferent trends over time. Seen over the 25-year time period, mobility items
(running, walking) and disability indicators showed improvement. However,
these improvements occurred during the 1980s and early 1990s. After the
mid-1990s, the positive development ceased, and in some cases there were
considerable increases in problems (Parker et al., 2008).
4.4.2 Compression and expansion of morbidity – why diverging
results?
A great deal of the confusion between different health trend studies might
have to do with methodological issues, such as representativeness and the
use of different health and function indicators, as well as changes in contex-
tual factors and reporting.
The positive trends in morbidity and disability that were reported between
the 1970s and early 1990s gave support to the compression and postpone-
ment of morbidity hypotheses (Cutler, 2001; Lagergren & Batljan, 2000;
Manton et al., 1997). It has been shown that health trends depend on the
choice of health indicators (Brønnum-Hansen, 2005; Parker & Thorslund,
2007). Many of the earlier studies did not differentiate between morbidity
and disability, which reflect different dimensions of health and may show
different trends over time.
Other factors that might affect results between studies are differing age ceil-
ings, nonresponse rates, and strategies regarding the inclusion of persons
living in institutions. As older members of the population in general – and
elderly nonrespondents and institutionalized people in particular – report
more disease and health problems, the exclusion of the oldest old will likely
lead to an underestimation of health problems in health studies among older
people. Since the threshold for access to institutions changes over time ac-
cording to changes in policy and priorities, an exclusion of institutionalized
42
persons would affect the prevalence of health problems in the elderly popu-
lation.
4.4.3 The gender gap in health among the oldest old people:
getting bigger or smaller?
The association between mortality and morbidity has changed during the last
decade. The survival of very frail people has increased considerably (Rosén
& Haglund, 2005), and this is especially pronounced among elderly men
(Crimmins & Saito, 2000). Meinow (2008) showed that the increase in sur-
vival between 1992 and 2002 in Sweden was primarily due to increased sur-
vival among very frail elderly men.
Compared to the gender differences in mortality and life expectancy, the
patterns of gender difference in healthy life expectancy (the average number
of years expect to live with a given health condition within total life expec-
tancy) are less evident (Jagger et al., 2008). The methodological issues men-
tioned above will also influence studies of gender differences in health over
time. Studies from the U.S. have shown that the years added to life generally
consist of healthy years for men, while for women, the increase in life expec-
tancy seems to consist of years with functional disability (Bird & Rieker,
2008; Crimmins et al., 2002).
Sweden, as many other countries, has experienced great changes in gender
roles. Some of the improvements in men’s IADL disability (preparing food
and doing laundry) may be explained by men’s greater ability to perform
activities that traditionally have been the women’s domain. ADL (toileting,
dressing, eating) on the other hand, are probably less influenced by changes
in gender roles.

43
5 Gender equity in the utilization of care services
5.1 The objectives of care services – equal access for equal need
Access to care is often emphasized in the political context. In recent years,
the importance of gender has grown in social policy discussions regarding
health and social care services. The main reason for this is that gender equal-
ity is an all-embracing goal from a political perspective. According to the
National Board of Health and Welfare (2008, p. 14) this means that ―men
and women, according to their specific, and sometimes different, needs shall
be given equal possibilities to gain the best health and living conditions
possible through equal access to health and social care.‖
The overarching objective of the Swedish welfare system is good health for
the entire population. A fundamental principle, explicitly supported by legis-
lation, is to provide services – ―equal access for equal need‖ – irrespective of
sex, age, socioeconomic position, ethnicity, and geographical location. This
principle is evident in legislation regarding dental, medical, and social ser-
vices (Dental Care Act, SFS 1985:125; Health and Medical Services Act,
SFS 1982:763; Social Services Act, SFS 2001:453). Another explicit objec-
tive is to reduce inequalities in health and health-care utilization among
groups (Gillström, 2001; National Board of Health and Welfare, 2008,
2009b).
Discrepancies exist in the legislation, however, with consequences for indi-
viduals and their relatives as well as for the system. The Health and Medical
Services Act, for example, allows priority to be given to those with the
greatest need for care, and further, that the individual’s need be met within
the economic frame of the commissioning authority. The Social Services
Act, on the other hand, has an important addition, the condition that the indi-
vidual must fulfill the criteria ―if the need cannot be met in any other way.‖
According to the Social Services Act, the individual has the right to appeal a
decision in an administrative court. Another crucial discrepancy in the legis-
lation is the field of responsibility division: the 290 municipalities (kom-
muner) are responsible for providing social services, while the 20 county
44
councils (landsting) and four regions are responsible for health care. Yet the
division is not clear-cut for old-age care. Municipalities are responsible for
special housing, including nursing homes that require medical care.
Moreover, the legislation consists of so-called ―framework laws‖, which are
vague and rather broad, and they do not give much guidance to politicians or
municipal and county-council officials in designing health and social care
services. Nor does the legislation provide guidelines for communication and
collaboration between municipal and county providers.
5.2 Fair care – inequality and inequity regarding
utilization of care services
The terms inequality and inequity are commonly used in social policy and in
the context of health and the utilization of care services. In brief, the notion
of inequality regarding health and use of care services is descriptive and
refers to observable differences between individuals or groups (between
women and men, and social groups). These inequalities, in turn, might be
considered unfair, which leads to inequity (Wamala & Lynch, 2002).
The main principle, in the Health and Medical Services Act, of equal access
for equal need is often divided into the concepts of horizontal and vertical
equity. Horizontal equity means that persons in equal need should be treated
equally. Vertical equity implies that persons with greater needs should be
prioritized over those with lesser needs (Culyer & Wagstaff, 1993). These
concepts are not explicitly outlined in the legislation.
Another aspect of fair care is health literacy. Health literacy refers to a per-
son’s ability to understand information regarding care and social services,
how factors affect health, and how to navigate in the care systems. That is,
two persons with equal need may have different circumstances and compe-
tencies for actually accessing care services. To reach the goal of equal access
for equal need, persons with a low level of health literacy might need more
health care intervention (Burström, 2010; Rudd et al., 1999).
Health literacy might differ for women and men. In their landmark paper,
Hibbard and Pope (1986) proposed that women and men differ in how they
perceive, evaluate, and act in regard to symptoms of disease. Due to their
reproductive role, lactation, menstruation, and menopause, women may have
become more observant and aware of bodily cues and changes than men.
They also argued that it is more socially acceptable for women to admit ill-
ness, discuss symptoms, and seek care.
45
5.3 Factors affecting utilization of care services
Care visits depend not only on an individual’s objective and subjective
needs. Care visits reflect how accessible the care form is, both economically
and physically. They also reflect differences in knowledge and awareness
about the kind of care available.
The Andersen Behavioral Model of the use of health services, originally
developed over 40 years ago, provides a multidisciplinary conceptual
framework for health service use (Andersen, 1995). This model differen-
tiates between three generic variables that may explain utilization of care
services: need factors, enabling factors, and predisposing factors.
Need factors refer to subjective and objective evaluations (by the indi-
vidual or by a care provider) of an individual’s health status, symptoms,
and functional capacity.
Enabling factors include conditions that support or hamper the use of
care services when they are needed, such as economy, family, social
support, and availability of services.
Predisposing factors refer to individual characteristics, such as demo-
graphic factors (age, gender, and marital status), social structure (occu-
pation and education), knowledge, and attitudes. These factors influence
the propensity to use and seek health services.
There is, however, no clear-cut differentiation between these three factors;
rather, they overlap and interact with each other. For example, age (predis-
posing) is associated with more health problems (need) and therefore asso-
ciated with care utilization. A spouse or social support may help to detect
health problems, encourage the seeking of care, and give instrumental sup-
port (transport, phone calls) – that is, both enabling and predisposing charac-
teristics. Education is associated with better health, but can also influence an
individual’s aspirations, awareness, and knowledge regarding both health
and care services.
How the care system is organized can also have an effect on the utilization
of care services. For example, patient fees, shortage of providers, as well as
geographical distances might have a restrictive effect regarding access to
care services. Moreover, care-service types may be driven to varying extents
by the factors included in the Andersen model, and these factors may affect
women and men differently. Physician visits most often indicate a health
problem (medical need), while dental visits are more likely to be influenced
by enabling factors (economy) and predisposing factors (health behavior and

46
habits) (Andersen, 1995; Gilbert et al., 2003). Dental visits are also seen as a
preventive measure to a higher degree.
Most care services involve some kind of gatekeeper. For example, an appli-
cant’s need for old-age care (home help or special housing) is assessed by a
municipal care manager (biståndshandläggare), nurses usually screen per-
sons requesting an appointment with a physician, physicians are responsible
for prescribing particular drugs, and a nurse or a physiotherapist is involved
in functional training and the provision of assistive technology. It is common
that family members are engaged in this process, particularly among elderly
people. A child or a spouse may initiate and provide support in the care-
seeking process. Larsson and colleagues demonstrated that coresiding older
people who received informal care also had greater chances of receiving
home help or moving to institutional care (Larsson et al., 2004; Larsson et
al., 2006).
Age and gender may influence the behavior of gatekeepers, positively and
negatively. Gatekeepers’ perceptions, beliefs, and attitudes about older per-
sons may influence their evaluation of the need and the intervention or
treatment that is appropriate. It has, for example, been shown that men are
more often prescribed newer and more expensive drugs (Johnell et al.,
2009).
5.3.1 How does gender affect services and care utilization?
Research on patterns in health care utilization has shown that different fac-
tors predict care utilization for women and men. Today, there are about
25 percent more women than men in Sweden aged 65 and older, and the
numerical gender difference increases with age, so that by 85 years and older
there are more than twice as many women as men (Statistics Sweden, 2010).
A consequence of their longer life span is that women are more likely to live
without a spouse during the last years of life. Women also tend to marry men
who are older than themselves and are less likely to remarry in old age than
men, further increasing the proportion of women living alone.
The fact that women are more likely to be widows and to live without a
spouse when becoming frail during the last years of life makes them more
dependent on help and support from outside their households, that is, from
relatives or old-age care, while a vast majority of old men are cohabiting
during the end of life. That is, elderly men are more likely to receive infor-
mal care, most often provided by their wives, while elderly women generally
are the recipients of formal care (Larsson & Silverstein, 2004; Larsson &
Thorslund, 2006; Statistics Sweden, 2005; Szebehely, 2005).
47
Being married or cohabiting has been shown to be positively associated with
health care utilization for men but not for women. Men’s care seeking beha-
vior seems to be highly influenced by women with whom they are living
(Parslow et al., 2004).
Living alone is associated with the use of both formal and informal (supplied
by families, friends, and neighbors) social care. Since older women are more
likely to live alone when becoming disabled, they also have a higher proba-
bility of getting into an institution. Controlling for living alone, the gender
differences in institutional living among elderly people are substantially
reduced. Social variables, such as household composition and marital status,
which serve as proxies for accessibility of informal care, are stronger deter-
minants of institutional care than gender or age (Arber & Cooper, 1999;
Larsson, 2004).
5.4 Different care services
The utilization of care services is driven by a complex pattern that involves
characteristics of the care-seeking individual – like health and function
(need), propensity to seek help (predisposing factors), and opportunities and
resources for seeking help (enabling factors) – as well as the influence of
family members and care providers. This complex interplay of forces driving
utilization differs by kind of care and may affect women and men different-
ly. The factors that influence the use of physician visits may differ from
those that drive the use of dental visits or use of municipal home help. It has
been shown that women (16–84 years) are more likely to forego medical
care than men, even though they feel they need it (Statistics Sweden, 2006a),
and that economically vulnerable women (18–75 years) to a higher extent
than men refrain from seeking dental care as a consequence of patient fees
(Gillström, 2001). In Study III of this thesis, the focus was on gender differ-
ences in care utilization among very old persons in regard to visits to the
physician and dentist.
As shown in chapter 3, gender differences in health and disability are well
documented. Therefore, it is likely that gender’s impact on utilization varies
by care form. Comparing types of care services will enrich the understanding
of the sources of gender variation in care-service utilization and the mechan-
isms that underlie them.

48
5.4.1 Medical care
Before 1970 there were great variations in the supply of health care in Swe-
den. There was no uniform health-care system. For example, there were sub-
stantial variations in patient fees, and patients could not foresee the cost. In
1970, a major health reform was accomplished to eliminate economic bar-
riers regarding health care, the aim of which was fair care. The patient fees
were set to a fixed sum, irrespective of the actual cost or the treatment given.
Another aim was to attain a more uniform system to facilitate the expansion
of primary care. Since the 1970s, patient fees have more than doubled (re-
lated to retail prices), with the largest increase made during the 1980s
(Gillström, 2001).
Today, when elderly people seek medical care, they most often go to a coun-
ty primary-care center for an appointment with a general practitioner. At
these facilities, a nurse often functions as a gatekeeper. In 2002 (the year
studied in Study III), the ordinary patient fee for such visits was set to
SEK 150, a cost known before the visit. Additionally, there is a high-cost
ceiling. In 2002, if a patient exceeded the amount of SEK 900 during one
year she or he had the right to free medical care from the date of the first
visit until 12 months had passed.
Despite the high rates of care utilization in the elderly population, surprising-
ly little research has focused on gender differences in the fastest growing
sector of the population – the oldest old – that is dominated by women (Bird
et al., 2002). It is often proposed that women make greater use of care ser-
vices than men in all ages. However, this does not seem to be persistent for
all ages and for all types of care services.
Previous research has shown that women have overall higher care service
utilization than men in the general older population, but this gender differ-
ence tends to be less for more serious health conditions. Furthermore, older
women are more likely to use preventive care and primary care, while older
men have more hospital admissions (Bertakis et al., 2000; Dunlop et al.,
2002; Juel & Christensen, 2008; Waldron, 1983; Verbrugge & Wingard,
1987).
Studies that have examined gender differences in physician visits, and have
included older people, have found diminishing gender differences with in-
creasing age, despite the fact that older women generally report more health
problems than older men (Cameron et al., 2010; Ladwig et al., 2000;
National Board of Health and Welfare, 2009b; Suominen-Taipale et al.,
2006).
49
5.4.2 Dental care
Dental care is not included in the Swedish universal care services system.
The Swedish dental health system has undergone extensive changes over the
years. Changes in dental care provide a good example on how public health
care interventions have affected health outcomes. Both treatment, and neg-
lect of treatment, is reflected in different cohorts’ dental health statuses.
(Ahacic, 2002).
In 1974, a major dental care reform was enacted. The aim was twofold: to
expand public dental care, restricted as it was by a shortage of dentists, and
to reduce differences in dental health and dental care utilization due to social
class by lowering patient fees (making care free of charge for children up to
19 years old). The subsidies were then lowered stepwise, and expired in the
late 1990s. A high cost protection for people aged 65 years and older was
introduced in 2002, and in 2008 a further dental care reform emerged. This
reform introduced a general dental-care allowance (in addition to the high
cost ceiling). The annual allowance is SEK 600 for people aged 20–29 years
and 75 years and older, and SEK 300 for people aged 30–74 years.
A dental visit, in contrast to visits to county primary care, has no fixed costs.
The patient does not know the cost before the dental visit; rather, the fee is
set after the examination. There is a high-cost ceiling, but at a substantially
higher level than for medical care and social services. Over the course of one
year, the patient gets a 50 percent discount on costs over SEK 3,000 and an
85 percent discount on costs over SEK 15,000. Also, in contrast to health
care and old-age care, there are no gatekeepers who control access to dental
care. Patients book their visits directly, whenever they feel the need. It is
also more common that a dental visit is made as a preventive measure; that
is, many people have regular checkups.
There have been considerable improvements in the adult population’s dental
health status in Sweden in the last 40 years. There have been great decreases
in edentulousness, and more and more people have teeth in good condition.
In the older population there has been an increase in the number of persons
that have teeth with many fillings, crowns, or bridges. As both the proportion
of older persons in the population and the proportion of persons with their
own teeth increases, future needs for dental care will also most likely in-
crease (Ahacic, 2002; National Board of Health and Welfare, 2009a).
Very few studies, national or international, have examined gender differenc-
es in dental care utilization among older people. A study from the National
Swedish Social Insurance Board (Riksförsäkringsverket) showed that wom-
en had somewhat higher dental care utilization in the general population
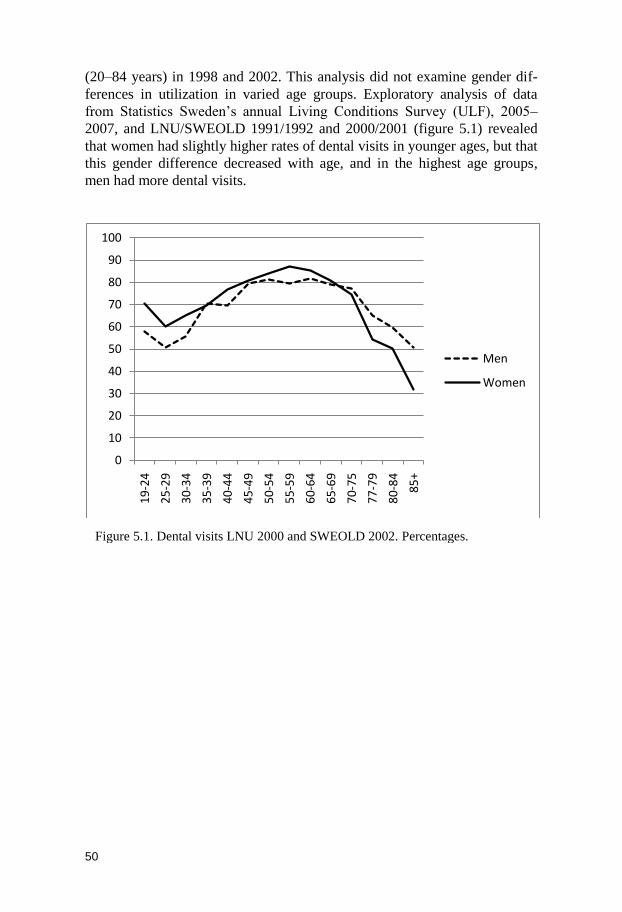
50
(20–84 years) in 1998 and 2002. This analysis did not examine gender dif-
ferences in utilization in varied age groups. Exploratory analysis of data
from Statistics Sweden’s annual Living Conditions Survey (ULF), 2005–
2007, and LNU/SWEOLD 1991/1992 and 2000/2001 (figure 5.1) revealed
that women had slightly higher rates of dental visits in younger ages, but that
this gender difference decreased with age, and in the highest age groups,
men had more dental visits.
0
10
20
30
40
50
60
70
80
90
100
19
-24
25
-29
30
-34
35
-39
40
-44
45
-49
50
-54
55
-59
60
-64
65
-69
70
-75
77
-79
80
-84
85
+
Men
Women
Figure 5.1. Dental visits LNU 2000 and SWEOLD 2002. Percentages.
51
6 Material and methods
6.1 Data
Two surveys (LNU and SWEOLD) and mortality data provided by Statistics
Sweden were used in the studies included in this thesis. In Study I and Study
II, data from the SWEOLD survey waves of 1992 and 2002 were analyzed.
Study III used data from the SWEOLD survey of 2002. Study IV was based
on the LNU survey waves of 1991 and 2000, and the SWEOLD survey
waves of 1992 and 2002, combined with mortality data from Statistics Swe-
den for the four respective survey years.
6.1.1 The Swedish Level of Living Survey
The Swedish Level of Living Survey (LNU) is a multipurpose nationally
representative sociological panel interview survey with the aim of studying
the distribution of welfare in Sweden in a broad sense. LNU was first con-
ducted in 1968 (Erikson & Åberg, 1987). Thereafter, follow-ups were car-
ried out in 1974, 1981, 1991, and 2000. Right now a sixth wave is being
carried out in 2010 and 2011. The baseline survey in 1968 consisted of about
6,000 randomly selected persons in the age range 15–75 years. In 1991 the
lower age limit was raised to 18 years, while the age ceiling of 75 years was
maintained. In order to preserve a representative sample, younger people and
immigrants were added over the years. Between 1968 and 2000 the response
rate varied between 91 percent in 1968 and 77 percent in 2000. In the run-
ning survey waves people dropped out from the panel when turning 76 years
of age.
6.1.2 The Swedish Panel Study of Living Conditions of the
Oldest Old
The Swedish Panel Study of Living Conditions of the Oldest Old
(SWEOLD) is an extension of LNU. SWEOLD was established in order to
follow those LNU participants who had passed the age ceiling of 75, with
the purpose of maintaining a level-of-living survey that included the oldest
sector of the population. In 1992 (n = 537), all persons who had turned
75 years and had participated in at least one of the LNU survey waves were
traced. Subsequent survey waves were carried out in 2002 (n = 621) and
52
2004 (n = 1180). In 2004 the interviews were conducted by telephone, and
the lower age limit was lowered to 69 years. The nonresponse rates were
4.6 percent in 1992, 11.5 percent in 2002, and 7.8 percent in 2004. Adding
the nonresponse figures from LNU, the effective nonresponse rate for com-
parison to the nationally representative sample was 11.1 percent in
SWEOLD in 1992 (O. Lundberg & Thorslund, 1996).
Professional interviewers carried out structured interviews with the respon-
dents. Institutionalized persons were included. Most of the interviews were
direct visits, conducted face-to-face in the respondent’s home. Telephone
interviews were carried out when necessary, primarily due to reluctance to
receive an interviewer in the home. If the respondent could not be inter-
viewed (because of severe illness or cognitive impairment), proxy interviews
were performed with a close relative or nursing staff. Distribution of inter-
view mode changed only slightly between the survey years. Age and sex
distribution and the proportion of persons living in institutions in the total
sample reflect national averages at each time of measurement (O. Lundberg
& Thorslund, 1996).
Both LNU and SWEOLD include questions about living conditions (econo-
my, living arrangements, social relations, leisure activities, and political
resources). In order to ―gerontologize‖ SWEOLD, working-life-related ques-
tions from LNU were reduced in favor of a range of questions relevant for
the oldest population (indicators of health and disability, use of care and
social services, tests of physical function). Since each wave of LNU and
SWEOLD is nationally representative, the data can be used for cross-
sectional analyses. SWEOLD was used in all studies in the present thesis.
Study IV also included some age groups (65–75 years) from LNU.
6.2 Measurements
6.2.1 Indicators of health and disability
Different types of health indicators, both self-reported and ―objective‖ tests,
were used in the four studies included in this thesis. These indicators were
used both as outcome variables as well as independent variables depending
on the specific purpose.
In Study I, gender differences in health and their change over time were ana-
lyzed using a wide range of health indicators. Eleven self-reported health
problems (single indicators) were included: global self-rated health, leg ulc-
ers, diabetes, myocardial infarction, hypertension, depression, sleeplessness,

53
general fatigue, musculoskeletal pain, hearing, and mobility; two self-
reported measures of disability were included: IADL and ADL. In addition to
these, four objective tests were included: physical performance, peak flow,
cognition, and vision.
Study II examined gender differences in the association between disability,
as measured by ADL, IADL, and other health indicators, and the change
over time in these associations. Thus, dependent variables were ADL and
IADL. Independent variables included objective tests of performance and
peak flow as well as the self-reported measures, global self-rated health,
mobility, musculoskeletal pain, psychological problems, and fatigue.
Study III explored gender differences in care utilization in terms of visits to
the physician and dentist by community-dwelling people of the oldest old
sector. Dependent variables were self-reported physician visits and dental
visits. Independent variables were civil status, education, cash margin (a
measure of economic resources), mobility, health status, and dental status.
In Study IV, gender differences in the proportion of healthy years, measured
as years free from self-reported musculoskeletal pain in relation to life ex-
pectancy at 65 in 1992 and 2002, were described.
6.2.1.1 Self-reported indicators
Global self-rated health (SRH) is a subjective measure of a person’s overall
health, reflecting dimensions of health that are important to each individual.
This means the dimensions of health that SRH reflects for each person may
differ. However, this straightforward and simple health indicator has shown
to be a stable and good predictor of mortality (Idler & Benyamini, 1997;
Idler et al., 1999; O. Lundberg & Manderbacka, 1996). SRH was obtained
by a single question: How do you view your general state of health? Alterna-
tive responses were: Good, In-between, or Poor. Good SRH was coded as no
problems, in-between as mild, and poor as severe problems in both Study I
and Study II. SRH was used as an outcome variable in Study I, and as an
independent variable in Study II.
Some of the outcome variables in Study I (leg ulcers, diabetes, myocardial
infarction, hypertension, depression, sleeplessness, and fatigue) were taken
from a list, headed by the question: Have you had any of the following dis-
eases or disorders during the last 12 months? Alternative answers were: No;
Yes, mild problems; or Yes, severe problems. Common Swedish expressions
for respective medical conditions were used in the interviews.
Musculoskeletal pain was an index of pain in shoulders, back, hip or sciatica,
hands, elbows, legs, or knees. In Study I, where the index was studied as an

54
outcome variable, it was divided into three categories: no pain, one or two
mild pains, and at least one severe pain. In Study II and Study IV, the index
was dichotomized, to differentiate between those with at least three mild
problems or one severe problem from those with lower scores. Musculoske-
letal pain was used as an independent variable in Study II and as the pain
measure when pain-free life expectancy was analyzed in Study IV.
Hearing problems was a dichotomous (yes or no) variable, based on the res-
pondent’s reported ability to hear a conversation between several persons
without difficulty, with or without a hearing aid (outcome variable Study I).
Mobility was an index of four items regarding the ability to walk 100 meters,
climb stairs, rise from a chair without problems, and stand without support.
In Study I, where mobility was studied as an outcome variable, one limita-
tion was considered to be mild problems, more than one limitation was con-
sidered severe. In Study II and Study III, the mobility index was used as an
independent variable and was dichotomized; limitations with one or more of
the items were coded as having impaired mobility.
ADL and IADL were used as outcome variables in Study I and Study II.
ADL consisted of five basic self-care items: eating, toileting, dressing, trans-
ferring in and out of bed, and bathing. IADL, which measure the activities
necessary for living in the community, were included only for community
dwelling persons. Respondents were asked if they usually cleaned house,
shopped for food, and prepared food without help. Those who reported hav-
ing help were then asked if they were able to do these activities if necessary.
One limitation was considered mild problems, and more than one limitation
was considered severe. IADL questions were not answered by respondents
living in institutions. Due to the different purposes of Study I and Study II,
IADL was treated differently in regard to persons living in institutions. In
Study I, which focused on gender differences in health and changes over
time, the analysis of IADL excluded persons living in institutions. In Study
II, which focused on associations between ADL, IADL, and other health
indicators, persons living in institutions were rated as disabled on all IADL
items. IADL tasks are even more demanding than the ADL tasks. Explorato-
ry analysis (not shown) revealed that 95 percent of the persons living in in-
stitutions were disabled in at least two of the ADL tasks. Therefore it is rea-
sonable to assume that people in institutions have IADL limitations.
Psychological problems (independent variable in Study II) were measured by
an index based on five psychological items: general fatigue, sleeping prob-
lems, nervous problems (anxiety), depression, and mental illness. Respon-
dents that reported at least two mild problems or one severe problem were
considered to have psychological problems. Similar indices have been used

55
in earlier studies (Fors, 2007; Fritzell & Lundberg, 2007; Thorslund &
Lundberg, 1994) and have been shown to predict mortality (O. Lundberg,
1990).
The fatigue index (independent variable in Study II) summarized five items
concerning tiredness. Four of them – tiredness during the last 14 days,
trouble getting started in the morning, remarkably tired in the daytime, and
quite exhausted in the evenings – had yes or no answers. The fifth item in
the index concerned overall fatigue during the past 12 months. Respondents
reporting two or more problems were regarded as having problems with
fatigue.
Health status (independent variable in Study III) was measured by an index
based on 18 self-reported symptoms and diseases. Respondents were asked
whether they had experienced any of the diseases during the past 12 months.
Possible answers were: No; Yes, mild problems; or Yes, severe problems.
The summarized index was dichotomized; one severe or three slight prob-
lems or more was considered as poor health status.
Dental status (independent variable in Study III) was measured by the ques-
tion: Which of the following statements best describes your teeth? The res-
pondent was shown a card with following response alternatives:
1. No teeth or roots only
2. Dentures, complete or partial
3. Own teeth, in poor condition: many missing, etc.
4. Own teeth, in good condition; no or few fillings
The categories 1 (no teeth roots only) and 2 (dentures, complete or partial)
were collapsed in the analyses.
6.2.1.2 Objective tests
Performance was the name of an index constructed of nine simple tests en-
compassing range of motion, balance, strength, and hand function. Each test
was first demonstrated by the interviewer, and then the interviewer asked the
respondent to pick up a pen from the floor, touch opposite toes, lift one kilo-
gram, or rise from a chair. Those who could not perform a test without prob-
lems were classified as having failed the test. A respondent who failed one
or two tests was considered to have mild problems, and failing three or more
tests was considered severe. The performance index was studied as an out-
come variable in Study I and as an independent variable in Study II.
Peak expiratory flow is a simple test of lung capacity. The participant was
tested three times, and the best score was analyzed. As lung capacity is high-
ly dependent on height, the residual from a regression model where height
56
was regressed against the peak flow value was used as the outcome measure.
Similar procedures were carried out and used empirically in several studies
(Ahacic et al., 2007; Cook et al., 1995; Cook et al., 1991). In Study I, where
peak flow was studied as an outcome variable, less than one standard devia-
tion below the mean was considered severe, rates between this point and the
mean were considered mild, and rates at or above the mean were considered
no problem. In Study II, peak flow was used as an independent variable and
was dichotomized to differentiate those with severe problems from those
with higher scores.
Cognition was tested with a short form of the established Folstein Mini-
Mental State Examination (Folstein et al., 1975). This abridged version con-
sists of five items: registration (repeating three named objects), orientation
to time and place (year, month, and date), recall (repeat the three objects in
the registration task), attention, concentration, calculation (subtracting 7
from 100 five times to get 93, 86, 79, 72, and 65), and visual-spatial ability
(drawing a figure shown). Cutoff points for mild and severe cognitive im-
pairment were found using the corresponding items in larger Swedish studies
(Gatz et al., 2005; Palmer et al., 2002) that included the entire Mini-Mental
State Examination as well as clinical diagnoses of dementia (Parker et al.,
1996).
Vision was tested by asking the participants to read the instructions on a
medicine bottle with or without glasses. Because literacy in Sweden is very
high (even in the oldest age groups), it is reasonable to consider this as a test
of vision and not of reading ability. Reading incorrectly or with difficulty
was considered mild impairment, and total inability to read was considered
severe.
6.2.2 Indicators of care utilization
Care utilization was based on self-reported information. Physician visits
were based on the question: Have you at any time during the past 12 months
consulted a doctor about your own diseases and disorders? Consultations
during a hospital stay were not included.
Dental visits were obtained by the question: Have you visited a dentist dur-
ing the past 12 months? Alternative responses were yes or no for both physi-
cian visits and dental visits.
57
7 Overview of the studies
7.1 Study I: Sex differences in health in 1992 and 2002 among very old Swedes
Despite their longer lives, women show higher morbidity rates compared to
men at all ages. In recent decades the gender gap in mortality has narrowed
due to men’s greater ―gains‖ in life expectancy. However, this does not nec-
essarily entail improvements in men’s health compared to women. Few stu-
dies have examined sex differences in morbidity over time among the oldest
old.
Objectives
To describe sex differences in health in 1992 and 2002 in two representative
samples of the Swedish population aged 77 or older, and to examine changes
in the sex differences between the survey years.
Methods
The analyses were based on the Swedish Panel Study of the Living Condi-
tions of the Oldest Old (SWEOLD) surveys conducted in 1992 (n = 537) and
2002 (n = 561) and comprised a representative sample of the Swedish popu-
lation aged 77 and older. The analyses were cross-sectional and the data
were treated as two independent samples. Outcomes included both self-
reported variables of disease and function, as well as objective tests of cogni-
tion, vision, lung function, and physical performance. Ordered logistic re-
gressions were performed in order to calculate odds ratios of health problems
by sex, period, and change between 1992 and 2002. Ordered logistic regres-
sion is an extension of the common logistic regression that allows for an
ordered multicategorical outcome.
Results
Women, in general, had higher or similar prevalence rates of the studied
health indicators compared to men. Exceptions were men’s higher rates in
2002 for myocardial infarction (MI) and hearing problems. The general pat-
tern for the change of morbidity over time, for both men and women, was
increased prevalence rates for most health problems, but no change in ADL
and IADL. While gender differences changed for several indicators, the inte-
raction effect for time and gender was significant only for MI and poor glob-
58
al self-rated health (SRH), meaning that the development over time was dif-
ferent for men and women. The gender gap decreased significantly for SRH,
due to men’s increased reporting of poor health, and increased for MI, due to
increased prevalence among men. Despite women’s higher prevalence rates
of problems, and their increases between survey waves, their assessments of
poor SRH did not increase over time.
Conclusions
Several health indicators seem to be developing differently for men and
women. During the studied period, life expectancy increased considerably,
but our results provide no support for a compression of morbidity.
7.2 Study II: Gender differences in associations between ADL and other health indicators in 1992 and 2002
Studies have shown increased prevalence rates over time in several health
indicators in the older population. These increases have not been accompa-
nied by corresponding increases in ADL and IADL disability. Given that
disability and other health indicators follow different trends, the associations
between them may change. Since both health and disability appear to follow
differing trends for men and women, we can also expect gender differences
in the associations.
Objectives
To examine gender differences in the association between disability, as
measured by ADL and IADL, and other health indicators, and to examine
whether these associations have changed between 1992 and 2002.
Methods
The study was based on the SWEOLD surveys conducted in 1992 and 2002.
The SWEOLD samples are representative of the Swedish population aged 77
years or older at each time of measurement (1992: n = 537; 2002: n = 561).
SWEOLD includes both self-reported measures and objective tests of func-
tion. Because the analyses in this study included tests of physical perfor-
mance, only those who were interviewed face-to-face were included. Or-
dered logistic regression was used for the analyses.
Results
Compared to men, women had significantly higher prevalence rates for most
health indicators both survey years, but there were no significant gender
differences in ADL and IADL limitations. Prevalence rates increased signif-
59
icantly between 1992 and 2002 for all health indicators, but not for ADL and
IADL. Most of the associations between ADL/IADL and other health indica-
tors were stronger for men than for women. The overall pattern was that
associations have become weaker for women over time; for men, the picture
was mixed.
Conclusions
The changing associations between ADL IADL and other health indicators
may reflect a complex interplay between changes in a range of social and
environmental factors, some of which may be modifiable. ADL and IADL
appear to reflect different dimensions of health and different kinds of needs
for social services and care for men and women.
7.3 Study III: Gender differences in visits to the physician and dentist among very old persons
The overall goal of the Swedish health care system is good physical and
dental health for the entire population, according to the principle of equal
access for equal need. Regarding gender equality, a number of studies have
suggested that these objectives have not been fully reached.
Objectives
To explore gender differences in care utilization in terms of visits to the phy-
sician and dentist among very old people living at home.
Methods
The analyses were based on the SWEOLD survey from 2002 (n = 621). Per-
sons living in institutions were excluded from the analysis because the fac-
tors associated with visits are different for persons living in institutions.
SWEOLD comprises self-reported information on care utilization including
both physician visits and dental visits during the past 12 months. Other cova-
riates (control variables and independent variables) were sex, age, civil sta-
tus, education, cash margin, mobility, and health and dental status. Logistic
regression was used for the analysis.
Results
Despite women’s generally poorer health status, we found no gender differ-
ences in physician visits. Despite that women showed significantly more
health problems than men, there were no gender differences in physician
visits during the past 12 months. For dentist visits, on the contrary, we found
that men visited the dentist more often than women during the past
12 months even though, or maybe as a result of, their better dental status.
60
There was no effect of age on physician visits for men or women. For dental
visits, on the other hand, higher age was associated with less utilization for
women but not for men. Marriage was positively associated with visits to the
physician and the dentist for men.
Conclusions
The results of this study suggest that there are different mechanisms behind
the propensity to seek medical care versus dental care and that women may
be at a disadvantage in regard to dental care. Given that women have worse
health than men, they should be visiting physicians more often. Therefore,
women may also be at a disadvantage regarding physician visits.
7.4 Study IV: The pains of a longer life: Gender differences in life expectancy free from musculoskeletal pain at age 65 in Sweden
The worldwide increase in life expectancy has prompted different kinds of
health expectancy studies. These studies combine information on mortality
and morbidity to investigate the average life years spent with (or without)
different health conditions. Pain is common in the older population and is a
major public health challenge. Pain is also a crucial dimension of health and
has both personal and societal consequences. A growing body of research
has shown substantial sex differences in the prevalence of pain and suggests
that pain affects men and women differently.
Objectives
To describe the number of years spent with musculoskeletal pain in relation
to total life expectancy at age 65 in 1991/1992 and 2000/2002 and to ex-
amine the change in the proportion of life expectancy spent free from mus-
culoskeletal pain (pain-free life expectancy, PFLE) among women and men.
Do the years added to life consist of years with or without musculoskeletal
pain?
Methods
Musculoskeletal pain was measured by an index of pain in shoulders, back,
and joints. The calculation of PFLE was made by using the Sullivan method,
which combines the age-specific prevalence (proportions) of the population
with or without pain, with age-specific mortality information obtained from
a period life table (the probability that a person at a certain age will die with-
in a year). The prevalence of pain was derived from the Swedish Level of
Living Surveys (LNU) from 1991 and 2000, and the SWEOLD surveys from

61
1992 and 2002. The information on age-specific mortality was derived from
period life tables for each year provided from Statistics Sweden.
The Sullivan method is the most widely used method to calculate different
health expectancies. Health expectancies is the number of remaining years,
at a certain age, a person is expected to live in a healthy state. Health expec-
tancies take both changes in prevalence of a certain health problem and
changes in mortality into consideration. Health expectancy is therefore use-
ful in order to identify the interaction between good health, poor health, and
mortality (Jagger et al., 2001).
Results
In 1992, life expectancy at age 65 was 15.9 years for men and 20.0 years for
women; in 2002 the corresponding years were 17.2 for men and 20.6 for
women. Women reported significantly more pain than men both in
1991/1992 and 2000/2002, with the exception of those aged 85+ in 1992. In
1991/1992, both men and women aged 65 could expect to live another 12
pain-free years. However, the proportion of PFLE among men (75%) and
women (60%) differed significantly. Ten years later, both men and women
could expect more years with pain. In 2000/2002, PFLE among women had
decreased to 51 percent; among men it had decreased to 68 percent.
Conclusions
The association between pain and age seems to have changed between the
survey years. Our study contributes to the debate of whether the extended
years will be spent in good health or in poor health. This study also shows
that PFLE provides important information on men’s and women’s health
statuses, and provides an important dimension to the quality of life.
62
8 Discussion
In the light of the aging population, knowledge of disability and health status
among our oldest old people as well as developments over time is crucial for
future policy planning and the needs for care services. The high proportion
of women to men in the expanding older population and the changing gender
patterns in mortality and morbidity make it particularly important to consider
gender differences in population-based gerontological research. The primary
purpose of the present thesis was to describe and analyze gender differences
and changes over time regarding health, physical function, and disability
among the oldest old. A second purpose was to study gender differences in
care utilization and correlates to utilization regarding physician and dentist
visits.
8.1 Worsening of health for women and men, especially women
While many previous studies from the United States, Europe, and Sweden
reported health improvements in the older population, SWEOLD was one of
the first studies that showed worsened health (Parker, et al., 2005). The lack
of improvement could reflect increased survival in the oldest age groups
(Meinow, 2008; Rosén & Haglund, 2005). In this way, Sweden may be
―ahead‖ of many other countries regarding population aging by being in a
later stage of the epidemiological and demographical development (Parker &
Thorslund, 2007; Robine & Michel, 2004).
Study I focused on gender differences in a wide range of health and disabili-
ty indicators and how they have changed over time. Women generally have
higher morbidity rates than men at all ages. The results of this thesis show
that these gender differences in health in general persist into the oldest ages.
The overall pattern found in Study I was that women had significantly higher
prevalence rates in a wide range of health problems, both self-reported and
in objective tests, compared to men in 1992 and 2002, but there were no
gender differences in disability measures such as ADL and IADL.
Analyses of change over time showed increased prevalence rates for both
women and men for most health indicators, especially for women. The in-

63
crease of health problems was not accompanied by corresponding increases
in the prevalence of ADL and IADL limitations. Some of the health indica-
tors showed different trends for women and men. Despite the greater in-
crease in the prevalence rates of several health indicators for women, their
reporting of poor global self-rated health (SRH) did not increase over time.
It is, however, not easy to describe changes over time in gender differences
in morbidity and disability in the oldest population in a simple way. Mor-
bidity and disability are multidimensional concepts, and health indicators
capture different dimensions of morbidity and disability. The prevalence of
disease and disability result from a complicated process of onset, probability
of survival, and mortality rates among persons with and without health prob-
lems (Crimmins, 1996; Crimmins & Saito, 2000). Furthermore, in the differ-
ent dimensions, changes over time vary. Changes are affected by factors
other than physical health that also differ between the sexes. This is further
complicated by the fact that the morbidity—mortality process differs be-
tween women and men.
A common explanation for women’s higher morbidity rates is that there are
gender differences in reporting behavior. It has been assumed that women
are more prone to report illness and adopt the sick role than men, although
this assumption has been challenged. Due to gender roles and their physiolo-
gy (pregnancy, lactation, menstruation, and menopause) women may be
more observant of bodily cues and changes and therefore identify symptoms
and respond to bodily changes more readily than men do (Hibbard & Pope,
1986). Interestingly, as seen in Study I, women increased their reports of
specific health problems between 1992 and 2002, and their performance on
objective tests worsened, but their poor global self-rated health did not in-
crease. This can challenge the assumption of women’s over-reporting, or it
may reflect the complexity of the relationship between symptoms, condi-
tions, and global self-rated health.
The gender gap in mortality has decreased over the past 20 years in Sweden
and in many other countries. Very few studies, though, have examined gend-
er differences in disability and morbidity over time among the oldest old. As
the patterns we found were mixed, it is difficult to draw definite conclusions
other than that some health indicators seemed to be developing differently
for women and men.
In general, the findings in the present thesis are in agreement with the inter-
national literature which also has shown mixed trends in functioning, disabil-
ity, and health for women and men. A review of trends in disability and
functioning (physical, cognitive, and sensory) in the older population in the
United States during the late 1980s and 1990s showed both decreases and no
change in trends in gender disparities depending on which indicator of func-
64
tion is used. There were no signs of increases in the gender differences in
disability and functioning. In the cases of a narrowing gender gap, it was due
to women’s greater improvements (Freedman, et al., 2002). Comparisons
between OECD countries showed general improvement in disability, but
with some gender differences in trends in certain countries, where there was
decreased disability for men while women showed either fewer decreases or
increases in disability (Jacobzone, 2000).
8.2 Expansion of morbidity and compression of disability
Women live longer than men despite higher morbidity rates. Life expectancy
(LE) has increased for both women and men between 1992 and 2002, but
more for men. A fundamental question in gerontological research is whether
the increased LE has been accompanied by a compression or expansion of
periods of morbidity. Healthy LE studies provide a link between the devel-
opment of population health and increasing life expectancy.
Study IV examined whether increased LE during the studied 10-year period
consisted of years of good health, measured as years free from musculoske-
letal pain, or if the years added to life were spent in poor health, with muscu-
loskeletal pain. The results revealed that the estimated proportion of pain-
free years at age 65 decreased for both women and men compared to the
same age group 10 years previously; in other words, years in pain increased
more than years added to life. These changes differed for women and men.
For men, the absolute number of pain-free years remained unchanged, but
years in pain increased. For women, there was both a decrease in pain-free
years and an increase in years with musculoskeletal pain.
Most studies show that musculoskeletal pain is more common among wom-
en than men (Fillingim et al., 2009). Healthy LE in regard to musculoskeletal
pain has to our knowledge never been studied before. Most research on
healthy LE has focused on life with and without disability. In general, esti-
mates of life with and without disability show that women’s longer life spans
consist of more years both with disability and without disability (Crimmins,
et al., 2002).
As described in 4.3.1, there are several different hypotheses regarding the
association between mortality and morbidity and disability (Fries, 1980,
1983, 1986; Gruenberg, 1977; Manton, 1982; Olshansky, et al., 1991). Many
previous studies of health trends in older populations have suggested a com-
pression of morbidity. These studies have predominantly used health indica-
tors based on disability, most often measured as ADL and IADL limitations.

65
As disability is a contextually embedded concept, it also reflects environ-
mental improvements.
The results from Study I, Study II, and Study IV, suggest an expansion of
health problems in regard to diseases, symptoms, and objective tests of phys-
ical function in the oldest Swedish population between 1992 and 2002. Ad-
ditionally, the results from Study I and Study II also revealed a compression
of disability. Both Swedish and international studies that have included the
oldest old members of the population and used different health indicators
point to an expansion of health problems (symptoms and diseases) in the
elderly population in the 1990s (Crimmins, 2004; Crimmins & Beltrán-
Sánchez, 2011; Parker & Thorslund, 2007; Rosén & Haglund, 2005).
Descriptive studies of single health indicators among the oldest old are im-
portant from a methodological standpoint and in regard to the policy impli-
cations of prevalence rates and trends. The findings of Study I and Study IV
have several potential implications for health trend studies and the field of
social work (for future needs and resource allocations, social policy, and for
families).
Our results reveal that we cannot assume similar health trends for women
and men. Therefore, health trend studies must analyze health indicators for
women and men separately. Analyses that only control for gender may miss
important gender differences in trends over time. This may help us under-
stand how behavioral, social, and contextual factors affect women’s and
men’s health and how gender differences in disability and health arise.
The increases in several symptoms and diseases between 1992 and 2002
occurred during a period with dramatic changes in the social and health care
systems. This was a period of severe economic constraints on the public
sector that resulted in cutbacks and reforms. For example, the Elderly (Ädel)
Reform in 1992 transferred the responsibility for institutional care and for
discharged patients who still needed care from the county councils to the
municipalities. Between 1992 and 2005 the number of hospital beds and
treatment periods was drastically reduced (National Board of Health and
Welfare, 2007). Municipalities made their guidelines more stringent and
raised the threshold to old-age care. Changing social policy and access to
care services may affect both ―actual‖ health and the reporting of health
problems and need for help with daily activities. For example, reports of
need for help with ADL can be influenced by the individual’s awareness of
the ease or difficulty in getting help (Larsson, 2006).
Care of the older population is in many respects a concern for women, since
women dominate both as formal and informal caregivers as well as care re-
ceivers. Since older women live longer and are more likely to live alone
66
when they need help, they have a greater need for formal care services. This
means that younger, middle-aged, and older women are more dependent on
the social and health care systems. Changes to these systems would most
likely have a greater impact on the lives of women than men. If health and
functioning, especially women’s health, continue to worsen, this will imply a
need for more social and health care resources for the oldest old.
8.3 Changing relationships between health indicators
The findings of Study I implied that the association between health indica-
tors and ADL and IADL disability has changed over time. Study II explored
these associations directly. Results showed that most of the associations
between ADL and IADL disability and other health indicators were weaker
for women than for men. The associations became weaker for women over
time, while men showed a somewhat mixed pattern.
Both international and Swedish studies have shown increased prevalence
rates of several health indicators in the elderly population, while disability
measures, such as ADL and IADL, most often show no change or improve-
ment over time. This implies that the associations between health indicators
and disability change over time. A number of studies suggest that the associ-
ation between diseases and disability weakened during the 1990s (Crimmins,
2004; Jagger et al., 2007; Parker, et al., 2005; Rosén & Haglund, 2005;
Spillman, 2004).
Previous analyses of the SWEOLD data showed that the association between
mobility and ADL became weaker between 1992 and 2002 (Ahacic, et al.,
2007). A historical study from the United States (Costa, 2002) that examined
data from the early 1900s to the 1990s also suggested long-term reduction in
the debilitating effects of chronic conditions. Robine et al., (1998) studied
data from 1981 and 1991 in France and found that the most frequent chronic
conditions seemed to be less disabling in 1991. American data have shown
increases in disease and chronic conditions between 1984 and 1994 among
persons 70 years of age and older; at the same time, many of these condi-
tions became less disabling over time (Crimmins & Saito, 2000; Freedman
& Martin, 2000). The new contribution of Study II is that we explored the
gender specificity in the association between disability and other health indi-
cators.
Knowledge about the properties of various health indicators and the chang-
ing associations between them is important for research methodology and for
practical applications such as need assessment. For example, if we only look
at disability indicators, we miss the changing associations between condi-
tions that can lead to disability.
67
The differences between types of health indicators are described in the Inter-
national Classification of Functioning, Disability, and Health (ICF) (see 1.4).
The ICF model suggests that different components of health and functioning
are associated with different care needs. In short, symptoms and diseases
will imply a need for medical care, while functional limitations require reha-
bilitation and compensatory interventions. Disability among older persons
often implies a need for social services (home help services or institutional
living) (WHO, 2002b).
Accordingly, our findings of increases in symptoms and diseases suggest an
increased need and demand for medical care. The increases in functional
limitations (as measured in the performance tests) may require rehabilitation
and intervention. The fact that these conditions seem to have become less
disabling over time may imply that certain environmental changes (better
accessibility, access to assistive technology, and microwave ovens) may
have benefited old people, allowing even people in poor health to manage
daily living. If the environmental factors underlying these changes could be
identified, it may be possible to further facilitate disability despite poor
health and functional limitations.
Various instruments that incorporate ADL scales are often used to assess
elderly people’s needs for care and services. An assessment that included
functional limitations and the availability, or lack, of environmental supports
(elevators, walking aids, and vision and hearing aids) would provide a better
assessment of what the individual needs in terms of intervention or care ser-
vices.
Our results suggest that ADL and IADL reflect different dimensions of
health for women and men. For example, men’s stronger associations be-
tween psychological problems and IADL disability might suggest that men
are more emotionally vulnerable to physical limitations. We also see that
associations between ADL and other health indicators have changed in dif-
ferent ways for men and women. This could imply gender differences in the
availability or use of interventions or that gender roles are changing.
8.4 Gender differences in care utilization
According to the Andersen Behavioral Model (described in 5.3), care utiliza-
tion is the result of a multifaceted process of a person’s need (health and
functioning), behavior (propensity to seek care), and access (opportunities
and resources) (Andersen, 1995). These three components have both indi-
vidual and societal dimensions and are all influenced by gender. They also
differ depending on the kind of service provided. Study III described and
68
analyzed gender differences in physician and dentist visits among communi-
ty dwelling elderly people in 2002. Despite women’s generally poorer health
status, there were no gender differences in physician visits. Women had
poorer dental status than men. However, men reported more dental visits
compared to women (not significant after controls). Marriage was positively
associated with physician visits for men and dentist visits for women.
Increasing age is associated with health problems and, therefore, obviously
associated with the utilization of different kinds of care services. Many stu-
dies have shown that women have higher rates of care utilization than men in
young and middle ages (Bertakis, et al., 2000; Waldron, 1983; Verbrugge &
Wingard, 1987). Despite the high rates of care utilization among the oldest
segment of the population, which is dominated by women, relatively little
research has focused on gender differences in this group (Bird, et al., 2002;
Verbrugge & Wingard, 1987).
Some studies have found decreasing gender differences in health care utili-
zation with age, for example, in Sweden (ULF, ages 15–74) (National Board
of Health and Welfare, 2009b), Germany (ages 25–69) (Ladwig, et al.,
2000), and Finland and Norway (ages 65–74) (Suominen-Taipale, et al.,
2006). In one of the few studies including the oldest age groups, the Health
and Retirement Study in the United States (age 65+), showed no gender dif-
ferences in physician visits despite older women’s substantially greater
health needs (defined as functional health, disability, and medical condi-
tions) (Cameron, et al., 2010).
A Swedish study using data from Statistics Sweden (ULF, 1988/89, age 65+)
found that dental visits during the past year were more common among
women than men (Österberg et al., 1998). In contrast to our study, this study
included younger old persons (aged 65–76) and did not analyze age groups
separately. It has been shown that women have higher rates of dental care
utilization among younger age groups (see chapter 5, figure 5.1).
Given women’s worse health and dental status, one would expect them to
visit physicians and dentists more often than men. We found no gender dif-
ferences in physician visits and no gender differences in dentist visits after
controlling for civil status. We could identify certain ―vulnerable‖ groups
potentially in danger of unmet care needs. Our results imply that women
may be at a disadvantage regarding physician visits and unmarried men re-
garding both dentist and physician care. Perhaps these groups should be tar-
geted in preventive interventions.
These results cannot necessarily be transferred to other forms of care. The
access to different kinds of care services is influenced to different degrees by
gatekeepers and costs to the individual and provider. The gender bias differs
69
in factors that influence visits to physicians and dentists, and we can assume
they differ for other forms of care as well. For example, in regard to home-
help services and institutionalization, Larsson et al. (2004) found clear gend-
er differences. Women who gave care and support to their husbands were
less apt to receive informal or formal care than men who cared for their
wives. Accordingly, since women both live longer and tend to marry men
older than themselves, they are also less likely to have a spouse to care for
them in old age and more likely to need institutional care.
8.5 Methodological considerations
8.5.1 Representativity
Representativity is an important issue in prevalence-based descriptive stu-
dies of elderly people. In an ideal study (however unfeasible), the sample
perfectly reflects the actual referent population, and all respondents provide
complete data. In reality, all population-based studies must make compro-
mises between internal validity and generalizability (Hardy et al., 2009).
Much of the variation in health in the older population seen in studies is due
to methodological differences (in regard to nonresponse, inclusion or exclu-
sion of institutionalized and cognitively impaired individuals, handling of
missing data, and age standardization) (Parker & Thorslund, 2007). Studies
that have scrutinized and reexamined previous health-trend studies have
shown that rather small differences in survey design and methodological
changes between waves can influence results (Freedman et al., 2004; Wolf,
et al., 2005).
Missing data is a special challenge and the most common potential bias in
population-based studies is lack of response. Nonresponse rates generally
tend to increase with age, and nonresponse at high ages has been shown to
be associated with poor health and cognitive impairment (Chatfield et al.,
2005; Hardy, et al., 2009). Consequently, nonresponse in old ages will often
result in an underestimation of health problems. This kind of bias will be
more of a problem in older age groups than younger groups.
As described in chapter 6, the Swedish Panel Study of Living Conditions of
the Oldest Old (SWEOLD) (age 77+) was used in all studies in the present
thesis. Study IV also included some age groups (65–75 years) from the Swe-
dish Level of Living Survey (LNU). Both SWEOLD and LNU are based on
Swedish nationally representative samples with low nonresponse rates com-
pared to other population-based studies.

70
As with other surveys, nonresponse increased over time, and this increase
could have led to an underestimation of poor health in later waves. If this
was the case, a lower nonresponse rate in 2002 would have led to even
greater increases in poor health over time.
Response patterns and, therefore, the results might also have been affected
by the mode of interview (direct, proxy, and telephone). Fortunately, distri-
bution of interview mode in the SWEOLD surveys changed only slightly
between 1992 and 2002. Age and sex distribution in the samples, as well as
the percentage of persons living in institutions, reflected national figures
both in 1992 and 2002 (Thorslund et al., 2004)
A strength of the SWEOLD data is that both community-dwelling and insti-
tutionalized persons are included. Living alone has been shown to be a
strong predictor of institutionalization. Due to the fact that women often
outlive their spouses and thereby lack support from a partner, the majority
living in institutions are women (Larsson, et al., 2006). Men are more likely
to receive informal care from their wives in their own homes. The exclusion
of persons living in institutions in studies of elderly populations will there-
fore lead to an underrepresentation of older women, many of whom have
poor health.
Another important reason to include institutionalized persons when studying
health trends in the total elderly population is that the threshold to institu-
tional care changes over time in response to changes in policy and resource
allocation.
The impact of using proxy reports in surveys of elderly people has not been
fully examined. The biasing effect varies depending on type of indicator and
who acts as proxy. In general, the literature supports the use of proxies in
objective measures that are easy to observe, such as mobility. Subjective
measures, like psychological well-being, are more questionable (Middleton
et al., 2010; Neumann et al., 2000). In surveys of elderly people, the nonres-
ponse created by excluding these disabled elderly persons may be a greater
problem than the biasing effect of proxy reports (Corder et al., 1996).
8.5.2 Capturing change
One of the limitations of SWEOLD is that the data are only from two points
in time (a third wave is currently in progress). There is always a risk that
measures from few specific points in time could deviate from a general
trend. Nor can changes in the direction of trends be identified. For example,
the results of the annual Survey of Living Conditions (ULF) showed consi-
derably health improvement in people aged 65–85 years between the 1980
and 2006 surveys. However, a closer analysis demonstrated that most of
71
improvements took place during the 1980s; from the mid-1990s on, there
were mixed results, with some indicators showing deterioration (Parker, et
al., 2008).
Prevalence rates of self-reported (or proxy-reported) health problems can
reflect both ―real‖ health changes and changes in reporting behavior. The
propensity to report health problems can be affected by raised expectations
and aspirations in new cohorts of elderly people, greater awareness and
knowledge of health problems, and greater social acceptance of certain
symptoms and diseases. For example, education levels among elderly people
in 2002 were significantly higher than in 1992, which may correlate with
higher expectations in regard to health. Improvements and changed thre-
sholds in diagnostics can also have affected the reported prevalence of dis-
eases and symptoms. There have been changes in thresholds for hyperten-
sion and diabetes, for example, over the last decades (Freedman, et al.,
2007). This means that some of the increases in health problems we have
seen in our studies could be related to increased reporting in 2002 or under-
reporting in 1992. Since Study I and Study II include objective tests of phys-
ical function that also showed health deterioration, our results are not due
solely to raised expectations or changes in reporting behavior.
8.5.3 Other concerns
The SWEOLD sample (about 1/1000 of the Swedish population aged 77
years and older) provides limited statistical power. This means that some of
the gender differences in the analyses, particularly interactions between pe-
riod and gender, may not have been significant due to a lack of statistical
power.
The scales and questions included in SWEOLD are well established and
validated, and they are combined with both established tests (peak expiratory
flow, Mini-Mental State Examination) and some innovative tests of function
(range of motion, balance, strength, and vision). Some of the items have
been ―inherited‖ from the original LNU questionnaire of 1968 and are less
than ideal. The 1968 survey was not designed for old people, and there have
been methodological advancements since then. For example, the care utiliza-
tion items in 1968 required a 12-month recall for all kinds of care. Shorter
recall periods for some kinds of care utilization (physician visits) would have
been better. However, in an effort to preserve the longitudinal value of the
surveys, the researchers chose to retain the old formulations. Another exam-
ple concerns pain, an area that is ultimately subjective and so important to
elderly people. There are better ways to ask about pain, but new questions
could not have been easily compared to earlier answers in longitudinal ana-
lyses.
72
A strength of the SWEOLD data is the wide range of health indicators in-
cluded, from objective tests of function to self-reports of diseases and symp-
toms to disability. The benefit of objective tests is that they are less sensitive
to individual interpretations or expectations and less affected by environ-
mental factors. Self-reports, on the other hand, are more influenced by ex-
pectations and aspirations, which in turn may affect the results. However,
expectations have an impact on demand for care services and are therefore
important for that discussion.
It is clear that the choice of health indicator depends on the purpose of the
study. The findings of Study II, like those of Study I, confirm the fact that
we cannot assume unchanged associations between different health indica-
tors or unchanged gender patterns in health trends. The use of additive indic-
es can hide a complex reality. Single health indicators included in a compo-
site index may cover different trends over time and may differ between
women and men.
8.6 Concluding remarks and recommendations for future research
Our oldest old people are the fastest growing sector of the population. The
number and proportion of people over 80 years old is expected to continue
increasing rapidly. Changing gender patterns in mortality rates mean that the
composition of the population in regard to gender is also changing. Know-
ledge of health and disability trends in the aging population will provide
useful information for policy makers, planners, and researchers, because
these trends are likely to have implications on the demands on the Swedish
welfare system (health care, social care, and social policy in general). Cur-
rent health trends may also be helpful in forecasting future trends, and in
turn, future needs for care services.
Descriptive studies, as included in this thesis, provide valuable information
and constitute a necessary foundation for explanatory studies. Several impor-
tant questions arise from the findings of this thesis. To what extent do the
changing gender patterns in morbidity and disability reflect gender differ-
ences in trends in other underlying factors? To what extent are the changing
associations between morbidity and disability influenced by changing gender
roles? Are there gender differences in the use of assistive technology and in
the benefits of housing adaptations?
One recommendation for future research in this area is to apply a life course
perspective, with longitudinal analysis to examine the determinants of gend-
er differences in health and disability and how they emerge over time and
73
change in different cohorts. The weakening of the link between health and
disability needs further analysis and this could be done by examining gender
differences in specific ADL and IADL items independently. Another ques-
tion of interest is to what extent changing expectations and aspirations, as
well as gender roles, contribute to the changing associations between health
and disability.
Analyses of LNU data among younger age groups (19–75) between 1981
and 2000 showed increased prevalence rates for many health problems,
symptoms, self-reported health, musculoskeletal pain, and psychological
distress (Fritzell et al., 2007). Those in the older age groups in LNU 2000 are
the future SWEOLD cohorts. At the time of completing this thesis, in the
spring of 2011, a third SWEOLD survey wave is in progress, and this will
include these new cohorts of older persons. Whether these people will bring
their health problems with them into old age is an important question for
future research.
As a result of societal changes experienced during their lives, today’s co-
horts of elderly women and men differ in many respects from those of elder-
ly people during the 1990s. There are, for example, cohort changes and
changing gender patterns in health-related behaviors such as smoking, with
decreased smoking rates among men, and increased among women. Obesity
is increasing. With women’s increased participation in the labor market, the
proportion of housewives has decreased. Living conditions and working
environments have improved. Education levels are higher in more recent
cohorts, especially among women. How will these changes affect health in
old age, and how will these effects differ between women and men?
The study of healthy life expectancy is one way to monitor health changes
over time and between cohorts. This thesis looked at pain-free life expectan-
cy. What are the trends for other health indicators, such as disability-free life
expectancy or dependency-free life expectancy? And how are the gender
differences in healthy life expectancy changing over time?
The fact that men have gained more in life expectancy implies that the popu-
lation composition is also changing. The increased survival of men, even
very frail men, is leading to a greater proportion of men among the oldest
old. This implies that gender differences in health might decrease in the fu-
ture. This, in turn, implies that the probability of having a male spouse
among the oldest old will increase. Thus, women may have partners longer
in old age. If the proportion of couples among older people increases, this
may affect health, well-being, and needs for formal and informal care. More
work is needed in this area.

74
Gender differences in care utilization among the oldest old have not been
studied thoroughly. There is no doubt that gender is an influential factor in
the complex process of care utilization. Study III revealed interesting gender
patterns in regard to physician and dentist visits, and some groups that may
be at risk for unmet care needs were identified. Another interesting research
approach would be to focus on those who have not visited a physician or
dentist during the past 12 months. Are they in good health or can they also
be considered at risk for unmet care needs? In coming studies we will also
broaden our research perspective to include other forms of care services such
as formal social care services and informal care.
75
9 Acknowledgements
The work for this thesis was carried out at the Department of Social Work at
Stockholm University, and the Aging Research Center (ARC) (Karolinska
Institutet and Stockholm University). It has been a great privilege to work in
such a stimulating research environment, and to have input from so many
inspiring professionals. I would like to express my gratitude to the many
people who have helped and supported me in writing this thesis. In would
particularly like to mention:
Marti Parker, my main supervisor and co-author. I am extremely grateful to
you for sharing with me your broad knowledge and experience in the field of
social gerontology. Your support and inspiration have been invaluable.
Thank you for always taking the time to read and comment on my manu-
scripts without delay. Your editing skills are remarkable and your renowned
―Marti-ändringar‖ have helped me to understand how one should write and
tell a story. I hope that some of your excellent research skills have rubbed off
on me.
Mats Thorslund, my co-supervisor and co-author, was the one who intro-
duced me to the field of social gerontology. I am very grateful for all you
have done for me. Thank you for your advice, enthusiasm, laughs, discus-
sions on social policy and rock’n’roll, and for sometimes pushing me in the
right direction when I needed it. Marti and Mats, I can’t thank you enough!
My co-author Ingemar (Pingo) Kåreholt, a very generous person, with ex-
traordinary statistical and pedagogical skills - a rare combination. Thanks for
always taking the time to help me and for your support, and also from time
to time for convincing me that I would succeed in finishing this thesis. You
are the best informal supervisor a person could ask for: it is a privilege
knowing you.
My co-author Neda Agahi, for your positive attitude and for standing up for
what you believe in. You always told me that I should believe more in my
own ideas and this has been a great help. It is always a pleasure to work with
you!
Bitte Modin, thank you for thoroughly scrutinizing the final manuscript and
for all the helpful and constructive comments.

76
Thanks to Karin Hagersten, for careful and thorough English revisions of the
final manuscript.
Lennarth Johansson, at the National Board of Health and Welfare, and a new
member in the social gerontology group at ARC, thank you for the valuable
comments at article seminars and advice on this thesis, and for providing
inspiration for future work.
Many thanks to all my colleagues and friends in the social gerontology re-
search group at the Aging Research Center. I am greatly indebted to all of
you – both past and present members of the group: Bettina Meinow, Jose-
phine Heap, Jonas Wastesson, Helen Long, Susanne Kelfve, Linda Hols
Salén, Duangjai Lexomboon, Vanessa Parker, Dominika Piekut, and Kozma
Ahacic. You have all helped me a lot! Special thanks goes to: Stefan Fors,
my fellow PhD student and former room-mate in ―drängstugan‖; for sharing
your intellectual sharpness, all your help, stimulating discussions on research
and politics, and for keeping me updated on popular culture, and finally for
trying, in vain, to make an anglophile of me. Carin Lennartsson, for your
warm encouragement and for always being there, I would have been lost
without your support. Last but not least to Sara Hjulström, previously a
member of the social gerontology group, now at the Swedish Dementia Cen-
ter, my English tutor and much appreciated friend – thank you for sharing all
the ups and downs and for always making me laugh. You never gave up, and
I think you have finally taught me how to turn a phrase into English (I still
need some practice though). Your help has been invaluable!
A special posthumous thank you to Kristina Larsson, for her knowledge and
insight that will live on both in my own research and that of others.
Thanks to our international friend and collaborator Benjamin Shaw from the
University at Albany for valuable comments on the final manuscript.
Many thanks to everyone in the House of Aging Research: the Aging Re-
search Center, the Stockholm Gerontology Research Center, the Swedish
Dementia Center, and Tidningen Äldre i Centrum for providing such an in-
spiring working environment. Several people deserve a special mention:
Sven Erik Wånell, who first employed me at the Stockholm Gerontology
Research Center. My elderly care mentors Eva Norman and Ingrid Hjalmar-
son for keeping me updated on developments in elderly care. And also Jenny
Österman, Lars Sonde, Anita Karp, Ulla Gurner, Lisbeth Hagman, Eva von
Strauss, Kristina Johnell, Rose-Marie Hedberg, Inger Dahlén, Carl-Erik Ols-
son, Inger Raune, and Ethel Lanesjö. And finally, my earlier co-author,
Mårten Lagergren, for introducing me to time series analyses, and for enter-
taining me with stories from all over the world.
77
Many thanks to my fellow PhD students and the senior researchers at the
Department of Social Work at Stockholm University (my other home).
Thanks to Evy Gunnarsson and Ilija Batjlan for valuable comments on my
research plan, and to Lotten Cederholm Riese who has guided me through all
the administrative tasks. Special thanks to Marie Birge Rönnerfält for intro-
ducing me to the House of Aging Research.
Thanks to Britt-Marie Guldbrandsen, Cecilia Annerholm, Hélène von
Strauss, Maria Yohuang, Christian Lynghaug, and Zoltán Pethö for all your
help with administrative and technical tasks.
Furthermore, I would like to thank all of my friends, old and new. You know
who you are and you have waited patiently for me to finish my homework so
I can come out and play again. My friends in the gruppetto, you will never
have to wait (this long) for me again!
My final thanks go to my family: My parents Fred and Ingrid for always
supporting me in whatever I have wanted to do. My mother-in-law Annukka
for all your help. Finally and most of all, my wife Inka, and our adorable
children Cesar and Lydia for all the fun, laughter, and love in life.
This thesis was supported by grants from the Swedish Council for Working
Life and Social Research (FAS).
Pär Schön, February 2011
78
10 References
Agahi, N. (2008). Leisure in late life: Patterns of participation and relationship with health. Doctoral thesis. Department of neurobiology, care sciences and society. Karolinska Institutet. Sweden.
Ahacic, K. (2002). Improvements in the aging population 1968-1991: Trends in mobility and dental status. Doctoral thesis. Department of social work. Stockholm University. Sweden.
Ahacic, K., Kennison, R., & Thorslund, M. (2008). Trends in smoking in Sweden from 1968 to 2002: Age, period, and cohort patterns. Preventive Medicine, 46(6), 558-564.
Ahacic, K., Kåreholt, I., Thorslund, M., & Parker, M. G. (2007). Relationships between symptoms, physical capacity and activity limitations in 1992 and 2002. Aging Clinical and Experimental Research, 19(3), 187-193.
Ahacic, K., Parker, M., & Thorslund, M. (2000). Mobility limitations in the Swedish population from 1968 to 1992: Age, gender and social class differences. Aging (Milano), 12(3), 190.
Andersen, R. M. (1995). Revisiting the behavioral model and access to medical care: Does it matter? Journal of Health and Social Behavior, 36(1), 1-10.
Appelros, P., Stegmayr, B., & Terent, A. (2009). Sex differences in stroke epidemiology: A systematic review. Stroke, 40, 1082-1090.
Arber, S., & Cooper, H. (1999). Gender differences in health in later life: The new paradox? Social Science & Medicine, 48(1), 61-76.
Arber, S., & Ginn, J. (1993). Gender and inequalities in health in later life. Social Science & Medicine, 36(1), 33-46.
Arber, S., & Thomas, H. (2001). From women’s health to a gender analysis of health. In W. C. Cockerham (Ed.), Comparative medical sociology (pp. 94–113). New York: Blackwell.
Austad, S. N. (2006). Why women live longer than men: Sex differences in longevity. Gender Medicine, 3(2), 79-92.
Axelsson, C. (1992). Hemmafrun som försvann. Övergången till lönearbete bland gifta kvinnor i Sverige 1968-1981 [The housewife that disappeared. The transition to paid work among married women in Sweden 1968-1981]. Doctoral thesis. Swedish Institute for Social Research. Stockholm University. Sweden.
Barford, A., Dorling, D., Davey Smith, G., & Shaw, M. (2006). Life expectancy: Women now on top everywhere. British Medical Journal, 332(7545), 808.

79
Batljan, I., & Thorslund, M. (2009). The effect of change in educational composition on population ageing. European Journal of Ageing, 6(3), 191-200.
Bengtsson, T., & Scott, K. (2010). The ageing population. In T. Bengtsson (Ed.), Population Ageing - A Threat to the Welfare State? The Case of Sweden (pp. 7-22). Berlin Heidelberg: Springer.
Berfenstam, R., & Hedqvist, H. (1960). Åldringarnas livsvillkor och vårdbehov. En utredning omfattande pensionärer i Uppsala län [Elderly peoples living conditions and care needs. An investigation concerning pensioners in Uppsala county]. Uppsala: Almqvist & Wiksell.
Bertakis, K., Azari, R., Helms, L., Callahan, E., & Robbins, J. (2000). Gender differences in the utilization of health care services. Journal of Family Practice, 49(2), 147-152.
Bird, C., & Rieker, P. (1999). Gender matters: An integrated model for understanding men's and women's health. Social Science & Medicine, 48(6), 745-755.
Bird, C., & Rieker, P. (2008). Gender and health: The effects of constrained choices and social policies. New York: Cambridge University Press.
Bird, C., Shugarman, L., & Lynn, J. (2002). Age and gender differences in health care utilization and spending for Medicare beneficiaries in their last years of life. Journal of Palliative Medicine, 5(5), 705-712.
Brønnum-Hansen, H. (2005). Health expectancy in Denmark, 1987–2000. The European Journal of Public Health, 15(1), 20.
Buckley, N., Robb, A., Denton, F., & Spencer, B. (2005). Healthy aging at older ages: Are income and education important? Canadian Journal on Aging/La Revue canadienne du vieillissement, 23(5), S155-S169.
Burström, B. (2010). Socialmedicin och rättvis vård [Social medicine and fair care]. Socialmedicinsk tidskrift, 86(5), 410-416.
Cameron, K., Song, J., Manheim, L., & Dunlop, D. (2010). Gender disparities in health and healthcare use among older adults. Journal of Women's Health, 19(9), 1643-1650.
Chatfield, M. D., Brayne, C. E., & Matthews, F. E. (2005). A systematic literature review of attrition between waves in longitudinal studies in the elderly shows a consistent pattern of dropout between differing studies. Jornal of Clinical Epidemiology, 58(1), 13-19.
Christensen, K., Doblhammer, G., Rau, R., & Vaupel, J. (2009). Ageing populations: The challenges ahead. The Lancet, 374(9696), 1196-1208.
Christensen, K., Ørstavik, K. H., & Vaupel, J. W. (2001). The X chromosome and the female survival advantage. Annals of the New York Academy of Sciences, 954(Population health and aging: Strengthening the dialogue between epidemiology and demography), 175-183.
Cook, N. R., Albert, M. S., Berkman, L. F., Blazer, D., Taylor, J. O., & Hennekens, C. H. (1995). Interrelationships of peak expiratory flow rate with physical and cognitive function in the elderly: MacArthur

80
Foundation Studies of Aging. Journal of Gerontology: MEDICAL SCIENCES, 50(6), M317-323.
Cook, N. R., Evans, D. A., Scherr, P. A., Speizer, F. E., Taylor, J. O., & Hennekens, C. H. (1991). Peak expiratory flow rate and 5-year mortality in an elderly population. American Journal of Epidemiology, 133(8), 784-794.
Corder, L. S., Woodbury, M. A., & Manton, K. G. (1996). Proxy response patterns among the aged: Effects on estimates of health status and medical care utilization from the 1982-1984 long-term care surveys. Journal of Clinical Epidemiology, 49(2), 173-182.
Costa, D. (2002). Changing chronic disease rates and long-term declines in functional limitation among older men. Demography, 39(1), 119-137.
Crimmins, E. M. (1996). Guest Editorial: Mixed Trends in Population Health among Older Adults. Journal of Gerontology: SOCIAL SCIENCES, 51(5), S223.
Crimmins, E. M. (2004). Trends in the health of the elderly. Annual Review of Public Health, 25, 79-98.
Crimmins, E. M., & Beltrán-Sánchez, H. (2011). Mortality and Morbidity Trends: Is there compression of morbidity? Journal of Gerontology: SOCIAL SCIENCES, 66(1), 75.
Crimmins, E. M., Kim, J., & Hagedorn, A. (2002). Life with and without disease: Women experience more of both. Journal of Women & Aging, 14(1), 47-59.
Crimmins, E. M., & Saito, Y. (2000). Change in the prevalence of diseases among older Americans: 1984-1994. Demographic Research, 3, Article 9. Retreived from http://www.demographic-research.org.
Crimmins, E. M., & Saito, Y. (2001). Trends in healthy life expectancy in the United States, 1970-1990: Gender, racial, and educational differences. Social Science & Medicine, 52(11), 1629-1641.
Culyer, A., & Wagstaff, A. (1993). Equity and equality in health and health care. Journal of Health Economics, 12(4), 431.
Cutler, D. (2001). The reduction in disability among the elderly. Proceedings of the National Academy of Sciences, USA, 98(12), 6546.
Danielsson, M., & Lindberg, G. (2001). Differences between men's and women's health: The old and new gender paradox. In P. Östlin et al. (Ed.), Gender Inequalities in Health: A Swedish Perspective (pp. 23-66). Boston: Harvard University Press.
Danielsson, M., & Talbäck, M. (2009). Folkhälsan översikt [Public health overview]. In National Board of Health and Welfare (Ed.), Hälso- och sjukvårdsrapport 2009 (Health and care report 2009) (pp. 17-39). Stockholm: National Board of Health and Welfare.
Dental Care Act. (SFS 1985:125). [Tandvårdslag]. Sweden. Directorate-General Health and Consumer Protection. (2004). The State of
Mental Health in the European Union. European Commission, Luxembourg.

81
Dunlop, D., Manheim, L., Song, J., & Chang, R. (2002). Gender and ethnic/racial disparities in health care utilization among older adults. Journal of Gerontology: SOCIAL SCIENCES, 57(3), S221-233.
Erikson, R. (2001). Why do graduates live longer? Education, occupation, family and mortality during the 1990s. In J. O. Jonsson & C. Mills (Eds.), Cradle to grave. Life-course change in modern sweden (pp. 211-227). Durham: Sociology Press.
Erikson, R., & Åberg, R. (1987). Welfare in transition: A survey of living conditions in Sweden 1968-1981. Oxford: Clarendon.
Eurostat. (2005). EU-25 population rises until 2025, then falls. News release. Luxemburg: Eurostat.
Feigin, V., Lawes, C., Bennett, D., & Anderson, C. (2003). Stroke epidemiology: A review of population-based studies of incidence, prevalence, and case-fatality in the late 20th century. The Lancet Neurology, 2(1), 43-53.
Fillingim, R., King, C., Ribeiro-Dasilva, M., Rahim-Williams, B., & Riley III, J. (2009). Sex, gender, and pain: A review of recent clinical and experimental findings. Journal of Pain, 10(5), 447-485.
Folstein, M. F., Folstein, S. E., & McHugh, P. R. (1975). Mini-mental state: A practical method for grading the cognitive state of patients for the clinician. Journal of Psychiatric Research, 12(3), 189-198.
Fors, S. (2007). Health inequalities among older adults in Sweden 1992-2002. The European Journal of Public Health, 18(2), 138-143.
Fors, S. (2010). Blood on the tracks. Life-course perspectives on health inequalities in later life. Doctoral thesis. Department of social work. Stockholm University. Sweden.
Freedman, V. A., Crimmins, E., Schoeni, R. F., Spillman, B. C., Aykan, H., Kramarow, E., et al. (2004). Resolving inconsistencies in trends in old-age disability: Report from a technical working group. Demography, 41(3), 417-441.
Freedman, V. A., & Martin, L. G. (2000). Contribution of chronic conditions to aggregate changes in old-age functioning. American Journal of Public Health, 90(11), 1755-1760.
Freedman, V. A., Martin, L. G., & Schoeni, R. F. (2002). Recent trends in disability and functioning among older adults in the United States: A systematic review. JAMA, 288(24), 3137-3146.
Freedman, V. A., Schoeni, R., Martin, L., & Cornman, J. (2007). Chronic conditions and the decline in late-life disability. Demography, 459-477.
Fries, J. F. (1980). Aging, natural death, and the compression of morbidity. New England Journal of Medicine, 303(3), 130-135.
Fries, J. F. (1983). The compression of morbidity. Milbank Memorial Fund Quarterly/Health and Society, 61(3), 397-419.
Fries, J. F. (1986). The future of disease and treatment. Changing health conditions, changing behaviors, and new medical technology. Journal of Professional Nursing, 2(1), 10-19.

82
Fries, J. F. (2003). Measuring and monitoring success in compressing morbidity. Annals of Internal Medicine, 139(5 Pt 2), 455-459.
Fritzell, J., Lennartsson, C., & Lundberg, O. (2007). Health and inequalities in Sweden: Long and short-term perspectives. In J. Fritzell & O. Lundberg (Eds.), Health inequalities and welfare resources, continuity and change in Sweden (pp. 19-41). Bristol: The Policy Press.
Fritzell, J., & Lundberg, O. (Eds.). (2007). Health inequalities and welfare resources. Continuity and change in Sweden. Bristol: The Policy Press.
Galobardes, B., Lynch, J., & Smith, G. D. (2007). Measuring socioeconomic position in health research. Brittish Medical Bulletin, 81-82, 21-37.
Gatz, M., Fratiglioni, L., Johansson, B., Berg, S., Mortimer, J. A., Reynolds, C. A., et al. (2005). Complete ascertainment of dementia in the Swedish Twin Registry: The HARMONY study. Neurobiology of Aging, 26(4), 439-447.
George, L. K. (1996). Social factors and illness. In R. H. Binstock & L. K. George (Eds.), Handbook of aging and the social sciences (pp. 229-249). San Diego: Academic Press.
Gilbert, G., Shelton, B., Chavers, L., & Bradford Jr, E. (2003). The paradox of dental need in a population-based study of dentate adults. Medical Care, 41(1), 119-134.
Gillström, P. (2001). Fair care: Four essays on the allocation and utilization of health care. Doctoral thesis. Department of Sociology. Stockholm University. Sweden, Stockholm.
Ginn, J., & Arber, S. (1995). Only connect: Gender relations and ageing. In S. Arber & J. Ginn (Eds.), Connecting gender and ageing: A sociological approach (pp. 1–14). Buckingham: Open university press.
Gold, C., Malmberg, B., McClearn, G., Pedersen, N., & Berg, S. (2002). Gender and health. Journal of Gerontology: SOCIAL SCIENCES, 57(3), S168-176.
Goldman, N. (1993). Marriage selection and mortality patterns: Inferences and fallacies. Demography, 30(2), 189-208.
Gruenberg, E. M. (1977). The failures of success. Milbank Memorial Fund Quarterly, 55(1), 3-24.
Gunnarsson, E. (2009). Man får inte stanna upp - om äldre kvinnors och mäns vardagsliv och kroppens förändring [One shouldn't slow down - on elderly womens and mens everyday life and their bodily changes]. In E. Gunnarsson & M. Szebehely (Eds.), Genus i omsorgens vardag [Gender in everyday elderly care] (pp. 100-116). Stockholm: Gothia.
Gunnarsson, E., & Szebehely, M. (2009). Komplexiteter och utmaningar i omsorgens vardag [Complexities and challenges in everyday elderly care]. In E. Gunnarsson & M. Szebehely (Eds.), Genus i omsorgens vardag [Gender in everyday elderly care] (pp. 11-26). Stockholm: Gothia.
83
Hammarström, A. (2002). What could a gender perspective mean in medical and public-health research. In S. P. Wamala & J. Lynch (Eds.), Gender and social inequities in health (pp. 21-41). Lund: Studentlitteratur.
Hammarström, A., Härenstam, A., & Östlin, P. (2001). Gender and health: Concepts and explanatory models. In P. Östlin et al. (Ed.), Gender inequalities in health: A Swedish perspective (pp. 1-22). Boston: Harvard University Press.
Hardy, S. E., Allore, H., & Studenski, S. A. (2009). Missing data: A special challenge in aging research. Journal of the American Geriatrics Society, 57(4), 722-729.
Health and Medical Services Act. (SFS 1982:763). [Hälso- och sjukvårdslag]. Sweden.
Hemström, Ö. (2001a). Biological and social conditions: Hypotheses regarding mortality differentials between men and women. In P. Östlin et al. (Ed.), Gender inequalities in health: A Swedish perspective (pp. 195-223). Boston: Harvard University Press.
Hemström, Ö. (2001b). Working conditions, the work environment and health: Health in Sweden: The National Public Health Report 2001. Scandinavian Journal of Public Health, 58, 167-184.
Hibbard, J., & Pope, C. (1986). Another look at sex differences in the use of medical care. Women Health, 11(2), 21-36.
Hu, Y. R., & Goldman, N. (1990). Mortality differentials by marital status: An international comparison. Demography, 27(2), 233-250.
Idler, E., & Benyamini, Y. (1997). Self-rated health and mortality: A review of twenty-seven community studies. Journal of Health and Social Behavior, 38(1), 21-37.
Idler, E., Hudson, S., & Leventhal, H. (1999). The meanings of self-ratings of health. Research on Aging, 21(3), 458.
Jacobzone, S. (2000). Coping with aging: International challenges. Health Affairs, 19(3), 213-225.
Jacobzone, S., Cambois, E., & Robine, J. M. (2000). Is the health of older persons in OECD countries improving fast enough to compensate for population ageing? OECD Economic Studies, 30(1), 149-183.
Jagger, C., Gillies, C., Moscone, F., Cambois, E., Van Oyen, H., Nusselder, W., et al. (2008). Inequalities in healthy life years in the 25 countries of the European Union in 2005: A cross-national meta-regression analysis. Lancet, 372(9656), 2124-2131.
Jagger, C., Hauet, E., & Brouard, N. (2001). Health expectancy calculation by the Sullivan Method: A practical guide: European Concerted Action on the Harmonization of Health Expectancy Calculations in Europe (EURO-REVES).
Jagger, C., Matthews, R., Matthews, F., Spiers, N., Nickson, J., Paykel, E., et al. (2007). Cohort differences in disease and disability in the young-old: Findings from the MRC Cognitive Function and Ageing Study (MRC-CFAS). BMC Public Health, 7(1), 156.
84
Johnell, K., Weitoft, G. R., & Fastbom, J. (2009). Sex differences in inappropriate drug use: A register-based study of over 600,000 older people. Annals of Pharmacotherapy, 43(7), 1233-1238.
Juel, K., & Christensen, K. (2008). Are men seeking medical advice too late? Contacts to general practitioners and hospital admissions in Denmark 2005. Journal of Public Health, 30(1), 111-113.
Kalben, B. B. (2000). Why men die younger: Causes of mortality differences by sex. North American Actuarial Journal, 4(4), 83-111.
Kramarow, E., Lubitz, J., Lentzner, H., & Gorina, Y. (2007). Trends in the health of older Americans, 1970-2005. Health Affairs, 26(5), 1417.
Kuh, D., Ben-Shlomo, Y., Lynch, J., Hallqvist, J., & Power, C. (2003). Life course epidemiology. Journal of Epidemiology and Community Health, 57(10), 778.
Kuh, D., & Hardy, R. (2002). A life course approach to women's health: Does the past predict the present? In D. Kuh & R. Hardy (Eds.), A life course approach to women's health (pp. 3-20). Oxford: Oxford University Press.
Kunst, A. E., Bos, V., Lahelma, E., Bartley, M., Lissau, I., Regidor, E., et al. (2005). Trends in socioeconomic inequalities in self-assessed health in 10 European countries. International Journal of Epidemiology, 34(2), 295-305.
Kåreholt, I., Parker, M. G., Thorslund, M., Meinow, B., & Ahacic, K. (2004). Possible causes for declining health in the oldest old of Sweden 1992-2002. The Gerontologist, 44(Special issue 1), 49-50.
Ladwig, K., Marten-Mittag, B., Formanek, B., & Dammann, G. (2000). Gender differences of symptom reporting and medical health care utilization in the German population. European Journal of Epidemiology, 16(6), 511-518.
Lagergren, M., & Batljan, I. (2000). Will there be a helping hand? Macroeconomic scenarios of future needs and costs of health and social care for the elderly in Sweden, 2000-2030. Stockholm: Ministry of Health and Social Affairs.
Lahelma, E., Kivelä, K., Roos, E., Tuominen, T., Dahl, E., Diderichsen, F., et al. (2002). Analysing changes of health inequalities in the Nordic welfare states. Social Science & Medicine, 55(4), 609-625.
Lahelma, E., Martikainen, P., Rahkonen, O., & Silventoinen, K. (1999). Gender differences in illhealth in Finland: Patterns, magnitude and change. Social Science & Medicine, 48(1), 7-19.
Lahelma, E., & Rahkonen, O. (1997). Health inequalities in modern societies and beyond: Introduction. Social Science & Medicine, 44(6), 721-722.
Larsson, K. (2004). According to need? Predicting use of formal and informal care in a Swedish urban elderly population. Doctoral thesis. Department of social work. Stockholm University. Sweden.
Larsson, K. (2006). Hemtjänst och anhörigvård [Home-help services and informal care]. In Statistics Sweden (Ed.), Äldres levnadsförhållanden. Arbete, ekonomi, hälsa och sociala nätverk
85
1980-2003 [Living conditions of the elderly. Work, economy, health and social networks 1980-2003] (pp. 421-434). Stockholm: Statistics Sweden.
Larsson, K., & Silverstein, M. (2004). The effects of marital and parental status on informal support and service utilization: A study of older Swedes living alone. Journal of Aging Studies, 18, 231-244.
Larsson, K., & Thorslund, M. (2006). Old people's health. Scandinavian Journal of Public Health, 34 (Suppl 67), 185-198.
Larsson, K., Thorslund, M., & Forsell, Y. (2004). Dementia and depressive symptoms as predictors of home help utilization among the oldest old. Journal of Aging and Health, 16(5), 641.
Larsson, K., Thorslund, M., & Kåreholt, I. (2006). Are public care and services for older people targeted according to need? Applying the Behavioural Model on longitudinal data of a Swedish urban older population. European Journal of Ageing, 3(1), 22-33.
Lennartsson, C., & Lundberg, O. (2007). 'What's marital status got to do with it?': Gender inequalities in economic resources, health and functional abilities among older adults. In J. Fritzell & O. Lundberg (Eds.), Health inequalities and welfare resources: Continuity and change in Sweden (pp. 179-198). Brighton: Policy Press.
Lorber, J., & Moore, L. (2002). Gender and the social construction of illness. Walnut Creek: Altamira Press.
Lundberg, O. (1990). Den ojämlika ohälsan. Om klass- och könsskillnader i sjuklighet [Inequality in ill health: On class and sex differences in illness]. Stockholm: Almqvist & Wiksell International.
Lundberg, O., & Manderbacka, K. (1996). Assessing reliability of a measure of self-rated health. Scandinavian Journal of Social Medicine, 24(3), 218-224.
Lundberg, O., & Thorslund, M. (1996). Fieldwork and measurement considerations in surveys of the oldest old. Social Indicators Research, 37(2), 165-187.
Lundberg, U. (2002). Gender, multiple roles and physiological reactions. In S. Wamala, P & J. Lynch (Eds.), Gender and social inequities in health: A public health issue (pp. 123-157). Lund: Studentlitteratur.
Lundberg, U., & Frankenhaeuser, M. (1999). Stress and workload of men and women in high-ranking positions. Journal of Occupational Health Psychology, 4(2), 142-151.
Macintyre, S., Ford, G., & Hunt, K. (1999). Do women 'over-report' morbidity? Men's and women's responses to structured prompting on a standard question on long standing illness. Social Science & Medicine, 48(1), 89-98.
Macintyre, S., Hunt, K., & Sweeting, H. (1996). Gender differences in health: Are things really as simple as they seem? Social Science & Medicine, 42(4), 617-624.
Manton, K. G. (1982). Changing concepts of morbidity and mortality in the elderly population. Milbank Memorial Fund Quarterly/Health and Society, 60(2), 183-244.
86
Manton, K. G. (1990). Mortality and morbidity. In R. H. Binstock & L. K. George (Eds.), Handbook of aging and the social sciences (Third edition ed., pp. 64-90). New York: Academic Press.
Manton, K. G., Corder, L., & Stallard, E. (1997). Chronic disability trends in elderly United States populations: 1982–1994. Proceedings of the National Academy of Sciences, USA, 94(6), 2593.
Manton, K. G., & Gu, X. (2001). Changes in the prevalence of chronic disability in the United States black and nonblack population above age 65 from 1982 to 1999. Proceedings of the National Academy of Sciences, USA, 98(11), 6354.
Marmot, M. (2004). The Status Syndrome. New York: Times Books. Meinow, B. (2008). Capturing health in the elderly population. Complex
health problems, mortality, and the allocation of home-help services. Doctoral thesis. Department of social work. Stockholm University. Sweden.
Merrill, S. S., Seeman, T. E., Kasl, S. V., & Berkman, L. F. (1997). Gender differences in the comparison of self-reported disability and performance measures. Journal of Gerontology: MEDICAL SCIENCES, 52(1), M19-26.
Middleton, L. E., Kirkland, S. A., Mitnitski, A., & Rockwood, K. (2010). Proxy reports of physical activity were valid in older people with and without cognitive impairment. Journal of Clinical Epidemiology, 63(4), 435-440.
Nathanson, C. A. (1977). Sex, illness, and medical care: A review of data, theory, and method. Social Science & Medicine, 11(1), 13-25.
National Board of Health and Welfare. (2007). Current developments in care of the elderly in Sweden. Stockholm: National Board of Health and Welfare.
National Board of Health and Welfare. (2008). Mot en mer jämställd sjukvård och socialtjänst [Towards more equal health care and social services]. Stockholm: National Board of Health and Welfare.
National Board of Health and Welfare. (2009a). Tandvård och tandhälsa [Dental care and dental health]. In National Board of Health and Welfare (Ed.), Hälso- och sjukvårdsrapport 2009 (Health and care report 2009) (pp. 402-420). Stockholm: National Board of Health and Welfare.
National Board of Health and Welfare. (2009b). Vård på lika villkor - hur jämlik är vården? (Care on equal terms - how equal is care?). In National Board of Health and Welfare (Ed.), Hälso- och sjukvårdsrapport 2009 (Health and care report 2009) (pp. 183-204). Stockholm: National Board of Health and Welfare.
National Board of Health and Welfare. (2011). Lägesrapport 2011. Hälso- och sjukvård och socialtjänst [Report of the situation 2011. Health care and social services]. Stockholm: National Board of Health and Welfare.
Nermo, M. (1999). Structured by gender: Patterns of sex segregation in the Swedish labour market. Historical and cross-national comparisons.
87
Doctoral thesis. Swedish Institute for Social Research. Stockholm University. Sweden.
Neumann, P. J., Araki, S. S., & Gutterman, E. M. (2000). The use of proxy respondents in studies of older adults: Lessons, challenges, and opportunities. Journal of the American Geriatrics Society, 48(12), 1646-1654.
Oeppen, J., & Vaupel, J. (2002). Broken limits to life expectancy. Science, 296(5570), 1029.
Oksuzyan, A. (2009). Sex differences in health and mortality - A multi-wave survey and register study. Doctoral thesis. University of Southern Denmark, Odense, and Max Planck Institute for Demographic Research, Rostock, Germany.
Oksuzyan, A., Juel, K., Vaupel, J. W., & Christensen, K. (2008). Men: Good health and high mortality. Sex differences in health and aging. Aging Clinical and Experimental Research, 20(2), 91-102.
Olshansky, S., Rudberg, M., Carnes, B., Cassel, C., & Brody, J. (1991). Trading off longer life for worsening health. Journal of Aging and Health, 3(2), 194-216.
Palmer, K., Wang, H. X., Backman, L., Winblad, B., & Fratiglioni, L. (2002). Differential evolution of cognitive impairment in nondemented older persons: Results from the Kungsholmen Project. American Journal of Psychiatry, 159(3), 436-442.
Parker, M. G., Ahacic, K., & Thorslund, M. (2005). Health changes among Swedish oldest old: Prevalence rates from 1992 and 2002 show increasing health problems. Journal of Gerontology: Medical Sciences, 60 A(10), 1351-1355.
Parker, M. G., Gatz, M., & Thorslund, M. (1996). Brief cognitive screening in a field survey of the oldest old. Aging (Milano), 8(5), 354-359.
Parker, M. G., Lennartsson, C., & Kelfve, S. (2010). Approcher l’âge de la retraite en Suède: Santé et ressources des 50-64 ans entre 1968 et 2000 [Approaching retirement age in Sweden: Health and resources of 50 to 64-year-olds from 1968 to 2000]. Retraite et Société, 59, 39-59.
Parker, M. G., Schön, P., Lagergren, M., & Thorslund, M. (2008). Functional ability in the elderly Swedish population from 1980 to 2005. European Journal of Ageing, 5(4), 299-309.
Parker, M. G., & Thorslund, M. (2007). Health trends in the elderly population: Getting better and getting worse. The Gerontologist, 47(2), 150-158.
Parker, M. G., Thorslund, M., & Lundberg, O. (1994). Physical function and social class among Swedish oldest old. Journal of Gerontology: SOCIAL SCIENCES, 49(4), 196-201.
Parslow, R., Jorm, A., Christensen, H., Jacomb, P., & Rodgers, B. (2004). Gender differences in factors affecting use of health services: An analysis of a community study of middle-aged and older Australians. Social Science & Medicine, 59(10), 2121-2129.
88
Persson, G., Boström, G., Allebeck, P., Andersson, L., Berg, S., Johansson, L., et al. (2001). Elderly people's health - 65 and after. Health in Sweden: The National Public Health Report 2001. Scandinavian Journal of Public Health, 29(3), 117-131.
Persson, J., Sjöberg, I., & Johansson, S.-E. (2004). Bruk och missbruk, vanor och ovanor. Hälsorelaterade levnadsvanor 1980-2002 [Health related habits of life 1980-2002]. Stockholm: SCB.
Rieker, P. P., & Bird, C. E. (2005). Rethinking gender differences in health: Why we need to integrate social and biological perspectives. Journal of Gerontology: SERIES B, 60B (Special issue II), 40-47.
Robine, J. M., & Michel, J. P. (2004). Looking forward to a general theory on population aging. Journal of Gerontology: MEDICAL SCIENCES, 59(6), M590-597.
Robine, J. M., Mormiche, P., & Sermet, C. (1998). Examination of the causes and mechanisms of the increase in disability-free life expectancy. Journal of Aging and Health, 10(2), 171.
Rosén, M., & Haglund, B. (2005). From healthy survivors to sick survivors - Implications for the twenty-first century. Scandinavian Journal of Public Health, 33(2), 151-155.
Rudd, R., Moeykens, B., & Colton, T. (1999). Health and literacy: A review of medical and public health literature. In J. P. Comings, B. Garners & C. Smith (Eds.), Annual review of adult learning and literacy (Vol. 1, pp. 158-199). New York: Jossey-Bass.
Shye, D., Mullooly, J., Freeborn, D., & Pope, C. (1995). Gender differences in the relationship between social network support and mortality: A longitudinal study of an elderly cohort. Social Science & Medicine, 41(7), 935-947.
Social Services Act. (SFS 2001:453). [Socialtjänstlagen]. Sweden. Spillman, B. C. (2004). Changes in elderly disability rates and the
implications for health care utilization and cost. Milbank Quarterly, 82(1), 157-194.
Statistics Sweden. (1999). Från folkbrist till en åldrande befolkning: Glimtar ur en unik befolkningsstatistik under 250 år. Fakta inför 2000-talet. [From a shortage of people to an aging population. Glimpses from a unique population based statistical database covering 250 years: Facts for the 21th Century]. Stockholm: Statistics Sweden.
Statistics Sweden. (2005). Beskrivning av Sveriges befolkning 2004 [Description of the population in Sweden 2004]. Official Statistics of Sweden. Stockholm: Statistics Sweden.
Statistics Sweden. (2006a). Ohälsa och sjukvård 1980-2005. [Illness and medical care 1980-2005]. Levnadsförhållanden. Rapport nummer 113. Stockholm: Statistics Sweden.
Statistics Sweden. (2006b). Women and men in Sweden: Facts and figures 2006. Stockholm: Statistics Sweden.
Statistics Sweden. (2007). Livslängden i Sverige 2001-2005: Livslängdstabeller för riket och länen [Length of life in Sweden
89
2001-2002: Tables of length of life for the country and countys]. Stockholm: Statistics Sweden.
Statistics Sweden. (2009). Demografiska rapporter 2009:1. Sveriges framtida befolkning 2009-2060 [Demographic reports 2009:1. The future population of Sweden]. Stockholm: Statistics Sweden.
Statistics Sweden. (2010). Population register. Retrieved 2010-12-14, from Statistics Sweden: http://www.ssd.scb.se/databaser/makro/SaveShow.asp
Sundin, J., & Willner, S. (2007). Social change and health in Sweden: 250 years of politics and practice. Stockholm: Swedish National Institute of Public Health.
Sundström, G., & Thorslund, M. (2011). Healthy aging in Sweden. In A. Scharlach (Ed.), Healthy aging in socio-cultural context: Perspectives from the United States, Sweden, and Japan. Tokyo: Kazamashobo Publishing. In press.
Suominen-Taipale, A., Martelin, T., Koskinen, S., Holmen, J., & Johnsen, R. (2006). Gender differences in health care use among the elderly population in areas of Norway and Finland: A cross-sectional analysis based on the HUNT study and the FINRISK Senior Survey. BMC Health Services Research, 6(1), 110.
Szebehely, M. (2003). Den nordiska hemtjänsten - bakgrund och omfattning [Home help services in the Nordic region - background and extent]. In M. Szebehely (Ed.), Hemhjälp i Norden - illustrationer och reflektioner [Home help services in the Nordic region - illustrations and reflections] (pp. 23-61). Lund: Studentlitteratur.
Szebehely, M. (2005). Anhörigas betalda och obetalda äldreomsorgsinsatser. In: Forskarrapporter till jämställdhetspolitiska utredningen. SOU 2005:66. Stockholm: Fritzes.
Szebehely, M. (2009). Omsorgsmönster bland kvinnor och män - inte bara en fråga om kön [Patterns of caregiving among women and men - more than a gender issue]. In E. Gunnarsson & M. Szebehely (Eds.), Genus i omsorgens vardag [Gender in the everyday care] (pp. 27-65). Lund: Studentlitteratur.
The National Board of Health and Welfare. (2008). Mot en mer jämställd sjukvård och socialtjänst [Towards more equality in health care and social services]. Stockholm: The National Board of Health and Welfare.
Thorslund, M., Lennartsson, C., Parker, M. G., & Lundberg, O. (2004). De allra äldstas hälsa har blivit sämre [Elderly people's health has become worse]. Läkartidningen [Journal of the Swedish Medical Association], 101, 1494-1499.
Thorslund, M., & Lundberg, O. (1994). Health and inequalities among the oldest old. Journal of Aging and Health, 6(1), 51-69.
Thorslund, M., & Silverstein, M. (2009). Care for older adults in the welfare state: Theories, policies, and realities. In V. L. Bengtson, M. Silverstein, N. M. Putney & D. Gans (Eds.), Handbook of theories of aging (pp. 629-639). New York: Springer.
90
Waldron, I. (1983). Sex differences in human mortality: The role of genetic factors. Social Science & Medicine, 17(6), 321-333.
Waldron, I. (1993). Recent trends in sex mortality ratios for adults in developed countries. Social Science & Medicine, 36(4), 451-462.
Walters, V. (2004). The social context of women's health. BMC Women's Health, 4(Suppl 1), S2.
Wamala, S., P, & Lynch, J. (2002). Introduction. Integrating research on gender and social inequities in health. In S. Wamala, P & J. Lynch (Eds.), Gender and social inequities in health (pp. 11-20). Lund: Studentlitteratur.
Verbrugge, L. M. (1987). Sex differences in health. In G. Maddox (Ed.), Encyclopedia of aging (pp. 601-604). New York: Springer.
Verbrugge, L. M. (1989a). Gender, aging, and health. In K. S. Markides (Ed.), Aging and health: Perspectives on gender, race, ethnicity, and class (pp. 23-78): SAGE.
Verbrugge, L. M. (1989b). The twain meet: Empirical explanations of sex differences in health and mortality. Journal of Health and Social Behavior, 30(3), 282-304.
Verbrugge, L. M., & Jette, A. M. (1994). The disablement process. Social Science & Medicine, 38(1), 1-14.
Verbrugge, L. M., & Wingard, D. L. (1987). Sex differentials in health and mortality. Women Health, 12(2), 103-145.
WHO. (2001). Health and ageing. A discussion paper. Geneva: World Health Organization.
WHO. (2002a). Active Ageing: A Policy Framework. Geneva: World Health Organization.
WHO. (2002b). Towards a common language for functioning, disability and health. ICF. Geneva: World Health Organization.
WHO. (2010). What do we mean by sex and gender. Retrieved 12 08, 2010 Wilhelmson, K., Allebeck, P., & Steen, B. (2002). Improved health among
70-year olds: Comparison of health indicators in three different birth cohorts. Aging Clinical and Experimental Research, 14(5), 361-370.
Wingard, D. (1984). The sex differential in morbidity, mortality, and lifestyle. Annual Review of Public Health, 5(1), 433-458.
Wolf, D. A., Hunt, K., & Knickman, J. (2005). Perspectives on the recent decline in disability at older ages. Milbank Quarterly, 83(3), 365-395.
Zajacova, A. (2006). Education, gender, and mortality: Does schooling have the same effect on mortality for men and women in the US? Social Science & Medicine, 63(8), 2176-2190.
Österberg, T., Lundgren, M., Emilson, C. G. Ö., Sundh, V., Birkhed, D., & Steen, B. (1998). Utilization of dental services in relation to socioeconomic and health factors in the middle-aged and elderly Swedish population. Acta Odontologica Scandinavica, 56(1), 41-47.
Östlin, P. (2002). Gender inequalities in health: the significance of work. In
S. Wamala, P & J. Lynch (Eds.), Gender and social inequalities in health
(pp. 43-65). Lund: Studentlitteratur.