gender and gis · resources for the future vajjhala 1 gender and gis: mapping the links between...
TRANSCRIPT

1616 P St. NW Washington, DC 20036 202-328-5000 www.rff.org
August 2009 RFF DP 09-27
Gender and GIS
Mapping the Links between Spatial Exclusion, Transport Access, and the Millennium Development Goals in Lesotho, Ethiopia, and Ghana
Wend y M . Wa lke r and Sha l in i P . Va j jha la
DIS
CU
SSIO
N P
APE
R

© 2009 Resources for the Future. All rights reserved. No portion of this paper may be reproduced without permission of the authors.
Discussion papers are research materials circulated by their authors for purposes of information and discussion. They have not necessarily undergone formal peer review.
Gender and GIS: Mapping the Links between Spatial Exclusion, Transport Access, and the Millennium Development Goals in
Lesotho, Ethiopia, and Ghana
Wendy M. Walker and Shalini P. Vajjhala
Abstract The gender dimensions of spatial exclusion are important components of social marginalization
and vulnerability. Transport infrastructure and services play a critical role in supporting mobility and access to basic services vital to achieving poverty reduction, gender equality, and sustainable development objectives. This paper explores how Geographic Information Systems (GIS) technology can support integrated evaluations of the gender dimensions of transport using an innovative combination of community participatory mapping, new gender-disaggregated household-level Demographic and Health Surveys (DHS), and transport sector GIS data. The pilot study focuses on three countries, Lesotho, Ethiopia, and Ghana, and reveals new opportunities for cross-scale evaluation.
Key Words: participatory mapping, GIS, health, transport, rural access

Contents
1. Introduction ......................................................................................................................... 1
2. Integrating Transport GIS and DHS ................................................................................ 3
2.1 Pilot Countries and Data ............................................................................................... 4
2.2 DHS Questions on Transport, Access, and Mobility .................................................... 7 Disaggregation and Analysis of Differential Impacts of Mobility ................................7
3. Methodology ........................................................................................................................ 8
4. Caveats ............................................................................................................................... 11
5. Illustrative Analyses and Major Results ......................................................................... 13
5.1 Transport ..................................................................................................................... 15
5.2 Barriers to Access ....................................................................................................... 19
5.3 Distance, Mobility, and Road Networks: What Are the Impacts of Poor Access? ... 23
5.4 HIV/AIDS ................................................................................................................... 25
5.5 Education .................................................................................................................... 27
6. Conclusions ........................................................................................................................ 29
References .............................................................................................................................. 31
Annex. Data Sources Used for Analyses ............................................................................. 32

Resources for the Future Vajjhala
1
Gender and GIS: Mapping the Links between Spatial Exclusion, Transport Access, and the Millennium Development Goals in
Lesotho, Ethiopia, and Ghana
Wendy M. Walker and Shalini P. Vajjhala ∗
1. Introduction
The gender dimensions of spatial exclusion are important components of social marginalization and vulnerability. Transport infrastructure and services play a critical role in supporting mobility and access to basic services that are vital to achieving poverty reduction, gender equality, and sustainable development objectives, such as the Millennium Development Goals (MDGs). However, one of the principal challenges facing the transport sector lies in measuring the social benefits and impacts of its investments, especially as they emerge over time and for particular segments of the population served by specific infrastructure and/or services.
To bridge this measurement gap, international targets, such as the MDGs, are being employed by countries to evaluate overall development progress, to serve as key indicators for national poverty reduction strategies, and to guide planning and prioritization of investments and programs. Three specific health-related MDGs—to reduce child mortality (Goal 4); improve maternal health (Goal 5); and combat HIV/AIDS, malaria, and other diseases (Goal 6)—are particularly relevant for transport investment and evaluation because the sector plays a key role in meeting all three goals. Transport sector contributions include support for routine medical visits, provision of emergency services, health care provider access, and mobile health service delivery to isolated communities and populations. Transport networks and services also play a vital role in ensuring the distribution of drugs and supplies.
Although these linkages have been clearly articulated and agreed upon by transport sector government officials in many countries, in reality, national programs and projects include very little explicit monitoring of transport impacts on MDGs (Sub-Saharan Africa Transport Policy Program [SSATP] 2005). Failure to monitor these impacts ensures that traditional cost–benefit analyses of planned projects will continue to drive investment prioritization and decisionmaking.
∗ Wendy Walker is a Social Development Specialist at the Asian Development Bank; 6 ADB Avenue, Mandaluyong City, 1550 Manila, Philippines. Phone: +63(2) 632-4444; Email: [email protected]. Shalini Vajjhala is a Fellow at Resources for the Future; 1616 P Street NW Washington, DC 20036-1400 USA. Phone: +1 (202) 328-5129; Email: [email protected].

Resources for the Future Vajjhala
2
The lack of a systematic approach to social cost and benefit accounting for transport investments limits decisionmakers’ abilities to weigh their options for investment based on a broader framework that includes the anticipated social impacts of investments (Greene et al. 1986; Button 1995; Howe 2003).
This paper explores how Geographic Information Systems (GIS) technology can support evaluations of the gender dimensions of transport using an innovative combination of participatory mapping with communities, gender disaggregated household-level Demographic and Health Survey (DHS) data, and transport sector GIS data. Maps can be important tools for illuminating the direct and indirect social impacts of transport investments and highlighting the gender dimensions of spatial exclusion. However, mapping technologies have only recently begun to make links to gender-based analyses. Innovations in participatory mapping methods and improvements to existing data sources, such as spatial referencing of household and community surveys, now allow these analyses to be done at multiple scales—from the community to national level—and to capture changes over time. This paper presents a pilot study focused on three countries: Lesotho, Ethiopia, and Ghana. The rationale for the choice of these countries is based on the availability of data for both DHS and road networks and differences among these countries in physical size, social context, and existing evidence on gender differences in access and mobility.
The integrated analysis developed here explores how the combination of existing DHS data and transport GIS data sources can be used to support national-level monitoring and evaluation of the social impacts of transport programs. The results of this type of integrated analysis can further help to address the following activities:
• monitoring and evaluation of the social and gender impacts of transport investments, especially cross-sectoral and indirect impacts, at multiple levels;
• inclusion of transport planning and budgetary support into poverty reduction strategy planning processes and country assistance strategies;
• understanding and addressing key underlying barriers to achieving international targets such as the MDGs; and
• facilitating long-term collaboration and communication across sectors and among stakeholders when addressing issues such as health and education access.
The resulting approach and analysis has the potential to address common goals in health and transport, such as mapping the synergies in mobility and access between the sectors and evaluating and assessing available services. As transport ministries increasingly invest in GIS for

Resources for the Future Vajjhala
3
decision support, georeference their road networks, and continue to expand their spatial data infrastructure, the opportunities for combining data sets and devising new ways to meet monitoring challenges across scales, timeframes, and forms of investments will continue to emerge. This paper explores some of the critical issues associated with the integration of new transport and health databases and outlines a spatial analytical approach to rigorous data integration and evaluation from the community to the national level.
2. Integrating Transport GIS and DHS
Direct social benefits and impacts of the transport sector include employment creation and reductions in travel costs and travel time. These indicators can be captured through (a) regular monitoring of infrastructure and road construction activities, (b) detailed questioning during key social assessments and surveys, (c) targeted follow-up evaluations, and (d) data collection from related agencies, such as government departments responsible for regulating public transport. Changes in mobility, access to key services or destinations, and greater frequency and/or ease of travel are the principal aims of many transport programs and national growth agendas. Yet these outcomes are harder to systematically capture on a large scale. Measuring these often indirect, but long-term and durable, impacts of a national program of linear investments presents numerous challenges.
Evaluation of cross-sectoral interactions can help identify indirect transport sector contributions to improving health or education outcomes. The health sector in particular offers data that capture underlying relationships with mobility and access to services. DHSs are routinely carried out in many countries around the world. These surveys focus primarily on characterizing health-seeking behaviors, but they also include valuable information for the transport sector on access to health care and the availability of transport services. Unlike many other sources of transport survey data, the DHS is nationally representative; capable of being disaggregated by gender, age, administrative boundaries, or ecozones; and increasingly georeferenced using global positioning system (GPS) technology to mark the locations of survey enumeration areas (EAs) or clusters.
These recent technological innovations allow DHS demographic and health data to be integrated into transport GIS. This integration through spatial analysis provides opportunities for both technical planners and managers to better understand specific transport-related challenges in access to health care, such as the role of transport costs, differential mobility time burdens, availability of transport infrastructure and services as barriers, and how these rank with other obstacles, including the availability of health care facilities/personnel or cultural restrictions. DHSs have a particular emphasis on elucidating gender differences in the access to and use of

Resources for the Future Vajjhala
4
health services and therefore can help to better understand gendered differences in access and mobility as well. The resulting spatial information can further serve as an important tool for analysts and managers to monitor the impact of transport plans on national development indicators, such as the MDGs, and assist in targeting future community development and infrastructure investments.
2.1 Pilot Countries and Data
This paper and pilot study focus on data from three countries: Lesotho, Ethiopia, and Ghana. The rationale for the choice of these countries is based on the availability of recent national DHS data and road network spatial data (see Table 1) as well as differences among these countries in physical size, social context, and existing evidence regarding access and mobility.
Lesotho
The major emphasis in this pilot is on Lesotho, in part because of the importance that the Ministry of Public Works and Transport (MoPWT) has placed on georeferencing the transport network and building a GIS system (Figure 1) that integrates many layers of transport and other spatial data. In 2004, Oddsson, Walker, and Bergveinsson carried out an in-depth multisectoral needs assessment of spatial data availability and updated the MoPWT GIS with extensive data layers in searchable formats.
In addition, MoPWT has engaged in complementary participatory mapping processes with communities and local government (Walker et al. 2005; Figure 2). As a relatively small country with low population densities in the rural highlands and multiple barriers to mobility and access, participatory mapping approaches have the potential to play a major role in linking community-level transport information to national data and monitoring. This community-centered spatial approach for eliciting local priorities and relevant indicators now forms a key methodology used by MoPWT for social assessments and prioritization of investments with local governments (see Vajjhala [2005] for more on general participatory mapping approaches).
Resources for the Future Vajjhala
5
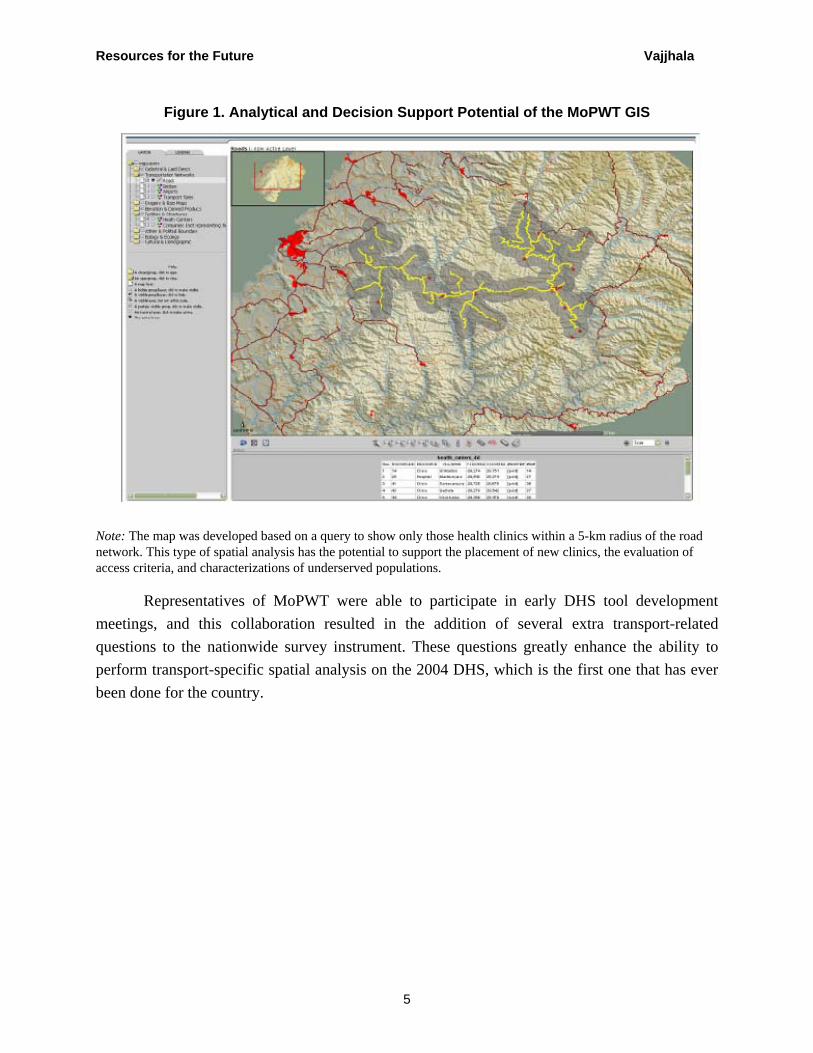
Figure 1. Analytical and Decision Support Potential of the MoPWT GIS
Note: The map was developed based on a query to show only those health clinics within a 5-km radius of the road network. This type of spatial analysis has the potential to support the placement of new clinics, the evaluation of access criteria, and characterizations of underserved populations.
Representatives of MoPWT were able to participate in early DHS tool development meetings, and this collaboration resulted in the addition of several extra transport-related questions to the nationwide survey instrument. These questions greatly enhance the ability to perform transport-specific spatial analysis on the 2004 DHS, which is the first one that has ever been done for the country.

Resources for the Future Vajjhala
6
Figure 2. Local Information on the Costs of Access to Health Care Facilities for Rural Communities in Lesotho During Normal Everyday Travel (yellow line on the right) and for
Emergency Access (red line on the left)
Transport Service CostsNo bus service availableTaxi prices / routes fixed Emergency costs vary
Multi-mode travelSend horse for taxiCarry by stretcher
Travel times varyPrice ratios from 1:15 to 1:47
Note: Emergency travel, in this example, can cost up to 47 times the cost of everyday access.
Ethiopia
With one of the lowest-density road networks in Africa, a population of more than 70 million, and great difficulties in access, especially for rural communities, investment in the transport sector has been and continues to be a major priority in Ethiopia. The Ethiopian Roads Authority (ERA) has created a GIS of the network and is including new layers of spatial data. At the same time, major efforts in the 2006 census laid the groundwork for georeferencing village locations and mapping administrative boundaries. DHSs have been carried out in the country several times, and the ability to analyze results over time is an important opportunity in the integration of these national survey data.
Ghana
Although the road network for Ghana has been georeferenced, the pilot team did not have access to the data or to data on village locations. This country was included to show what can be done with extremely limited data and serves as a counter example to the transport and social

Resources for the Future Vajjhala
7
contexts of Lesotho and Ethiopia. With a total land area intermediate to those of Lesotho and Ethiopia, a higher-density road network, established urban centers, and better MDG achievements, Ghana illustrates very different access and mobility issues.
Table 1. Data Used for Each of the Country Surveys Country/
survey Road
network DHS GPS Village
locations Health centers
Extra DHS questions Other
Ghana 2002 X
Ethiopia 2000 X
Ethiopia 2005 X X
Lesotho 2004/05 X X X X X Extensive GIS
layers
2.2 DHS Questions on Transport, Access, and Mobility
Access and mobility are addressed in several questions in all national DHSs. For example, the frequency of access to health providers for prenatal care and during deliveries is extensively probed. The DHS includes questions on the time required to access water and ownership of various modes of transportation, including country-specific intermediate means of transport (IMTs) and animal transport. In the women’s questionnaire, all DHSs include a question on barriers to health care access for self. Among the five barriers included in the survey, two are transport specific: distance to health facility and having to take transport.
For the Lesotho 2004 DHS, MoPWT was able to insert three extra transport-related questions onto the survey. These include: the time required to access health clinics, the mode of access to health clinics, and the main health center accessed. In addition, MoPWT verified that relevant IMT options, such as scotch carts and horses, were included in the question on ownership of transport. One important question suggested by MoPWT—on transport costs for access to health care facilities—was not included in the 2004 questionnaire. In the future, transport cost questions could help deconstruct and identify any underlying transport issues in an existing barrier to access: cost of treatment.
Disaggregation and Analysis of Differential Impacts of Mobility
All DHSs have specific survey questions for women, men, and children. Unfortunately, there are very few instances in which the same question is asked to members of each group. This
Resources for the Future Vajjhala
8
limits opportunities for analyzing gender differences and impacts across particular populations. However, disaggregation of the survey data can be done by age, EA, district, and ecozone. Georeferencing of the enumeration clusters, a technique added to many DHSs relatively recently, can facilitate further spatial analyses across other relevant boundaries, such as health service areas and local administrative boundaries beneath the level of districts. The use of GPS to locate enumeration clusters also allows for impact monitoring of specific project areas using different boundary definitions and impact identification of national transport programs at macro scales.
3. Methodology
Integrating transport and health data requires a careful, systematic approach. This section outlines the five-step methodology used by the study team for the integrated analysis of DHS transport and health data for broader comparative spatial analysis using GIS road network, health service, and administrative data. The steps outlined here are intended to serve as a replicable and adaptable framework for the application of georeferenced DHS data to the evaluation of a wide variety of cross-sectoral health and transport issues.
First, we selected key DHS questions relevant for transport analysis. For the Lesotho DHS, several new transport-related questions were specifically added to the 2004 survey. This set included questions on transport ownership, location of the primary health facility, mode of travel to health service provider(s), time to access health services, and major transport barriers to health service provision. Figure 3 is an excerpt from the 2004 Lesotho DHS questionnaire illustrating the different types of responses collected (multiple choice, yes/no, rating, ranking, and open-ended). By examining DHS questionnaires across countries, we defined a set of relevant research questions and possible statistical and spatial analyses, comparing within- and between-country metrics, given available data.

Resources for the Future Vajjhala
9
Figure 3. Excerpt of the 2004 Lesotho DHS Questionnaire Showing Key Transport Question Formats
Second, building on the research questions motivated by the available DHS data and the georeferenced survey clusters, we compiled relevant spatial data from different sources corresponding to selected DHS health and transport questions. For the purposes of this study, we gathered existing GIS information from a variety of health and transport databases, including those of the Transport and Health Ministries and various other departments and organizations across all three countries. All selected data were national level with full coverage corresponding to the DHS.1
Third, once we had compiled the available, relevant data for all of the countries under consideration, we plotted all DHS clusters in GIS based on their adjusted GPS coordinates and
1 In the case of Ethiopia, the Southeastern district was missing from all major databases and no DHS EA, road, or health center data were available for this region.
Resources for the Future Vajjhala
10
generated descriptive statistics and maps of basic transport ownership, use, and barriers to overlay on related road and health service layers. By evaluating country-, region-, and cluster-level variations in transport ownership, health services, and health outcomes, we also were able to identify basic data gaps (geographic) and outliers (statistical) to check the robustness of elicited responses, such as the stated time to access health services.
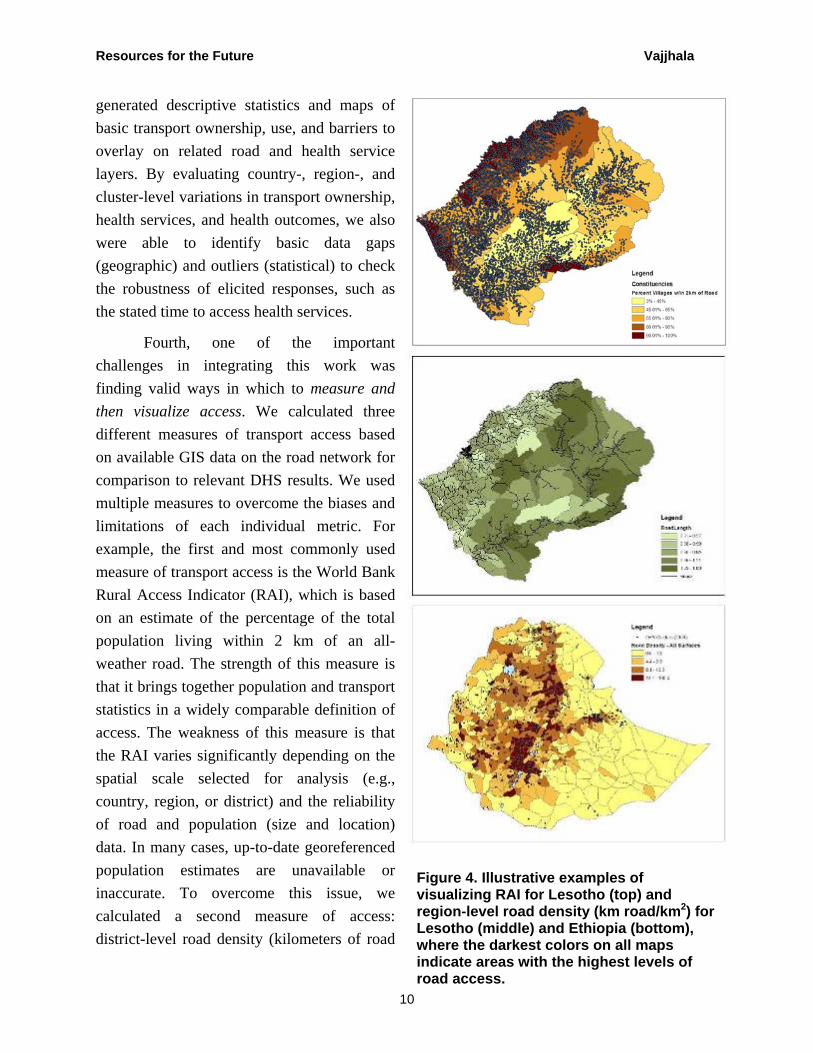
Fourth, one of the important challenges in integrating this work was finding valid ways in which to measure and then visualize access. We calculated three different measures of transport access based on available GIS data on the road network for comparison to relevant DHS results. We used multiple measures to overcome the biases and limitations of each individual metric. For example, the first and most commonly used measure of transport access is the World Bank Rural Access Indicator (RAI), which is based on an estimate of the percentage of the total population living within 2 km of an all-weather road. The strength of this measure is that it brings together population and transport statistics in a widely comparable definition of access. The weakness of this measure is that the RAI varies significantly depending on the spatial scale selected for analysis (e.g., country, region, or district) and the reliability of road and population (size and location) data. In many cases, up-to-date georeferenced population estimates are unavailable or inaccurate. To overcome this issue, we calculated a second measure of access: district-level road density (kilometers of road
Figure 4. Illustrative examples of visualizing RAI for Lesotho (top) and region-level road density (km road/km2) for Lesotho (middle) and Ethiopia (bottom), where the darkest colors on all maps indicate areas with the highest levels of road access.

Resources for the Future Vajjhala
11
length per square kilometers of area). This measure is also highly scale-dependent, but it provides a population-independent measure of road network availability.
Finally, to generate a jurisdiction-independent measure of access, we plotted 2-km, 5-km, and 10-km radius buffers around each survey EA and calculated the total road length (km) within each buffer. This last measure allows for comparisons of road density by buffer at the cluster level as well as comparisons of buffer averages at the district and country levels. The RAI and road density measures are illustrated in Figure 4. These multiple definitions of access allowed us to (a) overcome important data gaps among countries and (b) find ways to probe issues of access in relation to both the road network and the enumeration clusters that allowed us to look at different scales.
Finally, the fifth step in this study was the integrated evaluation of DHS cluster results; separately calculated measures of access; and related health, demographic, and socioeconomic statistics, including measures of social inclusion such as religion or ethnicity, education, and wealth. Comparative analyses included tests of pairwise correlations of distance to the primary health clinic (number of households that identified a clinic as the primary clinic in the DHS), time to access, and women’s perception of distance as a “big problem” in accessing health services. These comparisons allow for the visualization of key transport indicators and issues across countries and regions as well as the identification of area “hotspots” of limited transport access and/or poor health service outcomes.
The five-step approach outlined here brings together elements of separate DHS, transport, and health analyses into a single integrated spatial analysis. The value of this approach is that it supports the identification of significant cross-sectoral issues and influences. The next sections place this approach in context and illustrate the results of the analyses described here for selected transport and health DHS questions.
4. Caveats
Although the integration of DHS and GIS health and transport data provides many new opportunities for analysis and evaluation, these two types of databases have never traditionally been linked. As a result, there are several key data gaps. Below is a list of the most important caveats for interpreting the methods outlined in this paper and the results of this particular pilot study. We list these caveats up front to place the following analysis in context and to highlight future barriers to integration, while still demonstrating the value of integration and the robustness of our approach.
Resources for the Future Vajjhala
12
One of the most critical barriers to the effective use of DHS GPS data in transport–health analyses is a consequence of the DHS method of ensuring survey participant privacy. During the compilation of all survey results, actual GPS point data collected for each EA are taken at what researchers believe to be the center of the area and then randomly shifted to ensure that villages and individuals cannot be identified. Individual points are moved randomly in any direction by +/– 5 km for all rural clusters and +/– 2 km for all urban clusters. This decision, although important for maintaining participant anonymity, makes it impossible to estimate, measure, or analyze point-to-point distances between populations and key services, such as roads or health clinics. Importantly for this pilot, the shifting of the GPS points makes it impossible to layer the exact location of cluster sites over the road network and subsequently to directly analyze access and mobility issues.
The methodology section describes our approach to addressing this spatial ambiguity by using buffers over multiple distances to capture some of the basic relationships between populations, transport infrastructure, and health services without relying on actual measured distances. Using this approach, we believe that our results are robust for the general level of aggregation at which they are presented; importantly, however, the potential for comparative analysis is significantly limited by the imprecision deliberately introduced into all DHS GPS data. We believe that other means of addressing privacy concerns would allow for the full release of accurate survey GPS points.
A second caveat concerning both DHS and GIS data in different countries is data quality. Any analysis is only as good as the data it uses, and in cases where multiple datasets are being integrated, the least robust data have the potential to constrain an entire study. Issues of particular importance for this pilot include the accuracy, reliability, and/or completeness of the following variables or layers: village and health service locations, road network coverage, road classification (type), and time to access estimates, among others.
Without complete and robust data in each of these fields, it is difficult to assess and interpret the results of any comparative analysis. For example, incomplete health service provider data (e.g., GIS layers that are missing certain geographic areas or provider types) could result in inaccurate spatial analyses that show a lack of health service provision in areas where services are present or vice versa. Having reliable and up-to-date metadata for all GIS layers is essential. The results of this study highlighted in Section 5 are largely based on analyses of transport and health in Lesotho, primarily because of the high quality of both DHS and GIS data for the country relative to data on Ethiopia and Ghana.
Resources for the Future Vajjhala
13
In all three countries, the coverage of the DHS—the extent to which survey clusters and responses are (a) regionally representative of populations and groups, (b) uncorrelated with the road network and representative of inaccessible areas or communities, and (c) comparable between countries and over time—is critical. These issues are related to basic survey design and implementation decisions. Here we address coverage issues through statistical tests comparing key variables within and between regions and close examination of unusual results or outliers. Although this process can help identify some data gaps, applying this approach to other countries or sectors requires careful consideration of possible inconsistencies or incompatibilities that may occur as a result of data collection practices (e.g., whether survey teams really go to remote areas or tend to choose EAs that are readily accessible to the road network). Such inconsistencies could affect the interpretation of key results and their social development implications.
Building on this point, a final caveat for this analysis is that many of the relationships between transport and health evaluated and identified here have multiple underlying explanations. For example, the distance to health clinics could be positively correlated with a higher incidence of maternal or infant mortality in some countries; however, there are many other explanatory variables also correlated (co-linear) with distance that could influence maternal or infant mortality rates, including income, education, and a host of related demographic, spatial, cultural or socioeconomic characteristics. As a result, this study does not attempt to make any causal links between transport barriers and health outcomes. Instead, the focus of this effort is to illustrate key spatial relationships between transport and health, and highlight opportunities for improved evaluation and planning with new DHS and GIS databases in many countries. Obviously, it is very important to complement this kind of monitoring effort with other monitoring techniques, including in-depth qualitative analysis with focus groups, key informant interviews, and individual interviews.
Taken together, these caveats illustrate both the importance and the complexity of cross-sectoral spatial analysis. We see many of the data limitations described here as problems that can be overcome with better coordination of transport and health data collection. To this end, this section is intended to outline a roadmap for improvement both in how DHS data are collected and compiled and how GIS layers are generated in different countries and sectors.
5. Illustrative Analyses and Major Results
Based on DHS and GIS transport and health data for Lesotho, Ethiopia, and Ghana, several key national-level analyses are possible with available data. This section highlights four main categories of illustrative analyses and major results.
Resources for the Future Vajjhala
14
• Category One: Focuses on transport ownership and use from selected DHS questions, like those shown in Figure 3.
• Category Two: Examines a series of DHS responses on women’s barriers to health clinic access, mapping transport barriers in the context of other constraints.
• Category Three: Investigates health outcomes, specifically examples of the spatial relationships between transport infrastructure and HIV/AIDS knowledge and prevalence.
• Category Four: Evaluates the correlations between road density and socioeconomic characteristics, such as women’s education.
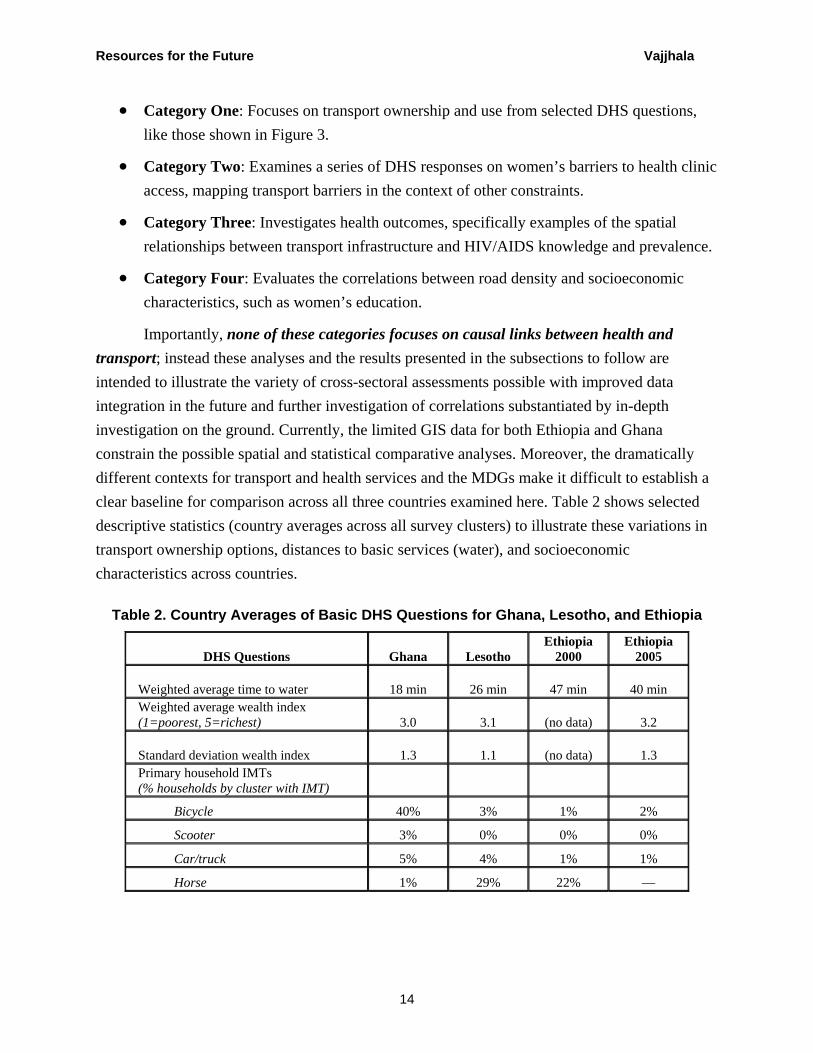
Importantly, none of these categories focuses on causal links between health and transport; instead these analyses and the results presented in the subsections to follow are intended to illustrate the variety of cross-sectoral assessments possible with improved data integration in the future and further investigation of correlations substantiated by in-depth investigation on the ground. Currently, the limited GIS data for both Ethiopia and Ghana constrain the possible spatial and statistical comparative analyses. Moreover, the dramatically different contexts for transport and health services and the MDGs make it difficult to establish a clear baseline for comparison across all three countries examined here. Table 2 shows selected descriptive statistics (country averages across all survey clusters) to illustrate these variations in transport ownership options, distances to basic services (water), and socioeconomic characteristics across countries.
Table 2. Country Averages of Basic DHS Questions for Ghana, Lesotho, and Ethiopia
DHS Questions Ghana Lesotho Ethiopia
2000 Ethiopia
2005
Weighted average time to water 18 min 26 min 47 min 40 min Weighted average wealth index (1=poorest, 5=richest) 3.0 3.1 (no data) 3.2
Standard deviation wealth index 1.3 1.1 (no data) 1.3 Primary household IMTs (% households by cluster with IMT)
Bicycle 40% 3% 1% 2%
Scooter 3% 0% 0% 0%
Car/truck 5% 4% 1% 1%
Horse 1% 29% 22% —

Resources for the Future Vajjhala
15
Overall, the four categories of analyses discussed below are only a few of the comparisons possible using georeferenced DHS data in tandem with GIS data.
5.1 Transport
The basic transport questions added to the 2004 Lesotho DHS survey focused on household transport ownership, the location of the primary health facility, the individual mode of transport to the health facility, and time to reach the health facility. Responses were aggregated for each of these questions (averages by survey cluster) and overlaid on related GIS transport data, including total constituency road lengths and road density. The three maps in this subsection highlight the tremendous spatial variation in transport availability, mode, and access. Together, they illustrate the implications of these variations for effective transport planning and improved health service delivery to diverse populations.

Resources for the Future Vajjhala
16
Figure 5. Overlay of DHS Transport Ownership by Survey Cluster and Road Density by Constituency Area for Lesotho
5.1.1 Transport Ownership
Figure 5 highlights the relationship between DHS transport ownership and road density by administrative constituency. The darker areas on the map background are those with higher total kilometers of roads per unit area. The pie charts indicate transport ownership by DHS cluster. Overlaying these results reveals significant variations in the dominant type of transport owned by cluster, such that a large majority of households own no transport and horses/mules are the next largest category of transport ownership. Ownership of motorized vehicles (car, truck, motorcycle, or scooter) is largely limited to urban areas, and there is a weak positive correlation between aggregate ownership (all forms of transport) and road density.
Tra

Resources for the Future Vajjhala
17
5.1.2 Health Clinic Access
A MoPWT-added Lesotho DHS question focuses on the primary mode of transport used to access health services. As Figure 6 shows, across Lesotho, the primary mode of access to health clinics is walking (orange) for the majority of clusters. Interestingly, the next most dominant mode of access is by car or truck rather than horse or mule. This is in sharp contrast to the high levels of horse/mule household ownership across the country and limited motorized transport ownership highlighted in Figure 5. However, it may also highlight a key gender issue: that women do not own or have access to horse or mule transport. When overlaid on total kilometers of road by district, clusters in and around urban areas and those along the main road network are associated with the greatest use of motorized transport for health facility access. Figure 6. Primary Mode of Transport to a Health Facility as a Percentage of a
Cluster Total Overlaid on Total District Road Lengths (km)

Resources for the Future Vajjhala
18
5.1.3 Time to Health Clinic The previous maps reveal the complex relationships between transport ownership and mode of health facility access. Figure 7 illustrates even greater challenges associated with considering time to access and distribution of health facility users. This map overlays the average time that respondents from different survey clusters said it took to go to the nearest health clinic and total use by health facility summed across all clusters. Results of this comparison reveal that survey clusters with very long travel times are, in many cases, located in close proximity to facilities with many users. This suggests that the primary health facility respondents identified in the survey may not be the nearest health facilities to their villages.
Figure 7. Weighted Average Time of Travel to a Health Clinic (hours) by Cluster Relative to Health Facility Locations and Use Patterns
Resources for the Future Vajjhala
19
In fact, some of the EAs located closest to the health facilities with the most self-identified users (the largest health facility symbols) are also those in which DHS survey respondents identified travel times of four or more hours to reach the nearest clinic. The many possible reasons for this incongruity include underlying issues such as the availability and quality of services at any given health facility, the adequacy of staffing and supplies, and key geographical barriers such as rivers or mountains that could make short straight-line distances on the map entirely inaccessible. This analysis points to opportunities for linking data from this DHS to Ministry of Health data—on clinic staffing, client base, satisfaction of service delivery surveys, and so on—in the future; this would help to further understand the relationships between access to and use of basic services across sectors. Such an analysis would (a) foster integrated planning and development and (b) prioritize lower-cost measures such as mobile clinics and footpath rehabilitation which, to date, have received relatively little attention as important community-level contributions to improving rural access, particularly for women.
5.2 Barriers to Access
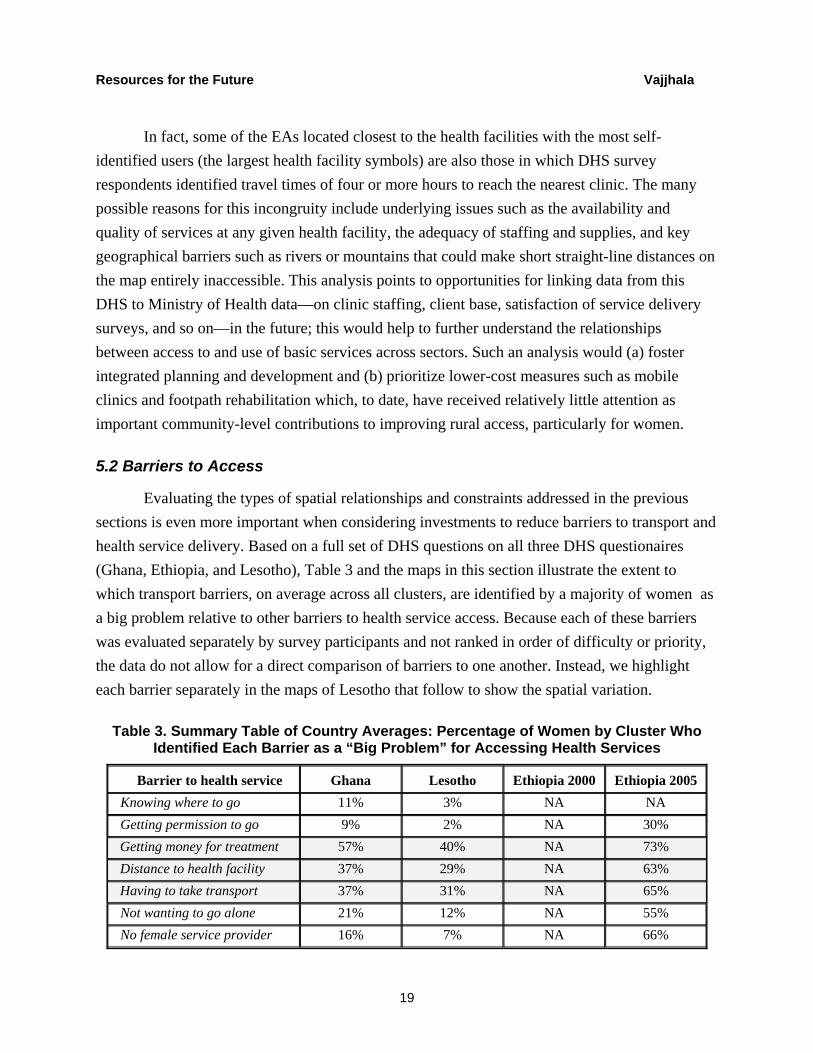
Evaluating the types of spatial relationships and constraints addressed in the previous sections is even more important when considering investments to reduce barriers to transport and health service delivery. Based on a full set of DHS questions on all three DHS questionaires (Ghana, Ethiopia, and Lesotho), Table 3 and the maps in this section illustrate the extent to which transport barriers, on average across all clusters, are identified by a majority of women as a big problem relative to other barriers to health service access. Because each of these barriers was evaluated separately by survey participants and not ranked in order of difficulty or priority, the data do not allow for a direct comparison of barriers to one another. Instead, we highlight each barrier separately in the maps of Lesotho that follow to show the spatial variation.
Table 3. Summary Table of Country Averages: Percentage of Women by Cluster Who Identified Each Barrier as a “Big Problem” for Accessing Health Services
Barrier to health service Ghana Lesotho Ethiopia 2000 Ethiopia 2005 Knowing where to go 11% 3% NA NA Getting permission to go 9% 2% NA 30% Getting money for treatment 57% 40% NA 73% Distance to health facility 37% 29% NA 63% Having to take transport 37% 31% NA 65% Not wanting to go alone 21% 12% NA 55% No female service provider 16% 7% NA 66%

Resources for the Future Vajjhala
20
5.2.1 Barrier: Distance
As summarized in Table 3, a large majority of women identify both transport barriers in the set of DHS surveyed issues as being a big problem and not a small problem compared to other constraints on health service access. Figure 8 shows that womens’ perceptions of distance as a barrier is further correlated with the location of their villages (clusters) relative to both roads and proximate health facilities. Comparing the average percentage of women by cluster who identify distance as a big problem with constituency road density reveals that clusters in constituencies with higher road densities have lower percentages of women who say that distance is a big problem.
Figure 8. Average Percentage of Women by Cluster Who Say that “Distance to Health Facility” is a Big Problem in Access to Health Services
Resources for the Future Vajjhala
21
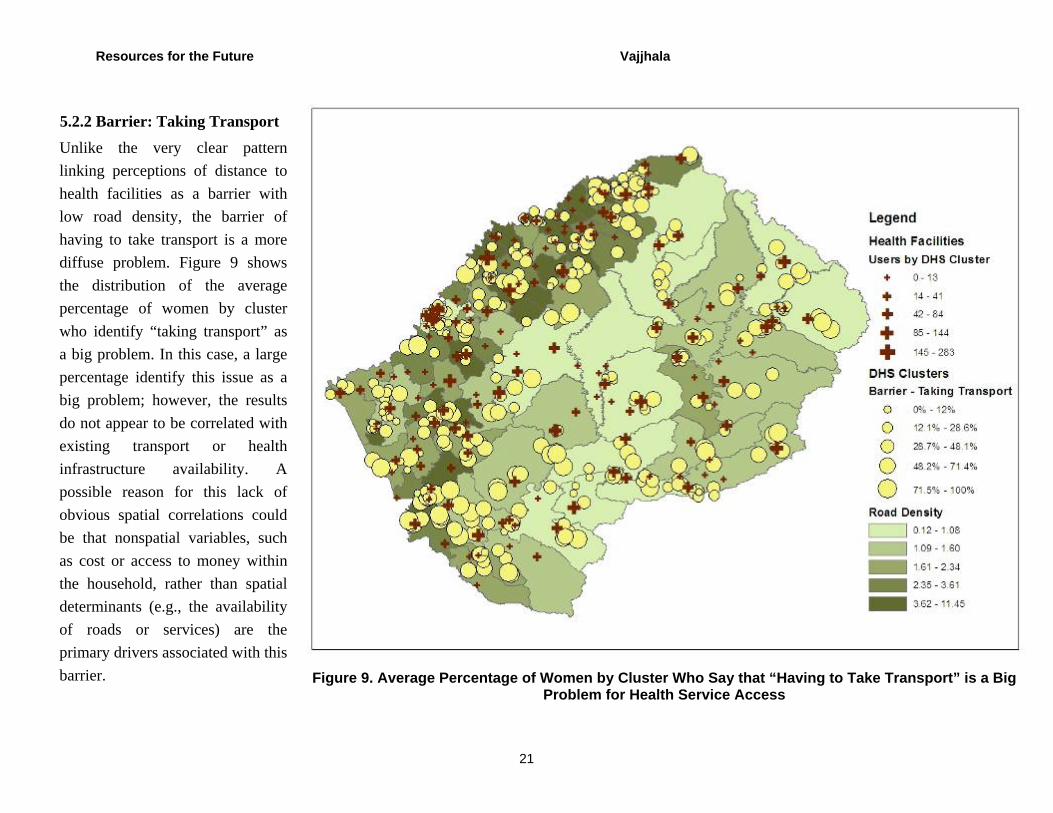
5.2.2 Barrier: Taking Transport
Unlike the very clear pattern linking perceptions of distance to health facilities as a barrier with low road density, the barrier of having to take transport is a more diffuse problem. Figure 9 shows the distribution of the average percentage of women by cluster who identify “taking transport” as a big problem. In this case, a large percentage identify this issue as a big problem; however, the results do not appear to be correlated with existing transport or health infrastructure availability. A possible reason for this lack of obvious spatial correlations could be that nonspatial variables, such as cost or access to money within the household, rather than spatial determinants (e.g., the availability of roads or services) are the primary drivers associated with this barrier. Figure 9. Average Percentage of Women by Cluster Who Say that “Having to Take Transport” is a Big
Problem for Health Service Access

Resources for the Future Vajjhala
22
5.2.3 Barrier: All Barriers
Evaluating all of the barriers included in the DHS health service access questions reveals that, for Lesotho, transport barriers dominate all others. Figure 10 is a close-up of a particular area of Lesotho with poor access and limited road density. This map covers the project area for the World Bank–supported Senqu–Senqunyane bridge project and serves as a preliminary snapshot of access issues for social assessment and baseline monitoring (Walker et al. 2005). In almost all cluster areas surveyed, distance and having to take transport account for at least 50 percent of barriers. Likewise, several of the health facilities located in the area are not used by respondents, even though they may be located in close proximity to communities.
Figure 10. Cluster Percentages of All Barriers to Health Service Access and Constituency Road Density in Southwestern Lesotho
Resources for the Future Vajjhala
23
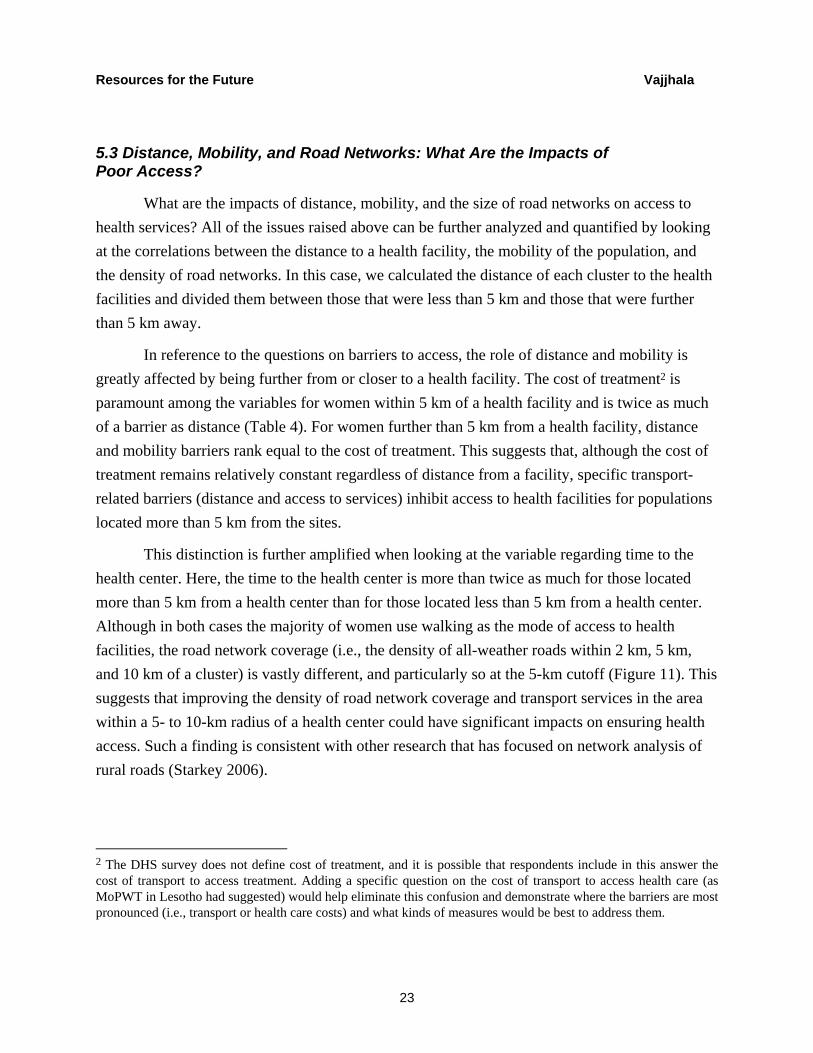
5.3 Distance, Mobility, and Road Networks: What Are the Impacts of Poor Access?
What are the impacts of distance, mobility, and the size of road networks on access to health services? All of the issues raised above can be further analyzed and quantified by looking at the correlations between the distance to a health facility, the mobility of the population, and the density of road networks. In this case, we calculated the distance of each cluster to the health facilities and divided them between those that were less than 5 km and those that were further than 5 km away.
In reference to the questions on barriers to access, the role of distance and mobility is greatly affected by being further from or closer to a health facility. The cost of treatment2 is paramount among the variables for women within 5 km of a health facility and is twice as much of a barrier as distance (Table 4). For women further than 5 km from a health facility, distance and mobility barriers rank equal to the cost of treatment. This suggests that, although the cost of treatment remains relatively constant regardless of distance from a facility, specific transport-related barriers (distance and access to services) inhibit access to health facilities for populations located more than 5 km from the sites.
This distinction is further amplified when looking at the variable regarding time to the health center. Here, the time to the health center is more than twice as much for those located more than 5 km from a health center than for those located less than 5 km from a health center. Although in both cases the majority of women use walking as the mode of access to health facilities, the road network coverage (i.e., the density of all-weather roads within 2 km, 5 km, and 10 km of a cluster) is vastly different, and particularly so at the 5-km cutoff (Figure 11). This suggests that improving the density of road network coverage and transport services in the area within a 5- to 10-km radius of a health center could have significant impacts on ensuring health access. Such a finding is consistent with other research that has focused on network analysis of rural roads (Starkey 2006).
2 The DHS survey does not define cost of treatment, and it is possible that respondents include in this answer the cost of transport to access treatment. Adding a specific question on the cost of transport to access health care (as MoPWT in Lesotho had suggested) would help eliminate this confusion and demonstrate where the barriers are most pronounced (i.e., transport or health care costs) and what kinds of measures would be best to address them.

Resources for the Future Vajjhala
24
Table 4. Lesotho: Barriers to Health Facilities by Distance
Lesotho Barriers to health
facilities
Less than 5 km to nearest health
center
Greater than 5 km to nearest health
center
Avg % women by cluster who say X is a big problem in accessing health services
Cost of treatment 36% 46% Distance to health facility 18% 46% Having to take transport 21% 47%
Weighted avg by cluster Time to health facility 65 min 152 min
Primary mode of transport to health facility (average %)
Walking 77% 64% Horse 1% 2% Car/truck 22% 34%
Average kilometers of all-weather road within X radius of cluster
2-km radius 4.10 1.70 5-km radius 19.84 9.92 10-km radius 59.35 38.10
Figure 11. Density of the Road Network Surrounding Clusters Greater and Less than 5 km from a Health Facility
0
10
20
30
40
50
60
2km radius 5km radius 10km radius
Ave
rage
Kilo
met
ers
Greater than 5km to Nearest Health Center
Less than 5km to Nearest Health Center
Resources for the Future Vajjhala
25
5.4 HIV/AIDS
The analysis of DHS survey data on HIV/AIDS can also be enhanced when combined with transport network and other spatial data. In this case, several of the questions about HIV/AIDS are exactly the same in both the men’s and women’s questionnaires. This allows for sex disaggregation of results and illuminates the differential impacts of access to health services, public health information, and the impact of HIV/AIDS on each group.
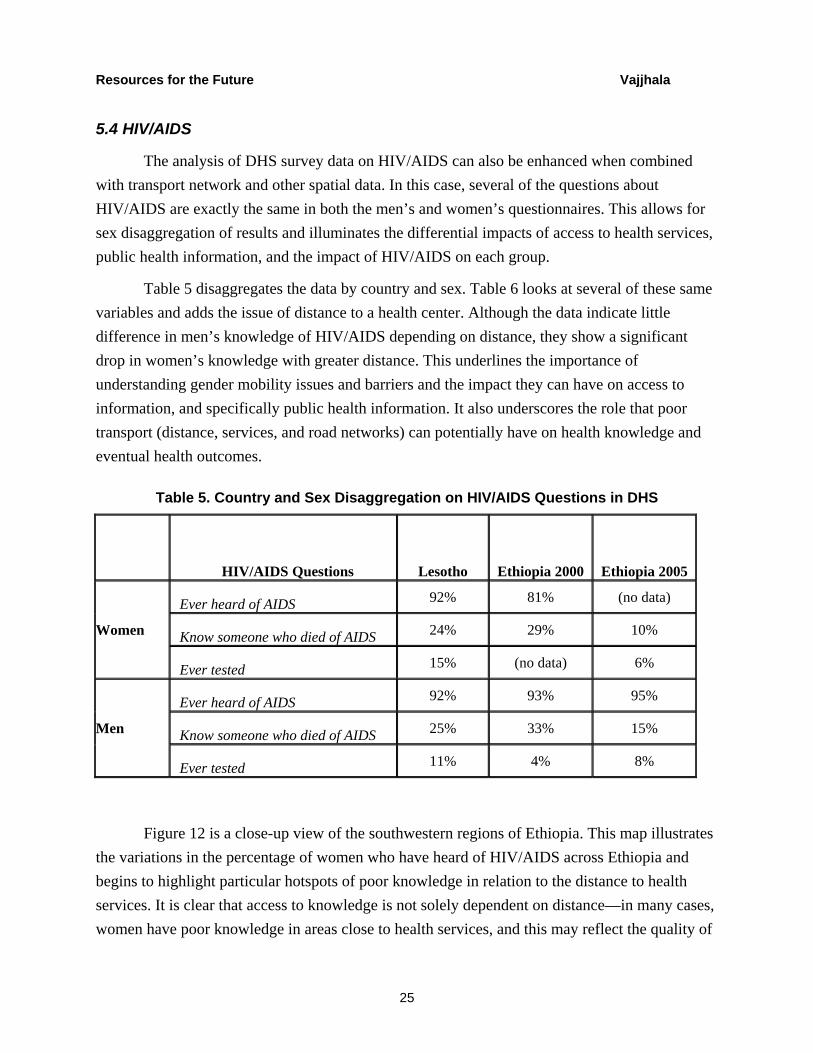
Table 5 disaggregates the data by country and sex. Table 6 looks at several of these same variables and adds the issue of distance to a health center. Although the data indicate little difference in men’s knowledge of HIV/AIDS depending on distance, they show a significant drop in women’s knowledge with greater distance. This underlines the importance of understanding gender mobility issues and barriers and the impact they can have on access to information, and specifically public health information. It also underscores the role that poor transport (distance, services, and road networks) can potentially have on health knowledge and eventual health outcomes.
Table 5. Country and Sex Disaggregation on HIV/AIDS Questions in DHS
HIV/AIDS Questions Lesotho Ethiopia 2000 Ethiopia 2005
Women
Ever heard of AIDS 92% 81% (no data)
Know someone who died of AIDS 24% 29% 10%
Ever tested 15% (no data) 6%
Men
Ever heard of AIDS 92% 93% 95%
Know someone who died of AIDS 25% 33% 15%
Ever tested 11% 4% 8%
Figure 12 is a close-up view of the southwestern regions of Ethiopia. This map illustrates the variations in the percentage of women who have heard of HIV/AIDS across Ethiopia and begins to highlight particular hotspots of poor knowledge in relation to the distance to health services. It is clear that access to knowledge is not solely dependent on distance—in many cases, women have poor knowledge in areas close to health services, and this may reflect the quality of

Resources for the Future Vajjhala
26
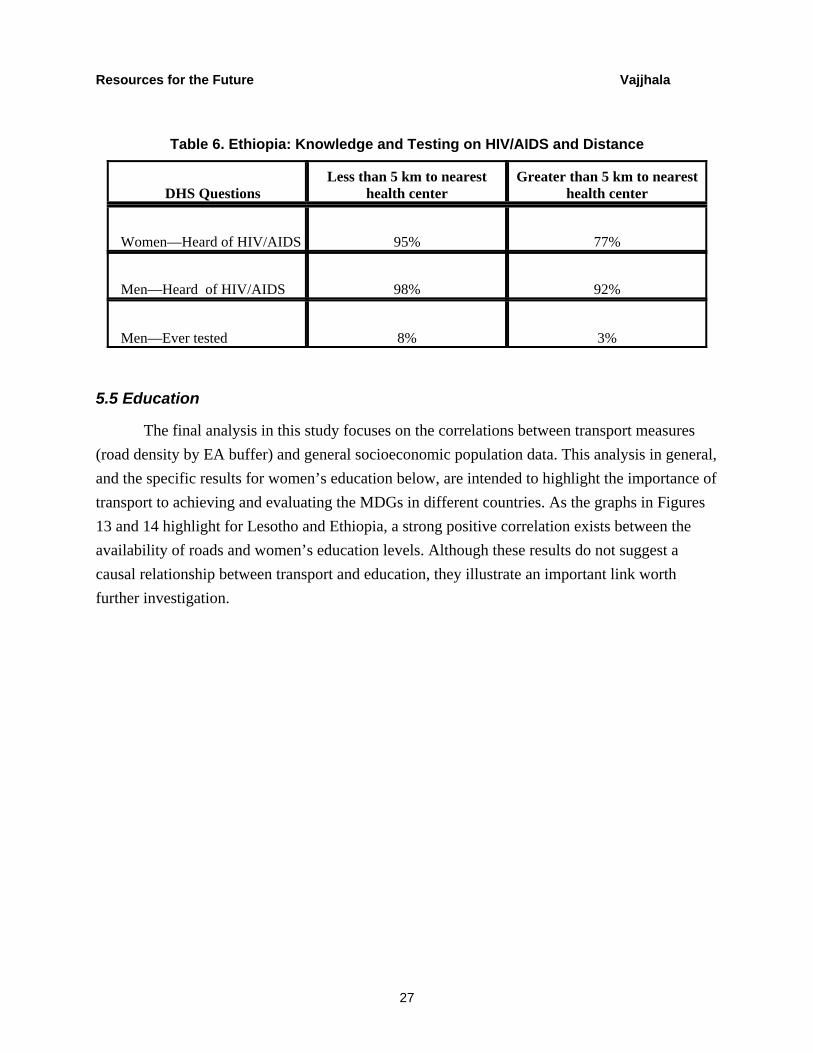
services being offered. However, this kind of analysis gives a quick snapshot of the state of awareness and can help identify areas for HIV/AIDS outreach and future transport investment aimed at facilitating access. Table 6 provides a summary of these same results dissaggregated spatially for survey clusters that contain a health center within a 5-km buffer and those that do not.
Figure 12. Average Percentage of Women Who Have Heard of HIV/AIDS
Resources for the Future Vajjhala
27
Table 6. Ethiopia: Knowledge and Testing on HIV/AIDS and Distance
DHS Questions Less than 5 km to nearest
health center Greater than 5 km to nearest
health center
Women—Heard of HIV/AIDS 95% 77%
Men—Heard of HIV/AIDS 98% 92%
Men—Ever tested 8% 3%
5.5 Education
The final analysis in this study focuses on the correlations between transport measures (road density by EA buffer) and general socioeconomic population data. This analysis in general, and the specific results for women’s education below, are intended to highlight the importance of transport to achieving and evaluating the MDGs in different countries. As the graphs in Figures 13 and 14 highlight for Lesotho and Ethiopia, a strong positive correlation exists between the availability of roads and women’s education levels. Although these results do not suggest a causal relationship between transport and education, they illustrate an important link worth further investigation.

Resources for the Future Vajjhala
28
Figure 13. Correlation between Road Density and Women’s Education Levels in Lesotho
Figure 14. Correlation between Road Density and Women’s Education Levels in Ethiopia
Lesotho - Correlation Road Density and Women's Education
0
0.2
0.4
0.6
0.8
1
1.2
1.4
1.25 1.75 2.25 2.75
Level of Education
Ave
rage
am
ount
of r
oads
in s
et ra
dius
of c
lust
ers
2km Road Buffers
5km Road Buffers
10km Road Buffers
Incomplete Primary Primary Secondary
Ethiopia - Correlation Road Density and Women's Education
0
0.2
0.4
0.6
0.8
1
1.2
1 1.4 1.8 2.2 2.6
Level of Education
Ave
rage
am
ount
of r
oads
in s
et ra
dius
of c
lust
ers
2km Road Buffers
5km Road Buffers
10km Road Buffers
Incomplete Primary Primary Secondary
Resources for the Future Vajjhala
29
6. Conclusions
This study illustrates some of the basic links between transport and health and highlights their implications for understanding the underlying dynamics of spatial exclusion across scales. There are many other possible applications of this approach and methodology. Carefully combining the types of data analyzed in this paper with other relevant metrics, such as transport cost, can help to further elucidate the social dimensions of transport programs. Most DHSs include sections on education and wealth ranking. Both of these topics, if complemented by a few transport-specific questions, could provide valuable intersectoral knowledge on barriers to access to education and correlations between wealth and mobility. Several (but not all) DHSs also include information on social inclusion issues such as religion and ethnicity. These indicators, when combined with transport and other data layers could support valuable initial analyses of the impact of mobility and access on inclusion, vulnerability, and isolation at a national level.
Overall, this pilot spatial analytical approach and cross-scale evaluation illustrate opportunities to improve the following activities.
• Visualization of transport issues and health barriers: The resulting analysis can help communicate the relevance of transport and access across sectors and countries and for particular populations, such as women.
• Assessment of transport impacts: The spatial analysis of transport and health data can facilitate the development of plans for new investments across sectors (siting roads and clinics, increasing footpath networks, supporting nonmotorized transport services, and so on) and facilitate the evaluation of change and impact over time.
• National priority setting: The spatial analysis can help identify hotspots of low transport access and low MDG indicators. Identifying such correlations will not provide perfect certainty, but can help planners and implementers identify key questions and particular areas that need to be addressed.
• Integrated spatial analysis and planning: Cross-sector and cross-scale analyses are critical to evaluating intersectoral gaps from the community to national levels and overcoming barriers to achieving the MGDs and other social development objectives.
Taken as a whole, the major results of this study reveal how opportunities for cross-sectoral analysis have improved as new information technologies, such as GIS, and cost-effective local data collection methodologies, such as georeferencing, have emerged. As the transport
Resources for the Future Vajjhala
30
sector increases its investments in Africa and moves from a project to a programmatic focus at a national level, the identification of supporting technologies and approaches to monitoring the social impacts of investments and the provision of relevant information for decision support of planners and policymakers are paramount. The study points to new opportunities for linking gender, transport, and health data across scales using spatial information technologies.

Resources for the Future Vajjhala
31
References
Button, Kenneth. 1995. What Can Meta-Analysis Tell Us about the Implications of Transport? Regional Studies (29)6: 507–517.
DHS (Demographic and Health Surveys) Data. 2000. Ethiopia. Measure DHS, Macro International. http://www.measuredhs.com/ (accessed July 25, 2009).
DHS Data. 2002. Ghana. Measure DHS, Macro International. http://www.measuredhs.com/ (accessed July 25, 2009).
DHS Data. 2004. Lesotho. Measure DHS, Macro International. http://www.measuredhs.com/ (accessed July 25, 2009).
DHS Data. 2005. Ethiopia. Measure DHS, Macro International. http://www.measuredhs.com/ (accessed July 25, 2009).
Greene, D.L, D.W. Jones, and M.A. Delucchi (eds.). 1986. The Full Costs and Benefits of Transportation: Contributions to Theory, Method, and Measurement. New York: Springer.
Howe, J. 2003. Inclusion of Social Benefits in Transport Planning: A Review of Developing Country Experience. Washington, DC: The World Bank.
Oddsson, G., W. Walker, and Solvi Bergveinsson. 2004. Lesotho Integrated Transport Program GIS Needs Assessment. Washington, DC: The World Bank.
SSATP (Sub-Saharan Africa Transport Policy Program). 2005. Transport and the Millennium Development Goals in Africa. Washington, DC: SSATP.
Starkey, P. 2006. The Rapid Assessment of Rural Transport Services. Washington, DC: SSATP.
Vajjhala, S.P. 2005. Mapping Alternatives: Facilitating Public Participation in Development and Environmental Decision Making. Unpublished doctoral dissertation, Carnegie Mellon University.
Walker, W., S. Vajjhala, T. Phomane, N. Zaly, S. Moonyane, and M. Mokhoro. 2005. Ground Truthing: Mapping Mobility and Access in Rural Lesotho. Washington, DC: The World Bank.
Resources for the Future Vajjhala
32
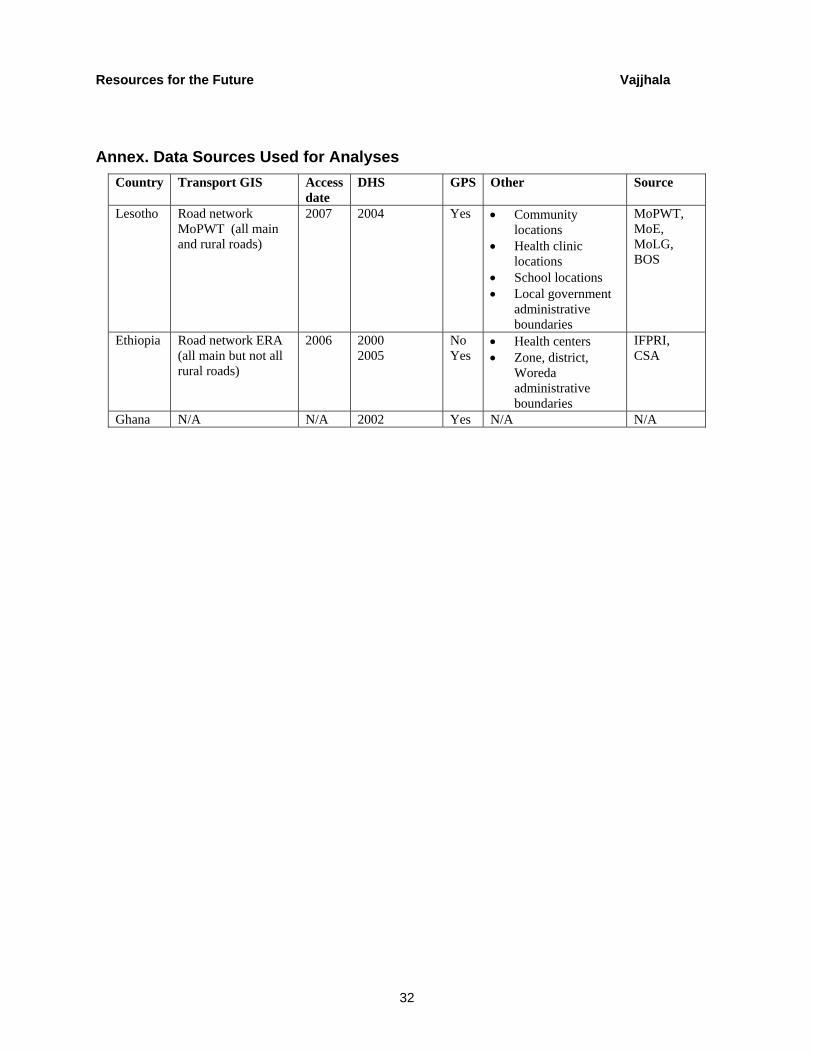
Annex. Data Sources Used for Analyses Country Transport GIS Access
date DHS GPS Other Source
Lesotho Road network MoPWT (all main and rural roads)
2007 2004 Yes • Community locations
• Health clinic locations
• School locations • Local government
administrative boundaries
MoPWT, MoE, MoLG, BOS
Ethiopia Road network ERA (all main but not all rural roads)
2006 2000 2005
No Yes
• Health centers • Zone, district,
Woreda administrative boundaries
IFPRI, CSA
Ghana N/A N/A 2002 Yes N/A N/A