gender and racial/ethnic differences in salary and other … · 2002-09-10 · sciences and...
TRANSCRIPT
U.S. Department of EducationOffice of Educational Researchand ImprovementNCES 2002–170
Gender and Racial/Ethnic Differencesin Salary and OtherCharacteristics ofPostsecondary Faculty:Fall 1998
Statistical Analysis Report

THIS PAGE INTENTIONALLY LEFT BLANK
U.S. Department of EducationOffice of Educational Researchand ImprovementNCES 2002–170
Gender and Racial/Ethnic Differencesin Salary and OtherCharacteristics ofPostsecondary Faculty:Fall 1998
Statistical Analysis Report
September 2002
Ellen M. BradburnAnna C. SikoraMPR Associates, Inc.
Linda J. ZimblerProject OfficerNational Center forEducation Statistics

U.S. Department of EducationRod PaigeSecretary
Office of Educational Research and ImprovementGrover J. WhitehurstAssistant Secretary
National Center for Education StatisticsGary W. PhillipsDeputy Commissioner
The National Center for Education Statistics (NCES) is the primary federal entity for collecting, analyzing, andreporting data related to education in the United States and other nations. It fulfills a congressional mandateto collect, collate, analyze, and report full and complete statistics on the condition of education in the UnitedStates; conduct and publish reports and specialized analyses of the meaning and significance of such statistics;assist state and local education agencies in improving their statistical systems; and review and report oneducation activities in foreign countries.
NCES activities are designed to address high priority education data needs; provide consistent, reliable, complete,and accurate indicators of education status and trends; and report timely, useful, and high quality data to theU.S. Department of Education, the Congress, the states, other education policymakers, practitioners, data users,and the general public.
We strive to make our products available in a variety of formats and in language that is appropriate to avariety of audiences. You, as our customer, are the best judge of our success in communicating informationeffectively. If you have any comments or suggestions about this or any other NCES product or report, we wouldlike to hear from you. Please direct your comments to:
National Center for Education StatisticsOffice of Educational Research and ImprovementU.S. Department of Education1990 K Street NWWashington, DC 20006–5651
September 2002
The NCES World Wide Web Home Page address is http://nces.ed.govThe NCES World Wide Web Electronic Catalog is: http://nces.ed.gov/pubsearch
Suggested Citation
U.S. Department of Education, National Center for Education Statistics (2002). Gender and Racial/EthnicDifferences in Salary and Other Characteristics of Postsecondary Faculty: Fall 1998, (NCES 2002–170), by EllenM. Bradburn and Anna C. Sikora. Project Officer: Linda J. Zimbler. Washington, DC: 2002.
For ordering information on this report, write:
U.S. Department of EducationED PubsP.O. Box 1398Jessup, MD 20794–1398
Or call toll free 1–877–4ED–Pubs
Content Contact:Aurora D’Amico(202) 502–7334Aurora.D’[email protected]
iii
Executive Summary
Disparities in salary, rank, and tenure amongfaculty members have been an interest of leadersand policymakers both inside and outsideacademe. Researchers have consistently found thatfaculty characteristics such as experience, researchproductivity, institution type, and teaching fieldrelate to faculty pay and outcomes (Fairweather1995; Bellas 1997; Bellas and Toutkoushian1999). Differences by gender and race/ethnicityare also evident, with relatively few women andminority faculty teaching at doctoral institutionsand holding tenure and the highest rankingpositions (Jusenius and Scheffler 1981; Alpert1989; Smart 1991; Ashraf 1996; Nettles, Perna,and Bradburn 2000). Additionally, wage gapsbetween male and female faculty remain aftercontrolling for numerous sociodemographic,human capital, productivity, and employmentcharacteristics (Barbezat 1991; Glazer-Raymo1999; Nettles, Perna, and Bradburn 2000). Thesegender and racial/ethnic equity issues areimportant to individuals currently working withinthe professoriate and to those who hope to attract adiverse pool of talent to the profession in thefuture (American Association of UniversityProfessors 1999).
Using data from the 1999 National Study ofPostsecondary Faculty (NSOPF:99), this reportexamines how gender and race/ethnicity relate to anumber of faculty outcomes and characteristics,including the following: salary, rank, tenure status,education, experience, institution type, teachingfield, workload, and research productivity. Thereport focuses on full-time faculty and staff who
had instructional duties for credit in fall 1998,1
comparing men and women as well as members offour racial/ethnic groups: White, non-Hispanic;Black, non-Hispanic; Asian/Pacific Islander; andHispanic. It also includes a regression analysis thatshows the residual relationship of gender andrace/ethnicity to salary after taking into accountother faculty characteristics. As a follow-up to thereport Salary, Promotion, and Tenure Status ofMinority and Women Faculty in U.S. Colleges andUniversities (Nettles, Perna, and Bradburn 2000),which used data from the 1993 National Study ofPostsecondary Faculty (NSOPF:93), the currentreport also examines changes in faculty outcomesand characteristics between 1992 and 1998.
Differences Between Male andFemale Faculty Members
Overall, men’s salaries were higher thanwomen’s salaries: full-time male faculty averagedabout $61,700 in base salary from the institution in1998, compared with $48,400 for full-time femalefaculty (figure A). Furthermore, men’s salaryadvantage was found among White,2 Asian, Black,and Hispanic faculty as well. The male-femaledifference in base salary ranged from about $7,000
1Throughout this report, “full-time faculty and staff who hadinstructional duties for credit” are often referred to simply as“faculty.” Included are full-time faculty who had for-creditinstructional duties, as well as staff who did not have facultystatus, but who did have for-credit instructional duties.Teaching assistants are not included.2For brevity throughout this report, “White” denotes “White,non-Hispanic,” “Black” refers to “Black, non-Hispanic,” and“Asian” refers to “Asian/Pacific Islander.”

Executive Summary
iv
among Black faculty to about $14,0003 amongWhite faculty. The regression analysis alsoshowed that, after controlling for race, type ofinstitution, teaching field, level of instruction,tenure status, rank, highest degree, years sincehighest degree, age, average proportion of timespent on teaching and on research, number ofclasses taught, and number of total publications orother permanent creative works, full-time femalefaculty members earned nearly 9 percent4 less thantheir male counterparts.
3These salary differences were calculated as follows: $53,640(Black male average salary) – $46,870 (Black female averagesalary) = $6,770 (salary difference between Black males andfemales); $61,950 (White male average salary) – $48,200(White female average salary) = $13,750 (salary differencebetween White males and females); $66,350 (Asian maleaverage salary) – $54,690 (Asian female average salary) =$11,660 (salary difference between Asian males and females)and $58,990 (Hispanic male average salary) – $46,890(Hispanic female average salary) = $12,100 (salary differencebetween Hispanic males and females).4This percentage difference was calculated using male andfemale average base salaries that were adjusted to take intoaccount differences associated with other variables in the
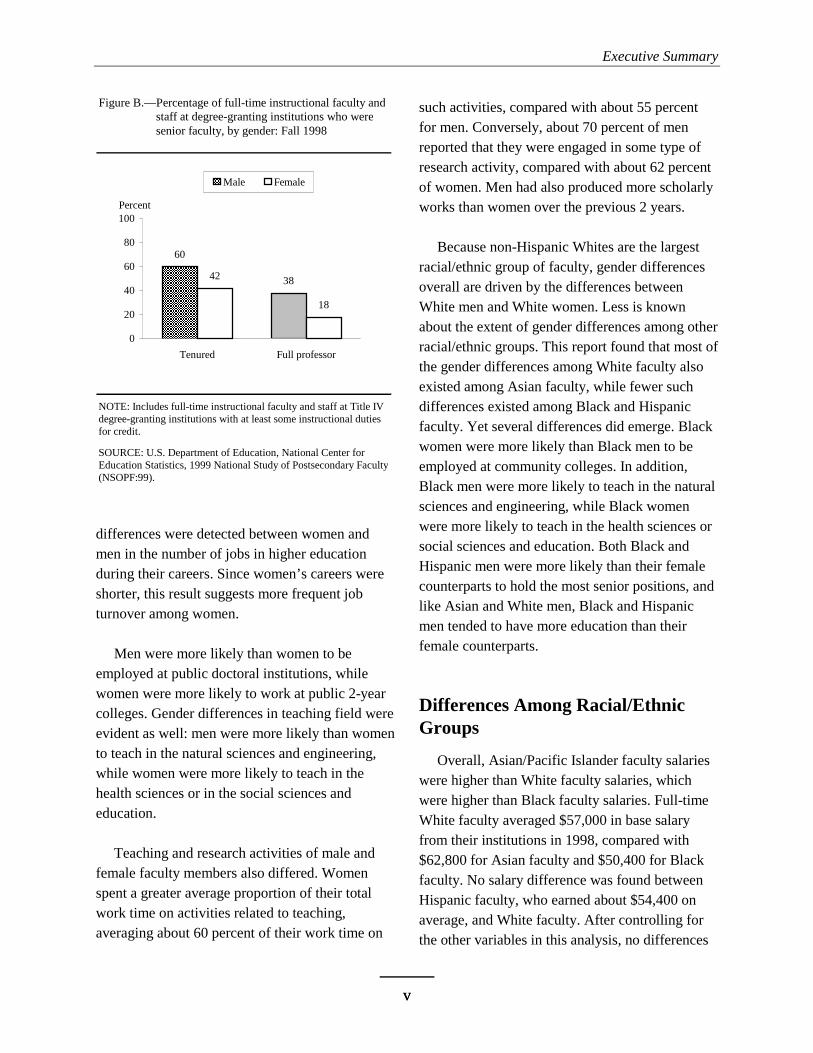
Other faculty outcomes and characteristics alsodiffered by gender in fall 1998. Overall, men heldhigher ranks and were more likely than women tohave tenure (figure B). Men were much morelikely than women to be full professors, and 60percent of men had tenure, compared with 42percent of women. Women were also more likelythan men to have jobs that were not on the tenuretrack. Men’s and women’s highest degree andyears of experience also differed. While aboutthree-quarters (74 percent) of men held doctoral orfirst-professional degrees, 54 percent of womenheld these degrees, and women were much morelikely than men to have completed their educationwith a master’s degree. Men had also held theirhighest degrees for longer periods of time, onaverage, than women and had been teachinglonger both in their current jobs and in highereducation overall. On the other hand, no
analysis: $58,690 (adjusted male average salary) – $53,620(adjusted female average salary) = $5,070 (gender salarydifference) / $58,690 = .086 x 100 = 9 percent.
Figure A.—Base salary of full-time instructional faculty and staff at degree-granting institutions, by gender and race/ethnicity:Figure A.—Calendar year 1998
NOTE: Includes full-time instructional faculty and staff at Title IV degree-granting institutions with at least some instructional duties for credit. Refers to base salary during calendar year 1998 received from the institution at which the respondent was sampled. Dollar figures arerounded to the nearest 10. Included in total but not shown separately are American Indian/Alaska Native faculty.
SOURCE: U.S. Department of Education, National Center for Education Statistics, 1999 National Study of Postsecondary Faculty (NSOPF:99).
$61,950$53,640
$66,350$58,990$61,680
$48,200 $46,870$54,690
$46,890$48,370
$0
$20,000
$40,000
$60,000
$80,000
$100,000
Total White, non-Hispanic
Black, non-Hispanic
Asian/Pacific Islander
Hispanic
Salary Male Female
Executive Summary
vv
differences were detected between women andmen in the number of jobs in higher educationduring their careers. Since women’s careers wereshorter, this result suggests more frequent jobturnover among women.
Men were more likely than women to beemployed at public doctoral institutions, whilewomen were more likely to work at public 2-yearcolleges. Gender differences in teaching field wereevident as well: men were more likely than womento teach in the natural sciences and engineering,while women were more likely to teach in thehealth sciences or in the social sciences andeducation.
Teaching and research activities of male andfemale faculty members also differed. Womenspent a greater average proportion of their totalwork time on activities related to teaching,averaging about 60 percent of their work time on
such activities, compared with about 55 percentfor men. Conversely, about 70 percent of menreported that they were engaged in some type ofresearch activity, compared with about 62 percentof women. Men had also produced more scholarlyworks than women over the previous 2 years.
Because non-Hispanic Whites are the largestracial/ethnic group of faculty, gender differencesoverall are driven by the differences betweenWhite men and White women. Less is knownabout the extent of gender differences among otherracial/ethnic groups. This report found that most ofthe gender differences among White faculty alsoexisted among Asian faculty, while fewer suchdifferences existed among Black and Hispanicfaculty. Yet several differences did emerge. Blackwomen were more likely than Black men to beemployed at community colleges. In addition,Black men were more likely to teach in the naturalsciences and engineering, while Black womenwere more likely to teach in the health sciences orsocial sciences and education. Both Black andHispanic men were more likely than their femalecounterparts to hold the most senior positions, andlike Asian and White men, Black and Hispanicmen tended to have more education than theirfemale counterparts.
Differences Among Racial/EthnicGroups
Overall, Asian/Pacific Islander faculty salarieswere higher than White faculty salaries, whichwere higher than Black faculty salaries. Full-timeWhite faculty averaged $57,000 in base salaryfrom their institutions in 1998, compared with$62,800 for Asian faculty and $50,400 for Blackfaculty. No salary difference was found betweenHispanic faculty, who earned about $54,400 onaverage, and White faculty. After controlling forthe other variables in this analysis, no differences
Figure B.—Percentage of full-time instructional faculty andFigure B.—staff at degree-granting institutions who wereFigure B.—senior faculty, by gender: Fall 1998
NOTE: Includes full-time instructional faculty and staff at Title IVdegree-granting institutions with at least some instructional duties for credit.
SOURCE: U.S. Department of Education, National Center forEducation Statistics, 1999 National Study of Postsecondary Faculty(NSOPF:99).
60
3842
18
0
20
40
60
80
100
Tenured Full professor
Percent
Male Female
Executive Summary
vi
were observed in average salaries acrossracial/ethnic categories.
The analysis of faculty outcomes andcharacteristics in fall 1998, which makesracial/ethnic comparisons separately for men andwomen, shows that racial/ethnic differences weremore often found among men than among women.When racial/ethnic differences did emerge, therewere more differences between Whites and Asiansthan between Whites and Blacks. Hispanic facultydisplayed the fewest differences from Whitefaculty overall. In some cases, small sample sizesand large standard errors meant that apparentdifferences were not statistically conclusive.
In general, full-time Asian/Pacific Islanderfaculty were more likely than full-time Whitefaculty to have several kinds of characteristics thatare associated with higher salaries. For example,
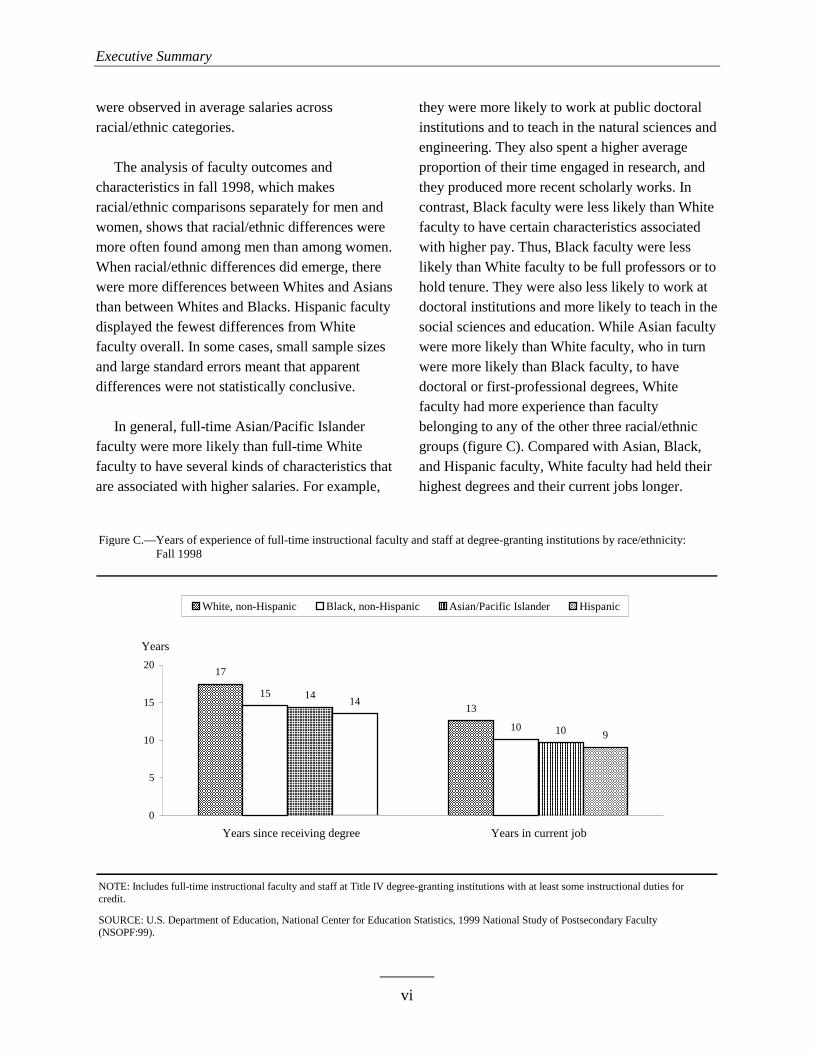
they were more likely to work at public doctoralinstitutions and to teach in the natural sciences andengineering. They also spent a higher averageproportion of their time engaged in research, andthey produced more recent scholarly works. Incontrast, Black faculty were less likely than Whitefaculty to have certain characteristics associatedwith higher pay. Thus, Black faculty were lesslikely than White faculty to be full professors or tohold tenure. They were also less likely to work atdoctoral institutions and more likely to teach in thesocial sciences and education. While Asian facultywere more likely than White faculty, who in turnwere more likely than Black faculty, to havedoctoral or first-professional degrees, Whitefaculty had more experience than facultybelonging to any of the other three racial/ethnicgroups (figure C). Compared with Asian, Black,and Hispanic faculty, White faculty had held theirhighest degrees and their current jobs longer.
Figure C.—Years of experience of full-time instructional faculty and staff at degree-granting institutions by race/ethnicity: Figure C.—Fall 1998
NOTE: Includes full-time instructional faculty and staff at Title IV degree-granting institutions with at least some instructional duties for credit.
SOURCE: U.S. Department of Education, National Center for Education Statistics, 1999 National Study of Postsecondary Faculty (NSOPF:99).
17
13
15
10
14
10
14
9
0
5
10
15
20
Years sincereceiving degree
Years incurrent job
Years
White, non-Hispanic Black, non-Hispanic Asian/Pacific Islander Hispanic
Years in current jobYears since receiving degree
Executive Summary
viivii
White faculty were also older than their Asian andHispanic colleagues.
Other Findings
The multiple regression analysis confirmed thatother faculty characteristics besides gender wererelated to salaries. Tenure status, academic rank,highest degree earned, and number of years sincereceiving highest degree were all associated withsalary. Full professors earned more than associateand assistant professors and faculty in other ranks.Faculty holding doctoral or first-professionaldegrees earned about 12 percent5 more thanfaculty holding other degrees, and those who heldtheir highest degrees for more than 15 yearsearned an average of at least $6,0006 more thantheir colleagues with less experience.
Institution type, teaching field, and teachingand research activities were also associated withsalaries. Compared with faculty who taught atpublic 2-year institutions, faculty who taught atpublic and private not-for-profit doctoralinstitutions earned significantly higher salariesafter adjusting for the other variables used in theanalysis. Faculty who taught in business, law,
5This percentage difference was calculated using averagebase salaries by highest degree adjusted to control fordifferences associated with other variables in the analysis:$58,980 (adjusted average salary for faculty holdingdoctoral/first-professional degrees) – $52,540 (adjustedaverage salary for faculty holding other degrees) = $6,440(salary difference) / $52,540 = 0.12 x 100 = 12 percent salarydifference.6These salary differences were calculated as follows: $60,690(adjusted average salary for faculty with more than 15 yearsof experience) – $54,280 (adjusted average salary of facultywith 11 to 15 years of experience) = $6,410 (salarydifference); $60,690 (adjusted average salary for faculty withmore than 15 years of experience) – $53,250 (adjustedaverage salary of faculty with 6 to 10 years of experience) =$7,440 (salary difference); and $60,690 (adjusted averagesalary for faculty with more than 15 years of experience) –$50,950 (adjusted average salary of faculty with 0 to 5 yearsof experience) = $9,740 (salary difference).
communications, and health sciences earnedsignificantly higher salaries than faculty in thenatural sciences and engineering. Faculty in thenatural sciences and engineering earned more thantheir counterparts in the humanities. Additionally,faculty who reported producing more than 10 totalpublications or other permanent creative worksover the previous 2 years earned more than theircounterparts who had produced fewer works.Salaries were also higher for those facultymembers who spent an average of 50 percent orless of their time on teaching activities.
A comparison of results from the 1993 and1999 administrations of NSOPF also showed thatdifferences among faculty have persisted overtime. Overall, the status of faculty acrossracial/ethnic groups changed little between 1992and 1998. Women’s average salary (in constant1998 dollars) rose significantly between 1992 and1998, resulting from an increase in salary amongWhite women in particular. But while salariesamong other racial/ethnic groups also appeared tohave increased for women (and, in some cases, formen), the standard errors were large, and there wasnot enough statistical evidence to conclude thatthese results were significant. In addition to havinghigher average salaries in 1998 than in 1992,White women were also more likely to havedoctoral or first-professional degrees and to be fullprofessors. Despite these changes, no change wasdetected in the gap between the average salary ofWhite men and women between 1992 and 1998. Infact, no significant changes were detected in thesalary gaps between male and female full-timeinstructional staff between 1992 and 1998 acrossthe four racial/ethnic groups examined.

viii
Foreword
This report describes gender and racial/ethnic differences in salaries and other
characteristics of full-time instructional faculty and staff in fall 1998. Gender and racial/ethnic
differences among four racial/ethnic groups—White, Asian/Pacific Islander, Black/African
American, and Hispanic faculty—are examined with respect to structural characteristics,
education and experience, and teaching and research activities. In addition, a regression analysis
examines whether salary differences by gender and race/ethnicity persist when controlling for all
of these types of factors.
This report uses data from the 1999 National Study of Postsecondary Faculty (NSOPF:99),
the third cycle of data collections on postsecondary faculty conducted by the National Center for
Education Statistics (NCES). Previous collections were conducted in 1987–88 and 1992–93.
Additional NCES reports using NSOPF:99 are planned on such topics as faculty and staff who
taught classes to undergraduates, faculty use of technology, involvement of instructional faculty
and staff in distance education, part-time faculty, and retirement and other departure plans of
faculty. Upon their release, these reports can be accessed and downloaded from the NCES Web
Site (http://nces.ed.gov).
The estimates presented in the report were produced using the NCES Data Analysis System
(DAS), a microcomputer application that allows users to specify and generate tables, for the
NSOPF:99 study. The DAS produces the design-adjusted standard errors necessary for testing
the statistical significance of differences among estimates. Researchers are encouraged to use the
NSOPF:99 data for their own analysis as well. For more information on the DAS and analysis
with NSOPF:99, readers should consult appendix B of this report.

ix
Acknowledgments
The authors appreciate the contributions of staff members at MPR Associates, NCES and
other U.S. Department of Education offices, and nongovernmental agencies for their
contributions to the production of this report. At MPR Associates, Katharin Peter and Rachael
Berger provided considerable skilled assistance with statistical analysis and literature review.
Laura Horn contributed to the development of the report with both detailed comments on drafts
and a helpful broader perspective on the direction of the report. Expert assistance in the
production of the report was supplied by Francesca Tussing and Barbara Kridl. Andrea
Livingston and Robin Henke provided helpful editorial and substantive reviews.
Outside of MPR Associates, Linda Zimbler at NCES oversaw the production and
development of the report through all stages, providing detailed feedback and guidance on all
drafts. Paula Knepper was the senior technical advisor for the report and contributed a great deal
to strengthening the complex results reported here. C. Dennis Carroll and Andrew G. Malizio at
NCES also reviewed and commented on the report at different stages, and Karen O’Conor
adjudicated the report. Other reviewers included Bill Sonnenberg and Jonaki Bose at NCES, Ann
Mullen of the Office of Educational Research and Improvement in the U.S. Department of
Education, Marcia Bellas at the University of Cincinnati, and Tom Nachazel and Sally Dillow at
the Education Statistics Services Institute. We greatly appreciate the input of all the reviewers.

THIS PAGE INTENTIONALLY LEFT BLANK

xi
Table of Contents
PageExecutive Summary .................................................................................................................. iii
Foreword .................................................................................................................................... viii
Acknowledgments...................................................................................................................... ix
List of Tables ............................................................................................................................. xii
List of Figures ............................................................................................................................ xiv
Introduction ............................................................................................................................... 1Background ........................................................................................................................... 2Data and Measurement Issues ............................................................................................... 4Organization of This Report.................................................................................................. 9
Gender Differences Among Full-Time Instructional Faculty and Staff .............................. 11Salary Differences in 1998.................................................................................................... 11Overall Gender Differences in Other Faculty Characteristics .............................................. 11Gender Differences by Racial/Ethnic Group ........................................................................ 15Summary ............................................................................................................................... 19
Racial/Ethnic Differences Among Full-Time Faculty............................................................ 23Salary Differences in 1998.................................................................................................... 23Overall Racial/Ethnic Differences in Other Faculty Characteristics .................................... 23Racial/Ethnic Differences Among Male and Female Faculty............................................... 28Summary ............................................................................................................................... 28
Gender and Racial/Ethnic Differences in Salary Controlling for Other Characteristics .. 33
Subgroup Changes Between 1992 and 1998 ........................................................................... 37
Conclusion.................................................................................................................................. 39
Tables ......................................................................................................................................... 41
References .................................................................................................................................. 65
Appendix A—Glossary ............................................................................................................. 69
Appendix B—Technical Notes ................................................................................................. 79
Appendix C—Supplemental Figures ....................................................................................... 91

xii
List of Tables
Table Page
1 Percentage distribution of full-time instructional faculty and staff according to basesalary, and average base salary, by gender and race/ethnicity: Calendar year 1998....... 43
2 Percentage distribution of full-time instructional faculty and staff according toinstitution type, by gender and race/ethnicity: Fall 1998 ................................................ 44
3 Percentage distribution of full-time instructional faculty and staff according to levelof instruction, by gender and race/ethnicity: Fall 1998................................................... 45
4 Percentage distribution of full-time instructional faculty and staff according to field ofteaching, by gender and race/ethnicity: Fall 1998........................................................... 46
5 Percentage distribution of full-time instructional faculty and staff according toacademic rank, by gender and race/ethnicity: Fall 1998................................................. 47
6 Percentage distribution of full-time instructional faculty and staff according to tenurestatus, by gender and race/ethnicity: Fall 1998 ............................................................... 48
7 Percentage distribution of full-time instructional faculty and staff according to highestdegree attained and average years since receiving highest degree, by gender andrace/ethnicity: Fall 1998.................................................................................................. 49
8 Among full-time instructional faculty and staff, average years in current job, years ofhigher education teaching experience, and number of jobs in higher education, bygender and race/ethnicity: Fall 1998 ............................................................................... 50
9 Percentage distribution of full-time instructional faculty and staff across age groupsand average age, by gender and race/ethnicity: Fall 1998 .............................................. 51
10 Among full-time instructional faculty and staff, average number of coursepreparations, for-credit classes, hours taught per week, and student contact hours perweek, by gender and race/ethnicity: Fall 1998................................................................ 52
11 Among full-time instructional faculty and staff, average percentage of time spent onvarious activities, by gender and race/ethnicity: Fall 1998............................................. 53

List of Tables
xiiixiii
Table Page
12 Percentage of full-time instructional faculty and staff engaged in research or otherscholarly work and of those, percentage in funded research, by gender andrace/ethnicity: Fall 1998.................................................................................................. 54
13 Among full-time instructional faculty and staff, number of various types of recentscholarly works, by gender and race/ethnicity: Fall 1998............................................... 55
14 Of full-time instructional faculty and staff engaged in research or other scholarlywork, percentage distribution across types of research, by gender and race/ethnicity:Fall 1998.......................................................................................................................... 56
15 Average base salary of full-time instructional faculty and staff at degree-grantinginstitutions, and average salary after taking into account the covariation of thevariables listed, by selected characteristics: Calendar year 1998.................................... 57
16 Average base salary (in constant 1998 dollars) of full-time instructional faculty andstaff and percentage making selected amounts, by gender and race/ethnicity: Calendaryears 1992 and 1998........................................................................................................ 59
17 Percentage of full-time instructional faculty and staff at selected types of institutions,by gender and race/ethnicity: Fall 1992 and fall 1998 .................................................... 60
18 Percentage of full-time instructional faculty and staff whose highest degree is adoctoral or master’s degree, by gender and race/ethnicity: Fall 1992 and fall 1998 ...... 61
19 Percentage of full-time instructional faculty and staff at selected academic ranks, bygender and race/ethnicity: Fall 1992 and fall 1998 ......................................................... 62
20 Percentage distribution of full-time instructional faculty and staff according to tenurestatus, by gender and race/ethnicity: Fall 1992 and fall 1998......................................... 63
Appendix Tables
B1 Percentage distribution of faculty and instructional staff according to detailedrace/ethnicity categories: Fall 1998................................................................................. 81
B2 Percentage distribution of full-time instructional faculty and staff according to basesalary, and average base salary, by gender and detailed race/ethnicity categories:Calendar year 1998.......................................................................................................... 82
B3 Standard errors for table 1: Percentage distribution of full-time instructional facultyand staff according to base salary, and average base salary, by gender andrace/ethnicity: Calendar year 1998.................................................................................. 85

xiv
List of Figures
Figure Page
Executive Summary Figures
A Base salary of full-time instructional faculty and staff at degree-granting institutions,by gender and race/ethnicity: Calendar year 1998 .......................................................... iv
B Percentage of full-time instructional faculty and staff at degree-granting institutionswho were senior faculty, by gender: Fall 1998 ............................................................... v
C Years of experience of full-time instructional faculty and staff at degree-grantinginstitutions, by race/ethnicity: Fall 1998......................................................................... vi
Text Figures
1 Percentage distribution of all instructional faculty and staff according to employmentstatus, by gender: Fall 1998............................................................................................. 6
2 Estimated number of full-time instructional faculty and staff in the population, bygender and race/ethnicity: Fall 1998 ............................................................................... 8
3 Percentage distribution of full-time instructional faculty and staff according togender, by race/ethnicity: Fall 1998................................................................................ 9
4 Percentage distribution of full-time instructional faculty and staff across racial/ethnicgroups: Fall 1998............................................................................................................. 10
5 Base salary of full-time instructional faculty and staff at degree-granting institutions,by gender and race/ethnicity: Calendar year 1998 .......................................................... 12
6 Percentage distribution of full-time instructional faculty and staff at degree-grantinginstitutions according to tenure status, by gender: Fall 1998.......................................... 13
7 Years of experience of full-time instructional faculty and staff at degree-grantinginstitutions, by gender: Fall 1998.................................................................................... 14
8 Percentage of full-time instructional faculty and staff at degree-granting institutionswho were full professors, by gender and race/ethnicity: Fall 1998 ................................ 19

List of Figures
xv
Figure Page
9 Number of recent publications or other permanent creative works of full-timeinstructional faculty and staff at degree-granting institutions, by gender andrace/ethnicity: Fall 1998.................................................................................................. 20
10 Percentage distribution of full-time instructional faculty and staff at degree-grantinginstitutions according to highest degree earned, by race/ethnicity: Fall 1998 ................ 29
11 Years of experience of full-time instructional faculty and staff at degree-grantinginstitutions, by race/ethnicity: Fall 1998......................................................................... 30
12 Percentage distribution of full-time instructional faculty and staff at degree-grantinginstitutions according to academic rank, by race/ethnicity: Fall 1998............................ 31
13 Percentage distribution of full-time instructional faculty and staff at degree-grantinginstitutions according to tenure status, by race/ethnicity: Fall 1998 ............................... 32
Appendix Figures
C1 Summary of gender differences among full-time instructional faculty and staff, byracial/ethnic group and for various characteristics: Fall 1998 ........................................ 92
C2 Summary of differences of selected racial/ethnic groups compared with non-HispanicWhites among full-time instructional faculty and staff, for various characteristics: Fall1998................................................................................................................................. 94
C3 Summary of differences of selected racial/ethnic groups compared with non-HispanicWhites among full-time male instructional faculty and staff, for variouscharacteristics: Fall 1998................................................................................................. 96
C4 Summary of differences of selected racial/ethnic groups compared with non-HispanicWhites among full-time female instructional faculty and staff, for variouscharacteristics: Fall 1998................................................................................................. 98

THIS PAGE INTENTIONALLY LEFT BLANK

1
Introduction
Although real faculty salaries rose during much of the 1990s, overall increases mask
persistent disparities among faculty that are reported each year by the American Association of
University Professors (Bell 2001). For example, the salary gap favoring faculty at private
institutions over those at public institutions has continued to grow (Smallwood 2001). Among
the most persistent differences in faculty salaries are those between men and women (Bell 2001).
Salary differences among racial/ethnic groups, though sometimes more difficult to assess
because of small sample sizes, are also evident. These gender and racial/ethnic equity issues are
particularly important to individuals currently working within the professoriate and to those who
hope to attract a diverse pool of talent to the profession in the future. The American Association
of University Professors (1999) has expressed specific concern about the persistent wage gap
between male and female faculty members over the past 2 decades, noting that pay disparities
have lingered despite increasing proportions of women entering the profession. Of course, many
factors contribute to faculty salaries, and many of those factors vary by gender and race/ethnicity
as well (Nettles, Perna, and Bradburn 2000). To fully understand the nature of gender and
racial/ethnic differences in faculty outcomes like salary, tenure status, and academic rank, the
differences in other background characteristics must also be fully explored and considered. There
is also evidence that gender differences in faculty characteristics vary across racial/ethnic groups
and that racial/ethnic disparities may differ for men and women (Toutkoushian 1998a).
Have gender and racial/ethnic differences in faculty characteristics and outcomes changed
in the 1990s? The 1999 National Study of Postsecondary Faculty (NSOPF:99) provides an
updated profile of how a wide variety of faculty characteristics and outcomes differed between
men and women and among racial/ethnic groups in fall 1998.1 This report expands on earlier
NSOPF reports by presenting information by race/ethnicity within gender. It also assesses gender
and racial/ethnic variation in salaries after controlling for other factors. In addition, the analysis
examines the ways in which the standing of men and women of different racial/ethnic groups has
changed since 1992.
1NSOPF:99 was conducted in 1999 and asked a nationally representative sample of faculty and instructional staff about theiremployment and activities in fall 1998.

Introduction
2
Background
Salary is the most widely used indicator of the status of the professoriate. Most prior
research on the question of faculty equity has generally shown that female faculty earn lower
salaries on average than male faculty and that these differences have persisted over time (Hirsch
and Leppel 1982; Alpert 1989; Weiler 1990; Barbezat 1991; Smart 1991; Ashraf 1996;
Toutkoushian 1998b; Hearn 1999). But many factors are associated with the salaries that faculty
receive.
Many studies have focused on the structural predictors of faculty outcomes. Tenure status
and academic rank are powerful determinants of salary (Smart 1991), and research has also
found that women tend to hold lower ranks (Alpert 1989; Smart 1991; Benjamin 1999;
Toutkoushian 1999) and are less likely than their male colleagues to earn tenure (Benjamin
1999). For example, Toutkoushian (1999) found that women were significantly less likely than
comparably qualified men to be associate or full professors. Nettles, Perna, and Bradburn (2000)
found that women were also less likely than men to hold tenured positions.
Researchers have found that faculty in law, business, engineering, computer sciences,
physical sciences, health professions, and mathematics earn the highest wages, while faculty in
fields such as education, fine arts, humanities, and social sciences earn the lowest (Hansen 1985).
Bellas (1997) found that the greatest salary growth occurred in disciplines with relatively few
women. In fact, Bellas argues that disciplines with more women suffer a “financial penalty”
relative to disciplines in which women are scarce. Whereas one researcher (Chamberlain 1988)
found that the employment of women in sciences and engineering has increased, especially at top
institutions, most studies show that female faculty are disproportionately under-represented in
higher paying disciplines (Benjamin 1999). Salaries also differ considerably at different types of
institutions, with private research universities topping the scale (Bell 2001). Benjamin (1999)
reports that “women are more likely than men to obtain appointments in lower-paying institution
types,” such as community colleges and comprehensive public universities, rather than public
and private research universities.
Along with these structural characteristics, human capital also plays a role. As elsewhere in
the labor market, the education and experience that faculty members bring to their jobs are
strongly associated with salary (along with tenure status and academic rank). On this basis, some
researchers have argued that female faculty have obtained less education and work experience,
which results in lower rank and salary (Smart 1991). This argument can be extended to suggest
that as more women and minorities obtain the terminal degrees in their fields and gain
experience as faculty members, gender and racial/ethnic disparities in wages will disappear over
time. While there is evidence that women hold relatively fewer doctorates, have had their careers

Introduction
3
interrupted more, and generally have less work experience than their male counterparts (Smart
1991, p. 521), these factors have not explained wage inequities fully. Several researchers have
found that a residual salary gap remains after controlling for institution type, educational
attainment, rank, and years of experience (Barbezat 1991; Glazer-Raymo 1999; Nettles, Perna,
and Bradburn 2000). Smart (1991) also found that women hold lower ranks than men after
controlling for these human capital attributes. Some studies show that the widest salary gap
between male and female faculty occurs at the ranks of assistant and full professor (Jusenius and
Scheffler 1981; Alpert 1989; Ashraf 1996), but more recent studies find the smallest salary gap
among assistant professors (Toutkoushian 1998b).
In neoclassical economics, human capital characteristics are used as proxy indicators of
productivity (Smart 1991; England 1992). Some forms of productivity, and the work activities of
faculty members more broadly, can also be measured directly and have been shown to influence
faculty salaries, rank, and tenure status. Fairweather (1995), for example, found that pay is
heavily based on research productivity across institution type. Additionally, Bellas (1999) reports
that teaching and service either negatively affect compensation or are unrelated, while research
and administrative duties positively affect compensation. Studies have found that women spend a
higher average proportion of time than men engaged in teaching and a lower average proportion
of time in research (Bellas 1999; Bellas and Toutkoushian 1999; Nettles, Perna, and Bradburn
2000). For example, using NSOPF:93, Bellas and Toutkoushian (1999) found that men spent an
average of 18 percent of their time on research activities, and women an average of 12 percent,
and men averaged 55 percent of their time on teaching activities, while women averaged 62
percent of their time on teaching. Although these differences were smaller after controlling for
race/ethnicity, experience, marital status, number of children, age, highest degree, rank, field,
and institution type, gender differences in time spent engaged in teaching and research remained.
Prior research on racial/ethnic faculty outcomes is considerably more sparse than is
research on gender (Hearn 1999). Most studies that examine differences in faculty salaries
among racial/ethnic groups have been hampered by the low representation of minority faculty in
study samples and by the aggregation of all racial/ethnic categories other than Whites into one
group (e.g., Fairweather 1993). Nevertheless, some differences have been found. For example,
Ashraf (1996) noted that the racial/ethnic earnings differentials attributed to discrimination have
risen since 1984, and Jusenius and Scheffler (1981) found that minority (especially Black) male
Ph.D. economists earned significantly less than their White counterparts. Nettles, Perna, and
Bradburn (2000) found that White faculty generally had higher salaries and were more likely to
be full professors and have tenure than Black faculty, while Asian/Pacific Islander full-time
faculty had generally higher salaries and were more likely to have higher rank and tenure than
White, Black, or Hispanic faculty. However, racial/ethnic differences in faculty salaries were

Introduction
4
accounted for when background characteristics were controlled (Toutkoushian 1998a; Nettles,
Perna, and Bradburn 2000). For example, Toutkoushian (1998a) found that pay disparities
between Asian faculty (who earned more than Whites) and White faculty were explained by
human capital and structural variables such as discipline, although these variables themselves
may reflect bias (Bellas 1997). Barbezat (1991) found that salary gaps between Black and White
faculty were smaller than those in the general labor market.
Finally, Toutkoushian (1998a) stated that “blacks appear to have reached earnings parity
with whites in higher education,” but, he asserted, salary differences vary widely for men and
women within racial/ethnic groups. According to Toutkoushian (1998a), the largest earnings gap
occurred between Hispanic and White males in the humanities and professional fields, while
White women earned less overall (after controlling for relevant characteristics) than Black
women, particularly in social sciences and arts and humanities. Studies of gender and
racial/ethnic differences in labor market outcomes for the workforce in general suggest that the
employment experiences of women vary considerably across racial/ethnic groups and that the
status of subgroups of workers can only be fully understood when compared across both
racial/ethnic and gender lines (Amott and Matthaei 1991; Kemp 1994). These results suggest that
gender and race/ethnicity must be taken into account simultaneously when exploring differences
among faculty.
The myriad factors that may influence pay and the potentially complex interactions of
gender and race/ethnicity make a comprehensive portrait of faculty salary differences
challenging. Furthermore, as the characteristics and responsibilities of faculty change over time,
so may differences in compensation.
Data and Measurement Issues
The many kinds of comparisons suggested by the literature, as mentioned above, lead to
certain data and analytic requirements. First, a nationally representative sample of faculty large
enough to permit analyses of both gender and racial/ethnic subgroups is essential. Also, the data
must include measures not only of salary but also of the wide variety of factors associated with
salary, including detailed information on the backgrounds of individuals and the jobs and
responsibilities they hold. Finally, examining changes in status over time necessitates careful
coding of race/ethnicity to maximize comparability. The National Study of Postsecondary
Faculty (NSOPF) meets these criteria. This section describes the NSOPF data, the specific
subsample used for the analyses, and scheme for categorizing the racial/ethnic groups. It also
provides basic descriptive information about the final sample used in this report.

Introduction
5
The 1999 National Study of Postsecondary Faculty (NSOPF:99) is the third cycle of the
National Study of Postsecondary Faculty conducted by the U.S. Department of Education’s
National Center for Education Statistics (NCES), which collected similar information in 1987–88
and 1992–93. NSOPF:99 is a nationally representative sample of college and university faculty
and instructional staff who were employed by public and private not-for-profit2 postsecondary
degree-granting institutions in fall 1998.3 NSOPF:99 contains data about faculty members’ job
responsibilities, professional backgrounds, salaries, benefits, attitudes, and demographic
characteristics.
Because this report looks at factors that contribute to differences in salary, the analyses are
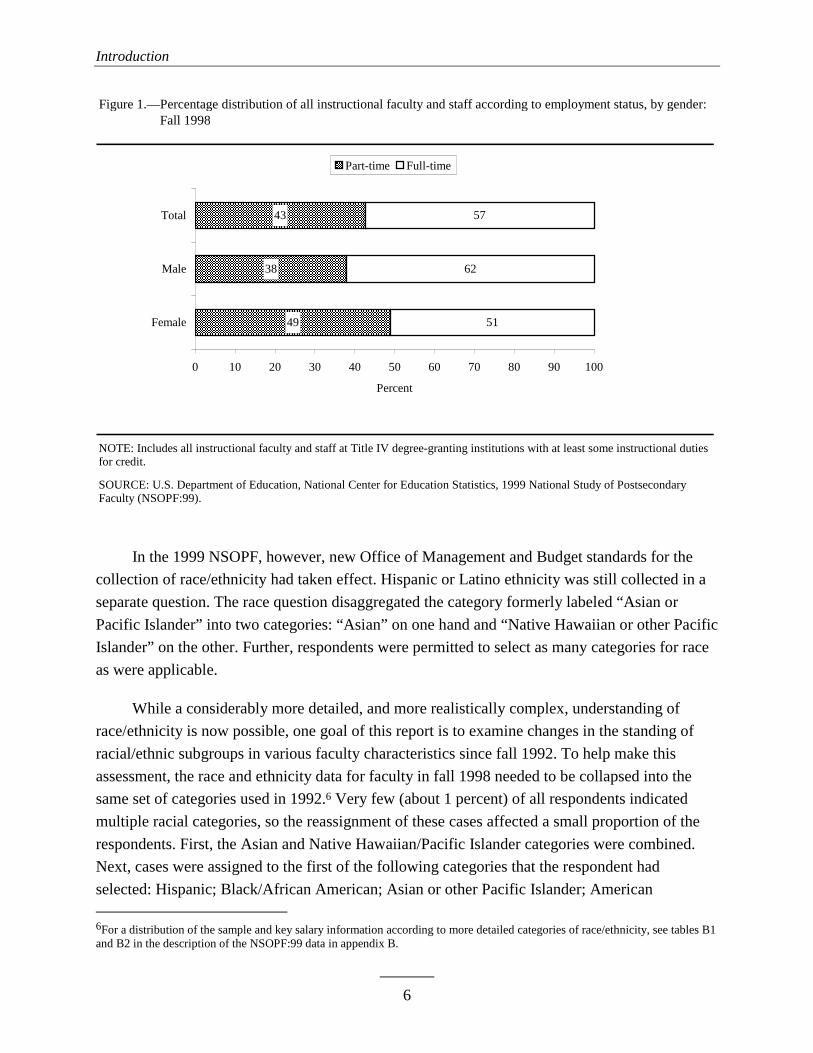
restricted to full-time instructional faculty and staff.4 Employment status itself differs by gender.
Male faculty were more likely than female faculty to be employed full time in fall 1998: 62
percent of men were employed full time, compared with 51 percent of women (figure 1). This
pattern is consistent with differences between men and women in hours worked in the national
workforce generally (U.S. Department of Labor 1999). The fact that men are more likely than
women to work full time may be the result of gender differences in a variety of factors, such as
competing demands on women’s time from family roles, inability to afford child care costs for
full-time work, differences in training and experience, or availability of full-time employment
(Kemp 1994). As with salary, many of the gender differences found in this report would be even
larger if all faculty, including part-time faculty, were included.
Changes in the way data on race are collected in federal data collection efforts were
enacted between the 1993 and 1999 administrations of NSOPF.5 In the earlier survey,
respondents were asked to select from five possible categories the racial group that they felt best
described them: White; Black; Asian/Pacific Islander; American Indian/Alaska Native; or other.
Those who selected “other” were reclassified into one of the other four categories based on
additional information provided, and White or Black respondents who indicated Hispanic or
Latino ethnicity in a separate question were categorized as Hispanic. Thus, the categories for the
primary resulting race/ethnicity variable were as follows: White, non-Hispanic; Black, non-
Hispanic; Hispanic; Asian/Pacific Islander; and American Indian/Alaska Native.
2Private for-profit institutions are not included in the sample. Hence, for brevity, “private” is used here to refer only to privatenot-for-profit institutions. See appendix B for details about the institution sample.3NSOPF:99, conducted in 1999, asked faculty and instructional staff about their activities in fall 1998.4For brevity, the term “faculty” is used interchangeably with instructional faculty and staff. Of the estimated 1,074,000 facultyand instructional staff represented by NSOPF:99 overall, 91 percent, or 976,000, had some instructional duties for credit. Ofthese instructional faculty and staff, about 560,000 were employed full time and 416,000 were employed part time.5Although earlier data are available, because the 1988 sample size was much smaller than the 1993 and 1999 NSOPF samplesand there were differences in how the data were sampled in 1988 versus later years, the analyses for this report were restricted todifferences found between fall 1992 and fall 1998.
Introduction
6
In the 1999 NSOPF, however, new Office of Management and Budget standards for the
collection of race/ethnicity had taken effect. Hispanic or Latino ethnicity was still collected in a
separate question. The race question disaggregated the category formerly labeled “Asian or
Pacific Islander” into two categories: “Asian” on one hand and “Native Hawaiian or other Pacific
Islander” on the other. Further, respondents were permitted to select as many categories for race
as were applicable.
While a considerably more detailed, and more realistically complex, understanding of
race/ethnicity is now possible, one goal of this report is to examine changes in the standing of
racial/ethnic subgroups in various faculty characteristics since fall 1992. To help make this
assessment, the race and ethnicity data for faculty in fall 1998 needed to be collapsed into the
same set of categories used in 1992.6 Very few (about 1 percent) of all respondents indicated
multiple racial categories, so the reassignment of these cases affected a small proportion of the
respondents. First, the Asian and Native Hawaiian/Pacific Islander categories were combined.
Next, cases were assigned to the first of the following categories that the respondent had
selected: Hispanic; Black/African American; Asian or other Pacific Islander; American 6For a distribution of the sample and key salary information according to more detailed categories of race/ethnicity, see tables B1and B2 in the description of the NSOPF:99 data in appendix B.
Figure 1.—Percentage distribution of all instructional faculty and staff according to employment status, by gender:Figure 1.—Fall 1998
NOTE: Includes all instructional faculty and staff at Title IV degree-granting institutions with at least some instructional duties for credit.
SOURCE: U.S. Department of Education, National Center for Education Statistics, 1999 National Study of PostsecondaryFaculty (NSOPF:99).
49
38
43
51
62
57
0 10 20 30 40 50 60 70 80 90 100
Female
Male
Total
Percent
Part-time Full-time
Introduction
7
Indian/Alaska Native; or White.7 Then, Asians or other Pacific Islanders who also indicated they
were of Hispanic or Latino origin and no other race were assigned to the Asian or other Pacific
Islander group, with five categories resulting: non-Hispanic White; non-Hispanic Black or
African American; Asian or other Pacific Islander; Hispanic; and American Indian/Alaska
Native.8
Finally, the number of American Indian/Alaska Native respondents made up only 0.8
percent of the overall sample. Unfortunately, because the group is so small, analyses involving
the comparison of this group to others, particularly if subdivided further, are inadvisable because
the resulting standard errors are very large and very few apparent differences would achieve
statistical significance. For this reason, this report excludes the American Indian/Alaska Native
category from analysis, though estimates for this group are shown in the tables.
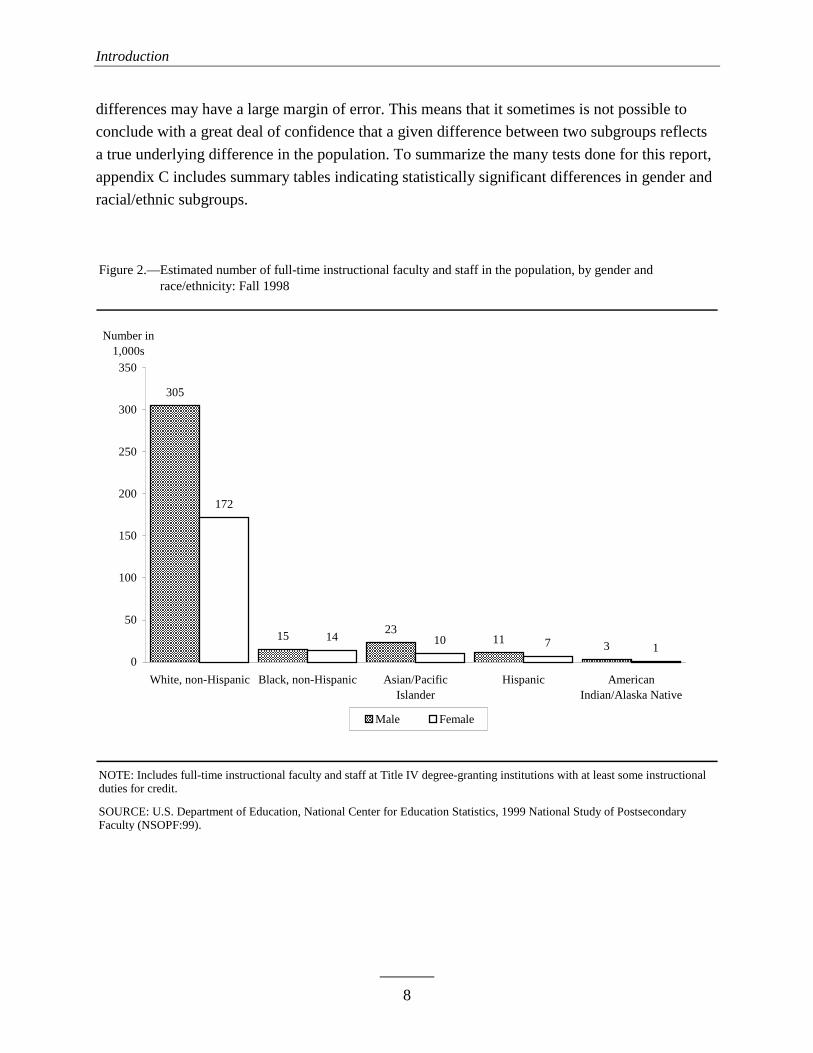
The estimated size of the population of full-time instructional faculty and staff in fall 1998
was approximately 560,000 (figure 2). Full-time instructional faculty included 305,000 White
males, 172,000 White females, 23,000 Asian/Pacific Islander males, 10,000 Asian/Pacific
Islander females, 15,000 Black males, 14,000 Black females, 11,000 Hispanic males, 7,000
Hispanic females, 3,000 American Indian males, and 1,000 American Indian females. Among all
full-time instructional faculty and staff, 64 percent were male and 36 percent were female (figure
3). Black faculty were more likely than Asian or White faculty to be female (48 percent versus
30 and 36 percent, respectively).9 As indicated by the estimated population totals, non-Hispanic
White faculty constituted the largest racial/ethnic group among full-time faculty (figure 4).
Eighty-five percent of full-time faculty were White, compared with 6 percent Asian/Pacific
Islander, 5 percent Black, 3 percent Hispanic, and 1 percent American Indian.
Some of the analyses conducted in this report should be interpreted with caution. Many of
the eight racial/ethnic/gender subgroups considered here constitute a small proportion of the
population of instructional faculty and staff. Because these populations are small, Blacks, Asians,
and Hispanics were oversampled in NSOPF:99 to try to minimize the variances for these groups.
Nevertheless, the standard errors associated with estimates for these groups are sometimes quite
large. This means that the likely range of possible true values for such estimates is
correspondingly large; that is, one can be less sure of the precision of the estimates that result
from these small samples. When making comparisons between two groups, even seemingly large
7Apart from the Hispanic group, the order of the other groups was based on their size in the general population, assigning them tothe largest (minority) group first.8Throughout the report, the following terms are used interchangeably: “White” and “White, non-Hispanic”; “Black” and “Black,non-Hispanic”; and “Asian” and “Asian/Pacific Islander.”9While it appears that Black faculty were more likely to be female than Hispanic faculty (38 percent) as well, the standard errorswere large and no statistically significant difference was detected.
Introduction
8
differences may have a large margin of error. This means that it sometimes is not possible to
conclude with a great deal of confidence that a given difference between two subgroups reflects
a true underlying difference in the population. To summarize the many tests done for this report,
appendix C includes summary tables indicating statistically significant differences in gender and
racial/ethnic subgroups.
Figure 2.—Estimated number of full-time instructional faculty and staff in the population, by gender and Figure 2.—race/ethnicity: Fall 1998
NOTE: Includes full-time instructional faculty and staff at Title IV degree-granting institutions with at least some instructional duties for credit.
SOURCE: U.S. Department of Education, National Center for Education Statistics, 1999 National Study of PostsecondaryFaculty (NSOPF:99).
305
2311
3
172
14 10 7 115
0
50
100
150
200
250
300
350
White, non-Hispanic Black, non-Hispanic Asian/PacificIslander
Hispanic AmericanIndian/Alaska Native
Number in 1,000s
Male Female

Introduction
9
Organization of This Report
The remainder of this report is organized as follows. The next section describes gender
differences among postsecondary faculty, beginning with a discussion of overall differences
between male and female faculty. Then, gender differences are considered separately for each
racial/ethnic group. The subsequent section takes a similar approach to exploring racial/ethnic
differences. First, overall racial/ethnic differences are explored, comparing White faculty to
Asian, Black, and Hispanic faculty in turn, and then racial/ethnic differences among men and
women are described. Next, the results of a regression analysis are presented. This analysis
examines characteristics associated with salary for full-time instructional faculty and staff,
focusing on whether gender and racial/ethnic differences in salary are found after controlling for
characteristics of faculty and their jobs. The report concludes by examining how the standing of
various subgroups of faculty by race/ethnicity and gender changed between fall 1992 and fall
1998 in terms of selected key characteristics.
Figure 3.—Percentage distribution of full-time instructional faculty and staff according to gender, by race/ethnicity:Figure 3.—Fall 1998
NOTE: Includes full-time instructional faculty and staff at Title IV degree-granting institutions with at least some instructional duties for credit. Included in total but not shown separately are American Indian/Alaska Native faculty.
SOURCE: U.S. Department of Education, National Center for Education Statistics, 1999 National Study of PostsecondaryFaculty (NSOPF:99).
62
52
64
38
30
48
36
64
70
36
0 10 20 30 40 50 60 70 80 90 100
Hispanic
Asian/Pacific Islander
Black, non-Hispanic
White, non-Hispanic
Total
Percent
Male Female

Introduction
10
Figure 4.—Percentage distribution of full-time instructional faculty and staff across racial/ethnic groups: Fall 1998
NOTE: Includes full-time instructional faculty and staff at Title IV degree-granting institutions with at least some instructional duties for credit.
SOURCE: U.S. Department of Education, National Center for Education Statistics, 1999 National Study of PostsecondaryFaculty (NSOPF:99).
White,non-Hispanic
85%
Asian/Pacific Islander
6%
American Indian/Alaska Native
1%
Hispanic3%
Black,non-Hispanic
5%

11
Gender Differences Among Full-Time Instructional Facultyand Staff
Salary Differences in 1998
Gender differences in salaries for full-time faculty are among the most persistent
differences among faculty (Bell 2001), and this observation was confirmed in fall 1998. Overall,
men’s salaries were about 28 percent10 higher than women’s salaries: full-time male faculty
averaged about $61,700 in base salary from the institution in 1998, compared with $48,400 for
full-time female faculty (table 1 and figure 5; tables begin on page 41). Furthermore, men’s
salary advantage was found among White, Asian, Black, and Hispanic faculty as well. Of course,
many factors determine the salaries that faculty members receive, and men and women have
differed with respect to many of these characteristics in the past (Nettles, Perna, and Bradburn
2000). The next section describes the extent to which gender differences were found in such
factors in fall 1998.
Overall Gender Differences in Other Faculty Characteristics
Overall, gender differences among instructional faculty and staff were prevalent in fall
1998. To begin with, the structural locations of men and women differed. Men were more likely
than women to work at public doctoral institutions,11 although no differences were found in the
proportions of men and women employed at public comprehensive institutions (table 2). Women
were more likely to work at public 2-year colleges: while 14 percent of men were employed at
community colleges, one-quarter of women worked at such institutions. Consistent with these
differences, men were also more likely than women to teach graduate students (table 3). Gender
differences in teaching field that have been observed elsewhere were also evident: men were
more likely than women to teach in the natural sciences and engineering (30 percent versus 15
percent), while women were more likely to teach in the health sciences or in the social sciences
and education (table 4).
10This percentage difference in salary was calculated as follows: $61,680 (male average salary) – $48,370 (female averagesalary) = $13,310 (salary difference) / $48,370 = 0.28 x 100 = 28 percent salary difference.11This group includes public research, doctoral, and medical institutions.

Gender Differences Among Full-Time Instructional Faculty and Staff
12
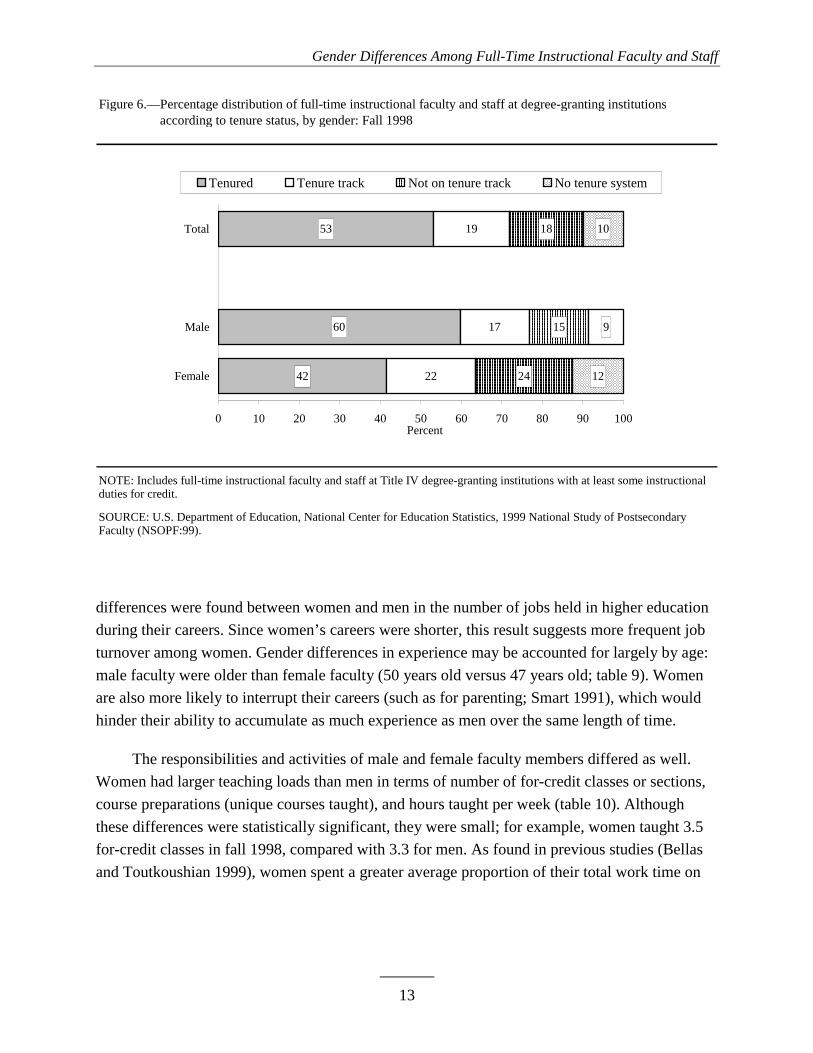
Finally, men held higher ranks and were more likely than women to have tenure. Men were
much more likely than women to be full professors (38 versus 18 percent), while women were
more likely to be assistant professors or instructors, lecturers, or other unspecified ranks (table
5). Sixty percent of men, compared with 42 percent of women, had tenure (table 6 and figure 6).
Women were more likely than men to be in tenure-track jobs (22 versus 17 percent) or to have
jobs that were not on the tenure track (24 versus 15 percent).
Of course, rank and tenure are largely determined by faculty members’ education and
experience, areas in which men showed a considerable advantage over women. While about
three-quarters (74 percent) of men held doctoral or first-professional degrees, 54 percent of
women did so (table 7). Women were more likely than men to have completed their education
with a master’s degree—39 compared with 22 percent. Men had held their highest degrees for
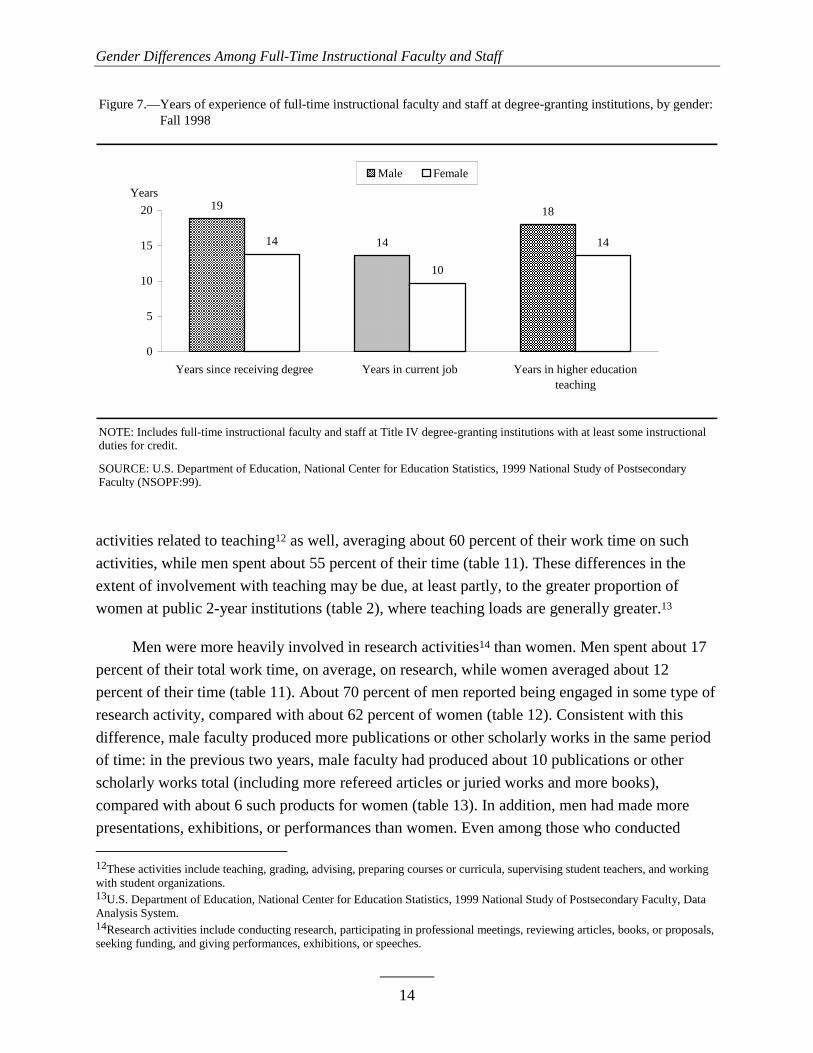
longer periods of time than women, on average (table 7), and also had been teaching longer, both
in their current jobs and in higher education overall (table 8 and figure 7). On the other hand, no
Figure 5.—Base salary of full-time instructional faculty and staff at degree-granting institutions, by gender and race/Figure 5.—ethnicity: Calendar year 1998
NOTE: Includes full-time instructional faculty and staff at Title IV degree-granting institutions with at least some instructional duties for credit. Refers to base salary during calendar year 1998 received from the institution at which the respondent was sampled. Dollar figures are rounded to the nearest 10. Included in total but not shown separately are American Indian/Alaska Native faculty.
SOURCE: U.S. Department of Education, National Center for Education Statistics, 1999 National Study of PostsecondaryFaculty (NSOPF:99).
$61,950$53,640
$66,350$58,990$61,680
$46,890$54,690
$46,870$48,200$48,370
$0
$10,000
$20,000
$30,000
$40,000
$50,000
$60,000
$70,000
$80,000
$90,000
$100,000
Total White, non-Hispanic
Black, non-Hispanic
Asian/Pacific Islander
Hispanic
Salary Male Female
Gender Differences Among Full-Time Instructional Faculty and Staff
13
differences were found between women and men in the number of jobs held in higher education
during their careers. Since women’s careers were shorter, this result suggests more frequent job
turnover among women. Gender differences in experience may be accounted for largely by age:
male faculty were older than female faculty (50 years old versus 47 years old; table 9). Women
are also more likely to interrupt their careers (such as for parenting; Smart 1991), which would
hinder their ability to accumulate as much experience as men over the same length of time.
The responsibilities and activities of male and female faculty members differed as well.
Women had larger teaching loads than men in terms of number of for-credit classes or sections,
course preparations (unique courses taught), and hours taught per week (table 10). Although
these differences were statistically significant, they were small; for example, women taught 3.5
for-credit classes in fall 1998, compared with 3.3 for men. As found in previous studies (Bellas
and Toutkoushian 1999), women spent a greater average proportion of their total work time on
Figure 6.—Percentage distribution of full-time instructional faculty and staff at degree-granting institutionsFigure 6.—according to tenure status, by gender: Fall 1998
NOTE: Includes full-time instructional faculty and staff at Title IV degree-granting institutions with at least some instructional duties for credit.
SOURCE: U.S. Department of Education, National Center for Education Statistics, 1999 National Study of PostsecondaryFaculty (NSOPF:99).
42
53
22
17
19
24
15
18
12
9
10
60
0 10 20 30 40 50 60 70 80 90 100
Female
Male
Total
Percent
Tenured Tenure track Not on tenure track No tenure system
Gender Differences Among Full-Time Instructional Faculty and Staff
14
activities related to teaching12 as well, averaging about 60 percent of their work time on such
activities, while men spent about 55 percent of their time (table 11). These differences in the
extent of involvement with teaching may be due, at least partly, to the greater proportion of
women at public 2-year institutions (table 2), where teaching loads are generally greater.13
Men were more heavily involved in research activities14 than women. Men spent about 17
percent of their total work time, on average, on research, while women averaged about 12
percent of their time (table 11). About 70 percent of men reported being engaged in some type of
research activity, compared with about 62 percent of women (table 12). Consistent with this
difference, male faculty produced more publications or other scholarly works in the same period
of time: in the previous two years, male faculty had produced about 10 publications or other
scholarly works total (including more refereed articles or juried works and more books),
compared with about 6 such products for women (table 13). In addition, men had made more
presentations, exhibitions, or performances than women. Even among those who conducted
12These activities include teaching, grading, advising, preparing courses or curricula, supervising student teachers, and workingwith student organizations.13U.S. Department of Education, National Center for Education Statistics, 1999 National Study of Postsecondary Faculty, DataAnalysis System.14Research activities include conducting research, participating in professional meetings, reviewing articles, books, or proposals,seeking funding, and giving performances, exhibitions, or speeches.
Figure 7.—Years of experience of full-time instructional faculty and staff at degree-granting institutions, by gender:Figure 7.—Fall 1998
NOTE: Includes full-time instructional faculty and staff at Title IV degree-granting institutions with at least some instructional duties for credit.
SOURCE: U.S. Department of Education, National Center for Education Statistics, 1999 National Study of PostsecondaryFaculty (NSOPF:99).
19
14
18
14
10
14
0
5
10
15
20
Years since receiving degree Years in current job Years in higher educationteaching
Years
Male Female

Gender Differences Among Full-Time Instructional Faculty and Staff
15
research, men and women differed in the type of research they did (table 14). Perhaps partly
because of their concentration in science and engineering fields, men are more likely than
women to be engaged in funded research (table 12), and to be doing basic or applied/policy-
oriented research, while women are more likely to be doing research in other areas (table 14).
Gender Differences by Racial/Ethnic Group
Virtually all of the gender differences described in the previous section were found among
non-Hispanic Whites, by far the largest racial/ethnic group of faculty (figure 4). Were the overall
gender differences also found among the other racial/ethnic groups? This section describes
gender differences separately for each of the other racial/ethnic groups. Appendix figure C1
summarizes which gender differences were detected for faculty overall as well as gender
differences for each racial/ethnic group separately, including White faculty.
Gender Differences Among Asian/Pacific Islander Faculty
Most of the gender differences found among faculty overall were also observed among
Asian/Pacific Islander faculty. For example, differences in structural characteristics followed the
pattern observed among White faculty. Asian male faculty were more likely than their female
counterparts to teach at public doctoral universities; in fact, about one-half (51 percent) of Asian
male faculty taught at these institutions, while 37 percent of Asian female faculty did so (table
2). On the other hand, 21 percent of Asian women taught at public 2-year colleges, compared
with 6 percent of Asian men. Perhaps partly because of these differences, Asian women were
more likely than Asian men to teach only undergraduates (table 3). Asian men were more likely
than Asian women to teach in the natural sciences and engineering, while Asian women were
more likely than their male colleagues to teach in the social sciences and education (table 4).
Finally, tenure and academic rank also differed by gender for Asian faculty. Asian men were
more likely than Asian women to be full professors (31 versus 13 percent), and they were less
likely to hold instructor, lecturer, or other unspecified ranks (11 versus 32 percent; table 5).
While 54 percent of Asian male faculty had tenure, 37 percent of Asian female faculty did, and
Asian women were more likely to have jobs not on the tenure track (table 6).
The education and experience of Asian faculty differed by gender in ways that resembled
the pattern for White faculty as well. While 90 percent of Asian men had doctoral or first-
professional degrees, about 72 percent of Asian women did (table 7). Asian women were more
likely than Asian men not to hold a degree more advanced than a master’s degree (27 versus 9
percent). Like Whites, Asian men had held their highest degrees for a longer period of time than
Asian women, and they had been in higher education longer, both in their current jobs and
Gender Differences Among Full-Time Instructional Faculty and Staff
16
overall (table 8). Asian men were older than their female counterparts, on average (table 9). As
among White faculty, no gender difference was detected among Asian/Pacific Islander faculty in
the number of higher education jobs they had held (table 8).
Unlike the pattern among White faculty, few differences were found in the teaching
responsibilities of Asian male and female faculty. Although Asian women spent a larger average
proportion of their total work time in teaching activities than men (56 percent versus 49 percent;
table 11), no significant differences were detected in the number of classes and course
preparations and the number of hours spent teaching each week (table 10).
While differences in teaching activities were not found, Asian men were more involved in
research activities than Asian women. Asian male faculty reported that they spent about 27
percent of their time in research or scholarly activities, on average, compared with an average of
19 percent for Asian female faculty (table 11). While 83 percent of Asian male faculty did
research, about 70 percent of Asian female faculty did so (table 12). Men had produced more
publications in the previous 2 years: an average of 13 total publications or permanent creative
works, compared with an average of 6 such products among the women, including more refereed
articles or juried works and more books (table 13). Asian men had also made more presentations
and performances during that period. Among those who did research, Asian men were more
likely to be engaged in applied or policy-oriented research, while Asian women’s research was
more likely to be in other areas such as program or curriculum design and development (table
14).
In summary, the structural characteristics, education and experience, and research activities
differed along gender lines for Asian faculty in ways that resembled the patterns for White
faculty. Asian males were more heavily concentrated in higher-paying fields and institutions, had
more experience, and were more involved in research than were their female counterparts.
However, no differences were detected in the teaching activities of male and female Asian
faculty.
Gender Differences Among Black/African American Faculty
Overall, fewer gender differences were found among Black or African American faculty.15
Nevertheless, many of the structural characteristics did vary for Black female and male faculty.
For example, Black women were more likely than Black men to be employed at community
colleges—26 compared with 17 percent (table 2). Teaching fields also differed along gender
lines, with men being more likely to teach in the natural sciences and engineering and women
15For brevity, the term “Black” is used throughout to refer to non-Hispanic Black or African American faculty.
Gender Differences Among Full-Time Instructional Faculty and Staff
17
being more likely to teach in the health sciences or social sciences and education (table 4). Black
men were more likely than Black women to be full professors or have tenure (tables 5 and 6),
and women were more likely than men to be instructors or lecturers or to have other unspecified
ranks. However, no significant difference was found in the level of instruction provided by Black
men and women: about 73–74 percent taught only undergraduates, 11–13 percent taught only
graduate students, and the remainder taught at both levels (table 3).
Like both Asian and White faculty, Black male faculty tended to have more education and
experience than their female colleagues. While 63 percent of Black men held doctoral or first-
professional degrees, about one-half (51 percent) of Black women did so, and women were more
likely than men to have no more than a master’s degree (table 7). Black men had held their
highest degrees longer and also had been employed in higher education longer (table 8). Black
men were, on average, 50 years of age, compared with an average age of about 47 for Black
women (table 9).
Many of the gender differences found in the teaching responsibilities and other job
activities of White and Asian faculty in fall 1998 were not found among Black faculty. No
significant differences were found between Black men and women in the average proportion of
time they reported spending on teaching activities (58–60 percent; table 11), the number of
classes and course preparations, or weekly teaching hours (table 10). Unlike the gender
differences detected among Whites and Asians, no significant differences were detected between
Black men and women in the average percentage of time spent engaged in research activities
(10–11 percent; table 11) or the percentage of Black men and women involved in research (67
and 62 percent, respectively; table 12). Among those engaged in research, no significant
differences were observed in the proportions doing funded research or different types of research
(tables 12 and 14). Yet Black men had produced more total publications or other permanent
creative works in the previous 2 years than Black women had: about eight for Black men,
compared with five for Black women, on average (table 13). This difference included a larger
number of refereed articles or juried works for Black men than Black women, although no
difference was detected in the number of books published during that time. Black men had also
produced more presentations or performances during the previous 2 years.
In summary, differences between male and female Black faculty were consistent with
overall gender differences in many structural characteristics and in education and experience.
Yet many gender differences in teaching and research responsibilities found among all faculty
were not observed among Black faculty. Even so, Black men still had more recent scholarly
works than Black women. One possible explanation for this result is that women’s research
efforts are less concentrated, perhaps subject to more interruptions and distractions from other

Gender Differences Among Full-Time Instructional Faculty and Staff
18
demands on their attention such as family roles. Alternatively, Bellas (1999) suggests that the
self-promotional work of publishing and networking to generate research is more fostered and
respected in men than in women.
Gender Differences Among Hispanic Faculty
Few of the gender differences found in the racial/ethnic groups considered so far were
observed among Hispanic faculty. For example, unlike all of the other racial/ethnic groups
considered here, no differences were found in the distribution of male and female Hispanic
faculty across institution types (table 2). Approximately one-third of both male and female
Hispanic faculty were employed at public doctoral universities (34 and 36 percent, respectively),
and approximately one-quarter of male and female Hispanic faculty were employed at public 2-
year institutions (24 and 28 percent, respectively). Also, while Hispanic men were more likely
than Hispanic women to teach in the natural sciences and engineering (29 versus 13 percent,
table 4), no significant difference was detected in the proportions of Hispanic men and women in
the health sciences and in social science and education. Yet in terms of tenure and academic
rank, Hispanic male faculty were more likely than their female counterparts to be among the
ranks of senior faculty: men were more likely than women to have tenure (56 versus 36 percent;
table 6) and to be full professors (31 versus 15 percent; table 5).
Consistent with the results found for White, Asian, and Black faculty, Hispanic male
faculty were much more likely than Hispanic female faculty to have doctoral or first-professional
degrees (70 versus 54 percent), and much less likely to have a master’s degree as their highest
degree (24 versus 39 percent; table 7). However, while Hispanic men had been in their current
jobs longer than Hispanic women, on average (10 versus 7 years; table 8), no significant
differences were found in the length of time since they had received their highest degree (table
7), the length of time they had taught in higher education (table 8), or their age (table 9). Thus,
several gender differences in overall teaching experience found among other racial/ethnic groups
were not observed among Hispanic faculty.
There were some differences in the research involvement of Hispanic male and female
faculty, but not in their teaching involvement. Hispanic men were more likely than Hispanic
women to be engaged in research (73 versus 57 percent; table 12), although no significant gender
differences were detected in the average proportion of total work time spent on research
activities (table 11). While Hispanic men had produced more total publications or other
permanent creative works in the previous 2 years (nine versus six publications; table 13),
Hispanic faculty were the only group for which no significant gender difference was found in the
number of refereed articles or juried works produced or presentations made during that period.
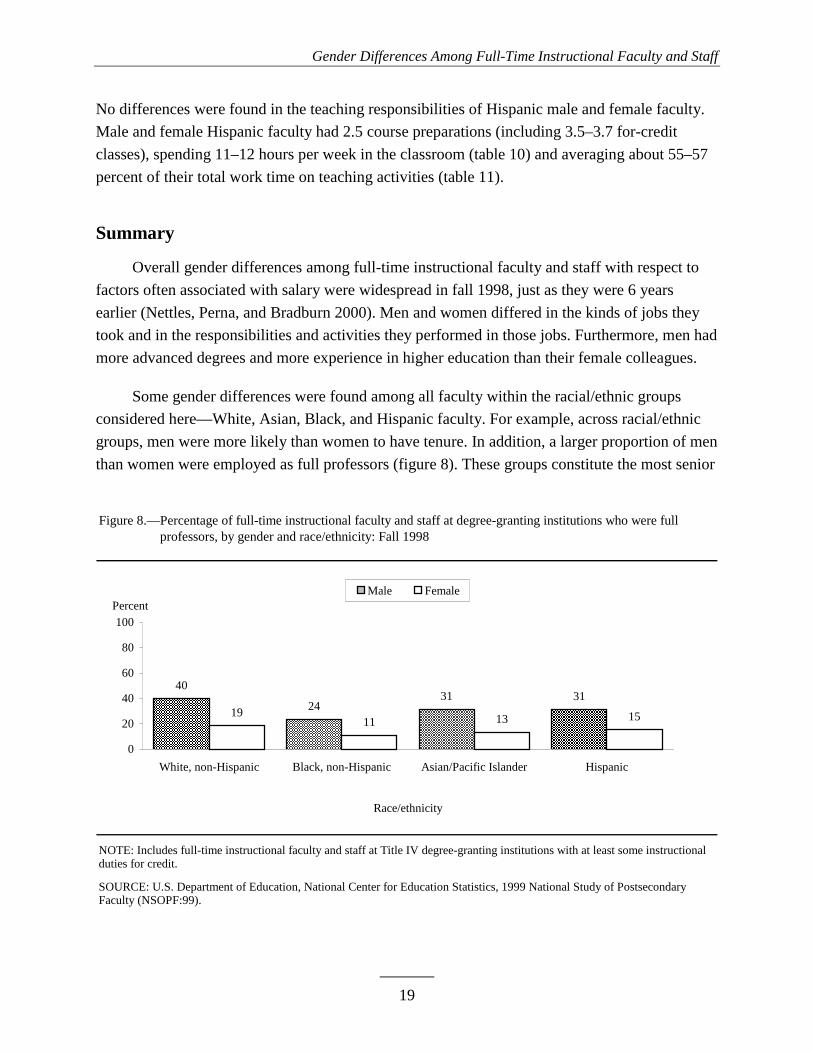
Gender Differences Among Full-Time Instructional Faculty and Staff
19
No differences were found in the teaching responsibilities of Hispanic male and female faculty.
Male and female Hispanic faculty had 2.5 course preparations (including 3.5–3.7 for-credit
classes), spending 11–12 hours per week in the classroom (table 10) and averaging about 55–57
percent of their total work time on teaching activities (table 11).
Summary
Overall gender differences among full-time instructional faculty and staff with respect to
factors often associated with salary were widespread in fall 1998, just as they were 6 years
earlier (Nettles, Perna, and Bradburn 2000). Men and women differed in the kinds of jobs they
took and in the responsibilities and activities they performed in those jobs. Furthermore, men had
more advanced degrees and more experience in higher education than their female colleagues.
Some gender differences were found among all faculty within the racial/ethnic groups
considered here—White, Asian, Black, and Hispanic faculty. For example, across racial/ethnic
groups, men were more likely than women to have tenure. In addition, a larger proportion of men
than women were employed as full professors (figure 8). These groups constitute the most senior
Figure 8.—Percentage of full-time instructional faculty and staff at degree-granting institutions who were fullFigure 8.—professors, by gender and race/ethnicity: Fall 1998
NOTE: Includes full-time instructional faculty and staff at Title IV degree-granting institutions with at least some instructional duties for credit.
SOURCE: U.S. Department of Education, National Center for Education Statistics, 1999 National Study of PostsecondaryFaculty (NSOPF:99).
40
2431 31
1911 13 15
0
20
40
60
80
100
White, non-Hispanic Black, non-Hispanic Asian/Pacific Islander Hispanic
Race/ethnicity
PercentMale Female

Gender Differences Among Full-Time Instructional Faculty and Staff
20
faculty, and the overall greater levels of experience among men are consistent with their
representation at this level. Other factors that differ consistently by gender across racial/ethnic
groups, however, are not necessarily dependent on length of service, and they contribute to
faculty’s advancement to senior status as well. For example, across all racial/ethnic groups, a
larger proportion of male than female faculty had doctoral or first-professional degrees, and men
had produced more total publications or other permanent creative works in the previous 2 years
than women (figure 9).
There were also some variations in the gender differences detected across racial/ethnic
groups. Appendix figure C1 summarizes the gender differences found among all of the factors
considered in this report, including both overall gender differences and differences within
racial/ethnic groups. Gender differences among non-Hispanic White faculty were found on
nearly all factors considered in this analysis. Most of the same differences, except for teaching
responsibilities, were found among Asian/Pacific Islander faculty. Among Black faculty, men
had more education, experience, and research productivity than women, and some differences in
the type of institution, teaching field, academic rank, and tenure status were evident, although
generally no gender differences were found in research and teaching activities. Unlike other
Figure 9.—Number of recent publications or other permanent creative works of full-time instructional faculty and Figure 9.—staff at degree-granting institutions, by gender and race/ethnicity: Fall 1998
NOTE: Includes full-time instructional faculty and staff at Title IV degree-granting institutions with at least some instructional duties for credit. Refers to publications or other permanent creative works, such as books, journal articles, and art works shown in juried media, produced in the previous 2 years.
SOURCE: U.S. Department of Education, National Center for Education Statistics, 1999 National Study of PostsecondaryFaculty (NSOPF:99).
108
13
9
6 56 6
0
5
10
15
White, non-Hispanic Black, non-Hispanic Asian/Pacific Islander Hispanic
Race/ethnicity
Number ofworks
Male Female

Gender Differences Among Full-Time Instructional Faculty and Staff
21
groups, Hispanic faculty displayed very few gender differences. For example, no differences
between Hispanic men and women were detected in the proportions employed in different types
of institutions or in the amount of overall work experience in higher education. Even among
Hispanics, however, men were more likely than women to have senior faculty positions and to
produce more total publications or other permanent creative works.

THIS PAGE INTENTIONALLY LEFT BLANK

23
Racial/Ethnic Differences Among Full-Time Faculty
Nettles, Perna, and Bradburn (2000) noted that racial/ethnic differences among
instructional faculty and staff in 1992 were very complex and somewhat idiosyncratic; they were
difficult to summarize, depending on the individual indicator and comparison being made. The
analysis for fall 1998, which makes racial/ethnic comparisons separately for men and women,
confirms this observation. Racial/ethnic differences were more often found among male faculty
than among female faculty. When they did occur, there were more differences between Whites
and Asians than between Whites and Blacks, and there were relatively few differences between
Whites and Hispanics. In some cases, small sample sizes and large standard errors meant that
apparent differences were not always statistically significant.
Salary Differences in 1998
Overall, the faculty salaries of Asians or other Pacific Islanders were higher than those of
Whites, which were higher than those of Blacks (table 1). In 1998, full-time White faculty
averaged about $57,000 in base salary from the institution, compared with $62,800 for Asian
faculty and $50,400 for Black faculty. No salary difference was found between Hispanic faculty,
who earned about $54,400 on average, and White faculty. Among males, Black faculty salaries
($53,600) were lower than those of Whites ($62,000), and among females, Asian faculty salaries
($54,700) were higher than those of Whites ($48,200). No significant salary differences were
detected between Hispanic and White faculty among either males or females.
Overall Racial/Ethnic Differences in Other Faculty Characteristics
Overall Differences Between Asian/Pacific Islander and White Faculty
The structural locations of Asian/Pacific Islander faculty differed from those of White
faculty in several ways. Asian/Pacific Islander faculty were more likely to teach at public
doctoral universities16 and less likely to teach at public 2-year institutions (table 2). Asians were
less likely than Whites to teach undergraduates only (56 versus 67 percent) and more likely to
teach both graduate and undergraduate students (23 versus 16 percent; table 3). At 42 percent,
16These institutions include public research, doctoral, and medical institutions.
Racial/Ethnic Differences Among Full-Time Faculty
24
the proportion of Asian faculty teaching in the natural sciences and engineering was larger than
the proportion of White faculty in the field (24 percent; table 4). No significant differences were
found in the proportions of Asian and White faculty in the health sciences and social sciences.
While Asians were less likely than Whites to be full professors (26 versus 32 percent), they were
more likely to be assistant professors and less likely to be instructors, lecturers, or other
unspecified academic ranks (table 5). Approximately one-half of Asian and White faculty had
tenure (49 and 54 percent, respectively), but Asians were more likely than Whites to hold tenure-
track positions (30 versus 17 percent; table 6).
The education and experience of faculty and staff members are associated with their rank
and tenure. Asian or Pacific Islander faculty held more doctoral degrees than White faculty, but
Whites had higher levels of experience. While 85 percent of Asian faculty held doctoral or first-
professional degrees, 67 percent of White faculty did so (table 7). Although Asians were also
less likely than Whites to have completed their education with a master’s degree, White faculty
reported greater experience along each experience indicator tested. White faculty reported both
holding their current jobs longer than Asian faculty (table 8), and earning their highest degrees
earlier (table 7). White faculty earned their degrees an average of 17 years before fall 1998,
while Asians reported earning their highest degrees an average of 14 years before. These varying
levels of experience were also reflected in the average age of White and Asian faculty (table 9).
White faculty were older than Asian faculty, on average (50 versus 46 years). However, while
White faculty reported longer careers in higher education than Asian faculty (17 versus 13
years), both groups had held about three jobs in the field (table 8).
Asians and Whites also reported differing levels of teaching and research activities. In
general, Asian faculty devoted a higher average proportion of their time (24 percent) to research
and a smaller average proportion to teaching (51 percent) than White faculty (15 percent and 57
percent, respectively; table 11). While no difference was found in the average number of classes
taught by Asian and White faculty, Asian faculty did report fewer course preparations (table 10).
Conversely, the proportion of Asian faculty doing research was higher than that of Whites (79
versus 66 percent; table 12). Among those who reported doing research, the proportions of Asian
faculty doing funded research and basic research were also higher than the proportions of White
faculty involved in such research (tables 12 and 14). Finally, Asian faculty reported producing
more total publications or other permanent creative works (including refereed or juried works) in
the previous 2 years than Whites, but no differences were found between the two groups in the
numbers of books published or in the number of presentations and performances made during
that time (table 13).
Racial/Ethnic Differences Among Full-Time Faculty
25
In summary, nearly one-half (47 percent) of Asian faculty taught at public doctoral
institutions, and another 14 percent at private not-for-profit doctoral institutions, while 11
percent taught at public 2-year colleges (table 2). One-quarter (26 percent) of Asian faculty were
full professors (table 5); about one-half (49 percent) were tenured with another 30 percent on the
tenure track (table 6), and they had been in their current jobs an average of about 10 years (table
8). A large majority (85 percent) had doctoral or first-professional degrees (table 7). About two
out of five (42 percent) Asian faculty taught in the natural sciences and engineering (table 4).
Asian faculty spent an average of about one-half (51 percent) of their total work time on teaching
activities (table 11), teaching about three for-credit classes (table 10). An average of 25 percent
of their work time was spent on research activities (table 11), with about four out of five faculty
members (79 percent) engaged in some research (table 12). Those research activities had yielded
an average of 11 total publications or other permanent creative works in the previous 2 years,
including 6 articles or works in refereed media and one book (table 13).
Overall Differences Between Black and White Faculty
White faculty were more likely than Black faculty to teach at public doctoral universities
(35 versus 23 percent; table 2), but no difference was found in the proportion of White and Black
faculty teaching at public 2-year institutions. No significant difference from White faculty was
detected for Black faculty in level of instruction (table 3). Also, Blacks were less likely than
Whites to teach in the natural sciences and engineering but were more likely to teach in the
social sciences (table 4). Black faculty, like Asian faculty, were less likely than White faculty to
be full professors but were more likely to be assistant professors (table 5). Black faculty were
also less likely than White faculty to hold tenure (44 versus 54 percent) and more likely to hold a
tenure-track position (26 versus 17 percent; table 6).
The education and experience of Black and White faculty members differed as well. Black
faculty were less likely to hold doctoral or first-professional degrees (57 versus 67 percent) and
were more likely to hold a master’s degree as their highest degree earned (39 versus 28 percent;
table 7). Furthermore, White faculty reported receiving their highest degrees earlier than Black
faculty did. White faculty had more experience teaching as well, both in their current jobs and in
higher education overall (table 8). However, both Black and White faculty were about 49–50
years of age, on average (table 9).
In general, few differences were detected between Black and White faculty across teaching
and research activities. Black faculty reported teaching more for-credit classes on average than
White faculty, but differences were not found in the number of course preparations or hours
spent in the classroom (table 10) or in the average proportion of total work time devoted to
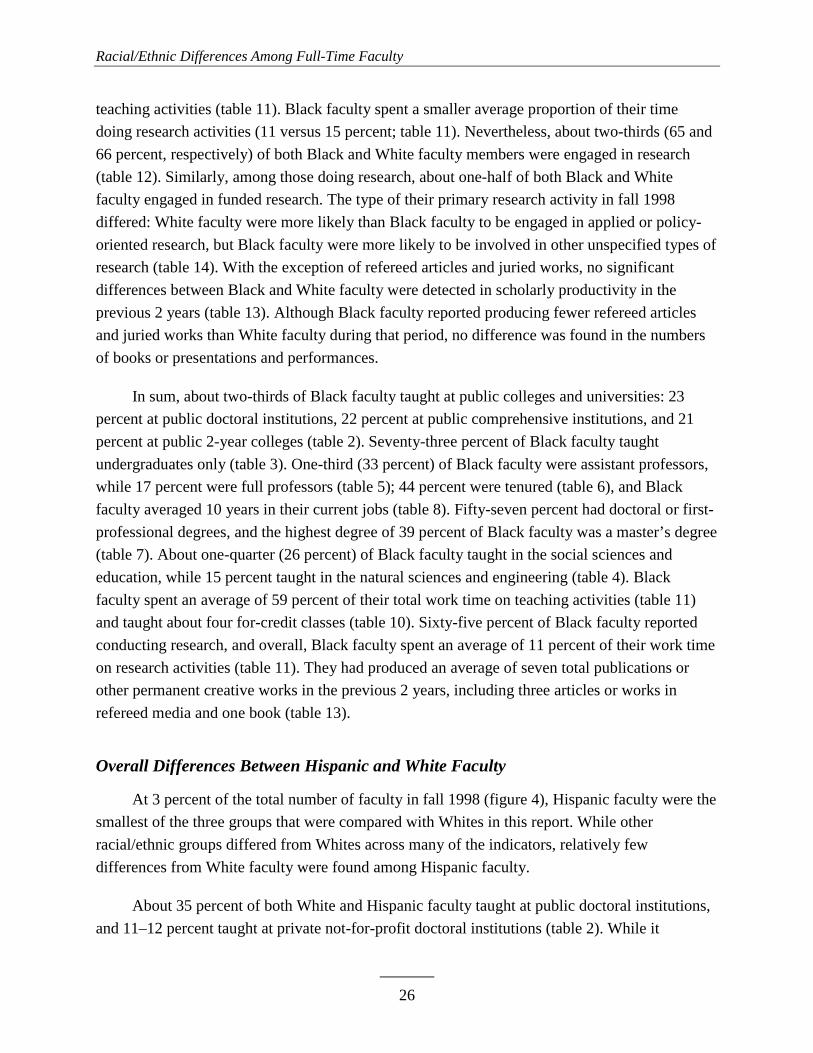
Racial/Ethnic Differences Among Full-Time Faculty
26
teaching activities (table 11). Black faculty spent a smaller average proportion of their time
doing research activities (11 versus 15 percent; table 11). Nevertheless, about two-thirds (65 and
66 percent, respectively) of both Black and White faculty members were engaged in research
(table 12). Similarly, among those doing research, about one-half of both Black and White
faculty engaged in funded research. The type of their primary research activity in fall 1998
differed: White faculty were more likely than Black faculty to be engaged in applied or policy-
oriented research, but Black faculty were more likely to be involved in other unspecified types of
research (table 14). With the exception of refereed articles and juried works, no significant
differences between Black and White faculty were detected in scholarly productivity in the
previous 2 years (table 13). Although Black faculty reported producing fewer refereed articles
and juried works than White faculty during that period, no difference was found in the numbers
of books or presentations and performances.
In sum, about two-thirds of Black faculty taught at public colleges and universities: 23
percent at public doctoral institutions, 22 percent at public comprehensive institutions, and 21
percent at public 2-year colleges (table 2). Seventy-three percent of Black faculty taught
undergraduates only (table 3). One-third (33 percent) of Black faculty were assistant professors,
while 17 percent were full professors (table 5); 44 percent were tenured (table 6), and Black
faculty averaged 10 years in their current jobs (table 8). Fifty-seven percent had doctoral or first-
professional degrees, and the highest degree of 39 percent of Black faculty was a master’s degree
(table 7). About one-quarter (26 percent) of Black faculty taught in the social sciences and
education, while 15 percent taught in the natural sciences and engineering (table 4). Black
faculty spent an average of 59 percent of their total work time on teaching activities (table 11)
and taught about four for-credit classes (table 10). Sixty-five percent of Black faculty reported
conducting research, and overall, Black faculty spent an average of 11 percent of their work time
on research activities (table 11). They had produced an average of seven total publications or
other permanent creative works in the previous 2 years, including three articles or works in
refereed media and one book (table 13).
Overall Differences Between Hispanic and White Faculty
At 3 percent of the total number of faculty in fall 1998 (figure 4), Hispanic faculty were the
smallest of the three groups that were compared with Whites in this report. While other
racial/ethnic groups differed from Whites across many of the indicators, relatively few
differences from White faculty were found among Hispanic faculty.
About 35 percent of both White and Hispanic faculty taught at public doctoral institutions,
and 11–12 percent taught at private not-for-profit doctoral institutions (table 2). While it

Racial/Ethnic Differences Among Full-Time Faculty
27
appeared that Hispanic faculty were more likely than White faculty to teach at public 2-year
institutions, the difference was not statistically significant. About two-thirds of both White and
Hispanic faculty taught undergraduates only, 16 percent of each group taught both graduates and
undergraduates, and the remainder taught only graduate students (table 3). About one-quarter of
both Hispanic (23 percent) and White faculty (24 percent) taught in the natural sciences and
engineering (table 4). About 15 percent of both White and Hispanic faculty taught in the health
sciences, while about one-sixth (17 percent) taught in the social sciences and education. Hispanic
faculty were more likely than White faculty to be instructors, lecturers, or other unspecified
academic ranks (32 versus 23 percent; table 5). While it appeared that White faculty were more
likely than Hispanic faculty to be full professors, the standard error was large and the difference
not statistically significant. Approximately one-half of both White and Hispanic faculty held
tenured positions (54 and 49 percent, respectively; table 6).
Approximately two-thirds of both White and Hispanic faculty held doctoral or first-
professional degrees (67 and 64 percent, respectively), and about 3 out of 10 held a master’s
degree as their highest degree (28 and 30 percent, respectively; table 7). As among other groups,
however, Whites reported higher levels of experience than Hispanics. Hispanic faculty reported
earning their degrees an average of 14 years before fall 1998 compared with 17 years among
White faculty. Hispanic faculty also reported holding their current jobs for fewer years than
White faculty and having fewer years of experience in higher education overall (table 8).
Consistent with these differences in experience, Hispanic faculty were also younger than White
faculty (46 versus 50 years of age, on average; table 9).
While the teaching and research activities of other racial/ethnic groups differed from those
of Whites, differences were not found between Hispanic and White faculty members in these
characteristics. Both groups spent an average of 56–57 percent of their total work time on
teaching activities, and 15–16 percent of their time on research activities (table 11). Hispanic
faculty taught approximately four classes for credit, worked on three course preparations, and
spent 12 hours in the classroom each week (table 10). Sixty-seven percent of Hispanic faculty
reported conducting research, and of those, 54 percent reported receiving funding for their
research (table 12). Forty-four percent of Hispanic faculty were engaged in basic research, 24
percent were engaged in applied or policy-oriented research, and 19 percent were engaged in
other types of research (table 14). Finally, no differences were found between Hispanic and
White faculty in the number of total publications or other permanent creative works or in the
number of presentations or performances in the previous 2 years: each group had produced about
eight publications total, including four refereed articles or juried works and one book, and 10–11
presentations, exhibitions, or performances (table 13).

Racial/Ethnic Differences Among Full-Time Faculty
28
Racial/Ethnic Differences Among Male and Female Faculty
As described above, there is evidence that gender differences are not uniform across
racial/ethnic groups and that racial/ethnic differences are not the same for both men and women
either among faculty or in the larger labor market (Toutkoushian 1998a; Amott and Matthaei
1991). To explore this variation, the previous section examined gender differences among full-
time faculty both overall and within separate racial/ethnic groups and found evidence that gender
differences, while present among all racial/ethnic groups, did indeed vary within various groups.
A similar analysis was conducted for race/ethnicity. In addition to the overall racial/ethnic
differences described above, analyses were conducted separately to explore racial/ethnic
differences among men and among women. Despite oversampling of racial/ethnic minorities,
however, the small samples of several groups under consideration yielded large standard errors.
As a result, as discussed in the introduction, there was not enough statistical evidence to
determine underlying population patterns conclusively. Consequently, this report does not
provide a detailed discussion of racial/ethnic differences for male and female faculty separately.
For interested readers, appendix figures C2, C3, and C4 summarize which tests produced
statistically significant differences between racial/ethnic groups for all full-time faculty, for full-
time male faculty, and for full-time female faculty, respectively.
Overall, there were fewer racial/ethnic differences among female faculty than there were
among male faculty. This may reflect both more similarity among women of different
racial/ethnic groups and the greater margin of error in the estimates produced for minority
women because they are based on smaller samples. Lower representations of women in the
professoriate also means that the overall racial/ethnic differences discussed in the preceding
paragraphs may have been driven by racial/ethnic differences among male faculty and do not
necessarily reflect differences among female faculty. Those racial/ethnic differences that did
occur among women were observed primarily between White and Asian female faculty.
Consistent with the comparisons between White and Hispanic faculty overall, few differences
emerged between White and Hispanic male or female faculty.
Summary
Full-time Asian/Pacific Islander faculty had higher salaries on average than White faculty,
and they were also more likely to have several characteristics associated with higher salaries,
such as holding doctoral or first-professional degrees and conducting research. In contrast, Black
faculty had lower salaries than White faculty and were less likely to have other characteristics
associated with higher pay. In contrast, for many of these characteristics, no differences were
found between Hispanic and White faculty. For example, Asian faculty were more likely than

Racial/Ethnic Differences Among Full-Time Faculty
29
White faculty, who were more likely than Black faculty, to have doctoral or first-professional
degrees and less likely to have completed their education with a master’s degree (figure 10).
Approximately two-thirds of both Hispanic and White faculty had advanced degrees (64 and 67
percent, respectively).
On the other hand, White faculty had more experience than faculty belonging to any of the
other three racial/ethnic groups (figure 11). Compared with Asian, Black, and Hispanic faculty,
White faculty had held their highest degrees and their current jobs longer. Consistent with this
difference in experience, Whites were more likely than both Blacks and Asians to be full
professors and less likely to be assistant professors, although Hispanic faculty, despite the
difference in overall experience, displayed no differences from Whites in the proportions at these
Figure 10.—Percentage distribution of full-time instructional faculty and staff at degree-granting institutionsFigure 11.—according to highest degree earned, by race/ethnicity: Fall 1998
NOTE: Includes full-time instructional faculty and staff at Title IV degree-granting institutions with at least some instructional duties for credit. Percentages may not sum to 100 due to rounding.
SOURCE: U.S. Department of Education, National Center for Education Statistics, 1999 National Study of PostsecondaryFaculty (NSOPF:99).
64
67
30
15
28
6
6
57
85
39
1
4
0 10 20 30 40 50 60 70 80 90 100
Hispanic
Asian/Pacific Islander
Black, non-Hispanic
White, non-Hispanic
Percent
Doctoral/first-professional Master’s Bachelor’s or less

Racial/Ethnic Differences Among Full-Time Faculty
30
ranks (figure 12). Asian and Black faculty were also more likely than White faculty to be on the
tenure track (figure 13), the most common status for assistant professors.17
Finally, no differences across racial/ethnic groups were found for some characteristics. For
example, no differences by racial/ethnic group were detected in student contact hours (table 10).
In short, among full-time instructional faculty and staff, overall racial/ethnic differences in
factors often associated with salary were as complex in fall 1998 as they were 6 years earlier
(Nettles, Perna, and Bradburn 2000).
17U.S. Department of Education, National Center for Education Statistics, 1999 National Study of Postsecondary Faculty(NSOPF:99), Data Analysis System.
Figure 11.—Years of experience of full-time instructional faculty and staff at degree-granting institutions, by race/Figure 12.—ethnicity: Fall 1998
NOTE: Includes full-time instructional faculty and staff at Title IV degree-granting institutions with at least some instructional duties for credit.
SOURCE: U.S. Department of Education, National Center for Education Statistics, 1999 National Study of PostsecondaryFaculty (NSOPF:99).
17
1315
10
14
10
14
9
0
5
10
15
20
Years since receiving degree Years in current job
Years
White, non-Hispanic Black, non-Hispanic Asian/Pacific Islander Hispanic
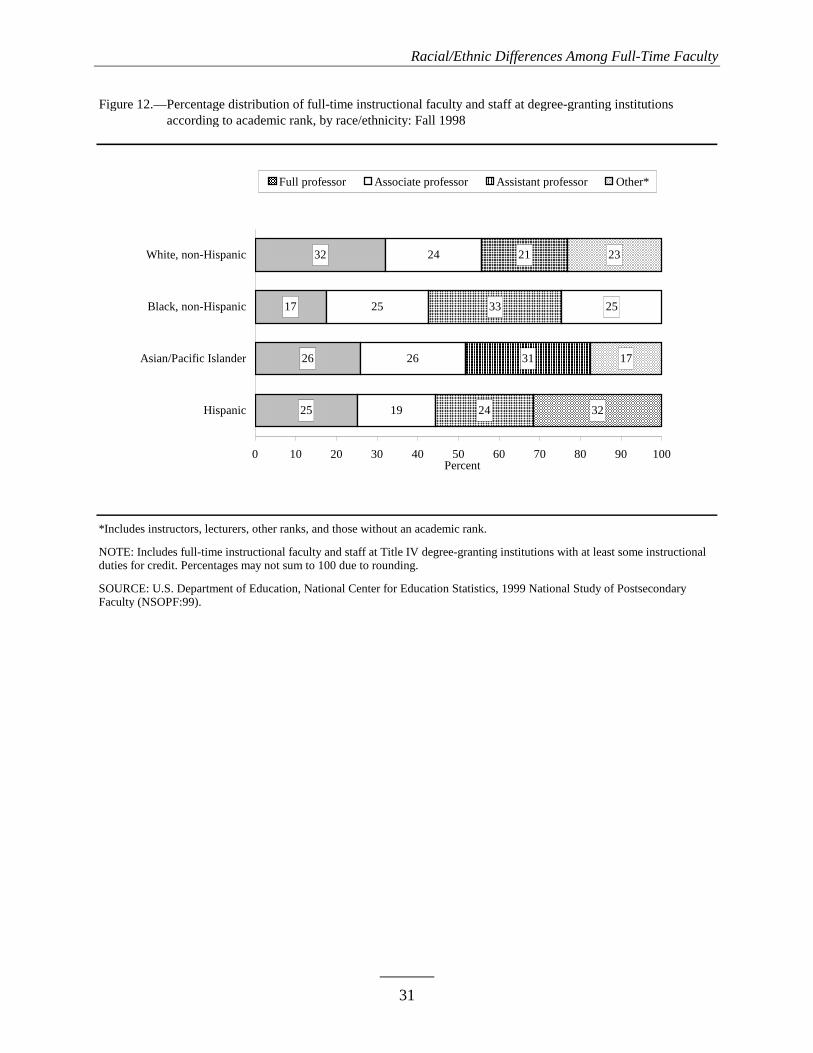
Racial/Ethnic Differences Among Full-Time Faculty
31
Figure 12.—Percentage distribution of full-time instructional faculty and staff at degree-granting institutionsFigure 13.—according to academic rank, by race/ethnicity: Fall 1998
*Includes instructors, lecturers, other ranks, and those without an academic rank.
NOTE: Includes full-time instructional faculty and staff at Title IV degree-granting institutions with at least some instructional duties for credit. Percentages may not sum to 100 due to rounding.
SOURCE: U.S. Department of Education, National Center for Education Statistics, 1999 National Study of PostsecondaryFaculty (NSOPF:99).
25
32
19
26
24
24
31
21
32
17
23
17
26
25 33 25
0 10 20 30 40 50 60 70 80 90 100
Hispanic
Asian/Pacific Islander
Black, non-Hispanic
White, non-Hispanic
Percent
Full professor Associate professor Assistant professor Other*
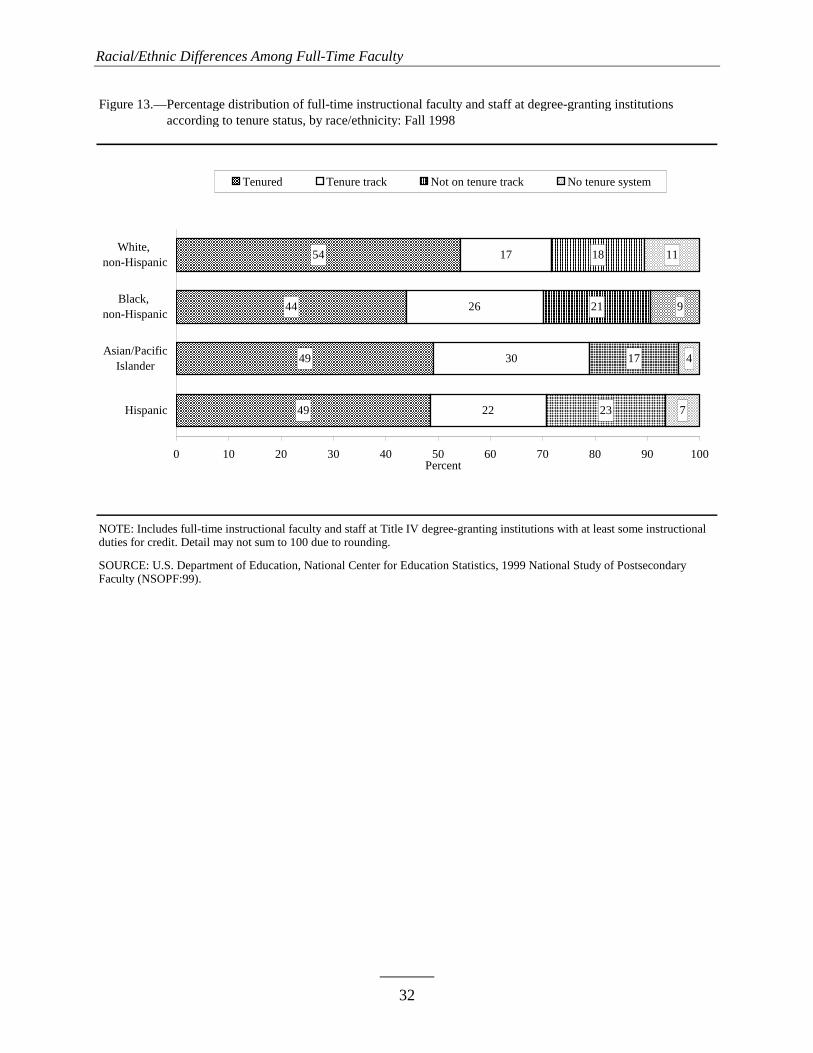
Racial/Ethnic Differences Among Full-Time Faculty
32
Figure 13.—Percentage distribution of full-time instructional faculty and staff at degree-granting institutionsFigure 14.—according to tenure status, by race/ethnicity: Fall 1998
NOTE: Includes full-time instructional faculty and staff at Title IV degree-granting institutions with at least some instructional duties for credit. Detail may not sum to 100 due to rounding.
SOURCE: U.S. Department of Education, National Center for Education Statistics, 1999 National Study of PostsecondaryFaculty (NSOPF:99).
49
54
22
30
17
23
17
18
7
4
11
44
49
26 21 9
0 10 20 30 40 50 60 70 80 90 100
Hispanic
Asian/PacificIslander
Black, non-Hispanic
White, non-Hispanic
Percent
Tenured Tenure track Not on tenure track No tenure system

33
Gender and Racial/Ethnic Differences in Salary Controlling forOther Characteristics
As the previous two chapters show, differences in faculty characteristics by gender and
race/ethnicity are common. While overall salary variations between men and women and among
faculty across racial/ethnic groups suggest persistent disparities, they do not take into account
other differences in factors that contribute to salary. Thus, it is not clear whether the salaries of
different gender or racial/ethnic groups of faculty vary in ways that can be accounted for by
differences in other characteristics, such as the types of institutions at which faculty teach, their
levels of experience, or their research activities. Because many such characteristics vary
together, it is necessary to conduct a multiple regression analysis that takes this covariation into
account in order to understand the net differences, if any, in salary by gender and race/ethnicity.
See appendix B for a description of the regression procedure used here.
Table 15 offers two estimates of the mean basic salaries for full-time faculty members and
staff who had instructional duties for credit in 1998. The first column of estimates shows
unadjusted average salaries, while the second column presents average salaries that have been
adjusted to take into account covariation among the independent variables in the table.
After controlling for race, type of institution, teaching field, level of instruction, tenure
status, rank, highest degree, years since highest degree, age, time spent teaching, number of
classes taught, time spent engaged in research, and number of total publications or other
permanent creative works in the previous 2 years, full-time female faculty members earned an
average of $53,600 compared with $58,700 for men. For 1992, Nettles, Perna, and Bradburn
(2000) found similar results. They found that women earned 8 percent less than men when a
similar group of characteristics, including academic rank and tenure status, were controlled.18
The 1992 and 1998 regression results reveal a persistent gap between male and female faculty
salaries.
18The inclusion of academic rank and tenure status as independent variables in a model of faculty salaries will generallyminimize the gender differences in salary that are found (Toutkoushian 1998b). Nettles, Perna, and Bradburn (2000) estimatedfour different models with NSOPF:93 data to investigate covariance. When academic rank and tenure status were excluded fromthe model, but other variables reflecting education, experience, institution type and location, and teaching and research activitieswere still included, women earned 11 percent less than men (Nettles, Perna, and Bradburn 2000). The regression analysispresented in this report only includes one model as shown in table 15.

Gender and Racial/Ethnic Differences in Salary Controlling for Other Characteristics
34
A wage gap based on race/ethnicity did not emerge in 1998. After controlling for the other
variables shown in table 15, no differences were observed in average salaries across racial/ethnic
categories. Though the unadjusted mean salary of Black faculty members was lower than that of
White faculty, no difference was found in the adjusted mean salary of Black and White faculty
members. The lower proportions of Black faculty members working at doctoral institutions and
holding tenure and full professor positions could account for the lack of adjusted salary variation.
Conversely, Asian faculty had a higher unadjusted mean salary compared with White faculty.
Taking into account such factors as the type of institution by which they were employed,
involvement in research, and highest degree held, no statistically significant differences were
found in the salaries of Asian faculty and White faculty. Salary differences did not emerge
between Hispanic and White faculty. Similar to the bivariate comparisons between Hispanic and
White faculty characteristics and outcomes, no differences were detected in the adjusted salaries
of these two groups.
While differences in salary between faculty of different racial/ethnic groups were not
detected in the regression analysis, there may still be racial/ethnic differences in various
situational variables (such as tenure status and academic rank) that were controlled in these
regression models. The bivariate results show that many differences in such characteristics do
exist. These differences could be the result of discrimination on the basis of race/ethnicity.
Alternatively, they may result from other antecedent factors. That is, for example, racial/ethnic
differences in academic rank could be the result of discrimination—differential treatment of
people of different races who otherwise have the same characteristics—or the result of
racial/ethnic differences in other characteristics that are associated with rank, such as education
and years of experience.19
Besides gender, several other faculty characteristics affected adjusted mean salaries in the
model shown in table 15. Tenure status and academic rank were associated with salary. After
controlling for other variables, faculty members holding tenure earned more than faculty who
were not on a tenure track or who worked in an institution without a tenure system. Similarly,
full professors earned more than associate and assistant professors and faculty in other ranks.
Faculty members’ highest degree earned and the number of years since receiving their highest
degree were also positively associated with salary. Faculty holding doctoral or first-professional
degrees earned about $59,000 compared with $52,500, the adjusted mean salary of faculty who
19The maximum effect size (r2) of the relationships of the other variables shown in table 15 with the racial/ethnic variables was0.009. Effect sizes of this magnitude may be considered relatively small (Cohen 1988).
Gender and Racial/Ethnic Differences in Salary Controlling for Other Characteristics
35
held any other type of degree. Those who held their highest degrees for more than 15 years
earned an average of at least $6,00020 more than their colleagues with less experience.
Institution type, teaching field, and teaching and research activities were also associated
with salaries. Compared with faculty who taught at public 2-year institutions, faculty who taught
at public and private not-for-profit doctoral institutions earned higher adjusted salaries, while
faculty who taught at private liberal arts colleges earned less than their counterparts at public 2-
year institutions. Faculty who taught in business, law, communications, and health sciences
earned higher salaries than those in the natural sciences and engineering. In turn, faculty in the
natural sciences and engineering earned more than their counterparts in the humanities, but no
differences were detected when comparing their salaries to those of faculty teaching in the social
sciences, education, and occupationally specific programs. Additionally, while no differences in
adjusted salaries were found based on time spent doing research after controlling for other
factors, those who reported producing more than 10 recent publications or other permanent
creative works total earned more than their counterparts who produced fewer works. Salaries
were also higher for faculty members who spent an average of 50 percent or less of their time
teaching, and faculty who taught more than two classes earned less than those who taught fewer
classes.
20These differences were calculated using average base salaries for groups with different levels of experience that were adjustedto take into account differences associated with other variables in the analysis: $60,690 (adjusted average salary for faculty withmore than 15 years of experience) – $54,280 (adjusted average salary of faculty with 11 to 15 years of experience) = $6,410(salary difference); $60,690 (adjusted average salary for faculty with more than 15 years of experience) – $53,250 (adjustedaverage salary of faculty with 6 to 10 years of experience) = $7,440 (salary difference); and $60,690 (adjusted average salary forfaculty with more than 15 years of experience) – $50,950 (adjusted average salary of faculty with 0 to 5 years of experience) =$9,740 (salary difference).

THIS PAGE INTENTIONALLY LEFT BLANK

37
Subgroup Changes Between 1992 and 1998
The previous section showed that the salaries of full-time male and female faculty
members differed in 1998 even controlling for many other factors that contribute to faculty
salaries, although racial/ethnic differences in salary were accounted for by variation in other
characteristics. These results were consistent with differences found in 1992 (Nettles, Perna, and
Bradburn 2000). Have the characteristics of male and female faculty of different racial/ethnic
groups changed during the 1990s? The NSOPF surveys provide an opportunity to examine how
the subgroups may have changed in terms of some of the characteristics studied here.
Women’s average salaries (in constant 1998 dollars) increased between 1992 and 1998, a
finding that resulted particularly from an increase in salary among White women (table 16).
Although other groups appeared to have increased their salaries as well, the standard errors were
large, and there was not enough statistical evidence to conclude that this was the case. Despite
the significant growth in White women’s average salary during the period, no change was found
in the gap between the average salary of White men and women between the 2 years. In fact, no
changes in the salary gaps between male and female full-time instructional staff were detected
among any of the racial/ethnic groups.
White men were less likely to be employed at public 2-year colleges in 1998 than in 1992
(14 versus 17 percent; table 17). Although other groups also appeared to decrease their
representation at this type of institution, these apparent differences were not statistically
significant. Black, Hispanic, and Asian women appeared to have increased their representation in
public doctoral universities between 1992 and 1998, but these differences were also not
statistically significant.
Between 1992 and 1998, the percentages of White and Asian women holding a doctoral or
first-professional degree increased (table 18). In addition, greater percentages of White women
rose to the rank of full professor, from 16 percent in 1992 to 19 percent in 1998 (table 19). They
were also less likely to be employed as assistant professors in 1998 than in 1992. While some
other groups, such as Hispanic men, appeared to show similar patterns, the changes for other
groups were not statistically significant.
White men and women as well as Hispanic men were less likely to be on a tenure track in
1998 than in 1992 (table 20). White men and Hispanic women were also more likely to be in
Subgroup Changes Between 1992 and 1998
38
nontenure track jobs in 1998 than in 1992. Although Hispanic men appeared to be more likely,
and Hispanic women less likely, to have tenure in 1998 than in 1992, these estimates had large
standard errors and the differences were not statistically significant. Between 1992 and 1998, the
gap between the percentage of White men and White women holding tenure positions narrowed,
while the gap between Hispanic men and women holding tenure grew.
In summary, the status of faculty of various racial/ethnic groups changed little between
1992 and 1998. Although the status of White women changed somewhat—they were more likely
to hold doctoral or first-professional degrees, to be full professors, and have higher salaries in
1998—salary differences by gender remained, even after taking into account other factors (table
15).
39
Conclusion
Gender and racial/ethnic differences were observed in faculty salaries and in many
characteristics that affect salary for full-time faculty with for-credit instructional duties in fall
1998. In some cases, these differences are easy to summarize. Despite some gains for women
during the 1990s, gender differences in salary and many other factors—such as education and
experience, teaching and research activities, and academic rank and tenure—persisted in 1998.
Furthermore, many of these differences were present across racial/ethnic groups: White,
Asian/Pacific Islander, Black, and Hispanic faculty all displayed gender differences in several
aspects of faculty status. Hispanic faculty exhibited the fewest gender differences. Finally,
gender differences in salary persisted even after taking into account a broad array of faculty
characteristics.
Racial/ethnic differences are also widespread. Asian/Pacific Islander faculty often fare well
relative to White faculty, with higher average salaries, more doctoral or first-professional
degrees, and more time for research. They have less experience overall and, perhaps partly
because they have more recently entered the professoriate, are no more likely than Whites to
have joined the ranks of senior faculty.
In contrast, Black faculty are often at a disadvantage relative to White faculty. Their
salaries are lower than those of Whites, and they are less likely to have doctoral or first-
professional degrees. Because Blacks have less experience as faculty members, they also are less
likely than Whites to have tenure or full professorships.
Hispanic faculty, the smallest of the racial/ethnic groups considered here, displayed few
observed differences from White faculty. In fact, although Hispanic faculty have less experience
on average than White faculty, no differences were found in the proportions of these two groups
who were employed as senior faculty. In addition, no differences were detected in salaries,
teaching, and research activities of Hispanic and White faculty.
Racial/ethnic differences in salary are generally a function of the many other differences in
faculty characteristics observed in this report. After controlling for such factors as institution
type, education and experience, teaching and research activities, and academic rank and tenure,
there were no statistically significant differences in the average salary of faculty. However, the

Conclusion
40
other results in this report highlight the fact that faculty from different racial/ethnic backgrounds
do vary considerably in other characteristics that contribute to salary.
Finally, there was little evidence that the status of male and female faculty from different
racial/ethnic backgrounds changed during the 1990s. Compared with results for fall 1992, no
differences were observed for most groups in their representation at various levels and types of
institutions. This overall stability no doubt contributed to the similar gender and racial/ethnic
differences found among full-time faculty in fall 1992 and 1998.

41
Tables

THIS PAGE INTENTIONALLY LEFT BLANK
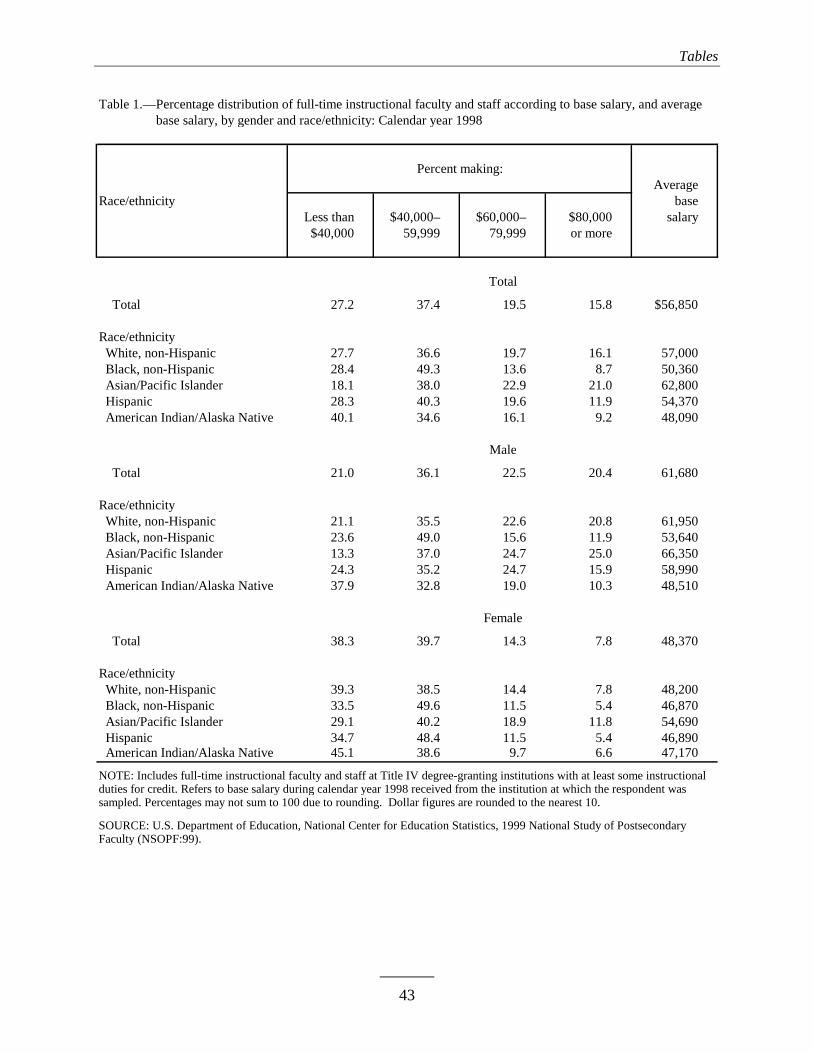
Tables
43
Table 1.—Percentage distribution of full-time instructional faculty and staff according to base salary, and averageTable 1.—base salary, by gender and race/ethnicity: Calendar year 1998
Average
Race/ethnicity base Less than $40,000– $60,000– $80,000 salary $40,000 59,999 79,999 or more
Total
Total 27.2 37.4 19.5 15.8 $56,850 Race/ethnicity White, non-Hispanic 27.7 36.6 19.7 16.1 57,000 Black, non-Hispanic 28.4 49.3 13.6 8.7 50,360 Asian/Pacific Islander 18.1 38.0 22.9 21.0 62,800 Hispanic 28.3 40.3 19.6 11.9 54,370 American Indian/Alaska Native 40.1 34.6 16.1 9.2 48,090
Male
Total 21.0 36.1 22.5 20.4 61,680 Race/ethnicity White, non-Hispanic 21.1 35.5 22.6 20.8 61,950 Black, non-Hispanic 23.6 49.0 15.6 11.9 53,640 Asian/Pacific Islander 13.3 37.0 24.7 25.0 66,350 Hispanic 24.3 35.2 24.7 15.9 58,990 American Indian/Alaska Native 37.9 32.8 19.0 10.3 48,510 Female
Total 38.3 39.7 14.3 7.8 48,370 Race/ethnicity White, non-Hispanic 39.3 38.5 14.4 7.8 48,200 Black, non-Hispanic 33.5 49.6 11.5 5.4 46,870 Asian/Pacific Islander 29.1 40.2 18.9 11.8 54,690 Hispanic 34.7 48.4 11.5 5.4 46,890 American Indian/Alaska Native 45.1 38.6 9.7 6.6 47,170
NOTE: Includes full-time instructional faculty and staff at Title IV degree-granting institutions with at least some instructional duties for credit. Refers to base salary during calendar year 1998 received from the institution at which the respondent was sampled. Percentages may not sum to 100 due to rounding. Dollar figures are rounded to the nearest 10.
SOURCE: U.S. Department of Education, National Center for Education Statistics, 1999 National Study of PostsecondaryFaculty (NSOPF:99).
Percent making:
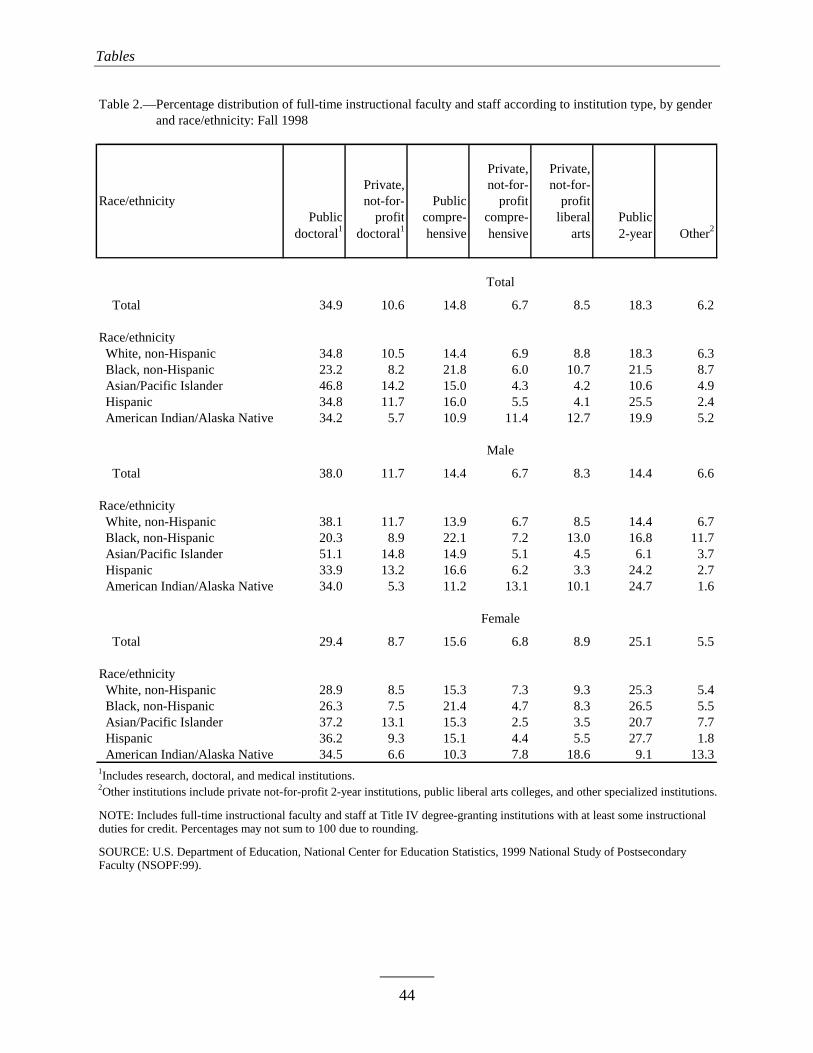
Tables
44
Table 2.—Percentage distribution of full-time instructional faculty and staff according to institution type, by genderTable 2.—and race/ethnicity: Fall 1998
Private, Private, Private, not-for- not-for-Race/ethnicity not-for- Public profit profit Public profit compre- compre- liberal Public
doctoral1 doctoral1 hensive hensive arts 2-year Other2
Total
Total 34.9 10.6 14.8 6.7 8.5 18.3 6.2 Race/ethnicity White, non-Hispanic 34.8 10.5 14.4 6.9 8.8 18.3 6.3 Black, non-Hispanic 23.2 8.2 21.8 6.0 10.7 21.5 8.7 Asian/Pacific Islander 46.8 14.2 15.0 4.3 4.2 10.6 4.9 Hispanic 34.8 11.7 16.0 5.5 4.1 25.5 2.4 American Indian/Alaska Native 34.2 5.7 10.9 11.4 12.7 19.9 5.2
Male
Total 38.0 11.7 14.4 6.7 8.3 14.4 6.6 Race/ethnicity White, non-Hispanic 38.1 11.7 13.9 6.7 8.5 14.4 6.7 Black, non-Hispanic 20.3 8.9 22.1 7.2 13.0 16.8 11.7 Asian/Pacific Islander 51.1 14.8 14.9 5.1 4.5 6.1 3.7 Hispanic 33.9 13.2 16.6 6.2 3.3 24.2 2.7 American Indian/Alaska Native 34.0 5.3 11.2 13.1 10.1 24.7 1.6 Female
Total 29.4 8.7 15.6 6.8 8.9 25.1 5.5 Race/ethnicity White, non-Hispanic 28.9 8.5 15.3 7.3 9.3 25.3 5.4 Black, non-Hispanic 26.3 7.5 21.4 4.7 8.3 26.5 5.5 Asian/Pacific Islander 37.2 13.1 15.3 2.5 3.5 20.7 7.7 Hispanic 36.2 9.3 15.1 4.4 5.5 27.7 1.8 American Indian/Alaska Native 34.5 6.6 10.3 7.8 18.6 9.1 13.31Includes research, doctoral, and medical institutions.2Other institutions include private not-for-profit 2-year institutions, public liberal arts colleges, and other specialized institutions.
NOTE: Includes full-time instructional faculty and staff at Title IV degree-granting institutions with at least some instructional duties for credit. Percentages may not sum to 100 due to rounding.
SOURCE: U.S. Department of Education, National Center for Education Statistics, 1999 National Study of PostsecondaryFaculty (NSOPF:99).

Tables
45
Table 3.—Percentage distribution of full-time instructional faculty and staff according to level of instruction,Table 3.—by gender and race/ethnicity: Fall 1998
Undergraduate Both undergraduate Graduate Race/ethnicity only and graduate only
Total
Total 66.6 16.4 17.0 Race/ethnicity White, non-Hispanic 66.8 16.1 17.1 Black, non-Hispanic 73.4 14.5 12.2 Asian/Pacific Islander 56.3 23.4 20.4 Hispanic 65.8 15.7 18.5 American Indian/Alaska Native 74.4 15.3 10.2 Male
Total 63.1 18.3 18.5 Race/ethnicity White, non-Hispanic 63.2 18.0 18.8 Black, non-Hispanic 73.5 13.6 12.9 Asian/Pacific Islander 52.8 26.4 20.9 Hispanic 64.4 19.4 16.2 American Indian/Alaska Native 75.1 15.4 9.5 Female
Total 72.6 13.0 14.4 Race/ethnicity White, non-Hispanic 73.2 12.8 14.0 Black, non-Hispanic 73.2 15.4 11.4 Asian/Pacific Islander 64.7 16.1 19.2 Hispanic 68.2 9.2 22.6 American Indian/Alaska Native (#) (#) (#)
#Too small to report.
NOTE: Includes full-time instructional faculty and staff at Title IV degree-granting institutions with at least some instructional duties for credit. Categories refer to primary level of students in up to five classes taught for credit. Percentages may not sum to 100 due to rounding.
SOURCE: U.S. Department of Education, National Center for Education Statistics, 1999 National Study of PostsecondaryFaculty (NSOPF:99).

Tables
46
Table 4.—Percentage distribution of full-time instructional faculty and staff according to field of teaching,Table 4.—by gender and race/ethnicity: Fall 1998
Business/ Natural Social Occupa- Race/ethnicity law/com- Health Human- sciences/ sciences/ tionally munications sciences ities engineering education specific Other
Total
Total 10.3 15.2 14.6 24.7 17.8 2.9 14.6 Race/ethnicity White, non-Hispanic 10.5 15.2 14.4 24.3 17.5 2.9 15.1 Black, non-Hispanic 10.8 13.2 13.2 14.5 26.3 3.5 18.5 Asian/Pacific Islander 8.2 16.2 12.1 41.5 13.9 1.8 6.4 Hispanic 5.7 15.1 28.8 23.1 16.6 2.5 8.2 American Indian/Alaska Native 15.7 15.2 7.8 12.3 27.6 9.9 11.5
Male
Total 10.5 11.8 12.8 30.1 16.0 3.9 15.0 Race/ethnicity White, non-Hispanic 10.6 11.8 12.8 29.2 16.2 3.9 15.6 Black, non-Hispanic 13.6 7.5 13.3 20.4 19.3 3.9 22.0 Asian/Pacific Islander 9.1 14.3 6.3 51.7 11.2 2.2 5.2 Hispanic 4.7 12.4 26.6 29.3 14.2 3.9 8.9 American Indian/Alaska Native 20.2 11.1 7.0 15.0 22.8 14.2 9.8 Female
Total 9.9 21.1 17.9 15.1 21.0 1.3 13.8 Race/ethnicity White, non-Hispanic 10.4 21.3 17.3 15.6 19.9 1.2 14.2 Black, non-Hispanic 7.7 19.4 13.0 8.2 33.9 3.0 14.8 Asian/Pacific Islander 6.0 20.5 25.2 18.4 20.0 0.8 9.1 Hispanic 7.2 19.6 32.4 13.0 20.5 0.2 7.1 American Indian/Alaska Native 5.4 24.5 9.7 6.2 38.8 0.0 15.4
NOTE: Includes full-time instructional faculty and staff at Title IV degree-granting institutions with at least some instructional duties for credit. Percentages may not sum to 100 due to rounding.
SOURCE: U.S. Department of Education, National Center for Education Statistics, 1999 National Study of Postsecondary Faculty(NSOPF:99).

Tables
47
Table 5.—Percentage distribution of full-time instructional faculty and staff according to academic rank, by genderTable 5.—and race/ethnicity: Fall 1998
Full Associate Assistant Race/ethnicity professor professor professor Other*
Total 30.7 23.6 22.3 23.4 Race/ethnicity White, non-Hispanic 32.2 23.5 21.0 23.3 Black, non-Hispanic 17.5 25.2 32.8 24.6 Asian/Pacific Islander 25.9 25.8 30.9 17.5 Hispanic 25.3 19.1 24.1 31.6 American Indian/Alaska Native 17.8 17.4 23.6 41.1
Total 38.2 24.3 19.3 18.2 Race/ethnicity White, non-Hispanic 39.8 24.1 18.0 18.0 Black, non-Hispanic 23.6 27.4 29.0 20.0 Asian/Pacific Islander 31.4 28.1 29.4 11.1 Hispanic 31.4 20.3 20.3 28.0 American Indian/Alaska Native 23.6 18.2 16.9 41.3
Total 17.6 22.2 27.6 32.6 Race/ethnicity White, non-Hispanic 18.5 22.5 26.3 32.6 Black, non-Hispanic 11.0 22.9 36.7 29.4 Asian/Pacific Islander 13.3 20.3 34.3 32.0 Hispanic 15.4 17.1 30.2 37.3 American Indian/Alaska Native 5.0 15.8 38.6 40.7
*Includes instructors, lecturers, other ranks, and those without an academic rank.
NOTE: Includes full-time instructional faculty and staff at Title IV degree-granting institutions with at least some instructional duties for credit. Percentages may not sum to 100 due to rounding.
SOURCE: U.S. Department of Education, National Center for Education Statistics, 1999 National Study of PostsecondaryFaculty (NSOPF:99).
Total
Male
Female

Tables
48
Table 6.—Percentage distribution of full-time instructional faculty and staff according to tenure status, by genderTable 6.—and race/ethnicity: Fall 1998
Tenure Not on No tenure Race/ethnicity Tenured track tenure track system
Total 53.1 18.8 18.1 10.0 Race/ethnicity White, non-Hispanic 54.3 17.4 17.8 10.5 Black, non-Hispanic 43.9 26.1 20.6 9.3 Asian/Pacific Islander 49.1 29.8 17.1 4.0 Hispanic 48.5 22.1 22.9 6.5 American Indian/Alaska Native 29.4 34.4 24.2 12.0
Total 59.7 17.1 14.7 8.5 Race/ethnicity White, non-Hispanic 60.9 15.7 14.4 9.0 Black, non-Hispanic 50.6 23.0 17.1 9.3 Asian/Pacific Islander 54.3 28.5 14.3 2.8 Hispanic 56.2 19.3 18.4 6.2 American Indian/Alaska Native 29.9 34.9 24.9 10.3
Total 41.6 21.8 24.1 12.5 Race/ethnicity White, non-Hispanic 42.5 20.3 23.9 13.3 Black, non-Hispanic 36.8 29.5 24.3 9.4 Asian/Pacific Islander 37.3 32.7 23.4 6.6 Hispanic 36.0 26.8 30.2 7.0 American Indian/Alaska Native 28.5 33.2 22.6 15.8
NOTE: Includes full-time instructional faculty and staff at Title IV degree-granting institutions with at least some instructional duties for credit. Percentages may not sum to 100 due to rounding.
SOURCE: U.S. Department of Education, National Center for Education Statistics, 1999 National Study of PostsecondaryFaculty (NSOPF:99).
Female
Male
Total
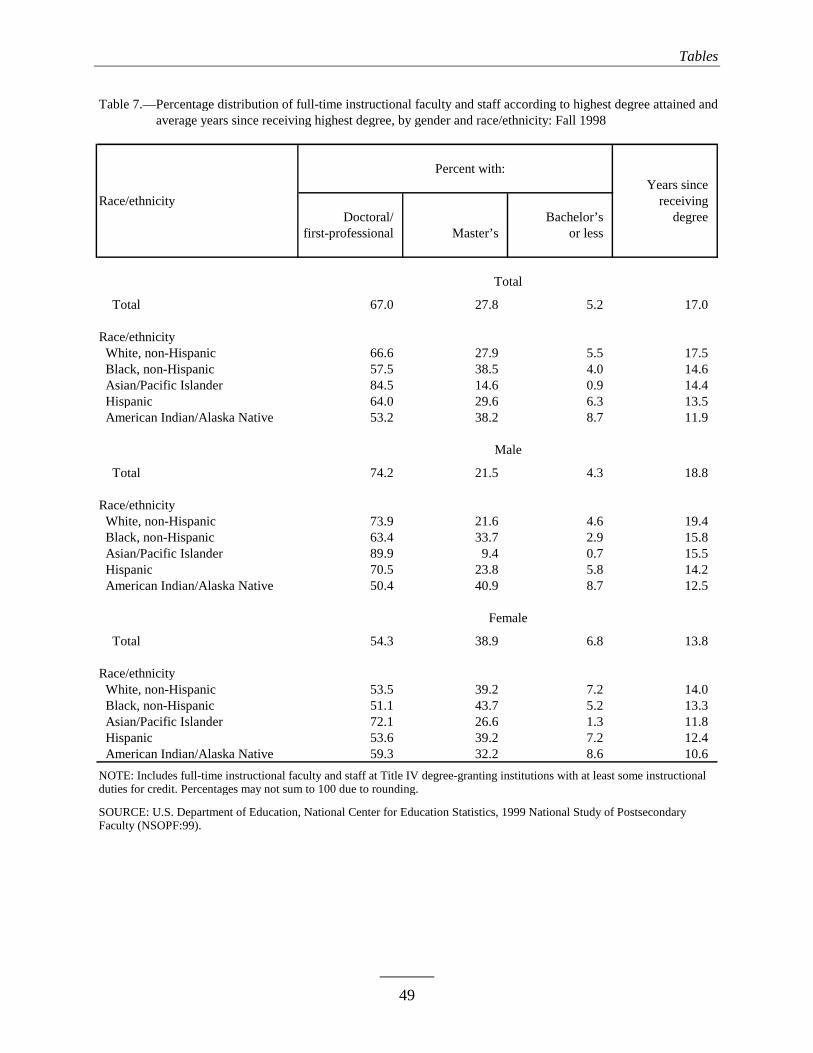
Tables
49
Table 7.—Percentage distribution of full-time instructional faculty and staff according to highest degree attained andTable 7.—average years since receiving highest degree, by gender and race/ethnicity: Fall 1998
Percent with:Years since
Race/ethnicity receiving Doctoral/ Bachelor’s degree
first-professional Master’s or less
Total 67.0 27.8 5.2 17.0 Race/ethnicity White, non-Hispanic 66.6 27.9 5.5 17.5 Black, non-Hispanic 57.5 38.5 4.0 14.6 Asian/Pacific Islander 84.5 14.6 0.9 14.4 Hispanic 64.0 29.6 6.3 13.5 American Indian/Alaska Native 53.2 38.2 8.7 11.9
Total 74.2 21.5 4.3 18.8 Race/ethnicity White, non-Hispanic 73.9 21.6 4.6 19.4 Black, non-Hispanic 63.4 33.7 2.9 15.8 Asian/Pacific Islander 89.9 9.4 0.7 15.5 Hispanic 70.5 23.8 5.8 14.2 American Indian/Alaska Native 50.4 40.9 8.7 12.5
Total 54.3 38.9 6.8 13.8 Race/ethnicity White, non-Hispanic 53.5 39.2 7.2 14.0 Black, non-Hispanic 51.1 43.7 5.2 13.3 Asian/Pacific Islander 72.1 26.6 1.3 11.8 Hispanic 53.6 39.2 7.2 12.4 American Indian/Alaska Native 59.3 32.2 8.6 10.6
NOTE: Includes full-time instructional faculty and staff at Title IV degree-granting institutions with at least some instructional duties for credit. Percentages may not sum to 100 due to rounding.
SOURCE: U.S. Department of Education, National Center for Education Statistics, 1999 National Study of PostsecondaryFaculty (NSOPF:99).
Total
Female
Male

Tables
50
Table 8.—Among full-time instructional faculty and staff, average years in current job, years of higher educationTable 8.—teaching experience, and number of jobs in higher education, by gender and race/ethnicity: Fall 1998
Years in higher Number of higher Race/ethnicity Years in current job education teaching education jobs
Total
Total 12.2 16.4 2.7 Race/ethnicity White, non-Hispanic 12.6 16.9 2.7 Black, non-Hispanic 10.1 14.7 2.9 Asian/Pacific Islander 9.7 13.2 2.7 Hispanic 9.1 12.8 2.7 American Indian/Alaska Native 8.2 11.3 2.8
Male
Total 13.6 17.9 2.8 Race/ethnicity White, non-Hispanic 14.1 18.5 2.8 Black, non-Hispanic 11.2 16.1 2.9 Asian/Pacific Islander 11.0 14.3 2.7 Hispanic 10.1 13.4 2.7 American Indian/Alaska Native 8.4 11.4 2.8
Female
Total 9.7 13.6 2.7 Race/ethnicity White, non-Hispanic 10.0 13.9 2.7 Black, non-Hispanic 9.0 13.2 3.0 Asian/Pacific Islander 6.8 10.5 2.7 Hispanic 7.5 11.8 2.8 American Indian/Alaska Native 7.6 11.0 2.7
NOTE: Includes full-time instructional faculty and staff at Title IV degree-granting institutions with at least some instructional duties for credit.
SOURCE: U.S. Department of Education, National Center for Education Statistics, 1999 National Study of PostsecondaryFaculty (NSOPF:99).
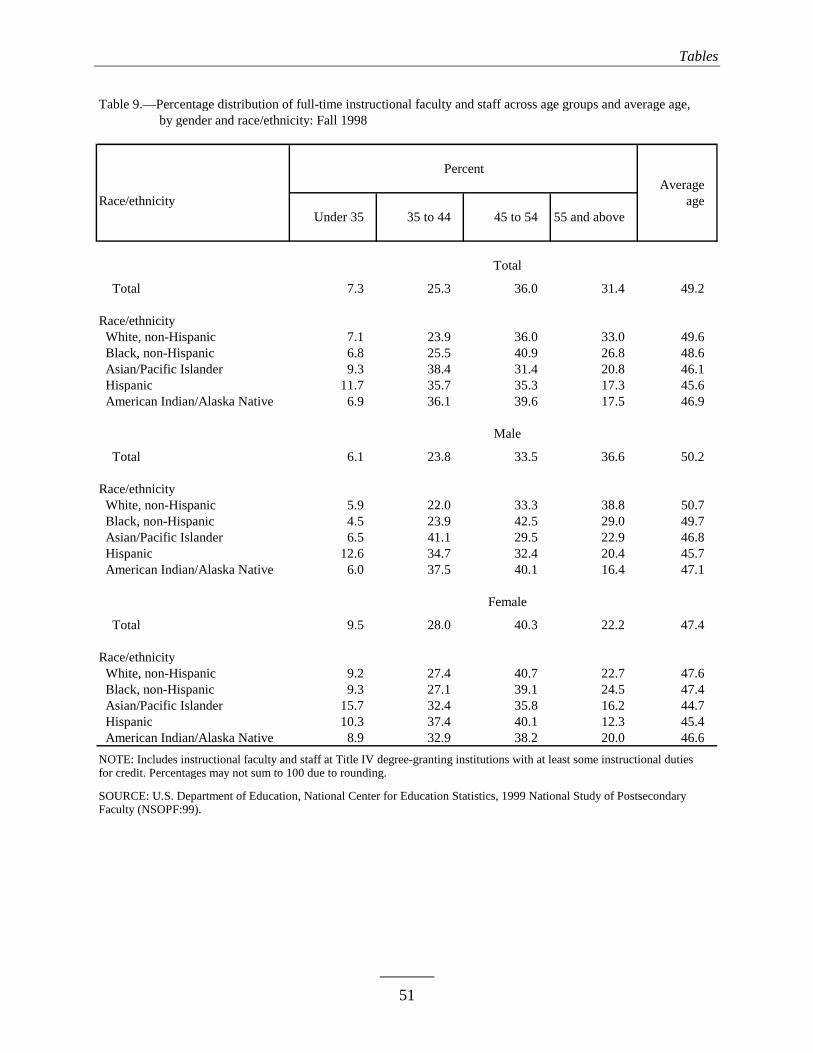
Tables
51
Table 9.—Percentage distribution of full-time instructional faculty and staff across age groups and average age,Table 9.— by gender and race/ethnicity: Fall 1998
Average
Race/ethnicity age Under 35 35 to 44 45 to 54 55 and above
Total
Total 7.3 25.3 36.0 31.4 49.2 Race/ethnicity White, non-Hispanic 7.1 23.9 36.0 33.0 49.6 Black, non-Hispanic 6.8 25.5 40.9 26.8 48.6 Asian/Pacific Islander 9.3 38.4 31.4 20.8 46.1 Hispanic 11.7 35.7 35.3 17.3 45.6 American Indian/Alaska Native 6.9 36.1 39.6 17.5 46.9 Male
Total 6.1 23.8 33.5 36.6 50.2 Race/ethnicity White, non-Hispanic 5.9 22.0 33.3 38.8 50.7 Black, non-Hispanic 4.5 23.9 42.5 29.0 49.7 Asian/Pacific Islander 6.5 41.1 29.5 22.9 46.8 Hispanic 12.6 34.7 32.4 20.4 45.7 American Indian/Alaska Native 6.0 37.5 40.1 16.4 47.1 Female
Total 9.5 28.0 40.3 22.2 47.4 Race/ethnicity White, non-Hispanic 9.2 27.4 40.7 22.7 47.6 Black, non-Hispanic 9.3 27.1 39.1 24.5 47.4 Asian/Pacific Islander 15.7 32.4 35.8 16.2 44.7 Hispanic 10.3 37.4 40.1 12.3 45.4 American Indian/Alaska Native 8.9 32.9 38.2 20.0 46.6
NOTE: Includes instructional faculty and staff at Title IV degree-granting institutions with at least some instructional duties for credit. Percentages may not sum to 100 due to rounding.
SOURCE: U.S. Department of Education, National Center for Education Statistics, 1999 National Study of PostsecondaryFaculty (NSOPF:99).
Percent
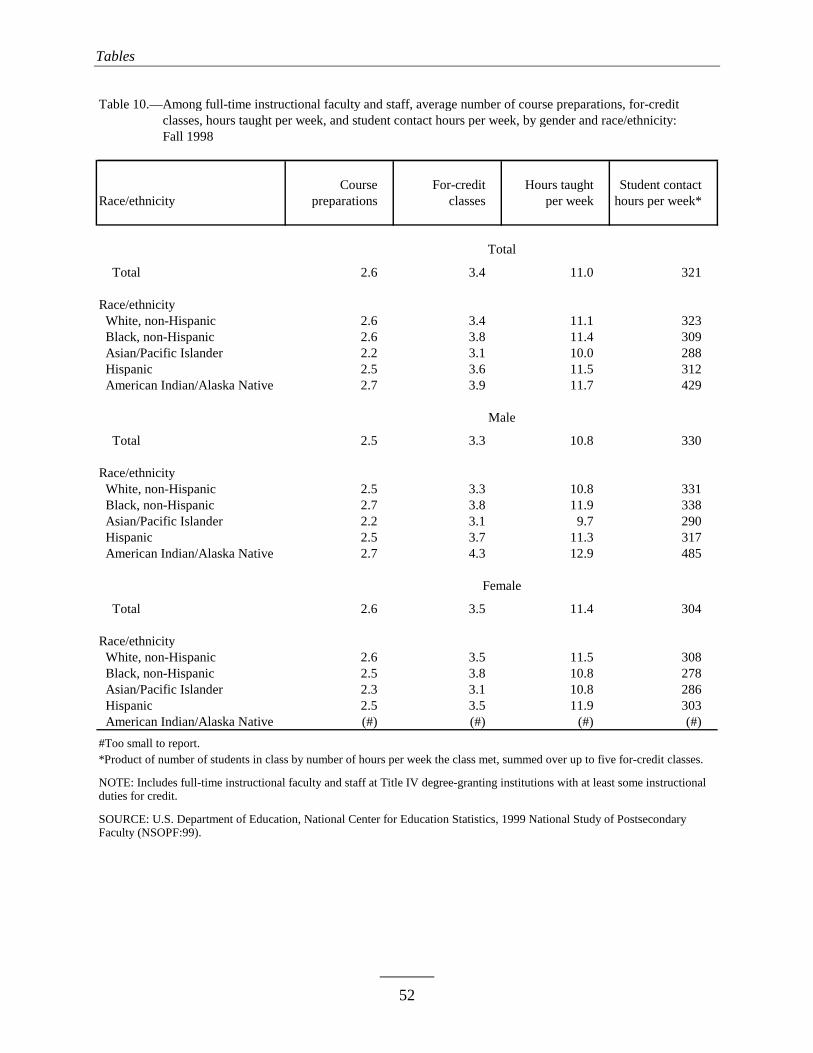
Tables
52
Table 10.—Among full-time instructional faculty and staff, average number of course preparations, for-credit Table 10.—classes, hours taught per week, and student contact hours per week, by gender and race/ethnicity: Table 10.—Fall 1998
Course For-credit Hours taught Student contact Race/ethnicity preparations classes per week hours per week*
Total 2.6 3.4 11.0 321 Race/ethnicity White, non-Hispanic 2.6 3.4 11.1 323 Black, non-Hispanic 2.6 3.8 11.4 309 Asian/Pacific Islander 2.2 3.1 10.0 288 Hispanic 2.5 3.6 11.5 312 American Indian/Alaska Native 2.7 3.9 11.7 429
Total 2.5 3.3 10.8 330 Race/ethnicity White, non-Hispanic 2.5 3.3 10.8 331 Black, non-Hispanic 2.7 3.8 11.9 338 Asian/Pacific Islander 2.2 3.1 9.7 290 Hispanic 2.5 3.7 11.3 317 American Indian/Alaska Native 2.7 4.3 12.9 485
Total 2.6 3.5 11.4 304 Race/ethnicity White, non-Hispanic 2.6 3.5 11.5 308 Black, non-Hispanic 2.5 3.8 10.8 278 Asian/Pacific Islander 2.3 3.1 10.8 286 Hispanic 2.5 3.5 11.9 303 American Indian/Alaska Native (#) (#) (#) (#)
#Too small to report.*Product of number of students in class by number of hours per week the class met, summed over up to five for-credit classes.
NOTE: Includes full-time instructional faculty and staff at Title IV degree-granting institutions with at least some instructional duties for credit.
SOURCE: U.S. Department of Education, National Center for Education Statistics, 1999 National Study of PostsecondaryFaculty (NSOPF:99).
Total
Male
Female
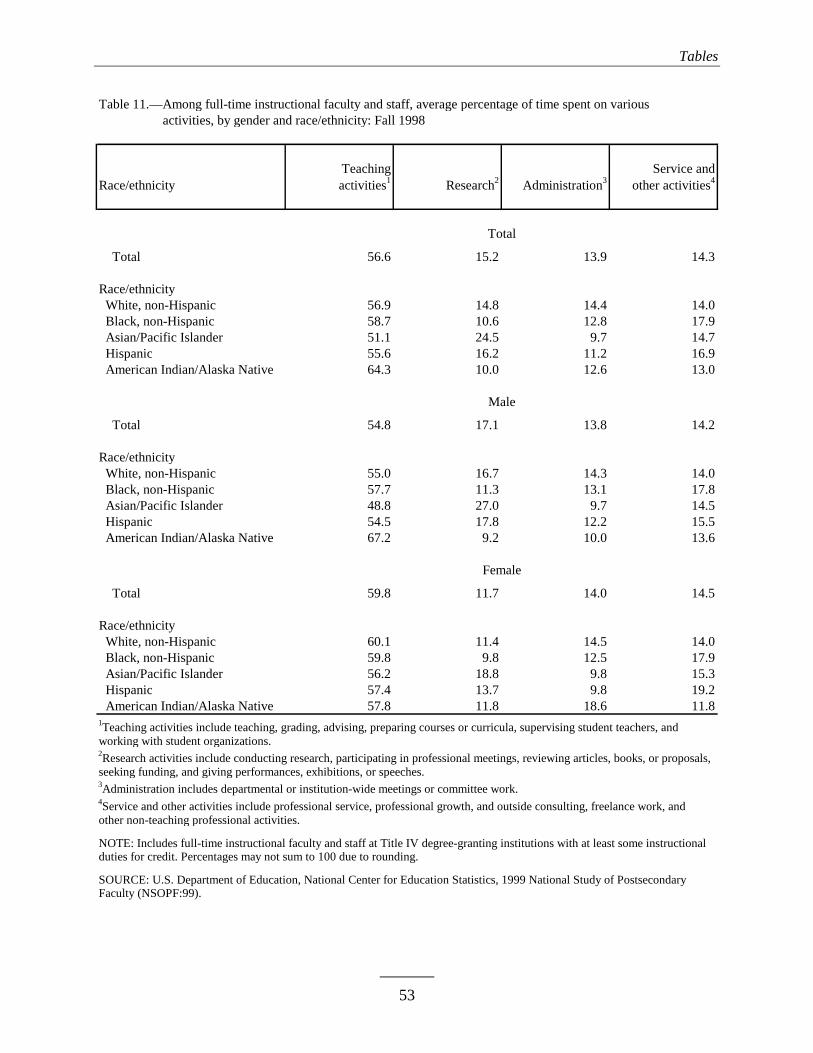
Tables
53
Table 11.—Among full-time instructional faculty and staff, average percentage of time spent on various Table 11.—activities, by gender and race/ethnicity: Fall 1998
Teaching Service andRace/ethnicity activities1 Research2 Administration3 other activities4
Total 56.6 15.2 13.9 14.3 Race/ethnicity White, non-Hispanic 56.9 14.8 14.4 14.0 Black, non-Hispanic 58.7 10.6 12.8 17.9 Asian/Pacific Islander 51.1 24.5 9.7 14.7 Hispanic 55.6 16.2 11.2 16.9 American Indian/Alaska Native 64.3 10.0 12.6 13.0
Total 54.8 17.1 13.8 14.2 Race/ethnicity White, non-Hispanic 55.0 16.7 14.3 14.0 Black, non-Hispanic 57.7 11.3 13.1 17.8 Asian/Pacific Islander 48.8 27.0 9.7 14.5 Hispanic 54.5 17.8 12.2 15.5 American Indian/Alaska Native 67.2 9.2 10.0 13.6
Total 59.8 11.7 14.0 14.5 Race/ethnicity White, non-Hispanic 60.1 11.4 14.5 14.0 Black, non-Hispanic 59.8 9.8 12.5 17.9 Asian/Pacific Islander 56.2 18.8 9.8 15.3 Hispanic 57.4 13.7 9.8 19.2 American Indian/Alaska Native 57.8 11.8 18.6 11.81Teaching activities include teaching, grading, advising, preparing courses or curricula, supervising student teachers, andworking with student organizations.2Research activities include conducting research, participating in professional meetings, reviewing articles, books, or proposals,seeking funding, and giving performances, exhibitions, or speeches.3Administration includes departmental or institution-wide meetings or committee work.4Service and other activities include professional service, professional growth, and outside consulting, freelance work, andother non-teaching professional activities.
NOTE: Includes full-time instructional faculty and staff at Title IV degree-granting institutions with at least some instructional duties for credit. Percentages may not sum to 100 due to rounding.
SOURCE: U.S. Department of Education, National Center for Education Statistics, 1999 National Study of PostsecondaryFaculty (NSOPF:99).
Male
Female
Total
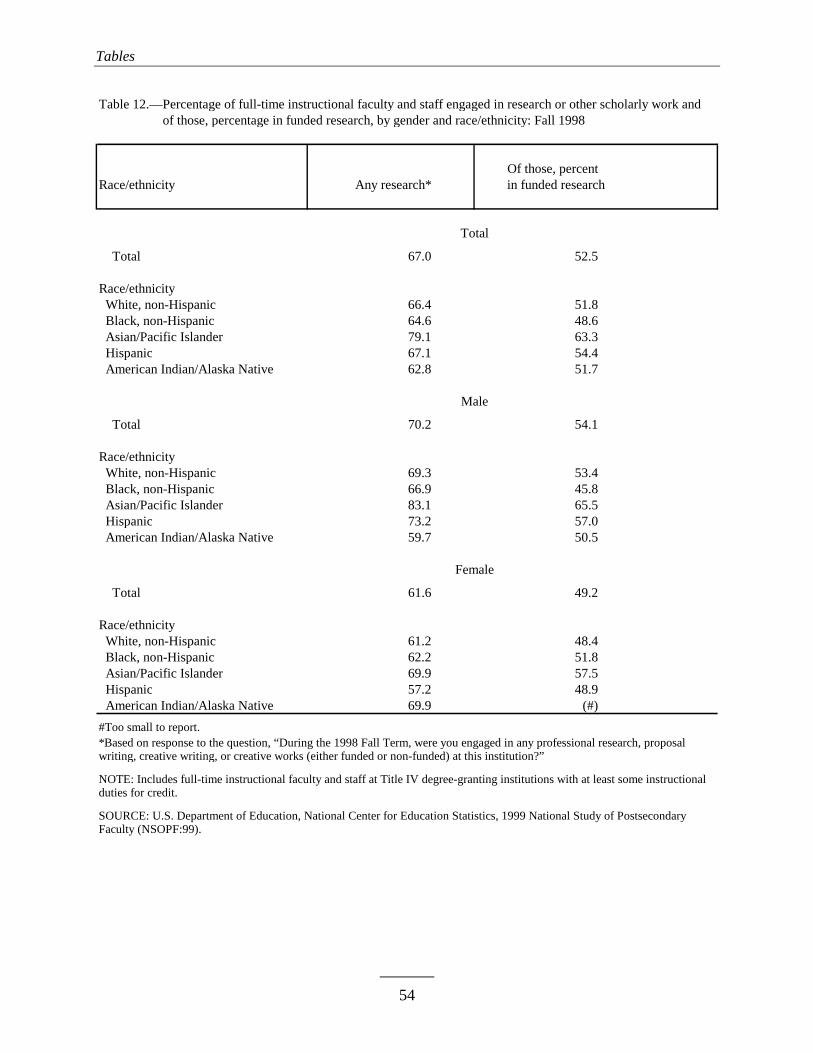
Tables
54
Table 12.—Percentage of full-time instructional faculty and staff engaged in research or other scholarly work andTable 12.—of those, percentage in funded research, by gender and race/ethnicity: Fall 1998
Of those, percent Race/ethnicity Any research* in funded research
Total 67.0 52.5 Race/ethnicity White, non-Hispanic 66.4 51.8 Black, non-Hispanic 64.6 48.6 Asian/Pacific Islander 79.1 63.3 Hispanic 67.1 54.4 American Indian/Alaska Native 62.8 51.7
Total 70.2 54.1 Race/ethnicity White, non-Hispanic 69.3 53.4 Black, non-Hispanic 66.9 45.8 Asian/Pacific Islander 83.1 65.5 Hispanic 73.2 57.0 American Indian/Alaska Native 59.7 50.5
Total 61.6 49.2 Race/ethnicity White, non-Hispanic 61.2 48.4 Black, non-Hispanic 62.2 51.8 Asian/Pacific Islander 69.9 57.5 Hispanic 57.2 48.9 American Indian/Alaska Native 69.9 (#)
#Too small to report.*Based on response to the question, “During the 1998 Fall Term, were you engaged in any professional research, proposalwriting, creative writing, or creative works (either funded or non-funded) at this institution?”
NOTE: Includes full-time instructional faculty and staff at Title IV degree-granting institutions with at least some instructional duties for credit.
SOURCE: U.S. Department of Education, National Center for Education Statistics, 1999 National Study of PostsecondaryFaculty (NSOPF:99).
Male
Female
Total
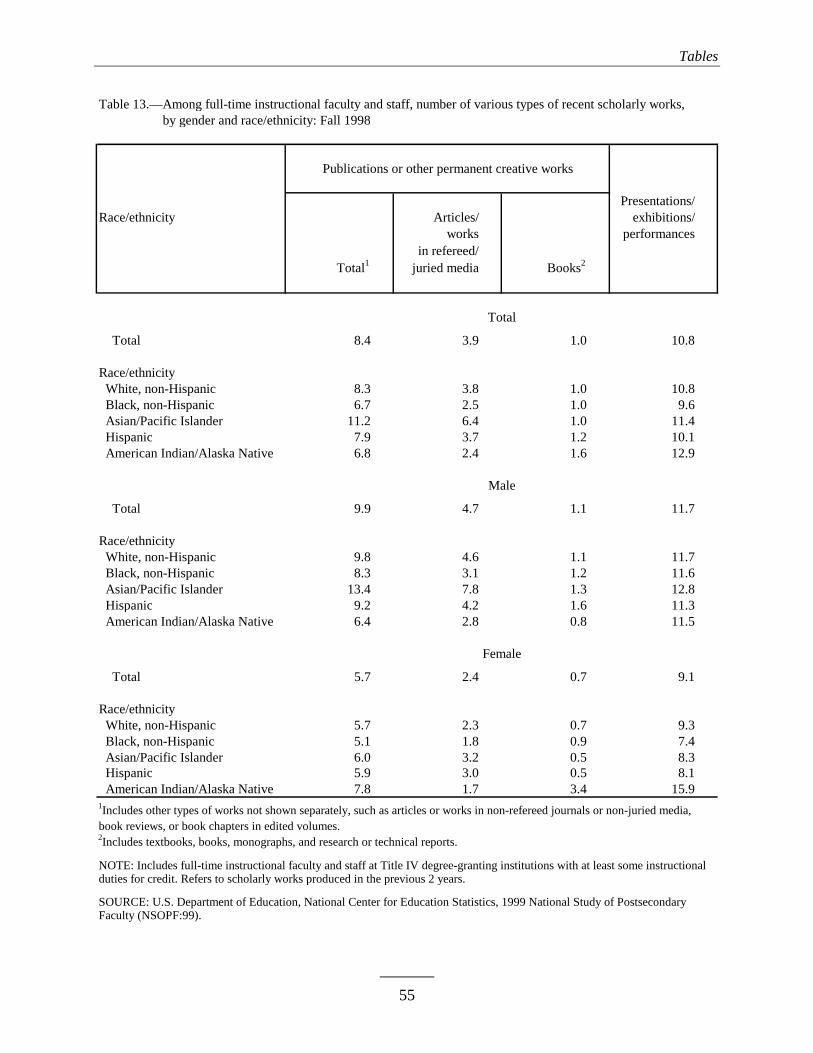
Tables
55
Table 13.—Among full-time instructional faculty and staff, number of various types of recent scholarly works,Table 13.—by gender and race/ethnicity: Fall 1998
Publications or other permanent creative works
Presentations/ Race/ethnicity Articles/ exhibitions/ works performances in refereed/
Total1fffff juried media Books2fffff
Total 8.4 3.9 1.0 10.8 Race/ethnicity White, non-Hispanic 8.3 3.8 1.0 10.8 Black, non-Hispanic 6.7 2.5 1.0 9.6 Asian/Pacific Islander 11.2 6.4 1.0 11.4 Hispanic 7.9 3.7 1.2 10.1 American Indian/Alaska Native 6.8 2.4 1.6 12.9
Total 9.9 4.7 1.1 11.7 Race/ethnicity White, non-Hispanic 9.8 4.6 1.1 11.7 Black, non-Hispanic 8.3 3.1 1.2 11.6 Asian/Pacific Islander 13.4 7.8 1.3 12.8 Hispanic 9.2 4.2 1.6 11.3 American Indian/Alaska Native 6.4 2.8 0.8 11.5
Total 5.7 2.4 0.7 9.1 Race/ethnicity White, non-Hispanic 5.7 2.3 0.7 9.3 Black, non-Hispanic 5.1 1.8 0.9 7.4 Asian/Pacific Islander 6.0 3.2 0.5 8.3 Hispanic 5.9 3.0 0.5 8.1 American Indian/Alaska Native 7.8 1.7 3.4 15.9 1Includes other types of works not shown separately, such as articles or works in non-refereed journals or non-juried media,book reviews, or book chapters in edited volumes.2Includes textbooks, books, monographs, and research or technical reports.
NOTE: Includes full-time instructional faculty and staff at Title IV degree-granting institutions with at least some instructional duties for credit. Refers to scholarly works produced in the previous 2 years.
SOURCE: U.S. Department of Education, National Center for Education Statistics, 1999 National Study of PostsecondaryFaculty (NSOPF:99).
Total
Male
Female
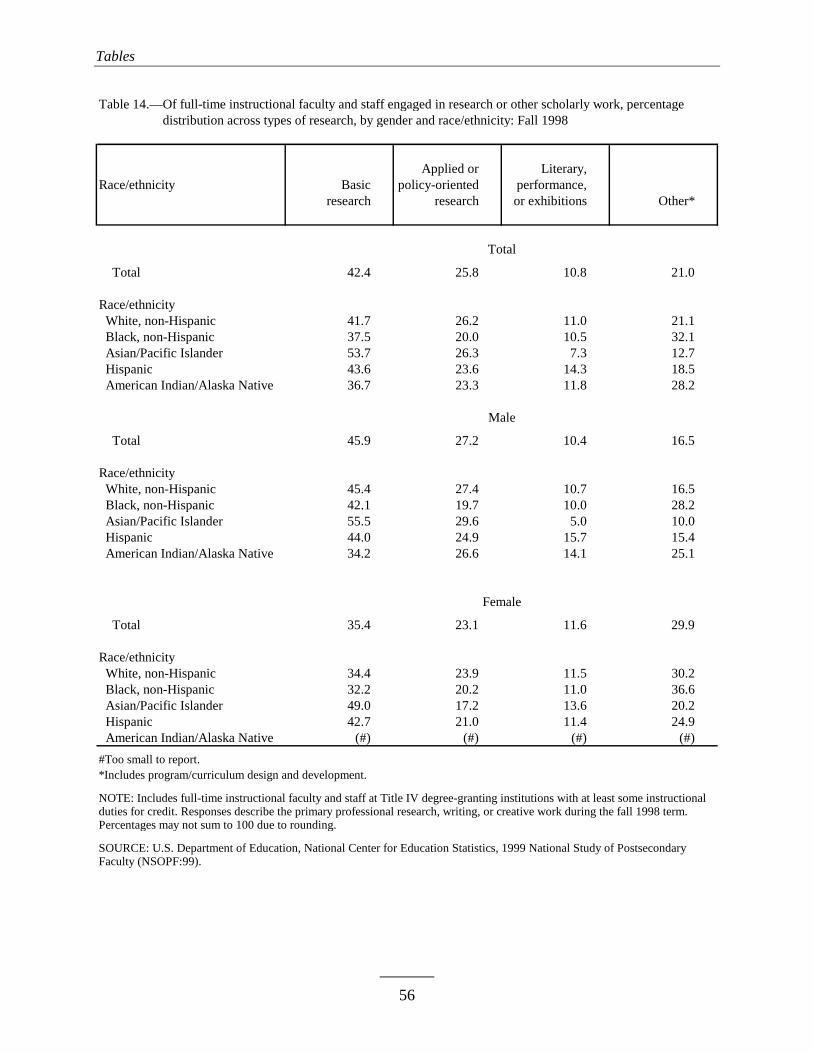
Tables
56
Table 14.—Of full-time instructional faculty and staff engaged in research or other scholarly work, percentageTable 14.—distribution across types of research, by gender and race/ethnicity: Fall 1998
Applied or Literary, Race/ethnicity Basic policy-oriented performance, research research or exhibitions Other*
Total 42.4 25.8 10.8 21.0 Race/ethnicity White, non-Hispanic 41.7 26.2 11.0 21.1 Black, non-Hispanic 37.5 20.0 10.5 32.1 Asian/Pacific Islander 53.7 26.3 7.3 12.7 Hispanic 43.6 23.6 14.3 18.5 American Indian/Alaska Native 36.7 23.3 11.8 28.2
Total 45.9 27.2 10.4 16.5 Race/ethnicity White, non-Hispanic 45.4 27.4 10.7 16.5 Black, non-Hispanic 42.1 19.7 10.0 28.2 Asian/Pacific Islander 55.5 29.6 5.0 10.0 Hispanic 44.0 24.9 15.7 15.4 American Indian/Alaska Native 34.2 26.6 14.1 25.1
Total 35.4 23.1 11.6 29.9 Race/ethnicity White, non-Hispanic 34.4 23.9 11.5 30.2 Black, non-Hispanic 32.2 20.2 11.0 36.6 Asian/Pacific Islander 49.0 17.2 13.6 20.2 Hispanic 42.7 21.0 11.4 24.9 American Indian/Alaska Native (#) (#) (#) (#)
#Too small to report.*Includes program/curriculum design and development.
NOTE: Includes full-time instructional faculty and staff at Title IV degree-granting institutions with at least some instructional duties for credit. Responses describe the primary professional research, writing, or creative work during the fall 1998 term. Percentages may not sum to 100 due to rounding.
SOURCE: U.S. Department of Education, National Center for Education Statistics, 1999 National Study of PostsecondaryFaculty (NSOPF:99).
Male
Female
Total

Tables
57
Table 15.—Average base salary of full-time instructional faculty and staff at degree-granting institutions, and Table 15.—average salary after taking into account the covariation of the variables listed, by selectedTable 15.—characteristics: Calendar year 1998
Unadjustedfff Adjusted Least squaresfff Standardfffmean2fff mean3fff coefficient4fff error5fff
Total $56,851 $56,851 $67,339 $2,797
Gender Female 48,374* 53,620* -5,074 1,015 Male 61,685 58,694 (†) (†)
Race/ethnicity White, non-Hispanic 57,003 56,618 (†) (†) Black, non-Hispanic 50,360* 56,950 332 2,075 Asian/Pacific Islander 62,798* 60,331 3,714 1,961 Hispanic 54,372 57,042 424 2,543 American Indian/Alaska Native 48,095* 54,873 -1,744 5,360
Institutional type Public doctoral 66,120* 59,641* 4,191 1,827 Private, not-for-profit doctoral 77,649* 67,424* 11,974 2,218 Private, not-for-profit liberal arts 43,605 51,349* -4,101 2,052 Public 2-year 44,636 55,450 (†) (†) Other6 49,307* 51,885* -3,566 1,610
Field of teaching Business/law/communications 57,724 59,586* 5,245 1,699 Health sciences 75,238* 72,491* 18,151 1,589 Humanities 47,703* 51,017* -3,323 1,531 Natural sciences and engineering 58,449 54,341 (†) (†) Social sciences/education 54,276 54,204 -136 1,447 Occupationally specific 47,224* 55,199 858 2,857 Other 49,339* 52,308 -2,033 1,549
Level of instruction Undergraduates only 48,840* 55,136* -3,086 1,359 Both graduates and undergraduates 61,016 58,222 (†) (†) Graduates only 74,104* 62,238* 4,016 1,639
Tenure status Tenured 65,399 59,055 (†) (†) Tenure track 48,835* 56,959 -2,096 1,632 Not on tenure track 47,889* 51,824* -7,232 1,659 No tenure system 42,725* 54,049* -5,006 1,787
Academic rank Full professor 74,762 66,468 (†) (†) Associate professor 57,685* 53,722* -12,746 1,330 Assistant professor 48,229* 51,730* -14,738 1,770 Other 40,725* 52,261* -14,207 1,833
See footnotes at end of table.
Variable1
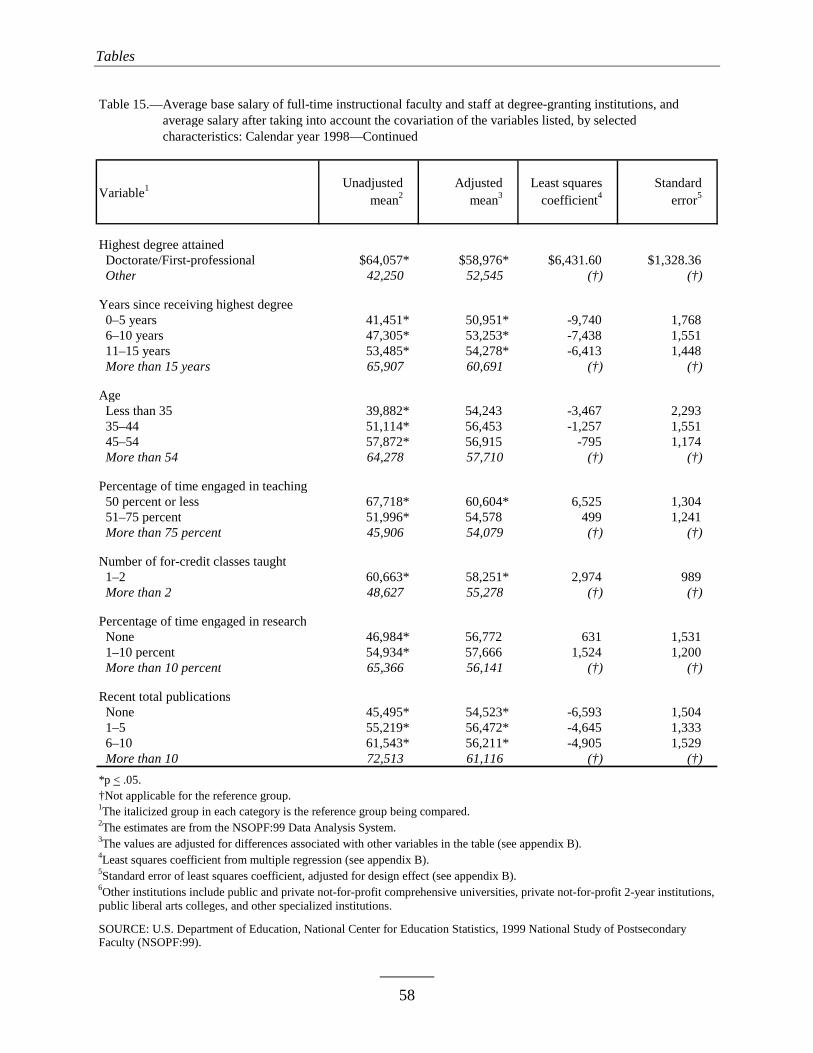
Tables
58
Table 15.—Average base salary of full-time instructional faculty and staff at degree-granting institutions, and Table 15.—average salary after taking into account the covariation of the variables listed, by selectedTable 15.—characteristics: Calendar year 1998—Continued
Unadjustedfff Adjustedfff Least squaresfff Standardfffmean2fff mean3fff coefficient4fff error5fff
Highest degree attained Doctorate/First-professional $64,057* $58,976* $6,431.60 $1,328.36 Other 42,250 52,545 (†) (†)
Years since receiving highest degree 0–5 years 41,451* 50,951* -9,740 1,768 6–10 years 47,305* 53,253* -7,438 1,551 11–15 years 53,485* 54,278* -6,413 1,448 More than 15 years 65,907 60,691 (†) (†)
Age Less than 35 39,882* 54,243 -3,467 2,293 35–44 51,114* 56,453 -1,257 1,551 45–54 57,872* 56,915 -795 1,174 More than 54 64,278 57,710 (†) (†)
Percentage of time engaged in teaching 50 percent or less 67,718* 60,604* 6,525 1,304 51–75 percent 51,996* 54,578 499 1,241 More than 75 percent 45,906 54,079 (†) (†)
Number of for-credit classes taught 1–2 60,663* 58,251* 2,974 989 More than 2 48,627 55,278 (†) (†)
Percentage of time engaged in research None 46,984* 56,772 631 1,531 1–10 percent 54,934* 57,666 1,524 1,200 More than 10 percent 65,366 56,141 (†) (†)
Recent total publications None 45,495* 54,523* -6,593 1,504 1–5 55,219* 56,472* -4,645 1,333 6–10 61,543* 56,211* -4,905 1,529 More than 10 72,513 61,116 (†) (†)
*p < .05.†Not applicable for the reference group.1The italicized group in each category is the reference group being compared.2The estimates are from the NSOPF:99 Data Analysis System.3The values are adjusted for differences associated with other variables in the table (see appendix B).4Least squares coefficient from multiple regression (see appendix B).5Standard error of least squares coefficient, adjusted for design effect (see appendix B).6Other institutions include public and private not-for-profit comprehensive universities, private not-for-profit 2-year institutions,public liberal arts colleges, and other specialized institutions.
SOURCE: U.S. Department of Education, National Center for Education Statistics, 1999 National Study of PostsecondaryFaculty (NSOPF:99).
Variable1
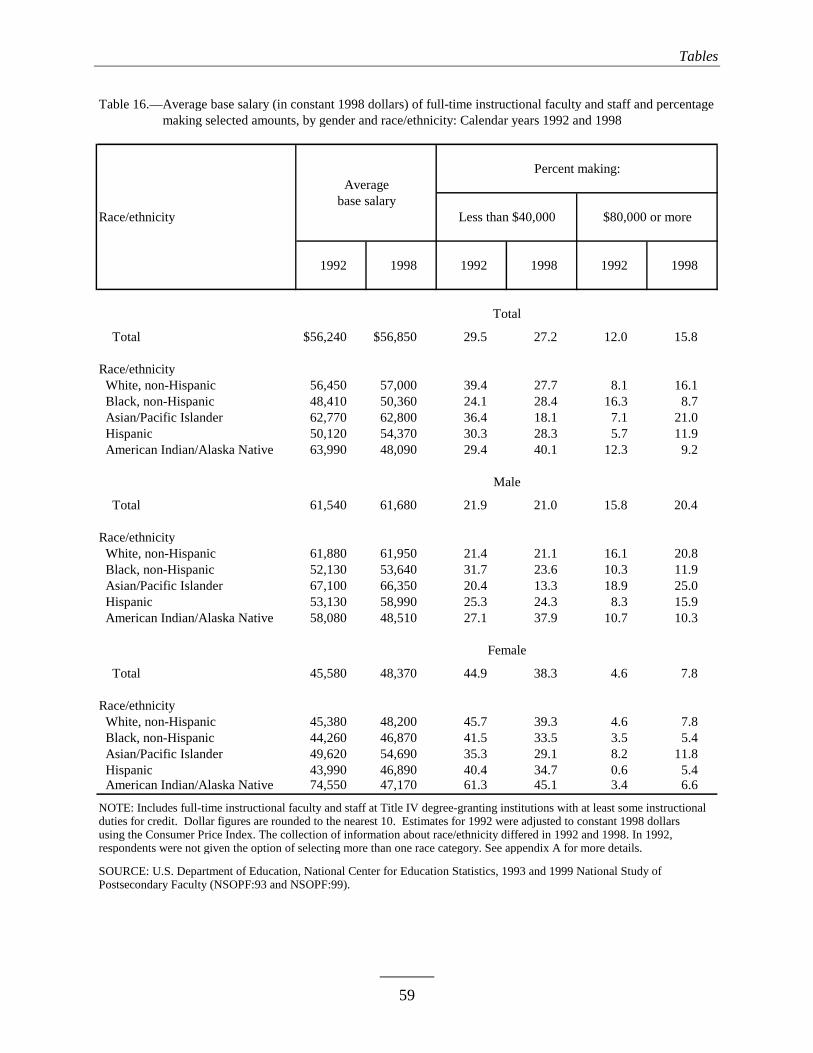
Tables
59
Table 16.—Average base salary (in constant 1998 dollars) of full-time instructional faculty and staff and percentage Table 16.—making selected amounts, by gender and race/ethnicity: Calendar years 1992 and 1998
Race/ethnicity
1992 1998 1992 1998 1992 1998
Total $56,240 $56,850 29.5 27.2 12.0 15.8 Race/ethnicity White, non-Hispanic 56,450 57,000 39.4 27.7 8.1 16.1 Black, non-Hispanic 48,410 50,360 24.1 28.4 16.3 8.7 Asian/Pacific Islander 62,770 62,800 36.4 18.1 7.1 21.0 Hispanic 50,120 54,370 30.3 28.3 5.7 11.9 American Indian/Alaska Native 63,990 48,090 29.4 40.1 12.3 9.2
Total 61,540 61,680 21.9 21.0 15.8 20.4 Race/ethnicity White, non-Hispanic 61,880 61,950 21.4 21.1 16.1 20.8 Black, non-Hispanic 52,130 53,640 31.7 23.6 10.3 11.9 Asian/Pacific Islander 67,100 66,350 20.4 13.3 18.9 25.0 Hispanic 53,130 58,990 25.3 24.3 8.3 15.9 American Indian/Alaska Native 58,080 48,510 27.1 37.9 10.7 10.3
Total 45,580 48,370 44.9 38.3 4.6 7.8 Race/ethnicity White, non-Hispanic 45,380 48,200 45.7 39.3 4.6 7.8 Black, non-Hispanic 44,260 46,870 41.5 33.5 3.5 5.4 Asian/Pacific Islander 49,620 54,690 35.3 29.1 8.2 11.8 Hispanic 43,990 46,890 40.4 34.7 0.6 5.4 American Indian/Alaska Native 74,550 47,170 61.3 45.1 3.4 6.6
NOTE: Includes full-time instructional faculty and staff at Title IV degree-granting institutions with at least some instructional duties for credit. Dollar figures are rounded to the nearest 10. Estimates for 1992 were adjusted to constant 1998 dollars using the Consumer Price Index. The collection of information about race/ethnicity differed in 1992 and 1998. In 1992, respondents were not given the option of selecting more than one race category. See appendix A for more details.
SOURCE: U.S. Department of Education, National Center for Education Statistics, 1993 and 1999 National Study ofPostsecondary Faculty (NSOPF:93 and NSOPF:99).
Female
Percent making:Average
Total
Male
base salary$80,000 or moreLess than $40,000

Tables
60
Table 17.—Percentage of full-time instructional faculty and staff at selected types of institutions, by gender andTable 17.—race/ethnicity: Fall 1992 and fall 1998
Race/ethnicity
1992 1998 1992 1998 1992 1998
Total 31.9 34.9 11.7 10.6 20.7 18.3 Race/ethnicity White, non-Hispanic 32.1 34.8 11.4 10.5 20.4 18.3 Black, non-Hispanic 20.3 23.2 11.2 8.2 24.7 21.5 Asian/Pacific Islander 40.6 46.8 16.9 14.2 12.9 10.6 Hispanic 32.3 34.8 12.4 11.7 32.3 25.5 American Indian/Alaska Native 21.7 34.2 5.1 5.7 40.9 19.9
Total 35.5 38.0 12.6 11.7 16.9 14.4 Race/ethnicity White, non-Hispanic 35.6 38.1 12.4 11.7 16.8 14.4 Black, non-Hispanic 20.9 20.3 13.2 8.9 18.9 16.8 Asian/Pacific Islander 44.0 51.1 16.6 14.8 9.8 6.1 Hispanic 36.3 33.9 13.1 13.2 29.1 24.2 American Indian/Alaska Native 23.9 34.0 4.8 5.3 44.2 24.7
Total 24.7 29.4 9.7 8.7 28.3 25.1 Race/ethnicity White, non-Hispanic 24.9 28.9 9.4 8.5 27.9 25.3 Black, non-Hispanic 19.6 26.3 9.0 7.5 31.2 26.5 Asian/Pacific Islander 30.4 37.2 17.8 13.1 22.2 20.7 Hispanic 24.0 36.2 11.1 9.3 39.0 27.7 American Indian/Alaska Native 17.8 34.5 5.6 6.6 35.0 9.1
*Includes research, doctoral, and medical institutions.
NOTE: Includes full-time instructional faculty and staff at Title IV degree-granting institutions with at least some instructional duties for credit. The collection of information about race/ethnicity differed in 1992 and 1998. In 1992, respondents were not given the option of selecting more than one race category. See appendix A for more details.
SOURCE: U.S. Department of Education, National Center for Education Statistics, 1993 and 1999 National Study ofPostsecondary Faculty (NSOPF:93 and NSOPF:99).
Female
Public doctoral* Public 2-yearPrivate not-for-profit doctoral*
Total
Male

Tables
61
Table 18.—Percentage of full-time instructional faculty and staff whose highest degree is a doctoral or master’sTable 18.—degree, by gender and race/ethnicity: Fall 1992 and fall 1998
Race/ethnicity
1992 1998 1992 1998
Total 65.1 67.0 29.7 27.8 Race/ethnicity White, non-Hispanic 65.2 66.6 29.7 27.9 Black, non-Hispanic 53.2 57.5 40.8 38.5 Asian/Pacific Islander 79.3 84.5 18.1 14.6 Hispanic 63.2 64.0 28.2 29.6 American Indian/Alaska Native 48.1 53.2 41.1 38.2
Total 72.9 74.2 22.4 21.5 Race/ethnicity White, non-Hispanic 72.9 73.9 22.5 21.6 Black, non-Hispanic 61.6 63.4 33.6 33.7 Asian/Pacific Islander 85.8 89.9 11.4 9.4 Hispanic 66.1 70.5 24.7 23.8 American Indian/Alaska Native 55.9 50.4 30.5 40.9
Total 49.6 54.3 44.3 38.9 Race/ethnicity White, non-Hispanic 49.5 53.5 44.4 39.2 Black, non-Hispanic 43.9 51.1 48.7 43.7 Asian/Pacific Islander 59.3 72.1 38.2 26.6 Hispanic 57.3 53.6 35.2 39.2 American Indian/Alaska Native 34.4 59.3 59.8 32.2
NOTE: Includes full-time instructional faculty and staff at Title IV degree-granting institutions with at least some instructional duties for credit. The collection of information about race/ethnicity differed in 1992 and 1998. In 1992, respondents were not given the option of selecting more than one race category. See appendix A for more details.
SOURCE: U.S. Department of Education, National Center for Education Statistics, 1993 and 1999 National Study ofPostsecondary Faculty (NSOPF:93 and NSOPF:99).
Female
Doctoral/first-professional Master’s
Total
Male

Tables
62
Table 19.—Percentage of full-time instructional faculty and staff at selected academic ranks, by gender andTable 19.—race/ethnicity: Fall 1992 and fall 1998
Race/ethnicity1992 1998 1992 1998 1992 1998
Total 30.4 30.7 23.5 22.3 22.7 23.4 Race/ethnicity White, non-Hispanic 31.5 32.2 22.6 21.0 22.2 23.3 Black, non-Hispanic 19.6 17.5 27.6 32.8 29.3 24.6 Asian/Pacific Islander 28.1 25.9 31.9 30.9 19.5 17.5 Hispanic 21.7 25.3 29.6 24.1 28.1 31.6 American Indian/Alaska Native 16.1 17.8 21.0 23.6 42.7 41.1
Total 37.9 38.2 20.1 19.3 17.3 18.2 Race/ethnicity White, non-Hispanic 39.3 39.8 19.0 18.0 16.6 18.0 Black, non-Hispanic 24.6 23.6 25.1 29.0 25.1 20.0 Asian/Pacific Islander 34.1 31.4 29.4 29.4 15.5 11.1 Hispanic 25.6 31.4 27.7 20.3 27.1 28.0 American Indian/Alaska Native 19.9 23.6 16.5 16.9 40.2 41.3
Total 15.2 17.6 30.5 27.6 33.5 32.6 Race/ethnicity White, non-Hispanic 15.7 18.5 30.0 26.3 33.6 32.6 Black, non-Hispanic 14.0 11.0 30.4 36.7 34.0 29.4 Asian/Pacific Islander 9.9 13.3 39.8 34.3 31.7 32.0 Hispanic 13.7 15.4 33.4 30.2 30.2 37.3 American Indian/Alaska Native 9.3 5.0 29.0 38.6 47.1 40.7
*Includes instructors, lecturers, other ranks, and those without an academic rank.
NOTE: Includes full-time instructional faculty and staff at Title IV degree-granting institutions with at least some instructional duties for credit. The collection of information about race/ethnicity differed in 1992 and 1998. In 1992, respondents were not given the option of selecting more than one race category. See appendix A for more details.
SOURCE: U.S. Department of Education, National Center for Education Statistics, 1993 and 1999 National Study ofPostsecondary Faculty (NSOPF:93 and NSOPF:99).
Male
Female
Other*Assistant professorFull professor
Total
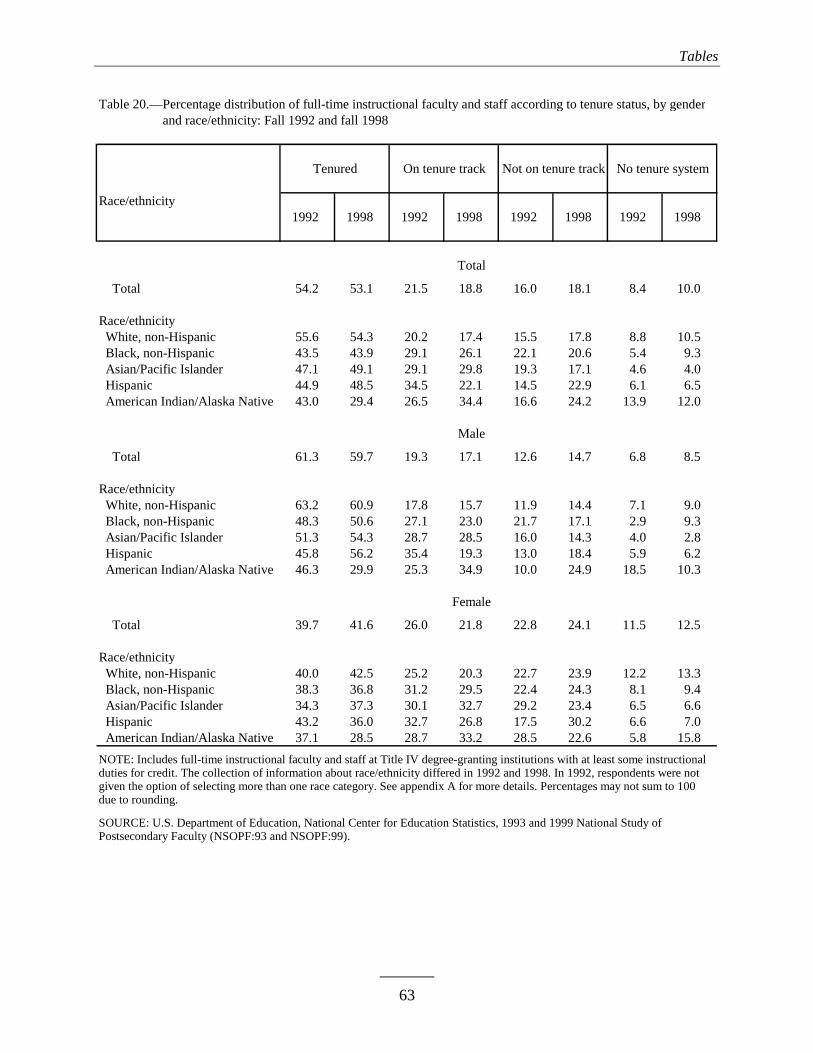
Tables
63
Table 20.—Percentage distribution of full-time instructional faculty and staff according to tenure status, by genderTable 20.—and race/ethnicity: Fall 1992 and fall 1998
Race/ethnicity 1992 1998 1992 1998 1992 1998 1992 1998
Total
Total 54.2 53.1 21.5 18.8 16.0 18.1 8.4 10.0 Race/ethnicity White, non-Hispanic 55.6 54.3 20.2 17.4 15.5 17.8 8.8 10.5 Black, non-Hispanic 43.5 43.9 29.1 26.1 22.1 20.6 5.4 9.3 Asian/Pacific Islander 47.1 49.1 29.1 29.8 19.3 17.1 4.6 4.0 Hispanic 44.9 48.5 34.5 22.1 14.5 22.9 6.1 6.5 American Indian/Alaska Native 43.0 29.4 26.5 34.4 16.6 24.2 13.9 12.0
Male
Total 61.3 59.7 19.3 17.1 12.6 14.7 6.8 8.5 Race/ethnicity White, non-Hispanic 63.2 60.9 17.8 15.7 11.9 14.4 7.1 9.0 Black, non-Hispanic 48.3 50.6 27.1 23.0 21.7 17.1 2.9 9.3 Asian/Pacific Islander 51.3 54.3 28.7 28.5 16.0 14.3 4.0 2.8 Hispanic 45.8 56.2 35.4 19.3 13.0 18.4 5.9 6.2 American Indian/Alaska Native 46.3 29.9 25.3 34.9 10.0 24.9 18.5 10.3
Female
Total 39.7 41.6 26.0 21.8 22.8 24.1 11.5 12.5 Race/ethnicity White, non-Hispanic 40.0 42.5 25.2 20.3 22.7 23.9 12.2 13.3 Black, non-Hispanic 38.3 36.8 31.2 29.5 22.4 24.3 8.1 9.4 Asian/Pacific Islander 34.3 37.3 30.1 32.7 29.2 23.4 6.5 6.6 Hispanic 43.2 36.0 32.7 26.8 17.5 30.2 6.6 7.0 American Indian/Alaska Native 37.1 28.5 28.7 33.2 28.5 22.6 5.8 15.8
NOTE: Includes full-time instructional faculty and staff at Title IV degree-granting institutions with at least some instructional duties for credit. The collection of information about race/ethnicity differed in 1992 and 1998. In 1992, respondents were not given the option of selecting more than one race category. See appendix A for more details. Percentages may not sum to 100 due to rounding.
SOURCE: U.S. Department of Education, National Center for Education Statistics, 1993 and 1999 National Study ofPostsecondary Faculty (NSOPF:93 and NSOPF:99).
Tenured On tenure track Not on tenure track No tenure system

THIS PAGE INTENTIONALLY LEFT BLANK

65
References
American Association of University Professors. (1999). Ups and Downs: The Annual Report on
the Economic Status of the Profession 1998–99. Academe, 85(2): 1–97.
Alpert, D. (1989). Gender Inequity in Academia: An Empirical Analysis. Initiatives, 52(2): 9–14.
Amott, T.L., and Matthaei, J.A. (1991). Race, Gender and Work: A Multicultural Economic
History of Women in the United States. Boston: South End Press.
Ashraf, J. (1996). The Influence of Gender on Faculty Salaries in the United States, 1969–89.
Applied Economics, 28: 857–864.
Barbezat, D.A. (1991). Updating Estimates of Male-Female Salary Differentials in the Academic
Labor Market. Economics Letters, 36: 191–195.
Bell, L.A. (2001). More Good News, So Why the Blues? Academe, 86(2): 11–95.
Bellas, M.L. (1997). Disciplinary Differences in Faculty Salaries: Does Gender Bias Play a
Role? Journal of Higher Education, 68(3): 299–321.
Bellas, M.L. (1999). Emotional Labor in Academia: The Case of Professors. The Annals of the
American Academy of Political and Social Science, 561: 96–110.
Bellas, M.L., and Toutkoushian, R.K. (1999). Faculty Time Allocations and Research
Productivity: Gender, Race, and Family Effects. Review of Higher Education, 22(4): 367–
390.
Benjamin, E. (1999). Disparities in the Salaries and Appointments of Academic Women and
Men. Academe, 85(1): 60–62.
Chamberlain, M.K. (Ed.) (1988). Women in Academe: Progress and Prospects. New York:
Russell Sage Foundation. (ERIC ED311820).
Cohen, Jacob. (1988). Statistical Power Analysis for the Behavioral Sciences, 2nd Edition.
Hillsdale, NJ: Lawrence Erlbaum Associates.

References
66
England, P. (1992). Comparable Worth: Theories and Evidence. New York: Aldine de Gruyter.
Fairweather, J.S. (1993). Faculty Reward Structures: Toward Institutional and Professional
Homogenization. Research in Higher Education, 34(5): 603–623.
Fairweather, J.S. (1995). Myths and Realities of Academic Labor Markets. Economics of
Education Review, 14(2): 179–192.
Glazer-Raymo, J. (1999). Shattering the Myths: Women in Academe. Baltimore: The Johns
Hopkins University Press.
Hansen, W.L. (1985). Salary Differences Across Disciplines. Academe, 71(4): 6–7.
Hearn, J.C. (1999). Pay and Performance in the University: An Examination of Faculty Salaries.
Review of Higher Education, 22(4): 391–410.
Hirsch, B.T., and Leppel, K. (1982). Sex Discrimination in Faculty Salaries: Evidence From a
Historical Women’s University. The American Economic Review, 72(4): 829–835.
Jusenius, C.L., and Scheffler, R.M. (1981). Earnings Differentials Among Academic
Economists: Empirical Evidence on Race and Sex. Journal of Economics and Business,
33(2): 88–96.
Kemp, A.A. (1994). Women’s Work: Degraded and Devalued. Englewood Cliffs, NJ: Prentice
Hall.
Nettles, M.T., Perna, L.W., and Bradburn, E.M. (2000). Salary, Promotion, and Tenure Status of
Minority and Women Faculty in U.S. Colleges and Universities (NCES 2000–173). U.S.
Department of Education, National Center for Education Statistics. Washington, DC: U.S.
Government Printing Office.
Smallwood, S. (2001, April 20). The Price Professors Pay for Teaching at Public Universities.
The Chronicle of Higher Education, p. A18.
Smart, J.C. (1991). Gender Equity in Academic Rank and Salary. Review of Higher Education,
14(4): 511–526.
Toutkoushian, R.K. (1998a). Racial and Marital Status Differences in Faculty Pay. Journal of
Higher Education, 69(5): 513–541.
References
67
Toutkoushian, R.K. (1998b). Sex Matters Less for Younger Faculty: Evidence of Disaggregate
Pay Disparities From the 1988 and 1993 NCES Surveys. Economics of Education Review,
17(1): 55–71.
Toutkoushian, R.K. (1999). The Status of Academic Women in the 1990s: No Longer Outsiders,
But Not Yet Equals. The Quarterly Review of Economics and Finance, 39(5): 679–698.
U.S. Department of Labor, Bureau of Labor Statistics. (1999). Report on the American
Workforce. Washington, DC: Author.
Weiler, W.C. (1990, Spring). Integrating Rank Differences into a Model of Male-Female Faculty
Salary Discrimination. Quarterly Review of Economics and Business, 30(1): 3–15.

THIS PAGE INTENTIONALLY LEFT BLANK

69
Appendix A—Glossary
This glossary describes the variables used in this report. The variables were taken directly from the NSOPF:99 andNSOPF:93 Data Analysis Systems (DAS), separate NCES software applications that generate tables from theNSOPF:99 and NSOPF:93 datasets. A description of the DAS software can be found in appendix B.
In the index below, the variables are organized by general topic and, within topic, listed in the order they appear inthe report. The glossary is in alphabetical order by variable label. Variables from NSOPF:99 are given first,followed by those from NSOPF:93.
GLOSSARY INDEX
NSOPF:99 VARIABLESDEMOGRAPHIC CHARACTERISTICSRace/ethnicity (report) ................................... X03Z84Race/ethnicity (appendix B) .......................... X07Z84Gender ..................................................................Q81Age in 1999 ................................................... X01Z82
FACULTY TRAINING AND EXPERIENCEHighest degree ............................................... X01Z16Highest degree, years since receiving............ X15Z16Years held current job...................................... X01Z7Number of positions in higher educationduring career .......................................................Q23
Number of years teaching in highereducation institution............................................Q25
FACULTY APPOINTMENTSInstitution type ................................................. X03Z0Tenure status.........................................................Q10Academic rank ................................................. X01Z8
TEACHINGAny instructional duties for credit ................... X01Z1Level of students in classes for credit ............ X06Z41Principal field of teaching.............................. X03Z14Any classes for credit taught, total........................Q40Courses taught, total .............................................Q34Total student contact hours/week................... X02Z41Total hours/week teaching classes ................. X01Z41
WORKLOAD AND COMPENSATIONFull- or part-time employment at thisinstitution ..............................................................Q5
Time spent at administration............................Q31A5Time spent at research .....................................Q31A3Time spent at teaching ................................... X01Z31Time spent in other activities......................... X03Z31Any creative work/writing/research......................Q52Any funded research .............................................Q54Any creative work/writing/research, type.............Q53Recent total publications or permanent creativeworks............................................................ X08Z29
Recent total articles/works in refereed/juried media ................................................. X01Z29
Recent total books, textbooks,monographs, reports..................................... X04Z29
Recent total presentations, exhibitions,or performances............................................ X05Z29
Basic salary from institution ..............................Q76A
NSOPF:93 VARIABLESAny instructional duties for credit ................... X01Z1Full- or part-time employment at thisinstitution ..............................................................A4
Race/ethnicity .................................................X02F53Institution type ......................................................X09Gender .................................................................. F51Highest degree ............................................... X01B16Years held current job......................................X01A6Tenure status...........................................................A7Academic rank .................................................X01A9Basic salary from institution .............................. E47A
Appendix A—Glossary
70
NSOPF:99 VARIABLES
Academic rank X01Z8
Identifies a respondent’s academic rank, title, or position at their sampled institution or identifies that ranks are notassigned.
Full professorAssociate professorAssistant professorOther Includes instructors, lecturers, and those without an academic
rank.
Age in 1999 X01Z82
Reports a respondent’s age.
Any classes for credit taught, total Q40
Faculty response to the question “How many of the classes/sections that you taught during the 1998 Fall Term werefor credit?” This analysis looks at the average number of classes.
Any creative work/writing/research Q52
Faculty response to the question “During the 1998 Fall Term, were you engaged in any professional research,proposal writing, creative writing, or creative works (either funded or non-funded) at this institution?” This analysislooks at respondents who engaged in research or other scholarly work.
Any creative work/writing/research, type Q53
Faculty response to the question “How would you describe your primary professional research, writing, or creativework during the 1998 Fall Term?”
Basic researchApplied or policy-oriented researchLiterary, performance or exhibitionsOther Includes program/curriculum design, grant writing/proposals,
writing textbooks, and research that is both basic and applied.
Any funded research Q54
Faculty response to the question “During the 1998 Fall Term were you engaged in any funded research or fundedcreative work? Include any grants, contracts, or institutional awards. Do not include consulting services.” Amongthose with a “Yes” response in Q52, this analysis looks at those with a “Yes” response to this question.
Any instructional duties for credit X01Z1
Indicates whether respondents had any instructional duties for credit at the institution from which they were sampledduring the 1998 Fall Term. This analysis looks only at respondents who had instructional duties for credit.

Appendix A—Glossary
71
Basic salary from institution Q76A
Faculty response to the question “How much compensation did you receive for your basic salary for the calendaryear?” The item refers to calendar year 1998.
Courses taught, total Q34
Faculty response to the question “How many different courses (preparations) do [the total number of classes/sectionstaught in fall 1998] represent?” This analysis looks at the average number of courses.
Full- or part-time employment at this institution Q5
Faculty response to the question “During the 1998 Fall Term, did this institution consider you to be employed part-time or full-time?” This analysis looks at respondents who worked full time.
Gender Q81
Faculty response to the question “Are you male or female?”
MaleFemale
Highest degree X01Z16
Describes the highest degree or award achieved by a respondent. For this analysis, the responses were aggregatedinto the following categories:
Doctoral/first-professionalMaster’sBachelor’s or less
Highest degree, years since receiving X15Z16
Calculates the number of years since the respondent attained the highest degree. This analysis looks at the averagenumber of years.
Institution type X03Z0
A modification of the sampling strata of the NSOPF:99 institutions, based on each institution’s control and categoryin the 1994 Carnegie Classification of Institutions of Higher Education. More information about the CarnegieClassification system and the 2000 revision is available at http://www.carnegiefoundation.org/classification.
Public doctoral Includes public Research Universities I and II and DoctoralUniversities I and II. These institutions offer a full range ofbaccalaureate programs and are committed to graduateeducation through the doctorate. Also included are publicmedical schools and medical centers. These institutions awardmost of their professional degrees in medicine. In some

Appendix A—Glossary
72
instances, their programs include other health professionalschools, such as dentistry, pharmacy, or nursing.
Private not-for-profit doctoral Includes private not-for-profit Research Universities I and IIand Doctoral Universities I and II. These institutions offer afull range of baccalaureate programs and are committed tograduate education through the doctorate. Also included areprivate not-for-profit medical schools and medical centers.These institutions award most of their professional degrees inmedicine. In some instances, their programs include otherhealth professional schools, such as dentistry, pharmacy, ornursing.
Public comprehensive Includes public Master’s (Comprehensive) Colleges andUniversities I and II. These institutions offer a full range ofbaccalaureate programs and are committed to graduateeducation through the master’s degree.
Private not-for-profit comprehensive Includes private not-for-profit Master’s (Comprehensive)Colleges and Universities I and II. These institutions offer afull range of baccalaureate programs and are committed tograduate education through the master’s degree.
Private not-for-profit liberal arts Includes private not-for-profit Baccalaureate (Liberal Arts)Colleges I and II. These institutions are primarilyundergraduate colleges with major emphasis on baccalaureatedegree programs.
Public 2-year Includes public Associate of Arts Colleges. These institutionsoffer associate of arts certificate or degree programs and, withfew exceptions, offer no baccalaureate degrees.
Other Includes private not-for-profit 2-year institutions (Associate ofArts Colleges), public liberal arts colleges (BaccalaureateColleges I and II). Also included are Professional andSpecialized Institutions, which offer degrees ranging from thebachelor’s to the doctorate. At least 50 percent of the degreesawarded by these institutions are in a single discipline.
Level of students in classes for credit X06Z41
Reports a respondent’s level of classroom credit instruction based on the primary level of students in up to five for-credit classes that they taught.
Undergraduate onlyBoth undergraduate and graduateGraduate only
Number of positions in higher education during career Q23
Faculty response to the question “In total, how many professional positions in higher education institutions have youheld?” This analysis looks at the average number of positions.

Appendix A—Glossary
73
Number of years teaching in higher education institution Q25
Faculty response to the question “How many years have you been teaching in higher education institutions?” Thisanalysis looks at the average number of years.
Principal field of teaching X03Z14
Classifies the program area of a respondent’s principal field of teaching to be able to separately identifyoccupationally specific/vocational programs.
Business/law/communicationsHealth sciencesHumanitiesNatural sciences/engineeringSocial sciences/educationOccupationally specificOther Includes Agribusiness and Agriculture; Agricultural, Animal
Production; Renewable Natural Resources; Other Agriculture;Architecture and Environmental Planning; City, Communityand Regional Planning; Interior Design; Other Architectureand Environmental Planning: Art History and Appreciation;Crafts; Dance; Design; Dramatic Arts; Film Arts; Fine Arts;Music; Music History and Appreciation; Other Visual andPerforming Arts; Home Economics; Industrial Arts; Libraryand Archival Studies; Theology; Physical Education; PublicAffairs; Other.
Race/ethnicity (report) X03Z84
This derived variable was created to categorize individuals into one and only one racial/ethnic category.Respondents were asked to pick one or more race categories (White/Caucasian; Black/African American; Asian;Native Hawaiian or other Pacific Islander; or American Indian/Alaska Native) to identify themselves. Very fewindividuals picked more than one race category. Respondents also were asked to identify if they were of Hispanicorigin. For those individuals who picked more than one racial/ethnic category, a coding scheme was devised to placethem into one and only one racial/ethnic category. Asian and Native Hawaiian/other Pacific Islander categories werecombined. Then, if the respondents identified themselves as Hispanic, they were coded as Hispanic, except thatthose Asians who also indicated they were of Hispanic or Latino origin and no other race were assigned to theAsian/Pacific Islander group. If the respondents indicated they were Black or African American and any other raceother than Hispanic, they were coded as Black. If they were Asian or Pacific Islander and any other race (except forBlack), they were coded as Asian. If they were American Indian or Alaska Native and any other race (except forBlack or Asian), they were coded as Native American. This variable was used for the race/ethnicity categoriesshown in the main text of the report. For more detailed categories shown in appendix tables B1 and B2, see X07Z84below.
White, non-HispanicBlack, non-HispanicAsian/Pacific IslanderHispanicAmerican Indian/Alaska Native

Appendix A—Glossary
74
Race/ethnicity (appendix B) X07Z84
This derived variable was created to separate out respondents who are Hispanic from respondents who are single ormulti-race but not Hispanic. Respondents were asked to pick one or more race categories (White/Caucasian;Black/African American; Asian; Native Hawaiian or other Pacific Islander; or American Indian/Alaska Native) toidentify themselves. Respondents also were asked in a separate item to identify if they were of Hispanic or Latinoorigin. Those who identified themselves as Hispanic or Latino are grouped together in this variable regardless of therace(s) they selected. Then, all those who selected more than one race category were grouped together. Theremaining respondents are placed in the category of the single race group they selected. This variable was used forthe detailed categories shown in appendix tables B1 and B2. For race/ethnicity categories shown in the main text ofthe report, see X03Z84 above.
White, non-HispanicBlack or African American, non-HispanicAsian, non-HispanicNative Hawaiian or other Pacific Islander, non-HispanicAmerican Indian or Alaska Native, non-HispanicMore than one race, non-HispanicHispanic or Latino
Recent total articles/works in refereed/juried media X01Z29
Combines the total number of articles the respondent had published in the past 2 years in refereed professional ortrade journals or creative works published in juried media for which they had sole responsibility or jointresponsibility. This analysis looks at the average number of articles/works in refereed/juried media.
Recent total books, textbooks, monographs, reports X04Z29
Combines the total number of textbooks, other books, monographs, and research or technical reports disseminatedinternally or to clients that the respondent had published in the past 2 years for which they had sole responsibility orjoint responsibility. This analysis looks at the average number of books.
Recent total presentations, exhibitions, or performances X05Z29
Combines the total number of presentations at conferences and workshops; or exhibitions or performances in thefine or applied arts that the respondent had in the past 2 years for which they had sole responsibility or jointresponsibility. This analysis looks at the average number of presentations/exhibitions/performances.
Recent total publications or permanent creative works X08Z29
Combines the total number of publications over the past 2 years, whether they were sole responsibility or jointresponsibility, including articles published in refereed journals, articles published in nonrefereed journals, publishedreviews of books or chapters in edited volumes and textbooks and reports. This analysis looks at the average numberof publications.
Tenure status Q10
Faculty response to the question “What was your tenure status at this institution during the 1998 Fall Term?”
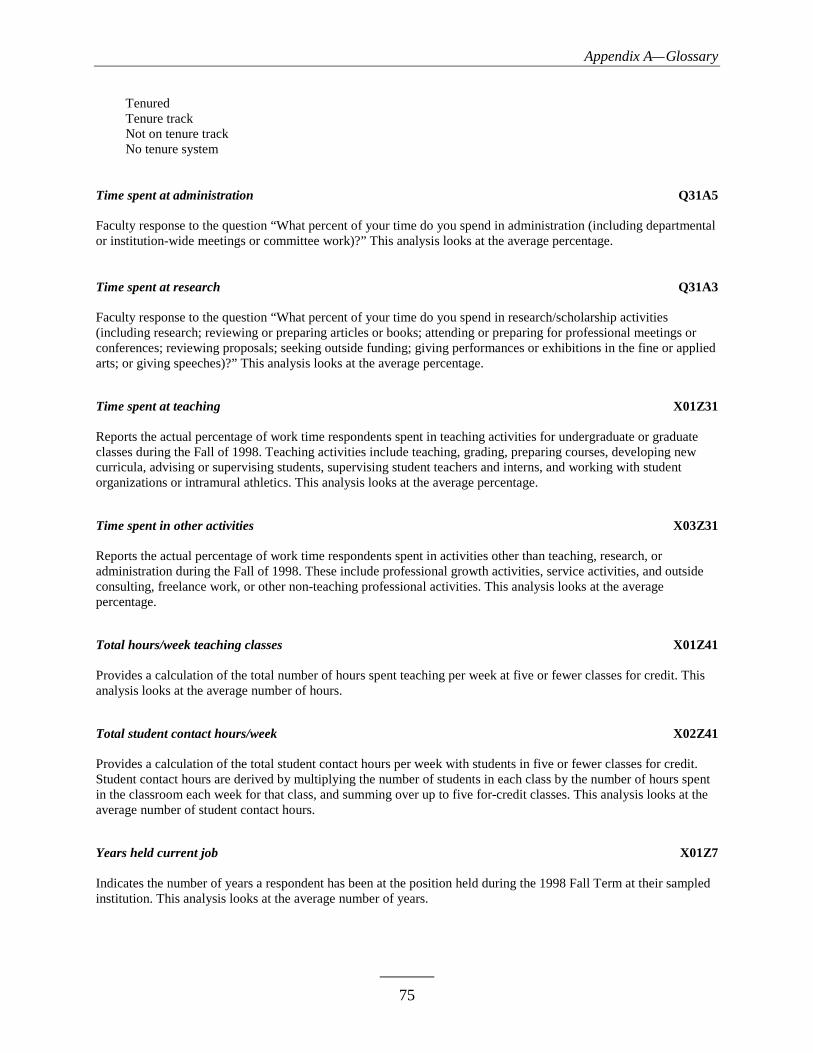
Appendix A—Glossary
75
TenuredTenure trackNot on tenure trackNo tenure system
Time spent at administration Q31A5
Faculty response to the question “What percent of your time do you spend in administration (including departmentalor institution-wide meetings or committee work)?” This analysis looks at the average percentage.
Time spent at research Q31A3
Faculty response to the question “What percent of your time do you spend in research/scholarship activities(including research; reviewing or preparing articles or books; attending or preparing for professional meetings orconferences; reviewing proposals; seeking outside funding; giving performances or exhibitions in the fine or appliedarts; or giving speeches)?” This analysis looks at the average percentage.
Time spent at teaching X01Z31
Reports the actual percentage of work time respondents spent in teaching activities for undergraduate or graduateclasses during the Fall of 1998. Teaching activities include teaching, grading, preparing courses, developing newcurricula, advising or supervising students, supervising student teachers and interns, and working with studentorganizations or intramural athletics. This analysis looks at the average percentage.
Time spent in other activities X03Z31
Reports the actual percentage of work time respondents spent in activities other than teaching, research, oradministration during the Fall of 1998. These include professional growth activities, service activities, and outsideconsulting, freelance work, or other non-teaching professional activities. This analysis looks at the averagepercentage.
Total hours/week teaching classes X01Z41
Provides a calculation of the total number of hours spent teaching per week at five or fewer classes for credit. Thisanalysis looks at the average number of hours.
Total student contact hours/week X02Z41
Provides a calculation of the total student contact hours per week with students in five or fewer classes for credit.Student contact hours are derived by multiplying the number of students in each class by the number of hours spentin the classroom each week for that class, and summing over up to five for-credit classes. This analysis looks at theaverage number of student contact hours.
Years held current job X01Z7
Indicates the number of years a respondent has been at the position held during the 1998 Fall Term at their sampledinstitution. This analysis looks at the average number of years.
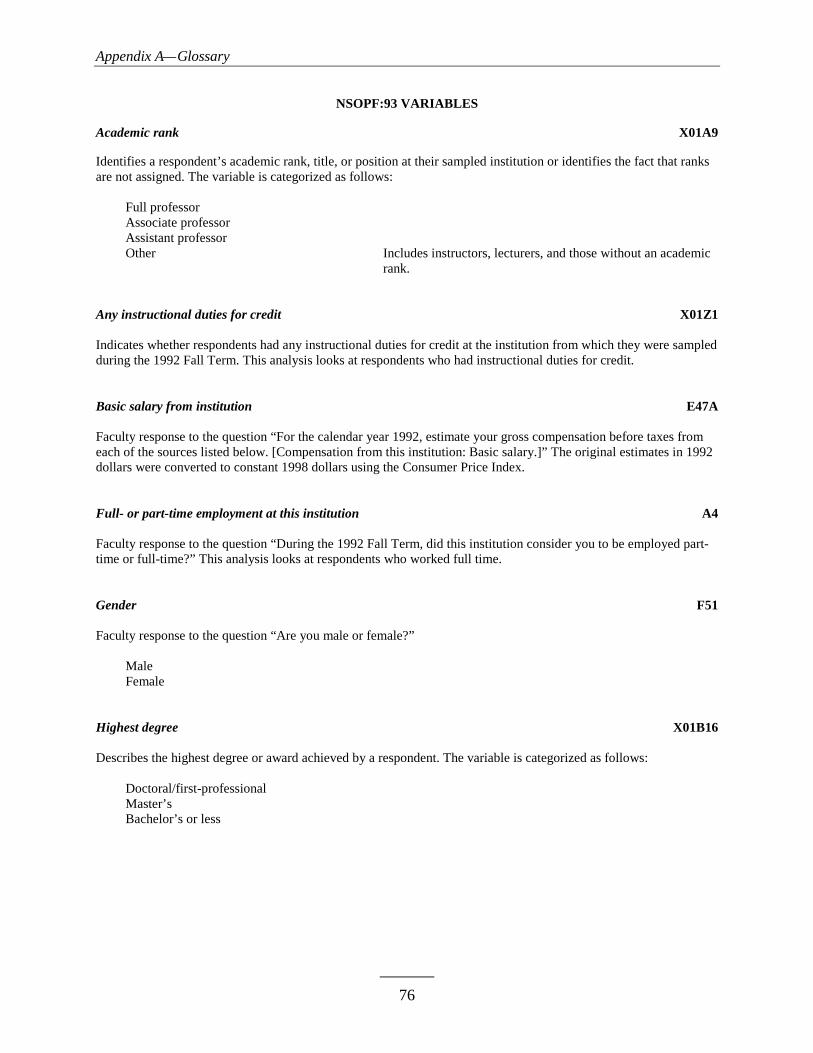
Appendix A—Glossary
76
NSOPF:93 VARIABLES
Academic rank X01A9
Identifies a respondent’s academic rank, title, or position at their sampled institution or identifies the fact that ranksare not assigned. The variable is categorized as follows:
Full professorAssociate professorAssistant professorOther Includes instructors, lecturers, and those without an academic
rank.
Any instructional duties for credit X01Z1
Indicates whether respondents had any instructional duties for credit at the institution from which they were sampledduring the 1992 Fall Term. This analysis looks at respondents who had instructional duties for credit.
Basic salary from institution E47A
Faculty response to the question “For the calendar year 1992, estimate your gross compensation before taxes fromeach of the sources listed below. [Compensation from this institution: Basic salary.]” The original estimates in 1992dollars were converted to constant 1998 dollars using the Consumer Price Index.
Full- or part-time employment at this institution A4
Faculty response to the question “During the 1992 Fall Term, did this institution consider you to be employed part-time or full-time?” This analysis looks at respondents who worked full time.
Gender F51
Faculty response to the question “Are you male or female?”
MaleFemale
Highest degree X01B16
Describes the highest degree or award achieved by a respondent. The variable is categorized as follows:
Doctoral/first-professionalMaster’sBachelor’s or less

Appendix A—Glossary
77
Institution type X09
Reflects the classification and control of each NSOPF:93 institution, based on groupings of the 1994 CarnegieClassification of Institutions of Higher Education. More information about the Carnegie Classification system andthe 2000 revision is available at http://www.carnegiefoundation.org/classification. The variable is categorized asfollows:
Public doctoral Includes public Research Universities I and II and DoctoralUniversities I and II. These institutions offer a full range ofbaccalaureate programs and are committed to graduateeducation through the doctorate. Also included are publicmedical schools and medical centers. These institutions awardmost of their professional degrees in medicine. In someinstances, their programs include other health professionalschools, such as dentistry, pharmacy, or nursing.
Private not-for-profit doctoral Includes private not-for-profit Research Universities I and IIand Doctoral Universities I and II. These institutions offer afull range of baccalaureate programs and are committed tograduate education through the doctorate. Also included areprivate not-for-profit medical schools and medical centers.These institutions award most of their professional degrees inmedicine. In some instances, their programs include otherhealth professional schools, such as dentistry, pharmacy, ornursing.
Public comprehensive Includes public Master’s (Comprehensive) Colleges andUniversities I and II. These institutions offer a full range ofbaccalaureate programs and are committed to graduateeducation through the master’s degree.
Private not-for-profit comprehensive Includes private not-for-profit Master’s (Comprehensive)Colleges and Universities I and II. These institutions offer afull range of baccalaureate programs and are committed tograduate education through the master’s degree.
Private not-for-profit liberal arts Includes private not-for-profit Baccalaureate (Liberal Arts)Colleges I and II. These institutions are primarilyundergraduate colleges with major emphasis on baccalaureatedegree programs.
Public 2-year Includes public Associate of Arts Colleges. These institutionsoffer associate of arts certificate or degree programs and, withfew exceptions, offer no baccalaureate degrees.
Other Includes private not-for-profit 2-year institutions (Associate ofArts Colleges), public liberal arts colleges (BaccalaureateColleges I and II). Also included are Professional andSpecialized Institutions, which offer degrees ranging from thebachelor’s to the doctorate. At least 50 percent of the degreesawarded by these institutions are in a single discipline.

Appendix A—Glossary
78
Race/ethnicity X02F53
This derived variable was created to categorize respondents by racial/ethnic group. Respondents were asked toidentify their race, with categories of American Indian or Alaska Native; Asian or Pacific Islander; AfricanAmerican/Black; White; and Other. The first four responses were coded accordingly. If the respondent answered“Other,” reassignment to one of the other four categories based on the specific answer given was carried outaccording to federal guidelines. In a separate question, respondents were asked whether they were of Hispanicorigin. Respondents who indicated a race of White or African American/Black and also indicated Hispanic descentwere recoded as Hispanic, with the resulting categories below. This variable was used in the main text of the reportfor the 1992 sample. The comparable variable for the 1998 sample is X03Z84 in the NSOPF:99 section of theglossary above. For the 1998 data shown in appendix tables B1 and B2, the variable X07Z84 (in the NSOPF:99section of the glossary) was used.
White, non-HispanicBlack, non-HispanicAsian/Pacific IslanderHispanicAmerican Indian/Alaska Native
Tenure status A7
Faculty response to the question “What was your tenure status at this institution during the 1992 Fall Term?”
TenuredOn tenure trackNot on tenure trackNo tenure system
Years held current job X01A6
Indicates the number of years a respondent has been at the position held during the 1992 Fall Term at their sampledinstitution. This analysis looks at the average number of years.
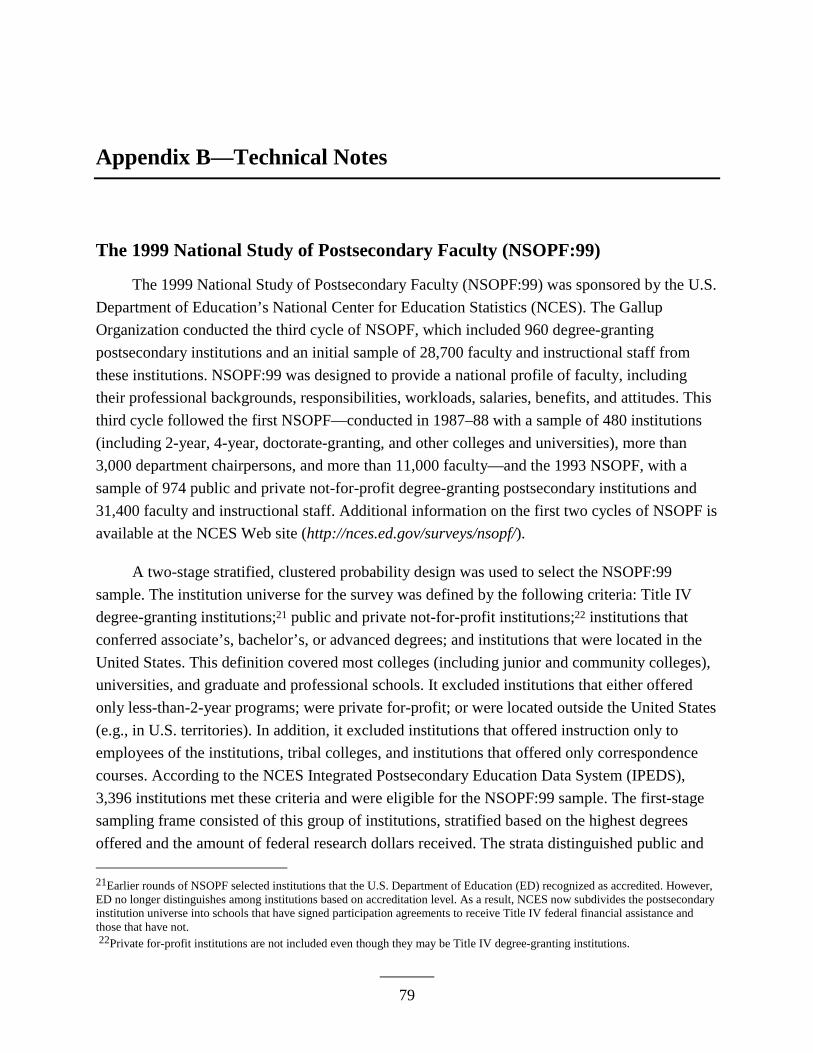
79
Appendix B—Technical Notes
The 1999 National Study of Postsecondary Faculty (NSOPF:99)
The 1999 National Study of Postsecondary Faculty (NSOPF:99) was sponsored by the U.S.
Department of Education’s National Center for Education Statistics (NCES). The Gallup
Organization conducted the third cycle of NSOPF, which included 960 degree-granting
postsecondary institutions and an initial sample of 28,700 faculty and instructional staff from
these institutions. NSOPF:99 was designed to provide a national profile of faculty, including
their professional backgrounds, responsibilities, workloads, salaries, benefits, and attitudes. This
third cycle followed the first NSOPF—conducted in 1987–88 with a sample of 480 institutions
(including 2-year, 4-year, doctorate-granting, and other colleges and universities), more than
3,000 department chairpersons, and more than 11,000 faculty—and the 1993 NSOPF, with a
sample of 974 public and private not-for-profit degree-granting postsecondary institutions and
31,400 faculty and instructional staff. Additional information on the first two cycles of NSOPF is
available at the NCES Web site (http://nces.ed.gov/surveys/nsopf/).
A two-stage stratified, clustered probability design was used to select the NSOPF:99
sample. The institution universe for the survey was defined by the following criteria: Title IV
degree-granting institutions;21 public and private not-for-profit institutions;22 institutions that
conferred associate’s, bachelor’s, or advanced degrees; and institutions that were located in the
United States. This definition covered most colleges (including junior and community colleges),
universities, and graduate and professional schools. It excluded institutions that either offered
only less-than-2-year programs; were private for-profit; or were located outside the United States
(e.g., in U.S. territories). In addition, it excluded institutions that offered instruction only to
employees of the institutions, tribal colleges, and institutions that offered only correspondence
courses. According to the NCES Integrated Postsecondary Education Data System (IPEDS),
3,396 institutions met these criteria and were eligible for the NSOPF:99 sample. The first-stage
sampling frame consisted of this group of institutions, stratified based on the highest degrees
offered and the amount of federal research dollars received. The strata distinguished public and
21Earlier rounds of NSOPF selected institutions that the U.S. Department of Education (ED) recognized as accredited. However,ED no longer distinguishes among institutions based on accreditation level. As a result, NCES now subdivides the postsecondaryinstitution universe into schools that have signed participation agreements to receive Title IV federal financial assistance andthose that have not. 22Private for-profit institutions are not included even though they may be Title IV degree-granting institutions.
Appendix B—Technical Notes
80
private institutions, as well as several types of institutions based on the Carnegie Foundation’s
classification system.23
Each institution was asked to complete an Institution Questionnaire and to provide a list of
all faculty and instructional staff at their institution. Unlike NSOPF:88, which was limited to
faculty whose assignment included instruction, the faculty universes for NSOPF:93 and
NSOPF:99 were expanded to include all those who were designated as faculty, whether their
responsibilities included instruction, and other (nonfaculty) personnel with instructional
responsibilities. Teaching assistants were not included in any cycle of NSOPF. Institution
coordinators were asked to provide a list of these full- and part-time faculty and instructional
staff who had faculty status or instructional responsibilities during the 1998 fall term (i.e., the
term that included November 1, 1998).
Of the 960 institutions in the sample, one was ineligible because it had merged with
another institution. A total of 818 institutions provided lists of faculty and instructional staff, for
a weighted list participation rate of 88.4 percent. A total of 865 institutions returned the
institution questionnaire, for a weighted response rate of 92.8 percent. Initially, 28,600 faculty
and instructional staff were selected from institutions that provided a list of their faculty and
instructional staff. A subsample of 19,800 faculty and instructional staff was drawn for intensive
follow-up. Approximately 18,000 faculty and instructional staff questionnaires were completed,
for a weighted response rate of 83.0 percent. The overall weighted faculty response rate
(institution list participation rate multiplied by the faculty questionnaire response rate) was 73.4
percent.
Faculty nonresponse bias analyses did not detect any bias. Item nonresponse occurred
when a respondent did not answer one or more survey questions. The item nonresponse rates
were generally low for the faculty questionnaire. For more information about NSOPF:99,
including a full description of faculty and item nonresponse, see the 1999 National Study of
Postsecondary Faculty: Methodology Report (NCES 2002–154).
As described in the section of the text on “Data and Measurement Issues,” the
race/ethnicity data available in NSOPF:99 were combined into collapsed categories for
comparison purposes with the NSOPF:93 survey. However, additional information about the
more detailed race categories, and about respondents with more than one race, is available. Table
B1 shows the percentage distribution of the NSOPF:99 sample according to the following more
23See A Classification of Institutions of Higher Education, The Carnegie Foundation for the Advancement of Teaching(Princeton, NJ: 1994).
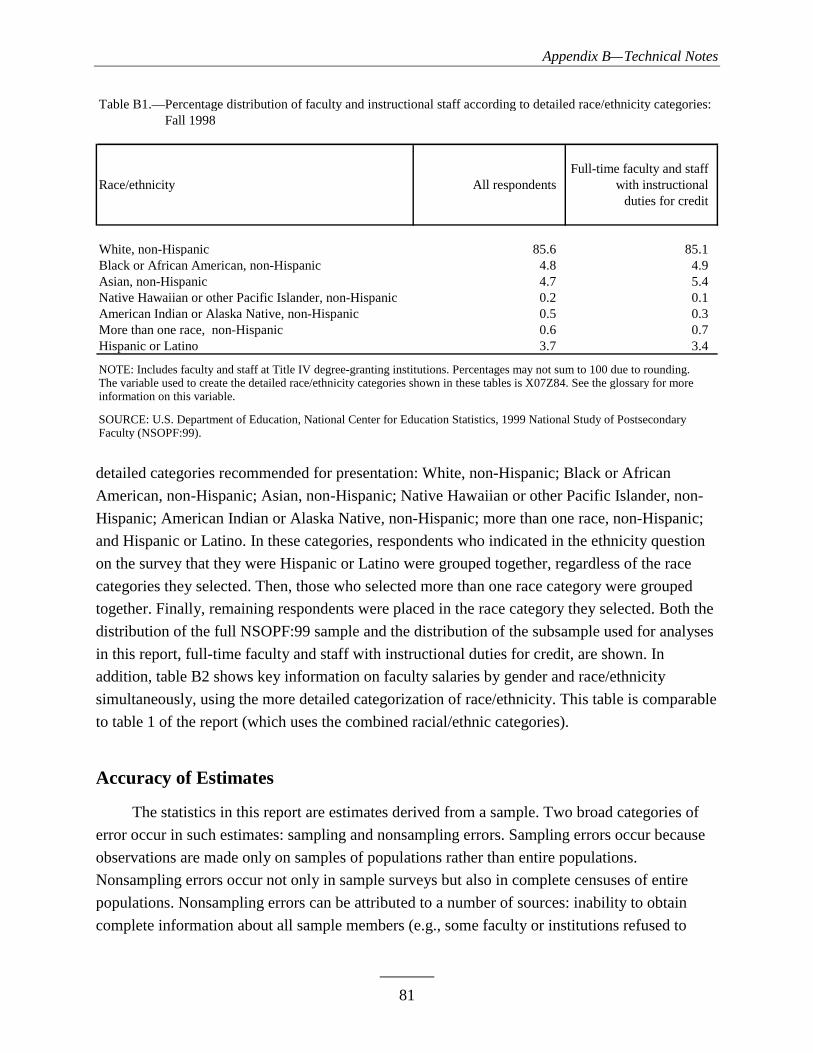
Appendix B—Technical Notes
81
detailed categories recommended for presentation: White, non-Hispanic; Black or African
American, non-Hispanic; Asian, non-Hispanic; Native Hawaiian or other Pacific Islander, non-
Hispanic; American Indian or Alaska Native, non-Hispanic; more than one race, non-Hispanic;
and Hispanic or Latino. In these categories, respondents who indicated in the ethnicity question
on the survey that they were Hispanic or Latino were grouped together, regardless of the race
categories they selected. Then, those who selected more than one race category were grouped
together. Finally, remaining respondents were placed in the race category they selected. Both the
distribution of the full NSOPF:99 sample and the distribution of the subsample used for analyses
in this report, full-time faculty and staff with instructional duties for credit, are shown. In
addition, table B2 shows key information on faculty salaries by gender and race/ethnicity
simultaneously, using the more detailed categorization of race/ethnicity. This table is comparable
to table 1 of the report (which uses the combined racial/ethnic categories).
Accuracy of Estimates
The statistics in this report are estimates derived from a sample. Two broad categories of
error occur in such estimates: sampling and nonsampling errors. Sampling errors occur because
observations are made only on samples of populations rather than entire populations.
Nonsampling errors occur not only in sample surveys but also in complete censuses of entire
populations. Nonsampling errors can be attributed to a number of sources: inability to obtain
complete information about all sample members (e.g., some faculty or institutions refused to
Table B1.—Percentage distribution of faculty and instructional staff according to detailed race/ethnicity categories:Table B1.—Fall 1998
Full-time faculty and staff Race/ethnicity All respondents with instructional
duties for credit
White, non-Hispanic 85.6 85.1 Black or African American, non-Hispanic 4.8 4.9 Asian, non-Hispanic 4.7 5.4 Native Hawaiian or other Pacific Islander, non-Hispanic 0.2 0.1 American Indian or Alaska Native, non-Hispanic 0.5 0.3 More than one race, non-Hispanic 0.6 0.7 Hispanic or Latino 3.7 3.4
NOTE: Includes faculty and staff at Title IV degree-granting institutions. Percentages may not sum to 100 due to rounding.The variable used to create the detailed race/ethnicity categories shown in these tables is X07Z84. See the glossary for more information on this variable.
SOURCE: U.S. Department of Education, National Center for Education Statistics, 1999 National Study of PostsecondaryFaculty (NSOPF:99).

Appendix B—Technical Notes
82
Table B2.—Percentage distribution of full-time instructional faculty and staff according to base salary, and averageTable B2.—base salary, by gender and detailed race/ethnicity categories: Calendar year 1998
Average
Race/ethnicity base Less than $40,000– $60,000– $80,000 salary $40,000 59,999 79,999 or more
Total
Total 27.2 37.4 19.5 15.8 $56,850 Race/ethnicity White, non-Hispanic 27.7 36.6 19.7 16.1 57,000 Black or African American, non-Hispanic 28.6 49.2 13.7 8.5 50,320 Asian, non-Hispanic 17.7 38.0 23.5 20.8 63,270 Native Hawaiian or other Pacific Islander, non-Hispanic (#) (#) (#) (#) (#) American Indian or Alaska Native, non-Hispanic 37.3 34.8 12.2 15.7 52,040 More than one race, non-Hispanic 34.3 36.0 17.3 12.4 50,120 Hispanic or Latino 27.9 40.2 19.4 12.5 54,560
Male
Total 21.0 36.1 22.5 20.4 61,690 Race/ethnicity White, non-Hispanic 21.1 35.5 22.6 20.8 61,950 Black or African American, non-Hispanic 23.8 49.1 15.8 11.4 53,530 Asian, non-Hispanic 12.9 37.2 25.1 24.8 66,750 Native Hawaiian or other Pacific Islander, non-Hispanic (#) (#) (#) (#) (#) American Indian or Alaska Native, non-Hispanic (#) (#) (#) (#) (#) More than one race, non-Hispanic 33.3 28.7 21.8 16.2 52,800 Hispanic or Latino 23.9 35.0 24.0 17.1 59,380 See footnotes at end of table.
Percent making:

Appendix B—Technical Notes
83
participate, or faculty participated but answered only certain items); ambiguous definitions;
differences in interpreting questions; inability or unwillingness to give correct information;
mistakes in recording or coding data; and other errors of collecting, processing, sampling, and
imputing missing data.
Data Analysis System
The estimates presented in this report were produced using the NSOPF:1999 Data Analysis
Systems (DAS). The DAS software makes it possible for users to specify and generate their own
tables from the NSOPF:99 data. With the DAS, users can replicate or expand upon the tables
presented in this report. In addition to the table estimates, the DAS calculates proper standard
Table B2.—Percentage distribution of full-time instructional faculty and staff according to base salary, and averageTable B2.—base salary, by gender and detailed race/ethnicity categories: Calendar year 1998—Continued
Average
Race/ethnicity base Less than $40,000– $60,000– $80,000 salary $40,000 59,999 79,999 or more
Female
Total 38.3 39.7 14.3 7.8 $48,370 Race/ethnicity White, non-Hispanic 39.3 38.5 14.4 7.8 48,200 Black or African American, non-Hispanic 33.6 49.3 11.6 5.5 46,940 Asian, non-Hispanic 28.9 39.9 19.7 11.5 55,160 Native Hawaiian or other Pacific Islander, non-Hispanic (#) (#) (#) (#) (#) American Indian or Alaska Native, non-Hispanic (#) (#) (#) (#) (#) More than one race, non-Hispanic 36.2 49.5 9.0 5.4 45,160 Hispanic or Latino 34.3 48.5 12.0 5.1 46,910
#Too small to report.
NOTE: Includes full-time instructional faculty and staff at Title IV degree-granting institutions with at least some instructional duties for credit. Refers to base salary during calendar year 1998 received from the institution at which the respondent was sampled. Percentages may not sum to 100 due to rounding. Dollar figures are rounded to the nearest 10. The variable used to create the detailed race/ethnicity categories shown in these tables is X07Z84. See the glossary for more information on this variable.
SOURCE: U.S. Department of Education, National Center for Education Statistics, 1999 National Study of PostsecondaryFaculty (NSOPF:99).
Percent making:

Appendix B—Technical Notes
84
errors24 and weighted sample sizes for these estimates. For example, table B3 contains standard
errors that correspond to table 1 of this report, and was generated by the DAS. If the number of
valid cases is too small to produce a reliable estimate (fewer than 30 cases), the DAS prints the
message “low-N” instead of the estimate.
In addition to tables, the DAS will also produce a correlation matrix of selected variables to
be used for linear regression models. Included in the output with the correlation matrix are the
design effects (DEFTs) for each variable in the matrix. Since statistical procedures generally
compute regression coefficients based on simple random sample assumptions, the standard errors
must be adjusted with the design effects to take into account the NSOPF:99 stratified sampling
method.
The DAS can be accessed electronically at http://nces.ed.gov/DAS. For more information
about the NSOPF:99 Data Analysis System, contact:
Aurora D’AmicoPostsecondary Studies DivisionNational Center for Education Statistics1990 K Street NWWashington, DC 20006-5652(202) 502-7334aurora.d’[email protected]
Statistical Procedures
Differences Between Means
The descriptive comparisons were tested in this report using Student’s t statistic.
Differences between estimates are tested against the probability of a Type I error,25 or
significance level. The significance levels were determined by calculating the Student’s t values
for the differences between each pair of means or proportions and comparing these with
published tables of significance levels for two-tailed hypothesis testing.
24The NSOPF:99 samples are not simple random samples, and therefore, simple random sample techniques for estimatingsampling error cannot be applied to these data. The DAS takes into account the complexity of the sampling procedures andcalculates standard errors appropriate for such samples. The method for computing sampling errors used by the DAS involvesapproximating the estimator by the linear terms of a Taylor series expansion. The procedure is typically referred to as the Taylorseries method.25A Type I error occurs when one concludes that a difference observed in a sample reflects a true difference in the populationfrom which the sample was drawn, when no such difference is present.
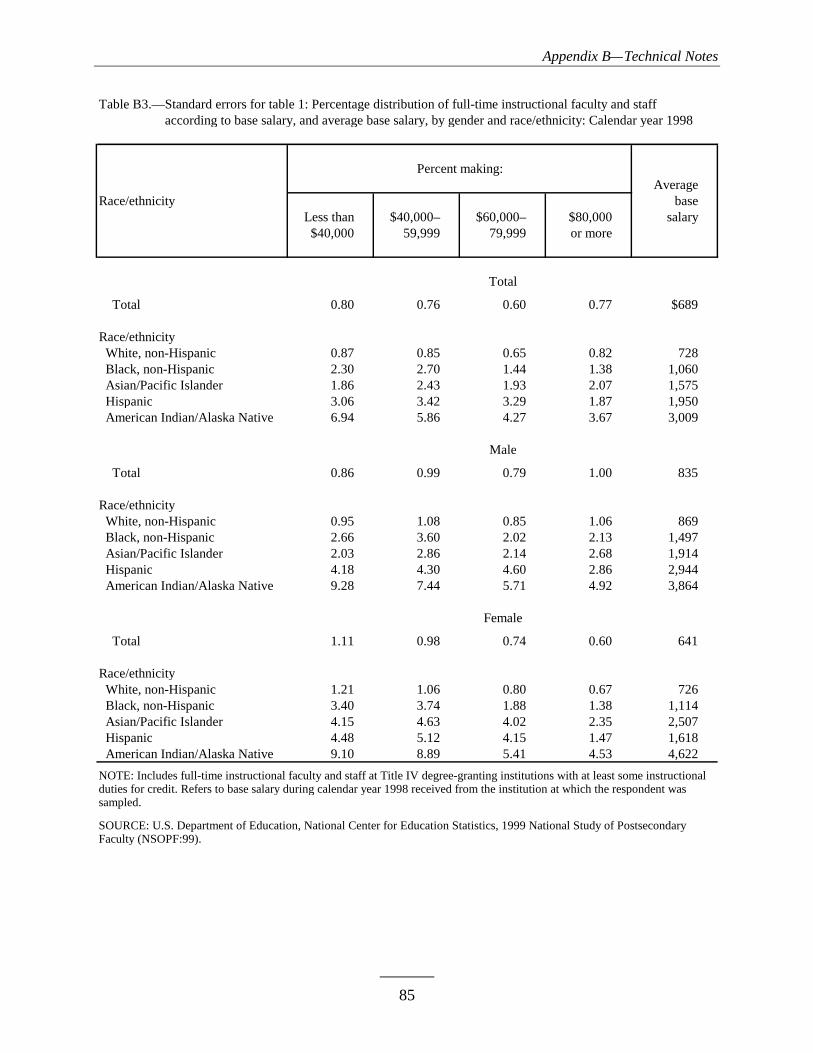
Appendix B—Technical Notes
85
Table B3.—Standard errors for table 1: Percentage distribution of full-time instructional faculty and staff Table B3.—according to base salary, and average base salary, by gender and race/ethnicity: Calendar year 1998
Average
Race/ethnicity base Less than $40,000– $60,000– $80,000 salary $40,000 59,999 79,999 or more
Total
Total 0.80 0.76 0.60 0.77 $689 Race/ethnicity White, non-Hispanic 0.87 0.85 0.65 0.82 728 Black, non-Hispanic 2.30 2.70 1.44 1.38 1,060 Asian/Pacific Islander 1.86 2.43 1.93 2.07 1,575 Hispanic 3.06 3.42 3.29 1.87 1,950 American Indian/Alaska Native 6.94 5.86 4.27 3.67 3,009
Male
Total 0.86 0.99 0.79 1.00 835 Race/ethnicity White, non-Hispanic 0.95 1.08 0.85 1.06 869 Black, non-Hispanic 2.66 3.60 2.02 2.13 1,497 Asian/Pacific Islander 2.03 2.86 2.14 2.68 1,914 Hispanic 4.18 4.30 4.60 2.86 2,944 American Indian/Alaska Native 9.28 7.44 5.71 4.92 3,864 Female
Total 1.11 0.98 0.74 0.60 641 Race/ethnicity White, non-Hispanic 1.21 1.06 0.80 0.67 726 Black, non-Hispanic 3.40 3.74 1.88 1.38 1,114 Asian/Pacific Islander 4.15 4.63 4.02 2.35 2,507 Hispanic 4.48 5.12 4.15 1.47 1,618 American Indian/Alaska Native 9.10 8.89 5.41 4.53 4,622
NOTE: Includes full-time instructional faculty and staff at Title IV degree-granting institutions with at least some instructional duties for credit. Refers to base salary during calendar year 1998 received from the institution at which the respondent was sampled.
SOURCE: U.S. Department of Education, National Center for Education Statistics, 1999 National Study of PostsecondaryFaculty (NSOPF:99).
Percent making:
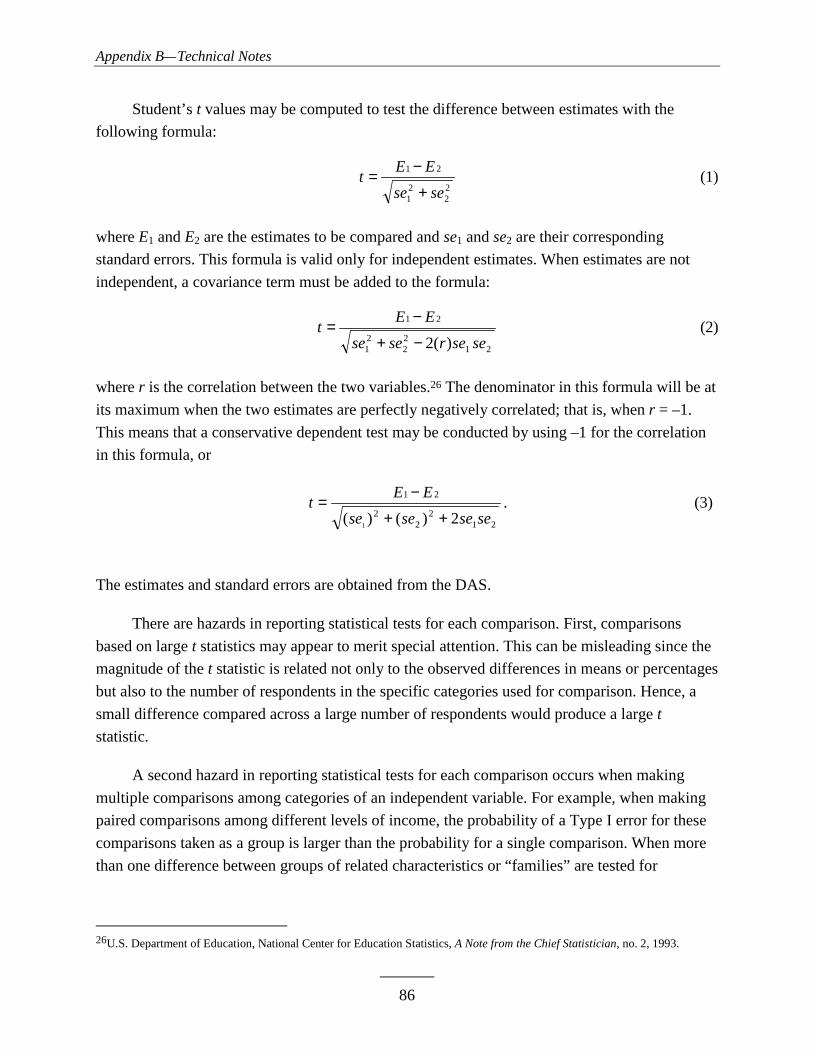
Appendix B—Technical Notes
86
Student’s t values may be computed to test the difference between estimates with the
following formula:
22
21
21
sese
EEt
+
−= (1)
where E1 and E2 are the estimates to be compared and se1 and se2 are their corresponding
standard errors. This formula is valid only for independent estimates. When estimates are not
independent, a covariance term must be added to the formula:
2122
21
21
)(2 sesersese
EEt
−+
−= (2)
where r is the correlation between the two variables.26 The denominator in this formula will be at
its maximum when the two estimates are perfectly negatively correlated; that is, when r = –1.
This means that a conservative dependent test may be conducted by using –1 for the correlation
in this formula, or
212
22
21
2)()(1
sesesese
EEt
++
−= . (3)
The estimates and standard errors are obtained from the DAS.
There are hazards in reporting statistical tests for each comparison. First, comparisons
based on large t statistics may appear to merit special attention. This can be misleading since the
magnitude of the t statistic is related not only to the observed differences in means or percentages
but also to the number of respondents in the specific categories used for comparison. Hence, a
small difference compared across a large number of respondents would produce a large t
statistic.
A second hazard in reporting statistical tests for each comparison occurs when making
multiple comparisons among categories of an independent variable. For example, when making
paired comparisons among different levels of income, the probability of a Type I error for these
comparisons taken as a group is larger than the probability for a single comparison. When more
than one difference between groups of related characteristics or “families” are tested for
26U.S. Department of Education, National Center for Education Statistics, A Note from the Chief Statistician, no. 2, 1993.
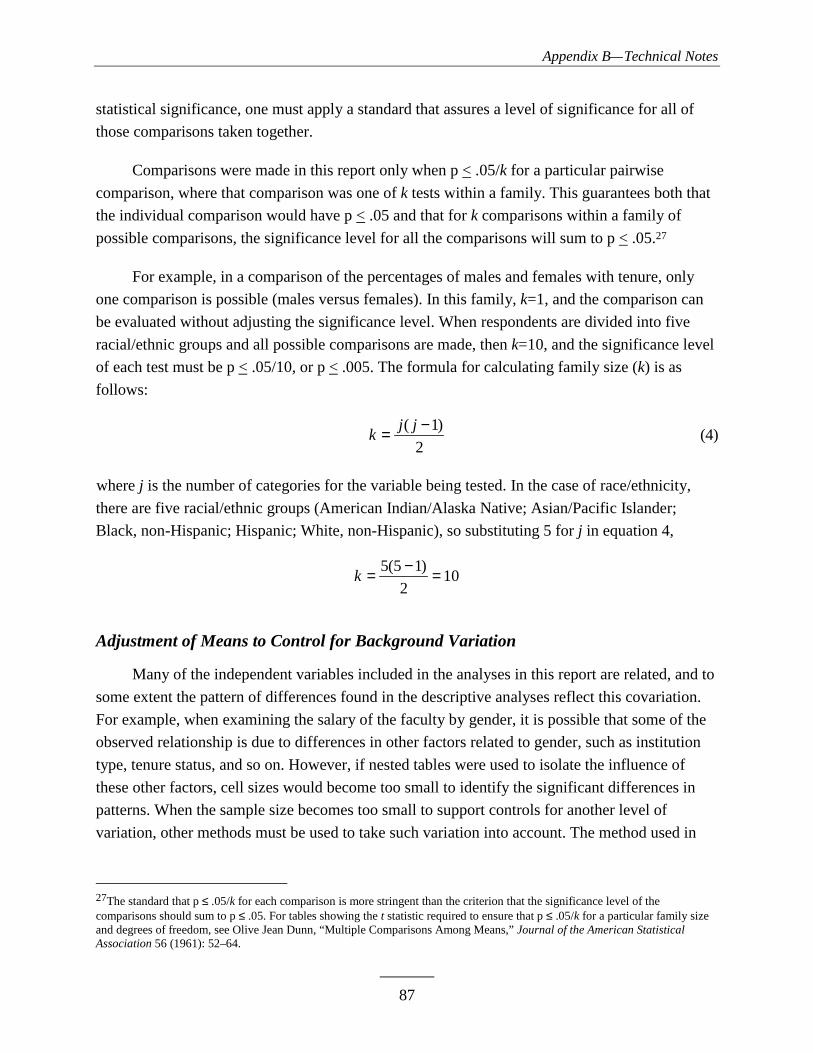
Appendix B—Technical Notes
87
statistical significance, one must apply a standard that assures a level of significance for all of
those comparisons taken together.
Comparisons were made in this report only when p < .05/k for a particular pairwise
comparison, where that comparison was one of k tests within a family. This guarantees both that
the individual comparison would have p < .05 and that for k comparisons within a family of
possible comparisons, the significance level for all the comparisons will sum to p < .05.27
For example, in a comparison of the percentages of males and females with tenure, only
one comparison is possible (males versus females). In this family, k=1, and the comparison can
be evaluated without adjusting the significance level. When respondents are divided into five
racial/ethnic groups and all possible comparisons are made, then k=10, and the significance level
of each test must be p < .05/10, or p < .005. The formula for calculating family size (k) is as
follows:
2
)1( −= jjk (4)
where j is the number of categories for the variable being tested. In the case of race/ethnicity,
there are five racial/ethnic groups (American Indian/Alaska Native; Asian/Pacific Islander;
Black, non-Hispanic; Hispanic; White, non-Hispanic), so substituting 5 for j in equation 4,
102
)15(5 =−=k
Adjustment of Means to Control for Background Variation
Many of the independent variables included in the analyses in this report are related, and to
some extent the pattern of differences found in the descriptive analyses reflect this covariation.
For example, when examining the salary of the faculty by gender, it is possible that some of the
observed relationship is due to differences in other factors related to gender, such as institution
type, tenure status, and so on. However, if nested tables were used to isolate the influence of
these other factors, cell sizes would become too small to identify the significant differences in
patterns. When the sample size becomes too small to support controls for another level of
variation, other methods must be used to take such variation into account. The method used in
27The standard that p ≤ .05/k for each comparison is more stringent than the criterion that the significance level of thecomparisons should sum to p ≤ .05. For tables showing the t statistic required to ensure that p ≤ .05/k for a particular family sizeand degrees of freedom, see Olive Jean Dunn, “Multiple Comparisons Among Means,” Journal of the American StatisticalAssociation 56 (1961): 52–64.

Appendix B—Technical Notes
88
this report estimates adjusted means with a regression model, an approach sometimes referred to
as communality analysis.
For the analysis of faculty salaries, multiple linear regression was used to obtain means that
were adjusted for covariation among a list of control variables.28 Variables that showed
significant gender or racial/ethnic differences in the crosstabular analyses were selected for
inclusion in the regression model. Some eliminations were then made for variables that were
highly correlated; in those cases, different combinations of variables were estimated in models
not shown in the report to determine which combinations of variables demonstrated robust
results. The final list of variables included in the regression is as follows: gender, race/ethnicity,
type of institution, teaching field, level of instruction, tenure status, rank, highest degree, years
since highest degree, age, time spent teaching, number of classes taught, time spent engaged in
research, and number of total publications or other permanent creative works in the previous 2
years. Each independent variable is divided into several discrete categories. To find an estimated
mean value on the dependent variable for each category of an independent variable, while
adjusting for its covariation with other independent variables in the equation, substitute the
following in the equation: (1) a one in the category’s term in the equation, (2) zeroes for the
other categories of this variable, and (3) the mean proportions for all other independent variables.
This procedure holds the impact of all remaining independent variables constant, and differences
between adjusted means of categories of an independent variable represent hypothetical groups
that are balanced or proportionately equal on all other characteristics included in the model as
independent variables.
For example, consider a hypothetical case in which two variables, age and gender, are used
to describe an outcome, Y (such as salary). The variables age and gender are recoded into a
dummy variable representing age, A, and a dummy variable representing gender, G:
Age A Less than 35 years old 1 35 years or older 0
andGender G Female 1 Male 0
28For more information about least squares regression, see Michael S. Lewis-Beck, Applied Regression: An Introduction, Vol. 22(Beverly Hills, CA: Sage Publications, Inc., 1980); William D. Berry and Stanley Feldman, Multiple Regression in Practice, Vol.50 (Beverly Hills, CA: Sage Publications, Inc., 1987).
Appendix B—Technical Notes
89
The following regression equation is then estimated from the correlation matrix output from the
DAS as input data for standard regression procedures:
GAY 21 bbaˆ ++= (5)
To estimate the adjusted mean for any subgroup evaluated at the mean of all other
variables, one substitutes the appropriate values for that subgroup’s dummy variables (1 or 0)
and the mean for the dummy variable(s) representing all other subgroups. For example, suppose
Y represents faculty salary, which is being described by age (A) and gender (G), coded as shown
above. Suppose the unadjusted mean values of these two variables are as follows:
Variable MeanA 0.355G 0.411
Next, suppose the regression equation results are as follows:
GAY 000,5000,1363,000ˆ −−= (6)
To estimate the adjusted value for younger faculty, one substitutes the appropriate
parameter estimates and variable values into equation 6.
Variable Parameter Valuea 63,000 —A -13,000 1.000G -5,000 0.411
This results in the following equation:
945,47)411.0)(000,5()1)(000,13(000,36ˆ =−−=Y
In this case, the adjusted mean for younger faculty is 47,945 and represents the expected
outcome for younger faculty who resemble the average faculty member across the other
variables (in this example, gender). In other words, the adjusted salary of younger faculty,
controlling for gender, is $47,945.
It is relatively straightforward to produce a regression model using the DAS, since one of
the DAS output options is a correlation matrix, computed using pairwise missing values. In
regression analysis, there are several common approaches to the problem of missing data. The
two simplest are pairwise deletion of missing data and listwise deletion of missing data. In
pairwise deletion, each correlation is calculated using all of the cases for the two relevant
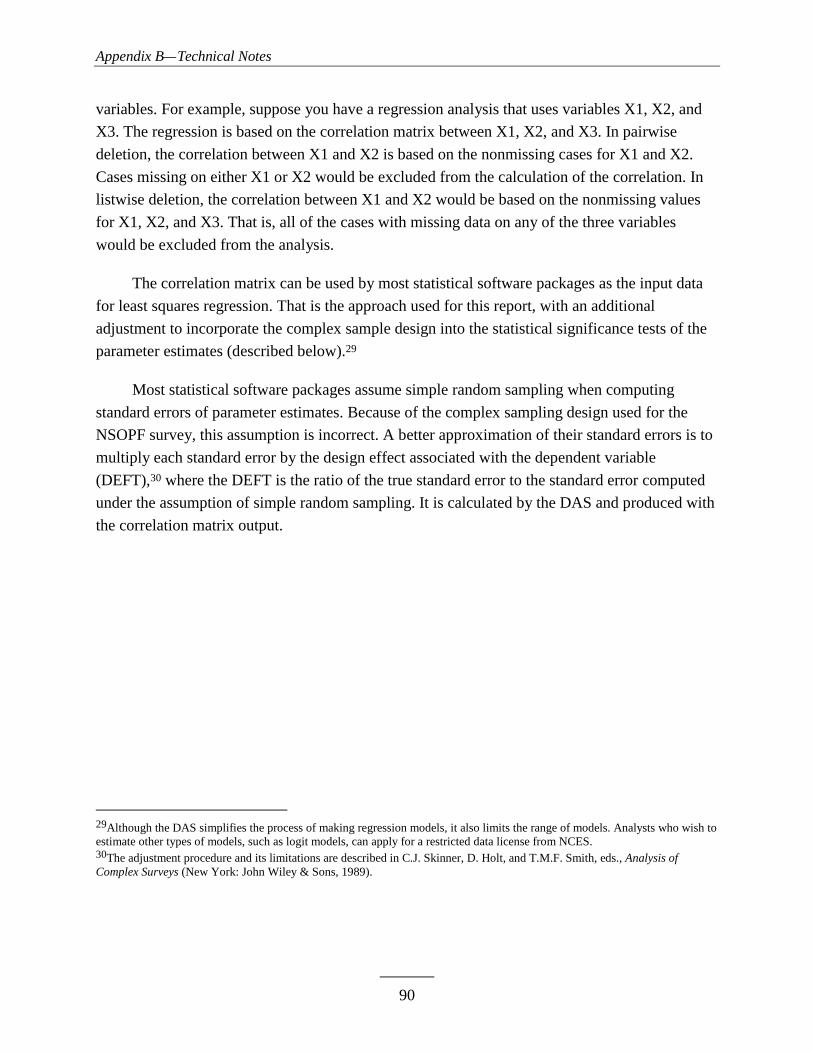
Appendix B—Technical Notes
90
variables. For example, suppose you have a regression analysis that uses variables X1, X2, and
X3. The regression is based on the correlation matrix between X1, X2, and X3. In pairwise
deletion, the correlation between X1 and X2 is based on the nonmissing cases for X1 and X2.
Cases missing on either X1 or X2 would be excluded from the calculation of the correlation. In
listwise deletion, the correlation between X1 and X2 would be based on the nonmissing values
for X1, X2, and X3. That is, all of the cases with missing data on any of the three variables
would be excluded from the analysis.
The correlation matrix can be used by most statistical software packages as the input data
for least squares regression. That is the approach used for this report, with an additional
adjustment to incorporate the complex sample design into the statistical significance tests of the
parameter estimates (described below).29
Most statistical software packages assume simple random sampling when computing
standard errors of parameter estimates. Because of the complex sampling design used for the
NSOPF survey, this assumption is incorrect. A better approximation of their standard errors is to
multiply each standard error by the design effect associated with the dependent variable
(DEFT),30 where the DEFT is the ratio of the true standard error to the standard error computed
under the assumption of simple random sampling. It is calculated by the DAS and produced with
the correlation matrix output.
29Although the DAS simplifies the process of making regression models, it also limits the range of models. Analysts who wish toestimate other types of models, such as logit models, can apply for a restricted data license from NCES.30The adjustment procedure and its limitations are described in C.J. Skinner, D. Holt, and T.M.F. Smith, eds., Analysis ofComplex Surveys (New York: John Wiley & Sons, 1989).

91
Appendix C—Supplemental Figures
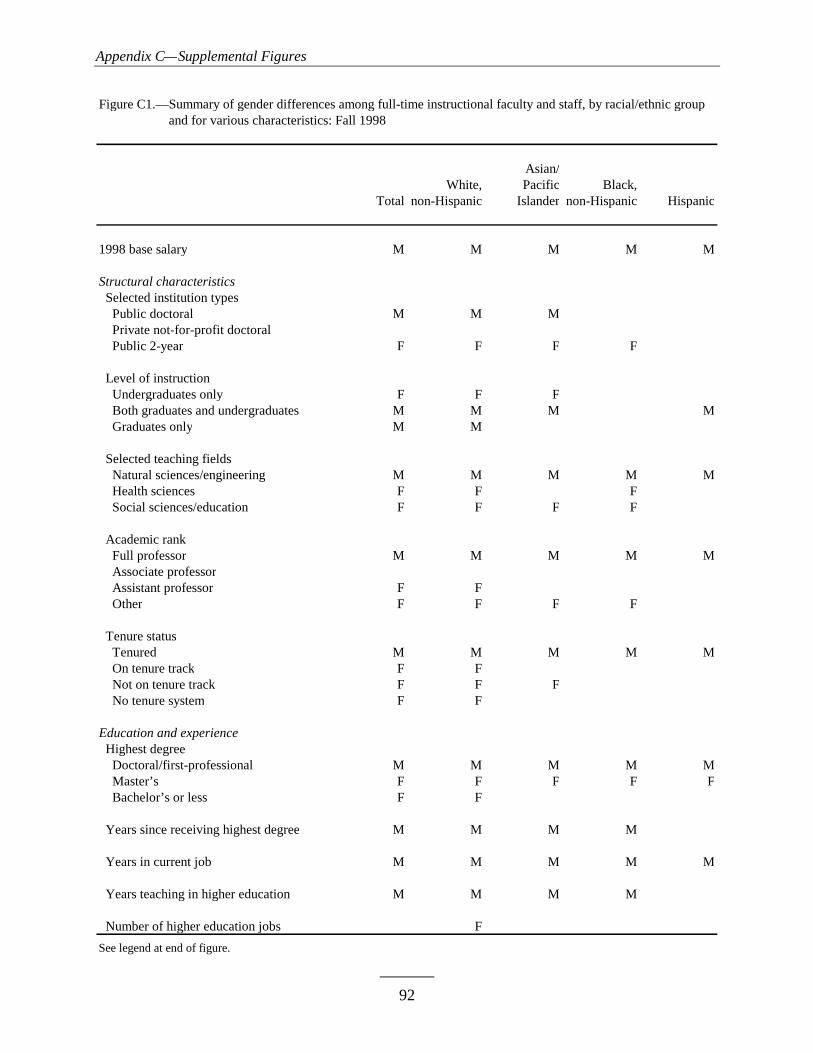
Appendix C—Supplemental Figures
92
Figure C1.—Summary of gender differences among full-time instructional faculty and staff, by racial/ethnic groupFigure C1.—and for various characteristics: Fall 1998
Asian/White, Pacific Black,
Total non-Hispanic Islander non-Hispanic Hispanic
1998 base salary M M M M M
Structural characteristics Selected institution types Public doctoral M M M Private not-for-profit doctoral Public 2-year F F F F
Level of instruction Undergraduates only F F F Both graduates and undergraduates M M M M Graduates only M M
Selected teaching fields Natural sciences/engineering M M M M M Health sciences F F F Social sciences/education F F F F
Academic rank Full professor M M M M M Associate professor Assistant professor F F Other F F F F
Tenure status Tenured M M M M M On tenure track F F Not on tenure track F F F No tenure system F F
Education and experience Highest degree Doctoral/first-professional M M M M M Master’s F F F F F Bachelor’s or less F F
Years since receiving highest degree M M M M
Years in current job M M M M M
Years teaching in higher education M M M M Number of higher education jobs F
See legend at end of figure.

Appendix C—Supplemental Figures
93
Figure C1.—Summary of gender differences among full-time instructional faculty and staff, by racial/ethnic groupFigure C1.—and for various characteristics: Fall 1998—Continued
Asian/White, Pacific Black,
Total non-Hispanic Islander non-Hispanic Hispanic
Average age M M M M
Job activities and responsibilities Average percentage of time on teaching activities F F F
Number of for-credit classes F F
Number of unique course preparations F F
Hours in the classroom per week F F
Average percentage of time on research M M M
Conducted any research M M M M
Had any funded research M M
Primary research type Basic research M M Applied/policy-oriented research M M M Literary/performance/exhibition Other F F F
Number of recent publications/ permanent works M M M M M
Number of recent refereed articles/ works in juried media M M M M
Number of recent books M M M
Number of recent presentations/ performances M M M M
M Indicates that percentage or estimate for men is significantly larger than percentage or estimate for women.F Indicates that percentage or estimate for women is significantly larger than percentage or estimate for men.
NOTE: Includes full-time instructional faculty and staff at Title-IV degree-granting institutions with at least some instructional duties for credit. Only statistically significant differences are shown.
SOURCE: U.S. Department of Education, National Center for Education Statistics, 1999 National Study of PostsecondaryFaculty (NSOPF:99).
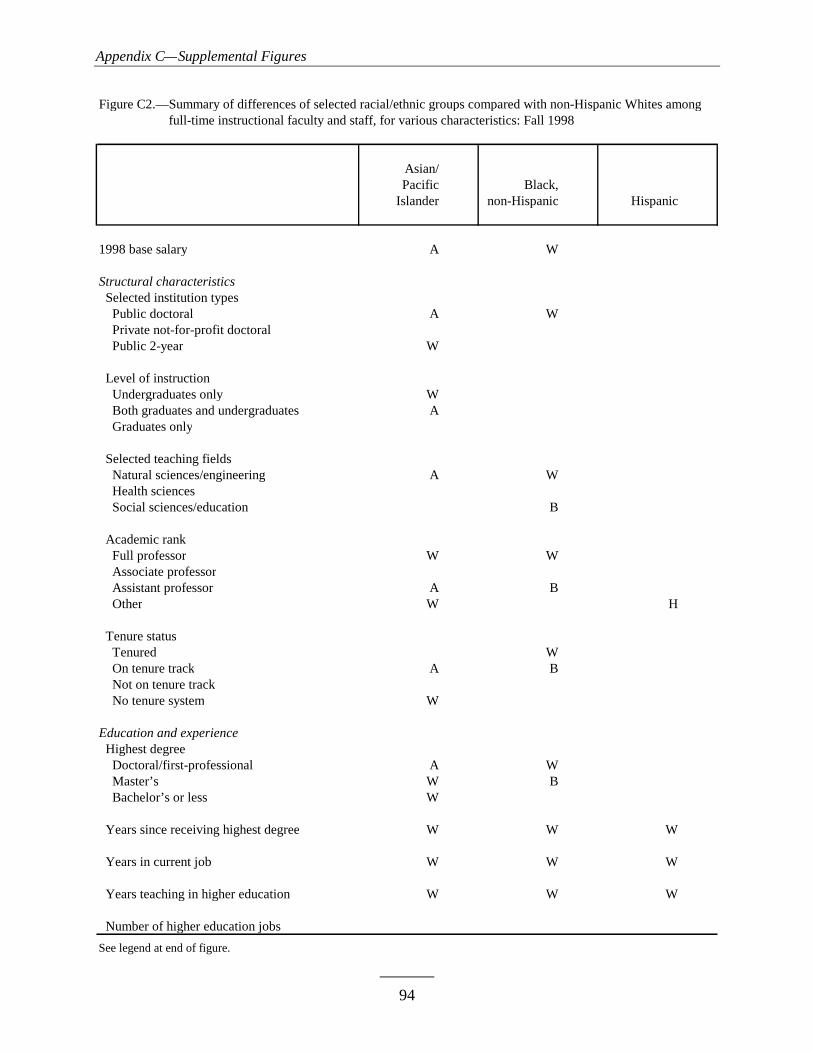
Appendix C—Supplemental Figures
94
Figure C2.—Summary of differences of selected racial/ethnic groups compared with non-Hispanic Whites amongFigure C2.—full-time instructional faculty and staff, for various characteristics: Fall 1998
Asian/ Pacific Black,
Islander non-Hispanic Hispanic
1998 base salary A W
Structural characteristics Selected institution types Public doctoral A W Private not-for-profit doctoral Public 2-year W
Level of instruction Undergraduates only W Both graduates and undergraduates A Graduates only
Selected teaching fields Natural sciences/engineering A W Health sciences Social sciences/education B
Academic rank Full professor W W Associate professor Assistant professor A B Other W H
Tenure status Tenured W On tenure track A B Not on tenure track No tenure system W
Education and experience Highest degree Doctoral/first-professional A W Master’s W B Bachelor’s or less W
Years since receiving highest degree W W W
Years in current job W W W
Years teaching in higher education W W W Number of higher education jobs
See legend at end of figure.
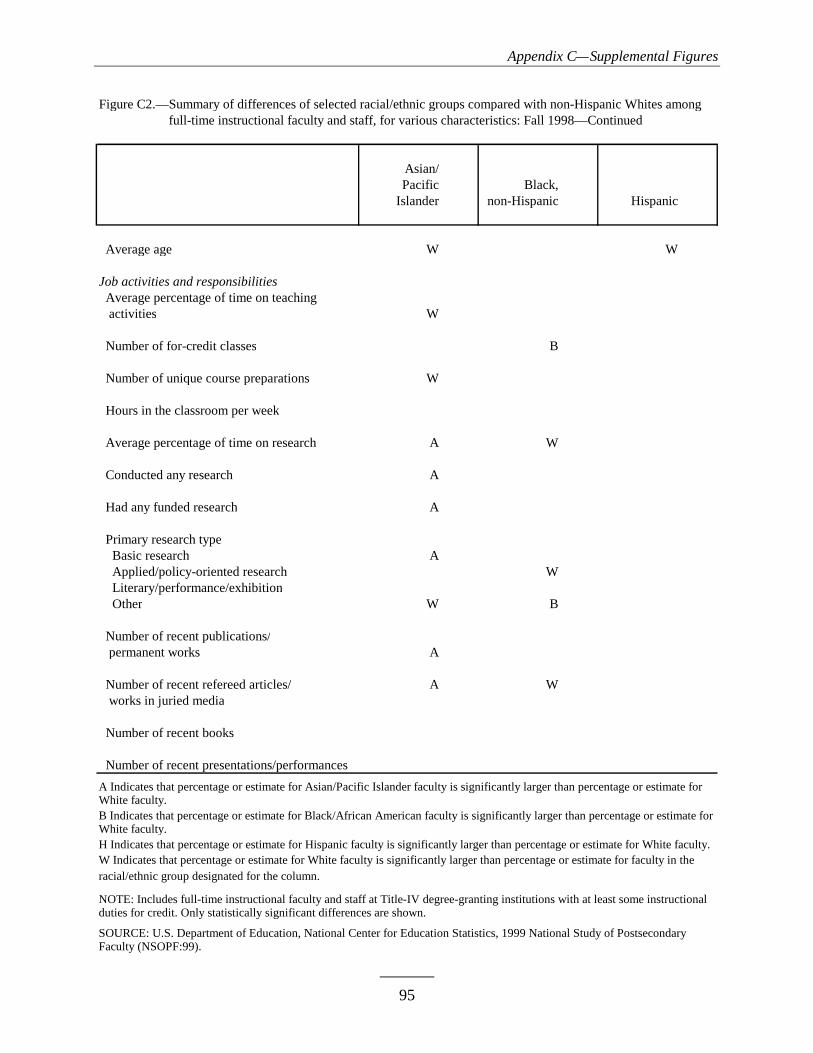
Appendix C—Supplemental Figures
95
Figure C2.—Summary of differences of selected racial/ethnic groups compared with non-Hispanic Whites among Figure C2.—full-time instructional faculty and staff, for various characteristics: Fall 1998—Continued
Asian/ Pacific Black,
Islander non-Hispanic Hispanic
Average age W W
Job activities and responsibilities Average percentage of time on teaching activities W
Number of for-credit classes B
Number of unique course preparations W
Hours in the classroom per week
Average percentage of time on research A W
Conducted any research A
Had any funded research A
Primary research type Basic research A Applied/policy-oriented research W Literary/performance/exhibition Other W B
Number of recent publications/ permanent works A
Number of recent refereed articles/ A W works in juried media
Number of recent books
Number of recent presentations/performances
A Indicates that percentage or estimate for Asian/Pacific Islander faculty is significantly larger than percentage or estimate forWhite faculty.B Indicates that percentage or estimate for Black/African American faculty is significantly larger than percentage or estimate forWhite faculty.H Indicates that percentage or estimate for Hispanic faculty is significantly larger than percentage or estimate for White faculty.W Indicates that percentage or estimate for White faculty is significantly larger than percentage or estimate for faculty in theracial/ethnic group designated for the column.
NOTE: Includes full-time instructional faculty and staff at Title-IV degree-granting institutions with at least some instructional duties for credit. Only statistically significant differences are shown.
SOURCE: U.S. Department of Education, National Center for Education Statistics, 1999 National Study of PostsecondaryFaculty (NSOPF:99).
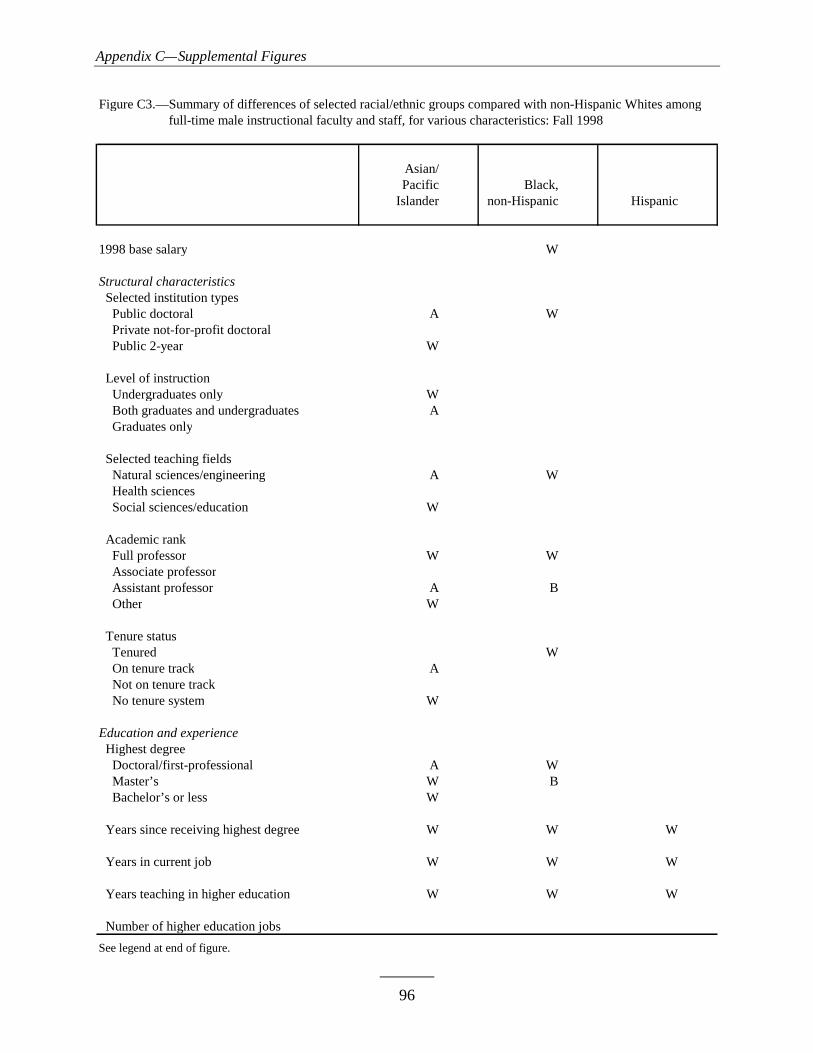
Appendix C—Supplemental Figures
96
Figure C3.—Summary of differences of selected racial/ethnic groups compared with non-Hispanic Whites amongFigure C3.—full-time male instructional faculty and staff, for various characteristics: Fall 1998
Asian/ Pacific Black,
Islander non-Hispanic Hispanic
1998 base salary W
Structural characteristics Selected institution types Public doctoral A W Private not-for-profit doctoral Public 2-year W
Level of instruction Undergraduates only W Both graduates and undergraduates A Graduates only
Selected teaching fields Natural sciences/engineering A W Health sciences Social sciences/education W
Academic rank Full professor W W Associate professor Assistant professor A B Other W
Tenure status Tenured W On tenure track A Not on tenure track No tenure system W
Education and experience Highest degree Doctoral/first-professional A W Master’s W B Bachelor’s or less W
Years since receiving highest degree W W W
Years in current job W W W
Years teaching in higher education W W W Number of higher education jobs
See legend at end of figure.

Appendix C—Supplemental Figures
97
Figure C3.—Summary of differences of selected racial/ethnic groups compared with non-Hispanic Whites amongFigure C3.—full-time male instructional faculty and staff, for various characteristics: Fall 1998—Continued
Asian/ Pacific Black,
Islander non-Hispanic Hispanic
Average age W W
Job activities and responsibilities Average percentage of time on teaching activities W
Number of for-credit classes B
Number of unique course preparations W
Hours in the classroom per week
Average percentage of time on research A W
Conducted any research A
Had any funded research A
Primary research type Basic research A Applied/policy-oriented research W Literary/performance/exhibition W Other W
Number of recent publications/ permanent works
Number of recent refereed articles/ A W works in juried media
Number of recent books
Number of recent presentations/performances
A Indicates that percentage or estimate for Asian/Pacific Islander faculty is significantly larger than percentage or estimate forWhite faculty.B Indicates that percentage or estimate for Black/African American faculty is significantly larger than percentage or estimate forWhite faculty.W Indicates that percentage or estimate for White faculty is significantly larger than percentage or estimate for faculty in theracial/ethnic group designated for the column.
NOTE: Includes full-time instructional faculty and staff at Title-IV degree-granting institutions with at least some instructional duties for credit. Only statistically significant differences are shown.
SOURCE: U.S. Department of Education, National Center for Education Statistics, 1999 National Study of PostsecondaryFaculty (NSOPF:99).
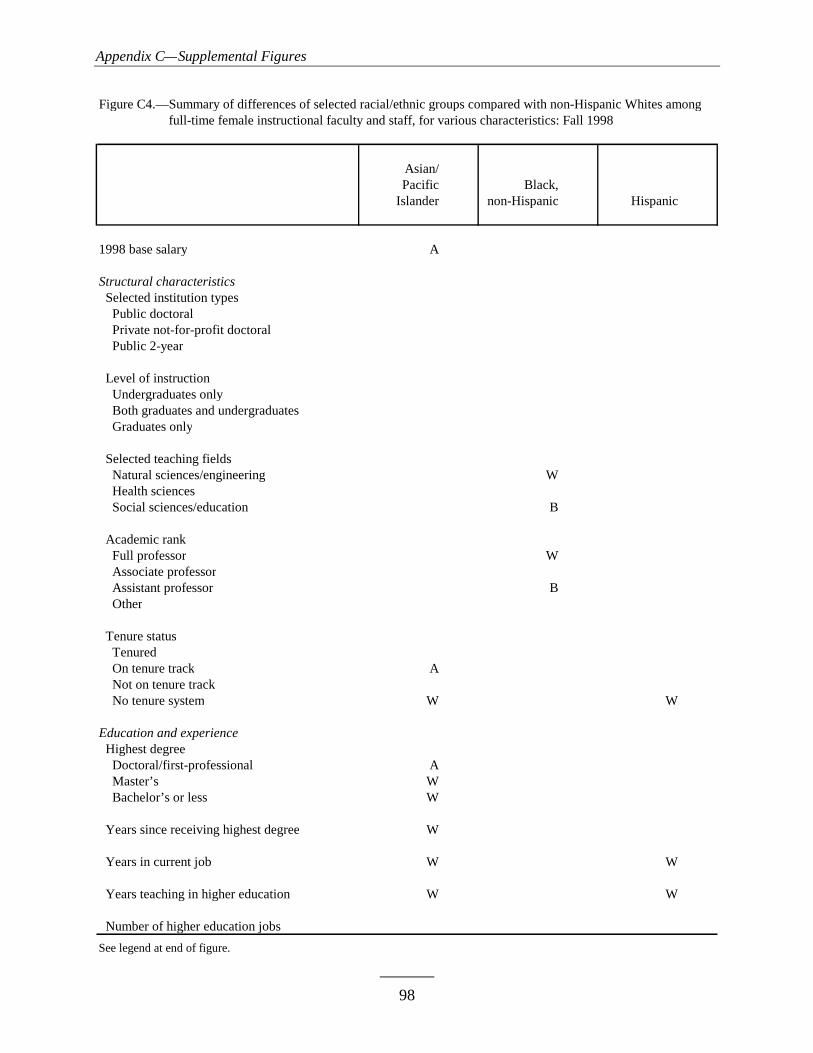
Appendix C—Supplemental Figures
98
Figure C4.—Summary of differences of selected racial/ethnic groups compared with non-Hispanic Whites amongFigure C4.—full-time female instructional faculty and staff, for various characteristics: Fall 1998
Asian/ Pacific Black,
Islander non-Hispanic Hispanic
1998 base salary A
Structural characteristics Selected institution types Public doctoral Private not-for-profit doctoral Public 2-year
Level of instruction Undergraduates only Both graduates and undergraduates Graduates only
Selected teaching fields Natural sciences/engineering W Health sciences Social sciences/education B
Academic rank Full professor W Associate professor Assistant professor B Other
Tenure status Tenured On tenure track A Not on tenure track No tenure system W W
Education and experience Highest degree Doctoral/first-professional A Master’s W Bachelor’s or less W
Years since receiving highest degree W
Years in current job W W
Years teaching in higher education W W Number of higher education jobs
See legend at end of figure.
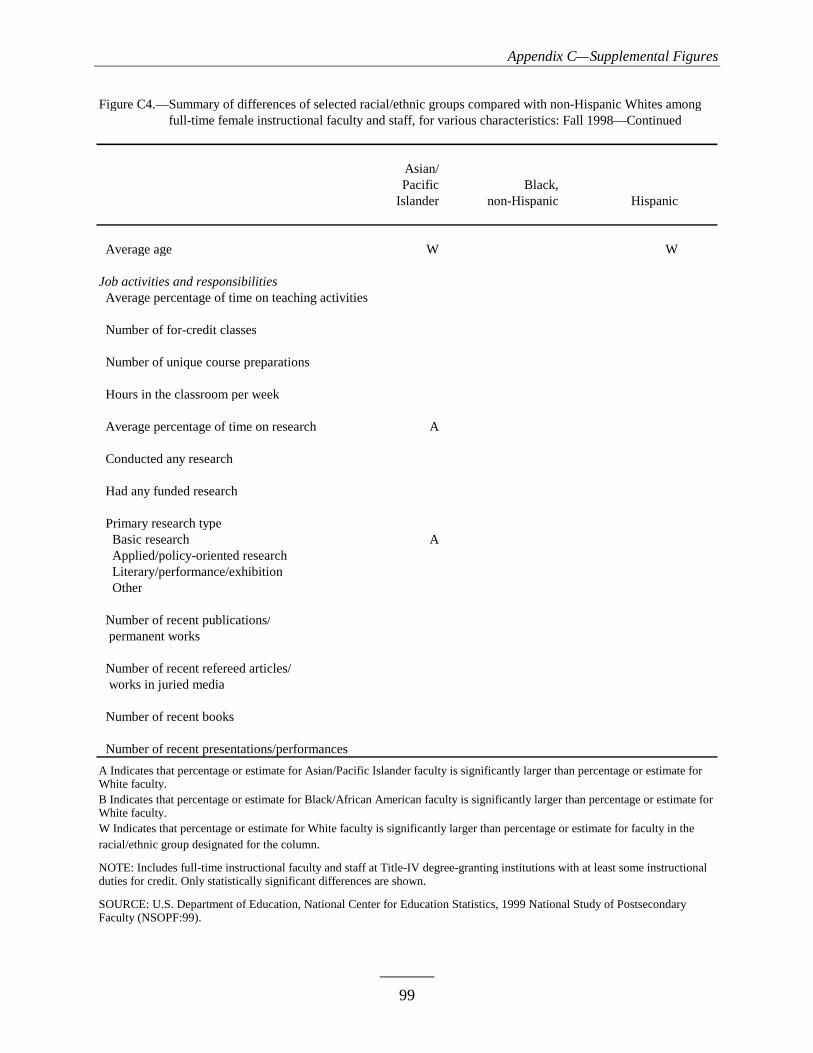
Appendix C—Supplemental Figures
99
Figure C4.—Summary of differences of selected racial/ethnic groups compared with non-Hispanic Whites amongFigure C4.—full-time female instructional faculty and staff, for various characteristics: Fall 1998—Continued
Asian/ Pacific Black,
Islander non-Hispanic Hispanic
Average age W W
Job activities and responsibilities Average percentage of time on teaching activities
Number of for-credit classes
Number of unique course preparations
Hours in the classroom per week
Average percentage of time on research A
Conducted any research
Had any funded research
Primary research type Basic research A Applied/policy-oriented research Literary/performance/exhibition Other
Number of recent publications/ permanent works
Number of recent refereed articles/ works in juried media
Number of recent books
Number of recent presentations/performances
A Indicates that percentage or estimate for Asian/Pacific Islander faculty is significantly larger than percentage or estimate forWhite faculty.B Indicates that percentage or estimate for Black/African American faculty is significantly larger than percentage or estimate forWhite faculty.W Indicates that percentage or estimate for White faculty is significantly larger than percentage or estimate for faculty in theracial/ethnic group designated for the column.
NOTE: Includes full-time instructional faculty and staff at Title-IV degree-granting institutions with at least some instructional duties for credit. Only statistically significant differences are shown.
SOURCE: U.S. Department of Education, National Center for Education Statistics, 1999 National Study of PostsecondaryFaculty (NSOPF:99).