gender and poverty reduction in ghana: the role of
TRANSCRIPT
International Journal of Economics and Finance; Vol. 13, No. 8; 2021
ISSN 1916-971X E-ISSN 1916-9728
Published by Canadian Center of Science and Education
71
Gender and Poverty Reduction in Ghana: The Role of Microfinance
Institutions
Bibiana K. Batinge1,2
& Hatice Jenkins1
1 Department of Banking and Finance, Eastern Mediterranean University, Cyprus
2 Sunyani Technical University, Ghana
Correspondence: Bibiana K Batinge, Department of Banking and Finance, Eastern Mediterranean University,
Cyprus. E-mail: [email protected]
Received: June 7, 2021 Accepted: July 6, 2021 Online Published: July 25, 2021
doi:10.5539/ijef.v13n8p71 URL: https://doi.org/10.5539/ijef.v13n8p71
Abstract
Inequality between men and women is widely acknowledged across many parts of the globe. For example,
among paid employees in Ghana, women‟s average hourly earnings were around 67% of men. The disparity in
earnings perpetuates poverty. Access to financial resources is widely regarded as crucial machinery to addressing
this gender disparity and reducing poverty among women. Microfinance is a conduit to increasing access to
finance among poor urban and rural women who usually lack the collateral to access loans from traditional
financial institutions. Notwithstanding the vital role microfinance institutions play, there is no consensus on the
assertion that its impact is generally favourable. Therefore, this study investigated the role of microfinance on
health, education, and standard of living, as dimensions of poverty reduction in the Techiman Municipality of
Ghana. The results indicate that access to microfinance services positively correlates to health, education, living
standards and poverty reduction. Therefore, it is essential to extend the reach of microfinance services to increase
access further to finance and, consequently, accelerate the rate of poverty reduction within the Municipality.
Keywords: gender, women, poverty reduction, microfinance, Ghana
1. Introduction
Gender inequality is widely acknowledged across many parts of the globe. Women, compared to men, receive
various unequal treatment across economic and social settings. Globally, women receive 24 per cent less in
wages than men, and it will take 170 years to close the gap (Oxfam International, 2019) at the current rate of
progress. In developing countries, gender inequality in the economy costs women $9 trillion a year, an amount
that would give women new spending power and support to their families, communities and the economy at
large (Oxfam International, 2019). Gender inequality within an economy perpetuates poverty.
In Ghana, ownership of wealth and assets is highly skewed in favour of men (Oduro et al., 2018). Only an
estimated 6% of Ghana‟s wealthiest people are women. Land and housing make up the most significant
proportion of portfolios of household property. Still, women are half as likely to own land as men, and almost
twice as many men own the deed to their place of residence as women. In the public sector, the proportion of
employed men is double that of women. Women are concentrated in precarious jobs in the informal sector and
are less likely to be eligible for medical care, paid parental leave, annual or sick leave, or retirement pension than
men. There is also a gender wage gap. Among paid employees, the average hourly earnings of women were
around 67% of their male counterparts.
Many scholars opine that microfinance plays a tremendous role in the entrepreneurial growth of women (Ishfaq,
Khan, Shah, & Jamil, 2016). It has been argued that microfinance creates opportunities for self-employment
(Shepherd & Diwakar, 2018) and is well-positioned to provide financial services to those who mainstream
financial institutions exclude. According to Beegle, Christiaensen, and Dabalen (2016), microcredit institutions
contribute tremendously to economic development by giving finance to small-scale businesses, creating the
willingness to save among rural people and improving the economic well-being of the people in the
communities.
More sustainable growth of microfinance institutions is projected to have taken more people out of poverty
(Nasir & Farooqi, 2016). Increasing inequality, however, decreased the effect of economic growth on poverty

ijef.ccsenet.org International Journal of Economics and Finance Vol. 13, No.8; 2021
72
reduction from 2006 to 2013 by 1.1 percentage points. This means that if inequality had not increased, poverty
would have fallen by 8.8 percentage points instead of 7.7 percentage points. Thus, reducing women‟s poverty
means empowering them socially, economically, and in business development by reducing gender inequality in
access to information and markets.
Several researchers such as Umemezia and Osifo (2018), Addai (2017) and Batola, Amoako, and Addai (2016)
have reiterated the role of microfinance institutions in ensuring poverty reduction of women in Africa.
Microfinance institutions disburse small amounts that have a knock-on effect resulting in a significant
contribution toward the well-being of the poor (Boateng, Boateng, & Bampoe, 2015).
Generally, microfinance institutions focus on funding for investment in micro-enterprises, complex customer
needs, and the broader financial environment (Ledgerwood, Earne, & Nelson, 2013). The goal of microfinance
institutions includes providing credit to the poor to combat poverty and other economic, social and business
development services often ignored by traditional commercial banks (Boateng et al., 2015).
Many women in Ghana, especially those residing in rural areas, have limited access to financial services due to
gender inequalities (Owusu-Antwi, Antwi, & Crabbe, 2014). Women are mostly not creditworthy as they lack
any collateral necessary to access a bank loan. This situation is seen as a major factor that hinders women‟s
productivity and renders them vulnerable to income shocks and, ultimately, loss of economic power.
There are, however, reasons to be concerned that Microcredit‟s impacts may not be uniformly positive. Studies
have found conflicting associations of Microcredit with women‟s nutrition (Hamad & Fernald, 2012; Moseson,
Hamad, & Fernald, 2014), empowerment (Mudaliar & Mathur, 2015; Olateju, 2018), contraceptive use
(Mudaliar & Mathur, 2015; Norwood, 2011), and mental health (Bajracharya & Amin, 2013). A randomised
group lending intervention study among administrative areas in Ethiopia found no change in economic or health
outcomes among those communities randomised to the microcredit intervention (Tarozzi, Desai, & Johnson,
2015). Another study in India examined various health and economic outcomes and found only increased
spending on durable goods in the treatment group (Bajracharya & Amin, 2013). An increased social capital was
found among loan recipients, although the loans were combined with a “participatory gender training” and may
not reflect the effects of the financial intervention itself (Banerjee, Karlan, & Zinman, 2015).
This study investigates the effect of microfinance services on health, education, and living standards as
dimensions of poverty reduction in the Techiman Municipality of Ghana. In the Techiman Municipality, about
34.2% of the households in Techiman Municipality are female-headed. The famous Techiman market, the largest
agricultural products market in the country, attracts a floating population of over three thousand for three days
every week into the Municipality. Males constitute 48.5 per cent, and females represent 51.5 per cent. With the
migration of women to the Municipality due to the market, this study sheds light on the role microfinance
institutions play toward poverty reduction.
The rest of the paper is organised as follows: section two provides further literature to the teams on gender,
poverty, and microfinance institutions, section three presents the methodological approach employed in
conducting the study, section four presents the results and analysis, section five presents the conclusions drawn
from the study.
2. Literature Review
Sub-Saharan Africa is the only region in the world where the overall number of impoverished people is growing
rather than decreasing, according to the new World Bank report on Poverty and Shared Prosperity (Friederike,
2018). There are currently an estimated 413 million people living in extreme poverty in Africa, more than half of
the total world poor population (Friederike, 2018). The continent has women who make up more than 80% of
farmers, and more than 40% of them are analphabets without access to formal education (Johnson, 2013).
Poverty is prevalent, especially among women. The consequences include limited access to better jobs, health
services, a clean environment, and good drinking water. The poverty crisis in sub-Saharan Africa gives way to
lack of knowledge, hunger and malnutrition, illness, and lack of access to credit facilities, short life span and
hopelessness.
It is estimated that women do at least double the amount of unpaid work, such as child care (Oxfam International,
2019). Women work longer days than men when they are counted together for paid and unpaid jobs. Jagger
(2013) noted that more than half of the world‟s population consists of women who perform nearly two-thirds of
the world‟s working hours and earn just 10 per cent of the world‟s profits. This means that a young woman today
can work an average of four years more than a man during her lifetime (Oxfam International, 2019).

ijef.ccsenet.org International Journal of Economics and Finance Vol. 13, No.8; 2021
73
2.1 Gender and Poverty in the Ghanaian Context
Ghana‟s economic growth has been remarkable over the past twenty years (Ghana Statistical Service, 2019).
Since the return to democracy in the 1990s, growth has been rising, although it has become more erratic in recent
years (Ghana Statistical Service, 2019). On average, between 1991 and 2013, the Ghanaian economy grew by
5.8 per cent annually in 13 of the 22 years. In the second quarter of 2019, Ghana‟s economy progressed by 5.7%
year-on-year, following a 6.7% rise in the previous period (Ghana Statistical Service, 2019).
Despite continued economic growth and a substantial poverty reduction, income inequality in Ghana has been
steadily increasing for several years. This is a serious threat to efforts to reduce inequality and needs to be
addressed. Oxfam International (2019) report added that there was no rise in deprivation during this time, and
nearly 300,000 more men, women and children could have been raised from poverty in Ghana between 2006 and
2013. Ghana needs a human society to address inequality: one that works equally for women as it does for men.
The state should guarantee the right to quality universal health care and education, with nobody‟s income
restricting their access to essential services.
It is estimated that more than 2.8 million Ghanaians are living in extreme poverty, representing around 10 per
cent of the population. The vast number is said to live below the $1.9 a day of the global poverty line ( National
Development Planning Commission, 2018). Nevertheless, Fortson (2003) reported that women reinvest up to 90
per cent of their total earnings in their societies in developing nations, as opposed to the thirty to forty per cent
that men reinvest. From a development standpoint, women are what economists call a growth reserve, meaning
that there is still tremendous untapped economic potential. The extreme economic and social effect unleashed on
the poor in developing countries has given rise to substantial interest on donors, policymakers, and practitioners
to increase access to Microfinance for the vulnerable.
2.2 Microfinance Institutions
Today, many analysts perceive Microfinance as a valuable financial service, but not as a transformative social
and economic activity (Cull & Murdoch, 2017). Some, responding to high expectations, condemn Microfinance
as a misguided fad, a capitalist paradox that entranced donors but failed to deliver programs that benefited poor
communities (Viswanath, 2018). Even optimistic critics fear that by focusing more on lenders‟ profitability than
on consumer poverty, Microfinance has lost its moral compass (Hulme & Maitrot, 2014). Other studies found
adverse effects on poverty reduction among women (Bhuiyan, Siwar, & Ismail, 2013). There are other services
like advisory, insurance, savings, asset financing that women entrepreneurs can access to help them achieve
economic empowerment (Fwamba, Matete, Nasimiyu, & Sungwacha, 2015).
Given that microcredit organisations provide loans rather than monetary transfers, participation may increase
debt and stress if the loans are not invested appropriately. Research has shown that women may become trapped
in a cycle of debt as they take out additional loans to repay old ones (Naeem, Khan, Sana-ur-Rehman, Ali, &
Hassan, 2015). Moreover, women often manage the microenterprise and run the household, resulting in a dual
burden of responsibility and contributing to role overload or role conflict (Parvin & Rahman, 2012). It is also
likely that the structural contexts in which women live play a determining factor in the effects of microcredit
programs on women‟s health (Kratzer & Kato, 2013). Prior research established that women in some microcredit
programs are subject to domestic violence and are often forced to take out loans by their spouses or other
relatives (Naeem et al., 2015). Studies further showed that women sometimes have little or no control over their
loans, with the spouse or male family member making all decisions (Cull & Murdoch, 2017; Macours & Vakis,
2014).
Differences in literacy, property rights and social attitudes about women may limit impact outside of the
immediate household. However, Bateman and Ha-Joon (2012) hold a contrary view, stating that micro-credit
only offers an illusion of poverty reduction. Dzisi and Obeng (2013) relate stories of the brutal way individuals
find themselves trapped in debts to some Microfinance institutions. Even when clients have lost everything
through disasters, they are still expected to pay their loans. Adams (2015), in his research, found that
Microfinance may not be appropriate in every situation as one size fits all strategy in poverty alleviation and
empowerment. The study notes that credit alone cannot serve Microfinance clients and take them out of poverty.
Boateng et al. (2015) also argue that although Microfinance can improve clients‟ conditions, it can also create
disturbing impacts hence the need for counteracting measures to curtail the adverse effects in the design of credit
programmes. The contrasting opinions thus raise questions about the impact Microfinance services have on the
socio-economic lives of their clients. Despite the extensive research on Microfinance, there are limited studies on
the effects of Microcredit on vital socio-economic indicators such as health, education, and standard of living.

ijef.ccsenet.org International Journal of Economics and Finance Vol. 13, No.8; 2021
74
2.3 Microfinance Institutions and Poverty Reduction
Adjei, Arun, and Hossain (2009) studied cross-sectional data from clients of Sinapi Aba Trust, a Microfinance
NGO in Ghana. They found that participation in the program enabled established clients to own savings deposits
and subscribe to a client welfare scheme that served as insurance to pay off debts in times of illness or death. In
addition, increased economic independence for women may enable them to be more active in decision-making
around finances and health, increasing their relative status within the household (Hamad & Fernald, 2015).
Fwamba et al. (2015) believe that Microfinance schemes can reduce poverty and improve people‟s health and
education needs. The implication of this is that increased earnings also mean that clients may seek out and pay
for health care services when needed, rather than go without or wait until their health seriously deteriorates
(KIVA, 2013).
Shimamura and Lastarria-Cornhiel (2010) evaluated the impact of agricultural credit program participation on
children‟s school attendance and found a positive relationship between this MFI service and children‟s school
attendance. However, Augsburg and Fouillet (2015) found a lower level of schooling among teenagers in more
impoverished families obtaining microfinance. Tarozzi et al. (2017) used data from a randomised control trial in
rural Ethiopia to study the impact of Microfinance on several socio-economic outcomes, including schooling and
found no effect on Education. Viswanath (2017) noted that the return on investments from finance awarded to
women seems to reach all household members better, significantly improving children‟s health and schooling.
Previously, Addae-Korankye (2012) indicated that all Microfinance institutions provide an affordable credit
source to their members. In conformity with this finding, Chen, Foster, and Putterman (2019) suggested that
Microfinance move funds from parties with excess capital to parties needing funds. His study indicated a
positive relationship between Microfinance services and poverty reduction. Microfinance institutions pool funds
from several sources through this process, enabling their clients to make significant investments (Okibo &
Makanga, 2014).
Ganle, Afriyie, and Segbefia (2015) stated that Microfinance institutions in Ghana came into existence to
re-enforce the government‟s commitment to rural credit as part of a national strategy to improve agriculture and
the living conditions of rural farms. Ansoglenang (2006) concluded that micro-credit institutions had been
helpful to the women in Lawra and another part of the Upper West Region. The women noted that their
undertakings were gainful and had brought about an enhanced standard of living. Asamoah, Ansah, Anchirinah,
Aneani, and Agyapong (2012), in a comprehensive study on the fight against poverty using the Microfinance
support system, found that the tactical engagement of well-made programs resulted in the increment of wealth
for the underprivileged and enhanced their socio-economic position. They contended that a strong signal that the
effect of a loan on a borrower‟s income was associated with the level of income as those with greater wealth had
an enhanced chance of investment opportunities. Funding establishments were disposed to favour the upper and
middle poor. According to Charlotte, Amankwaa, Asafo-Adjei, Ekow and Kumah (2012), there has been an
explicit endorsement of credit given to very underprivileged families. As a result, those homes grew their
incomes and assets.
3. Method
The study was carried out in several Microfinance institutions in the Techiman Municipality of the Bono East
Region of Ghana. The target population for the study comprised all Microfinance institutions and their female
customers in the Municipality. The Microfinance institutions were treated as a unit, and the same questionnaire
was administered to them. Sixteen Microfinance institutions registered within the Municipal Assembly were
considered as the sample institutions for the study.
The sample size for the Microfinance institutions was determined using Van Dalen‟s (1980) recommendation.
Van Dalen stipulated that a survey should contain at least ten to fifteen per cent of the target population. In
agreement with this, the researcher decided to use a sample of 8 out of the 16 microcredit institutions. This
number constitutes 50% of the population. The institutions are the Multicredit Savings and Loans, BACCSOD,
Abosomankotere Cooperative Credit Union, Ebenezer Cooperative Credit Union, Fiagya Rural Bank, Kaaseman
Rural Bank, Sinapi Aba Savings and Loans and Techiman Area Teachers Cooperative Credit Union. Both the
descriptive and the explanatory research design were adopted for the study. A sample size of 271 comprising 255
customers and 16 staff were selected.
A simple random sampling, where each of the participants in the study has an equal chance of being chosen, was
then used to select the Microfinance institutions. Next, a questionnaire was designed and used as a data
collection tool. A quota and simple random sampling techniques were used to determine the female customers of
the chosen microfinance institutions. The quota sampling technique was first applied to help to decide how many

ijef.ccsenet.org International Journal of Economics and Finance Vol. 13, No.8; 2021
75
respondents are needed to represent each microcredit institution. According to Prabhat and Meenu (2015), this
non-probability sampling technique helps researchers identify specific characteristics in their respondents and
then take a tailored sample in proportion to a population of interest. The criteria for selecting the female
customers included being active in the institution for at least one year and benefitted from the institution‟s loan
services. In addition, the respondents should be a resident in the Techiman Municipality.
Before applying the quota sampling, the study adopted the tables proposed by Krejcie and Morgan (1970) to
determine the sample size for the sample women. This sample study determination has been used and
recommended by various researchers such as Mutz, Hengevoss, Hugi, and Gross (2017). The formula guiding
this sample size determination is:
n = 𝑋2𝑁𝑃(1;𝑃)
𝑑2(𝑁;1) : 𝑋2𝑃(1;𝑃) (1)
where 𝑋2 = the table value of chi-square for 1 degree of freedom at the desired confidence level, which is
calculated as 1.96*1.96 = 3.8416
P = the population proportion (0.50 since this would provide the maximum sample size).
D = the degree of accuracy expressed as a proportion (.05).
Hence, for the women customers in the Microfinance institutions, the sample size is calculated as:
n =3.8416∗755∗0.5∗0.5
(0.05)2(755) : 3.8416∗0.5∗0.5=
725.102
2.8479= 254.61 ≅ 255 (2)
The following formula was used to determine the sample size for each microfinance institution:
𝑛ℎ =𝑛×𝑁ℎ
𝑁 (3)
Where 𝑛ℎ is the sample size of firm h;
𝑁ℎ is the population of respondents of the institution h;
𝑁 is the total population of respondents of the institutions;
𝑛 is the total sample size of respondents for the study.
Hence the sample size for respondents of BACCSOD is calculated as;
𝑛𝐵𝐴𝐶𝐶𝑆𝑂𝐷 =255×111
755= 35.49 ≈ 36 (4)
Hence the sample size for respondents of Abosomankotere Cooperative Credit Union is calculated as;
𝑛𝐴𝑏𝑜𝑠𝑜𝑚𝑎𝑛𝑘𝑜𝑡𝑒𝑟𝑒 =255×121
755= 40.87 ≈ 41 (5)
Applying the formula to the other institutions, the population and sample for the study is indicated in Table 1.
Table 1. Population and sample for the study
Microfinance institution Population of Women Customers Sample of Women Customers
BACCSOD 111 36
Abosomankotere Cooperative Credit Union 121 41
Ebenezer Cooperative Credit Union 93 32
Multicredit Savings and Loans 72 25
Sinapi Aba Savings and Loans 116 39
Fiagya Rural Bank 74 25
Kaaseman Rural Bank 59 20
Techiman Area Teachers Cooperative Credit Union 109 37
Total 755 255
Source: Field Data (2020).
The names of the respondents were obtained from the microfinance institutions and shortlisted using simple
random sampling.
The collection of this primary data provided an added advantage of designing the research tool to collect
information for specific purposes of their study (Creswell, 2003). Primary data has been described as the

ijef.ccsenet.org International Journal of Economics and Finance Vol. 13, No.8; 2021
76
most efficient data source because it is directed to the respondents.
The questionnaire was the instrument for this study. Two sets of questionnaires were developed: one
for Microfinance institutions and another for women customers. The management questionnaire consisted of two
parts: „I‟ and „II‟ Part I contained items on the demographic characteristics of the respondents. This included the
educational level and the working experience. Part II had questions relating to the Microfinance packages that
are available for women. The customers‟ questionnaire also consisted of three parts: „I, „II‟ and „III.‟ Part I
contained items on the demographic characteristics of the respondents. This included education and
working experience. Part II also had questions relating to the packages of the Microfinance institutions to women.
This section also covered financial intermediation, microinsurance, social intermediation and enterprise
development services. Part III looked at poverty reduction of women, covering health, education, and
improvement in living standards as dimensions of poverty measure. The questionnaires were administered to
both the institution (manager) and the female customers.
The data was processed into descriptive and inferential statistics, including a one-sample t-test, factor analysis,
correlation analysis, and regression analysis. The correlation and multiple regression were used to examine the
effect of Microfinance institutions on poverty reduction among women. The study used the correlation of
Pearson r, which is the most used statistical correlation to calculate the degree of the relationship between
linearly related variables.
The analytical model that was applied to compute for the regression analysis help to determine the Microfinance
and poverty reduction, and it is as given as:
Y=α+β1X1+ β2X2+ β3X3+ β4X4 + ε (6)
Where:
Y = Poverty Reduction (Health, Education, Standard of Living);
X1 = Financial Services;
X2 = Entrepreneurial Development Services;
X3 = Social Services;
X4 = Microinsurance;
ε = the error term.
This equation summarises the different equations. The regression was conducted, pairing each dependent
variable separately from the dependent variables. The dependability of a research result pivots on two essential
testing methods; reliability and validity (Saunders, Lewis, & Thornhill, 2009). The subjection of the research
outcomes to testing ensures that the findings of the study can withstand rigorous scrutiny.
The reliability test is vital in determining whether a measurement instrument used to arrive at a particular result
will yield the same result if the same methodological apparatus is employed (Ofori-Kuragu, Baiden, & Badu).
The research instrument should not vary in its results on different occasions when used (Denscombe, 2014). The
study adopted the Cronbach‟s alpha coefficient, the most common instrument used in measuring reliability
(Bassioni, Hassan, & Price, 2008) to test for reliability.
The validity depicts the extent to which an instrument measures the intended research component (Kimberlin &
Winterstein, 2008) and the appropriateness of the data in terms of the research question being investigated
(Denscombe, 2014). Content validity, which helps check the validity of the data collected, is attained by ensuring
that the respondents get into the accurate picture and the meaning of the concepts as purported by the researcher,
thereby making the concept clear.
The questionnaires were piloted with three experienced experts to ascertain wording and understanding in the
various constructs. However, the comments necessitated the modifications of some statements in the
questionnaire.
4. Results and Discussions
This section presents the study results findings. The study sourced respondents‟ demographics data, which is
summarised in Table 2. The demographic information of the respondents is provided in Table 2 below.

ijef.ccsenet.org International Journal of Economics and Finance Vol. 13, No.8; 2021
77
Table 2. Demographic data of respondents
MFI Staff Women Respondents
Questions Categories Freq Percent (%) Freq Percent (%)
Educational Level Illiterate - - 21 8.2
Basic - - 53 20.8
SHS/SSS - - 70 27.5
Diploma / HND 2 12.5 47 18.4
Degree 9 56.3 49 19.2
Masters 5 31.2 15 5.90
Total 16 100 255 100
How many years have
you been with the
Microfinance sector?
1-5 years 2 12.5 47 18.4
6-10 years 6 37.5 76 29.8
11-15 years 8 50.0 63 24.7
More than 15 years - - 69 27.1
Total 16 100 255 100
Source: Field Data (2019).
For educational qualification of staff, 2 (12.5%) had Diploma/HND, 9 (56.3%) were degree holders, and 5
(31.2%) had their masters. Therefore, respondents who answered the questionnaires on behalf of the
Microfinance institutions had all attended tertiary institutions. It is therefore anticipated that they can read and
understand the questions answer them appropriately. With their working experience, 2 (12.5%) indicated they
have worked with the institution for 1-5 years, 6 (37.5%) indicated that they have worked for 6-10 years, and 8
(50%) had worked for 11-15 years. Most of the staff who answered the questionnaire have worked for the
Microfinance sector for more than five years hence are expected to know the institutions‟ operations.
Of the women respondents, 21 (8.2%) had no formal education, 53 (20.8%) had Basic education, 70 (27.5%) had
attended either Senior High or Senior Secondary, and 47 (18.4%) possess Diploma / HND certificate. For the rest,
49 (19.2%) had their first-degree certificates, and 15 (5.9%) own their masters. Most of the women surveyed
have had at least secondary education and could read and answer the questionnaires appropriately. We translated
the questionnaire for them in the local dialect (“Twi”) to understand and respond to the respondents who could
not read and write. In terms of the number of years that these women have been with the Microfinance sector, 47
(18.4%) indicated 1-5 years, 76 (29.8%) indicated 6-10 years, 63 (24.7%) indicated 11-15 years and 69 (27.1%)
revealed more than 15 years.
4.1 The Effectiveness of Roles of Microfinance Institutions
The study examined the roles of the Microfinance institutions from both the staff and women customers‟
perspectives. The staff were asked to specify what their institutions had instituted to assist their women. The
results are shown in Table 3 below.
Table 3. Microfinance interventions for women
Package Frequency Percentage
Financial Products and Services 16 100
Mobilization of Funds 16 100
Business Advice 16 100
Training on Financial Management 16 100
Training on Skill Development 15 93.8
Social Services on advancing Women 16 100
Source: Field Data (2020).
From Table 3, all respondents indicated that their institution offered financial products and services, business
advice, financial management training, and mobilisation of funds. Other roles that were specified included
training on skill development, business advice and provision of social services to advance the welfare of women.
For training on skill development, 15 out of the 16 institutions (representing 93.8%) indicated that they offer
women training.
To the women, the roles of Microfinance were evaluated in four dimensions; financial intermediation services,
ijef.ccsenet.org International Journal of Economics and Finance Vol. 13, No.8; 2021
78
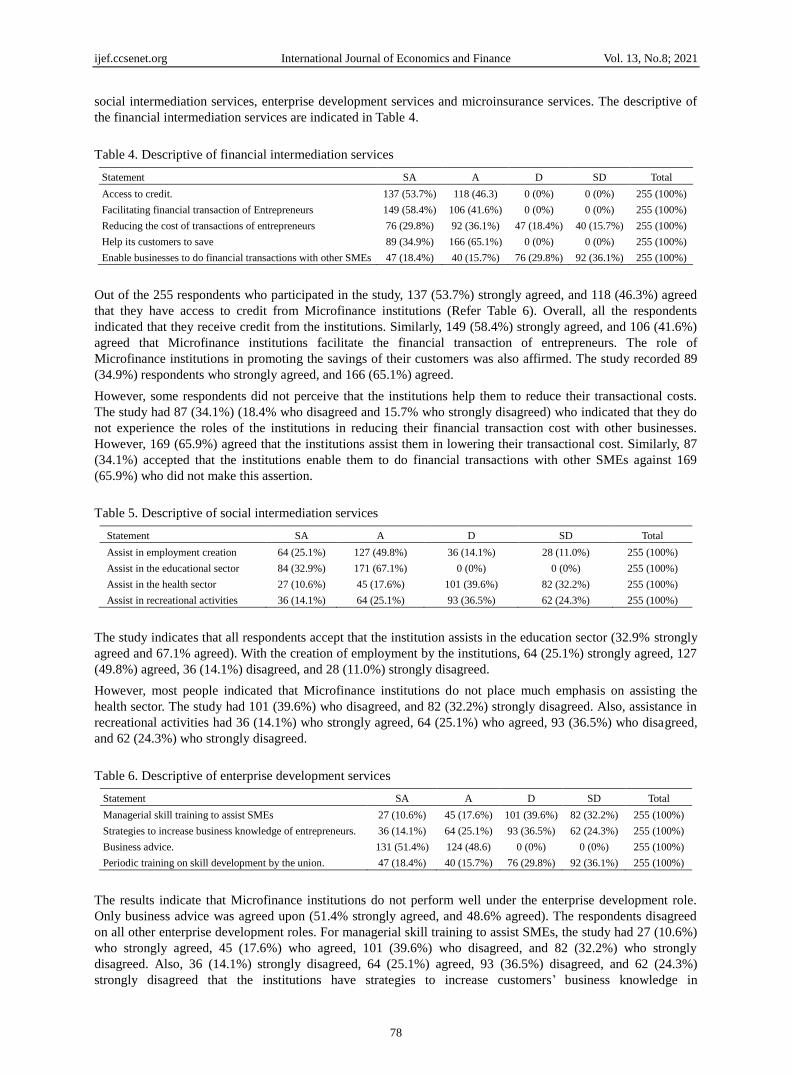
social intermediation services, enterprise development services and microinsurance services. The descriptive of
the financial intermediation services are indicated in Table 4.
Table 4. Descriptive of financial intermediation services
Statement SA A D SD Total
Access to credit. 137 (53.7%) 118 (46.3) 0 (0%) 0 (0%) 255 (100%)
Facilitating financial transaction of Entrepreneurs 149 (58.4%) 106 (41.6%) 0 (0%) 0 (0%) 255 (100%)
Reducing the cost of transactions of entrepreneurs 76 (29.8%) 92 (36.1%) 47 (18.4%) 40 (15.7%) 255 (100%)
Help its customers to save 89 (34.9%) 166 (65.1%) 0 (0%) 0 (0%) 255 (100%)
Enable businesses to do financial transactions with other SMEs 47 (18.4%) 40 (15.7%) 76 (29.8%) 92 (36.1%) 255 (100%)
Out of the 255 respondents who participated in the study, 137 (53.7%) strongly agreed, and 118 (46.3%) agreed
that they have access to credit from Microfinance institutions (Refer Table 6). Overall, all the respondents
indicated that they receive credit from the institutions. Similarly, 149 (58.4%) strongly agreed, and 106 (41.6%)
agreed that Microfinance institutions facilitate the financial transaction of entrepreneurs. The role of
Microfinance institutions in promoting the savings of their customers was also affirmed. The study recorded 89
(34.9%) respondents who strongly agreed, and 166 (65.1%) agreed.
However, some respondents did not perceive that the institutions help them to reduce their transactional costs.
The study had 87 (34.1%) (18.4% who disagreed and 15.7% who strongly disagreed) who indicated that they do
not experience the roles of the institutions in reducing their financial transaction cost with other businesses.
However, 169 (65.9%) agreed that the institutions assist them in lowering their transactional cost. Similarly, 87
(34.1%) accepted that the institutions enable them to do financial transactions with other SMEs against 169
(65.9%) who did not make this assertion.
Table 5. Descriptive of social intermediation services
Statement SA A D SD Total
Assist in employment creation 64 (25.1%) 127 (49.8%) 36 (14.1%) 28 (11.0%) 255 (100%)
Assist in the educational sector 84 (32.9%) 171 (67.1%) 0 (0%) 0 (0%) 255 (100%)
Assist in the health sector 27 (10.6%) 45 (17.6%) 101 (39.6%) 82 (32.2%) 255 (100%)
Assist in recreational activities 36 (14.1%) 64 (25.1%) 93 (36.5%) 62 (24.3%) 255 (100%)
The study indicates that all respondents accept that the institution assists in the education sector (32.9% strongly
agreed and 67.1% agreed). With the creation of employment by the institutions, 64 (25.1%) strongly agreed, 127
(49.8%) agreed, 36 (14.1%) disagreed, and 28 (11.0%) strongly disagreed.
However, most people indicated that Microfinance institutions do not place much emphasis on assisting the
health sector. The study had 101 (39.6%) who disagreed, and 82 (32.2%) strongly disagreed. Also, assistance in
recreational activities had 36 (14.1%) who strongly agreed, 64 (25.1%) who agreed, 93 (36.5%) who disagreed,
and 62 (24.3%) who strongly disagreed.
Table 6. Descriptive of enterprise development services
Statement SA A D SD Total
Managerial skill training to assist SMEs 27 (10.6%) 45 (17.6%) 101 (39.6%) 82 (32.2%) 255 (100%)
Strategies to increase business knowledge of entrepreneurs. 36 (14.1%) 64 (25.1%) 93 (36.5%) 62 (24.3%) 255 (100%)
Business advice. 131 (51.4%) 124 (48.6) 0 (0%) 0 (0%) 255 (100%)
Periodic training on skill development by the union. 47 (18.4%) 40 (15.7%) 76 (29.8%) 92 (36.1%) 255 (100%)
The results indicate that Microfinance institutions do not perform well under the enterprise development role.
Only business advice was agreed upon (51.4% strongly agreed, and 48.6% agreed). The respondents disagreed
on all other enterprise development roles. For managerial skill training to assist SMEs, the study had 27 (10.6%)
who strongly agreed, 45 (17.6%) who agreed, 101 (39.6%) who disagreed, and 82 (32.2%) who strongly
disagreed. Also, 36 (14.1%) strongly disagreed, 64 (25.1%) agreed, 93 (36.5%) disagreed, and 62 (24.3%)
strongly disagreed that the institutions have strategies to increase customers‟ business knowledge in

ijef.ccsenet.org International Journal of Economics and Finance Vol. 13, No.8; 2021
79
entrepreneurship. Furthermore, for periodic training on skill development by the union, the study had 47 (18.4%)
who strongly agreed, 40 (15.7%) who agreed, 76 (29.8%) who disagreed, and 92 (36.1%) who strongly
disagreed.
Table 7. Descriptive of micro insurance services
Statement SA A D SD Total
I have undertaken special deposits for my children in the institution 17 (6.7%) 35 (13.7%) 111 (43.5%) 92 (36.1%) 255 (100%)
The institution has opportunity for me to insure myself against the
future
28 (11.0%) 57 (22.3%) 100 (39.2%) 70 (27.5%) 255 (100%)
The institution has special accounts for funeral and disability which
I have engaged in
81 (31.8%) 74 (29.0) 50 (19.6%) 50 (19.6%) 255 (100%)
Through the Microfinance institutions, I have successfully insured
my work against future risk
37 (14.5%) 30 (11.8%) 86 (33.7%) 10 (3.9%) 255 (100%)
From the results, it could be inferred that the inclusion of women in the microinsurance services of Microfinance
institutions is not encouraging. For special deposits of Microfinance geared towards the future of customers
children‟s, 203 (79.6%) did not include themselves or were not involved. Similarly, 170 women representing
66.7%, disagreed that Microfinance institutions have an opportunity to insure themselves against the future. In
addition, women also disagreed that Microfinance institutions have insurance policies against their work.
4.2 Correlation, Factor Analysis and Descriptive Statistics of the Variables
The correlation table and its interpretations are shown below.
Table 8. Correlation analysis of the variables
H ED SL FS SS EDS MI
H PC 1.00 0.645 0.612 0.514* 0.181* 0.164* 0.023
Sig. 0.071 0.110 0.000 0.008 0.000 0.111
ED PC 0.645 1.00 0.387 0.213* 0.412 0.198* 0.121
Sig. 0.071 0.070 0.006 0.114 0.000 0.061
SL PC 0.612 0.387 1.00 0.316* 0.089 0.401* 0.141
Sig. 0.110 0.070 0.000 0.114 0.000 0.120
FS PC 051 * 0.213* 0.316* 1.00 0.178 0.386* 0.386
Sig. 0.000 0.006 0.000 0.150 0.000 0.100
SS PC 0.181* 0.412 0.089 0.178 1.00 0.266 0.266
Sig. 0.008 0.114 0.114 0.150 0.114 0.114
EDS PC 0.164* 0.198* 0.401* 0.386* 0.266 1.00 0.386
Sig. 0.000 0.000 0.000 0.000 0.114 0.100
MI PC 0.023 0.121 0.141 0.386 0.266 0.386 1.00
Sig. 0.111 0.061 0.120 0.100 0.114 0.100
Source: Field Survey, (2020).
*. Correlation is significant at the 0.05 significant level (2-tailed)
KEY: ED = Education, SL = Standard of Living, FS = Financial Services, SS = Social Services,
EDS = Enterprise Development Services, MI = Micro insurance, H = Health, PC = Pearson Correlation, Sig = Significance.
The study indicated in Table 8 indicates a positive relationship between the variable under poverty reduction
components and Microfinance institutions services, except micro-insurance services. Health component of
poverty reduction correlated positively with financial services (r = 0.514, p-value < 0.05), social services (r =
0.181, p-value < 0.05) and also with enterprise services (r = 0.164, p-value < 0.05). This implies a positive
relationship between Microfinance institutions services and the health dimension of poverty reduction. Education
components correlated positively with financial services (r = 0.213, p-value < 0.05) and enterprise development
services (r = 0.198, p-value < 0.05). Similarly, standard of living components correlated positively with financial
services (r = 0.316, p-value < 0.05) and enterprise development services (r = 0.401, p-value < 0.05). This implies
a positive relationship between Microfinance institutions financial and enterprise development services and
financial and enterprise development components of poverty reduction. Microfinance microinsurance services
did not, however, relate to poverty reduction.

ijef.ccsenet.org International Journal of Economics and Finance Vol. 13, No.8; 2021
80
4.2.1 Factor Analysis of the Variables
The basic principle of factor analysis is a set of underlying variables called factors (less than the observable
variables) that explain the interrelationships between these variables for a series of visible variables. However,
from the correlation (Table 8), there was no intercorrelation among the dependent variables or the independent
variables, and hence the data is usually distributed. The data, therefore, do not meet the assumption for factor
analysis.
The regression analysis requires all variables to be multivariate normal. The Kolmogorov-Smirnov Test and the
scatter plot were used. The results are presented in Table 9. The decision is that if the significance value of the
Kolmogorov-Smirnov Test is greater than 0.05, the data is normal. If it is below 0.05, the data significantly
deviate from a normal distribution.
The results (see Table 10) indicate that the data passes the test for normality, confirming the multivariate
normality of the data. This is because the Kolmogorov-Smirnov Test values for the variables are greater than the
5% significance level.
Table 9. Tests of normality
Kolmogorov-Smirnova
Statistic Sig.
Financial Services 0.287 0.310*
Social Services 0.177 0.200*
Enterprise Development Services 0.166 0.214*
Health 0.151 0.218*
Education 0.178 0.201*
Standard of Living 0.191 0.290*
Source: Field Data (2020).
The scatter plot is indicated in Figure 1. The diagram depicts a bell-shaped curve, which means that the
distribution is normal. The figure demonstrates that the normal distribution curve is not skewed to any side,
confirming the multivariate normality of the data.
Figure 1. Scatter diagram
Table 10. Descriptive of variables
Variable Min Max Mean Std. Deviation
Financial Services 1 5 3.56 0.5061
Social Services 1 5 3.25 0.4834
Enterprise Development Services 1 5 3.01 0.4801
Microinsurance 1 5 2.31 1.8902
Health 1 5 4.12 0.3512
Education 1 5 3.32 1.0981
Standard of Living 1 5 3.81 1.1610
Source: Field Survey, (2020).
ijef.ccsenet.org International Journal of Economics and Finance Vol. 13, No.8; 2021
81
The variables were evaluated from 1 (strongly disagreed) to 5 (strongly agree). The result gives minimum values
for the variables as one and maximum values as five. The implication is that the study had some respondents
who strongly disagreed and some who strongly agreed. From the results in Table 9, the variables with mean
values greater than 3.5 are health (mean = 4.12, standard deviation = 0.3512), standard of living (mean = 3.81,
standard deviation = 1.1610) and financial services (mean value of 3.52, standard deviation = 0.5061). The
implication is that among the Microfinance institutions services or roles, financial services are highly observed.
There is an improvement in people‟s health and standard of living in terms of poverty reduction.
The social services, enterprise development services, and microinsurance services of these Microfinance
institutions achieved a mean value of less than 3.5 (3.25 for social services and 3.01 for enterprise development).
Therefore, respondents believed that Microfinance institutions had not played a significant role in these services.
Also, the education component of poverty is low (mean of 3.32 and a standard deviation of 1.0981).
4.3 Effect of Microfinance Institutions’ Services on Health Dimension of Poverty Reduction
The study then determined the extent of influence of the Microfinance institutions services on improving
respondents‟ health. This is determined through the regression model of the analysis. The summary of the model
indicating the correlation coefficient (R) and the ratio of determination (R-square) is presented in Table 11.
Table 11. Regression model summary of microfinance institutions services on health
R R Square R Square Adjusted Std. Error
0.514 0.264 0.261 0.659
Source: Field Data (2020).
The indicated value of the correlation coefficient is 0.514. This value indicates a positive relationship between
Microfinance institutions services and improving the health of people. The study also registered the coefficient
of determination (R-Square) and the adjusted R-Square values of 0.264 and 0.261. With an R-square value of
0.264, the implication is that Microfinance institutions services predict 26.4% of the health improvement of
respondents. The ANOVA analysis of the results is used to determine whether this regression is significant. The
ANOVA analysis is displayed in Table 12.
Table 12. ANOVA on cooperative credit services and health
Model Sum of Squares Df Mean squares F Sig.
1 Regression 0.827 3 0.827 16.66 0.000b
Residual 49.778 251 0.498
Total 50.605 254
a. Dependent Variable: Health; b. Predictors: (Constant), financial services, social services, enterprise development services.
Source: Field Data (2019).
The results show that the significance value registered in the analysis is less than 0.05; this means the data is a
good fit for the model. The implication is that there is evidence that the regression model gives accurate
predictions on the relationship between cooperative credit services and improvement in people‟s health. The
regression coefficients of the study are indicated in Table 13.
Table 13. Regression coefficients of cooperative credit services and improvement in health
Unstandardised Coefficients Standardised Coefficients
B Std. Error Beta T Sig.
1 (constant) 1.818 0.443 4.107 0.000
Financial Services 0.628 0.167 0.309 7.765 0.000
Social Services 0.412 0.219 0.123 5.245 0.000
Enterprise Development Services 0.410 0.145 0.187 5.678 0.000
a. Dependent variable: improvement in health.
The regression coefficients illustrated in Table 12 showed a constant of 1.818, significant at the 0.05 significance

ijef.ccsenet.org International Journal of Economics and Finance Vol. 13, No.8; 2021
82
level. Financial services, social services, and enterprise development services were also significant at the 0.05
significance level. The model equation is:
Improvement in Health = 1.818 + 0.628 (financial services) + 0.412 (Social Services) + 0.410 (Enterprise
Development Services) +
The implication is that a unit increase in access to micro-financial services improves health by a factor of 0.628.
A unit increase in social services of cooperative credit institutions improves health by a factor of 0.412. Similarly,
a unit increase in cooperative credit development will improve the respondent‟s health by 0.410.
4.4 Effect of Microfinance Institutions’ Services on Educational Dimension of Poverty Reduction
The summary of the model indicating the correlation coefficient (R) and the ratio of determination (R-square) is
presented in Table 14.
Table 14. Regression model of microfinance institutions services and education
R R Square R Square Adjusted Std. Error
0.291 0.0847 0.0618 0.41923
Source: Field Data (2019).
The model summary gives a positive correlation coefficient (r = 0.291) between Microfinance institutions
services and the educational component of poverty reduction with an r-square value of 0.0847, adjusted
R-Square value of 0.0618 and standard error of 0.41923. The r-square value of 0.0847 indicates that the
Microfinance institutions explain an 8.5 % variation of the educational component of poverty reduction.
Table 15. ANOVA on microfinance institutions services and education
Model Sum of Squares Df Mean squares F Sig.
1 Regression 1.234 3 1.234 7.0114 0.000
Residual 29.527 251 0.176
Total 30.761 254
a. Dependent Variable: Education; b. Predictors: (Constant), financial services, social services, enterprise development services.
Source: Field Data (2019).
The ANOVA results in Table 14 (p-value = 0.000 < 0.05) indicate that the result is significant. This implies that
the relationship between the Microfinance institutions services and improvement in Education is significant, and
the model gives a better prediction. The regression coefficients of the study are indicated in Table 16.
Table 16. Regression coefficients of microfinance institutions services and improvement in education
Unstandardised Coefficients Standardised Coefficients
B Std. Error Beta T Sig.
1 (constant) 1.677 0.156 17.159 0.000
Financial Services 0.165 0.056 0.189 11.155 0.000
Social Services 0.276 0.187 0.223 7.291 0.141
Enterprise Development Services 0.139 0.048 0.177 6.108 0.000
b. Dependent variable: improvement in Education.
From Table 15, the improvement in education-related positively and significantly with financial services (b-value
= 1.165, p = 0.000 < 0.05), and enterprise development services (b-value = 1.139, p = 0.000 < 0.05). The
implication is that Microfinance financial services and enterprise development services predict improvement
education. The model for the study is thus stated as:
Improvement in Education = 1.677 + 0.165 (financial services) + 0.139 (enterprise development services) +
4.5 Effect of Microfinance Institutions’ Services on the Standard of Living
With the regression analysis, the model summary is indicated in Table 17.

ijef.ccsenet.org International Journal of Economics and Finance Vol. 13, No.8; 2021
83
Table 17. Regression model of microfinance institutions services and standard of living
R R Square R Square Adjusted Std. Error
0.457 0.209 0.193 0.1986
Source: Field Data (2019).
The model summary indicates a positive relationship between Microfinance institutions services and standard of
living (r = 0.457, r-square value = 0.209) (Refer to Table 17). The r-square value of 0.209 indicates that
Microfinance institutions services explain a 20.9% variation in the standard of living.
Table 18. ANOVA on microfinance institutions services and standard of living
Model Sum of Squares Df Mean squares F Sig.
1 Regression 0.813 3 0.813 4.619 0.000
Residual 30.171 251 0.175
Total 30.984 254
b. Dependent Variable: Standard of Living; b. Predictors: (Constant), financial services, social services, enterprise development services.
Source: Field Data (2019).
From the ANOVA table indicated in Table 19, the study is significant (F-value = 4.619, p-value = 0.000 < 0.05).
This means that the model is accurate, and Microfinance institutions services predict the standard of living.
Table 19. Regression coefficients of microfinance institutions services and standard of living
Unstandardised Coefficients Standardised Coefficients
B Std. Error Beta T Sig.
1 (constant) 2.733 0.095 28.719 0.000
Financial Services 1.061 1.046 1.102 4.336 0.000
Social Services 0.479 0.890 0.523 6.990 0.091
Enterprise Development Services 0.738 0.149 0.771 5.009 0.000
c. Dependent variable: standard of living.
From Table 18, standard of living related positively and significantly with financial services (b-value = 1.061, p
= 0.000 < 0.05), and enterprise development services (b-value = 0.738, p = 0.000 < 0.05). The implication is that
Microfinance financial services and enterprise development services predict improvement standard of living. The
model for the study could therefore be stated as
Standard of Living = 2.733 + 1.061 (financial services) + 0.738 (enterprise development services) +
4.6 Summary of Results
From the results the health component of poverty reduction correlated positively with financial services (r =
0.514, p-value < 0.05), social services (r = 0.181, p-value < 0.05) and also with enterprise services (r = 0.164,
p-value < 0.05) (see Table 8). The component registered a mean of 3.56 and a standard deviation of 0.3512.
There was a positive relationship between Microfinance institutions services and improvements in people‟s
health. Microfinance institutions‟ services predict 26.4% of the health improvement of respondents. From the
regression model, a unit increase in access to cooperative credit financial services improves health by a factor of
0.628. In addition, a unit increase in social services of cooperative credit institutions improves health by a factor
of 0.412.
Similarly, a unit increase in cooperative credit development will improve the respondent‟s health by 0.410. This
is consistent with some earlier studies, including Ferka (2011), who examined the impact of Microfinance on
women‟s livelihoods in rural communities and found that Microfinance has contributed to a large extend
increased access to credit and savings mobilisation. This contributed to women‟s ability to improve their petty
trading, increase their income, lead to good health and education for their families, acquire assets, and participate
in household decision-making. In addition, Hamad and Fernald (2015) examined cooperative credit participation
and women‟s health, establishing a positive correlation between the length of collaborative credit participation
and psychological health measures for women but not physical health. Other studies, such as Littlefield,

ijef.ccsenet.org International Journal of Economics and Finance Vol. 13, No.8; 2021
84
Murduch, and Hashemi (2003), Brana (2008), and Vob and Muller (2009), supports this finding.
The result indicated a positive correlation coefficient between Microfinance institutions‟ services and the
educational component of poverty reduction with an R-square value of 0.0847 and an adjusted R-Square value of
0.0618. The indication is that the Microfinance institutions explain an 8.5% variation of the educational
component of poverty reduction. From the regression model, an improvement in education relates positively and
significantly with financial services (b-value = 1.165, p = 0.000 < 0.05), and enterprise development services
(b-value = 1.139, p = 0.000 < 0.05). In his study, Viwanath (2018) described a study undertaken to gauge the
impact of cooperative credit availability on education expenditures for children of clients of a South Indian
Microfinance institution. The study revealed that cooperative credit impacts the demand for Education as
mediated by wealth effects and status effects. This implies that microloans increase spending on Education as the
wealth and social status of the family improves.
A positive relationship was also established between Microfinance institutions‟ services and standard of living.
Microfinance institutions services explain a 20.9% variation in the standard of living. Standard of living thus
relates positively and significantly with financial services (b-value = 1.061, p = 0.000 < 0.05), and enterprise
development services (b-value = 0.738, p = 0.000 < 0.05). The implication is that Microfinance financial services
and enterprise development services predict improvement standards of living.
Dzisi and Obeng (2013) examined the impact of Microfinance on the socio-economic lives of women
entrepreneurs in Ghana. The results showed an improvement in women‟s businesses and their socio-economic
status from the time the loans were taken. Rashid, John, Consolatta, and Stephen (2015) mirrored out the effects
of Microfinance on the economic empowerment of Women Entrepreneurs in developing economies and found
that Microfinance institutions services act as a critical fulcrum of women entrepreneurs‟ economic
empowerment.
While women are key economic actors, their inequality is slowing global economic growth. In contrast, their
vulnerability in developing countries feeds a devastating cycle of deprived populations. Countries with higher
levels of gender equality tend to have higher income levels, and data from several regions and countries suggests
that narrowing the gap results in poverty reduction. It is, therefore, essential to support women in accessing
quality and productive jobs and improving their livelihoods to reduce poverty and achieve broader development
goals. The political, social, and economic empowerment of women could, therefore, reduce poverty for all.
5. Conclusions
The study examined the role of microfinance institutions towards poverty reduction among women in the
Techiman Municipality of the Bono East Region of Ghana. It found that microfinance institutions play a critical
role in eradicating poverty among women by providing financial products and services, business advice,
financial management training, mobilisation of funds, skill development training, social services to advance the
welfare of women.
The results indicated a positive relationship between services of microfinance institutions and the measured
dimensions of poverty reduction. A unit increase in social services of cooperative credit institutions improves
health by a factor of 0.412. Similarly, a unit increase in collaborative credit development will improve the
respondent‟s health by 0.410. Microfinance institutions positively correlate to Education, explaining an 8.5%
variation of the educational component of poverty reduction. From the regression model, improvement in
financial services and enterprise development services significantly improve Education. Finally, there was a
positive relationship between microfinance institutions services and standard of living, with collaborative credit
union services explaining a 20.9% variation of the standard of living.
The financial services of microfinance institutions services in the Techiman Municipality are essential for
reducing poverty by improving key indicators such as health, education, and the standard of living. Therefore,
the study concludes that the relationship between microfinance institutions programs (financial services, social
services, and business growth services) and poverty reduction (health, education, and living standards) is
positive.
Therefore, it is essential to promote the services of microfinance institutions to enhance their role in business
advice, collaborative credit unions management, and skill development to support SMEs. Furthermore,
policymakers and governments should establish various programs to raise lending and improve the institutional
environment, to increase the willingness of microfinance institutions to lend to women. Such programs could
involve low interest, guarantees, and unique lines of credit for economic sectors like agriculture businesses and
innovative activities targeting women.

ijef.ccsenet.org International Journal of Economics and Finance Vol. 13, No.8; 2021
85
Women should also mobilise to form associations so that they can access group loans. These associations would
give a voice to these women, create synergy, and serve as a guarantee for individual women to access loans from
banks and other financial institutions.
The Bank of Ghana should enact laws to assist other banks to come out with innovative packages suitable for the
financial needs of women entrepreneurs.
References
Adams, D. A. N. I. E. L. (2015). Determinants of Microcredit Access and F Farmers’ Investment in Small Scale
Peri-Urban Agriculture: A Case Study of Dzorwulu Vegetable Farmers (Doctoral dissertation, University of
Ghana).
Addae-Korankye, A. (2012). Microfinance and poverty reduction in Ghana. The case of central region of Ghana.
Asian Economic and Financial Review, 2(1), 135-141.
Addai, B. (2017). Women empowerment through microfinance: Empirical evidence from Ghana. Journal of
Finance and Accounting, 5(1), 1-11. https://doi.org/10.11648/j.jfa.20170501.11
Adjei, J. K., Arun, T., & Hossain, F. (2009). The Role of Microfinance in Asset Building and Poverty Reduction:
The Case of Sinapi Aba Trust of Ghana. Manchester: Brooks World Poverty Institute.
Amankwaa, S., Asafo-Adjei, S. H. A. R. O. N., Badu, C., Croffie, F. E., & Kumah, M. (2012). Empowerment of
rural women (Doctoral dissertation).
Ansoglenang, G. (2006). Rural women and micro-credit schemes: Cases from the Lawra District of Ghana
(Master‟s thesis, Universitetet i Tromsø).
Asamoah, M., Ansah, F. O., Anchirinah, V., Aneani, F., & Agyapong, D. (2013). Insight into the standard of
living of Ghanaian cocoa farmers. Greener Journal of Agricultural Sciences, 3(5), 363-370.
https://doi.org/10.15580/GJAS.2013.3.031313522
Augsburg, B., & Fouillet, C. (2013). Profit empowerment: The microfinance „institution‟s mission drift. In The
Credibility of Microcredit (pp. 199-226). Brill. https://doi.org/10.1163/9789004252189_010
Bajracharya, A., & Amin, S. (2013). Microcredit and domestic violence in Bangladesh: An exploration of
selection bias influences. Demography, 50(5), 1819-1843. https://doi.org/10.1007/s13524-013-0226-0
Banerjee, A., Karlan, D., & Zinman, J. (2015). Six srandomised evaluations of Microcredit: Introduction and
further steps. American Economic Journal: Applied Economics, 7(1), 1-21.
https://doi.org/10.1257/app.20140287
Bassioni, H. A., Hassan, T. M., & Price, A. D. F. (2008). Evaluation and analysis of criteria and sub‐criteria of a
construction excellence model. Engineering, Construction and Architectural Management.
https://doi.org/10.1108/09699980810842043
Bediako-Kyeremeh, B., Duorinaa, E., & Agyemang, S. (2019). Cloud computing in industrial SMEs:
Identification of barriers to its adoption and benefits of its application in Ghana.
Beegle, K., Christiaensen, L., Dabalen, A., & Gaddis, I. (2016). Poverty in a rising Africa. The World Bank.
https://doi.org/10.1596/978-1-4648-0723-7
Bhuiyan, M. A. H., Ismail, S. M., & Siwar, C. (2013). Natural capital as Inclusive wealth for Malaysia: A review.
Advances in Environmental Biology, 7(11), 3181-3188.
Boateng, G. O., Boateng, A. A., & Bampoe, H. S. (2015). Microfinance and poverty reduction in Ghana:
Evidence from policy beneficiaries. Review of Business & Finance Studies, 6(1), 99-108.
Brana, S. (2008). Microcredit in France: Does gender matter. In 5th Annual Conference-Nice.
Chen, J.I., Foster, A., & Putterman, L. (2019). Identity, trust and altruism: An experiment on preferences and
microfinance lending. European Economic Review, 120, 103304.
https://doi.org/10.1016/j.euroecorev.2019.103304
Creswell, J.W. and Creswell, J., 2003. Research design (pp. 155-179). Thousand Oaks, CA: Sage publications.
Cull, R., & Morduch, J. (2017). Microfinance and economic development.
https://doi.org/10.1596/1813-9450-8252
Denscombe, M. (2014). The good research guide: For small-scale social research projects. McGraw-Hill
Education (UK).

ijef.ccsenet.org International Journal of Economics and Finance Vol. 13, No.8; 2021
86
Dzisi, S., & Obeng, F. (2013). Microfinance and the socio-economic well-being of women entrepreneurs in
Ghana. International Journal of Business and Social Research, 3(11), 45-62.
Ferka, A. (2011). The Impact of Microfinance on the Livelihoods of Women in Rural communities: A case study
of Jaman South District. Ghana, Kwame Nkrumah University Of Science And Technology.
Fortson, C. (2003). Women‟s Rights Vital for Developing World. Yale Daily News.
Friederike, M. (2018). World Bank report: Poverty rates remain high in Africa. Retrieved from
https://www.dw.com/en/world-bank-report-poverty-rates-remain-high-in-africa/a-45926382
Fwamba, R., Matete, J., Nasimiyu, C., & Sungwacha, S. (2015). Impact of microfinance institutions on
economic empowerment of women entrepreneurs in developing countries. International Journal of
Management Science and Business Administration, 1(10), 45-55.
https://doi.org/10.18775/ijmsba.1849-5664-5419.2014.110.1004
Ganle, J. K., Afriyie, K., & Segbefia, A. Y. (2015). Microcredit: Empowerment and disempowerment of rural
women in Ghana. World Development, 66, 335-345. https://doi.org/10.1016/j.worlddev.2014.08.027
Ghana Statistical Services. (2018). Ghana Statistical Services. Retrieved from https://www.statsghana.gov.gh/
Hamad, R., & Fernald, L. C. (2012). Microcredit participation and nutrition outcomes among women in Peru. J
Epidemiol Community Health, 66(6), e1-e1. https://doi.org/10.1136/jech.2010.108399
Hamad, R., & Fernald, L. C. (2015). Microcredit participation and women‟s health: Results from a
cross-sectional study in Peru. International Journal for Equity in Health, 14(1), 1-10.
https://doi.org/10.1186/s12939-015-0194-7
Hulme, D., & Maitrot, M. (2014). Has microfinance lost its moral compass? Economic and Political Weekly, 77-85.
https://doi.org/10.2139/ssrn.2560331
Ishfaq, S., Khan, I., Shah, T. A., & Jamil, R. A. (2015). The Role of Microfinance in Poverty Reduction: Evidence
from South Asia. International Journal of Management, Accounting and Economics, 2(10), 1191-1199.
Jaggar, A. M. (2013). Does poverty wear a woman‟s face? Some moral dimensions of a transnational feminist
research project. Hypatia, 28(2), 240-256. https://doi.org/10.1111/hypa.12022
Kimberlin, C. L., & Winterstein, A. G. (2008). Validity and reliability of measurement instruments used in
research. American Journal of Health-System Pharmacy, 65(23), 2276-2284.
https://doi.org/10.2146/ajhp070364
Kratzer, J., & Kato, M. P. (2013). Empowering women through microfinance: Evidence from Tanzania. ACRN
Journal of Entrepreneurship Perspectives, 2(1), 31-59.
Krejcie, R. V., & Morgan, D. W. (1970). Determining sample size for research activities. Educational and
Psychological Measurement, 30(3), 607-610. https://doi.org/10.1177/001316447003000308
Ledgerwood, J., Earne, J., & Nelson, C. (2013). The new microfinance handbook: A financial market system
perspective. World Bank Publications. https://doi.org/10.1596/978-0-8213-8927-0
Littlefield, E., Morduch, J., & Hashemi, S. (2003). Is microfinance an effective strategy to reach the millennium
development goals? Focus Note, 24(2003), 1-11.
Macours, K., & Vakis, R. (2014). Changing households‟ investment behaviour through social interactions with
local leaders: Evidence from a randomised transfer programme. The Economic Journal, 124(576), 607-633.
https://doi.org/10.1111/ecoj.12145
Moseson, H., Hamad, R., & Fernald, L. (2014). Microcredit participation and child health: Results from a
cross-sectional study in Peru. J Epidemiol Community Health, 68(12), 1175-1181.
https://doi.org/10.1136/jech-2014-204071
Mudaliar, A., & Mathur, A. (2015). Women empowerment through microfinance. International Journal of Arts,
Humanities and Management Studies, 1(2), 58-65.
Mutz, D., Hengevoss, D., Hugi, C., & Gross, T. (2017). Waste-to-Energy Options in Municipal Solid Waste
Management A Guide for Decision Makers in Developing and Emerging Countries. Deutsche Gesellschaft
für Internationale Zusammenarbeit (GIZ) GmbH.
Naeem, A., Khan, S., Sana-ur-Rehman, S., Ali, M., & Hassan, F. (2015). The impact of microfinance on women
micro-enterprises. A Case Study Of District Quetta- Pakistan. American International Journal of Social

ijef.ccsenet.org International Journal of Economics and Finance Vol. 13, No.8; 2021
87
Science, 4(4).
Nasir, S., & Farooqi, A. S. (2016). Impact of Microfinance on Women Empowerment with Special Reference to
District Aligarh (India). Middle-East Journal of Scientific Research, 24(3), 491-497.
National Development Planning Commission. (2018). 2.8 million Ghanaians are living in extreme poverty –
Report. Retrieved from https://www.ndpc.gov.gh/news/1886/
Norwood, C. (2011). Women, Microcredit, and family planning practices: A case study from rural Ghana. Journal
of Asian and African Studies, 46(2), 169-183. https://doi.org/10.1177/0021909610388747
Oduro, A., Arhin, A., Domfe, G., Alidu, S., Agyeman, F., Edem Asimadu, D., Walker, J., Gibson, L., Mariotti, C.
& Hall, S. (2018). Building a More Equal Ghana: A 5-point action plan to close the gap between the rich and
the rest. https://doi.org/10.21201/2018.2982
Ofori-Kuragu, J. K., Baiden, B. K., & Badu, E. (2016). Performance measurement tools for Ghanaian contractors.
International Journal of Construction Management, 16(1), 13-26.
https://doi.org/10.1080/15623599.2015.1115245
Okibo, B. W., & Makanga, N. (2014). Effects of microfinance institutions on poverty reduction in Kenya.
International Journal of current research and Academic Review, 2(2), 76-95.
Olateju, A. O. (2018). The Impact of Access to Microcredit Programme on Women Empowerment: A Case Study
of Cowries Microfinance Bank in Lagos State, Nigeria. European Journal of Economics, Law and Politics,
5(2), 21-34. https://doi.org/10.19044/elp.v5no2a2
Owusu-Antwi, G., Antwi, J., & Crabbe, M. (2014). The Performance of Rural Bank‟s in Ghana: The Ages Have
Past Anything Recommended for the Future. International Review of Management and Business Research,
3(2), 1047.
Oxfam, I. (2019). Why the majority of the world’s poor are women. Oxfam International. Retrieved from
https://www.oxfam.org/en/why-majority-worlds-poor-are-women
Pandey, P., & Pandey, M. (2015). Research methodology: Tools and techniques.
Parvin, L., Rahman, M. W., & Jia, J. (2012). Determinates of women micro-entrepreneurship development: An
empirical investigation in rural Bangladesh. International journal of Economics and Finance, 4(5), 254-260.
https://doi.org/10.5539/ijef.v4n5p254
Saunders, M., Lewis, P., & Thornhill, A. (2009). Research methods for business students. Pearson education.
Shepherd, A., & Diwakar, V. (2019). Pathways to sustained poverty reduction. Technical Report, 7.
Shimamura, Y., & Lastarria-Cornhiel, S. (2010). Credit program participation and child schooling in rural
Malawi. World Development, 38(4), 567-580. https://doi.org/10.1016/j.worlddev.2009.11.005
Tarozzi, A., Desai, J., & Johnson, K. (2015). The impacts of Microcredit: Evidence from Ethiopia. American
Economic Journal: Applied Economics, 7(1), 54-89. https://doi.org/10.1257/app.20130475
Umemezia, E., & Osifo, S. J. (2018). Microfinance and female entrepreneurship in Nigeria. DBA Africa
Management Review, 8(1), 34-43.
Van Dalen, D. B. (1980). Understanding educational research: An introduction.
https://doi.org/10.1007/978-3-662-08402-1_1
Viswanath, P. V. (2018). Microcredit and survival microenterprises: The role of market structure. International
Journal of Financial Studies, 6(1), 1. https://doi.org/10.3390/ijfs6010001
Vob, R., & Muller, C. (2009). How are the conditions for high-tech start-ups in Germany? International Journal
of Entrepreneurship and Small Business, 7(3), 284-311. https://doi.org/10.1504/IJESB.2009.023021
Copyrights
Copyright for this article is retained by the author(s), with first publication rights granted to the journal.
This is an open-access article distributed under the terms and conditions of the Creative Commons Attribution
license (http://creativecommons.org/licenses/by/4.0/).