gen z and digital distractions in the classroom: student
TRANSCRIPT

University of Nebraska - Lincoln University of Nebraska - Lincoln
DigitalCommons@University of Nebraska - Lincoln DigitalCommons@University of Nebraska - Lincoln
Faculty Publications, College of Journalism & Mass Communications
Journalism and Mass Communications, College of
Spring 4-15-2020
Gen Z and Digital Distractions in the Classroom: Student Gen Z and Digital Distractions in the Classroom: Student
Classroom Use of Digital Devices for Non-Class Related Purposes Classroom Use of Digital Devices for Non-Class Related Purposes
Bernard R. McCoy University of Nebraska-Lincoln, [email protected]
Follow this and additional works at: https://digitalcommons.unl.edu/journalismfacpub
Part of the Broadcast and Video Studies Commons, Communication Technology and New Media
Commons, Journalism Studies Commons, Mass Communication Commons, Public Relations and
Advertising Commons, and the Social Influence and Political Communication Commons
McCoy, Bernard R., "Gen Z and Digital Distractions in the Classroom: Student Classroom Use of Digital Devices for Non-Class Related Purposes" (2020). Faculty Publications, College of Journalism & Mass Communications. 116. https://digitalcommons.unl.edu/journalismfacpub/116
This Article is brought to you for free and open access by the Journalism and Mass Communications, College of at DigitalCommons@University of Nebraska - Lincoln. It has been accepted for inclusion in Faculty Publications, College of Journalism & Mass Communications by an authorized administrator of DigitalCommons@University of Nebraska - Lincoln.

P a g e | 1
Gen Z and Digital Distractions in the Classroom: Student Classroom Use of Digital Devices for Non-Class Related Purposes
(BEA Paper Submission) The author would like to acknowledge the instructors across the United States and Alberta, Canada who encouraged their students to participate in this survey. Thanks to Dr. William E. Rogge, in the Department of Mathematics at the University of Nebraska-Lincoln, who helped with weighted analysis on select survey responses in this study.
Abstract
A 2019 survey of college students examined classroom-learning distractions caused by
their use of digital devices for non-class purposes. The purpose of the survey, part of an on-going
study, was to learn more about students’ behaviors and perceptions regarding their classroom
uses of digital devices for non-class purposes. The survey included 986 respondents in 37 U.S.
states and 47 respondents in Alberta, Canada. A significant feature of the study was its
measurement of frequency and duration of students’ classroom digital distractions as well as
respondents’ motivations for engaging in the distracting behavior. Respondents averaged 19.4%
of class time using a digital device for non-class purposes. The average respondent used a digital
device 9.06 times during a typical school day in the 2019 survey for non-class purposes. On a
weighted average, survey respondents indicated they would turn-off all non-class digital
distractions if their instructor gave them 7.8% extra credit on their final class grade.
Introduction
Change is in the air as Generation Z students step onto center stage in my latest survey of digital
distractions in the classroom. Two previous digital distractions surveys (McCoy 2013 & 2016)
focused on Millennial Generation college student’s classroom use of digital devices such as
smart phones, laptops, and tablets for non-class purposes. They used their devices an average of
P a g e | 2
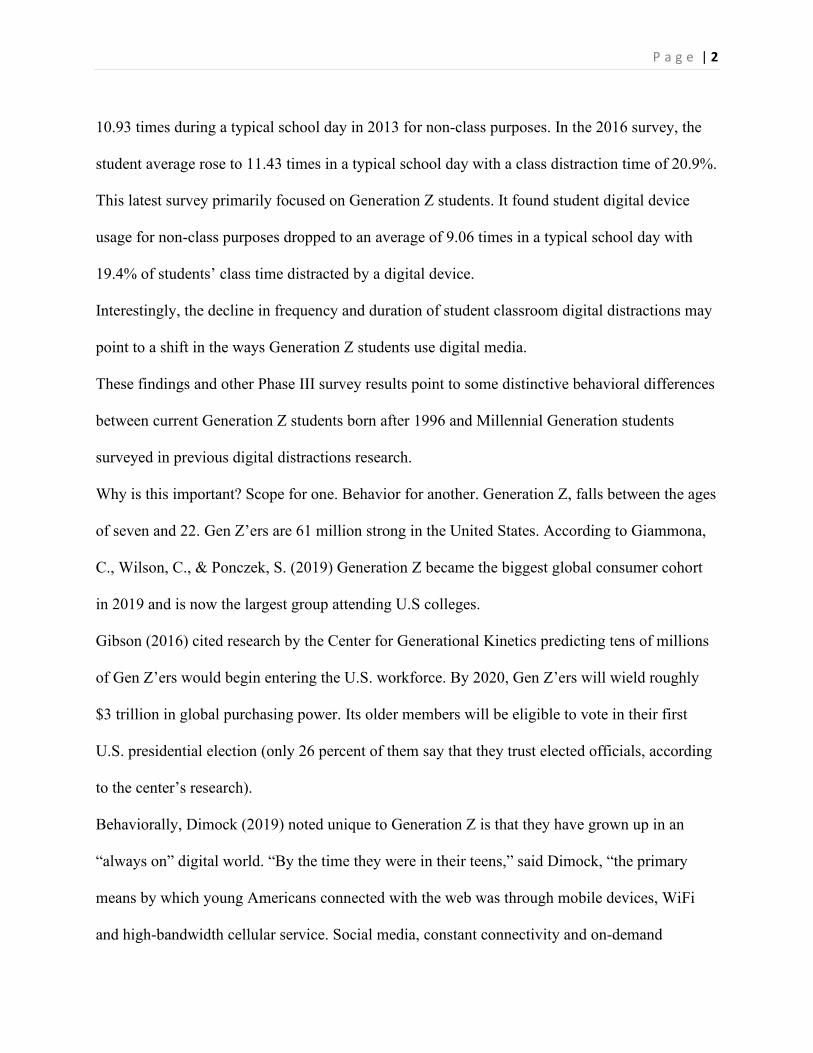
10.93 times during a typical school day in 2013 for non-class purposes. In the 2016 survey, the
student average rose to 11.43 times in a typical school day with a class distraction time of 20.9%.
This latest survey primarily focused on Generation Z students. It found student digital device
usage for non-class purposes dropped to an average of 9.06 times in a typical school day with
19.4% of students’ class time distracted by a digital device.
Interestingly, the decline in frequency and duration of student classroom digital distractions may
point to a shift in the ways Generation Z students use digital media.
These findings and other Phase III survey results point to some distinctive behavioral differences
between current Generation Z students born after 1996 and Millennial Generation students
surveyed in previous digital distractions research.
Why is this important? Scope for one. Behavior for another. Generation Z, falls between the ages
of seven and 22. Gen Z’ers are 61 million strong in the United States. According to Giammona,
C., Wilson, C., & Ponczek, S. (2019) Generation Z became the biggest global consumer cohort
in 2019 and is now the largest group attending U.S colleges.
Gibson (2016) cited research by the Center for Generational Kinetics predicting tens of millions
of Gen Z’ers would begin entering the U.S. workforce. By 2020, Gen Z’ers will wield roughly
$3 trillion in global purchasing power. Its older members will be eligible to vote in their first
U.S. presidential election (only 26 percent of them say that they trust elected officials, according
to the center’s research).
Behaviorally, Dimock (2019) noted unique to Generation Z is that they have grown up in an
“always on” digital world. “By the time they were in their teens,” said Dimock, “the primary
means by which young Americans connected with the web was through mobile devices, WiFi
and high-bandwidth cellular service. Social media, constant connectivity and on-demand

P a g e | 3
entertainment and communication are innovations Millennials adapted to as they came of age.
For the Generation Z, these are largely assumed,” Dimock wrote.
The GlobalWebIndex audience report (2019) found Gen Z spent an average of 2 hours and 52
minutes a day on social networks and messaging services. Pedotto and Chen (2017) found
smartphones dominated digital media time for 18 to 24-year-olds, who spent 2/3rds of their,
more than 3 hours a day, on smartphone apps alone. With multi-networking firmly the norm,
they spent their time with a range of different platforms and often multi-tasked while using them
for activities such as texting while watching video.
The “State of Gen Z: 2018” survey found 95% of Gen Z ages 13 to 22 currently had a
smartphone. Almost 2/3rds of Gen Z (61%) used their smartphone 5 or more hours per day and
26% used it 10 or more hours each day. One difference is when Gen Z’ers used smartphones.
The “State of Gen Z: 2018” survey noted 65% of Gen Z said they use smartphones after
midnight a few times a week or more. By comparison, only 39% of Millennials said they were
on their phones after midnight a few times a week or more.
Seventy-seven percent of Gen Z still use Facebook every month, but the GlobalWebIndex survey
found YouTube is bigger and almost universal, with 9 out of 10 Gen Z’ers visiting YouTube at
least once a month, “reiterating the importance of video and entertainment to this young
audience.”
When it comes to learning, a “Beyond Millennials” survey (2018) found Gen Z'ers are more
likely than Millennials to prefer YouTube (59 to 55%), in-person group activities (57 to 47%) or
learning apps (47 to 41%). Millennial students' top learning preference was printed books (60 to
47%). The survey found many Gen Z’ers, so-called “Digital Natives,” valued printed materials
and teacher interactions more than Millennials as part of their college experience.
P a g e | 4
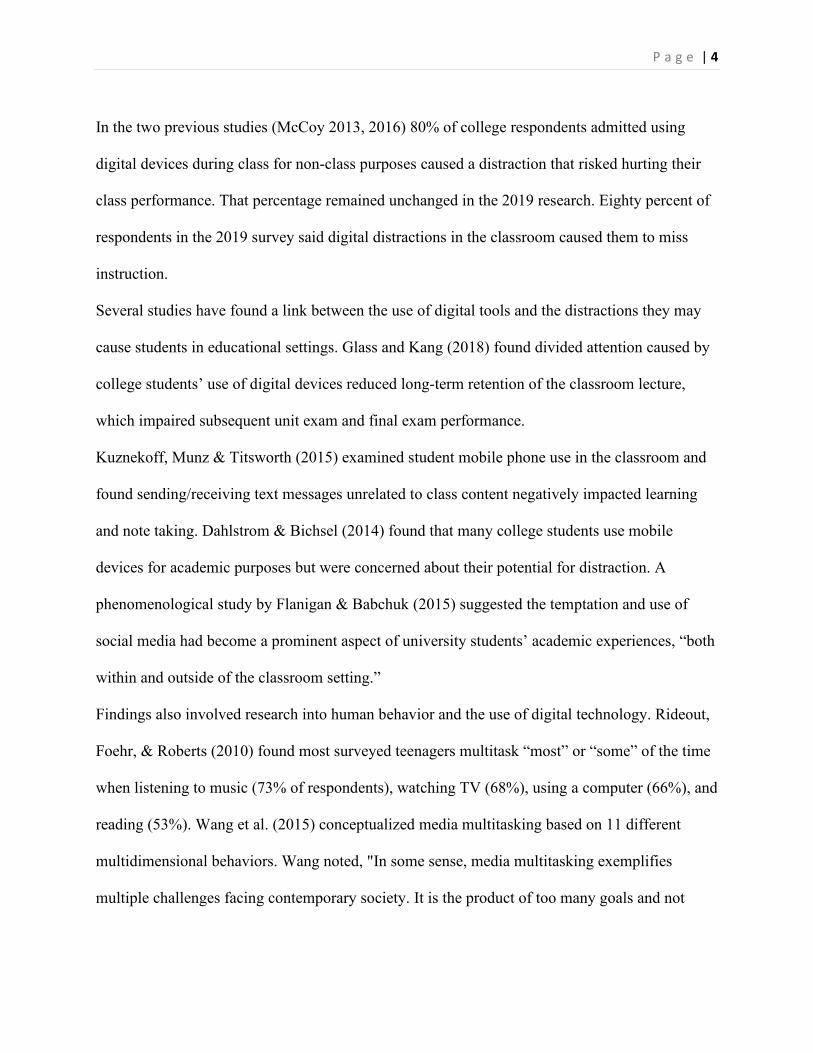
In the two previous studies (McCoy 2013, 2016) 80% of college respondents admitted using
digital devices during class for non-class purposes caused a distraction that risked hurting their
class performance. That percentage remained unchanged in the 2019 research. Eighty percent of
respondents in the 2019 survey said digital distractions in the classroom caused them to miss
instruction.
Several studies have found a link between the use of digital tools and the distractions they may
cause students in educational settings. Glass and Kang (2018) found divided attention caused by
college students’ use of digital devices reduced long-term retention of the classroom lecture,
which impaired subsequent unit exam and final exam performance.
Kuznekoff, Munz & Titsworth (2015) examined student mobile phone use in the classroom and
found sending/receiving text messages unrelated to class content negatively impacted learning
and note taking. Dahlstrom & Bichsel (2014) found that many college students use mobile
devices for academic purposes but were concerned about their potential for distraction. A
phenomenological study by Flanigan & Babchuk (2015) suggested the temptation and use of
social media had become a prominent aspect of university students’ academic experiences, “both
within and outside of the classroom setting.”
Findings also involved research into human behavior and the use of digital technology. Rideout,
Foehr, & Roberts (2010) found most surveyed teenagers multitask “most” or “some” of the time
when listening to music (73% of respondents), watching TV (68%), using a computer (66%), and
reading (53%). Wang et al. (2015) conceptualized media multitasking based on 11 different
multidimensional behaviors. Wang noted, "In some sense, media multitasking exemplifies
multiple challenges facing contemporary society. It is the product of too many goals and not
P a g e | 5
enough time, too many options and not enough discretion, and a building pressure to be
increasingly productive."
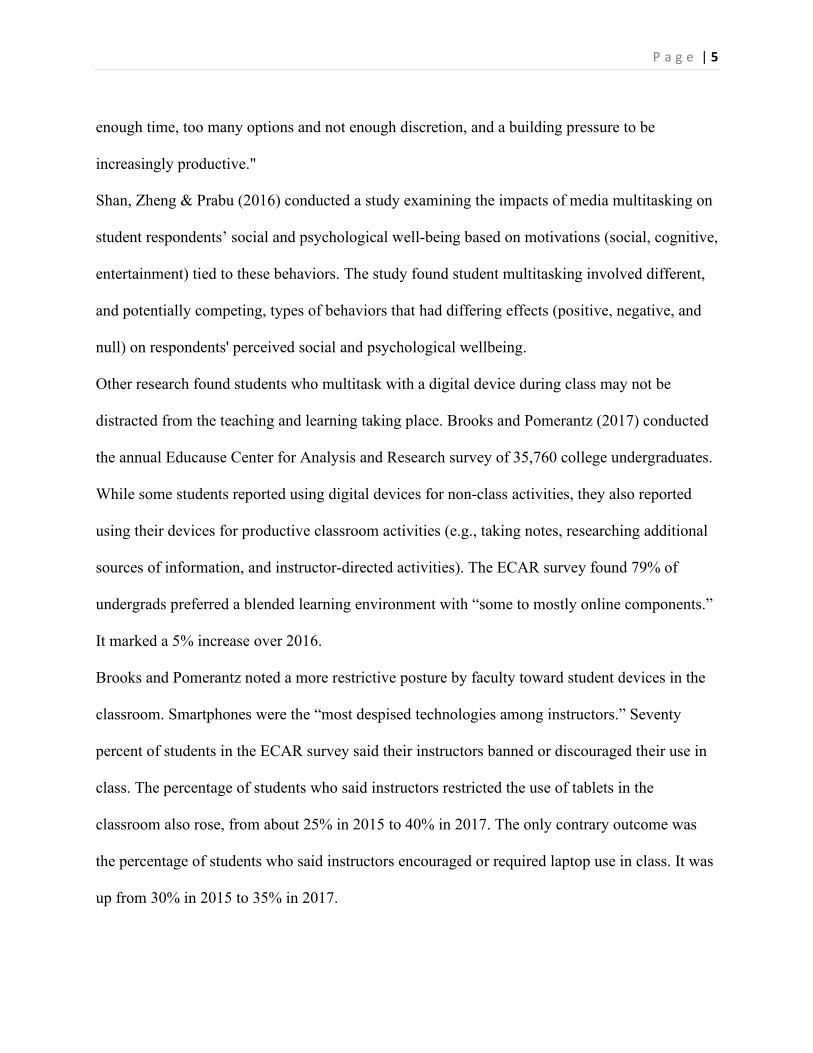
Shan, Zheng & Prabu (2016) conducted a study examining the impacts of media multitasking on
student respondents’ social and psychological well-being based on motivations (social, cognitive,
entertainment) tied to these behaviors. The study found student multitasking involved different,
and potentially competing, types of behaviors that had differing effects (positive, negative, and
null) on respondents' perceived social and psychological wellbeing.
Other research found students who multitask with a digital device during class may not be
distracted from the teaching and learning taking place. Brooks and Pomerantz (2017) conducted
the annual Educause Center for Analysis and Research survey of 35,760 college undergraduates.
While some students reported using digital devices for non-class activities, they also reported
using their devices for productive classroom activities (e.g., taking notes, researching additional
sources of information, and instructor-directed activities). The ECAR survey found 79% of
undergrads preferred a blended learning environment with “some to mostly online components.”
It marked a 5% increase over 2016.
Brooks and Pomerantz noted a more restrictive posture by faculty toward student devices in the
classroom. Smartphones were the “most despised technologies among instructors.” Seventy
percent of students in the ECAR survey said their instructors banned or discouraged their use in
class. The percentage of students who said instructors restricted the use of tablets in the
classroom also rose, from about 25% in 2015 to 40% in 2017. The only contrary outcome was
the percentage of students who said instructors encouraged or required laptop use in class. It was
up from 30% in 2015 to 35% in 2017.

P a g e | 6
Sullivan, Johnson, Owens & Conway (2014) identified digital device uses for non-class purposes
as a “low level disruptive behavior” and argue that teachers could benefit from understanding
how the classroom ecology influences student engagement, rather than focusing on ‘fixing’
unproductive behavior. Gebre, Saroyan & Bracewell (2014) found students' cognitive and social
engagement in technology-rich classrooms is significantly related to their professors' views of
effective teaching. They stressed technology implementation in university teaching needed to
incorporate faculty development programs related to changing professors' conceptions of
effective teaching.
Building on prior research, the purpose of this study examines college students’ evolving uses of
digital devices in the classroom for non-classroom related purposes. What impact does such
behavior have on student learning? What are the perceived advantages and disadvantages of this
behavior, and what policies might effectively limit classroom distractions caused by digital
devices?
Methods
In late 2018 and early 2019, we surveyed 982 students at U.S. colleges and universities in
37 states and 50 students in Alberta, Canada who answered 20 survey questions regarding their
classroom use of digital devices for non-class purposes. U.S. respondents included freshmen,
sophomores, juniors, seniors, and graduate students from Arkansas, Arizona, California,
Colorado, Connecticut, Florida, Georgia, Idaho, Indiana, Iowa, Illinois, Kansas, Louisiana,
Maryland, Massachusetts, Michigan, Minnesota, Mississippi, Missouri, Nebraska, Nevada, New
York, New Jersey, New Mexico, North Carolina, Ohio, Oklahoma, Pennsylvania, Rhode Island,
South Carolina, South Dakota, Tennessee, Texas, Virginia, Washington, West Virginia and

P a g e | 7
Wisconsin. Most respondents majored in mass communications, marketing, business, law,
education, and agriculture.
Instructor observations of college students in classroom settings, a baseline survey of
students, conversations with instructors at U.S. colleges, past research, and literature reviews
suggest student classroom uses of digital devices for non-class purposes causes learning
distractions. This sparked my on-going research, which focuses on the study of student
classroom uses of digital devices for non-class purposes, and the effects such behavior may have
on classroom learning.
The survey addressed the frequency, duration and intensity of non-class related digital
distractions in the classroom. It looked at students’ perceived advantages and disadvantages of
using digital devices for non-class purposes, responses to classroom digital distractions, potential
incentives and policies that may address such distractions in the classroom.
The survey’s 20 questions presented respondents with a list of answers from which to
choose. Some questions originated from a 2012 pilot survey of undergraduate mass
communications majors (N=95) at a Midwestern university that identified frequent types of non-
class related digital device behavior and use in classrooms. Other questions evolved and formed
after examining student responses from previous digital distractions surveys in 2013 (N=777)
and 2015 (N=675). Those responses were collected from U.S. colleges and universities.
Institutional Review Board approval was obtained before the survey’s administration. It
included a cover page statement informing students that the survey’s completion and submission
constituted their consent to participate in the study.
Classroom instructors volunteered to recruit student respondents for the survey using
email and personal contacts. All respondents were given the option to complete the survey. The

P a g e | 8
survey did not ask respondents to state their name or institution, but respondent surveys were geo
tagged (state and/or educational institution) by using Internet Protocol (IP) routing addresses
associated with survey responses. Using SurveyMonkey.com as a data collection tool, survey
results were statistically reported and compared with demographic data for gender, age, grade
point average, and year in school. The analysis also examined the frequency and duration of
responses. In the results below, some percentages have been rounded to the nearest 1/10 of a
percent.
Results
The survey’s quantitative results appear first, followed by a comparison analysis on select
responses.
Quantitative Results
Table 1 shows results for the 20-question survey. The last four survey questions were
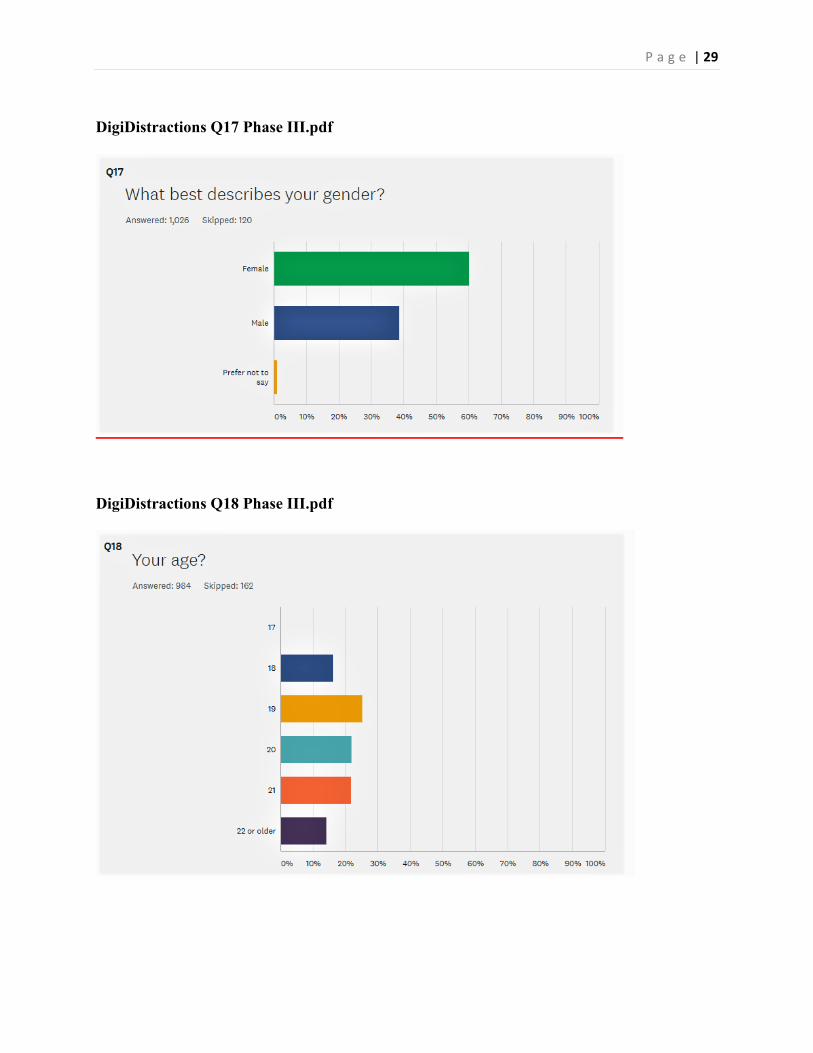
demographic in nature. Of the respondents, females accounted for 60%, males, 39%, and 1% of
the respondents answered “prefer not to say” regarding gender.
Age breakouts among the respondents included .2% who said they were 17-years-old,
16.5% said they were 18-years-old, 25.5% said they were 19-years-old, 22% were 20-year-olds,
22% were 21-year-olds, and 14% of the respondents were 22-years-old or older.
College freshmen accounted for 31.24% of the students, followed by sophomores at
21.81%, juniors at 24.46%, seniors at 21.51%, and graduate students at .98%.
When we asked students their approximate GPA, .69% said it was between 1.0 and 1.9,
16.6% said it fell between 2.0 and 2.9, 73.87% said it fell between 3.0 and 3.9, 6.58% said their
GPA was 4.0 or higher, and 2.26% said they didn’t know their approximate GPA.

P a g e | 9
DigiDistractions Q17 Phase III.pdf & DigiDistractions Q18 Phase III.pdf &
DigiDistractions Q19 Phase III.pdf & DigiDistractions Q20 Phase III.pdf
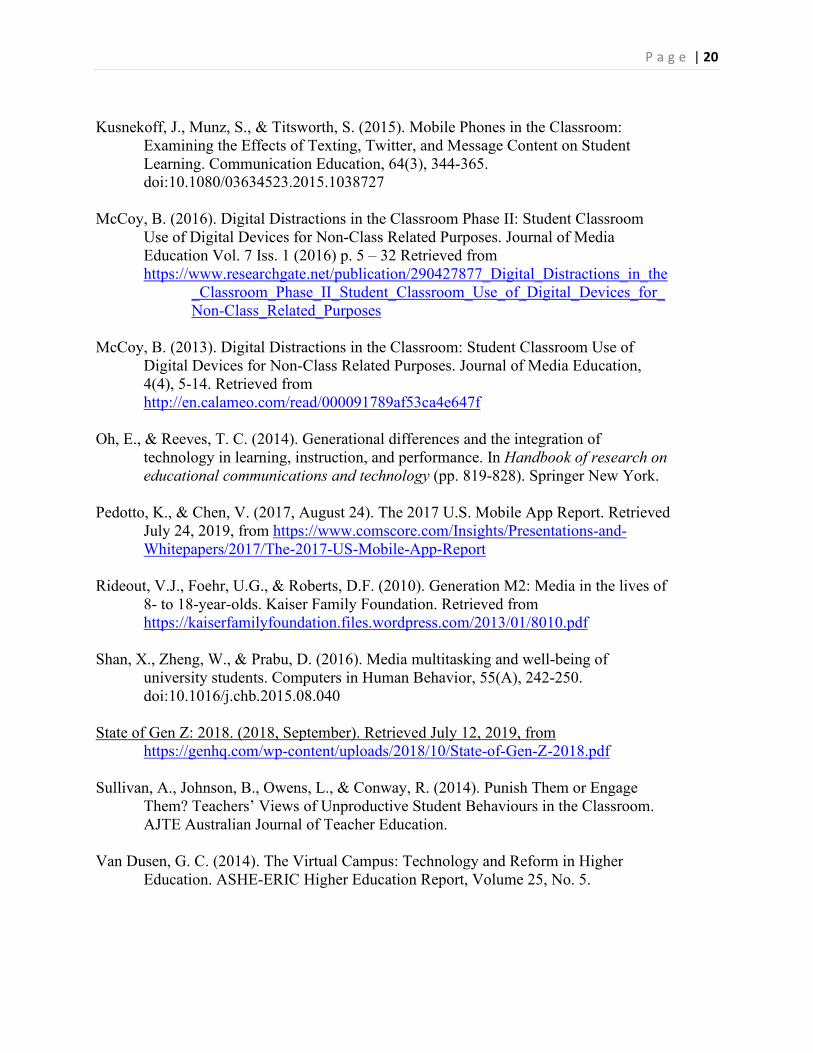
Students were asked in Question 1 how often they used a digital device during classes for
non-classroom related activities on a typical school day. Of the responses, 42.5 chose “1 to 3
times” as a response, followed by 28.2% who chose “4 to 10 times.” The remaining student
responses included 14.9% who chose “11 to 30 times,” 9.1% who chose “More than 30 times,”
and 5.3% who chose “Never.”
When overall frequency response rates were averaged for Question 1 ((1+3)/2=2,
(4+10)/2=7, (11-30)/2=20.5, 35) and added for each school year, combined undergraduate and
graduate students used a digital device an average of 9.06 times each class day for non-class
activities in our 2018/19 survey. Results from the 2013 and 2015 surveys show students using
digital devices more frequently (10.93 times each class day in 2013 versus 11.43 times each class
day in 2015) in the classroom for non-class related activities.
DigiDistractions Q1 Phase III.pdf
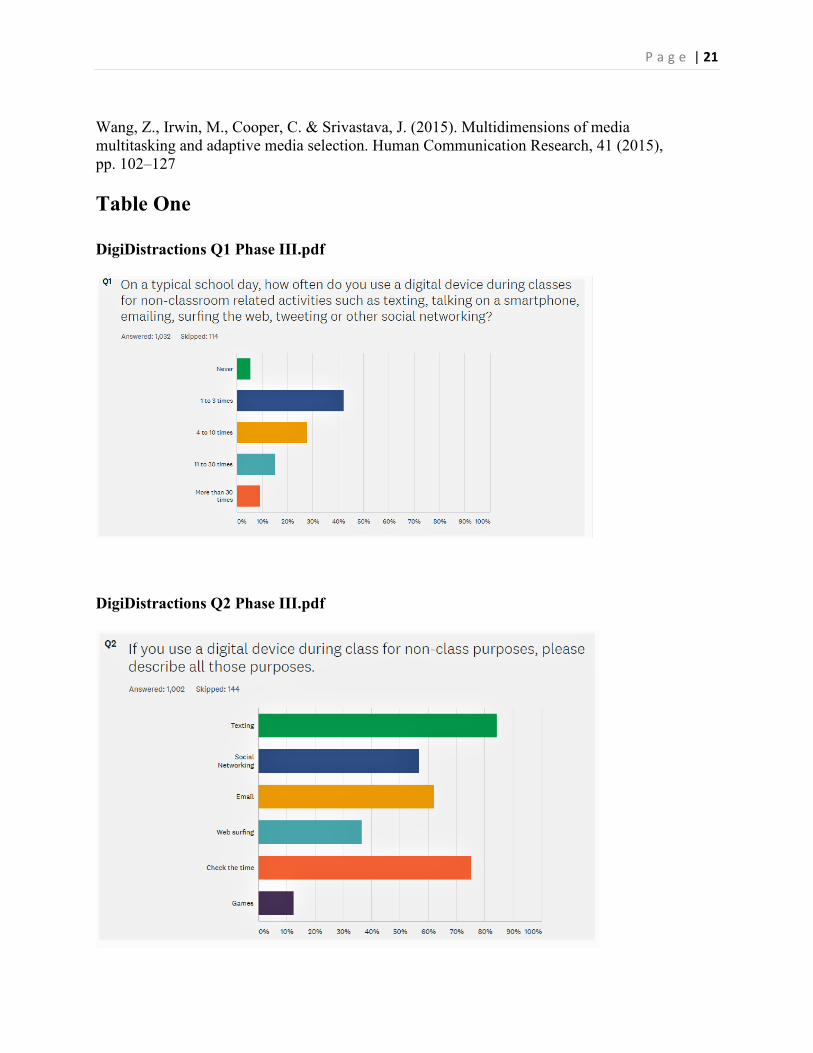
When Question 2 asked students to describe their various uses of digital devices during
class for non-class purposes, “Texting” was the top response at 84.6%. It was followed by
“Checking the time,” at 75.5%, “E-mail” at 62.3%, “Social Networking” at 56.9%, “Web
surfing” at 36.3%, and “Games” at 12.5%.
DigiDistractions Q2 Phase III.pdf
Question 3 asked students what percentage of the class was spent using a digital device
for non-class purposes. The top response was “1-10%” at 50.9%. It was followed by “11-20%” at
16.5%, “21-30%” at 9.1%, “31-40%” at 4.3%, “41-50%” at 3.3%, “51-60%” at 2.4%, “61-70%”
at 2.2%, “71-80%” at 2.8%, “81-90%” at 2.5%, “91-100%” at 1.9%.
P a g e | 10
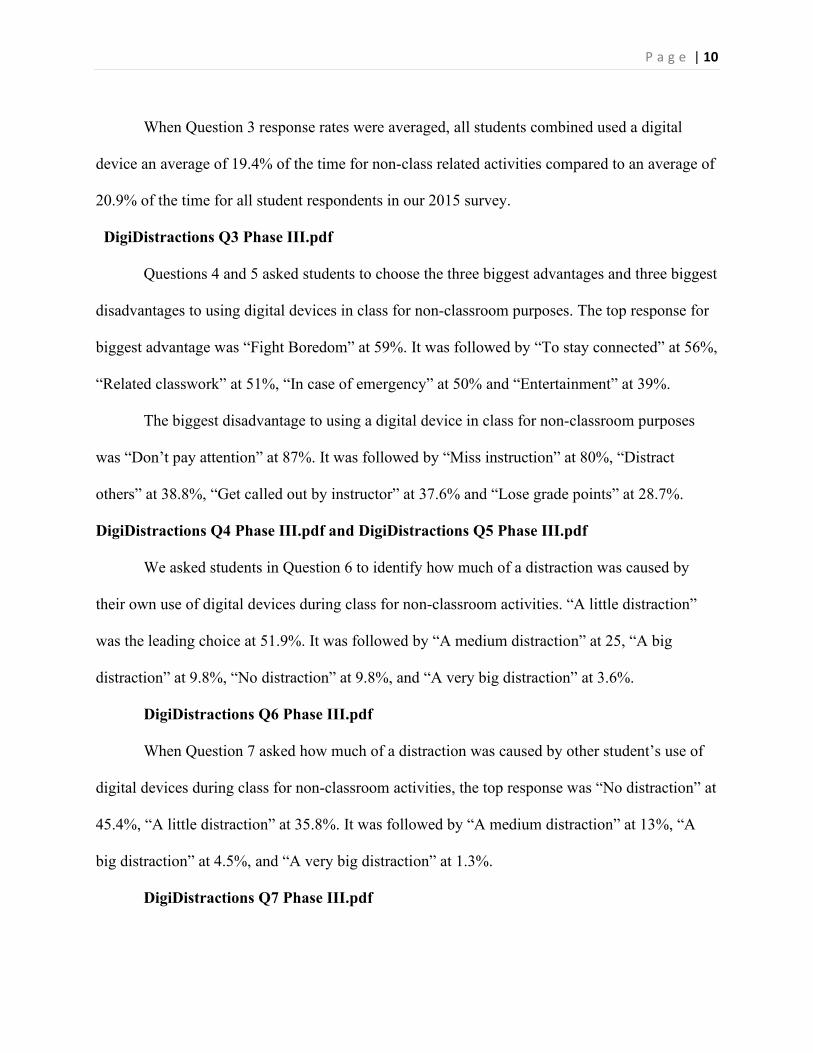
When Question 3 response rates were averaged, all students combined used a digital
device an average of 19.4% of the time for non-class related activities compared to an average of
20.9% of the time for all student respondents in our 2015 survey.
DigiDistractions Q3 Phase III.pdf
Questions 4 and 5 asked students to choose the three biggest advantages and three biggest
disadvantages to using digital devices in class for non-classroom purposes. The top response for
biggest advantage was “Fight Boredom” at 59%. It was followed by “To stay connected” at 56%,
“Related classwork” at 51%, “In case of emergency” at 50% and “Entertainment” at 39%.
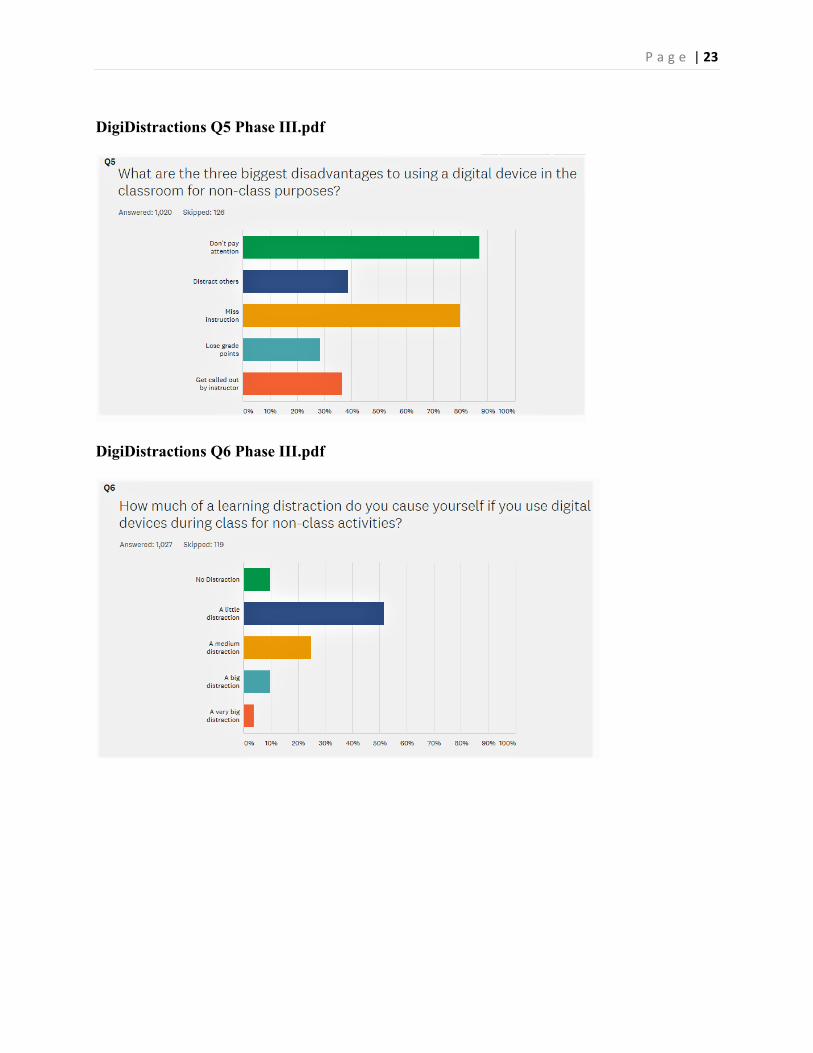
The biggest disadvantage to using a digital device in class for non-classroom purposes
was “Don’t pay attention” at 87%. It was followed by “Miss instruction” at 80%, “Distract
others” at 38.8%, “Get called out by instructor” at 37.6% and “Lose grade points” at 28.7%.
DigiDistractions Q4 Phase III.pdf and DigiDistractions Q5 Phase III.pdf
We asked students in Question 6 to identify how much of a distraction was caused by
their own use of digital devices during class for non-classroom activities. “A little distraction”
was the leading choice at 51.9%. It was followed by “A medium distraction” at 25, “A big
distraction” at 9.8%, “No distraction” at 9.8%, and “A very big distraction” at 3.6%.
DigiDistractions Q6 Phase III.pdf
When Question 7 asked how much of a distraction was caused by other student’s use of
digital devices during class for non-classroom activities, the top response was “No distraction” at
45.4%, “A little distraction” at 35.8%. It was followed by “A medium distraction” at 13%, “A
big distraction” at 4.5%, and “A very big distraction” at 1.3%.
DigiDistractions Q7 Phase III.pdf

P a g e | 11
Question 8 asked respondents to choose the types of distractions caused by the use of
digital devices during class for non-class activities. “Visual activity” was chosen by 71% of the
respondents, followed by “Audio activity” at 40.2%, and “Not a distraction" at 14.7%.
DigiDistractions Q8 Phase III.pdf
Question 9 asked students if digital devices should be banned from classrooms and 93.1%
of the respondents said “No,” and 6.8% said “Yes.”
Question 10 asked students if their instructors have a policy regarding the use of digital
devices in their classrooms. “Yes” was chosen by 74% of the respondents, followed by “No” at
26%.
When asked in Question 11 which statement they agree with “MOST” regarding
classroom uses of digital devices for non-classroom purposes, 35.4% of the student respondents
chose “I can freely use a digital device without it causing learning distractions,” followed by
27.5% who chose “It's my choice to use a digital device whenever I feel like using one, ” 17.1%
who chose “ I don't use digital devices because of the classroom learning distractions they may
cause,” 12.1% believe “my use of digital devices outweigh classroom learning distractions they
may cause,” and 7.8% chose “I can't stop myself from using digital devices even if they may
cause learning distractions.”
Question 12 asked if it would be helpful to have policies limiting non-classroom uses of
digital devices. “Yes” was chosen by 50% of the respondents, followed by “No” at 31.6% and
“Don’t know” at 18.3%.
DigiDistractions Q9 Phase III.pdf & DigiDistractions Q10 Phase III.pdf &
DigiDistractions Q11 Phase III.pdf & DigiDistractions Q12 Phase III.pdf

P a g e | 12
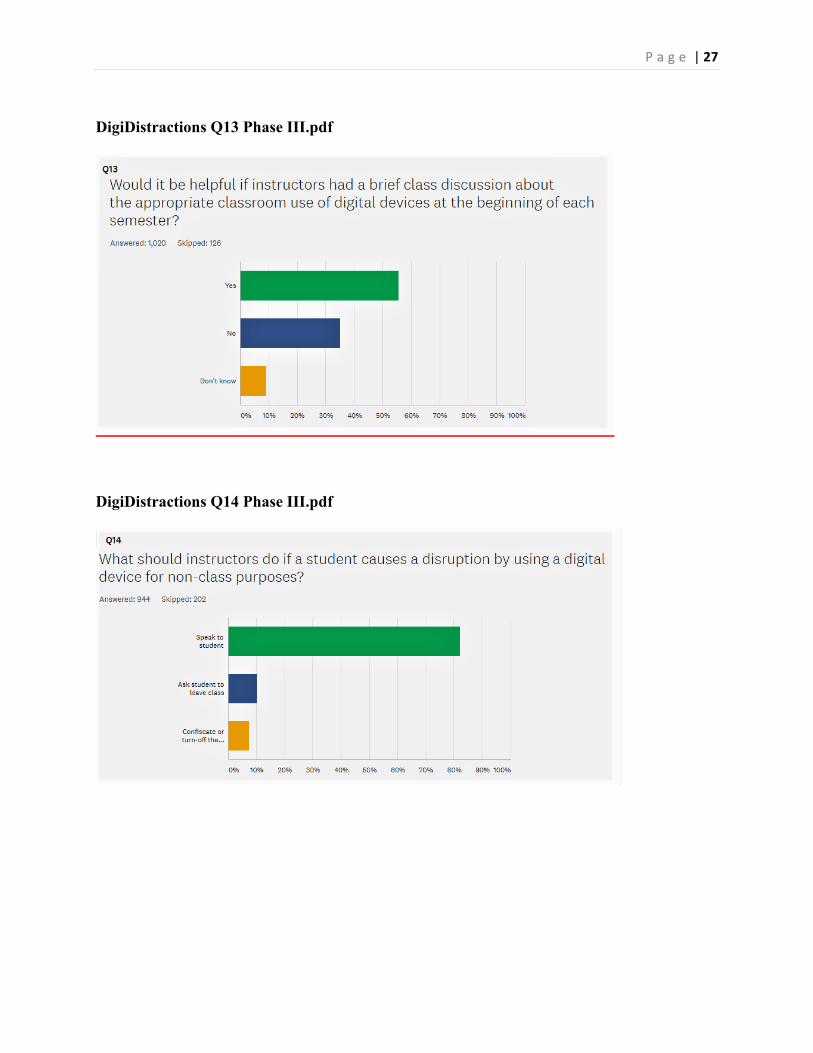
When asked in Question 13 if it would be “helpful if instructors had a brief class
discussion about the appropriate classroom use of digital devices at the beginning of each
semester,” 56% chose “Yes,” 34.8% chose “No,” and 9.2% said they “Don’t know.”
DigiDistractions Q13 Phase III.pdf
Question 14 asked students what an instructor should do if a student causes a disruption
by using a digital device for non-class purposes, 82.5% chose “Speak to student.” Other
responses were “Ask student to leave class” at 10.2%, and “Confiscate or turn-off device” at
7.4%.
DigiDistractions Q14 Phase III.pdf
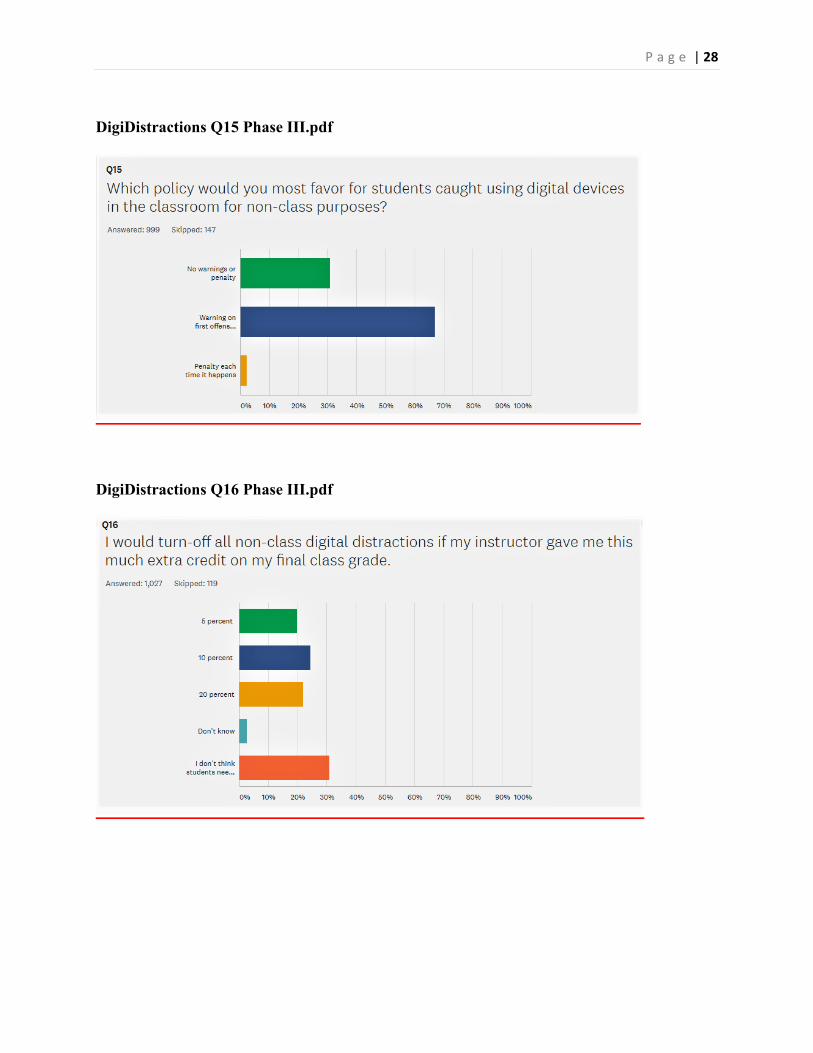
In Question 15, we asked students which policy they would favor most for students
caught using digital devices in the classroom for non-class purposes. “Warning on first offense
followed by penalties” was the leading response at 66.9%. It was followed by “No warnings or
penalty” at 31% and “Penalty each time it happens” at 2.1%.
DigiDistractions Q15 Phase III.pdf
In Question 16, we asked students: “I would turn-off all non-class digital distractions if
my instructor gave me this much extra credit on my final class grade.” The leading response by
31% of respondents was “I don't think students need extra credit for something like this.” It was
followed by 10% extra credit by 24.5% of respondents, 20% extra credit by 21.75% of
respondents, 5% extra credit by 20% of respondents, and “Don’t know” by 2.6% of respondents.
Comparison Analysis
Table 2 shows a comparison analysis of select statistically significant responses.
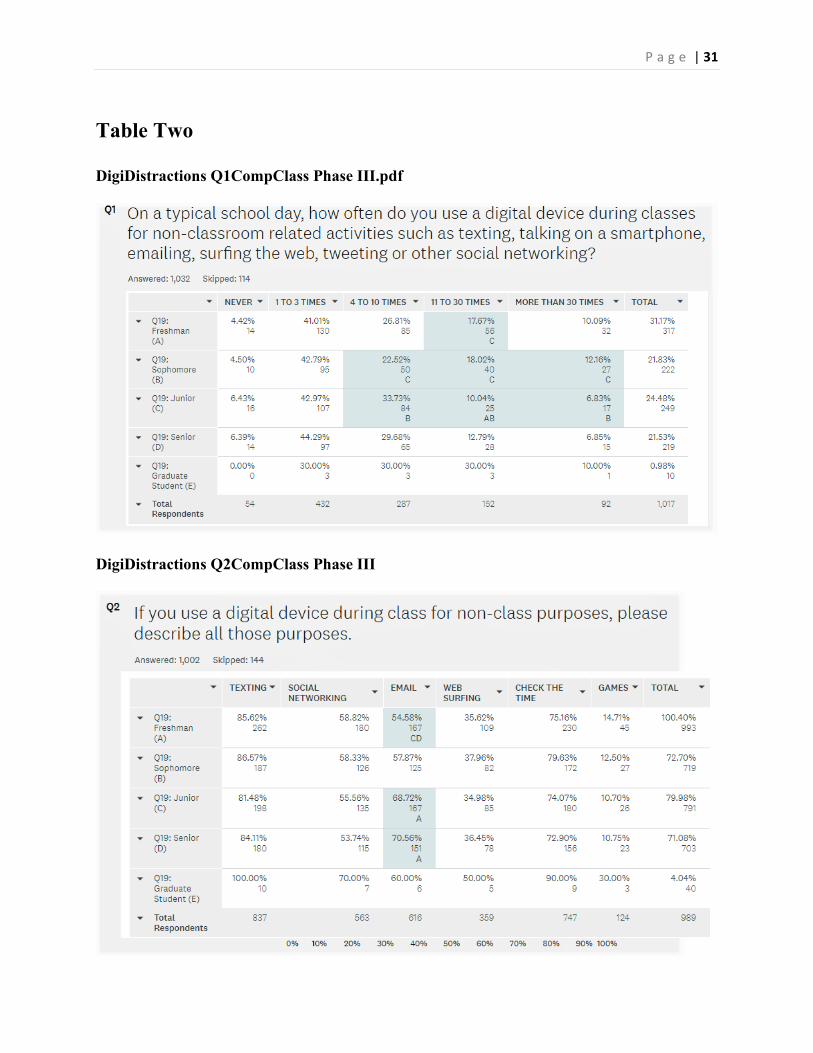
Question 1 found two statistically significant responses involving freshmen, sophomores and
juniors when asked “On a typical school day, how often do you use a digital device during

P a g e | 13
classes for non-classroom related activities such as texting, talking on a smartphone, emailing,
surfing the web, tweeting or other social networking?” On the “4 to 10 times” response juniors
(33.7%) were significantly higher than sophomores (22.5%). On the “11 to 30 times” response
juniors (10%) were significantly lower than sophomores (18%) and freshmen (17.7%). On the
“More than 30” response juniors (6.8%) were significantly lower than sophomores (12.2%).
INSERT DigiDistractions Q1CompClass Phase III.pdf
Question 2 found a statistically significant response involving freshmen, sophomores and
juniors use of email when asked “If you use a digital device during class for non-class purposes,
please describe all those purposes.” Juniors (70.6%), and sophomores (68.7%) were significantly
more likely than freshmen (54.6%) to say they use their digital devices for email during class.
INSERT DigiDistractions Q1CompClass Phase III.pdf
Question 2 comparison analysis also found a statistically significant difference between
females (N=524) and males (N=307) in their non-class related playing of games on their digital
devices during class. (males, 16.3% vs. females, 10.1%).
INSERT DigiDistractions Q2CompFemale Male Phase III.pdf
Question 3 found two statistically significant responses involving freshmen, sophomores
and juniors when asked “If you use a digital device during class for non-class purposes, what
percentage of the class is spent engaging in that activity?” On the “21 to 30%” response juniors
(10.4%) and sophomores (11.8%) were significantly higher than freshmen (5.7%). On the “61 to
70%” response juniors (.4%) were significantly lower than freshmen (3.5%).
INSERT DigiDistractions Q3CompClass Phase III.pdf

P a g e | 14
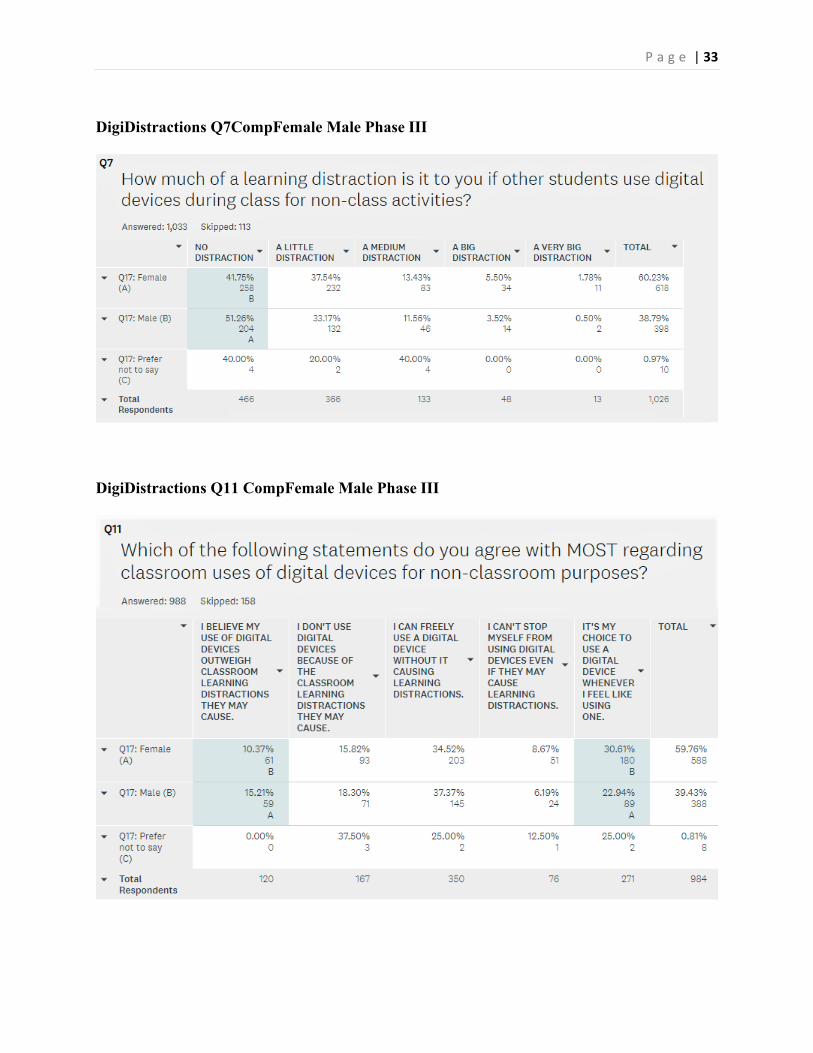
Comparison analysis on Question 7 indicate a statistically significant difference between
females (58.1%) and males (48.8%) in listing some level of distraction caused by another
student’s use of digital devices during class for non-class activities.
INSERT DigiDistractions Q7CompFemale Male Phase III.pdf
Comparison analysis on Question 11 indicates statistically significant responses between
females and males when asked which of these statements they agreed with: “It’s my choice to
use a digital device whenever I feel like using one.” (female, 30.5% vs. male, 23.4%) and ”I
believe my use of digital devices outweigh classroom learning distractions they may cause.”
(male, 15% vs. female, 0.4%).
INSERT DigiDistractions Q11 CompFemale Male Phase III.pdf
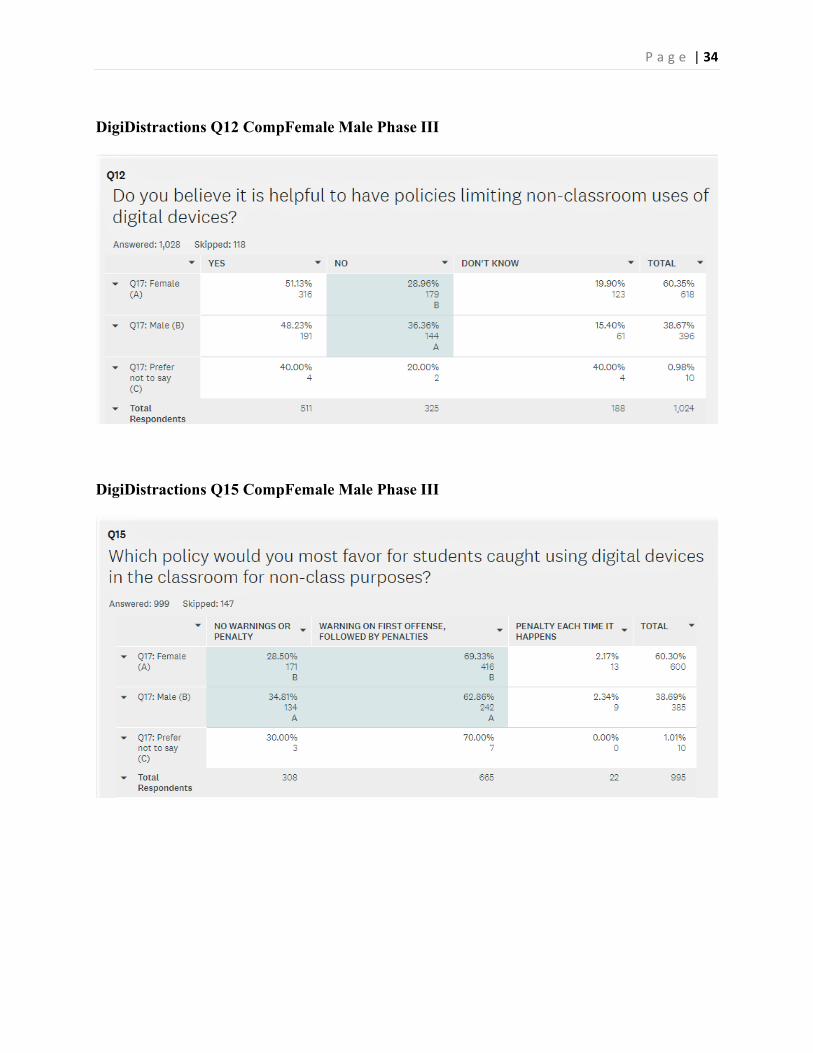
Comparison analysis on Question 12 indicates statistically significant responses between
females and males who answered “No” when asked if they “believe it is helpful to have policies
limiting non-classroom uses of digital devices.” (female, 29% vs. male, 36.1%)
INSERT DigiDistractions Q12 CompFemale Male Phase III.pdf
Comparison analysis on Question 15 indicates statistically significant responses between
females and males when asked “Which policy would you most favor for students caught using
digital devices in the classroom for non-class purposes?” On the response “No warnings or
penalty,” (female, 28.51 vs. male, 34.7%). On the response “Warning on first offense, followed
by penalty,” (female, 69.3% vs. male, 63.1%).
INSERT DigiDistractions Q15 CompFemale Male Phase III.pdf

P a g e | 15
Discussion
The unique contribution of this study was its measurement of the frequency and duration
of digital distractions in classrooms, as well as the competing justifications respondents
identified for engaging in distracting behavior with digital devices that they admit may have
negative learning consequences.
Research indicates the frequency and duration of classroom digital device distractions
decreased 21% among Generation Z college students surveyed in 2019 compared to our 2015
survey of Gen Z and Millennial students. What has not changed from past surveys is that digital
distractions are habitual and still happen frequently despite an admission by a large majority
(87%) of students that this behavior hampers their ability to pay attention in the classroom.
The 2019 survey found the average respondent used a digital device for non-class purposes 9.06
times during a typical school day compared to 11.43 times in the 2015 survey and 10.93 times in
the 2013 survey.
The 2019 survey respondents identified non-class related activities that included texting (84.3%),
emailing (62.1%), and social networking (56.9%). The 2019 survey found the duration of such
digital distractions consumed an average of 19% of respondents’ time in the classroom.
Respondents said three leading advantages for using digital devices for non-class related
behavior was to fight boredom (59%), stay connected (56%), and for related classwork (51%).
Respondents also admitted the disadvantages of such behavior caused them to not pay attention
(87%) and miss instruction (80%) during class.
This study also expanded on the findings of two previous surveys by asking what, if any,
extra credit incentives it would take for students to voluntarily turn-off all non-class digital
distractions. The weighted average response to the question “I would turn-off all non-class

P a g e | 16
digital distractions if my instructor gave me this much extra credit on my final class grade” was
7.8%. To put it another way, that would be slightly less than a whole grade point improvement.
A large majority (82.9%) of respondents agreed with one of the following statements
regarding their classroom uses of digital devices for non-classroom purposes:
• “I can freely use a digital device without it causing learning distractions.” (35.63%)
• “It's my choice to use a digital device whenever I feel like using one.” (27.43%)
• “My use of digital devices outweighs classroom learning distractions they may cause.”
(12.15%)
• “I can't stop myself from using digital devices even if they may cause learning
distractions.” (7.69%)
Such responses may explain why a growing majority (93%) of respondents, compared to
past surveys, oppose classroom bans on digital devices even as they recognize the detrimental
learning distractions they may cause. About half of respondents (49.9%) favor policies limiting
classroom distractions caused by digital devices. A third of the respondents (31.7%) oppose such
policies and 18.4% “didn’t know” how they felt about such policies. More than half of students
surveyed (55.69%) said they believed it would be helpful if instructors had a brief class
discussion about the appropriate classroom use of digital devices at the beginning of each
semester? This suggests many students are receptive to better clarity and conversations about
appropriate and inappropriate classroom uses of digital devices.
Respondents said fighting boredom (59%) in the classroom was a leading reason they
used digital devices for non-class activities compared to 63% in the 2016 survey. This suggests
more students recognize a need for more effective self-control techniques to stay focused on
learning in classroom settings.

P a g e | 17
Results of this survey suggest more instructors are using new ways to engage college
students by blending traditional face‐to‐face teaching methods described by Graham, Henrie &
Gibbons (2014) with online learning activities to reduce boredom and disruptions caused by non-
class uses of digital devices. Adams, Becker et al. (2017) identified blended learning designs as
one of the short-term forces driving technology adoption in higher education in the next 1–2
years. Dziuban et al. (2018) noted it seemed clear blended learning is the harbinger of substantial
change in higher education, K-12 schooling and industrial training because its flexibility "allows
us to maximize many positive education functions."
Findings by Wang et al. (2015) suggested digital device distractions may be minimized
by imposing multitasking behaviors in classrooms that can more strategically allocate students’
cognitive resources. Related research by Davis III, Deil-Amen, Rios-Aguilar, & González
Canché (2015), Oh & Reeves (2014), and Van Dusen (2014) stress the need for colleges and
universities to provide adequate technology, technology support, and instructor training time.
Halverson, et al. (2017) made these points:
• The instructor must adopt new tools with a new mindset and positive attitude. More time and commitment are required from instructors in preparing everything in advance and giving continuous feedback.
• Students need to be motivated to adapt new technology and feel comfortable. They also need good time management skills.
• Classroom technical support is crucial with dedicated support available to implement effectively.
One limitation of this study was the disproportionately larger sample of female
respondents compared to male respondents (60.2% vs. 38.8%). Another was the small sample
(N=10) of graduate student respondents. Future research might use larger samples of graduate

P a g e | 18
students and a more proportionally representative U.S. Census demographic sample of female
and male (50.3% vs 50.7%) respondents to see if they result in different responses.
Research indicates student use of digital devices, primarily smart phones, as well as
digital apps by Generation Z continues to grow. This was the case with Millennials in two earlier
surveys. There are distinct behavioral differences though between these two digitally savvy
generations in their use of technology. A part of it is defined by the predominant applications
they use as well as “why,” “how,” “where,” and “when” Gen Z’ers use them.
As Gen Z’ers play greater roles in America their current classroom learning experiences
will be reflected and help define how they will proceed. This should qualify for future research
into the motives and perceptions that drive Gen Z behavior in today’s classrooms and their
dawning futures as citizens across civic, corporate and political landscapes.
References
Adams Becker, S., Cummins, M., Davis, A., Freeman, A., Hall Giesinger, C., & Ananthanarayanan, V. (2017). NMC horizon report: 2017 higher Education Edition. Austin: The New Media Consortium.
Beyond Millennials: The Next Generation of Learners. (2018, August). Retrieved July
30, 2019, from https://www.pearson.com/content/dam/one-dot-com/one-dot-com/global/Files/news/news-annoucements/2018/The-Next-Generation-of-Learners_final.pdf
Brooks, D. Christopher, and Jeffrey Pomerantz. ECAR Study of Undergraduate Students and Information Technology. (2017) Research report. Louisville, CO: ECAR, October 2017. Retrieved July 24, 2019, from https://library.educause.edu/~/media/files/library/2017/10/studentitstudy2017.pdf
Dahlstrom, E. & Bichsel, J.(2014). ECAR Study of Undergraduate Students and Information Technology, 2014. [Web site] Retrieved from http://www.educause.edu/ecar Davis III, C. H., Deil-Amen, R., Rios-Aguilar, C., & González Canché, M. S. (2015).
Social media, higher education, and community colleges: A research synthesis and implications for the study of two-year institutions. Community College Journal of Research and Practice, 39(5), 409-422.\

P a g e | 19
Dimock, M., & Dimock, M. (2019, January 17). Defining generations: Where Millennials end and Generation Z begins. Retrieved from https://www.pewresearch.org/fact-tank/2019/01/17/where-millennials-end-and-generation-z-begins/ Dziuban, C., Graham, C. R., Moskal, P. D., Norberg, A., & Sicilia, N. (2018). Blended
learning: the new normal and emerging technologies. International Journal of Educational Technology in Higher Education, 15(3), 1–16.
Flanigan, A. E., & Babchuk, W. A. (2015November). Social media as academic quicksand: A phenomenological study of student experiences in and out of the classroom. doi:10.1016/j.lindif.2015.11.003.
Gebre, E., Saroyan, A., & Bracewell, R. (2014). Students' engagement in technology rich
classrooms and its relationship to professors' conceptions of effective teaching. Br J Educ Technol British Journal of Educational Technology, 83-96.
Giammona, C., Wilson, C., & Ponczek, S. (2019, April 5). Investors’ Guide to Gen Z:
Weed, Social Justice and Kylie Jenner. Retrieved July 22, 2019, from https://www.bloomberg.com/news/articles/2019-04-05/what-s-gen-z-and-how-can-you-invest-cannabis-influencers-key?intcmp=Insightsblog-042319-GenZ
Gibson, C. (2016, May 25). Inside the race to decipher today's teens, who will transform
society as we know it. Retrieved July 30, 2019, from https://www.washingtonpost.com/sf/style/2016/05/25/inside-the-race-to-decipher-todays-teens-who-will-transform-society-as-we-know-it/?utm_term=.ae98e0bfb8cf
GlobalWebIndex Audience report 2019. Gen Z: Examining the attitudes and digital
behaviors of internet users aged 16-21. (2019). Retrieved July 30, 2019, from https://unl.box.com/s/u7ka8bm4gghqdqt32loi4c685isybqga
Graham, C. R., Henrie, C. R., & Gibbons, A. S. (2014). Developing models and theory
for blended learning research. In A. G. Picciano, C. D. Dziuban, & C. R. Graham (Eds.), Blended learning: Research perspectives (Vol. 2, pp. 13–33). New York: Routledge.
Glass, A.L. & Kang, M., 2018. Dividing attention in the classroom reduces exam
performance, Educational Psychology, 39:3, 395-408 Halverson, L.R., Spring, K.J., Huyett, S., Henrie, C.R. and Graham, C.R., 2017.
Blended learning research in higher education and K-12 settings. In Learning, Design, and Technology (pp. 1-30).
P a g e | 20
Kusnekoff, J., Munz, S., & Titsworth, S. (2015). Mobile Phones in the Classroom: Examining the Effects of Texting, Twitter, and Message Content on Student Learning. Communication Education, 64(3), 344-365. doi:10.1080/03634523.2015.1038727
McCoy, B. (2016). Digital Distractions in the Classroom Phase II: Student Classroom
Use of Digital Devices for Non-Class Related Purposes. Journal of Media Education Vol. 7 Iss. 1 (2016) p. 5 – 32 Retrieved from https://www.researchgate.net/publication/290427877_Digital_Distractions_in_the
_Classroom_Phase_II_Student_Classroom_Use_of_Digital_Devices_for_Non-Class_Related_Purposes
McCoy, B. (2013). Digital Distractions in the Classroom: Student Classroom Use of
Digital Devices for Non-Class Related Purposes. Journal of Media Education, 4(4), 5-14. Retrieved from http://en.calameo.com/read/000091789af53ca4e647f
Oh, E., & Reeves, T. C. (2014). Generational differences and the integration of
technology in learning, instruction, and performance. In Handbook of research on educational communications and technology (pp. 819-828). Springer New York.
Pedotto, K., & Chen, V. (2017, August 24). The 2017 U.S. Mobile App Report. Retrieved
July 24, 2019, from https://www.comscore.com/Insights/Presentations-and-Whitepapers/2017/The-2017-US-Mobile-App-Report
Rideout, V.J., Foehr, U.G., & Roberts, D.F. (2010). Generation M2: Media in the lives of
8- to 18-year-olds. Kaiser Family Foundation. Retrieved from https://kaiserfamilyfoundation.files.wordpress.com/2013/01/8010.pdf
Shan, X., Zheng, W., & Prabu, D. (2016). Media multitasking and well-being of
university students. Computers in Human Behavior, 55(A), 242-250. doi:10.1016/j.chb.2015.08.040
State of Gen Z: 2018. (2018, September). Retrieved July 12, 2019, from
https://genhq.com/wp-content/uploads/2018/10/State-of-Gen-Z-2018.pdf Sullivan, A., Johnson, B., Owens, L., & Conway, R. (2014). Punish Them or Engage
Them? Teachers’ Views of Unproductive Student Behaviours in the Classroom. AJTE Australian Journal of Teacher Education.
Van Dusen, G. C. (2014). The Virtual Campus: Technology and Reform in Higher
Education. ASHE-ERIC Higher Education Report, Volume 25, No. 5.
P a g e | 21
Wang, Z., Irwin, M., Cooper, C. & Srivastava, J. (2015). Multidimensions of media multitasking and adaptive media selection. Human Communication Research, 41 (2015), pp. 102–127 Table One
DigiDistractions Q1 Phase III.pdf
DigiDistractions Q2 Phase III.pdf

P a g e | 22
DigiDistractions Q3 Phase III.pdf
DigiDistractions Q4 Phase III.pdf
P a g e | 23
DigiDistractions Q5 Phase III.pdf
DigiDistractions Q6 Phase III.pdf

P a g e | 24
DigiDistractions Q7 Phase III.pdf
DigiDistractions Q8 Phase III.pdf

P a g e | 25
DigiDistractions Q9 Phase III.pdf
DigiDistractions Q10 Phase III.pdf

P a g e | 26
DigiDistractions Q11 Phase III.pdf
DigiDistractions Q12 Phase III.pdf
P a g e | 27
DigiDistractions Q13 Phase III.pdf
DigiDistractions Q14 Phase III.pdf
P a g e | 28
DigiDistractions Q15 Phase III.pdf
DigiDistractions Q16 Phase III.pdf
P a g e | 29
DigiDistractions Q17 Phase III.pdf
DigiDistractions Q18 Phase III.pdf

P a g e | 30
DigiDistractions Q19 Phase III.pdf
DigiDistractions Q20 Phase III.pdf
P a g e | 31
Table Two
DigiDistractions Q1CompClass Phase III.pdf
DigiDistractions Q2CompClass Phase III

P a g e | 32
DigiDistractions Q2CompFemale Male Phase III
DigiDistractions Q3CompClass Phase III
P a g e | 33
DigiDistractions Q7CompFemale Male Phase III
DigiDistractions Q11 CompFemale Male Phase III
P a g e | 34
DigiDistractions Q12 CompFemale Male Phase III
DigiDistractions Q15 CompFemale Male Phase III