gem quality johachidolite: occurrence, chemical composition
TRANSCRIPT

No.5 November 2007
Copyright by GRS Gemresearch Swisslab AGP.O.Box 4028, 6002 Lucerne, Switzerland
www.gemresearch.ch
GEM QUALITY JOHACHIDOLITE:OCCURRENCE, CHEMICAL COMPOSITION AND CRYSTAL STRUCTURE
In this issue we are happy and privileged to look into the world of rare minerals of Mogok (Myanmar). Our focus is on one of the rarest gemstones in the world: Johachidolite.
We are describing the natural occurrence of this rare collector gemstone and document its chemical composition, crystal structure and the visual aspects of the rough and the beauty of the faceted stones. Modern scientific methods are used to unlock some of the secrets of formation of this extremely rare gem mineral.
In the world of advanced Earth Science, we are very excited to present this 5th edition of Contributions to Gemology. Our in-depth research into johachidolite has revealed the presence of 40 different chemical elements and exciting details on contents of rare earth elements (REE). Johachidolite traced million years old events of the earth crust rock evolution.
The vibrant colors in these faceted gemstones compete in beauty many well-known gemstones, such as rubies, sapphires and emeralds. Its high degree of hardness and mean refractive index is similar to other gems such as spinels.
We believe that this issue covers a comprehensive description of johachidolite including the chemical and crystallographic characteristics. One should be aware that johachidolite is an extraordinary example of the wonderful creativity of our planet Earth. To reveal the secrets of this treasure is an exciting experience.

MESSAGE
Editor
Dr. A. Peretti, FGG, FGA, EurGeolGRS Gemresearch Swisslab AG, P.O.Box 4028, 6002 Lucerne, Switzerland
Editorial Review Board
Prof. Dr. B. Grobéty, Institute of Mineralogy and Petrography, University of Fribourg, Fribourg, Switzerland
Prof. Dr. J. Mullis, Institute of Mineralogy and Petrography, University of Basel, Basel, Switzerland
Prof. Dr. K. Ramseyer, Institute for Geological Sciences,University of Berne, Berne, Switzerland
Prof. Dr. D. Günther, Institute of Chemistry, Laboratory for Inorganic Chemistry, ETH, Zurich, Switzerland
This journal follows the rules of the Commission on New Minerals and Mineral Names of the IMA in all matters concerning mineral names and nomenclature.
Distributor
GRS (Thailand) Co., LTD. 257/919 Silom Rd., JTC Building, Bangkok 10500, Thailand.
Journal and Website Copyrighted by GRS (Thailand) Co. LTD, Bangkok, Thailand and GRS Gemresearch Swisslab AG, Lucerne, Switzerland
This report is available online atwww.gemresearch.ch
ISBN 978-3-9523359-3-2
Message from the Editor’s Desk
The continuous research on new gem occurrences and new gemstones is a very important aspect of the activities of a modern gemological laboratory. With the description of a revised crystal structure of painite in our previous publication and the discovery of the new gem mineral pezzottaite, GRS has invested much in this tradition. It has featured its discoveries in two issues of Contribution to Gemology and published the detailed results in American Mineralogist and Mineralogical Record. Research institutions all over the world, some of them considered the most prestigious in this field of research, have made links to the online version of our journal at www.gemresearch.ch, particularly suitable for students to appreciate our extensive use of illustrations. Every day several thousand visitors search our website from more than 15 countries, confirming the interest in rare collector gems in the gem community and the public. It took GRS and its collaborating scientific partners in Switzerland almost two years of intensive research to make another important discovery of corresponding caliber. Again, it is a discovery in the field of new gem occurrences and new important data on mineral structures and mineral chemistry. This time the news is not coming from new mines in Madagascar but from the famous valley of Mogok in Burma, renowned for its fabulous rubies and sapphires. As we constantly studied the ruby and sapphire mines in Mogok, it was only a matter of time to discover one of the rarest collector gems in the world: Johachidolite. It is a true gem with its vivid color, high brilliancy due to the high refractive index, high density and Mohs hardness of over 7.5. Careful crystallographic examination of johachidolite enabled a state of the art structure refinement, which will be additionally published in a specialized scientific journal of high recognition. Thorough examination of the chemistry of johachidolite provided us with data elucidating its origin and authenticity. A new rare earth element (REE) “fingerprint test” for the origin of johachidolite has been made available with the publication of this new edition of “Contribution to Gemology No. 5”.
Adolf Peretti

Contents of Contributions to Gemology No.5 Contents of Contributions to Gemology No.5
MyemeKyauk Sin
Kolan
0’23
O
22O
22O
58’
59’
Pain PyitSapphireProvince
JOHACHIDOLITEOCCURRENCE
Dat Taw Xgwfawmf
N-22o 58’ 20.8” E-96o 32’ 54.0”
(1459 m)
GEM OCCURRENCES AT PYANT GYI
Pyant GyijyefH[uD;
Painpyitydef;jypf
JOHACHIDOLITEOCCURRENCE
Pain PyitSapphireProvince
Leu-DattawRuby Province
Painpyit
LEU
Dat Taw
OHN BIN
DanburiteCaB2Si2O8
HackmaniteNa8Al6Si6O24(Cl2, S)
JohachidoliteCaAl(B3O7)
PoudretteiteKNa2BSi12O30
Orthorhombic
Cubic
Orthorhombic
Hexagonal
H
Gem Quality Johachidolite: Occurrence, Chemical Composition and Structure
Origin of Johachidolite
New Discovery of Johachidolite: Geology
New Discovery of Johachidolite to the North-East of Mogok
New Discovery of Johachidolite: Geological Map and Cross Section of the Mogok Belt
The Neighboring Ruby Deposits at Kadottat and Baw Pa Dan
Visiting the Ruby and Spinel Mines of Pain Pyit in 2002
Studying the Mineral Occurrences in Chaung Gyi in 2002
Gemological Chart of Gem Occurrences at thePyant Gyi Mine
Catalogue of Gems fromPain Pyit Area andPyant Gyi Mine
Panorama View from the “Johachidolite-Hill” mine(Pyant Gyi) towards Pain Pyit
Details of Mining Activities at the “Johachidolite-Hill” Mine atPyant Gyi
Mining Activities for Johachidoliteat the Pyant Gyi Mine
Petrography of Pegmatite Containing Johachidolite
Library of Raman Spectra ofRock Forming Minerals of the “Johachidolite-Pegmatite”
Petrography of Johachidolite-Bearing Pegmatite and Inclusion in Johachidolite
Inclusion in Johachidolite
Analyses of 3-phase Fluid Inclusions in Johachidolite
Fluid Inclusion in Johachidolite
Inclusion Features in Johachidolite
Petrography of Johachidolite-BearingPegmatite
Johachidolite Gem Materials
Gem Set of Johachidolite andRare Johachidolite Crystal
Physical and OpticalProperties and UV-Fluorescenceof Johachidolite
Electron Microprobe Analysis: Methods
LA-ICP-MS and EMPA Chemical Analyses of Johachidolite
LA-ICP-MS Chemical Analysis of Johachidolite (Continued)
LA-ICP-MS Chemical Analysis: Methods
LA-ICP-MS Chemical Analyses of Johachidolite
Chemical Analyses of Johachidolite and Accompanying Minerals
LA-ICP-MS Chemical Profile Across a Color-Zoned Johachidolite
REE Patterns in Minerals and Explanation of Europium (Eu) Anomaly in Johachidolite
REE Patterns in Johachidolite and Color-Zoning
Chemical Variation in Johachidolite
REE-Pattern In Various Minerals Accompanying Johachidolite
Rare Earth Elements(LREE, HREE), Th, U and Be-Concentrations in Pegmatite Minerals
LA-ICP-MS Chemical Analyses of Fluorapatite
LA-ICP-MS Chemical Analyses of Hackmanite, Scapolite, Orthoclase and Fluorapatite
Classification of Johachidolite
Classification of Johachidolite, Fluorapatite and Scapolite Using REE-Patterns
FTIR and Raman Spectroscopy of Johachidolite
Raman Spectrum of Johachidolite
UV/VIS Spectroscopy of Johachidolite
Origin of Color in Johachidolite
Crystal Structure and Crystal Chemistry
Crystallography of Johachidolite
Crystal Structure and Crystal Chemistry of Johachidolite
Crystal Structure and Crystal Chemistry of Johachidolite and Comparison to Okayamalite
Poudretteite Crystal Structure
LA-ICP-MS Chemical Analyses of Poudretteite
Acknowledgements and Literature
1
2
3
4
5
6
7
8
9
10
11-12
13
14
15
16
17
18
19
20
21
22-23
24
25
26
27
28
29
30
31
32
33
34
35
36
37
38
39
40
41
42
43
44
45
46
47
48
49
50
51
52
53

Sapphire
Ruby
30’96O
29’96O
35’96O
34’96O
33’96O
32’96O
31’96O
0’23
O
22O
55’
22O
22O
22O
22O
56’
57’
58’
59’
22O
54’
N0 Miles 1
Kilometers
Chaung Gyi Sapphire Province
Pain PyitSapphireProvince
Pan Lin-Pyaung GaungPeridot-Sapphire Province
Yebu-Ohn GaingGem Province
Mogok-KadottatRuby Province
Leu-DattawRuby Province
JOHACHIDOLITEOCCURRENCE
Lin Yaung Chivif;a7mifjcnf
MOGOKrdk;ukwf
Mogok Area(Central Mogok)
A Shate Pine Area(East Mogok)
OHN GAINGtkef;ukdif;
LEUv,fOD;
Dat Taw Xgwfawmf
Pyaung Gaunga[ymifacgiff;
Shwe Pyi Ayea7GSjynfat;
KADOTTATuwkwfwyf
YE BUa7yl
TAUNG MIN TAUNGawmiffrif;awmif
Ho Mine]dkrdkif;
(Land MarkMountain)
N-22o 58’ 20.8” E-96o 32’ 54.0”
(1459 m)
Mogok
Eas
t Pan
oram
a
OHN BINtkef;yif
Pink Sapphire
Johachidolite
Poudretteite
Spinel (Fancy)
Spinel (Vivid Red)
Padparadscha
Fancy Sapphire
Star Sapphire
Sapphire
Star Ruby
Yellow Sapphire
Color-ChangingHackmanite
Danburite
GEM OCCURRENCES AT PYANT GYI
GEM OCCURRENCEEXPLAINATION
MAIN AREA OFOCCURRENCE OFRUBY & SAPPHIRE
Pyant GyijyefH[uD;
Painpyitydef;jypf
Fig. J02. Simplified map showing the occurrence of johachidolite close to Mogok (Burma, Myanmar). The mining area has been subdivided into different provinces (I-VI). Every mining spot consists of hundreds of individual mines including the so-called “one-foot” mines which cluster around several large mining sites. The occurrence of johachidolite in the Pain Pyit mining province at the locality of Pyant Gyi is indicated on the map with the exact coordinates of occurrence. The major gems mined in the close vicinity of the johachidolite occurrence are listed.
GEM QUALITY JOHACHIDOLITE:OCCURRENCE, CHEMICAL COMPOSTION AND CRYSTAL STRUCTURE Adolf Peretti (1), Francesca Peretti (1), Ngwe Lin Tun (1), Detlef Günther (2), Kathrin Hametner (2),Willy Bieri (3), Eric Reusser (4), Milen Kadiyski (5), Thomas Armbruster (5)
(1) GRS Gemresearch Swisslab Ltd, Sempacherstr.1, CH-6003 Lucerne, Switzerland(2) Laboratory of Inorganic Chemistry, ETH Hönggerberg, HCI, G113, CH-8093 Zurich, Switzerland(3) GRS (Thailand) CO LTD, Bangkok, 10500 Thailand(4) Institute of Mineralogy and Petrography, Clausiusstr. 25, ETH Zentrum, CH-8092 Zurich, Switzerland(5) Miner. Crystallogr., Institute of Geological Sciences, University of Berne, Freiestr. 3, CH-3012 Berne, Switzerland
Fig. J01. A specimen with a 40mm long johachidolite crystal associated with hackmanite on matrix. GRS collection. Origin: Pyant Gyi Mine, (Eastern Mogok, Burma, Myanmar).
INTRODUCTION
The mineral was first described, though with a wrong chemical formula, from the Johachidolite District, Kisshu County, Kankyo Hodu Perfecture, North Korea, and was named after the type locality. Aristarain and Erd (1977) assumed that the originally postulated composition of johachidolite H6Na2Ca3Al4F5B6O20 (Iwase and Saito, 1942) is due to intimate intergrowth of two different minerals, one F-rich and the other johachidolite of CaAlB3O7 composition. The newly proposed formula and redefinition of the mineral is based on electron microprobe analyses of the metatype specimen showing major Ca and Al only (Aristarain and Erd, 1977) and a single-crystal X-ray study performed on the same material by Moore and Araki (1972). The latter authors showed that johachidolite possesses an unusual layer structure in which BO4 tetrahedra are assembled to form corrugated sheets linked by octahedral Al and ten-fold coordinated Ca. In 2001, an article appeared with the title “johachidolite - a new gem” (Harding et al., 1999) featuring the worlds first and only gem quality johachidolite of 14.02 ct. The authors conclude that the gem is probably natural, with a possible source in the Mogok area of Myanmar. In this work, we were able to trace the origin of the material to the exact mine, collect and analyze rock samples containing johachidolite, present pictures of johachidolite in matrix, determine the chemical composition of johachidolite, restudy the crystal structure of johachidolite using state of the art equipment (See also Kadiyski et al., in prep.), present more gem quality johachidolite specimens (Worlds No. 2, 3, 4 etc.), present data on the chemical composition of the first published johachidolite of 14.02 ct and prove its natural origin.The chance that new gems may be found in the area of Mogok is quite likely because of extensive mining over an area of about 600 km2. According to the estimation of one of the authors (NLT) who lives permanently in Mogok, a huge number of up to four hundred thousand miners work day and night. Once a rare gem is found and identified, however, it is very difficult to trace it to the exact spot of discovery. Direct expeditions to mines are therefore the only possibility
to locate the occurrence of new gems. The mining area, however, is closed for foreigners since 2004 and even when visitors were permitted to visit the area, many mines were government controlled and inaccessible. Between 1999 and 2002, one of the authors (AP) was permitted to explore the mines at Mogok and was able to spend a total of about three weeks in the field. Among important information on the occurrence of rubies, sapphires and spinels in this area, it lead to the discovery of painite (Armbruster et al., 2004). During the trips to the Eastern part of Mogok, special attention was paid to the mining areas of Pain Pyit and Chaung Gyi. These mines are normally inaccessible to visitors but permission was granted in 2002 (Fig. J11 - J15). The area of Pain Pyit, which is known as Pyant Gyi was of special interest (Fig. J02). This area is known for the occurrence of various gems, such as other borates including danburite and poudretteite, as presented in Tab. J01. One of the authors (NLT) had the possibility to test gemstones in Mogok for GRS over a period of several years, which lead to the discovery of faceted johachidolite and eventually the exact spot of occurrence.
I
IIIII
IVV
VI
(*) Just before printing this report, one of the authors (FP) was able to acquire hackmanite-bearing pegmatite at the Munich Mineral Show (2007), obviously corresponding to the materials found in Mogok. The rock specimens also contained additional johachidolite.
OCCURRENCE OF JOHACHIDOLITEJohachidolite is found in the Pain Pyit mining province, which is located about 5 km northeast of Mogok (Fig. J02, J05, J11 and J17). The Pain Pyit mining province is famous for its findings of gem quality spinels (Fig. J13), sapphire and other collector gemstones (Tab. J01, Box J01). Rubies are also found, but mostly in other areas of Mogok (Fig. J09 and J10). Recently, mining of other minerals has gained importance in the Pain Pyit area. The locality of johachidolite occurrence is called Pyant Gyi and is also situated in the Pain Pyit mining province (coordinates are given on Fig. J02, J17 and J19). Previously, the mining at Pyant Gyi was targeted on gem quality pinkish-red spinels and pink scapolite (See Tab. J01 and Box. J01). The Pyant Gyi mine was already active in the 1980’s to 1990’s, when rubies, sapphires and spinels were found. In 2000, the mining activities increased, when attention turned to
the findings of spinels of vibrant pinkish-red color. In 2005, about 30 miners were searching at this mine for collector stones (Fig. J16), in particular for clean pink scapolite. Some of the material thought to be scapolite, turned out to be poudretteite, as first recognized by one of the authors (NLT) during gemological testing in Mogok. The discovery of gem quality hackmanite (Box J01) at this mine in 2005 initiated a mining boom (Fig. J16 and J19), which lead to more findings of other gem minerals (Box J01). Hackmanite-containing rocks were hammered to retrieve hackmanite with no attention to the yellow to orange colored johachidolite. Most of the johachidolite material, mined before August 2007, was lost (*).
0201
Gem Quality Johachidolite: Occurrence, Chemical Composition and Crystal Structure Origin of Johachidolite

30’96O
29’96O
35’96O
34’96O
33’96O
32’96O
31’96O
0’23
O
22O
55’
22O
22O
22O
22O
56’
57’
58’
59’
22O
54’
N0 Miles 1
Kilometers
JOHACHIDOLITEOCCURRENCEChaung Gyi
Sapphire Province
Pain PyitSapphireProvince
Pan Lin-Pyaung GaungPeridot-Sapphire Province
Yebu-Ohn GaingGem Province
Mogok-KadottatRuby Province
Leu-DattawRuby Province
Lin Yaung Chi
MOGOK
Mogok Area(Central Mogok)
A Shate Pine Area(East Mogok)
OHN GAING
Pain Pyit
LEU
Dat Taw
Pyaung Gaung
Shwe Pyi Aye
KADOTTAT
YE BU
TAUNG MIN TAUNG
Ho Mine
(Land MarkMountain)
Ohn Bin
Alluvium
Basic & Ultrabasic
Syenite
Augite &Hornblende granite
Calc-gneiss
Limestone &Calciphyre
Khondalites
Dips
LEGEND
Ohn Bin Sone Taw Mying
East Mogok
Dattaw ruby mine Johachidolite occurrencesbehind mountain range
Road to Pain Pyit
ESEWNW
Fig. J05A. View to northeast with Mogok in the foreground. In the background, the famous “Dattaw” - mine can be seen. This is a primary mine producing fine rubies. The johachidolite occurrences are localized behind the Dattaw mine, at the back slope of the mountain range, not directly visible from Mogok.
Fig. J05B. View to Mogok with the Mogok Inn Lake on the right and the Chan Tha Gyi Pagoda on the left. The land mark mountain directly bordering Mogok is known as “Nat Nyo Taung”. For a geological profile in the viewing direction see Fig. J07 and J08.
Fig. J06. Johachidolite of 10 mm length (in pegmatite matrix). The crystal is slightly broken at the tip. In a perpendicu-lar view, the crystal has an orthorhombic cross section. From Pyant Gyi Mine (Eastern Mogok, Burma, Myanmar). Sample No. GRS-Ref 5630.
Fig. J03. Geological map of Clegg and Iyer (See Iyer, 1953) superimposed to the map of Fig. J02. Johachidolite occurs in an area with limestones and gneisses. In the area west of the johachidolite occurrences, a series of intrusive rocks can be found, including syenite rocks.
Fig. J04. Panorama view of the eastern part of Mogok (location is marked on Fig. J02). The area is scattered with alluvial mines for rubies, sapphires and spinels. Ohn Bin is another important area for findings of collector gems, such as color-changing sapphire, taaffeite, chrysoberyl, green grossular garnet, colorless garnet and minerals of the amphibole group, such as edenite and even alexandrite. Like the Pain Pyit area, the Ohn Bin area attracts many gem dealers in their “hunt” for new rare gems. Both, Pain Pyit and Ohn Bin are situated at the margin of plutonic rock suites (Fig. J03).
Fig. J05A
Fig. J05B
0403
New Discovery of Johachidolite: Geology New Discovery of Johachidolite to the northeast of Mogok

A MyemeKyauk Sin
Kolan
B4000
2000
3000
Granite, tough,exfoliated, light grey
Granite, leucogranite,syenite, alaskite
Gneiss, garnet-biotite-gneiss,biotite-silimanite-gneiss,hornblende gneiss
Calc-silicate rockand diopside marble
Marble, coarse andcrystalline and hybrid rock
55’
Granite, leucogranite,syenite, alaskite
Granite, tough,exfoliated, light grey
Calc-silicate rockand diopside marble
Calc-silicate rock anddiopside marble
Marble, coarseand crystallineand hybrid rock
Gneiss, garnetbiotite gneiss,biotite-silimanite-gneiss,
hornblende gneiss
Granite, leucogranite,syenite, alaskite
Gneiss, garnetbiotite gneiss,biotite-silimanite-gneiss,
hornblende gneiss
Bawpadan
Taungma
PsitsweKolan
MOGOKBawton
Kathe
JOHACHIDOLITEOCCURRENCE
A
CR
OS
S- S
EC
TI O
N A
- B
Barnardmyo
BScale:1 2 3 4
Miles
N
30’96O
0’23O
22O
25’96O
Myeme
Kyauk Sin
GEOLOGY AND PETROGRAPHY
The geology and petrography of the Mogok area and its eastern extension is shown on Fig. J03, J07 and J08. The profile through the rock suite in the vicinity of Mogok is shown on Fig. J08. As can be seen in the profile, marble, gneiss and schists are associated to plutonic rocks. The metamorphic grade is high and lead to the formation of rocks such as sillimanite gneisses (Fig. J08). The metasedimentary rock staple is folded and overtrusted (Fig. J08), causing a repetition of the various rocks. Marbles and intrusive rocks occur close to the area of Pyant Gyi (Fig. J03). Assuming that a similar situation is found to the northeast at the Pyant Gyi mine, the presence of granitoide intrusive rocks may well be possible. Indeed, johachidolite is found in a pegmatite consisting of scapolite, hackmanite, orthoclase, fluorapatite, phlogopite, white mica and thorianite-uraninite (Fig. J26-J27 and J44-J49). However, the exact geology at the mine still needs more field work, which at the point of finalizing this report is impossible, as the area is completely inaccessible to foreigners.Fig. J08. Cross-section drawn passing through Kyauk Sin, Chinthe Taung, Myeme and Kolan
(After Thein et al, 1990)
Fig. J07. Geological map of the Mogok belt at the area of Mogok (After Thein et al, 1990)
Fig. J09. View to the Baw Pa Dan and Kadottat mining areas near Mogok. The most important rubies found in the world originate from these mines. These ruby occurrences (Fig. J10) are found in the marbles which are highly metamorphosed and intruded by igneous rocks (Fig. J08).
Fig. J10. Example of rubies formed in marbles (above) and a typical rough ruby as grown in the marble (below). GRS collection. Samples 3-5 cm large.
0605
New Discovery of Johachidolite: Geological Map and Cross Section of the Mogok Belt The Neighboring Ruby Deposits at Kadottat and Baw Pa Dan
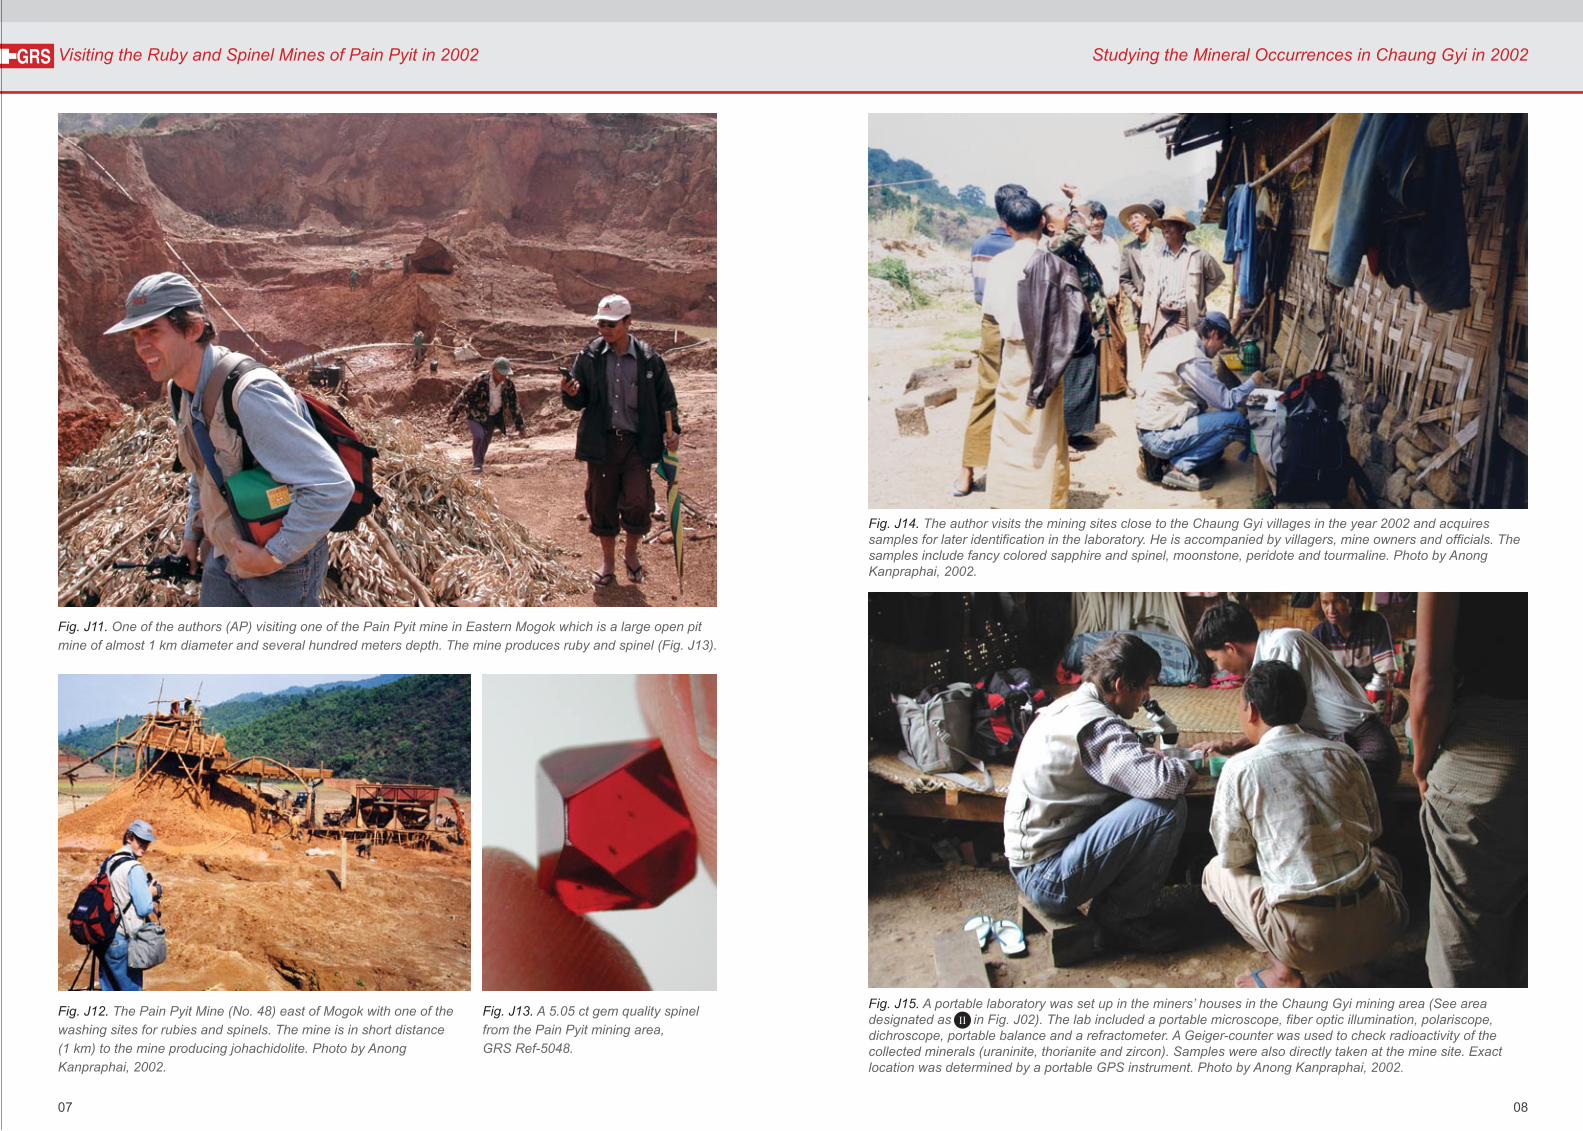
Fig. J14. The author visits the mining sites close to the Chaung Gyi villages in the year 2002 and acquires samples for later identification in the laboratory. He is accompanied by villagers, mine owners and officials. The samples include fancy colored sapphire and spinel, moonstone, peridote and tourmaline. Photo by Anong Kanpraphai, 2002.
Fig. J15. A portable laboratory was set up in the miners’ houses in the Chaung Gyi mining area (See area designated as in Fig. J02). The lab included a portable microscope, fiber optic illumination, polariscope, dichroscope, portable balance and a refractometer. A Geiger-counter was used to check radioactivity of the collected minerals (uraninite, thorianite and zircon). Samples were also directly taken at the mine site. Exact location was determined by a portable GPS instrument. Photo by Anong Kanpraphai, 2002.
Fig. J11. One of the authors (AP) visiting one of the Pain Pyit mine in Eastern Mogok which is a large open pit mine of almost 1 km diameter and several hundred meters depth. The mine produces ruby and spinel (Fig. J13).
Fig. J12. The Pain Pyit Mine (No. 48) east of Mogok with one of the washing sites for rubies and spinels. The mine is in short distance(1 km) to the mine producing johachidolite. Photo by Anong Kanpraphai, 2002.
Fig. J13. A 5.05 ct gem quality spinel from the Pain Pyit mining area,GRS Ref-5048.
II
0807
Visiting the Ruby and Spinel Mines of Pain Pyit in 2002 Studying the Mineral Occurrences in Chaung Gyi in 2002

Fig. J16. The mining area at the Pyant Gyi mine in 2005. The scene shows buyers waiting in groups for the miners which are selling the daily findings, such as spinel, ruby, danburite, scapolite and eventually poudretteite (Picture taken before the discovery of johachidolite)
Tab. J01. Gemological chart with a selection of some gemstones found at the Pyant Gyi mine. Data from measured reference samples and literature (www.webmineral.com)
Mineral/Chemical Formula Crystal System Color Density Hardness Optical Data
Ruby & SapphireAl2O3
9 Uniaxial (-)
ε=1.762-1.770, ω=1.770-1.780
Uniaxial (-)ε=1.522-1.571, ω=1.534-1.607
DanburiteCaB2Si2O8
HackmaniteNa8Al6Si6O24(Cl2, S)
2.97 - 3.02
3.99
7Biaxial (+/-)
α=1.63, β=1.633, γ=1.636
JohachidoliteCaAl(B3O7)
3.37-3.45
2.29
7.5
6
6
8
α=1.712, β=1.717, γ=1.726
Single refractiveRange: 1.483-1.484
PoudretteiteKNa2B3Si12O30
2.52 5-5.5Uniaxial (+)
ω=1.510, ε=1.532
SpinelMgAl2O4
Scapolite(Na,Ca)4[Al3Si9O24]Cl
3.57 - 3.72
2.56-2.77
Single refractiveRange: 1.714-1.728
Hexagonal
Orthorhombic
Cubic
Orthorhombic
Hexagonal
Cubic
Tetragonal
BOX J01 GEM OCCURRENCES AT THE PYANT GYI MINE
Tab. J01 Gemological Chart
Danburite
Johachidolite
Poudretteite
SpinelScapolite
Hackmanite
Box J01. Summary of rough and cut gemstones found in the area of the johachidolite occurrences, including danburite, hackmanite (purple, pink and blue), johachidolite (yellow and orange), poudretteite, pink scapolite (including cat’s eye scapolite) and spinel (rough and faceted). Origin: Pain Pyit area and Pyant Gyi Mine (Eastern Mogok, Burma, Myanmar). A, F, G, J, K, L, M, R and V are rough crystals. B, I, O, P, Q, S, U and W are faceted gemstones. C, D, E, H, N and T are polished gemstones.
(V) GRS-Ref 5048, 5.05ct
(A) GRS-Ref 2781, 1.22ct (B) GRS-Ref 5061
(O) GRS-Ref 5095, 2.01ct
(N) GRS-Ref 5096, 3.68ct(L) GRS-Ref 202, 1.66ct (M) GRS-Ref 4949
(P) GRS-Ref 2788, 4.19ct (Q) GRS-Ref 2791, 5.92ct (R) GRS-Ref 2794, 2.50ct
(S) GRS-Ref 3760, 4.85ct (T) GRS-Ref 2349, 5.12ct (U) GRS-Ref 2350, 2.05ct (W) GRS-Ref 4945, 1.46ct
(I) GRS-Ref 5672, 1.57ct(H) GRS-Ref 5648, 0.78 ct
(C) GRS-Ref 5567 (D) GRS-Ref 5577 (E) GRS-Ref 5569
(J) GRS-Ref 5630, 1 cm long
(K) GRS-Ref Poudretteite
(F) GRS-Ref 5965, 0.36ct (G) GRS-Ref 5965, 0.36ct
1009
Gemological Chart of Gem Occurrences at the Pyant Gyi Mine Catalogue of Gems from Pain Pyit Area and Pyant Gyi Mine

Occurrences ofjohachidolite, hackmanite and poudretteite
“JOHACHIDOLITE-HILL”
Ruby and spinel alluvial deposits
Ruby, sapphire and spinel mine flooded
Fig. J19. View to the so-called Johachidolite-Hill (circle) at Pyant Gyi. Progressive mining activities produce an ever growing valley at the top of the hill. At the base of the hill is the flooded ruby mine and on its slopes is the locality of an important spinel mine. Poudretteite and hackmanite also occur together with johachidolite. Photo 2007.
Fig. J17. Panorama view towards northeast with the Pain Pyit village in the background, the lake of the Pyant Gyi ruby mine (now flooded) and the johachidolite-hackmanite mine on the front left. The elevation of the view point is 1445 m. This area is included in the government science and technology area for prospecting minerals other than gems. It is an area prohibited to any visitors at this time. Photo 2007.
Fig. J18. View from the Johachidolite-Hill mine towards the alluvial and primary spinel mine at Pyant Gyi which is situated at a lower level. The mining activities are concentrated on small mines which may reach a depth of 50 m or more. In the slang of the miners such small pits are named “square foot mines”.
Pain Pyit Village
1211
Panoramic view from the “Johachidolite-Hill” mine (Pyant Gyi) towards Pain Pyit

Fig. J21 Example of a mine for hackmanite, poudretteite and johachidolite at the Pyant Gyi mine, which is still in operation. A so called “square-foot” mine reaches currently a depth of 40 m (Fig. J22). Photo 2007.
Fig. J21. The johachidolite mine in action, 2007. 50 m long rod is used to lift rock fragments and soil to the surface.
Fig. J22. View into the main shaft that produced the largest and best quality johachidolite at Pyant Gyi in 2007.
Fig. J23. Another “square foot” mine has been intentionally demolished and caved to prevent mining in this restricted area. It happened that most gem quality johachidolite were mined from this spot.
Fig. J24. The mined soil and rocks are collected in bags of 40 kg for further transportation to the washing place.
Fig. J25. The 40 kg bags are transported over a distance of about 500 m down the hill along a steep and slippery trail to a water spring at the base of the hill since no water can be found at the mining site at the top of the hill.
Fig. J20 The Johachidolite-Hill mine in the foreground as seen from the top of the mountain. The area was originally covered with numerous extremely small mines, which are now exhausted and backfilled. They have reached great depths and were primarily opened for hackmanite mining. Accompanying johachidolite was generally overlooked.
Fig. J21
Fig. J22
Fig. J23
Fig. J24
Fig. J25
1413
Details of Mining Activities at the “Johachidolite-Hill” Mine at Pyant Gyi Mining Activities for Johachidolite at the Pyant Gyi Mine

Fig. J26. 1.5 kg large pegmatite rock specimen composed of the following minerals: A = johachidolite, B = scapolite, C = phlogopite, D = orthoclase, E = fluorapatite, F = hackmanite. Rock sample in GRS collection.
Fig. J27. Detailed photo of rock specimen (Fig. J26) focusing on the johachidolite. The johachidolite crystal is approx. 6.5 cm long and is about 200 ct in weight. Note: color zoning follows growth sectors (yellow, light green and colorless). Orange rims are also observed. In the center of the picture a green apatite and gray orthoclase can be seen.
MINERALOGY OF PEGMATITE CONTAINING JOHACHIDOLITESeries of rock specimens containing johachidolite have been investigated (Fig. J01, J06, J26 and J41-J49). The methods used for identification of mineral phases included standard gemological testing (Tab. J01), ED-XRF (for qualitative chemical analyses), Raman spectroscopy (Fig. J28, J35, J36 and J76), electron-microprobe analysis (Fig. J79, Tab. J02), LA-ICP-MS (Tab. J03, J04 and J05) and X-ray diffraction (Kadiyski et al., in prep). The mineral phases of the johachidolite-bearing rocks were identified as scapolite (Fig. J28B and Tab. J05), fluorapatite (Fig. J28E and Tab. J05), orthoclase (Fig. J28D and Tab. J05), phlogopite (Fig. J28C and Tab. J05), white mica, johachidolite (Fig. J28A, Fig. J76 and Tab. J02-J04) and thorianite-uraninite (from ED-XRF analyses, data not shown). Series of
A
B
C
D
E
F
0
50
100
150
200
250
300
0 200 400 600 800 1000 1200 1400
126
161
261
294
357 41
937
7
458
536
771
1049
1112
806
Inte
nsity
cm-1
Fig. J28B Scapolite
B
050
100150200250300350400450500
0 200 400 600 800 1000 1200 1400 1600 1800
103 13
919
327
7 356
430
681
1037 10
75 1444
1656
218 82
0
Inte
nsity
cm-1
Fig. J28C Phlogopite
C
0
100
200
300
400
500
600
700
0 200 400 600 800 1000 1200
105
153
198 28
1
404
473
511
758
807
1123
454Inte
nsity
cm-1
Fig. J28D Orthoclase
D
Inte
nsity
0100020003000400050006000700080009000
0 200 400 600 800 1000 1200
101 42
9 589
605 84
5
964
1052
1079
cm-1
Fig. J28E Fluorapatite
E
Inte
nsity
cm-1
0
500
1000
1500
2000
2500
200 300 400 500 600 700 800 900 1000
Fig. J28A Johachidolite (from sample GRS-Ref 5647)
A
286
326
347
436
375
455
478
525
588
667
832
940
750
686
gemological tests were applied confirming the mineral phases in terms of refractive index and density (Tab. J01). LA-ICP-MS analysis was used to specify the chemical composition of the mineral phases with special attention to their minor and trace element compositions (Tab. J03-J06), such as rare earth elements (REE). Johachidolite was also confirmed by electron microprobe analyses (Tab. J02) with special attention to the presence of fluorine (F). ED-XRF revealed detectable concentrations of chlorine (Cl) in the following minerals: Hackmanite (high concentrations), fluorapatite and scapolite. The identification of orthoclase by Raman spectroscopy was confirmed by X-ray diffraction analysis. LA-ICP-MS-analyses of orthoclase revealed inhomogeneous compositions with variations in Na and Ca contents. In terms of chemical compositions, scapolite is a 33 percent meionite (calculated mineral formula using chemical analyses given in Tab. J05).
Fig. J28. Raman spectra of the rock-forming minerals of the pegmatite found at Pyant Gyi
1615
Petrography of Pegmatite Containing Johachidolite Library of Raman Spectra of Rock Forming Minerals of the “Johachidolite-Pegmatite”

Fig. J29. One of the authors (FP) on the GRS micro-photography station used for this study. It included a Canon EOS 350d Digital Camera, mounted to a trinocular Zeiss Stemi 2000-C microscope and a cold light Eickhorst base. The Digital camera system is controlled by a Mac notebook.
Fig. J34. Johachidolite with a phlogopite inclusion (4 mm diameter). GRS-Ref 5642.
Fig. J33. Johachidolite with a series of transparent and round solid inclusions (60x magnification) found in a faceted sample of yellow color (0.72 ct). They are rarely found in the otherwise clean stones.GRS-Ref 5937.
Fig. J31. Thorianite-uraninite twinned crystals as inclusions in the pegmatite containing johachidolite (See also Fig. J32).
Fig. J32. Johachidolite (yellow) and thorianite-uraninite occurring as inclusions in scapolite.Origin: Pyant Gyi, Mogok, Burma. Found in August 2007. Image size is 1 cm. GRS collection.
Fig. J30A,B. Radioactive thorianite-uraninite inclusions in johachidolite (A) causing orange colored halos in the host mineral (B). This proves that irradiation may produce color centers in johachidolite. Inclusions identified by ED-XRF analyses (at 50kV). GRS-Ref 5859.
The intergrowth of the minerals (Fig. J26, J44-49) is characteristic for a pegmatite. In terms of volumetric (modal) compositions of the pegmatite, the following relative amounts were found (based on large samples such as shown on Fig. J26): scapolite (35 %), orthoclase (25 %), sodalite (hackmanite) (20 %), phlogopite (10 %) together with isolated pockets of johachidolite (up to 5-10 %) and apatite (3 %). Quartz and beryl-group minerals were absent. Occasionally, white mica was found (Fig. J48). Johachidolite occurs as xenomorphic masses of approximately 200 ct in weight. It is intergrown with the other pegmatite minerals and occasionally forms large crystals up to 5 cm in length. Some of the pegmatite hand specimens are radioactive (0.5 micro sivert per hour) due to the presence of thorianite-uraninite (Fig. J31). Radioactive thorianite-uraninite crystals are found as inclusions in scapolite (Fig. J32) and in johachidolite (Fig. J30A,B). Orthoclase, phlogopite and johachidolite are found as inclusions in scapolite. Orthoclase is found also as inclusions in johachidolite (Fig. J49). Apatite is intergrown with johachidolite (Fig. J72B). In conclusion, phlogopite and orthoclase are the earlier mineral generations in the pegmatite and scapolite belongs to the latest minerals formed. Johachidolite may be formed simultaneously to various other minerals in the pegmatite such as apatite. It is also formed during the late stage formation of scapolite.Since johachidolite is a rock-forming mineral, idiomorphic crystals can be found only very rarely. Such an exception is shown in Fig. J53. Another idiomorphic crystal (0.5 cm long, with orthorhombic cross section) is shown in Fig. J06. However, this crystal did not grow freely in a cavity like the one shown in Fig. J53. It formed in competition with other surrounding minerals and could develop idiomorphic habitus inside the solid rock due to special circumstances. Studying the preserved crystals, series of crystal faces could be found (Fig. J53), which
Fig. J30A
exhibit the symmetry of the orthorhombic johachidolite. From the large rough johachidolite crystals which are present in the pegmatite (Fig. J27 and Fig. J54), it is theoretically possible to cut gem stones > 10 ct. From this point of view, the sample published by Harding et al. (1999) could originate from this type of pegmatite. Intense orange colored johachidolite may only be found in smaller crystals, as they occur in the marginal zones of the johachidolite crystals. However, gem crystals bigger than 2 ct must be already considered rare, because johachidolite often has numerous cracks. Different color zones are
Fig. J30B
found in johachidolite, including colorless, light green, yellow or orange. Three types of zoning are found. Crystals with colorless or greenish cores and yellow to orange rims (Fig. J63), crystals with oscillations of colorless and yellow to orange zones (Fig. J64) and specimens with color zoning following growth sectors.
INCLUSIONS IN JOHACHIDOLITEThe inclusions were investigated with the microscope (Fig. J29), by ED-XRF spectroscopy and by Raman spectroscopy (Fig. J35-36). Using a 50 kV micro-focused ED-XRF beam (Peretti and Günther, 2005), it was possible to identify thorianite-uraninite inclusions in johachidolite (Fig. J30A,B) causing orange halos in the johachidolite host. Thorianite-uraninite minerals were also found as inclusions in scapolite together with johachidolite (Fig. J32). Other solid inclusions such as shown in Fig. J33 are rather scarce in johachidolite. Phlogopite was also observed during our preliminary investigations of the inclusions in johachidolite (Fig. J34). More frequent than solid inclusions are fluid inclusions in johachidolite (Fig. J35-43). Among the many fluid inclusions present, isolated 3-phase inclusions were found containing a prominent vapor bubble at room temperature. Using Raman spectroscopy (Fig. J35-36), it was possible to characterize the fluid inclusions as aqueous solutions containing hambergite (Fig. J36). Additional unusual feature are the series of irregular shaped voids showing preferred orientation (Fig. J38 and J41) as well as short needles or tubes emerging perpendicular to the fluid inclusion trails (Fig. J42). Disc-like series of fingerprint-like features were rarely observed (Fig. J43).
1817
Petrography Johachidolite-Bearing Pegmatite and Inclusion in Johachidolite Inclusion in Johachidolite

H
Inte
nsity
cm-1
0
200
400
600
800
1000
1200
1400
1600
1800
100 200 300 400 600 700 800 900 1000
Hambergite (colorless crystal)Be2(OH)BO3
150
280
170
130 18
0
250 27
0
390
430
520
620
630 80
0
680J
980
340
310
JJ J
J 582
500
Fig. J39. Fluid inclusion feather in a 4.51 ct faceted gem quality yellow johachidolite, GRS-Ref 4584.
Fig. J41. Numerous disc-like voids in preferred orienta-tion emerge perpendicular from a fluid inclusion trail. This type of fluid inclusion voids are found in an orange johachidolite cabochon of 2.5 ct.GRS collection.
Fig. J40. 3-phase inclusion in a johachidolite cabochon. Liquid, vapor and solids. Inclusion found in sample GRS-Ref 5647d.
Fig. J37. 3-phase inclusion in johachidolite. Aqueous solution with H2O-rich vapor, liquid and daughter minerals including hambergite (arrow, H). Hambergite is Be2(OH)BO3. Identified by Raman spectroscopy (See Fig. J35). Picture by Glenn Lambrecht, University of Berne, Institute of Geological Sciences, Research Group Rock-Water Interaction (Prof. L. Diamond). Inclusion occurs in sample GRS-Ref 5647d.Fig. J38. Fluid inclusion in vivid yellow-orange johachidolite containing whitish reflecting whiskers. The sample is a faceted orange johachidolite of 1.08 ct. GRS-Ref 5936.
Fig. J35. Raman spectrum of hambergite (H) found as daughter mineral in a fluid inclusion in johachidolite (overlapping with spectrum of johachidolite, J).Inclusion picture see also Fig. J37(by Glenn Lambrecht ).
Fig. J36. Example of a 3-phase inclusion in a johachidolite. Liquid, vapor and solids.
Raman Spectra of Daughter Minerals in a Fluid Inclusion
Fig. J35
Fig. J36
Fig. J37 Fig. J38
2019
Analyses of 3-phase Fluid Inclusions in Johachidolite Fluid Inclusions in Johachidolite

Fig. J46. Large phlogopite crystals found frequently in the pegmatite containingjohachidolite. GRS-Ref 5630.
Fig. J45. Intergrowth of hackmanite with johachidolite, both included in scapolite (3 cm diameter). GRS-Ref 5631.
Fig. J44. Mineralogical composition of pegmatite: Johachidolite (orange), scapolite (white), orthoclase (gray), phlogopite (brown) and apatite (green). Quartz and minerals of the beryl group are absent. The sample is 10 cm large. Scapolite is most abundant in the rock.
Fig. J42. Fluid inclusions feather with needle-like extension appeared in a vivid orange faceted johachidolite of 0.37 ct, GRS-Ref 5934. Sample from Pyant Gyi (Mogok, Myanmar), 80× magnification.
Fig. J43. Series of fingerprint inclusions in yellow johachidolite of 0.41 ct, GRS-Ref 5935. Transmitted light,60x magnification.
2221
Inclusion Features in Johachidolite Petrography of Johachidolite-Bearing Pegmatite
JOHACHIDOLITE GEM MATERIALS
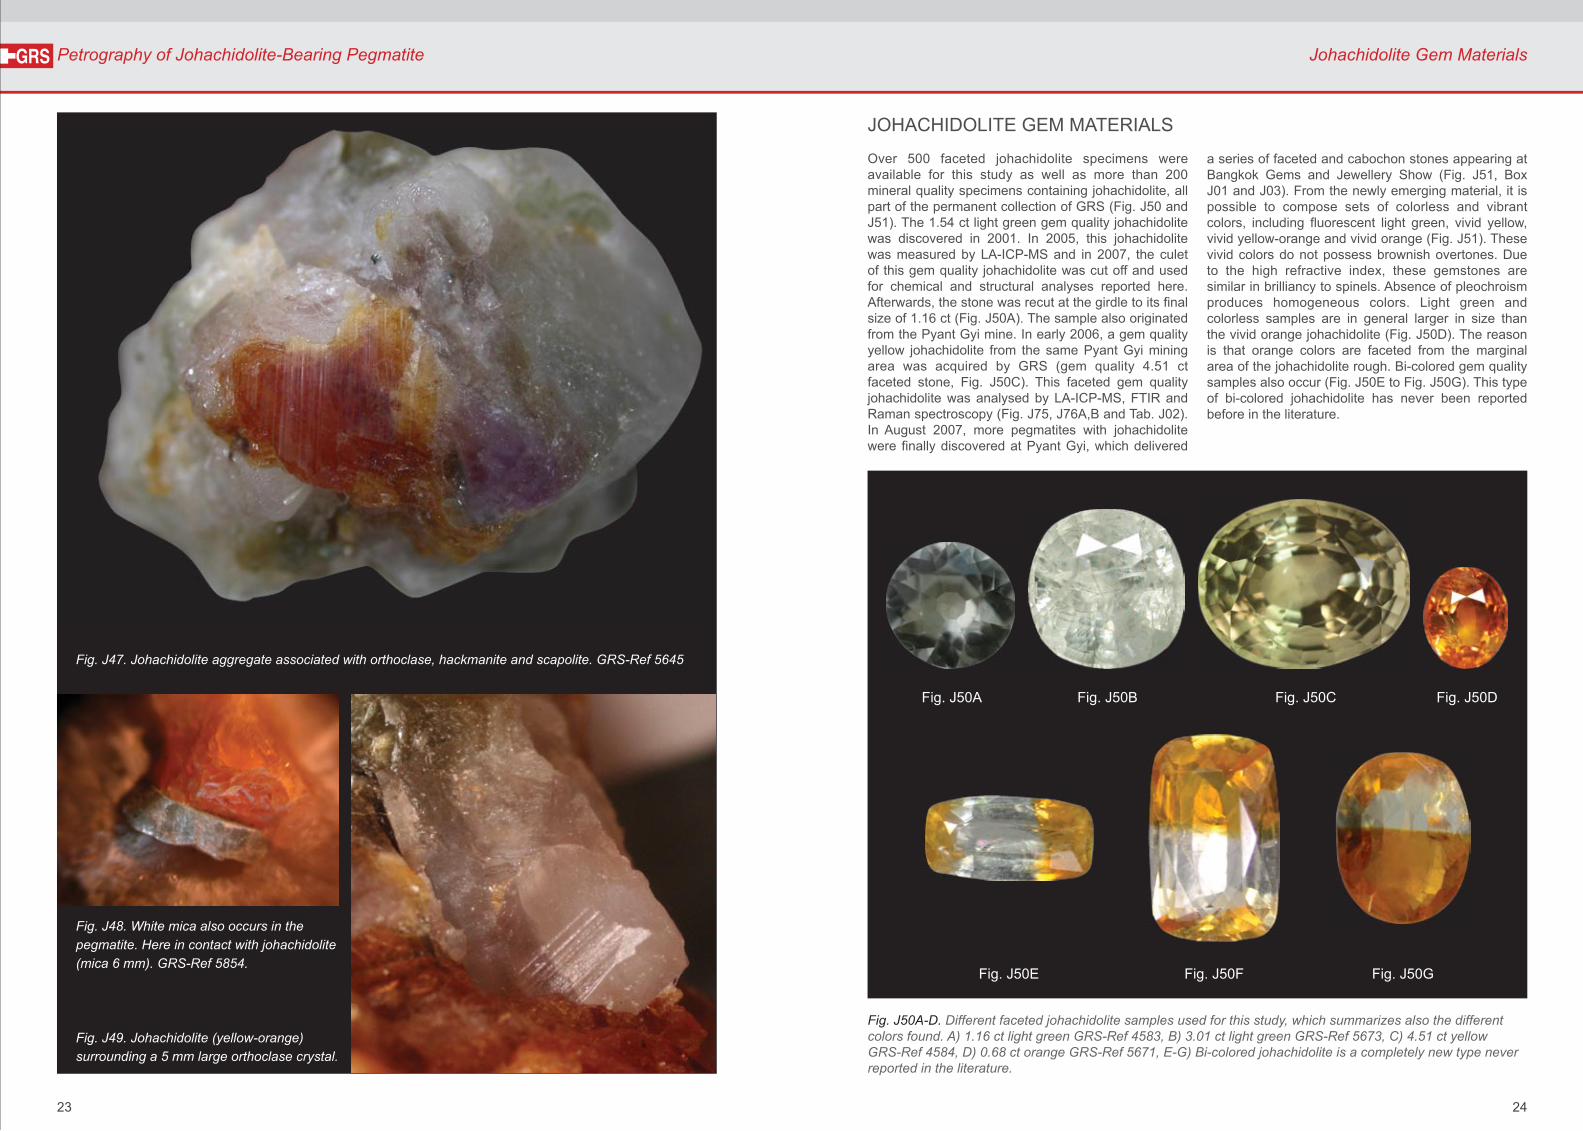
Over 500 faceted johachidolite specimens were available for this study as well as more than 200 mineral quality specimens containing johachidolite, all part of the permanent collection of GRS (Fig. J50 and J51). The 1.54 ct light green gem quality johachidolite was discovered in 2001. In 2005, this johachidolite was measured by LA-ICP-MS and in 2007, the culet of this gem quality johachidolite was cut off and used for chemical and structural analyses reported here. Afterwards, the stone was recut at the girdle to its final size of 1.16 ct (Fig. J50A). The sample also originated from the Pyant Gyi mine. In early 2006, a gem quality yellow johachidolite from the same Pyant Gyi mining area was acquired by GRS (gem quality 4.51 ct faceted stone, Fig. J50C). This faceted gem quality johachidolite was analysed by LA-ICP-MS, FTIR and Raman spectroscopy (Fig. J75, J76A,B and Tab. J02). In August 2007, more pegmatites with johachidolite were finally discovered at Pyant Gyi, which delivered
Fig. J48. White mica also occurs in the pegmatite. Here in contact with johachidolite (mica 6 mm). GRS-Ref 5854.
Fig. J49. Johachidolite (yellow-orange) surrounding a 5 mm large orthoclase crystal.
Fig. J47. Johachidolite aggregate associated with orthoclase, hackmanite and scapolite. GRS-Ref 5645
Fig. J50A-D. Different faceted johachidolite samples used for this study, which summarizes also the different colors found. A) 1.16 ct light green GRS-Ref 4583, B) 3.01 ct light green GRS-Ref 5673, C) 4.51 ct yellow GRS-Ref 4584, D) 0.68 ct orange GRS-Ref 5671, E-G) Bi-colored johachidolite is a completely new type never reported in the literature.
Fig. J50A Fig. J50B Fig. J50C
Fig. J50E Fig. J50F Fig. J50G
Fig. J50D
a series of faceted and cabochon stones appearing at Bangkok Gems and Jewellery Show (Fig. J51, Box J01 and J03). From the newly emerging material, it is possible to compose sets of colorless and vibrant colors, including fluorescent light green, vivid yellow, vivid yellow-orange and vivid orange (Fig. J51). These vivid colors do not possess brownish overtones. Due to the high refractive index, these gemstones are similar in brilliancy to spinels. Absence of pleochroism produces homogeneous colors. Light green and colorless samples are in general larger in size than the vivid orange johachidolite (Fig. J50D). The reason is that orange colors are faceted from the marginal area of the johachidolite rough. Bi-colored gem quality samples also occur (Fig. J50E to Fig. J50G). This type of bi-colored johachidolite has never been reported before in the literature.
2423
Petrography of Johachidolite-Bearing Pegmatite Johachidolite Gem Materials

Fig. J53. Johachidolite crystal of 0.36 ct and 5 mm length viewed in different orientations. Crystal faces include prisms (Pi) and various pyramids (Py). This is the only known picture of an euhedral johachidolite crystal reported in the world literature. GRS-Ref 5965.
Fig. J52. Triangular and half-moon shaped figures found on the surface of a johachidolite crystal GRS-Ref 5854.
Fig. J55A. Bi-colored johachidolite cabochon (colorless and yellow-orange). Weight 2.42 ct.
Fig. J55B. The cabochon of Fig. 14 is shown with its reaction to long-wave UV light. The colorless part shows strong fluorescence and the yellow to orange part is inert.
Fig. J55C. Same like Fig. 15, but with short UV light (254nm). The same fluorescence behavior but with weaker intensity is observed.
Fig. J 54. Example of a large johachidolite rough of 94 ct. Three colors are found in the rough, including colorless, light green and yellow-orange. The yellow-orange color is confined to the outer rim of the rough fragment, which represents the latest growth phase. The coloration of johachidolite is related to a drastic change in formation conditions, which occurred along a distinct phase of growth along a sharp zone in the crystal. Sample GRS-Ref 5649.
RADIOACTIVITY: low (related to
trace–concentrations of Th)
CLEAVAGE {001} imperfect
PARTING observed
TENACITY brittle
FRACTURE regular
DENSITY (meas.) 3.44 g/cm3
DENSITY (calc.) 3.44 g/cm3 (using unit-cell)
OPTICAL PROPERTIES
WAVELENGTH = Na light
BIAXIAL α 1.716-1.717, β 1.720-1.721
γ 1.725-1.728
BIREFRINGENCE 0.008 - 0.012 (positive)
COLOUR (megascopic) colorless, light green,
yellow and orange
Dichroism is not observed:
STREAK colorless to white
LUSTRE vitreous
TRANSPARENT to TRANSLUCENT
FLUORESCENCE inert to long- and short-wave
for yellow and orange samples,
strong blue for colorless in
SWUV radiation and medium
blue in LWUV radiation
HARDNESS: Mohs': 7.5-8
BOX J02 PHYSICAL AND OPTICAL PROPERTIES JOHACHIDOLITE
BOX J03 UV FLUORESENCE
APPEARANCE AND PHYSICAL PROPERTIESJohachidolite occurs as crystals that range in color from colorless, light green and yellow to orange. The crystals occur as:(1) irregularly-shaped flat masses that fill cavities between feldspars and hackmanite; (2) subhedral-to-euhedral orthorhombic crystals (Up to 2 cm in length).
BI-COLOREDJOHACHIDOLITE
Fig. J55B LWUV Fig. J55C SWUV
Fig. J51. Set of gem quality johachi-dolite arranged for mounting. Reserved for a necklace including a line of colored johachidolite with oval, round, triangular and pear-shape, faceted in brilliant/step with a range of vivid yellow-orange to orange colors, graduating in size; second line with colorless to light green colors, with a center stone of over 1 ct and an ear clip set with round and oval shaped vivid yellow colored johachidolite; two ring sets, a three-membered set of bi-color vivid yellow-orange/ colorless johachidolite and a marquise cut center stone surrounded with a set of yellow johachidolite. The color-less and light green stones are highly fluorescent in UV light. GRS-Ref 5967.
(Pi)
(Py)
2625
Gem Set of Johachidolite and Rare Johachidolite Crystals Physical and Optical Properties and UV-Fluorescence of Johachidolite

Fig. J56. Electron Microprobe at the Swiss Federal Institute of Technology, IMP ETHZ, Zurich, Switzerland (Dr. Eric Reusser)
EXPLANATION OF THE METHOD
The method is used for chemical composition analysis. For analytical purposes, the analyzed mineral must be coated with an electron-conducting layer and positioned in a highly evacuated vacuum chamber. The mineral is bombarded by electrons, which have previously been produced and accelerated in an electron gun. The different atoms in the mineral react to the impacting electrons by creating signals. These signals include X-rays, which can be detected by various kinds of detectors, such as WDS. From the responding signals, the chemical composition can be determined, providing standard materials (materials of known composition or probe standards) are analyzed for comparison. Light elements such as beryllium, lithium or boron are determined by other methods.
* Because of the low concentration of B in the NIST612-standard, any error in the standard resulted in a larger error of the major elements (approx. 10%). For the trends in minor and trace elements, these errors do not alter the conclusions (e.g. on thorium concentrations and REE pattern).
** Normalized to a total of 99.90 oxide wt.%
*** B2O3 assumed as 49.38 wt% stochiometric, from Aristarain and Erd (1977)
Average(8) StDev Average(3) StDev Average(3) StDev Average(18) StDev LA-ICP-MS/EMP
wt.%
n.d.
n.d.
44.5(*)
26.9(*)
27.9(*)
0.050
0.100
0.102
0.029
0.266
99.90
rel.%
-
-
8.6
1.7
3.9
112
86
81
6.4
5.4
wt.%
n.d.
n.d.
51.3
25.2
22.7
0.132
0.061
0.164
0.310
0.175
99.90
rel.%
-
-
1.5
1.3
1.3
150
2.7
29
3.2
3.7
wt.%
n.d.
n.d.
47.0
28.0
24.3
0.004
0.062
0.092
0.094
0.259
99.90
rel.%
-
-
2.6
1.3
4.4
4.7
4.0
9.6
3.5
4.2
wt.%
<0.01
≤0.74
49.38(***)
26.63
22.94
<0.03
0.074
≤0.35
0.165
0.320
99.69
rel.%
-
-
-
0.8
0.8
-
20
-
60
3.1
ratio
-
-
0.95
1.05
1.06
-
0.84
-
0.57
0.81
EMPA Electron Microprobe Analysis
sampleA) SFIT-14.02ct C) GRS-Ref-4583B) GRS-Ref-4584 C) GRS-Ref-4583
LA-ICP-MS analyses in oxide wt%
Oxide (**)
Cl
F
B2O3
CaO
Al2O3
Na2O
MgO
SiO2
FeO
ThO2
Total Oxide
EMPIRICAL FORMULA (Ca1.01Th0.003)(Al0.96Fe0.005)B3.01O7 normalized on the basis of 7 oxygens
(based on EMPA of GRS-Ref 4583, Si concentrations from LA-ICP-MS)
BOX J04 ELECTRON-MICROPROBE ANALYSIS (EMPA)
Tab. J02 Chemical Analyses of Johachidolite
ELECTRON MICROPROBE ANALYSISMajor and minor elements were measured with a JEOL JXA 8200 electron microprobe equipped with five wavelength dispersive spectrometers (WDS) and an energy dispersive detector (EDS). The standards used were natural and synthetic oxides, i.e. synthetic Al2O3 for Al, natural wollastonite for Ca, synthetic F-phlogopite for F and synthetic thorianite for Th. The selected electron beam conditions were a beam current of 20 nA at an acceleration voltage of 15 kV. All measured elements were analyzed for 40 s,
corrected for background and for the dead-time of the detectors. All analyses were further corrected for excitation effects, inter element absorption and fluorescence (Phi-Rho-Z procedure). For the matrix correction a fixed B2O3 of 49.38 wt % was assumed. The special set-up of the instrument allows for the measurement of fluorine (F) - concentrations to a detection limit of 0.1 wt %. Boron was not measured with this method.
2827
Electron Microprobe Analyses: Methods LA-ICP-MS and EMPA Chemical Analyses of Johachidolite

2
4
1
3
56
Fig. J57C
EXPERIMENTALThe ablation spots on the gemstones were placed along its narrow girdle. On high valuable gemstones, several craters of 60 µm were analyzed. For each measurement, the background signal was recorded for 30 s, and then the ablation was active for a period of 4 s. In a second measurement one crater was analyzed at a different location on the girdle during 10 s ablation (Tab. J02, J03). For other research samples, the crater size was increased to 80 µm and the ablation time was increased to 30 s (Tab. J04). NIST 610 glass standard was analyzed with the same parameters as an external standard.
1) Variation in detection limits dependent on concentrations of elements measured and on the variation of measuring conditions. The characteristics of the signals for Na, K, Cu, and Zn of the LA-ICP-MS analyses of GRS-Ref 4584 and to a slighter extent P were absent for the measurement with a 10 s ablation period. Thus, the mentioned elements are considered as contaminations on the surface only.A) From data collection of Prof. D. Günther, ETH Zurich, Johachidolite, 14.02ct, LA-ICP-MS: Measured with NIST612-standard for reference analysisB) GRS-Ref 4584, Johachidolite, 4.62ct, yellow, LA-ICP-MS: NIST610-standard used for reference analysisC) GRS-Ref 4583, Johachidolite, 1.18ct, light green, LA-ICP-MS: NIST610-standard used for reference analysis
ppm<0.72
8.02159300
1219370
119900769
6350
179800<0.53
3.9314.88.086.97
2403n.d.n.d.
2.835.4638.20.24610
850.22
<0.65<0.05
0.67<0.823.10.60
15321.37
rel.%-
861.5
1502.71.32929171.3
-123.0228.23.2
--
35390.7241.03.330
--
58-
8.0403.77.6
ppm0.2737.7
14610026.2376
128800428n.d.
14.4194100
n.d.15.043.014.01.537290.160.551.51
3n.d.0.11177
980.20n.d.
0.200.280.019.130.33
22802.90
rel.%279.52.64.74.04.49.6
-191.3
-233.3189.33.511365355.4
-285.65.733
-8360562.9334.24.0
ppm0.2-0.70.5-1.41.9-3.00.5-2.80.1-0.91.5-1.742-250
9.50.4-1.565-90
0.30.4-1.00.1-0.20.7-2.70.1-0.51.8-7.5
0.05-0.080.40
0.1-0.31.2-0.5
0.10.04-0.050.01-0.020.01-0.020.02-0.03
0.30.02
0.03-0.080.01-0.070.02-0.100.01-0.02
0.003-0.0140.002-0.008
ppmn.d.n.d.
138300370600
147900475n.d.n.d.
192100n.d.n.d.n.d.n.d.n.d.228n.d.n.d.
3.82n.d.n.d.
0.2514062.6n.d.n.d.n.d.
0.56n.d.
6.790.14
23404.95
rel.%--
8.6112863.981
--
1.7-----
6.4--
118--
968.55.0
---
120-
251125.48.8
Tab. J03 Full LA-ICP-MS analysis in ppm including major, minor and trace elements
ppm3449
5.3918
3.421.087.192.10
152.213.610.240.710.07
rel.%5.05.27.96.120209.77.39.01113505374
ppm326592
56181
284.95
233.75
233.276.540.611.800.10
rel.%2.84.82.16.5106.17.55.96.0138.425382.9
ppm252428
47171
366.94
386.53
284.065.880.451.430.09
rel.%6.36.05.62.53.17.23.35.93.77.44.45.61410
ppm0.004-0.0120.004-0.0180.003-0.0130.018-0.0670.022-0.1140.007-0.0230.020-0.1000.003-0.017
0.0210.003-0.0130.008-0.0250.003-0.0150.015-0.1200.003-0.018
LA-ICP-MS: Rare earth element concentrations in ppm
ElementLiBeBNaMgAlSiPKCaScTiVCrMnFeCoNiCuZaGaRbSrYZrSbCsBaHfPbBiThU
Average(8) StDev Average(3) StDev Average(3) StDev
detection limitrange 1)sample A) SFIT-14.02ct B) GRS-Ref-4584 C) GRS-Ref-4583
REELaCePrNdSmEuGdTbDyHoErTmYbLu
BOX 5 LA-ICP-MS CHEMICAL ANALYSIS
EXPLANATION OF THE METHOD The laser ablation technique (LA) uses a 193 nm excimer laser (1) which is focused onto the sample surface via microscope lenses (2). The laser is ablating (carrying away) the material (crater diameter 4 to 80 µm) (3). The mobilized material is suspended in a carrier gas (4) and transported via transport tube into an Inductively Coupled Plasma Mass Spectrometer (ICP-MS) (5). The material/elements (except those that cannot be ionized, such as gases and fluorine) are vaporized, atomized and ionized within the ICP. The created ions are then transferred to the mass spectrometer and separated by their mass divided by charge (5). The detector allows measuring major, minor and trace elements within a single analysis. Very light elements, such as boron, lithium or beryllium, can be detected, along with a large series of other elements at concentrations of less then 1 ppm. The quantification at low concentrations is possible by LA-ICP-MS due to a matrix-independent calibration, e.g. glass standard was used for quantification of johachidolite including special computer analysis and software (6). The use of complementary solid-analysis methods (such as EMPA and XRF) for comparison and validation purposes (e.g. for quantitative measurement of calcium and aluminum) had to be applied (See Tab. J02).
INSTRUMENTLambda Physics GeoLas Q with PE/Sciex Elan 6100 DRC
Fig. J57A
Fig. J57B
Fig. J57A-C. Laser Ablation Mass Spectroscopy (LA-ICP-MS) at the Laboratory for Inorganic Chemistry, SFIT ZH, Switzerland(Prof. D. Günther)
3029
LA-ICP-MS Chemical Analysis of Johachidolite (Continued) LA-ICP-MS Chemical Analysis: Methods

Con
cent
ratio
n C
hond
rite-
Nor
mal
ized
1
10
100
1000
La Ce Pr Nd Sm Eu Gd Tb Dy Ho Er Tm Yb LuElements
mr16a03
mr16a04mr16a05
mr16a06mr16a07
mr16a08mr16a09
mr16a10au25a05
au25a06au25a07
my24a04my24a05
my24a06
ETHZ 14.02ct,measured 2001
GRS-Ref 4584,4.62ct, measuredjan 2007
GRS-Ref 4583,1.18ct, measured 2005
Fig. J58. Rare earth element patterns in three samples of johachidolite (chondrite normalized). Distinct europium anomalies are present. Johachidolite of same origin (GRS-REF 4583 and 4584) have same pattern.
D) GRS-Ref 5667-2, johachidolite, yellow-orange E1) GRS-Ref 5642, johachidolite, yellow-orange partE2) GRS-Ref 5642, johachidolite, colorless part F) GRS-Ref 5646-2, johachidolite, yellow-orange
Calculation of the chemical formula resulted in the following formula ranges: Ca1.05-1.08 Al0.97-1.08 B2.93-2.98 O7(* ) Oxides are normalized to a total of 99.90 wt % to table (NIST610-standard used for reference analysis)
wt.%48.727.823.3
0.0010.0460.0760.0380.001
99.90
rel.%2.31.91.2103.2202.82.9
wt.%48.228.023.5
0.0020.0270.0790.0390.061
99.90
rel.%4.12.52.05134327.979
wt.%47.528.224.1
0.0020.0660.0000.0360.004
99.90
rel.%1.91.20.3242.8373.07.9
wt.%48.127.923.6
0.0020.0660.0990.0420.003
99.90
rel.%2.81.51.35.13.29.15.02.0
Tab. J04 LA-ICP-MS analyses in oxide wt%
ppm5.77
111.304.961.480.091.220.210.940.130.210.020.09
<0.01
StDev rel.%1311111411
8.76.03.75.610123714
-
ppm1130
4.0717
4.790.202.470.290.970.100.140.010.04
<0.01
StDev rel.%18151616141611
6.83.6128.82032
-
ppm2153
7.103011
0.547.550.993.410.380.480.030.110.01
StDev rel.%2927252425262728292931294130
ppm8.18
192.289.522.870.152.340.381.440.200.270.020.090.01
StDev rel.%3.83.94.66.81.711
7.96.1111214323220
LA-ICP-MS: Rare earth element concentrations in ppm
Oxide (*)B2O3CaOAl2O3Na2OMgOSiO2FeOThO2
Total Oxide
Average(4) StDev Average(15) StDev Average(24) StDevsample D) GRS-Ref 5667-2 E1) GRS-Ref 5642 E2) GRS-Ref 5642
yellow-orange yellow-orangeyellow-orange colorless
Average(24) StDev
F) GRS-Ref 5646-2
ppm1352.5913.51.37<0.183.01.9588.12.530.010.090.07
<0.070.930.111.74
StDev rel.%7.2213.2
203-
2.4912.53.7372032
-6.9363.4
ppm49.07.4918.30.43<0.11010.1188.59.010.030.090.09
<0.071.830.1244.5
StDev rel.%80642420
-10443.629593257
-455379
ppm1353.4
11.90.37<0.181.40.1078.04.770.220.092.94
<0.071.620.161.59
StDev rel.%6.5
04.011
-1.6241.04.6421066
-12293.7
ppm1392.487.29n.d.
<0.178.9n.d.
73.03.620.000.13n.d.
<0.071.580.162.21
StDev rel.%8.0173.0
--
1.1-
0.84.8
020
--
13284.2
Full LA-ICP-MS analyses in ppm including major, minor and trace elements ElementBeTiVNiCuGaRbSrYZrSbBaHfPbBiU
REELaCePrNdSmEuGdTbDyHoErTmYbLu
Rare Earth Element Pattern of Johachidolite (Normalized)
CHEMICAL COMPOSITIONS OF
MINERALS INCLUDING JOHACHIDOLITE
The chemical analyses of johachidolite are shown in Tab. J03, J04 and J05. The comparison of the analyses by LA-ICP-MS (average) and those obtained by the electron microprobe analysis are shown in Fig. J79 and Tab.J02. The data are in good agreement (approx. 5 % error). Extending the size of the LA-ICP-MS craters and the ablation time, the difference between the electron microprobe and LA-ICP-MS data diminished (Tab. J04). The microprobe analysis did not determine the boron concentrations. However, Cl and F could be measured along with other elements. Boron, however, could be measured with LA-ICP-MS. Electron microprobe analysis detected very small fluorine concentrations (from 30 analyses, 25 were above detection limit in the range of 0.1-0.78 wt %, Cl-concentrations were below the detection limit of 0.01 wt %). Stoichiometric boron concentrations were assumed for electron-microprobe analysis (Aristarian and Erd, 1977). Stoichiometric boron is confirmed by LA-ICP-MS analysis. The chemical composition of johachidolite is dominated by Ca, Al and B. The entire series of REE could also be measured. Combining the results of the two methods (each within their
limitations), the chemical composition of johachidolite could be determined. The formula was found to be stoichiometric with minor substitutions by Fe and Th (Tab. J02). Regarding minor and trace element, Na-concentrations are found to be below 0.01 wt %. Remarkable thorium concentrations of up to 2300 ppm were present. Relatively large variation in REE, Na, Mg, Be, Th and U were found in johachidolite, which can be correlated to variations in color (Fig. J66) and fluorescence (Fig. J55B,C) and various johachidolite generations (Fig. J73). Based on REE pattern and their concentrations different types of johachidolite can be distinguished. All johachidolite generations showed prominent negative Eu anomalies (Fig. J58, J60 and J62). The johachidolite of 14.02 ct, for example, is depleted in LREE with respect to other samples measured, but indicates also an Eu anomaly and similar HREE concentrations. The REE patterns of a 14.02 ct johachidolite described by Harding et al. (1999) could be produced by competitive formation of other minerals (Fig. J73 and J74). For comparison, the chemical composition of poudretteite, apatite, scapolite, orthoclase, phlogopite and hackmanite was measured (Tab. J05). Almost no REE can be found in poudretteite, orthoclase, phlogopite and hackmanite (Fig. J68 and J69A-C and Tab. J05). However, high concentrations of REE, Th and U were found in
3231
LA-ICP-MS Chemical Analyses of Johachidolite Chemical Analyses of Johachidolite and Accompanying Minerals

Lower Crust
Pegmatite
(4) Negative Eu anomaly
(2) Positive Eu anomaly
No Eu anomalyIn Meteorites
Chondrite
(1) Upper Mantle
Continental Crust
Granitic rocks and pegmatite
(2) (3)
(4)(3)
Fig. J59. Johachidolite rough fragment with color-zoning. Trail of LA-ICP-MS craters is present across the color-zoning, which shows where the chemical analyses were taken. Details on the chemical analysis are shown on Fig. J65, J66 and Tab. J04.
(modified from Stosch, unpubl.)
Series16Series17Series18Series19Series20Series21Series22Series23Series24Series25Series26Series27Series28Series29Series30Series31Series32Series33Series34
Nea
r col
orle
ss
Series1Series2Series3Series4Series5Series6Series7Series8Series9Series10Series11Series12Series13Series14Series15
Vivi
d ye
llow
-ora
nge
colorlesszone
depletion trendfrom
core to rim
0.1
1
10
100
La Ce Pr Nd Sm Eu Gd Tb Dy Ho Er Tm Yb Lu
orangy-yellowcolor zoneC
once
ntra
tion
Cho
ndrit
e-N
orm
aliz
ed
Elements
BOX J06 WHAT ARE REE’S AND HOW IS A NEGATIVE EU ANOMALY FORMED
Rare Earth Elements (REE)-Pattern In Color-Zoned Johachidolite (Profile Fig. J59)
fluorapatite (Fig. J71A,B and Tab. J05). Scapolite contains small concentrations of LREE. The LREE concentrations in scapolite are about one order of magnitude higher than its HREE concentrations (Fig. J68). Its REE concentrations are much lower than those of fluorapatite and johachidolite. This means that the structure of scapolite is not well suited to incorporate REE, and particularly not the large HREE. A negative Eu anomaly such as in johachidolite was also found in fluorapatite (Fig. J70) which also contained high Th concentrations as found in johachidolite. However, much higher U concentrations are found in fluorapatite than in johachidolite (Fig. J69B). The REE concentrations in johachidolite are zoned and correlate with color-zoning. The colorless core of johachidolite crystals contains higher REE concentrations than the colored rim (Fig. J60). Both minerals, johachidolite and fluorapatite, may show similar trends of chemical variation regarding REE and Th (Fig. J69A,B, J70 and J73-74). High REE concentrations correlate with high Th concentrations (Fig. J69A,B). While the core of johachidolite contains high concentrations of Th, the rim is depleted.
Fig. J60. REE pattern as measured in a profile across a color-zoned johachidolite (Fig.J59) with near-colorless and vivid yellow-orange zones (GRS-Ref 5642). Johachidolite found in August 2007 from Pyant Gyi mine (near Mogok). Shift towards lower concentrations of REE was observed in the colored part of the crystal relative to the colorless part.
1. REE-bearing rock forms magma (no Eu anomaly)
2. Accumulation of plagioclase and formation of anorthosite (positive Eu anomaly in rock)
3 Removal of remaining magma to higher levels of the Earth’s crust. Pegmatite derived from anorthosite is depleted in plagioclase (negative Eu anomaly)
4 Further recrystallization of minerals in the pegmatite distributes the remaining REE preferable into some minerals containing Ca2+.
SIMPLIFIED MODEL FOR THEEXPLANATION OF EU-ANOMALIESIN THE CONTINENTAL CRUST
Fig. J61 Typical pegmatite with johachidolite (yellow), apatite (green), scapolite (white), orthoclase (gray), phlogopite (brown) and hackmanite (purple). A negative Eu anomly is found in johachidolite and apatite(See Fig. J73 and J74).
The group of rare earth elements (REE) or lanthanides includes the elements lanthanum (La), cerium (Ce), promethium (Pr), neodymium (Nd), samarium (Sm), europium (Eu), gadolinium (Gd), terbium (Tb), dysprosium (Dy), holmium (Ho), erbium (Er), thulium (Tm), ytterbium (Yb) and lutetium (Lu). La, Ce, Pr, Nd, Sm and Eu can be summarized as light REE (LREE) and the remaining as heavy REE (HREE), due to the increase in their atomic weight in the periodic table from left to right. REE are special in that all 15 have the same outer electron configuration and therefore they tend to have similar chemical behavior. Promethium is not found in rocks as it is unstable. REE occur as 3-valent ions (REE3+) with the exception of Ce which occurs as Ce4+ and Ce3+ and Eu as Eu2+ and Eu3+. While the 3-valent ions (such as Eu3+) are in general more difficult to incorporate into minerals, Eu2+ can be easily incorporated into plagioclase substituting Ca2+ of the same valence. Eu2+ occurs preferentially in magmas under reducing conditions. The ionic radii of the three-valent REE slightly decrease from Ce3+ (LREE) of ca. 1.02 Å to Lu3+ (HREE) of 0.80 Å. Thus, depending on the available space within a crystal structure, some minerals prefer incorporation of LREE whereas others are also able to build in HREE. REE concentrations in rocks are compared to values characteristic of meteorites (values measured are multiplied by factor), which are called chondrite-normalized REE values. If the concentrations of REE in minerals and rocks are measured and chondrite normalized, occasionally a so-called Eu anomaly can be detected. It means that the Eu concentration is much different to the trend displayed by the other REE’s. Eu anomaly is
called “negative” if Eu is depleted relative to the other REE’s. Depletion is generally attributed to Eu’s tendency to be incorporated preferably into plagioclase over other minerals. If a magma crystallizes plagioclase, most of the Eu will be incorporated into this mineral. If the rest of the magma gets separated from its plagioclase crystals and subsequently solidifies, the chemical composition of the final rock will display a negative Eu anomaly. Eu anomalies can also be modified by fluid-rock interactions due to changes in oxidation state (such as oxygen fugacity of the present fluids) and change in formation conditions (such as increasing temperature) where trivalent Eu3+ is reduced to Eu2+.(See also http://en.wikipedia.org/Europium_anomalyor http://www.geokem.com/REE.html
3433
LA-ICP-MS Chemical Profile Across a Color-Zoned Johachidolite REE Patterns in Minerals and Explanation of Europium (EU) Anomaly in Johachidolite

0.1
1
10
100
La Ce Pr Nd Sm Eu Gd Tb Dy Ho Er Tm Yb Lu
Con
cent
ratio
n C
hond
rite-
Nor
mal
ized
Elements
Con
cent
ratio
n in
ppm
Con
cent
ratio
n in
ppm
0
50
100
150
200
250
300
BeNaMgTi
Yellow
1 5 10 15 20 25 30Number of Analyses in Profile
Colorless
0
200
400
600
800
1000
FeThUNa x 10
Fig. J65. Chemical analyses across a color-zoned johachidolite, showing the concentrations of light elements Be, Na and Mg. Be and Mg values are highest in the yellow-orange zone. Na does not follow this trend.
Fig. J66. Chemical analyses across the same color-zoned johachidolite (See also Fig. J65), showing the concentrations of the elements Fe, Th, U and Na. Th, U and Na are highest in the yellow-orange zone. Fe does not follow this trend. Picture of measured sample is inserted. Note presence of craters from LA-ICP-MS analyses in a profile across the color-zoning.
Chemical Profile Across Johachidolite Color-Zoning
Fig. J65
Fig. J66
5646-2 S1
5646-2 S2
5646-2 S3
5646-2 S4
5667-2 S1
5667-2 S2
5667-2 S3
5667-2 S4
Fig. J63. 1.5 cm large johachidolite crystal fragment with color-zoning (colorless core and yellow rim). In viewing direction, the crystal crown is broken and the interior color-distribution of this particular johachidolite becomes visible. Sample GRS collection.
Fig. J64. Oscillating color-zoning in a johachidolite rough fragment, with alternating colorless, yellow and orange zones. Sample about 1 cm in width. GRS collection.
Fig. J62. REE pattern in two vivid yellow-orange johachidolite samples (5646-2 and 5667-2), total 4 analyses each (analyses S1 to S4, see legend). 5667-2 is slightly more intense and slightly more orange in color. This difference in color is correlated with variations in REE values. Both samples show a pronounced negative Eu anomaly. Samples are from the production of August 2007 (Pyant Gyi mine)
Rare Earth Elements (REE)-Patterns in Vivid Yellow-Orange Johachidolite
3635
REE Patterns in Johachidolite and Color-Zoning Chemical Variation in Johachidolite

0
50
100
150
200
250
Con
cent
ratio
n in
ppm
LREE
HREE
Th
Be
U
Con
cent
ratio
n in
ppm
0
100
200
300
400
500
600
700
800
4 Phlogopite(Ref-5631)
4 Hackmanite(Ref-55775-2)
6 Orthoclase(Ref-5642)
4 Orthoclase(Ref-5632)
5 Scapolite(Ref-5636)
5 Fluor-/Chlorapatite
5 Fluor-/Chlorapatite
18 ColorlessJohachidolite(Ref-5642)
15 Yellow-Orange
Johachidolite(Ref-5642)
4 Yellow-Orange
Johachidolite(Ref-5646-2)
4 Yellow-Orange
Johachidolite(Ref-5667-2)
Con
cent
ratio
n in
ppm
0
20
40
60
80
100
120
140
0
1
2
3
4
5
6
7
8
9
La Ce Pr Nd Sm Eu Gd Tb Dy Ho Er Tm Yb Lu
Con
cent
ratio
n C
hond
rite-
Nor
mal
ized
LREE HREE
563256325632
564256425642564256425642
5636gla5636gla5636gla5636gla5636gla
5631_mica5631_mica
orthoclase
orthoclase
scapolite
phlogopite
Rare Earth Elements (LREE, HREE), Th, U and Be-Concentrations in Pegmatite Minerals
Rare Earth Elements (REE)-Pattern In Various Minerals Accompanying Johachidolite
Fig. J67. Rock specimen with scapolite on the left and orthoclase on the right, as well as hackmanite (purple), phlogopite and johachidolite (orange). Orthoclase is formed prior to scapolite and can be found as inclusions in scapolite (arrow). GRS-Ref 5630.
Fig. J68. REE (Rare Earth Elements) -patterns (chondrite normalized) in 3 minerals accompanying johachido-lite, orthoclase, scapolite and phlogopite (total 17 analyses). Very low REE values are found in orthoclase and phlogopite. Ce and Eu are below detection limits in orthoclase and phlogopite. In scapolite, a REE pattern is found with a pronounced increase in LREE and depletion of HREE (L abbreviation for light and H for heavy).
Fig. J69A-C. Concentrations of LREE and HREE (A), Th and U (B) and Be (C) in various minerals (phlogopite, hackmanite, orthoclase, scapolite, fluorapatite and johachidolite) which are found in the pegmatite containing johachidolite. LREE and HREE are mainly found in fluorapatite and johachidolite, Th is concentrated in johachi-dolite and fluorapatite, U in fluorapatite and Be is dominantly concentrated in certain generations of johachidolite.LREE = total sum of La + Ce + Pr + Nd + Sm and HREE = total sum of Eu + Gd + Tb + Dy + Ho + Er + Tm + Yb + Lu. The number in front of the mineral name refers to the number of averaged analyses.
Fig. J69A
Fig. J69C
Fig. J69B
3837
Rare Earth Elements (REE)-Pattern In Various Minerals Accompanying Johachidolite Rare Earth Elements (LREE, HREE), Th, U and Be-Concentrations in Pegmatite Minerals

1
10
100
1000
La Ce Pr Nd Sm Eu Gd Tb Dy Ho Er Tm Yb Lu
Series1Series2Series3Series4Series5Series6Series7Series8Series9Series10
Con
cent
ratio
n C
hond
rite-
Nor
mal
ized
Elements
0
100
200
300
400
500
600
700
800
900
La Ce Pr Nd Sm Th U
Con
cent
ratio
ns in
ppm
Selected Elements
Analyses2Analyses3Analyses4Analyses5Analyses6
0
100
200
300
400
500
600
700
800
900
1000
La Ce Pr Nd Sm Th U
Con
cent
ratio
ns in
ppm
Selected Elements
Analyses2Analyses3Analyses4Analyses5Analyses6
Fig. J71A,B. Chemical analyses of fluorapatite regarding LREE , Th and U as measured in two different positions of the same crystal (Fig. 71A is position one, 71B is position two, total 10 analyses). It is shown that the increase in LREE in fluorapatite correlates with the increase in Th and U. Detailed REE patterns see Fig. J70. Different chemical compositions are found in different parts of the fluorapatite. Higher LREE values are correlated with higher U and Th values.
Fig. J70. REE pattern (chondrite-normalized) for different chemical analyses of the same fluorapatite crystal (measured on different opposite positions of a broken crystal). Chemical variations are related to variations of chemical compositions in various growth zones in the same crystal. Note that some of the growth zones in fluorapatite have equal LREE and HREE levels (after chondrite normalization), while other growth zones have higher LREE than HREE levels. All different sectors in fluorapatite have similar HREE. All different apatite growth generations possess a prominent negative Eu anomaly. Similar trends are found in different johachidolite generations (See Fig. J73).
wt.%--
0.0260.908.2722.88.37
54.7(**)0.006
---
100.00
rel.%--
5.691.022.641.200.85
-6.25
--
5(*)
wt.%--
0.05015.3
0.03619.01.5464.0
0.004---
100.00
rel.%--
46.28.8765.23.6852.1
-13.3
---
wt.%-
3.770.0680.015
55.6(**)0.1820.1620.603
36.30.0913.2(*)
-100.00
rel.%--
14.027.8
-71.08.9334.30.5716.0
--
wt.%-
3.770.0640.016
55.6(**)0.1330.1510.504
37.00.0822.7(*)
-100.00
rel.%--
21.345.3
-16229.950.21.1226.7
--
wt.%7.32
---
0.81630.121.0
36.7(**)--
4.14(*)-
100.00
rel.%----
40.93.7712.3
-----
Tab. J05 LA-ICP-MS analyses in oxide wt%
Tab. J05 LA-ICP-MS analyses with details onstandardization and normalization (See page 40)
Rare Earth Elements (REE)-Patterns in Fluorapatite
ppm1.26
0.1940.8580.2380.0280.4330.0810.2530.0940.1950.0280.3400.030
StDev rel.%19414216315695.4139128190129159124
0127
ppm2.644.291.42
0.3260.0590.2000.0250.1240.0210.0470.0080.0450.002
E) Hackmanite: NIST610-standard used for reference analysis, Si as internal standard. Total Cl and F by difference to 100%
F) Scapolite: NIST610-standard used for reference analysis, Total normalized to 95 wt %. Cl + F + CO2 + H2O by difference to 100%
G) Orthoclase: NIST610-standard used for reference analyses, normalized to total of 100 wt %
H) and I) Fluorapatite: NIST610-standard used for reference analysis, Ca as internal standard
Minerals E) to I) Identified by Raman spectroscopy (See Fig. 28B-E)
StDev rel.%3.894.035.9215.522.142.728.920.925.124.117.439.7141
ppm0.5780.0610.4930.1980.0280.2180.0360.2520.0420.1350.0240.1870.030
StDev rel.%45.332.551.462.832.282.082.784.393.210891.793.187.5
ppm38.288.150.316.1
0.86615.72.5914.02.56
6.20.833
5.010.612
StDev rel.%15.816.012.912.68.7512.29.5611.311.011.011.811.010.4
OxideCl (*)F (*)B2O3K2OCaOAl2O3Na2OSiO2P2O5ThO2Cl+F+OHCl+F+CO2+H2OTotal Oxide
Average(4) StDev Average(5) StDev Average(6) StDevsample
Average(5) StDev Average(5) StDev
ppm35.680.018.26.68
bd28.40.26
<0.7518.58.531900.620.270.01
nd0.980.5428.70.0225.70.090.160.02
StDev rel.%10.45.6952.37.76
-5.6610.8
-1.784.021.9014.415282.7
-5.2914.023.870.95.4835.529.186.7
ppm19.615632.71.77
bd4.62
bd3.7224.532671.11.322.220.25
<0.081.4155.548.20.0649.40.232.610.31
StDev rel.%96.746.210253.8
-37.0
-1248.566.8511.397.997.3149
-29.960.467.549.110021.7119
70.1
ppm3.43199608
bd0.321260.370.742.170.7793.868.212.11.260.100.9617.81.340.086.010.50715488
ppm47.610459.518.91.0117.82.9715.72.906.94
0.9145.51
0.652
ppm4.362107920.340.341300.500.272.510.8910476.314.31.480.162.7714.82.400.106.130.51796549
StDev rel.%42.814.049.44.035.212.3438.836.819.338.62.7311.912.027.891.312736.396.039.712.48.4816.08.50
StDev rel.%20.022.118.316.713.715.314.713.612.612.712.310.49.67
StDev rel.%83.121.3114
-14.25.2822.533.215.456.614.312.516.810850.429.7123118
38.028.613.726.729.7
ppm26.30.06279
bdbd
17.7bd
<0.7534.06.061372.49
<0.08<0.03
0.182.153.3281.9
bd0.350.110.000.24
StDev rel.%22.35.05139
--
23.5--
2.3426.299.9195
--
1.8613.6131117
-66.523.886.6162
LA-ICP-MS of trace elements in ppmElementBeBMgTiVFeNiCuGaRbSrYZrNbMoSnSbBaHfPbBiThU
REELaCeNdSmEuGdTbDyHoErTmYbLu
I) FluorapatiteE) Hackmanite F) Scapolite G) Orthoclase H) Fluorapatite
Fig. J71A
Fig. J71B
LA-ICP-MS: Rare earth element concentrations in ppm
4039
LA-ICP-MS Chemical Analyses of Fluorapatite LA-ICP-MS Chemical Analyses of Hackmanite, Scapolite, Orthoclase and Fluorapatite

Fluorapatite
ScapoliteCon
cent
ratio
n C
hond
rite-
Nor
mal
ized
1
0.1
10
100
1000
La Ce Pr Nd Sm Eu Gd Tb Dy Ho Er Tm Yb Lu
Elements
Con
cent
ratio
n C
hond
rite-
Nor
mal
ized
1
0.1
10
100
1000
La Ce Pr Nd Sm Eu Gd Tb Dy Ho Er Tm Yb Lu
Elements
TYPE 1Johachidolite 4584Johachidolite 4583
TYPE 2Johachidolite14.02ct
TYPE 3Johachidolite5642 Colorless
TYPE 4Johachidolite 5642Yellow-orangeJohachidolite 5667Yellow-orange
1
2
3
4
Fig. J72B. Apatite inclusion found in the interior of a broken johachidolite crystal. GRS-Ref 5968.
Fig. J72A. Johachidolite (yellow-orange) in rock matrix adjacent to green apatite. Both embedded in scapo-lite. Origin: Pyant Gyi, Burma, Found in August 2007. Image size 2cm. GRS-Ref 5634.
Fig. J73. REE patterns of various generations of johachidolite. They are subdivided according to ratio of LREE (La to Sm) to HREE (Eu to Lu). Type 1 is high in LREE in comparison to HREE. Type 2 is LREE depleted with HREE unchanged, type 3 is medium depleted in LREE and depleted in HREE and in type 4 both LREE and HREE are depleted. All different types display a negative Eu anomaly. Competitive formation of scapolite and apatite (Fig. J74) may be used to explain the trend of LREE and HREE depletions. Scapolite formation causes the trend depicted by the red arrow. Competitive formation of fluorapatite may cause depletion of both LREE and HREE in johachidolite (green arrow).
Fig. J74. Simplified REE patterns of different fluorapatite generations and scapolite (Fig. J68 and J70). Note that REE patterns in the same fluorapatite crystal are characterized by two different types. Type 1 has high LREE and medium HREE and type 2 has medium LREE and medium HREE. Scapolite has low LREE and very low HREE content. Competitive formation of fluorapatite and scapolite with johachidolite can explain the formation of different johachidolite types as shown on Fig. J73 as well as fluorapatite (red arrow). Formation of large amounts of scapo-lite (up to 30% of the rock) may be respon-sible for consuming significant amounts of LREE in the pegmatite.
Classification of Johachidolite Using Rare Earth Elements (REE)-Patterns
Rare Earth Elements (REE)-Pattern Classification of Apatite and Scapolite
CLASSIFICATION OF JOHACHIDOLITEBased on detailed chemical analyses, it is possible to classify johachidolite into 4 different types (Fig. J69 and J73).
Type 1: High LREE, medium HREE, high Th Color: Light green and light yellow
Type 2: Medium LREE, medium HREE and high ThColor: Yellow
Type 3: Medium LREE, low HREEColor: Light green and colorless
Type 4: Low LREE, low HREE, very low Th, and strongly increased Be-concentrationsColor: Vivid yellow to vivid orange
FORMATION OF DIFFERENT JOHACHIDOLITE GENERATIONS (INTERPRETATION)Early formed johachidolite contains high concentrations of REE, Th and U. At a later stage of pegmatite chemical differentiation, and the formation of johachidolite type 2, scapolite was formed. Scapolite consumed preferably LREE over HREE. This caused a depletion of LREE in the remaining
pegmatite melt and fluid. Johachidolite that formed during scapolite precipitation was therefore relatively depleted in LREE while the HREE are still relatively high (Type 2, Fig. 73). The same trend was found in fluorapatite (Fig. J74). With continuous solidification of the pegmatite, apatite continued to grow, further consuming LREE as well as HREE equally, and consumed available Th and U in the system. Late stage johachidolite type 3, which was formed during or after fluorapatite, became further depleted in LREE, HREE, Th and U (Type 3, Fig. J73). With further growth of johachidolite, this trend became more pronounced (Type 4, Fig. J73). The prominent negative Eu-anomalies, however, remained visible in all johachidolite generations as well as in fluorapatite. It represents a “fingerprint” of the earlier magmatic evolution history of the pegmatite’s parent magma which cannot be extinct (Box J06). Be is preferably incorporated in johachidolite in comparison to the other minerals present (Fig. J69C). As no other Be-minerals are formed in the pegmatite, Be concentrations increase in type 3 and 4 johachidolite generations. This increase is correlated with the orange color of johachidolite and a distinct and dramatic change in the formation conditions.
Fig. J72A Fig. J72B
4241
Classification of Johachidolite Classification of Johachidolite, Fluorapatite and Scapolite Using REE-Patterns

-0.1
2
4
6
8
10
12
14
16
18
2020.8
4000 2800 2400
%T
3727
3622
3194
3380
2691
3545
3694
3600 3200
GRS-Ref5673GRS-Ref4584GRS-Ref5648GRS-Ref5671
cm-1
0100020003000400050006000700080009000
0 500 1000 2500 3000 3500 4000
Ram
an In
tens
ity
2010
.6
2065
.2
2351
.6
2558
.6
2747
.5
2910
.8
3297
3494
.6
3072
.9
3696
.638
59.13651
.7
1500 2000cm-1
GRS-Ref 4584
0
200
400
600
800
1000
1200
200 400 600 800 1000 1200 1400
Ram
an In
tens
ity
285.
632
5.7 34
7.4
375.
7
479.
643
6.9
685.
7
749.
7
938.
997
1.6
1111
.8
119145
5
527.
1
589
668
833.
7
cm-1
GRS-Ref 4584
GRS-Ref 4583
433
455
476
664
587
830 2032
2507
2556
2746
2843
2908
3070
3124
3288 34
95
3846
39303647
3750
3701
3991
cm-1
0
2000
4000
6000
8000
10000
12000
14000
16000
18000
20000
0 500 1000 1500 2000 2500 3000 3500 4000
Ram
an In
tens
ity
200
400
600
800
1000
1200
1400
1600
200 400 600 800 1000
Ram
an In
tens
ity
cm-1
346.
937
5.1
452.
847
7.5
523.
3
588.
4
831.
7
935.
3
665.
9
436.
3
FTIR INFRARED SPECTROSCOPYInfrared Spectroscopy in the 7800-370 cm-1 range was performed in transmission mode using a Perkin Elmer Spectrum One FTIR-Spectrometer (Fourier-transformed infrared) with four samples of johachidolite recording two scans at 4 cm-1 resolution. The FTIR spectra are shown on fig. J75.The IR Spectrum is dominated by very complicated series of asymmetric transmissions and absorption peaks. The spectrum resembles an overlapping of absorption and fluorescence peaks. No indications for OH-related absorption lines were found.
RAMAN SPECTROSCOPYRaman spectra were obtained using a Dilor Labram micro-Raman system coupled to an external Ar-ion laser setup at a wavelength of 488 nm. Spectra were collected by an Olympus microscope. The optical setup allows confocal microscopy giving a spatial resolution of 4 µm. Spectra were collected by accumulation of 6 individual spectral frames, each acquired during 60 s. Characteristic Raman shifts in wave numbers (cm-1) are shown on fig. J76A-C. The
errors are within 2cm-1. We found 12 strong Raman lines in the region between 200 and 1000 cm-1 in both samples (286, weak 326, 347, 375, 436, 455, 478, 525, 588, 667, 686, weak 750, 832, 940). They do match to the lines given by Harding et al. (1999) for the johachidolite of 14.02 ct (within their errors of ± 2cm-1) which is the same as our sample SFIT-14.02 ct (Tab. J02 and J03). Therefore, the 3 samples tested by chemical analyses (Tab. J02 and J03) were all measured by Raman spectroscopy in this work or in the literature (Harding et al, 1999). As they all have the same Raman spectrum, they have obviously the same crystal structure. In addition, seven strong lines were found in the range between 2000 to 4000 cm-1 (Fig.J76a-c) (weak 1112, weak 1191, 2032, weak 2155, weak 2352, 2400, 2508, 2557, weak 2747, weak 2843, weak 2910, 3072, weak 3124, weak 3292, weak 3495, 3650, weak 3700, 3750, weak 3852, weak 3930, weak 3991) which have not been reported by Harding et al. (1999). The lines above 2400 cm-1 including the strong 2508 line are most probably fluorescence peaks.
FTIR-Spectra of Johachidolite
Fig. J75. Infrared spectra showed only characteristic lines in the range of 2000 to 3000 wave numbers. Absorption lines are indicated which are followed by transmission peaks. Total absorption occurs at high wave numbers (Graph 04).
Fig. J76A-C Raman spectra of two johachidolite crystals (4584 and 4583), which correspond to the two samples applied for chemical composition measuerement (Tab. J02). The sample used for crystal-structure analysis is No. 4583. Johachidolite has a very distinct Raman spectrum in the r range between 200 and 1000 cm-1 as well as in the range between 2000 and 4000 cm-1. The two samples show identical Raman spectra (with differences in intensity of peaks due to orientation effects).
Raman Spectra of Johachidolite
Fig. J76A
Fig. J76B
Fig. J76C
4443
FTIR and Raman Spectroscopy of Johachidolite Raman Spectrum of Johachidolite

Con
cent
ratio
n in
wei
ght %
20.5
21
21.5
22
22.5
23
23.5
24colorlessyellow-orange
bi-colored johachidolite
1 2 3 4 5 6 7 8 9 10 11 12
CaOAl2O3
0
0.05
0.1
0.15
0.2
0.25
Number of Analyses in Profile
GRS- Ref 5671GRS- Ref 5673
0.75
375 450 525 600 675 750
1.5
2.25
3
0
Abs
orba
nce
Wavelength (nm)
SiO2
Na2O
ThO2
MgOTiO2
Fig. J78. Backscattered Image (BSE) of a bi-colored faceted johachidolite (left colorless and right orange). The orange colored part appeared darker in the BSE image. This indicates higher concentrations of lighter elements in the orange colored part of the crystal. Chemical profile see Fig. J79 (by Caricchi, IMP, ETH ZH, one crack in image retouched).
UV/VIS SPECTRUM
The spectrum was recorded with a multichannel TDAS spectrometer with 1024 diode arrays and an 80 W xenon lamp. The resolution is approx. 0.8 nm. The range measured is from 290 to 1024 nm.
RESULTS
No sharp absorption lines are found. General increase of the absorption spectrum towards the blue region of the visible spectrum was observed. There is a shoulder at approx. 380 nm in a near colorless johachidolite (GRS-Ref 5673). Such a shoulder was also reported by Harding et al. (1999). The orange colored sample (GRS-Ref 5671) however, did not show this shoulder and was characterized by a gentle increase of the absorption in the blue region towards the UV-region. Total absorption is found in the UV-region below approx. 375 nm in the yellow-range and slightly lower in the colorless samples. The spectrum resembles the one of Be-treated orange sapphires (Peretti and Günther, 2005).
TRACE ELEMENTS AND COLOR
Minerals which are formally free of transition metal cations, such as johachidolite, are in general colorless and if they are colored, specific reasons must be considered. Very often electronic transitions in trace elements (REE, Th, and Fe) are responsible for the mineral color. Thus, a crystal structure analysis is not the appropriate tool to unravel such causes for color because trace concentrations cannot be localized. On the other hand, exact knowledge of the structural arrangement allows a crystal chemist to make sugges-tions of possible substitutions, which may be the origin of color. Araki and Moore (1962), in their first structural study of johachidolite, suggested that the highly unusual structure of johachidolite could also be fulfilled by the hypothetical composition YAl[BeB2O7]. In other words one B3+ in the tetrahedral sheet is replaced by a small tetrahedral ion like Be2+ or Mg2+ and charge balance is achieved by a three-valent ion (e.g. Y or rare earth elements) with an ionic radius similar to Ca2+. To clarify whether such a substitution may be responsible for the color in johachidolite, we plotted Be and REE concentrations of different colored johachidolites (Fig.
J80 ) and measured a profile across a color-zoning in a single johachidolite (Fig. J65). As it can be seen on Figure J80, the correlation is opposite, higher REE are correlated with lower Be, Mg and/or Be + Mg (total) values. Therefore, the question remains how Mg and Be are charge-balanced in johachidolite. Several other alternatives may be considered. If Mg replaces Al and on the other hand, Be replaces B positions, Si and/or P should be found on tetrahedral positions of B. Fig. J82 shows that no correlation of Mg + Be with Si can be found. P was measured for one yellow colored sample only (Tab. J03). It can be expected from the preliminary data that also the P concentrations are too low for a possible charge compensation of Mg2+ and Be2+. Another possibility to charge balance Mg and Be, is the replacement of Al by Ti in octahedral positions. The variation of Ti-concentrations across a color-zoned johachidolite showed that Ti-concentrations decrease along with REE in the colored section of johachidolite (Fig. J65). Therefore, a charge-compensation by Ti can be ruled out as well. Another possibility for charge-compensation of Be and Mg ions is possible by F which
Fig. J79. Electron-microprobe analyses in a profile across a color-zoned johachidolite (6mm long).Note: Higher Ca, Al and lower Th concentrations (expressed as oxides) are found in the yellow-orange colored part of johachidolite. No trends in relation to the color-zoning could be found for Mg, Na, Ti and Si. Cl and F concentrations were below detection limits (Cl <0.01 wt.% and F <0.1 wt.%).
Fig. J77. UV-VIS absorption spectra of two johachidolites, colorless (GRS-Ref 5673) and orange (GRS-Ref 5671). No absorption lines are found in the visible region of the spectrum with the exception of a 380nm shoul-der. The orange johachidolite showed an absorption spectra with a gentle increase towards lower wave length of the spectrum with no shoulder at 380nm.
UV/VIS Spectra of Johachidolite Chemical Profile Across a Color-Zoned Johachidolite
4645
UV/VIS Spectroscopy of Johachidolite Origin of Color in Johachidolite

0
20
40
60
80
100
120
140
160
180
200
0
20
40
60
80
100
120
140
160
180
200
0 20 40 60 80 100 120 140 160 180Be in ppm
REE
+Y (T
otal
) in
ppm
Yellow-OrangeJohachidolite(Ref-5667-2)
Yellow-OrangeJohachidolite(Ref-5642)
ColorlessJohachidolite(Ref-5642)
Yellow-OrangeJohachidolite(Ref-5646-2)
Yellow-OrangeJohachidolite(Ref-5667-2)
Yellow-OrangeJohachidolite(Ref-5642)
ColorlessJohachidolite(Ref-5642)
Yellow-OrangeJohachidolite(Ref-5646-2)
0 100 200 300 400 500 600Mg+Be in ppm
REE
+Y (T
otal
) in
ppm
Yellow-OrangeJohachidolite(Ref-5667-2)
Yellow-OrangeJohachidolite(Ref-5642)
ColorlessJohachidolite(Ref-5642)
Yellow-OrangeJohachidolite(Ref-5646-2)
0
100
200
300
400
500
600
700
800
900
1000
0 100 200 300 400 500 600 700 800 900Si in ppm
Be+
Mg
(Tot
al) i
n pp
m
Fig. J81. Concentrations of the sum of Be + Mg and the sum of Y + REE (in ppm) in johachidolite of different colors (colorless and vivid yellow-orange). Note that colored johachidolite is depleted in sum of REE +Y and enriched in the sum of Mg + Be (See also Tab. J04).
Fig. J82. Concentrations of the sum of Be + Mg, and Si (in ppm) in johachidolite of different colors (colorless and vivid yellow-orange). Note that colored johachidolite is enriched in the sum of Be + Mg with no correlation to Si (See also Fig. J79 and Tab. J04).
may replace one corner of a B tetrahedron (Fig. J83). By this charge balance mechanism using an anion instead of a cation, one B reduces its coordination from 4 to 3. By this mechanism, it would be possible to charge-balance Be2+ and Mg2+. However, instead of F we could also consider OH in johachidolite. However, no indications for that were found by infrared spectros-copy (absence of prominent OH-specific lines, Fig. J75). The presence of F in johachidolite has been detected during EMPA analysis (Tab. J02). The special setup of the instrument allowed for a detection limit to 0.1 wt %. Thirty analyses were conducted on the light green sample (Fig. J79, Type 1, Fig. 73). It was found that F concentrations did fluctuate in the sample. In 1/3 of the measurements, F concentrations were below detection of 0.1 wt %, in another 1/3 of the measure-ments, the concentrations were around 3500 ppm and only in one spot the analyses reached 7500 ppm. Another color-zoned johachidolite was also measured for F by electron-microprobe analyses (See Fig. J79, Type 3 and 4, Fig. 73). In this set of analyses, F concentrations were below the detection limits. Because F concentrations of orange colored johachi-dolite could not be determined to concentrations below 0.1 wt. %, it cannot be decided at this point whether F is present in orange colored johachidolite (Type 4, Fig. 73) and therefore it is open whether the level of F concentrations is high enough in orange colored joha-chidolite to charge balance the amount of Be and Mg. In case of absence of Be and Mg, F could also be
theoretically compensated by Ca vacancies. The pres-ence of F in the pegmatite is also evidenced by fluor-apatite, which was found in association to johachidolite (Fig. J72A-B).Other chemical substitutions not related to color are the high thorium concentrations found during the laser ablation mass-spectroscopic analyses of the gem mineral. Thorium usually occurs as Th4+ in minerals, and has a radius similar to Ca2+. One possible mecha-nism of thorium incorporation in johachidolite is that Th4+ substitutes in one Ca site and for charge balance a second Ca site remains empty or two Ca sites are occupied by Na. An alternate substitution mechanism is charge balance of Th4+ by an octahedral Al vacancy. From the detailed chemical profile through a color-zoning in johachidolite it was possible to obtain further support for one of the possible substitutions. For this purpose, we measured the Na concentrations across a color-zoning in johachidolite (Fig. J66). As it can be seen, an increase in Th concentrations is correlated with an increase in Na concentrations. However, this relation is only of qualitative nature. Thus, the high Th concentration may suggest additional types of substitu-tions. As higher Th-concentrations are correlated with lower Al and lower Ca-concentrations (See Fig. J79), the other substitutions may occur as well.Na-concentrations are correlated with the color-zoning in the following way (Fig. J66). Highest Na-concentrations are found in the colorless part of the crystal.
Fig. J80. Concentrations of the sum of Y + REE and of Be (in ppm) in johachidolite of different colors (colorless and vivid yellow-orange). The material is from the same mining spot and mining period in August 2007 from the Pyant Gyi mine. Note that colored johachidolite is depleted in sum of REE +Y and enriched in Be (See Tab. J04)
Chemical Variation of REE, Y and Be in Johachidolite (LA-ICP-MS) Chemical Variation of REE, Y, Be and Mg in Johachidolite (LA-ICP-MS)
Chemical Variation of Be, Mg and Si in Johachidolite (LA-ICP-MS)
4847
Crystal Structure and Crystal Chemistry Crystallography of Johachidolite

Aluminum centeringoctahedra
Aluminum centeringoctahedra
Calcium (Ca)
Boron (B)centering
red oxygentetrahedra(1) and (2)
Boron (B) Silicon (Si)
(1)(2)
Boron (B) Silicon (Si)
Calcium(Ca) Calcium
(Ca)
BOX J07: CRYSTALLOGRAPHYMINERAL GROUP: BORATE WITH
LAYER STRUCTURE FORMEDBY [BO4] TETRAHEDRA
MINERAL NAME: JOHACHIDOLITE
CHEMICAL FORMULA: CaAl[B3O7]
CRYSTAL SYSTEM: Orthorhombic
SPACE GROUP: Cmma
a = 7.967(2), b = 11.723(3), c = 4.3718(5) Å
(a, b, c = unit-cell dimensions)
α = 90° β = 90° γ = 90°
(α, β, γ = angles of the unit-cell)
V = 408.32(14) Å3
(V = Volume of unit-cell, Å = in Ångstrom, 10-8 cm = 1Å)
Z = 4
(Z is number of formula units per unit-cell)
Details see Kadiyski et al. (in prep.)
Fig. J83. Sheets formed by BO4 tetrahedra (red) in johachidolite seen edgewise. The sheets are connected by Al octahedra (yellow) sharing edges with BO4 tetrahedra from adjacent sheets above and below; thus strong bonds between the sheets exist. In addition, Ca ions (blue spheres) strengthen the inter-layer linkage. Although, the structure of johachidolite is not based on closest oxygen packing, the ionic arrangement leads to very dense packing responsible for the high average refractive index of 1.720. The strong bonds between the sheets are responsible that no obvious cleavage parallel to the sheets can be observed.
Fig. J86. Structurally related to johachidolite is okayamalite Ca2[SiB2O7], a member of the melilite group. This tetragonal mineral has also a tetrahedral sheet but formed by pairs of borate tetrahedra (bow ties, shown in red), which are pin-wheel like linked to a central SiO4 tetrahedron (green). Interlayer Ca ions (blue spheres) link the superposed tetrahedral sheets.
Fig. J85. Sheets formed by BO4 (red) and SiO4 (green) tetrahedra in okayamalite seen edge-wise.Ca ions link adjacent tetrahedral sheets.
(All crystal structure images are produced using the software ATOMS V6.0 from Shape Software, Kingsport, TN 37663 USA)
Johachidolite Structure Model A
Okayamalite Crystal Structure Related to Johachidolite
Johachidolite Structure Model B
Fig. J84 Tetrahedral sheet in johachidolite: vertical pairs of BO4 tetrahedra (bow ties) with apices up alternate with apices down. These bow ties are connected by an additional BO4 tetrahedron, which is seen edge-wise linking the bow ties to a corrugated sheet. All BO4 tetrahedra are in red. The sheets are connected by Al (yellow spheres) visible through four-membered rings. In addition Ca (blue spheres) occupies interlayer positions.
CRYSTAL STRUCTURE AND CRYSTAL CHEMISTRY OF JOHACHIDOLITE AND OTHER BORATESIn general, boron occurs in two oxygen coordinations: (1) as three-coordinated anion [BO3]3-, comparable to triangular carbonate and nitrate groups, and (2) as four-coordinated anion [BO4]5- with tetrahedral coordination similar to silicate units. The structure of many borate minerals is characterized by a combination of linked borate tetrahedra and triangles contributing to very complex crystal chemistry. However, the major borate gem-minerals danburite Ca[B2Si2O8] and poudretteite KNa2[B3Si12O30] found together with johachidolite north-east of Mogok show only tetrahedral boron. Danburite and poudretteite may be classified as tetrahedral framework structures, with a framework formed by corner-sharing silicon and boron tetrahedra (Fig. J87A,B and Tab. J06). Alkali (K+, Na+) and earth alkali cations (Ca2+) are
occupying structural voids and /or channels within these condensed frameworks. Poudretteite is also a member of the milarite-group of minerals and its structure may also be described by six-membered double-rings of SiO4 tetrahedra linked by BO4 tetrahedra to a framework. In johachidolite CaAl[B3O7] borate tetrahedra are only linked in two dimensions forming a tetrahedral layer structure. Johachidolite is the one and only mineral with an uninterrupted, corrugated sheet formed by only BO4 tetrahedra (Fig. J85). There are also no synthetic analogs in this structural class of borates. The single tetrahedral sheets are strongly bonded to each other by the interlayer-like cations Al and Ca. In particular, AlO6 octahedra sharing edges with BO4 are responsible for strong bonds perpendicular to the borate sheet, thus the mineral has no pronounced cleavage, which one would expect for a layer structure. The ionic arrangement in the structure of johachidolite is very dense, which is responsible for its high mean refractive index of 1.720 and in this respect it is even similar to spinel MgAl2O4 with a closest-packed
structure.Johachidolite has some structural similarity to the mineral okayamalite Ca2[B2SiO7], which is a member of the melilite group. The structure of okayamalite (Giuli et al., 2002) is also characterized by a tetrahedral sheet but formed by a combination of borate and silicate tetrahedra linked by interlayer Ca thus no recognizable cleavage results (Fig. J85 and J86).
5049
Crystal Structure and Crystal Chemistry of Johachidolite Crystal Structure and Crystal Chemistry of Johachidolite and Comparison to Okayamalite

In the hexagonal crystal structure of poudretteite six-membered double rings of SiO4 tetrahedra (green) alternate with twelve-membered rings formed by edge-sharing of strongly flattened NaO6 octahedra (orange) with small BO4 tetrahedra (red). The center of the twelve-membered ring is occupied by K (magenta). The structure may also be interpreted as tetrahedral framework formed by corner-sharing of the Si12O30 units (green) with boron tetrahedra (red). The same structure type as found for poudretteite is known for minerals of the milarite-osumilite group.
Fig. J87A. Slightly inclined projection of the poudretteite structure parallel to the hexagonal axis passing through the center of the six- and twelve-membered ring.
Fig. J87B. Slightly inclined projection of the poudretteite structure perpendicular to the hexagonal axis passing through the center of the six- and twelve-membered ring.
Average(5) StDev Average(3) StDev Average(5) StDev Average(3) StDev
D) GRS-Ref-2791sample A) GRS-Ref-2794 B) GRS-Ref-5095 C) GRS-Ref-2788
As, Y, Zr, Nb, Mo, Sn, Sb, Ba, Hf, Ta, Pb, Bi, Gd,Tb, Dy, Ho, Er, Tm, Yb and Lu are below the limit of detection: 0.4, 0.07, 0.07, 0.06, 0.8, 0.6, 0.2, 0.2, 0.2, 0.01, 0.06, 0.01, 0.05, 0.01, 0.1, 0.01, 0.03, 0.01, 0.06, 0.1 * Si as internal standard
OxideB2O3K2OCaOAl2O3Na2OSiO2
Total
rel.%0.620.48
-27.40.32
-
rel.%0.300.2715.928.20.39
-
wt.%10.65.13
0.0050.001
6.0379.0
100.7
ppm8.034.83
3492046840≤0.87.90
36920044780≤52.60.802.480.32≤2.4≤0.5≤13.5≤0.07≤0.53≤0.51≤0.6≤0.36
101≤0.031.26
≤0.0020.001
ElementLiBeBNaMgAlSi*)KCaScTiVCrMnFeCoNiCuZnGaRbSrCsThU
wt.%11.25.42
≤0.00730.001
6.3279.0
102.0
REELaCeNdSmEu
rel.%1726.860.620.32
-27.4
std0.48
-3.58116
20.9--------
1.00-
26.3-
101
ppm4.975.10
3280044700
4.777.84
36920042370
390.801.990.263.651.20
16≤0.06≤2.3≤0.50≤0.73≤0.2584.40.022.34
≤0.0020.004
rel.%29.318.20.300.3952.328.2
std0.2715.97.1315.27.5428.8
1138.1
-----
0.3047.61.96
-107
ppm1.215.39
3394046680
3.0147.5
36920038320≤42.80.88≤0.80.282.04≤0.3≤3.8≤0.030.220.230.540.10103
≤0.071.76≤0.020.010
rel.%22.319.61.421.20153160std
1.00-
8.40-
15.812.2
---
15.875.670.321.71.27
-7.61
-94.6
ppm1.49≤1.1
3483046770
0.6022.7
36920038600≤41.50.76≤0.90.25≤2.1≤0.33.53≤0.03≤0.030.350.500.10110
≤0.030.53
0.002≤0.006
rel.%30.6
-1.091.2359.198.8
std0.69
-16.7
-30.3
-----
13.944.713.64.68
-26.3141
-
ppm0.005≤0.003≤0.008≤0.020.008
rel.%1.39
---
141
ppm0.0900.003≤0.007≤0.07≤0.02
rel.%1261.37
---
ppm≤0.010.016≤0.080.03
≤0.003
rel.%-
114-
46.3-
ppm0.0030.0040.041≤0.06≤0.03
rel.%54.655.246.8
--
wt.%10.94.64
≤0.0050.009
6.3079.0
100.9
rel.%1.421.00
-1601.20
-
wt.%11.24.67
≤0.0050.004
6.3179.0
101.2
rel.%1.090.69
-98.81.23
-
LA-ICP-MS analyses in oxide wt.%Tab. J06 LA-ICP-MS Chemical Analyses of Poudretteite
LA-ICP-MS: Rare earth element concentrations in ppm
Full LA-ICP-MS analyses in ppm including major, minor and trace elements
Fig. J88. 8.25 ct poudretteite crystal from Mogok, 2005. Origin: Pyant Gyi mine.
About the Authors
Dr. Peretti is Director of the GRS Gemresearch Swisslab Ltd., Lucerne, [email protected]
F. Peretti (GG) is Research Scientist of the GRS Gemresearch Swisslab Ltd., Lucerne, [email protected]
Ngwe Lin Tun (FGA) is Gemological Consultant for GRS Gemresearch Swisslab LTD, Lucerne, Switzerland
Dr. Günther is Professor for Trace Elements and Microanalysis at the Laboratory for Inorganic Chemistry, ETH Zurich, [email protected]
K. Hametner is Research Assistant for Trace Elements and Microanalysis at the Laboratory for Inorganic Chemistry, ETH Zurich, [email protected]
W. Bieri (Bsc. EarthSc.) is Research Gemologist at GRS (Thailand) in Bangkok, [email protected]
Dr. Reusser is Research Scientist at Institute of Mineralogy and Petrography, ETH Zentrum, CH-8092 Zurich, [email protected]
M. Kadiyski (Master EarthSc.) is Research Associate at the Group of Mineralogical Crystallography (Institute of Geological Sciences) at the University of Berne, [email protected]
Dr. Armbruster is Professor of Mineralogical Crystallography (Institute of Geological Sciences) at the University of Berne, [email protected]
5251
Poudretteite Crystal Structure LA-ICP-MS Chemical Analyses of Poudretteite

Acknowledgments
The support of the following persons and institutions is greatly appreciated: Mattias Fricker (Trace elements and micro analytics of LAC laboratory at ETH, Zurich) for LA-ICP-MS analyses of one johachidolite specimen, Luca Caricchi (Institute IMP, ETH ZH) for electron microprobe analyses of one specimen and one BSE image, Glenn Lambrecht (Research Group Rock Water Interaction, Institute of Geological Sciences, University of Bern) for Raman spectroscopy of fluid inclusions, Prof. Sanchez-Valle and Maarten Aerts (Institute IMP, ETH ZH) for Raman spectroscopy of rock-forming minerals, Anong Kanpraphai (GRS (Thailand) Co LTD.) for photography, Sumet Tanthadilok for graphic and artwork and Mr. Saleem Michael for preparing this report for the internet (www.gemresearch.ch).
Selected Literature
Araki, T. and Moore, P.B., 1972. Johachidolite, CaAl[B3O7], a borate with very dense atomic structure. Nature, Physical Science, 240, 63-65
Aristarain, L.F., and Erd, R.C., 1977. Johachidolite redefined: a calcium aluminum borate. American Mineralogist, 62, 327-329
Armbruster, T., Döbelin, N., Peretti, A., Günther, D., Reusser, E., and Grobéty, B., 2004. The Crystal Structure of Painite CaZrB[Al9O18] Revisited. American Mineralogist, 89, 610-613
Clegg, E.L.G., and Iyer, L.A.N., Geological map of Mogok stone tract (See Iyer, L.A.N., 1953)
Černý, P., 1997. REE trends in rare-element granitic pegmatites: enrichment vs. depletion in granite-to-pegmatite sequences, Department of Geological Sciences, University of Manitoba, Winnipeg, MB, Canada R3T 2N2. Journal of the Czech Geological Society v42 n3, 34
Giuli, G., Bindi, L., Bonazzi, P, 2000. Rietveld refinement of okayamalite, Ca2SiB2O7: Structural evidence for the B/Si ordered distribution. American Mineralogist, 85, 1512-1515
Harding, R.R., Francis, J.G.,Oldershaw, C.J.E., and Rankin, A.H., 1999. Johachidolite – a new gem. Journal of Gemology, 26(5), 324-329
Hawthorne, F.C., Cooper, M.A., Peretti, A., Simmons, W.B., Armbruster, T., Rossman, G.R., Günther, D., Laurs, B.M. and Grobéty B., 2003. Check-list for new mineral proposals: Pezzottaite. Proposal submitted to the International Mineralogical Association, 8
Hawthorne, F.C., Cooper, M.A., Simmons, W.B., Falster, A.U., Laurs, B.M., Armbruster, T., Rossman, G.R., Peretti, A., Günther, D. and Grobéty, B., 2004. Pezzottaite, Cs(Be2Li)Al2Si6O18, a spectacular new mineral related to the beryl group, from Madagascar. Mineralogical Record, 35 (Sept-Oct), 369-378
Iyer, L.A.N., 1953. The geology and gem-stones of the Mogok Stone Tract, Burma. Memoirs of the Geological Survey of India, 82, 100
Kadiyski, M., Armbruster, Th., Günther, D., Reusser, E. and Peretti, A. (in prep.): Crystal structure refinement and chemical composition of gem quality johachidolite from Mogok (Burma, Myanmar)
Keller, P.C.,1990. The ruby deposits of Mogok, Burma. Gemstones and their origins. Van Nostrand Reinhold, 89-99
Laurs, B.M., Simmons, W.B., Rossman, G.R., Quinn E.P., McClure, S.F., Peretti, A., Armbruster, T., Hawthorne, F.C., Falster, A.U., Günther, D., Cooper, M.A., and Grobéty, B., 2003. Pezzottaite from Ambatovita, Madagascar: A new gem mineral. Gems&Gemology, 39 (4), 284-301
Peretti, A., 2003. New Findings of Painite. Contributions to Gemology, No. 2, August, 19-20 Online-version at: www.gemresearch.ch/journal/No2/No2.htm
Peretti, A., Armbruster, T., Günther, D., Grobéty, B., Hawthorne, F.C., Cooper, M.A., Simmons, W.B., Falster, A.U., Rossman, G.R., and Laurs, B.M., 2004. The challenge of the identification of a new mineral species: Example “pezzottaite”. Contributions to Gemology, 3, 1-12Online-version at: www.gemresearch.ch/journal/No3/No3.htm
Peretti, A., Günther, D., 2005. The Beryllium-Treatment of natural Fancy Sapphires with a new Heat-Treatment Technique Part A. Contributions to Gemology, 4, 16Online-version at: www.gemresearch.ch/journal/No4/No4.htm
Smith, C.P, Bosshart G., Graeser, S., Haenni H., Guenther D., Hamentner K and Gubelin E.J., 2003. Poudretteite: A rare gem species from the Mogok valley. Gems&Gemology, 39 (1), 24-31
Thein, M.L., Myint, O., Kyi, S., and Win, H.N., 1990. Geology and stratigraphy of the metamorphosed early paleozoic rocks of the Mogok-Thaseikkyin-Singu- Madaya areas. Department of higher education-the applied geology department, Yangoon, Burma, 98, 1-24
53
Acknowledgments and Literature