gefa water system interconnection, redundancy and ... report gefa water system interconnection,...
TRANSCRIPT

F i n a l R e p o r t
GEFA Water System Interconnection, Redundancy and Reliability Act
Emergency Supply Plan
Prepared for
Georgia Environmental Finance Authority
September 2011
Prepared by

Acknowledgements
The Georgia Environmental Finance Authority (GEFA) and CH2M HILL wish to thank everyone that helped develop this plan. In particular, we thank the members of the Technical Panel who defined the emergency scenarios to be evaluated and helped determine the scope of the study. Additionally, we thank the members of the Metropolitan North Georgia Water Planning District’s Technical Coordinating Committee, the staff of the Georgia Environmental Protection Division and the Atlanta Regional Commission. All of these organizations contributed their time and insight to produce a valuable study for the participating water systems and public officials throughout the region and the state.
We also want to thank the project team members whose contributions were essential in developing this plan:
• Jacobs Engineering Group Inc.
• Lowe Engineers LLC
• River to Tap (R2T)
• Galardi Rothstein Group and
• Walker, Hulbert, Gray & Moore LLP

I
Contents
1.0 Introduction .................................................................................................................................. 1-1
1.1 Statement of Purpose ...................................................................................................... 1-1 1.2 Study Approach ............................................................................................................... 1-3 1.3 Note about Detailed System Data ................................................................................... 1-4
2.0 QWS Data Collection ................................................................................................................... 2-1 2.1 Data Collection Process .................................................................................................. 2-1 2.2 Summary of Data Collected ............................................................................................ 2-2
2.2.1 General System Information, Infrastructure, and Supply .................................. 2-2 2.2.2 Mapping ............................................................................................................ 2-6 2.2.3 Emergency Planning Data ................................................................................ 2-8
3.0 Emergency Water Supply Sources ............................................................................................ 3-1 3.1 Excess Capacity from Existing Surface Water Sources .................................................. 3-1 3.2 Potential Water Sources and Storage Options ................................................................ 3-4 3.3 Return Flows as Potential Emergency Water Supply ...................................................... 3-5 3.4 Factors Affecting Availability of Water Supply ................................................................. 3-5
3.4.1 Conveyance Factors ......................................................................................... 3-5 3.4.2 Water Withdrawal Permitting Factors ................................................................ 3-6 3.4.3 Finished Water Quality ...................................................................................... 3-6 3.4.4 Source Water Quality ....................................................................................... 3-6
4.0 Emergency Planning Benchmarks ............................................................................................. 4-1 4.1 Methodology for Calculating Demands ............................................................................ 4-1
4.1.1 Current (2006) Water Demands ........................................................................ 4-1 4.1.2 Projected (2035) Water Demands ..................................................................... 4-3
4.2 Reliability Targets ............................................................................................................ 4-4 5.0 Water Supply Risk Evaluations .................................................................................................. 5-1
5.1 Water Supply Risk Identification and Selection for Evaluation ........................................ 5-1 5.2 Water Supply Risk Evaluation ......................................................................................... 5-3
5.2.1 Overview of Risk Evaluation Methodology ........................................................ 5-3 5.2.2 Key Assumptions for Deficit Calculations .......................................................... 5-6
5.3 Water Supply Risk Selection for Further Evaluation ........................................................ 5-8 6.0 Evaluation of Potential Projects ................................................................................................. 6-1
6.1 Methodology .................................................................................................................... 6-1 6.2 Hydraulic Modeling .......................................................................................................... 6-2
6.2.1 Hydraulic Model Development .......................................................................... 6-2 6.2.2 Hydraulic Modeling Criteria ............................................................................... 6-5 6.2.3 Hydraulic Modeling and Evaluation Approach................................................... 6-5
6.3 Project Cost Estimates .................................................................................................... 6-7 6.3.1 Unit Cost Development ..................................................................................... 6-7 6.3.2 Project Cost Development Summary ................................................................ 6-9
7.0 Recommended Projects .............................................................................................................. 7-1 7.1.1 Prioritization Approach ...................................................................................... 7-1
8.0 Model Agreements and Summary of Innovative Financing Best Practices ........................... 8-1 8.1 Financing Approaches ..................................................................................................... 8-1
8.1.1 Independent Projects ........................................................................................ 8-1 8.1.2 Shared Projects ................................................................................................ 8-1
TABLE OF CONTENTS
II
8.2 Financing Options for the Recommended Projects and Regional Projects ..................... 8-2 8.3 Cost Allocation Options ................................................................................................... 8-6
8.3.1 Cost Allocation Concepts .................................................................................. 8-6 8.3.2 Cost Allocation Examples ................................................................................. 8-7 8.3.3 Summary of Cost Allocation Options .............................................................. 8-11
8.4 Model Intergovernmental Agreement ............................................................................ 8-16 8.4.1 Governance .................................................................................................... 8-16 8.4.2 Purpose ........................................................................................................... 8-17 8.4.3 Definitions ....................................................................................................... 8-17 8.4.4 Procedures ...................................................................................................... 8-18 8.4.5 Amount to Supply ............................................................................................ 8-18 8.4.6 Pricing ............................................................................................................. 8-19 8.4.7 Project Subject to Intergovernmental Agreement ............................................ 8-20 8.4.8 Meter Maintenance and Ownership Responsibilities ...................................... 8-20 8.4.9 Water Quality .................................................................................................. 8-21 8.4.10 Termination ..................................................................................................... 8-21 8.4.11 Water Conservation Measures ........................................................................ 8-22 8.4.12 Other Contract Considerations ........................................................................ 8-22
Exhibits 1-1 Qualified Water System Location Map .......................................................................................... 1-2 2-1 Key Data for Qualified Water Systems .......................................................................................... 2-2 2-2 Mapping Data Received from Qualified Water Systems ................................................................ 2-6 2-3 Summary of Emergency Planning Reports and Documents Received .......................................... 2-9 3-1 Current and Future Excess Capacity ............................................................................................. 3-2 3-2 Excess Capacity Summary ............................................................................................................ 3-4 4-1 2006 Water Demands .................................................................................................................... 4-2 4-2 Example demand calculation ......................................................................................................... 4-3 4-3 2035 Water Demands .................................................................................................................... 4-4 4-4 Reliability Target Verification ......................................................................................................... 4-5 5-1 Water Supply Risks and Emergency Scenarios ............................................................................ 5-1 5-2 Risk Evaluation Methodology ........................................................................................................ 5-4 5-3 Key Assumptions Used in Evaluation of Short-Term Defined Duration Scenarios ........................ 5-5 5-4 Key District-Identified Projects ....................................................................................................... 5-7 5-5 Deficit Summary ............................................................................................................................ 5-9 6-1 Methodology for Determining Recommended Projects ................................................................. 6-2 6-2 Hydraulic Model Summary ............................................................................................................. 6-3 6-3 Pipeline Unit Costs ........................................................................................................................ 6-8 6-4 Pump Station Unit Costs ................................................................................................................ 6-8 6-5 Control Valve Station Unit Costs ................................................................................................... 6-9 7-1 Recommended Project List ............................................................................................................ 7-2 7-2 Evaluation Criteria ......................................................................................................................... 7-4 7-3 Project Scoring Guidelines ............................................................................................................ 7-4 7-4 Example Prioritization Results ....................................................................................................... 7-5 8-1 Funding Options Summary ............................................................................................................ 8-4 8-2 Cost Allocations for UOBWA Bear Creek Reservoir, Treatment,
and Transmission Facilities ........................................................................................................... 8-9 8-3 Cost Allocation Options ............................................................................................................... 8-13 8-4 Model Decision Tree .................................................................................................................... 8-15 8-5 Model Intergovernmental Agreement for Emergency Water Interconnection System ................. 8-23
III
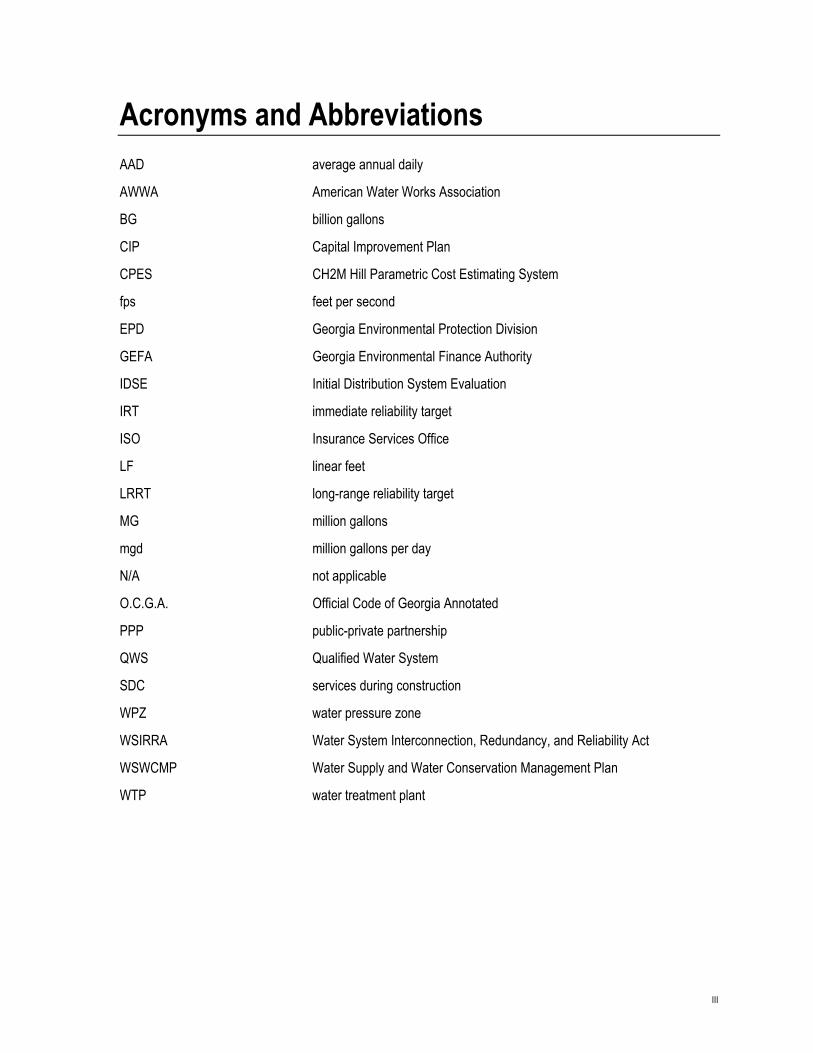
Acronyms and Abbreviations AAD average annual daily
AWWA American Water Works Association
BG billion gallons
CIP Capital Improvement Plan
CPES CH2M Hill Parametric Cost Estimating System
fps feet per second
EPD Georgia Environmental Protection Division
GEFA Georgia Environmental Finance Authority
IDSE Initial Distribution System Evaluation
IRT immediate reliability target
ISO Insurance Services Office
LF linear feet
LRRT long-range reliability target
MG million gallons
mgd million gallons per day
N/A not applicable
O.C.G.A. Official Code of Georgia Annotated
PPP public-private partnership
QWS Qualified Water System
SDC services during construction
WPZ water pressure zone
WSIRRA Water System Interconnection, Redundancy, and Reliability Act
WSWCMP Water Supply and Water Conservation Management Plan
WTP water treatment plant

This page intentionally left blank.
1-1
1.0 Introduction
The Water System Interconnection, Redundancy and Reliability Act (WSIRRA) was signed into law in May 2010. The legislation directed the Georgia Environmental Finance Authority (GEFA) to complete a thorough and detailed engineering study that develops an emergency water supply plan for all qualified water systems (QWSs) within the Metropolitan North Georgia Water Planning District (District).
For the purpose of this study, a QWS is defined as any public water system owned and operated by a city, county or water authority in the District that has current surface water withdrawal permit(s) or more than 20,000 retail connections/accounts. Thirty-three QWSs were identified within the District’s 15 counties, as shown in Exhibit 1-1.
1.1 Statement of Purpose The purpose of this study is to evaluate the drinking water withdrawal, treatment and distribution systems of the QWSs and to identify proactive measures that can be taken to reduce the risk of catastrophic interruptions of water service during emergencies.
Per the WSIRRA, emergency situations include:
1. Failure of largest water treatment facility;
2. Short-term catastrophic failure of a water distribution system;
3. Short-term contamination of a raw water source;
4. Full unavailability of major raw water sources due to federal or state government actions; and
5. Limited or reduced availability of major raw water sources due to federal or state government actions.
During commission of this study additional emergency situations were also identified and evaluated:
6. Failure of existing dam of a raw water supply.
7. Water supply reduction due to drought.
The study is mandated to identify emergency water supply sources and detail the steps required to modify any QWS’s operations to accept or share water with adjacent water providers within the District during emergencies in order to supply essential water needs (i.e., the minimum amount of water needed by residential and commercial users for food processing, drinking, toilet flushing, fire fighting, hospital use and critical asset use.)

Atlanta
eRosw ll
iaG inesv lle
Marietta
v llCarters i e
Canton
fBu ord
Newnan
East Point
Palmetto
gMcDonou ht iFayet ev lle
d lsA air vi le
rEme son
eS noia
tLocus Grove
nCummi g
Cobb Co. -Marietta WA
(Cherokee Co. WSA)
(CCWA)
(DDCWSA)
(Henry Co. WSA)
(Coweta Co. WSA)
2 Multi-Jurisdictional Wholesale Water Providers
17 Municipal/Authority Qualified Water Systems
14 County/Authority Qualified Water Systems
LEGEND
Atlanta - Fulton Co. WRC
Bartow Cherokee Forsyth
GwinnettCobb
DeKalb
RockdaleClayton
FultonDouglas
Paulding
Henry
FayetteCoweta
Hall
EXHIBIT 1-1Qualified Water System Location Map§ 0 10 205
Miles

1.0—INTRODUCTION
1-3
This study involved evaluation of numerous factors affecting water system reliability, including raw and finished water storage, infrastructure and equipment redundancy, and existing interconnection capabilities. Potential vulnerabilities during emergencies were assessed, and projects to improve system reliability were identified and prioritized.
A methodical approach was developed at the onset of this study to take into account complexities of the study, i.e., the large number of QWSs involved, an aggressive schedule, and the multifaceted analysis needed to analyze the QWSs’ infrastructure in order to determine their vulnerability to various emergency scenarios. This report documents the steps taken to complete the study and to develop a recommended emergency water supply plan.
1.2 Study Approach The section headings in this report are organized to reflect the sequential work task structure and reflect the execution of the study scope. The objectives and methodologies of each task are as follows:
Section 2 QWS Data Collection The data collection task involved developing a detailed questionnaire and data request list. It also included meeting with most of the QWSs (especially the larger systems) and obtaining all relevant data, maps, hydraulic models and accurate locations for QWS infrastructure. The capture of this information was important to the study because it formed the basis for assessing the planning benchmarks, supply risk and emergency readiness in subsequent tasks.
Section 3 Emergency Water Supply Sources The emergency water supply sources task involved identifying water bodies capable of providing redundant water supply. This task was requested by GEFA; however, it was recognized that all available sources are currently in use. While the study identified additional sources, none have the infrastructure that would allow them to be used for emergency supply. This evaluation includes both raw and potable water sources, emergency water supplies secured through interconnections between systems, and intra-system access to reliable alternate water supplies, such as back-up wells or other raw or finished water sources.
Section 4 Emergency Planning Benchmarks The development of planning benchmarks is dictated by the WSIRRA in order to evaluate risks and to set District-wide interconnection reliability targets. The enabling legislation dictates that this study should consider two District-wide interconnection reliability targets:
• 35 percent of the average annual daily (AAD) demand. • 65 percent of the AAD demand.
These general targets provide preliminary benchmarks for emergency planning in the study. The current (i.e., year 2006) and long-range (i.e., year 2035) water demands were calculated for each QWS based on previously developed water demands. These targets were not intended to represent permanently achievable demand reductions.
Section 5 Water Supply Risk Evaluations The water demands developed for each QWS as part of the Emergency Planning Benchmarks task were compared to the available water supply for each QWS. Emergency scenarios were identified, and the reliability targets were applied to each scenario to evaluate the capabilities of a QWS to respond to that emergency. Deficits of supply relative to demand under emergency conditions were then summarized in tables for use in subsequent tasks. The degree of readiness of each QWS to close deficits and to identify the maximum deficit (also known as the Critical Scenario Deficit) for the various emergency scenarios was also determined.

1.0—INTRODUCTION
1-4
Section 6 Evaluation of Potential Projects This task identified the most viable means of eliminating the critical scenario deficits in the subject QWSs. Modeling and/or other hydraulic evaluations were conducted to determine the hydraulic capacity of existing interconnections. The hydraulic capacity of existing interconnections was calculated to determine if the Critical Scenario Deficit could be reduced or eliminated. In the case of new interconnections, the critical scenarios were analyzed using additional computer modeling to identify capital improvements that would enable the transfer of water from neighboring utilities to the QWSs with deficits. Internal system redundancy alternatives were also included, where appropriate. Cost estimates were developed for the capital improvements, financial and legal options to fund the improvements were examined, and an approach was developed to prioritize and schedule the projects.
Section 7 Recommended Projects After the projects were identified, evaluated and cost-estimated, the most appropriate and cost-effective projects were selected for each QWS with a deficit. These projects include upgrades to existing interconnections, new interconnections, and internal infrastructure redundancy projects. In addition, major water plant upgrade projects already planned for the QWSs were identified.
Section 8 Model Agreements and Summary of Innovative Financing Best Practices The WSIRRA requires that policy, financing and new model agreements be studied in an effort to identify viable solutions to reliability or redundancy shortfalls. This study evaluated various financing options, including traditional financing approaches, such as state loans or municipal or commercial bonds, and non-traditional financing options, such as public-private-partnerships and asset transfer. In addition, a model intergovernmental agreement was developed for QWSs to use as a guide in creating emergency water sharing agreements.
1.3 Note about Detailed System Data As mentioned above, the WSIRRA directed the completion of a “thorough and detailed engineering study that develops an emergency water supply plan” for all QWSs within the District. The following sections on methodology bear out the fact that the project team that completed this study fulfilled the mandate. This study rests on a firm foundation of detailed data collection, mapping, hydraulic modeling and economic analysis. But, at GEFA’s insistence, the project team has excluded any detailed data that may compromise the security of the QWSs. Detailed system data will be shared directly with each QWS, but will not be distributed publicly.
2-1
2.0 QWS Data Collection
A substantial data collection and analysis task was undertaken at the outset of this study to gather, compile and assess detailed information about each QWS. This information includes facility descriptions and maps, operating data, permits, water sales contracts and agreements, computer models, plans, forecasts, and other relevant reports and data products.
2.1 Data Collection Process Each QWS was sent a standardized data request form approved by GEFA that included the following categories:
• System Description; • Water Demands and Rates; • Water Sources; • Water Treatment Facilities; • Distribution System Facilities; and • Infrastructure and Emergency Planning Documents.
Meetings were held with most of the QWSs to assist them in their data gathering efforts. Thirty of the 33 QWSs provided complete or partially complete data forms. For QWSs that had data missing, state of Georgia and District resources were used to obtain missing information and to verify and supplement information provided directly by the QWSs. The key resources included:
• Public Water System Operating Permits – Permits issued by the Georgia Environmental Protection Division (EPD) for water system operation. The permits describe operating conditions and limitations and list the approved water sources for systems including water treatment plants (WTPs), groundwater sources and purchased water connections. Permitted WTP capacities are identified along with raw water sources associated with each plant, the number of filters, and the maximum filter loading rate.
• Sanitary Surveys – Surveys conducted by EPD to monitor treatment practices. These surveys are performed periodically for each water system and contain detailed descriptions of facilities.
• Surface and Groundwater Withdrawal Permits – Permits issued by EPD for withdrawals from raw water sources. The permits identify raw water sources and withdrawal limits.
• Metropolitan North Georgia Water Planning District Water Metrics Report (February 2011) – This report documents recent historical water supply and sales for each county in the District.
• Water Supply and Water Conservation Management Plan (WSWCMP; May 2009) – This District report provides a comprehensive county-by-county plan through 2035 for new water treatment capacity and major system interconnections.

2.0—QWS DATA COLLECTION
2-2
2.2 Summary of Data Collected Some highlights of the collected data are presented below.
2.2.1 General System Information, Infrastructure, and Supply The data reveal that the 33 QWSs operate 38 WTPs. Overall, the QWSs have a combined treatment capacity of 1201 million gallons per day (mgd) and directly serve a total estimated current population of nearly 4.5 million people. Exhibit 2-1 shows basic general information about each QWS and the data collection efforts pertaining to it and identifies existing relationships between QWSs, such as regular purchases or sales of water. It should be noted that extensive interconnections are already in place.
Other findings of the data collection effort included:
• Nearly two-thirds of the QWSs have multiple raw water sources, pumps, reservoirs or reliable water purchase agreements. These systems serve more than 90 percent of the estimated total QWS-served population. The remaining systems lacking this level of redundancy serve less than 10 percent of the population.
• Seven QWSs have two or more WTPs at separate locations and serve nearly 50 percent of the District population.
• Of the QWSs’ 38 WTPs, 15 have dual power feed or emergency generators.
Information about water sources and water treatment practices was collected to determine the potential compatibility for mixing treated waters from different systems (i.e., as a result of interconnections). Surface water sources within the District generally have very similar quality in terms of hardness, alkalinity and total organic carbon levels. Thus, similar treatment processes are employed by all the QWSs and produce similar finished water qualities. All of the QWSs use free chlorine to maintain distribution residual disinfection; none use chloramines for this purpose. Most QWSs maintain finished water pH in the range of 7.0 to 7.5 and use phosphate-based corrosion inhibitors for control of pipe corrosion. Notable exceptions are the Cobb County-Marietta Water Authority and DeKalb County, which raise pH to approximately 8.5 to 9.0 for the purpose of corrosion control and do not add a phosphate-based corrosion inhibitor.
EXHIBIT 2-1 Key Data for Qualified Water Systems
County Qualified Water System
Estimated Population
Directly Served
(Rounded to Nearest 100)
Raw Water Source(s)
Made Regular Purchases
During 2000-2009 From:
Made Regular Sales
During 2000-2009 To:
Bartow Adairsville, City of 3,600 Lewis Spring None
Bartow County Water
Department, Floyd County
Bartow Bartow County Water Department 56,000 Bolivar Springs
Cities of Adairsville and Cartersville, Cherokee County
Water and Sewerage Authority, Cobb County Water System, Polk County
Cities of Emerson and
Kingston

2.0—QWS DATA COLLECTION
2-3
EXHIBIT 2-1 Key Data for Qualified Water Systems
County Qualified Water System
Estimated Population
Directly Served
(Rounded to Nearest 100)
Raw Water Source(s)
Made Regular Purchases
During 2000-2009 From:
Made Regular Sales
During 2000-2009 To:
Bartow Cartersville, City of 24,800
Lake Allatoona,
Etowah River None
Bartow County Water
Department
Bartow Emerson, City of 1,400 Moss Springs Bartow None
Cherokee Canton, City of 14,300 Etowah River
Cherokee County Water and
Sewerage Authority, City of Waleska
City of Waleska
Cherokee
Cherokee County Water and Sewerage Authority
192,000 Etowah River
Cobb County-Marietta Water
Authority, Pickens County
Bartow County Water
Department, Pickens County, Forsyth County, Etowah Water
and Sewer Authority, Cities of Ball Ground,
Canton, Woodstock,
Waleska, and Jasper.
Clayton Clayton County Water Authority 260,100
Flint River, Little Cotton
Indian Creek. Groundwater
wells.
City of Atlanta, DeKalb County, Henry County
Henry County
Cobb Cobb County Water System 533,000 Wholesale
Purchase
Cobb County-Marietta Water
Authority
Bartow County, Paulding County,
DDCWSA
Cobb Cobb County-Marietta Water
Authority 0
Lake Allatoona,
Chattahoochee River, Etowah
River
None
Cobb County Water System, Marietta Power
and Water, Paulding
County Water System,
Cherokee County Water and Sewerage
Authority, DDCWSA, City of Austell, City
of Powder Springs, City of Woodstock, City
of Mountain Park, Lockheed.

2.0—QWS DATA COLLECTION
2-4
EXHIBIT 2-1 Key Data for Qualified Water Systems
County Qualified Water System
Estimated Population
Directly Served
(Rounded to Nearest 100)
Raw Water Source(s)
Made Regular Purchases
During 2000-2009 From:
Made Regular Sales
During 2000-2009 To:
Cobb Marietta Power and Water 60,100 Wholesale
Purchase
Cobb County-Marietta Water
Authority None
Coweta
Coweta County Water and Sewerage Authority
59,800
Cedar Creek/BT
Brown Reservoir.
Groundwater wells.
City of Newnan, City of Atlanta, City of
Griffin
Cities of Senoia, Palmetto, Turin, and Grantville
Coweta Newnan Utilities 34,000
Brown, Sandy, Line,
White Oak Creeks
None
Coweta County Water and Sewerage Authority
Coweta Senoia, City of 2,500 Hutchin's Lake Groundwater
wells.
Coweta County Water and
Sewerage Authority None
DeKalb DeKalb County 594,400 Chattahoochee River
Gwinnett County, City of Atlanta
Henry County Water and Sewerage Authority,
Clayton County Water Authority, Rockdale Water
Resources
Douglas
Douglasville-Douglas County
Water and Sewer Authority
117,300 Dog River, Bear Creek
Cobb County-Marietta Water Authority, Cobb County Water
System
City of Villa Rica, Carroll
County
Fayette Fayette County Water System 71,100
Flint River, Line and
Whitewater Creeks. Lake
Kedron, Peachtree, and
McIntosh. Groundwater
wells.
City of Atlanta City of Fayetteville
Fayette Fayetteville, City of 15,300
Whitewater Creek
Groundwater wells
Fayette County Water System None
Forsyth Cumming, City of 38,600 Lake Lanier None Forsyth County

2.0—QWS DATA COLLECTION
2-5
EXHIBIT 2-1 Key Data for Qualified Water Systems
County Qualified Water System
Estimated Population
Directly Served
(Rounded to Nearest 100)
Raw Water Source(s)
Made Regular Purchases
During 2000-2009 From:
Made Regular Sales
During 2000-2009 To:
Forsyth Forsyth County
Water and Sewer Department
112,200 Lake Lanier Fulton County Water
System, City of Cumming
Etowah Water and Sewer Authority
Fulton Atlanta, City of 650,000 Chattahoochee River
Atlanta-Fulton County Water
Resources Commission
Fayette County Water System, Coweta County
Water and Sewerage Authority,
Clayton County
Fulton
Atlanta-Fulton County Water
Resources Commission
0 Chattahoochee River None
Fulton County Water System, City of Atlanta
Fulton East Point, City of 39,600 Sweetwater Creek None City of College
Park
Fulton Fulton County Water System 172,500 Wholesale
Purchase
Atlanta-Fulton County Water
Resources Commission
City of Roswell, Forsyth County
Fulton Palmetto, City of 4,000 Cedar Creek Coweta County
Water and Sewerage Authority
None
Fulton Roswell, City of 14,300 Big Creek Fulton County Water System None
Gwinnett Buford, City of 8,000 Lake Lanier Gwinnett County None
Gwinnett Gwinnett County Department of
Water Resources 743,800 Lake Lanier None
Cities of Gainesville, Loganville,
Lawrenceville, Norcross, Braselton,
Auburn, and Suwanee.
Rockdale Water Resources,
Walton County
Hall Gainesville, City of 176,000
Lake Lanier, North Oconee River, Cedar
Creek.
Gwinnett County, White County
Cities of Flowery Branch
and Lula, Jackson County

2.0—QWS DATA COLLECTION
2-6
EXHIBIT 2-1 Key Data for Qualified Water Systems
County Qualified Water System
Estimated Population
Directly Served
(Rounded to Nearest 100)
Raw Water Source(s)
Made Regular Purchases
During 2000-2009 From:
Made Regular Sales
During 2000-2009 To:
Henry
Henry County Water and Sewerage Authority
184,000
Towaliga River, Indian
Creek, Long Branch,
Tussahaw Reservoir
DeKalb County, Clayton County Water Authority
Cities of Stockbridge,
Locust Grove, McDonough, and Hampton
Henry Locust Grove, City of 1,100
Brown Branch (Spring),
Groundwater wells
Henry County Water and Sewerage
Authority None
Henry McDonough, City of 10,200
Walnut Creek Reservoir.
Groundwater wells.
Henry County Water and Sewerage
Authority None
Paulding Paulding County Water System 107,500 Wholesale
Purchase
Cobb County-Marietta Water
Authority
Cities of Dallas and Hiram, Polk
County
Rockdale Rockdale Water Resources 67,500 Big Haynes
Creek Gwinnett County, Newton County None
2.2.2 Mapping Mapping data was collected from the QWSs in various formats, including hard copies, digital mapping data primarily in the form of GIS, and digital mapping data extracted during this study from QWS-supplied hydraulic computer models.
Exhibit 2-2 summarizes the type of mapping data (if any) provided by each QWS. Most of the systems provided hydraulic computer models, many of which contained pertinent mapping data that were extracted and used to create maps. A handful of systems provided both computer models and digital mapping data. In these cases, both types of data were generally of equal usefulness and quality.
EXHIBIT 2-2 Mapping Data Received from Qualified Water Systems
County Qualified Water System
Estimated Current
Population Directly Served1
Level of Mapping Data Received
No Mapping
Data
Hard Copy Maps
Digital Mapping
Data (GIS)
Hydraulic Computer
Model
Bartow Adairsville, City of 3,600 √ Bartow Bartow County Water Department 56,000 √ Bartow Cartersville, City of 24,800 √

2.0—QWS DATA COLLECTION
2-7
EXHIBIT 2-2 Mapping Data Received from Qualified Water Systems
County Qualified Water System
Estimated Current
Population Directly Served1
Level of Mapping Data Received
No Mapping
Data
Hard Copy Maps
Digital Mapping
Data (GIS)
Hydraulic Computer
Model
Bartow Emerson, City of 1,400 √ Cherokee Canton, City of 14,300 √ Cherokee Cherokee County Water and
Sewerage Authority 192,000 √
Clayton Clayton County Water Authority 260,100 √ √ Cobb Cobb County Water System 533,000 √ Cobb Cobb County-Marietta Water
Authority 02 √
Cobb Marietta Power and Water 60,100 √ Coweta Coweta County Water and
Sewerage Authority 59,800 √
Coweta Newnan Utilities 34,000 √ Coweta Senoia, City of 2,500 √ DeKalb DeKalb County 594,400 √ Douglas Douglasville-Douglas County
Water and Sewer Authority 117,300 √ √
Fayette Fayette County Water System 71,100 √ Fayette Fayetteville, City of 15,300 √ Forsyth Cumming, City of 38,600 √ √ Forsyth Forsyth County Water and Sewer
Department 112,200 √ √
Fulton Atlanta, City of 650,000 √ √ Fulton Atlanta-Fulton County Water
Resources Commission 02 √
Fulton East Point, City of 39,600 √ Fulton Fulton County Water System 172,500 √ Fulton Palmetto, City of 4,000 √ Fulton Roswell, City of 14,300 √ Gwinnett Buford, City of 8,000 √ Gwinnett Gwinnett County 743,800 √ √ Hall Gainesville, City of 176,000 √ Henry Henry County Water and
Sewerage Authority 184,000 √ √
Henry Locust Grove, City of 1,100 √ Henry McDonough, City of 10,200 √ Paulding Paulding County Water System 107,500 √ √ Rockdale Rockdale Water Resources 67,500 √
Notes: 1-Populations rounded to nearest 100. 2-Populations are included in the population of their wholesale customers Overall, electronic mapping data was provided by 23 of the QWSs, representing 97 percent of the QWS-served population. Including the hydraulic model developed for DeKalb County, hydraulic models were ultimately available for 18 of the 33 systems.

2.0—QWS DATA COLLECTION
2-8
The GIS data for each QWS was edited and combined to create GIS files that include municipal boundaries, pipes, pipe sizes, water pressure zones (WPZs), WTPs, storage tanks, interconnections, and interconnection sizes for the QWSs. In numerous cases pipes and interconnections were duplicated from overlapping mapping data. The duplicates were removed from the database by visually comparing all of the neighboring QWSs. Additionally the overall database was edited to remove interconnections with non-qualified systems. This data was then used to create 10 large (1:48,000 scale) maps showing the data described above, county boundaries, major roadways, and water features.
2.2.3 Emergency Planning Data Data and reports related to emergency planning were requested from the QWSs. The specific types of reports collected included:
• System Master Plan/Capital Improvement Plan (CIP).
• Initial Distribution System Evaluation (IDSE) prepared for the Stage 2 Disinfectants and Disinfection Byproducts Rule.
• Insurance Services Office (ISO) Reports / Fire Flow Test Reports (Fire Department or ISO Reports).
• Reports or information related to status of the implementation of action item 9.2 in the District’s WSWCMP, which calls on District utilities to “develop or update local emergency water plans.”
• Emergency Response Plans.
• Conservation/Drought Plans.
• Purchase Agreements.
Exhibit 2-3 summarizes the documents received as part of this effort.

2.0—QWS DATA COLLECTION
2-9
EXHIBIT 2-3 Summary of Emergency Planning Reports and Documents Received
Emergency Planning Reports and Documents Received
County Qualified Water System CIP or Master Plans
IDSE Report
ISO Reports or Fire Flow Test
Reports
Status of District Audit Action
Item 9.2
Emergency Response
Plan Conservation/ Drought Plan
Purchase Agreements
Bartow Adairsville, City of √ √ Bartow Bartow County Water Department √ √ √ √ Bartow Cartersville, City of √ √ √ √ √ Bartow Emerson, City of √ Cherokee Canton, City of Cherokee Cherokee County Water and Sewerage Authority √ √ √ √ √ Clayton Clayton County Water Authority √ √ √ √ √ √ Cobb Cobb County Water System √ √ √ Cobb Cobb County-Marietta Water Authority √ √ Cobb Marietta Power and Water √ √ √ √ √ Coweta Coweta County Water and Sewerage Authority Coweta Newnan Utilities Coweta Senoia, City of DeKalb DeKalb County √ Douglas Douglasville-Douglas County Water and Sewer
Authority √ √ √ √ √
Fayette Fayette County Water System √ √ √ √ √ Fayette Fayetteville, City of √ √ √ Forsyth Cumming, City of √ √ √ √ √ Forsyth Forsyth County Water and Sewer Department √ √ √ √ √ Fulton Atlanta, City of √ √ √ √ Fulton Atlanta-Fulton County Water Resources
Commission √
Fulton East Point, City of √ √ √ √ Fulton Fulton County Water System √ √

2.0—QWS DATA COLLECTION
2-10
EXHIBIT 2-3 Summary of Emergency Planning Reports and Documents Received
Emergency Planning Reports and Documents Received
County Qualified Water System CIP or Master Plans
IDSE Report
ISO Reports or Fire Flow Test
Reports
Status of District Audit Action
Item 9.2
Emergency Response
Plan Conservation/ Drought Plan
Purchase Agreements
Fulton Palmetto, City of Fulton Roswell, City of √ Gwinnett Buford, City of Gwinnett Gwinnett County √ √ √ Hall Gainesville, City of √ √ Henry Henry County Water and Sewerage Authority √ √ √ Henry Locust Grove, City of Henry McDonough, City of √ √ √ Paulding Paulding County Water System √ √ √ Rockdale Rockdale Water Resources √ √ √

3-1
3.0 Emergency Water Supply Sources
This section evaluates sources of emergency water supply capable of providing redundant water supply to ensure that the water supplies needed to respond to the potential emergencies are available either from a neighboring QWS or through a new source.
Various water supply sources were assessed, and the study focused on four primary areas:
• Excess capacity from existing surface water sources; • Potential water sources and storage options; • Return flows as potential emergency water supply; and • Factors affecting availability of water supply.
The sections below provide a summary of this evaluation.
3.1 Excess Capacity from Existing Surface Water Sources Emergency supplies for the District could be provided using excess capacity from existing water sources. Two types of possible excess capacity were examined. Current and future (i.e., 2006 and 2035) uses of existing water sources by QWSs were initially assessed to determine if excess water is available from a given system to assist with short-term defined duration emergencies such as a power outage or equipment failure.
This evaluation calculated the difference between a QWS’s annual average daily demand and peak day treatment to determine the maximum amount of water that could be shared during a short-term defined duration emergency. This evaluation assumed that a QWS could increase to full peak day production in order to provide the excess water to the QWS experiencing the emergency (peak capacity – annual average demand = maximum amount of available water that could be shared). It is important to note that a given community’s’ local needs at the time of the emergency could be higher than their annual average demand, resulting in less “excess capacity” being available. As outlined in Exhibit 3-1, this evaluation demonstrates that there is sufficient excess capacity from existing sources to meet the short-term defined duration emergency scenarios identified in previous sections.
Current and future (i.e., 2006 and 2035) uses of existing water sources by QWSs were also assessed to determine if excess water is available from a given system to assist with long-term undefined duration emergencies, such as “full unavailability” or “limited or reduced availability” of major raw water sources due to federal or state government actions. Due to the long-term nature of this scenario, this evaluation compared the difference between a QWS’s average daily water use and average daily treatment capacity.
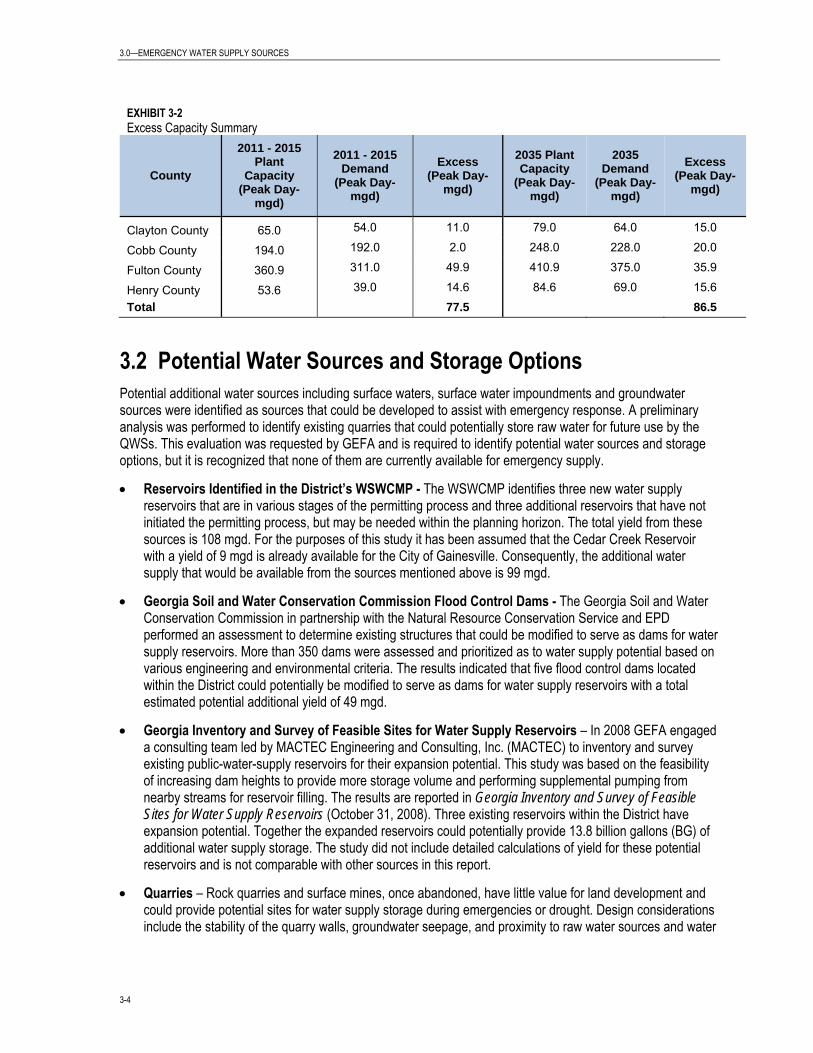
As outlined in Exhibit 3-2, the amount of excess capacity from existing sources using this calculation is relatively small, and the emergency response for these long-term undefined duration scenarios will require additional water sources beyond existing surface water sources within the District. As will be explained in section 5.1, these scenarios were evaluated, but the work was discontinued in the wake of the recent court case. Further study is needed.

3.0—EMERGENCY WATER SUPPLY SOURCES
3-2
EXHIBIT 3-1 Current and Future Excess Capacity
County Qualified Water System Water Treatment Plant
2010 Plant Capacity
(Peak Day-mgd)
2006 Demand(1) (AAD-mgd)
2006 Excess
Capacity (mgd)
2035 Plant Capacity(2) (Peak Day-
mgd)
2035 Demand
(AAD-mgd)
2035 Excess Capacity
(mgd)
Bartow Adairsville, City of Adairsville WTP 4.00 2.60 1.4 6.0 3.6 2.4
Bartow Bartow County Water Department Bartow County WTP 0.8 0.7 0.1 30.8 18.3 12.5
Bartow Cartersville, City of Cartersville WTP 27.0 13.9 13.1 40 23.8 16.2 Bartow Emerson, City of Emerson WTP 0.5 0.2 0.3 0.5 0.3 0.2
Cherokee Canton, City of Canton WTP 5.5 2.7 2.8 18.0 11.4 6.6
Cherokee Cherokee County
Water and Sewerage Authority
CCWSA Etowah River WTP 38.0 15.8 22.2 53.0 33.6 19.4
Clayton Clayton County Water Authority
Clayton Hicks WTP 42.0 29.7 12.3 79.0 40.0 39.0 Clayton Smith WTP
Clayton Hooper WTP
Cobb
Cobb County-Marietta Water Authority,
CCMWA Hugh A. Wyckoff WTP 158.0 98.2 59.8 248.0 143.0 105.0 CCMWA James E. Quarles WTP
Cobb County Water System - na na
Marietta Power and Water - na na
Coweta Coweta County Water
and Sewerage Authority
B.T. Brown WTP 7.7 2.7 5.0 10.0 16.2 -6.2
Coweta Newnan Utilities Newnan-Hershall Norred WTP 14.0 7.0 7.0 21.0 12.4 8.6
Coweta Senoia, City of Senoia WTP 0.5 0.3 0.2 0.6 0.4 0.2 DeKalb DeKalb County Scott Candler WTP 150.0 82.8 67.2 175.0 106.0 69.0 Douglas DDCWSA Bear Creek WTP 23.0 13.2 9.8 23.0 22.1 0.9
Fayette Fayette County Water System
Crosstown WTP 13.5 9.5 13.2 35.0 20.6 14.4 South Fayette WTP 9.2 Fayette Fayetteville, City of Fayetteville WTP 3.0 1.6 1.4 4.0 2.4 1.6 Forsyth Cumming, City of Cumming WTP 24.0 11.9 12.1 36.0 20.8 15.2
Forsyth Forsyth County Water and Sewer Department Forsyth County WTP 30.7 6.8 23.9 68.0 39.2 28.8
Fulton Atlanta, City of Hemphill WTP 136.5 102.5 143.9 136.5 154.8 124.1 Chattahoochee WTP 64.9 64.9

3.0—EMERGENCY WATER SUPPLY SOURCES
3-3
EXHIBIT 3-1 Current and Future Excess Capacity
County Qualified Water System Water Treatment Plant
2010 Plant Capacity
(Peak Day-mgd)
2006 Demand(1) (AAD-mgd)
2006 Excess
Capacity (mgd)
2035 Plant Capacity(2) (Peak Day-
mgd)
2035 Demand
(AAD-mgd)
2035 Excess Capacity
(mgd)
Atlanta-Fulton County WTP 45.0 77.5
Fulton Atlanta-Fulton County
Water Resources Commission
- N/A N/A
Fulton East Point, City of East Point WTP 13.9 9.7 4.2 13.9 10.0 3.9
Fulton Fulton County Water System
Atlanta-Fulton County WTP 45.0 28.4 16.6 112.5 54.1 58.4 Etowah WTP 0.0
Bear Creek WTP 0.0 Fulton Palmetto, City of Palmetto WTP 0.6 0.4 0.2 0.6 3.1 -2.5 Fulton Roswell, City of Roswell WTP 3.0 1.2 1.8 5.0 3.6 1.4
Gwinnett Buford, City of Buford WTP 4.8 1.5 3.3 4.8 2.9 1.9
Gwinnett Gwinnett County Shoal Creek WTP 75.0 92.6 -17.6 75 48.0 27 Lanier WTP 150.0 150.0 150 48.0 102
Hall Gainesville, City of Gainesville Riverside WTP 35.0 19.0 16.0 25.0
52.0 31.0 Gainesville Lakeside WTP 46.0 Cedar Creek 0.0 0.0 0.0 12.0
Henry Henry County Water
and Sewerage Authority
Tussahaw WTP 26.0 15.9 34.1 81.0 41.2 39.8 Towaliga River WTP 24.0
Henry Locust Grove, City of 0.5 0.2 0.3 0.5 0.2 0.3 Henry McDonough, City of McDonough WTP 2.4 0.5 1.9 3.1 0.6 2.5
Paulding Paulding County Water System N/A 40
Rockdale Rockdale Water Resources Big Haynes Creek WTP 22.1 11.4 10.7 27.1 17.0 10.1
Total 616 781 (1) 2006 Demand excludes purchased water (2) 2035 Plant Capacity figures reflect current capacity plus planned upgrades as reflected in the District’s WSWCMP
3.0—EMERGENCY WATER SUPPLY SOURCES
3-4
EXHIBIT 3-2 Excess Capacity Summary
County
2011 - 2015 Plant
Capacity (Peak Day-
mgd)
2011 - 2015 Demand
(Peak Day-mgd)
Excess (Peak Day-
mgd)
2035 Plant Capacity
(Peak Day-mgd)
2035 Demand
(Peak Day-mgd)
Excess (Peak Day-
mgd)
Clayton County 65.0 54.0 11.0 79.0 64.0 15.0
Cobb County 194.0 192.0 2.0 248.0 228.0 20.0
Fulton County 360.9 311.0 49.9 410.9 375.0 35.9
Henry County 53.6 39.0 14.6 84.6 69.0 15.6 Total 77.5 86.5
3.2 Potential Water Sources and Storage Options Potential additional water sources including surface waters, surface water impoundments and groundwater sources were identified as sources that could be developed to assist with emergency response. A preliminary analysis was performed to identify existing quarries that could potentially store raw water for future use by the QWSs. This evaluation was requested by GEFA and is required to identify potential water sources and storage options, but it is recognized that none of them are currently available for emergency supply.
• Reservoirs Identified in the District’s WSWCMP - The WSWCMP identifies three new water supply reservoirs that are in various stages of the permitting process and three additional reservoirs that have not initiated the permitting process, but may be needed within the planning horizon. The total yield from these sources is 108 mgd. For the purposes of this study it has been assumed that the Cedar Creek Reservoir with a yield of 9 mgd is already available for the City of Gainesville. Consequently, the additional water supply that would be available from the sources mentioned above is 99 mgd.
• Georgia Soil and Water Conservation Commission Flood Control Dams - The Georgia Soil and Water Conservation Commission in partnership with the Natural Resource Conservation Service and EPD performed an assessment to determine existing structures that could be modified to serve as dams for water supply reservoirs. More than 350 dams were assessed and prioritized as to water supply potential based on various engineering and environmental criteria. The results indicated that five flood control dams located within the District could potentially be modified to serve as dams for water supply reservoirs with a total estimated potential additional yield of 49 mgd.
• Georgia Inventory and Survey of Feasible Sites for Water Supply Reservoirs – In 2008 GEFA engaged a consulting team led by MACTEC Engineering and Consulting, Inc. (MACTEC) to inventory and survey existing public-water-supply reservoirs for their expansion potential. This study was based on the feasibility of increasing dam heights to provide more storage volume and performing supplemental pumping from nearby streams for reservoir filling. The results are reported in Georgia Inventory and Survey of Feasible Sites for Water Supply Reservoirs (October 31, 2008). Three existing reservoirs within the District have expansion potential. Together the expanded reservoirs could potentially provide 13.8 billion gallons (BG) of additional water supply storage. The study did not include detailed calculations of yield for these potential reservoirs and is not comparable with other sources in this report.
• Quarries – Rock quarries and surface mines, once abandoned, have little value for land development and could provide potential sites for water supply storage during emergencies or drought. Design considerations include the stability of the quarry walls, groundwater seepage, and proximity to raw water sources and water
3.0—EMERGENCY WATER SUPPLY SOURCES
3-5
treatment facilities. For this study a list of possible quarries was developed based on GIS mapping of 2009 land use data provided by the Atlanta Regional Commission.
The sizes and depths of 22 potential quarries that could be used for water storage were estimated using GIS and topographic maps. From this estimate, over 100 billion gallons of water storage is available that theoretically could provide water for several months. However, it is unreasonable to think that each of these quarries would be converted to water storage as most are still active quarry sites. In addition, the water stored is finite as there is little inflow to each quarry except by groundwater flow. Finally, the cost to develop a quarry into a water storage reservoir is very expensive. For example, the City of Atlanta has estimated it will cost $180 million to develop the 2.4 billion gallon Bellwood quarry located in the City of Atlanta.
• Groundwater – Groundwater is not a principal source of public water supply within the District due to the low yields available from the area’s aquifers. The District’s Water Metrics Report (February 2011) notes that less than 1 percent of the water supply within the District is from groundwater. QWSs within the District could pursue additional water supply from groundwater for emergency use. While groundwater can provide some relief as an alternate water supply for QWSs with relatively small demands, this source is not viable on a larger scale for meeting demands across the District during times of emergency.
3.3 Return Flows as Potential Emergency Water Supply Several municipalities within the District use indirect potable reuse to supplement existing water supply sources as part of a sustainable water supply system. In the planned return flow systems, treated water is pumped to a reservoir or lake for mixing with raw water to provide water supply.
The District’s WSWCMP indicates Lake Lanier receives return flows from several municipalities, including the cities of Gainesville and Flowery Branch and Gwinnett County. The Cobb County-Marietta Water Authority and the Cherokee County Water and Sewerage Authority return flows to Lake Allatoona.
The Clayton County Water Authority uses indirect potable reuse to supplement several water supply reservoirs. Once wastewater is treated, it is pumped to constructed wetlands where it is filtered naturally and returned to water supply reservoirs. This approach to sustainable water management allowed Clayton County reservoirs to remain near 80percent capacity during Georgia’s drought in 2007.
These return flows contribute to the development of a sustainable water supply, and both the state and federal governments should evaluate the feasibility of a credit for return flows into hydropower reservoirs and water supply rivers.
3.4 Factors Affecting Availability of Water Supply The feasibility of using the potential emergency water supplies described above depends on several factors including conveyance limits to WTPs, EPD permitting restrictions, and water quality.
3.4.1 Conveyance Factors Conveyance feasibility is a major consideration when assessing the practicality of using presently unused water sources to supply emergency water to the QWSs. Conveyance from new water sources would require construction of new pumping and piping infrastructure. The associated costs and permitting issues are key concerns and would depend heavily on the proximity of the water source(s) to the QWS(s) to be supplied. In addition, the choices for conveyance routes would be limited by natural topographical features and the presence of existing development and infrastructure, such as highways, railroads and residential housing, within the heavily developed District. These limitations could complicate conveyance layout and increase construction

3.0—EMERGENCY WATER SUPPLY SOURCES
3-6
costs. Detailed cost estimates would need to be performed to adequately assess the feasibility of conveying water from the potential water sources described earlier to the QWSs.
3.4.2 Water Withdrawal Permitting Factors Another requirement associated with using presently unused water sources is permitting. Water withdrawal is regulated by EPD, which has an established permitting system and associated requirements. There are a variety of issues that may affect the time required to permit new sources. These include: development of a water conservation plan and drought contingency plan, District audit requirements, and the 391-3-16-01 Criteria for Water Supply Watersheds.
3.4.3 Finished Water Quality The majority of current and prospective emergency water supply sources within the District are surface water supplies; thus, the treatment technologies to produce potable water are similar. The chemical and physical characteristics of the potable water within the various QWSs are similar; however, several QWSs treat their water differently, which creates the potential for water quality issues if waters from two systems are mixed. For example, blending water between Cobb County-Marietta Water Authority and systems on its border could cause noticeable precipitation of opaque, black or gray particles. If such an episode occurs, it would only pose an aesthetic problem for customers, but not a health risk. The precipitation is likely a result of one source using high pH for corrosion control and the other source using neutral pH and corrosion control inhibitors to protect against pipe corrosion. Another source of precipitation occurs when water flow is reversed, which results in particles that have settled in pipes being re-suspended or scale being pulled from the pipe as water flow is reversed when an interconnection is opened.
3.4.4 Source Water Quality To ensure the water quality of any new reservoir is protected, EPD may require collection of monthly or quarterly water quality monitoring data. Water quality may be monitored at various depths to identify the practical volume that can be used for the water supply. Factors that may contribute to water quality include land use within the water supply basin, and potential pollutant sources within the water supply basin. A source water assessment plan may be required for developing a new water supply source as well. The WTP targeted to receive emergency supply water may be evaluated to ensure the treatment process can handle the particular characteristics of the new supply.
4-1
4.0 Emergency Planning Benchmarks
The WSIRRA dictates that the emergency plan developed as part of this study should “evaluate risks and, where feasible, plan for a district-wide interconnection reliability target for immediate implementation of approximately 35 percent of the annual average daily demand and long-range district-wide interconnection reliability planning goal of approximately 65 percent of the annual average daily demand.” These general targets provided preliminary benchmarks for emergency planning in the study and the current (i.e., year 2006) and long-range (i.e., year 2035) water demands that were calculated for each QWS.
Year 2035 was selected as the future planning horizon as specified in the act; Year 2006 was selected to reflect current usage, because historical data were readily available for that year and are comparable to the current demand data utilized in the District’s WSWCMP. The emergency planning benchmarks (35 percent and 65 percent of annual average demands) represent a reduced usage pattern that could be achieved during short (3-12 months) emergencies while still meeting emergency water needs, such as eating, drinking, toilet flushing, fire fighting and hospital use. These targets were not intended to represent permanently achievable demand reductions.
4.1 Methodology for Calculating Demands The QWSs’ 2006 and 2035 demands were calculated using AAD values in units of mgd.
4.1.1 Current (2006) Water Demands The 2006 Water Demands were computed using the following formula:
2006 Total Demand = 2006 Withdrawal + 2006 Purchased Water (outside of the county) + 2006 Purchased Water (within the county)
The District’s Water Metrics Report (February 2011) provides values for 2006 withdrawals and the amounts of water purchased from outside of the county. The amounts of water purchased from QWSs within the county were obtained from multiple sources, including QWS data collection sheets, QWS personnel, and EPD data.
It should be noted that demand is counted for both internal customers and external customers (i.e., other QWSs to which water is sold). For example, Cherokee County withdrew 15.8 mgd in 2006 to meet the demands of its customers. Of that amount, 0.7 mgd was provided to the city of Canton QWS. The 0.7 mgd is also shown for the city of Canton QWS as a “2006 Purchased Within County” value. While the 0.7 mgd is included in both the Cherokee County and city of Canton demands, this is appropriate in that each system requires that amount of water to satisfy all of its customer demand.
Exhibit 4-1 lists the demand components and total demand calculated for each QWS for 2006.

4.0—EMERGENCY PLANNING BENCHMARKS
4-2
EXHIBIT 4-1 2006 Water Demands
County Qualified Water System
2006 Withdrawal
(AAD-mgd)
2006 Purchased Outside County
(AAD-mgd)
2006 Purchased
Within County
(AAD-mgd)
2006 Total Demand
(AAD-mgd)
Bartow Adairsville, City of 2.6 0.0 0.0 2.6 Bartow Bartow County 0.7 0.4 5.8 6.9 Bartow Cartersville, City of 13.9 0.0 0.0 13.9 Bartow Emerson, City of 0.2 0.0 0.1 0.3
Cherokee Canton, City of 2.7 0.0 0.7 3.4
Cherokee Cherokee County Water and Sewerage Authority 15.8 0.8 0.0 16.6
Clayton Clayton County Water Authority 29.7 0.0 0.0 29.7
Cobb Cobb County-Marietta Water Authority 98.2 0.0 0.0 98.2(1)
Cobb Cobb County Water System 0.0 0.0 66.3 66.3(1)
Cobb Marietta Power and Water 0.0 0.0 10.2 10.2(1)
Coweta Coweta County Water and Sewerage Authority 0.0 2.7 3.7 6.4
Coweta Newnan Utilities 7.0 0.0 0.0 7.0
Coweta Senoia, City of 0.3 0.0 0.0 0.3
DeKalb DeKalb County 82.8 0.0 0.0 82.8
Douglas Douglasville-Douglas
County Water and Sewer Authority
13.2 0.2 0.0 13.4
Fayette Fayette County Water System 9.5 0.0 0.0 9.5
Fayette Fayetteville, City of 1.6 0.0 0.3 1.9
Forsyth Cumming, City of 11.9 0.0 0.0 11.9
Forsyth Forsyth County Water and Sewer Department 6.8 0.6 4.5 11.9
Fulton Atlanta, City of 102.5 0.0 14.2 116.7(2)
Fulton Atlanta-Fulton County
Water Resources Commission
42.6 0.0 0.0 42.6(2)
Fulton East Point, City of 9.7 0.0 0.0 9.7
Fulton Fulton County Water System 0.0 0.0 28.4 28.4(2)
Fulton Palmetto, City of 0.4 0.0 0.0 0.5 Fulton Roswell, City of 1.2 0.0 2.4 3.6
Gwinnett Buford, City of 1.5 0.0 0.0 1.5 Gwinnett Gwinnett County 92.6 0.0 0.0 92.6
Hall Gainesville, City of 19.0 0.1 0.0 19.1
Henry Henry County Water and Sewerage Authority 15.9 0.5 0.0 16.4
Henry Locust Grove, City of 0.3 0.0 0.2 0.5

4.0—EMERGENCY PLANNING BENCHMARKS
4-3
EXHIBIT 4-1 2006 Water Demands
County Qualified Water System
2006 Withdrawal
(AAD-mgd)
2006 Purchased Outside County
(AAD-mgd)
2006 Purchased
Within County
(AAD-mgd)
2006 Total Demand
(AAD-mgd)
Henry McDonough, City of 1.3 0.0 0.1 1.4
Paulding Paulding County Water System 0.0 10.9 0.0 10.9(1)
Rockdale Rockdale Water Resources 11.4 0.0 0.0 11.4
(1) Demands listed for Cobb County Water System, Marietta Power and Water, and Paulding County Water System are a subset of the demand listed for Cobb County-Marietta Water Authority
(2) Demands listed for Fulton County Water System and a portion of the City of Atlanta’s demand is a subset of the demand listed for the Atlanta-Fulton County Water Resources Commission.
The calculated 2006 total demand values were verified through comparison with other QWS-provided information, data from EPD Water Use Reduction Forms, and hydraulic modeling data. The calculated demand values compared well with the information from these sources.
4.1.2 Projected (2035) Water Demands The District’s WSWCMP (May 2009) projects total water demands on a county-by-county basis for 2035. Although it does not provide individual QWS demands, it does list projected peak plant capacities for each QWS for 2035. These projected capacities for WTPs for each QWS were used to develop a percentage demand for each QWS. These percentages were then used to disaggregate total county demand to the individual QWSs. In most cases this method provided appropriate values for the individual QWS demands for 2035. However, for three of the smaller QWSs this method resulted in 2035 demands that were less than 2006 demands. In these cases, the 2006 demand was used for the 2035 demand. Additionally, some adjustments were made for the QWSs in Cobb and Fulton Counties to account for the large wholesale suppliers that provide a significant amount of water in these counties.
Exhibit 4-2 provides an example of how these demands were calculated for Cherokee County and Exhibit 4-3 summarizes the demands for all qualified systems.
EXHIBIT 4-2 Example demand calculation
QWS 2035 Plant
Capacity (PD-MGD) (1)
Percentage of PD-MGD
2035 Projected County Demand
(AAD-MGD) (2)
2035 Projected QWS Demand (AAD-MGD) (3)
Cherokee County WSA 53 53/71, (74.6%)
45
33.6
City of Canton 18 18/71, (25.4%) 11.4
Total 71 71/71, (100%) 45
(1) 2035 Plant Capacity figures were obtained from the District’s WSWCMP (2009) Appendix B (2) 2035 Projected County Demand (AAD-MGD) was obtained from the District’s WSWCMP (2009) Appendix B (3) 2035 Projected QWS Demand (AAD-MGD) was calculated using methodology described in 4.1.2.
CCWSA: 53/71 * 45 = 33.6, Canton: 18/71*45 = 11.4

4.0—EMERGENCY PLANNING BENCHMARKS
4-4
EXHIBIT 4-3 2035 Water Demands
County Qualified Water System 2035 Demand (AAD-mgd)
Bartow Adairsville, City of 3.6 Bartow Bartow County 18.3 Bartow Cartersville, City of 23.8 Bartow Emerson, City of 0.3 Cherokee Canton, City of 11.4 Cherokee Cherokee County Water and Sewerage Authority 33.6 Clayton Clayton County Water Authority 40.0 Cobb Cobb County-Marietta Water Authority 143.0(1) Cobb Cobb County Water System 98.8(1) Cobb Marietta Power and Water 10.2(1) Coweta Coweta County Water and Sewerage Authority 16.2 Coweta Newnan Utilities 12.4 Coweta Senoia, City of 0.4 DeKalb DeKalb County 106.0 Douglas Douglasville-Douglas County Water and Sewer Authority 22.1 Fayette Fayette County Water System 20.6 Fayette Fayetteville, City of 2.4 Forsyth Cumming, City of 20.8 Forsyth Forsyth County Water and Sewer Department 39.2 Fulton Atlanta, City of 154.8(2) Fulton Atlanta-Fulton County Water Resources Commission 86.0(2) Fulton East Point, City of 10.0 Fulton Fulton County Water System 54.1(2) Fulton Palmetto, City of 3.1 Fulton Roswell, City of 3.6 Gwinnett Buford, City of 2.9 Gwinnett Gwinnett County 137.1 Hall Gainesville, City of 52.0 Henry Henry County Water and Sewerage Authority 41.2 Henry Locust Grove, City of 0.5 Henry McDonough, City of 1.6 Paulding Paulding County Water System 47.0(1) Rockdale Rockdale Water Resources 17.0
(1) Demands listed for Cobb County Water System, Marietta Power and Water, and Paulding County Water System are a subset of the demand listed for Cobb County-Marietta Water Authority
(2) Demands listed for Fulton County Water System and a portion of the City of Atlanta’s demand is a subset of the demand listed for the Atlanta-Fulton County Water Resources Commission.
4.2 Reliability Targets The reliability targets identified in Exhibit 4-4 reflect the amount of water needed by each QWS to meet 35 percent and 65 percent of AAD demands for the duration of the emergency. Once these figures were calculated, an evaluation was conducted to ensure that essential water needs for both current and future conditions are less than these reduced levels of usage.

4.0—EMERGENCY PLANNING BENCHMARKS
4-5
Typically customers in the category of essential water needs are hospitals, nursing home/assisted living facilities, correctional facilities, and critical industry needs. For all QWSs, the essential water needs identified by the QWSs for their respective systems were less than the 35 percent and 65 percent immediate reliability targets (IRTs) and long-range reliability targets (LRRTs). Therefore, adjustments to the IRT and LRRT values are not necessary for any of the QWSs.
EXHIBIT 4-4 Reliability Target Verification
County Qualified Water System 2006
Demand (AAD-mgd)
35% IRT
(AAD-mgd)
65% IRT
(AAD-mgd)
2035 Demand (AAD-mgd)
35% LRRT (AAD-mgd)
65% LRRT (AAD-mgd)
Bartow Adairsville, City of 2.6 0.9 1.7 3.6 1.2 2.3
Bartow Bartow County 6.9 2.4 4.5 18.3 6.4 11.9
Bartow Cartersville, City of 13.9 4.9 9.0 23.8 8.3 15.5
Bartow Emerson, City of 0.3 0.1 0.2 0.3 0.1 0.2
Cherokee Canton, City of 3.4 1.2 2.2 11.4 4.0 7.4
Cherokee Cherokee County Water and Sewerage Authority 16.6 5.8 10.8 33.6 11.8 21.8
Clayton Clayton County Water Authority 29.7 10.4 19.3 40.0 14.0 26.0
Cobb Cobb County-Marietta Water Authority 98.2 34.4 63.8 143.0 50.1 93.0
Cobb Cobb County Water System 66.3 23.2 43.1 98.8 34.6 64.2
Cobb Marietta Power and Water 10.2 3.6 6.6 10.2 3.6 6.6
Coweta Coweta County Water and Sewerage Authority 6.4 2.2 4.2 16.2 5.7 10.6
Coweta Newnan Utilities 7.0 2.5 4.6 12.4 4.3 8.1
Coweta Senoia, City of 0.3 0.1 0.2 0.4 0.1 0.2
DeKalb DeKalb County 82.8 29.0 53.8 106.0 37.1 68.9
Douglas Douglasville-Douglas
County Water and Sewer Authority
13.4 4.7 8.7 22.1 7.7 14.4
Fayette Fayette County Water System 9.5 3.3 6.2 20.6 7.2 13.4
Fayette Fayetteville, City of 1.9 0.7 1.3 2.4 0.8 1.5
Forsyth Cumming, City of 11.9 4.2 7.8 20.8 7.3 13.5
Forsyth Forsyth County Water and Sewer Department 11.9 4.2 7.7 39.2 13.7 25.5
Fulton Atlanta, City of 116.7 40.9 75.9 154.8 54.2 100.6
Fulton Atlanta-Fulton County
Water Resources Commission
42.6 - - 86.0 - -
Fulton East Point, City of 9.7 3.4 6.3 10.0 3.5 6.5
Fulton Fulton County Water System 28.4 9.9 18.4 54.1 18.9 35.2
Fulton Palmetto, City of 0.5 0.2 0.3 3.1 1.1 2.0
Fulton Roswell, City of 3.6 1.2 2.3 3.6 1.3 2.3
Gwinnett Buford, City of 1.5 0.5 1.0 2.9 1.0 1.9 Gwinnett Gwinnett County 92.6 32.4 60.2 137.1 48.0 89.1

4.0—EMERGENCY PLANNING BENCHMARKS
4-6
EXHIBIT 4-4 Reliability Target Verification
County Qualified Water System 2006
Demand (AAD-mgd)
35% IRT
(AAD-mgd)
65% IRT
(AAD-mgd)
2035 Demand (AAD-mgd)
35% LRRT (AAD-mgd)
65% LRRT (AAD-mgd)
Hall Gainesville, City of 19.1 6.7 12.4 52.0 18.2 33.8
Henry Henry County Water and Sewerage Authority 16.4 5.7 10.7 41.2 14.4 26.8
Henry Locust Grove, City of 0.5 0.2 0.3 0.5 0.2 0.3
Henry McDonough, City of 1.4 0.5 0.9 1.6 0.6 1.0
Paulding Paulding County Water System 10.9 3.8 7.1 47.0 16.5 30.6
Rockdale Rockdale Water Resources 11.4 4.0 7.4 17.0 6.0 11.1

5-1
5.0 Water Supply Risk Evaluations
The following describes the emergency scenarios that were evaluated for each of the 33 QWSs, the methodology for those evaluations, and the critical scenarios selected for further hydraulic evaluation, which is described in Section 6.
5.1 Water Supply Risk Identification and Selection for Evaluation
The water supply risks and emergency scenarios evaluated in this study and the evaluation selection criteria used to determine which scenarios were assessed for which QWSs are shown in Exhibit 5-1.
EXHIBIT 5-1 Water Supply Risks and Emergency Scenarios
Water Supply Risk Emergency Scenario Type Duration (days)
Evaluation Selection Criteria
A. Failure of largest water treatment facility
A1. Power supply failure of largest WTP
Short-term Defined Duration
1 QWSs that receive water from a system-owned (or partially owned) WTP
A2. Critical asset failure at largest WTP (loss of flow splitting facility, filter gallery, clearwell, etc.)
Short-term Defined Duration
30
B. Short-term catastrophic failure of a water distribution system
Critical asset failure [loss of transmission main(s) from largest WTP or major connection to another system where water is purchased
Short-term Defined Duration
1 QWSs with a water distribution system
C. Short-term contamination of a water supply within distribution system
Contamination of distribution system (typically due to loss of pressure) triggers issuance of boil water notice
Short-term Defined Duration
3 QWSs that receive water from a system-owned (or partially owned) WTP
D. Short-term contamination of a raw water source
D1. Biological contamination of largest raw water source
Short-term Defined Duration
1 QWSs that receive water from a water source that supplies a system-owned (or partially owned) WTP
D2. Chemical contamination (fuel, industrial wastewater, etc.) of largest raw water source
Short-term Defined Duration
1

5.0—WATER SUPPLY RISK EVALUATIONS
5-2
EXHIBIT 5-1 Water Supply Risks and Emergency Scenarios
Water Supply Risk Emergency Scenario Type Duration (days)
Evaluation Selection Criteria
E. Full unavailability of major raw water sources due to federal or state government actions
- Long-term Undefined Duration
Long term (Undefined,
greater than 1 year)
QWSs that receive water directly from the Chattahoochee River and/or Lake Lanier as a water source
F. Limited or reduced availability of major raw water sources due to federal or state government actions
- Long-term Undefined Duration
Long term (Undefined,
greater than 1 year)
QWSs that receive water directly from the Chattahoochee River and/or Lake Lanier as a water source
G. Failure of an existing dam of a raw water supply
Dam failure for largest impoundment (temporary pump station would be required and dam repair required)
Short-term Defined Duration
30 QWSs that own (or partially own) a reservoir or other impoundment (Lake Lanier and Lake Allatoona are not considered reservoirs or impoundments for this risk)
H. Water supply reduction due to drought
Water supply available is 40% of AAD demand due to drought
Short-term (4 months)
Defined Duration
120 QWSs considered to be systems with reservoirs on small watersheds and no direct withdrawal from the Chattahoochee or Etowah Rivers
AAD = Annual Average Day
Water supply risks A through D and G identify short-term emergency scenarios, less than three days in most instances, but never more than 120 days. These scenarios represent the more traditional emergencies that utilities face and are typically prepared to address.
Risk H, the drought scenario, was added to the study scope because droughts can significantly affect QWS water supplies, especially those systems that are in the upper reaches of their watersheds. This risk was assessed only for systems considered most susceptible to drought, i.e., those with reservoirs in small watersheds with no direct withdrawal from the Chattahoochee or Etowah Rivers or the reservoirs located in those river basins. The drought scenario duration was assumed to be 120 days, because historically droughts in the area have been severe, but relatively short in duration. The deficits for this scenario were calculated using the assumption that once the drought is recognized, water managers will reduce their usage of their own limited water resources (local reservoir or wells) and will seek to maximize use of alternate emergency sources in order to extend the longevity of the local sources as far into the future as possible. To achieve this operational

5.0—WATER SUPPLY RISK EVALUATIONS
5-3
condition, it was assumed that each QWS would seek to meet no more than 40 percent of its projected AAD flow from local sources, with the remaining quantities needed to meet the 65 percent planning benchmark coming from alternate emergency sources.
Risks E and F apply to the QWSs that receive water directly from the large federally regulated Lake Lanier/Chattahoochee River and Allatoona Lake/Etowah River systems. It was assumed that these scenarios would last for a long period of time, perhaps indefinitely. The evaluation criteria for these two scenarios differ from those for the short-term emergencies, because the level of infrastructure and reliability and redundancy needed to provide water for a lengthy period of time is different and more intensive than that necessary for short durations.
However, emergency scenarios E and F were not evaluated further during the hydraulic evaluation. The WSIRRA provides that the "emergency plan shall evaluate risks..." related to, among other things, the unavailability of major raw water sources (O.C.G.A. § 12-5-202(b)-(c)). The 11th U.S. Circuit Court of Appeals recently issued a decision in the tri-state water litigation related to Lake Lanier, in which the court reversed the district court's 2009 decision. The decision of the 11th Circuit is still pending further appeal, and should it stand, the U.S. Army Corps of Engineers will take certain actions on remand to determine how much raw water is available for Georgia's use from Lake Lanier. All of these issues are vital to a proper evaluation of risk. Accordingly, further work will be necessary to complete this element of the emergency plan.
5.2 Water Supply Risk Evaluation 5.2.1 Overview of Risk Evaluation Methodology The purpose of the risk evaluation was to calculate the expected water deficits associated with each applicable emergency scenario.
Eight emergency scenarios were considered. Based on the criteria summarized in Exhibit 5-1, some scenarios were not applicable to all QWSs and were not evaluated. As outlined in Exhibit 5-2, the deficit is equal to the available water supply during each emergency minus the demand at the appropriate reliability target (see Exhibit 4-4). The reliability targets reflect the amount of water needed for each QWS to meet 35 percent and 65 percent of AAD demand for current and future conditions. These water demand values are constants in that they are not dependent on the emergency scenario. By contrast, the available water supply values are variables that depend on the emergency scenario.
To assess whether each QWS has sufficient water supply available under the various emergency scenarios, it was necessary to evaluate each QWS’s capability to produce water under the constraints of the respective emergency scenarios. Once the water supply availability was calculated for each scenario, then a deficit was established for each scenario.

5.0—WATER SUPPLY RISK EVALUATIONS
5-4
EXHIBIT 5-2 Risk Evaluation Methodology
Before the QWSs could be evaluated for each emergency scenario, it was necessary to calculate the maximum water production for each QWS. Because most of the emergency scenarios have a short term duration (less than 120 days), the water supply capacities were calculated based on maximum daily production capability rather than annual average day production. Each QWS was evaluated individually to determine its maximum daily production. The factors used to determine the maximum daily production included some or all of the following and are described below:
• Surface water supply (reservoir, river, etc.) capacity; • Groundwater supply capacity; • WTP capacity; • Water supply through regular purchased water interconnections (i.e., water purchased from other utilities
that was delivered via normally open interconnections); and • Water storage tank capacity in distribution system.
As shown in Exhibit 5-2, the deficit calculation is dependent on the calculated available water supply and demand. The following key components of the calculation were identified for each applicable emergency scenario:
• Total Water Source Capacity – The peak day total water capacity. For a QWS with multiple WTPs, the WTPs were listed individually and their capacities totaled.
• Capacity Loss Due to Emergency– The peak day capacity loss based on the characteristics of the QWS and the impact of the emergency scenario. For example, in emergency scenario A1, the largest WTP is assumed to be out of service when a power outage occurs, and the lost capacity used for this analysis would be that portion of the plant that is not supplied power by emergency generators. For emergency scenario C, short-term contamination of a water supply system, there would be no capacity loss, because a boil water notice would be issued and non-potable water would be delivered to customers. Specific assumptions for the various emergency scenarios are documented in Exhibit 5-3.
• Purchased Water Supply through Existing Normally Open Interconnections – The maximum hydraulic capacity of the interconnections used to regularly purchase water based on specific hydraulic criteria (pressure and velocity). The pressure and velocity data were provided by each QWS and were verified through hydraulic calculations or modeling. Section 6 includes a discussion of the methodologies used to develop the available quantities of purchased water for these QWSs.
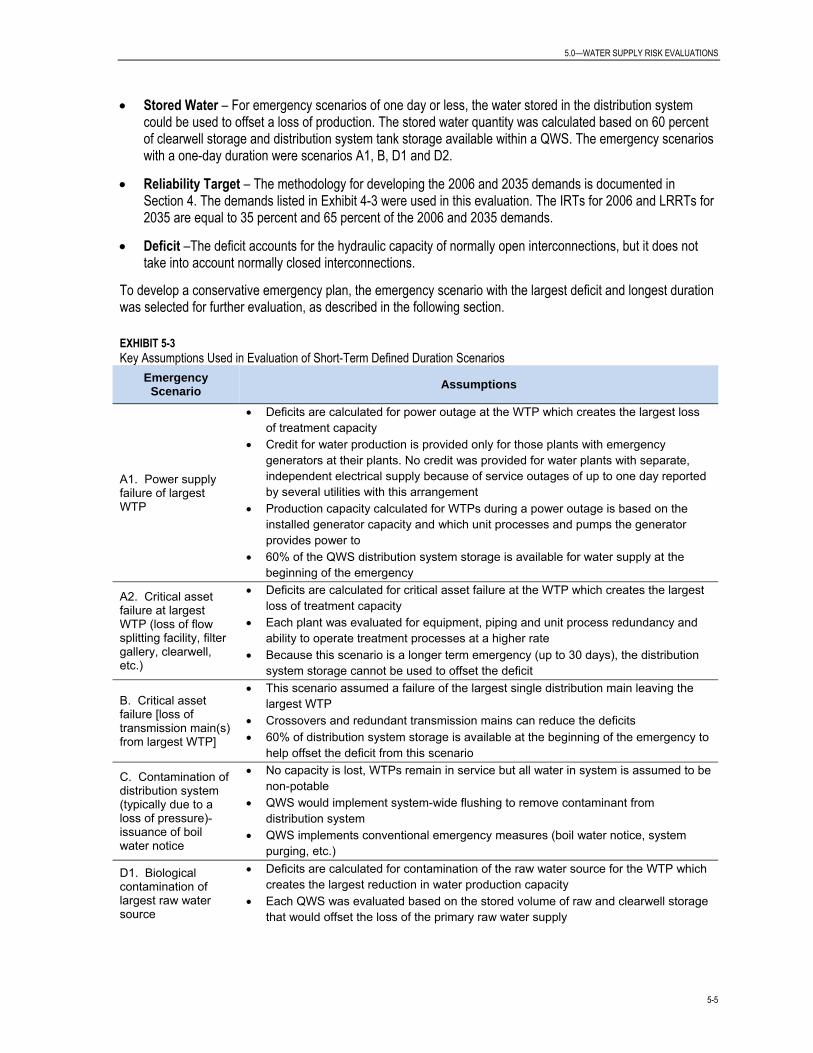
5.0—WATER SUPPLY RISK EVALUATIONS
5-5
• Stored Water – For emergency scenarios of one day or less, the water stored in the distribution system could be used to offset a loss of production. The stored water quantity was calculated based on 60 percent of clearwell storage and distribution system tank storage available within a QWS. The emergency scenarios with a one-day duration were scenarios A1, B, D1 and D2.
• Reliability Target – The methodology for developing the 2006 and 2035 demands is documented in Section 4. The demands listed in Exhibit 4-3 were used in this evaluation. The IRTs for 2006 and LRRTs for 2035 are equal to 35 percent and 65 percent of the 2006 and 2035 demands.
• Deficit –The deficit accounts for the hydraulic capacity of normally open interconnections, but it does not take into account normally closed interconnections.
To develop a conservative emergency plan, the emergency scenario with the largest deficit and longest duration was selected for further evaluation, as described in the following section.
EXHIBIT 5-3 Key Assumptions Used in Evaluation of Short-Term Defined Duration Scenarios
Emergency Scenario Assumptions
A1. Power supply failure of largest WTP
• Deficits are calculated for power outage at the WTP which creates the largest loss of treatment capacity
• Credit for water production is provided only for those plants with emergency generators at their plants. No credit was provided for water plants with separate, independent electrical supply because of service outages of up to one day reported by several utilities with this arrangement
• Production capacity calculated for WTPs during a power outage is based on the installed generator capacity and which unit processes and pumps the generator provides power to
• 60% of the QWS distribution system storage is available for water supply at the beginning of the emergency
A2. Critical asset failure at largest WTP (loss of flow splitting facility, filter gallery, clearwell, etc.)
• Deficits are calculated for critical asset failure at the WTP which creates the largest loss of treatment capacity
• Each plant was evaluated for equipment, piping and unit process redundancy and ability to operate treatment processes at a higher rate
• Because this scenario is a longer term emergency (up to 30 days), the distribution system storage cannot be used to offset the deficit
B. Critical asset failure [loss of transmission main(s) from largest WTP]
• This scenario assumed a failure of the largest single distribution main leaving the largest WTP
• Crossovers and redundant transmission mains can reduce the deficits • 60% of distribution system storage is available at the beginning of the emergency to
help offset the deficit from this scenario
C. Contamination of distribution system (typically due to a loss of pressure)- issuance of boil water notice
• No capacity is lost, WTPs remain in service but all water in system is assumed to be non-potable
• QWS would implement system-wide flushing to remove contaminant from distribution system
• QWS implements conventional emergency measures (boil water notice, system purging, etc.)
D1. Biological contamination of largest raw water source
• Deficits are calculated for contamination of the raw water source for the WTP which creates the largest reduction in water production capacity
• Each QWS was evaluated based on the stored volume of raw and clearwell storage that would offset the loss of the primary raw water supply

5.0—WATER SUPPLY RISK EVALUATIONS
5-6
EXHIBIT 5-3 Key Assumptions Used in Evaluation of Short-Term Defined Duration Scenarios
Emergency Scenario Assumptions
D2. Chemical contamination (fuel, industrial wastewater, etc.) of largest raw water source
• 60% of raw and finished water storage is available at the beginning of the emergency to help offset the loss of raw water
G. Dam failure for largest impoundment (temporary pump station would be required and dam repair required)
• Deficits are calculated for loss of raw water source • Because this scenario is a longer term emergency (up to 30 days), the distribution
system storage cannot be used to offset the deficit
H. Water supply available is 40% of AAD demand due to drought
• Relatively short drought that only affects systems in small watershed that do not use the Etowah River/Lake Allatoona or Chattahoochee River/Lake Lanier
• Assumes that once the drought is recognized, water managers will reduce their usage of their own limited water resources (local reservoir or wells) and will maximize the use of alternate emergency sources to extend the longevity of the local sources.
• Assumes that each system would seek to meet no more than 40% of their projected AAD demand from local sources.
• Longer term emergency (up to 120 days)
5.2.2 Key Assumptions for Deficit Calculations Computation of the deficit for each applicable short-term defined duration scenario depends on several foundational assumptions:
• Only the largest infrastructure element related to supply, treatment or distribution is out of service at one time.
• Only one emergency occurs at one time for scenarios A, B, C, D1 and D2 (i.e., no multi-system emergencies at one time).
• As part of the future water supply calculation for each QWS, it was assumed that all planned water plant production capacity additions or expansions will be implemented as defined in the District’s WSWCMP or a utility’s current water master plan or capital improvement program. It was assumed that these projects would be constructed by 2035; however, if these projects are reduced in scope or deleted, then the 2035 deficit calculations will need to be reevaluated. Cost estimates for these District-identified projects were not included in this study. Exhibit 5-4 summarizes some key District-identified projects.
• Systems may be able to exceed existing permitted withdrawal or treatment capacity during short (less than 30 days) duration emergencies with EPD approval.
• Water withdrawal limits in existing permits will not be reduced in the future, and existing water purchase contracts from adjacent QWSs will remain intact in the future.

5.0—WATER SUPPLY RISK EVALUATIONS
5-7
EXHIBIT 5-4 Key District-Identified Projects
County Qualified Water System 2009 District Recommended Projects
Bartow Adairsville, City of Adairsville WTP Expansion to 6 mgd
Bartow Bartow County New 30 mgd Etowah River WTP
Bartow Cartersville, City of Cartersville WTP Expansion to 40 mgd
Bartow Emerson, City of -
Cherokee Canton, City of Canton WTP Expansion to 18 mgd
Cherokee Cherokee County Water and Sewerage Authority
Cherokee County Water and Sewerage Authority Etowah River WTP Expansion to 53 mgd
Clayton Clayton County Water Authority WTP expansions totaling 37 mgd
Cobb Cobb County-Marietta Water Authority Quarles WTP Expansion to 106 mgd Wyckoff WTP Expansion to 142 mgd
Cobb Cobb County Water System - Cobb Marietta Power and Water -
Coweta Coweta County Water and Sewerage Authority B.T. Brown WTP Expansion to 10 mgd
Coweta Newnan Utilities Hershall Norred WTP Expansion to 21 mgd
Coweta Senoia, City of Senoia WTP Expansion to 0.6 mgd
DeKalb DeKalb County Scott Candler WTP Expansion to 175 mgd
Douglas Douglasville-Douglas County Water and Sewer Authority Bear Creek WTP Expansion to 23 mgd
Fayette Fayette County Water and Sewer Department
Fayette Crosstown WTP or South Fayette WTP Expansions to 35 mgd
Fayette Fayetteville, City of New off-stream storage for Fayetteville WTP
Forsyth Cumming, City of Cumming WTP Expansion to 36 mgd
Forsyth Forsyth County Water and Sewer Department Forsyth WTP Expansion to 68 mgd
Fulton Atlanta, City of -
Fulton Atlanta-Fulton County Water Resources Commission Atlanta-Fulton County WTP Expansion to 155 mgd
Fulton East Point, City of -
Fulton Fulton County Water System New 20 mgd Etowah WTP New 15 mgd Bear Creek WTP
Fulton Palmetto, City of -
Fulton Roswell, City of Roswell WTP Expansion to 5 mgd
Gwinnett Buford, City of Buford WTP Expansion to 4.83 mdg
Gwinnett Gwinnett County -
Hall Gainesville, City of Gainesville Lakeside WTP Expansion to 46 mgd New 12 mgd Gainesville/Hall County Cedar Creek WTP Construction
Henry Henry County Water and Sewerage Authority
Towaliga River WTP Expansion to 29 mgd Tussahaw WTP Expansion to 52 mgd and new reservoir
Henry Locust Grove, City of -
Henry McDonough, City of McDonough WTP Expansion to 3.1 mgd
Paulding Paulding County Water System New 40 mgd Paulding WTP
Rockdale Rockdale Water Resources Rockdale WTP Expansion to 32.1 mgd

5.0—WATER SUPPLY RISK EVALUATIONS
5-8
5.3 Water Supply Risk Selection for Further Evaluation Exhibit 5-5 summarizes the calculated deficits for the IRT and LRRT demand conditions. Emergency scenarios marked with an N/A were not applicable for the particular QWS, and emergency scenarios with dashes did not have a deficit (i.e., zero or a surplus). Of the 33 QWSs, eight did not have a deficit or were evaluated as part of another QWS (e.g., Cobb County Water System and Marietta Power and Water were evaluated as part of the Cobb County-Marietta Water Authority system).
For each QWS experiencing more than one deficit, the highest deficit with the longest duration scenario was selected for additional evaluation. These are called the Critical Scenario Deficits.
Those QWSs without Critical Scenario Deficits have sufficient emergency readiness, i.e., they are ready to meet the IRT and LRRT demands for all emergency scenarios applicable to them. The QWSs with Critical Scenario Deficits are at various stages of readiness depending on the availability and hydraulic capacities of their existing interconnections, their possibilities for new interconnections, and their already planned projects described in the District’s WSWCMP.

100% Demand
35% Demand
65% Demand
35% IRT Deficit
65% IRT Deficit
100% Demand
35% Demand
65% Demand
35% LRRT Deficit
65% LRRT Deficit
A1, 1 4.0 2.6 0.9 1.7 - - 6.0 3.6 1.3 2.3 - -A2, 30 0.0 2.6 0.9 1.7 0.9 1.7 0.0 3.6 1.3 2.3 1.3 2.3
B, 1 0.0 2.6 0.9 1.7 0.9 1.7 0.0 3.6 1.3 2.3 1.3 2.3C, 3 4.0 2.6 0.9 1.7 - - 6.0 3.6 1.3 2.3 - -
D1, 1 0.0 2.6 0.9 1.7 0.9 1.7 0.0 3.6 1.3 2.3 1.3 2.3D2, 1 0.0 2.6 0.9 1.7 0.9 1.7 0.0 3.6 1.3 2.3 1.3 2.3
E, 365+ N/A N/A N/A N/A N/A N/A N/A N/A N/A N/A N/A N/AF, 365+ N/A N/A N/A N/A N/A N/A N/A N/A N/A N/A N/A N/AG, 30 N/A N/A N/A N/A N/A N/A N/A N/A N/A N/A N/A N/AH, 120 1.0 2.6 0.9 1.7 - 0.7 1.6 3.6 1.3 2.3 - 0.7A1, 1 32.8 6.9 2.4 4.5 - - 33.6 18.3 6.4 11.9 - -A2, 30 32.8 6.9 2.4 4.5 - - 33.6 18.3 6.4 11.9 - -B, 1 32.8 6.9 2.4 4.5 - - 33.6 18.3 6.4 11.9 - -C, 3 32.8 6.9 2.4 4.5 - - 63.6 18.3 6.4 11.9 - -
D1, 1 32.8 6.9 2.4 4.5 - - 63.6 18.3 6.4 11.9 - -D2, 1 32.8 6.9 2.4 4.5 - - 63.6 18.3 6.4 11.9 - -
E, 365+ N/A N/A N/A N/A N/A N/A N/A N/A N/A N/A N/A N/AF, 365+ N/A N/A N/A N/A N/A N/A N/A N/A N/A N/A N/A N/AG, 30 N/A N/A N/A N/A N/A N/A N/A N/A N/A N/A N/A N/AH, 120 N/A N/A N/A N/A N/A N/A N/A N/A N/A N/A N/A N/AA1, 1 27.0 13.9 4.9 9.0 - - 40.0 23.8 8.3 15.5 - -A2, 30 0.0 13.9 4.9 9.0 4.9 9.0 0.0 23.8 8.3 15.5 8.3 15.5
B, 1 0.0 13.9 4.9 9.0 4.9 9.0 0.0 23.8 8.3 15.5 8.3 15.5C, 3 27.0 13.9 4.9 9.0 - - 40.0 23.8 8.3 15.5 - -
D1, 1 0.0 13.9 4.9 9.0 4.9 9.0 0.0 23.8 8.3 15.5 8.3 15.5D2, 1 0.0 13.9 4.9 9.0 4.9 9.0 0.0 23.8 8.3 15.5 8.3 15.5
E, 365+ N/A N/A N/A N/A N/A N/A N/A N/A N/A N/A N/A N/AF, 365+ N/A N/A N/A N/A N/A N/A N/A N/A N/A N/A N/A N/AG, 30 N/A N/A N/A N/A N/A N/A N/A N/A N/A N/A N/A N/AH, 120 N/A N/A N/A N/A N/A N/A N/A N/A N/A N/A N/A N/AA1, 1 0.5 0.3 0.1 0.2 - - 0.5 0.3 0.1 0.2 - -A2, 30 0.0 0.3 0.1 0.2 0.1 0.2 0.0 0.3 0.1 0.2 0.1 0.2
B, 1 0.0 0.3 0.1 0.2 0.1 0.2 0.0 0.3 0.1 0.2 0.1 0.2C, 3 0.5 0.3 0.1 0.2 - - 0.5 0.3 0.1 0.2 - -
D1, 1 0.0 0.3 0.1 0.2 0.1 0.2 0.0 0.3 0.1 0.2 0.1 0.2D2, 1 0.0 0.3 0.1 0.2 0.1 0.2 0.0 0.3 0.1 0.2 0.1 0.2
E, 365+ N/A N/A N/A N/A N/A N/A N/A N/A N/A N/A N/A N/AF, 365+ N/A N/A N/A N/A N/A N/A N/A N/A N/A N/A N/A N/AG, 30 N/A N/A N/A N/A N/A N/A N/A N/A N/A N/A N/A N/AH, 120 0.1 0.3 0.1 0.2 - 0.1 0.1 0.3 0.1 0.2 - 0.1
Bartow Bartow County Water Department
Bartow Cartersville, City of
Bartow Emerson, City of
Bartow Adairsville, City of
Risk Scenario, Duration (Days)
Qualified Water SystemCounty
EXHIBIT 5-5Deficit Summary
2006 Demands (AAD-mgd)Normal Operating Deficit
for Critical Scenario (AAD-mgd)1
2035 Demands (AAD-mgd)Normal Operating Deficit for Critical Scenario (AAD-
mgd)1
2006 Available
Water Supply (mgd)
2035 Available
Water Supply (mgd)

100% Demand
35% Demand
65% Demand
35% IRT Deficit
65% IRT Deficit
100% Demand
35% Demand
65% Demand
35% LRRT Deficit
65% LRRT Deficit
Risk Scenario, Duration (Days)
Qualified Water SystemCounty
EXHIBIT 5-5Deficit Summary
2006 Demands (AAD-mgd)Normal Operating Deficit
for Critical Scenario (AAD-mgd)1
2035 Demands (AAD-mgd)Normal Operating Deficit for Critical Scenario (AAD-
mgd)1
2006 Available
Water Supply (mgd)
2035 Available
Water Supply (mgd)
A1, 1 1.6 3.4 1.2 2.2 - 0.6 2.8 11.4 4.0 7.4 1.2 4.6A2, 30 1.1 3.4 1.2 2.2 0.1 1.1 1.1 11.4 4.0 7.4 2.9 6.3
B, 1 1.1 3.4 1.2 2.2 0.1 1.1 1.1 11.4 4.0 7.4 2.9 6.3C, 3 6.6 3.4 1.2 2.2 - - 19.1 11.4 4.0 7.4 - -
D1, 1 1.1 3.4 1.2 2.2 0.1 1.1 1.1 11.4 4.0 7.4 2.9 6.3D2, 1 1.1 3.4 1.2 2.2 0.1 1.1 1.1 11.4 4.0 7.4 2.9 6.3
E, 365+ 1.0 N/A N/A N/A N/A N/A N/A N/A N/A N/A N/A N/AF, 365+ 1.0 N/A N/A N/A N/A N/A N/A N/A N/A N/A N/A N/AG, 30 6.6 3.4 1.2 2.2 - - 6.6 11.4 4.0 7.4 - 0.9H, 120 N/A N/A N/A N/A N/A N/A N/A N/A N/A N/A N/A N/AA1, 1 18.0 16.6 5.8 10.8 - - 33.0 33.6 11.8 21.8 - -A2, 30 38.0 16.6 5.8 10.8 - - 53.0 33.6 11.8 21.8 - -B, 1 10.2 16.6 5.8 10.8 - 0.6 10.2 33.6 11.8 21.8 1.6 11.6C, 3 38.0 16.6 5.8 10.8 - - 53.0 33.6 11.8 21.8 - -
D1, 1 21.6 16.6 5.8 10.8 - - 21.6 33.6 11.8 21.8 - 0.2D2, 1 21.6 16.6 5.8 10.8 - - 21.6 33.6 11.8 21.8 - 0.2
E, 365+ N/A N/A N/A N/A N/A N/A N/A N/A N/A N/A N/A N/AF, 365+ N/A N/A N/A N/A N/A N/A N/A N/A N/A N/A N/A N/AG, 30 6.5 16.6 5.8 10.8 - 4.3 6.5 33.6 11.8 21.8 5.3 15.3H, 120 N/A N/A N/A N/A N/A N/A N/A N/A N/A N/A N/A N/AA1, 1 29.5 29.7 10.4 19.3 - - 63.5 40.0 14.0 26.0 - -A2, 30 19.5 29.7 10.4 19.3 - - 47.5 40.0 14.0 26.0 - -B, 1 19.5 29.7 10.4 19.3 - - 47.5 40.0 14.0 26.0 - -C, 3 39.5 29.7 10.4 19.3 - - 79.5 40.0 14.0 26.0 - -
D1, 1 19.5 29.7 10.4 19.3 - - 47.5 40.0 14.0 26.0 - -D2, 1 19.5 29.7 10.4 19.3 - - 47.5 40.0 14.0 26.0 - -
E, 365+ N/A N/A N/A N/A N/A N/A N/A N/A N/A N/A N/A N/AF, 365+ N/A N/A N/A N/A N/A N/A N/A N/A N/A N/A N/A N/AG, 30 19.5 29.7 10.4 19.3 - - 42.5 40.0 14.0 26.0 - -H, 120 N/A N/A N/A N/A N/A N/A N/A N/A N/A N/A N/A N/AA1, 1 72.0 98.2 34.4 63.8 - - 106.0 143.0 50.1 93.0 - -A2, 30 72.0 98.2 34.4 63.8 - - 106.0 143.0 50.1 93.0 - -B, 1 72.0 98.2 34.4 63.8 - - 106.0 143.0 50.1 93.0 - -C, 3 158.0 98.2 34.4 63.8 - - 248.0 143.0 50.1 93.0 - -
D1, 1 86.0 98.2 34.4 63.8 - - 106.0 143.0 50.1 93.0 - -D2, 1 86.0 98.2 34.4 63.8 - - 106.0 143.0 50.1 93.0 - -
E, 365+ 84.0 98.2 34.4 63.8 - - 112.5 143.0 50.1 93.0 - -F, 365+ 98.2 98.2 34.4 63.8 - - 126.7 143.0 50.1 93.0 - -G, 30 N/A N/A N/A N/A N/A N/A N/A N/A N/A N/A N/A N/AH, 120 N/A N/A N/A N/A N/A N/A N/A N/A N/A N/A N/A N/A
Cobb
Cobb County-Marietta Water Authority,
Cobb County Water System,
Marietta Power and Water
Cherokee Canton, City of
Cherokee Cherokee County Water and Sewerage Authority
Clayton Clayton County Water Authority

100% Demand
35% Demand
65% Demand
35% IRT Deficit
65% IRT Deficit
100% Demand
35% Demand
65% Demand
35% LRRT Deficit
65% LRRT Deficit
Risk Scenario, Duration (Days)
Qualified Water SystemCounty
EXHIBIT 5-5Deficit Summary
2006 Demands (AAD-mgd)Normal Operating Deficit
for Critical Scenario (AAD-mgd)1
2035 Demands (AAD-mgd)Normal Operating Deficit for Critical Scenario (AAD-
mgd)1
2006 Available
Water Supply (mgd)
2035 Available
Water Supply (mgd)
A1, 1 21.2 6.4 2.2 4.2 - - 23.5 16.2 5.7 10.5 - -A2, 30 13.5 6.4 2.2 4.2 - - 13.5 16.2 5.7 10.5 - -B, 1 13.5 6.4 2.2 4.2 - - 13.5 16.2 5.7 10.5 - -C, 3 21.2 6.4 2.2 4.2 - - 23.5 16.2 5.7 10.5 - -
D1, 1 13.5 6.4 2.2 4.2 - - 13.5 16.2 5.7 10.5 - -D2, 1 13.5 6.4 2.2 4.2 - - 13.5 16.2 5.7 10.5 - -
E, 365+ N/A N/A N/A N/A N/A N/A N/A N/A N/A N/A N/A N/AF, 365+ N/A N/A N/A N/A N/A N/A N/A N/A N/A N/A N/A N/AG, 30 13.5 6.4 2.2 4.2 - - 13.5 16.2 5.7 10.5 - -H, 120 2.6 6.4 2.2 4.2 - 1.6 6.4 16.2 5.7 10.5 - 4.1A1, 1 14.0 7.0 2.5 4.6 - - 21.0 12.4 4.3 8.1 - -A2, 30 0.0 7.0 2.5 4.6 2.5 4.6 0.0 12.4 4.3 8.1 4.3 8.1
B, 1 0.0 7.0 2.5 4.6 2.5 4.6 0.0 12.4 4.3 8.1 4.3 8.1C, 3 14.0 7.0 2.5 4.6 - - 21.0 12.4 4.3 8.1 - -
D1, 1 14.0 7.0 2.5 4.6 - - 21.0 12.4 4.3 8.1 - -D2, 1 14.0 7.0 2.5 4.6 - - 21.0 12.4 4.3 8.1 - -
E, 365+ N/A N/A N/A N/A N/A N/A N/A N/A N/A N/A N/A N/AF, 365+ N/A N/A N/A N/A N/A N/A N/A N/A N/A N/A N/A N/AG, 30 14.0 7.0 2.5 4.6 - - 21.0 12.4 4.3 8.1 - -H, 120 2.8 7.0 2.5 4.6 - 1.8 4.8 12.4 4.3 8.1 - 3.3A1, 1 0.3 0.3 0.1 0.2 - - 0.3 0.4 0.1 0.3 - -A2, 30 0.3 0.3 0.1 0.2 - - 0.3 0.4 0.1 0.3 - -B, 1 0.3 0.3 0.1 0.2 - - 0.3 0.4 0.1 0.3 - -C, 3 0.7 0.3 0.1 0.2 - - 0.9 0.4 0.1 0.3 - -
D1, 1 0.3 0.3 0.1 0.2 - - 0.3 0.4 0.1 0.3 - -D2, 1 0.3 0.3 0.1 0.2 - - 0.3 0.4 0.1 0.3 - -
E, 365+ N/A N/A N/A N/A N/A N/A N/A N/A N/A N/A N/A N/AF, 365+ N/A N/A N/A N/A N/A N/A N/A N/A N/A N/A N/A N/AG, 30 0.3 0.3 0.1 0.2 - - 0.3 0.4 0.1 0.3 - -H, 120 0.4 0.3 0.1 0.2 - - 0.2 0.4 0.1 0.3 - 0.1A1, 1 128.0 82.8 29.0 53.8 - - 175.0 106.0 37.1 68.9 - -A2, 30 0.0 82.8 29.0 53.8 29.0 53.8 0.0 106.0 37.1 68.9 37.1 68.9
B, 1 100.0 82.8 29.0 53.8 - - 100.0 106.0 37.1 68.9 - -C, 3 128.0 82.8 29.0 53.8 - - 175.0 106.0 37.1 68.9 - -
D1, 1 128.0 82.8 29.0 53.8 - - 175.0 106.0 37.1 68.9 - -D2, 1 128.0 82.8 29.0 53.8 - - 175.0 106.0 37.1 68.9 - -
E, 365+ 10.0 82.8 29.0 53.8 19.0 43.8 10.0 106.0 37.1 68.9 27.1 58.9F, 365+ 82.8 82.8 29.0 53.8 - - 82.8 106.0 37.1 68.9 - -G, 30 0.0 82.8 29.0 53.8 29.0 53.8 0.0 106.0 37.1 68.9 37.1 68.9H, 120 N/A N/A N/A N/A N/A N/A N/A N/A N/A N/A N/A N/A
Coweta Newnan Utilities
Coweta Senoia, City of
DeKalb DeKalb County
Coweta Coweta County Water and Sewerage Authority

100% Demand
35% Demand
65% Demand
35% IRT Deficit
65% IRT Deficit
100% Demand
35% Demand
65% Demand
35% LRRT Deficit
65% LRRT Deficit
Risk Scenario, Duration (Days)
Qualified Water SystemCounty
EXHIBIT 5-5Deficit Summary
2006 Demands (AAD-mgd)Normal Operating Deficit
for Critical Scenario (AAD-mgd)1
2035 Demands (AAD-mgd)Normal Operating Deficit for Critical Scenario (AAD-
mgd)1
2006 Available
Water Supply (mgd)
2035 Available
Water Supply (mgd)
A1, 1 23.0 13.4 4.7 8.7 - - 23.0 22.1 7.7 14.4 - -A2, 30 0.0 13.4 4.7 8.7 4.7 8.7 0.0 22.1 7.7 14.4 7.7 14.4
B, 1 0.0 13.4 4.7 8.7 4.7 8.7 0.0 22.1 7.7 14.4 7.7 14.4C, 3 23.0 13.4 4.7 8.7 - - 23.0 22.1 7.7 14.4 - -
D1, 1 6.4 13.4 4.7 8.7 - 2.3 6.4 22.1 7.7 14.4 1.3 8.0D2, 1 6.4 13.4 4.7 8.7 - 2.3 6.4 22.1 7.7 14.4 1.3 8.0
E, 365+ N/A N/A N/A N/A N/A N/A N/A N/A N/A N/A N/A N/AF, 365+ N/A N/A N/A N/A N/A N/A N/A N/A N/A N/A N/A N/AG, 30 6.4 13.4 4.7 8.7 - 2.3 6.4 22.1 7.7 14.4 1.3 8.0H, 120 5.4 13.4 4.7 8.7 - 3.4 8.8 22.1 7.7 14.4 - 5.6A1, 1 23.3 9.5 3.3 6.2 - - 16.9 20.6 7.2 13.4 - -A2, 30 13.9 9.5 3.3 6.2 - - 16.9 20.6 7.2 13.4 - -B, 1 13.9 9.5 3.3 6.2 - - 16.9 20.6 7.2 13.4 - -C, 3 27.4 9.5 3.3 6.2 - - 42.7 20.6 7.2 13.4 - -
D1, 1 30.7 9.5 3.3 6.2 - - 32.7 20.6 7.2 13.4 - -D2, 1 30.7 9.5 3.3 6.2 - - 32.7 20.6 7.2 13.4 - -
E, 365+ N/A N/A N/A N/A N/A N/A N/A N/A N/A N/A N/A N/AF, 365+ N/A N/A N/A N/A N/A N/A N/A N/A N/A N/A N/A N/AG, 30 26.7 9.5 3.3 6.2 - - 26.7 20.6 7.2 13.4 - -H, 120 10.6 9.5 3.3 6.2 - - 15.2 20.6 7.2 13.4 - -A1, 1 9.8 1.9 0.7 1.2 - - 9.8 2.4 0.8 1.6 - -A2, 30 5.8 1.9 0.7 1.2 - - 5.8 2.4 0.8 1.6 - -B, 1 5.8 1.9 0.7 1.2 - - 5.8 2.4 0.8 1.6 - -C, 3 9.8 1.9 0.7 1.2 - - 9.8 2.4 0.8 1.6 - -
D1, 1 5.8 1.9 0.7 1.2 - - 5.8 2.4 0.8 1.6 - -D2, 1 5.8 1.9 0.7 1.2 - - 5.8 2.4 0.8 1.6 - -
E, 365+ N/A N/A N/A N/A N/A N/A N/A N/A N/A N/A N/A N/AF, 365+ N/A N/A N/A N/A N/A N/A N/A N/A N/A N/A N/A N/AG, 30 N/A N/A N/A N/A N/A N/A N/A N/A N/A N/A N/A N/AH, 120 0.8 1.9 0.7 1.2 - 0.5 0.8 2.4 0.8 1.6 - 0.8A1, 1 2.6 11.9 4.2 7.7 1.6 5.1 2.6 20.8 7.3 13.5 4.7 10.9A2, 30 0.0 11.9 4.2 7.7 4.2 7.7 0.0 20.8 7.3 13.5 7.3 13.5
B, 1 2.6 11.9 4.2 7.7 1.6 5.1 2.6 20.8 7.3 13.5 4.7 10.9C, 3 24.0 11.9 4.2 7.7 - - 36.0 20.8 7.3 13.5 - -
D1, 1 4.4 11.9 4.2 7.7 - 3.3 4.4 20.8 7.3 13.5 2.9 9.7D2, 1 4.4 11.9 4.2 7.7 - 3.3 4.4 20.8 7.3 13.5 2.9 9.1
E, 365+ 0.0 11.9 4.2 7.7 4.2 7.7 0.0 20.8 7.3 13.5 7.3 13.5F, 365+ 11.9 11.9 4.2 7.7 - - 11.9 20.8 7.3 13.5 - 1.6G, 30 N/A N/A N/A N/A N/A N/A N/A N/A N/A N/A N/A N/AH, 120 N/A N/A N/A N/A N/A N/A N/A N/A N/A N/A N/A N/A
Forsyth Cumming, City of
Douglas DDCWSA
Fayette Fayette County Water System
Fayette Fayetteville, City of

100% Demand
35% Demand
65% Demand
35% IRT Deficit
65% IRT Deficit
100% Demand
35% Demand
65% Demand
35% LRRT Deficit
65% LRRT Deficit
Risk Scenario, Duration (Days)
Qualified Water SystemCounty
EXHIBIT 5-5Deficit Summary
2006 Demands (AAD-mgd)Normal Operating Deficit
for Critical Scenario (AAD-mgd)1
2035 Demands (AAD-mgd)Normal Operating Deficit for Critical Scenario (AAD-
mgd)1
2006 Available
Water Supply (mgd)
2035 Available
Water Supply (mgd)
A1, 1 14.3 11.9 4.2 7.7 - - 14.3 39.2 13.7 25.5 - 11.2A2, 30 5.9 11.9 4.2 7.7 - 1.8 5.9 39.2 13.7 25.5 7.8 19.6
B, 1 14.3 11.9 4.2 7.7 - - 14.3 39.2 13.7 25.5 - 11.2C, 3 34.6 11.9 4.2 7.7 - - 73.9 39.2 13.7 25.5 - -
D1, 1 23.4 11.9 4.2 7.7 - - 23.1 39.2 13.7 25.5 - 2.4D2, 1 23.4 11.9 4.2 7.7 - - 23.4 39.2 13.7 25.5 - 2.1
E, 365+ 0.0 11.9 4.2 7.7 4.2 7.7 0.0 39.2 13.7 25.5 13.7 25.5F, 365+ 16.5 11.9 4.2 7.7 - - 16.5 39.2 13.7 25.5 - 9.0G, 30 N/A N/A N/A N/A N/A N/A N/A N/A N/A N/A N/A N/AH, 120 N/A N/A N/A N/A N/A N/A N/A N/A N/A N/A N/A N/AA1, 1 246.4 116.7 40.8 75.9 - - 278.9 154.8 54.2 100.6 - -A2, 30 109.9 116.7 40.8 75.9 - - 142.4 154.8 54.2 100.6 - -B, 1 127.9 116.7 40.8 75.9 - - 142.4 154.8 54.2 100.6 - -C, 3 264.4 116.7 40.8 75.9 - - 278.9 154.8 54.2 100.6 - -
D1, 1 225.0 116.7 40.8 75.9 - - 278.9 154.8 54.2 100.6 - -D2, 1 225.0 116.7 40.8 75.9 - - 278.9 154.8 54.2 100.6 - -
E, 365+ 14.5 116.7 40.8 75.9 26.3 61.4 14.5 154.8 54.2 100.6 39.7 86.1F, 365+ 138.0 116.7 40.8 75.9 - - 138.0 154.8 54.2 100.6 - -G, 30 246.4 116.7 40.8 75.9 - - 278.9 154.8 54.2 100.6 - -H, 120 N/A N/A N/A N/A N/A N/A N/A N/A N/A N/A N/A N/AA1, 1 N/A N/A N/A N/A N/A N/A N/A N/A N/A N/A N/A N/AA2, 30 N/A N/A N/A N/A N/A N/A N/A N/A N/A N/A N/A N/AB, 1 N/A N/A N/A N/A N/A N/A N/A N/A N/A N/A N/A N/AC, 3 N/A N/A N/A N/A N/A N/A N/A N/A N/A N/A N/A N/A
D1, 1 N/A N/A N/A N/A N/A N/A N/A N/A N/A N/A N/A N/AD2, 1 N/A N/A N/A N/A N/A N/A N/A N/A N/A N/A N/A N/A
E, 365+ N/A N/A N/A N/A N/A N/A N/A N/A N/A N/A N/A N/AF, 365+ N/A N/A N/A N/A N/A N/A N/A N/A N/A N/A N/A N/AG, 30 N/A N/A N/A N/A N/A N/A N/A N/A N/A N/A N/A N/AH, 120 N/A N/A N/A N/A N/A N/A N/A N/A N/A N/A N/A N/AA1, 1 10.0 9.7 3.4 6.3 - - 10.0 10.0 3.5 6.5 - -A2, 30 0.0 9.7 3.4 6.3 3.4 6.3 0.0 10.0 3.5 6.5 3.5 6.5
B, 1 0.0 9.7 3.4 6.3 3.4 6.3 0.0 10.0 3.5 6.5 3.5 6.5C, 3 13.9 9.7 3.4 6.3 - - 13.9 10.0 3.5 6.5 - -
D1, 1 13.9 9.7 3.4 6.3 - - 13.9 10.0 3.5 6.5 - -D2, 1 13.9 9.7 3.4 6.3 - - 13.9 10.0 3.5 6.5 - -
E, 365+ N/A N/A N/A N/A N/A N/A N/A N/A N/A N/A N/A N/AF, 365+ N/A N/A N/A N/A N/A N/A N/A N/A N/A N/A N/A N/AG, 30 13.2 9.7 3.4 6.3 - - 13.9 10.0 3.5 6.5 - -H, 120 3.9 9.7 3.4 6.3 - 2.4 4.0 10.0 3.5 6.5 - 2.5
Fulton Atlanta-Fulton County Water Resources Commission
Fulton East Point, City of
Forsyth Forsyth County Water and Sewer Department
Fulton Atlanta, City of

100% Demand
35% Demand
65% Demand
35% IRT Deficit
65% IRT Deficit
100% Demand
35% Demand
65% Demand
35% LRRT Deficit
65% LRRT Deficit
Risk Scenario, Duration (Days)
Qualified Water SystemCounty
EXHIBIT 5-5Deficit Summary
2006 Demands (AAD-mgd)Normal Operating Deficit
for Critical Scenario (AAD-mgd)1
2035 Demands (AAD-mgd)Normal Operating Deficit for Critical Scenario (AAD-
mgd)1
2006 Available
Water Supply (mgd)
2035 Available
Water Supply (mgd)
A1, 1 45.0 28.4 9.9 18.5 - - 97.5 54.1 18.9 35.2 - -A2, 30 0.0 28.4 9.9 18.5 9.9 18.5 20.0 54.1 18.9 35.2 - 15.2
B, 1 14.7 28.4 9.9 18.5 - 3.7 34.7 54.1 18.9 35.2 - 0.4C, 3 45.0 28.4 9.9 18.5 - - 97.5 54.1 18.9 35.2 - -
D1, 1 45.0 28.4 9.9 18.5 - - 97.5 54.1 18.9 35.2 - -D2, 1 45.0 28.4 9.9 18.5 - - 97.5 54.1 18.9 35.2 - -
E, 365+ 2.5 28.4 9.9 18.5 7.4 16.0 17.5 54.1 18.9 35.2 1.4 17.7F, 365+ 21.3 28.4 9.9 18.5 - - 36.3 54.1 18.9 35.2 - -G, 30 45.0 28.4 9.9 18.5 - - 97.5 54.1 18.9 35.2 - -H, 120 N/A N/A N/A N/A N/A N/A N/A N/A N/A N/A N/A N/AA1, 1 0.2 0.5 0.2 0.3 - 0.1 0.8 3.1 1.1 2.0 0.3 1.2A2, 30 0.0 0.5 0.2 0.3 0.2 0.3 0.6 3.1 1.1 2.0 0.5 1.4
B, 1 0.2 0.5 0.2 0.3 - 0.1 0.8 3.1 1.1 2.0 0.3 1.2C, 3 0.6 0.5 0.2 0.3 - - 5.6 3.1 1.1 2.0 - -
D1, 1 0.3 0.5 0.2 0.3 - 0.1 0.9 3.1 1.1 2.0 0.2 1.2D2, 1 0.3 0.5 0.2 0.3 - 0.1 0.9 3.1 1.1 2.0 0.2 1.2
E, 365+ N/A N/A N/A N/A N/A N/A N/A N/A N/A N/A N/A N/AF, 365+ N/A N/A N/A N/A N/A N/A N/A N/A N/A N/A N/A N/AG, 30 0.0 0.5 0.2 0.3 0.2 0.3 0.6 3.1 1.1 2.0 0.5 1.4H, 120 0.2 0.5 0.2 0.3 - 0.1 1.2 3.1 1.1 2.0 - 0.8A1, 1 3.5 3.6 1.3 2.3 - - 3.5 3.6 1.3 2.3 - -A2, 30 3.5 3.6 1.3 2.3 - - 3.5 3.6 1.3 2.3 - -B, 1 3.5 3.6 1.3 2.3 - - 3.5 3.6 1.3 2.3 - -C, 3 4.7 3.6 1.3 2.3 - - 8.5 3.6 1.3 2.3 - -
D1, 1 3.5 3.6 1.3 2.3 - - 3.5 3.6 1.3 2.3 - -D2, 1 3.5 3.6 1.3 2.3 - - 3.5 3.6 1.3 2.3 - -
E, 365+ N/A N/A N/A N/A N/A N/A N/A N/A N/A N/A N/A N/AF, 365+ N/A N/A N/A N/A N/A N/A N/A N/A N/A N/A N/A N/AG, 30 N/A N/A N/A N/A N/A N/A N/A N/A N/A N/A N/A N/AH, 120 N/A N/A N/A N/A N/A N/A N/A N/A N/A N/A N/A N/AA1, 1 0.0 1.5 0.5 1.0 0.5 1.0 0.0 2.9 1.0 1.9 1.0 1.9A2, 30 0.0 1.5 0.5 1.0 0.5 1.0 0.0 2.9 1.0 1.9 1.0 1.9
B, 1 0.0 1.5 0.5 1.0 0.5 1.0 0.0 2.9 1.0 1.9 1.0 1.9C, 3 2.0 1.5 0.5 1.0 - - 4.8 2.9 1.0 1.9 - -
D1, 1 0.0 1.5 0.5 1.0 0.5 1.0 0.0 2.9 1.0 1.9 1.0 1.9D2, 1 0.0 1.5 0.5 1.0 0.5 1.0 0.0 2.9 1.0 1.9 1.0 1.9
E, 365+ 2.0 1.5 0.5 1.0 - - 2.0 2.9 1.0 1.9 - -F, 365+ 2.0 1.5 0.5 1.0 - - 2.0 2.9 1.0 1.9 - -G, 30 N/A N/A N/A N/A N/A N/A N/A N/A N/A N/A N/A N/AH, 120 N/A N/A N/A N/A N/A N/A N/A N/A N/A N/A N/A N/A
Fulton Palmetto, City of
Fulton Roswell, City of
Gwinnett Buford, City of
Fulton Fulton County Water System

100% Demand
35% Demand
65% Demand
35% IRT Deficit
65% IRT Deficit
100% Demand
35% Demand
65% Demand
35% LRRT Deficit
65% LRRT Deficit
Risk Scenario, Duration (Days)
Qualified Water SystemCounty
EXHIBIT 5-5Deficit Summary
2006 Demands (AAD-mgd)Normal Operating Deficit
for Critical Scenario (AAD-mgd)1
2035 Demands (AAD-mgd)Normal Operating Deficit for Critical Scenario (AAD-
mgd)1
2006 Available
Water Supply (mgd)
2035 Available
Water Supply (mgd)
A1, 1 225.0 92.6 32.4 60.2 - - 225.0 137.1 48.0 89.1 - -A2, 30 75.0 92.6 32.4 60.2 - - 75.0 137.1 48.0 89.1 - 14.1
B, 1 111.7 92.6 32.4 60.2 - - 111.7 137.1 48.0 89.1 - -C, 3 225.0 92.6 32.4 60.2 - - 225.0 137.1 48.0 89.1 - -
D1, 1 82.0 92.6 32.4 60.2 - - 82.0 137.1 48.0 89.1 - 7.1D2, 1 82.0 92.6 32.4 60.2 - - 82.0 137.1 48.0 89.1 - 7.1
E, 365+ 0.0 92.6 32.4 60.2 32.4 60.2 0.0 137.1 48.0 89.1 48.0 89.1F, 365+ 92.6 92.6 32.4 60.2 - - 92.6 137.1 48.0 89.1 - -G, 30 N/A N/A N/A N/A N/A N/A N/A N/A N/A N/A N/A N/AH, 120 N/A N/A N/A N/A N/A N/A N/A N/A N/A N/A N/A N/AA1, 1 32.0 19.1 6.7 12.4 - - 37.0 52.0 18.2 33.8 - -A2, 30 22.0 19.1 6.7 12.4 - - 37.0 52.0 18.2 33.8 - -B, 1 22.0 19.1 6.7 12.4 - - 37.0 52.0 18.2 33.8 - -C, 3 47.0 19.1 6.7 12.4 - - 83.0 52.0 18.2 33.8 - -
D1, 1 32.3 19.1 6.7 12.4 - - 32.3 52.0 18.2 33.8 - 1.5D2, 1 32.3 19.1 6.7 12.4 - - 32.3 52.0 18.2 33.8 - 1.5
E, 365+ 17.0 19.1 6.7 12.4 - - 17.0 52.0 18.2 33.8 1.2 16.8F, 365+ 28.1 19.1 6.7 12.4 - - 28.1 52.0 18.2 33.8 - 5.7G, 30 35.0 19.1 6.7 12.4 - - 71.0 52.0 18.2 33.8 - -H, 120 N/A N/A N/A N/A N/A N/A N/A N/A N/A N/A N/A N/AA1, 1 14.1 16.2 5.7 10.5 - - 30.1 41.2 14.4 26.8 - -A2, 30 14.1 16.2 5.7 10.5 - - 30.1 41.2 14.4 26.8 - -B, 1 14.1 16.2 5.7 10.5 - - 30.1 41.2 14.4 26.8 - -C, 3 38.1 16.2 5.7 10.5 - - 82.1 41.2 14.4 26.8 - -
D1, 1 37.6 16.2 5.7 10.5 - - 82.1 41.2 14.4 26.8 - -D2, 1 37.6 16.2 5.7 10.5 - - 82.1 41.2 14.4 26.8 - -
E, 365+ N/A N/A N/A N/A N/A N/A N/A N/A N/A N/A N/A N/AF, 365+ N/A N/A N/A N/A N/A N/A N/A N/A N/A N/A N/A N/AG, 30 24.1 16.2 5.7 10.5 - - 30.1 41.2 14.4 26.8 - -H, 120 7.7 16.2 5.7 10.5 - 2.9 17.5 41.2 14.4 26.8 - 9.3A1, 1 3.2 0.5 0.2 0.3 - - 3.2 0.5 0.2 0.3 - -A2, 30 3.2 0.5 0.2 0.3 - - 3.2 0.5 0.2 0.3 - -B, 1 3.2 0.5 0.2 0.3 - - 3.2 0.5 0.2 0.3 - -C, 3 3.7 0.5 0.2 0.3 - - 3.7 0.5 0.2 0.3 - -
D1, 1 3.2 0.5 0.2 0.3 - - 3.2 0.5 0.2 0.3 - -D2, 1 3.2 0.5 0.2 0.3 - - 3.2 0.5 0.2 0.3 - -
E, 365+ N/A N/A N/A N/A N/A N/A N/A N/A N/A N/A N/A N/AF, 365+ N/A N/A N/A N/A N/A N/A N/A N/A N/A N/A N/A N/AG, 30 N/A N/A N/A N/A N/A N/A N/A N/A N/A N/A N/A N/AH, 120 0.2 0.5 0.2 0.3 - 0.1 0.2 0.5 0.2 0.3 - 0.1
Henry Locust Grove, City of
Gwinnett Gwinnett County
Hall Gainesville, City of
Henry Henry County Water and Sewerage Authority

100% Demand
35% Demand
65% Demand
35% IRT Deficit
65% IRT Deficit
100% Demand
35% Demand
65% Demand
35% LRRT Deficit
65% LRRT Deficit
Risk Scenario, Duration (Days)
Qualified Water SystemCounty
EXHIBIT 5-5Deficit Summary
2006 Demands (AAD-mgd)Normal Operating Deficit
for Critical Scenario (AAD-mgd)1
2035 Demands (AAD-mgd)Normal Operating Deficit for Critical Scenario (AAD-
mgd)1
2006 Available
Water Supply (mgd)
2035 Available
Water Supply (mgd)
A1, 1 3.3 1.4 0.5 0.9 - - 4.0 1.6 0.6 1.0 - -A2, 30 0.9 1.4 0.5 0.9 - - 0.9 1.6 0.6 1.0 - 0.1B, 1 0.9 1.4 0.5 0.9 - - 0.9 1.6 0.6 1.0 - 0.1C, 3 3.3 1.4 0.5 0.9 - - 4.0 1.6 0.6 1.0 - -
D1, 1 0.9 1.4 0.5 0.9 - - 0.9 1.6 0.6 1.0 - 0.1D2, 1 0.9 1.4 0.5 0.9 - - 0.9 1.6 0.6 1.0 - 0.1
E, 365+ N/A N/A N/A N/A N/A N/A N/A N/A N/A N/A N/A N/AF, 365+ N/A N/A N/A N/A N/A N/A N/A N/A N/A N/A N/A N/AG, 30 0.9 1.4 0.5 0.9 - - 0.9 1.6 0.6 1.0 - 0.1H, 120 0.6 1.4 0.5 0.9 - 0.3 0.6 1.6 0.6 1.0 - 0.4A1, 1 N/A N/A N/A N/A N/A N/A 28.0 47.0 16.5 30.6 - 2.6A2, 30 N/A N/A N/A N/A N/A N/A 28.0 47.0 16.5 30.6 - 2.6
B, 1 N/A N/A N/A N/A N/A N/A 28.0 47.0 16.5 30.6 - 2.6C, 3 N/A N/A N/A N/A N/A N/A 68.0 47.0 16.5 30.6 - -
D1, 1 N/A N/A N/A N/A N/A N/A 28.0 47.0 16.5 30.6 - 2.6D2, 1 N/A N/A N/A N/A N/A N/A 28.0 47.0 16.5 30.6 - 2.6
E, 365+ N/A N/A N/A N/A N/A N/A N/A N/A N/A N/A N/A N/AF, 365+ N/A N/A N/A N/A N/A N/A N/A N/A N/A N/A N/A N/AG, 30 N/A N/A N/A N/A N/A N/A 28.0 47.0 16.5 30.6 - 2.6H, 120 N/A N/A N/A N/A N/A N/A N/A N/A N/A N/A N/A N/AA1, 1 17.7 11.4 4.0 7.4 - - 26.7 17.0 6.0 11.1 - -A2, 30 0.0 11.4 4.0 7.4 4.0 7.4 0.0 17.0 6.0 11.1 6.0 11.1
B, 1 0.0 11.4 4.0 7.4 4.0 7.4 0.0 17.0 6.0 11.1 6.0 11.1C, 3 22.1 11.4 4.0 7.4 - - 32.1 17.0 6.0 11.1 - -
D1, 1 0.0 11.4 4.0 7.4 4.0 7.4 0.0 17.0 6.0 11.1 6.0 11.1D2, 1 0.0 11.4 4.0 7.4 4.0 7.4 0.0 17.0 6.0 11.1 6.0 11.1
E, 365+ N/A N/A N/A N/A N/A N/A N/A N/A N/A N/A N/A N/AF, 365+ N/A N/A N/A N/A N/A N/A N/A N/A N/A N/A N/A N/AG, 30 3.2 11.4 4.0 7.4 0.8 4.2 3.2 17.0 6.0 11.1 2.8 7.9H, 120 4.6 11.4 4.0 7.4 - 2.9 6.8 17.0 6.0 11.1 - 4.3
Notes:1 - Dash indicates a zero or surplus, rather than a deficit.
Rockdale Rockdale Water Resources
Henry McDonough, City of
Paulding Paulding County Water System
6-1
6.0 Evaluation of Potential Projects
This section identifies and evaluates potential projects for ensuring that all QWSs will meet the readiness targets described in section 5. As shown in Exhibit 5-5, 12 QWSs had Critical Scenario Deficits and thus did not meet either the current or future water emergency readiness. As a result, new interconnections and internal system redundancy alternatives were evaluated. A hydraulic and economic evaluation was performed for these QWSs to arrive at a recommended list of projects.
6.1 Methodology The initial step in the analysis considered existing available capacity from normally closed interconnections. Additionally, new system interconnections and new internal system redundancy projects were evaluated. With respect to new interconnections, hydraulic evaluations were conducted to determine the optimum locations and sizes of new or expanded interconnections with adjacent QWSs. This was conducted using a two-step process that included developing emergency flow balance diagram spreadsheets in order to solve the mass balance of flows within and surrounding the QWS during the critical emergency. Second, after selecting potential interconnections using the flow balance diagram tool, additional hydraulic modeling was conducted using the individual hydraulic models described in Section 5 or by merging multiple QWSs into a larger system model to better simulate the hydraulics between various water systems.
In addition to investigating potential interconnection strategies with adjacent QWSs, internal system redundancy alternatives were evaluated to determine if WTP process or pipeline redundancy projects could mitigate the critical scenario. Frequently these redundancy alternatives are already included in the QWSs’ master plans or CIPs.
Cost estimates were developed to allow for a comparison of the total cost of new interconnection(s) against internal infrastructure redundancy costs to verify the viability of the projects and to provide enough information to choose the final recommended projects for each QWS. The existing normally closed interconnections identified in Section 5 were considered along with the new projects to develop a final recommended project list as shown in Exhibit 6-1.
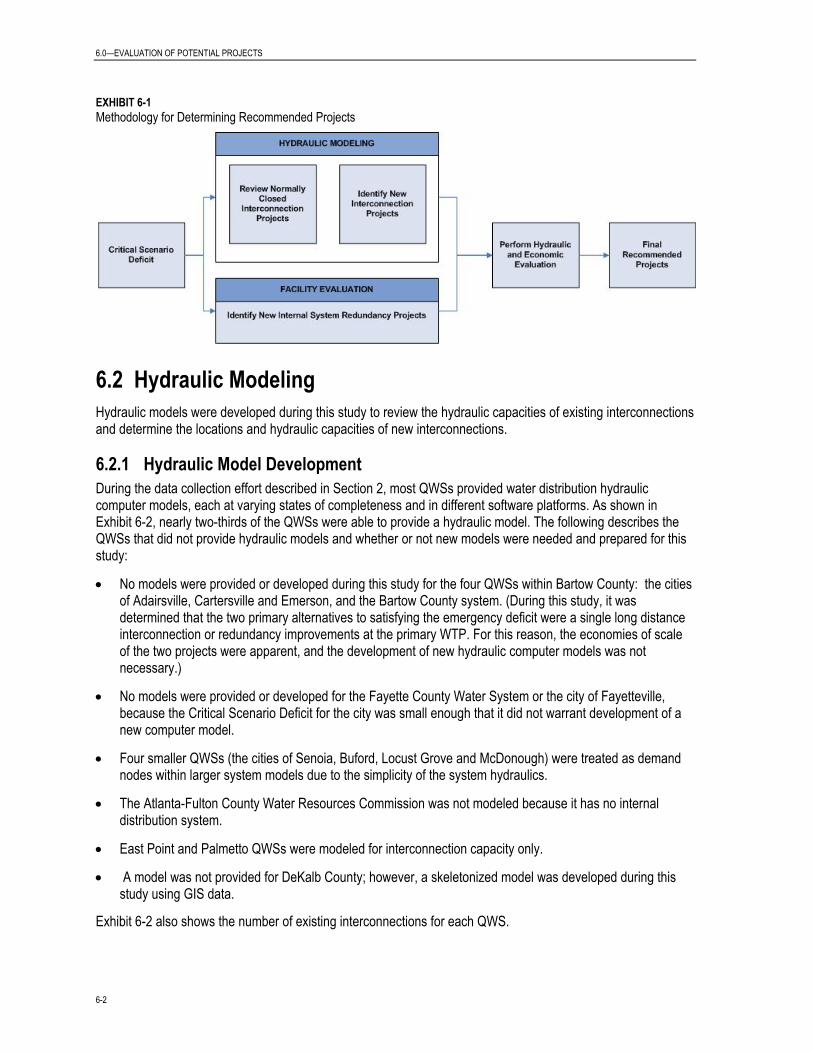
6.0—EVALUATION OF POTENTIAL PROJECTS
6-2
EXHIBIT 6-1 Methodology for Determining Recommended Projects
6.2 Hydraulic Modeling Hydraulic models were developed during this study to review the hydraulic capacities of existing interconnections and determine the locations and hydraulic capacities of new interconnections.
6.2.1 Hydraulic Model Development During the data collection effort described in Section 2, most QWSs provided water distribution hydraulic computer models, each at varying states of completeness and in different software platforms. As shown in Exhibit 6-2, nearly two-thirds of the QWSs were able to provide a hydraulic model. The following describes the QWSs that did not provide hydraulic models and whether or not new models were needed and prepared for this study:
• No models were provided or developed during this study for the four QWSs within Bartow County: the cities of Adairsville, Cartersville and Emerson, and the Bartow County system. (During this study, it was determined that the two primary alternatives to satisfying the emergency deficit were a single long distance interconnection or redundancy improvements at the primary WTP. For this reason, the economies of scale of the two projects were apparent, and the development of new hydraulic computer models was not necessary.)
• No models were provided or developed for the Fayette County Water System or the city of Fayetteville, because the Critical Scenario Deficit for the city was small enough that it did not warrant development of a new computer model.
• Four smaller QWSs (the cities of Senoia, Buford, Locust Grove and McDonough) were treated as demand nodes within larger system models due to the simplicity of the system hydraulics.
• The Atlanta-Fulton County Water Resources Commission was not modeled because it has no internal distribution system.
• East Point and Palmetto QWSs were modeled for interconnection capacity only.
• A model was not provided for DeKalb County; however, a skeletonized model was developed during this study using GIS data.
Exhibit 6-2 also shows the number of existing interconnections for each QWS.

6.0—EVALUATION OF POTENTIAL PROJECTS
6-3
EXHIBIT 6-2 Hydraulic Model Summary
County Qualified Water System
ModelReceived
from Qualified
Water System
Model Comments Number of Interconnections
Bartow Adairsville, City of Model not developed 5 Bartow Bartow County Model not developed 19 Bartow Cartersville, City of Model not developed 10 Bartow Emerson, City of Model not developed 1
Cherokee Canton, City of √ (WaterGEMS)
Model is not calibrated so it was used for information
only
5
Cherokee Cherokee County
Water and Sewerage Authority
√ (InfoWorx
WS)
Skeletonized the model to remove existing isolation
valves
45
Clayton Clayton County Water Authority
√ (H2O Map)
18
Cobb Cobb County-Marietta Water
Authority
√ (SynerGEE)
Includes pipes > 6 inches 81+
Cobb Cobb County Water System
√ (SynerGEE)
Part of the Cobb County-Marietta Water Authority
Model
5
Cobb Marietta Power and Water
√ (SynerGEE) 20+
Coweta Coweta County
Water and Sewerage Authority
√ (WaterCAD)
Includes pipes > 6 inches 15
Coweta Newnan Utilities √ (WaterCAD)
Part of the Coweta County Water
and Sewerage Authority model
5
Coweta Senoia, City of
Modeled as demand nodes in Coweta
County Water and Sewerage Authority
model
5
DeKalb DeKalb County
Developed new model with InfoWorks WS using GIS data
Includes pipes > 12
inches and some <12 inches at service area
boundaries
8
Douglas
Douglasville-Douglas County
Water and Sewer Authority
√ (WaterCAD) 8
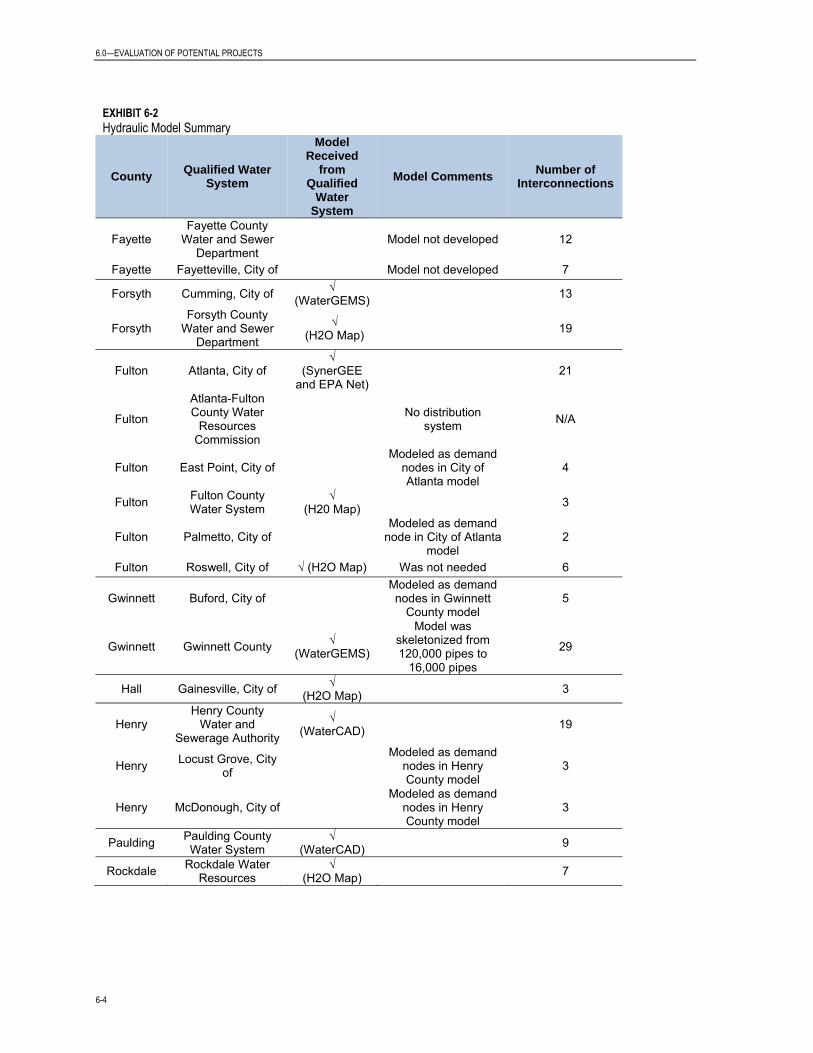
6.0—EVALUATION OF POTENTIAL PROJECTS
6-4
EXHIBIT 6-2 Hydraulic Model Summary
County Qualified Water System
ModelReceived
from Qualified
Water System
Model Comments Number of Interconnections
Fayette Fayette County
Water and Sewer Department
Model not developed 12
Fayette Fayetteville, City of Model not developed 7
Forsyth Cumming, City of √ (WaterGEMS) 13
Forsyth Forsyth County
Water and Sewer Department
√ (H2O Map) 19
Fulton Atlanta, City of √
(SynerGEE and EPA Net)
21
Fulton
Atlanta-Fulton County Water
Resources Commission
No distribution system N/A
Fulton East Point, City of Modeled as demand
nodes in City of Atlanta model
4
Fulton Fulton County Water System
√ (H20 Map) 3
Fulton Palmetto, City of Modeled as demand
node in City of Atlanta model
2
Fulton Roswell, City of √ (H2O Map) Was not needed 6
Gwinnett Buford, City of Modeled as demand nodes in Gwinnett
County model 5
Gwinnett Gwinnett County √ (WaterGEMS)
Model was skeletonized from 120,000 pipes to
16,000 pipes
29
Hall Gainesville, City of √ (H2O Map) 3
Henry Henry County
Water and Sewerage Authority
√ (WaterCAD) 19
Henry Locust Grove, City of
Modeled as demand nodes in Henry County model
3
Henry McDonough, City of Modeled as demand
nodes in Henry County model
3
Paulding Paulding County Water System
√ (WaterCAD) 9
Rockdale Rockdale Water Resources
√ (H2O Map) 7
6.0—EVALUATION OF POTENTIAL PROJECTS
6-5
6.2.2 Hydraulic Modeling Criteria Two hydraulic criteria were utilized during the hydraulic computer model analysis to estimate interconnection capacity: maximum velocity and pressure.
6.2.2.1 Maximum Velocity Criteria For adjacent QWSs with a large difference in hydraulic gradient, the maximum velocity approach was typically required. In this approach the velocity of the water traveling through the pipes between systems was monitored in the model runs to determine the maximum interconnection capacity. The following maximum velocity criteria were used to determine the interconnection hydraulic capacities: 3 feet per second (fps) for pipe diameters greater than or equal to 16 inches and 5 fps for pipe diameters less than or equal to 12 inches. These velocity criteria are commonly used as guidance when calculating pipe flow capacity.
6.2.2.2 Pressure Criteria If customer pressures in the vicinity of the open interconnection (donor or receiver systems) in the model runs varied by more than 15 percent above or below normal operating pressures, the selected capacity was limited to a reduced maximum velocity (i.e., lower than 3 or 5 fps depending on pipe diameter) in the model runs. This pressure criterion ensures that the area of the QWS supplying system in the vicinity of the interconnection does not experience excessively low pressures that could compromise fire protection sprinkler system designs and result in unacceptable service and public safety risks. In addition, this pressure criterion prevents receiver systems from experiencing excessively high pressures (which increase the risks of pipe bursts) local to the interconnection location. For those QWSs with significantly different head conditions, it was assumed that a pressure reducing valve existed or that the isolation valve was throttled in a manner that limited the velocity and/or pressure to the maximum criteria stated above.
For adjacent QWSs with similar hydraulic gradients, or for systems that supply large flows from one to another, a pressure criterion was applied in addition to the velocity criteria outlined above. To limit the pressure drop during the hydraulic evaluation, a pressure sustaining valve model element was used to establish the minimum supplying QWS system pressure at the interconnection to no more than 15 percent below the normal operating pressure. The addition of this pressure sustaining valve (even though a control valve may not actually exist) is a hydraulic modeling approach to limit the flow through the interconnection to the pressure drop of 15 percent at the interconnection. Iterative model runs were performed until the maximum velocity or pressure criteria were achieved.
6.2.3 Hydraulic Modeling and Evaluation Approach The hydraulic evaluation differed depending on whether or not deficits occurred, as reported in Exhibit 5-5. For QWSs without deficits a level of service verification was performed. For QWSs with a critical scenario deficit, modeling and/or other hydraulic evaluations were conducted to determine the hydraulic capacity of existing interconnections, to examine new interconnections, and to evaluate water treatment plant redundancy projects.
6.2.3.1 Level of Service Verification for Emergency System Operation Hydraulic modeling was conducted for QWSs that did not exhibit Critical Scenario Deficits. This hydraulic modeling was performed because the operating conditions mitigating the Critical Scenario Deficits may not be typical operating conditions for a QWS and may include a large facility out of service that is normally in operation. The hydraulic modeling was performed to confirm that the QWS can operate in this redundant fashion without compromising the level of service (i.e., pressure criteria). For example, this type of hydraulic modeling was performed for the city of Atlanta, Cobb County-Marietta Water Authority, the city of Gainesville, and the Clayton County Water Authority. None of these systems had compromised level of service (i.e., low pressures) during the atypical emergency operation based on the modeling analysis.

6.0—EVALUATION OF POTENTIAL PROJECTS
6-6
6.2.3.2 Hydraulic Evaluation of Existing Interconnections The hydraulic capacities of existing normally open and normally closed interconnections were evaluated and confirmed using the hydraulic computer models listed in Exhibit 6-2. For most systems, individual hydraulic models were utilized. This required adding a reservoir model element to simulate the hydraulic gradient or elevated tank overflow elevation of the receiving water system. In some cases more advanced merged models were used, as explained in section 6.2.3.3.2.
Normally closed (or emergency) interconnections are maintained in order to provide additional water supply from a neighboring utility during a water emergency. These interconnections are used only occasionally and are usually opened only to meet specific temporary needs. The disadvantages to using a particular normally closed interconnection on a regular basis may include: dissimilar water pressure zones (WPZs) and the inability to control flow to/from another QWS, water quality concerns, regulatory liability, or cost of the purchased water. Cost factors cannot be overlooked; it should be noted that frequent purchase of water from an adjacent QWS may have a negative financial impact on the receiving QWS. In the course of the study, it was found that most of the QWSs have normally closed (or emergency) interconnections with neighboring water systems.
For adjacent QWSs where the difference in the hydraulic gradient between the QWSs was greater than 25 feet and/or the largest Critical Scenario Deficit was less than 2 mgd, hydraulic modeling was not applied to determine the interconnection capacity. In these cases, the interconnection capacity was set by the hydraulic calculations on the interconnection pipe size.
6.2.3.3 Hydraulic Evaluation of Potential Interconnections Following the evaluation of existing interconnections, new interconnections and system redundancy projects were identified. This required a detailed understanding of the water treatment and distribution systems and in most cases required hydraulic modeling.
6.2.3.3.1 Emergency Flow Balance Diagram Tools A spreadsheet tool was developed for the study called the emergency flow balance diagram that was used to determine the magnitude of flow needed from adjacent water systems to satisfy the IRT and LRRT demands for the critical scenarios. This spreadsheet tool consists of a GIS map background of one or more QWSs and flow balance calculations accounting for supply sources, demands by WPZ, and interconnections with adjacent water systems. By incorporating the WPZ hydraulic gradient values, the user can see which systems can provide flow by gravity and which ones would likely need to pump flow to an adjacent QWS.
The initial flow balance calculation was developed for each QWS with the treatment plants and normally open interconnections in service under 2006 and 2035 demand conditions. Then, the critical scenario was evaluated under IRT and LRRT demand conditions. Plant flow rates associated with the critical scenario were incorporated into the flow balance to determine the number and capacity of interconnections that would be needed to satisfy the Critical Scenario Deficits.
6.2.3.3.2 Additional Hydraulic Model Development and Merge Process After the new interconnections were established using the emergency flow balance diagrams, modeling was performed. Some larger QWSs with large Critical Scenario Deficits required more extensive hydraulic modeling. This modeling was conducted by merging multiple QWS models together into one computer model to more accurately simulate existing and new interconnection options. This approach allowed for the interaction of system conditions to provide more reliable results for the QWS supplying water (donor) and the QWS receiving water (receiver).
To facilitate the merging of multiple QWS computer models, each model was converted from its native software platform to the Bentley WaterGEMS software platform. Next, six hydraulic modeling cases were developed: 2006 100 percent demand, 2006 65 percent IRT demand, 2006 35 percent IRT demand, 2035 100 percent LRRT
6.0—EVALUATION OF POTENTIAL PROJECTS
6-7
demand, 2035 65 percent LRRT demand, and 2035 35 percent LRRT demand. Boundary conditions for each case (tank level, pump/valve on/off status) were developed so that each individual scenario was hydraulically balanced. For a system to be hydraulically balanced, the supply to the system equals the demand, floating storage in the system is not contributing to meeting the demand, and the floating storage is also not filling. This step is critical so that the model represents a realistic “steady-state” hydraulic condition. If the model was not hydraulically balanced, and a tank was rapidly filling or draining in a scenario, the actual hydraulic capacity within the QWS as represented by the hydraulic model would not be accurate.
Once the individual QWS models were completed and fully functional, the models were merged in a step-wise fashion. For example, for merging of three individual hydraulic models, Model 1 would be merged with Model 2 and then Model 3 would be merged with the Combined Model 1+2. The merged models that were developed during this study included:
• City of Atlanta, DeKalb County, Gwinnett County • Forsyth County, city of Cumming, Fulton County, city of Gainesville, Gwinnett County • City of Atlanta, DeKalb County, Gwinnett County, Forsyth County, city of Cumming, Fulton County, city of
Gainesville
6.2.3.4 Water Treatment Plant Evaluation In addition to evaluating how QWSs can transfer water among adjacent systems, the WTPs at each QWS with only one plant were evaluated to determine what improvements would be necessary to provide full redundancy for each unit process, treatment train, storage tank and flow distribution structure. The projects required to provide this level of redundancy at the WTP were evaluated to determine if they provided greater infrastructure redundancy, lower cost or lower cost operations than the distribution infrastructure projects that may involve construction of multiple, long distance pipelines and/or pump stations that would have significant cost and potentially limited use during normal operations.
By potentially incorporating new process units or parallel pipelines at the WTP, the redundant water treatment capacity would increase, thus reducing the Critical Scenario Deficit and lessening the number of distribution projects. For example, if a WTP had a single raw water pipeline or flash mix reactor, but had two existing process trains through the rest of the WTP, a new parallel raw water pipeline or flash mix reactor would enable at least half the WTP to remain in service under a plant infrastructure emergency, thus reducing or eliminating the Critical Scenario Deficits.
6.3 Project Cost Estimates Planning level project costs were developed for each of the potential project alternatives including: minor rehabilitation of existing normally closed interconnections, construction of new interconnections, and construction of new internal infrastructure redundancy projects. Costs were not developed for previously planned projects identified in CIPs by the QWSs or in the District’s WSWCMP; however, the costs were documented when available from the QWSs.
The following sections describe the methodology for development of the unit costs.
6.3.1 Unit Cost Development Unit costs were developed for new pipelines, pump stations, and control valve stations; for rehabilitation of existing normally closed interconnections; and for new projects. The developed unit costs for new projects include engineering, permitting, right-of-way acquisition, contractor markups, and services during construction (SDC).
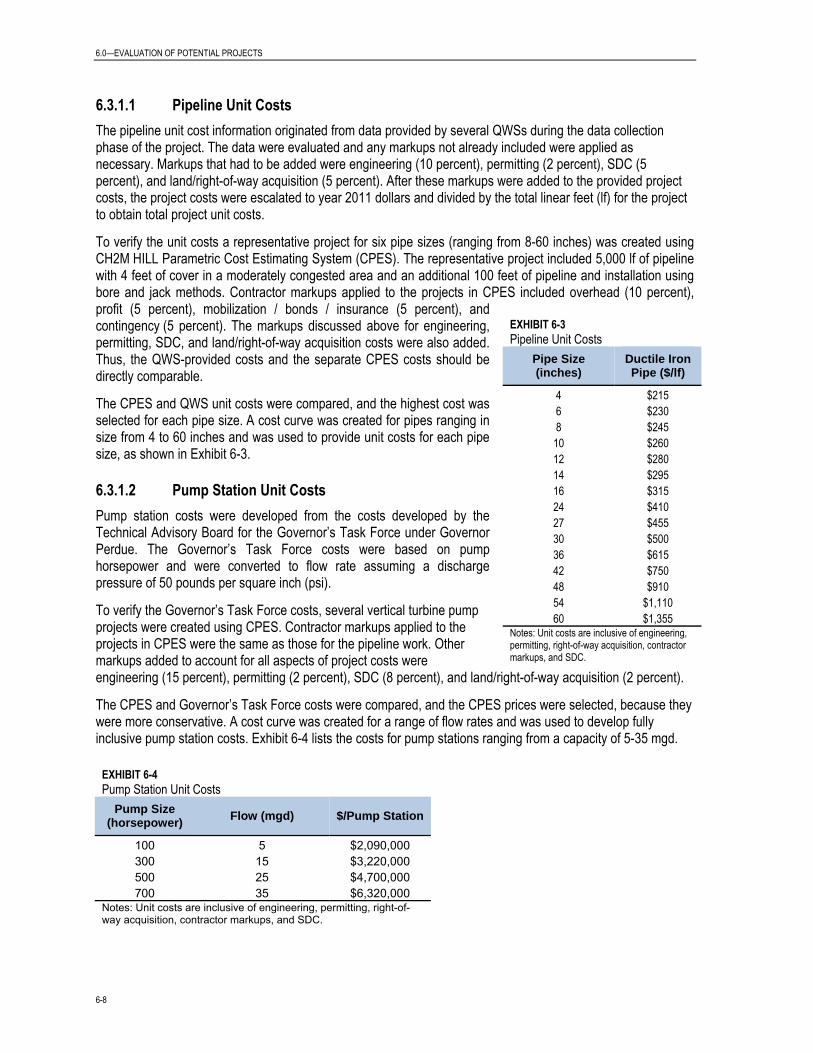
6.0—EVALUATION OF POTENTIAL PROJECTS
6-8
6.3.1.1 Pipeline Unit Costs The pipeline unit cost information originated from data provided by several QWSs during the data collection phase of the project. The data were evaluated and any markups not already included were applied as necessary. Markups that had to be added were engineering (10 percent), permitting (2 percent), SDC (5 percent), and land/right-of-way acquisition (5 percent). After these markups were added to the provided project costs, the project costs were escalated to year 2011 dollars and divided by the total linear feet (lf) for the project to obtain total project unit costs.
To verify the unit costs a representative project for six pipe sizes (ranging from 8-60 inches) was created using CH2M HILL Parametric Cost Estimating System (CPES). The representative project included 5,000 lf of pipeline with 4 feet of cover in a moderately congested area and an additional 100 feet of pipeline and installation using bore and jack methods. Contractor markups applied to the projects in CPES included overhead (10 percent), profit (5 percent), mobilization / bonds / insurance (5 percent), and contingency (5 percent). The markups discussed above for engineering, permitting, SDC, and land/right-of-way acquisition costs were also added. Thus, the QWS-provided costs and the separate CPES costs should be directly comparable.
The CPES and QWS unit costs were compared, and the highest cost was selected for each pipe size. A cost curve was created for pipes ranging in size from 4 to 60 inches and was used to provide unit costs for each pipe size, as shown in Exhibit 6-3.
6.3.1.2 Pump Station Unit Costs Pump station costs were developed from the costs developed by the Technical Advisory Board for the Governor’s Task Force under Governor Perdue. The Governor’s Task Force costs were based on pump horsepower and were converted to flow rate assuming a discharge pressure of 50 pounds per square inch (psi).
To verify the Governor’s Task Force costs, several vertical turbine pump projects were created using CPES. Contractor markups applied to the projects in CPES were the same as those for the pipeline work. Other markups added to account for all aspects of project costs were engineering (15 percent), permitting (2 percent), SDC (8 percent), and land/right-of-way acquisition (2 percent).
The CPES and Governor’s Task Force costs were compared, and the CPES prices were selected, because they were more conservative. A cost curve was created for a range of flow rates and was used to develop fully inclusive pump station costs. Exhibit 6-4 lists the costs for pump stations ranging from a capacity of 5-35 mgd.
EXHIBIT 6-4 Pump Station Unit Costs
Pump Size (horsepower) Flow (mgd) $/Pump Station
100 5 $2,090,000 300 15 $3,220,000 500 25 $4,700,000 700 35 $6,320,000
Notes: Unit costs are inclusive of engineering, permitting, right-of-way acquisition, contractor markups, and SDC.
EXHIBIT 6-3 Pipeline Unit Costs
Pipe Size (inches)
Ductile Iron Pipe ($/lf)
4 $215 6 $230 8 $245 10 $260 12 $280 14 $295 16 $315 24 $410 27 $455 30 $500 36 $615 42 $750 48 $910 54 $1,110 60 $1,355
Notes: Unit costs are inclusive of engineering, permitting, right-of-way acquisition, contractor markups, and SDC.

6.0—EVALUATION OF POTENTIAL PROJECTS
6-9
6.3.1.3 Control Valve Station Unit Costs Costs for control valve stations, which are required at some interconnection points, were calculated using a combination of CPES costs and vendor costs. CPES was used to estimate the cost of cast-in-place valve vaults, isolation valves, and associated piping at the vault. Vendor costs for the pressure control valves were obtained from a major manufacturer and were entered into CPES. The contractor-applied markups in CPES were the same as those used for the pipeline costs. Other markups added to account for all aspects of project costs were engineering (15 percent), permitting (2 percent), and SDC (8 percent). It was assumed that the valve vault would be located in an easement already associated with a pipeline; therefore, no markup was added for land/right-of-way acquisition.
A cost curve was created for the different sizes of pressure control valves and was used to ascertain fully inclusive control valve vault costs for valve sizes ranging from 4 to 36 inches (see Exhibit 6-5).
EXHIBIT 6-5 Control Valve Station Unit Costs
Valve Size (inches) Control Valve Station Unit Costs ($)
4 $ 70,000 6 $ 80,000 8 $ 90,000
10 $100,000 12 $120,000 14 $140,000 16 $160,000 24 $290,000 27 $360,000 30 $450,000 36 $690,000
Notes: Unit costs are inclusive of engineering, permitting, right-of-way acquisition, contractor markups, and SDC.
6.3.1.4 Existing Normally Closed Interconnection Costs Some QWSs can eliminate or reduce the Critical Scenario Deficits by utilizing existing normally closed interconnections. Field visits and evaluations will need to be conducted to determine if any of the following types of work are needed: piping modifications within the vaults, new control valve, expanded vault, supervisory control and data acquisition, (SCADA) connection/hardware, and/or electrical upgrades. Some interconnections may not require any work, while others may need significant modifications. Based on engineering judgment a placeholder cost of $50,000 was used to account for the work that may be required to make an existing normally closed interconnection serviceable; however, actual costs will be based on site specific conditions.
6.3.2 Project Cost Development Summary The unit costs discussed in the previous section were used to develop planning level cost estimates for the potential projects identified to eliminate the deficits. The following summarizes how the unit costs were applied:
• Existing Interconnections – Each normally closed existing interconnection being recommended is assigned a cost of $50,000, as described in Section 6.3.1.4.
• New Interconnections – New interconnections typically require some length of piping and a control valve vault. The length and size of pipe, as determined through hydraulic modeling, were used to determine the total pipeline cost using unit costs presented in Exhibit 6-3. The size of the control valve required at the connection point was used to estimate the cost of the control valve vault using unit costs presented in

6.0—EVALUATION OF POTENTIAL PROJECTS
6-10
Exhibit 6-5. In some instances, a new connection requires a pump station to be able to move water from one WPZ to another. The appropriate pump station unit costs were based on the flow rates shown in Exhibit 6-4.
• Internal Infrastructure Redundancy Projects – Costs were developed on a case by case basis, unless these projects (and associated costs) were already planned and included in a QWS’s master plan or CIP.

7.0 Recommended Projects
After the projects were identified, evaluated and cost-estimated, the most appropriate and cost effective project(s) were selected for each QWS with a deficit. These projects can be categorized as follows:
• Upgrades to Existing Interconnections - Normally closed existing interconnections were assessed for their potential to reduce or eliminate the Critical Scenario Deficits.
• New Interconnections – New or expanded interconnections were evaluated in the hydraulic models for their potential to reduce or eliminate the Critical Scenario Deficits. Each new interconnection is identified in terms of the pipes being connected, capacity and cost.
• Internal Infrastructure Redundancy Projects – Redundancy projects that could eliminate the deficits were identified and included projects such as: raw water intakes, parallel raw or finished water pipelines, parallel treatment units, pumping stations, etc. In some instances these new redundancy projects completely eliminate the deficits without the installation of new interconnections or use of existing normally closed interconnections. Projects in this category may also include previously planned projects from a QWS’s CIP or master plan, or plant expansions presented in the District’s WSWCMP. Final costs for these internally developed projects were not developed but were included where available from the QWSs.
Exhibit 7-1 provides the final recommended project list for the 33 QWSs. The total cost for all of the improvements is estimated to be $63 million.
7.1.1 Prioritization Approach A decision analysis approach was developed to guide QWS staff and policy makers regarding project implementation. The results of any prioritization are best regarded and applied as decision aids. Results should inform rather than dictate the decision. The analysis provides a way of organizing and comparing complex information.
The prioritization approach has four basic steps:
• Finalize evaluation criteria; • Finalize scoring guidelines and performance measures to objectively score each project; • Score projects using prioritization approach; and • Make final decision about projects and schedule.
The success of any prioritization approach rests on how well the evaluation criteria, scoring guidelines and performance measures accurately reflect the goals and objectives of the project. Key considerations when developing these approaches include:
• Do the criteria and performance measures make sense, and are they applicable across a broad range of projects?
• Can each criterion and performance measure be easily understood for applicability?
• Are the criteria weighted appropriately?
• Is there adequate separation between scores for each performance measure?
• When reviewing the weighted scores for each project, are the projects in an intuitive priority ranking and do they make sense?
• Are the criteria and performance measures non-redundant? It is important that the performance measures do not address overlapping aspects of each project to prevent “double-counting” the same attribute.
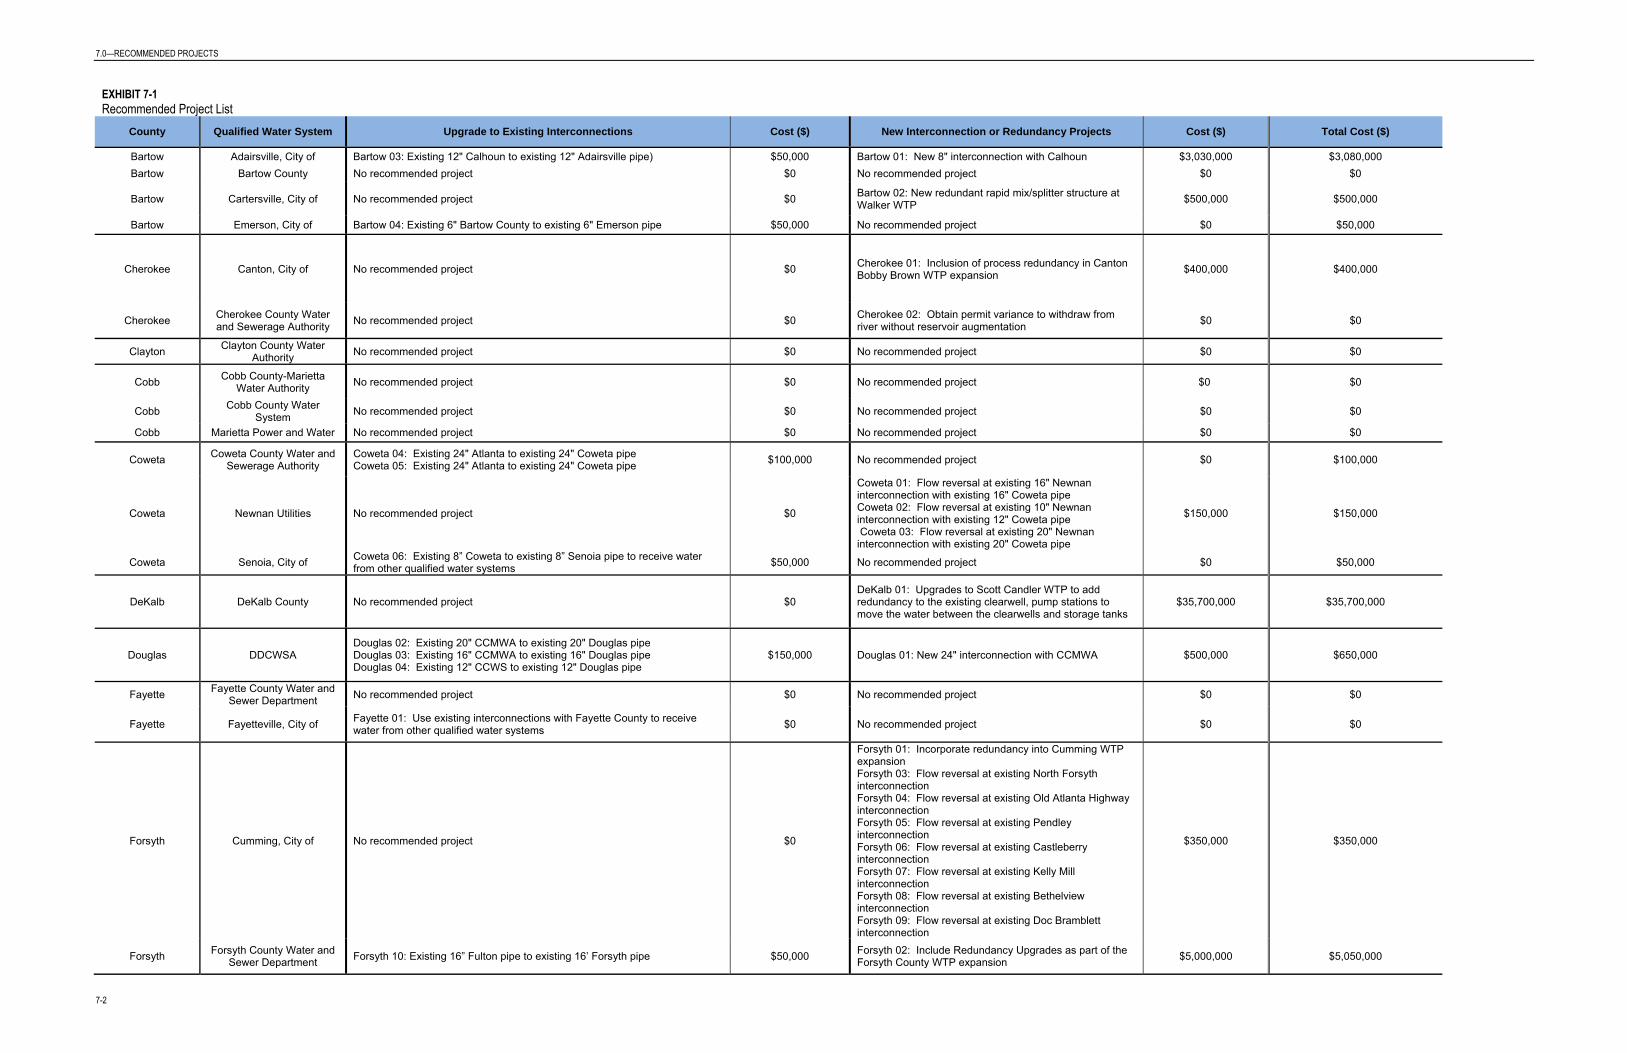
7.0—RECOMMENDED PROJECTS
7-2
EXHIBIT 7-1 Recommended Project List
County Qualified Water System Upgrade to Existing Interconnections Cost ($) New Interconnection or Redundancy Projects Cost ($) Total Cost ($)
Bartow Adairsville, City of Bartow 03: Existing 12" Calhoun to existing 12" Adairsville pipe) $50,000 Bartow 01: New 8" interconnection with Calhoun $3,030,000 $3,080,000 Bartow Bartow County No recommended project $0 No recommended project $0 $0
Bartow Cartersville, City of No recommended project $0 Bartow 02: New redundant rapid mix/splitter structure at Walker WTP $500,000 $500,000
Bartow Emerson, City of Bartow 04: Existing 6" Bartow County to existing 6" Emerson pipe $50,000 No recommended project $0 $50,000
Cherokee Canton, City of No recommended project $0 Cherokee 01: Inclusion of process redundancy in Canton Bobby Brown WTP expansion $400,000 $400,000
Cherokee Cherokee County Water and Sewerage Authority No recommended project $0 Cherokee 02: Obtain permit variance to withdraw from
river without reservoir augmentation $0 $0
Clayton Clayton County Water Authority No recommended project $0 No recommended project $0 $0
Cobb Cobb County-Marietta Water Authority No recommended project $0 No recommended project $0 $0
Cobb Cobb County Water System No recommended project $0 No recommended project $0 $0
Cobb Marietta Power and Water No recommended project $0 No recommended project $0 $0
Coweta Coweta County Water and Sewerage Authority
Coweta 04: Existing 24" Atlanta to existing 24" Coweta pipe Coweta 05: Existing 24" Atlanta to existing 24" Coweta pipe $100,000 No recommended project $0 $100,000
Coweta Newnan Utilities No recommended project $0
Coweta 01: Flow reversal at existing 16" Newnan interconnection with existing 16" Coweta pipe Coweta 02: Flow reversal at existing 10" Newnan interconnection with existing 12" Coweta pipe Coweta 03: Flow reversal at existing 20" Newnan interconnection with existing 20" Coweta pipe
$150,000 $150,000
Coweta Senoia, City of Coweta 06: Existing 8” Coweta to existing 8” Senoia pipe to receive water from other qualified water systems $50,000 No recommended project $0 $50,000
DeKalb DeKalb County No recommended project $0 DeKalb 01: Upgrades to Scott Candler WTP to add redundancy to the existing clearwell, pump stations to move the water between the clearwells and storage tanks
$35,700,000 $35,700,000
Douglas DDCWSA Douglas 02: Existing 20" CCMWA to existing 20" Douglas pipe Douglas 03: Existing 16" CCMWA to existing 16" Douglas pipe Douglas 04: Existing 12" CCWS to existing 12" Douglas pipe
$150,000 Douglas 01: New 24" interconnection with CCMWA $500,000 $650,000
Fayette Fayette County Water and Sewer Department No recommended project $0 No recommended project $0 $0
Fayette Fayetteville, City of Fayette 01: Use existing interconnections with Fayette County to receive water from other qualified water systems $0 No recommended project $0 $0
Forsyth Cumming, City of No recommended project $0
Forsyth 01: Incorporate redundancy into Cumming WTP expansion Forsyth 03: Flow reversal at existing North Forsyth interconnection Forsyth 04: Flow reversal at existing Old Atlanta Highway interconnection Forsyth 05: Flow reversal at existing Pendley interconnection Forsyth 06: Flow reversal at existing Castleberry interconnection Forsyth 07: Flow reversal at existing Kelly Mill interconnection Forsyth 08: Flow reversal at existing Bethelview interconnection Forsyth 09: Flow reversal at existing Doc Bramblett interconnection
$350,000 $350,000
Forsyth Forsyth County Water and Sewer Department Forsyth 10: Existing 16” Fulton pipe to existing 16’ Forsyth pipe $50,000 Forsyth 02: Include Redundancy Upgrades as part of the
Forsyth County WTP expansion $5,000,000 $5,050,000

7.0—RECOMMENDED PROJECTS
7-3
EXHIBIT 7-1 Recommended Project List
County Qualified Water System Upgrade to Existing Interconnections Cost ($) New Interconnection or Redundancy Projects Cost ($) Total Cost ($)
Fulton Atlanta, City of No recommended project $0
Fulton 07: AFC WRC Redundancy Project (redundant post flash mix basin + 16" redundant pipe), Project is needed for the Fulton County critical scenario deficit but is shared with Fulton County Water System. Cost Represents one-half of the total cost.
$503,300 $503,300
Fulton Atlanta-Fulton County
Water Resources Commission
- - - - -
Fulton East Point, City of No recommended project $0
Fulton 01: New 12" interconnection with Atlanta Fulton 02: New 12" interconnection with Atlanta Fulton 03: New 12" interconnection with Atlanta Fulton 04: New 12" interconnection with Atlanta Fulton 05: New 12" interconnection with Atlanta
$1,440,000 $1,440,000
Fulton Fulton County Water System No recommended project $0
Fulton 07: AFC WRC Redundancy Project (redundant post flash mix basin + 16" redundant pipe) Project is needed for the Fulton County critical scenario deficit but is shared with Fulton County Water System. Cost Represents one-half of the total cost.
$503,300 $503,300
Fulton Palmetto, City of Fulton 08: Existing 8" Coweta to existing Palmetto pipe Fulton 09: Existing 8" Gwinnett to existing 8" Buford pipe $100,000 Fulton 06: New 12" interconnection with Atlanta $140,000 $240,000
Fulton Roswell, City of No recommended project $0 No recommended project $0 $0
Gwinnett Buford, City of
Gwinnett 02: Existing 12" Gwinnett to existing 12" Buford pipe Gwinnett 03: Existing 8" Gwinnett to existing 8" Buford pipe Gwinnett 04: Existing 8" Gwinnett to existing Buford pipe Gwinnett 05: Existing 8" Gwinnett to existing Buford pipe
$200,000 No recommended project $0 $200,000
Gwinnett Gwinnett County No recommended project $0 Gwinnett 01: Shoal Creek Filter Plant Expansion (upgrade to Shoal Creek high service pump station per Gwinnett Master Plan)
$12,700,000 $12,700,000
Hall Gainesville, City of Hall 01: Existing 12” Gwinnett to existing 12” Gainesville pipe $50,000 No recommended project $0 $50,000
Henry Henry County Water and Sewerage Authority
Henry 02: Existing 16" DeKalb to existing 16" Henry pipe Henry 03: Existing 12" Clayton to existing 12" Henry pipe Henry 04: Existing 6" Clayton to existing 12" Henry pipe
$150,000 Henry 01: New 24" interconnection with Clayton County from the Hooper WTP transmission main $305,000 $460,000
Henry Locust Grove, City of No recommended project $0 Utilize new Henry County interconnection (Henry 01) with Clayton County $0 $0
Henry McDonough, City of No recommended project $0 Utilize new Henry County interconnection (Henry 01) with Clayton County $0 $0
Paulding Paulding County Water System
Paulding 01: Existing 6" Cobb County-Marietta Water Authority pipe to existing 6" Paulding pipe $50,000 No recommended project - $50,000
Rockdale Rockdale Water Resources
Rockdale 02: Existing 24" Gwinnett to existing 24" Rockdale pipe Rockdale 03: Existing 12" Gwinnett to existing 8" Rockdale pipe Rockdale 04: Existing 8" DeKalb to existing 8" Rockdale pipe Rockdale 05: Existing 12" DeKalb to existing 12" Rockdale pipe
$200,000 Rockdale 01: Existing 12" Henry County pipe to new 12" Rockdale pipe $205,000 $405,000
TOTAL: $1,200,000 TOTAL: $61,426,600 $62,626,600
1 Projects were assigned a sequential identifier by County name

7.0 RECOMMENDED PROJECTS
7-4
7.1.1.1 Evaluation Criteria Given the large numbers of projects, six evaluation criteria, as shown in Exhibit 7-2, were identified that could be used to objectively determine the projects with the greatest benefit to the District. The weightings of the criteria were initially assigned to be equal, but are frequently adjusted as a means of performing sensitivity analyses.
EXHIBIT 7-2 Evaluation Criteria
Title Initial
Weighting Description
Percent of Total Water Demand Provided by the Project (by QWS) 100 The percentage of total demand for a QWS that the recommended
project provides
Amount of Water Provided by the Project 100 Total water supply provided by the recommended project
Cost 100 Total cost of the recommended project
Mutually Benefits Another QWS 100 Recommended project that mutually benefits another QWS
Duration of Critical Scenario 100 The duration of the critical scenario associated with each recommended project
Community Impact 100 Minimizes environmental and community disturbance during construction activities
7.1.1.2 Scoring of Projects
Exhibit 7-3 summarizes scoring guidelines for each criterion that can be objectively scored for each project.
EXHIBIT 7-3 Project Scoring Guidelines
Project Scoring Guidelines
Score Percent of Total Water Demand
Provided by Project
Amount of Water
Provided by Project
Cost Mutually Benefits Another QWS
Duration of Critical
Scenario Community Impact
10 76-100% 76th percentile < $150,000 Benefits at 2 QWSs > 30 days Minimial Impact (project
completed on QWS property)
7 26-75% 26th – 75th percentile
$150,000 - $1,000,000 -- 30 days
Moderate Impact (project requires
excavation at points (i.e. control valve vault))
3 0-25% 0-25th percentile >$1,000,000 Benefits 1 QWS 1-3 days
Large Impact (project requires construction
for > 200 feet of pipe off QWS property, in
roadways)

7.0—RECOMMENDED PROJECTS
7-5
With the criteria and scoring guidelines set, the next step is to assign scores for each project to calculate a total benefit score for each project. The scores are then summarized to demonstrate to what extent each project supports each criterion. Using this approach a prioritization team can quickly compare both the total benefits of any given project and to what extent each project scored relative to the criteria. Given the local nature of the projects identified in Exhibit 7-1, GEFA did not request the project team to prioritize the recommended projects at this time. If a prioritized list is produced later, it will resemble results used in various regional plans produced under the Georgia State-wide Water Management Plan as reflected below in Exhibit 7-4.
EXHIBIT 7-4 Example Prioritization Results

7.0—RECOMMENDED PROJECTS
7-6
This Page Intentionally Left Blank.

8-1
8.0 Model Agreements and Summary of Innovative Financing Best Practices
Improving the interconnectivity, resilience and reliability of the District’s water supply and delivery infrastructure will require the use of various mechanisms for arranging capital project financing and equitably distributing cost responsibilities. The viability of project financing arrangements will be largely dependent on the anticipated project costs, the number of benefitting parties, and identification of sufficient revenue streams to support the selected project financing option.
8.1 Financing Approaches Project size, complexity, and the presence of multiple beneficiaries are all relevant in the consideration of financing strategies. In general, projects can be organized into two groups for financing and financial planning purposes:
• Independent Projects – These projects are internal to a QWS. As such, the project costs are nearly always limited, and there are effectively no cost allocation issues. While most interconnections could theoretically serve both QWSs, many interconnection projects are driven entirely by the needs of one of the two QWSs, and the realistic potential for utilization to benefit the other party is essentially zero.
• Shared Projects – These projects cover multiple QWSs within a local area. Costs may range from relatively minimal amounts to levels that could impact the rates charged by the water suppliers. These projects require allocation of cost responsibilities across more than one beneficiary. These cost allocations will ultimately impact water pricing within and across jurisdictional boundaries.
These two groups of projects may benefit from somewhat different financing approaches and levels of effort, but the financing needs of the projects identified in Section 7 to meet projected emergency demands are likely to be well satisfied by traditional utility system financing options. Current state and regional institutions, in collaboration with water suppliers, have developed similar projects and have arranged to distribute cost responsibilities through various forms of service contracts and intergovernmental agreements.
8.1.1 Independent Projects Many of the projects listed in Exhibit 7-1 may be readily financed by the individual QWSs. In fact, for projects costing less than a few million dollars, most forms of debt financing (excluding subsidized loans provided by GEFA) are not economical due to transaction costs. Also, the projects that are largely associated with an individual QWS do not present cost allocation issues, because costs are borne only by the QWS involved.
8.1.2 Shared Projects The vast majority of the projects listed in Exhibit 7-1 that might be considered shared projects also do not present significant project finance challenges. The costs involved tend to be within the normal financing ranges managed by utilities, and in most cases the cost allocations tend to be straightforward. One exception to this general rule may be with respect to arrangements for emergency or standby service as were evaluated in this study, for which there is relatively limited precedent for cost sharing. However, a variety of different arrangements have been used successfully to obtain project financing for locally shared projects. Benefitting providers have typically contributed cash or separately issued debt to finance allocated shares of project costs; however, in some cases separate legal entities with debt issuance authority have been created.

8.0—MODEL AGREEMENTS AND SUMMARY OF INNOVATIVE FINANCING BEST PRACTICES
8-2
Larger shared projects have more project financing and cost allocation challenges, but few, if any, of the projects identified in Section 7 are likely to encounter such challenges. In the event that such projects were developed in the future, arrangements between multiple public water providers or a consortium of private interests, often with some form of state or regional agency sponsorship, are likely to meet the financing and funding needs.
8.2 Financing Options for the Recommended Projects and Regional Projects
Exhibit 8-1 provides a listing of financing options for the projects identified in this study. While all of the projects are consistent with traditional financing options, some additional options potentially relevant to larger “regional” projects (such as construction of new reservoirs) are also provided in Exhibit 8-1.
In evaluating any of the options listed in Exhibit 8-1, several key attributes should be considered:
• Sources of Funding – The sources of funding can have significant implications on the overall cost of capital and the nature of restrictions on the use of proceeds. For example, public agencies generally benefit from the availability of tax-exempt financing instruments, which carry important restrictions to ensure that proceeds are applied for public benefit. Private sector funding sources are typically subject to taxation but may be applied to a broader spectrum of project development options. Specific government actions to support financing, whether grants or specialized forms of taxation, typically impose very specific requirements on the application of funds.
• Interest Rates/Cost of Funding – The different sources of financing generally imply different costs of capital. Funding relatively low-cost interconnection projects primarily through water providers’ fund balances or current revenues is undoubtedly the least expensive method of financing these projects. Non-traditional public options (e.g. SPLOST) that are effectively different forms of taxation also avoid interest costs, though there are significant administrative and transactions costs associated with these options. On the other end of the spectrum, taxable privately placed financing will typically impose relatively higher costs of capital.
• Financing Period/Term – In general, project financing will be completed before the end of the useful life of the installed assets. The resultant intergenerational equity impacts may be relatively insignificant for low-cost projects, but become an important consideration for larger scale investments. Financing periods are effectively non-existent for some of the interconnection or small independent projects that may be financed with current assets, while debt financing typically spreads project costs over a 20- to 30-year time frame. Differences in financing periods across debt instruments may have material impacts on water sales pricing and may be an important consideration in defining a feasible project debt portfolio.
• Security Provisions – For projects involving debt, a variety of considerations relate to managing the risks attendant in lending money over an extended period of time. These considerations do not prevail for cash-funded projects or those supported by non-traditional tax measures, and may be all the more acutely considered in private sector project developments. Security provisions relate, for example, to whether the debt obligations are insured or are supported by debt service reserve funds, and how supporting revenues are pledged.
In arranging project financing, it is critically important to use funding options with attributes that best align with the specific characteristics of the project. For most of the projects identified in this study, relatively simple, traditional financing approaches will limit water supplier indebtedness and minimize life-cycle project costs. For larger projects, a number of non-traditional and innovative options, including engagement of the private sector, may be employed to address long-term regional water supply challenges.
In conclusion, there is a broad spectrum of financing options available for financing water supply projects that may increase the interconnectivity, reliability and redundancy of systems throughout the District. Most of the

8.0—MODEL AGREEMENTS AND SUMMARY OF INNOVATIVE FINANCING BEST PRACTICES
8-3
projects identified as part of this study do not represent particularly substantial resource investments and may be readily financed with available, traditional instruments. Public sector water financing in Georgia is further enhanced with quality state and regional agencies (e.g. GEFA) experienced in arranging financing for relatively low-cost projects. In addition, water suppliers in the District are experienced in accessing the nation’s robust municipal finance markets. While there may be new rules established to encourage or enhance a greater focus on water supply reliability, financing of the projects recommended to meet the goals of the WSIRRA is not expected to be a particularly significant challenge.
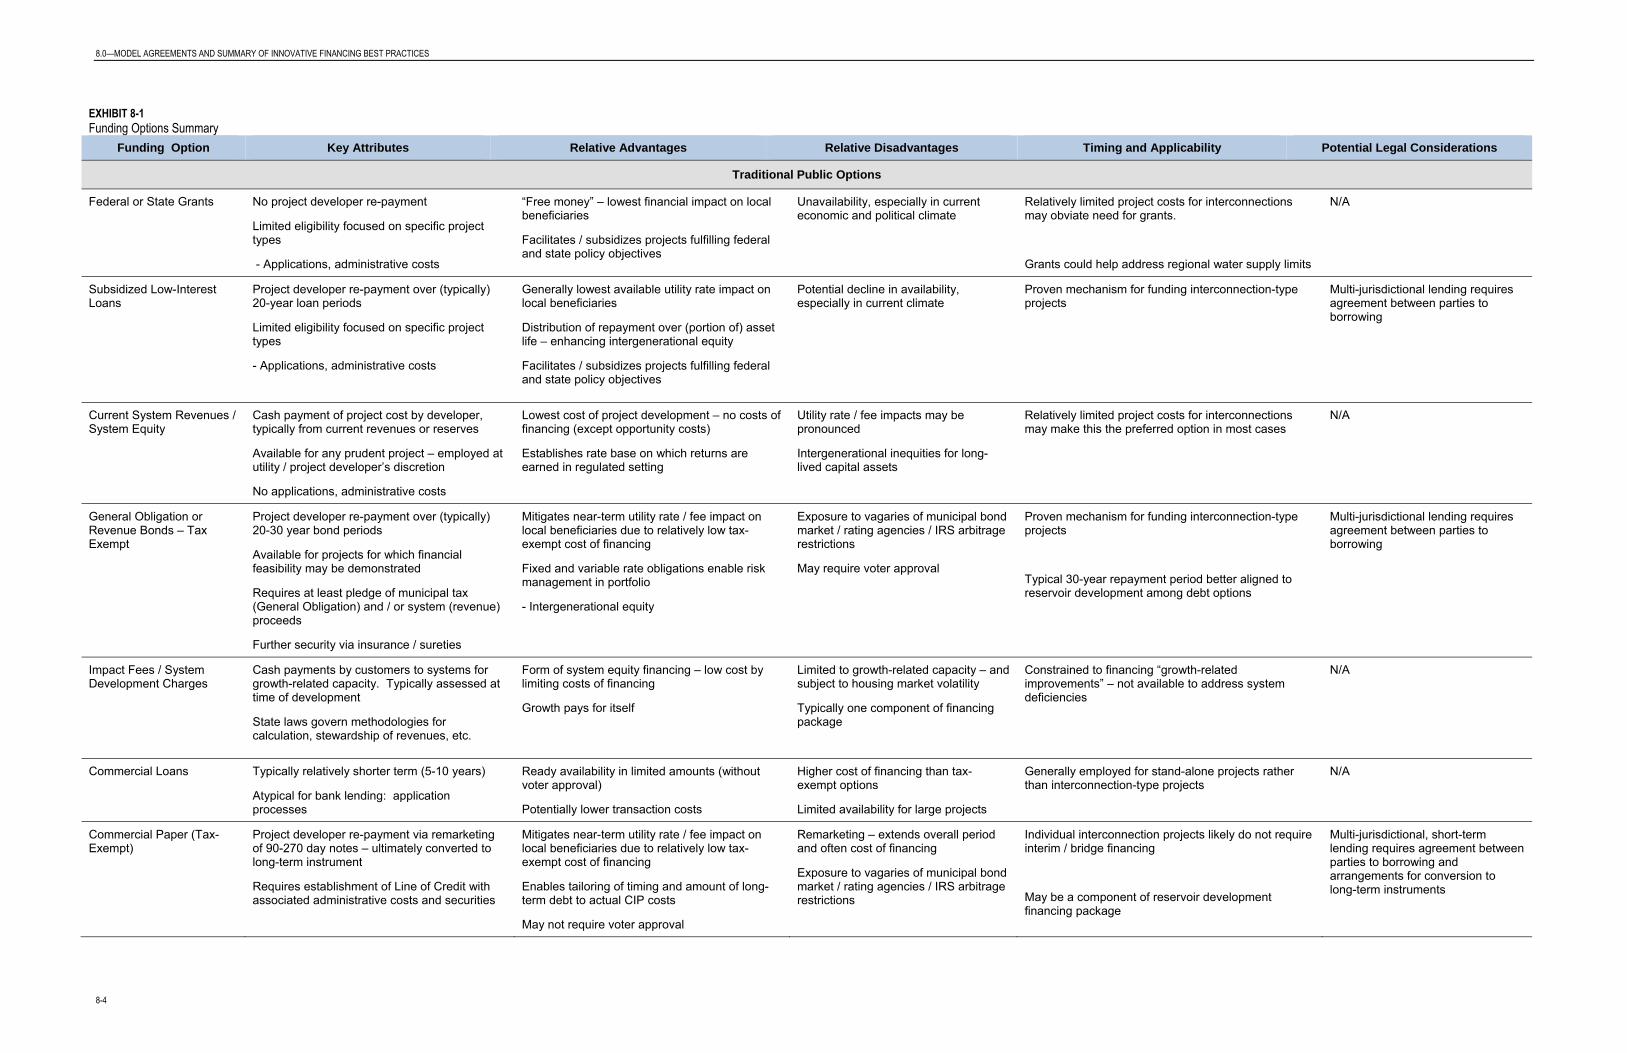
8.0—MODEL AGREEMENTS AND SUMMARY OF INNOVATIVE FINANCING BEST PRACTICES
8-4
EXHIBIT 8-1 Funding Options Summary
Funding Option Key Attributes Relative Advantages Relative Disadvantages Timing and Applicability Potential Legal Considerations
Traditional Public Options
Federal or State Grants No project developer re-payment
Limited eligibility focused on specific project types
- Applications, administrative costs
“Free money” – lowest financial impact on local beneficiaries
Facilitates / subsidizes projects fulfilling federal and state policy objectives
Unavailability, especially in current economic and political climate
Relatively limited project costs for interconnections may obviate need for grants.
Grants could help address regional water supply limits
N/A
Subsidized Low-Interest Loans
Project developer re-payment over (typically) 20-year loan periods
Limited eligibility focused on specific project types
- Applications, administrative costs
Generally lowest available utility rate impact on local beneficiaries
Distribution of repayment over (portion of) asset life – enhancing intergenerational equity
Facilitates / subsidizes projects fulfilling federal and state policy objectives
Potential decline in availability, especially in current climate
Proven mechanism for funding interconnection-type projects
Multi-jurisdictional lending requires agreement between parties to borrowing
Current System Revenues / System Equity
Cash payment of project cost by developer, typically from current revenues or reserves
Available for any prudent project – employed at utility / project developer’s discretion
No applications, administrative costs
Lowest cost of project development – no costs of financing (except opportunity costs)
Establishes rate base on which returns are earned in regulated setting
Utility rate / fee impacts may be pronounced
Intergenerational inequities for long-lived capital assets
Relatively limited project costs for interconnections may make this the preferred option in most cases
N/A
General Obligation or Revenue Bonds – Tax Exempt
Project developer re-payment over (typically) 20-30 year bond periods
Available for projects for which financial feasibility may be demonstrated
Requires at least pledge of municipal tax (General Obligation) and / or system (revenue) proceeds
Further security via insurance / sureties
Mitigates near-term utility rate / fee impact on local beneficiaries due to relatively low tax-exempt cost of financing
Fixed and variable rate obligations enable risk management in portfolio
- Intergenerational equity
Exposure to vagaries of municipal bond market / rating agencies / IRS arbitrage restrictions
May require voter approval
Proven mechanism for funding interconnection-type projects
Typical 30-year repayment period better aligned to reservoir development among debt options
Multi-jurisdictional lending requires agreement between parties to borrowing
Impact Fees / System Development Charges
Cash payments by customers to systems for growth-related capacity. Typically assessed at time of development
State laws govern methodologies for calculation, stewardship of revenues, etc.
Form of system equity financing – low cost by limiting costs of financing
Growth pays for itself
Limited to growth-related capacity – and subject to housing market volatility
Typically one component of financing package
Constrained to financing “growth-related improvements” – not available to address system deficiencies
N/A
Commercial Loans Typically relatively shorter term (5-10 years)
Atypical for bank lending: application processes
Ready availability in limited amounts (without voter approval)
Potentially lower transaction costs
Higher cost of financing than tax-exempt options
Limited availability for large projects
Generally employed for stand-alone projects rather than interconnection-type projects
N/A
Commercial Paper (Tax-Exempt)
Project developer re-payment via remarketing of 90-270 day notes – ultimately converted to long-term instrument
Requires establishment of Line of Credit with associated administrative costs and securities
Mitigates near-term utility rate / fee impact on local beneficiaries due to relatively low tax-exempt cost of financing
Enables tailoring of timing and amount of long-term debt to actual CIP costs
May not require voter approval
Remarketing – extends overall period and often cost of financing
Exposure to vagaries of municipal bond market / rating agencies / IRS arbitrage restrictions
Individual interconnection projects likely do not require interim / bridge financing
May be a component of reservoir development financing package
Multi-jurisdictional, short-term lending requires agreement between parties to borrowing and arrangements for conversion to long-term instruments
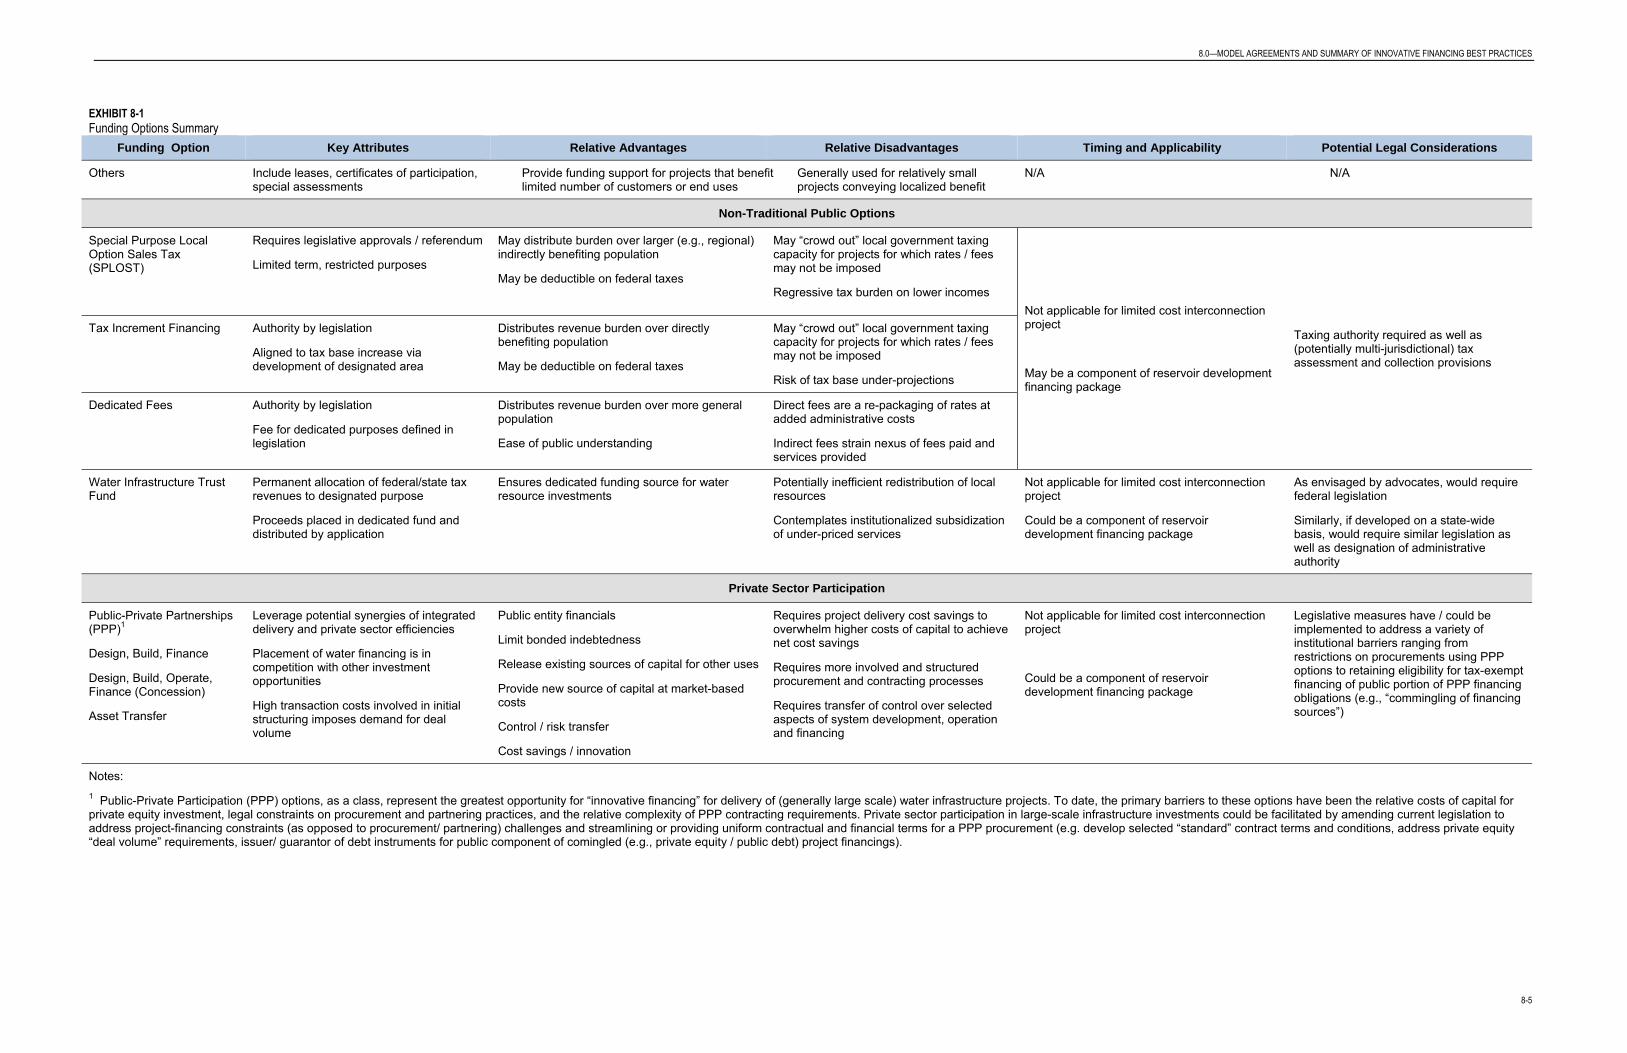
8.0—MODEL AGREEMENTS AND SUMMARY OF INNOVATIVE FINANCING BEST PRACTICES
8-5
EXHIBIT 8-1 Funding Options Summary
Funding Option Key Attributes Relative Advantages Relative Disadvantages Timing and Applicability Potential Legal Considerations
Others Include leases, certificates of participation, special assessments
Provide funding support for projects that benefit limited number of customers or end uses
Generally used for relatively small projects conveying localized benefit
N/A N/A
Non-Traditional Public Options
Special Purpose Local Option Sales Tax (SPLOST)
Requires legislative approvals / referendum
Limited term, restricted purposes
May distribute burden over larger (e.g., regional) indirectly benefiting population
May be deductible on federal taxes
May “crowd out” local government taxing capacity for projects for which rates / fees may not be imposed
Regressive tax burden on lower incomes Not applicable for limited cost interconnection project
May be a component of reservoir development financing package
Taxing authority required as well as (potentially multi-jurisdictional) tax assessment and collection provisions
Tax Increment Financing Authority by legislation
Aligned to tax base increase via development of designated area
Distributes revenue burden over directly benefiting population
May be deductible on federal taxes
May “crowd out” local government taxing capacity for projects for which rates / fees may not be imposed
Risk of tax base under-projections
Dedicated Fees Authority by legislation
Fee for dedicated purposes defined in legislation
Distributes revenue burden over more general population
Ease of public understanding
Direct fees are a re-packaging of rates at added administrative costs
Indirect fees strain nexus of fees paid and services provided
Water Infrastructure Trust Fund
Permanent allocation of federal/state tax revenues to designated purpose
Proceeds placed in dedicated fund and distributed by application
Ensures dedicated funding source for water resource investments
Potentially inefficient redistribution of local resources
Contemplates institutionalized subsidization of under-priced services
Not applicable for limited cost interconnection project
Could be a component of reservoir development financing package
As envisaged by advocates, would require federal legislation
Similarly, if developed on a state-wide basis, would require similar legislation as well as designation of administrative authority
Private Sector Participation
Public-Private Partnerships (PPP)1
Design, Build, Finance
Design, Build, Operate, Finance (Concession)
Asset Transfer
Leverage potential synergies of integrated delivery and private sector efficiencies
Placement of water financing is in competition with other investment opportunities
High transaction costs involved in initial structuring imposes demand for deal volume
Public entity financials
Limit bonded indebtedness
Release existing sources of capital for other uses
Provide new source of capital at market-based costs
Control / risk transfer
Cost savings / innovation
Requires project delivery cost savings to overwhelm higher costs of capital to achieve net cost savings
Requires more involved and structured procurement and contracting processes
Requires transfer of control over selected aspects of system development, operation and financing
Not applicable for limited cost interconnection project
Could be a component of reservoir development financing package
Legislative measures have / could be implemented to address a variety of institutional barriers ranging from restrictions on procurements using PPP options to retaining eligibility for tax-exempt financing of public portion of PPP financing obligations (e.g., “commingling of financing sources”)
Notes: 1 Public-Private Participation (PPP) options, as a class, represent the greatest opportunity for “innovative financing” for delivery of (generally large scale) water infrastructure projects. To date, the primary barriers to these options have been the relative costs of capital for private equity investment, legal constraints on procurement and partnering practices, and the relative complexity of PPP contracting requirements. Private sector participation in large-scale infrastructure investments could be facilitated by amending current legislation to address project-financing constraints (as opposed to procurement/ partnering) challenges and streamlining or providing uniform contractual and financial terms for a PPP procurement (e.g. develop selected “standard” contract terms and conditions, address private equity “deal volume” requirements, issuer/ guarantor of debt instruments for public component of comingled (e.g., private equity / public debt) project financings).

8.0—MODEL AGREEMENTS AND SUMMARY OF INNOVATIVE FINANCING BEST PRACTICES
8-6
8.3 Cost Allocation Options This section summarizes some of the issues related to the allocation of costs associated with interconnections between water utilities. Specific cost allocation solutions for any of the projects identified may vary, so potentially useful allocation concepts are introduced and discussed in terms of relative advantages and disadvantages. This allows an appropriate solution to be developed that addresses each project’s unique requirements and the needs of the individual QWSs. Additionally, this section includes an illustration of a cost allocation “decision tree” to suggest a logic sequence for future use in considering new or different types of cost allocation models as projects become relevant.
8.3.1 Cost Allocation Concepts Obviously there are differences in the treatment of costs for the two types of projects discussed earlier (i.e., independent and shared). The costs of projects that benefit solely one QWS should be borne by that system. The costs of projects that benefit more than one QWS must be allocated to all of the benefiting systems.
This section is primarily concerned with the allocation of project costs for the types of shared projects being driven by the WSIRRA. The focus here is primarily on cost allocation to support new projects. Existing interconnection and reliability assets have already been planned for, designed and constructed; thus, it is presumed that these costs are already being recovered under existing agreements and cost allocation patterns.
Recognizing key differences in the types of costs being considered is helpful in appropriately allocating costs. Operating and capital costs are different, and fixed and variable costs are different. These and other attributes may suggest different cost allocation or cost recovery approaches in some circumstances.
The experiences of utilities currently utilizing assets of benefit to more than one system indicate that multiple solutions are available. A wide variety of existing terms regarding rates and cost sharing are currently in use between utilities in the region. In some cases, base charges and volumetric components are applied, while in other cases the only charge is volume-based when usage occurs. In yet other cases a standard retail rate schedule is utilized or an average of rates for each utility is used.
This variety in the solutions reached by utility managers suggests that many non-cost factors may be relevant when two utilities agree on a cost allocation procedure. This is not surprising given the wide variety of types and utilization of interconnections. In some cases, utilities rely on neighboring utilities for all or a large portion of their water supply on a regular basis, while at the other extreme, some interconnections may exist for emergency support and never have been used. Elaborate cost allocation procedures are applicable in some cases, while in other cases, very simple solutions are employed. The appropriate level of effort is influenced by factors such as the magnitude of the costs involved; the long-term relationship between the utilities; the involvement of other units of local government; the rate of growth of each service area; the presence or lack of reliable water supply; the financial condition of each utility; and the local economic conditions in each service area.
A fundamental consideration in cost allocation is the ability to allocate costs to reflect the behaviors or needs that led to the cost being incurred. The attempt is made to associate costs with the need for facilities or services as a means of working toward an equitable allocation of costs. This objective is foundational in the water industry, and is generally seen as contributing to an efficient utilization of resources as consumers are informed directly or indirectly through prices or cost allocations of the implications of their actions.
This objective is tempered with a number of other objectives including, among others, the ability to generate sufficient revenues to cover the full costs of the project in question; the minimization of administrative costs, including implementation costs; the ease of communicating with stakeholders; the reliability of the resulting revenue stream and concurrent implications for funding; and the affordability of a full cost allocation to the parties involved.
8.0—MODEL AGREEMENTS AND SUMMARY OF INNOVATIVE FINANCING BEST PRACTICES
8-7
Another important factor in evaluating cost allocation approaches is the availability of data to support the allocation, both in preparation for a project and throughout its life. In this case, the need for reliable water supply can be associated with water consumption or potential demands, and as such, a number of alternative estimation procedures are available. The benefit to a customer or QWS could be measured similarly, restricted only by the quantity of water used or potentially used. Broader measures related to projects or parts of projects determined to have regional benefit could involve such higher level characteristics as population, employment or land area served.
8.3.2 Cost Allocation Examples Utilities in Georgia and throughout the U.S. have encountered issues and opportunities like those discussed in this section for many years. Their experiences demonstrate a range of potential solutions and confirm the opportunities for mutually beneficial arrangements. Brief summaries of three different situations are provided as examples of positive cost-sharing outcomes on a system-wide basis. Following the three examples of system-wide cost-sharing solutions, several examples of cost allocations for interconnections are presented to illustrate various approaches applied by water systems in the metro Atlanta area.
8.3.2.1 Atlanta – Fulton County Water Resources Commission The city of Atlanta and Fulton County entered into an agreement in 1986 for the joint construction of a water treatment plant, needed in the north Fulton County area to serve both the city and the county’s needs. The agreement runs for a period of 50 years, and it led to the formation of the Atlanta-Fulton County Water Resources Commission. Through the agreement, both entities agreed to share in the expenses of construction and operation of the plant. They also undertook joint planning and development enterprises for the efficient use of the water resources in general.
The Commission is the decision-making body of the joint venture and is formed of seven members: three from the city, three from the county, and one “independent” member not employed by either the city or the county and elected by vote of the other members. The Commission is in charge of formulating plans for site acquisition; developing plans for the construction and use of the facilities; reviewing and updating plans and procedures for additions and improvements; making long-term plans for additional joint efforts in the utilization of the water resources; establishing policies and procedures for the operations and maintenance of the facilities; and establishing the cost allocation to be charged for the water delivered to the respective distribution systems, based on metered water flows and finished water pumping costs.
The financial arrangement and cost allocations were established through the same agreement. Both the city and county agreed to pay for half of all the funds necessary to enable the Commission to perform its responsibilities throughout the period of planning and construction, until appropriate cost allocation formulas could be approved and established. All mutually agreeable capital costs associated with the facilities, including site acquisition, legal services, planning, engineering, and construction costs, were shared equally by the city and county. Furthermore, the agreement established that the cost of any additions and improvements would not be undertaken until it was approved by both parties. The city and county agreed upon certain reimbursements and credits, based on payments already made by the city towards the land and other expenses.
Once the facilities were constructed, it was agreed that the city and county would jointly own the land, treatment plant, intake, raw water lines, and raw water storage reservoirs on a 50-50 basis. Each entity owns and is entitled to distribute 50 percent of the total supply of water treated by the plant, or 50 percent of the capacity, whichever is greater. If either entity exceeded the 50 percent share needs, the agreement provides for the possibility of short-term agreements to deal with the excess share.
The monthly operating costs are allocated on the basis of pro-rata share of the water delivered to each party, as determined by the monthly meter readings. Each entity is billed monthly by the Commission. In addition to the

8.0—MODEL AGREEMENTS AND SUMMARY OF INNOVATIVE FINANCING BEST PRACTICES
8-8
monthly operating costs, the entities established a depreciation reserve account, funded monthly by the amount equal to the monthly depreciation expense, to be used only for renewal and/or replacement expenses.
This is an illustration of a much more substantial relationship than might be required for most of the improvements identified in this project, but it does confirm the ability of two units of local government to collaborate successfully on a large and complex undertaking.
8.3.2.2 Anderson Regional Joint Water System, South Carolina The Anderson Regional Joint Water System is a partnership of rural and municipal water districts in upstate South Carolina devoted to providing a high-quality, clean, safe, reliable and economical flow of treated water to its wholesale customers in Anderson and Pickens Counties. The Joint Water System’s Lake Hartwell Water Treatment Plant is supplied by surface water from the U.S. Army Corps of Engineers’ 55,000-acre Lake Hartwell Reservoir, which lies along the border of South Carolina and Georgia. Formed in 2000, there were initially three founding members: Belton-Honea Path Water Authority, Big Creek Water District, and Broadway Water District. These three members expanded the partnership to incorporate ten new members in April 2002, and the expanded partnership subsequently purchased and began operating Duke Energy’s Lake Hartwell Water Treatment Plant.
The Joint Water System is currently governed by a 15-member Board of Commissioners. Each member of the Board represents a water district or municipality that purchases its water from the Joint Water System. Currently, there are 15 member agencies in Anderson and Pickens Counties, and all except Belton-Honea Path Water Authority and the town of Central receive treated water from the Joint Water System. Clemson University also purchases water from the System, but because of state statute is exempt from membership on the Board. When the Anderson Regional Joint Water System partnership was originally established, all the water districts in the area became special purpose districts, through a special act written in the South Carolina state law to allow for this partnership. Each member received ownership in the water plant in terms of capacity, based on each member’s capacity needs.
The members on the Board have voting rights on all issues; however, each member district can carry more or less weight in the voting, depending on the type of issue being discussed. For some issues, each member district carries one vote equally, for other issues there must be a unanimous agreement, and for other issues each member votes proportional to the capacity they own. The original agreement defined the types of issues that require the different voting scenarios.
The Joint Water System borrowed $58.6 million to purchase the water plant from Duke Power, and the initial cash buy-in from each member district was the cash that each member had to front for the debt service reserve, which was proportional to their portion of the capacity owned. After the initial debt service reserve, each member district contributes through the monthly billing. The monthly billing is broken into two components: the volumetric portion is based on the percent of flow taken from the plant, and the capital charge is based on the percent of capacity each member owns (each member’s portion of the debt service), plus a 30 percent rehabilitation charge. In addition, those systems north of the plant also contribute to a portion of the extra pumping costs required to serve them. With each new upgrade to the plant, the Joint Water System issues additional debt as needed, and the capital charge increases for each member, based on their portion of the capacity owned in the plant.
This case illustrates the ability of a large number of independent systems to collaborate on a large and complex project for their mutual benefit. Additionally, it illustrates a common pattern in cost allocation, which is to allocate fixed costs according to pre-established capacity requirements, and variable costs according to usage.

8.0—MODEL AGREEMENTS AND SUMMARY OF INNOVATIVE FINANCING BEST PRACTICES
8-9
8.3.2.3 Upper Oconee Basin Water Authority, Georgia The Bear Creek Water Treatment and Transmission Facilities were constructed and are owned by the Upper Oconee Basin Water Authority (UOBWA). UOBWA is a public body established under the laws of the state of Georgia in the late 1980s, with the purpose of planning and developing a regional water supply system for its member governments. The members are Oconee, Barrow and Jackson Counties, and the consolidated government of Athens-Clarke County, all located in northeast Georgia. Each member contributed to the cost of constructing the facilities. The member counties purchase treated water from UOBWA on a wholesale basis and provide retail service to their individual customers. Athens-Clarke County only purchases raw water, which feeds its treatment facility.
Two intergovernmental agreements outlined how raw and treated water, and the associated costs, were allocated among the UOBWA members. In addition to the two intergovernmental agreements, the UOBWA issued a Series 1997 Revenue Bond to pay for the construction of the water treatment plant and the Barrow, Jackson and Oconee Counties’ share of the raw water reservoir.
A cost allocation method was developed based on the intergovernmental agreements and the Series 1997 Revenue Bond documents. Costs were allocated between treatment and raw water costs, and costs were then further allocated based on entitlement, bond proceeds, bond share, consultant fee share, operations contract share, and use share. In Athens-Clarke County’s case, the costs associated with the water treatment plant and the associated revenue bond were not applicable as Athens-Clarke County only participated in the raw water reservoir portion of the project. Exhibit 8-2 below summarizes how the costs were allocated among these various cost categories.
EXHIBIT 8-2 Cost Allocations for UOBWA Bear Creek Reservoir, Treatment, and Transmission Facilities
Method
Athens-Clarke Barrow Jackson Oconee
Raw Treat-ment
Raw Treat-ment
Raw Treat-ment
Raw Treat-ment
Entitlement Share 44.0% 0.0% 19.0% 38.1% 25.0% 42.9% 12.0% 19.0%
Bond Share 0.0% 0.0% 33.9% 39.5% 44.7% 39.8% 21.4% 20.7%
Operations Contract Share 44.0% 0.0% 18.7% 33.3% 18.7% 33.3% 18.7% 33.3%
Athens-Clarke Use Share 100.0% 0.0% 0.0% 0.0% 0.0% 0.0% 0.0% 0.0%
Jackson Use Share 0.0% 0.0% 0.0% 0.0% 0.0% 100.0% 0.0% 0.0%
Barrow/Oconee Use Share 0.0% 0.0% 0.0% By
use 0.0% By use 0.0% 0.0%
Use Share
By use 0.0% By
use By use
By use
By use
By use
By use
8.0—MODEL AGREEMENTS AND SUMMARY OF INNOVATIVE FINANCING BEST PRACTICES
8-10
8.3.2.4 Cost Allocations for Interconnections Many utilities have negotiated agreements to pay for new distribution piping and meters to allow one system to supply water to another. These agreements typically are negotiated when one system has a need for water, usually to supply water to an area that has low pressures or in cases where water can be obtained more economically from other surrounding utilities. The actual sharing of capital costs will be based on whether the improvements benefit only one utility or both.
Several examples of cost allocation approaches for interconnections are summarized below:
• As a wholesale supplier of finished water in the metro Atlanta area, the Cobb County-Marietta Water Authority (CCMWA) provides finished water to eleven public water systems through a large number of connections to CCMWA’s network of transmission mains and storage tanks throughout Cobb County. Most of these interconnections are for regular daily water supply; however, some interconnections are for intermittent or emergency use only. With the exception of Cobb County Water System (CCWS), the responsibility of paying the capital costs for the piping connections from the CCMWA transmission system to the purchasers’ systems is usually borne by the purchaser; however, if a determination is made that a new connecting pipeline has a mutual benefit for CCMWA, a joint funding agreement is executed based on a negotiated split of total project costs for design, construction management, materials, construction and land acquisition. For example, one of CCMWA’s customers needed to add a new interconnection to the CCMWA transmission system to supplement the supply available from existing interconnections; the two entities agreed that the purchasing system would be responsible for the installation costs for the new pipeline to the interconnection point, and would then turn over ownership of the pipeline to CCMWA for long-term operation and maintenance. Alternatively, because CCWS’s system provides redundancy for CCMWA’s transmission system during system maintenance events, CCMWA and CCWS often share costs in the construction of new connections.
• The Newton County Water & Sewerage Authority (NCWSA) faced occasional pressure problems in portions of its system near the Rockdale County system. NCWSA approached Rockdale County to request several interconnections. Rockdale County had no reciprocal need but readily agreed to NCWSA’s request for a one-way supply. A total of eight interconnections were envisioned, mostly using 8-inch pipes. NCWSA performed the engineering and planning, and installed four of the interconnections, including the required backflow preventers. The first four interconnections appear to have provided a sufficient solution to the need for additional water supply, and the remaining four are not anticipated to be constructed. No tap fee was charged by Rockdale County for these interconnections, and no capital costs were paid by Rockdale County. Discussions regarding a usage rate have been held between the two systems on a periodic basis since installation of the interconnections, but no contract has yet been executed. Usage by NCWSA occurs less than once a year, but the interconnection has been of great benefit to NCWSA in addressing short-term water supply issues. Billings from Rockdale County for the usage by NCWSA have not been at a consistent rate, but the variable rate has not been an issue of great concern to NCWSA, as obtaining sufficient water during an emergency has outweighed all other factors.
• An emergency interconnection was built to supply water from the Gainesville water system to the Jackson County Water and Sewerage Authority (JCWSA). Gainesville has an agreement with JCWSA that acknowledges the potential for each party to receive water from the other, but assigns sole responsibility for immediate capital expenses to JCWSA; this cost allocation provision was implemented for this emergency interconnection, with JCWSA paying the capital costs for the project. Because of current hydraulic conditions in the two water systems, water can only be delivered from Gainesville to JCWSA, making JCWSA the benefiting system. The standing agreement includes provisions for setting the rates for water purchased by either party, in the event that this or a future interconnection is able to deliver water in both directions.
8.0—MODEL AGREEMENTS AND SUMMARY OF INNOVATIVE FINANCING BEST PRACTICES
8-11
• Clayton County Water Authority (CCWA) was approached by the City of College Park to provide up to 1.5 mgd of potable water. The City of College Park was the primary beneficiary for this interconnection and proposed to pay for the design and construction of the water line that would run from CCWA’s system to the city’s. CCWA agreed to this approach as long as CCWA could review the plans and be involved in the construction to ensure that it met CCWA’s standards. The City and CCWA also negotiated an agreement on payment for water used each year.
• CCWA and Fayette County have constructed emergency interconnections between their systems in the past. These interconnections were designed and intended to provide one-way supply, with one interconnection providing emergency water supply from CCWA to Fayette County and the other providing emergency supply from Fayette County to CCWA as dictated by the system operating pressures at the tie-in points. In each of these cases, it was agreed that the receiving water system would pay the capital cost of the interconnection. CCWA has an agreement with Fayette and other systems, “It is agreed that additional tie-ins can be requested by either party, and that the cost of piping, valves, meters, meter vaults, etc., shall be negotiated between the parties.” This element of the agreement acknowledges a possibly evolving need for new interconnections between the parties, and that a case-by-case negotiation of cost apportionment is warranted in those cases.
This case illustrates the ability of four independent utilities to establish an elaborate allocation of costs suitable to their joint project. The allocations allowed for differing levels of participation and reflected the capacity demands and volumetric use of the parties for various types of costs.
8.3.3 Summary of Cost Allocation Options Exhibit 8-3 summarizes cost allocation options potentially of value in a variety of situations. It does not prescribe specific solutions, but provides a basis for the involved parties to evaluate potential options. The first section of Exhibit 8-3 addresses the allocation of costs related to potential upgrades or rehabilitation projects related to existing emergency interconnection facilities, and the second section addresses new facilities associated with the WSIRRA.
In conclusion, the representatives of local and state governments have many options, and the widely varying circumstances of each situation suggest that costs will need to be recovered in more than one way.
Some of the key points to be considered include:
• The costs of new facilities can be allocated using a variety of measures; these measures can be categorized as reflecting the need of each system for the improvements in question or the ability of the system to pay for the needed improvements.
• The relative need of each QWS as reflected by the Critical Scenario Deficits estimated as part of this study may represent the most equitable single approach for cost allocation.
• Combinations of approaches could be utilized, particularly if some portion of the improvements in question were determined to provide regional benefit.
Exhibit 8-4 reflects a simplified decision tool demonstrating a series of steps that could be used in evaluating the allocation of costs among QWSs for interconnection projects in the future. The decision tree can be easily modified to incorporate additional allocation or cost factors. Total costs are first segmented into those related to existing facilities (generally, operating, maintenance, and repair costs (OMR)), and those related to new facilities (capital costs as well as OMR). An allowance is then made for potential third party support of major projects to indicate that financial support of particular projects by state or other agencies would be removed prior to the allocation of costs among the participating QWSs. This allowance for third party financial support merely acknowledges the potential for partial funding of projects deemed to serve a particularly important interest beyond that of the QWSs involved. The net costs of a project can then be allocated as a function of projected

8.0—MODEL AGREEMENTS AND SUMMARY OF INNOVATIVE FINANCING BEST PRACTICES
8-12
water supply deficits or some other measure or mix of measures. The magnitude of the cost burden to each QWS could be estimated, and an example evaluation metric of $1.00 per customer per month is shown to illustrate one potential view of the possible benefit of alternative funding mechanisms for especially large projects.

8.0—MODEL AGREEMENTS AND SUMMARY OF INNOVATIVE FINANCING BEST PRACTICES
8-13
EXHIBIT 8-3 Cost Allocation Options
Type of Costs Potential Allocation Approach Relative Advantages Relative Disadvantages Comments
Costs of producing / providing water from existing emergency interconnection facilities
Volume of water used through the connection Usage is often seen as being related to costs; volumetric cost allocations are common
Interconnection usage is not always metered; capacity costs are not always well recovered through volumetric charges; use of an interconnection for peaking purposes can be particularly troublesome if volumetric charges are not well crafted
Not likely to be the best option in cases except where the interconnection is a primary source of supply for one QWS and an existing agreement is in place
Potential capacity use as measured by connection / meter size
Capacity is clearly related to the costs of providing water for emergency usage
Capacity may not reflect burden of actual usage patterns as some interconnections are used for more than emergency water; cost-based capacity allocations may be significantly higher than many utilities are accustomed to paying for emergency capacity
Not likely to be the best option if any periodic use is associated with the interconnection
New cost-based combination of capacity and volumetric charges
Provides equitable means of recovering costs of providing capacity as well as costs of water production
Negotiation, calculation, and implementation costs of transition to new system
New, cost-based rate structures following cost-of-service principles as outlined in Principles of Water Rates, Fees, and Charges published by AWWA help to achieve equity in cost recovery, but transaction and implementation costs may be high
Any method currently used by the parties Already accepted and in use; transaction / negotiation costs are minimized
May not fit a common standard for cost allocations May be the best option for recovery of costs from existing facilities in most cases
Incremental costs of new facilities associated with WSIRRA
Volume of water used through the interconnection
Usage is often seen as being related to costs; volumetric cost allocations are common
Interconnection usage is not always metered; capacity costs are not always well recovered through volumetric charges; use of an interconnection for peaking purposes can be particularly troublesome if volumetric charges are not well crafted; may not reflect cost drivers for WSIRRA improvements
Not likely to be the best option in many cases
Potential capacity use as measured by interconnection / meter size
Capacity is clearly related to the costs of providing water for emergency usage
Capacity may not reflect burden of actual usage patterns as some interconnections are used for more than emergency water; cost-based capacity allocations may be significantly higher than many utilities are accustomed to paying for emergency capacity; may not reflect drivers for WSIRRA improvements
Not likely to be the best option if any periodic use is associated with the interconnection
New cost-based combination of capacity and volumetric charges
Provides equitable means of recovering costs of providing capacity as well as costs of water production
Negotiation, calculation, and implementation costs of transition to new system
New, cost-based rate structures following cost-of-service principles as outlined in Principles of Water Rates, Fees, and Charges published by AWWA help to achieve equity in cost recovery; cost-based rate structures may be especially appropriate in cases of significant new investment
Any method currently used by the parties Already accepted and in use; transaction / negotiation costs are minimized
Current cost allocation methods did not anticipate WSIRRA improvements and likely would not equitably allocate these costs
Not likely to be the best option in cases except where new WSIRRA-related investment is de minimis
Population served by the QWS May reflect system size; could be said to reflect system need in some cases; could reflect system funding ability in some cases
Does not account for non-residential usage; does not reflect capacity or volumetric utilization of the interconnection; potentially seen as punishing prepared systems; does not reflect cost drivers for WSIRRA improvements
Subject to the stated disadvantages, population served by the QWS could be a potential method of allocation for a portion of the costs of regional interconnection projects if such projects were determined to be of region-wide benefit
Population served by the interconnection May reflect capacity associated with the interconnection; could reflect need associated with the interconnection; could reflect system funding ability in some cases
Does not account for non-residential usage; does not reflect capacity or volumetric utilization; potentially seen as punishing prepared QWSs; does not reflect cost drivers for WSIRRA improvements
Not likely to be the best option in many cases
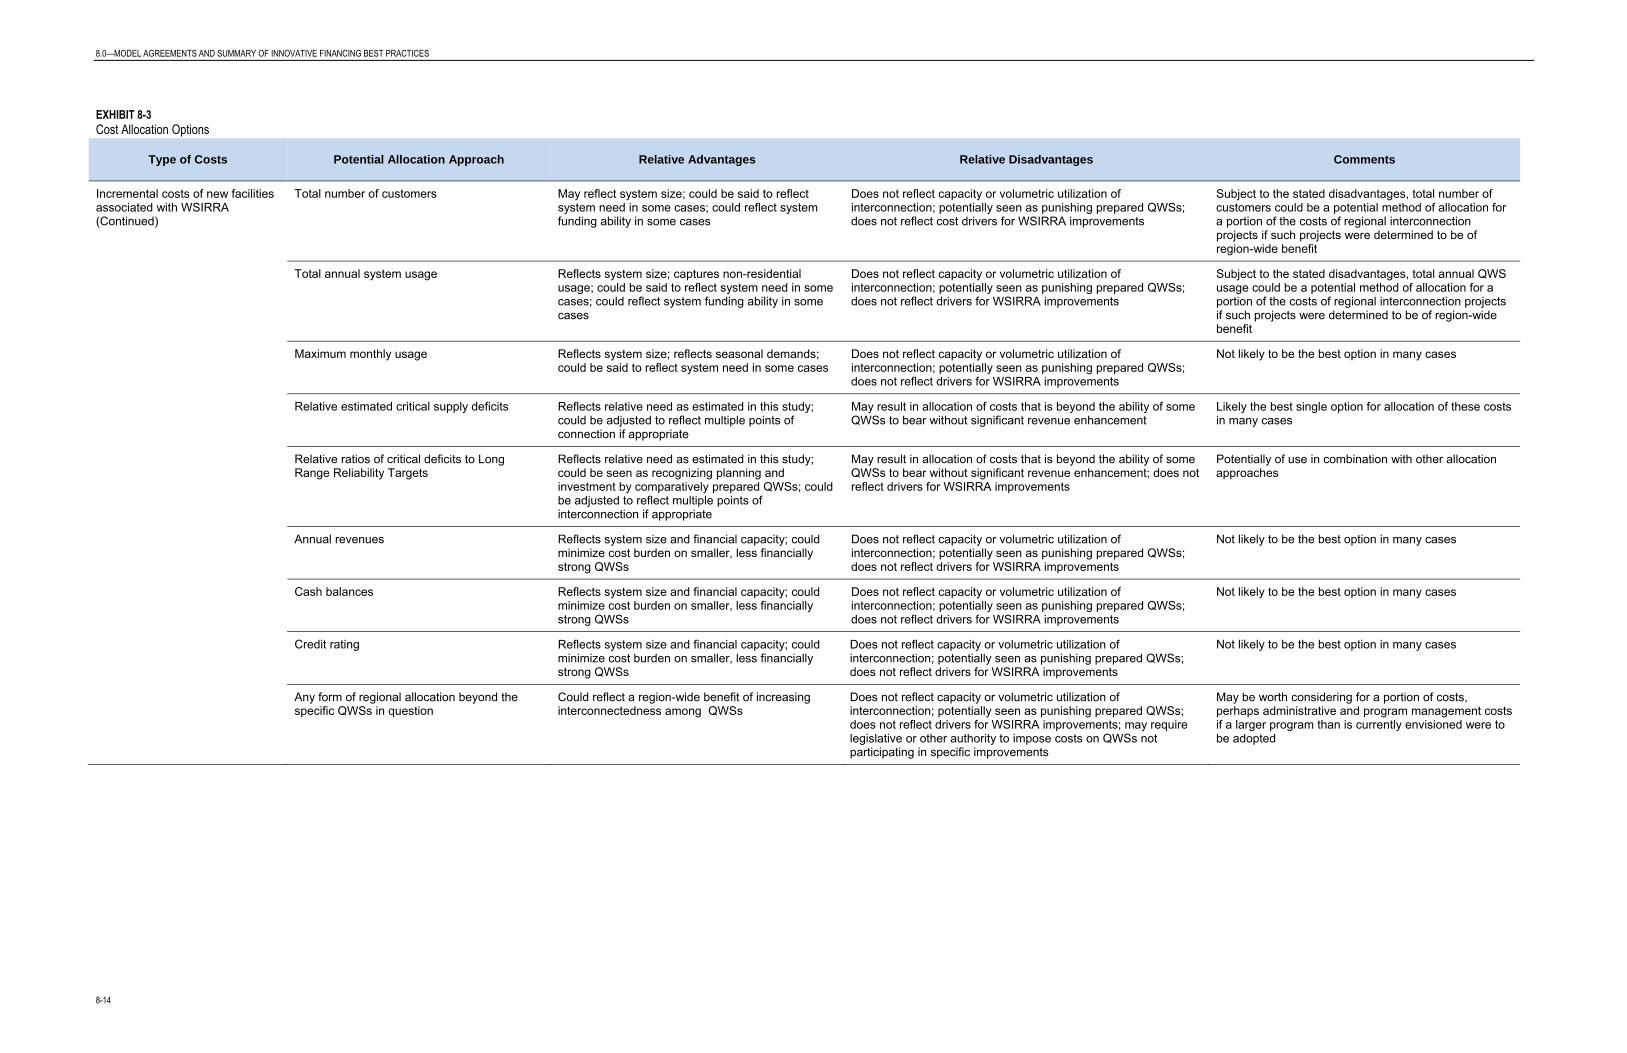
8.0—MODEL AGREEMENTS AND SUMMARY OF INNOVATIVE FINANCING BEST PRACTICES
8-14
EXHIBIT 8-3 Cost Allocation Options
Type of Costs Potential Allocation Approach Relative Advantages Relative Disadvantages Comments
Incremental costs of new facilities associated with WSIRRA (Continued)
Total number of customers May reflect system size; could be said to reflect system need in some cases; could reflect system funding ability in some cases
Does not reflect capacity or volumetric utilization of interconnection; potentially seen as punishing prepared QWSs; does not reflect cost drivers for WSIRRA improvements
Subject to the stated disadvantages, total number of customers could be a potential method of allocation for a portion of the costs of regional interconnection projects if such projects were determined to be of region-wide benefit
Total annual system usage Reflects system size; captures non-residential usage; could be said to reflect system need in some cases; could reflect system funding ability in some cases
Does not reflect capacity or volumetric utilization of interconnection; potentially seen as punishing prepared QWSs; does not reflect drivers for WSIRRA improvements
Subject to the stated disadvantages, total annual QWS usage could be a potential method of allocation for a portion of the costs of regional interconnection projects if such projects were determined to be of region-wide benefit
Maximum monthly usage Reflects system size; reflects seasonal demands; could be said to reflect system need in some cases
Does not reflect capacity or volumetric utilization of interconnection; potentially seen as punishing prepared QWSs; does not reflect drivers for WSIRRA improvements
Not likely to be the best option in many cases
Relative estimated critical supply deficits Reflects relative need as estimated in this study; could be adjusted to reflect multiple points of connection if appropriate
May result in allocation of costs that is beyond the ability of some QWSs to bear without significant revenue enhancement
Likely the best single option for allocation of these costs in many cases
Relative ratios of critical deficits to Long Range Reliability Targets
Reflects relative need as estimated in this study; could be seen as recognizing planning and investment by comparatively prepared QWSs; could be adjusted to reflect multiple points of interconnection if appropriate
May result in allocation of costs that is beyond the ability of some QWSs to bear without significant revenue enhancement; does not reflect drivers for WSIRRA improvements
Potentially of use in combination with other allocation approaches
Annual revenues Reflects system size and financial capacity; could minimize cost burden on smaller, less financially strong QWSs
Does not reflect capacity or volumetric utilization of interconnection; potentially seen as punishing prepared QWSs; does not reflect drivers for WSIRRA improvements
Not likely to be the best option in many cases
Cash balances Reflects system size and financial capacity; could minimize cost burden on smaller, less financially strong QWSs
Does not reflect capacity or volumetric utilization of interconnection; potentially seen as punishing prepared QWSs; does not reflect drivers for WSIRRA improvements
Not likely to be the best option in many cases
Credit rating Reflects system size and financial capacity; could minimize cost burden on smaller, less financially strong QWSs
Does not reflect capacity or volumetric utilization of interconnection; potentially seen as punishing prepared QWSs; does not reflect drivers for WSIRRA improvements
Not likely to be the best option in many cases
Any form of regional allocation beyond the specific QWSs in question
Could reflect a region-wide benefit of increasing interconnectedness among QWSs
Does not reflect capacity or volumetric utilization of interconnection; potentially seen as punishing prepared QWSs; does not reflect drivers for WSIRRA improvements; may require legislative or other authority to impose costs on QWSs not participating in specific improvements
May be worth considering for a portion of costs, perhaps administrative and program management costs if a larger program than is currently envisioned were to be adopted

8.0—MODEL AGREEMENTS AND SUMMARY OF INNOVATIVE FINANCING BEST PRACTICES
8-15
EXHIBIT 8-4 Model Decision Tree

8.0—MODEL AGREEMENTS AND SUMMARY OF INNOVATIVE FINANCING BEST PRACTICES
8-16
8.4 Model Intergovernmental Agreement Intergovernmental agreements for sharing and pricing of water during emergency situations are unique and will vary depending on the type of project and the systems or entities involved. Crafting a successful intergovernmental agreement will involve a number of policy decisions, which also will vary according to the governmental entities involved. However, there are key issues common to all intergovernmental agreements that are integral to the success of these agreements. Addressing these issues of governance and financial and technical issues in the agreement will minimize the potential for legal disagreements between the participating governmental parties.
A Model Intergovernmental Agreement for Emergency Water Interconnection System is provided at the end of this section as Exhibit 8-5. It assumes that the parties will share water in emergency situations via a physical interconnection between their distribution systems. While the type of project may vary, parties can use this Model Intergovernmental Agreement as a tool to facilitate discussion on drafting the specific intergovernmental agreement that best meets their needs.
This section sets out a list of topics that should be addressed by the parties during the drafting of the intergovernmental agreement and addresses the general issues surrounding each topic.
8.4.1 Governance Generally, the recitals of the agreement between various parties set forth the legal authority permitting the parties to enter into the agreement. Since the intergovernmental agreements at issue deal specifically with the sharing and pricing of water during emergency situations for QWSs in the District, the WSIRRA (O.C.G.A. § 12-5-200, et seq.) should be addressed. As defined by the WSIRRA, “Qualified Water Systems” considered in this study are limited to public water systems that are operated by a city, county or water authority. Therefore, the examples discussed in this section involve only intergovernmental agreements.
Example:
“WHEREAS, the General Assembly finds that it is in the best interests of the state of Georgia for public water systems in the Metropolitan North Georgia Water Planning District to evaluate their withdrawal, treatment, and distribution systems and to take proactive measures to reduce the risk of catastrophic interruptions of water service during emergencies as set forth in O.C.G.A. §12-5-200(2); and,”
City and county governmental entities need statutory authority to enter into contracts. This is because of the general rule that local governments may not enter into a contract that lasts longer that the government’s term of office. One council may not bind itself or its successors (O.C.G.A. § 36-30-3(a)). However, the Intergovernmental Contracts Clause found in Article IX, Section III, Paragraph I(a) of the 1983 Georgia Constitution provides an exception to that rule and allows political subdivisions of the state to contract with one another or with other public agencies provided that the contract does not exceed 50 years. This exception does not give authority for these governmental entities to enter into any kind of agreement that they want to. The agreement must be for the provision of services or for the use of facilities or equipment that the parties are authorized by law to undertake. See, City of Decatur vs. DeKalb County, Ga. (2011) (Georgia Supreme Court Case No. S11A0354, decided July 5, 2011). City and county governments are authorized by law to provide services for “[d]evelopment, storage, treatment, purification, and distribution of water”, 1983 Georgia Constitution Article IX, Section II, Paragraph III(7). Thus, city and county governments are permitted by law to contract for the provisions of services or for the use of facilities or equipment for the sharing of water.
Examples:
“WHEREAS, Article IX, Section III, Paragraph I(a) of the Georgia Constitution authorizes, among other things, any county, municipality or other political subdivision of the state to contract, for a period not exceeding 50 years, with another county, municipality or political subdivision or with any other public agency, public

8.0—MODEL AGREEMENTS AND SUMMARY OF INNOVATIVE FINANCING BEST PRACTICES
8-17
corporation or public authority for joint services, for the provision of services, or for the provision or separate use of facilities or equipment, provided that such contract deals with activities, services or facilities which the contracting parties are authorized by law to undertake or to provide; and,”
“WHEREAS, Article IX, Section II, Paragraph III(7) of the Georgia Constitution authorizes, among other things, any county or municipality to provide for the development, storage, treatment, purification, and distribution of water; and”
If the “qualified system” contracting party is a local water authority, the recitals of the agreement should set forth the legal authority permitting the local authority to contract. “[T]he term “local authority” means an instrumentality of one or more local governments created to fulfill a specialized public purpose or any other legally created organization that has authority to issue debt for a public purpose independent of a county or municipality, regardless of name; provided, however, that the term “local authority” does not include a state authority. A local authority may have been created by local constitutional amendment, general statute or local law.”( O.C.G.A. § 36-80-17(a)).
Example:
“WHEREAS, the Local Water Authority is organized and established under the provisions of [local constitutional amendment, general statute, or local law], for the purpose of constructing and operating a water supply distribution system serving water users within the area described in the plans now on file in the office of the Local Water Authority; and, “
8.4.2 Purpose The agreement should address why the parties are entering into the agreement, including the spirit and intent of the agreement, which can be set forth in the recitals or as a provision in the agreement.
Examples:
“WHEREAS, the City and County agree that the establishment of a potable water interconnection between the two parties is in the best interest of their respective communities and that to promote the establishment of such a system, all points of connection constructed between the City system and the County system shall be treated as emergency interconnections and constructed so as to allow the flow of water from either system to the other; and”
“WHEREAS, the City and the County desire to enter into an agreement for an emergency water interconnection system, whereby both parties agree to coordinate and cooperate with each other and agree to establish the terms and conditions under which the systems can be physically connected and water made available to each other during times of emergency, as more specifically set forth below. “
“1. Purpose. This is an Agreement for the reciprocal sale and purchase of available potable water by and between the City and County during emergency water conditions for the mutual convenience of the parties. All of the foregoing recitals are true and correct and are made a part of this Agreement as if fully set forth herein.”
8.4.3 Definitions Terms and corresponding definitions should clearly be set out in the agreement. Of particular interest is the definition of “emergency,” which should be defined to include those parameters set forth in O.C.G.A. § 12-5-201. Other terms and corresponding definitions may be dictated by the type of project and its financial and technical issues.
Examples:
“2. Definitions. For purpose of this Agreement, the following definitions shall apply:

8.0—MODEL AGREEMENTS AND SUMMARY OF INNOVATIVE FINANCING BEST PRACTICES
8-18
(a) ”Available Potable Water” shall mean a surplus of potable water not immediately needed by the Selling Party.
(b) ”Emergency Water Condition” shall mean a shortage of potable water to meet the essential water needs of the Requesting Party’s customers that threatens their health, safety and welfare.
(c) ”Essential Water Needs” shall mean the minimum amount of water needed for residential and commercial means for food processing, drinking, toilet flushing, fire fighting, hospital use, and critical asset use and a portion of the system’s unaccounted for water as defined in O.C.G.A. §12-5-201(4).
(d) ”Requesting Party” shall mean that party which desires to purchase potable water from the other.
(e) “Selling Party” shall mean that party which has Available Potable Water to sell to the Requesting Party.”
8.4.4 Procedures The agreement should address the processes and procedures for parties to follow in a water emergency.
Examples:
“3. Disruption of Potable Water Supply. Whenever either City or County experiences an Emergency Water Condition and desires to purchase Available Potable Water from the other, the Requesting Party shall notify the Selling Party of the Emergency Water Condition and request Available Potable Water be transferred to the Requesting Party for a limited period, as determined by mutual agreement. The Selling Party shall respond as soon as possible to the request by advising the Requesting Party of the quantity of Available Potable Water.
4. Notification of Emergency Water Conditions. The City water system director, by whatever name called,
or his on-call designee, and the County water system director, by whatever name called, or his on-call designee, shall immediately notify the other when Emergency Water Conditions develop and request temporary water service from the other. Such notice shall include a description of the emergency and expected duration.
5. Utility Staff Responsibilities. In the event that water is needed by City or County, each parties’ Utility Department will be responsible for operating all of the valves necessary to permit water to be sold from one to the other; and each utility will be responsible for returning their valves to the original closed position once the temporary water service event is completed.”
8.4.5 Amount to Supply The agreement should address how much water the parties agree will be supplied in the event of an emergency.
Example:
“6. Rate of Supply. The Selling Party shall not be required to draw water in excess of any Water Use permits, nor shall the Selling Party be required to provide more than its Available Potable Water; and the Selling Party shall not be liable to the Requesting Party or its customers for any interruptions or water service provided hereunder. The parties shall be obligated to supply water pursuant to this Agreement only to the extent that doing so does not prejudice the ability of the Selling Party to fulfill its obligations to its customers and other entities with contracts with the Selling Party.”
8.0—MODEL AGREEMENTS AND SUMMARY OF INNOVATIVE FINANCING BEST PRACTICES
8-19
8.4.6 Pricing The cost allocation concepts discussed in the prior sections give various examples of how allocation of costs associated with interconnections can be addressed by the parties in the agreement. The Model Intergovernmental Agreement presented here uses a volume of use approach to pricing and contemplates a change in rates; however, other approaches to pricing, as described previously, could be instituted with the concurrence of both parties. Setting the cost allocation in the agreement will require a mixture of accounting, business and political skills to arrive at a pricing agreement that meets both business and political criteria.
Example:
“7. Water Supply Charges. Water supplied by either party per this Agreement and distributed through the point(s) of interconnection shall be charged at the then current lowest retail residential water rate, regardless of the number of gallons used, as set forth in the Selling Party’s rate ordinance or resolution. The parties will not be required to pay each other impact or connection fees for the carrying out of this Agreement.
If the contracting party is a local water authority, the enabling legislation, i.e., the local constitutional amendment, general statute or local law that created the water authority, should be reviewed to determine what powers the local water authority has. See, City of Jonesboro v. Clayton County Water Authority, 136 Ga. App. 768 (1975) (Enabling Act of water authority gave it power to set rates; however, it did not give it power to arbitrarily revise rates after it had contracted for specific rates). The agreement also should address the requirements of O.C.G.A. § 36-80-17 as to contracts specifying rates, fees or other charges to be charged and collected for water utility services provided by the local authority. This Code Section allows the governing body of any local authority which is authorized to provide electric, natural gas or water utility services to enter into contracts that specify the rates, fees or other charges which will be charged and collected by the local authority for utility services to be provided by the local authority to one or more of its utility customers. However, such contracts are subject to the following conditions and limitations:
“(1) No such contract shall be for a term in excess of 10 years;
(2) Any such contract that is for a term in excess of two years shall include commercially reasonable provisions under which the rates, fees or other charges shall be adjusted with respect to inflationary or deflationary factors affecting the provision of the utility service in question; and,
(3) Any such contract shall include commercially reasonable provisions relieving the local authority from its obligations under the contract in the event that the local authority's ability to comply with the contract is impaired by war, natural disaster, catastrophe or any other emergency creating conditions under which the local authority's compliance with the contract would become impossible or create a substantial financial burden upon the local authority or its taxpayers.” (O.C.G.A. § 36-80-17 (b) (1) – (3)).
There is a similar provision authorizing municipalities to execute contracts establishing water rates, which recognizes the power of a local authority providing water utility services to establish rates, where the right or power to specify such rates, fees or charges is otherwise vested by local constitutional amendment, general statute or local law in the governing body of such local authority. However, any such contract is subject to the same three conditions and limitations listed above ( O.C.G.A. § 36-30-3(d) (1) – (3)).
Examples:
“(a) Change of Rates. If either City or County proposes any new or amended rate schedule while this Agreement is in effect, provided that any new or amended rate schedule shall be adjusted with respect to inflationary or deflationary factors affecting the provision of the water utility service, notice shall be furnished to the other party prior to the effective date of the new or
8.0—MODEL AGREEMENTS AND SUMMARY OF INNOVATIVE FINANCING BEST PRACTICES
8-20
amended rate schedule. Thereafter, the new or amended rate schedule shall take effect for purposes of this Agreement beginning in the next billing cycle after the change in rate takes effect. The purpose of this subsection is only to ensure disclosure of rate changes and shall not grant either party a right to appeal any rate increase. The parties hereby agree that, during the Agreement, both parties shall continue to be billed at the lowest retail residential water rate.”
“Term. This Agreement shall continue in effect for five (5) years, unless otherwise terminated, as set forth above. Further, this Agreement shall be automatically renewed for five (5) year increments unless either party notifies the other in writing at least one year prior to the termination date. Upon Termination of the Agreement both parties agree to share equally the interconnection removal costs.”
“Force Majeure. City and County agree that the Available Potable Water will be continuous during the Emergency Water Condition, except that temporary disruption of service at any time caused by an act of God, fire, strikes, casualties, war, terrorist act, natural disaster, accidents, necessary maintenance work, breakdowns of or injuries to machinery, pumps or pipelines, civil or military authority, insurrections, riot, acts or declarations of government or regulatory agencies other than City or County, or any other cause beyond the control of City or County, shall not constitute a breach of this Agreement; and no party shall be liable to the other or to its customers for any damage resulting from such unavoidable disruption of service.”
8.4.7 Project Subject to Intergovernmental Agreement The project contemplated by the Model Intergovernmental Agreement is a physical interconnection with the parties equally sharing the capital, operating and maintenance costs of the interconnection. As discussed in the prior sections, the available funding and cost allocation options will vary according to the project.
Example:
“8. Physical Interconnection for Emergency Conditions. Within six (6) months of the effective date of this Agreement, City and County shall install equipment that will allow water flow in either direction and will allow an automatic supply to occur to equalize pressure (the "Interconnection"). The parties shall mutually determine the scope of and the plan for maintenance of the Interconnection. The cost of installing and maintaining the Interconnection will be shared equally by the parties. The parties shall mutually develop a protocol for maintenance which includes the manner of and procedure for cost sharing. It is agreed that during normal operating conditions, the Interconnection will be closed and water will be prevented from flowing through the Interconnection.”
8.4.8 Meter Maintenance and Ownership Responsibilities The agreement should have basic language about who will read meters, maintain meters and replace meters, especially if the interconnection will be used on a regular basis to provide water from one system to another. The need for meters on emergency interconnections is not as important, and the use of meters is left to the discretion of the utility systems.
Example:
“9. Metering.
(a) Each party shall install a meter, and each party shall be charged with maintaining, calibrating and reading its meter at its own expense. Annually, or upon written notice by the other party, each shall inspect and test their meter in the presence of a representative of the other party. Copies of these inspections and tests shall be made available from one to the other. No meter

8.0—MODEL AGREEMENTS AND SUMMARY OF INNOVATIVE FINANCING BEST PRACTICES
8-21
shall be allowed to remain in service that has an error in excess of published American Water Works Association ("AWWA") Standards (or such succeeding standards) at the time of the testing. If a party requests a meter inspection in addition to the annual inspection, and the meter conforms to AWWA standards upon testing, the party requesting the inspection shall pay all inspection and testing costs. In the event that it is determined that the meter is not properly calibrated, then the requesting party shall not be liable for the inspection and testing cost, and the owner of the meter shall immediately take steps to restore the meter to an accurate condition or install a new meter, and credit the requesting party for any overpayment based on all available information as agreed to by the utility staffs of City and County.
(b) The Requesting Party shall read the meter prior to opening the Interconnection. Said meter reading shall be provided to the Selling Party with the notice required in Section 4. When the Interconnection is closed at the end of the Emergency Water Condition, the meter shall be read again by the Requesting Party, which shall immediately notify the Selling Party of the reading.”
8.4.9 Water Quality The agreement should address water quality standards and should include a basic agreement for each party to notify the other in the event of a change in the water treatment process that would affect the quality of water being furnished under the agreement.
Example:
“10. Water Quality. Each party shall provide treated water to the other party at the point of connection to the Interconnection. Treated water must meet the water quality requirements of all applicable regulatory agencies, including the U.S. Environmental Protection Agency and the Environmental Protection Division of the Georgia Department of Natural Resources. Further, if City or County proposes any change(s) to their water treatment process that would affect the water quality chemistry of their finished water while this Agreement is in effect, notice shall be furnished to the other party prior to the effective date of the proposed change(s).”
8.4.10 Termination The agreement should address early termination of the agreement, both for cause and without cause, and the process for handling disputes arising from early termination of the agreement. The model agreement contemplates the option of resolving any disputes through mediation.
Example:
“11. Early Termination.
(a) Without Cause. If neither party is in breach, either party may terminate this Agreement prior to the expiration of the term by rendering to the other party ninety (90) days notice of early termination.
(b) For Cause. If either party fails to perform each and every obligation of this Agreement, each party reserves the right to immediately discontinue performance of services pursuant to this Agreement, after the party seeking termination has provided written notice of the alleged violation to the breaching party, and the breaching party has failed to cure the breach within thirty (30) days of receipt of notice thereof.
(c) Remedies. Either party to this Agreement, in the event of or act of breach by the other, shall have all remedies available under the laws of the state of Georgia including, but not limited to,

8.0—MODEL AGREEMENTS AND SUMMARY OF INNOVATIVE FINANCING BEST PRACTICES
8-22
injunction to prevent breach, specific performance to enforce this Agreement, or mediation subject to State law.”
8.4.11 Water Conservation Measures The agreement should address how water conservation measures and restrictions will be handled. The Model Intergovernmental Agreement contemplates a reciprocal approach to this issue.
Example:
“12. Water Conservation. This Agreement shall be subject to all state and federal water conservation regulations. Further, any time that the customers of the Selling Party are under water use restriction and water is being supplied to the Requesting Party, the Requesting Party agrees to impose restrictions at least as strict as those imposed by the Selling Party.”
8.4.12 Other Contract Considerations The agreement may contain other standard contract provisions regarding the enforcement, interpretation and execution of the agreement, as necessary.

8.0—MODEL AGREEMENTS AND SUMMARY OF INNOVATIVE FINANCING BEST PRACTICES
8-23
EXHIBIT 8-5 Model Intergovernmental Agreement for Emergency Water Interconnection System
MODEL INTERGOVERNMENTAL AGREEMENT FOR EMERGENCY WATER INTERCONNECTION SYSTEM
THIS INTERGOVERNMENTAL AGREEMENT (this "Agreement"), made and entered into as of the
____ day of __________, 20___, by and between CITY OF __________, GEORGIA, a municipal corporation of _________County, Georgia (the "City"), and __________ COUNTY, GEORGIA, a political subdivision of the state of Georgia (the "County"). W I T N E S S E T H:
WHEREAS, City and County each own and operate public water systems in the Metropolitan North Georgia Water Planning District that provide service to their respective customers; and,
WHEREAS, the General Assembly finds that it is in the best interests of the state of Georgia for public water systems in the Metropolitan North Georgia Water Planning District to evaluate their withdrawal, treatment and distribution systems and to take proactive measures to reduce the risk of catastrophic interruptions of water service during emergencies as set forth in O.C.G.A. § 12-5-200(2); and,
WHEREAS, City and County agree that the establishment of a potable water interconnection between the two parties is in the best interest of their respective communities and that to promote the establishment of such a system, all points of connection constructed between the City system and the County system shall be treated as emergency interconnections and constructed so as to allow the flow of water from either system to the other; and,
WHEREAS, Article IX, Section III, Paragraph I(a) of the Georgia Constitution authorizes, among other things, any county, municipality or other political subdivision of the state to contract, for a period not exceeding 50 years, with another county, municipality or political subdivision or with any other public agency, public corporation or public authority for joint services, for the provision of services, or for the provision or separate use of facilities or equipment, provided that such contract deals with activities, services or facilities that the contracting parties are authorized by law to undertake or to provide; and,
WHEREAS, the City and the County desire to enter into an agreement for an emergency water interconnection system, whereby both parties agree to coordinate and cooperate with each other and agree to establish the terms and conditions under which the systems can be physically connected and water made available to the each other during times of emergency, as more specifically set forth below.
NOW, THEREFORE, for and in consideration of the premises and undertakings as hereinafter set forth and other good and valuable consideration, the receipt and sufficiency of which are hereby acknowledged, the City and the County DO HEREBY AGREE, as follows:
1. Purpose. This is an Agreement for the reciprocal sale and purchase of available potable water by and between the City and County during emergency water conditions for the mutual convenience of the parties. All of the foregoing recitals are true and correct and are made a part of this Agreement as if fully set forth herein. 2. Definitions. For purpose of this Agreement, the following definitions shall apply:
8.0—MODEL AGREEMENTS AND SUMMARY OF INNOVATIVE FINANCING BEST PRACTICES
8-24
(a) “Available Potable Water” shall mean a surplus of potable water not immediately needed by the Selling Party.
(b) “Emergency Water Condition” shall mean a shortage of potable water to meet the Essential
Water Needs of the Requesting Party’s customers that threatens their health, safety and welfare.
(c) “Essential Water Needs” shall mean the minimum amount of water needed for residential and
commercial means for food processing, drinking, toilet flushing, fire fighting, hospital use, and critical asset use and a portion of the system’s unaccounted for water as defined in O.C.G.A. § 12-5-201(4).
(d) “Requesting Party” shall mean that party which desires to purchase potable water from the
other.
(e) “Selling Party” shall mean that party which has Available Potable Water to sell to the Requesting Party.
3. Disruption of Potable Water Supply. Whenever either City or County experiences an Emergency Water
Condition and desires to purchase Available Potable Water from the other, the Requesting Party shall notify the Selling Party of the Emergency Water Condition and request Available Potable Water be transferred to the Requesting Party for a limited period, as determined by mutual agreement. The Selling Party shall respond as soon as possible to the request by advising the Requesting Party of the quantity of Available Potable Water.
4. Notification of Emergency Water Conditions. The City water system director, by whatever name called,
or his on-call designee, and the County water system director, by whatever name called, or his on-call designee, shall immediately notify the other when Emergency Water Conditions develop and request temporary water service from the other. Such notice shall include a description of the emergency and expected duration.
5. Utility Staff Responsibilities. In the event that water is needed by City or County, each party’s Utility
Department will be responsible for operating all of the valves necessary to permit water to be sold from one to the other; and each utility will be responsible for returning their valves to the original closed position once the temporary water service event is completed.
6. Rate of Supply. The Selling Party shall not be required to draw water in excess of any Water Use
permits, nor shall the Selling Party be required to provide more than its Available Potable Water; and the Selling Party shall not be liable to the Requesting Party or its customers for any interruptions or water service provided hereunder. The parties shall be obligated to supply water pursuant to this Agreement only to the extent that doing so does not prejudice the ability of the Selling Party to fulfill its obligations to its customers and other entities with contracts with the Selling Party.
7. Water Supply Charges. Water supplied by either party per this Agreement and distributed through the
point(s) of interconnection shall be charged at the then current lowest retail residential water rate, regardless of the number of gallons used, as set forth in the Selling Party’s rate ordinance or resolution. The parties will not be required to pay each other impact or connection fees for the carrying out of this Agreement.
(a) Change of Rates. If either City or County proposes any new or amended rate schedule while
this Agreement is in effect, notice shall be furnished to the other party prior to the effective

8.0—MODEL AGREEMENTS AND SUMMARY OF INNOVATIVE FINANCING BEST PRACTICES
8-25
date of the new or amended rate schedule. Thereafter, the new or amended rate schedule shall take effect for purposes of this Agreement beginning in the next billing cycle after the change in rate takes effect. The purpose of this subsection is only to ensure disclosure of rate changes and shall not grant either party a right to appeal any rate increase. The parties hereby agree that, during the Agreement, both parties shall continue to be billed at the lowest retail residential water rate.
8. Physical Interconnection. Within six (6) months of the effective date of this Agreement, City and County
shall install equipment that will allow water to flow in either direction and will allow an automatic supply to occur to equalize pressure (the "Interconnection"). The parties shall mutually determine the scope of and the plan for maintenance of the Interconnection. The cost of installing and maintaining the Interconnection will be shared equally by the parties. The parties shall mutually develop a protocol for maintenance which includes the manner of and procedure for cost sharing. It is agreed that during the normal operating conditions, water will be prevented from flowing through the Interconnection.
9. Metering.
(a) Each party shall install a meter, and each party shall be charged with maintaining, calibrating and reading its meter at its own expense. Annually, or upon written notice by the other party, each shall inspect and test their meter in the presence of a representative of the other party. Copies of these inspections and tests shall be made available from one to the other. No meter shall be allowed to remain in service that has an error in excess of published American Water Works Association ("AWWA") Standards (or such succeeding standards) at the time of the testing. If a party requests a meter inspection in addition to the annual inspection, and the meter conforms to AWWA standards upon testing, the party requesting the inspection shall pay all inspection and testing costs. In the event that it is determined that the meter is not properly calibrated, then the requesting party shall not be liable for the inspection and testing costs, and the owner of the meter shall immediately take steps to restore the meter to an accurate condition or install a new meter, and credit the requesting party for any overpayment based on all available information as agreed to by the utility staffs of City and County.
(b) The Requesting Party shall read the meter prior to opening the Interconnection. Said meter
reading shall be provided to the Selling Party with the notice required in Section 4. When the Interconnection is closed at the end of the Emergency Water Condition, the meter shall be read again by the Requesting Party, which shall immediately notify the Selling Party of the reading.
10. Water Quality. Each party shall provide treated water to the other party at the point of connection to the
Interconnection. Treated water must meet the water quality requirements of all applicable regulatory agencies, including the U.S. Environmental Protection Agency and the Environmental Protection Division of the Georgia Department of Natural Resources. Further, if City or County proposes any change(s) to their water treatment process that would affect the water quality chemistry of their finished water while this Agreement is in effect, notice shall be furnished to the other party prior to the effective date of the proposed change(s).
11. Early Termination.
(a) Without Cause. If neither party is in breach, either party may terminate this Agreement prior to the expiration of the term by rendering to the other party ninety (90) days notice of early termination.

8.0—MODEL AGREEMENTS AND SUMMARY OF INNOVATIVE FINANCING BEST PRACTICES
8-26
(b) For Cause. If either party fails to perform each and every obligation of this Agreement, each party reserves the right to immediately discontinue performance of services pursuant to this Agreement, after the party seeking termination has provided written notice of the alleged violation to the breaching party, and the breaching party has failed to cure the breach within thirty (30) days of receipt of notice thereof.
(c) Remedies. Either party to this Agreement, in the event of or act of breach by the other, shall have all
remedies available under the laws of the state of Georgia including, but not limited to, injunction to prevent breach, specific performance to enforce this Agreement, or mediation subject to state law.
12. Water Conservation. This Agreement shall be subject to all state and federal water conservation
regulations. Further, any time that the customers of the Selling Party are under water use restriction and water is being supplied to the Requesting Party, the Requesting Party agrees to impose restrictions at least as strict as those imposed by the Selling Party.
13. Billing. The Selling Party shall bill on or around the thirtieth (30) day of the month for all metered water
sold hereunder during the month. Bills not paid within forty-five (45) days of receipt shall be assessed a one and one-half percent (1-1/2%) per month late charge.
14. Term. This Agreement shall continue in effect for five (5) years, unless otherwise terminated, as set
forth above. Further, this Agreement shall be automatically renewed for five (5) year increments unless either party notifies the other in writing at least one (1) year prior to the termination date. Upon termination of the Agreement both parties agree to share equally the Interconnection removal costs.
15. Force Majeure. City and County agree that the Available Potable Water will be continuous during the
Emergency Water Condition, except that temporary disruption of service at any time caused by an act of God, fire, strikes, casualties, war, terrorist act, natural disaster, accidents, necessary maintenance work, breakdowns of or injuries to machinery, pumps or pipelines, civil or military authority, insurrections, riot, acts or declarations of government or regulatory agencies other than City or County, or any other cause beyond the control of City or County, shall not constitute a breach of this Agreement; and no party shall be liable to the other or to its customers for any damage resulting from such unavoidable disruption of service.
16. Notices. All notices under this Agreement will be in writing and shall be given only by hand delivery for
which a receipt is obtained, or certified mail, return receipt requested. Notices will be deemed given when received by the party for whom intended. Notices will be delivered or mailed to the addresses set forth below or as either party may designate in writing:
If to the CITY: Mayor Street City, Georgia ZIP
with a copy to: City Attorney Street City, Georgia ZIP
If to the COUNTY: Chairman, Board of Commissioners Street City, Georgia ZIP
with a copy to: County Attorney Street City, Georgia ZIP
8.0—MODEL AGREEMENTS AND SUMMARY OF INNOVATIVE FINANCING BEST PRACTICES
8-27
17. Entire Agreement. This Agreement constitutes the entire Agreement of the parties and may not be changed or modified except by instrument in writing executed by both of the parties hereto. This Agreement shall supersede any other agreement between the parties which may be in conflict.
18. Legal Prohibition. Neither City nor County shall be required to deliver Available Potable Water under
the terms of this Agreement if prohibited by any applicable, federal, state, regional or local statute, rule, ordinance, law, administrative order or judicial decree, or in violation of applicable permits.
19. Applicable Law and Venue. The laws of the state of Georgia shall govern the validity, interpretation,
construction and performance of this Agreement; and venue for any suit involving this Agreement shall be within County, Georgia.
20. Binding Effect. This Agreement is binding upon and shall inure to the benefit of the successors or
assigns of the parties to this Agreement. 21. Indemnity. Each party hereby agrees to save and hold harmless the other from and against any claims
made by third parties for damages resulting from the failure of either party to deliver Available Potable Water meeting all state and federal standards. Each party agrees, at its own expense, to maintain general liability insurance coverage or self insure with standard limits for utility operations during the term of this Agreement to cover all such claims by third parties. When receiving water under this Agreement, the Requesting Party acts in the capacity of owner and operator of a public water system and is solely responsible for compliance with all pertinent regulations and the Selling Party will have no responsibility for said water.
22. No Third Party Beneficiaries. The parties' obligations to deliver Available Potable Water shall run only
to each other and shall in no event create any obligation to or duty toward any other party or any customer. This Agreement is for the sole and exclusive benefit of the parties, and shall not be construed to confer a benefit or right upon any third party.
23. Assignment. No party may transfer or assign its rights under this Agreement without the written
approval from the governing boards of both parties. 24. Further Documents. The parties shall execute such other and further documents as may be deemed
necessary by either party to fulfill the intent of the parties to this Agreement. 25. Time of Essence. Time is of the essence of each and every term, provision and covenant of this
Agreement. 26. Captions. All captions, headings, Section and subsection numbers and letters and other reference
numbers or letters are solely for the purpose of facilitating reference to this Agreement and shall not supplement, limit or otherwise vary in any respect the text of this Agreement.
27. Counterparts. This Agreement may be executed in several counterparts, each of which shall constitute
an original and all of which together shall constitute one and the same instrument. 28. Severability. This Agreement is intended to be performed in accordance with, and only to the extent
permitted by, all applicable laws, ordinances, rules and regulations. If any provision of the Agreement, or the application thereof to any person or circumstance, shall, for any reason and to any extent be invalid or unenforceable, the remainder of this Agreement and the application of such provision to other

8.0—MODEL AGREEMENTS AND SUMMARY OF INNOVATIVE FINANCING BEST PRACTICES
8-28
persons or circumstances shall not be affected thereby but rather shall be enforced to the greatest extent permitted by law.
IN WITNESS WHEREOF, the parties hereto, acting by and through their duly authorized officers, have
caused this Agreement to be executed under seals as of the day and year first above written.
CITY OF _____________________, GEORGIA
_________________________________________ Mayor
(SEAL) ATTEST: ________________________________________ City Clerk
COUNTY OF _____________________, GEORGIA
_________________________________________ Chairman
(SEAL) ATTEST: ________________________________________ County Clerk