geco 2015 ghg and energy balances
TRANSCRIPT

Report EUR 27242 EN
Supplementary material to:
GECO 2015
Global Energy and Climate Outlook
Road to Paris
2015
GECO 2015 GHG and energy balances

European Commission
Joint Research Centre
Institute for Prospective Technological Studies
Contact information
Alban Kitous
Address: Edificio Expo. c/ Inca Garcilaso, 3. E-41092 Seville (Spain)
E-mail: [email protected]
Tel.: +34 954488318
Fax: +34 954488300
JRC Science Hub
https://ec.europa.eu/jrc
Legal Notice
This publication is a Technical Report by the Joint Research Centre, the European Commission’s in-house science service.
It aims to provide evidence-based scientific support to the European policy-making process. The scientific output
expressed does not imply a policy position of the European Commission. Neither the European Commission nor any person
acting on behalf of the Commission is responsible for the use which might be made of this publication.
All images © European Union 2015
This report is complementary to the following JRC Science and Policy Report:
Labat, A., Kitous, A., Perry, M., Saveyn, B., Vandyck, T., and Vrontisi, Z. (2015). GECO2015. Global Energy and Climate
Outlook. Road to Paris. JRC Scientific and Policy Report, EUR 27165EN.
JRC95759
EUR 27242 EN
ISBN 978-92-79-48245-8 (PDF)
ISSN 1831-9424 (online)
doi:10.2791/72487
Luxembourg: Publications Office of the European Union, 2015
© European Union, 2015
Reproduction is authorised provided the source is acknowledged.
Please cite as
EC JRC (European Commission Joint Research Centre) (2015). GECO2015 GHG and energy balances. JRC Technical Reports.
EUR 27242 EN

This document complements the GECO2015 Report1. It provides the detailed GHG and energy balances for the Baseline scenario and for the Global Mitigation scenario described in the main report. These results displayed in this report have been produced with the global energy system JRC POLES model2. The tables provide for each country or region: - the main economic indicators: population, income per capita, share of sectoral value added; - the international energy prices; - emissions per greenhouse gas (GHG) and per sector; - a reduced energy balance: primary energy production, net trade, primary energy demand; - power generation: inputs3, production, capacity; - final energy consumption per sector and per fuel. In addition to the World aggregate, 30 countries and regions are reported:
Table 1. Countries and regions with GHG and energy balances
Europe CIS North America Latin America Africa Middle East Asia
EU28 Russia USA Mexico Egypt Gulf Japan
Switzerland Ukraine Canada Rest
Central America Morocco & Tunisia
Mediterranean Middle East
Korea, Rep.
Norway Other CIS
China
Iceland
Brazil Algeria & Libya
Indonesia
Other Balkans Rest
South America
South Africa India
Rest Sub-Saharan
Africa
Oceania (inc. Australia & New-Zealand) Turkey
Rest South-East Asia
Rest South-Asia
1 See Labat et al. (2015) - European Commission JRC, Report EUR 27239 EN, doi: 10.2791/198028 2 Projections of GHG emissions from AFOLU (LULUCF CO2 and agriculture CH4 and N2O) as well as biomass supply costs curves come from GLOBIOM (Global Biosphere Management Model): see IIASA web site: http://www.iiasa.ac.at/web/home/research/modelsData/GLOBIOM/GLOBIOM.en.html 3 Primary energy from nuclear is calculated considering the primary heat equivalent of the electricity produced with an average efficiency of 33%.
1

Table 2 summarizes the sources and models used for both historical data and for the projections:
Table 2. Historical data and projections
Series Historical data GECO Projections
Population UN (2013) UN (2013, medium fertility)
GDP, growth WB (2014) EC (2013), IMF (2014), OECD (2013, see also Dellink 2014)
Other activity drivers
Value added WB (2014)
JRC POLES model
Mobility, vehicles, households, tons of steel..
Sectoral databases
Energy resources
Oil, gas, coal BGR (2013), USGS (2013), WEC (2013a), sectoral databases
Uranium OECD (2014)
Biomass EU: Green-X model1 Non-EU: GLOBIOM model2
Hydro Enerdata (2014)
Wind, solar NREL (2013), PIK (see Pietzcker 20143)
Energy balances
Reserves, production BP (2014), Enerdata (2014), IEA (2014)
Demand by sector and fuel, transformation (including. power), losses
Enerdata (2014), IEA (2014)
Energy prices
International prices, prices to consumer
EIA (2014), Enerdata (2014), IEA (2014) JRC POLES model
GHG emissions
Energy CO2 Derived from POLES energy balances JRC POLES model
Other GHG Annex 1 UNFCCC (2014) JRC POLES model, GLOBIOM
Other GHG Non-Annex 1 (excl. LULUCF)
EDGAR (EC JRC 2014a) JRC POLES model, GLOBIOM
LULUCF Non-Annex 1 FAO (2014) JRC POLES model, GLOBIOM
Technology costs
Own estimates based on specialised literature & market monitoring, including but not only: EC JRC (2014b), IEA Technology Roadmaps, WEC (2013b), TECHPOL database4,
JRC POLES model based on endogenous learning curves from
aforementioned sources
Notes: 1: University of Vienna: http://www.green-x.at/ 2: IIASA: http://www.globiom.org/ 3: see part 5, supplementary material SI2 4: developed in several European research projects: SAPIENT, SAPIENTIA, CASCADE MINTS - see for instance: http://cordis.europa.eu/result/rcn/47819_en.html
2
GECO2015 Baseline 150504 SUMMARY GHG & ENERGY BALANCE##### 100
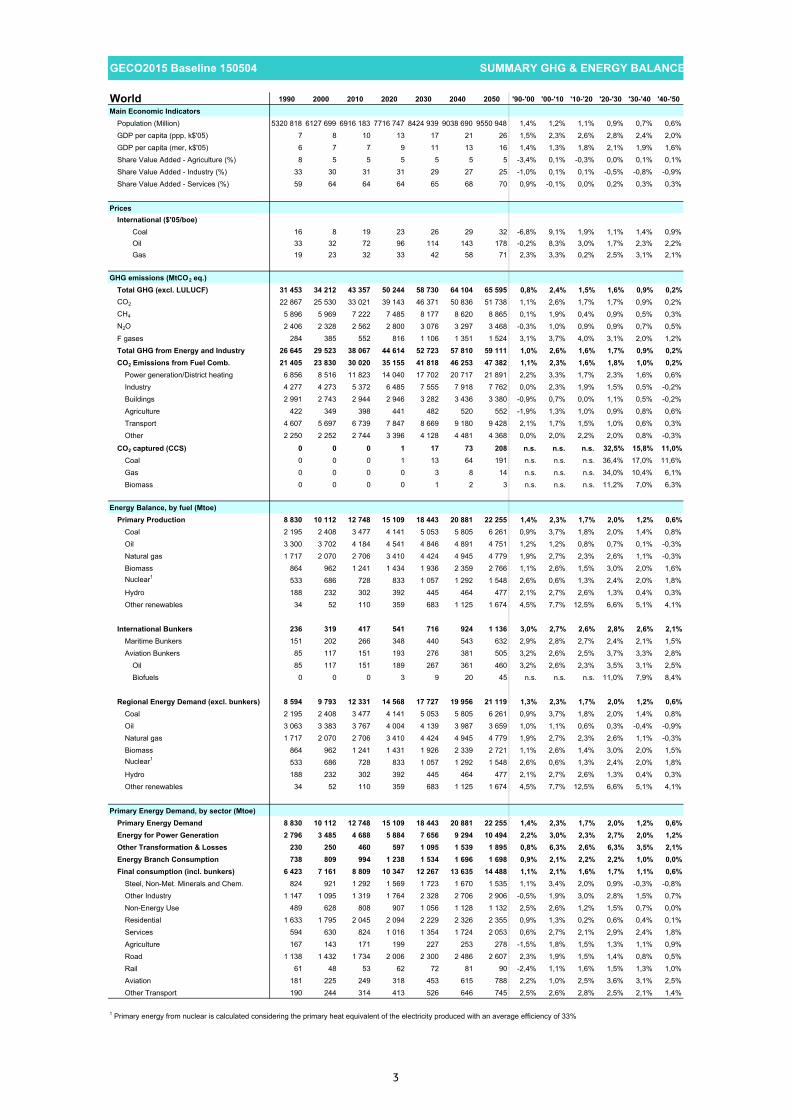
World 1990 2000 2010 2020 2030 2040 2050 '90-'00 '00-'10 '10-'20 '20-'30 '30-'40 '40-'50Main Economic Indicators
Population (Million) 5320 818 6127 699 6916 183 7716 747 8424 939 9038 690 9550 948 1,4% 1,2% 1,1% 0,9% 0,7% 0,6%GDP per capita (ppp, k$'05) 7 8 10 13 17 21 26 1,5% 2,3% 2,6% 2,8% 2,4% 2,0%GDP per capita (mer, k$'05) 6 7 7 9 11 13 16 1,4% 1,3% 1,8% 2,1% 1,9% 1,6%Share Value Added - Agriculture (%) 8 5 5 5 5 5 5 -3,4% 0,1% -0,3% 0,0% 0,1% 0,1%Share Value Added - Industry (%) 33 30 31 31 29 27 25 -1,0% 0,1% 0,1% -0,5% -0,8% -0,9%Share Value Added - Services (%) 59 64 64 64 65 68 70 0,9% -0,1% 0,0% 0,2% 0,3% 0,3%
PricesInternational ($'05/boe)
Coal 16 8 19 23 26 29 32 -6,8% 9,1% 1,9% 1,1% 1,4% 0,9%Oil 33 32 72 96 114 143 178 -0,2% 8,3% 3,0% 1,7% 2,3% 2,2%Gas 19 23 32 33 42 58 71 2,3% 3,3% 0,2% 2,5% 3,1% 2,1%
GHG emissions (MtCO2 eq.)Total GHG (excl. LULUCF) 31 453 34 212 43 357 50 244 58 730 64 104 65 595 0,8% 2,4% 1,5% 1,6% 0,9% 0,2%CO2 22 867 25 530 33 021 39 143 46 371 50 836 51 738 1,1% 2,6% 1,7% 1,7% 0,9% 0,2%CH4 5 896 5 969 7 222 7 485 8 177 8 620 8 865 0,1% 1,9% 0,4% 0,9% 0,5% 0,3%N2O 2 406 2 328 2 562 2 800 3 076 3 297 3 468 -0,3% 1,0% 0,9% 0,9% 0,7% 0,5%F gases 284 385 552 816 1 106 1 351 1 524 3,1% 3,7% 4,0% 3,1% 2,0% 1,2%Total GHG from Energy and Industry 26 645 29 523 38 067 44 614 52 723 57 810 59 111 1,0% 2,6% 1,6% 1,7% 0,9% 0,2%CO2 Emissions from Fuel Comb. 21 405 23 830 30 020 35 155 41 818 46 253 47 382 1,1% 2,3% 1,6% 1,8% 1,0% 0,2%
Power generation/District heating 6 856 8 516 11 823 14 040 17 702 20 717 21 891 2,2% 3,3% 1,7% 2,3% 1,6% 0,6%Industry 4 277 4 273 5 372 6 485 7 555 7 918 7 762 0,0% 2,3% 1,9% 1,5% 0,5% -0,2%Buildings 2 991 2 743 2 944 2 946 3 282 3 436 3 380 -0,9% 0,7% 0,0% 1,1% 0,5% -0,2%Agriculture 422 349 398 441 482 520 552 -1,9% 1,3% 1,0% 0,9% 0,8% 0,6%Transport 4 607 5 697 6 739 7 847 8 669 9 180 9 428 2,1% 1,7% 1,5% 1,0% 0,6% 0,3%Other 2 250 2 252 2 744 3 396 4 128 4 481 4 368 0,0% 2,0% 2,2% 2,0% 0,8% -0,3%
CO2 captured (CCS) 0 0 0 1 17 73 208 n.s. n.s. n.s. 32,5% 15,8% 11,0%Coal 0 0 0 1 13 64 191 n.s. n.s. n.s. 36,4% 17,0% 11,6%Gas 0 0 0 0 3 8 14 n.s. n.s. n.s. 34,0% 10,4% 6,1%Biomass 0 0 0 0 1 2 3 n.s. n.s. n.s. 11,2% 7,0% 6,3%
Energy Balance, by fuel (Mtoe)Primary Production 8 830 10 112 12 748 15 109 18 443 20 881 22 255 1,4% 2,3% 1,7% 2,0% 1,2% 0,6%
Coal 2 195 2 408 3 477 4 141 5 053 5 805 6 261 0,9% 3,7% 1,8% 2,0% 1,4% 0,8%Oil 3 300 3 702 4 184 4 541 4 846 4 891 4 751 1,2% 1,2% 0,8% 0,7% 0,1% -0,3%Natural gas 1 717 2 070 2 706 3 410 4 424 4 945 4 779 1,9% 2,7% 2,3% 2,6% 1,1% -0,3%Biomass 864 962 1 241 1 434 1 936 2 359 2 766 1,1% 2,6% 1,5% 3,0% 2,0% 1,6%Nuclear1 533 686 728 833 1 057 1 292 1 548 2,6% 0,6% 1,3% 2,4% 2,0% 1,8%Hydro 188 232 302 392 445 464 477 2,1% 2,7% 2,6% 1,3% 0,4% 0,3%Other renewables 34 52 110 359 683 1 125 1 674 4,5% 7,7% 12,5% 6,6% 5,1% 4,1%
International Bunkers 236 319 417 541 716 924 1 136 3,0% 2,7% 2,6% 2,8% 2,6% 2,1%Maritime Bunkers 151 202 266 348 440 543 632 2,9% 2,8% 2,7% 2,4% 2,1% 1,5%Aviation Bunkers 85 117 151 193 276 381 505 3,2% 2,6% 2,5% 3,7% 3,3% 2,8%
Oil 85 117 151 189 267 361 460 3,2% 2,6% 2,3% 3,5% 3,1% 2,5%Biofuels 0 0 0 3 9 20 45 n.s. n.s. n.s. 11,0% 7,9% 8,4%
Regional Energy Demand (excl. bunkers) 8 594 9 793 12 331 14 568 17 727 19 956 21 119 1,3% 2,3% 1,7% 2,0% 1,2% 0,6%Coal 2 195 2 408 3 477 4 141 5 053 5 805 6 261 0,9% 3,7% 1,8% 2,0% 1,4% 0,8%Oil 3 063 3 383 3 767 4 004 4 139 3 987 3 659 1,0% 1,1% 0,6% 0,3% -0,4% -0,9%Natural gas 1 717 2 070 2 706 3 410 4 424 4 945 4 779 1,9% 2,7% 2,3% 2,6% 1,1% -0,3%Biomass 864 962 1 241 1 431 1 926 2 339 2 721 1,1% 2,6% 1,4% 3,0% 2,0% 1,5%Nuclear1 533 686 728 833 1 057 1 292 1 548 2,6% 0,6% 1,3% 2,4% 2,0% 1,8%Hydro 188 232 302 392 445 464 477 2,1% 2,7% 2,6% 1,3% 0,4% 0,3%Other renewables 34 52 110 359 683 1 125 1 674 4,5% 7,7% 12,5% 6,6% 5,1% 4,1%
Primary Energy Demand, by sector (Mtoe)Primary Energy Demand 8 830 10 112 12 748 15 109 18 443 20 881 22 255 1,4% 2,3% 1,7% 2,0% 1,2% 0,6%Energy for Power Generation 2 796 3 485 4 688 5 884 7 656 9 294 10 494 2,2% 3,0% 2,3% 2,7% 2,0% 1,2%Other Transformation & Losses 230 250 460 597 1 095 1 539 1 895 0,8% 6,3% 2,6% 6,3% 3,5% 2,1%Energy Branch Consumption 738 809 994 1 238 1 534 1 696 1 698 0,9% 2,1% 2,2% 2,2% 1,0% 0,0%Final consumption (incl. bunkers) 6 423 7 161 8 809 10 347 12 267 13 635 14 488 1,1% 2,1% 1,6% 1,7% 1,1% 0,6%
Steel, Non-Met. Minerals and Chem. 824 921 1 292 1 569 1 723 1 670 1 535 1,1% 3,4% 2,0% 0,9% -0,3% -0,8%Other Industry 1 147 1 095 1 319 1 764 2 328 2 706 2 906 -0,5% 1,9% 3,0% 2,8% 1,5% 0,7%Non-Energy Use 489 628 808 907 1 056 1 128 1 132 2,5% 2,6% 1,2% 1,5% 0,7% 0,0%Residential 1 633 1 795 2 045 2 094 2 229 2 326 2 355 0,9% 1,3% 0,2% 0,6% 0,4% 0,1%Services 594 630 824 1 016 1 354 1 724 2 053 0,6% 2,7% 2,1% 2,9% 2,4% 1,8%Agriculture 167 143 171 199 227 253 278 -1,5% 1,8% 1,5% 1,3% 1,1% 0,9%Road 1 138 1 432 1 734 2 006 2 300 2 486 2 607 2,3% 1,9% 1,5% 1,4% 0,8% 0,5%Rail 61 48 53 62 72 81 90 -2,4% 1,1% 1,6% 1,5% 1,3% 1,0%Aviation 181 225 249 318 453 615 788 2,2% 1,0% 2,5% 3,6% 3,1% 2,5%Other Transport 190 244 314 413 526 646 745 2,5% 2,6% 2,8% 2,5% 2,1% 1,4%
1 Primary energy from nuclear is calculated considering the primary heat equivalent of the electricity produced with an average efficiency of 33%
3

GECO2015 Baseline 150504 SUMMARY GHG & ENERGY BALANCE##### 100
World 1990 2000 2010 2020 2030 2040 2050 '90-'00 '00-'10 '10-'20 '20-'30 '30-'40 '40-'50Power Generation
Fuel Inputs Therm. Power (Mtoe) 2 044 2 520 3 553 4 314 5 492 6 436 6 820 2,1% 3,5% 2,0% 2,4% 1,6% 0,6%Coal 1 174 1 532 2 170 2 550 3 226 3 903 4 348 2,7% 3,5% 1,6% 2,4% 1,9% 1,1%Oil 336 290 257 228 233 218 192 -1,4% -1,2% -1,2% 0,2% -0,7% -1,2%Gas 479 641 1 014 1 354 1 769 1 946 1 777 3,0% 4,7% 2,9% 2,7% 1,0% -0,9%Biomass & Waste 53 52 106 168 244 346 477 -0,2% 7,3% 4,7% 3,8% 3,6% 3,2%Other 3 4 6 13 20 23 25 3,6% 2,8% 8,3% 4,4% 1,3% 1,0%
Gross Elec. Generation (TWh e) 11 778 15 419 21 491 29 065 39 842 50 449 59 477 2,7% 3,4% 3,1% 3,2% 2,4% 1,7%Coal 4 425 5 999 8 694 10 715 14 406 18 143 20 832 3,1% 3,8% 2,1% 3,0% 2,3% 1,4%
of which CCS 0 0 0 0 15 76 247 n.s. n.s. n.s. n.s. 17,9% 12,5%Oil 1 317 1 180 962 972 990 933 839 -1,1% -2,0% 0,1% 0,2% -0,6% -1,1%Gas 1 728 2 733 4 767 6 858 9 352 10 592 9 876 4,7% 5,7% 3,7% 3,2% 1,3% -0,7%
of which CCS 0 0 0 0 7 21 39 n.s. n.s. n.s. n.s. 11,2% 6,5%Biomass & Waste 63 133 311 569 904 1 428 2 159 7,8% 8,9% 6,2% 4,7% 4,7% 4,2%
of which CCS 0 0 0 0 0 0 1 n.s. n.s. n.s. n.s. n.s. 47,0%Nuclear 2 013 2 591 2 756 3 192 4 153 5 167 6 202 2,6% 0,6% 1,5% 2,7% 2,2% 1,8%Hydro 2 190 2 699 3 514 4 555 5 173 5 390 5 551 2,1% 2,7% 2,6% 1,3% 0,4% 0,3%Wind 4 31 370 1 698 3 816 6 580 9 645 23,2% 28,0% 16,4% 8,4% 5,6% 3,9%Solar 1 1 48 327 731 1 791 3 796 7,4% 41,6% 21,2% 8,4% 9,4% 7,8%Other 36 52 69 179 317 425 576 3,6% 2,8% 10,1% 5,9% 3,0% 3,1%
Generation Capacity (GWe) 2 453 3 457 5 141 7 195 9 692 12 741 16 176 3,5% 4,0% 3,4% 3,0% 2,8% 2,4%Coal 772 1 064 1 690 2 123 2 685 3 308 3 945 3,3% 4,7% 2,3% 2,4% 2,1% 1,8%
of which CCS 0 0 0 0 2 10 36 n.s. n.s. n.s. n.s. 18,2% 13,1%Oil 402 489 422 378 339 324 321 2,0% -1,5% -1,1% -1,1% -0,5% -0,1%Gas 400 708 1 310 1 764 2 216 2 547 2 509 5,9% 6,4% 3,0% 2,3% 1,4% -0,2%
of which CCS 0 0 0 0 1 3 6 n.s. n.s. n.s. n.s. 11,7% 7,1%Biomass & Waste 17 34 84 135 186 262 359 7,4% 9,5% 4,8% 3,3% 3,5% 3,2%
of which CCS 0 0 0 0 0 0 0 n.s. n.s. n.s. n.s. n.s. 34,6%Nuclear 290 355 378 432 545 665 788 2,0% 0,6% 1,4% 2,3% 2,0% 1,7%Hydro 564 781 1 021 1 323 1 491 1 546 1 586 3,3% 2,7% 2,6% 1,2% 0,4% 0,3%Wind 2 17 185 747 1 633 2 764 3 996 24,0% 27,0% 15,0% 8,1% 5,4% 3,8%Solar 0 1 41 261 539 1 245 2 562 10,8% 42,8% 20,2% 7,5% 8,7% 7,5%Other 6 8 10 30 58 80 110 3,7% 2,0% 11,7% 6,6% 3,3% 3,2%
Total Final Consumption (Mtoe) 6 423 7 161 8 809 10 347 12 267 13 635 14 488 1,1% 2,1% 1,6% 1,7% 1,1% 0,6%Coal 892 700 1 042 1 281 1 446 1 480 1 472 -2,4% 4,1% 2,1% 1,2% 0,2% -0,1%Oil 2 641 3 157 3 625 4 005 4 304 4 383 4 305 1,8% 1,4% 1,0% 0,7% 0,2% -0,2%Gas 919 1 063 1 243 1 469 1 869 2 098 2 113 1,5% 1,6% 1,7% 2,4% 1,2% 0,1%Electricity 830 1 086 1 530 2 061 2 820 3 574 4 228 2,7% 3,5% 3,0% 3,2% 2,4% 1,7%Heat 337 256 296 350 403 502 592 -2,7% 1,5% 1,7% 1,4% 2,2% 1,7%Biomass & Other 804 899 1 072 1 182 1 424 1 599 1 777 1,1% 1,8% 1,0% 1,9% 1,2% 1,1%Share of Renewables 2 (%) 17% 18% 18% 20% 22% 24% 28% 0,4% 0,3% 0,7% 0,9% 1,2% 1,6%
Industry (incl. non-energy use) 2 460 2 645 3 419 4 239 5 107 5 504 5 573 0,7% 2,6% 2,2% 1,9% 0,8% 0,1%Coal 618 582 905 1 142 1 323 1 370 1 378 -0,6% 4,5% 2,4% 1,5% 0,3% 0,1%Oil 684 803 926 946 948 858 718 1,6% 1,4% 0,2% 0,0% -1,0% -1,8%Gas 478 526 627 812 1 051 1 179 1 159 1,0% 1,8% 2,6% 2,6% 1,2% -0,2%Electricity 380 458 637 944 1 305 1 566 1 729 1,9% 3,3% 4,0% 3,3% 1,8% 1,0%Heat 161 105 130 140 150 158 161 -4,2% 2,1% 0,7% 0,7% 0,5% 0,2%Biomass & Other 137 170 194 256 330 375 428 2,2% 1,3% 2,8% 2,6% 1,3% 1,3%
Buildings 2 227 2 425 2 869 3 110 3 583 4 049 4 408 0,9% 1,7% 0,8% 1,4% 1,2% 0,9%Coal 245 106 123 125 112 99 85 -8,0% 1,5% 0,1% -1,1% -1,2% -1,5%Oil 317 341 325 294 298 287 262 0,7% -0,5% -1,0% 0,1% -0,4% -0,9%Gas 434 531 610 651 811 912 947 2,0% 1,4% 0,6% 2,2% 1,2% 0,4%Electricity 403 582 832 1 022 1 306 1 636 1 960 3,8% 3,6% 2,1% 2,5% 2,3% 1,8%Heat 176 151 166 210 253 344 431 -1,5% 1,0% 2,4% 1,9% 3,1% 2,3%Biomass & Other 653 713 813 810 803 770 724 0,9% 1,3% 0,0% -0,1% -0,4% -0,6%
Agriculture 167 143 171 199 227 253 278 -1,5% 1,8% 1,5% 1,3% 1,1% 0,9%Coal 15 7 11 11 10 9 8 -7,2% 4,0% 0,3% -1,2% -1,2% -1,2%Oil 109 97 108 121 135 148 159 -1,2% 1,1% 1,2% 1,1% 0,9% 0,7%Gas 7 6 6 6 7 7 7 -2,4% 1,1% -0,1% 0,6% 0,5% 0,4%Electricity 30 29 39 52 65 78 90 -0,5% 3,2% 2,9% 2,2% 1,8% 1,5%Heat 0 0 0 0 0 0 0 n.s. n.s. n.s. n.s. n.s. n.s.Biomass & Other 6 5 7 9 10 12 13 -1,5% 3,6% 2,0% 1,9% 1,4% 1,2%
Transport (incl. bunkers) 1 569 1 948 2 350 2 799 3 350 3 828 4 230 2,2% 1,9% 1,8% 1,8% 1,3% 1,0%Coal 13 4 3 3 3 2 2 -10,4% -3,2% -0,4% -1,9% -1,9% -1,9%Oil 1 531 1 916 2 267 2 645 2 923 3 089 3 166 2,3% 1,7% 1,6% 1,0% 0,6% 0,2%Gas 0 0 0 0 0 0 0 n.s. n.s. n.s. n.s. n.s. n.s.Electricity 17 16 21 43 144 294 449 -0,7% 2,9% 7,1% 13,0% 7,4% 4,3%Heat 0 0 0 0 0 0 0 n.s. n.s. n.s. n.s. n.s. n.s.Biomass & Other 8 11 58 108 280 442 613 3,7% 18,1% 6,4% 10,0% 4,7% 3,3%
Energy Branch Consumption 738 809 994 1 238 1 534 1 696 1 698 0,9% 2,1% 2,2% 2,2% 1,0% 0,0%Other Transformation & Losses 3 230 250 460 597 1 095 1 539 1 895 0,8% 6,3% 2,6% 6,3% 3,5% 2,1%
2 ratio of renewable energy over final energy demand increased by distribution losses and self consumption of electricity and steam plants3 includes statistical differences
4

GECO2015 Baseline 150504 SUMMARY GHG & ENERGY BALANCE##### 100
EU28 1990 2000 2010 2020 2030 2040 2050 '90-'00 '00-'10 '10-'20 '20-'30 '30-'40 '40-'50Main Economic Indicators
Population (Million) 479 489 507 517 519 518 513 0,2% 0,4% 0,2% 0,1% 0,0% -0,1%GDP per capita (ppp, k$'05) 20 25 28 31 37 42 49 1,9% 1,1% 1,3% 1,5% 1,4% 1,4%GDP per capita (mer, k$'05) 21 26 29 32 38 44 50 2,0% 1,0% 1,3% 1,5% 1,4% 1,5%Share Value Added - Agriculture (%) 3 2 2 2 2 1 1 -5,0% -1,2% -0,8% -0,5% -0,5% -0,5%Share Value Added - Industry1 (%) 34 28 25 24 23 22 20 -1,8% -1,1% -0,4% -0,5% -0,5% -0,6%Share Value Added - Services (%) 63 70 73 74 75 77 78 1,1% 0,5% 0,1% 0,2% 0,2% 0,2%
PricesInternational/Regional ($'05/boe)
Coal 18 9 19 22 24 27 30 -6,6% 7,6% 1,4% 0,7% 1,5% 0,9%Oil 33 32 72 96 114 143 178 -0,2% 8,3% 3,0% 1,7% 2,3% 2,2%Gas 18 21 31 38 46 59 71 1,4% 4,0% 2,1% 2,1% 2,5% 1,9%
GHG emissions (MtCO2 eq.)Total GHG (excl. LULUCF) 5 508 5 056 4 693 4 095 3 959 3 940 3 672 -0,9% -0,7% -1,4% -0,3% 0,0% -0,7%CO2 4 366 4 111 3 884 3 401 3 260 3 242 2 977 -0,6% -0,6% -1,3% -0,4% -0,1% -0,8%CH4 589 483 403 334 328 325 320 -1,9% -1,8% -1,9% -0,2% -0,1% -0,1%N2O 498 397 318 261 259 258 258 -2,2% -2,2% -1,9% -0,1% 0,0% 0,0%F gases 56 64 89 99 112 115 116 1,5% 3,2% 1,1% 1,3% 0,2% 0,1%Total GHG from Energy and Industry 4 897 4 539 4 224 3 669 3 524 3 499 3 224 -0,8% -0,7% -1,4% -0,4% -0,1% -0,8%CO2 Emissions from Fuel Comb. 4 091 3 859 3 664 3 200 3 078 3 076 2 824 -0,6% -0,5% -1,3% -0,4% 0,0% -0,9%
Power generation/District heating 1 428 1 287 1 234 1 057 1 062 1 222 1 148 -1,0% -0,4% -1,5% 0,1% 1,4% -0,6%Industry 793 683 545 497 495 480 461 -1,5% -2,2% -0,9% 0,0% -0,3% -0,4%Buildings 731 651 646 521 544 537 513 -1,1% -0,1% -2,1% 0,4% -0,1% -0,4%Agriculture 84 72 59 56 58 61 64 -1,5% -1,9% -0,6% 0,5% 0,4% 0,4%Transport 756 888 915 828 685 553 440 1,6% 0,3% -1,0% -1,9% -2,1% -2,3%Other 300 278 263 241 233 223 199 -0,8% -0,5% -0,9% -0,3% -0,4% -1,2%
CO2 captured (CCS) 0 0 0 0 5 28 108 n.s. n.s. n.s. 28,3% 19,7% 14,3%Coal 0 0 0 0 4 25 99 n.s. n.s. n.s. 29,1% 21,4% 14,9%Gas 0 0 0 0 1 3 8 n.s. n.s. n.s. 37,1% 14,7% 9,4%Biomass 0 0 0 0 0 1 1 n.s. n.s. n.s. 16,4% 5,5% 8,1%
Energy Balance, by fuel (Mtoe)Primary Production 821 897 787 758 784 786 852 0,9% -1,3% -0,4% 0,3% 0,0% 0,8%
Coal 224 148 75 68 59 74 74 -4,1% -6,6% -1,0% -1,4% 2,2% 0,0%Oil 136 177 101 68 49 40 41 2,7% -5,5% -3,9% -3,1% -2,0% 0,2%Natural gas 178 218 168 117 92 90 96 2,1% -2,6% -3,5% -2,4% -0,2% 0,7%Biomass 44 64 144 197 258 261 255 3,9% 8,4% 3,2% 2,7% 0,1% -0,2%Nuclear1 210 250 242 209 192 153 174 1,7% -0,3% -1,5% -0,8% -2,2% 1,3%Hydro 27 33 35 33 33 33 34 2,3% 0,5% -0,6% 0,1% 0,1% 0,0%Other renewables 3 6 22 67 102 134 179 8,1% 13,0% 11,8% 4,2% 2,8% 2,9%
Net Imports 826 804 957 897 934 959 893Coal 225 176 205 173 160 165 184Oil 480 448 472 421 380 324 263Natural gas 117 177 275 294 376 431 394Biomass 0 0 2 6 10 27 38Biofuels 0 0 2 4 8 12 15Electricity 4 2 1 0 0 0 0
Primary Energy Demand2 1 647 1 701 1 743 1 655 1 718 1 744 1 746 0,3% 0,2% -0,5% 0,4% 0,2% 0,0%Coal 449 324 280 240 219 239 258 -3,2% -1,4% -1,5% -0,9% 0,9% 0,7%Oil 615 625 573 489 429 364 304 0,2% -0,9% -1,6% -1,3% -1,6% -1,8%Natural gas 295 396 443 411 468 521 490 3,0% 1,1% -0,7% 1,3% 1,1% -0,6%Biomass 44 64 146 203 268 288 293 3,9% 8,5% 3,4% 2,8% 0,7% 0,2%Nuclear1 210 250 242 209 192 153 174 1,7% -0,3% -1,5% -0,8% -2,2% 1,3%Hydro 27 33 35 33 33 33 34 2,3% 0,5% -0,6% 0,1% 0,1% 0,0%Other renewables 3 6 22 67 102 134 179 8,1% 13,0% 11,8% 4,2% 2,8% 2,9%
Primary Energy Demand, by sector (Mtoe)Primary Energy Demand 1 647 1 701 1 743 1 655 1 718 1 744 1 746 0,3% 0,2% -0,5% 0,4% 0,2% 0,0%Energy for Power Generation 636 675 724 716 779 851 909 0,6% 0,7% -0,1% 0,9% 0,9% 0,7%Other Transformation & Losses 212 248 302 329 402 455 500 1,6% 2,0% 0,8% 2,0% 1,2% 0,9%Energy Branch Consumption 107 103 102 95 97 99 97 -0,3% -0,2% -0,7% 0,2% 0,1% -0,2%Final consumption 1 153 1 196 1 214 1 150 1 179 1 182 1 180 0,4% 0,1% -0,5% 0,3% 0,0% 0,0%
Steel, Non-Met. Minerals and Chem. 190 166 141 127 119 109 102 -1,4% -1,6% -1,0% -0,7% -0,8% -0,7%Other Industry 175 163 150 156 171 178 184 -0,8% -0,8% 0,4% 0,9% 0,4% 0,3%Non-Energy Use 100 113 109 101 101 98 94 1,2% -0,4% -0,7% 0,0% -0,3% -0,5%Residential 278 289 310 276 289 293 291 0,4% 0,7% -1,2% 0,5% 0,1% -0,1%Services 117 133 161 157 179 199 220 1,3% 1,9% -0,2% 1,3% 1,1% 1,0%Agriculture 33 29 26 25 26 28 29 -1,3% -1,1% -0,3% 0,6% 0,5% 0,5%Road 237 281 297 285 271 251 234 1,7% 0,5% -0,4% -0,5% -0,8% -0,7%Rail 10 10 9 9 9 10 10 0,1% -1,2% 0,3% 0,6% 0,5% 0,5%Aviation 6 7 7 7 8 9 9 2,5% -0,6% 0,4% 1,4% 0,8% 0,5%Other Transport 7 6 6 6 6 6 6 -0,9% 0,0% -0,5% 0,5% 0,2% 0,1%
1 Primary energy from nuclear is calculated considering the primary heat equivalent of the electricity produced with an average efficiency of 33%
5

GECO2015 Baseline 150504 SUMMARY GHG & ENERGY BALANCE##### 100
EU28 1990 2000 2010 2020 2030 2040 2050 '90-'00 '00-'10 '10-'20 '20-'30 '30-'40 '40-'50Power Generation
Fuel Inputs Therm. Power (Mtoe) 396 386 425 409 455 533 525 -0,3% 1,0% -0,4% 1,1% 1,6% -0,1%Coal 285 235 209 177 156 170 183 -1,9% -1,2% -1,6% -1,3% 0,9% 0,7%Oil 56 42 23 11 11 11 11 -2,9% -5,6% -7,2% 0,2% 0,1% -0,4%Gas 50 94 141 135 176 228 209 6,6% 4,1% -0,4% 2,7% 2,6% -0,9%Biomass & Waste 6 15 52 84 110 120 119 10,0% 13,3% 4,9% 2,7% 0,9% -0,1%Other 0 0 0 2 3 3 3 4,0% 1,6% 14,8% 3,9% 0,9% 1,1%
Gross Elec. Generation (TWh e) 2 593 3 031 3 357 3 507 4 010 4 541 5 057 1,6% 1,0% 0,4% 1,3% 1,3% 1,1%Coal 1 050 966 862 749 701 792 875 -0,8% -1,1% -1,4% -0,7% 1,2% 1,0%
of which CCS 0 0 0 0 4 32 141 n.s. n.s. n.s. n.s. 23,9% 16,1%Oil 224 181 87 47 48 48 48 -2,1% -7,1% -6,0% 0,2% 0,1% -0,1%Gas 193 480 761 738 965 1 194 1 123 9,5% 4,7% -0,3% 2,7% 2,2% -0,6%
of which CCS 0 0 0 0 2 9 23 n.s. n.s. n.s. n.s. 16,6% 10,1%Biomass & Waste 18 45 137 268 367 427 442 9,8% 11,7% 6,9% 3,2% 1,5% 0,4%
of which CCS 0 0 0 0 0 0 0 n.s. n.s. n.s. n.s. n.s. 42,7%Nuclear 795 945 917 790 737 601 687 1,7% -0,3% -1,5% -0,7% -2,0% 1,3%Hydro 308 387 406 383 387 389 390 2,3% 0,5% -0,6% 0,1% 0,1% 0,0%Wind 1 22 149 360 526 673 912 39,8% 21,0% 9,2% 3,9% 2,5% 3,1%Solar 0 0 33 124 170 250 348 27,8% n.s. 14,3% 3,2% 4,0% 3,4%Other 3 5 6 48 109 165 232 4,0% 1,6% 24,1% 8,5% 4,2% 3,5%
Generation Capacity (GWe) 617 713 919 1 137 1 299 1 441 1 657 1,5% 2,6% 2,2% 1,3% 1,0% 1,4%Coal 206 198 192 168 152 148 165 -0,4% -0,3% -1,3% -1,0% -0,2% 1,1%
of which CCS 0 0 0 0 1 4 21 n.s. n.s. n.s. n.s. 24,0% 16,7%Oil 86 79 64 43 36 33 33 -0,9% -2,1% -4,0% -1,7% -0,9% 0,1%Gas 76 129 220 285 333 343 307 5,3% 5,5% 2,6% 1,6% 0,3% -1,1%
of which CCS 0 0 0 0 0 1 3 n.s. n.s. n.s. n.s. 16,8% 10,7%Biomass & Waste 8 17 47 66 79 83 85 7,5% 10,9% 3,5% 1,8% 0,5% 0,3%
of which CCS 0 0 0 0 0 0 0 n.s. n.s. n.s. n.s. n.s. 33,8%Nuclear 123 137 132 112 102 81 91 1,1% -0,4% -1,6% -1,0% -2,2% 1,1%Hydro 116 140 148 159 160 161 162 1,9% 0,5% 0,7% 0,1% 0,1% 0,0%Wind 0 12 85 174 248 315 424 40,0% 21,4% 7,4% 3,6% 2,4% 3,0%Solar 0 0 30 119 161 234 328 35,9% n.s. 14,6% 3,1% 3,8% 3,4%Other 0 1 1 12 29 44 62 2,0% 2,3% 31,4% 9,4% 4,5% 3,4%
Total Final Consumption 2 (Mtoe) 1 153 1 196 1 214 1 150 1 179 1 182 1 180 0,4% 0,1% -0,5% 0,3% 0,0% 0,0%Coal 143 73 57 53 54 58 63 -6,4% -2,5% -0,8% 0,2% 0,8% 0,9%Oil 503 539 504 436 382 323 268 0,7% -0,7% -1,4% -1,3% -1,7% -1,8%Gas 228 272 275 245 256 252 243 1,8% 0,1% -1,1% 0,4% -0,1% -0,4%Electricity 186 218 244 254 292 332 371 1,6% 1,2% 0,4% 1,4% 1,3% 1,1%Heat 55 46 56 56 64 75 84 -1,8% 2,0% 0,0% 1,4% 1,5% 1,1%Biomass & Other 38 48 78 105 133 143 152 2,4% 4,9% 3,0% 2,3% 0,8% 0,6%Share of Renewables 3 (%) 6% 8% 13% 20% 24% 28% 32% 2,6% 4,8% 4,6% 2,1% 1,3% 1,3%
Industry (incl. non-energy use) 466 441 399 385 391 385 380 -0,5% -1,0% -0,4% 0,2% -0,1% -0,1%Coal 93 61 45 44 47 53 60 -4,2% -3,0% -0,3% 0,8% 1,2% 1,2%Oil 139 144 126 103 90 74 60 0,3% -1,3% -2,0% -1,3% -1,9% -2,1%Gas 113 118 99 98 100 95 88 0,4% -1,7% -0,1% 0,2% -0,5% -0,8%Electricity 85 91 89 96 109 119 128 0,7% -0,2% 0,7% 1,2% 0,9% 0,8%Heat 21 11 16 16 16 15 15 -6,5% 4,2% 0,0% -0,2% -0,3% -0,2%Biomass & Other 14 17 24 28 29 29 29 2,1% 3,6% 1,4% 0,4% -0,1% 0,1%
Buildings 395 423 471 433 467 492 511 0,7% 1,1% -0,8% 0,8% 0,5% 0,4%Coal 48 12 11 8 6 4 3 -13,0% -0,7% -2,9% -3,3% -3,6% -3,9%Oil 89 80 63 48 52 51 47 -1,1% -2,3% -2,7% 0,8% -0,2% -0,8%Gas 110 150 172 144 152 153 151 3,2% 1,4% -1,8% 0,6% 0,1% -0,1%Electricity 91 116 145 144 154 169 186 2,5% 2,2% -0,1% 0,7% 0,9% 1,0%Heat 34 35 40 40 48 59 69 0,3% 1,3% 0,0% 2,0% 2,1% 1,5%Biomass & Other 24 29 40 49 55 55 56 2,3% 3,1% 2,2% 1,1% 0,1% 0,1%
Agriculture 33 29 26 25 26 28 29 -1,3% -1,1% -0,3% 0,6% 0,5% 0,5%Coal 2 1 1 1 1 1 0 -5,0% 0,2% -2,1% -2,0% -2,0% -2,0%Oil 21 18 14 14 15 16 17 -1,1% -2,4% -0,5% 0,7% 0,6% 0,6%Gas 5 4 4 4 4 4 4 -1,6% -0,4% -0,9% 0,3% 0,3% 0,3%Electricity 5 4 4 5 5 6 6 -1,4% 0,7% 0,8% 1,0% 1,0% 1,0%Heat 0 0 0 0 0 0 0 n.s. n.s. n.s. n.s. n.s. n.s.Biomass & Other 1 1 2 2 2 2 2 3,5% 4,2% 0,6% 0,0% 0,0% 0,0%
Transport 259 304 318 307 295 276 260 1,6% 0,5% -0,4% -0,4% -0,7% -0,6%Coal 0 0 0 0 0 0 0 -26,4% 1,7% -2,2% 0,0% 0,0% 0,0%Oil 253 297 300 271 224 181 144 1,6% 0,1% -1,0% -1,9% -2,1% -2,3%Gas 0 0 0 0 0 0 0 n.s. n.s. n.s. n.s. n.s. n.s.Electricity 5 6 6 9 23 38 50 1,3% -0,5% 4,7% 9,7% 5,0% 2,8%Heat 0 0 0 0 0 0 0 n.s. n.s. n.s. n.s. n.s. n.s.Biomass & Other 0 1 12 26 47 57 65 57,9% 33,1% 7,8% 6,0% 1,9% 1,4%
Energy Branch Consumption 107 103 102 95 97 99 97 -0,3% -0,2% -0,7% 0,2% 0,1% -0,2%Other Transformation & Losses 4 212 248 302 329 402 455 500 1,6% 2,0% 0,8% 2,0% 1,2% 0,9%
2 does not include international aviation and maritime bunkers; includes non-energy uses3 ratio of renewable energy over final energy demand increased by distribution losses and self consumption of electricity and steam plants4 includes statistical differences
6

GECO2015 Baseline 150504 SUMMARY GHG & ENERGY BALANCE##### 100
Canada 1990 2000 2010 2020 2030 2040 2050 '90-'00 '00-'10 '10-'20 '20-'30 '30-'40 '40-'50Main Economic Indicators
Population (Million) 28 31 34 38 41 43 45 1,0% 1,1% 1,0% 0,8% 0,6% 0,5%GDP per capita (ppp, k$'05) 27 33 35 39 45 52 59 1,9% 0,8% 1,1% 1,4% 1,3% 1,4%GDP per capita (mer, k$'05) 27 33 35 40 45 52 59 1,9% 0,8% 1,1% 1,4% 1,3% 1,4%Share Value Added - Agriculture (%) 3 2 2 2 2 2 2 -2,3% -1,7% -0,4% -0,4% -0,3% -0,3%Share Value Added - Industry (%) 31 33 32 30 27 24 20 0,6% -0,4% -0,7% -1,1% -1,2% -1,5%Share Value Added - Services (%) 66 65 66 68 71 75 78 -0,2% 0,2% 0,3% 0,5% 0,4% 0,4%
PricesInternational/Regional ($'05/boe)
Coal 12 8 13 17 18 22 26 -4,2% 5,4% 2,8% 0,7% 2,0% 1,3%Oil 33 32 72 96 114 143 178 -0,2% 8,3% 3,0% 1,7% 2,3% 2,2%Gas 17 26 20 23 37 54 68 4,7% -2,6% 1,2% 5,1% 3,8% 2,4%
GHG emissions (Mt CO2 eq.)Total GHG (excl. LULUCF) 574 696 688 709 759 833 879 1,9% -0,1% 0,3% 0,7% 0,9% 0,5%CO2 447 549 546 582 620 683 722 2,1% -0,1% 0,6% 0,6% 1,0% 0,6%CH4 69 91 88 72 82 90 94 2,7% -0,3% -1,9% 1,3% 0,9% 0,4%N2O 47 46 45 44 44 47 49 -0,3% -0,2% -0,1% 0,0% 0,5% 0,5%F gases 11 10 9 11 12 13 14 -0,4% -1,2% 1,4% 1,3% 0,9% 0,6%Total GHG from Energy and Industry 527 640 632 657 706 775 817 2,0% -0,1% 0,4% 0,7% 0,9% 0,5%CO2 Emissions from Fuel Comb. 425 523 525 562 604 669 708 2,1% 0,0% 0,7% 0,7% 1,0% 0,6%
Power generation/District heating 96 133 111 89 121 179 207 3,3% -1,8% -2,1% 3,1% 3,9% 1,5%Industry 80 90 100 120 120 119 116 1,2% 1,1% 1,8% 0,0% -0,1% -0,2%Buildings 74 86 71 83 87 87 87 1,6% -1,9% 1,5% 0,4% 0,0% 0,1%Agriculture 8 10 10 11 11 12 12 3,1% 0,2% 0,7% 0,3% 0,3% 0,3%Transport 116 136 162 163 140 125 116 1,6% 1,7% 0,1% -1,5% -1,1% -0,7%Other 51 67 70 96 124 148 170 2,8% 0,4% 3,1% 2,6% 1,7% 1,4%
CO2 captured (CCS) 0 0 0 0 1 2 4 n.s. n.s. n.s. 21,3% 13,0% 8,5%Coal 0 0 0 0 0 2 4 n.s. n.s. n.s. 23,9% 14,9% 9,2%Gas 0 0 0 0 0 0 0 n.s. n.s. n.s. 24,8% 7,1% 2,3%Biomass 0 0 0 0 0 0 0 n.s. n.s. n.s. 5,8% 3,0% 7,0%
Energy Balance, by fuel (Mtoe)Primary Production 270 372 383 524 773 905 922 3,2% 0,3% 3,2% 4,0% 1,6% 0,2%
Coal 30 27 20 28 112 113 26 -1,1% -2,7% 3,2% 15,1% 0,0% -13,6%Oil 97 133 164 214 299 383 468 3,2% 2,1% 2,7% 3,4% 2,5% 2,0%Natural gas 91 150 130 196 244 267 253 5,1% -1,4% 4,2% 2,2% 0,9% -0,6%Biomass 8 12 13 22 43 61 78 3,8% 0,9% 5,5% 7,0% 3,6% 2,4%Nuclear1 19 19 24 24 25 20 25 0,0% 2,2% 0,0% 0,4% -2,3% 2,5%Hydro 26 31 30 35 38 41 42 1,9% -0,2% 1,4% 0,9% 0,7% 0,4%Other renewables 0 0 1 6 12 20 29 n.s. 42,2% 22,0% 7,1% 5,2% 4,0%
Net Imports - 59 - 120 - 129 - 240 - 452 - 553 - 536Coal - 5 5 3 - 10 - 82 - 62 39Oil - 17 - 46 - 78 - 135 - 229 - 322 - 414Natural gas - 37 - 76 - 52 - 90 - 131 - 151 - 135Biomass 0 0 0 - 2 - 4 - 6 - 13Biofuels 0 0 0 0 - 4 - 8 - 10Electricity 0 - 3 - 2 - 3 - 3 - 3 - 3
Primary Energy Demand2 212 251 254 284 321 352 385 1,7% 0,1% 1,1% 1,2% 0,9% 0,9%Coal 24 31 23 18 31 51 65 2,5% -3,1% -2,4% 5,5% 5,1% 2,5%Oil 80 87 86 79 70 61 55 0,8% -0,1% -0,9% -1,2% -1,3% -1,1%Natural gas 54 74 79 106 113 117 117 3,2% 0,6% 3,1% 0,6% 0,3% 0,1%Biomass 8 12 12 19 39 55 64 3,7% 0,6% 4,6% 7,2% 3,4% 1,6%Nuclear1 19 19 24 24 25 20 25 0,0% 2,2% 0,0% 0,4% -2,3% 2,5%Hydro 26 31 30 35 38 41 42 1,9% -0,2% 1,4% 0,9% 0,7% 0,4%Other renewables 0 0 1 6 12 20 29 n.s. 42,2% 22,0% 7,1% 5,2% 4,0%
Primary Energy Demand, by sector (Mtoe)Primary Energy Demand 212 251 254 284 321 352 385 1,7% 0,1% 1,1% 1,2% 0,9% 0,9%Energy for Power Generation 71 89 90 96 114 134 159 2,2% 0,1% 0,6% 1,8% 1,6% 1,7%Other Transformation & Losses 40 45 35 44 73 101 121 1,2% -2,5% 2,4% 5,1% 3,3% 1,8%Energy Branch Consumption 21 29 30 42 53 61 70 3,1% 0,4% 3,2% 2,4% 1,5% 1,3%Final consumption 157 186 194 219 229 239 251 1,7% 0,5% 1,2% 0,5% 0,4% 0,5%
Steel, Non-Met. Minerals and Chem. 11 13 12 13 10 9 8 1,1% -1,0% 1,0% -2,1% -1,6% -0,5%Other Industry 37 43 43 53 55 55 55 1,6% -0,1% 2,0% 0,5% 0,0% -0,1%Non-Energy Use 15 20 22 23 24 24 23 2,9% 1,2% 0,2% 0,5% 0,0% -0,2%Residential 29 31 31 36 39 42 45 0,7% 0,0% 1,4% 0,9% 0,7% 0,7%Services 22 27 25 31 37 45 54 2,4% -0,9% 2,0% 2,0% 1,8% 1,8%Agriculture 3 4 4 5 5 6 6 2,6% 0,1% 1,1% 0,9% 0,9% 0,8%Road 33 39 49 51 49 49 51 1,7% 2,2% 0,5% -0,3% 0,0% 0,3%Rail 2 2 2 2 2 2 2 -0,7% 0,0% -0,1% 0,0% 0,0% 0,0%Aviation 3 4 4 4 5 5 5 2,4% -0,5% 0,4% 0,8% 0,4% 0,4%Other Transport 1 1 2 2 2 2 2 0,1% 2,6% 0,5% 0,8% 0,5% 0,5%
1 Primary energy from nuclear is calculated considering the primary heat equivalent of the electricity produced with an average efficiency of 33%
7

GECO2015 Baseline 150504 SUMMARY GHG & ENERGY BALANCE##### 100
Canada 1990 2000 2010 2020 2030 2040 2050 '90-'00 '00-'10 '10-'20 '20-'30 '30-'40 '40-'50Power Generation
Fuel Inputs Therm. Power (Mtoe) 27 39 35 31 39 54 62 3,9% -1,1% -1,2% 2,4% 3,3% 1,5%Coal 20 26 20 14 22 36 45 2,8% -3,0% -3,2% 4,8% 5,0% 2,0%Oil 4 3 2 0 0 0 0 -1,8% -5,3% -18,6% -36,0% n.s. n.s.Gas 2 7 12 14 14 15 14 14,7% 4,6% 1,9% -0,1% 0,8% -0,7%Biomass & Waste 1 2 2 3 3 2 4 7,8% 0,3% 2,9% 0,5% -1,4% 4,3%Other 0 0 0 0 0 0 0 n.s. n.s. n.s. n.s. n.s. n.s.
Gross Elec. Generation (TWh e) 482 605 608 723 882 1 052 1 237 2,3% 0,0% 1,8% 2,0% 1,8% 1,6%Coal 82 118 88 67 109 179 224 3,6% -2,9% -2,7% 5,0% 5,1% 2,2%
of which CCS 0 0 0 0 0 2 5 n.s. n.s. n.s. n.s. 16,6% 9,9%Oil 16 15 7 1 0 0 0 -1,1% -6,6% -18,1% -35,8% -19,2% n.s.Gas 10 33 52 80 86 94 88 13,2% 4,5% 4,4% 0,8% 0,9% -0,7%
of which CCS 0 0 0 0 0 1 1 n.s. n.s. n.s. n.s. 8,4% 2,6%Biomass & Waste 4 8 9 12 12 11 19 7,2% 0,9% 2,8% 0,5% -1,4% 5,8%
of which CCS 0 0 0 0 0 0 0 n.s. n.s. n.s. n.s. n.s. n.s.Nuclear 73 73 91 91 97 79 101 0,0% 2,2% 0,0% 0,6% -2,1% 2,5%Hydro 297 359 352 405 441 473 490 1,9% -0,2% 1,4% 0,9% 0,7% 0,4%Wind 0 0 9 65 129 202 286 n.s. 42,5% 21,8% 7,0% 4,6% 3,5%Solar 0 0 0 4 8 15 29 n.s. 36,0% 26,6% 7,8% 6,8% 6,9%Other 0 0 0 0 0 0 1 n.s. n.s. n.s. 26,5% 15,6% 11,2%
Generation Capacity (GWe) 103 111 135 193 253 308 376 0,7% 2,0% 3,7% 2,7% 2,0% 2,0%Coal 19 18 16 19 26 41 54 -0,8% -1,2% 1,8% 3,3% 4,6% 2,9%
of which CCS 0 0 0 0 0 0 1 n.s. n.s. n.s. n.s. 17,0% 10,5%Oil 7 8 7 4 6 5 6 0,5% -1,6% -3,9% 2,5% -1,1% 1,0%Gas 4 7 16 40 55 57 59 5,9% 9,5% 9,6% 3,2% 0,4% 0,3%
of which CCS 0 0 0 0 0 0 0 n.s. n.s. n.s. n.s. 9,8% 4,0%Biomass & Waste 1 1 4 4 3 2 3 2,2% 14,7% -0,9% -4,1% -3,7% 4,5%
of which CCS 0 0 0 0 0 0 0 n.s. n.s. n.s. n.s. n.s. n.s.Nuclear 13 10 13 13 14 11 14 -2,2% 2,3% 0,4% 0,4% -2,2% 2,3%Hydro 59 67 75 81 89 95 98 1,3% 1,1% 0,8% 0,9% 0,7% 0,4%Wind 0 0 4 28 55 85 118 n.s. 39,9% 21,5% 6,9% 4,4% 3,4%Solar 0 0 0 3 6 12 24 n.s. 44,3% 26,6% 7,8% 6,8% 6,9%Other 0 0 0 0 0 0 0 n.s. n.s. n.s. 25,8% 15,0% 10,7%
Total Final Consumption 2 (Mtoe) 157 186 194 219 229 239 251 1,7% 0,5% 1,2% 0,5% 0,4% 0,5%Coal 4 5 4 3 5 8 12 0,8% -1,4% -1,6% 4,3% 4,7% 3,6%Oil 69 81 90 87 79 71 65 1,6% 1,1% -0,3% -1,0% -1,0% -0,9%Gas 40 49 49 66 65 60 57 1,9% 0,2% 3,0% -0,3% -0,6% -0,7%Electricity 36 41 40 47 58 70 83 1,4% -0,2% 1,6% 2,1% 1,9% 1,7%Heat 1 1 0 0 0 1 2 2,5% -6,8% 0,0% 1,2% 12,1% 5,7%Biomass & Other 7 10 10 14 22 27 33 3,0% 0,4% 3,3% 4,7% 2,2% 1,8%Share of Renewables 3 (%) 22% 24% 23% 27% 32% 37% 41% 0,6% -0,3% 1,5% 2,0% 1,3% 1,0%
Industry (incl. non-energy use) 63 76 77 88 90 88 87 1,9% 0,1% 1,4% 0,2% -0,2% -0,2%Coal 4 5 4 3 5 8 12 0,9% -1,3% -1,6% 4,3% 4,7% 3,6%Oil 18 22 27 23 21 18 15 2,0% 1,8% -1,5% -0,7% -1,7% -2,1%Gas 20 23 25 38 36 32 28 1,5% 0,8% 4,0% -0,6% -1,0% -1,2%Electricity 14 17 14 17 19 21 22 1,9% -2,0% 1,5% 1,3% 0,9% 0,6%Heat 1 1 0 0 0 0 0 2,5% -6,7% 0,0% -0,2% -0,3% -0,2%Biomass & Other 6 8 6 7 8 9 10 3,1% -1,8% 1,1% 1,4% 0,5% 1,1%
Buildings 50 58 56 66 76 86 98 1,5% -0,4% 1,7% 1,4% 1,3% 1,3%Coal 0 0 0 0 0 0 0 -3,2% -21,2% -3,9% -2,7% -2,8% n.s.Oil 9 9 5 6 6 7 7 0,3% -5,4% 0,6% 1,6% 0,7% 0,3%Gas 20 25 23 28 28 28 28 2,3% -0,5% 1,8% 0,1% -0,2% 0,0%Electricity 20 23 25 29 35 42 50 1,0% 1,0% 1,5% 1,8% 1,8% 1,8%Heat 0 0 0 0 0 1 2 4,4% n.s. n.s. n.s. 33,3% 7,3%Biomass & Other 1 2 2 4 7 9 12 2,1% 3,0% 4,4% 5,9% 3,3% 2,4%
Agriculture 3 4 4 5 5 6 6 2,6% 0,1% 1,1% 0,9% 0,9% 0,8%Coal 0 0 0 0 0 0 0 n.s. n.s. n.s. n.s. n.s. n.s.Oil 2 3 3 3 3 3 3 3,3% 0,2% 0,7% 0,3% 0,3% 0,3%Gas 0 1 1 1 1 1 1 1,6% 0,1% 0,5% 0,3% 0,3% 0,3%Electricity 1 1 1 1 1 1 2 1,1% -0,2% 1,6% 1,9% 1,7% 1,7%Heat 0 0 0 0 0 0 0 n.s. n.s. n.s. n.s. n.s. n.s.Biomass & Other 0 0 0 0 0 0 1 n.s. n.s. n.s. 9,7% 4,2% 3,0%
Transport 40 47 57 59 58 58 60 1,6% 1,9% 0,4% -0,2% 0,0% 0,3%Coal 0 0 0 0 0 0 0 n.s. n.s. n.s. n.s. n.s. n.s.Oil 40 47 56 56 48 43 40 1,6% 1,7% 0,1% -1,5% -1,1% -0,7%Gas 0 0 0 0 0 0 0 n.s. n.s. n.s. n.s. n.s. n.s.Electricity 0 0 0 1 3 6 9 0,1% -1,2% 25,2% 18,0% 6,7% 4,1%Heat 0 0 0 0 0 0 0 n.s. n.s. n.s. n.s. n.s. n.s.Biomass & Other 0 0 1 3 7 9 11 n.s. 24,9% 8,9% 9,0% 3,0% 1,6%
Energy Branch Consumption 21 29 30 42 53 61 70 3,1% 0,4% 3,2% 2,4% 1,5% 1,3%Other Transformation & Losses 4 40 45 35 44 73 101 121 1,2% -2,5% 2,4% 5,1% 3,3% 1,8%
2 does not include international aviation and maritime bunkers; includes non-energy uses3 ratio of renewable energy over final energy demand increased by distribution losses and self consumption of electricity and steam plants4 includes statistical differences
8

GECO2015 Baseline 150504 SUMMARY GHG & ENERGY BALANCE##### 100
United States 1990 2000 2010 2020 2030 2040 2050 '90-'00 '00-'10 '10-'20 '20-'30 '30-'40 '40-'50Main Economic Indicators
Population (Million) 255 285 312 338 363 383 401 1,1% 0,9% 0,8% 0,7% 0,6% 0,5%GDP per capita (ppp, k$'05) 32 41 44 52 59 66 74 2,3% 0,7% 1,7% 1,3% 1,2% 1,1%GDP per capita (mer, k$'05) 32 41 44 52 59 66 74 2,3% 0,7% 1,7% 1,3% 1,2% 1,1%Share Value Added - Agriculture (%) 2 1 1 1 1 1 1 -5,3% 0,0% -0,3% -0,6% -0,5% -0,4%Share Value Added - Industry (%) 27 22 19 18 17 16 15 -1,7% -1,7% -0,5% -0,7% -0,7% -0,7%Share Value Added - Services (%) 71 76 80 81 82 83 85 0,7% 0,4% 0,1% 0,2% 0,2% 0,1%
PricesInternational/Regional ($'05/boe)
Coal 12 8 13 17 18 22 26 -4,2% 5,4% 2,8% 0,7% 2,0% 1,3%Oil 33 32 72 96 114 143 178 -0,2% 8,3% 3,0% 1,7% 2,3% 2,2%Gas 17 26 20 23 37 54 68 4,7% -2,6% 1,2% 5,1% 3,8% 2,4%
GHG emissions (Mt CO2 eq.)Total GHG (excl. LULUCF) 6 081 6 815 6 485 6 022 5 716 5 726 5 778 1,1% -0,5% -0,7% -0,5% 0,0% 0,1%CO2 5 046 5 774 5 469 5 089 4 767 4 743 4 768 1,4% -0,5% -0,7% -0,6% -0,1% 0,1%CH4 621 580 576 443 421 424 423 -0,7% -0,1% -2,6% -0,5% 0,1% 0,0%N2O 324 328 310 332 344 352 358 0,1% -0,6% 0,7% 0,3% 0,2% 0,2%F gases 90 133 130 157 183 208 230 4,0% -0,3% 1,9% 1,5% 1,3% 1,0%Total GHG from Energy and Industry 5 667 6 383 6 023 5 548 5 219 5 213 5 251 1,2% -0,6% -0,8% -0,6% 0,0% 0,1%CO2 Emissions from Fuel Comb. 4 892 5 622 5 347 4 977 4 670 4 655 4 680 1,4% -0,5% -0,7% -0,6% 0,0% 0,1%
Power generation/District heating 1 866 2 372 2 337 2 029 2 047 2 208 2 405 2,4% -0,2% -1,4% 0,1% 0,8% 0,9%Industry 689 609 525 581 605 640 666 -1,2% -1,5% 1,0% 0,4% 0,6% 0,4%Buildings 546 602 544 531 522 489 444 1,0% -1,0% -0,2% -0,2% -0,7% -1,0%Agriculture 46 45 49 46 45 45 44 -0,2% 1,0% -0,7% -0,2% -0,2% -0,2%Transport 1 384 1 656 1 576 1 420 1 093 937 830 1,8% -0,5% -1,0% -2,6% -1,5% -1,2%Other 361 338 316 370 358 336 291 -0,7% -0,7% 1,6% -0,3% -0,6% -1,4%
CO2 captured (CCS) 0 0 0 0 5 19 49 n.s. n.s. n.s. 46,5% 13,8% 9,8%Coal 0 0 0 0 4 17 46 n.s. n.s. n.s. 54,5% 15,3% 10,5%Gas 0 0 0 0 1 2 3 n.s. n.s. n.s. 47,3% 7,1% 2,2%Biomass 0 0 0 0 0 0 0 n.s. n.s. n.s. 0,1% 8,4% 12,5%
Energy Balance, by fuel (Mtoe)Primary Production 1 694 1 753 1 765 1 953 2 055 2 436 2 883 0,3% 0,1% 1,0% 0,5% 1,7% 1,7%
Coal 549 597 517 443 551 967 1 425 0,8% -1,4% -1,5% 2,2% 5,8% 3,9%Oil 440 381 372 429 348 316 300 -1,4% -0,2% 1,4% -2,1% -1,0% -0,5%Natural gas 422 449 492 657 629 546 455 0,6% 0,9% 2,9% -0,4% -1,4% -1,8%Biomass 82 76 112 107 139 139 153 -0,8% 3,9% -0,5% 2,7% 0,0% 0,9%Nuclear1 162 211 222 217 227 240 264 2,7% 0,5% -0,2% 0,5% 0,6% 1,0%Hydro 25 24 25 27 27 28 28 -0,3% 0,2% 1,1% 0,0% 0,0% 0,0%Other renewables 14 15 25 72 134 199 259 0,3% 5,4% 11,3% 6,3% 4,1% 2,7%
Net Imports 287 529 482 317 250 - 74 - 438Coal - 92 - 63 - 17 - 105 - 192 - 503 - 824Oil 332 490 434 290 243 193 142Natural gas 46 98 64 113 134 137 108Biomass 0 0 0 13 50 84 123Biofuels 0 0 - 1 3 11 11 10Electricity 0 3 2 3 3 3 3
Primary Energy Demand2 1 981 2 282 2 247 2 270 2 305 2 362 2 445 1,4% -0,2% 0,1% 0,2% 0,2% 0,3%Coal 457 534 500 338 359 464 601 1,6% -0,7% -3,8% 0,6% 2,6% 2,6%Oil 772 872 806 719 592 509 441 1,2% -0,8% -1,1% -1,9% -1,5% -1,4%Natural gas 469 547 556 770 763 684 563 1,6% 0,2% 3,3% -0,1% -1,1% -1,9%Biomass 82 76 112 120 189 224 276 -0,8% 3,9% 0,6% 4,7% 1,7% 2,1%Nuclear1 162 211 222 217 227 240 264 2,7% 0,5% -0,2% 0,5% 0,6% 1,0%Hydro 25 24 25 27 27 28 28 -0,3% 0,2% 1,1% 0,0% 0,0% 0,0%Other renewables 14 15 25 72 134 199 259 0,3% 5,4% 11,3% 6,3% 4,1% 2,7%
Primary Energy Demand, by sector (Mtoe)Primary Energy Demand 1 981 2 282 2 247 2 270 2 305 2 362 2 445 1,4% -0,2% 0,1% 0,2% 0,2% 0,3%Energy for Power Generation 754 931 959 986 1 066 1 181 1 308 2,1% 0,3% 0,3% 0,8% 1,0% 1,0%Other Transformation & Losses 253 322 396 428 537 612 691 2,5% 2,1% 0,8% 2,3% 1,3% 1,2%Energy Branch Consumption 145 146 139 163 160 152 142 0,0% -0,4% 1,6% -0,2% -0,5% -0,7%Final consumption 1 329 1 538 1 487 1 494 1 483 1 507 1 548 1,5% -0,3% 0,0% -0,1% 0,2% 0,3%
Steel, Non-Met. Minerals and Chem. 127 152 120 130 118 109 107 1,8% -2,3% 0,8% -1,0% -0,7% -0,2%Other Industry 209 185 160 181 190 193 194 -1,2% -1,5% 1,3% 0,5% 0,1% 0,0%Non-Energy Use 119 153 135 134 144 148 151 2,5% -1,3% -0,1% 0,7% 0,3% 0,2%Residential 224 265 268 260 268 279 289 1,7% 0,1% -0,3% 0,3% 0,4% 0,3%Services 158 193 217 245 277 314 349 2,0% 1,2% 1,2% 1,3% 1,2% 1,1%Agriculture 14 14 16 16 17 18 18 -0,2% 1,3% -0,1% 0,6% 0,5% 0,4%Road 397 493 508 464 400 374 366 2,2% 0,3% -0,9% -1,5% -0,7% -0,2%Rail 11 10 9 10 10 11 11 -0,5% -1,2% 0,4% 0,6% 0,5% 0,5%Aviation 64 68 49 49 53 55 57 0,7% -3,2% 0,0% 0,7% 0,4% 0,3%Other Transport 6 4 4 5 5 6 6 -4,3% 0,5% 1,0% 1,3% 0,9% 0,7%
1 Primary energy from nuclear is calculated considering the primary heat equivalent of the electricity produced with an average efficiency of 33%
9

GECO2015 Baseline 150504 SUMMARY GHG & ENERGY BALANCE##### 100
United States 1990 2000 2010 2020 2030 2040 2050 '90-'00 '00-'10 '10-'20 '20-'30 '30-'40 '40-'50Power Generation
Fuel Inputs Therm. Power (Mtoe) 554 681 687 670 678 714 757 2,1% 0,1% -0,3% 0,1% 0,5% 0,6%Coal 392 492 470 306 310 384 484 2,3% -0,5% -4,2% 0,1% 2,2% 2,3%Oil 27 30 11 14 13 11 11 0,8% -9,6% 2,5% -0,4% -2,2% 0,0%Gas 93 137 185 328 332 283 206 3,9% 3,1% 5,9% 0,1% -1,6% -3,1%Biomass & Waste 40 21 20 18 18 30 51 -6,0% -0,5% -1,1% -0,3% 5,6% 5,3%Other 1 1 2 4 5 6 6 -0,9% 1,9% 9,0% 3,7% 1,7% -0,2%
Gross Elec. Generation (TWh e) 3 154 4 024 4 374 4 801 5 495 6 319 7 126 2,5% 0,8% 0,9% 1,4% 1,4% 1,2%Coal 1 700 2 129 1 994 1 298 1 378 1 769 2 268 2,3% -0,7% -4,2% 0,6% 2,5% 2,5%
of which CCS 0 0 0 0 4 19 49 n.s. n.s. n.s. n.s. 15,7% 10,1%Oil 131 118 48 57 55 45 46 -1,0% -8,6% 1,8% -0,4% -2,2% 0,3%Gas 382 634 1 018 1 811 1 861 1 621 1 144 5,2% 4,8% 5,9% 0,3% -1,4% -3,4%
of which CCS 0 0 0 0 4 7 9 n.s. n.s. n.s. n.s. 7,3% 2,3%Biomass & Waste 22 43 75 62 70 135 246 7,1% 5,8% -1,9% 1,1% 6,8% 6,2%
of which CCS 0 0 0 0 0 0 0 n.s. n.s. n.s. n.s. n.s. n.s.Nuclear 612 798 839 822 885 954 1 050 2,7% 0,5% -0,2% 0,7% 0,8% 1,0%Hydro 289 280 286 318 319 320 320 -0,3% 0,2% 1,1% 0,0% 0,0% 0,0%Wind 3 6 90 332 711 1 059 1 345 6,3% 31,9% 14,0% 7,9% 4,1% 2,4%Solar 1 1 6 58 155 343 630 0,6% 24,1% 25,2% 10,3% 8,3% 6,3%Other 16 15 18 42 60 73 76 -0,9% 1,9% 9,0% 3,8% 2,0% 0,3%
Generation Capacity (GWe) 766 785 1 042 1 136 1 344 1 629 1 876 0,2% 2,9% 0,9% 1,7% 1,9% 1,4%Coal 271 271 319 260 223 285 356 0,0% 1,6% -2,0% -1,5% 2,5% 2,2%
of which CCS 0 0 0 0 1 3 7 n.s. n.s. n.s. n.s. 15,9% 10,0%Oil 82 109 56 23 20 16 16 2,9% -6,5% -8,5% -1,5% -2,2% -0,1%Gas 211 196 407 455 475 427 288 -0,7% 7,6% 1,1% 0,4% -1,1% -3,8%
of which CCS 0 0 0 0 0 1 1 n.s. n.s. n.s. n.s. 8,0% 2,5%Biomass & Waste 3 6 12 9 10 19 34 7,1% 6,8% -2,8% 0,9% 7,0% 5,9%
of which CCS 0 0 0 0 0 0 0 n.s. n.s. n.s. n.s. n.s. n.s.Nuclear 102 98 101 103 109 117 129 -0,4% 0,3% 0,1% 0,6% 0,8% 1,0%Hydro 92 99 101 102 102 102 102 0,7% 0,2% 0,1% 0,0% 0,0% 0,0%Wind 2 3 40 144 303 444 555 5,4% 31,6% 13,6% 7,7% 3,9% 2,3%Solar 0 0 4 36 96 211 385 2,5% 22,7% 25,3% 10,2% 8,2% 6,2%Other 3 3 2 5 7 9 11 0,5% -1,5% 8,4% 3,2% 1,9% 2,3%
Total Final Consumption 2 (Mtoe) 1 329 1 538 1 487 1 494 1 483 1 507 1 548 1,5% -0,3% 0,0% -0,1% 0,2% 0,3%Coal 59 39 31 29 45 71 100 -4,0% -2,4% -0,5% 4,4% 4,7% 3,5%Oil 683 793 749 670 551 479 419 1,5% -0,6% -1,1% -1,9% -1,4% -1,3%Gas 316 345 303 347 330 303 274 0,9% -1,3% 1,4% -0,5% -0,8% -1,0%Electricity 226 301 327 355 406 469 530 2,9% 0,8% 0,8% 1,4% 1,4% 1,2%Heat 2 7 8 10 15 25 36 11,3% 1,3% 2,0% 3,9% 5,3% 4,0%Biomass & Other 43 52 69 83 136 160 189 2,1% 2,8% 1,8% 5,1% 1,7% 1,7%Share of Renewables 3 (%) 6% 6% 8% 11% 17% 23% 28% 0,2% 3,2% 3,1% 5,1% 2,7% 2,3%
Industry (incl. non-energy use) 455 490 415 445 451 451 452 0,7% -1,7% 0,7% 0,1% 0,0% 0,0%Coal 53 37 29 28 44 70 99 -3,6% -2,3% -0,3% 4,6% 4,8% 3,5%Oil 147 160 152 132 124 106 87 0,8% -0,5% -1,4% -0,6% -1,5% -2,0%Gas 152 155 121 164 155 142 128 0,2% -2,5% 3,1% -0,6% -0,8% -1,1%Electricity 75 98 76 84 89 90 89 2,8% -2,6% 1,1% 0,5% 0,1% -0,1%Heat 0 4 5 5 5 5 5 n.s. 2,2% 0,0% -0,2% -0,3% -0,2%Biomass & Other 29 36 32 32 34 37 44 2,2% -1,1% -0,1% 0,6% 0,8% 1,8%
Buildings 382 458 485 505 546 593 638 1,8% 0,6% 0,4% 0,8% 0,8% 0,7%Coal 5 2 2 1 1 0 0 -8,3% -3,8% -4,5% -3,2% -3,2% -3,4%Oil 45 48 36 31 35 35 32 0,5% -2,8% -1,3% 1,1% -0,1% -1,0%Gas 164 189 182 183 175 161 146 1,5% -0,4% 0,1% -0,5% -0,8% -0,9%Electricity 152 202 251 264 287 324 363 2,9% 2,2% 0,5% 0,8% 1,2% 1,1%Heat 2 3 3 5 9 19 31 1,7% -0,2% 4,9% 7,2% 7,6% 4,9%Biomass & Other 14 13 12 20 39 53 65 -0,3% -0,6% 5,1% 6,7% 3,1% 2,0%
Agriculture 14 14 16 16 17 18 18 -0,2% 1,3% -0,1% 0,6% 0,5% 0,4%Coal 0 0 0 0 0 0 0 n.s. n.s. n.s. n.s. n.s. n.s.Oil 14 14 16 15 14 14 14 -0,2% 1,0% -0,7% -0,2% -0,2% -0,2%Gas 0 0 0 0 0 0 0 n.s. n.s. n.s. n.s. n.s. n.s.Electricity 0 0 0 0 1 1 1 n.s. n.s. n.s. 10,4% 5,0% 3,5%Heat 0 0 0 0 0 0 0 n.s. n.s. n.s. n.s. n.s. n.s.Biomass & Other 0 0 0 1 2 2 3 n.s. n.s. 10,2% 6,2% 3,3% 2,4%
Transport 477 576 571 528 469 446 440 1,9% -0,1% -0,8% -1,2% -0,5% -0,1%Coal 0 0 0 0 0 0 0 n.s. n.s. n.s. n.s. n.s. n.s.Oil 477 572 546 492 378 323 286 1,8% -0,5% -1,0% -2,6% -1,5% -1,2%Gas 0 0 0 0 0 0 0 n.s. n.s. n.s. n.s. n.s. n.s.Electricity 0 0 1 7 30 54 76 0,7% 7,6% 24,1% 16,0% 5,9% 3,5%Heat 0 0 0 0 0 0 0 n.s. n.s. n.s. n.s. n.s. n.s.Biomass & Other 0 3 24 30 61 68 78 n.s. 22,5% 2,0% 7,5% 1,1% 1,3%
Energy Branch Consumption 145 146 139 163 160 152 142 0,0% -0,4% 1,6% -0,2% -0,5% -0,7%Other Transformation & Losses 4 253 322 396 428 537 612 691 2,5% 2,1% 0,8% 2,3% 1,3% 1,2%
2 does not include international aviation and maritime bunkers; includes non-energy uses3 ratio of renewable energy over final energy demand increased by distribution losses and self consumption of electricity and steam plants4 includes statistical differences
10
GECO2015 Baseline 150504 SUMMARY GHG & ENERGY BALANCE##### 100
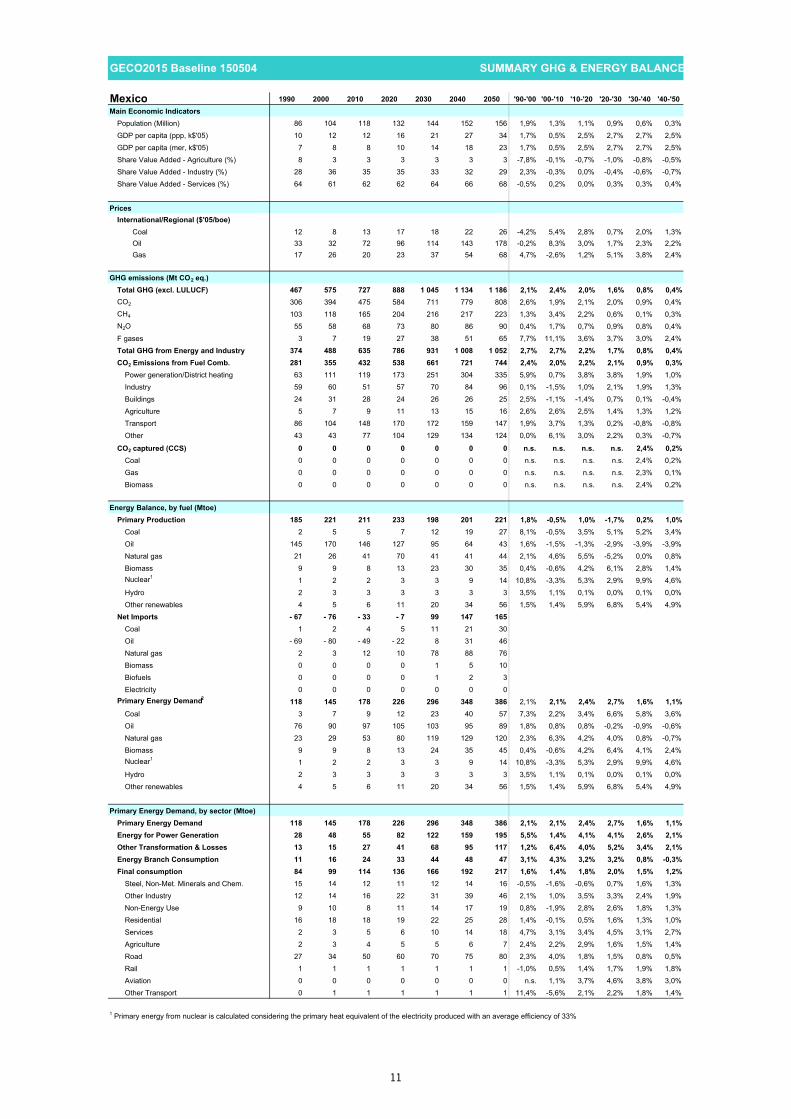
Mexico 1990 2000 2010 2020 2030 2040 2050 '90-'00 '00-'10 '10-'20 '20-'30 '30-'40 '40-'50Main Economic Indicators
Population (Million) 86 104 118 132 144 152 156 1,9% 1,3% 1,1% 0,9% 0,6% 0,3%GDP per capita (ppp, k$'05) 10 12 12 16 21 27 34 1,7% 0,5% 2,5% 2,7% 2,7% 2,5%GDP per capita (mer, k$'05) 7 8 8 10 14 18 23 1,7% 0,5% 2,5% 2,7% 2,7% 2,5%Share Value Added - Agriculture (%) 8 3 3 3 3 3 3 -7,8% -0,1% -0,7% -1,0% -0,8% -0,5%Share Value Added - Industry (%) 28 36 35 35 33 32 29 2,3% -0,3% 0,0% -0,4% -0,6% -0,7%Share Value Added - Services (%) 64 61 62 62 64 66 68 -0,5% 0,2% 0,0% 0,3% 0,3% 0,4%
PricesInternational/Regional ($'05/boe)
Coal 12 8 13 17 18 22 26 -4,2% 5,4% 2,8% 0,7% 2,0% 1,3%Oil 33 32 72 96 114 143 178 -0,2% 8,3% 3,0% 1,7% 2,3% 2,2%Gas 17 26 20 23 37 54 68 4,7% -2,6% 1,2% 5,1% 3,8% 2,4%
GHG emissions (Mt CO2 eq.)Total GHG (excl. LULUCF) 467 575 727 888 1 045 1 134 1 186 2,1% 2,4% 2,0% 1,6% 0,8% 0,4%CO2 306 394 475 584 711 779 808 2,6% 1,9% 2,1% 2,0% 0,9% 0,4%CH4 103 118 165 204 216 217 223 1,3% 3,4% 2,2% 0,6% 0,1% 0,3%N2O 55 58 68 73 80 86 90 0,4% 1,7% 0,7% 0,9% 0,8% 0,4%F gases 3 7 19 27 38 51 65 7,7% 11,1% 3,6% 3,7% 3,0% 2,4%Total GHG from Energy and Industry 374 488 635 786 931 1 008 1 052 2,7% 2,7% 2,2% 1,7% 0,8% 0,4%CO2 Emissions from Fuel Comb. 281 355 432 538 661 721 744 2,4% 2,0% 2,2% 2,1% 0,9% 0,3%
Power generation/District heating 63 111 119 173 251 304 335 5,9% 0,7% 3,8% 3,8% 1,9% 1,0%Industry 59 60 51 57 70 84 96 0,1% -1,5% 1,0% 2,1% 1,9% 1,3%Buildings 24 31 28 24 26 26 25 2,5% -1,1% -1,4% 0,7% 0,1% -0,4%Agriculture 5 7 9 11 13 15 16 2,6% 2,6% 2,5% 1,4% 1,3% 1,2%Transport 86 104 148 170 172 159 147 1,9% 3,7% 1,3% 0,2% -0,8% -0,8%Other 43 43 77 104 129 134 124 0,0% 6,1% 3,0% 2,2% 0,3% -0,7%
CO2 captured (CCS) 0 0 0 0 0 0 0 n.s. n.s. n.s. n.s. 2,4% 0,2%Coal 0 0 0 0 0 0 0 n.s. n.s. n.s. n.s. 2,4% 0,2%Gas 0 0 0 0 0 0 0 n.s. n.s. n.s. n.s. 2,3% 0,1%Biomass 0 0 0 0 0 0 0 n.s. n.s. n.s. n.s. 2,4% 0,2%
Energy Balance, by fuel (Mtoe)Primary Production 185 221 211 233 198 201 221 1,8% -0,5% 1,0% -1,7% 0,2% 1,0%
Coal 2 5 5 7 12 19 27 8,1% -0,5% 3,5% 5,1% 5,2% 3,4%Oil 145 170 146 127 95 64 43 1,6% -1,5% -1,3% -2,9% -3,9% -3,9%Natural gas 21 26 41 70 41 41 44 2,1% 4,6% 5,5% -5,2% 0,0% 0,8%Biomass 9 9 8 13 23 30 35 0,4% -0,6% 4,2% 6,1% 2,8% 1,4%Nuclear1 1 2 2 3 3 9 14 10,8% -3,3% 5,3% 2,9% 9,9% 4,6%Hydro 2 3 3 3 3 3 3 3,5% 1,1% 0,1% 0,0% 0,1% 0,0%Other renewables 4 5 6 11 20 34 56 1,5% 1,4% 5,9% 6,8% 5,4% 4,9%
Net Imports - 67 - 76 - 33 - 7 99 147 165Coal 1 2 4 5 11 21 30Oil - 69 - 80 - 49 - 22 8 31 46Natural gas 2 3 12 10 78 88 76Biomass 0 0 0 0 1 5 10Biofuels 0 0 0 0 1 2 3Electricity 0 0 0 0 0 0 0
Primary Energy Demand2 118 145 178 226 296 348 386 2,1% 2,1% 2,4% 2,7% 1,6% 1,1%Coal 3 7 9 12 23 40 57 7,3% 2,2% 3,4% 6,6% 5,8% 3,6%Oil 76 90 97 105 103 95 89 1,8% 0,8% 0,8% -0,2% -0,9% -0,6%Natural gas 23 29 53 80 119 129 120 2,3% 6,3% 4,2% 4,0% 0,8% -0,7%Biomass 9 9 8 13 24 35 45 0,4% -0,6% 4,2% 6,4% 4,1% 2,4%Nuclear1 1 2 2 3 3 9 14 10,8% -3,3% 5,3% 2,9% 9,9% 4,6%Hydro 2 3 3 3 3 3 3 3,5% 1,1% 0,1% 0,0% 0,1% 0,0%Other renewables 4 5 6 11 20 34 56 1,5% 1,4% 5,9% 6,8% 5,4% 4,9%
Primary Energy Demand, by sector (Mtoe)Primary Energy Demand 118 145 178 226 296 348 386 2,1% 2,1% 2,4% 2,7% 1,6% 1,1%Energy for Power Generation 28 48 55 82 122 159 195 5,5% 1,4% 4,1% 4,1% 2,6% 2,1%Other Transformation & Losses 13 15 27 41 68 95 117 1,2% 6,4% 4,0% 5,2% 3,4% 2,1%Energy Branch Consumption 11 16 24 33 44 48 47 3,1% 4,3% 3,2% 3,2% 0,8% -0,3%Final consumption 84 99 114 136 166 192 217 1,6% 1,4% 1,8% 2,0% 1,5% 1,2%
Steel, Non-Met. Minerals and Chem. 15 14 12 11 12 14 16 -0,5% -1,6% -0,6% 0,7% 1,6% 1,3%Other Industry 12 14 16 22 31 39 46 2,1% 1,0% 3,5% 3,3% 2,4% 1,9%Non-Energy Use 9 10 8 11 14 17 19 0,8% -1,9% 2,8% 2,6% 1,8% 1,3%Residential 16 18 18 19 22 25 28 1,4% -0,1% 0,5% 1,6% 1,3% 1,0%Services 2 3 5 6 10 14 18 4,7% 3,1% 3,4% 4,5% 3,1% 2,7%Agriculture 2 3 4 5 5 6 7 2,4% 2,2% 2,9% 1,6% 1,5% 1,4%Road 27 34 50 60 70 75 80 2,3% 4,0% 1,8% 1,5% 0,8% 0,5%Rail 1 1 1 1 1 1 1 -1,0% 0,5% 1,4% 1,7% 1,9% 1,8%Aviation 0 0 0 0 0 0 0 n.s. 1,1% 3,7% 4,6% 3,8% 3,0%Other Transport 0 1 1 1 1 1 1 11,4% -5,6% 2,1% 2,2% 1,8% 1,4%
1 Primary energy from nuclear is calculated considering the primary heat equivalent of the electricity produced with an average efficiency of 33%
11
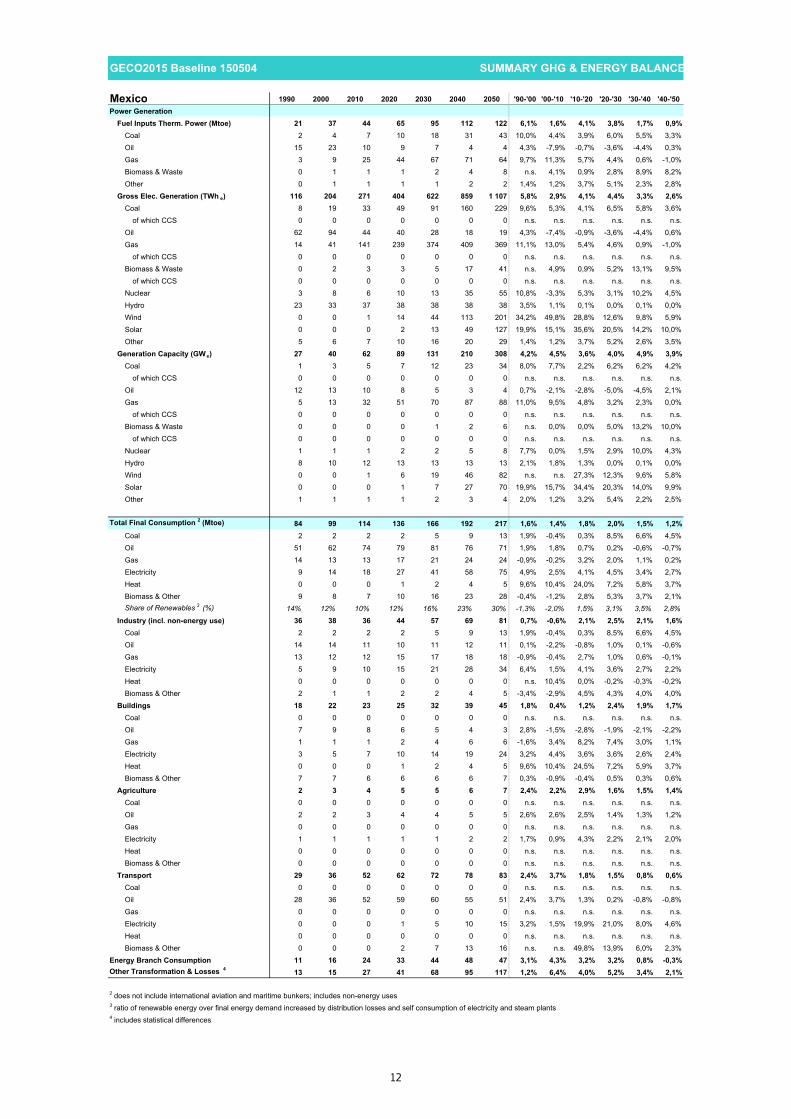
GECO2015 Baseline 150504 SUMMARY GHG & ENERGY BALANCE##### 100
Mexico 1990 2000 2010 2020 2030 2040 2050 '90-'00 '00-'10 '10-'20 '20-'30 '30-'40 '40-'50Power Generation
Fuel Inputs Therm. Power (Mtoe) 21 37 44 65 95 112 122 6,1% 1,6% 4,1% 3,8% 1,7% 0,9%Coal 2 4 7 10 18 31 43 10,0% 4,4% 3,9% 6,0% 5,5% 3,3%Oil 15 23 10 9 7 4 4 4,3% -7,9% -0,7% -3,6% -4,4% 0,3%Gas 3 9 25 44 67 71 64 9,7% 11,3% 5,7% 4,4% 0,6% -1,0%Biomass & Waste 0 1 1 1 2 4 8 n.s. 4,1% 0,9% 2,8% 8,9% 8,2%Other 0 1 1 1 1 2 2 1,4% 1,2% 3,7% 5,1% 2,3% 2,8%
Gross Elec. Generation (TWh e) 116 204 271 404 622 859 1 107 5,8% 2,9% 4,1% 4,4% 3,3% 2,6%Coal 8 19 33 49 91 160 229 9,6% 5,3% 4,1% 6,5% 5,8% 3,6%
of which CCS 0 0 0 0 0 0 0 n.s. n.s. n.s. n.s. n.s. n.s.Oil 62 94 44 40 28 18 19 4,3% -7,4% -0,9% -3,6% -4,4% 0,6%Gas 14 41 141 239 374 409 369 11,1% 13,0% 5,4% 4,6% 0,9% -1,0%
of which CCS 0 0 0 0 0 0 0 n.s. n.s. n.s. n.s. n.s. n.s.Biomass & Waste 0 2 3 3 5 17 41 n.s. 4,9% 0,9% 5,2% 13,1% 9,5%
of which CCS 0 0 0 0 0 0 0 n.s. n.s. n.s. n.s. n.s. n.s.Nuclear 3 8 6 10 13 35 55 10,8% -3,3% 5,3% 3,1% 10,2% 4,5%Hydro 23 33 37 38 38 38 38 3,5% 1,1% 0,1% 0,0% 0,1% 0,0%Wind 0 0 1 14 44 113 201 34,2% 49,8% 28,8% 12,6% 9,8% 5,9%Solar 0 0 0 2 13 49 127 19,9% 15,1% 35,6% 20,5% 14,2% 10,0%Other 5 6 7 10 16 20 29 1,4% 1,2% 3,7% 5,2% 2,6% 3,5%
Generation Capacity (GWe) 27 40 62 89 131 210 308 4,2% 4,5% 3,6% 4,0% 4,9% 3,9%Coal 1 3 5 7 12 23 34 8,0% 7,7% 2,2% 6,2% 6,2% 4,2%
of which CCS 0 0 0 0 0 0 0 n.s. n.s. n.s. n.s. n.s. n.s.Oil 12 13 10 8 5 3 4 0,7% -2,1% -2,8% -5,0% -4,5% 2,1%Gas 5 13 32 51 70 87 88 11,0% 9,5% 4,8% 3,2% 2,3% 0,0%
of which CCS 0 0 0 0 0 0 0 n.s. n.s. n.s. n.s. n.s. n.s.Biomass & Waste 0 0 0 0 1 2 6 n.s. 0,0% 0,0% 5,0% 13,2% 10,0%
of which CCS 0 0 0 0 0 0 0 n.s. n.s. n.s. n.s. n.s. n.s.Nuclear 1 1 1 2 2 5 8 7,7% 0,0% 1,5% 2,9% 10,0% 4,3%Hydro 8 10 12 13 13 13 13 2,1% 1,8% 1,3% 0,0% 0,1% 0,0%Wind 0 0 1 6 19 46 82 n.s. n.s. 27,3% 12,3% 9,6% 5,8%Solar 0 0 0 1 7 27 70 19,9% 15,7% 34,4% 20,3% 14,0% 9,9%Other 1 1 1 1 2 3 4 2,0% 1,2% 3,2% 5,4% 2,2% 2,5%
Total Final Consumption 2 (Mtoe) 84 99 114 136 166 192 217 1,6% 1,4% 1,8% 2,0% 1,5% 1,2%Coal 2 2 2 2 5 9 13 1,9% -0,4% 0,3% 8,5% 6,6% 4,5%Oil 51 62 74 79 81 76 71 1,9% 1,8% 0,7% 0,2% -0,6% -0,7%Gas 14 13 13 17 21 24 24 -0,9% -0,2% 3,2% 2,0% 1,1% 0,2%Electricity 9 14 18 27 41 58 75 4,9% 2,5% 4,1% 4,5% 3,4% 2,7%Heat 0 0 0 1 2 4 5 9,6% 10,4% 24,0% 7,2% 5,8% 3,7%Biomass & Other 9 8 7 10 16 23 28 -0,4% -1,2% 2,8% 5,3% 3,7% 2,1%Share of Renewables 3 (%) 14% 12% 10% 12% 16% 23% 30% -1,3% -2,0% 1,5% 3,1% 3,5% 2,8%
Industry (incl. non-energy use) 36 38 36 44 57 69 81 0,7% -0,6% 2,1% 2,5% 2,1% 1,6%Coal 2 2 2 2 5 9 13 1,9% -0,4% 0,3% 8,5% 6,6% 4,5%Oil 14 14 11 10 11 12 11 0,1% -2,2% -0,8% 1,0% 0,1% -0,6%Gas 13 12 12 15 17 18 18 -0,9% -0,4% 2,7% 1,0% 0,6% -0,1%Electricity 5 9 10 15 21 28 34 6,4% 1,5% 4,1% 3,6% 2,7% 2,2%Heat 0 0 0 0 0 0 0 n.s. 10,4% 0,0% -0,2% -0,3% -0,2%Biomass & Other 2 1 1 2 2 4 5 -3,4% -2,9% 4,5% 4,3% 4,0% 4,0%
Buildings 18 22 23 25 32 39 45 1,8% 0,4% 1,2% 2,4% 1,9% 1,7%Coal 0 0 0 0 0 0 0 n.s. n.s. n.s. n.s. n.s. n.s.Oil 7 9 8 6 5 4 3 2,8% -1,5% -2,8% -1,9% -2,1% -2,2%Gas 1 1 1 2 4 6 6 -1,6% 3,4% 8,2% 7,4% 3,0% 1,1%Electricity 3 5 7 10 14 19 24 3,2% 4,4% 3,6% 3,6% 2,6% 2,4%Heat 0 0 0 1 2 4 5 9,6% 10,4% 24,5% 7,2% 5,9% 3,7%Biomass & Other 7 7 6 6 6 6 7 0,3% -0,9% -0,4% 0,5% 0,3% 0,6%
Agriculture 2 3 4 5 5 6 7 2,4% 2,2% 2,9% 1,6% 1,5% 1,4%Coal 0 0 0 0 0 0 0 n.s. n.s. n.s. n.s. n.s. n.s.Oil 2 2 3 4 4 5 5 2,6% 2,6% 2,5% 1,4% 1,3% 1,2%Gas 0 0 0 0 0 0 0 n.s. n.s. n.s. n.s. n.s. n.s.Electricity 1 1 1 1 1 2 2 1,7% 0,9% 4,3% 2,2% 2,1% 2,0%Heat 0 0 0 0 0 0 0 n.s. n.s. n.s. n.s. n.s. n.s.Biomass & Other 0 0 0 0 0 0 0 n.s. n.s. n.s. n.s. n.s. n.s.
Transport 29 36 52 62 72 78 83 2,4% 3,7% 1,8% 1,5% 0,8% 0,6%Coal 0 0 0 0 0 0 0 n.s. n.s. n.s. n.s. n.s. n.s.Oil 28 36 52 59 60 55 51 2,4% 3,7% 1,3% 0,2% -0,8% -0,8%Gas 0 0 0 0 0 0 0 n.s. n.s. n.s. n.s. n.s. n.s.Electricity 0 0 0 1 5 10 15 3,2% 1,5% 19,9% 21,0% 8,0% 4,6%Heat 0 0 0 0 0 0 0 n.s. n.s. n.s. n.s. n.s. n.s.Biomass & Other 0 0 0 2 7 13 16 n.s. n.s. 49,8% 13,9% 6,0% 2,3%
Energy Branch Consumption 11 16 24 33 44 48 47 3,1% 4,3% 3,2% 3,2% 0,8% -0,3%Other Transformation & Losses 4 13 15 27 41 68 95 117 1,2% 6,4% 4,0% 5,2% 3,4% 2,1%
2 does not include international aviation and maritime bunkers; includes non-energy uses3 ratio of renewable energy over final energy demand increased by distribution losses and self consumption of electricity and steam plants4 includes statistical differences
12

GECO2015 Baseline 150504 SUMMARY GHG & ENERGY BALANCE##### 100
Rest Central America 1990 2000 2010 2020 2030 2040 2050 '90-'00 '00-'10 '10-'20 '20-'30 '30-'40 '40-'50Main Economic Indicators
Population (Million) 63 74 84 95 105 114 120 1,6% 1,3% 1,2% 1,0% 0,8% 0,6%GDP per capita (ppp, k$'05) 3 4 6 7 10 13 16 3,4% 3,5% 2,0% 2,7% 2,8% 2,7%GDP per capita (mer, k$'05) 2 2 2 3 4 5 7 2,2% 2,5% 2,1% 2,7% 2,8% 2,7%Share Value Added - Agriculture (%) 8 5 6 5 4 4 3 -3,9% 0,3% -1,1% -1,6% -1,2% -0,9%Share Value Added - Industry (%) 26 30 31 33 32 31 30 1,4% 0,6% 0,3% -0,2% -0,3% -0,4%Share Value Added - Services (%) 66 65 63 62 64 65 67 -0,2% -0,3% -0,1% 0,2% 0,2% 0,2%
PricesInternational/Regional ($'05/boe)
Coal 12 8 13 17 18 22 26 -4,2% 5,4% 2,8% 0,7% 2,0% 1,3%Oil 33 32 72 96 114 143 178 -0,2% 8,3% 3,0% 1,7% 2,3% 2,2%Gas 17 26 20 23 37 54 68 4,7% -2,6% 1,2% 5,1% 3,8% 2,4%
GHG emissions (Mt CO2 eq.)Total GHG (excl. LULUCF) 171 214 272 305 376 444 494 2,2% 2,4% 1,1% 2,1% 1,7% 1,1%CO2 101 140 185 203 258 310 348 3,4% 2,8% 0,9% 2,4% 1,8% 1,2%CH4 48 51 64 73 82 91 96 0,6% 2,3% 1,4% 1,1% 1,1% 0,6%N2O 23 23 22 27 33 39 44 -0,1% -0,3% 2,1% 1,9% 1,8% 1,2%F gases 0 0 1 2 3 4 6 n.s. 16,9% 3,4% 4,4% 3,9% 3,4%Total GHG from Energy and Industry 121 165 223 248 310 370 413 3,2% 3,0% 1,1% 2,3% 1,8% 1,1%CO2 Emissions from Fuel Comb. 92 126 162 175 224 270 301 3,2% 2,5% 0,8% 2,5% 1,9% 1,1%
Power generation/District heating 23 37 51 47 62 84 100 4,7% 3,4% -0,8% 2,8% 3,1% 1,7%Industry 22 32 44 50 68 85 103 3,7% 3,1% 1,4% 3,0% 2,3% 2,0%Buildings 8 10 10 8 9 11 12 2,0% 0,0% -2,5% 1,6% 1,7% 0,9%Agriculture 5 3 2 2 3 3 4 -4,9% -3,7% 2,2% 1,4% 1,4% 1,3%Transport 22 32 41 50 62 67 65 3,7% 2,3% 2,2% 2,2% 0,7% -0,2%Other 11 12 14 17 20 20 17 0,7% 1,7% 1,9% 1,3% -0,1% -1,3%
CO2 captured (CCS) 0 0 0 0 0 0 0 n.s. n.s. n.s. n.s. n.s. 4,9%Coal 0 0 0 0 0 0 0 n.s. n.s. n.s. n.s. n.s. 4,9%Gas 0 0 0 0 0 0 0 n.s. n.s. n.s. n.s. n.s. 4,9%Biomass 0 0 0 0 0 0 0 n.s. n.s. n.s. n.s. n.s. 5,0%
Energy Balance, by fuel (Mtoe)Primary Production 34 44 71 71 59 76 93 2,6% 5,0% 0,0% -1,8% 2,5% 2,1%
Coal 0 0 0 0 0 0 0 n.s. n.s. n.s. n.s. n.s. n.s.Oil 9 11 11 12 15 17 18 2,4% 0,3% 0,7% 2,1% 1,7% 0,4%Natural gas 5 13 37 28 2 3 3 10,9% 10,9% -2,8% -23,9% 3,7% 2,0%Biomass 19 16 18 21 26 33 41 -1,3% 0,7% 1,9% 2,2% 2,2% 2,3%Nuclear1 0 0 0 0 0 0 0 n.s. n.s. n.s. n.s. 27,5% 15,7%Hydro 1 1 2 2 2 2 2 2,7% 3,1% 0,7% 0,1% 0,2% 0,3%Other renewables 1 2 3 8 14 21 28 9,2% 6,0% 10,0% 6,3% 4,0% 3,0%
Net Imports 18 20 10 27 70 82 94Coal 0 0 1 3 11 23 34Oil 18 23 25 19 20 20 20Natural gas 0 - 3 - 16 6 39 41 41Biomass 0 0 0 0 - 1 - 2 - 3Biofuels 0 0 0 0 0 0 0Electricity 0 0 0 0 0 0 0
Primary Energy Demand2 51 64 81 98 129 158 186 2,2% 2,4% 1,9% 2,7% 2,1% 1,7%Coal 0 0 1 3 11 23 34 5,6% 11,5% 11,1% 13,0% 7,6% 4,2%Oil 26 34 36 31 35 37 38 2,7% 0,7% -1,7% 1,2% 0,7% 0,3%Natural gas 5 10 21 34 41 43 44 7,8% 7,7% 4,7% 1,9% 0,6% 0,2%Biomass 19 16 18 21 25 31 38 -1,3% 0,7% 1,7% 2,1% 2,0% 2,1%Nuclear1 0 0 0 0 0 0 0 n.s. n.s. n.s. n.s. 27,5% 15,7%Hydro 1 1 2 2 2 2 2 2,7% 3,1% 0,7% 0,1% 0,2% 0,3%Other renewables 1 2 3 8 14 21 28 9,2% 6,0% 10,0% 6,3% 4,0% 3,0%
Primary Energy Demand, by sector (Mtoe)Primary Energy Demand 51 64 81 98 129 158 186 2,2% 2,4% 1,9% 2,7% 2,1% 1,7%Energy for Power Generation 11 16 24 29 41 53 68 4,3% 4,1% 1,9% 3,3% 2,8% 2,4%Other Transformation & Losses 8 9 10 13 20 32 44 1,0% 0,4% 2,9% 4,9% 4,5% 3,4%Energy Branch Consumption 2 2 5 6 8 8 9 2,4% 7,5% 3,1% 1,9% 0,9% 0,5%Final consumption 39 47 58 71 91 112 133 2,1% 2,1% 2,0% 2,6% 2,1% 1,7%
Steel, Non-Met. Minerals and Chem. 0 1 1 1 1 1 1 6,4% 4,9% -5,2% -2,6% 0,5% 1,7%Other Industry 13 13 13 15 20 27 34 0,3% -0,4% 1,5% 3,3% 2,8% 2,4%Non-Energy Use 3 6 11 16 21 27 33 8,0% 6,9% 3,8% 3,0% 2,4% 2,1%Residential 11 14 16 18 19 20 21 2,0% 1,7% 1,0% 0,7% 0,6% 0,3%Services 2 2 3 4 5 7 9 1,9% 4,7% 1,5% 3,6% 3,2% 2,8%Agriculture 2 1 1 1 1 1 2 -4,5% -1,7% 2,1% 1,5% 1,5% 1,5%Road 8 11 13 16 22 27 31 3,7% 1,5% 2,5% 3,2% 2,0% 1,3%Rail 0 0 0 0 0 0 0 -8,6% 41,3% 0,5% 0,8% 0,8% 0,8%Aviation 0 0 0 0 0 0 1 2,6% 2,6% 4,0% 5,2% 4,7% 4,1%Other Transport 1 0 0 1 1 1 1 -6,3% 2,5% 1,8% 3,0% 2,7% 2,4%
1 Primary energy from nuclear is calculated considering the primary heat equivalent of the electricity produced with an average efficiency of 33%
13

GECO2015 Baseline 150504 SUMMARY GHG & ENERGY BALANCE##### 100
Rest Central America 1990 2000 2010 2020 2030 2040 2050 '90-'00 '00-'10 '10-'20 '20-'30 '30-'40 '40-'50Power Generation
Fuel Inputs Therm. Power (Mtoe) 9 13 20 20 24 30 37 4,0% 3,9% 0,1% 2,1% 2,2% 2,0%Coal 0 0 1 2 6 12 17 33,6% 14,9% 9,1% 12,2% 7,6% 3,4%Oil 6 10 13 7 5 4 3 4,4% 2,3% -5,6% -2,9% -3,0% -2,8%Gas 1 2 4 8 10 10 10 5,6% 6,9% 7,5% 2,5% 0,5% -0,3%Biomass & Waste 1 1 2 3 2 3 6 -1,7% 7,1% 1,2% -0,7% 1,1% 7,8%Other 0 0 0 1 1 1 1 9,1% 5,5% 8,3% 5,2% 2,1% 0,7%
Gross Elec. Generation (TWh e) 42 68 95 118 168 253 361 4,9% 3,4% 2,2% 3,6% 4,2% 3,6%Coal 0 1 3 8 29 64 92 33,5% 14,9% 10,5% 13,2% 8,1% 3,7%
of which CCS 0 0 0 0 0 0 0 n.s. n.s. n.s. n.s. n.s. n.s.Oil 24 40 48 31 23 17 13 5,4% 1,7% -4,3% -3,0% -3,1% -2,7%Gas 4 7 14 37 50 54 54 6,5% 7,6% 10,2% 3,0% 0,8% 0,1%
of which CCS 0 0 0 0 0 0 0 n.s. n.s. n.s. n.s. n.s. n.s.Biomass & Waste 2 2 4 5 5 11 27 2,1% 7,5% 2,0% 1,3% 6,9% 9,8%
of which CCS 0 0 0 0 0 0 0 n.s. n.s. n.s. n.s. n.s. n.s.Nuclear 0 0 0 0 0 0 0 n.s. n.s. n.s. n.s. n.s. n.s.Hydro 13 17 23 24 25 25 26 2,7% 3,1% 0,7% 0,1% 0,2% 0,3%Wind 0 0 0 4 16 40 68 n.s. 10,3% 24,5% 14,1% 9,3% 5,5%Solar 0 0 0 1 8 28 64 n.s. -7,8% n.s. 19,0% 13,9% 8,7%Other 1 2 3 7 12 15 18 9,1% 5,5% 8,3% 5,3% 2,3% 1,3%
Generation Capacity (GWe) 13 19 25 33 44 70 110 3,8% 3,1% 2,8% 2,9% 4,7% 4,6%Coal 0 0 0 1 4 9 15 5,6% 1,1% 8,9% 13,3% 8,7% 5,1%
of which CCS 0 0 0 0 0 0 0 n.s. n.s. n.s. n.s. n.s. n.s.Oil 8 12 16 15 12 9 4 4,2% 2,9% -0,4% -2,2% -2,7% -7,0%Gas 1 2 2 7 8 10 13 1,7% 4,3% 10,6% 2,3% 1,9% 2,4%
of which CCS 0 0 0 0 0 0 0 n.s. n.s. n.s. n.s. n.s. n.s.Biomass & Waste 0 0 1 1 1 1 4 8,1% 4,0% 0,0% 0,9% 6,6% 10,8%
of which CCS 0 0 0 0 0 0 0 n.s. n.s. n.s. n.s. n.s. n.s.Nuclear 0 0 0 0 0 0 0 n.s. n.s. n.s. n.s. n.s. n.s.Hydro 3 4 5 6 6 6 6 2,3% 2,9% 1,4% 0,1% 0,2% 0,3%Wind 0 0 0 2 7 16 28 n.s. 13,3% 23,7% 13,9% 9,2% 5,4%Solar 0 0 0 1 5 16 37 n.s. -3,4% 52,5% 18,7% 13,5% 8,7%Other 0 0 0 1 2 2 2 9,1% 2,3% 8,1% 5,2% 1,1% 1,7%
Total Final Consumption 2 (Mtoe) 39 47 58 71 91 112 133 2,1% 2,1% 2,0% 2,6% 2,1% 1,7%Coal 0 0 0 1 5 11 17 -1,1% 7,4% 14,0% 13,9% 7,5% 5,0%Oil 17 21 22 23 28 32 34 2,2% 0,8% 0,1% 2,2% 1,3% 0,6%Gas 3 7 14 21 24 26 27 10,0% 6,7% 3,8% 1,7% 0,7% 0,3%Electricity 3 5 7 9 12 18 26 4,6% 3,9% 2,2% 3,6% 4,2% 3,7%Heat 0 0 0 1 2 2 3 n.s. n.s. n.s. 6,2% 3,2% 3,1%Biomass & Other 16 14 14 17 20 23 25 -1,0% 0,0% 1,5% 1,6% 1,4% 1,2%Share of Renewables 3 (%) 46% 37% 34% 36% 36% 38% 41% -2,2% -0,7% 0,6% -0,1% 0,5% 0,9%
Industry (incl. non-energy use) 16 20 25 31 42 54 68 2,1% 2,4% 2,3% 3,1% 2,6% 2,3%Coal 0 0 0 1 5 11 17 -1,1% 7,4% 14,0% 13,9% 7,5% 5,0%Oil 6 6 6 4 6 8 11 1,0% -0,5% -3,5% 3,7% 3,6% 2,5%Gas 3 7 14 20 23 23 24 10,0% 6,8% 3,4% 1,4% 0,3% 0,1%Electricity 1 2 2 3 5 7 9 4,5% 2,7% 3,6% 4,0% 3,7% 3,3%Heat 0 0 0 0 0 0 0 n.s. n.s. n.s. n.s. n.s. n.s.Biomass & Other 6 4 2 3 4 5 7 -3,8% -6,6% 2,0% 3,4% 3,4% 3,0%
Buildings 13 15 19 21 24 27 30 2,0% 2,1% 1,1% 1,2% 1,2% 1,0%Coal 0 0 0 0 0 0 0 n.s. n.s. n.s. n.s. n.s. n.s.Oil 2 3 3 2 2 1 1 1,8% 0,1% -5,0% -1,6% -1,1% -1,2%Gas 0 0 0 1 2 3 3 11,9% -2,5% 19,1% 7,8% 4,3% 2,1%Electricity 2 3 4 5 6 8 11 4,8% 4,2% 1,3% 2,3% 2,7% 2,7%Heat 0 0 0 1 2 2 3 n.s. n.s. n.s. 6,2% 3,2% 3,1%Biomass & Other 8 9 12 13 13 12 11 1,2% 2,1% 1,0% 0,0% -0,2% -0,9%
Agriculture 2 1 1 1 1 1 2 -4,5% -1,7% 2,1% 1,5% 1,5% 1,5%Coal 0 0 0 0 0 0 0 n.s. n.s. n.s. n.s. n.s. n.s.Oil 1 1 1 1 1 1 1 -4,9% -3,7% 2,2% 1,4% 1,4% 1,3%Gas 0 0 0 0 0 0 0 n.s. n.s. n.s. n.s. n.s. n.s.Electricity 0 0 0 0 0 0 0 -1,4% 13,7% 2,3% 2,2% 2,2% 2,1%Heat 0 0 0 0 0 0 0 n.s. n.s. n.s. n.s. n.s. n.s.Biomass & Other 0 0 0 0 0 0 0 3,4% -2,5% -0,1% 0,0% 0,0% 0,0%
Transport 8 11 14 17 24 29 33 3,1% 1,7% 2,5% 3,2% 2,0% 1,4%Coal 0 0 0 0 0 0 0 n.s. n.s. n.s. n.s. n.s. n.s.Oil 7 11 13 16 20 21 21 4,2% 1,9% 2,2% 2,2% 0,7% -0,2%Gas 0 0 0 0 0 0 0 n.s. n.s. n.s. n.s. n.s. n.s.Electricity 0 0 0 0 1 3 6 -0,7% 10,0% 9,8% 30,4% 14,1% 6,9%Heat 0 0 0 0 0 0 0 n.s. n.s. n.s. n.s. n.s. n.s.Biomass & Other 1 1 1 1 3 5 7 -4,9% -0,9% 6,6% 8,5% 4,4% 3,4%
Energy Branch Consumption 2 2 5 6 8 8 9 2,4% 7,5% 3,1% 1,9% 0,9% 0,5%Other Transformation & Losses 4 8 9 10 13 20 32 44 1,0% 0,4% 2,9% 4,9% 4,5% 3,4%
2 does not include international aviation and maritime bunkers; includes non-energy uses3 ratio of renewable energy over final energy demand increased by distribution losses and self consumption of electricity and steam plants4 includes statistical differences
14
GECO2015 Baseline 150504 SUMMARY GHG & ENERGY BALANCE##### 100
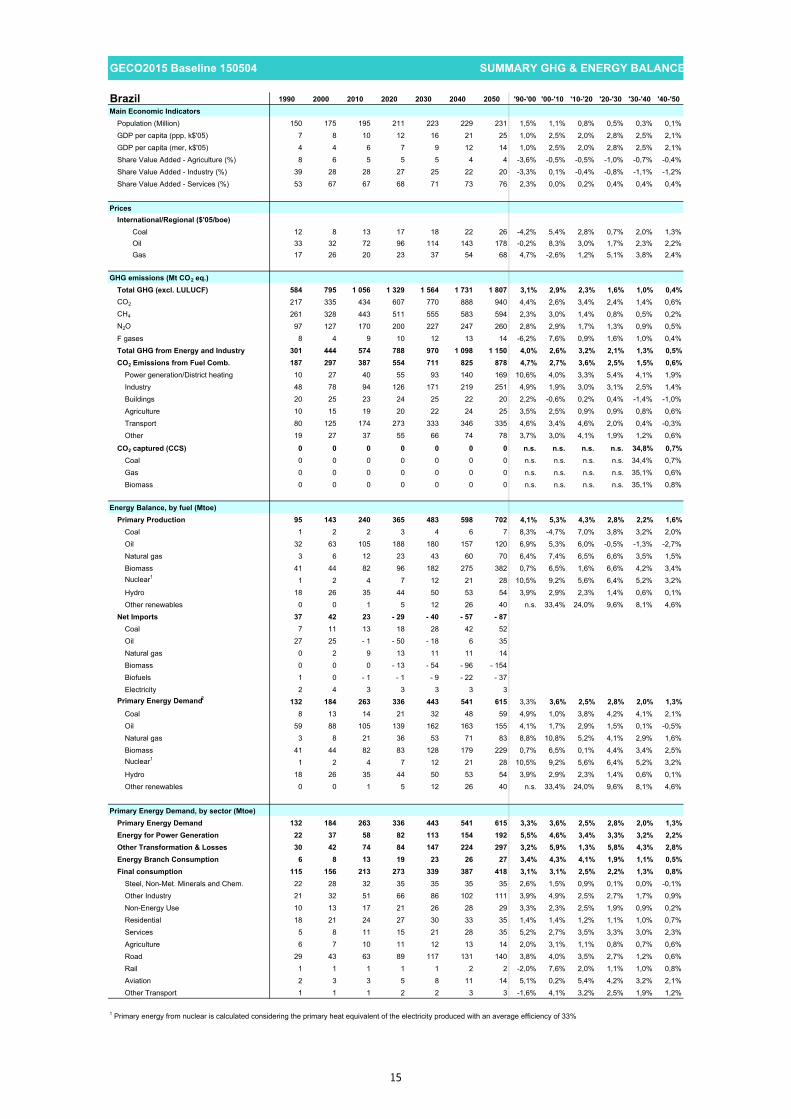
Brazil 1990 2000 2010 2020 2030 2040 2050 '90-'00 '00-'10 '10-'20 '20-'30 '30-'40 '40-'50Main Economic Indicators
Population (Million) 150 175 195 211 223 229 231 1,5% 1,1% 0,8% 0,5% 0,3% 0,1%GDP per capita (ppp, k$'05) 7 8 10 12 16 21 25 1,0% 2,5% 2,0% 2,8% 2,5% 2,1%GDP per capita (mer, k$'05) 4 4 6 7 9 12 14 1,0% 2,5% 2,0% 2,8% 2,5% 2,1%Share Value Added - Agriculture (%) 8 6 5 5 5 4 4 -3,6% -0,5% -0,5% -1,0% -0,7% -0,4%Share Value Added - Industry (%) 39 28 28 27 25 22 20 -3,3% 0,1% -0,4% -0,8% -1,1% -1,2%Share Value Added - Services (%) 53 67 67 68 71 73 76 2,3% 0,0% 0,2% 0,4% 0,4% 0,4%
PricesInternational/Regional ($'05/boe)
Coal 12 8 13 17 18 22 26 -4,2% 5,4% 2,8% 0,7% 2,0% 1,3%Oil 33 32 72 96 114 143 178 -0,2% 8,3% 3,0% 1,7% 2,3% 2,2%Gas 17 26 20 23 37 54 68 4,7% -2,6% 1,2% 5,1% 3,8% 2,4%
GHG emissions (Mt CO2 eq.)Total GHG (excl. LULUCF) 584 795 1 056 1 329 1 564 1 731 1 807 3,1% 2,9% 2,3% 1,6% 1,0% 0,4%CO2 217 335 434 607 770 888 940 4,4% 2,6% 3,4% 2,4% 1,4% 0,6%CH4 261 328 443 511 555 583 594 2,3% 3,0% 1,4% 0,8% 0,5% 0,2%N2O 97 127 170 200 227 247 260 2,8% 2,9% 1,7% 1,3% 0,9% 0,5%F gases 8 4 9 10 12 13 14 -6,2% 7,6% 0,9% 1,6% 1,0% 0,4%Total GHG from Energy and Industry 301 444 574 788 970 1 098 1 150 4,0% 2,6% 3,2% 2,1% 1,3% 0,5%CO2 Emissions from Fuel Comb. 187 297 387 554 711 825 878 4,7% 2,7% 3,6% 2,5% 1,5% 0,6%
Power generation/District heating 10 27 40 55 93 140 169 10,6% 4,0% 3,3% 5,4% 4,1% 1,9%Industry 48 78 94 126 171 219 251 4,9% 1,9% 3,0% 3,1% 2,5% 1,4%Buildings 20 25 23 24 25 22 20 2,2% -0,6% 0,2% 0,4% -1,4% -1,0%Agriculture 10 15 19 20 22 24 25 3,5% 2,5% 0,9% 0,9% 0,8% 0,6%Transport 80 125 174 273 333 346 335 4,6% 3,4% 4,6% 2,0% 0,4% -0,3%Other 19 27 37 55 66 74 78 3,7% 3,0% 4,1% 1,9% 1,2% 0,6%
CO2 captured (CCS) 0 0 0 0 0 0 0 n.s. n.s. n.s. n.s. 34,8% 0,7%Coal 0 0 0 0 0 0 0 n.s. n.s. n.s. n.s. 34,4% 0,7%Gas 0 0 0 0 0 0 0 n.s. n.s. n.s. n.s. 35,1% 0,6%Biomass 0 0 0 0 0 0 0 n.s. n.s. n.s. n.s. 35,1% 0,8%
Energy Balance, by fuel (Mtoe)Primary Production 95 143 240 365 483 598 702 4,1% 5,3% 4,3% 2,8% 2,2% 1,6%
Coal 1 2 2 3 4 6 7 8,3% -4,7% 7,0% 3,8% 3,2% 2,0%Oil 32 63 105 188 180 157 120 6,9% 5,3% 6,0% -0,5% -1,3% -2,7%Natural gas 3 6 12 23 43 60 70 6,4% 7,4% 6,5% 6,6% 3,5% 1,5%Biomass 41 44 82 96 182 275 382 0,7% 6,5% 1,6% 6,6% 4,2% 3,4%Nuclear1 1 2 4 7 12 21 28 10,5% 9,2% 5,6% 6,4% 5,2% 3,2%Hydro 18 26 35 44 50 53 54 3,9% 2,9% 2,3% 1,4% 0,6% 0,1%Other renewables 0 0 1 5 12 26 40 n.s. 33,4% 24,0% 9,6% 8,1% 4,6%
Net Imports 37 42 23 - 29 - 40 - 57 - 87Coal 7 11 13 18 28 42 52Oil 27 25 - 1 - 50 - 18 6 35Natural gas 0 2 9 13 11 11 14Biomass 0 0 0 - 13 - 54 - 96 - 154Biofuels 1 0 - 1 - 1 - 9 - 22 - 37Electricity 2 4 3 3 3 3 3
Primary Energy Demand2 132 184 263 336 443 541 615 3,3% 3,6% 2,5% 2,8% 2,0% 1,3%Coal 8 13 14 21 32 48 59 4,9% 1,0% 3,8% 4,2% 4,1% 2,1%Oil 59 88 105 139 162 163 155 4,1% 1,7% 2,9% 1,5% 0,1% -0,5%Natural gas 3 8 21 36 53 71 83 8,8% 10,8% 5,2% 4,1% 2,9% 1,6%Biomass 41 44 82 83 128 179 229 0,7% 6,5% 0,1% 4,4% 3,4% 2,5%Nuclear1 1 2 4 7 12 21 28 10,5% 9,2% 5,6% 6,4% 5,2% 3,2%Hydro 18 26 35 44 50 53 54 3,9% 2,9% 2,3% 1,4% 0,6% 0,1%Other renewables 0 0 1 5 12 26 40 n.s. 33,4% 24,0% 9,6% 8,1% 4,6%
Primary Energy Demand, by sector (Mtoe)Primary Energy Demand 132 184 263 336 443 541 615 3,3% 3,6% 2,5% 2,8% 2,0% 1,3%Energy for Power Generation 22 37 58 82 113 154 192 5,5% 4,6% 3,4% 3,3% 3,2% 2,2%Other Transformation & Losses 30 42 74 84 147 224 297 3,2% 5,9% 1,3% 5,8% 4,3% 2,8%Energy Branch Consumption 6 8 13 19 23 26 27 3,4% 4,3% 4,1% 1,9% 1,1% 0,5%Final consumption 115 156 213 273 339 387 418 3,1% 3,1% 2,5% 2,2% 1,3% 0,8%
Steel, Non-Met. Minerals and Chem. 22 28 32 35 35 35 35 2,6% 1,5% 0,9% 0,1% 0,0% -0,1%Other Industry 21 32 51 66 86 102 111 3,9% 4,9% 2,5% 2,7% 1,7% 0,9%Non-Energy Use 10 13 17 21 26 28 29 3,3% 2,3% 2,5% 1,9% 0,9% 0,2%Residential 18 21 24 27 30 33 35 1,4% 1,4% 1,2% 1,1% 1,0% 0,7%Services 5 8 11 15 21 28 35 5,2% 2,7% 3,5% 3,3% 3,0% 2,3%Agriculture 6 7 10 11 12 13 14 2,0% 3,1% 1,1% 0,8% 0,7% 0,6%Road 29 43 63 89 117 131 140 3,8% 4,0% 3,5% 2,7% 1,2% 0,6%Rail 1 1 1 1 1 2 2 -2,0% 7,6% 2,0% 1,1% 1,0% 0,8%Aviation 2 3 3 5 8 11 14 5,1% 0,2% 5,4% 4,2% 3,2% 2,1%Other Transport 1 1 1 2 2 3 3 -1,6% 4,1% 3,2% 2,5% 1,9% 1,2%
1 Primary energy from nuclear is calculated considering the primary heat equivalent of the electricity produced with an average efficiency of 33%
15

GECO2015 Baseline 150504 SUMMARY GHG & ENERGY BALANCE##### 100
Brazil 1990 2000 2010 2020 2030 2040 2050 '90-'00 '00-'10 '10-'20 '20-'30 '30-'40 '40-'50Power Generation
Fuel Inputs Therm. Power (Mtoe) 4 10 19 27 38 55 69 10,5% 7,4% 3,2% 3,7% 3,7% 2,4%Coal 1 3 3 6 13 22 26 8,3% -0,2% 7,6% 7,2% 5,3% 1,8%Oil 1 4 4 1 0 0 0 11,9% -0,2% -15,6% -7,3% -10,6% 7,8%Gas 0 1 7 12 17 23 28 28,1% 22,8% 5,9% 4,0% 2,8% 1,9%Biomass & Waste 1 2 6 8 7 10 15 7,7% 14,0% 2,9% -0,3% 3,0% 4,2%Other 0 0 0 0 0 0 0 n.s. n.s. n.s. n.s. n.s. n.s.
Gross Elec. Generation (TWh e) 223 349 515 705 946 1 242 1 520 4,6% 4,0% 3,2% 3,0% 2,8% 2,0%Coal 5 11 11 28 63 111 138 8,8% 0,3% 9,4% 8,5% 5,9% 2,1%
of which CCS 0 0 0 0 0 0 0 n.s. n.s. n.s. n.s. n.s. n.s.Oil 5 15 16 3 1 0 1 11,9% 0,6% -15,0% -7,2% -10,5% 8,0%Gas 0 4 36 64 98 131 161 28,7% 24,5% 5,8% 4,3% 3,0% 2,1%
of which CCS 0 0 0 0 0 0 0 n.s. n.s. n.s. n.s. n.s. n.s.Biomass & Waste 4 8 32 34 33 46 71 7,4% 14,9% 0,9% -0,4% 3,3% 4,5%
of which CCS 0 0 0 0 0 0 0 n.s. n.s. n.s. n.s. n.s. n.s.Nuclear 2 6 15 26 49 83 114 10,5% 9,2% 5,8% 6,7% 5,4% 3,2%Hydro 207 304 403 508 584 620 627 3,9% 2,9% 2,3% 1,4% 0,6% 0,1%Wind 0 0 2 38 91 164 222 n.s. n.s. 33,8% 9,2% 6,0% 3,1%Solar 0 0 0 4 25 84 181 n.s. n.s. n.s. 20,0% 12,7% 7,9%Other 0 0 0 0 0 2 5 n.s. n.s. n.s. 30,0% 16,9% 11,5%
Generation Capacity (GWe) 53 74 112 205 300 419 524 3,3% 4,3% 6,2% 3,9% 3,4% 2,3%Coal 1 1 2 5 12 24 37 3,0% 1,6% 12,0% 9,2% 7,1% 4,5%
of which CCS 0 0 0 0 0 0 0 n.s. n.s. n.s. n.s. n.s. n.s.Oil 4 6 8 14 18 19 16 3,5% 2,9% 5,6% 2,4% 0,6% -1,5%Gas 0 1 11 41 62 84 89 12,0% 23,2% 13,7% 4,4% 3,0% 0,6%
of which CCS 0 0 0 0 0 0 0 n.s. n.s. n.s. n.s. n.s. n.s.Biomass & Waste 1 2 8 22 30 34 30 5,1% 16,0% 10,9% 2,9% 1,5% -1,2%
of which CCS 0 0 0 0 0 0 0 n.s. n.s. n.s. n.s. n.s. n.s.Nuclear 1 2 2 3 6 10 14 11,8% 0,0% 4,7% 6,7% 5,3% 3,3%Hydro 46 61 81 101 117 124 125 3,0% 2,8% 2,3% 1,4% 0,6% 0,1%Wind 0 0 1 16 38 68 90 n.s. 46,8% 33,0% 9,1% 5,9% 2,9%Solar 0 0 0 3 17 57 122 n.s. n.s. n.s. 19,9% 12,6% 7,9%Other 0 0 0 0 0 0 1 n.s. n.s. n.s. 29,2% 16,4% 11,0%
Total Final Consumption 2 (Mtoe) 115 156 213 273 339 387 418 3,1% 3,1% 2,5% 2,2% 1,3% 0,8%Coal 6 9 11 13 18 25 32 3,5% 2,3% 1,9% 2,8% 3,5% 2,5%Oil 53 79 94 130 152 154 145 4,1% 1,6% 3,3% 1,6% 0,1% -0,5%Gas 2 5 11 18 27 36 41 6,6% 8,8% 5,1% 4,6% 2,8% 1,2%Electricity 18 28 38 50 67 89 109 4,3% 3,1% 2,9% 3,0% 2,8% 2,1%Heat 0 0 0 1 2 4 6 n.s. 28,4% 11,3% 4,6% 9,7% 2,9%Biomass & Other 35 36 60 61 73 79 85 0,3% 5,3% 0,1% 1,9% 0,8% 0,7%Share of Renewables 3 (%) 49% 42% 47% 42% 41% 42% 44% -1,5% 1,2% -1,1% -0,2% 0,1% 0,4%
Industry (incl. non-energy use) 53 73 100 122 147 166 175 3,3% 3,2% 2,0% 1,9% 1,2% 0,6%Coal 6 9 11 13 18 25 32 3,6% 2,3% 1,9% 2,8% 3,5% 2,5%Oil 17 26 27 32 35 34 29 4,4% 0,3% 1,9% 0,9% -0,4% -1,4%Gas 2 4 10 16 25 33 37 7,0% 8,8% 4,9% 4,3% 2,9% 1,2%Electricity 10 13 17 23 31 37 42 2,7% 3,3% 2,8% 2,9% 2,0% 1,2%Heat 0 0 0 0 0 0 0 n.s. n.s. n.s. n.s. n.s. n.s.Biomass & Other 18 21 35 37 39 37 34 1,8% 5,2% 0,7% 0,4% -0,6% -0,7%
Buildings 23 29 34 42 51 61 71 2,3% 1,7% 2,0% 2,0% 1,9% 1,5%Coal 0 0 0 0 0 0 0 n.s. n.s. n.s. n.s. n.s. n.s.Oil 6 8 7 7 6 5 4 2,2% -0,9% -0,6% -1,1% -2,6% -2,5%Gas 0 0 0 1 3 3 4 1,9% 7,3% 9,5% 7,9% 1,7% 1,4%Electricity 8 14 19 25 32 41 50 5,9% 3,0% 3,0% 2,6% 2,5% 2,0%Heat 0 0 0 1 2 4 6 n.s. 28,4% 11,3% 4,6% 9,7% 2,9%Biomass & Other 9 7 8 8 8 8 8 -2,1% 1,1% 0,0% 0,5% -0,4% 0,0%
Agriculture 6 7 10 11 12 13 14 2,0% 3,1% 1,1% 0,8% 0,7% 0,6%Coal 0 0 0 0 0 0 0 n.s. n.s. n.s. n.s. n.s. n.s.Oil 3 5 6 6 7 8 8 3,5% 2,5% 0,9% 0,9% 0,8% 0,6%Gas 0 0 0 0 0 0 0 n.s. n.s. -2,0% 0,7% 0,6% 0,4%Electricity 1 1 2 2 2 3 3 6,8% 3,2% 2,7% 1,5% 1,4% 1,2%Heat 0 0 0 0 0 0 0 n.s. n.s. n.s. n.s. n.s. n.s.Biomass & Other 2 2 3 3 3 3 3 -2,8% 4,4% 0,8% 0,0% 0,0% 0,0%
Transport 33 47 69 98 129 147 158 3,7% 3,8% 3,6% 2,8% 1,3% 0,8%Coal 0 0 0 0 0 0 0 n.s. n.s. n.s. n.s. n.s. n.s.Oil 27 41 54 85 104 108 105 4,5% 2,7% 4,6% 2,0% 0,4% -0,3%Gas 0 0 0 0 0 0 0 n.s. n.s. n.s. n.s. n.s. n.s.Electricity 0 0 0 0 2 8 14 0,5% 2,9% 6,4% 22,6% 13,9% 6,5%Heat 0 0 0 0 0 0 0 n.s. n.s. n.s. n.s. n.s. n.s.Biomass & Other 6 6 15 13 23 32 40 -0,3% 9,3% -1,4% 6,0% 3,3% 2,3%
Energy Branch Consumption 6 8 13 19 23 26 27 3,4% 4,3% 4,1% 1,9% 1,1% 0,5%Other Transformation & Losses 4 30 42 74 84 147 224 297 3,2% 5,9% 1,3% 5,8% 4,3% 2,8%
2 does not include international aviation and maritime bunkers; includes non-energy uses3 ratio of renewable energy over final energy demand increased by distribution losses and self consumption of electricity and steam plants4 includes statistical differences
16

GECO2015 Baseline 150504 SUMMARY GHG & ENERGY BALANCE##### 100
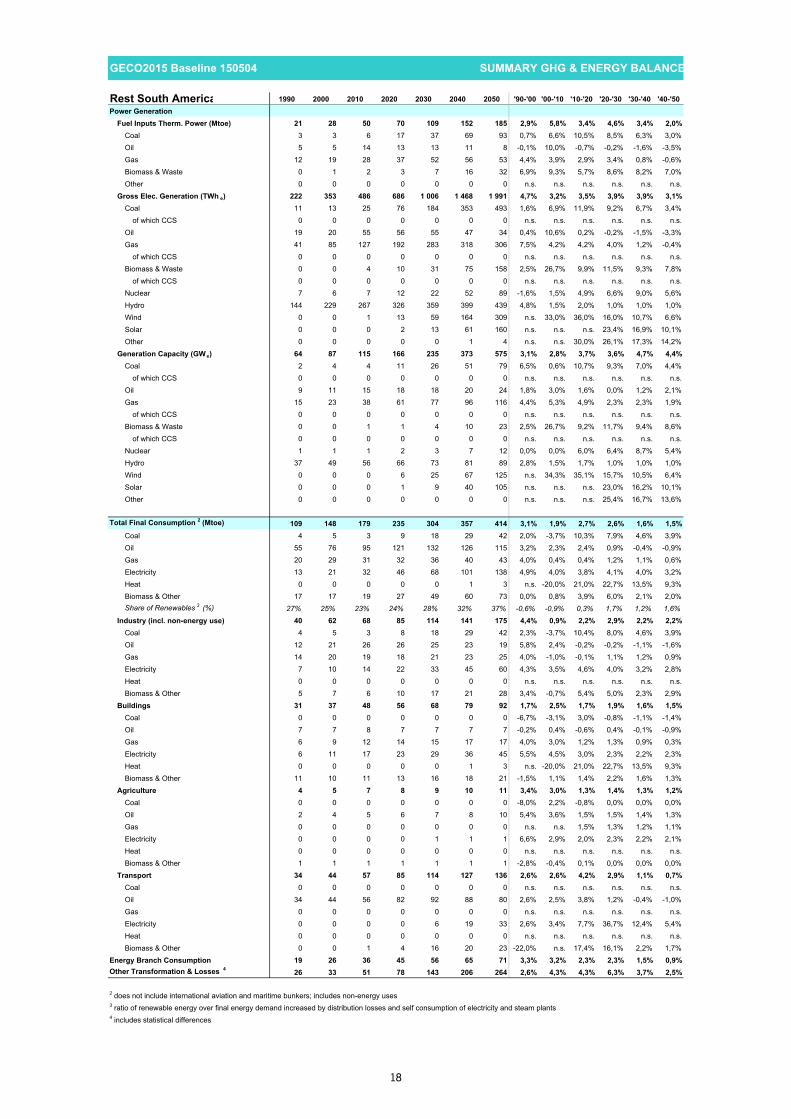
Rest South America 1990 2000 2010 2020 2030 2040 2050 '90-'00 '00-'10 '10-'20 '20-'30 '30-'40 '40-'50Main Economic Indicators
Population (Million) 146 174 199 223 245 262 274 1,7% 1,4% 1,2% 0,9% 0,7% 0,4%GDP per capita (ppp, k$'05) 6 8 10 13 18 23 29 1,8% 2,7% 2,8% 2,8% 2,6% 2,5%GDP per capita (mer, k$'05) 3 4 5 6 8 11 14 1,8% 2,7% 2,8% 2,8% 2,6% 2,5%Share Value Added - Agriculture (%) 10 6 7 5 5 5 4 -3,8% 1,3% -3,0% -0,9% -0,6% -0,5%Share Value Added - Industry (%) 39 33 39 37 35 34 32 -1,7% 1,7% -0,5% -0,4% -0,5% -0,6%Share Value Added - Services (%) 52 61 54 58 60 62 64 1,6% -1,2% 0,7% 0,3% 0,3% 0,4%
PricesInternational/Regional ($'05/boe)
Coal 12 8 13 17 18 22 26 -4,2% 5,4% 2,8% 0,7% 2,0% 1,3%Oil 33 32 72 96 114 143 178 -0,2% 8,3% 3,0% 1,7% 2,3% 2,2%Gas 17 26 20 23 37 54 68 4,7% -2,6% 1,2% 5,1% 3,8% 2,4%
GHG emissions (Mt CO2 eq.)Total GHG (excl. LULUCF) 720 877 1 095 1 321 1 589 1 810 1 947 2,0% 2,2% 1,9% 1,9% 1,3% 0,7%CO2 366 484 655 857 1 091 1 288 1 406 2,8% 3,1% 2,7% 2,4% 1,7% 0,9%CH4 261 294 311 324 344 356 365 1,2% 0,6% 0,4% 0,6% 0,3% 0,3%N2O 87 98 125 135 146 156 163 1,2% 2,5% 0,8% 0,8% 0,6% 0,4%F gases 6 2 4 5 7 10 13 -11,3% 8,3% 3,0% 3,4% 3,0% 2,5%Total GHG from Energy and Industry 452 593 775 984 1 237 1 439 1 564 2,8% 2,7% 2,4% 2,3% 1,5% 0,8%CO2 Emissions from Fuel Comb. 347 457 622 814 1 038 1 226 1 334 2,8% 3,1% 2,7% 2,5% 1,7% 0,8%
Power generation/District heating 58 74 134 194 310 440 517 2,5% 6,0% 3,8% 4,8% 3,6% 1,6%Industry 71 107 117 130 168 214 260 4,1% 0,9% 1,1% 2,6% 2,5% 2,0%Buildings 38 44 52 54 59 62 61 1,5% 1,7% 0,4% 0,9% 0,5% -0,2%Agriculture 7 12 17 20 23 27 31 5,3% 3,6% 1,5% 1,5% 1,4% 1,3%Transport 102 135 184 268 301 288 260 2,9% 3,1% 3,8% 1,2% -0,4% -1,0%Other 70 84 118 148 177 195 204 1,8% 3,5% 2,3% 1,8% 0,9% 0,5%
CO2 captured (CCS) 0 0 0 0 0 0 0 n.s. n.s. n.s. n.s. 5,0% 0,2%Coal 0 0 0 0 0 0 0 n.s. n.s. n.s. n.s. 5,0% 0,2%Gas 0 0 0 0 0 0 0 n.s. n.s. n.s. n.s. 5,1% 0,1%Biomass 0 0 0 0 0 0 0 n.s. n.s. n.s. n.s. 5,1% 0,2%
Energy Balance, by fuel (Mtoe)Primary Production 277 398 432 527 771 777 892 3,7% 0,8% 2,0% 3,9% 0,1% 1,4%
Coal 19 36 51 99 224 93 27 6,5% 3,5% 6,9% 8,5% -8,4% -11,8%Oil 182 255 248 237 258 300 364 3,4% -0,3% -0,5% 0,9% 1,5% 1,9%Natural gas 44 68 85 117 142 160 170 4,5% 2,3% 3,3% 2,0% 1,2% 0,6%Biomass 18 18 23 42 104 157 229 0,2% 2,5% 6,2% 9,4% 4,2% 3,9%Nuclear1 2 2 2 3 5 13 22 -1,6% 1,5% 4,6% 6,3% 8,9% 5,7%Hydro 12 20 23 28 31 34 38 4,8% 1,5% 2,0% 1,0% 1,0% 1,0%Other renewables 0 0 0 1 7 20 43 n.s. 0,6% 36,4% 17,2% 12,1% 7,7%
Net Imports - 122 - 196 - 170 - 181 - 294 - 193 - 211Coal - 12 - 29 - 42 - 72 - 165 8 114Oil - 108 - 163 - 120 - 83 - 92 - 141 - 221Natural gas 1 0 - 4 - 16 - 13 - 16 - 24Biomass 0 0 0 - 6 - 16 - 28 - 60Biofuels 0 0 - 1 - 1 - 5 - 12 - 17Electricity - 2 - 4 - 3 - 3 - 3 - 3 - 3
Primary Energy Demand2 155 202 262 347 476 584 681 2,7% 2,7% 2,8% 3,2% 2,1% 1,6%Coal 7 7 9 27 58 102 141 0,0% 3,0% 11,2% 8,0% 5,7% 3,3%Oil 74 92 128 154 166 159 143 2,1% 3,4% 1,9% 0,7% -0,4% -1,0%Natural gas 44 68 81 101 130 143 146 4,4% 1,8% 2,2% 2,5% 1,0% 0,2%Biomass 18 18 23 36 88 128 170 0,2% 2,5% 4,7% 9,2% 3,9% 2,8%Nuclear1 2 2 2 3 5 13 22 -1,6% 1,5% 4,6% 6,3% 8,9% 5,7%Hydro 12 20 23 28 31 34 38 4,8% 1,5% 2,0% 1,0% 1,0% 1,0%Other renewables 0 0 0 1 7 20 43 n.s. 0,6% 36,4% 17,2% 12,1% 7,7%
Primary Energy Demand, by sector (Mtoe)Primary Energy Demand 155 202 262 347 476 584 681 2,7% 2,7% 2,8% 3,2% 2,1% 1,6%Energy for Power Generation 36 50 75 102 152 219 288 3,4% 4,1% 3,2% 4,0% 3,7% 2,8%Other Transformation & Losses 26 33 51 78 143 206 264 2,6% 4,3% 4,3% 6,3% 3,7% 2,5%Energy Branch Consumption 19 26 36 45 56 65 71 3,3% 3,2% 2,3% 2,3% 1,5% 0,9%Final consumption 109 148 179 235 304 357 414 3,1% 1,9% 2,7% 2,6% 1,6% 1,5%
Steel, Non-Met. Minerals and Chem. 11 17 17 18 20 20 23 4,2% -0,2% 0,5% 1,2% -0,1% 1,6%Other Industry 24 34 42 57 81 106 134 3,2% 2,3% 3,1% 3,5% 2,7% 2,4%Non-Energy Use 5 11 9 10 13 15 17 9,6% -2,3% 1,1% 2,4% 1,7% 1,3%Residential 25 30 37 40 45 49 53 1,6% 2,1% 1,0% 1,1% 0,9% 0,8%Services 6 7 11 16 23 30 39 2,1% 4,2% 3,7% 3,6% 2,9% 2,6%Agriculture 4 5 7 8 9 10 11 3,4% 3,0% 1,3% 1,4% 1,3% 1,2%Road 32 42 54 82 108 119 126 2,7% 2,6% 4,2% 2,8% 1,0% 0,5%Rail 0 0 0 0 0 0 0 0,1% 4,0% 2,0% 1,8% 1,6% 1,4%Aviation 1 1 1 1 2 4 5 0,2% -0,1% 4,4% 5,0% 4,1% 3,3%Other Transport 1 1 2 2 3 4 5 2,7% 5,2% 2,5% 2,9% 2,4% 2,1%
1 Primary energy from nuclear is calculated considering the primary heat equivalent of the electricity produced with an average efficiency of 33%
17
GECO2015 Baseline 150504 SUMMARY GHG & ENERGY BALANCE##### 100
Rest South America 1990 2000 2010 2020 2030 2040 2050 '90-'00 '00-'10 '10-'20 '20-'30 '30-'40 '40-'50Power Generation
Fuel Inputs Therm. Power (Mtoe) 21 28 50 70 109 152 185 2,9% 5,8% 3,4% 4,6% 3,4% 2,0%Coal 3 3 6 17 37 69 93 0,7% 6,6% 10,5% 8,5% 6,3% 3,0%Oil 5 5 14 13 13 11 8 -0,1% 10,0% -0,7% -0,2% -1,6% -3,5%Gas 12 19 28 37 52 56 53 4,4% 3,9% 2,9% 3,4% 0,8% -0,6%Biomass & Waste 0 1 2 3 7 16 32 6,9% 9,3% 5,7% 8,6% 8,2% 7,0%Other 0 0 0 0 0 0 0 n.s. n.s. n.s. n.s. n.s. n.s.
Gross Elec. Generation (TWh e) 222 353 486 686 1 006 1 468 1 991 4,7% 3,2% 3,5% 3,9% 3,9% 3,1%Coal 11 13 25 76 184 353 493 1,6% 6,9% 11,9% 9,2% 6,7% 3,4%
of which CCS 0 0 0 0 0 0 0 n.s. n.s. n.s. n.s. n.s. n.s.Oil 19 20 55 56 55 47 34 0,4% 10,6% 0,2% -0,2% -1,5% -3,3%Gas 41 85 127 192 283 318 306 7,5% 4,2% 4,2% 4,0% 1,2% -0,4%
of which CCS 0 0 0 0 0 0 0 n.s. n.s. n.s. n.s. n.s. n.s.Biomass & Waste 0 0 4 10 31 75 158 2,5% 26,7% 9,9% 11,5% 9,3% 7,8%
of which CCS 0 0 0 0 0 0 0 n.s. n.s. n.s. n.s. n.s. n.s.Nuclear 7 6 7 12 22 52 89 -1,6% 1,5% 4,9% 6,6% 9,0% 5,6%Hydro 144 229 267 326 359 399 439 4,8% 1,5% 2,0% 1,0% 1,0% 1,0%Wind 0 0 1 13 59 164 309 n.s. 33,0% 36,0% 16,0% 10,7% 6,6%Solar 0 0 0 2 13 61 160 n.s. n.s. n.s. 23,4% 16,9% 10,1%Other 0 0 0 0 0 1 4 n.s. n.s. 30,0% 26,1% 17,3% 14,2%
Generation Capacity (GWe) 64 87 115 166 235 373 575 3,1% 2,8% 3,7% 3,6% 4,7% 4,4%Coal 2 4 4 11 26 51 79 6,5% 0,6% 10,7% 9,3% 7,0% 4,4%
of which CCS 0 0 0 0 0 0 0 n.s. n.s. n.s. n.s. n.s. n.s.Oil 9 11 15 18 18 20 24 1,8% 3,0% 1,6% 0,0% 1,2% 2,1%Gas 15 23 38 61 77 96 116 4,4% 5,3% 4,9% 2,3% 2,3% 1,9%
of which CCS 0 0 0 0 0 0 0 n.s. n.s. n.s. n.s. n.s. n.s.Biomass & Waste 0 0 1 1 4 10 23 2,5% 26,7% 9,2% 11,7% 9,4% 8,6%
of which CCS 0 0 0 0 0 0 0 n.s. n.s. n.s. n.s. n.s. n.s.Nuclear 1 1 1 2 3 7 12 0,0% 0,0% 6,0% 6,4% 8,7% 5,4%Hydro 37 49 56 66 73 81 89 2,8% 1,5% 1,7% 1,0% 1,0% 1,0%Wind 0 0 0 6 25 67 125 n.s. 34,3% 35,1% 15,7% 10,5% 6,4%Solar 0 0 0 1 9 40 105 n.s. n.s. n.s. 23,0% 16,2% 10,1%Other 0 0 0 0 0 0 0 n.s. n.s. n.s. 25,4% 16,7% 13,6%
Total Final Consumption 2 (Mtoe) 109 148 179 235 304 357 414 3,1% 1,9% 2,7% 2,6% 1,6% 1,5%Coal 4 5 3 9 18 29 42 2,0% -3,7% 10,3% 7,9% 4,6% 3,9%Oil 55 76 95 121 132 126 115 3,2% 2,3% 2,4% 0,9% -0,4% -0,9%Gas 20 29 31 32 36 40 43 4,0% 0,4% 0,4% 1,2% 1,1% 0,6%Electricity 13 21 32 46 68 101 138 4,9% 4,0% 3,8% 4,1% 4,0% 3,2%Heat 0 0 0 0 0 1 3 n.s. -20,0% 21,0% 22,7% 13,5% 9,3%Biomass & Other 17 17 19 27 49 60 73 0,0% 0,8% 3,9% 6,0% 2,1% 2,0%Share of Renewables 3 (%) 27% 25% 23% 24% 28% 32% 37% -0,6% -0,9% 0,3% 1,7% 1,2% 1,6%
Industry (incl. non-energy use) 40 62 68 85 114 141 175 4,4% 0,9% 2,2% 2,9% 2,2% 2,2%Coal 4 5 3 8 18 29 42 2,3% -3,7% 10,4% 8,0% 4,6% 3,9%Oil 12 21 26 26 25 23 19 5,8% 2,4% -0,2% -0,2% -1,1% -1,6%Gas 14 20 19 18 21 23 25 4,0% -1,0% -0,1% 1,1% 1,2% 0,9%Electricity 7 10 14 22 33 45 60 4,3% 3,5% 4,6% 4,0% 3,2% 2,8%Heat 0 0 0 0 0 0 0 n.s. n.s. n.s. n.s. n.s. n.s.Biomass & Other 5 7 6 10 17 21 28 3,4% -0,7% 5,4% 5,0% 2,3% 2,9%
Buildings 31 37 48 56 68 79 92 1,7% 2,5% 1,7% 1,9% 1,6% 1,5%Coal 0 0 0 0 0 0 0 -6,7% -3,1% 3,0% -0,8% -1,1% -1,4%Oil 7 7 8 7 7 7 7 -0,2% 0,4% -0,6% 0,4% -0,1% -0,9%Gas 6 9 12 14 15 17 17 4,0% 3,0% 1,2% 1,3% 0,9% 0,3%Electricity 6 11 17 23 29 36 45 5,5% 4,5% 3,0% 2,3% 2,2% 2,3%Heat 0 0 0 0 0 1 3 n.s. -20,0% 21,0% 22,7% 13,5% 9,3%Biomass & Other 11 10 11 13 16 18 21 -1,5% 1,1% 1,4% 2,2% 1,6% 1,3%
Agriculture 4 5 7 8 9 10 11 3,4% 3,0% 1,3% 1,4% 1,3% 1,2%Coal 0 0 0 0 0 0 0 -8,0% 2,2% -0,8% 0,0% 0,0% 0,0%Oil 2 4 5 6 7 8 10 5,4% 3,6% 1,5% 1,5% 1,4% 1,3%Gas 0 0 0 0 0 0 0 n.s. n.s. 1,5% 1,3% 1,2% 1,1%Electricity 0 0 0 0 1 1 1 6,6% 2,9% 2,0% 2,3% 2,2% 2,1%Heat 0 0 0 0 0 0 0 n.s. n.s. n.s. n.s. n.s. n.s.Biomass & Other 1 1 1 1 1 1 1 -2,8% -0,4% 0,1% 0,0% 0,0% 0,0%
Transport 34 44 57 85 114 127 136 2,6% 2,6% 4,2% 2,9% 1,1% 0,7%Coal 0 0 0 0 0 0 0 n.s. n.s. n.s. n.s. n.s. n.s.Oil 34 44 56 82 92 88 80 2,6% 2,5% 3,8% 1,2% -0,4% -1,0%Gas 0 0 0 0 0 0 0 n.s. n.s. n.s. n.s. n.s. n.s.Electricity 0 0 0 0 6 19 33 2,6% 3,4% 7,7% 36,7% 12,4% 5,4%Heat 0 0 0 0 0 0 0 n.s. n.s. n.s. n.s. n.s. n.s.Biomass & Other 0 0 1 4 16 20 23 -22,0% n.s. 17,4% 16,1% 2,2% 1,7%
Energy Branch Consumption 19 26 36 45 56 65 71 3,3% 3,2% 2,3% 2,3% 1,5% 0,9%Other Transformation & Losses 4 26 33 51 78 143 206 264 2,6% 4,3% 4,3% 6,3% 3,7% 2,5%
2 does not include international aviation and maritime bunkers; includes non-energy uses3 ratio of renewable energy over final energy demand increased by distribution losses and self consumption of electricity and steam plants4 includes statistical differences
18

GECO2015 Baseline 150504 SUMMARY GHG & ENERGY BALANCE##### 100
Other Central Europe 1990 2000 2010 2020 2030 2040 2050 '90-'00 '00-'10 '10-'20 '20-'30 '30-'40 '40-'50Main Economic Indicators
Population (Million) 25 24 23 22 21 20 18 -0,2% -0,5% -0,3% -0,4% -0,6% -0,8%GDP per capita (ppp, k$'05) 5 4 6 8 11 16 22 -2,3% 4,4% 2,1% 3,8% 3,8% 3,1%GDP per capita (mer, k$'05) 2 2 3 4 5 8 10 -1,0% 4,6% 2,2% 3,8% 3,8% 3,1%Share Value Added - Agriculture (%) 17 16 12 11 9 8 7 -0,5% -2,9% -1,3% -2,0% -1,4% -0,8%Share Value Added - Industry (%) 46 25 24 22 21 20 19 -5,9% -0,2% -1,0% -0,3% -0,5% -0,6%Share Value Added - Services (%) 37 59 64 67 70 72 74 4,7% 0,8% 0,6% 0,4% 0,3% 0,2%
PricesInternational/Regional ($'05/boe)
Coal 18 9 19 22 24 27 30 -6,6% 7,6% 1,4% 0,7% 1,5% 0,9%Oil 33 32 72 96 114 143 178 -0,2% 8,3% 3,0% 1,7% 2,3% 2,2%Gas 18 21 31 38 46 59 71 1,4% 4,0% 2,1% 2,1% 2,5% 1,9%
GHG emissions (Mt CO2 eq.)Total GHG (excl. LULUCF) 127 91 130 136 151 169 172 -3,3% 3,6% 0,5% 1,1% 1,1% 0,2%CO2 101 71 89 92 101 111 109 -3,4% 2,2% 0,4% 0,9% 1,0% -0,2%CH4 17 12 11 12 13 13 13 -3,5% -0,7% 0,6% 0,7% 0,4% 0,0%N2O 8 5 21 21 22 22 21 -4,3% 14,9% -0,2% 0,3% 0,1% -0,3%F gases 1 2 9 11 16 23 29 5,9% 13,3% 2,5% 4,1% 3,5% 2,3%Total GHG from Energy and Industry 111 79 116 121 135 152 155 -3,3% 3,8% 0,5% 1,1% 1,2% 0,2%CO2 Emissions from Fuel Comb. 96 69 84 87 95 105 104 -3,3% 2,0% 0,4% 0,9% 1,0% -0,2%
Power generation/District heating 52 47 53 56 60 69 68 -1,0% 1,3% 0,4% 0,8% 1,3% -0,1%Industry 17 8 8 8 10 12 13 -7,8% -0,1% 0,4% 2,3% 1,7% 0,7%Buildings 14 4 5 5 5 5 5 -10,8% 1,5% -0,5% -0,1% -0,1% -0,4%Agriculture 0 1 1 1 1 1 1 10,5% -4,0% 0,9% 1,1% 1,1% 0,9%Transport 7 7 12 12 12 10 9 -1,2% 6,5% 0,1% -0,7% -1,1% -1,9%Other 6 3 5 5 8 9 9 -8,4% 6,6% 1,2% 3,6% 1,8% 0,0%
CO2 captured (CCS) 0 0 0 0 0 0 0 n.s. n.s. n.s. n.s. n.s. 23,0%Coal 0 0 0 0 0 0 0 n.s. n.s. n.s. n.s. n.s. 22,6%Gas 0 0 0 0 0 0 0 n.s. n.s. n.s. n.s. n.s. n.s.Biomass 0 0 0 0 0 0 0 n.s. n.s. n.s. n.s. n.s. 23,5%
Energy Balance, by fuel (Mtoe)Primary Production 6 8 9 11 13 16 18 2,7% 1,3% 1,7% 2,2% 1,7% 1,3%
Coal 0 2 2 3 3 4 4 38,3% -0,4% 2,0% 1,5% 2,1% 0,6%Oil 2 1 2 2 2 1 1 -5,3% 2,5% 0,9% -0,9% -1,4% -2,2%Natural gas 1 1 0 0 1 1 1 -1,5% -6,5% 4,0% 0,8% 0,6% 0,1%Biomass 2 2 2 3 4 4 4 -0,7% 1,6% 3,8% 4,2% 0,8% 0,2%Nuclear1 0 0 0 0 0 0 0 n.s. n.s. n.s. n.s. 17,9% 11,0%Hydro 1 2 3 3 3 4 4 3,7% 3,9% -0,3% 1,7% 1,5% 1,4%Other renewables 0 0 0 0 0 1 3 n.s. 19,8% 30,2% 15,3% 11,9% 7,6%
Net Imports 26 16 21 21 24 27 26Coal 16 11 13 13 13 14 13Oil 7 4 6 6 6 6 5Natural gas 3 1 2 2 6 8 8Biomass 0 0 0 0 0 0 0Biofuels 0 0 0 0 0 0 0Electricity 0 0 0 0 0 0 0
Primary Energy Demand2 32 23 30 32 37 43 44 -3,1% 2,5% 0,5% 1,7% 1,3% 0,4%Coal 16 13 15 16 16 18 18 -2,1% 1,6% 0,3% 0,2% 1,0% -0,1%Oil 9 5 8 8 8 7 6 -6,5% 5,4% -0,5% 0,0% -0,7% -1,7%Natural gas 4 2 2 3 6 8 9 -6,6% 1,8% 3,3% 7,6% 2,8% 0,6%Biomass 2 2 2 3 4 4 5 -0,7% 1,7% 3,6% 4,2% 1,1% 0,6%Nuclear1 0 0 0 0 0 0 0 n.s. n.s. n.s. n.s. 17,9% 11,0%Hydro 1 2 3 3 3 4 4 3,7% 3,9% -0,3% 1,7% 1,5% 1,4%Other renewables 0 0 0 0 0 1 3 n.s. 19,8% 30,2% 15,3% 11,9% 7,6%
Primary Energy Demand, by sector (Mtoe)Primary Energy Demand 32 23 30 32 37 43 44 -3,1% 2,5% 0,5% 1,7% 1,3% 0,4%Energy for Power Generation 15 14 16 17 20 24 26 -0,6% 1,8% 0,5% 1,6% 1,8% 0,8%Other Transformation & Losses 6 5 6 8 11 14 16 -2,0% 3,5% 1,5% 3,6% 2,6% 1,6%Energy Branch Consumption 2 1 2 2 4 4 5 -3,0% 4,2% 2,0% 3,9% 2,1% 0,6%Final consumption 21 13 18 20 23 26 27 -4,5% 3,4% 0,7% 1,6% 1,2% 0,5%
Steel, Non-Met. Minerals and Chem. 0 1 3 3 3 3 3 5,2% 14,0% 0,4% 1,1% -0,2% -0,9%Other Industry 7 3 2 3 4 5 5 -8,4% -3,3% 2,4% 3,2% 2,7% 1,6%Non-Energy Use 2 0 1 1 1 2 2 -13,1% 10,0% -0,5% 2,1% 1,4% 0,4%Residential 4 5 6 6 6 7 7 1,0% 1,5% 0,5% 1,0% 0,5% 0,0%Services 4 1 2 2 3 3 4 -10,4% 3,0% 0,9% 2,3% 2,4% 1,6%Agriculture 0 0 0 0 0 0 0 11,9% -2,6% 0,7% 1,2% 1,3% 1,1%Road 3 2 4 5 5 6 6 -1,1% 6,3% 0,8% 1,3% 0,8% 0,1%Rail 0 0 0 0 0 0 0 2,1% 18,1% 0,2% 0,9% 1,0% 0,6%Aviation 0 0 0 0 0 0 0 n.s. n.s. n.s. n.s. n.s. n.s.Other Transport 0 0 0 0 0 0 0 n.s. 4,8% -0,6% 2,1% 1,7% 0,8%
1 Primary energy from nuclear is calculated considering the primary heat equivalent of the electricity produced with an average efficiency of 33%
19

GECO2015 Baseline 150504 SUMMARY GHG & ENERGY BALANCE##### 100
Other Central Europe 1990 2000 2010 2020 2030 2040 2050 '90-'00 '00-'10 '10-'20 '20-'30 '30-'40 '40-'50Power Generation
Fuel Inputs Therm. Power (Mtoe) 13 12 14 14 16 19 19 -1,1% 1,4% 0,6% 1,3% 1,4% 0,0%Coal 12 11 13 13 13 15 14 -0,4% 1,3% 0,1% -0,1% 1,1% -0,1%Oil 1 0 0 0 1 1 1 -12,5% -2,0% 0,4% 9,7% 1,5% -0,9%Gas 0 0 0 1 3 3 3 -7,4% 7,7% 14,1% 11,8% 3,0% 0,3%Biomass & Waste 0 0 0 0 0 0 0 n.s. n.s. n.s. n.s. 10,8% 7,4%Other 0 0 0 0 0 0 0 n.s. n.s. n.s. n.s. n.s. n.s.
Gross Elec. Generation (TWh e) 65 59 79 90 117 150 175 -0,9% 3,0% 1,3% 2,6% 2,5% 1,6%Coal 44 35 45 52 60 72 73 -2,3% 2,6% 1,4% 1,5% 1,8% 0,2%
of which CCS 0 0 0 0 0 0 0 n.s. n.s. n.s. n.s. n.s. n.s.Oil 3 1 0 1 3 3 3 -11,9% -12,6% 15,7% 9,7% 1,6% -0,7%Gas 1 0 0 4 12 17 18 -11,4% 0,3% 26,4% 10,8% 3,5% 0,9%
of which CCS 0 0 0 0 0 0 0 n.s. n.s. n.s. n.s. n.s. n.s.Biomass & Waste 0 0 0 0 0 1 1 n.s. n.s. n.s. n.s. 11,2% 7,9%
of which CCS 0 0 0 0 0 0 0 n.s. n.s. n.s. n.s. n.s. n.s.Nuclear 0 0 0 0 0 0 0 n.s. n.s. n.s. n.s. n.s. n.s.Hydro 16 23 34 33 39 45 52 3,7% 3,9% -0,3% 1,7% 1,5% 1,4%Wind 0 0 0 0 3 9 19 n.s. n.s. n.s. 18,1% 13,1% 7,8%Solar 0 0 0 0 1 3 8 n.s. n.s. n.s. 23,1% 15,0% 9,9%Other 0 0 0 0 0 0 0 n.s. n.s. n.s. n.s. 18,0% 14,1%
Generation Capacity (GWe) 9 13 14 21 24 33 46 3,5% 0,4% 4,4% 1,3% 3,5% 3,1%Coal 8 8 8 13 13 16 19 0,0% 0,0% 4,6% -0,1% 2,3% 1,4%
of which CCS 0 0 0 0 0 0 0 n.s. n.s. n.s. n.s. n.s. n.s.Oil 1 1 1 1 1 1 1 -0,2% 1,3% 0,2% -2,3% 1,1% 1,4%Gas 0 0 0 1 2 3 3 -1,1% 2,2% 18,3% 4,6% 3,1% 1,8%
of which CCS 0 0 0 0 0 0 0 n.s. n.s. n.s. n.s. n.s. n.s.Biomass & Waste 0 0 0 0 0 0 0 n.s. n.s. n.s. n.s. 11,4% 8,3%
of which CCS 0 0 0 0 0 0 0 n.s. n.s. n.s. n.s. n.s. n.s.Nuclear 0 0 0 0 0 0 0 n.s. n.s. n.s. n.s. n.s. n.s.Hydro 0 4 4 5 6 7 8 n.s. 0,9% 2,4% 1,7% 1,5% 1,4%Wind 0 0 0 0 1 4 8 n.s. n.s. n.s. 18,0% 13,0% 7,7%Solar 0 0 0 0 1 2 6 n.s. n.s. n.s. 23,1% 14,9% 9,9%Other 0 0 0 0 0 0 0 n.s. n.s. n.s. n.s. 17,4% 13,6%
Total Final Consumption 2 (Mtoe) 21 13 18 20 23 26 27 -4,5% 3,4% 0,7% 1,6% 1,2% 0,5%Coal 3 2 2 2 2 3 3 -7,7% 1,0% 1,9% 1,8% 0,8% 0,2%Oil 8 4 7 7 7 6 5 -6,1% 6,0% -0,4% -0,5% -1,0% -1,7%Gas 3 1 1 1 2 2 3 -7,6% -0,1% -0,3% 3,6% 2,5% 0,9%Electricity 4 4 5 6 7 9 11 -0,8% 2,5% 1,2% 2,7% 2,6% 1,7%Heat 1 1 1 1 2 2 2 -1,9% 5,9% 1,9% 1,9% 1,8% 1,1%Biomass & Other 2 2 2 2 3 3 4 -0,7% 1,7% 2,4% 3,1% 0,8% 0,4%Share of Renewables 3 (%) 16% 26% 26% 26% 29% 32% 37% 5,1% 0,1% 0,1% 1,1% 0,8% 1,5%
Industry (incl. non-energy use) 9 4 6 6 8 9 10 -8,0% 3,7% 1,0% 2,2% 1,5% 0,7%Coal 1 1 1 2 2 2 3 -2,7% 1,0% 2,8% 3,1% 1,4% 0,6%Oil 4 1 2 1 2 1 1 -15,1% 7,5% -1,4% 0,3% -0,5% -1,6%Gas 1 1 1 1 1 1 1 -2,4% -0,7% -1,4% 2,2% 2,0% 0,5%Electricity 2 1 1 2 3 3 4 -7,8% 5,1% 2,7% 3,0% 2,6% 1,7%Heat 0 0 0 0 0 0 0 -6,1% 10,9% 0,0% -0,2% -0,3% -0,2%Biomass & Other 0 0 0 0 0 0 0 n.s. -5,6% 12,2% 5,1% 1,0% 1,7%
Buildings 9 6 7 8 9 10 11 -3,3% 1,9% 0,6% 1,3% 1,1% 0,5%Coal 2 0 1 1 0 0 0 -14,1% 2,2% -0,1% -2,8% -3,1% -3,4%Oil 1 1 1 1 0 0 0 -1,0% 1,1% -2,0% -1,8% -1,9% -1,9%Gas 2 0 0 0 1 1 1 -14,8% 1,1% 2,0% 5,7% 3,1% 1,3%Electricity 2 3 3 4 4 5 6 3,1% 1,6% 0,4% 1,7% 1,9% 1,2%Heat 0 0 1 1 1 1 2 0,0% 3,7% 2,9% 2,7% 2,5% 1,4%Biomass & Other 2 1 2 2 2 2 1 -1,7% 2,3% 0,6% 0,5% -1,2% -1,9%
Agriculture 0 0 0 0 0 0 0 11,9% -2,6% 0,7% 1,2% 1,3% 1,1%Coal 0 0 0 0 0 0 0 2,0% -28,4% n.s. n.s. n.s. n.s.Oil 0 0 0 0 0 0 0 16,2% -2,0% 1,0% 1,1% 1,2% 0,9%Gas 0 0 0 0 0 0 0 n.s. n.s. 0,1% 0,9% 1,0% 0,7%Electricity 0 0 0 0 0 0 0 5,0% 6,0% -0,9% 1,9% 2,0% 1,7%Heat 0 0 0 0 0 0 0 n.s. n.s. n.s. n.s. n.s. n.s.Biomass & Other 0 0 0 0 0 0 0 n.s. -13,5% 5,6% 0,0% 0,0% 0,0%
Transport 3 2 5 5 6 6 6 -1,0% 6,8% 0,7% 1,3% 0,8% 0,2%Coal 0 0 0 0 0 0 0 n.s. n.s. n.s. n.s. n.s. n.s.Oil 3 2 5 5 4 4 3 -0,9% 6,8% 0,1% -0,7% -1,1% -1,9%Gas 0 0 0 0 0 0 0 n.s. n.s. n.s. n.s. n.s. n.s.Electricity 0 0 0 0 1 1 1 -5,5% 4,4% 12,2% 16,9% 6,7% 3,4%Heat 0 0 0 0 0 0 0 n.s. n.s. n.s. n.s. n.s. n.s.Biomass & Other 0 0 0 0 1 1 2 n.s. n.s. n.s. 13,1% 4,4% 2,5%
Energy Branch Consumption 2 1 2 2 4 4 5 -3,0% 4,2% 2,0% 3,9% 2,1% 0,6%Other Transformation & Losses 4 6 5 6 8 11 14 16 -2,0% 3,5% 1,5% 3,6% 2,6% 1,6%
2 does not include international aviation and maritime bunkers; includes non-energy uses3 ratio of renewable energy over final energy demand increased by distribution losses and self consumption of electricity and steam plants4 includes statistical differences
20
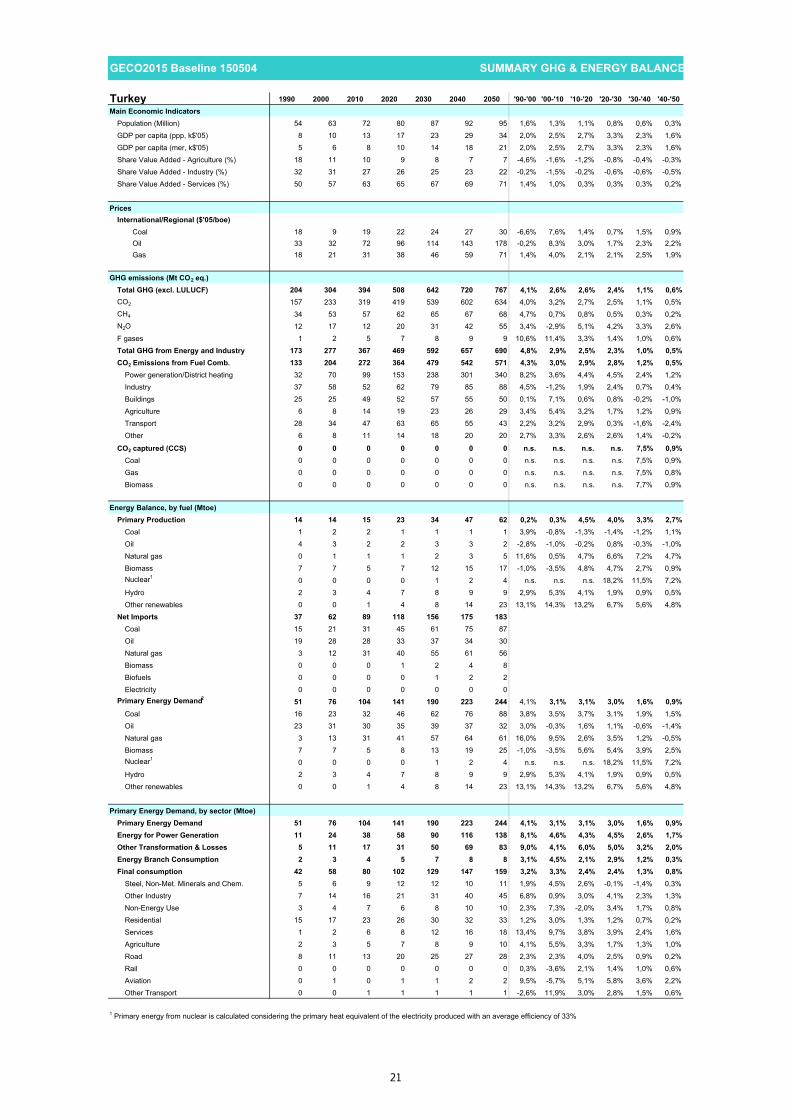
GECO2015 Baseline 150504 SUMMARY GHG & ENERGY BALANCE##### 100
Turkey 1990 2000 2010 2020 2030 2040 2050 '90-'00 '00-'10 '10-'20 '20-'30 '30-'40 '40-'50Main Economic Indicators
Population (Million) 54 63 72 80 87 92 95 1,6% 1,3% 1,1% 0,8% 0,6% 0,3%GDP per capita (ppp, k$'05) 8 10 13 17 23 29 34 2,0% 2,5% 2,7% 3,3% 2,3% 1,6%GDP per capita (mer, k$'05) 5 6 8 10 14 18 21 2,0% 2,5% 2,7% 3,3% 2,3% 1,6%Share Value Added - Agriculture (%) 18 11 10 9 8 7 7 -4,6% -1,6% -1,2% -0,8% -0,4% -0,3%Share Value Added - Industry (%) 32 31 27 26 25 23 22 -0,2% -1,5% -0,2% -0,6% -0,6% -0,5%Share Value Added - Services (%) 50 57 63 65 67 69 71 1,4% 1,0% 0,3% 0,3% 0,3% 0,2%
PricesInternational/Regional ($'05/boe)
Coal 18 9 19 22 24 27 30 -6,6% 7,6% 1,4% 0,7% 1,5% 0,9%Oil 33 32 72 96 114 143 178 -0,2% 8,3% 3,0% 1,7% 2,3% 2,2%Gas 18 21 31 38 46 59 71 1,4% 4,0% 2,1% 2,1% 2,5% 1,9%
GHG emissions (Mt CO2 eq.)Total GHG (excl. LULUCF) 204 304 394 508 642 720 767 4,1% 2,6% 2,6% 2,4% 1,1% 0,6%CO2 157 233 319 419 539 602 634 4,0% 3,2% 2,7% 2,5% 1,1% 0,5%CH4 34 53 57 62 65 67 68 4,7% 0,7% 0,8% 0,5% 0,3% 0,2%N2O 12 17 12 20 31 42 55 3,4% -2,9% 5,1% 4,2% 3,3% 2,6%F gases 1 2 5 7 8 9 9 10,6% 11,4% 3,3% 1,4% 1,0% 0,6%Total GHG from Energy and Industry 173 277 367 469 592 657 690 4,8% 2,9% 2,5% 2,3% 1,0% 0,5%CO2 Emissions from Fuel Comb. 133 204 272 364 479 542 571 4,3% 3,0% 2,9% 2,8% 1,2% 0,5%
Power generation/District heating 32 70 99 153 238 301 340 8,2% 3,6% 4,4% 4,5% 2,4% 1,2%Industry 37 58 52 62 79 85 88 4,5% -1,2% 1,9% 2,4% 0,7% 0,4%Buildings 25 25 49 52 57 55 50 0,1% 7,1% 0,6% 0,8% -0,2% -1,0%Agriculture 6 8 14 19 23 26 29 3,4% 5,4% 3,2% 1,7% 1,2% 0,9%Transport 28 34 47 63 65 55 43 2,2% 3,2% 2,9% 0,3% -1,6% -2,4%Other 6 8 11 14 18 20 20 2,7% 3,3% 2,6% 2,6% 1,4% -0,2%
CO2 captured (CCS) 0 0 0 0 0 0 0 n.s. n.s. n.s. n.s. 7,5% 0,9%Coal 0 0 0 0 0 0 0 n.s. n.s. n.s. n.s. 7,5% 0,9%Gas 0 0 0 0 0 0 0 n.s. n.s. n.s. n.s. 7,5% 0,8%Biomass 0 0 0 0 0 0 0 n.s. n.s. n.s. n.s. 7,7% 0,9%
Energy Balance, by fuel (Mtoe)Primary Production 14 14 15 23 34 47 62 0,2% 0,3% 4,5% 4,0% 3,3% 2,7%
Coal 1 2 2 1 1 1 1 3,9% -0,8% -1,3% -1,4% -1,2% 1,1%Oil 4 3 2 2 3 3 2 -2,8% -1,0% -0,2% 0,8% -0,3% -1,0%Natural gas 0 1 1 1 2 3 5 11,6% 0,5% 4,7% 6,6% 7,2% 4,7%Biomass 7 7 5 7 12 15 17 -1,0% -3,5% 4,8% 4,7% 2,7% 0,9%Nuclear1 0 0 0 0 1 2 4 n.s. n.s. n.s. 18,2% 11,5% 7,2%Hydro 2 3 4 7 8 9 9 2,9% 5,3% 4,1% 1,9% 0,9% 0,5%Other renewables 0 0 1 4 8 14 23 13,1% 14,3% 13,2% 6,7% 5,6% 4,8%
Net Imports 37 62 89 118 156 175 183Coal 15 21 31 45 61 75 87Oil 19 28 28 33 37 34 30Natural gas 3 12 31 40 55 61 56Biomass 0 0 0 1 2 4 8Biofuels 0 0 0 0 1 2 2Electricity 0 0 0 0 0 0 0
Primary Energy Demand2 51 76 104 141 190 223 244 4,1% 3,1% 3,1% 3,0% 1,6% 0,9%Coal 16 23 32 46 62 76 88 3,8% 3,5% 3,7% 3,1% 1,9% 1,5%Oil 23 31 30 35 39 37 32 3,0% -0,3% 1,6% 1,1% -0,6% -1,4%Natural gas 3 13 31 41 57 64 61 16,0% 9,5% 2,6% 3,5% 1,2% -0,5%Biomass 7 7 5 8 13 19 25 -1,0% -3,5% 5,6% 5,4% 3,9% 2,5%Nuclear1 0 0 0 0 1 2 4 n.s. n.s. n.s. 18,2% 11,5% 7,2%Hydro 2 3 4 7 8 9 9 2,9% 5,3% 4,1% 1,9% 0,9% 0,5%Other renewables 0 0 1 4 8 14 23 13,1% 14,3% 13,2% 6,7% 5,6% 4,8%
Primary Energy Demand, by sector (Mtoe)Primary Energy Demand 51 76 104 141 190 223 244 4,1% 3,1% 3,1% 3,0% 1,6% 0,9%Energy for Power Generation 11 24 38 58 90 116 138 8,1% 4,6% 4,3% 4,5% 2,6% 1,7%Other Transformation & Losses 5 11 17 31 50 69 83 9,0% 4,1% 6,0% 5,0% 3,2% 2,0%Energy Branch Consumption 2 3 4 5 7 8 8 3,1% 4,5% 2,1% 2,9% 1,2% 0,3%Final consumption 42 58 80 102 129 147 159 3,2% 3,3% 2,4% 2,4% 1,3% 0,8%
Steel, Non-Met. Minerals and Chem. 5 6 9 12 12 10 11 1,9% 4,5% 2,6% -0,1% -1,4% 0,3%Other Industry 7 14 16 21 31 40 45 6,8% 0,9% 3,0% 4,1% 2,3% 1,3%Non-Energy Use 3 4 7 6 8 10 10 2,3% 7,3% -2,0% 3,4% 1,7% 0,8%Residential 15 17 23 26 30 32 33 1,2% 3,0% 1,3% 1,2% 0,7% 0,2%Services 1 2 6 8 12 16 18 13,4% 9,7% 3,8% 3,9% 2,4% 1,6%Agriculture 2 3 5 7 8 9 10 4,1% 5,5% 3,3% 1,7% 1,3% 1,0%Road 8 11 13 20 25 27 28 2,3% 2,3% 4,0% 2,5% 0,9% 0,2%Rail 0 0 0 0 0 0 0 0,3% -3,6% 2,1% 1,4% 1,0% 0,6%Aviation 0 1 0 1 1 2 2 9,5% -5,7% 5,1% 5,8% 3,6% 2,2%Other Transport 0 0 1 1 1 1 1 -2,6% 11,9% 3,0% 2,8% 1,5% 0,6%
1 Primary energy from nuclear is calculated considering the primary heat equivalent of the electricity produced with an average efficiency of 33%
21

GECO2015 Baseline 150504 SUMMARY GHG & ENERGY BALANCE##### 100
Turkey 1990 2000 2010 2020 2030 2040 2050 '90-'00 '00-'10 '10-'20 '20-'30 '30-'40 '40-'50Power Generation
Fuel Inputs Therm. Power (Mtoe) 9 21 32 47 73 91 101 8,9% 4,3% 3,8% 4,5% 2,3% 1,1%Coal 6 11 14 27 42 55 66 6,7% 2,6% 6,4% 4,5% 2,7% 1,8%Oil 1 3 1 1 2 2 1 8,9% -14,3% 5,9% 5,3% 0,6% -2,3%Gas 2 7 17 18 29 33 32 13,3% 8,7% 0,6% 4,7% 1,5% -0,4%Biomass & Waste 0 0 0 0 1 1 2 n.s. 7,3% 12,9% 4,6% 7,7% 5,0%Other 0 0 0 0 0 0 0 -0,5% 24,3% 16,1% 2,6% 0,2% 0,6%
Gross Elec. Generation (TWh e) 58 125 211 314 500 673 819 8,1% 5,4% 4,1% 4,7% 3,0% 2,0%Coal 20 38 55 111 183 249 305 6,6% 3,7% 7,3% 5,1% 3,2% 2,0%
of which CCS 0 0 0 0 0 0 0 n.s. n.s. n.s. n.s. n.s. n.s.Oil 4 9 2 4 7 8 6 9,0% -13,5% 6,9% 5,3% 0,7% -2,1%Gas 10 46 98 102 161 193 185 16,3% 7,8% 0,4% 4,7% 1,8% -0,4%
of which CCS 0 0 0 0 0 0 0 n.s. n.s. n.s. n.s. n.s. n.s.Biomass & Waste 0 0 0 2 3 6 10 n.s. 10,6% 12,9% 5,3% 8,5% 5,7%
of which CCS 0 0 0 0 0 0 0 n.s. n.s. n.s. n.s. n.s. n.s.Nuclear 0 0 0 1 3 8 16 n.s. n.s. n.s. 18,5% 11,2% 6,7%Hydro 23 31 52 77 93 102 108 2,9% 5,3% 4,1% 1,9% 0,9% 0,5%Wind 0 0 3 13 35 69 110 n.s. 56,4% 16,6% 10,2% 7,0% 4,7%Solar 0 0 0 2 10 32 72 n.s. n.s. n.s. 19,2% 12,2% 8,4%Other 0 0 1 3 4 5 6 -0,5% 24,3% 16,2% 2,9% 1,5% 3,4%
Generation Capacity (GWe) 17 27 49 88 135 196 252 5,0% 6,1% 6,0% 4,4% 3,8% 2,6%Coal 6 7 12 18 28 38 49 2,8% 5,3% 3,9% 4,5% 3,1% 2,5%
of which CCS 0 0 0 0 0 0 0 n.s. n.s. n.s. n.s. n.s. n.s.Oil 2 2 2 2 2 3 3 -2,7% -0,4% 3,8% 0,4% 1,7% -0,7%Gas 2 7 18 35 51 68 67 12,3% 10,0% 6,7% 3,9% 3,0% -0,1%
of which CCS 0 0 0 0 0 0 0 n.s. n.s. n.s. n.s. n.s. n.s.Biomass & Waste 0 0 0 0 0 1 1 n.s. 16,3% 8,3% 4,4% 8,4% 6,0%
of which CCS 0 0 0 0 0 0 0 n.s. n.s. n.s. n.s. n.s. n.s.Nuclear 0 0 0 0 0 1 2 n.s. n.s. n.s. 18,3% 11,0% 6,5%Hydro 7 11 16 26 31 34 36 5,1% 3,5% 4,9% 2,0% 0,9% 0,5%Wind 0 0 1 6 15 29 45 n.s. 53,0% 15,8% 9,9% 6,8% 4,6%Solar 0 0 0 1 7 21 48 n.s. n.s. n.s. 19,1% 12,2% 8,4%Other 0 0 0 0 1 1 1 0,0% 20,2% 14,6% 3,3% 2,5% 3,2%
Total Final Consumption 2 (Mtoe) 42 58 80 102 129 147 159 3,2% 3,3% 2,4% 2,4% 1,3% 0,8%Coal 10 11 17 16 18 18 19 1,3% 4,5% -0,4% 0,8% 0,0% 0,7%Oil 20 26 28 33 36 34 30 2,5% 0,8% 1,6% 0,9% -0,7% -1,3%Gas 1 5 13 19 24 26 24 21,0% 10,2% 4,1% 2,3% 0,5% -0,6%Electricity 4 8 15 22 36 49 60 7,9% 5,9% 4,4% 4,8% 3,1% 2,1%Heat 0 1 3 4 4 5 7 12,4% 9,2% 2,0% 1,3% 2,1% 2,2%Biomass & Other 7 6 4 6 10 15 19 -1,1% -3,7% 3,6% 5,1% 3,9% 2,4%Share of Renewables 3 (%) 23% 16% 13% 15% 19% 24% 30% -3,3% -2,6% 1,9% 2,0% 2,5% 2,2%
Industry (incl. non-energy use) 15 24 32 39 51 59 66 4,6% 3,0% 1,9% 2,9% 1,5% 1,1%Coal 6 9 9 10 12 13 15 4,7% 0,1% 0,7% 1,7% 0,4% 1,5%Oil 6 8 8 7 8 8 6 2,9% -0,2% -2,2% 1,9% -0,4% -1,7%Gas 1 2 7 10 12 13 12 10,1% 14,0% 3,9% 2,3% 0,5% -0,6%Electricity 2 4 7 11 17 22 27 5,4% 5,3% 5,1% 4,4% 2,9% 1,9%Heat 0 0 1 1 1 1 1 50,7% 10,8% 0,0% -0,2% -0,3% -0,2%Biomass & Other 0 0 0 0 1 3 5 n.s. n.s. n.s. 16,4% 8,1% 4,9%
Buildings 16 19 29 35 42 48 51 2,1% 4,0% 1,9% 2,0% 1,2% 0,7%Coal 4 2 7 6 6 5 4 -8,2% 17,0% -1,9% -0,8% -1,1% -1,4%Oil 3 4 1 2 2 2 1 1,4% -8,7% 0,5% 0,4% -0,5% -1,3%Gas 0 3 6 10 12 13 12 50,4% 7,5% 4,4% 2,4% 0,5% -0,7%Electricity 1 4 7 10 15 19 22 10,7% 6,5% 3,1% 3,7% 2,5% 1,8%Heat 0 1 2 2 3 4 5 7,4% 8,0% 3,4% 2,1% 3,1% 2,9%Biomass & Other 7 6 4 5 5 5 6 -1,1% -3,7% 0,6% 0,6% 0,6% 0,5%
Agriculture 2 3 5 7 8 9 10 4,1% 5,5% 3,3% 1,7% 1,3% 1,0%Coal 0 0 0 0 0 0 0 n.s. n.s. -3,4% 0,0% 0,0% 0,0%Oil 2 3 4 6 7 8 9 3,4% 5,3% 3,2% 1,7% 1,2% 0,9%Gas 0 0 0 0 0 0 0 n.s. n.s. 3,8% 1,5% 1,0% 0,7%Electricity 0 0 0 1 1 1 1 18,2% 6,2% 3,6% 2,0% 1,6% 1,2%Heat 0 0 0 0 0 0 0 n.s. n.s. n.s. n.s. n.s. n.s.Biomass & Other 0 0 0 0 0 0 0 n.s. n.s. n.s. n.s. n.s. n.s.
Transport 9 12 14 21 28 30 32 2,4% 2,1% 3,9% 2,6% 1,0% 0,4%Coal 0 0 0 0 0 0 0 n.s. n.s. n.s. n.s. n.s. n.s.Oil 9 12 14 19 20 17 13 2,4% 2,1% 2,9% 0,3% -1,6% -2,3%Gas 0 0 0 0 0 0 0 n.s. n.s. n.s. n.s. n.s. n.s.Electricity 0 0 0 1 4 7 9 8,3% -0,8% 27,6% 18,2% 6,1% 3,4%Heat 0 0 0 0 0 0 0 n.s. n.s. n.s. n.s. n.s. n.s.Biomass & Other 0 0 0 1 4 7 9 n.s. n.s. n.s. 11,7% 5,6% 2,6%
Energy Branch Consumption 2 3 4 5 7 8 8 3,1% 4,5% 2,1% 2,9% 1,2% 0,3%Other Transformation & Losses 4 5 11 17 31 50 69 83 9,0% 4,1% 6,0% 5,0% 3,2% 2,0%
2 does not include international aviation and maritime bunkers; includes non-energy uses3 ratio of renewable energy over final energy demand increased by distribution losses and self consumption of electricity and steam plants4 includes statistical differences
22

GECO2015 Baseline 150504 SUMMARY GHG & ENERGY BALANCE##### 100
Norway 1990 2000 2010 2020 2030 2040 2050 '90-'00 '00-'10 '10-'20 '20-'30 '30-'40 '40-'50Main Economic Indicators
Population (Million) 4 4 5 5 6 6 7 0,6% 0,9% 1,0% 0,8% 0,6% 0,5%GDP per capita (ppp, k$'05) 32 44 47 52 61 68 75 3,1% 0,6% 1,1% 1,5% 1,1% 0,9%GDP per capita (mer, k$'05) 45 61 65 72 84 94 103 3,1% 0,6% 1,1% 1,5% 1,1% 0,9%Share Value Added - Agriculture (%) 3 2 2 2 2 2 2 -4,8% -2,7% -0,1% -0,1% -0,1% -0,1%Share Value Added - Industry (%) 34 42 40 36 31 27 23 2,1% -0,5% -0,9% -1,7% -1,4% -1,3%Share Value Added - Services (%) 63 56 59 62 68 72 75 -1,1% 0,5% 0,6% 0,9% 0,6% 0,5%
PricesInternational/Regional ($'05/boe)
Coal 18 9 19 22 24 27 30 -6,6% 7,6% 1,4% 0,7% 1,5% 0,9%Oil 33 32 72 96 114 143 178 -0,2% 8,3% 3,0% 1,7% 2,3% 2,2%Gas 18 21 31 38 46 59 71 1,4% 4,0% 2,1% 2,1% 2,5% 1,9%
GHG emissions (Mt CO2 eq.)Total GHG (excl. LULUCF) 47 49 51 57 67 72 70 0,4% 0,5% 1,1% 1,6% 0,8% -0,3%CO2 32 37 43 49 58 63 59 1,6% 1,5% 1,3% 1,7% 0,7% -0,5%CH4 5 5 4 4 4 4 4 0,1% -1,3% -1,9% 0,1% 0,6% 0,6%N2O 5 5 3 3 4 4 5 -0,7% -4,1% 0,9% 1,2% 1,5% 1,5%F gases 6 3 1 1 2 2 2 -7,5% -7,6% 1,6% 1,4% 0,9% 0,4%Total GHG from Energy and Industry 42 44 47 52 61 66 62 0,5% 0,6% 1,0% 1,6% 0,7% -0,5%CO2 Emissions from Fuel Comb. 30 35 41 47 56 61 58 1,6% 1,6% 1,4% 1,8% 0,8% -0,5%
Power generation/District heating 0 0 2 5 13 16 16 3,3% 27,7% 11,0% 9,1% 2,5% -0,2%Industry 6 6 7 7 7 7 7 1,5% 0,9% -0,3% 0,4% -0,2% -0,5%Buildings 3 1 2 1 1 1 1 -5,2% 0,4% -1,9% 0,2% -0,7% -1,0%Agriculture 1 2 2 2 2 2 2 2,6% 0,7% 0,2% 0,3% -0,3% -0,7%Transport 12 14 16 16 15 13 11 1,8% 1,5% -0,1% -1,1% -1,4% -1,3%Other 8 11 12 15 19 22 21 2,8% 1,2% 2,3% 2,0% 1,5% -0,4%
CO2 captured (CCS) 0 0 0 0 0 1 5 n.s. n.s. n.s. n.s. 21,3% 14,6%Coal 0 0 0 0 0 1 5 n.s. n.s. n.s. n.s. 23,2% 15,1%Gas 0 0 0 0 0 0 0 n.s. n.s. n.s. n.s. 11,1% 8,3%Biomass 0 0 0 0 0 0 0 n.s. n.s. n.s. n.s. n.s. 14,0%
Energy Balance, by fuel (Mtoe)Primary Production 119 223 206 154 127 99 86 6,5% -0,8% -2,9% -1,9% -2,4% -1,4%
Coal 0 1 1 2 2 3 3 8,4% 8,8% 2,8% 3,3% 0,9% 1,4%Oil 85 165 105 69 42 26 20 6,9% -4,4% -4,2% -4,7% -4,7% -2,6%Natural gas 23 44 87 69 66 54 45 6,7% 7,1% -2,3% -0,4% -2,1% -1,8%Biomass 1 1 1 2 3 3 3 2,8% 0,2% 5,8% 1,8% -0,4% -0,5%Nuclear1 0 0 0 0 0 0 0 n.s. n.s. n.s. n.s. 12,9% 8,8%Hydro 10 12 10 11 11 11 11 1,6% -1,9% 0,8% 0,2% 0,1% 0,1%Other renewables 0 0 0 1 2 3 4 n.s. 38,7% 23,7% 8,8% 5,4% 3,4%
Net Imports - 98 - 197 - 173 - 117 - 86 - 54 - 39Coal 1 0 - 1 0 1 2 3Oil - 76 - 156 - 92 - 57 - 32 - 16 - 11Natural gas - 21 - 40 - 81 - 60 - 56 - 41 - 33Biomass 0 0 0 0 1 1 2Biofuels 0 0 0 0 0 0 0Electricity - 1 - 2 1 0 0 0 0
Primary Energy Demand2 21 26 32 36 41 45 47 2,0% 2,2% 1,2% 1,3% 0,9% 0,4%Coal 1 1 1 2 4 5 6 2,1% -2,2% 9,6% 6,4% 2,3% 2,0%Oil 8 9 13 11 11 10 9 0,6% 3,8% -1,3% -0,8% -0,9% -1,0%Natural gas 2 4 6 9 11 13 12 7,7% 4,1% 3,6% 2,2% 1,5% -0,3%Biomass 1 1 1 3 3 4 4 2,9% 0,5% 6,5% 2,6% 1,6% 1,6%Nuclear1 0 0 0 0 0 0 0 n.s. n.s. n.s. n.s. 12,9% 8,8%Hydro 10 12 10 11 11 11 11 1,6% -1,9% 0,8% 0,2% 0,1% 0,1%Other renewables 0 0 0 1 2 3 4 n.s. 38,7% 23,7% 8,8% 5,4% 3,4%
Primary Energy Demand, by sector (Mtoe)Primary Energy Demand 21 26 32 36 41 45 47 2,0% 2,2% 1,2% 1,3% 0,9% 0,4%Energy for Power Generation 11 12 11 14 17 19 22 1,6% -1,0% 2,2% 2,0% 1,4% 1,3%Other Transformation & Losses 10 13 15 18 20 22 24 2,3% 1,2% 2,0% 1,3% 1,0% 0,7%Energy Branch Consumption 3 4 5 7 8 10 10 3,1% 2,4% 2,4% 2,3% 1,7% -0,1%Final consumption 17 20 21 22 24 25 26 1,3% 0,8% 0,2% 0,8% 0,5% 0,4%
Steel, Non-Met. Minerals and Chem. 2 3 2 2 2 2 2 1,8% -1,3% -1,2% -0,6% -0,6% -0,6%Other Industry 4 4 4 4 5 5 5 1,0% -1,2% 1,0% 1,3% 0,8% 0,6%Non-Energy Use 2 2 2 2 2 2 2 1,6% 0,6% -1,0% -0,2% -0,7% -0,9%Residential 4 4 4 4 5 5 6 0,6% 1,2% 0,4% 1,0% 0,8% 0,7%Services 2 2 3 3 4 4 5 0,4% 3,7% 0,1% 2,1% 1,6% 1,4%Agriculture 1 1 1 1 1 1 1 4,2% 0,6% 0,5% 1,1% 0,9% 0,8%Road 3 3 4 4 4 4 4 1,4% 1,8% 0,8% 0,1% -0,2% -0,3%Rail 0 0 0 0 0 0 0 -2,2% 0,2% 0,5% 1,3% 0,9% 0,8%Aviation 0 0 0 0 0 0 1 13,4% 2,4% 0,8% 1,0% 0,5% 0,4%Other Transport 1 1 1 1 1 1 1 1,1% 1,3% 0,8% 0,9% 0,2% -0,1%
1 Primary energy from nuclear is calculated considering the primary heat equivalent of the electricity produced with an average efficiency of 33%
23

GECO2015 Baseline 150504 SUMMARY GHG & ENERGY BALANCE##### 100
Norway 1990 2000 2010 2020 2030 2040 2050 '90-'00 '00-'10 '10-'20 '20-'30 '30-'40 '40-'50Power Generation
Fuel Inputs Therm. Power (Mtoe) 0 0 1 2 4 5 7 3,1% 21,3% 8,8% 6,3% 2,7% 2,3%Coal 0 0 0 1 3 4 5 0,1% 5,0% 39,4% 10,9% 3,1% 2,4%Oil 0 0 0 0 0 0 0 -8,8% 10,6% 13,3% 2,3% 3,4% -8,0%Gas 0 0 1 1 1 1 1 n.s. 38,7% -2,0% 3,9% 3,7% -0,4%Biomass & Waste 0 0 0 1 1 0 1 1,9% 8,1% 13,2% -2,2% -1,4% 7,2%Other 0 0 0 0 0 0 0 n.s. n.s. n.s. n.s. n.s. n.s.
Gross Elec. Generation (TWh e) 122 143 124 146 169 190 210 1,6% -1,4% 1,6% 1,5% 1,2% 1,0%Coal 0 0 0 4 13 19 24 -1,3% 3,9% 45,5% 11,5% 3,4% 2,6%
of which CCS 0 0 0 0 0 2 8 n.s. n.s. n.s. n.s. 25,8% 15,8%Oil 0 0 0 0 0 0 0 4,1% 13,2% 18,6% 2,4% 3,5% -7,9%Gas 0 0 5 4 5 8 7 n.s. 36,9% -3,2% 4,3% 3,9% -0,5%
of which CCS 0 0 0 0 0 0 0 n.s. n.s. n.s. n.s. 13,3% 7,5%Biomass & Waste 0 0 0 2 2 2 4 1,7% 5,5% 17,6% -2,1% -0,7% 8,0%
of which CCS 0 0 0 0 0 0 0 n.s. n.s. n.s. n.s. n.s. n.s.Nuclear 0 0 0 0 0 0 0 n.s. n.s. n.s. n.s. n.s. n.s.Hydro 121 142 118 127 130 132 134 1,6% -1,9% 0,8% 0,2% 0,1% 0,1%Wind 0 0 1 8 17 28 38 n.s. 41,0% 23,1% 8,3% 5,2% 3,1%Solar 0 0 0 0 1 2 3 n.s. 4,2% 40,6% 14,6% 5,2% 5,3%Other 0 0 0 0 0 0 0 n.s. n.s. n.s. 24,9% 15,9% 12,0%
Generation Capacity (GWe) 27 28 33 44 55 65 73 0,5% 1,4% 3,0% 2,4% 1,6% 1,1%Coal 0 0 0 1 3 5 7 5,9% -4,6% 29,6% 15,1% 5,6% 3,4%
of which CCS 0 0 0 0 0 0 1 n.s. n.s. n.s. n.s. 27,4% 18,5%Oil 0 0 0 1 1 1 2 -17,6% 7,2% 33,7% 5,3% 1,3% 1,5%Gas 0 0 1 7 11 13 13 0,0% 40,2% 20,2% 4,5% 1,1% 0,4%
of which CCS 0 0 0 0 0 0 0 n.s. n.s. n.s. n.s. 15,6% 9,7%Biomass & Waste 0 0 0 2 2 3 3 7,6% -0,7% 28,8% 1,5% 4,8% -1,2%
of which CCS 0 0 0 0 0 0 0 n.s. n.s. n.s. n.s. n.s. n.s.Nuclear 0 0 0 0 0 0 0 n.s. n.s. n.s. n.s. n.s. n.s.Hydro 27 28 31 30 31 31 32 0,5% 0,9% -0,2% 0,2% 0,1% 0,1%Wind 0 0 0 3 6 10 14 n.s. 42,1% 21,1% 8,1% 5,0% 3,0%Solar 0 0 0 0 1 2 3 n.s. 4,2% 40,6% 14,6% 5,2% 5,3%Other 0 0 0 0 0 0 0 n.s. n.s. n.s. n.s. 15,4% 11,4%
Total Final Consumption 2 (Mtoe) 17 20 21 22 24 25 26 1,3% 0,8% 0,2% 0,8% 0,5% 0,4%Coal 1 1 1 1 1 1 1 2,1% -4,0% -1,7% 2,1% 1,4% 0,7%Oil 7 8 9 8 7 6 5 0,2% 1,3% -0,8% -1,2% -1,6% -1,5%Gas 0 1 1 1 1 1 1 n.s. 2,0% 2,1% 2,6% 0,9% -0,1%Electricity 8 9 10 11 12 14 15 1,2% 0,5% 0,7% 1,5% 1,2% 1,0%Heat 0 0 0 0 1 1 1 5,6% 11,6% 1,0% 2,9% 2,7% 1,9%Biomass & Other 1 1 1 2 2 2 3 2,9% 0,3% 2,7% 2,7% 1,6% 0,8%Share of Renewables 3 (%) 67% 70% 55% 61% 63% 65% 67% 0,3% -2,4% 1,1% 0,2% 0,4% 0,4%
Industry (incl. non-energy use) 8 9 8 8 9 9 9 1,4% -0,8% -0,2% 0,4% 0,2% 0,0%Coal 1 1 1 1 1 1 1 2,2% -4,0% -1,7% 2,1% 1,5% 0,7%Oil 3 2 3 2 2 1 1 -1,3% 1,4% -1,9% -1,9% -2,7% -2,7%Gas 0 1 1 1 1 1 1 n.s. 1,3% 1,6% 1,9% 0,6% -0,3%Electricity 4 4 4 4 5 5 5 1,2% -1,5% 0,8% 0,9% 0,7% 0,5%Heat 0 0 0 0 0 0 0 1,9% 7,1% 0,0% -0,2% -0,3% -0,2%Biomass & Other 0 1 0 0 0 1 1 4,6% -4,1% 0,6% 1,7% 1,5% 0,9%
Buildings 6 6 7 8 9 10 11 0,5% 2,2% 0,3% 1,4% 1,2% 1,0%Coal 0 0 0 0 0 0 0 -7,8% -3,9% -2,1% n.s. n.s. n.s.Oil 1 0 0 0 0 0 0 -5,1% 0,0% -3,1% -2,1% -2,6% -2,6%Gas 0 0 0 0 0 0 0 n.s. 36,3% 11,8% 8,6% 2,6% 0,7%Electricity 4 5 6 6 7 8 9 1,1% 2,0% 0,4% 1,5% 1,3% 1,1%Heat 0 0 0 0 1 1 1 6,5% 12,3% 1,1% 3,2% 2,9% 2,0%Biomass & Other 1 1 1 1 1 1 1 1,5% 2,1% -0,4% 0,5% 0,0% -0,3%
Agriculture 1 1 1 1 1 1 1 4,2% 0,6% 0,5% 1,1% 0,9% 0,8%Coal 0 0 0 0 0 0 0 n.s. n.s. n.s. n.s. n.s. n.s.Oil 0 1 1 1 1 1 1 2,7% 0,4% 0,3% 0,3% -0,3% -0,7%Gas 0 0 0 0 0 0 0 n.s. n.s. -4,7% 0,3% -0,1% -0,4%Electricity 0 0 0 0 0 0 0 12,0% 0,1% 1,0% 2,0% 1,9% 1,8%Heat 0 0 0 0 0 0 0 n.s. n.s. n.s. n.s. n.s. n.s.Biomass & Other 0 0 0 0 0 0 0 n.s. 10,2% 18,1% 10,7% 6,2% 4,5%
Transport 3 4 5 5 5 5 5 1,8% 1,7% 0,8% 0,3% -0,1% -0,2%Coal 0 0 0 0 0 0 0 n.s. n.s. n.s. n.s. n.s. n.s.Oil 3 4 5 5 4 4 3 1,8% 1,5% 0,0% -1,0% -1,3% -1,2%Gas 0 0 0 0 0 0 0 n.s. n.s. n.s. n.s. n.s. n.s.Electricity 0 0 0 0 0 1 1 -0,4% 1,1% 7,1% 12,6% 5,3% 2,9%Heat 0 0 0 0 0 0 0 n.s. n.s. n.s. n.s. n.s. n.s.Biomass & Other 0 0 0 0 1 1 1 n.s. n.s. 16,4% 5,5% 2,5% 1,1%
Energy Branch Consumption 3 4 5 7 8 10 10 3,1% 2,4% 2,4% 2,3% 1,7% -0,1%Other Transformation & Losses 4 10 13 15 18 20 22 24 2,3% 1,2% 2,0% 1,3% 1,0% 0,7%
2 does not include international aviation and maritime bunkers; includes non-energy uses3 ratio of renewable energy over final energy demand increased by distribution losses and self consumption of electricity and steam plants4 includes statistical differences
24
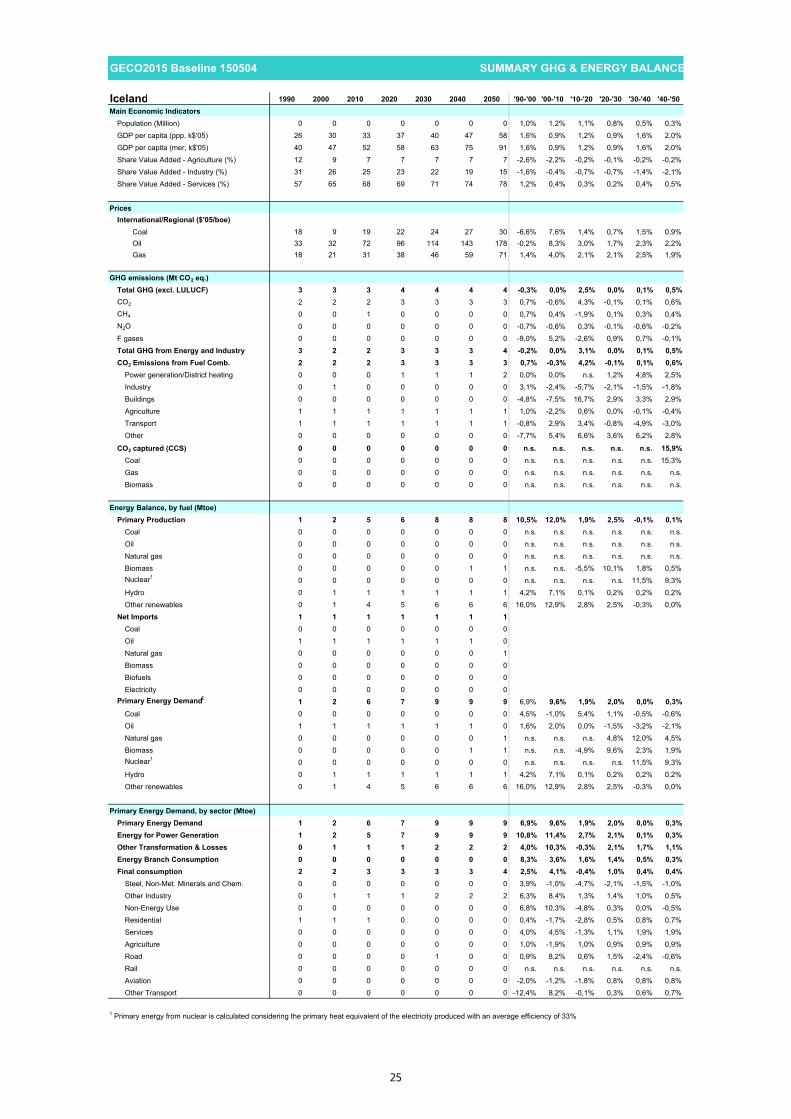
GECO2015 Baseline 150504 SUMMARY GHG & ENERGY BALANCE##### 100
Iceland 1990 2000 2010 2020 2030 2040 2050 '90-'00 '00-'10 '10-'20 '20-'30 '30-'40 '40-'50Main Economic Indicators
Population (Million) 0 0 0 0 0 0 0 1,0% 1,2% 1,1% 0,8% 0,5% 0,3%GDP per capita (ppp, k$'05) 26 30 33 37 40 47 58 1,6% 0,9% 1,2% 0,9% 1,6% 2,0%GDP per capita (mer, k$'05) 40 47 52 58 63 75 91 1,6% 0,9% 1,2% 0,9% 1,6% 2,0%Share Value Added - Agriculture (%) 12 9 7 7 7 7 7 -2,6% -2,2% -0,2% -0,1% -0,2% -0,2%Share Value Added - Industry (%) 31 26 25 23 22 19 15 -1,6% -0,4% -0,7% -0,7% -1,4% -2,1%Share Value Added - Services (%) 57 65 68 69 71 74 78 1,2% 0,4% 0,3% 0,2% 0,4% 0,5%
PricesInternational/Regional ($'05/boe)
Coal 18 9 19 22 24 27 30 -6,6% 7,6% 1,4% 0,7% 1,5% 0,9%Oil 33 32 72 96 114 143 178 -0,2% 8,3% 3,0% 1,7% 2,3% 2,2%Gas 18 21 31 38 46 59 71 1,4% 4,0% 2,1% 2,1% 2,5% 1,9%
GHG emissions (Mt CO2 eq.)Total GHG (excl. LULUCF) 3 3 3 4 4 4 4 -0,3% 0,0% 2,5% 0,0% 0,1% 0,5%CO2 2 2 2 3 3 3 3 0,7% -0,6% 4,3% -0,1% 0,1% 0,6%CH4 0 0 1 0 0 0 0 0,7% 0,4% -1,9% 0,1% 0,3% 0,4%N2O 0 0 0 0 0 0 0 -0,7% -0,6% 0,3% -0,1% -0,6% -0,2%F gases 0 0 0 0 0 0 0 -9,0% 5,2% -2,6% 0,9% 0,7% -0,1%Total GHG from Energy and Industry 3 2 2 3 3 3 4 -0,2% 0,0% 3,1% 0,0% 0,1% 0,5%CO2 Emissions from Fuel Comb. 2 2 2 3 3 3 3 0,7% -0,3% 4,2% -0,1% 0,1% 0,6%
Power generation/District heating 0 0 0 1 1 1 2 0,0% 0,0% n.s. 1,2% 4,8% 2,5%Industry 0 1 0 0 0 0 0 3,1% -2,4% -5,7% -2,1% -1,5% -1,8%Buildings 0 0 0 0 0 0 0 -4,8% -7,5% 16,7% 2,9% 3,3% 2,9%Agriculture 1 1 1 1 1 1 1 1,0% -2,2% 0,6% 0,0% -0,1% -0,4%Transport 1 1 1 1 1 1 1 -0,8% 2,9% 3,4% -0,8% -4,9% -3,0%Other 0 0 0 0 0 0 0 -7,7% 5,4% 6,6% 3,6% 6,2% 2,8%
CO2 captured (CCS) 0 0 0 0 0 0 0 n.s. n.s. n.s. n.s. n.s. 15,9%Coal 0 0 0 0 0 0 0 n.s. n.s. n.s. n.s. n.s. 15,3%Gas 0 0 0 0 0 0 0 n.s. n.s. n.s. n.s. n.s. n.s.Biomass 0 0 0 0 0 0 0 n.s. n.s. n.s. n.s. n.s. n.s.
Energy Balance, by fuel (Mtoe)Primary Production 1 2 5 6 8 8 8 10,5% 12,0% 1,9% 2,5% -0,1% 0,1%
Coal 0 0 0 0 0 0 0 n.s. n.s. n.s. n.s. n.s. n.s.Oil 0 0 0 0 0 0 0 n.s. n.s. n.s. n.s. n.s. n.s.Natural gas 0 0 0 0 0 0 0 n.s. n.s. n.s. n.s. n.s. n.s.Biomass 0 0 0 0 0 1 1 n.s. n.s. -5,5% 10,1% 1,8% 0,5%Nuclear1 0 0 0 0 0 0 0 n.s. n.s. n.s. n.s. 11,5% 9,3%Hydro 0 1 1 1 1 1 1 4,2% 7,1% 0,1% 0,2% 0,2% 0,2%Other renewables 0 1 4 5 6 6 6 16,0% 12,9% 2,8% 2,5% -0,3% 0,0%
Net Imports 1 1 1 1 1 1 1Coal 0 0 0 0 0 0 0Oil 1 1 1 1 1 1 0Natural gas 0 0 0 0 0 0 1Biomass 0 0 0 0 0 0 0Biofuels 0 0 0 0 0 0 0Electricity 0 0 0 0 0 0 0
Primary Energy Demand2 1 2 6 7 9 9 9 6,9% 9,6% 1,9% 2,0% 0,0% 0,3%Coal 0 0 0 0 0 0 0 4,5% -1,0% 5,4% 1,1% -0,5% -0,6%Oil 1 1 1 1 1 1 0 1,6% 2,0% 0,0% -1,5% -3,2% -2,1%Natural gas 0 0 0 0 0 0 1 n.s. n.s. n.s. 4,8% 12,0% 4,5%Biomass 0 0 0 0 0 1 1 n.s. n.s. -4,9% 9,6% 2,3% 1,9%Nuclear1 0 0 0 0 0 0 0 n.s. n.s. n.s. n.s. 11,5% 9,3%Hydro 0 1 1 1 1 1 1 4,2% 7,1% 0,1% 0,2% 0,2% 0,2%Other renewables 0 1 4 5 6 6 6 16,0% 12,9% 2,8% 2,5% -0,3% 0,0%
Primary Energy Demand, by sector (Mtoe)Primary Energy Demand 1 2 6 7 9 9 9 6,9% 9,6% 1,9% 2,0% 0,0% 0,3%Energy for Power Generation 1 2 5 7 9 9 9 10,8% 11,4% 2,7% 2,1% 0,1% 0,3%Other Transformation & Losses 0 1 1 1 2 2 2 4,0% 10,3% -0,3% 2,1% 1,7% 1,1%Energy Branch Consumption 0 0 0 0 0 0 0 8,3% 3,6% 1,6% 1,4% 0,5% 0,3%Final consumption 2 2 3 3 3 3 4 2,5% 4,1% -0,4% 1,0% 0,4% 0,4%
Steel, Non-Met. Minerals and Chem. 0 0 0 0 0 0 0 3,9% -1,0% -4,7% -2,1% -1,5% -1,0%Other Industry 0 1 1 1 2 2 2 6,3% 8,4% 1,3% 1,4% 1,0% 0,5%Non-Energy Use 0 0 0 0 0 0 0 6,8% 10,3% -4,8% 0,3% 0,0% -0,5%Residential 1 1 1 0 0 0 0 0,4% -1,7% -2,8% 0,5% 0,8% 0,7%Services 0 0 0 0 0 0 0 4,0% 4,5% -1,3% 1,1% 1,9% 1,9%Agriculture 0 0 0 0 0 0 0 1,0% -1,9% 1,0% 0,9% 0,9% 0,9%Road 0 0 0 0 1 0 0 0,9% 8,2% 0,6% 1,5% -2,4% -0,6%Rail 0 0 0 0 0 0 0 n.s. n.s. n.s. n.s. n.s. n.s.Aviation 0 0 0 0 0 0 0 -2,0% -1,2% -1,8% 0,8% 0,8% 0,8%Other Transport 0 0 0 0 0 0 0 -12,4% 8,2% -0,1% 0,3% 0,6% 0,7%
1 Primary energy from nuclear is calculated considering the primary heat equivalent of the electricity produced with an average efficiency of 33%
25

GECO2015 Baseline 150504 SUMMARY GHG & ENERGY BALANCE##### 100
Iceland 1990 2000 2010 2020 2030 2040 2050 '90-'00 '00-'10 '10-'20 '20-'30 '30-'40 '40-'50Power Generation
Fuel Inputs Therm. Power (Mtoe) 0 0 0 1 1 1 1 15,7% 12,9% 7,0% 2,3% 2,0% 1,5%Coal 0 0 0 0 0 0 0 n.s. n.s. n.s. 2,0% -0,7% -1,5%Oil 0 0 0 0 0 0 0 0,0% 0,0% 44,4% -9,1% n.s. n.s.Gas 0 0 0 0 0 0 1 n.s. n.s. n.s. 3,8% 13,8% 4,7%Biomass & Waste 0 0 0 0 0 0 0 n.s. n.s. n.s. 6,9% 1,7% 0,6%Other 0 0 0 1 1 1 1 16,0% 12,9% 2,7% 2,4% -0,4% 0,0%
Gross Elec. Generation (TWh e) 5 8 17 20 23 26 28 5,5% 8,3% 1,8% 1,4% 1,1% 0,7%Coal 0 0 0 1 1 1 1 n.s. n.s. n.s. 2,2% -0,5% -1,4%
of which CCS 0 0 0 0 0 0 0 n.s. n.s. n.s. n.s. n.s. 12,6%Oil 0 0 0 0 0 0 0 -1,8% -8,8% 56,7% -9,2% n.s. n.s.Gas 0 0 0 0 1 2 3 n.s. n.s. n.s. 4,1% 13,7% 4,7%
of which CCS 0 0 0 0 0 0 0 n.s. n.s. n.s. n.s. n.s. n.s.Biomass & Waste 0 0 0 0 0 0 0 n.s. n.s. n.s. 7,3% 2,0% 1,0%
of which CCS 0 0 0 0 0 0 0 n.s. n.s. n.s. n.s. n.s. n.s.Nuclear 0 0 0 0 0 0 0 n.s. n.s. n.s. n.s. n.s. n.s.Hydro 4 6 13 13 13 13 13 4,2% 7,1% 0,1% 0,2% 0,2% 0,2%Wind 0 0 0 1 1 3 3 n.s. n.s. n.s. 9,8% 6,2% 1,2%Solar 0 0 0 0 0 0 0 n.s. n.s. n.s. 15,3% 6,5% 3,2%Other 0 1 4 6 7 7 7 16,0% 12,9% 2,7% 2,4% -0,4% 0,2%
Generation Capacity (GWe) 1 1 3 4 6 7 8 3,9% 6,6% 5,5% 2,3% 2,4% 0,8%Coal 0 0 0 0 0 0 0 n.s. n.s. n.s. 1,1% 0,5% -0,5%
of which CCS 0 0 0 0 0 0 0 n.s. n.s. n.s. n.s. n.s. 10,8%Oil 0 0 0 0 0 0 0 0,4% 0,1% 8,9% 0,0% 0,0% -1,3%Gas 0 0 0 0 0 1 1 n.s. n.s. n.s. 5,4% 14,1% 4,1%
of which CCS 0 0 0 0 0 0 0 n.s. n.s. n.s. n.s. n.s. n.s.Biomass & Waste 0 0 0 0 0 0 0 n.s. n.s. n.s. 6,7% 3,9% 2,1%
of which CCS 0 0 0 0 0 0 0 n.s. n.s. n.s. n.s. n.s. n.s.Nuclear 0 0 0 0 0 0 0 n.s. n.s. n.s. n.s. n.s. n.s.Hydro 1 1 2 2 2 2 2 3,5% 5,9% 0,2% 0,2% 0,2% 0,2%Wind 0 0 0 0 1 1 1 n.s. n.s. n.s. 9,8% 6,1% 1,2%Solar 0 0 0 0 0 0 0 n.s. n.s. n.s. 15,3% 6,5% 3,2%Other 0 0 1 2 2 2 2 14,3% 12,8% 10,9% 2,9% 1,4% -0,1%
Total Final Consumption 2 (Mtoe) 2 2 3 3 3 3 4 2,5% 4,1% -0,4% 1,0% 0,4% 0,4%Coal 0 0 0 0 0 0 0 4,5% -1,0% -9,9% -3,6% -0,8% 0,2%Oil 1 1 1 1 1 1 0 1,6% 2,0% -0,5% -1,2% -3,0% -2,1%Gas 0 0 0 0 0 0 0 n.s. n.s. n.s. 9,1% 4,5% 2,9%Electricity 0 1 1 2 2 2 2 5,9% 8,6% 1,8% 1,4% 1,1% 0,8%Heat 1 1 1 0 0 0 0 1,0% -0,9% -4,8% 0,4% 0,5% -0,2%Biomass & Other 0 0 0 0 0 0 0 n.s. n.s. -5,5% 9,4% 2,4% 2,3%Share of Renewables 3 (%) 28% 36% 58% 61% 67% 69% 70% 2,2% 5,0% 0,5% 0,9% 0,4% 0,1%
Industry (incl. non-energy use) 0 1 2 2 2 2 2 5,8% 7,1% -0,2% 1,0% 0,8% 0,3%Coal 0 0 0 0 0 0 0 4,5% -1,0% -9,9% -3,6% -0,8% 0,2%Oil 0 0 0 0 0 0 0 4,5% 4,6% -6,2% -3,5% -3,6% -4,4%Gas 0 0 0 0 0 0 0 n.s. n.s. n.s. 7,5% 2,4% -0,3%Electricity 0 0 1 1 2 2 2 7,4% 10,1% 1,3% 1,3% 1,0% 0,5%Heat 0 0 0 0 0 0 0 2,4% -4,8% 0,0% -0,2% -0,3% -0,2%Biomass & Other 0 0 0 0 0 0 0 n.s. n.s. n.s. 11,3% 3,6% 1,6%
Buildings 1 1 1 1 1 1 1 1,0% -0,2% -2,3% 0,7% 1,2% 1,2%Coal 0 0 0 0 0 0 0 n.s. n.s. n.s. n.s. n.s. n.s.Oil 0 0 0 0 0 0 0 -4,8% -7,5% 12,4% -2,5% -0,4% 0,7%Gas 0 0 0 0 0 0 0 n.s. n.s. n.s. 9,8% 5,2% 3,7%Electricity 0 0 0 0 0 0 0 2,4% 1,6% 3,4% 0,1% 1,3% 1,9%Heat 1 1 1 0 0 0 0 0,9% -0,6% -5,2% 0,5% 0,6% -0,2%Biomass & Other 0 0 0 0 0 0 0 n.s. n.s. n.s. 9,7% 4,5% 5,5%
Agriculture 0 0 0 0 0 0 0 1,0% -1,9% 1,0% 0,9% 0,9% 0,9%Coal 0 0 0 0 0 0 0 n.s. n.s. n.s. n.s. n.s. n.s.Oil 0 0 0 0 0 0 0 1,0% -2,2% 0,6% 0,0% -0,1% -0,4%Gas 0 0 0 0 0 0 0 n.s. n.s. n.s. n.s. n.s. n.s.Electricity 0 0 0 0 0 0 0 0,9% 1,1% 1,9% 2,0% 2,4% 2,5%Heat 0 0 0 0 0 0 0 n.s. n.s. n.s. n.s. n.s. n.s.Biomass & Other 0 0 0 0 0 0 0 n.s. n.s. n.s. 12,0% 6,4% 4,7%
Transport 0 0 0 0 1 0 0 0,0% 8,0% 0,6% 1,5% -2,3% -0,6%Coal 0 0 0 0 0 0 0 n.s. n.s. n.s. n.s. n.s. n.s.Oil 0 0 0 0 0 0 0 0,0% 2,9% 3,4% -0,8% -4,9% -2,9%Gas 0 0 0 0 0 0 0 n.s. n.s. n.s. n.s. n.s. n.s.Electricity 0 0 0 0 0 0 0 n.s. n.s. n.s. 9,0% 3,3% 2,0%Heat 0 0 0 0 0 0 0 n.s. n.s. n.s. n.s. n.s. n.s.Biomass & Other 0 0 0 0 0 0 0 n.s. n.s. -11,5% 7,7% -0,4% 0,6%
Energy Branch Consumption 0 0 0 0 0 0 0 8,3% 3,6% 1,6% 1,4% 0,5% 0,3%Other Transformation & Losses 4 0 1 1 1 2 2 2 4,0% 10,3% -0,3% 2,1% 1,7% 1,1%
2 does not include international aviation and maritime bunkers; includes non-energy uses3 ratio of renewable energy over final energy demand increased by distribution losses and self consumption of electricity and steam plants4 includes statistical differences
26
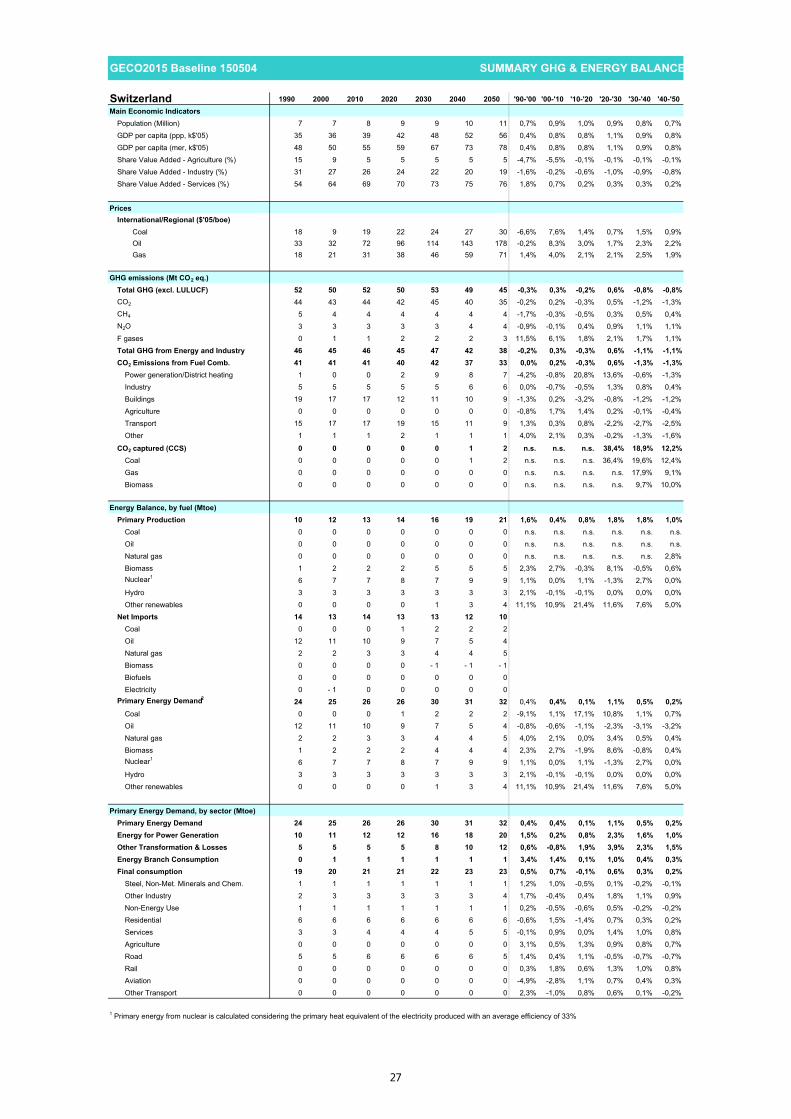
GECO2015 Baseline 150504 SUMMARY GHG & ENERGY BALANCE##### 100
Switzerland 1990 2000 2010 2020 2030 2040 2050 '90-'00 '00-'10 '10-'20 '20-'30 '30-'40 '40-'50Main Economic Indicators
Population (Million) 7 7 8 9 9 10 11 0,7% 0,9% 1,0% 0,9% 0,8% 0,7%GDP per capita (ppp, k$'05) 35 36 39 42 48 52 56 0,4% 0,8% 0,8% 1,1% 0,9% 0,8%GDP per capita (mer, k$'05) 48 50 55 59 67 73 78 0,4% 0,8% 0,8% 1,1% 0,9% 0,8%Share Value Added - Agriculture (%) 15 9 5 5 5 5 5 -4,7% -5,5% -0,1% -0,1% -0,1% -0,1%Share Value Added - Industry (%) 31 27 26 24 22 20 19 -1,6% -0,2% -0,6% -1,0% -0,9% -0,8%Share Value Added - Services (%) 54 64 69 70 73 75 76 1,8% 0,7% 0,2% 0,3% 0,3% 0,2%
PricesInternational/Regional ($'05/boe)
Coal 18 9 19 22 24 27 30 -6,6% 7,6% 1,4% 0,7% 1,5% 0,9%Oil 33 32 72 96 114 143 178 -0,2% 8,3% 3,0% 1,7% 2,3% 2,2%Gas 18 21 31 38 46 59 71 1,4% 4,0% 2,1% 2,1% 2,5% 1,9%
GHG emissions (Mt CO2 eq.)Total GHG (excl. LULUCF) 52 50 52 50 53 49 45 -0,3% 0,3% -0,2% 0,6% -0,8% -0,8%CO2 44 43 44 42 45 40 35 -0,2% 0,2% -0,3% 0,5% -1,2% -1,3%CH4 5 4 4 4 4 4 4 -1,7% -0,3% -0,5% 0,3% 0,5% 0,4%N2O 3 3 3 3 3 4 4 -0,9% -0,1% 0,4% 0,9% 1,1% 1,1%F gases 0 1 1 2 2 2 3 11,5% 6,1% 1,8% 2,1% 1,7% 1,1%Total GHG from Energy and Industry 46 45 46 45 47 42 38 -0,2% 0,3% -0,3% 0,6% -1,1% -1,1%CO2 Emissions from Fuel Comb. 41 41 41 40 42 37 33 0,0% 0,2% -0,3% 0,6% -1,3% -1,3%
Power generation/District heating 1 0 0 2 9 8 7 -4,2% -0,8% 20,8% 13,6% -0,6% -1,3%Industry 5 5 5 5 5 6 6 0,0% -0,7% -0,5% 1,3% 0,8% 0,4%Buildings 19 17 17 12 11 10 9 -1,3% 0,2% -3,2% -0,8% -1,2% -1,2%Agriculture 0 0 0 0 0 0 0 -0,8% 1,7% 1,4% 0,2% -0,1% -0,4%Transport 15 17 17 19 15 11 9 1,3% 0,3% 0,8% -2,2% -2,7% -2,5%Other 1 1 1 2 1 1 1 4,0% 2,1% 0,3% -0,2% -1,3% -1,6%
CO2 captured (CCS) 0 0 0 0 0 1 2 n.s. n.s. n.s. 38,4% 18,9% 12,2%Coal 0 0 0 0 0 1 2 n.s. n.s. n.s. 36,4% 19,6% 12,4%Gas 0 0 0 0 0 0 0 n.s. n.s. n.s. n.s. 17,9% 9,1%Biomass 0 0 0 0 0 0 0 n.s. n.s. n.s. n.s. 9,7% 10,0%
Energy Balance, by fuel (Mtoe)Primary Production 10 12 13 14 16 19 21 1,6% 0,4% 0,8% 1,8% 1,8% 1,0%
Coal 0 0 0 0 0 0 0 n.s. n.s. n.s. n.s. n.s. n.s.Oil 0 0 0 0 0 0 0 n.s. n.s. n.s. n.s. n.s. n.s.Natural gas 0 0 0 0 0 0 0 n.s. n.s. n.s. n.s. n.s. 2,8%Biomass 1 2 2 2 5 5 5 2,3% 2,7% -0,3% 8,1% -0,5% 0,6%Nuclear1 6 7 7 8 7 9 9 1,1% 0,0% 1,1% -1,3% 2,7% 0,0%Hydro 3 3 3 3 3 3 3 2,1% -0,1% -0,1% 0,0% 0,0% 0,0%Other renewables 0 0 0 0 1 3 4 11,1% 10,9% 21,4% 11,6% 7,6% 5,0%
Net Imports 14 13 14 13 13 12 10Coal 0 0 0 1 2 2 2Oil 12 11 10 9 7 5 4Natural gas 2 2 3 3 4 4 5Biomass 0 0 0 0 - 1 - 1 - 1Biofuels 0 0 0 0 0 0 0Electricity 0 - 1 0 0 0 0 0
Primary Energy Demand2 24 25 26 26 30 31 32 0,4% 0,4% 0,1% 1,1% 0,5% 0,2%Coal 0 0 0 1 2 2 2 -9,1% 1,1% 17,1% 10,8% 1,1% 0,7%Oil 12 11 10 9 7 5 4 -0,8% -0,6% -1,1% -2,3% -3,1% -3,2%Natural gas 2 2 3 3 4 4 5 4,0% 2,1% 0,0% 3,4% 0,5% 0,4%Biomass 1 2 2 2 4 4 4 2,3% 2,7% -1,9% 8,6% -0,8% 0,4%Nuclear1 6 7 7 8 7 9 9 1,1% 0,0% 1,1% -1,3% 2,7% 0,0%Hydro 3 3 3 3 3 3 3 2,1% -0,1% -0,1% 0,0% 0,0% 0,0%Other renewables 0 0 0 0 1 3 4 11,1% 10,9% 21,4% 11,6% 7,6% 5,0%
Primary Energy Demand, by sector (Mtoe)Primary Energy Demand 24 25 26 26 30 31 32 0,4% 0,4% 0,1% 1,1% 0,5% 0,2%Energy for Power Generation 10 11 12 12 16 18 20 1,5% 0,2% 0,8% 2,3% 1,6% 1,0%Other Transformation & Losses 5 5 5 5 8 10 12 0,6% -0,8% 1,9% 3,9% 2,3% 1,5%Energy Branch Consumption 0 1 1 1 1 1 1 3,4% 1,4% 0,1% 1,0% 0,4% 0,3%Final consumption 19 20 21 21 22 23 23 0,5% 0,7% -0,1% 0,6% 0,3% 0,2%
Steel, Non-Met. Minerals and Chem. 1 1 1 1 1 1 1 1,2% 1,0% -0,5% 0,1% -0,2% -0,1%Other Industry 2 3 3 3 3 3 4 1,7% -0,4% 0,4% 1,8% 1,1% 0,9%Non-Energy Use 1 1 1 1 1 1 1 0,2% -0,5% -0,6% 0,5% -0,2% -0,2%Residential 6 6 6 6 6 6 6 -0,6% 1,5% -1,4% 0,7% 0,3% 0,2%Services 3 3 4 4 4 5 5 -0,1% 0,9% 0,0% 1,4% 1,0% 0,8%Agriculture 0 0 0 0 0 0 0 3,1% 0,5% 1,3% 0,9% 0,8% 0,7%Road 5 5 6 6 6 6 5 1,4% 0,4% 1,1% -0,5% -0,7% -0,7%Rail 0 0 0 0 0 0 0 0,3% 1,8% 0,6% 1,3% 1,0% 0,8%Aviation 0 0 0 0 0 0 0 -4,9% -2,8% 1,1% 0,7% 0,4% 0,3%Other Transport 0 0 0 0 0 0 0 2,3% -1,0% 0,8% 0,6% 0,1% -0,2%
1 Primary energy from nuclear is calculated considering the primary heat equivalent of the electricity produced with an average efficiency of 33%
27

GECO2015 Baseline 150504 SUMMARY GHG & ENERGY BALANCE##### 100
Switzerland 1990 2000 2010 2020 2030 2040 2050 '90-'00 '00-'10 '10-'20 '20-'30 '30-'40 '40-'50Power Generation
Fuel Inputs Therm. Power (Mtoe) 1 1 1 1 4 4 4 2,3% 2,4% -1,8% 15,4% -1,9% 0,7%Coal 0 0 0 0 2 2 2 n.s. n.s. n.s. 13,0% 0,1% -0,1%Oil 0 0 0 0 0 0 0 -12,5% -9,2% n.s. n.s. -15,3% -14,2%Gas 0 0 0 0 1 1 1 5,4% 0,9% 6,1% 14,7% 0,5% 1,8%Biomass & Waste 1 1 1 0 2 1 1 3,7% 2,8% -12,0% 18,5% -6,3% 0,6%Other 0 0 0 0 0 0 0 n.s. n.s. n.s. n.s. n.s. n.s.
Gross Elec. Generation (TWh e) 56 68 68 76 96 116 133 1,9% 0,1% 1,1% 2,4% 1,9% 1,4%Coal 0 0 0 2 8 8 8 n.s. n.s. n.s. 13,1% 0,5% 0,1%
of which CCS 0 0 0 0 0 1 3 n.s. n.s. n.s. n.s. 25,5% 13,4%Oil 0 0 0 0 0 0 0 -5,2% -11,1% n.s. n.s. -15,4% -14,1%Gas 0 1 1 1 5 6 7 10,0% 2,0% 3,6% 13,9% 1,0% 2,1%
of which CCS 0 0 0 0 0 0 0 n.s. n.s. n.s. n.s. 19,4% 10,3%Biomass & Waste 1 2 2 1 6 3 4 8,1% 3,3% -7,8% 19,1% -6,0% 1,0%
of which CCS 0 0 0 0 0 0 0 n.s. n.s. n.s. n.s. n.s. n.s.Nuclear 24 26 26 30 27 35 35 1,1% 0,0% 1,2% -1,0% 2,8% 0,0%Hydro 31 38 38 37 37 37 37 2,1% -0,1% -0,1% 0,0% 0,0% 0,0%Wind 0 0 0 2 9 18 29 n.s. 42,0% 37,6% 13,5% 7,7% 4,8%Solar 0 0 0 1 4 7 12 21,3% 22,0% 28,8% 8,9% 7,2% 5,5%Other 0 0 0 0 0 0 0 n.s. n.s. n.s. n.s. 21,8% 14,0%
Generation Capacity (GWe) 16 19 20 26 32 43 53 1,5% 0,5% 2,8% 2,3% 2,8% 2,2%Coal 0 0 0 1 2 2 3 n.s. n.s. 26,4% 6,0% 3,0% 1,2%
of which CCS 0 0 0 0 0 0 1 n.s. n.s. n.s. n.s. 26,8% 15,8%Oil 0 0 0 1 1 1 1 5,2% 5,3% 11,9% 3,4% 0,3% 1,6%Gas 0 0 0 1 2 3 4 8,7% 2,0% 13,6% 5,9% 4,6% 3,5%
of which CCS 0 0 0 0 0 0 0 n.s. n.s. n.s. n.s. 20,6% 12,3%Biomass & Waste 0 0 0 2 2 3 2 6,9% 2,8% 15,6% 4,0% 1,1% -1,9%
of which CCS 0 0 0 0 0 0 0 n.s. n.s. n.s. n.s. n.s. n.s.Nuclear 3 3 3 4 3 4 4 0,8% 0,2% 1,8% -1,5% 2,8% 0,1%Hydro 13 15 15 15 15 15 15 1,4% 0,3% 0,0% 0,0% 0,0% 0,0%Wind 0 0 0 1 4 8 12 n.s. 31,2% 37,8% 13,4% 7,6% 4,7%Solar 0 0 0 1 3 7 11 21,3% 22,0% 28,8% 8,9% 7,2% 5,5%Other 0 0 0 0 0 0 0 n.s. n.s. n.s. n.s. 21,2% 13,4%
Total Final Consumption 2 (Mtoe) 19 20 21 21 22 23 23 0,5% 0,7% -0,1% 0,6% 0,3% 0,2%Coal 0 0 0 0 0 1 1 -8,8% 1,1% 5,5% 6,0% 3,8% 2,2%Oil 12 11 11 10 8 6 5 -0,2% -0,3% -1,1% -2,1% -2,6% -2,6%Gas 1 2 3 3 3 3 3 3,9% 2,3% -0,5% 1,3% 0,4% -0,1%Electricity 4 5 5 6 7 9 10 1,1% 1,3% 1,1% 2,4% 1,9% 1,5%Heat 0 0 1 1 1 1 2 3,1% 5,0% 1,4% 3,0% 3,0% 2,1%Biomass & Other 1 1 1 2 2 3 3 1,2% 2,4% 2,4% 4,1% 0,9% 0,2%Share of Renewables 3 (%) 18% 21% 21% 24% 31% 35% 41% 1,5% 0,0% 1,0% 2,6% 1,4% 1,6%
Industry (incl. non-energy use) 4 4 4 4 5 5 6 1,3% 0,0% 0,0% 1,2% 0,6% 0,6%Coal 0 0 0 0 0 1 1 -9,0% 1,0% 5,9% 6,2% 3,8% 2,3%Oil 1 1 1 1 1 1 1 1,2% -1,8% -2,2% -0,9% -2,0% -2,5%Gas 1 1 1 1 1 1 1 2,3% 1,5% -0,4% 0,2% -0,3% -0,4%Electricity 1 2 2 2 2 3 3 0,5% 0,6% 1,2% 1,9% 1,4% 1,2%Heat 0 0 0 0 0 0 0 10,6% 1,7% 0,0% -0,2% -0,3% -0,2%Biomass & Other 0 0 0 0 0 0 0 11,0% -0,1% -1,2% 0,8% -0,4% 0,7%
Buildings 9 9 10 9 10 11 11 -0,4% 1,2% -0,9% 1,0% 0,6% 0,5%Coal 0 0 0 0 0 0 0 -4,5% 3,1% -4,2% -5,7% -6,8% n.s.Oil 5 4 4 3 2 2 1 -2,1% -0,5% -4,1% -2,3% -2,8% -2,8%Gas 1 1 2 2 2 2 2 3,8% 2,7% -0,7% 2,0% 0,8% 0,1%Electricity 2 3 3 3 4 5 5 1,6% 1,7% 0,9% 1,7% 1,5% 1,3%Heat 0 0 1 1 1 1 2 0,8% 6,3% 1,8% 3,7% 3,6% 2,4%Biomass & Other 1 0 1 1 1 1 1 -3,4% 3,9% 2,7% 2,3% -0,4% -0,9%
Agriculture 0 0 0 0 0 0 0 3,1% 0,5% 1,3% 0,9% 0,8% 0,7%Coal 0 0 0 0 0 0 0 n.s. n.s. n.s. n.s. n.s. n.s.Oil 0 0 0 0 0 0 0 n.s. n.s. n.s. n.s. n.s. n.s.Gas 0 0 0 0 0 0 0 n.s. 1,7% 1,4% 0,2% -0,1% -0,4%Electricity 0 0 0 0 0 0 0 1,2% 0,1% 1,1% 1,5% 1,4% 1,3%Heat 0 0 0 0 0 0 0 n.s. n.s. n.s. n.s. n.s. n.s.Biomass & Other 0 0 0 0 0 0 0 40,5% -5,0% 2,0% 3,4% 3,2% 3,0%
Transport 5 6 6 7 7 6 6 1,2% 0,4% 1,1% -0,4% -0,6% -0,5%Coal 0 0 0 0 0 0 0 n.s. n.s. n.s. n.s. n.s. n.s.Oil 5 6 6 6 5 4 3 1,3% 0,2% 0,8% -2,2% -2,7% -2,5%Gas 0 0 0 0 0 0 0 n.s. n.s. n.s. n.s. n.s. n.s.Electricity 0 0 0 0 1 1 2 0,3% 1,9% 3,4% 8,7% 4,7% 2,7%Heat 0 0 0 0 0 0 0 n.s. n.s. n.s. n.s. n.s. n.s.Biomass & Other 0 0 0 0 1 1 1 n.s. n.s. 15,3% 14,1% 3,5% 1,1%
Energy Branch Consumption 0 1 1 1 1 1 1 3,4% 1,4% 0,1% 1,0% 0,4% 0,3%Other Transformation & Losses 4 5 5 5 5 8 10 12 0,6% -0,8% 1,9% 3,9% 2,3% 1,5%
2 does not include international aviation and maritime bunkers; includes non-energy uses3 ratio of renewable energy over final energy demand increased by distribution losses and self consumption of electricity and steam plants4 includes statistical differences
28

GECO2015 Baseline 150504 SUMMARY GHG & ENERGY BALANCE##### 100
Russia 1990 2000 2010 2020 2030 2040 2050 '90-'00 '00-'10 '10-'20 '20-'30 '30-'40 '40-'50Main Economic Indicators
Population (Million) 148 147 144 140 134 127 121 -0,1% -0,2% -0,3% -0,5% -0,5% -0,5%GDP per capita (ppp, k$'05) 13 9 14 19 26 33 34 -3,8% 5,1% 3,1% 3,3% 2,1% 0,5%GDP per capita (mer, k$'05) 6 4 6 9 12 15 15 -3,8% 5,1% 3,1% 3,3% 2,1% 0,5%Share Value Added - Agriculture (%) 17 6 4 4 3 3 3 -9,0% -5,0% -0,7% -0,7% -0,4% -0,1%Share Value Added - Industry (%) 48 38 35 35 32 31 30 -2,4% -0,9% 0,0% -0,7% -0,6% -0,2%Share Value Added - Services (%) 35 56 61 62 64 66 67 4,7% 1,0% 0,0% 0,4% 0,3% 0,1%
PricesInternational/Regional ($'05/boe)
Coal 18 9 19 22 24 27 30 -6,6% 7,6% 1,4% 0,7% 1,5% 0,9%Oil 33 32 72 96 114 143 178 -0,2% 8,3% 3,0% 1,7% 2,3% 2,2%Gas 18 21 31 38 46 59 71 1,4% 4,0% 2,1% 2,1% 2,5% 1,9%
GHG emissions (Mt CO2 eq.)Total GHG (excl. LULUCF) 3 331 2 175 2 275 2 375 2 527 2 503 2 231 -4,2% 0,4% 0,4% 0,6% -0,1% -1,1%CO2 2 489 1 605 1 662 1 747 1 886 1 855 1 618 -4,3% 0,4% 0,5% 0,8% -0,2% -1,4%CH4 588 433 488 486 490 496 465 -3,0% 1,2% 0,0% 0,1% 0,1% -0,6%N2O 213 109 110 119 119 116 112 -6,5% 0,2% 0,8% 0,0% -0,3% -0,4%F gases 41 29 14 23 30 35 36 -3,5% -6,9% 4,9% 2,9% 1,5% 0,2%Total GHG from Energy and Industry 3 013 2 022 2 133 2 225 2 378 2 360 2 093 -3,9% 0,5% 0,4% 0,7% -0,1% -1,2%CO2 Emissions from Fuel Comb. 2 285 1 478 1 520 1 596 1 751 1 740 1 520 -4,3% 0,3% 0,5% 0,9% -0,1% -1,3%
Power generation/District heating 807 594 579 589 688 723 649 -3,0% -0,3% 0,2% 1,6% 0,5% -1,1%Industry 229 176 203 218 216 200 173 -2,6% 1,4% 0,7% -0,1% -0,8% -1,4%Buildings 336 170 138 130 133 116 79 -6,6% -2,1% -0,6% 0,3% -1,4% -3,8%Agriculture 49 21 14 15 17 18 19 -8,3% -4,1% 1,2% 1,1% 0,7% 0,2%Transport 229 127 170 201 221 216 198 -5,7% 2,9% 1,7% 1,0% -0,2% -0,9%Other 634 391 418 443 475 467 402 -4,7% 0,7% 0,6% 0,7% -0,2% -1,5%
CO2 captured (CCS) 0 0 0 0 0 0 0 n.s. n.s. n.s. 20,6% -0,2% -0,2%Coal 0 0 0 0 0 0 0 n.s. n.s. n.s. 20,6% -0,2% -0,1%Gas 0 0 0 0 0 0 0 n.s. n.s. n.s. 20,5% -0,3% -0,3%Biomass 0 0 0 0 0 0 0 n.s. n.s. n.s. 20,5% -0,2% -0,1%
Energy Balance, by fuel (Mtoe)Primary Production 1 228 961 1 266 1 370 1 656 2 117 2 406 -2,4% 2,8% 0,8% 1,9% 2,5% 1,3%
Coal 140 111 155 187 292 645 984 -2,3% 3,5% 1,9% 4,6% 8,2% 4,3%Oil 510 325 511 531 492 444 387 -4,4% 4,6% 0,4% -0,8% -1,0% -1,4%Natural gas 524 472 536 579 767 890 864 -1,0% 1,3% 0,8% 2,9% 1,5% -0,3%Biomass 8 5 4 9 28 44 59 -5,5% -1,0% 8,2% 11,6% 4,6% 3,0%Nuclear1 31 35 45 47 57 67 73 1,0% 2,7% 0,4% 2,1% 1,6% 0,8%Hydro 14 14 14 15 16 17 18 0,0% 0,2% 0,4% 0,4% 0,7% 0,8%Other renewables 0 0 0 1 3 11 20 7,6% 24,2% 11,9% 9,5% 12,6% 6,3%
Net Imports - 349 - 344 - 568 - 636 - 849 -1 307 -1 682Coal 39 9 - 41 - 62 - 138 - 457 - 768Oil - 249 - 199 - 372 - 365 - 317 - 280 - 251Natural gas - 138 - 154 - 153 - 206 - 388 - 560 - 649Biomass 0 0 0 - 1 - 3 - 4 - 9Biofuels 0 0 0 - 1 - 2 - 3 - 4Electricity - 1 - 1 - 2 - 1 - 1 - 1 - 1
Primary Energy Demand2 879 617 698 734 807 810 724 -3,5% 1,2% 0,5% 1,0% 0,0% -1,1%Coal 178 120 114 126 155 188 216 -3,9% -0,5% 1,0% 2,1% 1,9% 1,4%Oil 261 126 139 166 175 163 136 -7,0% 1,0% 1,8% 0,5% -0,7% -1,8%Natural gas 386 319 383 373 379 329 215 -1,9% 1,8% -0,3% 0,2% -1,4% -4,2%Biomass 8 5 4 9 25 40 50 -5,5% -1,0% 7,3% 11,6% 4,5% 2,4%Nuclear1 31 35 45 47 57 67 73 1,0% 2,7% 0,4% 2,1% 1,6% 0,8%Hydro 14 14 14 15 16 17 18 0,0% 0,2% 0,4% 0,4% 0,7% 0,8%Other renewables 0 0 0 1 3 11 20 7,6% 24,2% 11,9% 9,5% 12,6% 6,3%
Primary Energy Demand, by sector (Mtoe)Primary Energy Demand 879 617 698 734 807 810 724 -3,5% 1,2% 0,5% 1,0% 0,0% -1,1%Energy for Power Generation 328 254 274 276 316 334 311 -2,5% 0,8% 0,0% 1,4% 0,6% -0,7%Other Transformation & Losses 126 75 115 135 169 191 194 -5,0% 4,4% 1,6% 2,3% 1,3% 0,1%Energy Branch Consumption 184 152 159 164 177 170 139 -1,9% 0,4% 0,3% 0,8% -0,4% -2,0%Final consumption 605 400 416 451 483 480 440 -4,1% 0,4% 0,8% 0,7% -0,1% -0,9%
Steel, Non-Met. Minerals and Chem. 102 78 88 92 86 76 68 -2,7% 1,2% 0,5% -0,7% -1,2% -1,2%Other Industry 128 65 52 55 60 60 56 -6,5% -2,2% 0,5% 0,9% 0,1% -0,7%Non-Energy Use 40 36 60 72 80 79 69 -1,0% 5,2% 1,8% 1,0% -0,1% -1,3%Residential 168 140 111 109 107 102 89 -1,8% -2,3% -0,2% -0,2% -0,6% -1,4%Services 62 25 37 42 55 60 55 -8,7% 3,9% 1,4% 2,6% 1,0% -0,9%Agriculture 22 9 6 7 8 9 9 -8,3% -4,4% 1,4% 1,3% 0,9% 0,4%Road 55 34 48 58 70 77 78 -4,5% 3,4% 2,0% 1,9% 0,9% 0,2%Rail 12 5 7 7 7 7 7 -7,6% 2,1% 0,7% 0,5% 0,0% -0,6%Aviation 9 5 5 7 8 8 7 -6,9% 1,4% 2,3% 1,9% 0,2% -0,9%Other Transport 7 1 1 1 1 1 1 -14,7% -1,5% 1,0% 1,3% 0,0% -1,8%
1 Primary energy from nuclear is calculated considering the primary heat equivalent of the electricity produced with an average efficiency of 33%
29

GECO2015 Baseline 150504 SUMMARY GHG & ENERGY BALANCE##### 100
Russia 1990 2000 2010 2020 2030 2040 2050 '90-'00 '00-'10 '10-'20 '20-'30 '30-'40 '40-'50Power Generation
Fuel Inputs Therm. Power (Mtoe) 283 206 214 212 239 239 199 -3,1% 0,4% -0,1% 1,2% 0,0% -1,8%Coal 66 65 48 53 77 102 119 -0,2% -3,0% 1,0% 3,8% 2,9% 1,5%Oil 46 12 4 8 7 5 2 -12,6% -10,2% 6,8% -0,7% -3,0% -8,4%Gas 170 127 160 151 154 128 72 -2,9% 2,4% -0,6% 0,2% -1,8% -5,6%Biomass & Waste 0 2 2 0 1 3 6 29,4% 1,7% -21,3% 23,2% 8,9% 5,7%Other 0 0 0 0 0 0 0 7,6% 24,2% 9,7% 3,1% 0,4% 1,8%
Gross Elec. Generation (TWh e) 1 082 875 1 035 1 212 1 507 1 651 1 593 -2,1% 1,7% 1,6% 2,2% 0,9% -0,4%Coal 157 176 166 199 322 455 543 1,1% -0,6% 1,8% 4,9% 3,5% 1,8%
of which CCS 0 0 0 0 0 0 0 n.s. n.s. n.s. n.s. n.s. n.s.Oil 129 33 9 34 31 23 10 -12,7% -11,9% 13,9% -0,8% -3,0% -8,3%Gas 512 370 521 622 720 619 357 -3,2% 3,5% 1,8% 1,5% -1,5% -5,3%
of which CCS 0 0 0 0 0 0 0 n.s. n.s. n.s. n.s. n.s. n.s.Biomass & Waste 0 0 0 1 7 16 29 n.s. n.s. n.s. 23,9% 9,4% 6,1%
of which CCS 0 0 0 0 0 0 0 n.s. n.s. n.s. n.s. n.s. n.s.Nuclear 118 131 170 177 223 269 294 1,0% 2,7% 0,4% 2,3% 1,9% 0,9%Hydro 166 165 168 175 183 196 214 0,0% 0,2% 0,4% 0,4% 0,7% 0,8%Wind 0 0 0 3 17 58 110 n.s. 25,4% n.s. 20,9% 12,8% 6,7%Solar 0 0 0 0 3 12 33 n.s. n.s. n.s. 24,4% 15,7% 10,5%Other 0 0 1 1 2 2 3 7,6% 24,2% 9,7% 3,5% 1,7% 4,0%
Generation Capacity (GWe) 0 211 229 262 285 341 395 n.s. 0,8% 1,4% 0,8% 1,8% 1,5%Coal 0 42 42 39 50 72 90 n.s. 0,0% -0,7% 2,4% 3,8% 2,3%
of which CCS 0 0 0 0 0 0 0 n.s. n.s. n.s. n.s. n.s. n.s.Oil 0 16 16 14 7 7 6 n.s. 0,0% -1,3% -6,8% -0,1% -1,2%Gas 0 89 103 136 139 138 127 n.s. 1,5% 2,8% 0,2% 0,0% -0,8%
of which CCS 0 0 0 0 0 0 0 n.s. n.s. n.s. n.s. n.s. n.s.Biomass & Waste 0 0 0 0 1 2 4 n.s. n.s. n.s. 24,1% 9,7% 6,7%
of which CCS 0 0 0 0 0 0 0 n.s. n.s. n.s. n.s. n.s. n.s.Nuclear 0 20 23 23 29 34 36 n.s. 1,4% 0,3% 2,1% 1,7% 0,7%Hydro 0 44 45 48 50 54 59 n.s. 0,2% 0,7% 0,4% 0,7% 0,8%Wind 0 0 0 1 7 23 44 n.s. n.s. n.s. 20,7% 12,7% 6,6%Solar 0 0 0 0 2 10 26 n.s. n.s. n.s. 24,4% 15,6% 10,6%Other 0 0 0 0 0 0 0 n.s. 14,6% 8,2% 3,2% 1,1% 3,4%
Total Final Consumption 2 (Mtoe) 605 400 416 451 483 480 440 -4,1% 0,4% 0,8% 0,7% -0,1% -0,9%Coal 68 29 25 28 28 27 29 -8,3% -1,4% 1,2% -0,1% -0,2% 0,8%Oil 149 91 103 122 131 126 109 -4,8% 1,3% 1,7% 0,7% -0,4% -1,4%Gas 109 90 110 110 110 97 72 -1,9% 2,0% 0,0% 0,0% -1,2% -3,0%Electricity 68 50 60 71 88 97 93 -2,9% 1,8% 1,6% 2,2% 0,9% -0,3%Heat 203 137 115 113 111 111 110 -3,9% -1,8% -0,1% -0,2% 0,0% -0,1%Biomass & Other 8 3 2 7 15 22 26 -9,3% -2,8% 11,4% 8,5% 3,6% 1,7%Share of Renewables 3 (%) 6% 8% 7% 7% 9% 12% 17% 2,0% -0,9% 0,7% 2,2% 3,0% 3,1%
Industry (incl. non-energy use) 270 179 201 219 226 216 193 -4,0% 1,1% 0,9% 0,3% -0,5% -1,1%Coal 28 19 21 24 25 25 28 -3,9% 1,1% 1,6% 0,1% 0,0% 1,1%Oil 44 36 37 45 46 43 34 -2,0% 0,4% 1,9% 0,3% -0,8% -2,2%Gas 52 43 66 69 67 60 46 -1,9% 4,5% 0,4% -0,3% -1,2% -2,5%Electricity 41 27 28 32 39 41 38 -4,2% 0,5% 1,4% 1,9% 0,4% -0,7%Heat 105 55 48 47 46 44 42 -6,4% -1,4% -0,1% -0,3% -0,4% -0,3%Biomass & Other 0 1 0 2 3 4 5 n.s. -2,4% 12,5% 8,3% 2,0% 2,3%
Buildings 231 166 148 152 162 162 144 -3,3% -1,1% 0,2% 0,7% 0,0% -1,2%Coal 40 10 4 4 3 2 2 -13,1% -8,6% -1,1% -2,3% -2,6% -2,9%Oil 14 7 6 7 7 7 5 -7,0% -0,6% 0,4% 1,0% -1,1% -3,6%Gas 57 47 43 41 42 37 25 -1,9% -0,8% -0,7% 0,5% -1,3% -3,9%Electricity 15 18 26 31 39 42 39 1,7% 3,8% 1,8% 2,3% 0,8% -0,8%Heat 98 82 67 66 65 67 68 -1,7% -2,0% -0,1% -0,2% 0,3% 0,0%Biomass & Other 7 2 2 4 6 7 6 -10,8% -3,2% 8,7% 4,5% 1,3% -0,7%
Agriculture 22 9 6 7 8 9 9 -8,3% -4,4% 1,4% 1,3% 0,9% 0,4%Coal 1 0 0 0 0 0 0 -7,1% -11,4% 3,5% 0,0% 0,0% 0,0%Oil 14 6 4 4 5 5 5 -8,7% -4,2% 1,2% 1,2% 0,8% 0,2%Gas 1 1 1 1 1 1 1 -0,8% 0,9% 0,8% 1,0% 0,6% 0,0%Electricity 6 3 1 2 2 2 3 -7,7% -6,2% 2,1% 2,0% 1,6% 1,0%Heat 0 0 0 0 0 0 0 n.s. n.s. n.s. n.s. n.s. n.s.Biomass & Other 1 0 0 0 0 0 0 -15,8% 1,1% 1,4% 0,0% 0,0% 0,0%
Transport 82 46 61 73 87 94 94 -5,7% 3,0% 1,8% 1,8% 0,7% 0,0%Coal 0 0 0 0 0 0 0 n.s. n.s. n.s. n.s. n.s. n.s.Oil 77 42 56 66 73 71 65 -5,8% 2,8% 1,7% 1,0% -0,2% -0,9%Gas 0 0 0 0 0 0 0 n.s. n.s. n.s. n.s. n.s. n.s.Electricity 6 3 5 6 8 12 14 -5,5% 4,5% 1,3% 3,9% 3,3% 2,0%Heat 0 0 0 0 0 0 0 n.s. n.s. n.s. n.s. n.s. n.s.Biomass & Other 0 0 0 1 6 11 14 n.s. n.s. n.s. 17,0% 6,4% 2,7%
Energy Branch Consumption 184 152 159 164 177 170 139 -1,9% 0,4% 0,3% 0,8% -0,4% -2,0%Other Transformation & Losses 4 126 75 115 135 169 191 194 -5,0% 4,4% 1,6% 2,3% 1,3% 0,1%
2 does not include international aviation and maritime bunkers; includes non-energy uses3 ratio of renewable energy over final energy demand increased by distribution losses and self consumption of electricity and steam plants4 includes statistical differences
30
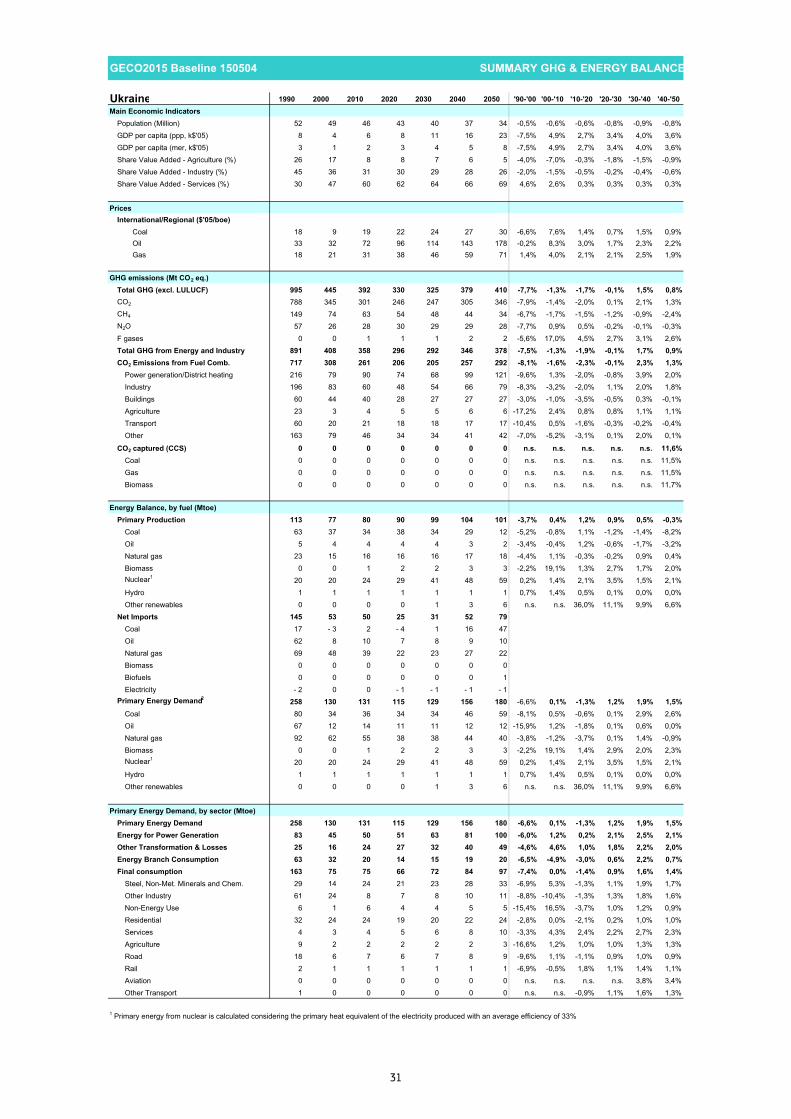
GECO2015 Baseline 150504 SUMMARY GHG & ENERGY BALANCE##### 100
Ukraine 1990 2000 2010 2020 2030 2040 2050 '90-'00 '00-'10 '10-'20 '20-'30 '30-'40 '40-'50Main Economic Indicators
Population (Million) 52 49 46 43 40 37 34 -0,5% -0,6% -0,6% -0,8% -0,9% -0,8%GDP per capita (ppp, k$'05) 8 4 6 8 11 16 23 -7,5% 4,9% 2,7% 3,4% 4,0% 3,6%GDP per capita (mer, k$'05) 3 1 2 3 4 5 8 -7,5% 4,9% 2,7% 3,4% 4,0% 3,6%Share Value Added - Agriculture (%) 26 17 8 8 7 6 5 -4,0% -7,0% -0,3% -1,8% -1,5% -0,9%Share Value Added - Industry (%) 45 36 31 30 29 28 26 -2,0% -1,5% -0,5% -0,2% -0,4% -0,6%Share Value Added - Services (%) 30 47 60 62 64 66 69 4,6% 2,6% 0,3% 0,3% 0,3% 0,3%
PricesInternational/Regional ($'05/boe)
Coal 18 9 19 22 24 27 30 -6,6% 7,6% 1,4% 0,7% 1,5% 0,9%Oil 33 32 72 96 114 143 178 -0,2% 8,3% 3,0% 1,7% 2,3% 2,2%Gas 18 21 31 38 46 59 71 1,4% 4,0% 2,1% 2,1% 2,5% 1,9%
GHG emissions (Mt CO2 eq.)Total GHG (excl. LULUCF) 995 445 392 330 325 379 410 -7,7% -1,3% -1,7% -0,1% 1,5% 0,8%CO2 788 345 301 246 247 305 346 -7,9% -1,4% -2,0% 0,1% 2,1% 1,3%CH4 149 74 63 54 48 44 34 -6,7% -1,7% -1,5% -1,2% -0,9% -2,4%N2O 57 26 28 30 29 29 28 -7,7% 0,9% 0,5% -0,2% -0,1% -0,3%F gases 0 0 1 1 1 2 2 -5,6% 17,0% 4,5% 2,7% 3,1% 2,6%Total GHG from Energy and Industry 891 408 358 296 292 346 378 -7,5% -1,3% -1,9% -0,1% 1,7% 0,9%CO2 Emissions from Fuel Comb. 717 308 261 206 205 257 292 -8,1% -1,6% -2,3% -0,1% 2,3% 1,3%
Power generation/District heating 216 79 90 74 68 99 121 -9,6% 1,3% -2,0% -0,8% 3,9% 2,0%Industry 196 83 60 48 54 66 79 -8,3% -3,2% -2,0% 1,1% 2,0% 1,8%Buildings 60 44 40 28 27 27 27 -3,0% -1,0% -3,5% -0,5% 0,3% -0,1%Agriculture 23 3 4 5 5 6 6 -17,2% 2,4% 0,8% 0,8% 1,1% 1,1%Transport 60 20 21 18 18 17 17 -10,4% 0,5% -1,6% -0,3% -0,2% -0,4%Other 163 79 46 34 34 41 42 -7,0% -5,2% -3,1% 0,1% 2,0% 0,1%
CO2 captured (CCS) 0 0 0 0 0 0 0 n.s. n.s. n.s. n.s. n.s. 11,6%Coal 0 0 0 0 0 0 0 n.s. n.s. n.s. n.s. n.s. 11,5%Gas 0 0 0 0 0 0 0 n.s. n.s. n.s. n.s. n.s. 11,5%Biomass 0 0 0 0 0 0 0 n.s. n.s. n.s. n.s. n.s. 11,7%
Energy Balance, by fuel (Mtoe)Primary Production 113 77 80 90 99 104 101 -3,7% 0,4% 1,2% 0,9% 0,5% -0,3%
Coal 63 37 34 38 34 29 12 -5,2% -0,8% 1,1% -1,2% -1,4% -8,2%Oil 5 4 4 4 4 3 2 -3,4% -0,4% 1,2% -0,6% -1,7% -3,2%Natural gas 23 15 16 16 16 17 18 -4,4% 1,1% -0,3% -0,2% 0,9% 0,4%Biomass 0 0 1 2 2 3 3 -2,2% 19,1% 1,3% 2,7% 1,7% 2,0%Nuclear1 20 20 24 29 41 48 59 0,2% 1,4% 2,1% 3,5% 1,5% 2,1%Hydro 1 1 1 1 1 1 1 0,7% 1,4% 0,5% 0,1% 0,0% 0,0%Other renewables 0 0 0 0 1 3 6 n.s. n.s. 36,0% 11,1% 9,9% 6,6%
Net Imports 145 53 50 25 31 52 79Coal 17 - 3 2 - 4 1 16 47Oil 62 8 10 7 8 9 10Natural gas 69 48 39 22 23 27 22Biomass 0 0 0 0 0 0 0Biofuels 0 0 0 0 0 0 1Electricity - 2 0 0 - 1 - 1 - 1 - 1
Primary Energy Demand2 258 130 131 115 129 156 180 -6,6% 0,1% -1,3% 1,2% 1,9% 1,5%Coal 80 34 36 34 34 46 59 -8,1% 0,5% -0,6% 0,1% 2,9% 2,6%Oil 67 12 14 11 11 12 12 -15,9% 1,2% -1,8% 0,1% 0,6% 0,0%Natural gas 92 62 55 38 38 44 40 -3,8% -1,2% -3,7% 0,1% 1,4% -0,9%Biomass 0 0 1 2 2 3 3 -2,2% 19,1% 1,4% 2,9% 2,0% 2,3%Nuclear1 20 20 24 29 41 48 59 0,2% 1,4% 2,1% 3,5% 1,5% 2,1%Hydro 1 1 1 1 1 1 1 0,7% 1,4% 0,5% 0,1% 0,0% 0,0%Other renewables 0 0 0 0 1 3 6 n.s. n.s. 36,0% 11,1% 9,9% 6,6%
Primary Energy Demand, by sector (Mtoe)Primary Energy Demand 258 130 131 115 129 156 180 -6,6% 0,1% -1,3% 1,2% 1,9% 1,5%Energy for Power Generation 83 45 50 51 63 81 100 -6,0% 1,2% 0,2% 2,1% 2,5% 2,1%Other Transformation & Losses 25 16 24 27 32 40 49 -4,6% 4,6% 1,0% 1,8% 2,2% 2,0%Energy Branch Consumption 63 32 20 14 15 19 20 -6,5% -4,9% -3,0% 0,6% 2,2% 0,7%Final consumption 163 75 75 66 72 84 97 -7,4% 0,0% -1,4% 0,9% 1,6% 1,4%
Steel, Non-Met. Minerals and Chem. 29 14 24 21 23 28 33 -6,9% 5,3% -1,3% 1,1% 1,9% 1,7%Other Industry 61 24 8 7 8 10 11 -8,8% -10,4% -1,3% 1,3% 1,8% 1,6%Non-Energy Use 6 1 6 4 4 5 5 -15,4% 16,5% -3,7% 1,0% 1,2% 0,9%Residential 32 24 24 19 20 22 24 -2,8% 0,0% -2,1% 0,2% 1,0% 1,0%Services 4 3 4 5 6 8 10 -3,3% 4,3% 2,4% 2,2% 2,7% 2,3%Agriculture 9 2 2 2 2 2 3 -16,6% 1,2% 1,0% 1,0% 1,3% 1,3%Road 18 6 7 6 7 8 9 -9,6% 1,1% -1,1% 0,9% 1,0% 0,9%Rail 2 1 1 1 1 1 1 -6,9% -0,5% 1,8% 1,1% 1,4% 1,1%Aviation 0 0 0 0 0 0 0 n.s. n.s. n.s. n.s. 3,8% 3,4%Other Transport 1 0 0 0 0 0 0 n.s. n.s. -0,9% 1,1% 1,6% 1,3%
1 Primary energy from nuclear is calculated considering the primary heat equivalent of the electricity produced with an average efficiency of 33%
31

GECO2015 Baseline 150504 SUMMARY GHG & ENERGY BALANCE##### 100
Ukraine 1990 2000 2010 2020 2030 2040 2050 '90-'00 '00-'10 '10-'20 '20-'30 '30-'40 '40-'50Power Generation
Fuel Inputs Therm. Power (Mtoe) 62 23 26 21 20 29 35 -9,3% 1,0% -2,0% -0,5% 4,0% 1,7%Coal 37 15 19 15 13 19 26 -8,6% 2,4% -2,1% -1,3% 3,7% 3,0%Oil 13 0 0 1 1 1 1 -30,9% -3,6% 8,5% 1,7% 4,1% -1,9%Gas 12 8 6 5 5 8 7 -4,2% -2,7% -2,4% 1,2% 4,6% -2,5%Biomass & Waste 0 0 0 0 0 1 1 n.s. n.s. -4,5% 4,8% 6,1% 5,9%Other 0 0 0 0 0 0 0 n.s. n.s. n.s. n.s. n.s. n.s.
Gross Elec. Generation (TWh e) 299 171 189 215 277 376 491 -5,4% 1,0% 1,3% 2,6% 3,1% 2,7%Coal 114 52 70 62 59 89 129 -7,6% 3,0% -1,1% -0,5% 4,2% 3,7%
of which CCS 0 0 0 0 0 0 0 n.s. n.s. n.s. n.s. n.s. n.s.Oil 48 1 1 2 3 4 3 -30,9% -5,6% 12,3% 1,7% 4,2% -1,6%Gas 50 30 16 21 27 41 37 -5,0% -6,3% 3,0% 2,6% 4,2% -0,9%
of which CCS 0 0 0 0 0 0 0 n.s. n.s. n.s. n.s. n.s. n.s.Biomass & Waste 0 0 0 0 1 3 6 n.s. n.s. 4,6% 11,6% 8,9% 7,4%
of which CCS 0 0 0 0 0 0 0 n.s. n.s. n.s. n.s. n.s. n.s.Nuclear 76 77 89 111 160 190 236 0,2% 1,4% 2,2% 3,7% 1,7% 2,2%Hydro 11 11 13 14 14 14 14 0,7% 1,4% 0,5% 0,1% 0,0% 0,0%Wind 0 0 0 4 12 30 56 n.s. 42,8% 34,4% 11,2% 9,9% 6,3%Solar 0 0 0 1 1 4 10 n.s. n.s. 52,9% 8,1% 11,1% 8,9%Other 0 0 0 0 0 0 0 n.s. n.s. n.s. n.s. 16,5% 12,3%
Generation Capacity (GWe) 0 52 54 49 63 84 118 n.s. 0,3% -1,0% 2,7% 2,8% 3,4%Coal 0 22 22 14 16 20 32 n.s. 0,0% -4,6% 1,5% 2,6% 4,7%
of which CCS 0 0 0 0 0 0 0 n.s. n.s. n.s. n.s. n.s. n.s.Oil 0 1 1 0 1 1 1 n.s. 0,0% -7,2% 2,3% 3,2% 2,9%Gas 0 14 12 11 13 15 15 n.s. -1,0% -1,2% 1,6% 1,5% 0,5%
of which CCS 0 0 0 0 0 0 0 n.s. n.s. n.s. n.s. n.s. n.s.Biomass & Waste 0 0 0 0 0 0 1 n.s. n.s. 2,1% 11,0% 8,7% 7,9%
of which CCS 0 0 0 0 0 0 0 n.s. n.s. n.s. n.s. n.s. n.s.Nuclear 0 11 13 16 22 26 32 n.s. 1,6% 1,9% 3,5% 1,5% 2,0%Hydro 0 5 5 6 6 6 6 n.s. 1,5% 0,4% 0,1% 0,0% 0,0%Wind 0 0 0 2 5 12 23 n.s. n.s. 33,2% 11,0% 9,7% 6,2%Solar 0 0 0 1 1 3 8 n.s. n.s. 52,8% 8,0% 10,9% 8,8%Other 0 0 0 0 0 0 0 n.s. n.s. n.s. n.s. 16,0% 11,8%
Total Final Consumption 2 (Mtoe) 163 75 75 66 72 84 97 -7,4% 0,0% -1,4% 0,9% 1,6% 1,4%Coal 39 16 14 15 17 22 28 -8,5% -1,0% 0,2% 1,5% 2,4% 2,4%Oil 43 11 12 10 10 10 10 -13,0% 1,5% -2,1% 0,0% 0,4% 0,1%Gas 33 26 25 15 15 15 15 -2,6% -0,2% -4,9% -0,3% 0,4% -0,4%Electricity 18 10 11 13 17 23 31 -5,8% 1,7% 1,5% 2,7% 3,2% 2,8%Heat 31 13 11 11 11 11 11 -8,0% -1,8% 0,1% -0,1% -0,2% -0,3%Biomass & Other 0 0 1 1 2 2 3 -2,2% 15,4% 2,2% 2,4% 2,4% 1,9%Share of Renewables 3 (%) 2% 3% 4% 5% 6% 8% 10% 2,9% 4,3% 2,7% 1,7% 2,1% 2,2%
Industry (incl. non-energy use) 97 40 38 32 36 43 50 -8,5% -0,6% -1,7% 1,1% 1,8% 1,6%Coal 30 13 14 14 16 21 27 -7,8% 0,4% -0,1% 1,7% 2,6% 2,6%Oil 15 2 2 1 1 2 2 -16,8% -0,2% -5,8% 0,9% 1,7% 0,4%Gas 23 12 11 6 6 6 6 -6,5% -1,2% -5,0% -0,2% 0,2% -1,2%Electricity 13 5 6 5 7 9 11 -8,4% 0,9% -0,5% 2,4% 2,6% 2,2%Heat 16 7 5 5 5 5 5 -8,0% -3,0% 0,0% -0,2% -0,3% -0,2%Biomass & Other 0 0 0 0 0 0 0 n.s. n.s. -8,7% 3,2% 6,4% 5,1%
Buildings 36 27 28 24 26 30 34 -2,9% 0,5% -1,3% 0,6% 1,4% 1,4%Coal 8 3 1 1 1 1 1 -9,9% -13,4% 5,5% -1,0% -1,3% -1,6%Oil 2 0 1 1 1 1 1 -13,8% 12,8% -2,7% -0,2% 1,1% 0,6%Gas 10 14 14 9 8 9 9 3,2% 0,5% -4,8% -0,4% 0,5% 0,1%Electricity 1 3 5 7 9 12 17 8,5% 3,7% 3,2% 2,8% 3,5% 3,2%Heat 14 6 6 6 6 6 6 -8,1% -0,5% 0,1% 0,1% -0,1% -0,3%Biomass & Other 0 0 1 1 1 1 1 -2,2% 14,5% -0,1% -2,2% -1,7% -1,5%
Agriculture 9 2 2 2 2 2 3 -16,6% 1,2% 1,0% 1,0% 1,3% 1,3%Coal 1 0 0 0 0 0 0 n.s. n.s. 0,5% 0,0% 0,0% 0,0%Oil 6 1 1 1 1 2 2 -15,7% 1,5% 0,9% 0,8% 1,1% 1,1%Gas 0 0 0 0 0 0 0 n.s. n.s. -0,2% 0,6% 0,9% 0,9%Electricity 2 0 0 0 0 0 1 -15,9% -4,2% 2,1% 1,7% 1,9% 1,9%Heat 0 0 0 0 0 0 0 n.s. n.s. n.s. n.s. n.s. n.s.Biomass & Other 0 0 0 0 0 0 0 n.s. n.s. 0,0% 0,0% 0,0% 0,0%
Transport 21 7 8 8 8 9 10 -9,9% 1,1% -0,8% 0,9% 1,1% 0,9%Coal 0 0 0 0 0 0 0 n.s. n.s. 1,0% 0,0% 0,0% 0,0%Oil 20 7 8 6 6 6 6 -10,3% 1,1% -1,6% -0,3% -0,3% -0,4%Gas 0 0 0 0 0 0 0 n.s. n.s. n.s. n.s. n.s. n.s.Electricity 1 1 1 1 1 2 2 -4,7% 0,1% 2,7% 3,8% 3,8% 2,9%Heat 0 0 0 0 0 0 0 n.s. n.s. n.s. n.s. n.s. n.s.Biomass & Other 0 0 0 0 1 1 2 n.s. n.s. n.s. 11,2% 5,1% 3,2%
Energy Branch Consumption 63 32 20 14 15 19 20 -6,5% -4,9% -3,0% 0,6% 2,2% 0,7%Other Transformation & Losses 4 25 16 24 27 32 40 49 -4,6% 4,6% 1,0% 1,8% 2,2% 2,0%
2 does not include international aviation and maritime bunkers; includes non-energy uses3 ratio of renewable energy over final energy demand increased by distribution losses and self consumption of electricity and steam plants4 includes statistical differences
32

GECO2015 Baseline 150504 SUMMARY GHG & ENERGY BALANCE##### 100
Other CIS 1990 2000 2010 2020 2030 2040 2050 '90-'00 '00-'10 '10-'20 '20-'30 '30-'40 '40-'50Main Economic Indicators
Population (Million) 77 81 88 97 103 107 110 0,6% 0,8% 1,0% 0,6% 0,4% 0,3%GDP per capita (ppp, k$'05) 5 3 6 10 16 23 30 -4,0% 7,4% 4,6% 4,8% 3,6% 2,5%GDP per capita (mer, k$'05) 2 1 3 4 6 9 12 -4,0% 7,4% 4,7% 4,8% 3,6% 2,5%Share Value Added - Agriculture (%) 20 20 9 7 6 5 5 -0,4% -7,5% -2,2% -1,9% -0,9% -0,5%Share Value Added - Industry (%) 26 35 43 41 39 37 35 2,9% 2,1% -0,5% -0,5% -0,6% -0,6%Share Value Added - Services (%) 53 45 48 52 55 58 60 -1,6% 0,6% 0,8% 0,6% 0,5% 0,4%
PricesInternational/Regional ($'05/boe)
Coal 18 9 19 22 24 27 30 -6,6% 7,6% 1,4% 0,7% 1,5% 0,9%Oil 33 32 72 96 114 143 178 -0,2% 8,3% 3,0% 1,7% 2,3% 2,2%Gas 18 21 31 38 46 59 71 1,4% 4,0% 2,1% 2,1% 2,5% 1,9%
GHG emissions (Mt CO2 eq.)Total GHG (excl. LULUCF) 972 574 785 870 1 097 1 255 1 330 -5,1% 3,2% 1,0% 2,3% 1,4% 0,6%CO2 733 397 535 602 793 919 982 -5,9% 3,0% 1,2% 2,8% 1,5% 0,7%CH4 173 132 193 200 223 245 251 -2,6% 3,8% 0,4% 1,1% 1,0% 0,2%N2O 63 43 54 63 71 75 76 -3,8% 2,4% 1,5% 1,2% 0,6% 0,2%F gases 3 1 3 6 10 15 20 -9,0% 10,0% 6,6% 6,1% 4,1% 2,6%Total GHG from Energy and Industry 846 491 674 748 962 1 111 1 182 -5,3% 3,2% 1,0% 2,5% 1,5% 0,6%CO2 Emissions from Fuel Comb. 708 383 508 569 762 889 952 -6,0% 2,9% 1,1% 3,0% 1,6% 0,7%
Power generation/District heating 255 151 164 205 290 361 408 -5,1% 0,8% 2,2% 3,5% 2,2% 1,2%Industry 137 53 72 80 104 115 122 -9,0% 3,1% 1,0% 2,7% 1,0% 0,6%Buildings 168 81 119 118 153 173 178 -7,1% 4,0% 0,0% 2,6% 1,2% 0,3%Agriculture 11 8 8 10 12 14 15 -2,8% -0,3% 2,2% 1,8% 1,5% 1,1%Transport 59 32 45 54 61 63 62 -6,0% 3,5% 1,9% 1,3% 0,3% -0,2%Other 78 58 100 102 141 164 167 -3,0% 5,6% 0,2% 3,3% 1,5% 0,2%
CO2 captured (CCS) 0 0 0 0 0 0 0 n.s. n.s. n.s. 7,0% 10,1% -0,2%Coal 0 0 0 0 0 0 0 n.s. n.s. n.s. 7,0% 10,0% -0,2%Gas 0 0 0 0 0 0 0 n.s. n.s. n.s. 7,0% 10,1% -0,3%Biomass 0 0 0 0 0 0 0 n.s. n.s. n.s. 6,9% 10,4% -0,2%
Energy Balance, by fuel (Mtoe)Primary Production 230 208 328 357 464 575 599 -1,0% 4,6% 0,8% 2,7% 2,2% 0,4%
Coal 56 39 47 61 111 191 229 -3,5% 1,9% 2,7% 6,1% 5,6% 1,8%Oil 50 65 151 140 124 115 107 2,7% 8,7% -0,7% -1,2% -0,7% -0,7%Natural gas 119 98 123 143 208 236 218 -2,0% 2,3% 1,6% 3,8% 1,3% -0,8%Biomass 1 2 2 5 13 17 21 6,5% 0,0% 12,3% 9,9% 2,9% 2,1%Nuclear1 0 1 1 2 3 6 8 n.s. 2,2% 9,6% 5,6% 7,1% 3,8%Hydro 4 4 5 5 5 5 6 -0,3% 2,0% 0,3% -0,1% 0,2% 0,2%Other renewables 0 0 0 0 1 6 11 n.s. n.s. 52,3% 26,6% 21,9% 6,9%
Net Imports 23 - 60 - 136 - 148 - 177 - 233 - 228Coal - 3 - 16 - 10 - 11 - 45 - 110 - 130Oil 48 - 30 - 111 - 95 - 73 - 63 - 57Natural gas - 23 - 15 - 15 - 41 - 58 - 61 - 44Biomass 0 0 0 0 0 1 3Biofuels 0 0 0 0 0 0 0Electricity 1 1 0 0 0 0 0
Primary Energy Demand2 254 149 192 209 287 343 371 -5,2% 2,6% 0,9% 3,2% 1,8% 0,8%Coal 52 23 37 51 65 80 99 -8,0% 4,9% 3,4% 2,6% 2,1% 2,1%Oil 98 35 40 45 50 52 50 -9,7% 1,3% 1,0% 1,2% 0,3% -0,4%Natural gas 96 83 108 102 150 176 174 -1,5% 2,6% -0,5% 3,9% 1,6% -0,1%Biomass 1 2 2 5 12 18 24 6,4% 0,0% 12,0% 10,0% 3,8% 2,9%Nuclear1 0 1 1 2 3 6 8 n.s. 2,2% 9,6% 5,6% 7,1% 3,8%Hydro 4 4 5 5 5 5 6 -0,3% 2,0% 0,3% -0,1% 0,2% 0,2%Other renewables 0 0 0 0 1 6 11 n.s. n.s. 52,3% 26,6% 21,9% 6,9%
Primary Energy Demand, by sector (Mtoe)Primary Energy Demand 254 149 192 209 287 343 371 -5,2% 2,6% 0,9% 3,2% 1,8% 0,8%Energy for Power Generation 86 56 63 72 100 128 146 -4,2% 1,1% 1,3% 3,4% 2,5% 1,3%Other Transformation & Losses 30 18 23 29 48 64 76 -4,8% 2,3% 2,3% 5,1% 3,0% 1,7%Energy Branch Consumption 23 20 36 37 52 61 62 -1,5% 6,3% 0,2% 3,5% 1,6% 0,2%Final consumption 188 99 123 138 180 211 232 -6,2% 2,2% 1,2% 2,7% 1,6% 0,9%
Steel, Non-Met. Minerals and Chem. 7 6 14 16 13 11 11 -2,4% 9,7% 1,1% -1,6% -1,9% 0,1%Other Industry 51 23 23 27 40 47 52 -7,7% 0,2% 1,5% 3,9% 1,8% 0,9%Non-Energy Use 15 7 6 6 9 11 12 -7,6% -1,6% 1,1% 4,0% 1,7% 0,6%Residential 12 27 30 31 38 42 44 8,1% 1,1% 0,3% 1,9% 1,0% 0,6%Services 75 21 30 33 48 62 71 -11,8% 3,4% 1,1% 3,8% 2,6% 1,3%Agriculture 8 5 5 6 8 9 11 -4,5% -0,4% 2,3% 2,3% 2,0% 1,6%Road 17 9 13 16 21 24 25 -6,3% 4,0% 2,1% 2,5% 1,2% 0,6%Rail 2 1 1 1 2 2 2 -7,4% 1,5% 2,5% 2,3% 1,6% 0,9%Aviation 0 0 0 1 1 2 2 0,4% -1,8% 5,0% 7,5% 4,6% 1,4%Other Transport 0 0 0 0 0 0 0 -12,5% 21,9% 4,0% 4,1% 2,6% 1,4%
1 Primary energy from nuclear is calculated considering the primary heat equivalent of the electricity produced with an average efficiency of 33%
33

GECO2015 Baseline 150504 SUMMARY GHG & ENERGY BALANCE##### 100
Other CIS 1990 2000 2010 2020 2030 2040 2050 '90-'00 '00-'10 '10-'20 '20-'30 '30-'40 '40-'50Power Generation
Fuel Inputs Therm. Power (Mtoe) 82 51 57 65 91 111 122 -4,6% 1,0% 1,3% 3,5% 2,0% 0,9%Coal 28 16 19 32 46 61 77 -5,5% 1,9% 5,2% 3,8% 2,9% 2,3%Oil 21 7 1 3 3 3 2 -10,7% -20,3% 13,4% 2,4% 0,0% -3,4%Gas 33 29 37 30 42 46 40 -1,4% 2,6% -2,0% 3,3% 1,0% -1,3%Biomass & Waste 0 0 0 0 0 1 2 n.s. n.s. -4,2% 17,2% 9,3% 7,7%Other 0 0 0 0 0 0 0 n.s. n.s. n.s. n.s. n.s. n.s.
Gross Elec. Generation (TWh e) 295 200 252 335 495 656 788 -3,8% 2,4% 2,9% 4,0% 2,8% 1,9%Coal 73 38 69 130 208 297 388 -6,3% 6,1% 6,5% 4,8% 3,7% 2,7%
of which CCS 0 0 0 0 0 0 0 n.s. n.s. n.s. n.s. n.s. n.s.Oil 68 23 2 11 14 14 10 -10,3% -20,9% 17,6% 2,3% -0,1% -3,2%Gas 103 87 118 124 192 224 212 -1,7% 3,1% 0,5% 4,4% 1,6% -0,6%
of which CCS 0 0 0 0 0 0 0 n.s. n.s. n.s. n.s. n.s. n.s.Biomass & Waste 0 0 0 0 2 5 11 n.s. n.s. n.s. 17,9% 9,7% 8,2%
of which CCS 0 0 0 0 0 0 0 n.s. n.s. n.s. n.s. n.s. n.s.Nuclear 0 2 2 6 11 23 33 n.s. 2,2% 10,0% 5,9% 7,2% 3,7%Hydro 51 50 61 62 62 63 64 -0,3% 2,0% 0,3% -0,1% 0,2% 0,2%Wind 0 0 0 1 6 23 54 n.s. n.s. 48,9% 23,5% 15,0% 8,8%Solar 0 0 0 0 1 6 17 n.s. n.s. n.s. 23,5% 16,7% 11,2%Other 0 0 0 0 0 0 1 n.s. n.s. n.s. 33,5% 20,2% 13,9%
Generation Capacity (GWe) 0 66 72 76 92 128 169 n.s. 0,9% 0,4% 2,0% 3,4% 2,8%Coal 0 14 15 21 32 49 66 n.s. 0,3% 3,7% 4,3% 4,2% 3,1%
of which CCS 0 0 0 0 0 0 0 n.s. n.s. n.s. n.s. n.s. n.s.Oil 0 8 9 7 4 5 5 n.s. 1,2% -2,9% -4,7% 0,8% 0,4%Gas 0 28 31 29 33 39 40 n.s. 1,1% -0,8% 1,4% 1,8% 0,2%
of which CCS 0 0 0 0 0 0 0 n.s. n.s. n.s. n.s. n.s. n.s.Biomass & Waste 0 0 0 0 0 1 1 n.s. n.s. n.s. 18,0% 9,9% 8,5%
of which CCS 0 0 0 0 0 0 0 n.s. n.s. n.s. n.s. n.s. n.s.Nuclear 0 0 0 1 2 4 5 n.s. 0,0% 9,7% 5,7% 7,0% 3,5%Hydro 0 15 17 17 17 18 18 n.s. 1,0% 0,2% -0,1% 0,2% 0,2%Wind 0 0 0 0 2 9 21 n.s. n.s. 47,3% 23,4% 14,9% 8,7%Solar 0 0 0 0 1 4 12 n.s. n.s. n.s. 23,5% 16,6% 11,1%Other 0 0 0 0 0 0 0 n.s. n.s. n.s. n.s. 19,6% 13,4%
Total Final Consumption 2 (Mtoe) 188 99 123 138 180 211 232 -6,2% 2,2% 1,2% 2,7% 1,6% 0,9%Coal 24 7 17 19 19 19 21 -11,2% 8,8% 1,5% 0,0% -0,4% 1,1%Oil 61 23 33 36 40 41 41 -9,5% 3,9% 0,7% 1,2% 0,3% -0,2%Gas 52 39 40 42 63 76 79 -2,8% 0,2% 0,4% 4,2% 1,8% 0,4%Electricity 23 13 16 22 32 43 51 -5,2% 2,0% 2,9% 4,0% 2,9% 1,9%Heat 27 15 15 16 16 19 20 -5,7% 0,2% 0,2% 0,1% 1,7% 0,9%Biomass & Other 1 2 1 4 9 14 20 6,4% -1,0% 11,7% 8,5% 4,1% 3,4%Share of Renewables 3 (%) 5% 7% 6% 8% 9% 11% 14% 4,8% -1,3% 1,5% 1,4% 2,7% 2,4%
Industry (incl. non-energy use) 73 35 43 49 62 70 75 -7,0% 2,1% 1,3% 2,4% 1,1% 0,7%Coal 19 6 12 15 15 15 17 -10,5% 6,8% 2,1% 0,3% -0,2% 1,6%Oil 22 7 6 5 7 8 8 -11,4% -1,5% -0,8% 2,8% 1,3% -0,1%Gas 12 11 12 13 19 21 20 -0,7% 0,8% 0,6% 3,8% 1,0% -0,4%Electricity 13 5 8 10 15 18 21 -8,6% 3,6% 2,7% 3,8% 2,4% 1,5%Heat 7 5 5 5 5 5 5 -1,9% 0,1% 0,0% -0,2% -0,3% -0,2%Biomass & Other 0 0 0 1 2 2 3 n.s. -0,1% 16,1% 7,2% 3,5% 4,0%
Buildings 87 49 60 64 86 104 116 -5,7% 2,2% 0,7% 2,9% 2,0% 1,0%Coal 5 1 5 4 4 4 3 -14,0% 15,9% -0,3% -0,8% -1,1% -1,4%Oil 18 3 11 11 11 10 9 -15,3% 12,6% -0,5% -0,1% -0,7% -0,9%Gas 39 28 28 29 44 54 58 -3,3% -0,1% 0,3% 4,4% 2,1% 0,7%Electricity 4 5 6 8 12 16 19 2,6% 0,7% 3,2% 4,2% 3,2% 2,1%Heat 21 10 10 10 10 13 15 -7,3% 0,2% 0,3% 0,2% 2,6% 1,3%Biomass & Other 1 1 1 3 5 7 11 5,1% -1,4% 9,5% 6,0% 3,5% 3,8%
Agriculture 8 5 5 6 8 9 11 -4,5% -0,4% 2,3% 2,3% 2,0% 1,6%Coal 0 0 0 0 0 0 0 -26,3% 43,6% -0,5% 0,0% 0,0% 0,0%Oil 2 2 2 3 3 4 4 0,3% -1,7% 2,6% 2,0% 1,6% 1,2%Gas 1 0 0 0 0 0 0 -17,0% 3,8% 1,4% 1,8% 1,4% 1,0%Electricity 4 2 2 3 4 5 6 -5,6% -0,6% 2,5% 2,8% 2,4% 2,0%Heat 0 0 0 0 0 0 0 n.s. n.s. n.s. n.s. n.s. n.s.Biomass & Other 0 0 0 0 0 0 0 8,4% 13,0% 0,5% 0,0% 0,0% 0,0%
Transport 20 10 15 19 24 28 30 -6,2% 3,6% 2,2% 2,7% 1,5% 0,7%Coal 0 0 0 0 0 0 0 -10,0% 13,3% 1,2% 0,0% 0,0% 0,0%Oil 19 10 14 17 19 20 20 -6,0% 3,5% 1,9% 1,3% 0,3% -0,2%Gas 0 0 0 0 0 0 0 n.s. n.s. n.s. n.s. n.s. n.s.Electricity 1 0 1 1 2 4 5 -10,8% 6,5% 4,4% 7,6% 5,0% 3,1%Heat 0 0 0 0 0 0 0 n.s. n.s. n.s. n.s. n.s. n.s.Biomass & Other 0 0 0 0 3 4 6 n.s. n.s. n.s. 19,0% 5,5% 2,3%
Energy Branch Consumption 23 20 36 37 52 61 62 -1,5% 6,3% 0,2% 3,5% 1,6% 0,2%Other Transformation & Losses 4 30 18 23 29 48 64 76 -4,8% 2,3% 2,3% 5,1% 3,0% 1,7%
2 does not include international aviation and maritime bunkers; includes non-energy uses3 ratio of renewable energy over final energy demand increased by distribution losses and self consumption of electricity and steam plants4 includes statistical differences
34
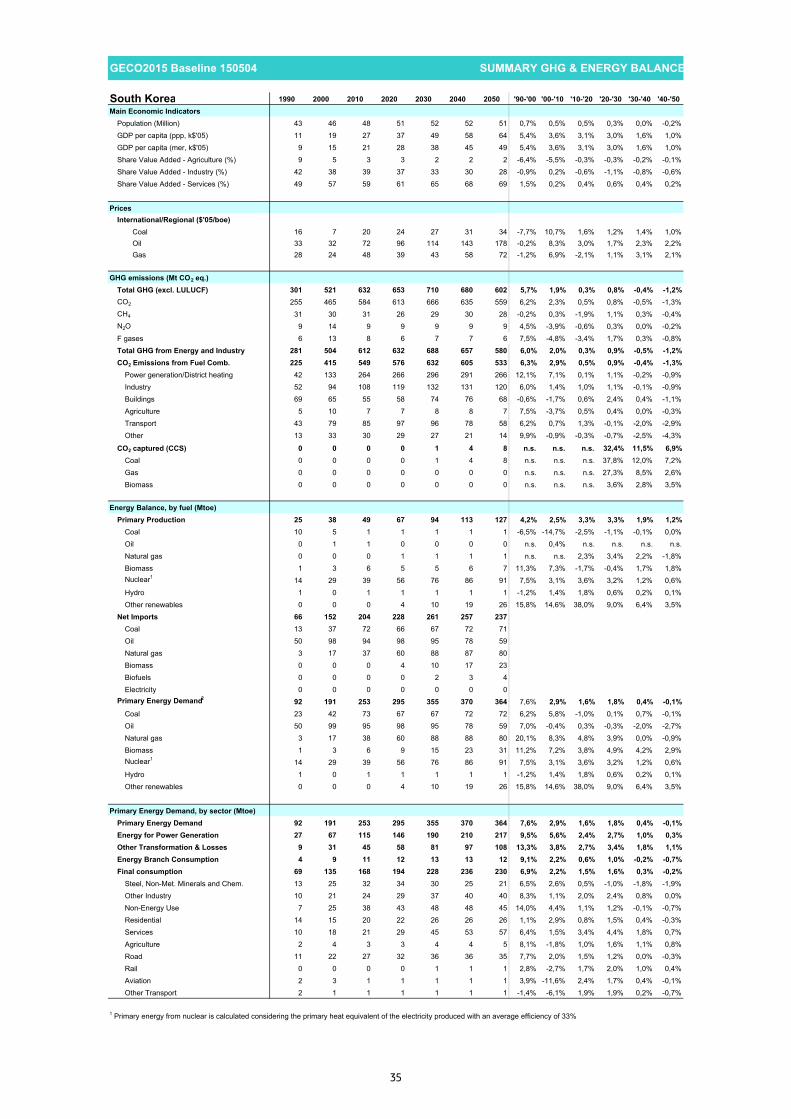
GECO2015 Baseline 150504 SUMMARY GHG & ENERGY BALANCE##### 100
South Korea 1990 2000 2010 2020 2030 2040 2050 '90-'00 '00-'10 '10-'20 '20-'30 '30-'40 '40-'50Main Economic Indicators
Population (Million) 43 46 48 51 52 52 51 0,7% 0,5% 0,5% 0,3% 0,0% -0,2%GDP per capita (ppp, k$'05) 11 19 27 37 49 58 64 5,4% 3,6% 3,1% 3,0% 1,6% 1,0%GDP per capita (mer, k$'05) 9 15 21 28 38 45 49 5,4% 3,6% 3,1% 3,0% 1,6% 1,0%Share Value Added - Agriculture (%) 9 5 3 3 2 2 2 -6,4% -5,5% -0,3% -0,3% -0,2% -0,1%Share Value Added - Industry (%) 42 38 39 37 33 30 28 -0,9% 0,2% -0,6% -1,1% -0,8% -0,6%Share Value Added - Services (%) 49 57 59 61 65 68 69 1,5% 0,2% 0,4% 0,6% 0,4% 0,2%
PricesInternational/Regional ($'05/boe)
Coal 16 7 20 24 27 31 34 -7,7% 10,7% 1,6% 1,2% 1,4% 1,0%Oil 33 32 72 96 114 143 178 -0,2% 8,3% 3,0% 1,7% 2,3% 2,2%Gas 28 24 48 39 43 58 72 -1,2% 6,9% -2,1% 1,1% 3,1% 2,1%
GHG emissions (Mt CO2 eq.)Total GHG (excl. LULUCF) 301 521 632 653 710 680 602 5,7% 1,9% 0,3% 0,8% -0,4% -1,2%CO2 255 465 584 613 666 635 559 6,2% 2,3% 0,5% 0,8% -0,5% -1,3%CH4 31 30 31 26 29 30 28 -0,2% 0,3% -1,9% 1,1% 0,3% -0,4%N2O 9 14 9 9 9 9 9 4,5% -3,9% -0,6% 0,3% 0,0% -0,2%F gases 6 13 8 6 7 7 6 7,5% -4,8% -3,4% 1,7% 0,3% -0,8%Total GHG from Energy and Industry 281 504 612 632 688 657 580 6,0% 2,0% 0,3% 0,9% -0,5% -1,2%CO2 Emissions from Fuel Comb. 225 415 549 576 632 605 533 6,3% 2,9% 0,5% 0,9% -0,4% -1,3%
Power generation/District heating 42 133 264 266 296 291 266 12,1% 7,1% 0,1% 1,1% -0,2% -0,9%Industry 52 94 108 119 132 131 120 6,0% 1,4% 1,0% 1,1% -0,1% -0,9%Buildings 69 65 55 58 74 76 68 -0,6% -1,7% 0,6% 2,4% 0,4% -1,1%Agriculture 5 10 7 7 8 8 7 7,5% -3,7% 0,5% 0,4% 0,0% -0,3%Transport 43 79 85 97 96 78 58 6,2% 0,7% 1,3% -0,1% -2,0% -2,9%Other 13 33 30 29 27 21 14 9,9% -0,9% -0,3% -0,7% -2,5% -4,3%
CO2 captured (CCS) 0 0 0 0 1 4 8 n.s. n.s. n.s. 32,4% 11,5% 6,9%Coal 0 0 0 0 1 4 8 n.s. n.s. n.s. 37,8% 12,0% 7,2%Gas 0 0 0 0 0 0 0 n.s. n.s. n.s. 27,3% 8,5% 2,6%Biomass 0 0 0 0 0 0 0 n.s. n.s. n.s. 3,6% 2,8% 3,5%
Energy Balance, by fuel (Mtoe)Primary Production 25 38 49 67 94 113 127 4,2% 2,5% 3,3% 3,3% 1,9% 1,2%
Coal 10 5 1 1 1 1 1 -6,5% -14,7% -2,5% -1,1% -0,1% 0,0%Oil 0 1 1 0 0 0 0 n.s. 0,4% n.s. n.s. n.s. n.s.Natural gas 0 0 0 1 1 1 1 n.s. n.s. 2,3% 3,4% 2,2% -1,8%Biomass 1 3 6 5 5 6 7 11,3% 7,3% -1,7% -0,4% 1,7% 1,8%Nuclear1 14 29 39 56 76 86 91 7,5% 3,1% 3,6% 3,2% 1,2% 0,6%Hydro 1 0 1 1 1 1 1 -1,2% 1,4% 1,8% 0,6% 0,2% 0,1%Other renewables 0 0 0 4 10 19 26 15,8% 14,6% 38,0% 9,0% 6,4% 3,5%
Net Imports 66 152 204 228 261 257 237Coal 13 37 72 66 67 72 71Oil 50 98 94 98 95 78 59Natural gas 3 17 37 60 88 87 80Biomass 0 0 0 4 10 17 23Biofuels 0 0 0 0 2 3 4Electricity 0 0 0 0 0 0 0
Primary Energy Demand2 92 191 253 295 355 370 364 7,6% 2,9% 1,6% 1,8% 0,4% -0,1%Coal 23 42 73 67 67 72 72 6,2% 5,8% -1,0% 0,1% 0,7% -0,1%Oil 50 99 95 98 95 78 59 7,0% -0,4% 0,3% -0,3% -2,0% -2,7%Natural gas 3 17 38 60 88 88 80 20,1% 8,3% 4,8% 3,9% 0,0% -0,9%Biomass 1 3 6 9 15 23 31 11,2% 7,2% 3,8% 4,9% 4,2% 2,9%Nuclear1 14 29 39 56 76 86 91 7,5% 3,1% 3,6% 3,2% 1,2% 0,6%Hydro 1 0 1 1 1 1 1 -1,2% 1,4% 1,8% 0,6% 0,2% 0,1%Other renewables 0 0 0 4 10 19 26 15,8% 14,6% 38,0% 9,0% 6,4% 3,5%
Primary Energy Demand, by sector (Mtoe)Primary Energy Demand 92 191 253 295 355 370 364 7,6% 2,9% 1,6% 1,8% 0,4% -0,1%Energy for Power Generation 27 67 115 146 190 210 217 9,5% 5,6% 2,4% 2,7% 1,0% 0,3%Other Transformation & Losses 9 31 45 58 81 97 108 13,3% 3,8% 2,7% 3,4% 1,8% 1,1%Energy Branch Consumption 4 9 11 12 13 13 12 9,1% 2,2% 0,6% 1,0% -0,2% -0,7%Final consumption 69 135 168 194 228 236 230 6,9% 2,2% 1,5% 1,6% 0,3% -0,2%
Steel, Non-Met. Minerals and Chem. 13 25 32 34 30 25 21 6,5% 2,6% 0,5% -1,0% -1,8% -1,9%Other Industry 10 21 24 29 37 40 40 8,3% 1,1% 2,0% 2,4% 0,8% 0,0%Non-Energy Use 7 25 38 43 48 48 45 14,0% 4,4% 1,1% 1,2% -0,1% -0,7%Residential 14 15 20 22 26 26 26 1,1% 2,9% 0,8% 1,5% 0,4% -0,3%Services 10 18 21 29 45 53 57 6,4% 1,5% 3,4% 4,4% 1,8% 0,7%Agriculture 2 4 3 3 4 4 5 8,1% -1,8% 1,0% 1,6% 1,1% 0,8%Road 11 22 27 32 36 36 35 7,7% 2,0% 1,5% 1,2% 0,0% -0,3%Rail 0 0 0 0 1 1 1 2,8% -2,7% 1,7% 2,0% 1,0% 0,4%Aviation 2 3 1 1 1 1 1 3,9% -11,6% 2,4% 1,7% 0,4% -0,1%Other Transport 2 1 1 1 1 1 1 -1,4% -6,1% 1,9% 1,9% 0,2% -0,7%
1 Primary energy from nuclear is calculated considering the primary heat equivalent of the electricity produced with an average efficiency of 33%
35

GECO2015 Baseline 150504 SUMMARY GHG & ENERGY BALANCE##### 100
South Korea 1990 2000 2010 2020 2030 2040 2050 '90-'00 '00-'10 '10-'20 '20-'30 '30-'40 '40-'50Power Generation
Fuel Inputs Therm. Power (Mtoe) 12 37 75 85 103 105 99 11,7% 7,2% 1,3% 1,9% 0,1% -0,5%Coal 6 24 52 43 43 46 44 15,2% 8,1% -1,9% 0,0% 0,7% -0,4%Oil 5 8 5 6 5 5 4 5,4% -4,7% 1,9% -0,4% -1,2% -1,2%Gas 2 6 18 33 47 41 37 10,9% 12,0% 6,3% 3,6% -1,2% -1,3%Biomass & Waste 0 0 0 4 8 12 14 n.s. 34,9% 24,9% 7,7% 4,2% 1,4%Other 0 0 0 0 0 0 0 n.s. n.s. n.s. n.s. n.s. n.s.
Gross Elec. Generation (TWh e) 105 290 499 670 924 1 082 1 167 10,7% 5,6% 3,0% 3,3% 1,6% 0,8%Coal 18 111 219 190 199 223 225 20,2% 7,0% -1,4% 0,5% 1,2% 0,1%
of which CCS 0 0 0 0 2 5 11 n.s. n.s. n.s. n.s. 12,7% 7,7%Oil 19 35 19 24 24 21 19 6,3% -5,8% 2,6% -0,4% -1,1% -1,1%Gas 10 29 103 171 250 230 203 11,9% 13,4% 5,2% 3,9% -0,9% -1,2%
of which CCS 0 0 0 0 0 1 1 n.s. n.s. n.s. n.s. 9,3% 2,9%Biomass & Waste 0 0 1 14 32 51 59 n.s. 28,1% 28,8% 8,7% 4,7% 1,6%
of which CCS 0 0 0 0 0 0 0 n.s. n.s. n.s. n.s. n.s. n.s.Nuclear 53 109 149 215 298 340 362 7,5% 3,2% 3,7% 3,3% 1,3% 0,6%Hydro 6 6 6 8 8 8 8 -1,2% 1,4% 1,8% 0,6% 0,2% 0,1%Wind 0 0 1 37 92 163 210 n.s. 48,1% 45,7% 9,5% 5,9% 2,6%Solar 0 0 1 11 21 45 79 17,5% n.s. 30,3% 7,0% 7,8% 5,7%Other 0 0 0 0 0 1 2 n.s. n.s. n.s. 26,5% 15,7% 12,1%
Generation Capacity (GWe) 21 49 73 139 211 285 319 8,8% 4,1% 6,6% 4,2% 3,0% 1,2%Coal 4 14 24 33 36 43 38 14,3% 5,6% 3,0% 0,9% 1,8% -1,2%
of which CCS 0 0 0 0 0 1 2 n.s. n.s. n.s. n.s. 13,2% 8,3%Oil 5 5 5 5 6 6 7 0,1% 1,0% -0,6% 1,0% 0,9% 0,7%Gas 3 13 19 39 62 70 61 17,4% 4,3% 7,1% 4,7% 1,2% -1,2%
of which CCS 0 0 0 0 0 0 0 n.s. n.s. n.s. n.s. 10,0% 3,2%Biomass & Waste 0 1 0 3 6 12 13 n.s. -12,0% 33,8% 8,0% 6,4% 1,3%
of which CCS 0 0 0 0 0 0 0 n.s. n.s. n.s. n.s. n.s. n.s.Nuclear 8 14 18 29 40 44 46 6,1% 2,6% 5,1% 3,1% 1,1% 0,4%Hydro 2 3 6 7 7 8 8 3,0% 5,8% 2,4% 0,5% 0,2% 0,1%Wind 0 0 0 16 38 67 85 n.s. 51,8% 45,0% 9,3% 5,7% 2,4%Solar 0 0 1 8 17 35 61 n.s. n.s. 28,9% 7,2% 7,8% 5,7%Other 0 0 0 0 0 0 0 n.s. n.s. n.s. 25,8% 15,2% 11,6%
Total Final Consumption 2 (Mtoe) 69 135 168 194 228 236 230 6,9% 2,2% 1,5% 1,6% 0,3% -0,2%Coal 16 15 18 20 21 23 24 -0,5% 1,9% 1,4% 0,4% 0,9% 0,5%Oil 44 80 82 84 82 66 50 6,2% 0,2% 0,3% -0,3% -2,1% -2,8%Gas 1 11 19 27 40 45 43 32,1% 5,9% 3,3% 4,2% 1,2% -0,6%Electricity 8 23 39 52 72 85 91 10,8% 5,5% 3,1% 3,3% 1,6% 0,8%Heat 0 3 4 4 5 5 6 n.s. 2,8% 0,2% 0,2% 0,9% 1,3%Biomass & Other 1 3 6 6 8 11 16 11,1% 5,8% 0,2% 2,9% 3,9% 3,8%Share of Renewables 3 (%) 3% 3% 5% 7% 11% 17% 24% 2,8% 3,5% 4,2% 3,9% 4,5% 3,3%
Industry (incl. non-energy use) 30 71 94 105 115 113 105 9,2% 2,9% 1,1% 0,9% -0,2% -0,7%Coal 7 14 17 20 21 23 24 8,1% 1,7% 1,6% 0,5% 0,9% 0,6%Oil 18 36 44 43 40 31 23 7,4% 2,0% -0,2% -0,7% -2,5% -3,2%Gas 0 3 7 11 19 22 21 44,4% 9,1% 4,8% 5,4% 1,6% -0,4%Electricity 5 13 20 25 30 32 32 10,0% 4,3% 2,4% 1,8% 0,7% 0,1%Heat 0 2 2 2 2 2 2 n.s. 1,0% 0,0% -0,2% -0,3% -0,2%Biomass & Other 0 3 5 4 4 3 3 24,8% 5,1% -1,1% -1,5% -1,9% 0,3%
Buildings 23 33 41 51 70 80 83 3,6% 2,2% 2,2% 3,2% 1,3% 0,3%Coal 9 1 1 1 0 0 0 -24,1% 4,5% -3,0% -3,7% -3,6% -3,8%Oil 10 14 7 6 7 6 5 3,3% -6,7% -1,5% 1,0% -0,6% -1,8%Gas 1 8 12 16 22 24 22 29,6% 4,5% 2,4% 3,3% 0,8% -0,9%Electricity 3 9 18 26 38 46 49 11,9% 7,1% 3,7% 4,0% 1,8% 0,8%Heat 0 1 2 2 2 3 4 n.s. 5,5% 0,5% 0,6% 2,0% 2,4%Biomass & Other 1 0 1 1 1 1 3 -7,0% 8,8% -0,4% -1,4% 5,6% 8,1%
Agriculture 2 4 3 3 4 4 5 8,1% -1,8% 1,0% 1,6% 1,1% 0,8%Coal 0 0 0 0 0 0 0 n.s. n.s. n.s. n.s. n.s. n.s.Oil 2 3 2 2 2 2 2 7,5% -3,7% 0,5% 0,4% 0,0% -0,3%Gas 0 0 0 0 0 0 0 n.s. -9,6% 1,6% 0,5% 0,0% -0,3%Electricity 0 0 1 1 1 2 2 13,8% 6,6% 1,4% 3,1% 2,2% 1,7%Heat 0 0 0 0 0 0 0 n.s. n.s. n.s. n.s. n.s. n.s.Biomass & Other 0 0 0 0 0 0 0 n.s. n.s. n.s. 10,6% 4,7% 3,1%
Transport 15 27 29 34 38 39 38 6,3% 0,8% 1,5% 1,2% 0,1% -0,2%Coal 0 0 0 0 0 0 0 n.s. n.s. n.s. n.s. n.s. n.s.Oil 15 27 29 33 32 27 20 6,3% 0,7% 1,3% -0,1% -2,0% -2,9%Gas 0 0 0 0 0 0 0 n.s. n.s. n.s. n.s. n.s. n.s.Electricity 0 0 0 1 3 5 8 7,2% 1,0% 11,6% 17,2% 6,8% 3,7%Heat 0 0 0 0 0 0 0 n.s. n.s. n.s. n.s. n.s. n.s.Biomass & Other 0 0 0 1 3 7 10 n.s. n.s. 18,9% 16,3% 7,8% 4,2%
Energy Branch Consumption 4 9 11 12 13 13 12 9,1% 2,2% 0,6% 1,0% -0,2% -0,7%Other Transformation & Losses 4 9 31 45 58 81 97 108 13,3% 3,8% 2,7% 3,4% 1,8% 1,1%
2 does not include international aviation and maritime bunkers; includes non-energy uses3 ratio of renewable energy over final energy demand increased by distribution losses and self consumption of electricity and steam plants4 includes statistical differences
36
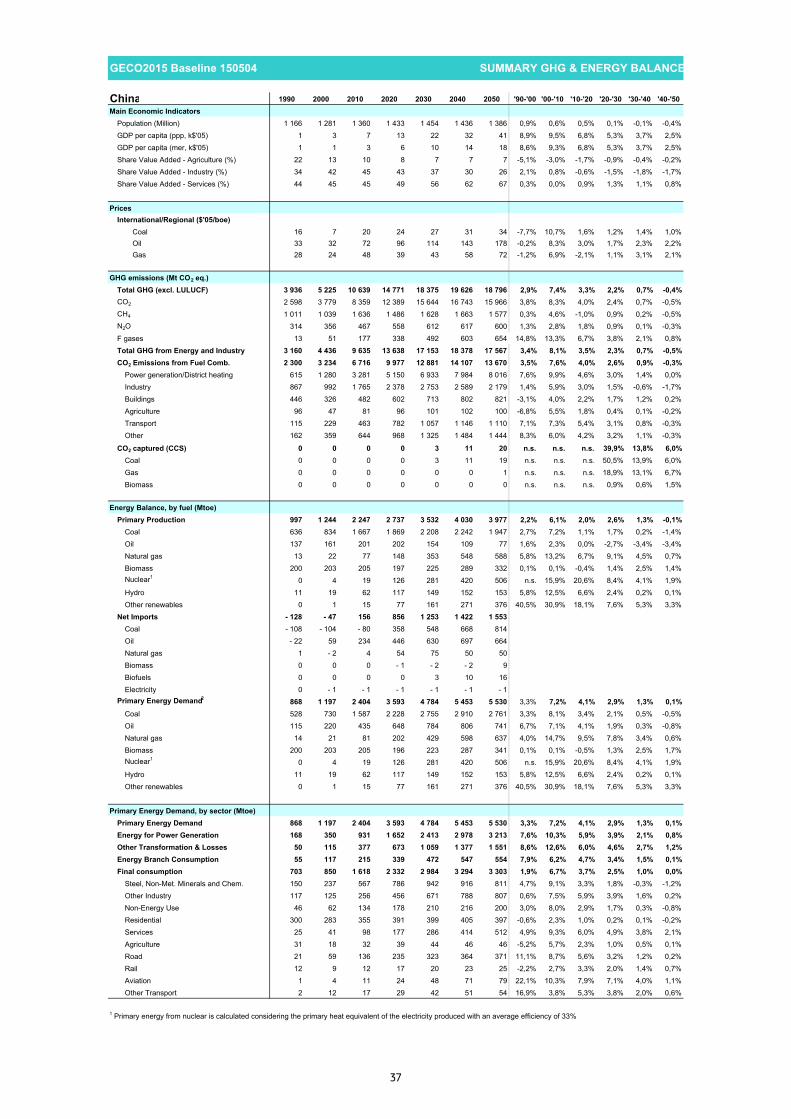
GECO2015 Baseline 150504 SUMMARY GHG & ENERGY BALANCE##### 100
China 1990 2000 2010 2020 2030 2040 2050 '90-'00 '00-'10 '10-'20 '20-'30 '30-'40 '40-'50Main Economic Indicators
Population (Million) 1 166 1 281 1 360 1 433 1 454 1 436 1 386 0,9% 0,6% 0,5% 0,1% -0,1% -0,4%GDP per capita (ppp, k$'05) 1 3 7 13 22 32 41 8,9% 9,5% 6,8% 5,3% 3,7% 2,5%GDP per capita (mer, k$'05) 1 1 3 6 10 14 18 8,6% 9,3% 6,8% 5,3% 3,7% 2,5%Share Value Added - Agriculture (%) 22 13 10 8 7 7 7 -5,1% -3,0% -1,7% -0,9% -0,4% -0,2%Share Value Added - Industry (%) 34 42 45 43 37 30 26 2,1% 0,8% -0,6% -1,5% -1,8% -1,7%Share Value Added - Services (%) 44 45 45 49 56 62 67 0,3% 0,0% 0,9% 1,3% 1,1% 0,8%
PricesInternational/Regional ($'05/boe)
Coal 16 7 20 24 27 31 34 -7,7% 10,7% 1,6% 1,2% 1,4% 1,0%Oil 33 32 72 96 114 143 178 -0,2% 8,3% 3,0% 1,7% 2,3% 2,2%Gas 28 24 48 39 43 58 72 -1,2% 6,9% -2,1% 1,1% 3,1% 2,1%
GHG emissions (Mt CO2 eq.)Total GHG (excl. LULUCF) 3 936 5 225 10 639 14 771 18 375 19 626 18 796 2,9% 7,4% 3,3% 2,2% 0,7% -0,4%CO2 2 598 3 779 8 359 12 389 15 644 16 743 15 966 3,8% 8,3% 4,0% 2,4% 0,7% -0,5%CH4 1 011 1 039 1 636 1 486 1 628 1 663 1 577 0,3% 4,6% -1,0% 0,9% 0,2% -0,5%N2O 314 356 467 558 612 617 600 1,3% 2,8% 1,8% 0,9% 0,1% -0,3%F gases 13 51 177 338 492 603 654 14,8% 13,3% 6,7% 3,8% 2,1% 0,8%Total GHG from Energy and Industry 3 160 4 436 9 635 13 638 17 153 18 378 17 567 3,4% 8,1% 3,5% 2,3% 0,7% -0,5%CO2 Emissions from Fuel Comb. 2 300 3 234 6 716 9 977 12 881 14 107 13 670 3,5% 7,6% 4,0% 2,6% 0,9% -0,3%
Power generation/District heating 615 1 280 3 281 5 150 6 933 7 984 8 016 7,6% 9,9% 4,6% 3,0% 1,4% 0,0%Industry 867 992 1 765 2 378 2 753 2 589 2 179 1,4% 5,9% 3,0% 1,5% -0,6% -1,7%Buildings 446 326 482 602 713 802 821 -3,1% 4,0% 2,2% 1,7% 1,2% 0,2%Agriculture 96 47 81 96 101 102 100 -6,8% 5,5% 1,8% 0,4% 0,1% -0,2%Transport 115 229 463 782 1 057 1 146 1 110 7,1% 7,3% 5,4% 3,1% 0,8% -0,3%Other 162 359 644 968 1 325 1 484 1 444 8,3% 6,0% 4,2% 3,2% 1,1% -0,3%
CO2 captured (CCS) 0 0 0 0 3 11 20 n.s. n.s. n.s. 39,9% 13,8% 6,0%Coal 0 0 0 0 3 11 19 n.s. n.s. n.s. 50,5% 13,9% 6,0%Gas 0 0 0 0 0 0 1 n.s. n.s. n.s. 18,9% 13,1% 6,7%Biomass 0 0 0 0 0 0 0 n.s. n.s. n.s. 0,9% 0,6% 1,5%
Energy Balance, by fuel (Mtoe)Primary Production 997 1 244 2 247 2 737 3 532 4 030 3 977 2,2% 6,1% 2,0% 2,6% 1,3% -0,1%
Coal 636 834 1 667 1 869 2 208 2 242 1 947 2,7% 7,2% 1,1% 1,7% 0,2% -1,4%Oil 137 161 201 202 154 109 77 1,6% 2,3% 0,0% -2,7% -3,4% -3,4%Natural gas 13 22 77 148 353 548 588 5,8% 13,2% 6,7% 9,1% 4,5% 0,7%Biomass 200 203 205 197 225 289 332 0,1% 0,1% -0,4% 1,4% 2,5% 1,4%Nuclear1 0 4 19 126 281 420 506 n.s. 15,9% 20,6% 8,4% 4,1% 1,9%Hydro 11 19 62 117 149 152 153 5,8% 12,5% 6,6% 2,4% 0,2% 0,1%Other renewables 0 1 15 77 161 271 376 40,5% 30,9% 18,1% 7,6% 5,3% 3,3%
Net Imports - 128 - 47 156 856 1 253 1 422 1 553Coal - 108 - 104 - 80 358 548 668 814Oil - 22 59 234 446 630 697 664Natural gas 1 - 2 4 54 75 50 50Biomass 0 0 0 - 1 - 2 - 2 9Biofuels 0 0 0 0 3 10 16Electricity 0 - 1 - 1 - 1 - 1 - 1 - 1
Primary Energy Demand2 868 1 197 2 404 3 593 4 784 5 453 5 530 3,3% 7,2% 4,1% 2,9% 1,3% 0,1%Coal 528 730 1 587 2 228 2 755 2 910 2 761 3,3% 8,1% 3,4% 2,1% 0,5% -0,5%Oil 115 220 435 648 784 806 741 6,7% 7,1% 4,1% 1,9% 0,3% -0,8%Natural gas 14 21 81 202 429 598 637 4,0% 14,7% 9,5% 7,8% 3,4% 0,6%Biomass 200 203 205 196 223 287 341 0,1% 0,1% -0,5% 1,3% 2,5% 1,7%Nuclear1 0 4 19 126 281 420 506 n.s. 15,9% 20,6% 8,4% 4,1% 1,9%Hydro 11 19 62 117 149 152 153 5,8% 12,5% 6,6% 2,4% 0,2% 0,1%Other renewables 0 1 15 77 161 271 376 40,5% 30,9% 18,1% 7,6% 5,3% 3,3%
Primary Energy Demand, by sector (Mtoe)Primary Energy Demand 868 1 197 2 404 3 593 4 784 5 453 5 530 3,3% 7,2% 4,1% 2,9% 1,3% 0,1%Energy for Power Generation 168 350 931 1 652 2 413 2 978 3 213 7,6% 10,3% 5,9% 3,9% 2,1% 0,8%Other Transformation & Losses 50 115 377 673 1 059 1 377 1 551 8,6% 12,6% 6,0% 4,6% 2,7% 1,2%Energy Branch Consumption 55 117 215 339 472 547 554 7,9% 6,2% 4,7% 3,4% 1,5% 0,1%Final consumption 703 850 1 618 2 332 2 984 3 294 3 303 1,9% 6,7% 3,7% 2,5% 1,0% 0,0%
Steel, Non-Met. Minerals and Chem. 150 237 567 786 942 916 811 4,7% 9,1% 3,3% 1,8% -0,3% -1,2%Other Industry 117 125 256 456 671 788 807 0,6% 7,5% 5,9% 3,9% 1,6% 0,2%Non-Energy Use 46 62 134 178 210 216 200 3,0% 8,0% 2,9% 1,7% 0,3% -0,8%Residential 300 283 355 391 399 405 397 -0,6% 2,3% 1,0% 0,2% 0,1% -0,2%Services 25 41 98 177 286 414 512 4,9% 9,3% 6,0% 4,9% 3,8% 2,1%Agriculture 31 18 32 39 44 46 46 -5,2% 5,7% 2,3% 1,0% 0,5% 0,1%Road 21 59 136 235 323 364 371 11,1% 8,7% 5,6% 3,2% 1,2% 0,2%Rail 12 9 12 17 20 23 25 -2,2% 2,7% 3,3% 2,0% 1,4% 0,7%Aviation 1 4 11 24 48 71 79 22,1% 10,3% 7,9% 7,1% 4,0% 1,1%Other Transport 2 12 17 29 42 51 54 16,9% 3,8% 5,3% 3,8% 2,0% 0,6%
1 Primary energy from nuclear is calculated considering the primary heat equivalent of the electricity produced with an average efficiency of 33%
37

GECO2015 Baseline 150504 SUMMARY GHG & ENERGY BALANCE##### 100
China 1990 2000 2010 2020 2030 2040 2050 '90-'00 '00-'10 '10-'20 '20-'30 '30-'40 '40-'50Power Generation
Fuel Inputs Therm. Power (Mtoe) 157 326 835 1 332 1 822 2 135 2 178 7,6% 9,9% 4,8% 3,2% 1,6% 0,2%Coal 144 310 811 1 248 1 655 1 889 1 895 8,0% 10,1% 4,4% 2,9% 1,3% 0,0%Oil 12 13 6 16 24 32 34 0,7% -8,3% 11,2% 4,0% 3,1% 0,7%Gas 1 1 15 56 115 159 163 7,5% 28,1% 13,8% 7,5% 3,3% 0,2%Biomass & Waste 0 1 4 12 28 55 86 n.s. 16,8% 11,6% 9,0% 7,0% 4,6%Other 0 0 0 0 0 0 0 n.s. n.s. n.s. n.s. n.s. n.s.
Gross Elec. Generation (TWh e) 621 1 356 4 226 8 180 12 641 16 058 17 995 8,1% 12,0% 6,8% 4,4% 2,4% 1,1%Coal 443 1 062 3 273 5 352 7 503 8 834 9 078 9,1% 11,9% 5,0% 3,4% 1,6% 0,3%
of which CCS 0 0 0 0 4 13 25 n.s. n.s. n.s. n.s. 13,8% 6,5%Oil 49 46 13 69 101 138 151 -0,5% -11,7% 17,9% 3,9% 3,2% 0,9%Gas 3 6 69 262 591 861 947 7,6% 28,2% 14,3% 8,5% 3,8% 1,0%
of which CCS 0 0 0 0 0 1 3 n.s. n.s. n.s. n.s. 15,1% 7,2%Biomass & Waste 0 2 3 46 121 255 430 n.s. 3,3% 29,8% 10,3% 7,7% 5,4%
of which CCS 0 0 0 0 0 0 0 n.s. n.s. n.s. n.s. n.s. n.s.Nuclear 0 17 74 495 1 127 1 698 2 045 n.s. 16,0% 21,0% 8,6% 4,2% 1,9%Hydro 127 222 722 1 364 1 735 1 763 1 777 5,8% 12,5% 6,6% 2,4% 0,2% 0,1%Wind 0 1 70 547 1 357 2 229 2 953 n.s. n.s. 22,7% 9,5% 5,1% 2,9%Solar 0 0 1 45 103 270 581 26,7% 27,8% 47,1% 8,7% 10,1% 8,0%Other 0 0 0 0 2 11 33 n.s. n.s. -0,2% 30,0% 17,0% 11,2%
Generation Capacity (GWe) 149 336 1 012 1 865 2 908 3 794 4 606 8,5% 11,7% 6,3% 4,5% 2,7% 2,0%Coal 92 225 707 1 046 1 455 1 705 1 907 9,3% 12,1% 4,0% 3,4% 1,6% 1,1%
of which CCS 0 0 0 0 0 2 4 n.s. n.s. n.s. n.s. 14,1% 7,2%Oil 18 20 15 11 15 22 27 1,1% -2,9% -3,4% 3,8% 3,5% 2,2%Gas 3 8 31 67 126 195 241 11,7% 14,3% 7,9% 6,5% 4,5% 2,1%
of which CCS 0 0 0 0 0 0 0 n.s. n.s. n.s. n.s. 15,3% 7,7%Biomass & Waste 0 0 0 6 16 35 60 n.s. 0,0% 29,1% 10,2% 7,8% 5,6%
of which CCS 0 0 0 0 0 0 0 n.s. n.s. n.s. n.s. n.s. n.s.Nuclear 0 2 10 64 142 210 251 n.s. 16,6% 20,2% 8,4% 4,0% 1,8%Hydro 36 79 216 409 514 523 527 8,2% 10,5% 6,6% 2,3% 0,2% 0,1%Wind 0 0 31 233 570 925 1 210 n.s. 57,2% 22,2% 9,4% 5,0% 2,7%Solar 0 0 1 30 68 177 379 26,7% 31,7% 42,6% 8,5% 10,0% 7,9%Other 0 0 0 0 0 2 4 n.s. n.s. n.s. 29,3% 16,4% 10,7%
Total Final Consumption 2 (Mtoe) 703 850 1 618 2 332 2 984 3 294 3 303 1,9% 6,7% 3,7% 2,5% 1,0% 0,0%Coal 354 337 623 798 861 766 624 -0,5% 6,3% 2,5% 0,8% -1,2% -2,0%Oil 85 179 370 550 672 685 624 7,7% 7,6% 4,0% 2,0% 0,2% -0,9%Gas 10 15 52 108 230 317 343 4,3% 13,6% 7,6% 7,8% 3,3% 0,8%Electricity 41 89 297 581 898 1 142 1 284 8,0% 12,8% 6,9% 4,5% 2,4% 1,2%Heat 13 28 76 113 141 178 201 7,7% 10,6% 4,1% 2,2% 2,4% 1,3%Biomass & Other 200 202 201 181 182 206 226 0,1% -0,1% -1,0% 0,1% 1,2% 0,9%Share of Renewables 3 (%) 32% 27% 18% 17% 17% 19% 23% -1,4% -4,1% -0,8% 0,1% 1,3% 1,8%
Industry (incl. non-energy use) 312 423 957 1 420 1 823 1 920 1 818 3,1% 8,5% 4,0% 2,5% 0,5% -0,5%Coal 226 267 542 716 792 710 578 1,7% 7,3% 2,8% 1,0% -1,1% -2,0%Oil 38 69 141 185 199 178 135 6,0% 7,4% 2,8% 0,7% -1,1% -2,7%Gas 7 9 26 48 108 142 139 2,2% 11,1% 6,3% 8,3% 2,8% -0,2%Electricity 30 59 203 403 618 752 805 7,2% 13,1% 7,1% 4,4% 2,0% 0,7%Heat 11 19 45 56 68 78 84 5,9% 9,1% 2,1% 2,0% 1,4% 0,7%Biomass & Other 0 0 0 11 38 61 76 n.s. n.s. n.s. 13,1% 4,8% 2,3%
Buildings 325 324 453 568 685 819 909 0,0% 3,4% 2,3% 1,9% 1,8% 1,0%Coal 105 60 69 70 58 47 37 -5,4% 1,3% 0,1% -1,8% -2,0% -2,3%Oil 7 23 47 58 62 65 61 12,9% 7,2% 2,2% 0,6% 0,4% -0,6%Gas 2 5 26 60 122 175 205 10,3% 17,0% 8,9% 7,4% 3,7% 1,6%Electricity 8 24 82 159 247 340 413 12,2% 13,1% 6,9% 4,5% 3,2% 2,0%Heat 3 9 31 57 73 99 117 13,4% 13,2% 6,5% 2,4% 3,2% 1,7%Biomass & Other 200 202 200 164 123 93 75 0,1% -0,1% -1,9% -2,9% -2,8% -2,1%
Agriculture 31 18 32 39 44 46 46 -5,2% 5,7% 2,3% 1,0% 0,5% 0,1%Coal 11 5 9 10 8 7 7 -7,2% 5,3% 0,6% -1,2% -1,2% -1,2%Oil 16 8 14 18 21 23 23 -6,4% 5,6% 2,7% 1,4% 0,7% 0,2%Gas 0 0 0 0 0 0 0 n.s. n.s. 5,1% 2,0% 1,3% 0,7%Electricity 4 5 8 11 13 15 15 2,2% 6,2% 3,0% 1,7% 1,0% 0,4%Heat 0 0 0 0 0 0 0 n.s. n.s. n.s. n.s. n.s. n.s.Biomass & Other 0 0 0 0 1 1 1 n.s. n.s. n.s. 10,1% 4,2% 2,8%
Transport 35 84 176 304 433 509 529 9,1% 7,7% 5,6% 3,6% 1,6% 0,4%Coal 11 4 3 3 2 2 2 -8,4% -3,3% -0,4% -2,0% -2,0% -2,0%Oil 24 78 168 288 390 420 405 12,6% 8,0% 5,5% 3,1% 0,7% -0,4%Gas 0 0 0 0 0 0 0 n.s. n.s. n.s. n.s. n.s. n.s.Electricity 1 1 3 8 20 36 50 9,6% 10,3% 8,6% 9,9% 5,9% 3,4%Heat 0 0 0 0 0 0 0 n.s. n.s. n.s. n.s. n.s. n.s.Biomass & Other 0 0 1 5 21 52 73 n.s. n.s. 17,0% 15,0% 9,6% 3,6%
Energy Branch Consumption 55 117 215 339 472 547 554 7,9% 6,2% 4,7% 3,4% 1,5% 0,1%Other Transformation & Losses 4 50 115 377 673 1 059 1 377 1 551 8,6% 12,6% 6,0% 4,6% 2,7% 1,2%
2 does not include international aviation and maritime bunkers; includes non-energy uses3 ratio of renewable energy over final energy demand increased by distribution losses and self consumption of electricity and steam plants4 includes statistical differences
38
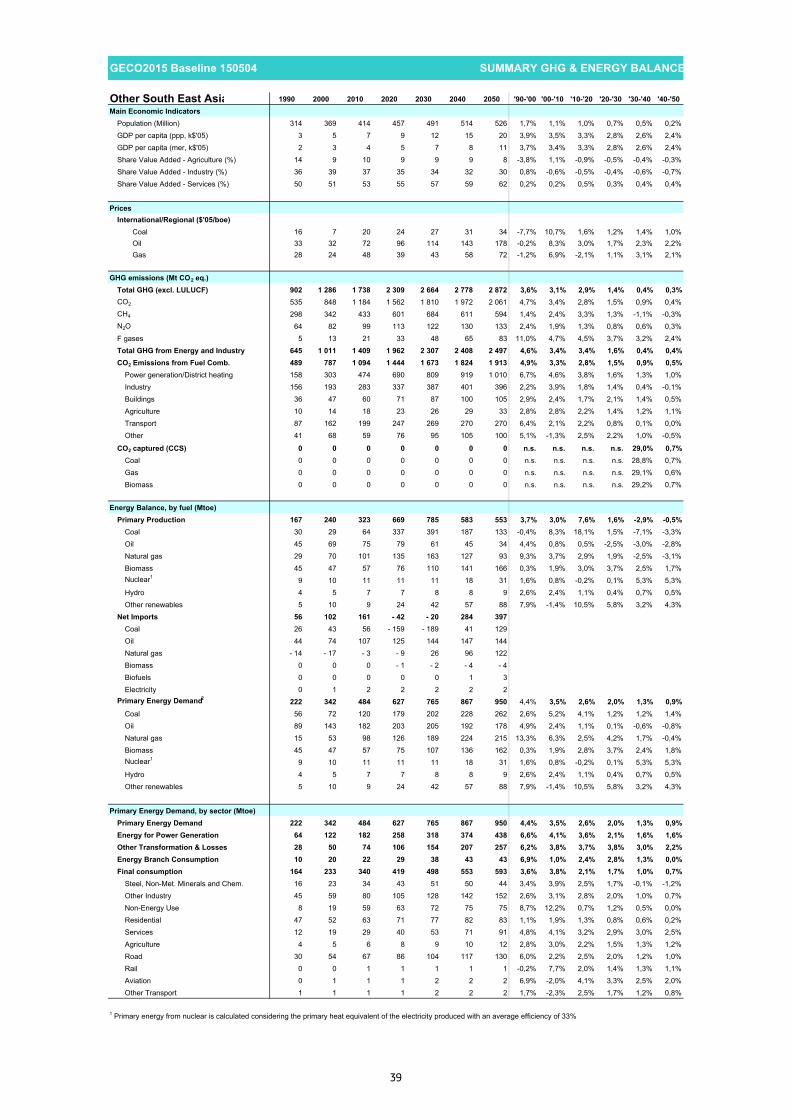
GECO2015 Baseline 150504 SUMMARY GHG & ENERGY BALANCE##### 100
Other South East Asia 1990 2000 2010 2020 2030 2040 2050 '90-'00 '00-'10 '10-'20 '20-'30 '30-'40 '40-'50Main Economic Indicators
Population (Million) 314 369 414 457 491 514 526 1,7% 1,1% 1,0% 0,7% 0,5% 0,2%GDP per capita (ppp, k$'05) 3 5 7 9 12 15 20 3,9% 3,5% 3,3% 2,8% 2,6% 2,4%GDP per capita (mer, k$'05) 2 3 4 5 7 8 11 3,7% 3,4% 3,3% 2,8% 2,6% 2,4%Share Value Added - Agriculture (%) 14 9 10 9 9 9 8 -3,8% 1,1% -0,9% -0,5% -0,4% -0,3%Share Value Added - Industry (%) 36 39 37 35 34 32 30 0,8% -0,6% -0,5% -0,4% -0,6% -0,7%Share Value Added - Services (%) 50 51 53 55 57 59 62 0,2% 0,2% 0,5% 0,3% 0,4% 0,4%
PricesInternational/Regional ($'05/boe)
Coal 16 7 20 24 27 31 34 -7,7% 10,7% 1,6% 1,2% 1,4% 1,0%Oil 33 32 72 96 114 143 178 -0,2% 8,3% 3,0% 1,7% 2,3% 2,2%Gas 28 24 48 39 43 58 72 -1,2% 6,9% -2,1% 1,1% 3,1% 2,1%
GHG emissions (Mt CO2 eq.)Total GHG (excl. LULUCF) 902 1 286 1 738 2 309 2 664 2 778 2 872 3,6% 3,1% 2,9% 1,4% 0,4% 0,3%CO2 535 848 1 184 1 562 1 810 1 972 2 061 4,7% 3,4% 2,8% 1,5% 0,9% 0,4%CH4 298 342 433 601 684 611 594 1,4% 2,4% 3,3% 1,3% -1,1% -0,3%N2O 64 82 99 113 122 130 133 2,4% 1,9% 1,3% 0,8% 0,6% 0,3%F gases 5 13 21 33 48 65 83 11,0% 4,7% 4,5% 3,7% 3,2% 2,4%Total GHG from Energy and Industry 645 1 011 1 409 1 962 2 307 2 408 2 497 4,6% 3,4% 3,4% 1,6% 0,4% 0,4%CO2 Emissions from Fuel Comb. 489 787 1 094 1 444 1 673 1 824 1 913 4,9% 3,3% 2,8% 1,5% 0,9% 0,5%
Power generation/District heating 158 303 474 690 809 919 1 010 6,7% 4,6% 3,8% 1,6% 1,3% 1,0%Industry 156 193 283 337 387 401 396 2,2% 3,9% 1,8% 1,4% 0,4% -0,1%Buildings 36 47 60 71 87 100 105 2,9% 2,4% 1,7% 2,1% 1,4% 0,5%Agriculture 10 14 18 23 26 29 33 2,8% 2,8% 2,2% 1,4% 1,2% 1,1%Transport 87 162 199 247 269 270 270 6,4% 2,1% 2,2% 0,8% 0,1% 0,0%Other 41 68 59 76 95 105 100 5,1% -1,3% 2,5% 2,2% 1,0% -0,5%
CO2 captured (CCS) 0 0 0 0 0 0 0 n.s. n.s. n.s. n.s. 29,0% 0,7%Coal 0 0 0 0 0 0 0 n.s. n.s. n.s. n.s. 28,8% 0,7%Gas 0 0 0 0 0 0 0 n.s. n.s. n.s. n.s. 29,1% 0,6%Biomass 0 0 0 0 0 0 0 n.s. n.s. n.s. n.s. 29,2% 0,7%
Energy Balance, by fuel (Mtoe)Primary Production 167 240 323 669 785 583 553 3,7% 3,0% 7,6% 1,6% -2,9% -0,5%
Coal 30 29 64 337 391 187 133 -0,4% 8,3% 18,1% 1,5% -7,1% -3,3%Oil 45 69 75 79 61 45 34 4,4% 0,8% 0,5% -2,5% -3,0% -2,8%Natural gas 29 70 101 135 163 127 93 9,3% 3,7% 2,9% 1,9% -2,5% -3,1%Biomass 45 47 57 76 110 141 166 0,3% 1,9% 3,0% 3,7% 2,5% 1,7%Nuclear1 9 10 11 11 11 18 31 1,6% 0,8% -0,2% 0,1% 5,3% 5,3%Hydro 4 5 7 7 8 8 9 2,6% 2,4% 1,1% 0,4% 0,7% 0,5%Other renewables 5 10 9 24 42 57 88 7,9% -1,4% 10,5% 5,8% 3,2% 4,3%
Net Imports 56 102 161 - 42 - 20 284 397Coal 26 43 56 - 159 - 189 41 129Oil 44 74 107 125 144 147 144Natural gas - 14 - 17 - 3 - 9 26 96 122Biomass 0 0 0 - 1 - 2 - 4 - 4Biofuels 0 0 0 0 0 1 3Electricity 0 1 2 2 2 2 2
Primary Energy Demand2 222 342 484 627 765 867 950 4,4% 3,5% 2,6% 2,0% 1,3% 0,9%Coal 56 72 120 179 202 228 262 2,6% 5,2% 4,1% 1,2% 1,2% 1,4%Oil 89 143 182 203 205 192 178 4,9% 2,4% 1,1% 0,1% -0,6% -0,8%Natural gas 15 53 98 126 189 224 215 13,3% 6,3% 2,5% 4,2% 1,7% -0,4%Biomass 45 47 57 75 107 136 162 0,3% 1,9% 2,8% 3,7% 2,4% 1,8%Nuclear1 9 10 11 11 11 18 31 1,6% 0,8% -0,2% 0,1% 5,3% 5,3%Hydro 4 5 7 7 8 8 9 2,6% 2,4% 1,1% 0,4% 0,7% 0,5%Other renewables 5 10 9 24 42 57 88 7,9% -1,4% 10,5% 5,8% 3,2% 4,3%
Primary Energy Demand, by sector (Mtoe)Primary Energy Demand 222 342 484 627 765 867 950 4,4% 3,5% 2,6% 2,0% 1,3% 0,9%Energy for Power Generation 64 122 182 258 318 374 438 6,6% 4,1% 3,6% 2,1% 1,6% 1,6%Other Transformation & Losses 28 50 74 106 154 207 257 6,2% 3,8% 3,7% 3,8% 3,0% 2,2%Energy Branch Consumption 10 20 22 29 38 43 43 6,9% 1,0% 2,4% 2,8% 1,3% 0,0%Final consumption 164 233 340 419 498 553 593 3,6% 3,8% 2,1% 1,7% 1,0% 0,7%
Steel, Non-Met. Minerals and Chem. 16 23 34 43 51 50 44 3,4% 3,9% 2,5% 1,7% -0,1% -1,2%Other Industry 45 59 80 105 128 142 152 2,6% 3,1% 2,8% 2,0% 1,0% 0,7%Non-Energy Use 8 19 59 63 72 75 75 8,7% 12,2% 0,7% 1,2% 0,5% 0,0%Residential 47 52 63 71 77 82 83 1,1% 1,9% 1,3% 0,8% 0,6% 0,2%Services 12 19 29 40 53 71 91 4,8% 4,1% 3,2% 2,9% 3,0% 2,5%Agriculture 4 5 6 8 9 10 12 2,8% 3,0% 2,2% 1,5% 1,3% 1,2%Road 30 54 67 86 104 117 130 6,0% 2,2% 2,5% 2,0% 1,2% 1,0%Rail 0 0 1 1 1 1 1 -0,2% 7,7% 2,0% 1,4% 1,3% 1,1%Aviation 0 1 1 1 2 2 2 6,9% -2,0% 4,1% 3,3% 2,5% 2,0%Other Transport 1 1 1 1 2 2 2 1,7% -2,3% 2,5% 1,7% 1,2% 0,8%
1 Primary energy from nuclear is calculated considering the primary heat equivalent of the electricity produced with an average efficiency of 33%
39

GECO2015 Baseline 150504 SUMMARY GHG & ENERGY BALANCE##### 100
Other South East Asia 1990 2000 2010 2020 2030 2040 2050 '90-'00 '00-'10 '10-'20 '20-'30 '30-'40 '40-'50Power Generation
Fuel Inputs Therm. Power (Mtoe) 47 96 155 216 257 290 311 7,5% 4,9% 3,4% 1,8% 1,2% 0,7%Coal 22 40 70 118 135 159 193 6,4% 5,7% 5,3% 1,4% 1,7% 1,9%Oil 18 20 9 12 12 11 9 1,1% -7,5% 2,5% 0,0% -0,7% -1,6%Gas 6 33 71 78 100 106 90 18,3% 7,8% 1,0% 2,5% 0,6% -1,7%Biomass & Waste 0 1 4 6 7 9 13 17,0% 13,9% 3,3% 1,1% 2,9% 3,9%Other 0 1 1 2 4 4 5 7,8% -1,6% 10,0% 5,0% 1,0% 2,0%
Gross Elec. Generation (TWh e) 274 521 821 1 129 1 414 1 767 2 151 6,6% 4,7% 3,2% 2,3% 2,3% 2,0%Coal 85 164 278 489 576 697 871 6,8% 5,4% 5,8% 1,6% 1,9% 2,3%
of which CCS 0 0 0 0 0 0 0 n.s. n.s. n.s. n.s. n.s. n.s.Oil 77 86 38 51 50 47 40 1,1% -7,8% 2,8% 0,0% -0,7% -1,6%Gas 26 158 366 404 532 586 496 19,7% 8,8% 1,0% 2,8% 1,0% -1,7%
of which CCS 0 0 0 0 0 0 0 n.s. n.s. n.s. n.s. n.s. n.s.Biomass & Waste 1 3 10 16 21 37 62 16,2% 13,5% 5,3% 2,8% 5,7% 5,3%
of which CCS 0 0 0 0 0 0 0 n.s. n.s. n.s. n.s. n.s. n.s.Nuclear 33 39 42 41 43 74 124 1,6% 0,8% -0,2% 0,5% 5,5% 5,3%Hydro 46 60 76 86 89 95 99 2,6% 2,4% 1,1% 0,4% 0,7% 0,5%Wind 0 0 1 12 42 120 236 n.s. n.s. 25,0% 13,6% 10,9% 7,0%Solar 0 0 0 5 19 65 162 n.s. n.s. 33,6% 13,8% 13,1% 9,7%Other 5 12 10 26 42 47 60 7,8% -1,6% 10,0% 5,1% 1,2% 2,3%
Generation Capacity (GWe) 66 127 193 246 305 399 518 6,7% 4,3% 2,4% 2,2% 2,7% 2,6%Coal 20 32 48 74 87 104 127 4,7% 4,1% 4,4% 1,7% 1,7% 2,0%
of which CCS 0 0 0 0 0 0 0 n.s. n.s. n.s. n.s. n.s. n.s.Oil 20 37 30 25 19 11 10 6,1% -1,9% -1,8% -2,8% -5,3% -1,4%Gas 5 28 72 91 117 132 105 17,7% 10,0% 2,4% 2,5% 1,2% -2,2%
of which CCS 0 0 0 0 0 0 0 n.s. n.s. n.s. n.s. n.s. n.s.Biomass & Waste 0 2 3 2 3 5 9 38,6% 1,5% -0,9% 2,3% 5,6% 5,4%
of which CCS 0 0 0 0 0 0 0 n.s. n.s. n.s. n.s. n.s. n.s.Nuclear 5 5 5 5 5 9 15 0,0% 0,2% 0,1% 0,5% 5,5% 5,3%Hydro 14 21 32 36 37 39 41 4,1% 4,4% 0,9% 0,4% 0,7% 0,5%Wind 0 0 1 5 18 49 95 n.s. n.s. 24,3% 13,4% 10,8% 6,9%Solar 0 0 0 3 13 43 108 n.s. n.s. 33,4% 13,8% 13,1% 9,6%Other 1 2 2 4 6 6 8 7,9% 0,2% 6,5% 4,9% 0,5% 1,9%
Total Final Consumption 2 (Mtoe) 164 233 340 419 498 553 593 3,6% 3,8% 2,1% 1,7% 1,0% 0,7%Coal 34 31 49 59 65 67 67 -0,8% 4,7% 1,9% 0,9% 0,3% 0,0%Oil 62 110 161 179 180 169 158 5,8% 3,9% 1,0% 0,1% -0,6% -0,7%Gas 3 7 14 29 62 84 93 10,4% 7,3% 7,6% 7,9% 3,1% 0,9%Electricity 20 39 64 87 109 136 165 7,1% 5,0% 3,1% 2,3% 2,2% 2,0%Heat 1 1 1 1 1 2 6 -2,9% 4,0% 1,8% 1,6% 6,9% 8,7%Biomass & Other 45 46 51 64 81 94 106 0,1% 1,2% 2,3% 2,3% 1,6% 1,2%Share of Renewables 3 (%) 30% 22% 19% 20% 22% 25% 30% -2,9% -1,3% 0,3% 0,9% 1,3% 1,7%
Industry (incl. non-energy use) 70 100 173 211 250 267 272 3,7% 5,6% 2,1% 1,7% 0,7% 0,2%Coal 29 26 44 54 60 62 62 -0,9% 5,2% 2,1% 1,1% 0,3% 0,0%Oil 22 41 75 75 70 59 48 6,1% 6,4% -0,1% -0,7% -1,7% -2,1%Gas 2 6 12 23 46 60 63 12,6% 8,1% 6,5% 7,2% 2,7% 0,6%Electricity 10 18 29 41 52 60 66 6,4% 5,0% 3,6% 2,3% 1,3% 1,0%Heat 0 0 0 0 0 0 0 -3,6% 0,7% 0,0% -0,2% -0,3% -0,2%Biomass & Other 7 10 12 18 23 27 33 3,5% 2,1% 4,3% 2,3% 1,8% 1,8%
Buildings 59 71 92 111 130 152 174 1,9% 2,5% 1,9% 1,6% 1,6% 1,3%Coal 5 5 5 6 5 5 5 -0,1% 1,1% 0,5% -0,3% -0,6% -0,9%Oil 5 8 11 11 8 7 6 5,6% 3,1% -0,1% -2,3% -2,2% -1,9%Gas 1 1 2 6 17 25 29 4,8% 3,0% 12,7% 10,3% 4,2% 1,6%Electricity 10 21 34 44 54 69 87 7,9% 4,9% 2,7% 1,9% 2,5% 2,3%Heat 1 0 1 1 1 2 5 -2,5% 5,3% 2,4% 2,0% 7,9% 9,3%Biomass & Other 38 36 39 43 45 45 42 -0,6% 0,8% 1,0% 0,3% 0,0% -0,6%
Agriculture 4 5 6 8 9 10 12 2,8% 3,0% 2,2% 1,5% 1,3% 1,2%Coal 0 0 0 0 0 0 0 -14,4% -0,9% 0,9% 0,0% 0,0% 0,0%Oil 3 4 6 7 8 9 10 3,2% 2,8% 2,2% 1,4% 1,3% 1,1%Gas 0 0 0 0 0 0 0 n.s. n.s. n.s. n.s. n.s. n.s.Electricity 0 0 0 1 1 1 1 2,1% 5,2% 2,6% 2,5% 2,3% 2,1%Heat 0 0 0 0 0 0 0 n.s. n.s. n.s. n.s. n.s. n.s.Biomass & Other 0 0 0 0 0 0 0 3,3% 5,4% 0,5% 0,0% 0,0% 0,0%
Transport 32 57 70 89 108 122 136 5,8% 2,1% 2,5% 2,0% 1,2% 1,1%Coal 0 0 0 0 0 0 0 -7,2% -3,7% 4,5% 0,0% 0,0% 0,0%Oil 32 57 69 86 94 94 94 5,8% 2,0% 2,2% 0,8% 0,1% 0,0%Gas 0 0 0 0 0 0 0 n.s. n.s. n.s. n.s. n.s. n.s.Electricity 0 0 0 0 2 6 11 5,6% 13,5% 3,9% 16,2% 12,5% 6,1%Heat 0 0 0 0 0 0 0 n.s. n.s. n.s. n.s. n.s. n.s.Biomass & Other 0 0 0 3 13 22 31 n.s. n.s. 23,8% 16,8% 5,5% 3,3%
Energy Branch Consumption 10 20 22 29 38 43 43 6,9% 1,0% 2,4% 2,8% 1,3% 0,0%Other Transformation & Losses 4 28 50 74 106 154 207 257 6,2% 3,8% 3,7% 3,8% 3,0% 2,2%
2 does not include international aviation and maritime bunkers; includes non-energy uses3 ratio of renewable energy over final energy demand increased by distribution losses and self consumption of electricity and steam plants4 includes statistical differences
40

GECO2015 Baseline 150504 SUMMARY GHG & ENERGY BALANCE##### 100
Indonesia 1990 2000 2010 2020 2030 2040 2050 '90-'00 '00-'10 '10-'20 '20-'30 '30-'40 '40-'50Main Economic Indicators
Population (Million) 179 209 241 269 293 311 321 1,6% 1,4% 1,1% 0,9% 0,6% 0,3%GDP per capita (ppp, k$'05) 2 3 4 6 10 14 19 2,6% 3,8% 4,8% 4,4% 3,6% 3,3%GDP per capita (mer, k$'05) 1 1 2 3 4 5 8 2,6% 3,8% 4,8% 4,4% 3,6% 3,3%Share Value Added - Agriculture (%) 19 16 15 12 11 10 10 -2,2% -0,2% -2,0% -1,1% -0,6% -0,4%Share Value Added - Industry (%) 39 46 47 47 46 43 40 1,6% 0,2% 0,1% -0,3% -0,6% -0,9%Share Value Added - Services (%) 41 38 38 40 43 46 50 -0,7% -0,2% 0,6% 0,6% 0,8% 0,9%
PricesInternational/Regional ($'05/boe)
Coal 16 7 20 24 27 31 34 -7,7% 10,7% 1,6% 1,2% 1,4% 1,0%Oil 33 32 72 96 114 143 178 -0,2% 8,3% 3,0% 1,7% 2,3% 2,2%Gas 28 24 48 39 43 58 72 -1,2% 6,9% -2,1% 1,1% 3,1% 2,1%
GHG emissions (Mt CO2 eq.)Total GHG (excl. LULUCF) 364 519 723 973 1 141 1 267 1 318 3,6% 3,4% 3,0% 1,6% 1,1% 0,4%CO2 162 302 440 639 786 898 942 6,4% 3,8% 3,8% 2,1% 1,3% 0,5%CH4 141 157 213 254 263 270 272 1,1% 3,1% 1,8% 0,4% 0,3% 0,1%N2O 60 60 69 80 91 99 104 0,0% 1,4% 1,4% 1,2% 0,9% 0,5%F gases 2 0 0 0 0 0 0 -18,4% 0,7% 2,3% 1,7% 1,3% 0,9%Total GHG from Energy and Industry 236 393 570 803 951 1 062 1 103 5,2% 3,8% 3,5% 1,7% 1,1% 0,4%CO2 Emissions from Fuel Comb. 152 285 413 599 733 833 869 6,5% 3,8% 3,8% 2,0% 1,3% 0,4%
Power generation/District heating 22 61 121 199 255 311 319 10,7% 7,0% 5,1% 2,5% 2,0% 0,2%Industry 39 72 121 169 178 197 201 6,4% 5,3% 3,4% 0,5% 1,0% 0,2%Buildings 21 37 24 23 31 33 35 6,0% -4,4% -0,4% 3,0% 0,9% 0,4%Agriculture 3 8 9 11 14 16 19 9,3% 2,0% 1,7% 2,2% 1,7% 1,5%Transport 35 70 99 139 167 172 182 7,2% 3,5% 3,5% 1,9% 0,3% 0,6%Other 32 37 40 59 89 104 114 1,5% 0,8% 4,0% 4,2% 1,6% 0,9%
CO2 captured (CCS) 0 0 0 0 0 0 0 n.s. n.s. n.s. n.s. 9,3% 2,1%Coal 0 0 0 0 0 0 0 n.s. n.s. n.s. n.s. 9,3% 2,2%Gas 0 0 0 0 0 0 0 n.s. n.s. n.s. n.s. 9,2% 2,0%Biomass 0 0 0 0 0 0 0 n.s. n.s. n.s. n.s. 9,4% 2,2%
Energy Balance, by fuel (Mtoe)Primary Production 167 236 372 499 353 270 239 3,5% 4,7% 3,0% -3,4% -2,6% -1,2%
Coal 7 53 189 280 103 16 0 22,4% 13,6% 4,0% -9,5% -17,0% n.s.Oil 76 72 49 50 45 39 24 -0,6% -3,7% 0,2% -1,2% -1,3% -4,8%Natural gas 40 58 70 88 106 94 67 3,7% 1,9% 2,4% 1,8% -1,1% -3,4%Biomass 42 48 54 65 72 81 89 1,4% 1,1% 1,9% 1,0% 1,1% 1,0%Nuclear1 0 0 0 0 0 2 6 n.s. n.s. n.s. n.s. n.s. 9,9%Hydro 0 1 2 1 1 2 2 5,8% 5,8% -0,8% 0,4% 0,7% 0,6%Other renewables 1 4 8 14 26 37 52 15,8% 6,8% 5,3% 6,7% 3,4% 3,5%
Net Imports - 69 - 86 - 173 - 226 - 11 130 201Coal - 3 - 41 - 159 - 231 - 42 60 81Oil - 41 - 14 17 37 45 51 66Natural gas - 25 - 31 - 31 - 28 - 8 20 56Biomass 0 0 0 - 4 - 5 - 2 - 1Biofuels 0 0 0 0 - 1 - 1 - 1Electricity 0 0 0 0 0 0 0
Primary Energy Demand2 97 150 199 272 342 400 440 4,5% 2,9% 3,2% 2,3% 1,6% 1,0%Coal 4 12 30 49 61 76 81 10,7% 9,4% 4,8% 2,3% 2,3% 0,6%Oil 34 58 67 88 89 90 90 5,3% 1,4% 2,8% 0,2% 0,1% 0,0%Natural gas 15 27 39 60 98 115 123 6,0% 3,9% 4,5% 5,0% 1,6% 0,7%Biomass 42 48 54 61 67 79 88 1,4% 1,1% 1,3% 0,9% 1,6% 1,1%Nuclear1 0 0 0 0 0 2 6 n.s. n.s. n.s. n.s. n.s. 9,9%Hydro 0 1 2 1 1 2 2 5,8% 5,8% -0,8% 0,4% 0,7% 0,6%Other renewables 1 4 8 14 26 37 52 15,8% 6,8% 5,3% 6,7% 3,4% 3,5%
Primary Energy Demand, by sector (Mtoe)Primary Energy Demand 97 150 199 272 342 400 440 4,5% 2,9% 3,2% 2,3% 1,6% 1,0%Energy for Power Generation 8 24 46 74 106 136 161 11,7% 6,7% 4,9% 3,6% 2,5% 1,7%Other Transformation & Losses 5 10 13 23 45 73 95 8,0% 2,7% 6,1% 6,8% 5,1% 2,6%Energy Branch Consumption 10 11 12 18 28 33 35 0,9% 0,9% 4,1% 4,3% 1,6% 0,7%Final consumption 79 120 155 203 234 263 285 4,2% 2,7% 2,7% 1,4% 1,1% 0,8%
Steel, Non-Met. Minerals and Chem. 3 5 9 21 13 15 15 6,3% 6,0% 8,7% -4,5% 0,9% 0,2%Other Industry 15 25 36 49 66 76 82 5,2% 3,7% 2,9% 3,1% 1,4% 0,7%Non-Energy Use 7 10 9 11 14 16 17 3,0% -1,0% 2,2% 2,7% 1,2% 0,4%Residential 42 52 58 61 61 59 57 2,2% 1,1% 0,6% 0,0% -0,3% -0,3%Services 1 4 5 8 12 18 26 13,3% 3,1% 4,4% 4,6% 4,2% 3,6%Agriculture 1 2 3 3 4 5 6 9,3% 2,0% 1,7% 2,2% 1,7% 1,5%Road 9 19 31 43 53 59 64 7,3% 4,9% 3,3% 2,1% 1,1% 0,9%Rail 0 0 0 0 0 0 0 n.s. n.s. n.s. n.s. n.s. n.s.Aviation 0 1 2 4 7 10 13 7,4% 14,1% 6,4% 5,1% 3,5% 2,9%Other Transport 1 2 2 3 4 5 6 7,9% 2,0% 4,2% 3,4% 2,3% 1,7%
1 Primary energy from nuclear is calculated considering the primary heat equivalent of the electricity produced with an average efficiency of 33%
41

GECO2015 Baseline 150504 SUMMARY GHG & ENERGY BALANCE##### 100
Indonesia 1990 2000 2010 2020 2030 2040 2050 '90-'00 '00-'10 '10-'20 '20-'30 '30-'40 '40-'50Power Generation
Fuel Inputs Therm. Power (Mtoe) 7 19 37 59 79 96 102 11,3% 6,7% 5,0% 2,8% 2,0% 0,7%Coal 2 8 19 35 45 57 59 13,7% 8,3% 6,5% 2,4% 2,5% 0,3%Oil 4 5 8 7 7 8 7 1,5% 6,3% -1,3% -0,4% 1,5% -2,1%Gas 0 6 9 15 23 24 26 39,3% 4,1% 5,9% 4,4% 0,4% 0,8%Biomass & Waste 0 0 0 0 1 3 7 n.s. 31,8% 21,3% 15,2% 10,4% 7,9%Other 0 0 1 1 2 3 3 15,8% 6,8% 4,7% 6,0% 1,2% 2,0%
Gross Elec. Generation (TWh e) 33 93 170 279 400 543 694 11,1% 6,2% 5,1% 3,7% 3,1% 2,5%Coal 10 34 68 143 192 260 288 13,3% 7,2% 7,7% 3,0% 3,1% 1,0%
of which CCS 0 0 0 0 0 0 0 n.s. n.s. n.s. n.s. n.s. n.s.Oil 15 18 35 31 30 35 29 1,8% 6,5% -1,0% -0,4% 1,5% -2,0%Gas 1 26 40 71 114 122 136 42,9% 4,4% 5,9% 4,9% 0,7% 1,1%
of which CCS 0 0 0 0 0 0 0 n.s. n.s. n.s. n.s. n.s. n.s.Biomass & Waste 0 0 0 1 5 15 34 n.s. n.s. n.s. 16,2% 11,0% 8,5%
of which CCS 0 0 0 0 0 0 0 n.s. n.s. n.s. n.s. n.s. n.s.Nuclear 0 0 0 0 0 9 24 n.s. n.s. n.s. n.s. n.s. 9,9%Hydro 6 10 18 16 17 18 19 5,8% 5,8% -0,8% 0,4% 0,7% 0,6%Wind 0 0 0 2 12 40 87 n.s. n.s. n.s. 20,1% 13,1% 8,1%Solar 0 0 0 0 3 14 42 n.s. n.s. n.s. 23,7% 16,7% 11,8%Other 1 5 9 15 27 30 37 15,8% 6,8% 4,7% 6,0% 1,2% 2,1%
Generation Capacity (GWe) 13 25 34 60 81 110 164 6,9% 3,0% 5,8% 3,0% 3,1% 4,0%Coal 2 8 13 31 37 45 52 16,1% 5,4% 9,0% 1,9% 1,9% 1,5%
of which CCS 0 0 0 0 0 0 0 n.s. n.s. n.s. n.s. n.s. n.s.Oil 7 5 6 9 10 9 9 -4,6% 2,4% 4,9% 0,5% -1,4% -0,1%Gas 1 8 10 13 18 20 23 32,6% 2,0% 2,0% 3,9% 0,6% 1,6%
of which CCS 0 0 0 0 0 0 0 n.s. n.s. n.s. n.s. n.s. n.s.Biomass & Waste 0 0 0 0 1 2 5 n.s. n.s. n.s. 16,3% 11,2% 8,8%
of which CCS 0 0 0 0 0 0 0 n.s. n.s. n.s. n.s. n.s. n.s.Nuclear 0 0 0 0 0 1 4 n.s. n.s. n.s. n.s. n.s. 9,6%Hydro 3 4 4 4 4 5 5 2,9% -1,2% 1,0% 0,4% 0,7% 0,6%Wind 0 0 0 1 5 16 35 n.s. n.s. n.s. 20,0% 12,9% 8,0%Solar 0 0 0 0 2 9 27 n.s. n.s. n.s. 23,9% 16,7% 11,9%Other 0 0 1 2 4 4 5 9,9% 12,7% 5,8% 6,0% 0,6% 1,6%
Total Final Consumption 2 (Mtoe) 79 120 155 203 234 263 285 4,2% 2,7% 2,7% 1,4% 1,1% 0,8%Coal 2 5 13 16 18 21 24 8,1% 10,7% 2,0% 1,6% 1,3% 1,3%Oil 27 48 61 83 86 85 86 6,1% 2,3% 3,2% 0,3% -0,1% 0,1%Gas 6 12 16 23 39 49 51 6,7% 3,2% 3,9% 5,2% 2,3% 0,4%Electricity 2 7 13 21 30 41 52 10,8% 6,5% 5,1% 3,7% 3,1% 2,5%Heat 0 0 0 1 2 6 10 n.s. n.s. n.s. 11,3% 12,0% 4,1%Biomass & Other 42 48 53 60 60 61 62 1,4% 1,0% 1,2% 0,0% 0,2% 0,3%Share of Renewables 3 (%) 59% 45% 37% 32% 30% 30% 33% -2,7% -1,8% -1,4% -0,8% 0,2% 0,7%
Industry (incl. non-energy use) 25 40 55 81 94 107 114 4,8% 3,1% 4,0% 1,5% 1,3% 0,6%Coal 2 5 13 16 18 21 24 8,0% 10,7% 2,0% 1,6% 1,3% 1,3%Oil 9 13 15 24 18 16 13 3,8% 1,9% 4,7% -3,2% -1,1% -1,7%Gas 6 11 16 22 32 40 40 6,7% 3,2% 3,3% 4,1% 2,1% 0,2%Electricity 1 3 4 8 11 13 15 8,9% 4,2% 5,7% 3,6% 1,9% 1,1%Heat 0 0 0 0 0 0 0 n.s. n.s. n.s. n.s. n.s. n.s.Biomass & Other 7 9 6 12 15 18 22 1,8% -3,0% 6,5% 2,0% 1,8% 2,1%
Buildings 43 55 63 69 73 77 82 2,7% 1,2% 0,9% 0,6% 0,6% 0,7%Coal 0 0 0 0 0 0 0 n.s. n.s. n.s. n.s. n.s. n.s.Oil 7 12 7 6 5 4 3 5,9% -4,5% -2,2% -2,1% -2,5% -2,1%Gas 0 0 0 2 7 9 11 8,1% 14,4% 27,5% 14,4% 3,5% 1,5%Electricity 1 4 8 13 18 25 33 12,6% 7,9% 4,7% 3,4% 3,1% 2,8%Heat 0 0 0 1 2 6 10 n.s. n.s. n.s. 11,3% 12,0% 4,1%Biomass & Other 35 40 47 47 41 32 26 1,3% 1,7% 0,0% -1,4% -2,2% -2,1%
Agriculture 1 2 3 3 4 5 6 9,3% 2,0% 1,7% 2,2% 1,7% 1,5%Coal 0 0 0 0 0 0 0 n.s. n.s. n.s. n.s. n.s. n.s.Oil 1 2 3 3 4 5 6 9,3% 2,0% 1,7% 2,2% 1,7% 1,5%Gas 0 0 0 0 0 0 0 n.s. n.s. n.s. n.s. n.s. n.s.Electricity 0 0 0 0 0 0 0 n.s. n.s. n.s. n.s. n.s. n.s.Heat 0 0 0 0 0 0 0 n.s. n.s. n.s. n.s. n.s. n.s.Biomass & Other 0 0 0 0 0 0 0 n.s. n.s. n.s. n.s. n.s. n.s.
Transport 11 21 35 50 64 74 83 7,4% 5,1% 3,6% 2,4% 1,4% 1,2%Coal 0 0 0 0 0 0 0 n.s. n.s. n.s. n.s. n.s. n.s.Oil 11 21 35 49 59 61 64 7,4% 5,1% 3,5% 1,8% 0,3% 0,5%Gas 0 0 0 0 0 0 0 n.s. n.s. n.s. n.s. n.s. n.s.Electricity 0 0 0 0 1 2 5 n.s. n.s. n.s. n.s. 15,9% 6,4%Heat 0 0 0 0 0 0 0 n.s. n.s. n.s. n.s. n.s. n.s.Biomass & Other 0 0 0 1 4 10 15 n.s. n.s. n.s. 18,6% 9,8% 3,3%
Energy Branch Consumption 10 11 12 18 28 33 35 0,9% 0,9% 4,1% 4,3% 1,6% 0,7%Other Transformation & Losses 4 5 10 13 23 45 73 95 8,0% 2,7% 6,1% 6,8% 5,1% 2,6%
2 does not include international aviation and maritime bunkers; includes non-energy uses3 ratio of renewable energy over final energy demand increased by distribution losses and self consumption of electricity and steam plants4 includes statistical differences
42
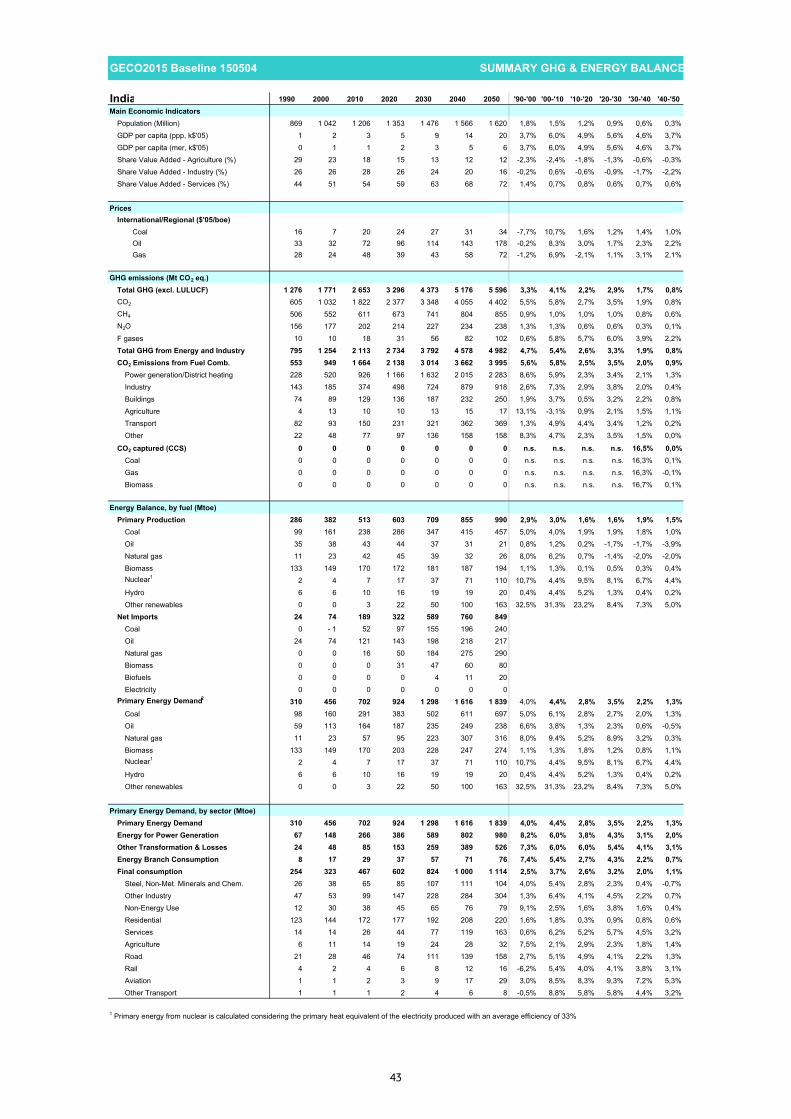
GECO2015 Baseline 150504 SUMMARY GHG & ENERGY BALANCE##### 100
India 1990 2000 2010 2020 2030 2040 2050 '90-'00 '00-'10 '10-'20 '20-'30 '30-'40 '40-'50Main Economic Indicators
Population (Million) 869 1 042 1 206 1 353 1 476 1 566 1 620 1,8% 1,5% 1,2% 0,9% 0,6% 0,3%GDP per capita (ppp, k$'05) 1 2 3 5 9 14 20 3,7% 6,0% 4,9% 5,6% 4,6% 3,7%GDP per capita (mer, k$'05) 0 1 1 2 3 5 6 3,7% 6,0% 4,9% 5,6% 4,6% 3,7%Share Value Added - Agriculture (%) 29 23 18 15 13 12 12 -2,3% -2,4% -1,8% -1,3% -0,6% -0,3%Share Value Added - Industry (%) 26 26 28 26 24 20 16 -0,2% 0,6% -0,6% -0,9% -1,7% -2,2%Share Value Added - Services (%) 44 51 54 59 63 68 72 1,4% 0,7% 0,8% 0,6% 0,7% 0,6%
PricesInternational/Regional ($'05/boe)
Coal 16 7 20 24 27 31 34 -7,7% 10,7% 1,6% 1,2% 1,4% 1,0%Oil 33 32 72 96 114 143 178 -0,2% 8,3% 3,0% 1,7% 2,3% 2,2%Gas 28 24 48 39 43 58 72 -1,2% 6,9% -2,1% 1,1% 3,1% 2,1%
GHG emissions (Mt CO2 eq.)Total GHG (excl. LULUCF) 1 276 1 771 2 653 3 296 4 373 5 176 5 596 3,3% 4,1% 2,2% 2,9% 1,7% 0,8%CO2 605 1 032 1 822 2 377 3 348 4 055 4 402 5,5% 5,8% 2,7% 3,5% 1,9% 0,8%CH4 506 552 611 673 741 804 855 0,9% 1,0% 1,0% 1,0% 0,8% 0,6%N2O 156 177 202 214 227 234 238 1,3% 1,3% 0,6% 0,6% 0,3% 0,1%F gases 10 10 18 31 56 82 102 0,6% 5,8% 5,7% 6,0% 3,9% 2,2%Total GHG from Energy and Industry 795 1 254 2 113 2 734 3 792 4 578 4 982 4,7% 5,4% 2,6% 3,3% 1,9% 0,8%CO2 Emissions from Fuel Comb. 553 949 1 664 2 138 3 014 3 662 3 995 5,6% 5,8% 2,5% 3,5% 2,0% 0,9%
Power generation/District heating 228 520 926 1 166 1 632 2 015 2 283 8,6% 5,9% 2,3% 3,4% 2,1% 1,3%Industry 143 185 374 498 724 879 918 2,6% 7,3% 2,9% 3,8% 2,0% 0,4%Buildings 74 89 129 136 187 232 250 1,9% 3,7% 0,5% 3,2% 2,2% 0,8%Agriculture 4 13 10 10 13 15 17 13,1% -3,1% 0,9% 2,1% 1,5% 1,1%Transport 82 93 150 231 321 362 369 1,3% 4,9% 4,4% 3,4% 1,2% 0,2%Other 22 48 77 97 136 158 158 8,3% 4,7% 2,3% 3,5% 1,5% 0,0%
CO2 captured (CCS) 0 0 0 0 0 0 0 n.s. n.s. n.s. n.s. 16,5% 0,0%Coal 0 0 0 0 0 0 0 n.s. n.s. n.s. n.s. 16,3% 0,1%Gas 0 0 0 0 0 0 0 n.s. n.s. n.s. n.s. 16,3% -0,1%Biomass 0 0 0 0 0 0 0 n.s. n.s. n.s. n.s. 16,7% 0,1%
Energy Balance, by fuel (Mtoe)Primary Production 286 382 513 603 709 855 990 2,9% 3,0% 1,6% 1,6% 1,9% 1,5%
Coal 99 161 238 286 347 415 457 5,0% 4,0% 1,9% 1,9% 1,8% 1,0%Oil 35 38 43 44 37 31 21 0,8% 1,2% 0,2% -1,7% -1,7% -3,9%Natural gas 11 23 42 45 39 32 26 8,0% 6,2% 0,7% -1,4% -2,0% -2,0%Biomass 133 149 170 172 181 187 194 1,1% 1,3% 0,1% 0,5% 0,3% 0,4%Nuclear1 2 4 7 17 37 71 110 10,7% 4,4% 9,5% 8,1% 6,7% 4,4%Hydro 6 6 10 16 19 19 20 0,4% 4,4% 5,2% 1,3% 0,4% 0,2%Other renewables 0 0 3 22 50 100 163 32,5% 31,3% 23,2% 8,4% 7,3% 5,0%
Net Imports 24 74 189 322 589 760 849Coal 0 - 1 52 97 155 196 240Oil 24 74 121 143 198 218 217Natural gas 0 0 16 50 184 275 290Biomass 0 0 0 31 47 60 80Biofuels 0 0 0 0 4 11 20Electricity 0 0 0 0 0 0 0
Primary Energy Demand2 310 456 702 924 1 298 1 616 1 839 4,0% 4,4% 2,8% 3,5% 2,2% 1,3%Coal 98 160 291 383 502 611 697 5,0% 6,1% 2,8% 2,7% 2,0% 1,3%Oil 59 113 164 187 235 249 238 6,6% 3,8% 1,3% 2,3% 0,6% -0,5%Natural gas 11 23 57 95 223 307 316 8,0% 9,4% 5,2% 8,9% 3,2% 0,3%Biomass 133 149 170 203 228 247 274 1,1% 1,3% 1,8% 1,2% 0,8% 1,1%Nuclear1 2 4 7 17 37 71 110 10,7% 4,4% 9,5% 8,1% 6,7% 4,4%Hydro 6 6 10 16 19 19 20 0,4% 4,4% 5,2% 1,3% 0,4% 0,2%Other renewables 0 0 3 22 50 100 163 32,5% 31,3% 23,2% 8,4% 7,3% 5,0%
Primary Energy Demand, by sector (Mtoe)Primary Energy Demand 310 456 702 924 1 298 1 616 1 839 4,0% 4,4% 2,8% 3,5% 2,2% 1,3%Energy for Power Generation 67 148 266 386 589 802 980 8,2% 6,0% 3,8% 4,3% 3,1% 2,0%Other Transformation & Losses 24 48 85 153 259 389 526 7,3% 6,0% 6,0% 5,4% 4,1% 3,1%Energy Branch Consumption 8 17 29 37 57 71 76 7,4% 5,4% 2,7% 4,3% 2,2% 0,7%Final consumption 254 323 467 602 824 1 000 1 114 2,5% 3,7% 2,6% 3,2% 2,0% 1,1%
Steel, Non-Met. Minerals and Chem. 26 38 65 85 107 111 104 4,0% 5,4% 2,8% 2,3% 0,4% -0,7%Other Industry 47 53 99 147 228 284 304 1,3% 6,4% 4,1% 4,5% 2,2% 0,7%Non-Energy Use 12 30 38 45 65 76 79 9,1% 2,5% 1,6% 3,8% 1,6% 0,4%Residential 123 144 172 177 192 208 220 1,6% 1,8% 0,3% 0,9% 0,8% 0,6%Services 14 14 26 44 77 119 163 0,6% 6,2% 5,2% 5,7% 4,5% 3,2%Agriculture 6 11 14 19 24 28 32 7,5% 2,1% 2,9% 2,3% 1,8% 1,4%Road 21 28 46 74 111 139 158 2,7% 5,1% 4,9% 4,1% 2,2% 1,3%Rail 4 2 4 6 8 12 16 -6,2% 5,4% 4,0% 4,1% 3,8% 3,1%Aviation 1 1 2 3 9 17 29 3,0% 8,5% 8,3% 9,3% 7,2% 5,3%Other Transport 1 1 1 2 4 6 8 -0,5% 8,8% 5,8% 5,8% 4,4% 3,2%
1 Primary energy from nuclear is calculated considering the primary heat equivalent of the electricity produced with an average efficiency of 33%
43

GECO2015 Baseline 150504 SUMMARY GHG & ENERGY BALANCE##### 100
India 1990 2000 2010 2020 2030 2040 2050 '90-'00 '00-'10 '10-'20 '20-'30 '30-'40 '40-'50Power Generation
Fuel Inputs Therm. Power (Mtoe) 59 137 247 330 484 611 688 8,7% 6,1% 3,0% 3,9% 2,4% 1,2%Coal 52 118 208 260 345 420 487 8,4% 5,9% 2,2% 2,9% 2,0% 1,5%Oil 4 9 11 9 11 12 11 9,7% 2,1% -2,1% 2,5% 0,7% -0,7%Gas 3 9 26 44 95 129 131 10,3% 10,9% 5,4% 8,0% 3,2% 0,1%Biomass & Waste 0 1 1 17 32 49 58 n.s. 4,3% 30,8% 6,5% 4,2% 1,7%Other 0 0 0 0 0 0 0 n.s. n.s. n.s. n.s. n.s. n.s.
Gross Elec. Generation (TWh e) 289 560 969 1 615 2 710 3 969 5 201 6,8% 5,6% 5,2% 5,3% 3,9% 2,7%Coal 192 387 653 904 1 332 1 746 2 127 7,3% 5,4% 3,3% 4,0% 2,7% 2,0%
of which CCS 0 0 0 0 0 0 0 n.s. n.s. n.s. n.s. n.s. n.s.Oil 10 24 26 39 49 53 50 9,1% 0,9% 3,9% 2,4% 0,7% -0,6%Gas 10 56 118 201 447 627 655 18,8% 7,7% 5,5% 8,3% 3,4% 0,4%
of which CCS 0 0 0 0 0 0 0 n.s. n.s. n.s. n.s. n.s. n.s.Biomass & Waste 0 0 2 56 119 196 247 n.s. n.s. 39,2% 7,8% 5,1% 2,4%
of which CCS 0 0 0 0 0 0 0 n.s. n.s. n.s. n.s. n.s. n.s.Nuclear 6 17 26 66 149 290 445 10,7% 4,5% 9,7% 8,4% 6,9% 4,4%Hydro 72 74 114 189 216 225 229 0,4% 4,4% 5,2% 1,3% 0,4% 0,2%Wind 0 2 29 151 359 696 1 092 48,6% 32,7% 18,1% 9,0% 6,8% 4,6%Solar 0 0 0 8 38 135 348 4,8% 26,0% n.s. 16,1% 13,6% 10,0%Other 0 0 0 0 0 3 8 n.s. n.s. n.s. 30,9% 18,4% 11,8%
Generation Capacity (GWe) 74 115 202 393 644 1 000 1 432 4,4% 5,8% 6,9% 5,1% 4,5% 3,7%Coal 48 72 118 198 266 342 422 4,2% 5,1% 5,3% 3,0% 2,5% 2,1%
of which CCS 0 0 0 0 0 0 0 n.s. n.s. n.s. n.s. n.s. n.s.Oil 3 5 5 6 8 8 9 5,9% -1,2% 3,1% 1,8% 1,0% 0,6%Gas 3 10 21 37 87 137 166 11,4% 7,5% 5,9% 8,8% 4,7% 1,9%
of which CCS 0 0 0 0 0 0 0 n.s. n.s. n.s. n.s. n.s. n.s.Biomass & Waste 0 0 3 10 18 30 37 n.s. n.s. 14,8% 5,7% 5,0% 2,4%
of which CCS 0 0 0 0 0 0 0 n.s. n.s. n.s. n.s. n.s. n.s.Nuclear 1 3 4 9 19 36 55 8,2% 4,9% 7,5% 8,2% 6,7% 4,2%Hydro 19 24 37 62 71 74 75 2,3% 4,7% 5,2% 1,4% 0,4% 0,2%Wind 0 1 13 65 152 289 446 44,9% 27,1% 17,2% 8,8% 6,6% 4,5%Solar 0 0 0 6 24 85 220 8,8% 22,2% n.s. 15,8% 13,5% 10,0%Other 0 0 0 0 0 0 1 n.s. n.s. n.s. 30,2% 17,8% 11,3%
Total Final Consumption 2 (Mtoe) 254 323 467 602 824 1 000 1 114 2,5% 3,7% 2,6% 3,2% 2,0% 1,1%Coal 44 39 82 116 149 181 199 -1,2% 7,6% 3,6% 2,5% 2,0% 1,0%Oil 52 94 127 149 189 200 192 6,2% 3,0% 1,6% 2,4% 0,6% -0,4%Gas 6 10 28 44 113 154 159 5,4% 10,7% 4,9% 9,8% 3,2% 0,3%Electricity 18 32 61 103 173 255 337 5,7% 6,8% 5,3% 5,4% 3,9% 2,8%Heat 0 0 0 8 15 29 39 16,5% 23,5% 40,0% 6,2% 6,3% 3,3%Biomass & Other 133 148 169 182 185 181 187 1,0% 1,3% 0,7% 0,2% -0,2% 0,3%Share of Renewables 3 (%) 56% 50% 40% 38% 32% 31% 34% -1,2% -2,1% -0,6% -1,7% -0,3% 0,9%
Industry (incl. non-energy use) 85 122 202 277 400 471 487 3,6% 5,2% 3,2% 3,7% 1,7% 0,3%Coal 32 31 68 96 126 155 173 -0,3% 8,1% 3,6% 2,7% 2,1% 1,1%Oil 16 42 50 51 59 56 46 10,1% 1,8% 0,2% 1,5% -0,5% -2,0%Gas 6 10 27 41 93 121 117 5,2% 11,1% 4,0% 8,7% 2,6% -0,3%Electricity 9 14 28 45 68 88 100 4,1% 7,3% 5,0% 4,2% 2,5% 1,3%Heat 0 0 0 0 0 0 0 n.s. n.s. n.s. n.s. n.s. n.s.Biomass & Other 23 26 29 44 53 51 51 1,3% 1,3% 4,2% 1,9% -0,3% 0,0%
Buildings 136 159 198 220 269 327 383 1,5% 2,2% 1,1% 2,0% 2,0% 1,6%Coal 10 8 14 19 23 26 26 -2,1% 5,6% 3,3% 1,7% 1,4% 0,0%Oil 11 18 23 16 16 16 15 5,1% 2,7% -3,7% 0,1% 0,1% -0,4%Gas 0 0 0 4 19 33 41 21,0% -21,7% n.s. 18,1% 5,5% 2,4%Electricity 4 10 21 39 78 126 179 8,4% 7,8% 6,4% 7,0% 4,9% 3,6%Heat 0 0 0 8 15 29 39 16,5% 23,5% 40,0% 6,2% 6,3% 3,3%Biomass & Other 111 122 140 134 117 98 82 1,0% 1,3% -0,4% -1,3% -1,8% -1,8%
Agriculture 6 11 14 19 24 28 32 7,5% 2,1% 2,9% 2,3% 1,8% 1,4%Coal 0 0 0 0 0 0 0 n.s. n.s. n.s. n.s. n.s. n.s.Oil 1 4 3 3 4 5 5 13,3% -3,3% 0,9% 2,1% 1,5% 1,2%Gas 0 0 0 0 0 0 0 5,4% 2,5% 1,0% 1,9% 1,3% 1,0%Electricity 4 7 11 15 20 23 27 5,3% 4,3% 3,4% 2,4% 1,8% 1,5%Heat 0 0 0 0 0 0 0 n.s. n.s. n.s. n.s. n.s. n.s.Biomass & Other 0 0 0 0 0 0 0 n.s. n.s. n.s. n.s. n.s. n.s.
Transport 27 31 52 85 132 174 211 1,7% 5,2% 5,0% 4,5% 2,8% 1,9%Coal 2 0 0 0 0 0 0 n.s. n.s. n.s. n.s. n.s. n.s.Oil 24 31 51 79 109 123 125 2,5% 5,2% 4,4% 3,4% 1,2% 0,2%Gas 0 0 0 0 0 0 0 n.s. n.s. n.s. n.s. n.s. n.s.Electricity 0 1 1 3 8 18 31 7,2% 5,0% 8,9% 11,2% 9,1% 5,3%Heat 0 0 0 0 0 0 0 n.s. n.s. n.s. n.s. n.s. n.s.Biomass & Other 0 0 0 4 15 32 55 n.s. 9,9% 36,3% 13,9% 8,1% 5,4%
Energy Branch Consumption 8 17 29 37 57 71 76 7,4% 5,4% 2,7% 4,3% 2,2% 0,7%Other Transformation & Losses 4 24 48 85 153 259 389 526 7,3% 6,0% 6,0% 5,4% 4,1% 3,1%
2 does not include international aviation and maritime bunkers; includes non-energy uses3 ratio of renewable energy over final energy demand increased by distribution losses and self consumption of electricity and steam plants4 includes statistical differences
44
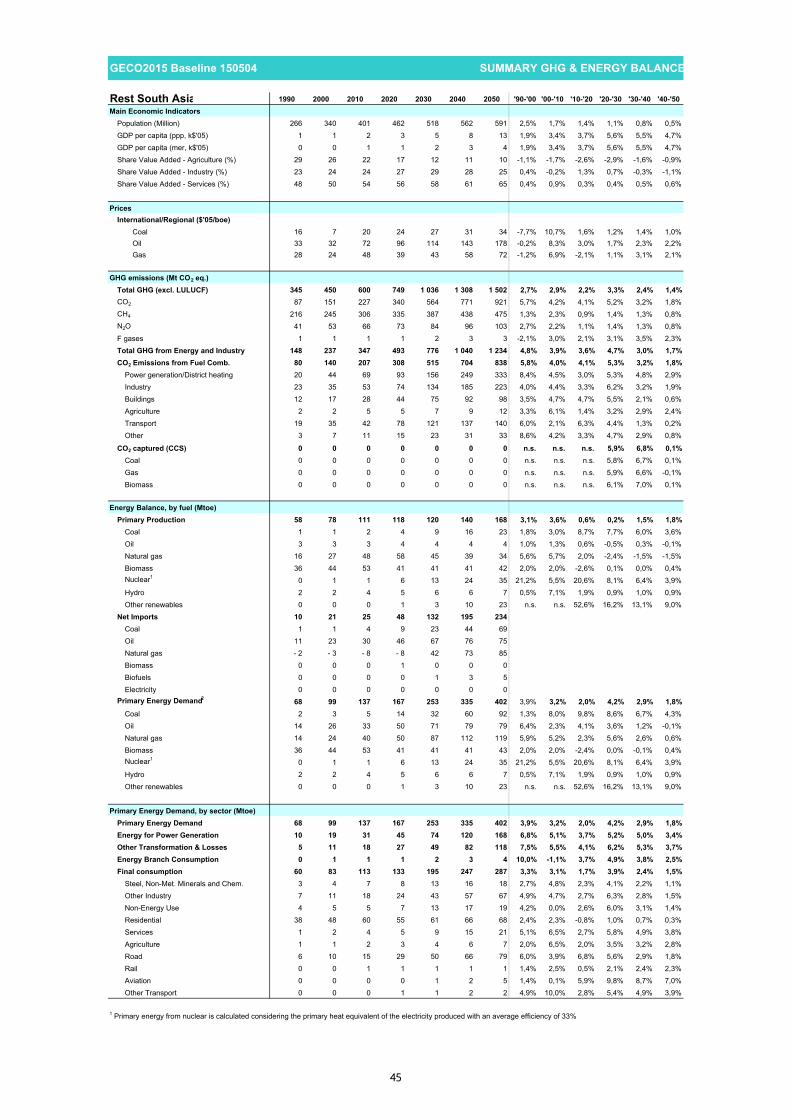
GECO2015 Baseline 150504 SUMMARY GHG & ENERGY BALANCE##### 100
Rest South Asia 1990 2000 2010 2020 2030 2040 2050 '90-'00 '00-'10 '10-'20 '20-'30 '30-'40 '40-'50Main Economic Indicators
Population (Million) 266 340 401 462 518 562 591 2,5% 1,7% 1,4% 1,1% 0,8% 0,5%GDP per capita (ppp, k$'05) 1 1 2 3 5 8 13 1,9% 3,4% 3,7% 5,6% 5,5% 4,7%GDP per capita (mer, k$'05) 0 0 1 1 2 3 4 1,9% 3,4% 3,7% 5,6% 5,5% 4,7%Share Value Added - Agriculture (%) 29 26 22 17 12 11 10 -1,1% -1,7% -2,6% -2,9% -1,6% -0,9%Share Value Added - Industry (%) 23 24 24 27 29 28 25 0,4% -0,2% 1,3% 0,7% -0,3% -1,1%Share Value Added - Services (%) 48 50 54 56 58 61 65 0,4% 0,9% 0,3% 0,4% 0,5% 0,6%
PricesInternational/Regional ($'05/boe)
Coal 16 7 20 24 27 31 34 -7,7% 10,7% 1,6% 1,2% 1,4% 1,0%Oil 33 32 72 96 114 143 178 -0,2% 8,3% 3,0% 1,7% 2,3% 2,2%Gas 28 24 48 39 43 58 72 -1,2% 6,9% -2,1% 1,1% 3,1% 2,1%
GHG emissions (Mt CO2 eq.)Total GHG (excl. LULUCF) 345 450 600 749 1 036 1 308 1 502 2,7% 2,9% 2,2% 3,3% 2,4% 1,4%CO2 87 151 227 340 564 771 921 5,7% 4,2% 4,1% 5,2% 3,2% 1,8%CH4 216 245 306 335 387 438 475 1,3% 2,3% 0,9% 1,4% 1,3% 0,8%N2O 41 53 66 73 84 96 103 2,7% 2,2% 1,1% 1,4% 1,3% 0,8%F gases 1 1 1 1 2 3 3 -2,1% 3,0% 2,1% 3,1% 3,5% 2,3%Total GHG from Energy and Industry 148 237 347 493 776 1 040 1 234 4,8% 3,9% 3,6% 4,7% 3,0% 1,7%CO2 Emissions from Fuel Comb. 80 140 207 308 515 704 838 5,8% 4,0% 4,1% 5,3% 3,2% 1,8%
Power generation/District heating 20 44 69 93 156 249 333 8,4% 4,5% 3,0% 5,3% 4,8% 2,9%Industry 23 35 53 74 134 185 223 4,0% 4,4% 3,3% 6,2% 3,2% 1,9%Buildings 12 17 28 44 75 92 98 3,5% 4,7% 4,7% 5,5% 2,1% 0,6%Agriculture 2 2 5 5 7 9 12 3,3% 6,1% 1,4% 3,2% 2,9% 2,4%Transport 19 35 42 78 121 137 140 6,0% 2,1% 6,3% 4,4% 1,3% 0,2%Other 3 7 11 15 23 31 33 8,6% 4,2% 3,3% 4,7% 2,9% 0,8%
CO2 captured (CCS) 0 0 0 0 0 0 0 n.s. n.s. n.s. 5,9% 6,8% 0,1%Coal 0 0 0 0 0 0 0 n.s. n.s. n.s. 5,8% 6,7% 0,1%Gas 0 0 0 0 0 0 0 n.s. n.s. n.s. 5,9% 6,6% -0,1%Biomass 0 0 0 0 0 0 0 n.s. n.s. n.s. 6,1% 7,0% 0,1%
Energy Balance, by fuel (Mtoe)Primary Production 58 78 111 118 120 140 168 3,1% 3,6% 0,6% 0,2% 1,5% 1,8%
Coal 1 1 2 4 9 16 23 1,8% 3,0% 8,7% 7,7% 6,0% 3,6%Oil 3 3 3 4 4 4 4 1,0% 1,3% 0,6% -0,5% 0,3% -0,1%Natural gas 16 27 48 58 45 39 34 5,6% 5,7% 2,0% -2,4% -1,5% -1,5%Biomass 36 44 53 41 41 41 42 2,0% 2,0% -2,6% 0,1% 0,0% 0,4%Nuclear1 0 1 1 6 13 24 35 21,2% 5,5% 20,6% 8,1% 6,4% 3,9%Hydro 2 2 4 5 6 6 7 0,5% 7,1% 1,9% 0,9% 1,0% 0,9%Other renewables 0 0 0 1 3 10 23 n.s. n.s. 52,6% 16,2% 13,1% 9,0%
Net Imports 10 21 25 48 132 195 234Coal 1 1 4 9 23 44 69Oil 11 23 30 46 67 76 75Natural gas - 2 - 3 - 8 - 8 42 73 85Biomass 0 0 0 1 0 0 0Biofuels 0 0 0 0 1 3 5Electricity 0 0 0 0 0 0 0
Primary Energy Demand2 68 99 137 167 253 335 402 3,9% 3,2% 2,0% 4,2% 2,9% 1,8%Coal 2 3 5 14 32 60 92 1,3% 8,0% 9,8% 8,6% 6,7% 4,3%Oil 14 26 33 50 71 79 79 6,4% 2,3% 4,1% 3,6% 1,2% -0,1%Natural gas 14 24 40 50 87 112 119 5,9% 5,2% 2,3% 5,6% 2,6% 0,6%Biomass 36 44 53 41 41 41 43 2,0% 2,0% -2,4% 0,0% -0,1% 0,4%Nuclear1 0 1 1 6 13 24 35 21,2% 5,5% 20,6% 8,1% 6,4% 3,9%Hydro 2 2 4 5 6 6 7 0,5% 7,1% 1,9% 0,9% 1,0% 0,9%Other renewables 0 0 0 1 3 10 23 n.s. n.s. 52,6% 16,2% 13,1% 9,0%
Primary Energy Demand, by sector (Mtoe)Primary Energy Demand 68 99 137 167 253 335 402 3,9% 3,2% 2,0% 4,2% 2,9% 1,8%Energy for Power Generation 10 19 31 45 74 120 168 6,8% 5,1% 3,7% 5,2% 5,0% 3,4%Other Transformation & Losses 5 11 18 27 49 82 118 7,5% 5,5% 4,1% 6,2% 5,3% 3,7%Energy Branch Consumption 0 1 1 1 2 3 4 10,0% -1,1% 3,7% 4,9% 3,8% 2,5%Final consumption 60 83 113 133 195 247 287 3,3% 3,1% 1,7% 3,9% 2,4% 1,5%
Steel, Non-Met. Minerals and Chem. 3 4 7 8 13 16 18 2,7% 4,8% 2,3% 4,1% 2,2% 1,1%Other Industry 7 11 18 24 43 57 67 4,9% 4,7% 2,7% 6,3% 2,8% 1,5%Non-Energy Use 4 5 5 7 13 17 19 4,2% 0,0% 2,6% 6,0% 3,1% 1,4%Residential 38 48 60 55 61 66 68 2,4% 2,3% -0,8% 1,0% 0,7% 0,3%Services 1 2 4 5 9 15 21 5,1% 6,5% 2,7% 5,8% 4,9% 3,8%Agriculture 1 1 2 3 4 6 7 2,0% 6,5% 2,0% 3,5% 3,2% 2,8%Road 6 10 15 29 50 66 79 6,0% 3,9% 6,8% 5,6% 2,9% 1,8%Rail 0 0 1 1 1 1 1 1,4% 2,5% 0,5% 2,1% 2,4% 2,3%Aviation 0 0 0 0 1 2 5 1,4% 0,1% 5,9% 9,8% 8,7% 7,0%Other Transport 0 0 0 1 1 2 2 4,9% 10,0% 2,8% 5,4% 4,9% 3,9%
1 Primary energy from nuclear is calculated considering the primary heat equivalent of the electricity produced with an average efficiency of 33%
45

GECO2015 Baseline 150504 SUMMARY GHG & ENERGY BALANCE##### 100
Rest South Asia 1990 2000 2010 2020 2030 2040 2050 '90-'00 '00-'10 '10-'20 '20-'30 '30-'40 '40-'50Power Generation
Fuel Inputs Therm. Power (Mtoe) 8 16 26 33 52 80 103 7,8% 4,8% 2,5% 4,8% 4,3% 2,6%Coal 0 0 0 5 15 36 58 17,8% 11,9% 32,7% 12,2% 8,8% 5,0%Oil 2 8 10 10 11 9 6 12,5% 2,6% 0,5% 0,6% -1,4% -4,4%Gas 5 8 16 18 26 33 35 4,8% 6,4% 1,2% 3,9% 2,6% 0,5%Biomass & Waste 0 0 0 0 0 2 4 n.s. n.s. n.s. 13,7% 14,4% 8,3%Other 0 0 0 0 0 0 0 n.s. n.s. n.s. n.s. n.s. n.s.
Gross Elec. Generation (TWh e) 52 95 159 236 403 694 1 032 6,2% 5,3% 4,0% 5,5% 5,6% 4,0%Coal 0 0 1 23 76 185 313 20,3% 11,7% 41,1% 12,9% 9,3% 5,4%
of which CCS 0 0 0 0 0 0 0 n.s. n.s. n.s. n.s. n.s. n.s.Oil 8 32 41 45 47 41 27 14,2% 2,4% 1,0% 0,5% -1,4% -4,2%Gas 19 36 64 78 127 179 196 6,4% 6,0% 1,9% 5,1% 3,5% 0,9%
of which CCS 0 0 0 0 0 0 0 n.s. n.s. n.s. n.s. n.s. n.s.Biomass & Waste 0 0 0 1 2 9 21 n.s. n.s. n.s. 15,0% 15,1% 9,0%
of which CCS 0 0 0 0 0 0 0 n.s. n.s. n.s. n.s. n.s. n.s.Nuclear 0 2 3 23 52 97 142 21,2% 5,5% 21,1% 8,3% 6,5% 3,9%Hydro 24 25 50 60 66 73 80 0,5% 7,1% 1,9% 0,9% 1,0% 0,9%Wind 0 0 0 6 26 81 171 n.s. 40,3% 53,5% 15,2% 11,8% 7,8%Solar 0 0 0 1 6 30 83 n.s. 7,8% 46,2% 22,9% 17,4% 10,8%Other 0 0 0 0 0 0 1 n.s. n.s. n.s. 27,7% 17,3% 11,5%
Generation Capacity (GWe) 13 24 34 53 85 151 264 6,5% 3,5% 4,8% 4,8% 5,9% 5,8%Coal 0 0 0 3 11 25 48 n.s. 10,7% 22,1% 13,2% 9,2% 6,4%
of which CCS 0 0 0 0 0 0 0 n.s. n.s. n.s. n.s. n.s. n.s.Oil 3 7 8 15 16 15 19 7,9% 2,2% 6,2% 0,8% -0,7% 2,2%Gas 4 9 14 16 22 31 43 7,6% 4,0% 1,5% 3,4% 3,2% 3,4%
of which CCS 0 0 0 0 0 0 0 n.s. n.s. n.s. n.s. n.s. n.s.Biomass & Waste 0 0 0 0 0 1 3 n.s. n.s. 19,6% 15,1% 14,9% 9,8%
of which CCS 0 0 0 0 0 0 0 n.s. n.s. n.s. n.s. n.s. n.s.Nuclear 0 0 0 3 7 12 18 13,7% 0,0% 20,9% 8,1% 6,3% 3,7%Hydro 5 7 11 13 14 16 17 3,7% 4,0% 2,1% 0,9% 1,0% 0,9%Wind 0 0 0 3 11 33 69 n.s. 29,2% 52,7% 15,0% 11,7% 7,7%Solar 0 0 0 0 3 17 48 n.s. n.s. n.s. 22,8% 17,3% 10,8%Other 0 0 0 0 0 0 0 n.s. n.s. n.s. n.s. 16,8% 10,9%
Total Final Consumption 2 (Mtoe) 60 83 113 133 195 247 287 3,3% 3,1% 1,7% 3,9% 2,4% 1,5%Coal 2 2 5 9 16 25 34 0,3% 8,5% 5,8% 6,2% 4,2% 3,3%Oil 11 17 22 37 57 67 69 4,6% 2,3% 5,5% 4,3% 1,6% 0,4%Gas 8 14 22 29 55 69 73 5,6% 4,7% 3,0% 6,5% 2,3% 0,5%Electricity 3 6 11 17 29 50 74 6,1% 6,9% 4,1% 5,5% 5,6% 4,1%Heat 0 0 0 0 0 0 1 n.s. n.s. n.s. n.s. n.s. 27,1%Biomass & Other 36 44 52 40 38 36 35 2,0% 1,9% -2,6% -0,6% -0,6% -0,2%Share of Renewables 3 (%) 65% 57% 51% 35% 24% 20% 21% -1,3% -1,0% -3,8% -3,7% -1,7% 0,6%
Industry (incl. non-energy use) 14 21 30 39 69 90 104 4,2% 3,7% 2,6% 5,8% 2,7% 1,4%Coal 2 2 5 9 16 24 34 0,5% 7,9% 6,1% 6,4% 4,3% 3,3%Oil 2 3 3 3 5 8 9 6,0% -2,7% 1,8% 5,7% 4,1% 1,5%Gas 6 9 14 16 30 37 39 4,7% 3,8% 1,7% 6,3% 2,2% 0,3%Electricity 1 2 4 6 10 13 16 4,5% 7,9% 3,8% 4,4% 3,2% 2,1%Heat 0 0 0 0 0 0 0 n.s. n.s. n.s. n.s. n.s. n.s.Biomass & Other 3 4 5 5 8 7 5 4,2% 2,1% 0,0% 4,8% -0,9% -2,5%
Buildings 39 50 64 60 70 80 89 2,5% 2,6% -0,6% 1,5% 1,3% 1,1%Coal 0 0 0 0 0 0 0 -11,7% 31,7% 0,8% -0,8% -1,1% -1,4%Oil 2 2 2 4 5 5 5 -0,1% 0,2% 4,9% 2,3% 1,3% 0,1%Gas 2 4 8 13 25 32 34 7,8% 6,4% 4,9% 6,7% 2,4% 0,8%Electricity 2 3 6 9 15 24 35 8,4% 6,2% 4,3% 4,7% 4,9% 3,8%Heat 0 0 0 0 0 0 1 n.s. n.s. n.s. n.s. n.s. 27,1%Biomass & Other 33 40 47 34 25 18 13 1,9% 1,7% -3,2% -3,0% -3,0% -3,3%
Agriculture 1 1 2 3 4 6 7 2,0% 6,5% 2,0% 3,5% 3,2% 2,8%Coal 0 0 0 0 0 0 0 n.s. n.s. n.s. n.s. n.s. n.s.Oil 1 1 1 2 2 3 4 3,1% 6,2% 1,4% 3,2% 2,9% 2,4%Gas 0 0 0 0 0 0 0 n.s. 2,8% 2,0% 3,0% 2,7% 2,2%Electricity 0 0 1 1 2 3 4 0,1% 7,1% 3,0% 4,0% 3,7% 3,2%Heat 0 0 0 0 0 0 0 n.s. n.s. n.s. n.s. n.s. n.s.Biomass & Other 0 0 0 0 0 0 0 n.s. n.s. n.s. n.s. n.s. n.s.
Transport 6 11 16 30 52 71 87 5,7% 3,9% 6,6% 5,6% 3,1% 2,1%Coal 0 0 0 0 0 0 0 n.s. n.s. n.s. n.s. n.s. n.s.Oil 6 11 16 29 45 51 51 5,7% 3,5% 6,4% 4,4% 1,3% 0,1%Gas 0 0 0 0 0 0 0 n.s. n.s. n.s. n.s. n.s. n.s.Electricity 0 0 0 0 3 10 20 -7,2% n.s. n.s. 38,1% 14,3% 6,9%Heat 0 0 0 0 0 0 0 n.s. n.s. n.s. n.s. n.s. n.s.Biomass & Other 0 0 1 1 5 10 17 n.s. n.s. 10,0% 13,3% 7,1% 4,9%
Energy Branch Consumption 0 1 1 1 2 3 4 10,0% -1,1% 3,7% 4,9% 3,8% 2,5%Other Transformation & Losses 4 5 11 18 27 49 82 118 7,5% 5,5% 4,1% 6,2% 5,3% 3,7%
2 does not include international aviation and maritime bunkers; includes non-energy uses3 ratio of renewable energy over final energy demand increased by distribution losses and self consumption of electricity and steam plants4 includes statistical differences
46
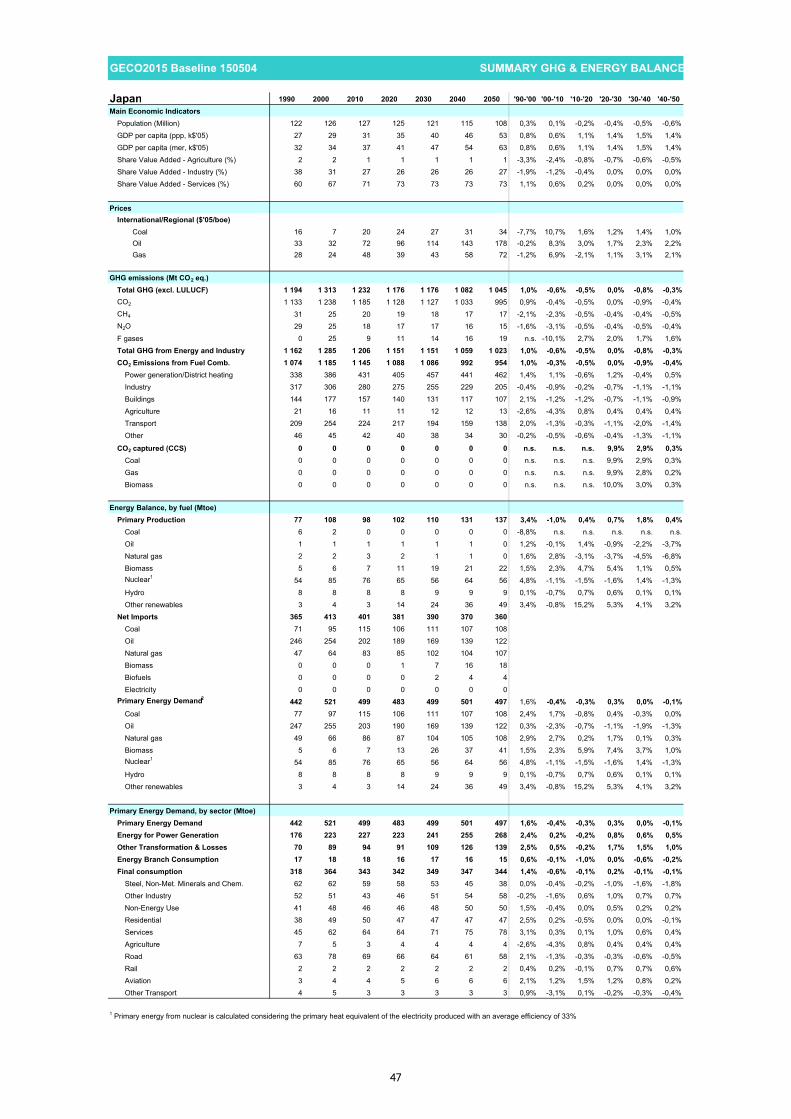
GECO2015 Baseline 150504 SUMMARY GHG & ENERGY BALANCE##### 100
Japan 1990 2000 2010 2020 2030 2040 2050 '90-'00 '00-'10 '10-'20 '20-'30 '30-'40 '40-'50Main Economic Indicators
Population (Million) 122 126 127 125 121 115 108 0,3% 0,1% -0,2% -0,4% -0,5% -0,6%GDP per capita (ppp, k$'05) 27 29 31 35 40 46 53 0,8% 0,6% 1,1% 1,4% 1,5% 1,4%GDP per capita (mer, k$'05) 32 34 37 41 47 54 63 0,8% 0,6% 1,1% 1,4% 1,5% 1,4%Share Value Added - Agriculture (%) 2 2 1 1 1 1 1 -3,3% -2,4% -0,8% -0,7% -0,6% -0,5%Share Value Added - Industry (%) 38 31 27 26 26 26 27 -1,9% -1,2% -0,4% 0,0% 0,0% 0,0%Share Value Added - Services (%) 60 67 71 73 73 73 73 1,1% 0,6% 0,2% 0,0% 0,0% 0,0%
PricesInternational/Regional ($'05/boe)
Coal 16 7 20 24 27 31 34 -7,7% 10,7% 1,6% 1,2% 1,4% 1,0%Oil 33 32 72 96 114 143 178 -0,2% 8,3% 3,0% 1,7% 2,3% 2,2%Gas 28 24 48 39 43 58 72 -1,2% 6,9% -2,1% 1,1% 3,1% 2,1%
GHG emissions (Mt CO2 eq.)Total GHG (excl. LULUCF) 1 194 1 313 1 232 1 176 1 176 1 082 1 045 1,0% -0,6% -0,5% 0,0% -0,8% -0,3%CO2 1 133 1 238 1 185 1 128 1 127 1 033 995 0,9% -0,4% -0,5% 0,0% -0,9% -0,4%CH4 31 25 20 19 18 17 17 -2,1% -2,3% -0,5% -0,4% -0,4% -0,5%N2O 29 25 18 17 17 16 15 -1,6% -3,1% -0,5% -0,4% -0,5% -0,4%F gases 0 25 9 11 14 16 19 n.s. -10,1% 2,7% 2,0% 1,7% 1,6%Total GHG from Energy and Industry 1 162 1 285 1 206 1 151 1 151 1 059 1 023 1,0% -0,6% -0,5% 0,0% -0,8% -0,3%CO2 Emissions from Fuel Comb. 1 074 1 185 1 145 1 088 1 086 992 954 1,0% -0,3% -0,5% 0,0% -0,9% -0,4%
Power generation/District heating 338 386 431 405 457 441 462 1,4% 1,1% -0,6% 1,2% -0,4% 0,5%Industry 317 306 280 275 255 229 205 -0,4% -0,9% -0,2% -0,7% -1,1% -1,1%Buildings 144 177 157 140 131 117 107 2,1% -1,2% -1,2% -0,7% -1,1% -0,9%Agriculture 21 16 11 11 12 12 13 -2,6% -4,3% 0,8% 0,4% 0,4% 0,4%Transport 209 254 224 217 194 159 138 2,0% -1,3% -0,3% -1,1% -2,0% -1,4%Other 46 45 42 40 38 34 30 -0,2% -0,5% -0,6% -0,4% -1,3% -1,1%
CO2 captured (CCS) 0 0 0 0 0 0 0 n.s. n.s. n.s. 9,9% 2,9% 0,3%Coal 0 0 0 0 0 0 0 n.s. n.s. n.s. 9,9% 2,9% 0,3%Gas 0 0 0 0 0 0 0 n.s. n.s. n.s. 9,9% 2,8% 0,2%Biomass 0 0 0 0 0 0 0 n.s. n.s. n.s. 10,0% 3,0% 0,3%
Energy Balance, by fuel (Mtoe)Primary Production 77 108 98 102 110 131 137 3,4% -1,0% 0,4% 0,7% 1,8% 0,4%
Coal 6 2 0 0 0 0 0 -8,8% n.s. n.s. n.s. n.s. n.s.Oil 1 1 1 1 1 1 0 1,2% -0,1% 1,4% -0,9% -2,2% -3,7%Natural gas 2 2 3 2 1 1 0 1,6% 2,8% -3,1% -3,7% -4,5% -6,8%Biomass 5 6 7 11 19 21 22 1,5% 2,3% 4,7% 5,4% 1,1% 0,5%Nuclear1 54 85 76 65 56 64 56 4,8% -1,1% -1,5% -1,6% 1,4% -1,3%Hydro 8 8 8 8 9 9 9 0,1% -0,7% 0,7% 0,6% 0,1% 0,1%Other renewables 3 4 3 14 24 36 49 3,4% -0,8% 15,2% 5,3% 4,1% 3,2%
Net Imports 365 413 401 381 390 370 360Coal 71 95 115 106 111 107 108Oil 246 254 202 189 169 139 122Natural gas 47 64 83 85 102 104 107Biomass 0 0 0 1 7 16 18Biofuels 0 0 0 0 2 4 4Electricity 0 0 0 0 0 0 0
Primary Energy Demand2 442 521 499 483 499 501 497 1,6% -0,4% -0,3% 0,3% 0,0% -0,1%Coal 77 97 115 106 111 107 108 2,4% 1,7% -0,8% 0,4% -0,3% 0,0%Oil 247 255 203 190 169 139 122 0,3% -2,3% -0,7% -1,1% -1,9% -1,3%Natural gas 49 66 86 87 104 105 108 2,9% 2,7% 0,2% 1,7% 0,1% 0,3%Biomass 5 6 7 13 26 37 41 1,5% 2,3% 5,9% 7,4% 3,7% 1,0%Nuclear1 54 85 76 65 56 64 56 4,8% -1,1% -1,5% -1,6% 1,4% -1,3%Hydro 8 8 8 8 9 9 9 0,1% -0,7% 0,7% 0,6% 0,1% 0,1%Other renewables 3 4 3 14 24 36 49 3,4% -0,8% 15,2% 5,3% 4,1% 3,2%
Primary Energy Demand, by sector (Mtoe)Primary Energy Demand 442 521 499 483 499 501 497 1,6% -0,4% -0,3% 0,3% 0,0% -0,1%Energy for Power Generation 176 223 227 223 241 255 268 2,4% 0,2% -0,2% 0,8% 0,6% 0,5%Other Transformation & Losses 70 89 94 91 109 126 139 2,5% 0,5% -0,2% 1,7% 1,5% 1,0%Energy Branch Consumption 17 18 18 16 17 16 15 0,6% -0,1% -1,0% 0,0% -0,6% -0,2%Final consumption 318 364 343 342 349 347 344 1,4% -0,6% -0,1% 0,2% -0,1% -0,1%
Steel, Non-Met. Minerals and Chem. 62 62 59 58 53 45 38 0,0% -0,4% -0,2% -1,0% -1,6% -1,8%Other Industry 52 51 43 46 51 54 58 -0,2% -1,6% 0,6% 1,0% 0,7% 0,7%Non-Energy Use 41 48 46 46 48 50 50 1,5% -0,4% 0,0% 0,5% 0,2% 0,2%Residential 38 49 50 47 47 47 47 2,5% 0,2% -0,5% 0,0% 0,0% -0,1%Services 45 62 64 64 71 75 78 3,1% 0,3% 0,1% 1,0% 0,6% 0,4%Agriculture 7 5 3 4 4 4 4 -2,6% -4,3% 0,8% 0,4% 0,4% 0,4%Road 63 78 69 66 64 61 58 2,1% -1,3% -0,3% -0,3% -0,6% -0,5%Rail 2 2 2 2 2 2 2 0,4% 0,2% -0,1% 0,7% 0,7% 0,6%Aviation 3 4 4 5 6 6 6 2,1% 1,2% 1,5% 1,2% 0,8% 0,2%Other Transport 4 5 3 3 3 3 3 0,9% -3,1% 0,1% -0,2% -0,3% -0,4%
1 Primary energy from nuclear is calculated considering the primary heat equivalent of the electricity produced with an average efficiency of 33%
47

GECO2015 Baseline 150504 SUMMARY GHG & ENERGY BALANCE##### 100
Japan 1990 2000 2010 2020 2030 2040 2050 '90-'00 '00-'10 '10-'20 '20-'30 '30-'40 '40-'50Power Generation
Fuel Inputs Therm. Power (Mtoe) 111 125 140 135 153 147 154 1,2% 1,1% -0,3% 1,2% -0,4% 0,5%Coal 25 47 61 53 63 65 69 6,7% 2,5% -1,3% 1,7% 0,3% 0,6%Oil 51 28 18 17 13 9 11 -5,9% -4,1% -0,8% -2,3% -3,7% 1,6%Gas 33 47 56 60 70 66 65 3,5% 1,8% 0,6% 1,5% -0,6% -0,1%Biomass & Waste 2 3 4 5 6 6 8 2,9% 3,5% 1,3% 1,7% 0,0% 3,2%Other 0 0 0 1 1 1 1 6,8% -2,4% 12,9% 3,4% 0,1% 0,9%
Gross Elec. Generation (TWh e) 842 1 059 1 120 1 142 1 287 1 417 1 549 2,3% 0,6% 0,2% 1,2% 1,0% 0,9%Coal 117 232 304 295 351 355 374 7,1% 2,7% -0,3% 1,7% 0,1% 0,5%
of which CCS 0 0 0 0 0 0 0 n.s. n.s. n.s. n.s. n.s. n.s.Oil 248 137 97 73 58 40 47 -5,8% -3,4% -2,9% -2,3% -3,7% 1,7%Gas 167 251 305 319 371 359 357 4,2% 1,9% 0,5% 1,5% -0,3% -0,1%
of which CCS 0 0 0 0 0 0 0 n.s. n.s. n.s. n.s. n.s. n.s.Biomass & Waste 11 15 23 26 30 28 39 3,8% 4,4% 1,0% 1,5% -0,6% 3,4%
of which CCS 0 0 0 0 0 0 0 n.s. n.s. n.s. n.s. n.s. n.s.Nuclear 202 322 288 255 218 254 225 4,8% -1,1% -1,2% -1,5% 1,5% -1,2%Hydro 96 97 91 97 103 104 105 0,1% -0,7% 0,7% 0,6% 0,1% 0,1%Wind 0 0 5 32 82 156 226 n.s. 46,9% 20,0% 10,0% 6,7% 3,8%Solar 0 0 4 37 61 107 157 41,7% 27,0% 25,6% 5,1% 5,8% 3,9%Other 2 3 3 9 13 14 19 6,8% -2,4% 13,0% 3,7% 1,1% 2,8%
Generation Capacity (GWe) 197 261 287 330 371 440 489 2,9% 0,9% 1,4% 1,2% 1,7% 1,1%Coal 31 50 63 69 68 63 58 4,9% 2,5% 0,9% -0,2% -0,7% -0,8%
of which CCS 0 0 0 0 0 0 0 n.s. n.s. n.s. n.s. n.s. n.s.Oil 78 79 56 44 38 33 31 0,2% -3,4% -2,5% -1,5% -1,3% -0,7%Gas 17 37 60 73 83 87 76 8,2% 5,0% 2,0% 1,3% 0,5% -1,3%
of which CCS 0 0 0 0 0 0 0 n.s. n.s. n.s. n.s. n.s. n.s.Biomass & Waste 3 3 5 4 4 4 5 1,8% 4,1% -0,9% 0,9% -0,9% 2,9%
of which CCS 0 0 0 0 0 0 0 n.s. n.s. n.s. n.s. n.s. n.s.Nuclear 31 45 49 41 34 39 34 3,9% 0,8% -1,7% -1,7% 1,3% -1,4%Hydro 38 46 48 53 56 57 57 2,0% 0,3% 1,0% 0,6% 0,1% 0,1%Wind 0 0 2 14 35 65 93 n.s. 32,7% 19,4% 9,8% 6,5% 3,7%Solar 0 0 4 31 51 90 131 43,4% 27,1% 24,1% 5,1% 5,7% 3,9%Other 0 1 1 1 2 2 3 7,0% 0,0% 9,1% 3,8% 1,1% 2,6%
Total Final Consumption 2 (Mtoe) 318 364 343 342 349 347 344 1,4% -0,6% -0,1% 0,2% -0,1% -0,1%Coal 50 46 47 46 40 36 32 -0,8% 0,3% -0,3% -1,2% -1,2% -1,1%Oil 184 210 171 163 147 123 105 1,3% -2,0% -0,5% -1,0% -1,8% -1,5%Gas 15 23 34 34 40 44 47 4,2% 4,1% -0,2% 1,6% 1,1% 0,7%Electricity 64 81 86 89 101 111 122 2,3% 0,6% 0,3% 1,2% 1,0% 0,9%Heat 1 1 1 2 2 4 6 0,4% -2,8% 3,4% 2,4% 6,5% 4,8%Biomass & Other 3 3 3 8 19 29 31 0,1% 0,5% 10,8% 9,3% 4,5% 0,6%Share of Renewables 3 (%) 5% 4% 5% 8% 14% 21% 26% -1,2% 1,0% 6,2% 5,4% 4,1% 2,1%
Industry (incl. non-energy use) 155 160 148 150 152 149 146 0,3% -0,8% 0,1% 0,1% -0,2% -0,2%Coal 49 45 47 45 40 35 32 -0,7% 0,3% -0,3% -1,2% -1,2% -1,1%Oil 71 76 62 59 52 43 35 0,7% -2,0% -0,5% -1,2% -2,0% -2,0%Gas 4 5 8 11 19 25 29 2,9% 4,4% 2,8% 5,6% 3,0% 1,5%Electricity 29 31 29 31 36 40 45 0,7% -0,8% 0,9% 1,5% 1,1% 1,0%Heat 0 0 0 0 0 0 0 n.s. n.s. n.s. n.s. n.s. n.s.Biomass & Other 3 3 3 4 5 6 6 0,4% 0,4% 3,0% 2,8% 1,6% 0,7%
Buildings 83 110 113 111 118 122 125 2,8% 0,3% -0,2% 0,6% 0,4% 0,2%Coal 1 1 1 0 0 0 0 -4,4% -1,8% -1,0% -2,3% -2,6% -2,9%Oil 36 42 30 27 25 22 20 1,6% -3,4% -1,1% -0,5% -1,3% -1,3%Gas 11 18 26 23 21 19 19 4,7% 4,0% -1,3% -0,9% -0,9% -0,3%Electricity 34 48 56 56 60 64 68 3,6% 1,4% 0,0% 0,7% 0,6% 0,6%Heat 1 1 1 2 2 4 6 0,4% -2,8% 3,4% 2,4% 6,5% 4,8%Biomass & Other 0 0 0 4 9 13 13 -7,5% -7,9% n.s. 10,0% 3,4% -0,4%
Agriculture 7 5 3 4 4 4 4 -2,6% -4,3% 0,8% 0,4% 0,4% 0,4%Coal 0 0 0 0 0 0 0 n.s. n.s. n.s. n.s. n.s. n.s.Oil 7 5 3 4 4 4 4 -2,6% -4,3% 0,8% 0,4% 0,4% 0,4%Gas 0 0 0 0 0 0 0 n.s. n.s. n.s. n.s. n.s. n.s.Electricity 0 0 0 0 0 0 0 -0,3% -5,7% 0,6% 0,7% 0,7% 0,7%Heat 0 0 0 0 0 0 0 n.s. n.s. n.s. n.s. n.s. n.s.Biomass & Other 0 0 0 0 0 0 0 n.s. n.s. n.s. n.s. n.s. n.s.
Transport 72 88 78 77 75 72 69 2,0% -1,2% -0,2% -0,2% -0,4% -0,4%Coal 0 0 0 0 0 0 0 n.s. n.s. n.s. n.s. n.s. n.s.Oil 71 87 77 74 66 54 47 2,0% -1,2% -0,3% -1,1% -2,0% -1,4%Gas 0 0 0 0 0 0 0 n.s. n.s. n.s. n.s. n.s. n.s.Electricity 1 2 2 2 4 7 10 1,0% 0,4% 1,8% 8,3% 5,1% 3,0%Heat 0 0 0 0 0 0 0 n.s. n.s. n.s. n.s. n.s. n.s.Biomass & Other 0 0 0 1 5 10 12 n.s. n.s. 23,0% 25,0% 8,5% 1,7%
Energy Branch Consumption 17 18 18 16 17 16 15 0,6% -0,1% -1,0% 0,0% -0,6% -0,2%Other Transformation & Losses 4 70 89 94 91 109 126 139 2,5% 0,5% -0,2% 1,7% 1,5% 1,0%
2 does not include international aviation and maritime bunkers; includes non-energy uses3 ratio of renewable energy over final energy demand increased by distribution losses and self consumption of electricity and steam plants4 includes statistical differences
48
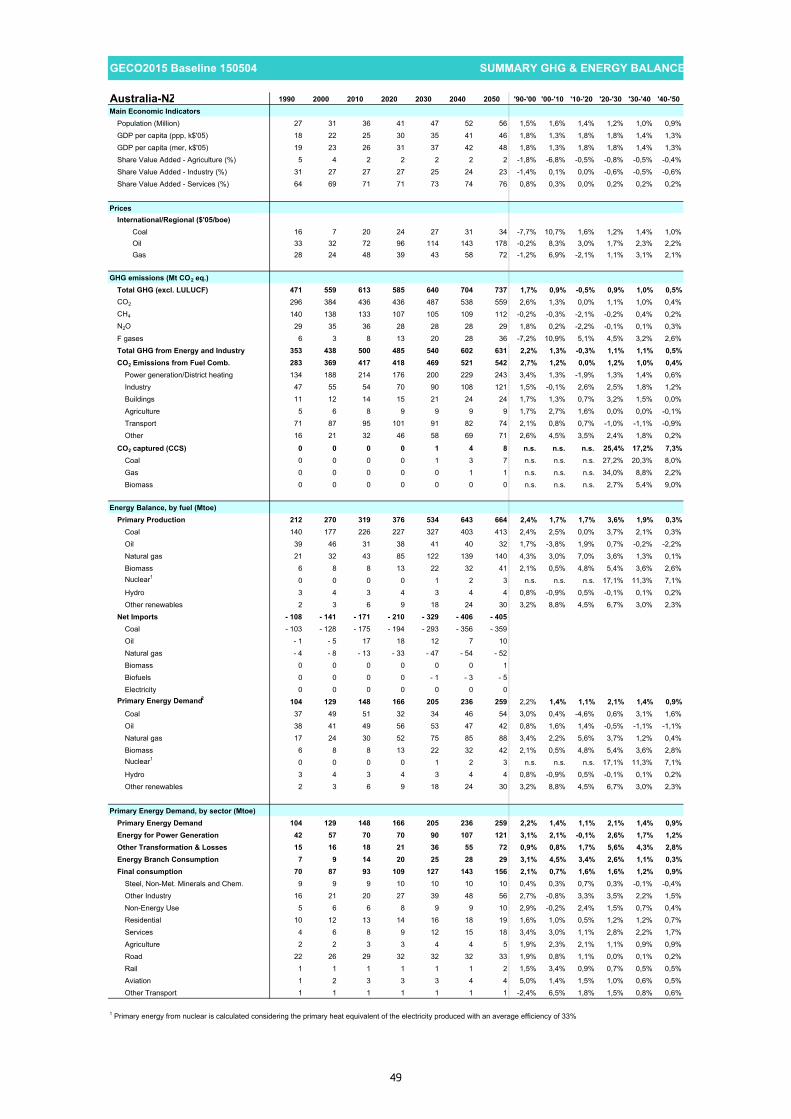
GECO2015 Baseline 150504 SUMMARY GHG & ENERGY BALANCE##### 100
Australia-NZ 1990 2000 2010 2020 2030 2040 2050 '90-'00 '00-'10 '10-'20 '20-'30 '30-'40 '40-'50Main Economic Indicators
Population (Million) 27 31 36 41 47 52 56 1,5% 1,6% 1,4% 1,2% 1,0% 0,9%GDP per capita (ppp, k$'05) 18 22 25 30 35 41 46 1,8% 1,3% 1,8% 1,8% 1,4% 1,3%GDP per capita (mer, k$'05) 19 23 26 31 37 42 48 1,8% 1,3% 1,8% 1,8% 1,4% 1,3%Share Value Added - Agriculture (%) 5 4 2 2 2 2 2 -1,8% -6,8% -0,5% -0,8% -0,5% -0,4%Share Value Added - Industry (%) 31 27 27 27 25 24 23 -1,4% 0,1% 0,0% -0,6% -0,5% -0,6%Share Value Added - Services (%) 64 69 71 71 73 74 76 0,8% 0,3% 0,0% 0,2% 0,2% 0,2%
PricesInternational/Regional ($'05/boe)
Coal 16 7 20 24 27 31 34 -7,7% 10,7% 1,6% 1,2% 1,4% 1,0%Oil 33 32 72 96 114 143 178 -0,2% 8,3% 3,0% 1,7% 2,3% 2,2%Gas 28 24 48 39 43 58 72 -1,2% 6,9% -2,1% 1,1% 3,1% 2,1%
GHG emissions (Mt CO2 eq.)Total GHG (excl. LULUCF) 471 559 613 585 640 704 737 1,7% 0,9% -0,5% 0,9% 1,0% 0,5%CO2 296 384 436 436 487 538 559 2,6% 1,3% 0,0% 1,1% 1,0% 0,4%CH4 140 138 133 107 105 109 112 -0,2% -0,3% -2,1% -0,2% 0,4% 0,2%N2O 29 35 36 28 28 28 29 1,8% 0,2% -2,2% -0,1% 0,1% 0,3%F gases 6 3 8 13 20 28 36 -7,2% 10,9% 5,1% 4,5% 3,2% 2,6%Total GHG from Energy and Industry 353 438 500 485 540 602 631 2,2% 1,3% -0,3% 1,1% 1,1% 0,5%CO2 Emissions from Fuel Comb. 283 369 417 418 469 521 542 2,7% 1,2% 0,0% 1,2% 1,0% 0,4%
Power generation/District heating 134 188 214 176 200 229 243 3,4% 1,3% -1,9% 1,3% 1,4% 0,6%Industry 47 55 54 70 90 108 121 1,5% -0,1% 2,6% 2,5% 1,8% 1,2%Buildings 11 12 14 15 21 24 24 1,7% 1,3% 0,7% 3,2% 1,5% 0,0%Agriculture 5 6 8 9 9 9 9 1,7% 2,7% 1,6% 0,0% 0,0% -0,1%Transport 71 87 95 101 91 82 74 2,1% 0,8% 0,7% -1,0% -1,1% -0,9%Other 16 21 32 46 58 69 71 2,6% 4,5% 3,5% 2,4% 1,8% 0,2%
CO2 captured (CCS) 0 0 0 0 1 4 8 n.s. n.s. n.s. 25,4% 17,2% 7,3%Coal 0 0 0 0 1 3 7 n.s. n.s. n.s. 27,2% 20,3% 8,0%Gas 0 0 0 0 0 1 1 n.s. n.s. n.s. 34,0% 8,8% 2,2%Biomass 0 0 0 0 0 0 0 n.s. n.s. n.s. 2,7% 5,4% 9,0%
Energy Balance, by fuel (Mtoe)Primary Production 212 270 319 376 534 643 664 2,4% 1,7% 1,7% 3,6% 1,9% 0,3%
Coal 140 177 226 227 327 403 413 2,4% 2,5% 0,0% 3,7% 2,1% 0,3%Oil 39 46 31 38 41 40 32 1,7% -3,8% 1,9% 0,7% -0,2% -2,2%Natural gas 21 32 43 85 122 139 140 4,3% 3,0% 7,0% 3,6% 1,3% 0,1%Biomass 6 8 8 13 22 32 41 2,1% 0,5% 4,8% 5,4% 3,6% 2,6%Nuclear1 0 0 0 0 1 2 3 n.s. n.s. n.s. 17,1% 11,3% 7,1%Hydro 3 4 3 4 3 4 4 0,8% -0,9% 0,5% -0,1% 0,1% 0,2%Other renewables 2 3 6 9 18 24 30 3,2% 8,8% 4,5% 6,7% 3,0% 2,3%
Net Imports - 108 - 141 - 171 - 210 - 329 - 406 - 405Coal - 103 - 128 - 175 - 194 - 293 - 356 - 359Oil - 1 - 5 17 18 12 7 10Natural gas - 4 - 8 - 13 - 33 - 47 - 54 - 52Biomass 0 0 0 0 0 0 1Biofuels 0 0 0 0 - 1 - 3 - 5Electricity 0 0 0 0 0 0 0
Primary Energy Demand2 104 129 148 166 205 236 259 2,2% 1,4% 1,1% 2,1% 1,4% 0,9%Coal 37 49 51 32 34 46 54 3,0% 0,4% -4,6% 0,6% 3,1% 1,6%Oil 38 41 49 56 53 47 42 0,8% 1,6% 1,4% -0,5% -1,1% -1,1%Natural gas 17 24 30 52 75 85 88 3,4% 2,2% 5,6% 3,7% 1,2% 0,4%Biomass 6 8 8 13 22 32 42 2,1% 0,5% 4,8% 5,4% 3,6% 2,8%Nuclear1 0 0 0 0 1 2 3 n.s. n.s. n.s. 17,1% 11,3% 7,1%Hydro 3 4 3 4 3 4 4 0,8% -0,9% 0,5% -0,1% 0,1% 0,2%Other renewables 2 3 6 9 18 24 30 3,2% 8,8% 4,5% 6,7% 3,0% 2,3%
Primary Energy Demand, by sector (Mtoe)Primary Energy Demand 104 129 148 166 205 236 259 2,2% 1,4% 1,1% 2,1% 1,4% 0,9%Energy for Power Generation 42 57 70 70 90 107 121 3,1% 2,1% -0,1% 2,6% 1,7% 1,2%Other Transformation & Losses 15 16 18 21 36 55 72 0,9% 0,8% 1,7% 5,6% 4,3% 2,8%Energy Branch Consumption 7 9 14 20 25 28 29 3,1% 4,5% 3,4% 2,6% 1,1% 0,3%Final consumption 70 87 93 109 127 143 156 2,1% 0,7% 1,6% 1,6% 1,2% 0,9%
Steel, Non-Met. Minerals and Chem. 9 9 9 10 10 10 10 0,4% 0,3% 0,7% 0,3% -0,1% -0,4%Other Industry 16 21 20 27 39 48 56 2,7% -0,8% 3,3% 3,5% 2,2% 1,5%Non-Energy Use 5 6 6 8 9 9 10 2,9% -0,2% 2,4% 1,5% 0,7% 0,4%Residential 10 12 13 14 16 18 19 1,6% 1,0% 0,5% 1,2% 1,2% 0,7%Services 4 6 8 9 12 15 18 3,4% 3,0% 1,1% 2,8% 2,2% 1,7%Agriculture 2 2 3 3 4 4 5 1,9% 2,3% 2,1% 1,1% 0,9% 0,9%Road 22 26 29 32 32 32 33 1,9% 0,8% 1,1% 0,0% 0,1% 0,2%Rail 1 1 1 1 1 1 2 1,5% 3,4% 0,9% 0,7% 0,5% 0,5%Aviation 1 2 3 3 3 4 4 5,0% 1,4% 1,5% 1,0% 0,6% 0,5%Other Transport 1 1 1 1 1 1 1 -2,4% 6,5% 1,8% 1,5% 0,8% 0,6%
1 Primary energy from nuclear is calculated considering the primary heat equivalent of the electricity produced with an average efficiency of 33%
49

GECO2015 Baseline 150504 SUMMARY GHG & ENERGY BALANCE##### 100
Australia-NZ 1990 2000 2010 2020 2030 2040 2050 '90-'00 '00-'10 '10-'20 '20-'30 '30-'40 '40-'50Power Generation
Fuel Inputs Therm. Power (Mtoe) 37 51 61 57 68 78 83 3,3% 1,8% -0,7% 1,9% 1,3% 0,7%Coal 30 43 46 28 28 34 38 3,6% 0,8% -5,0% 0,1% 2,0% 1,0%Oil 1 1 2 2 2 2 2 -2,3% 5,7% 4,4% -0,8% -0,5% -0,8%Gas 5 6 10 25 35 38 39 2,4% 5,4% 9,2% 3,5% 0,8% 0,2%Biomass & Waste 1 1 2 1 2 2 3 0,1% 8,6% -6,0% 4,6% 3,1% 4,0%Other 0 0 1 1 1 1 1 3,2% 7,8% 2,5% 6,5% 1,4% -0,1%
Gross Elec. Generation (TWh e) 190 253 289 318 425 539 644 2,9% 1,3% 1,0% 2,9% 2,4% 1,8%Coal 122 176 183 111 117 151 172 3,7% 0,4% -4,8% 0,5% 2,6% 1,3%
of which CCS 0 0 0 0 1 2 5 n.s. n.s. n.s. n.s. 14,0% 7,6%Oil 4 3 6 10 10 9 9 -2,8% 5,5% 6,2% -0,7% -0,3% -0,5%Gas 20 26 46 120 183 209 216 2,6% 5,9% 10,0% 4,3% 1,3% 0,4%
of which CCS 0 0 0 0 1 2 2 n.s. n.s. n.s. n.s. 9,3% 2,3%Biomass & Waste 1 2 3 4 6 10 15 3,3% 6,7% 0,3% 6,0% 4,3% 4,8%
of which CCS 0 0 0 0 0 0 0 n.s. n.s. n.s. n.s. n.s. n.s.Nuclear 0 0 0 0 2 7 13 n.s. n.s. n.s. 17,4% 11,4% 6,9%Hydro 39 43 39 41 40 41 42 0,8% -0,9% 0,5% -0,1% 0,1% 0,2%Wind 0 0 5 14 32 57 83 n.s. 40,3% 10,4% 8,6% 5,8% 3,8%Solar 0 0 0 9 18 37 75 15,0% 25,1% 38,4% 7,2% 7,3% 7,2%Other 2 3 6 8 15 18 19 3,2% 7,8% 2,6% 6,6% 1,6% 0,7%
Generation Capacity (GWe) 47 56 70 87 108 143 193 1,8% 2,3% 2,2% 2,3% 2,8% 3,1%Coal 25 28 31 29 23 26 29 0,8% 1,1% -0,7% -2,1% 1,1% 1,3%
of which CCS 0 0 0 0 0 0 1 n.s. n.s. n.s. n.s. 14,2% 7,9%Oil 2 4 3 2 2 2 2 6,5% -4,5% -2,3% -1,9% -1,1% 0,5%Gas 5 8 17 26 38 45 52 4,9% 8,1% 4,1% 4,0% 1,8% 1,5%
of which CCS 0 0 0 0 0 0 0 n.s. n.s. n.s. n.s. 9,7% 2,9%Biomass & Waste 0 0 0 0 1 1 2 2,6% 0,4% 0,3% 6,0% 4,1% 4,9%
of which CCS 0 0 0 0 0 0 0 n.s. n.s. n.s. n.s. n.s. n.s.Nuclear 0 0 0 0 0 1 2 n.s. n.s. n.s. 17,1% 11,1% 6,6%Hydro 13 15 15 16 16 16 16 1,1% 0,4% 0,3% -0,1% 0,1% 0,2%Wind 0 0 2 6 14 24 34 n.s. 43,4% 9,9% 8,4% 5,6% 3,7%Solar 0 0 0 7 13 27 53 13,6% 24,8% 40,3% 7,0% 7,1% 7,1%Other 0 0 1 1 2 2 3 4,4% 5,4% 4,8% 6,0% 2,1% 1,6%
Total Final Consumption 2 (Mtoe) 70 87 93 109 127 143 156 2,1% 0,7% 1,6% 1,6% 1,2% 0,9%Coal 6 6 5 5 7 10 14 -0,7% -1,7% 0,3% 2,9% 4,0% 3,1%Oil 34 41 45 51 48 44 40 1,9% 1,0% 1,1% -0,5% -0,9% -1,0%Gas 11 14 14 19 26 30 31 3,0% 0,1% 2,8% 3,2% 1,5% 0,4%Electricity 14 18 21 23 31 40 48 2,8% 1,5% 1,0% 3,0% 2,5% 1,9%Heat 0 0 0 1 1 1 2 0,9% 5,6% 5,0% 1,3% 4,7% 4,7%Biomass & Other 6 7 6 10 14 17 20 2,3% -1,4% 4,9% 3,5% 2,1% 1,7%Share of Renewables 3 (%) 13% 13% 12% 16% 19% 22% 26% -0,3% -0,9% 2,8% 2,0% 1,5% 1,8%
Industry (incl. non-energy use) 30 36 35 45 58 68 75 2,1% -0,4% 2,5% 2,5% 1,6% 1,1%Coal 6 6 5 5 7 10 14 -0,5% -1,7% 0,3% 3,0% 4,0% 3,1%Oil 7 9 9 11 12 11 10 1,9% 0,5% 2,3% 0,4% -0,8% -1,4%Gas 8 10 10 14 20 23 24 2,9% -0,3% 3,7% 3,2% 1,5% 0,5%Electricity 6 8 8 9 13 17 21 2,6% -0,2% 1,7% 3,7% 2,6% 1,8%Heat 0 0 0 0 0 0 0 2,1% 0,7% 0,0% -0,2% -0,3% -0,2%Biomass & Other 2 4 3 5 6 6 7 4,7% -1,9% 4,5% 2,3% 1,0% 1,2%
Buildings 15 18 21 23 28 33 37 2,1% 1,7% 0,8% 1,9% 1,6% 1,2%Coal 0 0 0 0 0 0 0 -7,9% -4,0% -4,4% -5,5% -5,4% -5,6%Oil 1 1 1 1 2 2 2 -0,1% 2,5% 1,9% 3,2% 1,4% -0,4%Gas 3 4 4 5 6 7 7 3,3% 1,2% 0,4% 3,2% 1,5% 0,1%Electricity 7 9 12 13 15 18 21 2,9% 2,8% 0,3% 1,7% 1,7% 1,6%Heat 0 0 0 1 1 1 2 -0,1% 9,1% 6,8% 1,7% 5,5% 5,1%Biomass & Other 3 3 3 4 4 4 4 0,4% -1,6% 2,0% 0,4% 0,6% 0,5%
Agriculture 2 2 3 3 4 4 5 1,9% 2,3% 2,1% 1,1% 0,9% 0,9%Coal 0 0 0 0 0 0 0 4,6% 12,2% 5,1% -1,6% -1,4% -1,4%Oil 2 2 2 3 3 3 3 1,7% 2,7% 1,5% 0,0% 0,0% 0,0%Gas 0 0 0 0 0 0 0 0,3% -2,8% -5,6% 0,1% 0,1% 0,1%Electricity 0 0 0 0 1 1 1 3,2% 0,0% 2,8% 3,6% 2,7% 2,3%Heat 0 0 0 0 0 0 0 n.s. n.s. n.s. n.s. n.s. n.s.Biomass & Other 0 0 0 0 0 0 1 n.s. n.s. n.s. 9,6% 4,2% 2,9%
Transport 24 30 33 37 38 38 39 2,0% 1,1% 1,1% 0,1% 0,1% 0,3%Coal 0 0 0 0 0 0 0 -3,1% n.s. n.s. n.s. n.s. n.s.Oil 24 30 33 35 32 28 26 2,0% 1,0% 0,7% -1,1% -1,1% -0,9%Gas 0 0 0 0 0 0 0 n.s. n.s. n.s. n.s. n.s. n.s.Electricity 0 0 0 1 2 4 6 2,5% 5,1% 6,5% 12,5% 6,4% 3,6%Heat 0 0 0 0 0 0 0 n.s. n.s. n.s. n.s. n.s. n.s.Biomass & Other 0 0 0 2 4 6 8 n.s. n.s. 21,1% 9,9% 4,3% 2,7%
Energy Branch Consumption 7 9 14 20 25 28 29 3,1% 4,5% 3,4% 2,6% 1,1% 0,3%Other Transformation & Losses 4 15 16 18 21 36 55 72 0,9% 0,8% 1,7% 5,6% 4,3% 2,8%
2 does not include international aviation and maritime bunkers; includes non-energy uses3 ratio of renewable energy over final energy demand increased by distribution losses and self consumption of electricity and steam plants4 includes statistical differences
50

GECO2015 Baseline 150504 SUMMARY GHG & ENERGY BALANCE##### 100
North Africa Non-producers 1990 2000 2010 2020 2030 2040 2050 '90-'00 '00-'10 '10-'20 '20-'30 '30-'40 '40-'50Main Economic Indicators
Population (Million) 33 39 43 48 53 55 57 1,6% 1,0% 1,2% 0,8% 0,5% 0,3%GDP per capita (ppp, k$'05) 3 4 5 7 11 16 23 1,7% 3,7% 2,9% 4,4% 4,2% 3,5%GDP per capita (mer, k$'05) 2 2 3 4 6 8 12 1,6% 3,7% 2,9% 4,4% 4,2% 3,5%Share Value Added - Agriculture (%) 18 14 13 10 8 7 6 -2,8% -0,5% -2,3% -2,4% -1,6% -0,9%Share Value Added - Industry (%) 33 30 30 30 30 26 22 -1,2% 0,2% 0,1% -0,3% -1,1% -1,7%Share Value Added - Services (%) 48 57 57 59 62 67 71 1,6% 0,0% 0,4% 0,5% 0,7% 0,7%
PricesInternational/Regional ($'05/boe)
Coal 18 9 19 22 24 27 30 -6,6% 7,6% 1,4% 0,7% 1,5% 0,9%Oil 33 32 72 96 114 143 178 -0,2% 8,3% 3,0% 1,7% 2,3% 2,2%Gas 18 21 31 38 46 59 71 1,4% 4,0% 2,1% 2,1% 2,5% 1,9%
GHG emissions (Mt CO2 eq.)Total GHG (excl. LULUCF) 58 78 101 121 166 212 238 3,0% 2,6% 1,8% 3,2% 2,5% 1,2%CO2 37 54 74 90 129 169 192 3,7% 3,3% 2,0% 3,6% 2,8% 1,3%CH4 13 16 18 22 27 32 34 2,1% 1,3% 1,6% 2,4% 1,6% 0,7%N2O 8 8 8 9 10 11 11 0,4% 0,5% 0,7% 1,0% 0,7% 0,4%F gases 0 0 0 0 0 0 0 n.s. n.s. n.s. 3,1% 2,3% 1,1%Total GHG from Energy and Industry 45 64 87 107 152 198 223 3,5% 3,0% 2,1% 3,6% 2,7% 1,2%CO2 Emissions from Fuel Comb. 32 47 66 80 115 153 175 3,9% 3,4% 1,9% 3,7% 2,9% 1,3%
Power generation/District heating 12 17 24 34 55 82 97 3,9% 3,4% 3,6% 5,0% 4,1% 1,7%Industry 8 8 11 11 17 22 25 0,5% 2,9% -0,3% 4,4% 2,9% 1,1%Buildings 3 5 8 6 10 14 16 5,9% 4,1% -2,2% 4,4% 3,2% 1,5%Agriculture 2 4 7 8 10 12 14 6,3% 6,9% 1,8% 1,8% 1,8% 1,5%Transport 6 11 15 19 22 21 19 6,1% 2,8% 2,7% 1,2% -0,5% -0,8%Other 2 2 1 1 1 3 4 2,3% -4,9% -0,4% 3,1% 5,6% 5,0%
CO2 captured (CCS) 0 0 0 0 0 0 0 n.s. n.s. n.s. n.s. n.s. 8,3%Coal 0 0 0 0 0 0 0 n.s. n.s. n.s. n.s. n.s. 8,3%Gas 0 0 0 0 0 0 0 n.s. n.s. n.s. n.s. n.s. 8,2%Biomass 0 0 0 0 0 0 0 n.s. n.s. n.s. n.s. n.s. 8,5%
Energy Balance, by fuel (Mtoe)Primary Production 6 7 9 12 16 22 28 0,6% 2,3% 3,3% 3,2% 3,1% 2,4%
Coal 0 0 0 0 0 0 0 -24,1% n.s. n.s. n.s. n.s. n.s.Oil 5 4 4 6 7 8 9 -2,2% 0,3% 3,8% 2,3% 1,6% 1,0%Natural gas 0 2 2 3 4 6 8 17,5% 3,6% 1,5% 3,3% 4,7% 2,6%Biomass 1 1 2 2 3 3 3 3,5% 3,4% 2,3% 4,2% 0,8% -0,3%Nuclear1 0 0 0 0 0 0 0 n.s. n.s. n.s. n.s. 14,8% 22,1%Hydro 0 0 0 0 0 0 0 -4,7% 16,8% -1,6% 0,6% 0,6% 0,6%Other renewables 0 0 0 1 2 4 7 26,0% 32,4% 16,6% 6,2% 7,7% 6,4%
Net Imports 5 11 17 20 30 39 45Coal 1 3 3 5 10 17 21Oil 4 7 11 9 9 8 6Natural gas 1 1 3 5 9 12 13Biomass 0 0 0 0 1 1 3Biofuels 0 0 0 0 0 1 1Electricity 0 0 0 0 0 0 0
Primary Energy Demand2 12 17 26 32 46 61 72 3,9% 4,0% 2,1% 3,8% 2,9% 1,7%Coal 1 3 3 5 10 17 21 8,4% 0,2% 6,7% 6,3% 5,5% 2,1%Oil 8 10 15 15 17 16 15 2,2% 4,0% -0,3% 1,0% -0,3% -0,4%Natural gas 1 3 5 7 13 18 21 8,2% 6,0% 4,1% 6,0% 3,2% 1,6%Biomass 1 1 2 2 4 5 6 3,5% 3,4% 3,4% 4,6% 2,7% 2,3%Nuclear1 0 0 0 0 0 0 0 n.s. n.s. n.s. n.s. 14,8% 22,1%Hydro 0 0 0 0 0 0 0 -4,7% 16,8% -1,6% 0,6% 0,6% 0,6%Other renewables 0 0 0 1 2 4 7 26,0% 32,4% 16,6% 6,2% 7,7% 6,4%
Primary Energy Demand, by sector (Mtoe)Primary Energy Demand 12 17 26 32 46 61 72 3,9% 4,0% 2,1% 3,8% 2,9% 1,7%Energy for Power Generation 4 5 8 12 19 29 37 3,7% 4,3% 3,8% 5,0% 4,1% 2,4%Other Transformation & Losses 2 2 4 6 11 17 24 2,6% 5,8% 5,0% 6,3% 5,0% 3,2%Energy Branch Consumption 0 0 0 1 1 1 1 3,1% 2,6% 1,8% 3,7% 3,3% 2,4%Final consumption 9 13 20 24 33 42 50 4,4% 4,0% 1,8% 3,4% 2,6% 1,7%
Steel, Non-Met. Minerals and Chem. 0 0 2 2 3 4 5 0,1% 18,1% 1,0% 4,3% 2,9% 1,3%Other Industry 3 3 3 4 6 8 9 1,5% -0,5% 1,5% 5,0% 3,1% 1,4%Non-Energy Use 0 0 1 1 1 1 1 8,2% 4,5% -0,6% 2,7% 1,0% -0,5%Residential 2 3 5 5 6 8 10 4,8% 4,0% 0,5% 2,7% 2,3% 1,6%Services 0 0 1 2 3 5 7 6,8% 9,8% 3,3% 5,5% 4,7% 3,7%Agriculture 1 1 2 3 3 4 5 6,3% 7,0% 1,8% 1,8% 1,8% 1,6%Road 2 4 5 7 9 11 13 5,8% 2,7% 3,4% 2,8% 2,0% 1,3%Rail 0 0 0 0 0 0 0 5,2% 2,9% 1,2% 1,3% 1,2% 0,9%Aviation 0 0 0 0 0 0 0 n.s. n.s. n.s. n.s. n.s. n.s.Other Transport 0 0 0 1 1 1 1 9,4% 3,6% 3,1% 3,9% 3,4% 2,5%
1 Primary energy from nuclear is calculated considering the primary heat equivalent of the electricity produced with an average efficiency of 33%
51

GECO2015 Baseline 150504 SUMMARY GHG & ENERGY BALANCE##### 100
North Africa Non-producers 1990 2000 2010 2020 2030 2040 2050 '90-'00 '00-'10 '10-'20 '20-'30 '30-'40 '40-'50Power Generation
Fuel Inputs Therm. Power (Mtoe) 4 5 8 11 17 25 30 3,8% 3,8% 3,3% 4,9% 3,7% 1,7%Coal 1 2 3 5 8 14 17 10,9% 2,7% 6,0% 5,5% 5,3% 1,9%Oil 2 1 1 1 1 1 1 -5,9% 1,4% -8,5% 4,7% -0,3% 1,7%Gas 1 2 4 5 8 10 11 9,2% 5,7% 3,6% 4,4% 2,0% 1,2%Biomass & Waste 0 0 0 0 0 0 0 n.s. n.s. n.s. 33,8% 12,0% 10,1%Other 0 0 0 0 0 0 0 n.s. n.s. n.s. n.s. n.s. n.s.
Gross Elec. Generation (TWh e) 15 23 39 58 100 161 219 4,3% 5,1% 4,2% 5,6% 4,8% 3,1%Coal 2 9 11 22 40 70 88 14,8% 2,4% 7,1% 6,1% 5,9% 2,3%
of which CCS 0 0 0 0 0 0 0 n.s. n.s. n.s. n.s. n.s. n.s.Oil 8 5 5 2 3 3 4 -5,8% 0,9% -7,7% 4,3% 0,0% 2,1%Gas 4 9 18 26 42 54 62 9,6% 6,9% 3,8% 4,8% 2,5% 1,4%
of which CCS 0 0 0 0 0 0 0 n.s. n.s. n.s. n.s. n.s. n.s.Biomass & Waste 0 0 0 0 0 1 2 n.s. n.s. n.s. 34,6% 12,6% 10,8%
of which CCS 0 0 0 0 0 0 0 n.s. n.s. n.s. n.s. n.s. n.s.Nuclear 0 0 0 0 0 0 0 n.s. n.s. n.s. n.s. n.s. n.s.Hydro 1 1 4 3 3 4 4 -4,7% 16,8% -1,6% 0,6% 0,6% 0,6%Wind 0 0 1 4 9 21 37 n.s. 23,5% 17,9% 9,4% 8,7% 5,9%Solar 0 0 0 1 2 8 21 n.s. n.s. 22,1% 14,9% 12,4% 10,1%Other 0 0 0 0 0 0 1 n.s. n.s. n.s. 39,7% 19,9% 12,8%
Generation Capacity (GWe) 4 7 10 14 22 38 59 6,8% 3,5% 3,4% 4,6% 5,6% 4,4%Coal 1 3 3 3 6 11 14 10,9% 0,0% 1,6% 5,6% 6,4% 2,5%
of which CCS 0 0 0 0 0 0 0 n.s. n.s. n.s. n.s. n.s. n.s.Oil 1 1 1 1 1 1 2 -2,9% 5,5% 1,0% -0,8% -0,3% 3,1%Gas 1 2 4 5 7 10 13 10,7% 6,9% 3,5% 3,4% 3,0% 2,3%
of which CCS 0 0 0 0 0 0 0 n.s. n.s. n.s. n.s. n.s. n.s.Biomass & Waste 0 0 0 0 0 0 0 n.s. n.s. n.s. 34,9% 12,4% 11,2%
of which CCS 0 0 0 0 0 0 0 n.s. n.s. n.s. n.s. n.s. n.s.Nuclear 0 0 0 0 0 0 0 n.s. n.s. n.s. n.s. n.s. n.s.Hydro 1 2 2 2 2 2 2 4,3% 1,4% 1,0% 0,6% 0,6% 0,6%Wind 0 0 0 2 4 9 16 n.s. 18,7% 16,9% 9,3% 8,6% 5,7%Solar 0 0 0 0 2 5 13 n.s. n.s. 22,4% 14,9% 12,3% 10,0%Other 0 0 0 0 0 0 0 n.s. n.s. n.s. n.s. 19,3% 12,3%
Total Final Consumption 2 (Mtoe) 9 13 20 24 33 42 50 4,4% 4,0% 1,8% 3,4% 2,6% 1,7%Coal 0 1 0 0 1 3 3 2,8% -28,5% 33,5% 13,5% 6,7% 3,1%Oil 6 9 14 14 15 15 14 4,3% 4,3% 0,3% 0,8% -0,3% -0,5%Gas 0 1 1 2 5 8 9 6,1% 5,9% 6,1% 9,1% 4,4% 1,6%Electricity 1 2 3 5 8 12 17 5,2% 5,6% 3,6% 5,3% 4,7% 3,1%Heat 0 0 0 1 1 1 2 n.s. n.s. n.s. 2,6% 4,9% 4,6%Biomass & Other 1 1 2 2 3 4 5 3,5% 3,4% 1,6% 4,0% 3,4% 2,7%Share of Renewables 3 (%) 10% 9% 11% 13% 14% 17% 21% -1,2% 1,6% 1,7% 0,8% 1,8% 2,5%
Industry (incl. non-energy use) 3 4 6 6 10 13 15 2,0% 3,3% 1,1% 4,6% 2,9% 1,3%Coal 0 1 0 0 1 3 3 2,8% -28,5% 33,5% 13,5% 6,7% 3,1%Oil 2 2 3 3 3 2 2 0,0% 5,8% -2,8% -0,2% -1,7% -3,2%Gas 0 0 1 1 2 3 3 5,1% 5,5% 3,6% 7,0% 3,3% 0,6%Electricity 1 1 1 2 3 5 6 4,3% 3,1% 4,7% 5,5% 3,7% 2,1%Heat 0 0 0 0 0 0 0 n.s. n.s. n.s. n.s. n.s. n.s.Biomass & Other 0 0 0 0 0 0 0 n.s. 1,1% 6,0% 5,9% 1,1% 2,0%
Buildings 2 4 6 7 9 13 16 5,0% 4,9% 1,1% 3,5% 3,1% 2,4%Coal 0 0 0 0 0 0 0 n.s. n.s. n.s. n.s. n.s. n.s.Oil 1 2 2 1 1 1 1 5,7% 3,9% -4,9% -1,3% -1,2% -1,1%Gas 0 0 0 1 3 4 5 10,1% 6,9% 11,0% 11,5% 5,3% 2,2%Electricity 0 1 2 2 3 5 7 6,4% 7,7% 2,9% 4,0% 3,9% 3,3%Heat 0 0 0 1 1 1 2 n.s. n.s. n.s. 2,6% 4,9% 4,6%Biomass & Other 1 1 2 1 1 1 1 2,9% 3,6% -0,9% -1,0% -2,7% -2,0%
Agriculture 1 1 2 3 3 4 5 6,3% 7,0% 1,8% 1,8% 1,8% 1,6%Coal 0 0 0 0 0 0 0 n.s. n.s. n.s. n.s. n.s. n.s.Oil 1 1 2 3 3 4 4 6,3% 6,9% 1,8% 1,8% 1,8% 1,5%Gas 0 0 0 0 0 0 0 n.s. n.s. 1,0% 1,5% 1,6% 1,3%Electricity 0 0 0 0 0 0 0 6,1% 6,9% 1,6% 2,6% 2,6% 2,3%Heat 0 0 0 0 0 0 0 n.s. n.s. n.s. n.s. n.s. n.s.Biomass & Other 0 0 0 0 0 0 0 n.s. n.s. n.s. n.s. n.s. n.s.
Transport 2 4 6 8 10 13 14 6,0% 2,8% 3,3% 2,8% 2,1% 1,4%Coal 0 0 0 0 0 0 0 n.s. n.s. n.s. n.s. n.s. n.s.Oil 2 4 6 7 8 8 7 6,0% 2,8% 2,8% 1,2% -0,6% -0,9%Gas 0 0 0 0 0 0 0 n.s. n.s. n.s. n.s. n.s. n.s.Electricity 0 0 0 0 1 2 3 2,8% 2,6% 5,6% 24,2% 11,7% 4,9%Heat 0 0 0 0 0 0 0 n.s. n.s. n.s. n.s. n.s. n.s.Biomass & Other 0 0 0 0 1 3 4 n.s. n.s. n.s. 13,8% 7,5% 4,1%
Energy Branch Consumption 0 0 0 1 1 1 1 3,1% 2,6% 1,8% 3,7% 3,3% 2,4%Other Transformation & Losses 4 2 2 4 6 11 17 24 2,6% 5,8% 5,0% 6,3% 5,0% 3,2%
2 does not include international aviation and maritime bunkers; includes non-energy uses3 ratio of renewable energy over final energy demand increased by distribution losses and self consumption of electricity and steam plants4 includes statistical differences
52

GECO2015 Baseline 150504 SUMMARY GHG & ENERGY BALANCE##### 100
North Africa Producers 1990 2000 2010 2020 2030 2040 2050 '90-'00 '00-'10 '10-'20 '20-'30 '30-'40 '40-'50Main Economic Indicators
Population (Million) 31 37 43 51 56 60 63 1,9% 1,6% 1,6% 1,0% 0,7% 0,5%GDP per capita (ppp, k$'05) 7 7 9 11 16 22 29 -0,6% 2,3% 2,2% 4,2% 3,4% 2,6%GDP per capita (mer, k$'05) 3 3 4 5 7 10 13 -0,7% 2,3% 2,0% 4,2% 3,4% 2,6%Share Value Added - Agriculture (%) 8 5 9 8 7 6 6 -3,4% 4,6% -0,7% -1,6% -0,9% -0,5%Share Value Added - Industry (%) 33 36 51 47 42 36 30 1,0% 3,6% -0,8% -1,1% -1,6% -1,8%Share Value Added - Services (%) 59 58 40 45 51 58 64 -0,2% -3,7% 1,1% 1,3% 1,3% 1,0%
PricesInternational/Regional ($'05/boe)
Coal 18 9 19 22 24 27 30 -6,6% 7,6% 1,4% 0,7% 1,5% 0,9%Oil 33 32 72 96 114 143 178 -0,2% 8,3% 3,0% 1,7% 2,3% 2,2%Gas 18 21 31 38 46 59 71 1,4% 4,0% 2,1% 2,1% 2,5% 1,9%
GHG emissions (Mt CO2 eq.)Total GHG (excl. LULUCF) 144 182 245 334 447 498 491 2,3% 3,0% 3,2% 2,9% 1,1% -0,1%CO2 91 119 173 257 360 411 415 2,8% 3,8% 4,1% 3,4% 1,3% 0,1%CH4 48 57 64 67 74 73 62 1,7% 1,2% 0,4% 1,1% -0,1% -1,7%N2O 5 5 7 9 10 11 11 0,9% 2,5% 2,3% 1,9% 0,7% 0,1%F gases 1 1 1 2 2 3 3 4,0% 3,0% 2,7% 2,6% 2,1% 1,5%Total GHG from Energy and Industry 136 174 236 323 435 486 479 2,5% 3,1% 3,2% 3,0% 1,1% -0,2%CO2 Emissions from Fuel Comb. 83 110 157 237 335 382 384 2,8% 3,6% 4,2% 3,5% 1,3% 0,1%
Power generation/District heating 18 32 53 68 107 151 185 5,8% 5,3% 2,6% 4,6% 3,5% 2,1%Industry 10 14 19 24 26 25 23 3,2% 3,2% 2,3% 0,6% -0,4% -0,7%Buildings 9 13 19 24 29 29 25 3,8% 4,0% 2,3% 1,8% -0,1% -1,2%Agriculture 0 0 0 0 0 0 0 0,9% 17,7% 3,7% 1,9% 1,5% 1,3%Transport 17 22 37 76 112 112 90 2,5% 5,1% 7,6% 4,0% 0,0% -2,1%Other 28 29 29 44 61 66 60 0,2% 0,0% 4,4% 3,3% 0,9% -1,0%
CO2 captured (CCS) 0 0 0 0 0 0 0 n.s. n.s. n.s. n.s. 18,0% 2,2%Coal 0 0 0 0 0 0 0 n.s. n.s. n.s. n.s. 18,0% 2,3%Gas 0 0 0 0 0 0 0 n.s. n.s. n.s. n.s. 17,8% 2,1%Biomass 0 0 0 0 0 0 0 n.s. n.s. n.s. n.s. 18,1% 2,3%
Energy Balance, by fuel (Mtoe)Primary Production 178 218 245 292 359 361 315 2,1% 1,2% 1,8% 2,1% 0,1% -1,4%
Coal 0 0 0 0 0 0 0 n.s. n.s. n.s. n.s. n.s. n.s.Oil 137 149 166 181 206 210 168 0,9% 1,0% 0,9% 1,3% 0,2% -2,2%Natural gas 41 69 79 110 147 137 123 5,3% 1,4% 3,4% 2,9% -0,7% -1,1%Biomass 0 0 0 1 5 9 11 4,4% 1,2% 17,0% 15,9% 5,8% 1,8%Nuclear1 0 0 0 0 0 0 1 n.s. n.s. n.s. 18,3% 11,8% 7,4%Hydro 0 0 0 0 0 0 0 -8,8% 12,4% 6,7% 1,1% 1,0% 0,9%Other renewables 0 0 0 0 1 4 13 n.s. n.s. 19,0% 22,7% 20,7% 11,1%
Net Imports - 144 - 174 - 184 - 197 - 221 - 200 - 147Coal 0 1 0 1 3 11 24Oil - 119 - 127 - 135 - 137 - 143 - 146 - 116Natural gas - 25 - 48 - 50 - 61 - 81 - 65 - 57Biomass 0 0 0 0 0 - 1 1Biofuels 0 0 0 0 0 0 1Electricity 0 0 0 0 0 0 0
Primary Energy Demand2 34 44 61 96 138 161 167 2,6% 3,3% 4,7% 3,7% 1,6% 0,4%Coal 0 1 0 1 3 11 24 2,5% -4,0% 10,2% 13,8% 12,9% 8,0%Oil 17 22 31 44 63 64 52 2,5% 3,3% 3,7% 3,6% 0,1% -2,1%Natural gas 16 21 29 49 66 72 65 2,6% 3,3% 5,4% 3,0% 0,9% -1,0%Biomass 0 0 0 1 5 9 12 4,4% 1,2% 16,1% 15,7% 6,2% 3,3%Nuclear1 0 0 0 0 0 0 1 n.s. n.s. n.s. 18,3% 11,8% 7,4%Hydro 0 0 0 0 0 0 0 -8,8% 12,4% 6,7% 1,1% 1,0% 0,9%Other renewables 0 0 0 0 1 4 13 n.s. n.s. 19,0% 22,7% 20,7% 11,1%
Primary Energy Demand, by sector (Mtoe)Primary Energy Demand 34 44 61 96 138 161 167 2,6% 3,3% 4,7% 3,7% 1,6% 0,4%Energy for Power Generation 7 12 20 28 44 61 78 5,8% 5,5% 3,2% 4,5% 3,5% 2,4%Other Transformation & Losses 4 6 8 14 26 38 49 3,6% 2,8% 6,6% 6,1% 3,8% 2,5%Energy Branch Consumption 9 9 7 12 17 19 19 -0,8% -1,6% 5,0% 3,4% 1,3% -0,3%Final consumption 18 24 37 61 86 96 98 2,9% 4,5% 5,2% 3,5% 1,1% 0,2%
Steel, Non-Met. Minerals and Chem. 1 1 1 1 1 1 1 -1,6% 4,0% 2,8% -1,1% -1,4% -1,3%Other Industry 3 4 6 8 10 10 9 3,3% 4,7% 3,5% 1,6% -0,1% -0,6%Non-Energy Use 3 4 5 6 8 8 8 3,1% 0,6% 2,5% 2,6% 0,8% -0,1%Residential 4 6 8 10 13 14 14 4,6% 3,2% 2,8% 2,0% 0,7% 0,2%Services 0 1 3 5 8 11 15 5,0% 17,8% 6,1% 5,5% 3,5% 2,6%Agriculture 0 0 0 0 0 1 1 0,9% 10,0% 1,4% 2,6% 2,3% 2,0%Road 7 8 13 28 43 48 46 2,1% 5,1% 7,7% 4,4% 1,0% -0,5%Rail 0 0 0 0 0 0 0 1,2% 9,4% 1,9% 0,6% 0,4% 0,2%Aviation 0 0 0 1 2 3 4 4,1% n.s. 8,9% 7,0% 4,7% 2,3%Other Transport 0 0 0 0 0 0 0 0,9% 10,0% 4,6% 3,5% 2,2% 1,2%
1 Primary energy from nuclear is calculated considering the primary heat equivalent of the electricity produced with an average efficiency of 33%
53

GECO2015 Baseline 150504 SUMMARY GHG & ENERGY BALANCE##### 100
North Africa Producers 1990 2000 2010 2020 2030 2040 2050 '90-'00 '00-'10 '10-'20 '20-'30 '30-'40 '40-'50Power Generation
Fuel Inputs Therm. Power (Mtoe) 7 12 20 28 43 57 64 5,8% 5,5% 3,2% 4,4% 2,9% 1,3%Coal 0 0 0 0 2 10 22 n.s. n.s. n.s. 22,3% 15,4% 8,6%Oil 3 5 7 4 5 5 4 5,1% 3,9% -6,3% 3,1% 1,4% -2,1%Gas 4 7 14 24 35 41 35 6,3% 6,4% 5,9% 4,0% 1,4% -1,3%Biomass & Waste 0 0 0 0 0 1 2 n.s. n.s. n.s. 28,8% 14,4% 8,6%Other 0 0 0 0 0 0 0 n.s. n.s. n.s. n.s. n.s. n.s.
Gross Elec. Generation (TWh e) 27 43 80 134 225 338 461 4,6% 6,4% 5,3% 5,3% 4,1% 3,1%Coal 0 0 0 2 12 51 119 n.s. n.s. n.s. 22,8% 15,8% 8,9%
of which CCS 0 0 0 0 0 0 0 n.s. n.s. n.s. n.s. n.s. n.s.Oil 11 13 20 15 20 24 20 1,5% 4,3% -2,7% 3,1% 1,6% -1,9%Gas 16 30 60 116 184 220 192 6,4% 7,1% 6,9% 4,7% 1,8% -1,3%
of which CCS 0 0 0 0 0 0 0 n.s. n.s. n.s. n.s. n.s. n.s.Biomass & Waste 0 0 0 0 1 5 13 n.s. n.s. n.s. 29,7% 15,0% 9,2%
of which CCS 0 0 0 0 0 0 0 n.s. n.s. n.s. n.s. n.s. n.s.Nuclear 0 0 0 0 0 1 2 n.s. n.s. n.s. 18,3% 11,9% 5,4%Hydro 0 0 0 0 0 0 0 -8,8% 12,4% 6,7% 1,1% 1,0% 0,9%Wind 0 0 0 0 3 19 58 n.s. n.s. n.s. 28,3% 18,9% 11,6%Solar 0 0 0 1 3 17 56 n.s. n.s. 15,1% 16,9% 17,5% 12,6%Other 0 0 0 0 0 0 0 n.s. n.s. n.s. n.s. 22,2% 15,6%
Generation Capacity (GWe) 8 11 20 25 38 65 119 2,7% 6,3% 2,3% 4,5% 5,4% 6,3%Coal 0 0 0 0 2 7 17 n.s. n.s. n.s. 23,0% 15,5% 9,4%
of which CCS 0 0 0 0 0 0 0 n.s. n.s. n.s. n.s. n.s. n.s.Oil 4 4 4 4 4 4 5 -0,5% -0,1% -1,1% 0,0% 1,6% 1,2%Gas 4 6 15 20 29 34 37 5,8% 9,1% 2,7% 3,8% 1,6% 0,9%
of which CCS 0 0 0 0 0 0 0 n.s. n.s. n.s. n.s. n.s. n.s.Biomass & Waste 0 0 0 0 0 1 2 n.s. n.s. n.s. 29,9% 14,7% 9,5%
of which CCS 0 0 0 0 0 0 0 n.s. n.s. n.s. n.s. n.s. n.s.Nuclear 0 0 0 0 0 0 0 n.s. n.s. n.s. 18,0% 11,7% 5,2%Hydro 0 0 0 0 0 0 0 -0,4% 0,0% -0,5% 1,1% 1,0% 0,9%Wind 0 0 0 0 1 8 23 n.s. n.s. n.s. 28,1% 18,7% 11,4%Solar 0 0 0 0 2 10 35 n.s. n.s. 15,1% 16,9% 17,7% 12,7%Other 0 0 0 0 0 0 0 n.s. n.s. n.s. n.s. 21,7% 15,1%
Total Final Consumption 2 (Mtoe) 18 24 37 61 86 96 98 2,9% 4,5% 5,2% 3,5% 1,1% 0,2%Coal 0 0 0 1 1 1 2 -3,2% -0,5% 6,6% 5,5% 4,0% 3,0%Oil 11 14 21 36 51 51 41 2,1% 4,0% 5,7% 3,6% -0,1% -2,1%Gas 4 7 11 15 17 17 15 4,6% 4,7% 3,5% 1,1% -0,2% -1,0%Electricity 2 2 5 8 14 21 29 4,7% 7,1% 5,3% 5,3% 4,2% 3,3%Heat 0 0 0 0 0 1 3 n.s. n.s. n.s. n.s. 31,8% 8,4%Biomass & Other 0 0 0 1 3 6 9 4,4% 1,2% 15,5% 12,1% 6,0% 3,9%Share of Renewables 3 (%) 1% 1% 1% 1% 4% 10% 20% 0,8% -2,7% 6,6% 10,9% 8,7% 7,2%
Industry (incl. non-energy use) 7 9 12 16 19 19 18 2,7% 2,8% 3,1% 1,8% 0,2% -0,4%Coal 0 0 0 1 1 1 2 -3,2% -0,5% 6,6% 5,5% 4,0% 3,0%Oil 2 3 4 4 5 5 4 2,1% 1,5% 1,7% 2,1% -0,4% -1,0%Gas 3 5 7 8 8 8 7 3,7% 3,2% 2,4% 0,1% -0,6% -1,3%Electricity 1 1 1 3 4 4 5 2,7% 5,2% 7,0% 3,9% 0,9% 0,3%Heat 0 0 0 0 0 0 0 n.s. n.s. n.s. n.s. n.s. n.s.Biomass & Other 0 0 0 0 1 1 1 n.s. n.s. n.s. 13,9% 2,2% -0,5%
Buildings 4 6 11 15 21 25 29 4,6% 5,3% 3,7% 3,2% 1,9% 1,3%Coal 0 0 0 0 0 0 0 n.s. n.s. n.s. n.s. n.s. n.s.Oil 2 3 3 3 3 3 2 2,3% 1,4% -1,6% 1,0% -0,8% -2,4%Gas 1 2 4 7 9 9 8 6,9% 7,4% 5,1% 2,1% 0,2% -0,8%Electricity 1 1 3 5 8 11 14 6,6% 7,9% 4,8% 5,0% 3,0% 2,6%Heat 0 0 0 0 0 1 3 n.s. n.s. n.s. n.s. 31,8% 8,4%Biomass & Other 0 0 0 1 1 2 2 4,4% 1,2% 11,5% 6,0% 2,0% 0,3%
Agriculture 0 0 0 0 0 1 1 0,9% 10,0% 1,4% 2,6% 2,3% 2,0%Coal 0 0 0 0 0 0 0 n.s. n.s. n.s. n.s. n.s. n.s.Oil 0 0 0 0 0 0 0 0,9% 12,1% 2,9% 2,0% 1,6% 1,3%Gas 0 0 0 0 0 0 0 n.s. n.s. 4,8% 1,8% 1,4% 1,1%Electricity 0 0 0 0 0 1 1 1,0% 8,8% 0,9% 2,8% 2,4% 2,1%Heat 0 0 0 0 0 0 0 n.s. n.s. n.s. n.s. n.s. n.s.Biomass & Other 0 0 0 0 0 0 0 n.s. n.s. n.s. n.s. n.s. n.s.
Transport 7 8 14 30 46 51 50 2,1% 5,5% 7,6% 4,5% 1,2% -0,3%Coal 0 0 0 0 0 0 0 n.s. n.s. n.s. n.s. n.s. n.s.Oil 7 8 14 29 43 43 35 2,1% 5,5% 7,6% 4,0% -0,1% -2,2%Gas 0 0 0 0 0 0 0 n.s. n.s. n.s. n.s. n.s. n.s.Electricity 0 0 0 0 1 5 9 3,0% 6,5% 7,3% 29,3% 15,3% 6,8%Heat 0 0 0 0 0 0 0 n.s. n.s. n.s. n.s. n.s. n.s.Biomass & Other 0 0 0 0 1 4 6 n.s. n.s. n.s. 23,6% 9,7% 5,8%
Energy Branch Consumption 9 9 7 12 17 19 19 -0,8% -1,6% 5,0% 3,4% 1,3% -0,3%Other Transformation & Losses 4 4 6 8 14 26 38 49 3,6% 2,8% 6,6% 6,1% 3,8% 2,5%
2 does not include international aviation and maritime bunkers; includes non-energy uses3 ratio of renewable energy over final energy demand increased by distribution losses and self consumption of electricity and steam plants4 includes statistical differences
54

GECO2015 Baseline 150504 SUMMARY GHG & ENERGY BALANCE##### 100
Egypt 1990 2000 2010 2020 2030 2040 2050 '90-'00 '00-'10 '10-'20 '20-'30 '30-'40 '40-'50Main Economic Indicators
Population (Million) 56 66 78 91 103 113 122 1,6% 1,7% 1,6% 1,2% 1,0% 0,8%GDP per capita (ppp, k$'05) 3 4 6 7 10 16 21 2,6% 3,1% 1,7% 4,3% 4,1% 3,2%GDP per capita (mer, k$'05) 1 1 2 2 3 4 6 2,6% 3,1% 1,7% 4,3% 4,1% 3,2%Share Value Added - Agriculture (%) 19 17 14 13 10 8 8 -1,4% -1,8% -1,0% -2,5% -1,6% -0,9%Share Value Added - Industry (%) 29 33 38 38 37 34 29 1,5% 1,3% 0,2% -0,2% -1,0% -1,4%Share Value Added - Services (%) 52 50 48 49 53 58 63 -0,4% -0,3% 0,1% 0,7% 0,9% 0,9%
PricesInternational/Regional ($'05/boe)
Coal 18 9 19 22 24 27 30 -6,6% 7,6% 1,4% 0,7% 1,5% 0,9%Oil 33 32 72 96 114 143 178 -0,2% 8,3% 3,0% 1,7% 2,3% 2,2%Gas 18 21 31 38 46 59 71 1,4% 4,0% 2,1% 2,1% 2,5% 1,9%
GHG emissions (Mt CO2 eq.)Total GHG (excl. LULUCF) 139 171 279 329 443 541 597 2,0% 5,1% 1,7% 3,0% 2,0% 1,0%CO2 94 116 205 249 355 442 491 2,1% 5,9% 2,0% 3,6% 2,2% 1,1%CH4 25 36 48 52 54 60 64 3,7% 3,0% 0,7% 0,5% 1,0% 0,6%N2O 18 17 23 26 31 35 37 -0,7% 3,2% 1,0% 1,7% 1,2% 0,7%F gases 2 2 2 3 3 4 5 -2,8% 4,8% 0,9% 2,6% 2,4% 1,6%Total GHG from Energy and Industry 120 145 251 299 410 505 559 1,9% 5,6% 1,8% 3,2% 2,1% 1,0%CO2 Emissions from Fuel Comb. 84 101 181 218 309 386 429 1,8% 6,0% 1,9% 3,6% 2,2% 1,1%
Power generation/District heating 22 27 66 88 128 169 199 2,0% 9,4% 2,9% 3,9% 2,8% 1,6%Industry 26 26 31 40 62 78 86 -0,1% 1,8% 2,5% 4,5% 2,4% 1,0%Buildings 10 12 18 10 13 14 14 1,8% 3,8% -5,2% 2,6% 0,7% -0,2%Agriculture 0 0 10 10 12 15 18 n.s. 45,7% 0,5% 1,9% 1,9% 1,6%Transport 15 28 38 47 63 75 79 6,1% 3,2% 2,1% 2,9% 1,8% 0,5%Other 11 8 18 23 31 35 34 -2,5% 8,1% 2,1% 3,1% 1,2% -0,3%
CO2 captured (CCS) 0 0 0 0 0 0 0 n.s. n.s. n.s. n.s. n.s. 8,7%Coal 0 0 0 0 0 0 0 n.s. n.s. n.s. n.s. n.s. 8,6%Gas 0 0 0 0 0 0 0 n.s. n.s. n.s. n.s. n.s. 8,5%Biomass 0 0 0 0 0 0 0 n.s. n.s. n.s. n.s. n.s. 8,8%
Energy Balance, by fuel (Mtoe)Primary Production 53 56 89 109 137 173 185 0,5% 4,8% 2,1% 2,3% 2,3% 0,7%
Coal 0 0 0 0 0 0 0 n.s. n.s. n.s. n.s. n.s. n.s.Oil 44 38 36 31 21 19 18 -1,4% -0,7% -1,4% -3,8% -1,3% -0,3%Natural gas 7 15 50 72 106 136 138 7,8% 13,2% 3,7% 3,9% 2,5% 0,1%Biomass 1 1 2 2 3 3 4 2,3% 1,9% 1,0% 3,9% 2,6% 2,0%Nuclear1 0 0 0 0 0 0 0 n.s. n.s. n.s. n.s. n.s. 22,7%Hydro 1 1 1 1 1 1 1 3,3% -0,5% 1,6% 0,5% 0,3% 0,3%Other renewables 0 0 1 3 6 13 23 14,1% 32,0% 18,6% 7,6% 8,5% 5,8%
Net Imports - 21 - 15 - 16 - 19 - 5 - 5 7Coal 1 1 1 3 8 18 32Oil - 21 - 15 - 4 - 2 16 24 28Natural gas 0 0 - 12 - 20 - 30 - 49 - 58Biomass 0 0 0 0 1 2 4Biofuels 0 0 0 0 0 0 1Electricity 0 0 0 0 0 0 0
Primary Energy Demand2 32 41 73 90 132 168 191 2,4% 6,0% 2,1% 3,9% 2,5% 1,3%Coal 1 1 1 3 8 18 32 3,1% -1,4% 13,1% 11,3% 8,5% 5,9%Oil 23 23 32 29 37 43 46 0,0% 3,3% -0,8% 2,3% 1,5% 0,6%Natural gas 7 14 38 52 77 87 80 7,9% 10,1% 3,3% 3,9% 1,3% -0,9%Biomass 1 1 2 2 3 5 8 2,1% 1,9% 2,6% 5,1% 4,5% 4,6%Nuclear1 0 0 0 0 0 0 0 n.s. n.s. n.s. n.s. n.s. 22,7%Hydro 1 1 1 1 1 1 1 3,3% -0,5% 1,6% 0,5% 0,3% 0,3%Other renewables 0 0 1 3 6 13 23 14,1% 32,0% 18,6% 7,6% 8,5% 5,8%
Primary Energy Demand, by sector (Mtoe)Primary Energy Demand 32 41 73 90 132 168 191 2,4% 6,0% 2,1% 3,9% 2,5% 1,3%Energy for Power Generation 9 12 28 40 59 79 95 3,1% 8,9% 3,6% 3,9% 3,0% 1,9%Other Transformation & Losses 6 7 13 16 27 40 54 1,4% 6,8% 1,8% 5,3% 4,1% 3,1%Energy Branch Consumption 1 3 7 9 12 14 13 9,6% 8,1% 2,8% 3,4% 1,4% -0,3%Final consumption 23 31 49 61 90 116 134 3,1% 4,6% 2,2% 3,9% 2,6% 1,5%
Steel, Non-Met. Minerals and Chem. 1 1 1 1 2 1 0 1,0% -0,5% 7,2% 4,4% -4,6% -13,4%Other Industry 10 10 12 17 28 37 41 0,4% 2,2% 3,2% 5,0% 2,9% 1,2%Non-Energy Use 2 3 7 9 13 17 19 4,0% 7,7% 2,5% 4,3% 2,5% 1,1%Residential 5 7 11 11 15 19 22 3,0% 5,3% 0,4% 2,8% 2,4% 1,5%Services 0 1 2 4 6 10 14 11,3% 7,6% 3,9% 5,3% 4,9% 3,9%Agriculture 0 0 4 4 5 6 7 9,9% 28,3% 1,0% 2,0% 2,0% 1,8%Road 5 8 11 14 19 23 26 4,9% 3,6% 2,1% 2,9% 2,0% 1,2%Rail 0 0 0 0 0 0 0 n.s. n.s. n.s. n.s. n.s. n.s.Aviation 0 0 1 1 2 3 4 8,0% 2,5% 3,8% 6,4% 5,7% 3,9%Other Transport 0 1 0 0 1 1 1 n.s. -6,4% 1,9% 4,2% 3,7% 2,6%
1 Primary energy from nuclear is calculated considering the primary heat equivalent of the electricity produced with an average efficiency of 33%
55

GECO2015 Baseline 150504 SUMMARY GHG & ENERGY BALANCE##### 100
Egypt 1990 2000 2010 2020 2030 2040 2050 '90-'00 '00-'10 '10-'20 '20-'30 '30-'40 '40-'50Power Generation
Fuel Inputs Therm. Power (Mtoe) 8 11 26 36 52 64 70 3,1% 9,4% 3,1% 3,7% 2,3% 0,9%Coal 0 0 0 1 3 11 23 n.s. n.s. n.s. 18,4% 12,5% 7,3%Oil 4 2 5 3 3 3 3 -6,9% 10,1% -4,2% -0,5% -1,8% -0,4%Gas 4 9 21 32 45 50 43 8,3% 9,2% 4,1% 3,4% 1,1% -1,4%Biomass & Waste 0 0 0 0 0 1 2 n.s. n.s. n.s. n.s. 14,4% 9,1%Other 0 0 0 0 0 0 0 n.s. n.s. n.s. n.s. n.s. n.s.
Gross Elec. Generation (TWh e) 42 78 147 212 331 475 614 6,3% 6,5% 3,7% 4,6% 3,7% 2,6%Coal 0 0 0 3 18 59 123 n.s. n.s. n.s. 18,9% 12,8% 7,7%
of which CCS 0 0 0 0 0 0 0 n.s. n.s. n.s. n.s. n.s. n.s.Oil 13 22 31 14 14 11 11 5,2% 3,3% -7,3% -0,6% -1,8% -0,2%Gas 19 42 101 160 234 270 241 8,3% 9,2% 4,7% 3,9% 1,5% -1,1%
of which CCS 0 0 0 0 0 0 0 n.s. n.s. n.s. n.s. n.s. n.s.Biomass & Waste 0 0 0 0 1 4 10 n.s. n.s. n.s. n.s. 15,0% 9,8%
of which CCS 0 0 0 0 0 0 0 n.s. n.s. n.s. n.s. n.s. n.s.Nuclear 0 0 0 0 0 0 0 n.s. n.s. n.s. n.s. n.s. n.s.Hydro 10 14 13 15 16 16 17 3,3% -0,5% 1,6% 0,5% 0,3% 0,3%Wind 0 0 1 18 46 100 169 n.s. 23,7% 32,0% 9,6% 8,0% 5,4%Solar 0 0 0 1 3 14 43 n.s. n.s. 30,5% 12,7% 15,9% 11,6%Other 0 0 0 0 0 0 0 n.s. n.s. n.s. n.s. 21,5% 15,1%
Generation Capacity (GWe) 12 15 27 52 77 126 183 2,5% 6,0% 7,0% 4,0% 5,1% 3,7%Coal 0 0 0 0 2 8 18 n.s. n.s. n.s. 18,9% 13,1% 8,1%
of which CCS 0 0 0 0 0 0 0 n.s. n.s. n.s. n.s. n.s. n.s.Oil 4 2 5 6 4 3 3 -7,4% 9,0% 1,2% -4,4% -2,4% 1,7%Gas 5 10 18 34 46 60 59 8,3% 6,2% 6,5% 2,9% 2,8% -0,1%
of which CCS 0 0 0 0 0 0 0 n.s. n.s. n.s. n.s. n.s. n.s.Biomass & Waste 0 0 0 0 0 1 1 n.s. n.s. n.s. n.s. 15,2% 10,2%
of which CCS 0 0 0 0 0 0 0 n.s. n.s. n.s. n.s. n.s. n.s.Nuclear 0 0 0 0 0 0 0 n.s. n.s. n.s. n.s. n.s. n.s.Hydro 3 3 3 3 3 3 4 0,3% 0,2% 1,2% 0,5% 0,3% 0,3%Wind 0 0 1 8 20 44 73 n.s. 40,0% 31,0% 9,5% 8,0% 5,3%Solar 0 0 0 1 2 8 24 n.s. n.s. 31,9% 12,2% 15,9% 11,8%Other 0 0 0 0 0 0 0 n.s. n.s. n.s. n.s. n.s. 14,6%
Total Final Consumption 2 (Mtoe) 23 31 49 61 90 116 134 3,1% 4,6% 2,2% 3,9% 2,6% 1,5%Coal 1 1 1 2 4 7 9 1,0% -0,5% 10,7% 8,5% 4,3% 3,2%Oil 16 20 25 24 32 38 40 2,2% 2,3% -0,2% 2,6% 1,8% 0,7%Gas 2 4 11 16 24 28 28 5,0% 11,0% 3,6% 4,3% 1,5% -0,1%Electricity 3 6 11 16 25 35 46 5,9% 6,9% 3,8% 4,6% 3,7% 2,6%Heat 0 0 0 1 2 3 5 n.s. n.s. n.s. 3,3% 7,8% 4,1%Biomass & Other 1 1 2 2 3 4 6 2,1% 1,8% 2,5% 4,3% 3,1% 3,8%Share of Renewables 3 (%) 9% 8% 7% 11% 12% 18% 25% -0,5% -1,7% 4,3% 1,4% 3,5% 3,4%
Industry (incl. non-energy use) 12 14 20 27 43 55 60 1,1% 3,6% 3,1% 4,8% 2,5% 1,0%Coal 1 1 1 2 4 7 9 1,0% -0,5% 10,7% 8,5% 4,3% 3,2%Oil 7 7 4 4 6 7 8 -0,9% -4,3% -1,5% 4,1% 2,9% 1,0%Gas 2 4 10 14 21 24 23 4,4% 11,2% 3,3% 3,8% 1,4% -0,3%Electricity 1 2 4 6 10 14 17 3,8% 5,2% 4,8% 6,0% 3,6% 2,0%Heat 0 0 0 0 0 0 0 n.s. n.s. n.s. n.s. n.s. n.s.Biomass & Other 1 1 1 1 2 2 2 2,5% 1,8% 3,7% 4,2% 1,6% -0,3%
Buildings 5 8 13 15 21 29 36 3,9% 5,6% 1,1% 3,5% 3,1% 2,4%Coal 0 0 0 0 0 0 0 n.s. n.s. n.s. n.s. n.s. n.s.Oil 3 4 5 2 2 1 1 1,3% 3,3% -8,4% -2,1% -2,3% -2,4%Gas 0 0 1 2 3 4 5 16,9% 9,8% 6,5% 7,8% 2,2% 0,6%Electricity 2 3 7 9 13 19 25 7,5% 7,9% 3,1% 3,7% 3,4% 2,8%Heat 0 0 0 1 2 3 5 n.s. n.s. n.s. 3,3% 7,8% 4,1%Biomass & Other 1 1 1 1 1 1 1 1,8% 1,8% 0,2% 2,3% -0,5% -1,7%
Agriculture 0 0 4 4 5 6 7 9,9% 28,3% 1,0% 2,0% 2,0% 1,8%Coal 0 0 0 0 0 0 0 n.s. n.s. n.s. n.s. n.s. n.s.Oil 0 0 3 3 4 5 6 n.s. 45,7% 0,5% 1,9% 1,9% 1,6%Gas 0 0 0 0 0 0 0 n.s. n.s. n.s. n.s. n.s. n.s.Electricity 0 0 0 1 1 1 1 6,9% 6,9% 4,1% 2,7% 2,7% 2,4%Heat 0 0 0 0 0 0 0 n.s. n.s. n.s. n.s. n.s. n.s.Biomass & Other 0 0 0 0 0 0 0 n.s. n.s. n.s. n.s. n.s. n.s.
Transport 5 9 12 15 21 27 31 5,9% 3,0% 2,2% 3,2% 2,4% 1,5%Coal 0 0 0 0 0 0 0 n.s. n.s. n.s. n.s. n.s. n.s.Oil 5 9 12 15 20 24 26 5,9% 3,0% 2,1% 2,9% 1,8% 0,5%Gas 0 0 0 0 0 0 0 n.s. n.s. n.s. n.s. n.s. n.s.Electricity 0 0 0 0 0 1 2 n.s. n.s. n.s. n.s. 15,5% 6,7%Heat 0 0 0 0 0 0 0 n.s. n.s. n.s. n.s. n.s. n.s.Biomass & Other 0 0 0 0 0 1 3 n.s. n.s. 46,0% 15,6% 13,4% 10,8%
Energy Branch Consumption 1 3 7 9 12 14 13 9,6% 8,1% 2,8% 3,4% 1,4% -0,3%Other Transformation & Losses 4 6 7 13 16 27 40 54 1,4% 6,8% 1,8% 5,3% 4,1% 3,1%
2 does not include international aviation and maritime bunkers; includes non-energy uses3 ratio of renewable energy over final energy demand increased by distribution losses and self consumption of electricity and steam plants4 includes statistical differences
56

GECO2015 Baseline 150504 SUMMARY GHG & ENERGY BALANCE##### 100
Rest Sub Saharian Africa 1990 2000 2010 2020 2030 2040 2050 '90-'00 '00-'10 '10-'20 '20-'30 '30-'40 '40-'50Main Economic Indicators
Population (Million) 473 622 816 1 067 1 365 1 710 2 088 2,8% 2,8% 2,7% 2,5% 2,3% 2,0%GDP per capita (ppp, k$'05) 1 1 2 2 3 4 7 0,0% 3,0% 3,1% 3,9% 4,0% 4,0%GDP per capita (mer, k$'05) 1 0 1 1 1 2 3 -0,2% 2,9% 3,1% 3,9% 4,0% 4,0%Share Value Added - Agriculture (%) 31 27 22 14 9 7 5 -1,5% -1,7% -4,4% -4,5% -3,1% -2,1%Share Value Added - Industry (%) 29 34 36 38 41 42 41 1,7% 0,7% 0,6% 0,6% 0,2% -0,2%Share Value Added - Services (%) 40 40 41 47 50 52 54 -0,2% 0,5% 1,4% 0,5% 0,3% 0,4%
PricesInternational/Regional ($'05/boe)
Coal 18 9 19 22 24 27 30 -6,6% 7,6% 1,4% 0,7% 1,5% 0,9%Oil 33 32 72 96 114 143 178 -0,2% 8,3% 3,0% 1,7% 2,3% 2,2%Gas 18 21 31 38 46 59 71 1,4% 4,0% 2,1% 2,1% 2,5% 1,9%
GHG emissions (Mt CO2 eq.)Total GHG (excl. LULUCF) 542 679 861 1 229 1 684 2 339 3 165 2,3% 2,4% 3,6% 3,2% 3,3% 3,1%CO2 107 134 202 356 606 938 1 367 2,3% 4,2% 5,8% 5,5% 4,5% 3,8%CH4 310 393 453 612 731 944 1 210 2,4% 1,4% 3,0% 1,8% 2,6% 2,5%N2O 124 151 204 257 340 444 563 2,0% 3,1% 2,3% 2,8% 2,7% 2,4%F gases 2 1 2 3 7 13 24 -5,8% 6,0% 6,6% 7,5% 7,0% 6,3%Total GHG from Energy and Industry 243 319 436 750 1 133 1 708 2 455 2,8% 3,2% 5,6% 4,2% 4,2% 3,7%CO2 Emissions from Fuel Comb. 99 126 188 335 570 878 1 270 2,4% 4,1% 5,9% 5,5% 4,4% 3,8%
Power generation/District heating 20 26 44 104 201 344 521 2,4% 5,6% 8,8% 6,9% 5,5% 4,2%Industry 21 19 27 43 83 127 173 -1,1% 3,6% 4,7% 6,7% 4,4% 3,1%Buildings 12 17 23 36 55 78 115 3,5% 3,4% 4,4% 4,4% 3,5% 4,0%Agriculture 2 3 3 4 5 6 8 5,1% -0,9% 1,7% 2,3% 2,4% 2,4%Transport 34 49 77 123 187 265 370 3,6% 4,7% 4,8% 4,3% 3,5% 3,4%Other 9 12 13 26 39 57 82 2,9% 0,7% 7,3% 4,1% 3,9% 3,7%
CO2 captured (CCS) 0 0 0 0 0 0 0 n.s. n.s. n.s. n.s. 17,2% -0,2%Coal 0 0 0 0 0 0 0 n.s. n.s. n.s. n.s. 17,2% -0,1%Gas 0 0 0 0 0 0 0 n.s. n.s. n.s. n.s. 17,2% -0,3%Biomass 0 0 0 0 0 0 0 n.s. n.s. n.s. n.s. 17,3% -0,1%
Energy Balance, by fuel (Mtoe)Primary Production 303 398 582 702 810 932 1 042 2,8% 3,9% 1,9% 1,4% 1,4% 1,1%
Coal 6 5 3 31 24 45 75 -1,0% -5,0% 25,6% -2,7% 6,7% 5,2%Oil 146 190 284 290 298 292 288 2,7% 4,1% 0,2% 0,3% -0,2% -0,1%Natural gas 4 12 42 70 107 124 122 12,1% 13,2% 5,3% 4,4% 1,4% -0,1%Biomass 143 185 244 297 360 435 488 2,6% 2,8% 2,0% 1,9% 1,9% 1,1%Nuclear1 0 0 0 0 0 0 1 n.s. n.s. n.s. 22,5% 29,9% 21,1%Hydro 4 5 8 9 10 12 14 3,1% 4,0% 1,8% 1,4% 1,5% 1,5%Other renewables 0 0 1 4 10 24 54 3,0% 13,1% 12,8% 8,8% 9,3% 8,4%
Net Imports - 121 - 162 - 262 - 303 - 277 - 243 - 151Coal - 1 - 1 1 - 17 11 23 34Oil - 120 - 156 - 234 - 217 - 198 - 163 - 118Natural gas 0 - 5 - 30 - 39 - 43 - 18 30Biomass 0 0 0 - 28 - 37 - 71 - 81Biofuels 0 0 0 - 3 - 11 - 14 - 16Electricity 0 0 1 0 0 0 0
Primary Energy Demand2 182 236 319 399 532 690 891 2,7% 3,1% 2,2% 2,9% 2,6% 2,6%Coal 5 4 4 14 35 68 109 -1,6% -0,4% 13,5% 9,3% 7,0% 4,8%Oil 26 34 50 73 100 129 170 2,8% 4,0% 3,8% 3,2% 2,5% 2,8%Natural gas 4 8 12 31 65 106 153 7,2% 4,4% 10,2% 7,7% 5,1% 3,7%Biomass 143 185 244 269 323 364 406 2,6% 2,8% 1,0% 1,8% 1,2% 1,1%Nuclear1 0 0 0 0 0 0 1 n.s. n.s. n.s. 22,5% 29,9% 21,1%Hydro 4 5 8 9 10 12 14 3,1% 4,0% 1,8% 1,4% 1,5% 1,5%Other renewables 0 0 1 4 10 24 54 3,0% 13,1% 12,8% 8,8% 9,3% 8,4%
Primary Energy Demand, by sector (Mtoe)Primary Energy Demand 182 236 319 399 532 690 891 2,7% 3,1% 2,2% 2,9% 2,6% 2,6%Energy for Power Generation 11 14 24 48 87 151 245 3,0% 5,5% 7,0% 6,1% 5,7% 5,0%Other Transformation & Losses 7 9 14 35 89 160 269 3,2% 4,1% 9,5% 9,8% 6,0% 5,3%Energy Branch Consumption 2 3 3 7 11 15 22 6,2% 0,6% 7,9% 4,1% 3,6% 3,4%Final consumption 173 223 301 356 446 546 670 2,6% 3,0% 1,7% 2,3% 2,0% 2,1%
Steel, Non-Met. Minerals and Chem. 2 1 1 2 3 5 9 -2,3% 0,1% 2,5% 6,4% 5,2% 4,6%Other Industry 19 23 32 46 66 90 121 1,9% 3,6% 3,6% 3,6% 3,2% 3,0%Non-Energy Use 1 1 1 2 3 5 8 0,5% -0,1% 4,7% 5,9% 5,1% 4,7%Residential 134 172 227 243 268 281 281 2,6% 2,8% 0,7% 1,0% 0,5% 0,0%Services 3 5 9 14 24 40 63 5,9% 5,0% 5,1% 5,6% 5,0% 4,8%Agriculture 1 2 2 3 3 4 4 4,0% 1,1% 1,2% 1,6% 1,8% 1,9%Road 12 18 26 43 72 107 154 3,8% 4,0% 5,0% 5,2% 4,1% 3,8%Rail 0 0 0 0 0 0 1 -4,9% 1,2% 1,3% 2,1% 2,6% 3,0%Aviation 0 1 1 2 5 12 26 3,0% 5,7% 8,0% 9,4% 8,9% 8,4%Other Transport 0 0 0 1 1 1 2 4,7% 4,1% 5,1% 5,2% 5,0% 4,7%
1 Primary energy from nuclear is calculated considering the primary heat equivalent of the electricity produced with an average efficiency of 33%
57

GECO2015 Baseline 150504 SUMMARY GHG & ENERGY BALANCE##### 100
Rest Sub Saharian Africa 1990 2000 2010 2020 2030 2040 2050 '90-'00 '00-'10 '10-'20 '20-'30 '30-'40 '40-'50Power Generation
Fuel Inputs Therm. Power (Mtoe) 7 9 15 35 67 114 176 3,0% 5,8% 8,4% 6,8% 5,6% 4,4%Coal 2 2 2 11 26 53 86 -1,1% 1,3% 16,7% 9,5% 7,3% 5,0%Oil 2 4 7 9 11 10 11 4,5% 7,2% 2,6% 1,7% -1,2% 1,1%Gas 2 3 6 14 27 45 63 4,5% 6,9% 9,5% 6,7% 5,1% 3,5%Biomass & Waste 0 0 0 1 2 7 17 8,3% 1,9% 3,0% 14,9% 12,0% 9,2%Other 0 0 0 0 0 1 0 2,9% 13,0% 10,5% 3,0% 0,9% -1,2%
Gross Elec. Generation (TWh e) 66 90 147 276 513 940 1 624 3,1% 5,1% 6,5% 6,4% 6,2% 5,6%Coal 6 5 6 44 126 269 456 -1,6% 1,6% 22,1% 10,9% 7,9% 5,4%
of which CCS 0 0 0 0 0 0 0 n.s. n.s. n.s. n.s. n.s. n.s.Oil 8 12 27 40 47 41 47 4,1% 8,2% 4,0% 1,6% -1,2% 1,3%Gas 7 12 24 71 150 253 362 5,1% 7,1% 11,5% 7,7% 5,4% 3,7%
of which CCS 0 0 0 0 0 0 0 n.s. n.s. n.s. n.s. n.s. n.s.Biomass & Waste 0 1 1 2 10 34 86 6,6% 3,1% 6,7% 16,3% 12,7% 9,7%
of which CCS 0 0 0 0 0 0 0 n.s. n.s. n.s. n.s. n.s. n.s.Nuclear 0 0 0 0 0 0 0 n.s. n.s. n.s. n.s. n.s. n.s.Hydro 44 59 87 105 120 140 163 3,1% 4,0% 1,8% 1,4% 1,5% 1,5%Wind 0 0 0 6 34 112 253 21,5% 8,5% n.s. 19,8% 12,5% 8,5%Solar 0 0 0 3 21 83 246 n.s. 31,2% 30,5% 19,5% 15,0% 11,4%Other 0 0 1 4 6 7 11 2,9% 13,0% 10,5% 3,4% 2,7% 4,1%
Generation Capacity (GWe) 24 24 39 71 126 252 484 0,2% 5,0% 6,1% 6,0% 7,1% 6,8%Coal 2 2 2 6 18 40 73 -0,3% 1,1% 12,3% 11,0% 8,3% 6,1%
of which CCS 0 0 0 0 0 0 0 n.s. n.s. n.s. n.s. n.s. n.s.Oil 4 6 9 21 27 30 33 2,8% 4,5% 8,7% 2,3% 1,3% 1,0%Gas 3 1 7 14 27 50 82 -7,2% 19,8% 6,8% 6,5% 6,5% 5,0%
of which CCS 0 0 0 0 0 0 0 n.s. n.s. n.s. n.s. n.s. n.s.Biomass & Waste 0 0 0 0 1 5 13 -1,3% 3,3% 6,0% 16,4% 13,0% 10,2%
of which CCS 0 0 0 0 0 0 0 n.s. n.s. n.s. n.s. n.s. n.s.Nuclear 0 0 0 0 0 0 0 n.s. n.s. n.s. n.s. n.s. n.s.Hydro 15 15 20 24 27 32 37 0,3% 3,0% 1,7% 1,4% 1,5% 1,5%Wind 0 0 0 2 14 46 103 n.s. 12,9% n.s. 19,7% 12,5% 8,4%Solar 0 0 0 2 12 48 142 n.s. 28,8% 32,0% 19,3% 15,0% 11,5%Other 0 0 0 1 1 1 1 3,6% 12,3% 9,4% 3,2% 2,9% 4,9%
Total Final Consumption 2 (Mtoe) 173 223 301 356 446 546 670 2,6% 3,0% 1,7% 2,3% 2,0% 2,1%Coal 3 2 2 3 8 14 23 -2,1% -3,0% 5,5% 10,9% 6,7% 4,5%Oil 21 28 41 61 86 115 153 2,9% 3,8% 4,0% 3,5% 2,9% 2,9%Gas 1 2 3 10 26 44 65 5,3% 6,0% 11,3% 9,9% 5,3% 4,1%Electricity 4 6 11 20 36 67 116 3,5% 6,0% 6,1% 6,4% 6,3% 5,7%Heat 0 0 0 0 1 2 7 n.s. n.s. n.s. 24,4% 14,2% 11,5%Biomass & Other 143 185 243 262 289 304 306 2,6% 2,8% 0,7% 1,0% 0,5% 0,1%Share of Renewables 3 (%) 84% 84% 82% 75% 66% 58% 54% 0,0% -0,2% -1,0% -1,3% -1,2% -0,8%
Industry (incl. non-energy use) 22 25 35 50 72 101 138 1,5% 3,3% 3,6% 3,8% 3,4% 3,2%Coal 2 1 1 2 7 14 22 -2,8% -1,8% 6,9% 11,6% 6,8% 4,6%Oil 5 4 6 7 9 9 9 -0,4% 2,7% 2,3% 1,8% 0,6% 0,2%Gas 1 1 3 6 14 22 28 2,3% 8,3% 7,1% 8,3% 4,4% 2,7%Electricity 2 3 5 9 17 29 48 1,9% 5,0% 7,3% 6,4% 5,7% 5,1%Heat 0 0 0 0 0 0 0 n.s. n.s. n.s. n.s. n.s. n.s.Biomass & Other 12 15 20 25 25 27 30 2,7% 3,0% 2,0% 0,3% 0,4% 1,1%
Buildings 137 177 236 258 293 321 344 2,6% 2,9% 0,9% 1,3% 0,9% 0,7%Coal 0 0 0 0 0 0 0 -1,0% -4,5% -1,6% -0,3% -0,6% -0,9%Oil 3 5 7 8 8 8 9 3,2% 4,3% 1,9% 0,0% -0,2% 0,9%Gas 0 0 0 4 12 22 37 n.s. -6,5% 30,9% 12,4% 6,2% 5,3%Electricity 2 3 6 10 18 31 53 5,2% 6,9% 5,2% 5,8% 5,6% 5,5%Heat 0 0 0 0 1 2 7 n.s. n.s. n.s. 24,4% 14,2% 11,5%Biomass & Other 131 169 222 235 254 257 239 2,6% 2,8% 0,6% 0,8% 0,1% -0,7%
Agriculture 1 2 2 3 3 4 4 4,0% 1,1% 1,2% 1,6% 1,8% 1,9%Coal 0 0 0 0 0 0 0 5,0% -8,1% -3,6% 0,0% 0,0% 0,0%Oil 0 1 1 1 1 2 2 5,2% 2,3% 2,6% 2,6% 2,6% 2,6%Gas 0 0 0 0 0 0 0 n.s. n.s. n.s. n.s. n.s. n.s.Electricity 0 0 0 0 0 1 1 2,5% 3,2% 3,1% 3,3% 3,4% 3,3%Heat 0 0 0 0 0 0 0 n.s. n.s. n.s. n.s. n.s. n.s.Biomass & Other 1 1 1 1 1 1 1 3,2% 2,3% 0,1% 0,0% 0,0% 0,0%
Transport 13 19 28 46 78 120 184 3,7% 4,0% 5,1% 5,4% 4,5% 4,3%Coal 0 0 0 0 0 0 0 -22,1% -7,3% -3,7% 0,0% 0,0% 0,0%Oil 13 19 28 44 68 95 132 3,8% 4,0% 4,8% 4,3% 3,5% 3,3%Gas 0 0 0 0 0 0 0 n.s. n.s. n.s. n.s. n.s. n.s.Electricity 0 0 0 0 1 6 15 n.s. 4,7% 35,7% 37,7% 17,5% 9,2%Heat 0 0 0 0 0 0 0 n.s. n.s. n.s. n.s. n.s. n.s.Biomass & Other 0 0 0 2 9 19 37 n.s. n.s. 36,6% 19,3% 7,7% 6,8%
Energy Branch Consumption 2 3 3 7 11 15 22 6,2% 0,6% 7,9% 4,1% 3,6% 3,4%Other Transformation & Losses 4 7 9 14 35 89 160 269 3,2% 4,1% 9,5% 9,8% 6,0% 5,3%
2 does not include international aviation and maritime bunkers; includes non-energy uses3 ratio of renewable energy over final energy demand increased by distribution losses and self consumption of electricity and steam plants4 includes statistical differences
58

GECO2015 Baseline 150504 SUMMARY GHG & ENERGY BALANCE##### 100
South Africa 1990 2000 2010 2020 2030 2040 2050 '90-'00 '00-'10 '10-'20 '20-'30 '30-'40 '40-'50Main Economic Indicators
Population (Million) 37 45 51 55 58 61 63 2,0% 1,4% 0,7% 0,5% 0,5% 0,4%GDP per capita (ppp, k$'05) 8 7 9 12 18 25 30 -0,2% 2,1% 2,5% 4,6% 3,1% 1,9%GDP per capita (mer, k$'05) 5 5 6 7 11 15 18 -0,2% 2,1% 2,5% 4,6% 3,1% 1,9%Share Value Added - Agriculture (%) 5 3 3 2 2 2 2 -3,4% -2,4% -0,6% -0,9% -0,4% -0,2%Share Value Added - Industry (%) 40 32 30 27 22 19 16 -2,3% -0,6% -1,0% -1,8% -1,9% -1,5%Share Value Added - Services (%) 55 65 68 71 75 79 82 1,6% 0,4% 0,4% 0,6% 0,5% 0,3%
PricesInternational/Regional ($'05/boe)
Coal 18 9 19 22 24 27 30 -6,6% 7,6% 1,4% 0,7% 1,5% 0,9%Oil 33 32 72 96 114 143 178 -0,2% 8,3% 3,0% 1,7% 2,3% 2,2%Gas 18 21 31 38 46 59 71 1,4% 4,0% 2,1% 2,1% 2,5% 1,9%
GHG emissions (Mt CO2 eq.)Total GHG (excl. LULUCF) 362 408 493 500 616 673 673 1,2% 1,9% 0,1% 2,1% 0,9% 0,0%CO2 293 334 414 416 516 561 554 1,3% 2,2% 0,0% 2,2% 0,8% -0,1%CH4 50 57 63 65 76 87 92 1,2% 1,0% 0,4% 1,6% 1,3% 0,6%N2O 17 16 15 18 21 23 24 -0,3% -0,6% 1,4% 1,6% 0,9% 0,6%F gases 1 1 2 2 3 3 3 -4,7% 5,7% 1,5% 3,3% 1,7% 0,5%Total GHG from Energy and Industry 330 376 459 463 575 631 628 1,3% 2,0% 0,1% 2,2% 0,9% 0,0%CO2 Emissions from Fuel Comb. 280 325 402 401 499 542 535 1,5% 2,1% 0,0% 2,2% 0,8% -0,1%
Power generation/District heating 142 188 242 228 308 354 358 2,8% 2,6% -0,6% 3,0% 1,4% 0,1%Industry 51 43 39 33 35 32 28 -1,6% -1,1% -1,7% 0,8% -0,8% -1,4%Buildings 11 8 18 16 17 17 17 -3,2% 7,8% -1,0% 0,4% 0,4% 0,0%Agriculture 3 4 3 4 5 6 7 1,7% -0,3% 1,7% 2,2% 1,7% 1,2%Transport 34 44 56 66 76 71 61 2,5% 2,4% 1,7% 1,5% -0,7% -1,5%Other 39 39 45 55 58 62 64 0,0% 1,4% 2,1% 0,7% 0,6% 0,4%
CO2 captured (CCS) 0 0 0 0 0 0 0 n.s. n.s. n.s. n.s. n.s. 7,8%Coal 0 0 0 0 0 0 0 n.s. n.s. n.s. n.s. n.s. 7,7%Gas 0 0 0 0 0 0 0 n.s. n.s. n.s. n.s. n.s. 7,8%Biomass 0 0 0 0 0 0 0 n.s. n.s. n.s. n.s. n.s. 7,9%
Energy Balance, by fuel (Mtoe)Primary Production 119 164 161 183 275 412 513 3,2% -0,2% 1,3% 4,2% 4,1% 2,2%
Coal 108 148 146 164 238 335 393 3,3% -0,1% 1,1% 3,8% 3,5% 1,6%Oil 0 1 0 0 0 0 0 n.s. -16,6% 2,1% 1,7% 0,9% 0,1%Natural gas 2 1 0 1 8 36 67 -0,8% -10,5% 9,4% 21,7% 16,0% 6,4%Biomass 8 9 11 12 19 21 23 1,9% 1,3% 1,5% 4,3% 1,1% 0,7%Nuclear1 2 3 3 4 6 11 14 4,4% -0,7% 2,0% 5,2% 5,8% 2,3%Hydro 0 0 0 1 1 1 1 3,3% 2,6% 3,0% 1,6% 1,8% 1,8%Other renewables 0 0 0 1 3 8 15 n.s. n.s. 26,9% 11,2% 10,5% 7,2%
Net Imports - 32 - 49 - 14 - 36 - 90 - 203 - 292Coal - 40 - 52 - 32 - 56 - 111 - 200 - 258Oil 9 2 15 15 19 18 14Natural gas - 1 0 2 5 1 - 22 - 49Biomass 0 0 0 0 0 - 1 0Biofuels 0 0 0 0 0 1 1Electricity 0 1 0 0 0 0 0
Primary Energy Demand2 87 115 147 147 185 209 220 2,8% 2,5% 0,0% 2,3% 1,3% 0,5%Coal 68 96 114 108 127 136 135 3,6% 1,7% -0,6% 1,6% 0,7% -0,1%Oil 9 3 15 15 20 18 14 -11,6% 19,0% 0,1% 2,5% -0,8% -2,4%Natural gas 0 1 3 6 9 14 17 10,9% 7,8% 7,2% 4,7% 4,1% 2,0%Biomass 8 9 11 12 18 20 22 1,9% 1,3% 1,4% 4,2% 1,0% 0,8%Nuclear1 2 3 3 4 6 11 14 4,4% -0,7% 2,0% 5,2% 5,8% 2,3%Hydro 0 0 0 1 1 1 1 3,3% 2,6% 3,0% 1,6% 1,8% 1,8%Other renewables 0 0 0 1 3 8 15 n.s. n.s. 26,9% 11,2% 10,5% 7,2%
Primary Energy Demand, by sector (Mtoe)Primary Energy Demand 87 115 147 147 185 209 220 2,8% 2,5% 0,0% 2,3% 1,3% 0,5%Energy for Power Generation 38 51 64 64 90 114 128 3,0% 2,4% -0,1% 3,5% 2,4% 1,2%Other Transformation & Losses 21 36 53 56 73 89 101 5,5% 3,9% 0,5% 2,8% 2,0% 1,3%Energy Branch Consumption 2 3 3 3 5 6 7 2,1% 1,0% 1,0% 3,7% 2,7% 1,5%Final consumption 52 58 67 68 87 97 102 1,0% 1,5% 0,2% 2,4% 1,1% 0,5%
Steel, Non-Met. Minerals and Chem. 10 7 9 9 10 9 8 -3,2% 1,5% 0,5% 0,9% -0,9% -1,1%Other Industry 13 14 14 12 15 17 16 0,8% 0,5% -1,5% 2,3% 0,8% -0,1%Non-Energy Use 4 6 4 1 2 2 2 3,3% -3,8% -9,8% 2,5% 0,7% -0,4%Residential 10 12 15 14 16 16 16 1,2% 2,4% -0,3% 0,8% 0,6% 0,0%Services 3 5 6 7 11 15 18 4,8% 2,0% 1,3% 4,5% 3,2% 1,9%Agriculture 1 1 2 2 2 3 3 1,5% 1,0% 1,6% 2,5% 1,9% 1,4%Road 9 11 16 20 27 30 32 1,9% 3,5% 2,3% 3,0% 1,0% 0,8%Rail 0 1 0 1 1 1 1 5,1% -4,2% 2,4% 2,8% 1,9% 1,1%Aviation 0 1 1 1 3 4 5 5,7% 5,5% 3,1% 7,1% 4,1% 1,0%Other Transport 0 0 0 0 0 0 0 n.s. n.s. n.s. n.s. n.s. n.s.
1 Primary energy from nuclear is calculated considering the primary heat equivalent of the electricity produced with an average efficiency of 33%
59

GECO2015 Baseline 150504 SUMMARY GHG & ENERGY BALANCE##### 100
South Africa 1990 2000 2010 2020 2030 2040 2050 '90-'00 '00-'10 '10-'20 '20-'30 '30-'40 '40-'50Power Generation
Fuel Inputs Therm. Power (Mtoe) 36 47 61 58 80 94 98 2,9% 2,6% -0,4% 3,2% 1,6% 0,4%Coal 36 47 61 55 73 82 81 2,8% 2,6% -0,9% 2,8% 1,1% -0,1%Oil 0 0 0 1 2 2 2 n.s. n.s. 31,7% 8,0% 3,2% 0,9%Gas 0 0 0 2 5 9 11 n.s. n.s. n.s. 7,2% 6,1% 2,8%Biomass & Waste 0 0 0 0 0 1 3 n.s. -0,9% -10,9% 27,3% 13,3% 9,4%Other 0 0 0 0 0 0 0 n.s. n.s. n.s. n.s. n.s. n.s.
Gross Elec. Generation (TWh e) 167 210 260 277 424 589 720 2,3% 2,1% 0,7% 4,4% 3,3% 2,0%Coal 156 193 242 234 333 396 403 2,2% 2,3% -0,3% 3,6% 1,8% 0,2%
of which CCS 0 0 0 0 0 0 0 n.s. n.s. n.s. n.s. n.s. n.s.Oil 0 0 0 3 7 9 10 n.s. n.s. 31,8% 8,0% 3,3% 1,1%Gas 0 0 0 12 25 46 64 n.s. n.s. n.s. 7,9% 6,4% 3,2%
of which CCS 0 0 0 0 0 0 0 n.s. n.s. n.s. n.s. n.s. n.s.Biomass & Waste 0 0 0 0 2 6 15 n.s. n.s. n.s. 28,0% 13,8% 9,9%
of which CCS 0 0 0 0 0 0 0 n.s. n.s. n.s. n.s. n.s. n.s.Nuclear 8 13 12 15 25 46 57 4,4% -0,7% 2,1% 5,5% 6,0% 2,3%Hydro 3 4 5 7 8 10 12 3,3% 2,6% 3,0% 1,6% 1,8% 1,8%Wind 0 0 0 5 18 53 101 n.s. n.s. n.s. 14,4% 11,4% 6,6%Solar 0 0 0 1 7 23 57 n.s. n.s. 20,9% 16,3% 13,1% 9,7%Other 0 0 0 0 0 0 1 n.s. n.s. n.s. 26,5% 17,0% 13,9%
Generation Capacity (GWe) 35 41 44 55 81 129 190 1,7% 0,7% 2,1% 4,0% 4,8% 3,9%Coal 31 37 38 43 56 70 77 1,8% 0,2% 1,2% 2,8% 2,2% 0,9%
of which CCS 0 0 0 0 0 0 0 n.s. n.s. n.s. n.s. n.s. n.s.Oil 0 0 0 1 1 2 2 29,8% 0,0% 8,7% 4,1% 3,3% 2,3%Gas 0 0 2 3 4 7 11 n.s. n.s. 4,6% 1,8% 6,7% 4,1%
of which CCS 0 0 0 0 0 0 0 n.s. n.s. n.s. n.s. n.s. n.s.Biomass & Waste 0 0 0 0 0 1 2 n.s. n.s. n.s. 28,2% 13,6% 9,8%
of which CCS 0 0 0 0 0 0 0 n.s. n.s. n.s. n.s. n.s. n.s.Nuclear 2 2 2 2 4 6 8 0,0% 0,0% 1,7% 5,3% 5,8% 2,1%Hydro 2 2 2 2 3 3 4 0,3% 0,1% 1,3% 1,6% 1,8% 1,8%Wind 0 0 0 2 8 22 41 n.s. n.s. 56,9% 14,3% 11,2% 6,4%Solar 0 0 0 1 5 18 45 n.s. n.s. 26,5% 16,2% 13,0% 9,8%Other 0 0 0 0 0 0 0 n.s. n.s. n.s. n.s. 16,5% 13,4%
Total Final Consumption 2 (Mtoe) 52 58 67 68 87 97 102 1,0% 1,5% 0,2% 2,4% 1,1% 0,5%Coal 17 16 13 11 11 10 9 -0,9% -2,0% -1,7% 0,3% -0,9% -1,2%Oil 15 16 23 24 28 26 23 0,7% 3,9% 0,4% 1,4% -0,6% -1,3%Gas 0 1 2 2 3 4 4 5,6% 7,6% 2,1% 3,8% 1,8% 0,4%Electricity 12 16 18 19 30 41 51 3,0% 1,4% 0,5% 4,3% 3,3% 2,1%Heat 0 0 0 0 1 1 1 n.s. n.s. 20,6% 4,1% 4,1% 4,0%Biomass & Other 8 9 11 11 14 15 15 1,8% 1,3% 0,4% 2,7% 0,3% -0,1%Share of Renewables 3 (%) 16% 17% 16% 17% 19% 22% 28% 0,8% -0,5% 0,7% 1,0% 1,5% 2,3%
Industry (incl. non-energy use) 27 27 27 23 27 28 26 -0,1% 0,0% -1,6% 1,8% 0,2% -0,5%Coal 15 14 9 7 8 7 6 -0,4% -3,9% -2,3% 0,5% -1,0% -1,4%Oil 4 2 4 2 2 2 1 -5,3% 6,2% -6,7% -0,1% -2,1% -3,5%Gas 0 1 2 2 2 2 2 5,5% 8,0% 1,1% 2,3% -0,1% -1,5%Electricity 7 8 10 9 13 15 15 1,6% 2,0% -0,6% 2,9% 1,5% 0,5%Heat 0 0 0 0 0 0 0 n.s. n.s. n.s. n.s. n.s. n.s.Biomass & Other 1 2 2 2 2 2 2 1,3% 1,4% 0,8% 1,8% -2,0% -1,1%
Buildings 14 17 21 21 26 31 34 2,2% 2,3% 0,2% 2,1% 1,7% 1,0%Coal 2 1 3 3 3 3 3 -4,6% 8,2% 0,0% -0,3% -0,6% -0,9%Oil 1 1 1 1 1 1 1 1,6% 7,1% -6,6% -0,8% -0,7% -0,9%Gas 0 0 0 0 1 1 2 8,2% -4,9% 27,0% 11,9% 6,4% 3,1%Electricity 4 7 7 9 13 18 22 5,1% 0,8% 1,7% 4,2% 3,1% 2,0%Heat 0 0 0 0 1 1 1 n.s. n.s. 20,6% 4,1% 4,1% 4,0%Biomass & Other 6 8 9 8 8 7 6 1,9% 1,3% -1,0% 0,0% -0,8% -2,2%
Agriculture 1 1 2 2 2 3 3 1,5% 1,0% 1,6% 2,5% 1,9% 1,4%Coal 0 0 0 0 0 0 0 3,3% -0,3% -0,6% 0,0% 0,0% 0,0%Oil 1 1 1 1 2 2 2 1,6% -0,3% 1,8% 2,3% 1,7% 1,2%Gas 0 0 0 0 0 0 0 n.s. n.s. n.s. n.s. n.s. n.s.Electricity 0 0 1 1 1 1 1 0,8% 4,5% 1,2% 3,0% 2,4% 1,9%Heat 0 0 0 0 0 0 0 n.s. n.s. n.s. n.s. n.s. n.s.Biomass & Other 0 0 0 0 0 0 0 n.s. n.s. n.s. n.s. n.s. n.s.
Transport 10 13 17 22 31 35 38 2,2% 3,3% 2,3% 3,4% 1,4% 0,9%Coal 0 0 0 0 0 0 0 n.s. n.s. n.s. n.s. n.s. n.s.Oil 10 12 17 20 24 22 19 2,2% 3,5% 1,7% 1,5% -0,6% -1,5%Gas 0 0 0 0 0 0 0 n.s. n.s. n.s. n.s. n.s. n.s.Electricity 0 0 0 0 3 7 12 2,9% -4,0% 4,5% 19,9% 9,8% 5,1%Heat 0 0 0 0 0 0 0 n.s. n.s. n.s. n.s. n.s. n.s.Biomass & Other 0 0 0 1 4 5 7 n.s. n.s. n.s. 14,0% 3,2% 2,5%
Energy Branch Consumption 2 3 3 3 5 6 7 2,1% 1,0% 1,0% 3,7% 2,7% 1,5%Other Transformation & Losses 4 21 36 53 56 73 89 101 5,5% 3,9% 0,5% 2,8% 2,0% 1,3%
2 does not include international aviation and maritime bunkers; includes non-energy uses3 ratio of renewable energy over final energy demand increased by distribution losses and self consumption of electricity and steam plants4 includes statistical differences
60

GECO2015 Baseline 150504 SUMMARY GHG & ENERGY BALANCE##### 100
Mediterranean Middle East 1990 2000 2010 2020 2030 2040 2050 '90-'00 '00-'10 '10-'20 '20-'30 '30-'40 '40-'50Main Economic Indicators
Population (Million) 25 33 43 52 59 65 70 2,8% 2,7% 2,0% 1,3% 1,0% 0,8%GDP per capita (ppp, k$'05) 6 8 9 10 13 16 21 2,8% 1,3% 0,9% 2,5% 2,7% 2,6%GDP per capita (mer, k$'05) 4 5 6 7 8 11 14 2,9% 1,0% 1,1% 2,5% 2,7% 2,6%Share Value Added - Agriculture (%) 6 3 1 2 2 2 2 -4,6% -13,2% 10,5% -1,1% -0,9% -0,7%Share Value Added - Industry (%) 6 8 10 12 12 11 11 2,7% 2,5% 2,1% -0,3% -0,4% -0,5%Share Value Added - Services (%) 89 89 89 86 86 87 87 0,0% 0,1% -0,4% 0,1% 0,1% 0,1%
PricesInternational/Regional ($'05/boe)
Coal 16 7 20 24 27 31 34 -7,7% 10,7% 1,6% 1,2% 1,4% 1,0%Oil 33 32 72 96 114 143 178 -0,2% 8,3% 3,0% 1,7% 2,3% 2,2%Gas 28 24 48 39 43 58 72 -1,2% 6,9% -2,1% 1,1% 3,1% 2,1%
GHG emissions (Mt CO2 eq.)Total GHG (excl. LULUCF) 106 167 201 225 291 357 407 4,7% 1,9% 1,1% 2,6% 2,1% 1,3%CO2 87 142 172 190 245 301 343 5,0% 2,0% 1,0% 2,6% 2,1% 1,3%CH4 12 17 19 22 29 36 41 4,1% 0,8% 1,5% 3,0% 2,0% 1,2%N2O 6 6 7 9 10 10 10 0,8% 1,3% 1,6% 1,1% 0,4% 0,4%F gases 1 1 3 4 6 9 13 3,4% 6,5% 4,2% 4,4% 4,0% 3,4%Total GHG from Energy and Industry 98 158 190 212 277 342 392 4,9% 1,9% 1,1% 2,7% 2,1% 1,4%CO2 Emissions from Fuel Comb. 83 134 163 180 233 288 328 4,9% 2,0% 1,0% 2,6% 2,1% 1,3%
Power generation/District heating 29 59 88 105 145 190 223 7,3% 4,1% 1,8% 3,3% 2,7% 1,6%Industry 8 14 16 14 20 27 35 5,3% 1,0% -1,0% 3,7% 3,0% 2,6%Buildings 14 18 19 14 18 23 27 2,4% 0,8% -3,0% 2,4% 2,3% 1,5%Agriculture 1 1 2 2 3 3 4 3,9% 2,5% 4,3% 1,5% 1,5% 1,4%Transport 20 30 32 37 39 37 32 4,0% 0,5% 1,5% 0,7% -0,6% -1,3%Other 10 11 7 7 7 7 7 1,2% -4,1% -0,4% 0,3% 0,1% -0,2%
CO2 captured (CCS) 0 0 0 0 0 0 0 n.s. n.s. n.s. n.s. n.s. 5,2%Coal 0 0 0 0 0 0 0 n.s. n.s. n.s. n.s. n.s. 5,1%Gas 0 0 0 0 0 0 0 n.s. n.s. n.s. n.s. n.s. 5,1%Biomass 0 0 0 0 0 0 0 n.s. n.s. n.s. n.s. n.s. 5,3%
Energy Balance, by fuel (Mtoe)Primary Production 25 37 41 38 41 44 53 4,0% 1,0% -0,8% 0,7% 0,8% 1,9%
Coal 0 0 0 0 0 0 0 n.s. n.s. n.s. n.s. n.s. n.s.Oil 23 31 28 22 17 10 5 3,1% -0,7% -2,6% -2,3% -5,0% -6,2%Natural gas 2 5 10 10 14 18 22 13,1% 6,7% 0,3% 3,0% 2,5% 1,9%Biomass 0 0 1 3 3 3 3 3,0% 18,5% 14,0% 3,0% -0,4% 0,1%Nuclear1 0 0 0 0 1 3 6 n.s. n.s. n.s. 16,1% 11,1% 7,4%Hydro 0 0 0 0 0 0 0 1,5% -0,6% 0,2% 0,4% 0,4% 0,4%Other renewables 0 1 1 2 4 9 16 4,8% 6,8% 6,6% 6,0% 7,4% 6,2%
Net Imports 2 7 18 27 48 70 83Coal 2 7 8 14 23 36 46Oil 0 0 6 10 13 17 20Natural gas 0 0 5 4 10 12 12Biomass 0 0 0 0 1 3 4Biofuels 0 0 0 0 1 1 1Electricity 0 0 0 0 0 0 0
Primary Energy Demand2 27 44 59 65 88 113 136 4,8% 3,0% 1,0% 3,1% 2,5% 1,8%Coal 2 7 8 14 23 36 46 11,2% 1,5% 6,2% 5,1% 4,4% 2,6%Oil 23 31 34 32 31 28 25 3,1% 1,0% -0,8% -0,4% -1,0% -1,0%Natural gas 1 5 15 14 24 30 33 13,2% 11,0% -0,5% 5,6% 2,3% 1,0%Biomass 0 0 1 3 5 7 8 2,9% 18,5% 13,9% 6,0% 3,8% 1,7%Nuclear1 0 0 0 0 1 3 6 n.s. n.s. n.s. 16,1% 11,1% 7,4%Hydro 0 0 0 0 0 0 0 1,5% -0,6% 0,2% 0,4% 0,4% 0,4%Other renewables 0 1 1 2 4 9 16 4,8% 6,8% 6,6% 6,0% 7,4% 6,2%
Primary Energy Demand, by sector (Mtoe)Primary Energy Demand 27 44 59 65 88 113 136 4,8% 3,0% 1,0% 3,1% 2,5% 1,8%Energy for Power Generation 9 19 31 36 51 70 89 7,0% 5,1% 1,7% 3,5% 3,2% 2,4%Other Transformation & Losses 5 8 11 14 23 34 46 5,0% 3,6% 2,2% 4,8% 4,2% 3,1%Energy Branch Consumption 2 2 2 2 3 4 4 3,7% 1,3% 0,1% 1,9% 1,6% 1,4%Final consumption 18 29 37 41 54 70 85 5,0% 2,5% 1,0% 2,9% 2,5% 2,0%
Steel, Non-Met. Minerals and Chem. 0 1 1 1 1 2 2 17,7% -1,1% -0,6% 2,5% 2,2% 2,0%Other Industry 3 4 6 6 10 14 19 2,6% 3,3% 1,5% 4,1% 3,6% 3,1%Non-Energy Use 1 4 4 3 4 5 6 11,9% -0,6% -1,2% 2,6% 1,9% 1,6%Residential 3 6 8 8 10 13 16 6,3% 3,2% 0,3% 2,4% 2,5% 2,1%Services 4 4 6 6 9 12 16 2,3% 3,0% 0,4% 3,6% 3,2% 2,7%Agriculture 0 1 1 1 2 2 2 4,6% 3,1% 5,0% 1,9% 1,9% 1,8%Road 6 9 12 14 18 21 23 3,5% 3,3% 1,9% 2,5% 1,6% 0,8%Rail 0 0 0 0 0 0 0 n.s. n.s. n.s. n.s. n.s. n.s.Aviation 0 0 0 0 0 0 0 32,1% -12,3% 2,0% 5,4% 4,8% 3,8%Other Transport 0 0 0 0 0 0 0 n.s. 5,8% 1,2% 2,5% 2,3% 2,0%
1 Primary energy from nuclear is calculated considering the primary heat equivalent of the electricity produced with an average efficiency of 33%
61

GECO2015 Baseline 150504 SUMMARY GHG & ENERGY BALANCE##### 100
Mediterranean Middle East 1990 2000 2010 2020 2030 2040 2050 '90-'00 '00-'10 '10-'20 '20-'30 '30-'40 '40-'50Power Generation
Fuel Inputs Therm. Power (Mtoe) 9 18 29 33 46 58 67 7,2% 5,1% 1,3% 3,2% 2,4% 1,4%Coal 2 6 7 13 22 33 41 10,6% 1,7% 6,1% 4,9% 4,2% 2,4%Oil 6 9 9 8 6 5 5 4,4% 0,1% -0,8% -2,8% -2,4% -0,5%Gas 1 2 13 11 17 19 19 13,8% 18,1% -1,5% 4,5% 1,1% -0,1%Biomass & Waste 0 0 0 1 1 2 2 n.s. n.s. 45,6% 3,5% 6,3% 3,9%Other 0 0 0 0 0 0 0 n.s. n.s. n.s. n.s. n.s. n.s.
Gross Elec. Generation (TWh e) 38 85 136 165 251 374 517 8,5% 4,8% 2,0% 4,3% 4,1% 3,3%Coal 10 29 34 64 106 165 214 10,9% 1,6% 6,5% 5,1% 4,5% 2,7%
of which CCS 0 0 0 0 0 0 0 n.s. n.s. n.s. n.s. n.s. n.s.Oil 21 42 40 36 27 21 20 7,1% -0,5% -1,1% -2,8% -2,3% -0,4%Gas 3 10 58 51 80 93 97 13,6% 19,1% -1,2% 4,6% 1,5% 0,4%
of which CCS 0 0 0 0 0 0 0 n.s. n.s. n.s. n.s. n.s. n.s.Biomass & Waste 0 0 0 2 3 7 11 n.s. n.s. n.s. 3,9% 6,9% 4,7%
of which CCS 0 0 0 0 0 0 0 n.s. n.s. n.s. n.s. n.s. n.s.Nuclear 0 0 0 1 4 12 24 n.s. n.s. n.s. 16,3% 11,1% 7,4%Hydro 3 4 4 4 4 4 4 1,5% -0,6% 0,2% 0,4% 0,4% 0,4%Wind 0 0 0 4 17 43 78 11,6% 16,8% n.s. 14,1% 10,0% 6,0%Solar 0 0 0 3 9 29 69 n.s. n.s. 25,8% 14,1% 11,8% 9,2%Other 0 0 0 0 0 0 1 n.s. n.s. n.s. 40,2% 20,3% 14,2%
Generation Capacity (GWe) 11 21 27 39 55 89 137 6,4% 2,9% 3,7% 3,4% 5,0% 4,4%Coal 2 4 5 10 16 26 33 7,8% 1,2% 7,2% 5,3% 4,7% 2,6%
of which CCS 0 0 0 0 0 0 0 n.s. n.s. n.s. n.s. n.s. n.s.Oil 7 10 6 6 5 5 4 3,4% -5,0% 0,9% -1,7% -1,1% -0,8%Gas 1 5 15 18 18 19 19 17,3% 12,3% 1,8% 0,0% 0,6% -0,2%
of which CCS 0 0 0 0 0 0 0 n.s. n.s. n.s. n.s. n.s. n.s.Biomass & Waste 0 0 0 0 0 1 1 n.s. n.s. n.s. 4,0% 7,0% 4,7%
of which CCS 0 0 0 0 0 0 0 n.s. n.s. n.s. n.s. n.s. n.s.Nuclear 0 0 0 0 1 2 4 n.s. n.s. n.s. 16,0% 10,9% 7,2%Hydro 1 2 2 2 2 2 2 4,6% -2,0% 0,0% 0,4% 0,4% 0,4%Wind 0 0 0 2 7 18 32 n.s. 18,1% n.s. 14,0% 9,9% 6,0%Solar 0 0 0 2 6 17 42 n.s. n.s. 24,7% 14,0% 11,8% 9,2%Other 0 0 0 0 0 0 0 n.s. n.s. n.s. n.s. 19,7% 13,7%
Total Final Consumption 2 (Mtoe) 18 29 37 41 54 70 85 5,0% 2,5% 1,0% 2,9% 2,5% 2,0%Coal 0 0 0 0 1 3 5 30,2% 4,0% 8,1% 11,3% 7,1% 5,3%Oil 14 20 24 23 23 22 20 3,5% 2,0% -0,6% 0,4% -0,6% -1,0%Gas 1 3 2 3 7 10 14 12,8% -3,6% 4,1% 9,3% 4,8% 2,6%Electricity 3 6 10 12 18 27 38 8,4% 4,8% 2,1% 4,4% 4,1% 3,4%Heat 0 1 1 2 2 3 4 4,8% 6,6% 3,8% 1,5% 2,4% 2,9%Biomass & Other 0 0 0 2 3 4 5 2,9% 12,8% 13,6% 6,7% 4,4% 2,0%Share of Renewables 3 (%) 4% 4% 5% 11% 14% 19% 24% -0,8% 3,1% 6,9% 2,6% 3,2% 2,6%
Industry (incl. non-energy use) 5 9 10 11 15 21 27 7,2% 1,2% 0,3% 3,5% 3,0% 2,7%Coal 0 0 0 0 1 3 5 30,2% 4,0% 8,1% 11,3% 7,1% 5,3%Oil 4 5 6 5 5 5 5 3,1% 1,8% -2,1% 0,9% -0,2% -0,6%Gas 0 2 2 2 3 4 5 55,4% -3,6% 0,3% 5,9% 3,7% 2,4%Electricity 1 2 3 4 5 8 11 7,3% 3,7% 2,9% 4,3% 4,0% 3,5%Heat 0 0 0 0 0 0 0 n.s. n.s. n.s. n.s. n.s. n.s.Biomass & Other 0 0 0 0 0 0 1 n.s. n.s. n.s. -0,3% 3,4% 4,4%
Buildings 7 10 14 14 19 26 32 4,4% 3,1% 0,3% 2,9% 2,8% 2,4%Coal 0 0 0 0 0 0 0 n.s. n.s. n.s. n.s. n.s. n.s.Oil 4 5 6 4 3 3 2 3,4% 0,9% -4,6% -1,9% -1,5% -1,2%Gas 1 0 0 1 4 6 8 -9,1% -4,0% 18,4% 13,3% 5,6% 2,8%Electricity 2 4 6 7 10 13 17 9,1% 5,4% 1,2% 2,8% 3,1% 2,9%Heat 0 1 1 2 2 3 4 4,8% 6,6% 3,8% 1,5% 2,4% 2,9%Biomass & Other 0 0 0 1 1 1 1 2,9% -0,5% 16,2% 4,1% 0,1% -0,5%
Agriculture 0 1 1 1 2 2 2 4,6% 3,1% 5,0% 1,9% 1,9% 1,8%Coal 0 0 0 0 0 0 0 n.s. n.s. n.s. n.s. n.s. n.s.Oil 0 0 0 1 1 1 1 3,9% 2,5% 4,3% 1,5% 1,5% 1,4%Gas 0 0 0 0 0 0 0 n.s. n.s. n.s. n.s. n.s. n.s.Electricity 0 0 0 1 1 1 1 5,8% 3,9% 5,9% 2,3% 2,3% 2,2%Heat 0 0 0 0 0 0 0 n.s. n.s. n.s. n.s. n.s. n.s.Biomass & Other 0 0 0 0 0 0 0 n.s. n.s. n.s. n.s. n.s. n.s.
Transport 6 9 12 14 18 22 23 3,7% 3,0% 1,9% 2,5% 1,7% 0,9%Coal 0 0 0 0 0 0 0 n.s. n.s. n.s. n.s. n.s. n.s.Oil 6 9 12 13 14 13 12 3,7% 2,7% 1,5% 0,7% -0,6% -1,3%Gas 0 0 0 0 0 0 0 n.s. n.s. n.s. n.s. n.s. n.s.Electricity 0 0 0 0 2 5 8 n.s. n.s. 28,8% 21,5% 8,5% 4,7%Heat 0 0 0 0 0 0 0 n.s. n.s. n.s. n.s. n.s. n.s.Biomass & Other 0 0 0 1 2 3 4 n.s. n.s. 7,6% 10,9% 6,0% 2,1%
Energy Branch Consumption 2 2 2 2 3 4 4 3,7% 1,3% 0,1% 1,9% 1,6% 1,4%Other Transformation & Losses 4 5 8 11 14 23 34 46 5,0% 3,6% 2,2% 4,8% 4,2% 3,1%
2 does not include international aviation and maritime bunkers; includes non-energy uses3 ratio of renewable energy over final energy demand increased by distribution losses and self consumption of electricity and steam plants4 includes statistical differences
62

GECO2015 Baseline 150504 SUMMARY GHG & ENERGY BALANCE##### 100
Persian Gulf Countries 1990 2000 2010 2020 2030 2040 2050 '90-'00 '00-'10 '10-'20 '20-'30 '30-'40 '40-'50Main Economic Indicators
Population (Million) 109 137 174 209 240 267 290 2,3% 2,4% 1,9% 1,4% 1,1% 0,8%GDP per capita (ppp, k$'05) 10 11 13 15 20 24 28 1,0% 2,3% 1,5% 2,5% 2,0% 1,3%GDP per capita (mer, k$'05) 4 5 6 7 9 11 13 1,4% 2,2% 1,7% 2,5% 2,0% 1,3%Share Value Added - Agriculture (%) 9 6 1 1 1 1 0 -5,1% -15,7% -5,7% -0,7% -0,4% -0,3%Share Value Added - Industry (%) 42 49 50 50 48 46 45 1,5% 0,1% 0,1% -0,4% -0,4% -0,3%Share Value Added - Services (%) 48 45 49 49 51 53 55 -0,7% 0,9% -0,1% 0,4% 0,4% 0,3%
PricesInternational/Regional ($'05/boe)
Coal 16 7 20 24 27 31 34 -7,7% 10,7% 1,6% 1,2% 1,4% 1,0%Oil 33 32 72 96 114 143 178 -0,2% 8,3% 3,0% 1,7% 2,3% 2,2%Gas 28 24 48 39 43 58 72 -1,2% 6,9% -2,1% 1,1% 3,1% 2,1%
GHG emissions (Mt CO2 eq.)Total GHG (excl. LULUCF) 745 1 175 1 956 2 327 2 906 3 300 3 396 4,7% 5,2% 1,8% 2,2% 1,3% 0,3%CO2 562 927 1 608 1 910 2 388 2 746 2 848 5,1% 5,7% 1,7% 2,3% 1,4% 0,4%CH4 143 206 304 363 456 486 476 3,7% 4,0% 1,8% 2,3% 0,6% -0,2%N2O 31 38 39 47 53 56 58 2,1% 0,2% 1,8% 1,3% 0,6% 0,2%F gases 9 4 6 7 9 12 14 -7,9% 3,6% 2,2% 2,9% 2,6% 1,8%Total GHG from Energy and Industry 697 1 119 1 896 2 258 2 831 3 222 3 315 4,9% 5,4% 1,8% 2,3% 1,3% 0,3%CO2 Emissions from Fuel Comb. 529 879 1 497 1 755 2 186 2 505 2 580 5,2% 5,5% 1,6% 2,2% 1,4% 0,3%
Power generation/District heating 151 271 513 539 706 831 885 6,0% 6,6% 0,5% 2,7% 1,6% 0,6%Industry 117 168 308 411 487 555 588 3,7% 6,3% 2,9% 1,7% 1,3% 0,6%Buildings 54 105 146 158 164 165 149 7,0% 3,3% 0,8% 0,3% 0,1% -1,0%Agriculture 13 12 16 18 21 24 26 -0,1% 2,8% 1,1% 1,4% 1,1% 0,8%Transport 129 189 308 363 473 538 525 3,9% 5,0% 1,7% 2,7% 1,3% -0,2%Other 65 135 206 266 336 393 408 7,5% 4,3% 2,6% 2,3% 1,6% 0,4%
CO2 captured (CCS) 0 0 0 0 0 0 0 n.s. n.s. n.s. 2,5% 7,0% 0,4%Coal 0 0 0 0 0 0 0 n.s. n.s. n.s. 2,7% 7,1% 0,5%Gas 0 0 0 0 0 0 0 n.s. n.s. n.s. 2,4% 6,8% 0,3%Biomass 0 0 0 0 0 0 0 n.s. n.s. n.s. 2,5% 7,0% 0,5%
Energy Balance, by fuel (Mtoe)Primary Production 919 1 302 1 618 2 146 3 030 3 405 3 400 3,5% 2,2% 2,9% 3,5% 1,2% 0,0%
Coal 1 1 1 0 0 0 0 3,6% -1,4% -7,6% n.s. n.s. n.s.Oil 843 1 140 1 242 1 569 2 044 2 214 2 198 3,1% 0,9% 2,4% 2,7% 0,8% -0,1%Natural gas 75 161 372 565 956 1 140 1 110 7,9% 8,7% 4,3% 5,4% 1,8% -0,3%Biomass 0 0 2 8 25 39 55 -2,3% 24,5% 15,1% 12,4% 4,6% 3,6%Nuclear1 0 0 0 1 1 2 7 n.s. n.s. n.s. 0,0% 5,4% 10,6%Hydro 1 0 1 2 2 2 2 -6,9% 12,9% 3,2% 1,0% 0,7% 1,0%Other renewables 0 0 0 0 1 8 27 n.s. 42,1% 7,0% 17,3% 22,4% 13,2%
Net Imports - 719 - 969 -1 046 -1 446 -2 135 -2 359 -2 292Coal 0 1 2 4 11 28 64Oil - 715 - 953 - 968 -1 295 -1 732 -1 881 -1 885Natural gas - 4 - 16 - 79 - 154 - 411 - 501 - 468Biomass 0 0 0 0 - 3 - 4 - 4Biofuels 0 0 0 0 - 1 0 1Electricity 0 0 0 0 0 0 0
Primary Energy Demand2 201 334 572 699 895 1 046 1 107 5,2% 5,5% 2,0% 2,5% 1,6% 0,6%Coal 1 1 2 4 11 28 64 10,8% 4,2% 6,3% 11,0% 9,5% 8,6%Oil 128 187 274 275 313 333 313 3,9% 3,9% 0,0% 1,3% 0,6% -0,6%Natural gas 72 145 293 411 546 639 642 7,3% 7,3% 3,4% 2,9% 1,6% 0,1%Biomass 0 0 2 7 22 35 52 -2,3% 24,5% 14,4% 11,8% 4,7% 4,0%Nuclear1 0 0 0 1 1 2 7 n.s. n.s. n.s. 0,0% 5,4% 10,6%Hydro 1 0 1 2 2 2 2 -6,9% 12,9% 3,2% 1,0% 0,7% 1,0%Other renewables 0 0 0 0 1 8 27 n.s. 42,1% 7,0% 17,3% 22,4% 13,2%
Primary Energy Demand, by sector (Mtoe)Primary Energy Demand 201 334 572 699 895 1 046 1 107 5,2% 5,5% 2,0% 2,5% 1,6% 0,6%Energy for Power Generation 57 102 193 214 285 345 385 6,0% 6,6% 1,0% 2,9% 1,9% 1,1%Other Transformation & Losses 20 36 56 82 127 170 202 5,7% 4,6% 3,9% 4,4% 3,0% 1,7%Energy Branch Consumption 21 42 73 97 127 150 155 7,2% 5,6% 3,0% 2,7% 1,7% 0,3%Final consumption 134 213 367 465 587 688 731 4,7% 5,6% 2,4% 2,4% 1,6% 0,6%
Steel, Non-Met. Minerals and Chem. 4 8 18 23 26 29 29 7,9% 9,0% 2,3% 1,6% 0,9% 0,0%Other Industry 36 52 87 118 146 170 185 3,7% 5,3% 3,2% 2,1% 1,6% 0,8%Non-Energy Use 18 27 57 77 98 116 126 3,9% 7,8% 3,1% 2,4% 1,7% 0,8%Residential 21 44 72 86 97 107 108 7,5% 5,0% 1,8% 1,3% 0,9% 0,1%Services 8 15 24 32 45 56 62 6,4% 5,3% 2,6% 3,5% 2,3% 1,1%Agriculture 4 5 8 10 11 13 15 1,1% 4,5% 2,2% 1,8% 1,5% 1,3%Road 43 63 101 120 163 194 204 3,9% 4,9% 1,7% 3,1% 1,8% 0,5%Rail 0 0 0 0 0 0 0 n.s. 36,9% 2,0% 2,4% 1,8% 1,1%Aviation 1 1 1 1 1 2 2 2,0% 1,2% 1,7% 4,2% 2,9% 0,9%Other Transport 0 1 0 0 0 0 0 n.s. -30,1% -0,7% 1,8% 1,2% 0,2%
1 Primary energy from nuclear is calculated considering the primary heat equivalent of the electricity produced with an average efficiency of 33%
63

GECO2015 Baseline 150504 SUMMARY GHG & ENERGY BALANCE##### 100
Persian Gulf Countries 1990 2000 2010 2020 2030 2040 2050 '90-'00 '00-'10 '10-'20 '20-'30 '30-'40 '40-'50Power Generation
Fuel Inputs Therm. Power (Mtoe) 56 101 192 211 281 333 349 6,1% 6,6% 0,9% 2,9% 1,7% 0,5%Coal 0 0 0 1 4 12 35 22,3% -3,1% 18,9% 19,1% 13,1% 11,3%Oil 24 41 77 55 56 50 38 5,3% 6,6% -3,2% 0,1% -1,2% -2,7%Gas 32 61 115 155 220 267 267 6,6% 6,6% 3,0% 3,6% 2,0% 0,0%Biomass & Waste 0 0 0 0 1 3 9 n.s. n.s. 40,6% 34,8% 12,2% 10,7%Other 0 0 0 0 0 0 0 n.s. n.s. n.s. n.s. n.s. n.s.
Gross Elec. Generation (TWh e) 202 380 748 1 020 1 480 1 933 2 250 6,5% 7,0% 3,1% 3,8% 2,7% 1,5%Coal 0 0 0 3 18 64 192 22,2% -3,1% 24,0% 19,6% 13,4% 11,6%
of which CCS 0 0 0 0 0 0 0 n.s. n.s. n.s. n.s. n.s. n.s.Oil 91 153 246 232 236 212 164 5,3% 4,9% -0,6% 0,2% -1,1% -2,6%Gas 103 222 486 757 1 182 1 552 1 579 8,0% 8,1% 4,5% 4,6% 2,8% 0,2%
of which CCS 0 0 0 0 0 0 0 n.s. n.s. n.s. n.s. n.s. n.s.Biomass & Waste 0 0 0 0 5 16 46 n.s. n.s. n.s. 35,5% 12,8% 11,3%
of which CCS 0 0 0 0 0 0 0 n.s. n.s. n.s. n.s. n.s. n.s.Nuclear 0 0 0 6 6 10 27 n.s. n.s. n.s. 0,0% 5,6% 10,9%Hydro 9 4 14 20 22 23 26 -6,9% 12,9% 3,2% 1,0% 0,7% 1,0%Wind 0 0 0 1 8 38 129 n.s. 18,5% 16,1% 23,6% 17,5% 13,1%Solar 0 0 1 2 4 18 86 n.s. n.s. 4,0% 9,9% 16,6% 16,6%Other 0 0 0 0 0 0 1 n.s. n.s. n.s. n.s. 22,3% 17,0%
Generation Capacity (GWe) 68 99 186 237 281 373 482 3,8% 6,5% 2,5% 1,7% 2,9% 2,6%Coal 0 0 0 0 2 9 26 n.s. n.s. n.s. 19,8% 13,5% 11,5%
of which CCS 0 0 0 0 0 0 0 n.s. n.s. n.s. n.s. n.s. n.s.Oil 32 39 64 71 54 51 39 2,0% 5,1% 1,2% -2,7% -0,7% -2,7%Gas 33 55 110 149 202 267 287 5,4% 7,2% 3,0% 3,1% 2,9% 0,7%
of which CCS 0 0 0 0 0 0 0 n.s. n.s. n.s. n.s. n.s. n.s.Biomass & Waste 0 0 0 0 1 2 6 n.s. n.s. n.s. 35,7% 12,8% 11,1%
of which CCS 0 0 0 0 0 0 0 n.s. n.s. n.s. n.s. n.s. n.s.Nuclear 0 0 0 1 1 1 4 n.s. n.s. n.s. -0,2% 5,4% 10,7%Hydro 4 5 11 14 15 17 18 2,5% 9,1% 2,4% 1,0% 0,7% 1,0%Wind 0 0 0 0 3 15 52 n.s. n.s. 14,8% 23,3% 17,3% 13,0%Solar 0 0 1 1 2 10 50 n.s. n.s. 4,6% 10,4% 16,7% 16,8%Other 0 0 0 0 0 0 0 n.s. n.s. n.s. n.s. 21,7% 16,5%
Total Final Consumption 2 (Mtoe) 134 213 367 465 587 688 731 4,7% 5,6% 2,4% 2,4% 1,6% 0,6%Coal 0 1 1 3 6 13 23 6,4% 6,1% 6,1% 9,5% 7,5% 5,8%Oil 92 129 188 217 257 282 274 3,5% 3,8% 1,4% 1,7% 0,9% -0,3%Gas 28 57 125 169 205 231 233 7,5% 8,2% 3,1% 1,9% 1,2% 0,1%Electricity 14 26 51 69 100 130 152 6,4% 7,0% 3,1% 3,7% 2,7% 1,6%Heat 0 0 0 0 0 3 9 n.s. n.s. n.s. n.s. 51,3% 11,1%Biomass & Other 0 0 1 8 19 29 41 -2,3% 18,9% 20,9% 9,4% 4,1% 3,5%Share of Renewables 3 (%) 1% 0% 1% 2% 4% 6% 10% -9,7% 10,1% 8,8% 7,6% 4,3% 5,9%
Industry (incl. non-energy use) 58 86 161 218 270 316 340 4,1% 6,5% 3,1% 2,2% 1,6% 0,7%Coal 0 1 1 3 6 13 23 6,2% 6,3% 6,1% 9,5% 7,5% 5,8%Oil 30 42 66 77 83 87 85 3,5% 4,6% 1,5% 0,8% 0,5% -0,3%Gas 25 38 85 122 152 176 182 4,4% 8,3% 3,7% 2,2% 1,5% 0,4%Electricity 3 5 9 14 21 27 32 7,2% 6,5% 4,4% 3,8% 2,7% 1,6%Heat 0 0 0 0 0 0 0 n.s. n.s. n.s. n.s. n.s. n.s.Biomass & Other 0 0 0 2 8 13 18 n.s. n.s. n.s. 14,3% 4,4% 3,5%
Buildings 29 58 96 117 142 163 171 7,2% 5,1% 2,0% 1,9% 1,4% 0,5%Coal 0 0 0 0 0 0 0 n.s. -7,3% -1,7% -2,3% -2,6% -2,9%Oil 15 19 17 16 13 12 10 2,6% -1,5% -0,4% -1,9% -1,0% -1,6%Gas 3 19 40 46 52 55 50 21,5% 7,8% 1,5% 1,3% 0,5% -0,9%Electricity 11 20 39 51 68 84 91 6,1% 7,0% 2,6% 3,0% 2,1% 0,9%Heat 0 0 0 0 0 3 9 n.s. n.s. n.s. n.s. 51,3% 11,1%Biomass & Other 0 0 0 4 8 10 11 -2,3% 6,0% 27,9% 6,2% 1,8% 0,9%
Agriculture 4 5 8 10 11 13 15 1,1% 4,5% 2,2% 1,8% 1,5% 1,3%Coal 0 0 0 0 0 0 0 n.s. n.s. n.s. n.s. n.s. n.s.Oil 4 4 5 5 6 7 8 -0,1% 2,3% 1,1% 1,4% 1,1% 0,8%Gas 0 0 0 0 0 1 1 n.s. n.s. 1,6% 1,4% 1,1% 0,8%Electricity 0 1 2 4 5 6 7 8,1% 9,3% 4,2% 2,4% 2,1% 1,8%Heat 0 0 0 0 0 0 0 n.s. n.s. n.s. n.s. n.s. n.s.Biomass & Other 0 0 0 0 0 0 0 n.s. n.s. n.s. n.s. n.s. n.s.
Transport 43 64 102 121 164 196 206 4,0% 4,8% 1,7% 3,1% 1,8% 0,5%Coal 0 0 0 0 0 0 0 n.s. n.s. n.s. n.s. n.s. n.s.Oil 43 64 101 119 155 176 172 4,0% 4,7% 1,7% 2,7% 1,3% -0,2%Gas 0 0 0 0 0 0 0 n.s. n.s. n.s. n.s. n.s. n.s.Electricity 0 0 0 0 6 14 22 n.s. 37,9% 30,5% 31,0% 8,5% 5,0%Heat 0 0 0 0 0 0 0 n.s. n.s. n.s. n.s. n.s. n.s.Biomass & Other 0 0 1 1 3 7 12 n.s. n.s. 4,8% 9,1% 7,8% 6,3%
Energy Branch Consumption 21 42 73 97 127 150 155 7,2% 5,6% 3,0% 2,7% 1,7% 0,3%Other Transformation & Losses 4 20 36 56 82 127 170 202 5,7% 4,6% 3,9% 4,4% 3,0% 1,7%
2 does not include international aviation and maritime bunkers; includes non-energy uses3 ratio of renewable energy over final energy demand increased by distribution losses and self consumption of electricity and steam plants4 includes statistical differences
64

GECO2015 Global Mitigation 150504 SUMMARY GHG & ENERGY BALANCE##### 100
World 1990 2000 2010 2020 2030 2040 2050 '90-'00 '00-'10 '10-'20 '20-'30 '30-'40 '40-'50Main Economic Indicators
Population (Million) 5320 818 6127 699 6916 183 7716 747 8424 939 9038 690 9550 948 1,4% 1,2% 1,1% 0,9% 0,7% 0,6%GDP per capita (ppp, k$'05) 7 8 10 13 17 21 26 1,5% 2,3% 2,6% 2,8% 2,4% 2,0%GDP per capita (mer, k$'05) 6 7 7 9 11 13 16 1,4% 1,3% 1,8% 2,1% 1,9% 1,6%Share Value Added - Agriculture (%) 8 5 5 5 5 5 5 -3,4% 0,1% -0,3% 0,0% 0,1% 0,1%Share Value Added - Industry (%) 33 30 31 31 29 27 25 -1,0% 0,1% 0,1% -0,5% -0,8% -0,9%Share Value Added - Services (%) 59 64 64 64 65 68 70 0,9% -0,1% 0,0% 0,2% 0,3% 0,3%
PricesInternational ($'05/boe)
Coal 16 8 19 23 25 27 31 -6,8% 9,1% 1,9% 0,7% 0,9% 1,4%Oil 33 32 72 96 103 104 74 -0,2% 8,3% 2,9% 0,7% 0,1% -3,3%Gas 19 23 32 33 37 36 28 2,3% 3,3% 0,1% 1,2% -0,4% -2,4%
GHG emissions (MtCO2 eq.)Total GHG (excl. LULUCF) 31 453 34 212 43 357 48 367 39 829 29 726 15 761 0,8% 2,4% 1,1% -1,9% -2,9% -6,1%CO2 22 867 25 530 33 021 38 226 32 752 24 208 11 974 1,1% 2,6% 1,5% -1,5% -3,0% -6,8%CH4 5 896 5 969 7 222 6 617 4 589 3 513 2 447 0,1% 1,9% -0,9% -3,6% -2,6% -3,6%N2O 2 406 2 328 2 562 2 734 2 293 1 933 1 293 -0,3% 1,0% 0,7% -1,7% -1,7% -3,9%F gases 284 385 552 789 195 73 47 3,1% 3,7% 3,6% -13,0% -9,4% -4,4%Total GHG from Energy and Industry 26 645 29 523 38 067 42 829 35 298 25 808 13 060 1,0% 2,6% 1,2% -1,9% -3,1% -6,6%CO2 Emissions from Fuel Comb. 21 405 23 830 30 020 34 258 28 681 20 550 9 380 1,1% 2,3% 1,3% -1,8% -3,3% -7,5%
Power generation/District heating 6 856 8 516 11 823 13 446 9 993 5 144 541 2,2% 3,3% 1,3% -2,9% -6,4% -20,2%Industry 4 277 4 273 5 372 6 417 5 740 4 415 2 219 0,0% 2,3% 1,8% -1,1% -2,6% -6,6%Buildings 2 991 2 743 2 944 2 873 2 338 1 838 1 107 -0,9% 0,7% -0,2% -2,0% -2,4% -4,9%Agriculture 422 349 398 436 341 225 145 -1,9% 1,3% 0,9% -2,4% -4,1% -4,3%Transport 4 607 5 697 6 739 7 761 7 196 6 440 4 457 2,1% 1,7% 1,4% -0,8% -1,1% -3,6%Other 2 250 2 252 2 744 3 324 3 072 2 489 910 0,0% 2,0% 1,9% -0,8% -2,1% -9,6%
CO2 captured (CCS) 0 0 0 1 1 010 5 672 11 323 n.s. n.s. n.s. n.s. 18,8% 7,2%Coal 0 0 0 1 707 3 617 5 435 n.s. n.s. n.s. n.s. 17,7% 4,2%Gas 0 0 0 0 301 1 505 2 441 n.s. n.s. n.s. n.s. 17,5% 5,0%Biomass 0 0 0 0 2 550 3 447 n.s. n.s. n.s. 19,8% n.s. 20,1%
Energy Balance, by fuel (Mtoe)Primary Production 8 830 10 112 12 748 14 922 15 964 16 658 16 311 1,4% 2,3% 1,6% 0,7% 0,4% -0,2%
Coal 2 195 2 408 3 477 3 972 2 768 2 159 1 849 0,9% 3,7% 1,3% -3,5% -2,5% -1,5%Oil 3 300 3 702 4 184 4 514 4 153 3 667 2 662 1,2% 1,2% 0,8% -0,8% -1,2% -3,2%Natural gas 1 717 2 070 2 706 3 338 3 836 3 872 3 177 1,9% 2,7% 2,1% 1,4% 0,1% -2,0%Biomass 864 962 1 241 1 462 2 191 2 847 3 702 1,1% 2,6% 1,7% 4,1% 2,7% 2,7%Nuclear1 533 686 728 838 1 624 2 098 2 286 2,6% 0,6% 1,4% 6,8% 2,6% 0,9%Hydro 188 232 302 400 469 489 502 2,1% 2,7% 2,8% 1,6% 0,4% 0,3%Other renewables 34 52 110 398 924 1 525 2 133 4,5% 7,7% 13,7% 8,8% 5,1% 3,4%
International Bunkers 236 319 417 536 646 742 637 3,0% 2,7% 2,5% 1,9% 1,4% -1,5%Maritime Bunkers 151 202 266 346 427 488 371 2,9% 2,8% 2,7% 2,1% 1,3% -2,7%Aviation Bunkers 85 117 151 190 218 253 266 3,2% 2,6% 2,4% 1,4% 1,5% 0,5%
Oil 85 117 151 188 190 194 147 3,2% 2,6% 2,2% 0,1% 0,2% -2,8%Biofuels 0 0 0 2 28 59 120 n.s. n.s. n.s. 29,3% 7,8% 7,3%
Regional Energy Demand (excl. bunkers) 8 594 9 793 12 331 14 385 15 319 15 916 15 674 1,3% 2,3% 1,6% 0,6% 0,4% -0,2%Coal 2 195 2 408 3 477 3 972 2 768 2 159 1 849 0,9% 3,7% 1,3% -3,5% -2,5% -1,5%Oil 3 063 3 383 3 767 3 980 3 535 2 985 2 145 1,0% 1,1% 0,6% -1,2% -1,7% -3,2%Natural gas 1 717 2 070 2 706 3 338 3 836 3 872 3 177 1,9% 2,7% 2,1% 1,4% 0,1% -2,0%Biomass 864 962 1 241 1 460 2 163 2 788 3 582 1,1% 2,6% 1,6% 4,0% 2,6% 2,5%Nuclear1 533 686 728 838 1 624 2 098 2 286 2,6% 0,6% 1,4% 6,8% 2,6% 0,9%Hydro 188 232 302 400 469 489 502 2,1% 2,7% 2,8% 1,6% 0,4% 0,3%Other renewables 34 52 110 398 924 1 525 2 133 4,5% 7,7% 13,7% 8,8% 5,1% 3,4%
Primary Energy Demand, by sector (Mtoe)Primary Energy Demand 8 830 10 112 12 748 14 922 15 964 16 658 16 311 1,4% 2,3% 1,6% 0,7% 0,4% -0,2%Energy for Power Generation 2 796 3 485 4 688 5 812 6 820 8 031 9 118 2,2% 3,0% 2,2% 1,6% 1,6% 1,3%Other Transformation & Losses 230 250 460 592 1 052 1 374 1 721 0,8% 6,3% 2,6% 5,9% 2,7% 2,3%Energy Branch Consumption 738 809 994 1 216 1 237 1 201 1 053 0,9% 2,1% 2,0% 0,2% -0,3% -1,3%Final consumption (incl. bunkers) 6 423 7 161 8 809 10 248 10 757 10 968 10 440 1,1% 2,1% 1,5% 0,5% 0,2% -0,5%
Steel, Non-Met. Minerals and Chem. 824 921 1 292 1 548 1 406 1 203 1 007 1,1% 3,4% 1,8% -1,0% -1,5% -1,8%Other Industry 1 147 1 095 1 319 1 754 2 071 2 261 2 277 -0,5% 1,9% 2,9% 1,7% 0,9% 0,1%Non-Energy Use 489 628 808 904 968 974 876 2,5% 2,6% 1,1% 0,7% 0,1% -1,1%Residential 1 633 1 795 2 045 2 072 2 007 1 944 1 786 0,9% 1,3% 0,1% -0,3% -0,3% -0,8%Services 594 630 824 1 000 1 178 1 368 1 511 0,6% 2,7% 2,0% 1,7% 1,5% 1,0%Agriculture 167 143 171 199 226 249 269 -1,5% 1,8% 1,5% 1,3% 1,0% 0,8%Road 1 138 1 432 1 734 1 986 1 966 1 919 1 780 2,3% 1,9% 1,4% -0,1% -0,2% -0,7%Rail 61 48 53 62 71 79 84 -2,4% 1,1% 1,6% 1,4% 1,0% 0,7%Aviation 181 225 249 313 361 411 419 2,2% 1,0% 2,3% 1,4% 1,3% 0,2%Other Transport 190 244 314 410 504 561 431 2,5% 2,6% 2,7% 2,1% 1,1% -2,6%
1 Primary energy from nuclear is calculated considering the primary heat equivalent of the electricity produced with an average efficiency of 33%
65

GECO2015 Global Mitigation 150504 SUMMARY GHG & ENERGY BALANCE##### 100
World 1990 2000 2010 2020 2030 2040 2050 '90-'00 '00-'10 '10-'20 '20-'30 '30-'40 '40-'50Power Generation
Fuel Inputs Therm. Power (Mtoe) 2 044 2 520 3 553 4 191 3 828 3 947 4 225 2,1% 3,5% 1,7% -0,9% 0,3% 0,7%Coal 1 174 1 532 2 170 2 411 1 619 1 393 1 319 2,7% 3,5% 1,1% -3,9% -1,5% -0,5%Oil 336 290 257 230 224 223 159 -1,4% -1,2% -1,1% -0,2% -0,1% -3,3%Gas 479 641 1 014 1 335 1 615 1 686 1 660 3,0% 4,7% 2,8% 1,9% 0,4% -0,2%Biomass & Waste 53 52 106 201 345 617 1 060 -0,2% 7,3% 6,7% 5,5% 6,0% 5,6%Other 3 4 6 14 24 28 28 3,6% 2,8% 9,2% 5,2% 1,7% 0,0%
Gross Elec. Generation (TWh e) 11 778 15 419 21 491 28 869 36 817 45 553 54 830 2,7% 3,4% 3,0% 2,5% 2,2% 1,9%Coal 4 425 5 999 8 694 10 110 7 141 6 370 6 270 3,1% 3,8% 1,5% -3,4% -1,1% -0,2%
of which CCS 0 0 0 0 813 3 936 5 950 n.s. n.s. n.s. n.s. 17,1% 4,2%Oil 1 317 1 180 962 980 956 953 693 -1,1% -2,0% 0,2% -0,2% 0,0% -3,1%Gas 1 728 2 733 4 767 6 753 8 606 9 284 9 821 4,7% 5,7% 3,5% 2,5% 0,8% 0,6%
of which CCS 0 0 0 0 744 3 873 6 565 n.s. n.s. n.s. n.s. 17,9% 5,4%Biomass & Waste 63 133 311 707 1 344 2 660 4 965 7,8% 8,9% 8,5% 6,6% 7,1% 6,4%
of which CCS 0 0 0 0 0 466 2 394 n.s. n.s. n.s. n.s. n.s. 17,8%Nuclear 2 013 2 591 2 756 3 212 6 448 8 393 9 102 2,6% 0,6% 1,5% 7,2% 2,7% 0,8%Hydro 2 190 2 699 3 514 4 650 5 455 5 680 5 833 2,1% 2,7% 2,8% 1,6% 0,4% 0,3%Wind 4 31 370 1 867 5 285 8 209 10 175 23,2% 28,0% 17,6% 11,0% 4,5% 2,2%Solar 1 1 48 399 1 202 3 456 7 238 7,4% 41,6% 23,7% 11,7% 11,1% 7,7%Other 36 52 69 192 378 546 733 3,6% 2,8% 10,9% 7,0% 3,7% 3,0%
Generation Capacity (GWe) 2 453 3 457 5 141 7 307 10 408 12 802 16 524 3,5% 4,0% 3,6% 3,6% 2,1% 2,6%Coal 772 1 064 1 690 2 078 2 070 1 393 1 124 3,3% 4,7% 2,1% 0,0% -3,9% -2,1%
of which CCS 0 0 0 0 109 555 995 n.s. n.s. n.s. n.s. 17,7% 6,0%Oil 402 489 422 375 338 325 328 2,0% -1,5% -1,2% -1,1% -0,4% 0,1%Gas 400 708 1 310 1 741 2 157 2 038 2 296 5,9% 6,4% 2,9% 2,2% -0,6% 1,2%
of which CCS 0 0 0 0 96 524 1 040 n.s. n.s. n.s. n.s. 18,5% 7,1%Biomass & Waste 17 34 84 172 264 461 801 7,4% 9,5% 7,4% 4,4% 5,7% 5,7%
of which CCS 0 0 0 0 0 62 326 n.s. n.s. n.s. n.s. n.s. 18,1%Nuclear 290 355 378 435 842 1 075 1 153 2,0% 0,6% 1,4% 6,8% 2,5% 0,7%Hydro 564 781 1 021 1 344 1 565 1 623 1 660 3,3% 2,7% 2,8% 1,5% 0,4% 0,2%Wind 2 17 185 821 2 250 3 443 4 211 24,0% 27,0% 16,1% 10,6% 4,3% 2,0%Solar 0 1 41 309 853 2 339 4 808 10,8% 42,8% 22,2% 10,7% 10,6% 7,5%Other 6 8 10 32 68 105 143 3,7% 2,0% 12,4% 7,8% 4,4% 3,1%
Total Final Consumption (Mtoe) 6 423 7 161 8 809 10 248 10 757 10 968 10 440 1,1% 2,1% 1,5% 0,5% 0,2% -0,5%Coal 892 700 1 042 1 264 926 583 361 -2,4% 4,1% 1,9% -3,1% -4,5% -4,7%Oil 2 641 3 157 3 625 3 976 3 661 3 233 2 368 1,8% 1,4% 0,9% -0,8% -1,2% -3,1%Gas 919 1 063 1 243 1 427 1 545 1 523 1 014 1,5% 1,6% 1,4% 0,8% -0,1% -4,0%Electricity 830 1 086 1 530 2 048 2 614 3 246 3 928 2,7% 3,5% 3,0% 2,5% 2,2% 1,9%Heat 337 256 296 356 434 542 633 -2,7% 1,5% 1,9% 2,0% 2,2% 1,6%Biomass & Other 804 899 1 072 1 177 1 577 1 842 2 137 1,1% 1,8% 0,9% 3,0% 1,6% 1,5%Share of Renewables 2 (%) 17% 18% 18% 20% 29% 38% 49% 0,4% 0,3% 1,1% 3,6% 2,6% 2,7%
Industry (incl. non-energy use) 2 460 2 645 3 419 4 207 4 444 4 438 4 160 0,7% 2,6% 2,1% 0,6% 0,0% -0,6%Coal 618 582 905 1 128 875 570 356 -0,6% 4,5% 2,2% -2,5% -4,2% -4,6%Oil 684 803 926 947 895 813 707 1,6% 1,4% 0,2% -0,6% -1,0% -1,4%Gas 478 526 627 798 946 1 009 709 1,0% 1,8% 2,4% 1,7% 0,6% -3,5%Electricity 380 458 637 937 1 158 1 329 1 484 1,9% 3,3% 3,9% 2,1% 1,4% 1,1%Heat 161 105 130 140 150 158 161 -4,2% 2,1% 0,7% 0,7% 0,5% 0,2%Biomass & Other 137 170 194 257 421 560 743 2,2% 1,3% 2,8% 5,1% 2,9% 2,9%
Buildings 2 227 2 425 2 869 3 072 3 185 3 311 3 297 0,9% 1,7% 0,7% 0,4% 0,4% 0,0%Coal 245 106 123 122 43 9 2 -8,0% 1,5% -0,1% -9,9% -14,8% -15,9%Oil 317 341 325 294 247 193 125 0,7% -0,5% -1,0% -1,8% -2,4% -4,3%Gas 434 531 610 623 593 510 302 2,0% 1,4% 0,2% -0,5% -1,5% -5,1%Electricity 403 582 832 1 014 1 206 1 467 1 775 3,8% 3,6% 2,0% 1,7% 2,0% 1,9%Heat 176 151 166 216 284 384 472 -1,5% 1,0% 2,7% 2,8% 3,1% 2,1%Biomass & Other 653 713 813 803 812 748 622 0,9% 1,3% -0,1% 0,1% -0,8% -1,8%
Agriculture 167 143 171 199 226 249 269 -1,5% 1,8% 1,5% 1,3% 1,0% 0,8%Coal 15 7 11 11 6 2 1 -7,2% 4,0% 0,2% -6,0% -8,5% -8,5%Oil 109 97 108 119 97 65 42 -1,2% 1,1% 1,0% -2,1% -3,9% -4,2%Gas 7 6 6 6 5 4 3 -2,4% 1,1% -0,2% -1,6% -2,9% -3,0%Electricity 30 29 39 53 75 101 123 -0,5% 3,2% 2,9% 3,7% 2,9% 2,1%Heat 0 0 0 0 0 0 0 n.s. n.s. n.s. n.s. n.s. n.s.Biomass & Other 6 5 7 10 43 77 99 -1,5% 3,6% 3,2% 16,0% 6,1% 2,6%
Transport (incl. bunkers) 1 569 1 948 2 350 2 770 2 902 2 970 2 714 2,2% 1,9% 1,7% 0,5% 0,2% -0,9%Coal 13 4 3 3 3 2 2 -10,4% -3,2% -0,4% -1,9% -1,9% -1,9%Oil 1 531 1 916 2 267 2 616 2 423 2 162 1 494 2,3% 1,7% 1,4% -0,8% -1,1% -3,6%Gas 0 0 0 0 0 0 0 n.s. n.s. n.s. n.s. n.s. n.s.Electricity 17 16 21 44 176 349 546 -0,7% 2,9% 7,5% 14,8% 7,1% 4,6%Heat 0 0 0 0 0 0 0 n.s. n.s. n.s. n.s. n.s. n.s.Biomass & Other 8 11 58 107 301 457 673 3,7% 18,1% 6,4% 10,8% 4,3% 3,9%
Energy Branch Consumption 738 809 994 1 216 1 237 1 201 1 053 0,9% 2,1% 2,0% 0,2% -0,3% -1,3%Other Transformation & Losses 3 230 250 460 592 1 052 1 374 1 721 0,8% 6,3% 2,6% 5,9% 2,7% 2,3%
2 ratio of renewable energy over final energy demand increased by distribution losses and self consumption of electricity and steam plants3 includes statistical differences
66

GECO2015 Global Mitigation 150504 SUMMARY GHG & ENERGY BALANCE##### 100
EU28 1990 2000 2010 2020 2030 2040 2050 '90-'00 '00-'10 '10-'20 '20-'30 '30-'40 '40-'50Main Economic Indicators
Population (Million) 479 489 507 517 519 518 513 0,2% 0,4% 0,2% 0,1% 0,0% -0,1%GDP per capita (ppp, k$'05) 20 25 28 31 37 42 49 1,9% 1,1% 1,3% 1,5% 1,4% 1,4%GDP per capita (mer, k$'05) 21 26 29 32 38 44 50 2,0% 1,0% 1,3% 1,5% 1,4% 1,5%Share Value Added - Agriculture (%) 3 2 2 2 2 1 1 -5,0% -1,2% -0,8% -0,5% -0,5% -0,5%Share Value Added - Industry1 (%) 34 28 25 24 23 22 20 -1,8% -1,1% -0,4% -0,5% -0,5% -0,6%Share Value Added - Services (%) 63 70 73 74 75 77 78 1,1% 0,5% 0,1% 0,2% 0,2% 0,2%
PricesInternational/Regional ($'05/boe)
Coal 18 9 19 22 24 26 30 -6,6% 7,6% 1,4% 0,8% 1,0% 1,4%Oil 33 32 72 96 103 104 74 -0,2% 8,3% 2,9% 0,7% 0,1% -3,3%Gas 18 21 31 38 39 36 28 1,4% 4,0% 2,0% 0,4% -0,7% -2,7%
GHG emissions (MtCO2 eq.)Total GHG (excl. LULUCF) 5 508 5 056 4 693 4 068 3 140 2 150 1 071 -0,9% -0,7% -1,4% -2,6% -3,7% -6,7%CO2 4 366 4 111 3 884 3 394 2 685 1 816 806 -0,6% -0,6% -1,3% -2,3% -3,8% -7,8%CH4 589 483 403 317 192 112 70 -1,9% -1,8% -2,4% -4,9% -5,2% -4,6%N2O 498 397 318 258 227 205 187 -2,2% -2,2% -2,1% -1,3% -1,1% -0,9%F gases 56 64 89 99 35 18 9 1,5% 3,2% 1,1% -9,8% -6,6% -6,2%Total GHG from Energy and Industry 4 897 4 539 4 224 3 658 2 815 1 871 840 -0,8% -0,7% -1,4% -2,6% -4,0% -7,7%CO2 Emissions from Fuel Comb. 4 091 3 859 3 664 3 193 2 513 1 684 733 -0,6% -0,5% -1,4% -2,4% -3,9% -8,0%
Power generation/District heating 1 428 1 287 1 234 1 054 815 522 181 -1,0% -0,4% -1,6% -2,5% -4,4% -10,1%Industry 793 683 545 497 446 311 144 -1,5% -2,2% -0,9% -1,1% -3,5% -7,4%Buildings 731 651 646 519 433 316 188 -1,1% -0,1% -2,2% -1,8% -3,1% -5,0%Agriculture 84 72 59 55 42 27 17 -1,5% -1,9% -0,7% -2,7% -4,4% -4,3%Transport 756 888 915 827 576 369 180 1,6% 0,3% -1,0% -3,6% -4,4% -6,9%Other 300 278 263 241 200 139 22 -0,8% -0,5% -0,9% -1,8% -3,6% -16,9%
CO2 captured (CCS) 0 0 0 0 62 438 865 n.s. n.s. n.s. n.s. 21,6% 7,0%Coal 0 0 0 0 40 238 359 n.s. n.s. n.s. n.s. 19,5% 4,2%Gas 0 0 0 0 21 166 332 n.s. n.s. n.s. n.s. 23,1% 7,2%Biomass 0 0 0 0 1 34 174 n.s. n.s. n.s. 26,0% 43,4% 17,7%
Energy Balance, by fuel (Mtoe)Primary Production 821 897 787 759 813 810 833 0,9% -1,3% -0,4% 0,7% 0,0% 0,3%
Coal 224 148 75 67 43 28 9 -4,1% -6,6% -1,0% -4,4% -4,2% -10,8%Oil 136 177 101 68 49 36 28 2,7% -5,5% -3,9% -3,2% -3,0% -2,6%Natural gas 178 218 168 117 91 85 75 2,1% -2,6% -3,5% -2,5% -0,8% -1,1%Biomass 44 64 144 197 272 292 285 3,9% 8,4% 3,2% 3,3% 0,7% -0,2%Nuclear1 210 250 242 209 210 175 193 1,7% -0,3% -1,5% 0,1% -1,8% 1,0%Hydro 27 33 35 33 34 33 34 2,3% 0,5% -0,6% 0,2% 0,0% 0,1%Other renewables 3 6 22 67 115 162 209 8,1% 13,0% 11,8% 5,5% 3,5% 2,6%
Net Imports 826 804 957 895 789 684 563Coal 225 176 205 171 110 104 98Oil 480 448 472 420 327 239 140Natural gas 117 177 275 294 339 308 267Biomass 0 0 2 6 7 24 48Biofuels 0 0 2 4 7 9 9Electricity 4 2 1 0 0 0 0
Primary Energy Demand2 1 647 1 701 1 743 1 654 1 602 1 494 1 396 0,3% 0,2% -0,5% -0,3% -0,7% -0,7%Coal 449 324 280 239 153 132 107 -3,2% -1,4% -1,6% -4,3% -1,5% -2,1%Oil 615 625 573 488 376 275 168 0,2% -0,9% -1,6% -2,6% -3,1% -4,8%Natural gas 295 396 443 412 430 393 342 3,0% 1,1% -0,7% 0,4% -0,9% -1,4%Biomass 44 64 146 203 279 315 333 3,9% 8,5% 3,4% 3,2% 1,2% 0,6%Nuclear1 210 250 242 209 210 175 193 1,7% -0,3% -1,5% 0,1% -1,8% 1,0%Hydro 27 33 35 33 34 33 34 2,3% 0,5% -0,6% 0,2% 0,0% 0,1%Other renewables 3 6 22 67 115 162 209 8,1% 13,0% 11,8% 5,5% 3,5% 2,6%
Primary Energy Demand, by sector (Mtoe)Primary Energy Demand 1 647 1 701 1 743 1 654 1 602 1 494 1 396 0,3% 0,2% -0,5% -0,3% -0,7% -0,7%Energy for Power Generation 636 675 724 716 766 816 876 0,6% 0,7% -0,1% 0,7% 0,6% 0,7%Other Transformation & Losses 212 248 302 329 397 440 498 1,6% 2,0% 0,8% 1,9% 1,0% 1,2%Energy Branch Consumption 107 103 102 95 89 80 73 -0,3% -0,2% -0,7% -0,7% -1,0% -0,9%Final consumption 1 153 1 196 1 214 1 149 1 086 984 886 0,4% 0,1% -0,6% -0,6% -1,0% -1,1%
Steel, Non-Met. Minerals and Chem. 190 166 141 127 113 93 79 -1,4% -1,6% -1,0% -1,2% -1,9% -1,6%Other Industry 175 163 150 156 165 161 157 -0,8% -0,8% 0,4% 0,5% -0,2% -0,3%Non-Energy Use 100 113 109 101 98 88 75 1,2% -0,4% -0,7% -0,3% -1,0% -1,6%Residential 278 289 310 275 262 235 207 0,4% 0,7% -1,2% -0,5% -1,1% -1,3%Services 117 133 161 157 162 163 166 1,3% 1,9% -0,2% 0,3% 0,1% 0,2%Agriculture 33 29 26 25 26 28 29 -1,3% -1,1% -0,3% 0,5% 0,5% 0,4%Road 237 281 297 285 239 196 155 1,7% 0,5% -0,4% -1,8% -1,9% -2,3%Rail 10 10 9 9 9 10 10 0,1% -1,2% 0,3% 0,5% 0,3% 0,3%Aviation 6 7 7 7 7 6 5 2,5% -0,6% 0,4% -0,4% -1,3% -2,1%Other Transport 7 6 6 6 5 4 3 -0,9% 0,0% -0,5% -0,7% -2,9% -2,7%
1 Primary energy from nuclear is calculated considering the primary heat equivalent of the electricity produced with an average efficiency of 33%
67
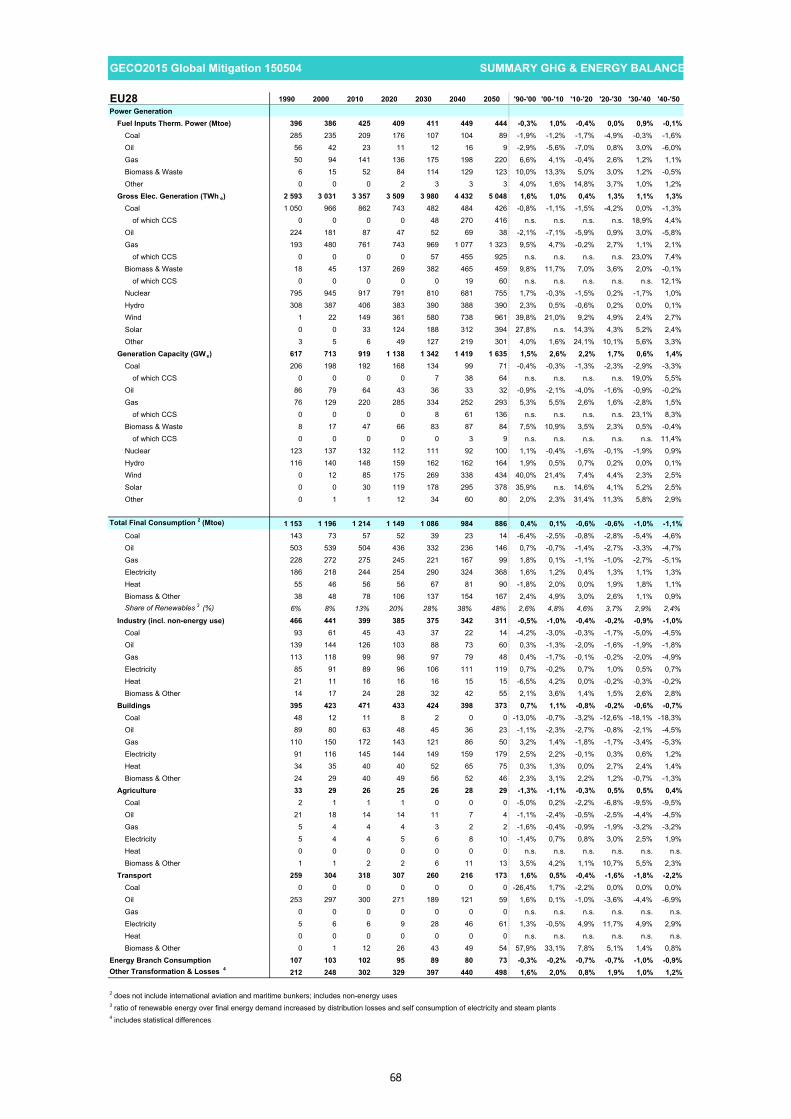
GECO2015 Global Mitigation 150504 SUMMARY GHG & ENERGY BALANCE##### 100
EU28 1990 2000 2010 2020 2030 2040 2050 '90-'00 '00-'10 '10-'20 '20-'30 '30-'40 '40-'50Power Generation
Fuel Inputs Therm. Power (Mtoe) 396 386 425 409 411 449 444 -0,3% 1,0% -0,4% 0,0% 0,9% -0,1%Coal 285 235 209 176 107 104 89 -1,9% -1,2% -1,7% -4,9% -0,3% -1,6%Oil 56 42 23 11 12 16 9 -2,9% -5,6% -7,0% 0,8% 3,0% -6,0%Gas 50 94 141 136 175 198 220 6,6% 4,1% -0,4% 2,6% 1,2% 1,1%Biomass & Waste 6 15 52 84 114 129 123 10,0% 13,3% 5,0% 3,0% 1,2% -0,5%Other 0 0 0 2 3 3 3 4,0% 1,6% 14,8% 3,7% 1,0% 1,2%
Gross Elec. Generation (TWh e) 2 593 3 031 3 357 3 509 3 980 4 432 5 048 1,6% 1,0% 0,4% 1,3% 1,1% 1,3%Coal 1 050 966 862 743 482 484 426 -0,8% -1,1% -1,5% -4,2% 0,0% -1,3%
of which CCS 0 0 0 0 48 270 416 n.s. n.s. n.s. n.s. 18,9% 4,4%Oil 224 181 87 47 52 69 38 -2,1% -7,1% -5,9% 0,9% 3,0% -5,8%Gas 193 480 761 743 969 1 077 1 323 9,5% 4,7% -0,2% 2,7% 1,1% 2,1%
of which CCS 0 0 0 0 57 455 925 n.s. n.s. n.s. n.s. 23,0% 7,4%Biomass & Waste 18 45 137 269 382 465 459 9,8% 11,7% 7,0% 3,6% 2,0% -0,1%
of which CCS 0 0 0 0 0 19 60 n.s. n.s. n.s. n.s. n.s. 12,1%Nuclear 795 945 917 791 810 681 755 1,7% -0,3% -1,5% 0,2% -1,7% 1,0%Hydro 308 387 406 383 390 388 390 2,3% 0,5% -0,6% 0,2% 0,0% 0,1%Wind 1 22 149 361 580 738 961 39,8% 21,0% 9,2% 4,9% 2,4% 2,7%Solar 0 0 33 124 188 312 394 27,8% n.s. 14,3% 4,3% 5,2% 2,4%Other 3 5 6 49 127 219 301 4,0% 1,6% 24,1% 10,1% 5,6% 3,3%
Generation Capacity (GWe) 617 713 919 1 138 1 342 1 419 1 635 1,5% 2,6% 2,2% 1,7% 0,6% 1,4%Coal 206 198 192 168 134 99 71 -0,4% -0,3% -1,3% -2,3% -2,9% -3,3%
of which CCS 0 0 0 0 7 38 64 n.s. n.s. n.s. n.s. 19,0% 5,5%Oil 86 79 64 43 36 33 32 -0,9% -2,1% -4,0% -1,6% -0,9% -0,2%Gas 76 129 220 285 334 252 293 5,3% 5,5% 2,6% 1,6% -2,8% 1,5%
of which CCS 0 0 0 0 8 61 136 n.s. n.s. n.s. n.s. 23,1% 8,3%Biomass & Waste 8 17 47 66 83 87 84 7,5% 10,9% 3,5% 2,3% 0,5% -0,4%
of which CCS 0 0 0 0 0 3 9 n.s. n.s. n.s. n.s. n.s. 11,4%Nuclear 123 137 132 112 111 92 100 1,1% -0,4% -1,6% -0,1% -1,9% 0,9%Hydro 116 140 148 159 162 162 164 1,9% 0,5% 0,7% 0,2% 0,0% 0,1%Wind 0 12 85 175 269 338 434 40,0% 21,4% 7,4% 4,4% 2,3% 2,5%Solar 0 0 30 119 178 295 378 35,9% n.s. 14,6% 4,1% 5,2% 2,5%Other 0 1 1 12 34 60 80 2,0% 2,3% 31,4% 11,3% 5,8% 2,9%
Total Final Consumption 2 (Mtoe) 1 153 1 196 1 214 1 149 1 086 984 886 0,4% 0,1% -0,6% -0,6% -1,0% -1,1%Coal 143 73 57 52 39 23 14 -6,4% -2,5% -0,8% -2,8% -5,4% -4,6%Oil 503 539 504 436 332 236 146 0,7% -0,7% -1,4% -2,7% -3,3% -4,7%Gas 228 272 275 245 221 167 99 1,8% 0,1% -1,1% -1,0% -2,7% -5,1%Electricity 186 218 244 254 290 324 368 1,6% 1,2% 0,4% 1,3% 1,1% 1,3%Heat 55 46 56 56 67 81 90 -1,8% 2,0% 0,0% 1,9% 1,8% 1,1%Biomass & Other 38 48 78 106 137 154 167 2,4% 4,9% 3,0% 2,6% 1,1% 0,9%Share of Renewables 3 (%) 6% 8% 13% 20% 28% 38% 48% 2,6% 4,8% 4,6% 3,7% 2,9% 2,4%
Industry (incl. non-energy use) 466 441 399 385 375 342 311 -0,5% -1,0% -0,4% -0,2% -0,9% -1,0%Coal 93 61 45 43 37 22 14 -4,2% -3,0% -0,3% -1,7% -5,0% -4,5%Oil 139 144 126 103 88 73 60 0,3% -1,3% -2,0% -1,6% -1,9% -1,8%Gas 113 118 99 98 97 79 48 0,4% -1,7% -0,1% -0,2% -2,0% -4,9%Electricity 85 91 89 96 106 111 119 0,7% -0,2% 0,7% 1,0% 0,5% 0,7%Heat 21 11 16 16 16 15 15 -6,5% 4,2% 0,0% -0,2% -0,3% -0,2%Biomass & Other 14 17 24 28 32 42 55 2,1% 3,6% 1,4% 1,5% 2,6% 2,8%
Buildings 395 423 471 433 424 398 373 0,7% 1,1% -0,8% -0,2% -0,6% -0,7%Coal 48 12 11 8 2 0 0 -13,0% -0,7% -3,2% -12,6% -18,1% -18,3%Oil 89 80 63 48 45 36 23 -1,1% -2,3% -2,7% -0,8% -2,1% -4,5%Gas 110 150 172 143 121 86 50 3,2% 1,4% -1,8% -1,7% -3,4% -5,3%Electricity 91 116 145 144 149 159 179 2,5% 2,2% -0,1% 0,3% 0,6% 1,2%Heat 34 35 40 40 52 65 75 0,3% 1,3% 0,0% 2,7% 2,4% 1,4%Biomass & Other 24 29 40 49 56 52 46 2,3% 3,1% 2,2% 1,2% -0,7% -1,3%
Agriculture 33 29 26 25 26 28 29 -1,3% -1,1% -0,3% 0,5% 0,5% 0,4%Coal 2 1 1 1 0 0 0 -5,0% 0,2% -2,2% -6,8% -9,5% -9,5%Oil 21 18 14 14 11 7 4 -1,1% -2,4% -0,5% -2,5% -4,4% -4,5%Gas 5 4 4 4 3 2 2 -1,6% -0,4% -0,9% -1,9% -3,2% -3,2%Electricity 5 4 4 5 6 8 10 -1,4% 0,7% 0,8% 3,0% 2,5% 1,9%Heat 0 0 0 0 0 0 0 n.s. n.s. n.s. n.s. n.s. n.s.Biomass & Other 1 1 2 2 6 11 13 3,5% 4,2% 1,1% 10,7% 5,5% 2,3%
Transport 259 304 318 307 260 216 173 1,6% 0,5% -0,4% -1,6% -1,8% -2,2%Coal 0 0 0 0 0 0 0 -26,4% 1,7% -2,2% 0,0% 0,0% 0,0%Oil 253 297 300 271 189 121 59 1,6% 0,1% -1,0% -3,6% -4,4% -6,9%Gas 0 0 0 0 0 0 0 n.s. n.s. n.s. n.s. n.s. n.s.Electricity 5 6 6 9 28 46 61 1,3% -0,5% 4,9% 11,7% 4,9% 2,9%Heat 0 0 0 0 0 0 0 n.s. n.s. n.s. n.s. n.s. n.s.Biomass & Other 0 1 12 26 43 49 54 57,9% 33,1% 7,8% 5,1% 1,4% 0,8%
Energy Branch Consumption 107 103 102 95 89 80 73 -0,3% -0,2% -0,7% -0,7% -1,0% -0,9%Other Transformation & Losses 4 212 248 302 329 397 440 498 1,6% 2,0% 0,8% 1,9% 1,0% 1,2%
2 does not include international aviation and maritime bunkers; includes non-energy uses3 ratio of renewable energy over final energy demand increased by distribution losses and self consumption of electricity and steam plants4 includes statistical differences
68

GECO2015 Global Mitigation 150504 SUMMARY GHG & ENERGY BALANCE##### 100
Canada 1990 2000 2010 2020 2030 2040 2050 '90-'00 '00-'10 '10-'20 '20-'30 '30-'40 '40-'50Main Economic Indicators
Population (Million) 28 31 34 38 41 43 45 1,0% 1,1% 1,0% 0,8% 0,6% 0,5%GDP per capita (ppp, k$'05) 27 33 35 39 45 52 59 1,9% 0,8% 1,1% 1,4% 1,3% 1,4%GDP per capita (mer, k$'05) 27 33 35 40 45 52 59 1,9% 0,8% 1,1% 1,4% 1,3% 1,4%Share Value Added - Agriculture (%) 3 2 2 2 2 2 2 -2,3% -1,7% -0,4% -0,4% -0,3% -0,3%Share Value Added - Industry (%) 31 33 32 30 27 24 20 0,6% -0,4% -0,7% -1,1% -1,2% -1,5%Share Value Added - Services (%) 66 65 66 68 71 75 78 -0,2% 0,2% 0,3% 0,5% 0,4% 0,4%
PricesInternational/Regional ($'05/boe)
Coal 12 8 13 17 19 21 25 -4,2% 5,4% 2,9% 1,0% 1,0% 1,8%Oil 33 32 72 96 103 104 74 -0,2% 8,3% 2,9% 0,7% 0,1% -3,3%Gas 17 26 20 22 32 34 28 4,7% -2,6% 0,8% 4,0% 0,6% -2,1%
GHG emissions (Mt CO2 eq.)Total GHG (excl. LULUCF) 574 696 688 664 514 387 152 1,9% -0,1% -0,4% -2,5% -2,8% -8,9%CO2 447 549 546 535 412 297 84 2,1% -0,1% -0,2% -2,6% -3,2% -11,9%CH4 69 91 88 73 58 51 34 2,7% -0,3% -1,8% -2,3% -1,3% -3,8%N2O 47 46 45 45 41 39 34 -0,3% -0,2% 0,0% -1,0% -0,3% -1,5%F gases 11 10 9 10 3 1 0 -0,4% -1,2% 1,3% -11,5% -16,6% -4,3%Total GHG from Energy and Industry 527 640 632 608 467 341 114 2,0% -0,1% -0,4% -2,6% -3,1% -10,4%CO2 Emissions from Fuel Comb. 425 523 525 516 397 284 75 2,1% 0,0% -0,2% -2,6% -3,3% -12,5%
Power generation/District heating 96 133 111 76 31 - 2 - 58 3,3% -1,8% -3,7% -8,5% n.s. n.s.Industry 80 90 100 109 85 64 30 1,2% 1,1% 0,8% -2,5% -2,8% -7,3%Buildings 74 86 71 73 55 42 25 1,6% -1,9% 0,3% -2,8% -2,8% -5,0%Agriculture 8 10 10 11 8 6 4 3,1% 0,2% 0,6% -2,7% -4,0% -4,0%Transport 116 136 162 157 112 87 56 1,6% 1,7% -0,3% -3,3% -2,5% -4,2%Other 51 67 70 90 105 88 18 2,8% 0,4% 2,5% 1,5% -1,7% -14,8%
CO2 captured (CCS) 0 0 0 0 14 80 188 n.s. n.s. n.s. n.s. 18,7% 9,0%Coal 0 0 0 0 8 43 62 n.s. n.s. n.s. n.s. 17,7% 3,8%Gas 0 0 0 0 6 17 28 n.s. n.s. n.s. n.s. 10,9% 5,4%Biomass 0 0 0 0 0 20 98 n.s. n.s. n.s. 5,4% n.s. 17,1%
Energy Balance, by fuel (Mtoe)Primary Production 270 372 383 508 666 733 714 3,2% 0,3% 2,9% 2,7% 1,0% -0,3%
Coal 30 27 20 24 39 60 73 -1,1% -2,7% 1,6% 5,1% 4,4% 2,1%Oil 97 133 164 213 292 294 199 3,2% 2,1% 2,6% 3,2% 0,1% -3,8%Natural gas 91 150 130 183 195 188 151 5,1% -1,4% 3,4% 0,6% -0,4% -2,2%Biomass 8 12 13 24 54 91 174 3,8% 0,9% 6,6% 8,3% 5,4% 6,7%Nuclear1 19 19 24 24 36 39 43 0,0% 2,2% 0,0% 4,2% 0,8% 1,1%Hydro 26 31 30 35 39 41 43 1,9% -0,2% 1,4% 1,0% 0,7% 0,5%Other renewables 0 0 1 6 12 21 30 n.s. 42,2% 22,3% 7,2% 5,7% 3,6%
Net Imports - 59 - 120 - 129 - 239 - 391 - 445 - 425Coal - 5 5 3 - 8 - 30 - 46 - 57Oil - 17 - 46 - 78 - 135 - 237 - 253 - 176Natural gas - 37 - 76 - 52 - 90 - 111 - 114 - 105Biomass 0 0 0 - 2 - 7 - 21 - 76Biofuels 0 0 0 0 - 4 - 8 - 9Electricity 0 - 3 - 2 - 3 - 3 - 3 - 3
Primary Energy Demand2 212 251 254 269 275 288 289 1,7% 0,1% 0,6% 0,2% 0,5% 0,0%Coal 24 31 23 15 9 14 16 2,5% -3,1% -4,0% -4,9% 4,0% 1,9%Oil 80 87 86 77 55 40 23 0,8% -0,1% -1,1% -3,3% -3,0% -5,3%Natural gas 54 74 79 93 84 74 46 3,2% 0,6% 1,7% -1,0% -1,3% -4,7%Biomass 8 12 12 22 47 70 99 3,7% 0,6% 5,8% 8,0% 4,1% 3,5%Nuclear1 19 19 24 24 36 39 43 0,0% 2,2% 0,0% 4,2% 0,8% 1,1%Hydro 26 31 30 35 39 41 43 1,9% -0,2% 1,4% 1,0% 0,7% 0,5%Other renewables 0 0 1 6 12 21 30 n.s. 42,2% 22,3% 7,2% 5,7% 3,6%
Primary Energy Demand, by sector (Mtoe)Primary Energy Demand 212 251 254 269 275 288 289 1,7% 0,1% 0,6% 0,2% 0,5% 0,0%Energy for Power Generation 71 89 90 92 105 133 174 2,2% 0,1% 0,2% 1,4% 2,3% 2,8%Other Transformation & Losses 40 45 35 43 69 93 116 1,2% -2,5% 2,0% 4,9% 3,0% 2,3%Energy Branch Consumption 21 29 30 39 46 45 27 3,1% 0,4% 2,6% 1,6% -0,3% -5,1%Final consumption 157 186 194 208 195 195 196 1,7% 0,5% 0,7% -0,6% 0,0% 0,0%
Steel, Non-Met. Minerals and Chem. 11 13 12 11 8 7 6 1,1% -1,0% -0,2% -3,1% -1,5% -1,1%Other Industry 37 43 43 50 48 48 46 1,6% -0,1% 1,6% -0,4% -0,1% -0,4%Non-Energy Use 15 20 22 23 22 21 19 2,9% 1,2% 0,0% -0,4% -0,3% -1,1%Residential 29 31 31 33 31 32 31 0,7% 0,0% 0,7% -0,6% 0,2% -0,1%Services 22 27 25 29 31 35 40 2,4% -0,9% 1,3% 0,7% 1,3% 1,2%Agriculture 3 4 4 5 5 6 6 2,6% 0,1% 1,1% 0,9% 0,7% 0,7%Road 33 39 49 49 42 40 42 1,7% 2,2% 0,1% -1,5% -0,5% 0,4%Rail 2 2 2 2 2 2 2 -0,7% 0,0% -0,1% -0,2% -0,6% -0,8%Aviation 3 4 4 4 4 3 3 2,4% -0,5% -0,1% -1,1% -1,4% -1,8%Other Transport 1 1 2 2 2 2 1 0,1% 2,6% 0,1% -0,1% -1,9% -2,2%
1 Primary energy from nuclear is calculated considering the primary heat equivalent of the electricity produced with an average efficiency of 33%
69

GECO2015 Global Mitigation 150504 SUMMARY GHG & ENERGY BALANCE##### 100
Canada 1990 2000 2010 2020 2030 2040 2050 '90-'00 '00-'10 '10-'20 '20-'30 '30-'40 '40-'50Power Generation
Fuel Inputs Therm. Power (Mtoe) 27 39 35 27 19 31 58 3,9% -1,1% -2,6% -3,5% 5,3% 6,3%Coal 20 26 20 12 5 11 15 2,8% -3,0% -5,0% -7,4% 7,3% 3,3%Oil 4 3 2 0 0 0 0 -1,8% -5,3% -20,4% n.s. n.s. n.s.Gas 2 7 12 12 10 11 16 14,7% 4,6% 0,7% -1,9% 0,9% 3,4%Biomass & Waste 1 2 2 3 3 9 27 7,8% 0,3% 2,3% 2,0% 11,5% 11,5%Other 0 0 0 0 0 0 0 n.s. n.s. n.s. n.s. n.s. n.s.
Gross Elec. Generation (TWh e) 482 605 608 705 833 1 018 1 285 2,3% 0,0% 1,5% 1,7% 2,0% 2,4%Coal 82 118 88 56 27 52 74 3,6% -2,9% -4,5% -7,2% 7,0% 3,5%
of which CCS 0 0 0 0 10 49 73 n.s. n.s. n.s. n.s. 17,3% 4,0%Oil 16 15 7 1 0 0 0 -1,1% -6,6% -19,9% -44,0% n.s. n.s.Gas 10 33 52 71 64 69 99 13,2% 4,5% 3,2% -1,1% 0,8% 3,6%
of which CCS 0 0 0 0 17 46 79 n.s. n.s. n.s. n.s. 10,7% 5,5%Biomass & Waste 4 8 9 11 13 43 134 7,2% 0,9% 2,3% 2,0% 12,4% 12,1%
of which CCS 0 0 0 0 0 18 84 n.s. n.s. n.s. n.s. n.s. 16,6%Nuclear 73 73 91 91 141 153 168 0,0% 2,2% 0,0% 4,5% 0,8% 0,9%Hydro 297 359 352 405 449 482 506 1,9% -0,2% 1,4% 1,0% 0,7% 0,5%Wind 0 0 9 66 126 194 268 n.s. 42,5% 21,8% 6,7% 4,4% 3,3%Solar 0 0 0 5 14 24 36 n.s. 36,0% 30,3% 10,8% 5,7% 4,2%Other 0 0 0 0 0 0 1 n.s. n.s. n.s. 25,5% 13,8% 11,9%
Generation Capacity (GWe) 103 111 135 193 248 301 362 0,7% 2,0% 3,6% 2,6% 1,9% 1,9%Coal 19 18 16 18 15 15 16 -0,8% -1,2% 1,5% -2,1% 0,4% 0,2%
of which CCS 0 0 0 0 1 8 15 n.s. n.s. n.s. n.s. 19,5% 6,6%Oil 7 8 7 4 6 6 8 0,5% -1,6% -3,9% 2,7% 0,5% 2,6%Gas 4 7 16 39 51 55 54 5,9% 9,5% 9,3% 2,6% 0,8% -0,2%
of which CCS 0 0 0 0 2 11 22 n.s. n.s. n.s. n.s. 17,3% 7,0%Biomass & Waste 1 1 4 4 3 7 24 2,2% 14,7% -0,9% -4,1% 10,7% 12,3%
of which CCS 0 0 0 0 0 2 12 n.s. n.s. n.s. n.s. n.s. 17,2%Nuclear 13 10 13 13 20 21 23 -2,2% 2,3% 0,4% 4,4% 0,6% 0,7%Hydro 59 67 75 81 90 97 101 1,3% 1,1% 0,8% 1,0% 0,7% 0,5%Wind 0 0 4 28 53 80 108 n.s. 39,9% 21,6% 6,5% 4,2% 3,1%Solar 0 0 0 4 11 19 29 n.s. 44,3% 30,3% 10,8% 5,7% 4,2%Other 0 0 0 0 0 0 0 n.s. n.s. n.s. 24,7% 13,3% 11,4%
Total Final Consumption 2 (Mtoe) 157 186 194 208 195 195 196 1,7% 0,5% 0,7% -0,6% 0,0% 0,0%Coal 4 5 4 3 3 3 2 0,8% -1,4% -2,6% -0,3% -0,2% -3,2%Oil 69 81 90 86 66 53 38 1,6% 1,1% -0,5% -2,6% -2,2% -3,3%Gas 40 49 49 57 41 31 17 1,9% 0,2% 1,4% -3,2% -2,9% -5,8%Electricity 36 41 40 46 55 67 86 1,4% -0,2% 1,3% 1,8% 2,1% 2,4%Heat 1 1 0 0 1 3 4 2,5% -6,8% 0,0% 3,8% 17,1% 4,5%Biomass & Other 7 10 10 16 30 39 49 3,0% 0,4% 5,0% 6,2% 2,5% 2,4%Share of Renewables 3 (%) 22% 24% 23% 29% 43% 54% 66% 0,6% -0,3% 2,5% 4,0% 2,3% 2,0%
Industry (incl. non-energy use) 63 76 77 84 78 76 71 1,9% 0,1% 0,9% -0,7% -0,3% -0,7%Coal 4 5 4 3 3 3 2 0,9% -1,3% -2,6% -0,3% -0,2% -3,2%Oil 18 22 27 23 20 17 15 2,0% 1,8% -1,4% -1,5% -1,3% -1,6%Gas 20 23 25 33 24 18 10 1,5% 0,8% 2,5% -3,0% -2,7% -6,2%Electricity 14 17 14 16 17 19 20 1,9% -2,0% 1,2% 0,8% 0,9% 0,6%Heat 1 1 0 0 0 0 0 2,5% -6,7% 0,0% -0,2% -0,3% -0,2%Biomass & Other 6 8 6 9 13 18 24 3,1% -1,8% 3,4% 4,1% 2,8% 3,0%
Buildings 50 58 56 62 62 67 71 1,5% -0,4% 1,0% 0,0% 0,8% 0,6%Coal 0 0 0 0 0 0 0 -3,2% -21,2% -4,2% n.s. n.s. n.s.Oil 9 9 5 6 5 4 3 0,3% -5,4% 0,8% -0,6% -1,8% -4,3%Gas 20 25 23 24 16 12 7 2,3% -0,5% 0,1% -3,6% -3,2% -5,3%Electricity 20 23 25 28 31 37 46 1,0% 1,0% 1,2% 1,1% 1,8% 2,1%Heat 0 0 0 0 0 2 4 4,4% n.s. n.s. n.s. 29,3% 5,1%Biomass & Other 1 2 2 4 9 11 12 2,1% 3,0% 6,2% 7,1% 2,0% 0,7%
Agriculture 3 4 4 5 5 6 6 2,6% 0,1% 1,1% 0,9% 0,7% 0,7%Coal 0 0 0 0 0 0 0 n.s. n.s. n.s. n.s. n.s. n.s.Oil 2 3 3 3 2 1 1 3,3% 0,2% 0,6% -2,8% -4,2% -4,2%Gas 0 1 1 1 1 0 0 1,6% 0,1% 0,5% -1,9% -2,9% -2,9%Electricity 1 1 1 1 1 2 2 1,1% -0,2% 1,6% 3,8% 3,3% 2,4%Heat 0 0 0 0 0 0 0 n.s. n.s. n.s. n.s. n.s. n.s.Biomass & Other 0 0 0 0 1 2 2 n.s. n.s. n.s. 22,1% 5,9% 2,5%
Transport 40 47 57 57 50 47 47 1,6% 1,9% 0,1% -1,4% -0,6% 0,1%Coal 0 0 0 0 0 0 0 n.s. n.s. n.s. n.s. n.s. n.s.Oil 40 47 56 54 38 30 19 1,6% 1,7% -0,3% -3,3% -2,6% -4,2%Gas 0 0 0 0 0 0 0 n.s. n.s. n.s. n.s. n.s. n.s.Electricity 0 0 0 1 5 9 17 0,1% -1,2% 27,1% 20,3% 7,0% 6,7%Heat 0 0 0 0 0 0 0 n.s. n.s. n.s. n.s. n.s. n.s.Biomass & Other 0 0 1 3 7 8 11 n.s. 24,9% 8,8% 9,0% 1,8% 3,1%
Energy Branch Consumption 21 29 30 39 46 45 27 3,1% 0,4% 2,6% 1,6% -0,3% -5,1%Other Transformation & Losses 4 40 45 35 43 69 93 116 1,2% -2,5% 2,0% 4,9% 3,0% 2,3%
2 does not include international aviation and maritime bunkers; includes non-energy uses3 ratio of renewable energy over final energy demand increased by distribution losses and self consumption of electricity and steam plants4 includes statistical differences
70
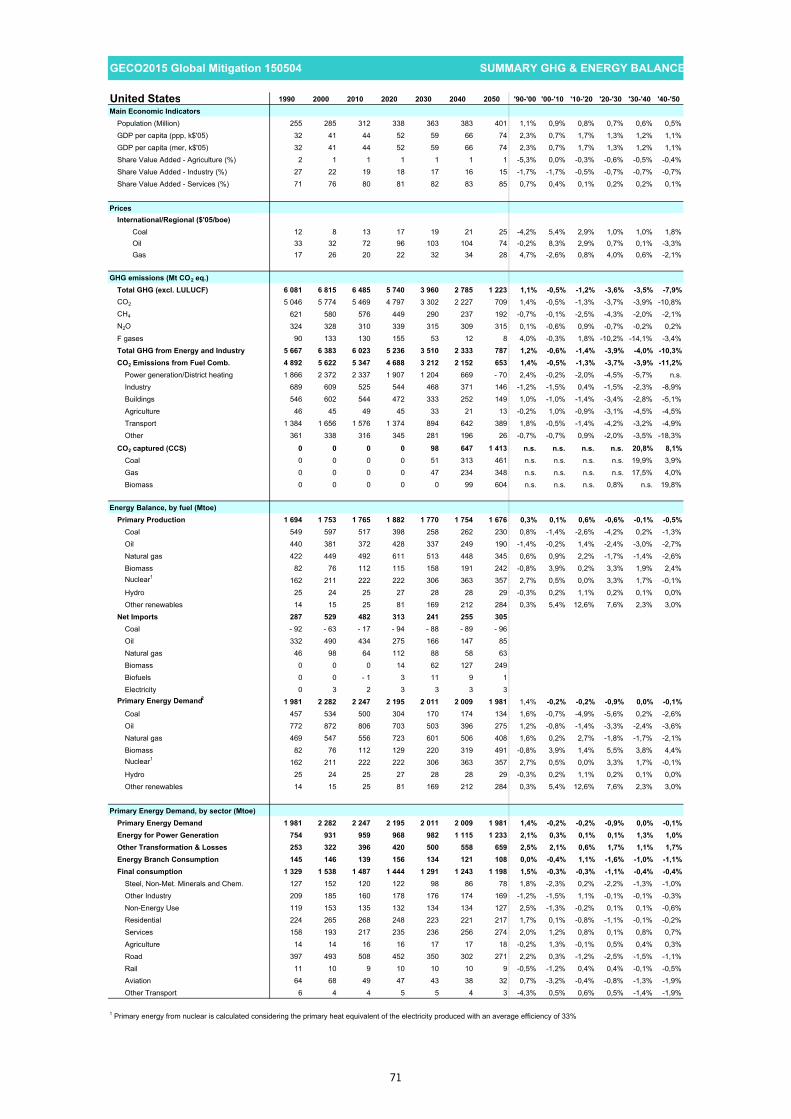
GECO2015 Global Mitigation 150504 SUMMARY GHG & ENERGY BALANCE##### 100
United States 1990 2000 2010 2020 2030 2040 2050 '90-'00 '00-'10 '10-'20 '20-'30 '30-'40 '40-'50Main Economic Indicators
Population (Million) 255 285 312 338 363 383 401 1,1% 0,9% 0,8% 0,7% 0,6% 0,5%GDP per capita (ppp, k$'05) 32 41 44 52 59 66 74 2,3% 0,7% 1,7% 1,3% 1,2% 1,1%GDP per capita (mer, k$'05) 32 41 44 52 59 66 74 2,3% 0,7% 1,7% 1,3% 1,2% 1,1%Share Value Added - Agriculture (%) 2 1 1 1 1 1 1 -5,3% 0,0% -0,3% -0,6% -0,5% -0,4%Share Value Added - Industry (%) 27 22 19 18 17 16 15 -1,7% -1,7% -0,5% -0,7% -0,7% -0,7%Share Value Added - Services (%) 71 76 80 81 82 83 85 0,7% 0,4% 0,1% 0,2% 0,2% 0,1%
PricesInternational/Regional ($'05/boe)
Coal 12 8 13 17 19 21 25 -4,2% 5,4% 2,9% 1,0% 1,0% 1,8%Oil 33 32 72 96 103 104 74 -0,2% 8,3% 2,9% 0,7% 0,1% -3,3%Gas 17 26 20 22 32 34 28 4,7% -2,6% 0,8% 4,0% 0,6% -2,1%
GHG emissions (Mt CO2 eq.)Total GHG (excl. LULUCF) 6 081 6 815 6 485 5 740 3 960 2 785 1 223 1,1% -0,5% -1,2% -3,6% -3,5% -7,9%CO2 5 046 5 774 5 469 4 797 3 302 2 227 709 1,4% -0,5% -1,3% -3,7% -3,9% -10,8%CH4 621 580 576 449 290 237 192 -0,7% -0,1% -2,5% -4,3% -2,0% -2,1%N2O 324 328 310 339 315 309 315 0,1% -0,6% 0,9% -0,7% -0,2% 0,2%F gases 90 133 130 155 53 12 8 4,0% -0,3% 1,8% -10,2% -14,1% -3,4%Total GHG from Energy and Industry 5 667 6 383 6 023 5 236 3 510 2 333 787 1,2% -0,6% -1,4% -3,9% -4,0% -10,3%CO2 Emissions from Fuel Comb. 4 892 5 622 5 347 4 688 3 212 2 152 653 1,4% -0,5% -1,3% -3,7% -3,9% -11,2%
Power generation/District heating 1 866 2 372 2 337 1 907 1 204 669 - 70 2,4% -0,2% -2,0% -4,5% -5,7% n.s.Industry 689 609 525 544 468 371 146 -1,2% -1,5% 0,4% -1,5% -2,3% -8,9%Buildings 546 602 544 472 333 252 149 1,0% -1,0% -1,4% -3,4% -2,8% -5,1%Agriculture 46 45 49 45 33 21 13 -0,2% 1,0% -0,9% -3,1% -4,5% -4,5%Transport 1 384 1 656 1 576 1 374 894 642 389 1,8% -0,5% -1,4% -4,2% -3,2% -4,9%Other 361 338 316 345 281 196 26 -0,7% -0,7% 0,9% -2,0% -3,5% -18,3%
CO2 captured (CCS) 0 0 0 0 98 647 1 413 n.s. n.s. n.s. n.s. 20,8% 8,1%Coal 0 0 0 0 51 313 461 n.s. n.s. n.s. n.s. 19,9% 3,9%Gas 0 0 0 0 47 234 348 n.s. n.s. n.s. n.s. 17,5% 4,0%Biomass 0 0 0 0 0 99 604 n.s. n.s. n.s. 0,8% n.s. 19,8%
Energy Balance, by fuel (Mtoe)Primary Production 1 694 1 753 1 765 1 882 1 770 1 754 1 676 0,3% 0,1% 0,6% -0,6% -0,1% -0,5%
Coal 549 597 517 398 258 262 230 0,8% -1,4% -2,6% -4,2% 0,2% -1,3%Oil 440 381 372 428 337 249 190 -1,4% -0,2% 1,4% -2,4% -3,0% -2,7%Natural gas 422 449 492 611 513 448 345 0,6% 0,9% 2,2% -1,7% -1,4% -2,6%Biomass 82 76 112 115 158 191 242 -0,8% 3,9% 0,2% 3,3% 1,9% 2,4%Nuclear1 162 211 222 222 306 363 357 2,7% 0,5% 0,0% 3,3% 1,7% -0,1%Hydro 25 24 25 27 28 28 29 -0,3% 0,2% 1,1% 0,2% 0,1% 0,0%Other renewables 14 15 25 81 169 212 284 0,3% 5,4% 12,6% 7,6% 2,3% 3,0%
Net Imports 287 529 482 313 241 255 305Coal - 92 - 63 - 17 - 94 - 88 - 89 - 96Oil 332 490 434 275 166 147 85Natural gas 46 98 64 112 88 58 63Biomass 0 0 0 14 62 127 249Biofuels 0 0 - 1 3 11 9 1Electricity 0 3 2 3 3 3 3
Primary Energy Demand2 1 981 2 282 2 247 2 195 2 011 2 009 1 981 1,4% -0,2% -0,2% -0,9% 0,0% -0,1%Coal 457 534 500 304 170 174 134 1,6% -0,7% -4,9% -5,6% 0,2% -2,6%Oil 772 872 806 703 503 396 275 1,2% -0,8% -1,4% -3,3% -2,4% -3,6%Natural gas 469 547 556 723 601 506 408 1,6% 0,2% 2,7% -1,8% -1,7% -2,1%Biomass 82 76 112 129 220 319 491 -0,8% 3,9% 1,4% 5,5% 3,8% 4,4%Nuclear1 162 211 222 222 306 363 357 2,7% 0,5% 0,0% 3,3% 1,7% -0,1%Hydro 25 24 25 27 28 28 29 -0,3% 0,2% 1,1% 0,2% 0,1% 0,0%Other renewables 14 15 25 81 169 212 284 0,3% 5,4% 12,6% 7,6% 2,3% 3,0%
Primary Energy Demand, by sector (Mtoe)Primary Energy Demand 1 981 2 282 2 247 2 195 2 011 2 009 1 981 1,4% -0,2% -0,2% -0,9% 0,0% -0,1%Energy for Power Generation 754 931 959 968 982 1 115 1 233 2,1% 0,3% 0,1% 0,1% 1,3% 1,0%Other Transformation & Losses 253 322 396 420 500 558 659 2,5% 2,1% 0,6% 1,7% 1,1% 1,7%Energy Branch Consumption 145 146 139 156 134 121 108 0,0% -0,4% 1,1% -1,6% -1,0% -1,1%Final consumption 1 329 1 538 1 487 1 444 1 291 1 243 1 198 1,5% -0,3% -0,3% -1,1% -0,4% -0,4%
Steel, Non-Met. Minerals and Chem. 127 152 120 122 98 86 78 1,8% -2,3% 0,2% -2,2% -1,3% -1,0%Other Industry 209 185 160 178 176 174 169 -1,2% -1,5% 1,1% -0,1% -0,1% -0,3%Non-Energy Use 119 153 135 132 134 134 127 2,5% -1,3% -0,2% 0,1% 0,1% -0,6%Residential 224 265 268 248 223 221 217 1,7% 0,1% -0,8% -1,1% -0,1% -0,2%Services 158 193 217 235 236 256 274 2,0% 1,2% 0,8% 0,1% 0,8% 0,7%Agriculture 14 14 16 16 17 17 18 -0,2% 1,3% -0,1% 0,5% 0,4% 0,3%Road 397 493 508 452 350 302 271 2,2% 0,3% -1,2% -2,5% -1,5% -1,1%Rail 11 10 9 10 10 10 9 -0,5% -1,2% 0,4% 0,4% -0,1% -0,5%Aviation 64 68 49 47 43 38 32 0,7% -3,2% -0,4% -0,8% -1,3% -1,9%Other Transport 6 4 4 5 5 4 3 -4,3% 0,5% 0,6% 0,5% -1,4% -1,9%
1 Primary energy from nuclear is calculated considering the primary heat equivalent of the electricity produced with an average efficiency of 33%
71

GECO2015 Global Mitigation 150504 SUMMARY GHG & ENERGY BALANCE##### 100
United States 1990 2000 2010 2020 2030 2040 2050 '90-'00 '00-'10 '10-'20 '20-'30 '30-'40 '40-'50Power Generation
Fuel Inputs Therm. Power (Mtoe) 554 681 687 637 479 512 563 2,1% 0,1% -0,8% -2,8% 0,7% 1,0%Coal 392 492 470 278 144 149 117 2,3% -0,5% -5,1% -6,4% 0,3% -2,3%Oil 27 30 11 14 14 19 14 0,8% -9,6% 2,8% -0,4% 3,3% -3,2%Gas 93 137 185 323 291 264 254 3,9% 3,1% 5,7% -1,0% -1,0% -0,4%Biomass & Waste 40 21 20 18 25 75 171 -6,0% -0,5% -0,9% 2,9% 11,8% 8,6%Other 1 1 2 4 5 5 6 -0,9% 1,9% 9,1% 4,2% -0,5% 1,7%
Gross Elec. Generation (TWh e) 3 154 4 024 4 374 4 715 5 137 5 850 6 802 2,5% 0,8% 0,8% 0,9% 1,3% 1,5%Coal 1 700 2 129 1 994 1 180 635 671 555 2,3% -0,7% -5,1% -6,0% 0,6% -1,9%
of which CCS 0 0 0 0 56 349 536 n.s. n.s. n.s. n.s. 20,1% 4,4%Oil 131 118 48 59 57 79 59 -1,0% -8,6% 2,1% -0,4% 3,2% -2,8%Gas 382 634 1 018 1 780 1 666 1 436 1 479 5,2% 4,8% 5,7% -0,7% -1,5% 0,3%
of which CCS 0 0 0 0 132 643 966 n.s. n.s. n.s. n.s. 17,2% 4,2%Biomass & Waste 22 43 75 64 102 344 839 7,1% 5,8% -1,7% 4,8% 13,0% 9,3%
of which CCS 0 0 0 0 0 91 485 n.s. n.s. n.s. n.s. n.s. 18,2%Nuclear 612 798 839 842 1 203 1 439 1 408 2,7% 0,5% 0,0% 3,6% 1,8% -0,2%Hydro 289 280 286 319 326 331 332 -0,3% 0,2% 1,1% 0,2% 0,1% 0,0%Wind 3 6 90 356 881 993 1 178 6,3% 31,9% 14,8% 9,5% 1,2% 1,7%Solar 1 1 6 72 202 495 874 0,6% 24,1% 28,0% 10,8% 9,3% 5,9%Other 16 15 18 42 64 63 79 -0,9% 1,9% 9,1% 4,3% -0,2% 2,3%
Generation Capacity (GWe) 766 785 1 042 1 148 1 414 1 442 1 817 0,2% 2,9% 1,0% 2,1% 0,2% 2,3%Coal 271 271 319 255 153 103 80 0,0% 1,6% -2,2% -5,0% -3,9% -2,5%
of which CCS 0 0 0 0 8 46 77 n.s. n.s. n.s. n.s. 19,7% 5,3%Oil 82 109 56 23 20 17 20 2,9% -6,5% -8,5% -1,5% -1,5% 1,7%Gas 211 196 407 449 469 275 314 -0,7% 7,6% 1,0% 0,4% -5,2% 1,3%
of which CCS 0 0 0 0 17 83 143 n.s. n.s. n.s. n.s. 17,2% 5,6%Biomass & Waste 3 6 12 9 14 46 113 7,1% 6,8% -2,6% 4,7% 12,3% 9,4%
of which CCS 0 0 0 0 0 12 64 n.s. n.s. n.s. n.s. n.s. 18,3%Nuclear 102 98 101 105 148 177 173 -0,4% 0,3% 0,4% 3,5% 1,8% -0,2%Hydro 92 99 101 102 104 106 106 0,7% 0,2% 0,1% 0,2% 0,1% 0,0%Wind 2 3 40 154 374 413 477 5,4% 31,6% 14,3% 9,3% 1,0% 1,5%Solar 0 0 4 45 124 297 523 2,5% 22,7% 28,2% 10,6% 9,1% 5,8%Other 3 3 2 5 7 9 11 0,5% -1,5% 8,5% 3,2% 1,9% 2,3%
Total Final Consumption 2 (Mtoe) 1 329 1 538 1 487 1 444 1 291 1 243 1 198 1,5% -0,3% -0,3% -1,1% -0,4% -0,4%Coal 59 39 31 26 26 24 17 -4,0% -2,4% -1,7% -0,1% -0,6% -3,3%Oil 683 793 749 652 466 362 253 1,5% -0,6% -1,4% -3,3% -2,5% -3,5%Gas 316 345 303 311 228 175 102 0,9% -1,3% 0,3% -3,0% -2,6% -5,3%Electricity 226 301 327 349 381 434 507 2,9% 0,8% 0,7% 0,9% 1,3% 1,6%Heat 2 7 8 15 28 39 52 11,3% 1,3% 6,3% 6,2% 3,4% 3,0%Biomass & Other 43 52 69 91 162 208 267 2,1% 2,8% 2,8% 5,9% 2,6% 2,5%Share of Renewables 3 (%) 6% 6% 8% 12% 25% 36% 51% 0,2% 3,2% 4,6% 7,6% 3,5% 3,6%
Industry (incl. non-energy use) 455 490 415 433 407 394 373 0,7% -1,7% 0,4% -0,6% -0,3% -0,5%Coal 53 37 29 25 25 24 17 -3,6% -2,3% -1,5% 0,2% -0,5% -3,3%Oil 147 160 152 131 120 109 99 0,8% -0,5% -1,4% -0,9% -0,9% -1,0%Gas 152 155 121 152 124 100 60 0,2% -2,5% 2,3% -2,0% -2,1% -5,1%Electricity 75 98 76 82 81 80 79 2,8% -2,6% 0,8% -0,1% -0,1% -0,2%Heat 0 4 5 5 5 5 5 n.s. 2,2% 0,0% -0,2% -0,3% -0,2%Biomass & Other 29 36 32 37 52 75 113 2,2% -1,1% 1,4% 3,4% 3,8% 4,1%
Buildings 382 458 485 482 459 477 491 1,8% 0,6% -0,1% -0,5% 0,4% 0,3%Coal 5 2 2 1 0 0 0 -8,3% -3,8% -5,1% -11,7% -16,0% -16,2%Oil 45 48 36 31 28 24 16 0,5% -2,8% -1,5% -1,0% -1,4% -4,1%Gas 164 189 182 159 105 75 42 1,5% -0,4% -1,3% -4,1% -3,2% -5,6%Electricity 152 202 251 259 257 282 319 2,9% 2,2% 0,3% -0,1% 0,9% 1,2%Heat 2 3 3 10 23 34 47 1,7% -0,2% 13,0% 8,6% 4,1% 3,4%Biomass & Other 14 13 12 23 46 62 67 -0,3% -0,6% 6,4% 7,3% 3,0% 0,8%
Agriculture 14 14 16 16 17 17 18 -0,2% 1,3% -0,1% 0,5% 0,4% 0,3%Coal 0 0 0 0 0 0 0 n.s. n.s. n.s. n.s. n.s. n.s.Oil 14 14 16 14 10 7 4 -0,2% 1,0% -0,9% -3,1% -4,5% -4,5%Gas 0 0 0 0 0 0 0 n.s. n.s. n.s. n.s. n.s. n.s.Electricity 0 0 0 0 1 3 4 n.s. n.s. n.s. 17,5% 6,4% 3,2%Heat 0 0 0 0 0 0 0 n.s. n.s. n.s. n.s. n.s. n.s.Biomass & Other 0 0 0 1 5 8 10 n.s. n.s. 12,7% 14,4% 5,4% 2,3%
Transport 477 576 571 514 408 354 316 1,9% -0,1% -1,1% -2,3% -1,4% -1,1%Coal 0 0 0 0 0 0 0 n.s. n.s. n.s. n.s. n.s. n.s.Oil 477 572 546 476 309 222 134 1,8% -0,5% -1,4% -4,2% -3,3% -4,9%Gas 0 0 0 0 0 0 0 n.s. n.s. n.s. n.s. n.s. n.s.Electricity 0 0 1 8 41 70 106 0,7% 7,6% 25,9% 17,8% 5,5% 4,2%Heat 0 0 0 0 0 0 0 n.s. n.s. n.s. n.s. n.s. n.s.Biomass & Other 0 3 24 30 59 63 76 n.s. 22,5% 2,2% 6,9% 0,7% 2,0%
Energy Branch Consumption 145 146 139 156 134 121 108 0,0% -0,4% 1,1% -1,6% -1,0% -1,1%Other Transformation & Losses 4 253 322 396 420 500 558 659 2,5% 2,1% 0,6% 1,7% 1,1% 1,7%
2 does not include international aviation and maritime bunkers; includes non-energy uses3 ratio of renewable energy over final energy demand increased by distribution losses and self consumption of electricity and steam plants4 includes statistical differences
72

GECO2015 Global Mitigation 150504 SUMMARY GHG & ENERGY BALANCE##### 100
Mexico 1990 2000 2010 2020 2030 2040 2050 '90-'00 '00-'10 '10-'20 '20-'30 '30-'40 '40-'50Main Economic Indicators
Population (Million) 86 104 118 132 144 152 156 1,9% 1,3% 1,1% 0,9% 0,6% 0,3%GDP per capita (ppp, k$'05) 10 12 12 16 21 27 34 1,7% 0,5% 2,5% 2,7% 2,7% 2,5%GDP per capita (mer, k$'05) 7 8 8 10 14 18 23 1,7% 0,5% 2,5% 2,7% 2,7% 2,5%Share Value Added - Agriculture (%) 8 3 3 3 3 3 3 -7,8% -0,1% -0,7% -1,0% -0,8% -0,5%Share Value Added - Industry (%) 28 36 35 35 33 32 29 2,3% -0,3% 0,0% -0,4% -0,6% -0,7%Share Value Added - Services (%) 64 61 62 62 64 66 68 -0,5% 0,2% 0,0% 0,3% 0,3% 0,4%
PricesInternational/Regional ($'05/boe)
Coal 12 8 13 17 19 21 25 -4,2% 5,4% 2,9% 1,0% 1,0% 1,8%Oil 33 32 72 96 103 104 74 -0,2% 8,3% 2,9% 0,7% 0,1% -3,3%Gas 17 26 20 22 32 34 28 4,7% -2,6% 0,8% 4,0% 0,6% -2,1%
GHG emissions (Mt CO2 eq.)Total GHG (excl. LULUCF) 467 575 727 789 743 567 309 2,1% 2,4% 0,8% -0,6% -2,7% -5,9%CO2 306 394 475 543 563 431 231 2,6% 1,9% 1,3% 0,4% -2,6% -6,1%CH4 103 118 165 149 111 77 57 1,3% 3,4% -1,0% -2,9% -3,6% -3,0%N2O 55 58 68 72 67 58 21 0,4% 1,7% 0,5% -0,7% -1,4% -9,8%F gases 3 7 19 25 2 1 1 7,7% 11,1% 3,1% -21,4% -6,0% -6,0%Total GHG from Energy and Industry 374 488 635 690 659 492 272 2,7% 2,7% 0,8% -0,5% -2,9% -5,8%CO2 Emissions from Fuel Comb. 281 355 432 499 516 382 190 2,4% 2,0% 1,4% 0,3% -3,0% -6,7%
Power generation/District heating 63 111 119 145 179 96 8 5,9% 0,7% 2,0% 2,1% -6,0% -21,8%Industry 59 60 51 56 58 50 25 0,1% -1,5% 0,9% 0,3% -1,5% -6,6%Buildings 24 31 28 24 20 14 9 2,5% -1,1% -1,7% -1,8% -3,2% -4,3%Agriculture 5 7 9 11 8 6 4 2,6% 2,6% 2,0% -2,4% -3,8% -3,9%Transport 86 104 148 167 140 114 79 1,9% 3,7% 1,2% -1,8% -2,1% -3,6%Other 43 43 77 96 110 102 65 0,0% 6,1% 2,2% 1,4% -0,7% -4,5%
CO2 captured (CCS) 0 0 0 0 18 114 239 n.s. n.s. n.s. n.s. 20,1% 7,7%Coal 0 0 0 0 5 31 52 n.s. n.s. n.s. n.s. 19,8% 5,2%Gas 0 0 0 0 13 62 82 n.s. n.s. n.s. n.s. 16,9% 2,8%Biomass 0 0 0 0 0 21 105 n.s. n.s. n.s. 7,7% n.s. 17,6%
Energy Balance, by fuel (Mtoe)Primary Production 185 221 211 230 214 206 217 1,8% -0,5% 0,8% -0,7% -0,4% 0,5%
Coal 2 5 5 6 7 7 9 8,1% -0,5% 2,3% 1,6% 0,0% 2,3%Oil 145 170 146 128 98 54 32 1,6% -1,5% -1,3% -2,6% -5,7% -5,3%Natural gas 21 26 41 62 43 41 38 2,1% 4,6% 4,3% -3,6% -0,4% -0,8%Biomass 9 9 8 13 27 40 54 0,4% -0,6% 4,4% 7,5% 4,3% 2,9%Nuclear1 1 2 2 3 6 14 16 10,8% -3,3% 5,3% 9,3% 8,2% 1,2%Hydro 2 3 3 3 3 3 3 3,5% 1,1% 0,2% 0,2% 0,1% 0,1%Other renewables 4 5 6 15 29 45 65 1,5% 1,4% 9,6% 6,9% 4,6% 3,7%
Net Imports - 67 - 76 - 33 - 14 54 96 109Coal 1 2 4 4 5 5 6Oil - 69 - 80 - 49 - 26 - 12 16 22Natural gas 2 3 12 8 60 69 61Biomass 0 0 0 0 0 6 19Biofuels 0 0 0 0 0 1 1Electricity 0 0 0 0 0 0 0
Primary Energy Demand2 118 145 178 216 268 302 326 2,1% 2,1% 1,9% 2,2% 1,2% 0,7%Coal 3 7 9 10 13 12 15 7,3% 2,2% 1,8% 2,0% -0,4% 2,2%Oil 76 90 97 102 86 70 53 1,8% 0,8% 0,5% -1,7% -2,0% -2,7%Natural gas 23 29 53 70 104 110 99 2,3% 6,3% 2,8% 3,9% 0,6% -1,1%Biomass 9 9 8 13 27 46 73 0,4% -0,6% 4,4% 7,6% 5,6% 4,7%Nuclear1 1 2 2 3 6 14 16 10,8% -3,3% 5,3% 9,3% 8,2% 1,2%Hydro 2 3 3 3 3 3 3 3,5% 1,1% 0,2% 0,2% 0,1% 0,1%Other renewables 4 5 6 15 29 45 65 1,5% 1,4% 9,6% 6,9% 4,6% 3,7%
Primary Energy Demand, by sector (Mtoe)Primary Energy Demand 118 145 178 216 268 302 326 2,1% 2,1% 1,9% 2,2% 1,2% 0,7%Energy for Power Generation 28 48 55 76 118 154 191 5,5% 1,4% 3,3% 4,5% 2,7% 2,2%Other Transformation & Losses 13 15 27 40 66 89 114 1,2% 6,4% 3,9% 5,1% 3,0% 2,5%Energy Branch Consumption 11 16 24 30 39 41 38 3,1% 4,3% 2,2% 2,8% 0,5% -0,7%Final consumption 84 99 114 135 150 164 175 1,6% 1,4% 1,7% 1,1% 0,9% 0,6%
Steel, Non-Met. Minerals and Chem. 15 14 12 11 11 12 13 -0,5% -1,6% -0,7% -0,1% 1,0% 0,5%Other Industry 12 14 16 22 29 36 43 2,1% 1,0% 3,4% 2,8% 2,2% 1,7%Non-Energy Use 9 10 8 11 13 14 15 0,8% -1,9% 2,7% 1,7% 1,2% 0,1%Residential 16 18 18 19 20 22 22 1,4% -0,1% 0,5% 0,9% 0,6% 0,3%Services 2 3 5 6 10 13 16 4,7% 3,1% 3,3% 4,0% 2,7% 2,5%Agriculture 2 3 4 5 5 6 7 2,4% 2,2% 2,9% 1,5% 1,2% 1,1%Road 27 34 50 59 60 60 58 2,3% 4,0% 1,6% 0,1% 0,0% -0,3%Rail 1 1 1 1 1 1 1 -1,0% 0,5% 1,4% 1,6% 1,6% 1,5%Aviation 0 0 0 0 0 0 0 n.s. 1,1% 3,4% 2,5% 2,1% 0,7%Other Transport 0 1 1 1 1 1 1 11,4% -5,6% 1,9% 1,0% -0,7% -1,5%
1 Primary energy from nuclear is calculated considering the primary heat equivalent of the electricity produced with an average efficiency of 33%
73

GECO2015 Global Mitigation 150504 SUMMARY GHG & ENERGY BALANCE##### 100
Mexico 1990 2000 2010 2020 2030 2040 2050 '90-'00 '00-'10 '10-'20 '20-'30 '30-'40 '40-'50Power Generation
Fuel Inputs Therm. Power (Mtoe) 21 37 44 55 79 92 107 6,1% 1,6% 2,3% 3,7% 1,5% 1,6%Coal 2 4 7 9 10 9 12 10,0% 4,4% 2,2% 1,5% -0,9% 3,1%Oil 15 23 10 8 6 4 4 4,3% -7,9% -2,5% -2,5% -3,5% -1,8%Gas 3 9 25 37 59 66 63 9,7% 11,3% 3,8% 4,9% 1,0% -0,5%Biomass & Waste 0 1 1 1 2 11 26 n.s. 4,1% 0,7% 7,3% 15,9% 9,3%Other 0 1 1 1 1 2 2 1,4% 1,2% 3,3% 6,5% 2,3% 1,8%
Gross Elec. Generation (TWh e) 116 204 271 401 622 856 1 124 5,8% 2,9% 4,0% 4,5% 3,2% 2,8%Coal 8 19 33 41 48 44 60 9,6% 5,3% 2,4% 1,7% -0,9% 3,1%
of which CCS 0 0 0 0 6 35 59 n.s. n.s. n.s. n.s. 19,4% 5,3%Oil 62 94 44 33 26 18 15 4,3% -7,4% -2,8% -2,5% -3,5% -1,6%Gas 14 41 141 199 327 371 366 11,1% 13,0% 3,5% 5,1% 1,3% -0,1%
of which CCS 0 0 0 0 37 171 228 n.s. n.s. n.s. n.s. 16,6% 2,9%Biomass & Waste 0 2 3 3 9 50 130 n.s. 4,9% 0,7% 12,5% 18,3% 9,9%
of which CCS 0 0 0 0 0 20 86 n.s. n.s. n.s. n.s. n.s. 15,9%Nuclear 3 8 6 10 25 54 58 10,8% -3,3% 5,3% 9,6% 8,2% 0,7%Hydro 23 33 37 38 39 39 39 3,5% 1,1% 0,2% 0,2% 0,1% 0,1%Wind 0 0 1 55 96 161 231 34,2% 49,8% 48,2% 5,7% 5,3% 3,7%Solar 0 0 0 12 35 96 193 19,9% 15,1% n.s. 10,9% 10,7% 7,3%Other 5 6 7 9 17 22 30 1,4% 1,2% 3,3% 6,6% 2,6% 3,1%
Generation Capacity (GWe) 27 40 62 107 156 230 340 4,2% 4,5% 5,6% 3,8% 4,0% 4,0%Coal 1 3 5 6 7 6 9 8,0% 7,7% 1,3% 1,7% -2,0% 3,9%
of which CCS 0 0 0 0 1 5 9 n.s. n.s. n.s. n.s. 19,5% 6,2%Oil 12 13 10 8 4 3 4 0,7% -2,1% -3,0% -5,4% -3,6% 3,5%Gas 5 13 32 46 63 69 81 11,0% 9,5% 3,7% 3,1% 1,0% 1,5%
of which CCS 0 0 0 0 5 23 38 n.s. n.s. n.s. n.s. 17,2% 5,3%Biomass & Waste 0 0 0 0 1 7 18 n.s. 0,0% 0,0% 12,4% 18,2% 10,0%
of which CCS 0 0 0 0 0 3 11 n.s. n.s. n.s. n.s. n.s. 16,0%Nuclear 1 1 1 2 4 8 9 7,7% 0,0% 1,5% 9,4% 7,9% 0,5%Hydro 8 10 12 13 13 14 14 2,1% 1,8% 1,4% 0,2% 0,1% 0,1%Wind 0 0 1 24 41 68 96 n.s. n.s. 46,8% 5,4% 5,2% 3,5%Solar 0 0 0 7 20 53 107 19,9% 15,7% n.s. 10,8% 10,4% 7,3%Other 1 1 1 1 2 3 4 2,0% 1,2% 2,6% 5,9% 2,4% 3,1%
Total Final Consumption 2 (Mtoe) 84 99 114 135 150 164 175 1,6% 1,4% 1,7% 1,1% 0,9% 0,6%Coal 2 2 2 2 3 3 3 1,9% -0,4% -0,8% 3,8% 1,6% -1,1%Oil 51 62 74 78 66 55 41 1,9% 1,8% 0,5% -1,6% -1,9% -2,8%Gas 14 13 13 17 19 17 12 -0,9% -0,2% 3,2% 0,7% -0,8% -3,5%Electricity 9 14 18 27 42 58 77 4,9% 2,5% 4,1% 4,5% 3,4% 2,8%Heat 0 0 0 1 3 5 6 9,6% 10,4% 25,3% 10,0% 5,0% 3,1%Biomass & Other 9 8 7 10 18 27 36 -0,4% -1,2% 3,0% 6,3% 4,0% 3,1%Share of Renewables 3 (%) 14% 12% 10% 15% 24% 36% 50% -1,3% -2,0% 4,3% 4,6% 4,1% 3,4%
Industry (incl. non-energy use) 36 38 36 44 53 62 70 0,7% -0,6% 2,1% 1,8% 1,7% 1,2%Coal 2 2 2 2 3 3 3 1,9% -0,4% -0,8% 3,8% 1,6% -1,1%Oil 14 14 11 10 11 11 11 0,1% -2,2% -0,8% 0,5% 0,3% 0,0%Gas 13 12 12 15 15 14 10 -0,9% -0,4% 2,7% 0,0% -1,0% -3,5%Electricity 5 9 10 15 20 26 32 6,4% 1,5% 4,1% 3,1% 2,6% 2,1%Heat 0 0 0 0 0 0 0 n.s. 10,4% 0,0% -0,2% -0,3% -0,2%Biomass & Other 2 1 1 2 4 8 14 -3,4% -2,9% 4,9% 8,4% 8,2% 5,6%
Buildings 18 22 23 25 30 34 38 1,8% 0,4% 1,1% 1,8% 1,3% 1,1%Coal 0 0 0 0 0 0 0 n.s. n.s. n.s. n.s. n.s. n.s.Oil 7 9 8 6 4 2 1 2,8% -1,5% -3,1% -4,3% -6,1% -5,3%Gas 1 1 1 2 3 3 2 -1,6% 3,4% 8,0% 4,6% 0,2% -3,4%Electricity 3 5 7 10 14 18 23 3,2% 4,4% 3,5% 3,4% 2,6% 2,5%Heat 0 0 0 1 3 5 6 9,6% 10,4% 25,9% 10,0% 5,0% 3,1%Biomass & Other 7 7 6 6 6 6 5 0,3% -0,9% -0,4% 0,1% -0,1% -1,2%
Agriculture 2 3 4 5 5 6 7 2,4% 2,2% 2,9% 1,5% 1,2% 1,1%Coal 0 0 0 0 0 0 0 n.s. n.s. n.s. n.s. n.s. n.s.Oil 2 2 3 3 3 2 1 2,6% 2,6% 2,0% -2,4% -3,8% -3,9%Gas 0 0 0 0 0 0 0 n.s. n.s. n.s. n.s. n.s. n.s.Electricity 1 1 1 1 2 2 3 1,7% 0,9% 4,7% 3,9% 3,3% 2,6%Heat 0 0 0 0 0 0 0 n.s. n.s. n.s. n.s. n.s. n.s.Biomass & Other 0 0 0 0 1 2 3 n.s. n.s. n.s. 23,8% 6,4% 2,7%
Transport 29 36 52 61 62 62 60 2,4% 3,7% 1,6% 0,1% 0,0% -0,3%Coal 0 0 0 0 0 0 0 n.s. n.s. n.s. n.s. n.s. n.s.Oil 28 36 52 58 49 40 28 2,4% 3,7% 1,2% -1,8% -2,1% -3,6%Gas 0 0 0 0 0 0 0 n.s. n.s. n.s. n.s. n.s. n.s.Electricity 0 0 0 1 6 11 18 3,2% 1,5% 20,4% 23,4% 7,2% 4,7%Heat 0 0 0 0 0 0 0 n.s. n.s. n.s. n.s. n.s. n.s.Biomass & Other 0 0 0 2 7 10 14 n.s. n.s. 50,1% 13,6% 3,9% 2,9%
Energy Branch Consumption 11 16 24 30 39 41 38 3,1% 4,3% 2,2% 2,8% 0,5% -0,7%Other Transformation & Losses 4 13 15 27 40 66 89 114 1,2% 6,4% 3,9% 5,1% 3,0% 2,5%
2 does not include international aviation and maritime bunkers; includes non-energy uses3 ratio of renewable energy over final energy demand increased by distribution losses and self consumption of electricity and steam plants4 includes statistical differences
74

GECO2015 Global Mitigation 150504 SUMMARY GHG & ENERGY BALANCE##### 100
Rest Central America 1990 2000 2010 2020 2030 2040 2050 '90-'00 '00-'10 '10-'20 '20-'30 '30-'40 '40-'50Main Economic Indicators
Population (Million) 63 74 84 95 105 114 120 1,6% 1,3% 1,2% 1,0% 0,8% 0,6%GDP per capita (ppp, k$'05) 3 4 6 7 10 13 16 3,4% 3,5% 2,0% 2,7% 2,8% 2,7%GDP per capita (mer, k$'05) 2 2 2 3 4 5 7 2,2% 2,5% 2,1% 2,7% 2,8% 2,7%Share Value Added - Agriculture (%) 8 5 6 5 4 4 3 -3,9% 0,3% -1,1% -1,6% -1,2% -0,9%Share Value Added - Industry (%) 26 30 31 33 32 31 30 1,4% 0,6% 0,3% -0,2% -0,3% -0,4%Share Value Added - Services (%) 66 65 63 62 64 65 67 -0,2% -0,3% -0,1% 0,2% 0,2% 0,2%
PricesInternational/Regional ($'05/boe)
Coal 12 8 13 17 19 21 25 -4,2% 5,4% 2,9% 1,0% 1,0% 1,8%Oil 33 32 72 96 103 104 74 -0,2% 8,3% 2,9% 0,7% 0,1% -3,3%Gas 17 26 20 22 32 34 28 4,7% -2,6% 0,8% 4,0% 0,6% -2,1%
GHG emissions (Mt CO2 eq.)Total GHG (excl. LULUCF) 171 214 272 293 308 271 123 2,2% 2,4% 0,7% 0,5% -1,3% -7,6%CO2 101 140 185 203 233 220 93 3,4% 2,8% 0,9% 1,4% -0,6% -8,3%CH4 48 51 64 62 52 39 24 0,6% 2,3% -0,3% -1,7% -2,8% -4,7%N2O 23 23 22 26 22 12 6 -0,1% -0,3% 1,7% -1,7% -5,6% -7,1%F gases 0 0 1 2 1 0 0 n.s. 16,9% 3,1% -8,3% -18,9% -5,9%Total GHG from Energy and Industry 121 165 223 238 260 238 106 3,2% 3,0% 0,7% 0,9% -0,9% -7,8%CO2 Emissions from Fuel Comb. 92 126 162 175 200 183 63 3,2% 2,5% 0,8% 1,3% -0,9% -10,1%
Power generation/District heating 23 37 51 47 54 38 - 11 4,7% 3,4% -0,9% 1,4% -3,5% n.s.Industry 22 32 44 51 61 65 32 3,7% 3,1% 1,4% 1,8% 0,7% -6,8%Buildings 8 10 10 8 8 8 5 2,0% 0,0% -2,5% 0,3% 0,5% -5,1%Agriculture 5 3 2 2 2 2 1 -4,9% -3,7% 2,1% -0,6% -3,0% -3,8%Transport 22 32 41 50 56 53 36 3,7% 2,3% 2,1% 1,1% -0,5% -3,8%Other 11 12 14 18 19 18 0 0,7% 1,7% 2,0% 1,0% -0,9% -32,0%
CO2 captured (CCS) 0 0 0 0 2 25 86 n.s. n.s. n.s. n.s. 30,3% 13,4%Coal 0 0 0 0 1 12 19 n.s. n.s. n.s. n.s. 23,5% 5,1%Gas 0 0 0 0 0 4 7 n.s. n.s. n.s. n.s. 30,9% 4,4%Biomass 0 0 0 0 0 9 60 n.s. n.s. n.s. n.s. n.s. 21,5%
Energy Balance, by fuel (Mtoe)Primary Production 34 44 71 69 62 83 104 2,6% 5,0% -0,2% -1,2% 3,1% 2,3%
Coal 0 0 0 0 0 0 0 n.s. n.s. n.s. n.s. n.s. n.s.Oil 9 11 11 12 14 16 16 2,4% 0,3% 0,6% 2,0% 0,9% 0,0%Natural gas 5 13 37 26 2 3 3 10,9% 10,9% -3,4% -22,9% 4,4% 1,2%Biomass 19 16 18 21 28 40 53 -1,3% 0,7% 1,9% 2,7% 3,6% 3,0%Nuclear1 0 0 0 0 0 0 0 n.s. n.s. n.s. n.s. 29,7% 14,0%Hydro 1 1 2 2 2 2 3 2,7% 3,1% 0,7% 0,5% 0,5% 0,9%Other renewables 1 2 3 8 15 22 29 9,2% 6,0% 10,0% 7,0% 4,0% 2,6%
Net Imports 18 20 10 29 62 62 46Coal 0 0 1 3 7 11 8Oil 18 23 25 19 18 18 15Natural gas 0 - 3 - 16 8 38 38 26Biomass 0 0 0 - 1 - 2 - 4 - 4Biofuels 0 0 0 0 0 0 0Electricity 0 0 0 0 0 0 0
Primary Energy Demand2 51 64 81 98 124 146 150 2,2% 2,4% 1,9% 2,3% 1,7% 0,3%Coal 0 0 1 3 7 11 8 5,6% 11,5% 10,6% 8,8% 4,0% -2,7%Oil 26 34 36 31 33 34 31 2,7% 0,7% -1,7% 0,7% 0,3% -0,9%Natural gas 5 10 21 34 40 41 29 7,8% 7,7% 4,8% 1,5% 0,4% -3,4%Biomass 19 16 18 21 26 35 50 -1,3% 0,7% 1,7% 2,3% 3,1% 3,5%Nuclear1 0 0 0 0 0 0 0 n.s. n.s. n.s. n.s. 29,7% 14,0%Hydro 1 1 2 2 2 2 3 2,7% 3,1% 0,7% 0,5% 0,5% 0,9%Other renewables 1 2 3 8 15 22 29 9,2% 6,0% 10,0% 7,0% 4,0% 2,6%
Primary Energy Demand, by sector (Mtoe)Primary Energy Demand 51 64 81 98 124 146 150 2,2% 2,4% 1,9% 2,3% 1,7% 0,3%Energy for Power Generation 11 16 24 29 40 52 62 4,3% 4,1% 1,9% 3,2% 2,6% 1,7%Other Transformation & Losses 8 9 10 13 20 31 42 1,0% 0,4% 2,9% 4,8% 4,3% 3,2%Energy Branch Consumption 2 2 5 6 8 8 6 2,4% 7,5% 3,2% 1,5% 0,6% -2,4%Final consumption 39 47 58 71 87 102 104 2,1% 2,1% 2,0% 2,0% 1,6% 0,2%
Steel, Non-Met. Minerals and Chem. 0 1 1 1 0 0 0 6,4% 4,9% -5,2% -3,8% -1,0% -1,3%Other Industry 13 13 13 15 20 25 27 0,3% -0,4% 1,5% 2,9% 2,3% 0,8%Non-Energy Use 3 6 11 16 20 25 27 8,0% 6,9% 3,8% 2,6% 2,3% 0,6%Residential 11 14 16 18 19 19 17 2,0% 1,7% 1,0% 0,5% 0,1% -1,0%Services 2 2 3 4 5 6 8 1,9% 4,7% 1,5% 3,2% 2,7% 1,9%Agriculture 2 1 1 1 1 1 2 -4,5% -1,7% 2,1% 1,5% 1,3% 1,2%Road 8 11 13 16 20 23 22 3,7% 1,5% 2,5% 2,3% 1,2% -0,4%Rail 0 0 0 0 0 0 0 -8,6% 41,3% 0,5% 0,7% 0,6% 0,2%Aviation 0 0 0 0 0 0 0 2,6% 2,6% 4,0% 3,7% 3,4% 1,1%Other Transport 1 0 0 1 1 1 1 -6,3% 2,5% 1,8% 2,5% 1,5% -1,0%
1 Primary energy from nuclear is calculated considering the primary heat equivalent of the electricity produced with an average efficiency of 33%
75

GECO2015 Global Mitigation 150504 SUMMARY GHG & ENERGY BALANCE##### 100
Rest Central America 1990 2000 2010 2020 2030 2040 2050 '90-'00 '00-'10 '10-'20 '20-'30 '30-'40 '40-'50Power Generation
Fuel Inputs Therm. Power (Mtoe) 9 13 20 20 23 27 30 4,0% 3,9% 0,0% 1,6% 1,8% 0,9%Coal 0 0 1 2 4 5 4 33,6% 14,9% 8,5% 7,4% 3,8% -1,4%Oil 6 10 13 7 6 5 4 4,4% 2,3% -5,8% -1,6% -2,2% -2,6%Gas 1 2 4 8 10 10 8 5,6% 6,9% 7,8% 2,4% 0,3% -3,0%Biomass & Waste 1 1 2 3 3 6 13 -1,7% 7,1% 1,2% 0,0% 8,9% 8,1%Other 0 0 0 1 1 1 1 9,1% 5,5% 8,3% 5,5% 1,6% -0,6%
Gross Elec. Generation (TWh e) 42 68 95 118 170 254 345 4,9% 3,4% 2,2% 3,7% 4,1% 3,1%Coal 0 1 3 8 17 25 22 33,5% 14,9% 9,8% 8,1% 3,8% -1,4%
of which CCS 0 0 0 0 2 14 21 n.s. n.s. n.s. n.s. 22,6% 4,2%Oil 24 40 48 30 25 20 15 5,4% 1,7% -4,5% -1,7% -2,2% -2,7%Gas 4 7 14 38 51 55 41 6,5% 7,6% 10,6% 3,0% 0,7% -3,1%
of which CCS 0 0 0 0 1 12 18 n.s. n.s. n.s. n.s. 31,2% 4,5%Biomass & Waste 2 2 4 5 7 27 65 2,1% 7,5% 2,0% 3,2% 15,2% 9,2%
of which CCS 0 0 0 0 0 9 43 n.s. n.s. n.s. n.s. n.s. 17,4%Nuclear 0 0 0 0 0 0 0 n.s. n.s. n.s. n.s. n.s. n.s.Hydro 13 17 23 24 25 27 29 2,7% 3,1% 0,7% 0,5% 0,5% 0,9%Wind 0 0 0 4 22 45 66 n.s. 10,3% 24,6% 17,5% 7,5% 3,9%Solar 0 0 0 1 9 39 91 n.s. -7,8% n.s. 21,2% 15,7% 8,7%Other 1 2 3 7 13 15 16 9,1% 5,5% 8,3% 5,5% 1,8% 0,7%
Generation Capacity (GWe) 13 19 25 33 47 77 118 3,8% 3,1% 2,8% 3,4% 5,1% 4,4%Coal 0 0 0 1 2 4 4 5,6% 1,1% 8,3% 8,3% 4,2% 2,1%
of which CCS 0 0 0 0 0 2 4 n.s. n.s. n.s. n.s. 23,0% 8,4%Oil 8 12 16 15 12 10 5 4,2% 2,9% -0,4% -2,1% -2,5% -7,1%Gas 1 2 2 7 9 10 10 1,7% 4,3% 10,7% 2,5% 1,8% -0,5%
of which CCS 0 0 0 0 0 2 4 n.s. n.s. n.s. n.s. 31,8% 9,0%Biomass & Waste 0 0 1 1 1 4 11 8,1% 4,0% 0,0% 2,6% 15,1% 11,0%
of which CCS 0 0 0 0 0 1 7 n.s. n.s. n.s. n.s. n.s. 19,0%Nuclear 0 0 0 0 0 0 0 n.s. n.s. n.s. n.s. n.s. n.s.Hydro 3 4 5 6 6 6 7 2,3% 2,9% 1,4% 0,5% 0,5% 0,9%Wind 0 0 0 2 9 19 27 n.s. 13,3% 23,8% 17,3% 7,4% 3,7%Solar 0 0 0 1 5 23 53 n.s. -3,4% 52,4% 20,8% 15,3% 8,9%Other 0 0 0 1 2 2 3 9,1% 2,3% 8,1% 5,2% 1,2% 2,1%
Total Final Consumption 2 (Mtoe) 39 47 58 71 87 102 104 2,1% 2,1% 2,0% 2,0% 1,6% 0,2%Coal 0 0 0 1 4 6 4 -1,1% 7,4% 13,7% 10,4% 4,2% -4,2%Oil 17 21 22 22 26 28 26 2,2% 0,8% 0,1% 1,3% 0,8% -0,6%Gas 3 7 14 21 23 24 17 10,0% 6,7% 3,8% 1,2% 0,3% -3,6%Electricity 3 5 7 9 12 18 25 4,6% 3,9% 2,2% 3,7% 4,2% 3,3%Heat 0 0 0 1 2 3 4 n.s. n.s. n.s. 6,7% 3,6% 3,2%Biomass & Other 16 14 14 17 20 23 29 -1,0% 0,0% 1,5% 1,8% 1,5% 2,1%Share of Renewables 3 (%) 46% 37% 34% 36% 40% 47% 65% -2,2% -0,7% 0,6% 0,9% 1,7% 3,3%
Industry (incl. non-energy use) 16 20 25 31 40 50 54 2,1% 2,4% 2,3% 2,6% 2,3% 0,7%Coal 0 0 0 1 4 6 4 -1,1% 7,4% 13,7% 10,4% 4,2% -4,2%Oil 6 6 6 4 6 9 14 1,0% -0,5% -3,5% 3,7% 4,7% 4,0%Gas 3 7 14 20 22 22 16 10,0% 6,8% 3,5% 0,9% 0,1% -3,4%Electricity 1 2 2 3 5 6 8 4,5% 2,7% 3,6% 3,9% 3,3% 2,5%Heat 0 0 0 0 0 0 0 n.s. n.s. n.s. n.s. n.s. n.s.Biomass & Other 6 4 2 3 4 7 13 -3,8% -6,6% 2,0% 5,1% 5,3% 6,2%
Buildings 13 15 19 21 24 25 25 2,0% 2,1% 1,1% 1,0% 0,7% -0,2%Coal 0 0 0 0 0 0 0 n.s. n.s. n.s. n.s. n.s. n.s.Oil 2 3 3 2 1 1 1 1,8% 0,1% -5,1% -2,9% -2,2% -5,4%Gas 0 0 0 1 2 2 1 11,9% -2,5% 19,2% 6,3% 2,9% -5,0%Electricity 2 3 4 5 6 8 10 4,8% 4,2% 1,3% 2,2% 2,4% 2,4%Heat 0 0 0 1 2 3 4 n.s. n.s. n.s. 6,7% 3,6% 3,2%Biomass & Other 8 9 12 13 13 12 9 1,2% 2,1% 0,9% -0,1% -0,8% -2,1%
Agriculture 2 1 1 1 1 1 2 -4,5% -1,7% 2,1% 1,5% 1,3% 1,2%Coal 0 0 0 0 0 0 0 n.s. n.s. n.s. n.s. n.s. n.s.Oil 1 1 1 1 1 1 0 -4,9% -3,7% 2,1% -0,6% -3,0% -3,8%Gas 0 0 0 0 0 0 0 n.s. n.s. n.s. n.s. n.s. n.s.Electricity 0 0 0 0 0 0 1 -1,4% 13,7% 2,3% 3,2% 3,6% 3,0%Heat 0 0 0 0 0 0 0 n.s. n.s. n.s. n.s. n.s. n.s.Biomass & Other 0 0 0 0 0 0 1 3,4% -2,5% 1,2% 14,4% 8,9% 3,9%
Transport 8 11 14 17 22 25 24 3,1% 1,7% 2,5% 2,3% 1,2% -0,4%Coal 0 0 0 0 0 0 0 n.s. n.s. n.s. n.s. n.s. n.s.Oil 7 11 13 16 18 17 11 4,2% 1,9% 2,1% 1,1% -0,5% -3,8%Gas 0 0 0 0 0 0 0 n.s. n.s. n.s. n.s. n.s. n.s.Electricity 0 0 0 0 1 4 6 -0,7% 10,0% 10,0% 33,2% 13,5% 6,1%Heat 0 0 0 0 0 0 0 n.s. n.s. n.s. n.s. n.s. n.s.Biomass & Other 1 1 1 1 3 4 6 -4,9% -0,9% 6,7% 7,5% 3,3% 3,4%
Energy Branch Consumption 2 2 5 6 8 8 6 2,4% 7,5% 3,2% 1,5% 0,6% -2,4%Other Transformation & Losses 4 8 9 10 13 20 31 42 1,0% 0,4% 2,9% 4,8% 4,3% 3,2%
2 does not include international aviation and maritime bunkers; includes non-energy uses3 ratio of renewable energy over final energy demand increased by distribution losses and self consumption of electricity and steam plants4 includes statistical differences
76

GECO2015 Global Mitigation 150504 SUMMARY GHG & ENERGY BALANCE##### 100
Brazil 1990 2000 2010 2020 2030 2040 2050 '90-'00 '00-'10 '10-'20 '20-'30 '30-'40 '40-'50Main Economic Indicators
Population (Million) 150 175 195 211 223 229 231 1,5% 1,1% 0,8% 0,5% 0,3% 0,1%GDP per capita (ppp, k$'05) 7 8 10 12 16 21 25 1,0% 2,5% 2,0% 2,8% 2,5% 2,1%GDP per capita (mer, k$'05) 4 4 6 7 9 12 14 1,0% 2,5% 2,0% 2,8% 2,5% 2,1%Share Value Added - Agriculture (%) 8 6 5 5 5 4 4 -3,6% -0,5% -0,5% -1,0% -0,7% -0,4%Share Value Added - Industry (%) 39 28 28 27 25 22 20 -3,3% 0,1% -0,4% -0,8% -1,1% -1,2%Share Value Added - Services (%) 53 67 67 68 71 73 76 2,3% 0,0% 0,2% 0,4% 0,4% 0,4%
PricesInternational/Regional ($'05/boe)
Coal 12 8 13 17 19 21 25 -4,2% 5,4% 2,9% 1,0% 1,0% 1,8%Oil 33 32 72 96 103 104 74 -0,2% 8,3% 2,9% 0,7% 0,1% -3,3%Gas 17 26 20 22 32 34 28 4,7% -2,6% 0,8% 4,0% 0,6% -2,1%
GHG emissions (Mt CO2 eq.)Total GHG (excl. LULUCF) 584 795 1 056 1 205 991 825 403 3,1% 2,9% 1,3% -1,9% -1,8% -6,9%CO2 217 335 434 560 547 468 136 4,4% 2,6% 2,6% -0,2% -1,6% -11,6%CH4 261 328 443 443 308 258 202 2,3% 3,0% 0,0% -3,6% -1,8% -2,4%N2O 97 127 170 193 136 99 64 2,8% 2,9% 1,3% -3,4% -3,1% -4,2%F gases 8 4 9 9 0 0 0 -6,2% 7,6% -0,5% -26,5% -7,1% -5,9%Total GHG from Energy and Industry 301 444 574 685 613 507 165 4,0% 2,6% 1,8% -1,1% -1,9% -10,6%CO2 Emissions from Fuel Comb. 187 297 387 507 494 417 97 4,7% 2,7% 2,7% -0,3% -1,7% -13,6%
Power generation/District heating 10 27 40 13 19 18 - 37 10,6% 4,0% -10,4% 3,8% -0,6% n.s.Industry 48 78 94 126 134 129 59 4,9% 1,9% 2,9% 0,7% -0,4% -7,4%Buildings 20 25 23 24 19 11 7 2,2% -0,6% 0,2% -2,3% -4,9% -5,3%Agriculture 10 15 19 20 15 10 6 3,5% 2,5% 0,8% -2,9% -4,3% -4,4%Transport 80 125 174 272 255 219 127 4,6% 3,4% 4,6% -0,7% -1,5% -5,3%Other 19 27 37 52 52 30 - 65 3,7% 3,0% 3,5% 0,1% -5,2% n.s.
CO2 captured (CCS) 0 0 0 0 5 58 221 n.s. n.s. n.s. n.s. 27,4% 14,3%Coal 0 0 0 0 3 22 29 n.s. n.s. n.s. n.s. 20,2% 2,9%Gas 0 0 0 0 2 6 9 n.s. n.s. n.s. n.s. 12,8% 4,5%Biomass 0 0 0 0 0 31 183 n.s. n.s. n.s. n.s. n.s. 19,5%
Energy Balance, by fuel (Mtoe)Primary Production 95 143 240 365 550 675 842 4,1% 5,3% 4,3% 4,2% 2,1% 2,2%
Coal 1 2 2 2 2 2 2 8,3% -4,7% 1,9% -1,3% 1,7% -1,3%Oil 32 63 105 188 175 134 89 6,9% 5,3% 6,0% -0,7% -2,6% -4,1%Natural gas 3 6 12 23 41 47 42 6,4% 7,4% 6,9% 5,8% 1,4% -1,0%Biomass 41 44 82 90 247 371 561 0,7% 6,5% 1,0% 10,6% 4,1% 4,2%Nuclear1 1 2 4 4 13 25 31 10,5% 9,2% 1,3% 11,7% 6,6% 2,1%Hydro 18 26 35 50 56 59 60 3,9% 2,9% 3,7% 1,1% 0,6% 0,2%Other renewables 0 0 1 7 17 37 57 n.s. 33,4% 28,7% 9,2% 8,3% 4,6%
Net Imports 37 42 23 - 44 - 147 - 205 - 343Coal 7 11 13 13 10 11 9Oil 27 25 - 1 - 51 - 48 - 26 - 20Natural gas 0 2 9 4 - 1 5 - 2Biomass 0 0 0 - 13 - 103 - 180 - 309Biofuels 1 0 - 1 - 1 - 8 - 18 - 24Electricity 2 4 3 3 3 3 3
Primary Energy Demand2 132 184 263 320 404 469 499 3,3% 3,6% 2,0% 2,3% 1,5% 0,6%Coal 8 13 14 15 12 13 10 4,9% 1,0% 0,3% -2,4% 1,1% -2,4%Oil 59 88 105 137 128 109 69 4,1% 1,7% 2,8% -0,7% -1,6% -4,5%Natural gas 3 8 21 28 40 51 41 8,8% 10,8% 2,6% 3,8% 2,5% -2,3%Biomass 41 44 82 77 144 190 252 0,7% 6,5% -0,6% 6,4% 2,8% 2,9%Nuclear1 1 2 4 4 13 25 31 10,5% 9,2% 1,3% 11,7% 6,6% 2,1%Hydro 18 26 35 50 56 59 60 3,9% 2,9% 3,7% 1,1% 0,6% 0,2%Other renewables 0 0 1 7 17 37 57 n.s. 33,4% 28,7% 9,2% 8,3% 4,6%
Primary Energy Demand, by sector (Mtoe)Primary Energy Demand 132 184 263 320 404 469 499 3,3% 3,6% 2,0% 2,3% 1,5% 0,6%Energy for Power Generation 22 37 58 68 104 148 192 5,5% 4,6% 1,5% 4,3% 3,6% 2,7%Other Transformation & Losses 30 42 74 84 152 217 271 3,2% 5,9% 1,3% 6,2% 3,6% 2,3%Energy Branch Consumption 6 8 13 18 20 20 17 3,4% 4,3% 3,5% 0,8% 0,3% -2,0%Final consumption 115 156 213 272 312 342 349 3,1% 3,1% 2,5% 1,4% 0,9% 0,2%
Steel, Non-Met. Minerals and Chem. 22 28 32 35 32 32 31 2,6% 1,5% 0,8% -0,8% -0,1% -0,3%Other Industry 21 32 51 66 87 103 113 3,9% 4,9% 2,5% 2,8% 1,7% 0,9%Non-Energy Use 10 13 17 21 24 25 23 3,3% 2,3% 2,5% 1,0% 0,5% -0,6%Residential 18 21 24 27 29 31 31 1,4% 1,4% 1,2% 0,7% 0,7% 0,2%Services 5 8 11 15 20 27 33 5,2% 2,7% 3,5% 3,1% 2,8% 2,2%Agriculture 6 7 10 11 12 13 13 2,0% 3,1% 1,1% 0,7% 0,6% 0,5%Road 29 43 63 89 99 102 94 3,8% 4,0% 3,5% 1,1% 0,2% -0,8%Rail 1 1 1 1 1 2 2 -2,0% 7,6% 2,0% 0,9% 0,7% 0,3%Aviation 2 3 3 5 6 7 6 5,1% 0,2% 5,3% 1,2% 1,1% -0,4%Other Transport 1 1 1 2 2 2 2 -1,6% 4,1% 3,2% 0,9% -0,7% -1,7%
1 Primary energy from nuclear is calculated considering the primary heat equivalent of the electricity produced with an average efficiency of 33%
77

GECO2015 Global Mitigation 150504 SUMMARY GHG & ENERGY BALANCE##### 100
Brazil 1990 2000 2010 2020 2030 2040 2050 '90-'00 '00-'10 '10-'20 '20-'30 '30-'40 '40-'50Power Generation
Fuel Inputs Therm. Power (Mtoe) 4 10 19 7 18 27 43 10,5% 7,4% -9,9% 10,4% 3,8% 5,0%Coal 1 3 3 1 1 4 4 8,3% -0,2% -14,1% 4,9% 13,8% 0,5%Oil 1 4 4 0 0 0 0 11,9% -0,2% -53,7% n.s. n.s. n.s.Gas 0 1 7 5 8 14 15 28,1% 22,8% -3,6% 6,2% 5,1% 1,0%Biomass & Waste 1 2 6 2 9 9 24 7,7% 14,0% -12,3% 19,0% 0,0% 10,4%Other 0 0 0 0 0 0 0 n.s. n.s. n.s. n.s. n.s. n.s.
Gross Elec. Generation (TWh e) 223 349 515 700 960 1 300 1 659 4,6% 4,0% 3,1% 3,2% 3,1% 2,5%Coal 5 11 11 3 5 19 20 8,8% 0,3% -13,7% 6,8% 14,2% 0,8%
of which CCS 0 0 0 0 3 17 20 n.s. n.s. n.s. n.s. 17,5% 1,4%Oil 5 15 16 0 0 0 0 11,9% 0,6% -53,4% n.s. n.s. n.s.Gas 0 4 36 26 49 81 91 28,7% 24,5% -3,2% 6,4% 5,1% 1,2%
of which CCS 0 0 0 0 5 15 24 n.s. n.s. n.s. n.s. 12,7% 4,7%Biomass & Waste 4 8 32 7 38 40 117 7,4% 14,9% -14,4% 19,1% 0,5% 11,2%
of which CCS 0 0 0 0 0 13 81 n.s. n.s. n.s. n.s. n.s. 20,5%Nuclear 2 6 15 17 52 100 119 10,5% 9,2% 1,3% 12,2% 6,6% 1,8%Hydro 207 304 403 581 650 690 703 3,9% 2,9% 3,7% 1,1% 0,6% 0,2%Wind 0 0 2 62 134 255 357 n.s. n.s. 40,6% 7,9% 6,7% 3,4%Solar 0 0 0 4 32 113 246 n.s. n.s. n.s. 21,9% 13,6% 8,1%Other 0 0 0 0 0 1 5 n.s. n.s. n.s. 28,5% 16,3% 13,8%
Generation Capacity (GWe) 53 74 112 232 328 466 610 3,3% 4,3% 7,5% 3,5% 3,6% 2,7%Coal 1 1 2 3 4 6 10 3,0% 1,6% 5,5% 4,2% 3,6% 5,9%
of which CCS 0 0 0 0 1 5 10 n.s. n.s. n.s. n.s. 23,1% 8,1%Oil 4 6 8 11 14 14 11 3,5% 2,9% 3,2% 2,5% 0,1% -3,1%Gas 0 1 11 31 49 52 53 12,0% 23,2% 10,5% 4,9% 0,5% 0,3%
of which CCS 0 0 0 0 1 6 13 n.s. n.s. n.s. n.s. 20,2% 8,3%Biomass & Waste 1 2 8 37 47 63 71 5,1% 16,0% 16,9% 2,3% 3,1% 1,2%
of which CCS 0 0 0 0 0 2 14 n.s. n.s. n.s. n.s. n.s. 23,8%Nuclear 1 2 2 2 7 13 15 11,8% 0,0% 0,4% 12,2% 6,6% 1,7%Hydro 46 61 81 116 130 138 140 3,0% 2,8% 3,7% 1,1% 0,6% 0,2%Wind 0 0 1 29 56 105 145 n.s. 46,8% 41,2% 6,7% 6,6% 3,3%Solar 0 0 0 3 21 75 163 n.s. n.s. n.s. 21,5% 13,4% 8,1%Other 0 0 0 0 0 0 1 n.s. n.s. n.s. 27,8% 15,7% 13,2%
Total Final Consumption 2 (Mtoe) 115 156 213 272 312 342 349 3,1% 3,1% 2,5% 1,4% 0,9% 0,2%Coal 6 9 11 13 10 9 6 3,5% 2,3% 1,6% -2,7% -1,2% -4,0%Oil 53 79 94 130 120 103 66 4,1% 1,6% 3,3% -0,7% -1,6% -4,3%Gas 2 5 11 18 24 29 20 6,6% 8,8% 5,2% 3,2% 1,9% -3,8%Electricity 18 28 38 50 68 92 118 4,3% 3,1% 2,9% 3,2% 3,1% 2,5%Heat 0 0 0 1 2 5 5 n.s. 28,4% 11,4% 7,8% 7,8% 1,1%Biomass & Other 35 36 60 61 87 104 134 0,3% 5,3% 0,2% 3,6% 1,7% 2,6%Share of Renewables 3 (%) 49% 42% 47% 44% 53% 60% 74% -1,5% 1,2% -0,6% 1,8% 1,2% 2,1%
Industry (incl. non-energy use) 53 73 100 122 143 160 167 3,3% 3,2% 2,0% 1,6% 1,1% 0,5%Coal 6 9 11 13 10 9 6 3,6% 2,3% 1,6% -2,7% -1,2% -4,0%Oil 17 26 27 32 32 30 23 4,4% 0,3% 1,9% 0,0% -0,8% -2,4%Gas 2 4 10 17 22 27 19 7,0% 8,8% 5,0% 3,0% 2,1% -3,8%Electricity 10 13 17 23 30 37 42 2,7% 3,3% 2,7% 2,9% 2,0% 1,2%Heat 0 0 0 0 0 0 0 n.s. n.s. n.s. n.s. n.s. n.s.Biomass & Other 18 21 35 38 48 57 78 1,8% 5,2% 0,8% 2,5% 1,8% 3,2%
Buildings 23 29 34 42 49 57 65 2,3% 1,7% 2,0% 1,6% 1,6% 1,2%Coal 0 0 0 0 0 0 0 n.s. n.s. n.s. n.s. n.s. n.s.Oil 6 8 7 7 4 2 1 2,2% -0,9% -0,6% -3,9% -6,8% -6,7%Gas 0 0 0 1 2 2 1 1,9% 7,3% 9,6% 5,2% -0,7% -3,5%Electricity 8 14 19 25 32 41 49 5,9% 3,0% 3,0% 2,6% 2,5% 2,0%Heat 0 0 0 1 2 5 5 n.s. 28,4% 11,4% 7,8% 7,8% 1,1%Biomass & Other 9 7 8 8 8 8 7 -2,1% 1,1% 0,0% 0,3% -0,7% -0,3%
Agriculture 6 7 10 11 12 13 13 2,0% 3,1% 1,1% 0,7% 0,6% 0,5%Coal 0 0 0 0 0 0 0 n.s. n.s. n.s. n.s. n.s. n.s.Oil 3 5 6 6 5 3 2 3,5% 2,5% 0,8% -2,9% -4,3% -4,4%Gas 0 0 0 0 0 0 0 n.s. n.s. -2,0% -2,0% -3,0% n.s.Electricity 1 1 2 2 3 3 4 6,8% 3,2% 2,7% 3,1% 2,7% 2,0%Heat 0 0 0 0 0 0 0 n.s. n.s. n.s. n.s. n.s. n.s.Biomass & Other 2 2 3 3 5 6 7 -2,8% 4,4% 0,9% 5,1% 3,0% 1,5%
Transport 33 47 69 98 109 112 104 3,7% 3,8% 3,6% 1,1% 0,3% -0,7%Coal 0 0 0 0 0 0 0 n.s. n.s. n.s. n.s. n.s. n.s.Oil 27 41 54 85 79 68 40 4,5% 2,7% 4,6% -0,7% -1,5% -5,3%Gas 0 0 0 0 0 0 0 n.s. n.s. n.s. n.s. n.s. n.s.Electricity 0 0 0 0 3 11 23 0,5% 2,9% 6,5% 27,9% 13,4% 7,4%Heat 0 0 0 0 0 0 0 n.s. n.s. n.s. n.s. n.s. n.s.Biomass & Other 6 6 15 13 26 33 42 -0,3% 9,3% -1,3% 7,5% 2,1% 2,4%
Energy Branch Consumption 6 8 13 18 20 20 17 3,4% 4,3% 3,5% 0,8% 0,3% -2,0%Other Transformation & Losses 4 30 42 74 84 152 217 271 3,2% 5,9% 1,3% 6,2% 3,6% 2,3%
2 does not include international aviation and maritime bunkers; includes non-energy uses3 ratio of renewable energy over final energy demand increased by distribution losses and self consumption of electricity and steam plants4 includes statistical differences
78
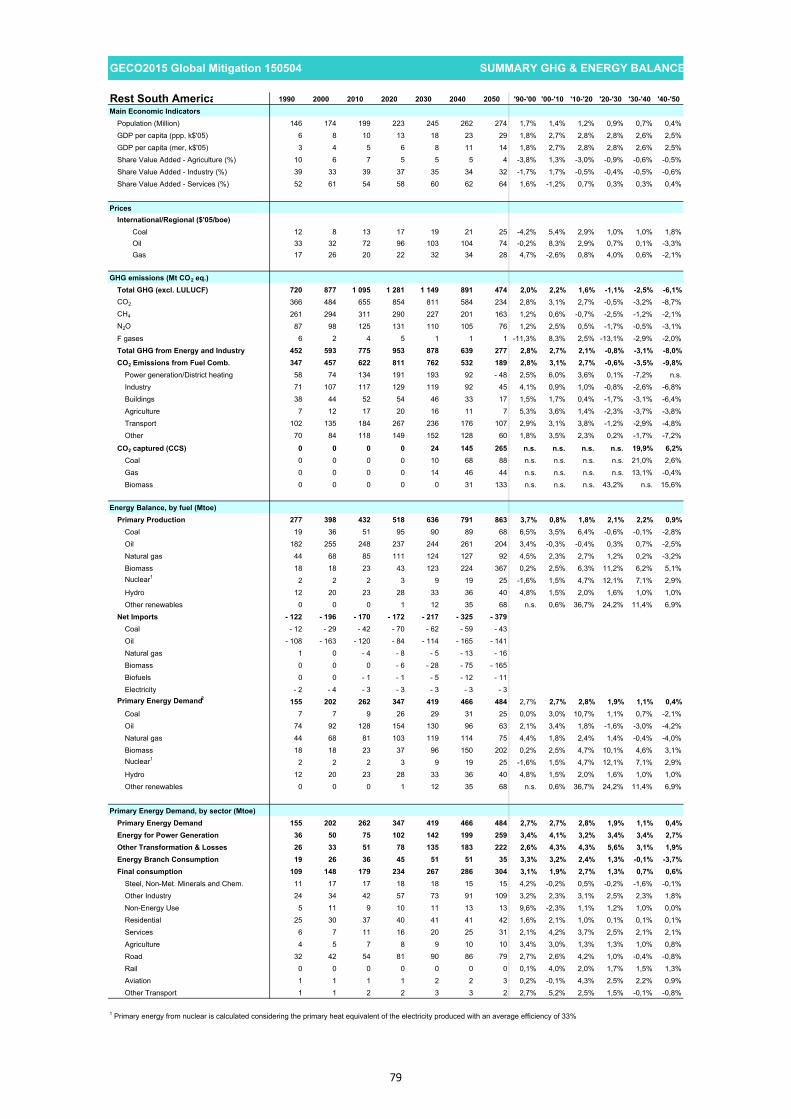
GECO2015 Global Mitigation 150504 SUMMARY GHG & ENERGY BALANCE##### 100
Rest South America 1990 2000 2010 2020 2030 2040 2050 '90-'00 '00-'10 '10-'20 '20-'30 '30-'40 '40-'50Main Economic Indicators
Population (Million) 146 174 199 223 245 262 274 1,7% 1,4% 1,2% 0,9% 0,7% 0,4%GDP per capita (ppp, k$'05) 6 8 10 13 18 23 29 1,8% 2,7% 2,8% 2,8% 2,6% 2,5%GDP per capita (mer, k$'05) 3 4 5 6 8 11 14 1,8% 2,7% 2,8% 2,8% 2,6% 2,5%Share Value Added - Agriculture (%) 10 6 7 5 5 5 4 -3,8% 1,3% -3,0% -0,9% -0,6% -0,5%Share Value Added - Industry (%) 39 33 39 37 35 34 32 -1,7% 1,7% -0,5% -0,4% -0,5% -0,6%Share Value Added - Services (%) 52 61 54 58 60 62 64 1,6% -1,2% 0,7% 0,3% 0,3% 0,4%
PricesInternational/Regional ($'05/boe)
Coal 12 8 13 17 19 21 25 -4,2% 5,4% 2,9% 1,0% 1,0% 1,8%Oil 33 32 72 96 103 104 74 -0,2% 8,3% 2,9% 0,7% 0,1% -3,3%Gas 17 26 20 22 32 34 28 4,7% -2,6% 0,8% 4,0% 0,6% -2,1%
GHG emissions (Mt CO2 eq.)Total GHG (excl. LULUCF) 720 877 1 095 1 281 1 149 891 474 2,0% 2,2% 1,6% -1,1% -2,5% -6,1%CO2 366 484 655 854 811 584 234 2,8% 3,1% 2,7% -0,5% -3,2% -8,7%CH4 261 294 311 290 227 201 163 1,2% 0,6% -0,7% -2,5% -1,2% -2,1%N2O 87 98 125 131 110 105 76 1,2% 2,5% 0,5% -1,7% -0,5% -3,1%F gases 6 2 4 5 1 1 1 -11,3% 8,3% 2,5% -13,1% -2,9% -2,0%Total GHG from Energy and Industry 452 593 775 953 878 639 277 2,8% 2,7% 2,1% -0,8% -3,1% -8,0%CO2 Emissions from Fuel Comb. 347 457 622 811 762 532 189 2,8% 3,1% 2,7% -0,6% -3,5% -9,8%
Power generation/District heating 58 74 134 191 193 92 - 48 2,5% 6,0% 3,6% 0,1% -7,2% n.s.Industry 71 107 117 129 119 92 45 4,1% 0,9% 1,0% -0,8% -2,6% -6,8%Buildings 38 44 52 54 46 33 17 1,5% 1,7% 0,4% -1,7% -3,1% -6,4%Agriculture 7 12 17 20 16 11 7 5,3% 3,6% 1,4% -2,3% -3,7% -3,8%Transport 102 135 184 267 236 176 107 2,9% 3,1% 3,8% -1,2% -2,9% -4,8%Other 70 84 118 149 152 128 60 1,8% 3,5% 2,3% 0,2% -1,7% -7,2%
CO2 captured (CCS) 0 0 0 0 24 145 265 n.s. n.s. n.s. n.s. 19,9% 6,2%Coal 0 0 0 0 10 68 88 n.s. n.s. n.s. n.s. 21,0% 2,6%Gas 0 0 0 0 14 46 44 n.s. n.s. n.s. n.s. 13,1% -0,4%Biomass 0 0 0 0 0 31 133 n.s. n.s. n.s. 43,2% n.s. 15,6%
Energy Balance, by fuel (Mtoe)Primary Production 277 398 432 518 636 791 863 3,7% 0,8% 1,8% 2,1% 2,2% 0,9%
Coal 19 36 51 95 90 89 68 6,5% 3,5% 6,4% -0,6% -0,1% -2,8%Oil 182 255 248 237 244 261 204 3,4% -0,3% -0,4% 0,3% 0,7% -2,5%Natural gas 44 68 85 111 124 127 92 4,5% 2,3% 2,7% 1,2% 0,2% -3,2%Biomass 18 18 23 43 123 224 367 0,2% 2,5% 6,3% 11,2% 6,2% 5,1%Nuclear1 2 2 2 3 9 19 25 -1,6% 1,5% 4,7% 12,1% 7,1% 2,9%Hydro 12 20 23 28 33 36 40 4,8% 1,5% 2,0% 1,6% 1,0% 1,0%Other renewables 0 0 0 1 12 35 68 n.s. 0,6% 36,7% 24,2% 11,4% 6,9%
Net Imports - 122 - 196 - 170 - 172 - 217 - 325 - 379Coal - 12 - 29 - 42 - 70 - 62 - 59 - 43Oil - 108 - 163 - 120 - 84 - 114 - 165 - 141Natural gas 1 0 - 4 - 8 - 5 - 13 - 16Biomass 0 0 0 - 6 - 28 - 75 - 165Biofuels 0 0 - 1 - 1 - 5 - 12 - 11Electricity - 2 - 4 - 3 - 3 - 3 - 3 - 3
Primary Energy Demand2 155 202 262 347 419 466 484 2,7% 2,7% 2,8% 1,9% 1,1% 0,4%Coal 7 7 9 26 29 31 25 0,0% 3,0% 10,7% 1,1% 0,7% -2,1%Oil 74 92 128 154 130 96 63 2,1% 3,4% 1,8% -1,6% -3,0% -4,2%Natural gas 44 68 81 103 119 114 75 4,4% 1,8% 2,4% 1,4% -0,4% -4,0%Biomass 18 18 23 37 96 150 202 0,2% 2,5% 4,7% 10,1% 4,6% 3,1%Nuclear1 2 2 2 3 9 19 25 -1,6% 1,5% 4,7% 12,1% 7,1% 2,9%Hydro 12 20 23 28 33 36 40 4,8% 1,5% 2,0% 1,6% 1,0% 1,0%Other renewables 0 0 0 1 12 35 68 n.s. 0,6% 36,7% 24,2% 11,4% 6,9%
Primary Energy Demand, by sector (Mtoe)Primary Energy Demand 155 202 262 347 419 466 484 2,7% 2,7% 2,8% 1,9% 1,1% 0,4%Energy for Power Generation 36 50 75 102 142 199 259 3,4% 4,1% 3,2% 3,4% 3,4% 2,7%Other Transformation & Losses 26 33 51 78 135 183 222 2,6% 4,3% 4,3% 5,6% 3,1% 1,9%Energy Branch Consumption 19 26 36 45 51 51 35 3,3% 3,2% 2,4% 1,3% -0,1% -3,7%Final consumption 109 148 179 234 267 286 304 3,1% 1,9% 2,7% 1,3% 0,7% 0,6%
Steel, Non-Met. Minerals and Chem. 11 17 17 18 18 15 15 4,2% -0,2% 0,5% -0,2% -1,6% -0,1%Other Industry 24 34 42 57 73 91 109 3,2% 2,3% 3,1% 2,5% 2,3% 1,8%Non-Energy Use 5 11 9 10 11 13 13 9,6% -2,3% 1,1% 1,2% 1,0% 0,0%Residential 25 30 37 40 41 41 42 1,6% 2,1% 1,0% 0,1% 0,1% 0,1%Services 6 7 11 16 20 25 31 2,1% 4,2% 3,7% 2,5% 2,1% 2,1%Agriculture 4 5 7 8 9 10 10 3,4% 3,0% 1,3% 1,3% 1,0% 0,8%Road 32 42 54 81 90 86 79 2,7% 2,6% 4,2% 1,0% -0,4% -0,8%Rail 0 0 0 0 0 0 0 0,1% 4,0% 2,0% 1,7% 1,5% 1,3%Aviation 1 1 1 1 2 2 3 0,2% -0,1% 4,3% 2,5% 2,2% 0,9%Other Transport 1 1 2 2 3 3 2 2,7% 5,2% 2,5% 1,5% -0,1% -0,8%
1 Primary energy from nuclear is calculated considering the primary heat equivalent of the electricity produced with an average efficiency of 33%
79

GECO2015 Global Mitigation 150504 SUMMARY GHG & ENERGY BALANCE##### 100
Rest South America 1990 2000 2010 2020 2030 2040 2050 '90-'00 '00-'10 '10-'20 '20-'30 '30-'40 '40-'50Power Generation
Fuel Inputs Therm. Power (Mtoe) 21 28 50 70 88 109 126 2,9% 5,8% 3,4% 2,4% 2,2% 1,4%Coal 3 3 6 16 17 22 20 0,7% 6,6% 9,8% 1,0% 2,4% -1,1%Oil 5 5 14 13 10 6 4 -0,1% 10,0% -0,9% -2,7% -4,7% -3,9%Gas 12 19 28 38 49 48 35 4,4% 3,9% 3,1% 2,6% -0,2% -2,9%Biomass & Waste 0 1 2 3 12 33 67 6,9% 9,3% 5,7% 14,3% 10,6% 7,2%Other 0 0 0 0 0 0 0 n.s. n.s. n.s. n.s. n.s. n.s.
Gross Elec. Generation (TWh e) 222 353 486 686 993 1 432 1 917 4,7% 3,2% 3,5% 3,8% 3,7% 3,0%Coal 11 13 25 71 81 104 96 1,6% 6,9% 11,1% 1,3% 2,5% -0,9%
of which CCS 0 0 0 0 12 74 94 n.s. n.s. n.s. n.s. 19,8% 2,4%Oil 19 20 55 55 42 26 18 0,4% 10,6% 0,1% -2,7% -4,7% -3,7%Gas 41 85 127 197 272 276 208 7,5% 4,2% 4,5% 3,3% 0,2% -2,8%
of which CCS 0 0 0 0 29 112 114 n.s. n.s. n.s. n.s. 14,6% 0,1%Biomass & Waste 0 0 4 10 54 157 329 2,5% 26,7% 9,9% 17,8% 11,4% 7,7%
of which CCS 0 0 0 0 0 30 131 n.s. n.s. n.s. n.s. n.s. 15,8%Nuclear 7 6 7 12 37 74 97 -1,6% 1,5% 4,9% 12,5% 7,1% 2,7%Hydro 144 229 267 326 380 422 466 4,8% 1,5% 2,0% 1,6% 1,0% 1,0%Wind 0 0 1 14 106 265 438 n.s. 33,0% 36,3% 22,6% 9,6% 5,2%Solar 0 0 0 2 21 106 260 n.s. n.s. n.s. 29,9% 17,3% 9,4%Other 0 0 0 0 0 1 6 n.s. n.s. 30,0% 28,0% 18,8% 16,5%
Generation Capacity (GWe) 64 87 115 166 256 417 645 3,1% 2,8% 3,7% 4,5% 5,0% 4,5%Coal 2 4 4 10 13 16 21 6,5% 0,6% 10,1% 2,3% 2,3% 2,6%
of which CCS 0 0 0 0 2 10 21 n.s. n.s. n.s. n.s. 20,5% 7,4%Oil 9 11 15 17 17 19 20 1,8% 3,0% 1,5% -0,4% 1,1% 0,8%Gas 15 23 38 62 78 86 90 4,4% 5,3% 5,0% 2,4% 1,0% 0,5%
of which CCS 0 0 0 0 4 19 34 n.s. n.s. n.s. n.s. 17,6% 6,1%Biomass & Waste 0 0 1 1 7 22 55 2,5% 26,7% 9,3% 17,8% 11,6% 9,8%
of which CCS 0 0 0 0 0 4 18 n.s. n.s. n.s. n.s. n.s. 16,4%Nuclear 1 1 1 2 5 10 13 0,0% 0,0% 6,1% 12,2% 6,9% 2,5%Hydro 37 49 56 66 78 86 95 2,8% 1,5% 1,7% 1,6% 1,0% 1,0%Wind 0 0 0 6 44 109 179 n.s. 34,3% 35,4% 22,3% 9,5% 5,1%Solar 0 0 0 1 15 69 171 n.s. n.s. n.s. 29,4% 16,6% 9,4%Other 0 0 0 0 0 0 1 n.s. n.s. n.s. 27,3% 18,3% 15,9%
Total Final Consumption 2 (Mtoe) 109 148 179 234 267 286 304 3,1% 1,9% 2,7% 1,3% 0,7% 0,6%Coal 4 5 3 8 9 8 5 2,0% -3,7% 10,1% 1,0% -1,6% -4,3%Oil 55 76 95 120 103 77 49 3,2% 2,3% 2,4% -1,5% -2,9% -4,4%Gas 20 29 31 32 31 27 17 4,0% 0,4% 0,5% -0,4% -1,4% -4,7%Electricity 13 21 32 46 67 98 133 4,9% 4,0% 3,8% 4,0% 3,9% 3,1%Heat 0 0 0 0 1 3 8 n.s. -20,0% 20,7% 37,7% 12,8% 9,9%Biomass & Other 17 17 19 28 55 73 92 0,0% 0,8% 4,0% 7,1% 2,9% 2,4%Share of Renewables 3 (%) 27% 25% 23% 24% 37% 52% 70% -0,6% -0,9% 0,4% 4,5% 3,3% 3,0%
Industry (incl. non-energy use) 40 62 68 85 102 119 136 4,4% 0,9% 2,2% 1,8% 1,6% 1,4%Coal 4 5 3 8 9 8 5 2,3% -3,7% 10,2% 1,1% -1,6% -4,3%Oil 12 21 26 26 21 16 12 5,8% 2,4% -0,2% -2,1% -2,7% -2,8%Gas 14 20 19 19 19 18 12 4,0% -1,0% 0,0% 0,3% -0,4% -3,9%Electricity 7 10 14 22 31 41 54 4,3% 3,5% 4,6% 3,3% 3,0% 2,8%Heat 0 0 0 0 0 0 0 n.s. n.s. n.s. n.s. n.s. n.s.Biomass & Other 5 7 6 10 22 36 53 3,4% -0,7% 5,5% 7,8% 4,9% 4,0%
Buildings 31 37 48 56 61 66 72 1,7% 2,5% 1,7% 0,9% 0,8% 0,9%Coal 0 0 0 0 0 0 0 -6,7% -3,1% 2,7% -12,1% -16,0% n.s.Oil 7 7 8 7 6 4 2 -0,2% 0,4% -0,7% -2,2% -2,9% -6,2%Gas 6 9 12 14 12 9 4 4,0% 3,0% 1,2% -1,4% -3,2% -6,5%Electricity 6 11 17 23 27 32 40 5,5% 4,5% 3,0% 1,6% 1,9% 2,3%Heat 0 0 0 0 1 3 8 n.s. -20,0% 20,7% 37,7% 12,8% 9,9%Biomass & Other 11 10 11 13 16 18 18 -1,5% 1,1% 1,4% 2,5% 1,3% -0,4%
Agriculture 4 5 7 8 9 10 10 3,4% 3,0% 1,3% 1,3% 1,0% 0,8%Coal 0 0 0 0 0 0 0 -8,0% 2,2% -0,9% -5,7% -7,5% -7,5%Oil 2 4 5 6 5 3 2 5,4% 3,6% 1,4% -2,3% -3,7% -3,8%Gas 0 0 0 0 0 0 0 n.s. n.s. 1,4% -1,4% -2,4% -2,5%Electricity 0 0 0 0 1 2 3 6,6% 2,9% 2,2% 7,8% 5,5% 3,7%Heat 0 0 0 0 0 0 0 n.s. n.s. n.s. n.s. n.s. n.s.Biomass & Other 1 1 1 1 3 4 6 -2,8% -0,4% 0,6% 12,1% 5,1% 2,3%
Transport 34 44 57 85 95 91 85 2,6% 2,6% 4,1% 1,1% -0,4% -0,7%Coal 0 0 0 0 0 0 0 n.s. n.s. n.s. n.s. n.s. n.s.Oil 34 44 56 81 72 54 33 2,6% 2,5% 3,8% -1,2% -2,9% -4,8%Gas 0 0 0 0 0 0 0 n.s. n.s. n.s. n.s. n.s. n.s.Electricity 0 0 0 0 9 23 36 2,6% 3,4% 8,2% 41,7% 10,0% 4,4%Heat 0 0 0 0 0 0 0 n.s. n.s. n.s. n.s. n.s. n.s.Biomass & Other 0 0 1 4 14 14 16 -22,0% n.s. 17,5% 14,3% 0,4% 1,3%
Energy Branch Consumption 19 26 36 45 51 51 35 3,3% 3,2% 2,4% 1,3% -0,1% -3,7%Other Transformation & Losses 4 26 33 51 78 135 183 222 2,6% 4,3% 4,3% 5,6% 3,1% 1,9%
2 does not include international aviation and maritime bunkers; includes non-energy uses3 ratio of renewable energy over final energy demand increased by distribution losses and self consumption of electricity and steam plants4 includes statistical differences
80

GECO2015 Global Mitigation 150504 SUMMARY GHG & ENERGY BALANCE##### 100
Other Central Europe 1990 2000 2010 2020 2030 2040 2050 '90-'00 '00-'10 '10-'20 '20-'30 '30-'40 '40-'50Main Economic Indicators
Population (Million) 25 24 23 22 21 20 18 -0,2% -0,5% -0,3% -0,4% -0,6% -0,8%GDP per capita (ppp, k$'05) 5 4 6 8 11 16 22 -2,3% 4,4% 2,1% 3,8% 3,8% 3,1%GDP per capita (mer, k$'05) 2 2 3 4 5 8 10 -1,0% 4,6% 2,2% 3,8% 3,8% 3,1%Share Value Added - Agriculture (%) 17 16 12 11 9 8 7 -0,5% -2,9% -1,3% -2,0% -1,4% -0,8%Share Value Added - Industry (%) 46 25 24 22 21 20 19 -5,9% -0,2% -1,0% -0,3% -0,5% -0,6%Share Value Added - Services (%) 37 59 64 67 70 72 74 4,7% 0,8% 0,6% 0,4% 0,3% 0,2%
PricesInternational/Regional ($'05/boe)
Coal 18 9 19 22 24 26 30 -6,6% 7,6% 1,4% 0,8% 1,0% 1,4%Oil 33 32 72 96 103 104 74 -0,2% 8,3% 2,9% 0,7% 0,1% -3,3%Gas 18 21 31 38 39 36 28 1,4% 4,0% 2,0% 0,4% -0,7% -2,7%
GHG emissions (Mt CO2 eq.)Total GHG (excl. LULUCF) 127 91 130 133 97 56 27 -3,3% 3,6% 0,2% -3,1% -5,4% -7,0%CO2 101 71 89 91 71 39 12 -3,4% 2,2% 0,2% -2,4% -5,8% -11,4%CH4 17 12 11 10 7 4 2 -3,5% -0,7% -0,8% -4,1% -5,9% -4,5%N2O 8 5 21 21 15 12 13 -4,3% 14,9% -0,3% -3,0% -2,1% 0,2%F gases 1 2 9 11 4 1 0 5,9% 13,3% 2,4% -10,0% -18,1% -6,0%Total GHG from Energy and Industry 111 79 116 118 84 44 14 -3,3% 3,8% 0,2% -3,4% -6,2% -11,2%CO2 Emissions from Fuel Comb. 96 69 84 86 66 35 9 -3,3% 2,0% 0,2% -2,6% -6,2% -13,1%
Power generation/District heating 52 47 53 54 37 11 - 6 -1,0% 1,3% 0,2% -3,8% -11,6% n.s.Industry 17 8 8 8 8 7 6 -7,8% -0,1% 0,4% 0,3% -1,2% -1,9%Buildings 14 4 5 5 3 2 1 -10,8% 1,5% -0,6% -4,7% -4,1% -6,1%Agriculture 0 1 1 1 0 0 0 10,5% -4,0% 0,8% -2,2% -3,8% -4,0%Transport 7 7 12 12 10 8 5 -1,2% 6,5% 0,0% -2,1% -2,7% -4,5%Other 6 3 5 5 7 7 3 -8,4% 6,6% 1,3% 3,1% -0,7% -8,0%
CO2 captured (CCS) 0 0 0 0 5 25 35 n.s. n.s. n.s. n.s. 17,7% 3,6%Coal 0 0 0 0 4 19 18 n.s. n.s. n.s. n.s. 15,9% -0,5%Gas 0 0 0 0 0 3 5 n.s. n.s. n.s. n.s. 21,5% 6,4%Biomass 0 0 0 0 0 3 12 n.s. n.s. n.s. n.s. 52,8% 16,6%
Energy Balance, by fuel (Mtoe)Primary Production 6 8 9 11 14 17 19 2,7% 1,3% 1,7% 2,4% 2,1% 1,4%
Coal 0 2 2 3 2 2 2 38,3% -0,4% 1,8% -1,9% -0,8% -1,2%Oil 2 1 2 2 2 1 1 -5,3% 2,5% 0,9% -0,9% -1,8% -2,7%Natural gas 1 1 0 0 1 1 1 -1,5% -6,5% 4,3% 1,3% 0,0% -0,8%Biomass 2 2 2 3 4 5 6 -0,7% 1,6% 3,8% 4,9% 1,7% 0,8%Nuclear1 0 0 0 0 0 0 0 n.s. n.s. n.s. n.s. 17,6% 6,7%Hydro 1 2 3 3 4 4 5 3,7% 3,9% -0,2% 2,5% 1,4% 1,1%Other renewables 0 0 0 0 1 3 6 n.s. 19,8% 31,1% 26,5% 11,1% 5,1%
Net Imports 26 16 21 21 19 16 13Coal 16 11 13 12 7 5 3Oil 7 4 6 6 5 4 2Natural gas 3 1 2 3 7 7 6Biomass 0 0 0 0 0 0 1Biofuels 0 0 0 0 0 0 0Electricity 0 0 0 0 0 0 0
Primary Energy Demand2 32 23 30 31 32 33 32 -3,1% 2,5% 0,4% 0,3% 0,2% -0,3%Coal 16 13 15 15 10 7 5 -2,1% 1,6% 0,0% -4,4% -2,8% -2,9%Oil 9 5 8 8 7 5 3 -6,5% 5,4% -0,5% -1,1% -2,5% -4,5%Natural gas 4 2 2 3 7 8 6 -6,6% 1,8% 3,9% 8,4% 1,0% -2,1%Biomass 2 2 2 3 4 5 7 -0,7% 1,7% 3,6% 4,8% 2,1% 2,7%Nuclear1 0 0 0 0 0 0 0 n.s. n.s. n.s. n.s. 17,6% 6,7%Hydro 1 2 3 3 4 4 5 3,7% 3,9% -0,2% 2,5% 1,4% 1,1%Other renewables 0 0 0 0 1 3 6 n.s. 19,8% 31,1% 26,5% 11,1% 5,1%
Primary Energy Demand, by sector (Mtoe)Primary Energy Demand 32 23 30 31 32 33 32 -3,1% 2,5% 0,4% 0,3% 0,2% -0,3%Energy for Power Generation 15 14 16 17 17 19 20 -0,6% 1,8% 0,4% -0,1% 1,0% 0,8%Other Transformation & Losses 6 5 6 7 10 13 15 -2,0% 3,5% 1,5% 3,0% 2,3% 1,9%Energy Branch Consumption 2 1 2 3 4 4 3 -3,0% 4,2% 2,2% 3,6% 0,8% -1,0%Final consumption 21 13 18 20 21 22 21 -4,5% 3,4% 0,7% 0,6% 0,4% -0,1%
Steel, Non-Met. Minerals and Chem. 0 1 3 3 3 2 2 5,2% 14,0% 0,4% -0,2% -1,8% -2,0%Other Industry 7 3 2 3 3 4 5 -8,4% -3,3% 2,4% 2,2% 2,2% 1,3%Non-Energy Use 2 0 1 1 1 1 1 -13,1% 10,0% -0,5% 1,5% 0,9% -0,5%Residential 4 5 6 6 6 6 5 1,0% 1,5% 0,4% 0,3% -0,1% -0,6%Services 4 1 2 2 2 3 3 -10,4% 3,0% 0,8% 0,5% 1,4% 1,0%Agriculture 0 0 0 0 0 0 0 11,9% -2,6% 0,7% 1,2% 1,1% 0,9%Road 3 2 4 5 5 5 5 -1,1% 6,3% 0,8% 0,2% -0,1% -0,7%Rail 0 0 0 0 0 0 0 2,1% 18,1% 0,2% 0,8% 0,6% 0,1%Aviation 0 0 0 0 0 0 0 n.s. n.s. n.s. n.s. n.s. n.s.Other Transport 0 0 0 0 0 0 0 n.s. 4,8% -0,6% 0,8% -0,8% -1,9%
1 Primary energy from nuclear is calculated considering the primary heat equivalent of the electricity produced with an average efficiency of 33%
81

GECO2015 Global Mitigation 150504 SUMMARY GHG & ENERGY BALANCE##### 100
Other Central Europe 1990 2000 2010 2020 2030 2040 2050 '90-'00 '00-'10 '10-'20 '20-'30 '30-'40 '40-'50Power Generation
Fuel Inputs Therm. Power (Mtoe) 13 12 14 14 12 11 10 -1,1% 1,4% 0,4% -1,5% -0,9% -1,0%Coal 12 11 13 13 8 6 5 -0,4% 1,3% -0,2% -4,8% -2,6% -2,8%Oil 1 0 0 0 1 1 0 -12,5% -2,0% 2,8% 9,8% -2,9% -16,5%Gas 0 0 0 1 3 3 3 -7,4% 7,7% 15,8% 13,2% 0,5% -2,6%Biomass & Waste 0 0 0 0 0 1 3 n.s. n.s. n.s. n.s. 20,1% 11,0%Other 0 0 0 0 0 0 0 n.s. n.s. n.s. n.s. n.s. n.s.
Gross Elec. Generation (TWh e) 65 59 79 90 108 136 162 -0,9% 3,0% 1,3% 1,8% 2,3% 1,8%Coal 44 35 45 51 35 28 22 -2,3% 2,6% 1,2% -3,5% -2,2% -2,6%
of which CCS 0 0 0 0 5 23 21 n.s. n.s. n.s. n.s. 15,8% -0,6%Oil 3 1 0 1 3 3 0 -11,9% -12,6% 18,5% 9,8% -2,8% -16,3%Gas 1 0 0 5 16 19 17 -11,4% 0,3% 27,9% 13,0% 1,8% -1,3%
of which CCS 0 0 0 0 1 7 13 n.s. n.s. n.s. n.s. 21,9% 6,6%Biomass & Waste 0 0 0 0 1 5 13 n.s. n.s. n.s. n.s. 20,6% 11,4%
of which CCS 0 0 0 0 0 3 11 n.s. n.s. n.s. n.s. n.s. 15,3%Nuclear 0 0 0 0 0 0 0 n.s. n.s. n.s. n.s. n.s. n.s.Hydro 16 23 34 33 42 48 54 3,7% 3,9% -0,2% 2,5% 1,4% 1,1%Wind 0 0 0 1 8 24 37 n.s. n.s. n.s. 30,8% 11,6% 4,5%Solar 0 0 0 0 3 10 19 n.s. n.s. n.s. 37,9% 13,8% 7,1%Other 0 0 0 0 0 0 0 n.s. n.s. n.s. n.s. 18,3% 14,3%
Generation Capacity (GWe) 9 13 14 21 27 42 53 3,5% 0,4% 4,4% 2,5% 4,7% 2,3%Coal 8 8 8 13 11 12 6 0,0% 0,0% 4,5% -1,7% 0,6% -6,4%
of which CCS 0 0 0 0 1 4 5 n.s. n.s. n.s. n.s. 17,7% 4,0%Oil 1 1 1 1 1 1 1 -0,2% 1,3% 0,3% -0,8% 1,6% 3,4%Gas 0 0 0 1 3 4 5 -1,1% 2,2% 18,5% 6,9% 3,8% 2,2%
of which CCS 0 0 0 0 0 1 2 n.s. n.s. n.s. n.s. 22,7% 8,3%Biomass & Waste 0 0 0 0 0 1 2 n.s. n.s. n.s. n.s. 21,0% 11,3%
of which CCS 0 0 0 0 0 0 2 n.s. n.s. n.s. n.s. n.s. 15,4%Nuclear 0 0 0 0 0 0 0 n.s. n.s. n.s. n.s. n.s. n.s.Hydro 0 4 4 5 7 8 9 n.s. 0,9% 2,5% 2,5% 1,4% 1,1%Wind 0 0 0 0 3 10 15 n.s. n.s. n.s. 30,6% 11,5% 4,5%Solar 0 0 0 0 2 8 15 n.s. n.s. n.s. 38,0% 13,7% 7,1%Other 0 0 0 0 0 0 0 n.s. n.s. n.s. n.s. 17,7% 13,8%
Total Final Consumption 2 (Mtoe) 21 13 18 20 21 22 21 -4,5% 3,4% 0,7% 0,6% 0,4% -0,1%Coal 3 2 2 2 2 1 1 -7,7% 1,0% 1,8% -2,5% -4,3% -3,2%Oil 8 4 7 7 6 5 3 -6,1% 6,0% -0,4% -1,9% -2,3% -3,4%Gas 3 1 1 1 2 2 2 -7,6% -0,1% -0,3% 2,8% 1,8% -1,2%Electricity 4 4 5 6 7 9 10 -0,8% 2,5% 1,2% 2,0% 2,5% 1,9%Heat 1 1 1 1 2 2 2 -1,9% 5,9% 1,9% 2,3% 1,5% 0,7%Biomass & Other 2 2 2 2 3 3 3 -0,7% 1,7% 2,4% 3,4% 0,2% -1,2%Share of Renewables 3 (%) 16% 26% 26% 26% 38% 49% 61% 5,1% 0,1% 0,2% 3,6% 2,6% 2,2%
Industry (incl. non-energy use) 9 4 6 6 7 7 8 -8,0% 3,7% 1,0% 1,1% 0,7% 0,2%Coal 1 1 1 2 1 1 1 -2,7% 1,0% 2,8% -0,4% -3,7% -3,0%Oil 4 1 2 1 1 1 1 -15,1% 7,5% -1,4% -0,4% -0,7% -0,8%Gas 1 1 1 1 1 1 1 -2,4% -0,7% -1,3% 2,8% 3,1% 0,3%Electricity 2 1 1 2 2 3 4 -7,8% 5,1% 2,6% 1,8% 2,4% 2,1%Heat 0 0 0 0 0 0 0 -6,1% 10,9% 0,0% -0,2% -0,3% -0,2%Biomass & Other 0 0 0 0 0 0 0 n.s. -5,6% 12,4% 9,0% 1,3% -5,1%
Buildings 9 6 7 8 8 8 8 -3,3% 1,9% 0,5% 0,3% 0,3% -0,1%Coal 2 0 1 1 0 0 0 -14,1% 2,2% -0,4% -12,6% -17,7% -17,9%Oil 1 1 1 1 0 0 0 -1,0% 1,1% -2,0% -4,8% -5,5% -5,6%Gas 2 0 0 0 1 1 0 -14,8% 1,1% 2,0% 2,9% -0,8% -6,0%Electricity 2 3 3 4 4 5 5 3,1% 1,6% 0,4% 0,8% 1,6% 1,4%Heat 0 0 1 1 1 2 2 0,0% 3,7% 3,0% 3,3% 2,1% 1,0%Biomass & Other 2 1 2 2 2 2 1 -1,7% 2,3% 0,6% 0,3% -2,1% -4,2%
Agriculture 0 0 0 0 0 0 0 11,9% -2,6% 0,7% 1,2% 1,1% 0,9%Coal 0 0 0 0 0 0 0 2,0% -28,4% n.s. n.s. n.s. n.s.Oil 0 0 0 0 0 0 0 16,2% -2,0% 1,0% -2,2% -3,9% -4,1%Gas 0 0 0 0 0 0 0 n.s. n.s. 0,0% -1,4% -2,6% -2,8%Electricity 0 0 0 0 0 0 0 5,0% 6,0% -0,8% 4,2% 3,7% 2,7%Heat 0 0 0 0 0 0 0 n.s. n.s. n.s. n.s. n.s. n.s.Biomass & Other 0 0 0 0 0 0 0 n.s. -13,5% 6,1% 11,9% 5,8% 2,5%
Transport 3 2 5 5 5 5 5 -1,0% 6,8% 0,7% 0,3% 0,0% -0,6%Coal 0 0 0 0 0 0 0 n.s. n.s. n.s. n.s. n.s. n.s.Oil 3 2 5 5 4 3 2 -0,9% 6,8% 0,1% -2,1% -2,7% -4,6%Gas 0 0 0 0 0 0 0 n.s. n.s. n.s. n.s. n.s. n.s.Electricity 0 0 0 0 1 1 2 -5,5% 4,4% 12,4% 17,7% 7,0% 3,1%Heat 0 0 0 0 0 0 0 n.s. n.s. n.s. n.s. n.s. n.s.Biomass & Other 0 0 0 0 1 1 2 n.s. n.s. n.s. 12,8% 3,5% 2,7%
Energy Branch Consumption 2 1 2 3 4 4 3 -3,0% 4,2% 2,2% 3,6% 0,8% -1,0%Other Transformation & Losses 4 6 5 6 7 10 13 15 -2,0% 3,5% 1,5% 3,0% 2,3% 1,9%
2 does not include international aviation and maritime bunkers; includes non-energy uses3 ratio of renewable energy over final energy demand increased by distribution losses and self consumption of electricity and steam plants4 includes statistical differences
82

GECO2015 Global Mitigation 150504 SUMMARY GHG & ENERGY BALANCE##### 100
Turkey 1990 2000 2010 2020 2030 2040 2050 '90-'00 '00-'10 '10-'20 '20-'30 '30-'40 '40-'50Main Economic Indicators
Population (Million) 54 63 72 80 87 92 95 1,6% 1,3% 1,1% 0,8% 0,6% 0,3%GDP per capita (ppp, k$'05) 8 10 13 17 23 29 34 2,0% 2,5% 2,7% 3,3% 2,3% 1,6%GDP per capita (mer, k$'05) 5 6 8 10 14 18 21 2,0% 2,5% 2,7% 3,3% 2,3% 1,6%Share Value Added - Agriculture (%) 18 11 10 9 8 7 7 -4,6% -1,6% -1,2% -0,8% -0,4% -0,3%Share Value Added - Industry (%) 32 31 27 26 25 23 22 -0,2% -1,5% -0,2% -0,6% -0,6% -0,5%Share Value Added - Services (%) 50 57 63 65 67 69 71 1,4% 1,0% 0,3% 0,3% 0,3% 0,2%
PricesInternational/Regional ($'05/boe)
Coal 18 9 19 22 24 26 30 -6,6% 7,6% 1,4% 0,8% 1,0% 1,4%Oil 33 32 72 96 103 104 74 -0,2% 8,3% 2,9% 0,7% 0,1% -3,3%Gas 18 21 31 38 39 36 28 1,4% 4,0% 2,0% 0,4% -0,7% -2,7%
GHG emissions (Mt CO2 eq.)Total GHG (excl. LULUCF) 204 304 394 487 427 325 200 4,1% 2,6% 2,1% -1,3% -2,7% -4,7%CO2 157 233 319 414 385 296 176 4,0% 3,2% 2,6% -0,7% -2,6% -5,1%CH4 34 53 57 47 28 18 13 4,7% 0,7% -1,8% -5,2% -4,3% -3,5%N2O 12 17 12 19 13 9 10 3,4% -2,9% 4,4% -4,0% -3,4% 0,9%F gases 1 2 5 6 2 2 1 10,6% 11,4% 2,5% -11,0% -1,7% -1,4%Total GHG from Energy and Industry 173 277 367 450 399 302 181 4,8% 2,9% 2,1% -1,2% -2,8% -5,0%CO2 Emissions from Fuel Comb. 133 204 272 359 320 213 103 4,3% 3,0% 2,8% -1,2% -4,0% -7,0%
Power generation/District heating 32 70 99 149 136 72 12 8,2% 3,6% 4,1% -0,9% -6,1% -16,7%Industry 37 58 52 62 64 60 53 4,5% -1,2% 1,9% 0,3% -0,7% -1,2%Buildings 25 25 49 52 36 23 13 0,1% 7,1% 0,5% -3,7% -4,1% -5,9%Agriculture 6 8 14 19 16 11 7 3,4% 5,4% 3,2% -2,2% -3,8% -4,1%Transport 28 34 47 63 54 36 20 2,2% 3,2% 2,9% -1,6% -3,9% -5,5%Other 6 8 11 14 14 11 - 2 2,7% 3,3% 2,5% 0,4% -2,4% n.s.
CO2 captured (CCS) 0 0 0 0 14 77 144 n.s. n.s. n.s. n.s. 18,7% 6,5%Coal 0 0 0 0 7 37 48 n.s. n.s. n.s. n.s. 18,0% 2,7%Gas 0 0 0 0 7 30 44 n.s. n.s. n.s. n.s. 16,1% 3,9%Biomass 0 0 0 0 0 10 52 n.s. n.s. n.s. n.s. n.s. 18,2%
Energy Balance, by fuel (Mtoe)Primary Production 14 14 15 23 44 64 79 0,2% 0,3% 4,6% 6,5% 3,9% 2,1%
Coal 1 2 2 1 1 1 1 3,9% -0,8% -1,4% -3,2% 0,9% 0,0%Oil 4 3 2 2 3 3 2 -2,8% -1,0% -0,2% 0,9% -0,3% -1,2%Natural gas 0 1 1 1 2 4 4 11,6% 0,5% 5,1% 8,3% 6,1% 1,9%Biomass 7 7 5 7 14 20 23 -1,0% -3,5% 4,8% 7,0% 3,5% 1,1%Nuclear1 0 0 0 0 2 4 6 n.s. n.s. n.s. 29,4% 8,4% 3,0%Hydro 2 3 4 7 9 9 10 2,9% 5,3% 4,1% 2,5% 0,9% 0,6%Other renewables 0 0 1 4 13 23 33 13,1% 14,3% 13,4% 11,6% 5,7% 3,7%
Net Imports 37 62 89 117 119 113 110Coal 15 21 31 43 29 24 19Oil 19 28 28 33 30 22 15Natural gas 3 12 31 41 57 59 57Biomass 0 0 0 1 2 7 18Biofuels 0 0 0 0 1 1 1Electricity 0 0 0 0 0 0 0
Primary Energy Demand2 51 76 104 140 163 177 189 4,1% 3,1% 3,1% 1,5% 0,8% 0,7%Coal 16 23 32 44 30 25 20 3,8% 3,5% 3,3% -3,7% -2,0% -2,0%Oil 23 31 30 35 33 24 17 3,0% -0,3% 1,6% -0,7% -2,9% -3,4%Natural gas 3 13 31 41 59 63 61 16,0% 9,5% 2,8% 3,5% 0,7% -0,3%Biomass 7 7 5 8 17 27 41 -1,0% -3,5% 5,6% 7,8% 5,0% 4,1%Nuclear1 0 0 0 0 2 4 6 n.s. n.s. n.s. 29,4% 8,4% 3,0%Hydro 2 3 4 7 9 9 10 2,9% 5,3% 4,1% 2,5% 0,9% 0,6%Other renewables 0 0 1 4 13 23 33 13,1% 14,3% 13,4% 11,6% 5,7% 3,7%
Primary Energy Demand, by sector (Mtoe)Primary Energy Demand 51 76 104 140 163 177 189 4,1% 3,1% 3,1% 1,5% 0,8% 0,7%Energy for Power Generation 11 24 38 57 77 92 107 8,1% 4,6% 4,2% 2,9% 1,8% 1,6%Other Transformation & Losses 5 11 17 31 48 62 77 9,0% 4,1% 6,0% 4,6% 2,5% 2,2%Energy Branch Consumption 2 3 4 5 6 6 6 3,1% 4,5% 2,1% 1,5% 0,1% -0,2%Final consumption 42 58 80 101 115 125 130 3,2% 3,3% 2,3% 1,3% 0,8% 0,5%
Steel, Non-Met. Minerals and Chem. 5 6 9 12 15 28 37 1,9% 4,5% 2,7% 2,5% 6,1% 2,9%Other Industry 7 14 16 21 24 20 15 6,8% 0,9% 2,9% 1,6% -1,9% -3,0%Non-Energy Use 3 4 7 6 7 7 6 2,3% 7,3% -2,1% 1,9% -0,7% -1,7%Residential 15 17 23 26 25 24 22 1,2% 3,0% 1,3% -0,5% -0,5% -0,9%Services 1 2 6 8 11 14 16 13,4% 9,7% 3,8% 3,1% 1,9% 1,5%Agriculture 2 3 5 7 8 9 10 4,1% 5,5% 3,3% 1,6% 1,0% 0,7%Road 8 11 13 19 22 21 23 2,3% 2,3% 3,9% 1,1% -0,3% 0,9%Rail 0 0 0 0 0 0 0 0,3% -3,6% 2,1% 1,3% 0,7% 0,2%Aviation 0 1 0 1 1 1 1 9,5% -5,7% 5,1% 4,0% 2,3% 0,5%Other Transport 0 0 1 1 1 1 1 -2,6% 11,9% 3,0% 1,7% -1,0% -2,1%
1 Primary energy from nuclear is calculated considering the primary heat equivalent of the electricity produced with an average efficiency of 33%
83

GECO2015 Global Mitigation 150504 SUMMARY GHG & ENERGY BALANCE##### 100
Turkey 1990 2000 2010 2020 2030 2040 2050 '90-'00 '00-'10 '10-'20 '20-'30 '30-'40 '40-'50Power Generation
Fuel Inputs Therm. Power (Mtoe) 9 21 32 46 53 55 59 8,9% 4,3% 3,6% 1,4% 0,4% 0,7%Coal 6 11 14 25 17 12 9 6,7% 2,6% 5,8% -4,1% -3,3% -2,6%Oil 1 3 1 1 2 3 3 8,9% -14,3% 7,0% 7,7% 1,6% -0,3%Gas 2 7 17 19 32 35 34 13,3% 8,7% 1,0% 5,4% 0,8% -0,2%Biomass & Waste 0 0 0 0 1 5 12 n.s. 7,3% 13,0% 12,5% 14,4% 9,5%Other 0 0 0 0 0 0 0 -0,5% 24,3% 16,1% 2,3% 0,2% 1,1%
Gross Elec. Generation (TWh e) 58 125 211 314 476 608 739 8,1% 5,4% 4,0% 4,2% 2,5% 2,0%Coal 20 38 55 104 72 55 43 6,6% 3,7% 6,6% -3,6% -2,6% -2,4%
of which CCS 0 0 0 0 8 33 40 n.s. n.s. n.s. n.s. 15,5% 2,0%Oil 4 9 2 5 10 12 12 9,0% -13,5% 7,9% 7,7% 1,7% -0,1%Gas 10 46 98 106 183 200 202 16,3% 7,8% 0,8% 5,6% 0,9% 0,1%
of which CCS 0 0 0 0 19 82 122 n.s. n.s. n.s. n.s. 15,8% 4,0%Biomass & Waste 0 0 0 2 6 23 61 n.s. 10,6% 13,1% 13,7% 15,2% 10,1%
of which CCS 0 0 0 0 0 10 45 n.s. n.s. n.s. n.s. n.s. 16,4%Nuclear 0 0 0 1 8 16 21 n.s. n.s. n.s. 29,5% 8,0% 2,5%Hydro 23 31 52 78 99 109 115 2,9% 5,3% 4,1% 2,5% 0,9% 0,6%Wind 0 0 3 14 75 130 170 n.s. 56,4% 17,1% 18,3% 5,6% 2,7%Solar 0 0 0 2 19 58 109 n.s. n.s. n.s. 26,3% 12,0% 6,5%Other 0 0 1 3 4 4 6 -0,5% 24,3% 16,2% 2,7% 1,2% 3,4%
Generation Capacity (GWe) 17 27 49 89 152 202 262 5,0% 6,1% 6,0% 5,5% 2,9% 2,6%Coal 6 7 12 18 18 9 7 2,8% 5,3% 3,7% 0,0% -6,7% -2,4%
of which CCS 0 0 0 0 1 4 6 n.s. n.s. n.s. n.s. 15,6% 3,6%Oil 2 2 2 2 3 3 5 -2,7% -0,4% 3,8% 1,2% 3,2% 3,0%Gas 2 7 18 35 52 55 57 12,3% 10,0% 6,8% 4,1% 0,4% 0,4%
of which CCS 0 0 0 0 2 12 21 n.s. n.s. n.s. n.s. 17,2% 6,0%Biomass & Waste 0 0 0 0 1 3 9 n.s. 16,3% 8,3% 12,7% 15,1% 10,4%
of which CCS 0 0 0 0 0 1 6 n.s. n.s. n.s. n.s. n.s. 16,9%Nuclear 0 0 0 0 1 3 3 n.s. n.s. n.s. 29,3% 7,8% 2,3%Hydro 7 11 16 26 33 36 38 5,1% 3,5% 4,9% 2,5% 0,9% 0,6%Wind 0 0 1 6 32 54 70 n.s. 53,0% 16,3% 18,0% 5,5% 2,6%Solar 0 0 0 1 12 38 72 n.s. n.s. n.s. 26,1% 12,0% 6,5%Other 0 0 0 0 1 1 1 0,0% 20,2% 14,6% 3,3% 2,3% 2,8%
Total Final Consumption 2 (Mtoe) 42 58 80 101 115 125 130 3,2% 3,3% 2,3% 1,3% 0,8% 0,5%Coal 10 11 17 16 11 11 9 1,3% 4,5% -0,5% -3,6% -0,6% -1,7%Oil 20 26 28 33 30 21 15 2,5% 0,8% 1,6% -1,1% -3,3% -3,7%Gas 1 5 13 19 22 24 23 21,0% 10,2% 4,2% 1,4% 0,6% -0,4%Electricity 4 8 15 22 34 44 53 7,9% 5,9% 4,3% 4,3% 2,5% 2,0%Heat 0 1 3 4 5 6 8 12,4% 9,2% 2,1% 2,8% 2,5% 2,3%Biomass & Other 7 6 4 6 13 19 23 -1,1% -3,7% 3,7% 7,3% 3,8% 2,0%Share of Renewables 3 (%) 23% 16% 13% 15% 28% 39% 50% -3,3% -2,6% 1,9% 6,2% 3,5% 2,3%
Industry (incl. non-energy use) 15 24 32 39 47 55 58 4,6% 3,0% 1,9% 2,0% 1,5% 0,5%Coal 6 9 9 10 10 10 9 4,7% 0,1% 0,6% -0,5% 0,7% -1,5%Oil 6 8 8 6 7 6 5 2,9% -0,2% -2,2% 0,7% -1,8% -0,8%Gas 1 2 7 10 12 16 19 10,1% 14,0% 4,0% 2,3% 2,9% 1,6%Electricity 2 4 7 11 15 17 17 5,4% 5,3% 5,0% 3,1% 1,2% 0,5%Heat 0 0 1 1 1 1 1 50,7% 10,8% 0,0% -0,2% -0,3% -0,2%Biomass & Other 0 0 0 0 2 5 6 n.s. n.s. n.s. 22,3% 7,2% 2,4%
Buildings 16 19 29 35 36 38 38 2,1% 4,0% 1,8% 0,5% 0,3% 0,1%Coal 4 2 7 6 2 0 0 -8,2% 17,0% -2,1% -12,1% -16,0% -16,2%Oil 3 4 1 2 2 1 1 1,4% -8,7% 0,6% 0,0% -1,8% -3,3%Gas 0 3 6 10 10 8 4 50,4% 7,5% 4,4% 0,6% -2,8% -6,2%Electricity 1 4 7 10 14 17 21 10,7% 6,5% 3,1% 3,2% 2,3% 1,8%Heat 0 1 2 2 4 5 7 7,4% 8,0% 3,5% 4,2% 3,4% 2,8%Biomass & Other 7 6 4 5 5 6 5 -1,1% -3,7% 0,7% 1,3% 0,7% -1,1%
Agriculture 2 3 5 7 8 9 10 4,1% 5,5% 3,3% 1,6% 1,0% 0,7%Coal 0 0 0 0 0 0 0 n.s. n.s. -3,5% n.s. n.s. n.s.Oil 2 3 4 6 5 3 2 3,4% 5,3% 3,2% -2,2% -3,8% -4,1%Gas 0 0 0 0 0 0 0 n.s. n.s. 3,7% -1,2% -2,5% -2,8%Electricity 0 0 0 1 2 3 4 18,2% 6,2% 3,9% 9,2% 5,1% 2,8%Heat 0 0 0 0 0 0 0 n.s. n.s. n.s. n.s. n.s. n.s.Biomass & Other 0 0 0 0 1 3 4 n.s. n.s. n.s. 47,8% 7,0% 2,8%
Transport 9 12 14 21 24 24 26 2,4% 2,1% 3,9% 1,2% -0,2% 0,8%Coal 0 0 0 0 0 0 0 n.s. n.s. n.s. n.s. n.s. n.s.Oil 9 12 14 19 16 11 6 2,4% 2,1% 2,9% -1,6% -3,9% -5,4%Gas 0 0 0 0 0 0 0 n.s. n.s. n.s. n.s. n.s. n.s.Electricity 0 0 0 1 4 7 11 8,3% -0,8% 27,7% 18,6% 6,2% 4,8%Heat 0 0 0 0 0 0 0 n.s. n.s. n.s. n.s. n.s. n.s.Biomass & Other 0 0 0 1 4 6 8 n.s. n.s. n.s. 10,9% 4,0% 3,8%
Energy Branch Consumption 2 3 4 5 6 6 6 3,1% 4,5% 2,1% 1,5% 0,1% -0,2%Other Transformation & Losses 4 5 11 17 31 48 62 77 9,0% 4,1% 6,0% 4,6% 2,5% 2,2%
2 does not include international aviation and maritime bunkers; includes non-energy uses3 ratio of renewable energy over final energy demand increased by distribution losses and self consumption of electricity and steam plants4 includes statistical differences
84
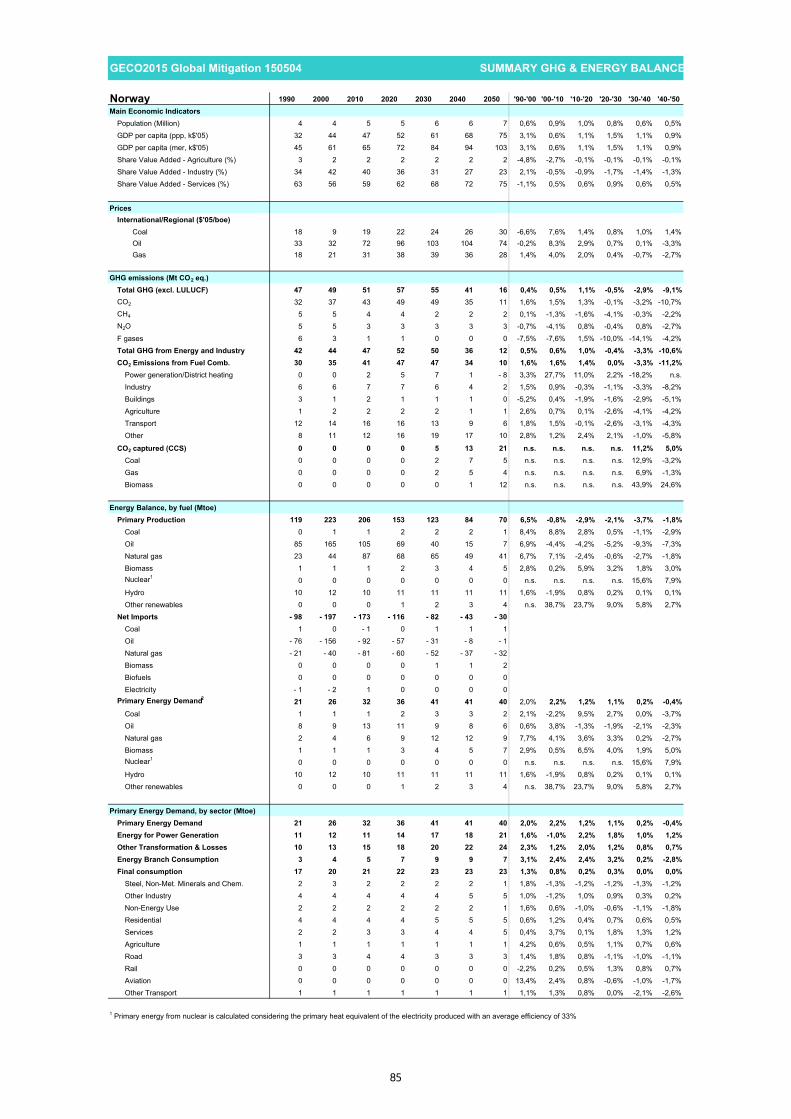
GECO2015 Global Mitigation 150504 SUMMARY GHG & ENERGY BALANCE##### 100
Norway 1990 2000 2010 2020 2030 2040 2050 '90-'00 '00-'10 '10-'20 '20-'30 '30-'40 '40-'50Main Economic Indicators
Population (Million) 4 4 5 5 6 6 7 0,6% 0,9% 1,0% 0,8% 0,6% 0,5%GDP per capita (ppp, k$'05) 32 44 47 52 61 68 75 3,1% 0,6% 1,1% 1,5% 1,1% 0,9%GDP per capita (mer, k$'05) 45 61 65 72 84 94 103 3,1% 0,6% 1,1% 1,5% 1,1% 0,9%Share Value Added - Agriculture (%) 3 2 2 2 2 2 2 -4,8% -2,7% -0,1% -0,1% -0,1% -0,1%Share Value Added - Industry (%) 34 42 40 36 31 27 23 2,1% -0,5% -0,9% -1,7% -1,4% -1,3%Share Value Added - Services (%) 63 56 59 62 68 72 75 -1,1% 0,5% 0,6% 0,9% 0,6% 0,5%
PricesInternational/Regional ($'05/boe)
Coal 18 9 19 22 24 26 30 -6,6% 7,6% 1,4% 0,8% 1,0% 1,4%Oil 33 32 72 96 103 104 74 -0,2% 8,3% 2,9% 0,7% 0,1% -3,3%Gas 18 21 31 38 39 36 28 1,4% 4,0% 2,0% 0,4% -0,7% -2,7%
GHG emissions (Mt CO2 eq.)Total GHG (excl. LULUCF) 47 49 51 57 55 41 16 0,4% 0,5% 1,1% -0,5% -2,9% -9,1%CO2 32 37 43 49 49 35 11 1,6% 1,5% 1,3% -0,1% -3,2% -10,7%CH4 5 5 4 4 2 2 2 0,1% -1,3% -1,6% -4,1% -0,3% -2,2%N2O 5 5 3 3 3 3 3 -0,7% -4,1% 0,8% -0,4% 0,8% -2,7%F gases 6 3 1 1 0 0 0 -7,5% -7,6% 1,5% -10,0% -14,1% -4,2%Total GHG from Energy and Industry 42 44 47 52 50 36 12 0,5% 0,6% 1,0% -0,4% -3,3% -10,6%CO2 Emissions from Fuel Comb. 30 35 41 47 47 34 10 1,6% 1,6% 1,4% 0,0% -3,3% -11,2%
Power generation/District heating 0 0 2 5 7 1 - 8 3,3% 27,7% 11,0% 2,2% -18,2% n.s.Industry 6 6 7 7 6 4 2 1,5% 0,9% -0,3% -1,1% -3,3% -8,2%Buildings 3 1 2 1 1 1 0 -5,2% 0,4% -1,9% -1,6% -2,9% -5,1%Agriculture 1 2 2 2 2 1 1 2,6% 0,7% 0,1% -2,6% -4,1% -4,2%Transport 12 14 16 16 13 9 6 1,8% 1,5% -0,1% -2,6% -3,1% -4,3%Other 8 11 12 16 19 17 10 2,8% 1,2% 2,4% 2,1% -1,0% -5,8%
CO2 captured (CCS) 0 0 0 0 5 13 21 n.s. n.s. n.s. n.s. 11,2% 5,0%Coal 0 0 0 0 2 7 5 n.s. n.s. n.s. n.s. 12,9% -3,2%Gas 0 0 0 0 2 5 4 n.s. n.s. n.s. n.s. 6,9% -1,3%Biomass 0 0 0 0 0 1 12 n.s. n.s. n.s. n.s. 43,9% 24,6%
Energy Balance, by fuel (Mtoe)Primary Production 119 223 206 153 123 84 70 6,5% -0,8% -2,9% -2,1% -3,7% -1,8%
Coal 0 1 1 2 2 2 1 8,4% 8,8% 2,8% 0,5% -1,1% -2,9%Oil 85 165 105 69 40 15 7 6,9% -4,4% -4,2% -5,2% -9,3% -7,3%Natural gas 23 44 87 68 65 49 41 6,7% 7,1% -2,4% -0,6% -2,7% -1,8%Biomass 1 1 1 2 3 4 5 2,8% 0,2% 5,9% 3,2% 1,8% 3,0%Nuclear1 0 0 0 0 0 0 0 n.s. n.s. n.s. n.s. 15,6% 7,9%Hydro 10 12 10 11 11 11 11 1,6% -1,9% 0,8% 0,2% 0,1% 0,1%Other renewables 0 0 0 1 2 3 4 n.s. 38,7% 23,7% 9,0% 5,8% 2,7%
Net Imports - 98 - 197 - 173 - 116 - 82 - 43 - 30Coal 1 0 - 1 0 1 1 1Oil - 76 - 156 - 92 - 57 - 31 - 8 - 1Natural gas - 21 - 40 - 81 - 60 - 52 - 37 - 32Biomass 0 0 0 0 1 1 2Biofuels 0 0 0 0 0 0 0Electricity - 1 - 2 1 0 0 0 0
Primary Energy Demand2 21 26 32 36 41 41 40 2,0% 2,2% 1,2% 1,1% 0,2% -0,4%Coal 1 1 1 2 3 3 2 2,1% -2,2% 9,5% 2,7% 0,0% -3,7%Oil 8 9 13 11 9 8 6 0,6% 3,8% -1,3% -1,9% -2,1% -2,3%Natural gas 2 4 6 9 12 12 9 7,7% 4,1% 3,6% 3,3% 0,2% -2,7%Biomass 1 1 1 3 4 5 7 2,9% 0,5% 6,5% 4,0% 1,9% 5,0%Nuclear1 0 0 0 0 0 0 0 n.s. n.s. n.s. n.s. 15,6% 7,9%Hydro 10 12 10 11 11 11 11 1,6% -1,9% 0,8% 0,2% 0,1% 0,1%Other renewables 0 0 0 1 2 3 4 n.s. 38,7% 23,7% 9,0% 5,8% 2,7%
Primary Energy Demand, by sector (Mtoe)Primary Energy Demand 21 26 32 36 41 41 40 2,0% 2,2% 1,2% 1,1% 0,2% -0,4%Energy for Power Generation 11 12 11 14 17 18 21 1,6% -1,0% 2,2% 1,8% 1,0% 1,2%Other Transformation & Losses 10 13 15 18 20 22 24 2,3% 1,2% 2,0% 1,2% 0,8% 0,7%Energy Branch Consumption 3 4 5 7 9 9 7 3,1% 2,4% 2,4% 3,2% 0,2% -2,8%Final consumption 17 20 21 22 23 23 23 1,3% 0,8% 0,2% 0,3% 0,0% 0,0%
Steel, Non-Met. Minerals and Chem. 2 3 2 2 2 2 1 1,8% -1,3% -1,2% -1,2% -1,3% -1,2%Other Industry 4 4 4 4 4 5 5 1,0% -1,2% 1,0% 0,9% 0,3% 0,2%Non-Energy Use 2 2 2 2 2 2 1 1,6% 0,6% -1,0% -0,6% -1,1% -1,8%Residential 4 4 4 4 5 5 5 0,6% 1,2% 0,4% 0,7% 0,6% 0,5%Services 2 2 3 3 4 4 5 0,4% 3,7% 0,1% 1,8% 1,3% 1,2%Agriculture 1 1 1 1 1 1 1 4,2% 0,6% 0,5% 1,1% 0,7% 0,6%Road 3 3 4 4 3 3 3 1,4% 1,8% 0,8% -1,1% -1,0% -1,1%Rail 0 0 0 0 0 0 0 -2,2% 0,2% 0,5% 1,3% 0,8% 0,7%Aviation 0 0 0 0 0 0 0 13,4% 2,4% 0,8% -0,6% -1,0% -1,7%Other Transport 1 1 1 1 1 1 1 1,1% 1,3% 0,8% 0,0% -2,1% -2,6%
1 Primary energy from nuclear is calculated considering the primary heat equivalent of the electricity produced with an average efficiency of 33%
85

GECO2015 Global Mitigation 150504 SUMMARY GHG & ENERGY BALANCE##### 100
Norway 1990 2000 2010 2020 2030 2040 2050 '90-'00 '00-'10 '10-'20 '20-'30 '30-'40 '40-'50Power Generation
Fuel Inputs Therm. Power (Mtoe) 0 0 1 2 4 4 5 3,1% 21,3% 8,9% 5,2% 0,7% 2,7%Coal 0 0 0 1 2 2 1 0,1% 5,0% 39,2% 6,1% 1,3% -4,3%Oil 0 0 0 0 0 0 0 -8,8% 10,6% 13,7% 0,1% -30,1% n.s.Gas 0 0 1 1 1 1 1 n.s. 38,7% -1,9% 7,0% 1,0% -2,4%Biomass & Waste 0 0 0 1 1 1 3 1,9% 8,1% 13,4% 1,8% -0,8% 14,9%Other 0 0 0 0 0 0 0 n.s. n.s. n.s. n.s. n.s. n.s.
Gross Elec. Generation (TWh e) 122 143 124 146 166 183 199 1,6% -1,4% 1,6% 1,3% 0,9% 0,9%Coal 0 0 0 4 8 9 6 -1,3% 3,9% 45,3% 6,2% 1,2% -4,2%
of which CCS 0 0 0 0 3 8 6 n.s. n.s. n.s. n.s. 12,5% -3,6%Oil 0 0 0 0 0 0 0 4,1% 13,2% 19,1% 0,2% -30,0% n.s.Gas 0 0 5 4 7 8 6 n.s. 36,9% -3,1% 7,4% 0,9% -2,3%
of which CCS 0 0 0 0 3 5 4 n.s. n.s. n.s. n.s. 7,3% -2,9%Biomass & Waste 0 0 0 3 3 3 14 1,7% 5,5% 17,8% 2,0% 0,4% 16,1%
of which CCS 0 0 0 0 0 1 12 n.s. n.s. n.s. n.s. n.s. 25,5%Nuclear 0 0 0 0 0 0 0 n.s. n.s. n.s. n.s. n.s. n.s.Hydro 121 142 118 127 130 132 134 1,6% -1,9% 0,8% 0,2% 0,1% 0,1%Wind 0 0 1 8 17 29 36 n.s. 41,0% 23,1% 8,3% 5,5% 2,3%Solar 0 0 0 0 1 2 3 n.s. 4,2% 40,6% 14,6% 5,2% 5,3%Other 0 0 0 0 0 0 0 n.s. n.s. n.s. 26,8% 18,2% 12,9%
Generation Capacity (GWe) 27 28 33 44 55 65 69 0,5% 1,4% 3,0% 2,4% 1,7% 0,5%Coal 0 0 0 1 2 3 3 5,9% -4,6% 29,5% 11,0% 4,8% 1,3%
of which CCS 0 0 0 0 0 2 3 n.s. n.s. n.s. n.s. 17,2% 6,3%Oil 0 0 0 1 1 1 2 -17,6% 7,2% 33,7% 5,8% 1,0% 0,8%Gas 0 0 1 7 12 13 11 0,0% 40,2% 20,2% 4,9% 0,7% -1,7%
of which CCS 0 0 0 0 0 2 4 n.s. n.s. n.s. n.s. 17,2% 6,0%Biomass & Waste 0 0 0 2 2 4 5 7,6% -0,7% 28,8% 1,9% 7,9% 1,8%
of which CCS 0 0 0 0 0 0 2 n.s. n.s. n.s. n.s. n.s. 26,3%Nuclear 0 0 0 0 0 0 0 n.s. n.s. n.s. n.s. n.s. n.s.Hydro 27 28 31 30 31 31 32 0,5% 0,9% -0,2% 0,2% 0,1% 0,1%Wind 0 0 0 3 6 11 13 n.s. 42,1% 21,1% 8,1% 5,3% 2,2%Solar 0 0 0 0 1 2 3 n.s. 4,2% 40,6% 14,6% 5,2% 5,3%Other 0 0 0 0 0 0 0 n.s. n.s. n.s. n.s. 17,6% 12,3%
Total Final Consumption 2 (Mtoe) 17 20 21 22 23 23 23 1,3% 0,8% 0,2% 0,3% 0,0% 0,0%Coal 1 1 1 1 1 0 0 2,1% -4,0% -1,7% -1,2% -3,3% -5,2%Oil 7 8 9 8 6 4 3 0,2% 1,3% -0,8% -2,5% -3,2% -3,8%Gas 0 1 1 1 1 1 1 n.s. 2,0% 2,1% 2,3% 0,0% -4,2%Electricity 8 9 10 11 12 13 14 1,2% 0,5% 0,7% 1,3% 1,0% 0,9%Heat 0 0 0 0 1 1 1 5,6% 11,6% 1,0% 3,0% 3,0% 1,9%Biomass & Other 1 1 1 2 2 3 3 2,9% 0,3% 2,6% 3,3% 2,0% 1,6%Share of Renewables 3 (%) 67% 70% 55% 61% 67% 74% 84% 0,3% -2,4% 1,1% 0,9% 1,0% 1,2%
Industry (incl. non-energy use) 8 9 8 8 8 8 8 1,4% -0,8% -0,2% 0,0% -0,4% -0,5%Coal 1 1 1 1 1 0 0 2,2% -4,0% -1,7% -1,2% -3,3% -5,2%Oil 3 2 3 2 2 1 1 -1,3% 1,4% -1,9% -2,3% -2,9% -2,6%Gas 0 1 1 1 1 1 1 n.s. 1,3% 1,6% 1,7% -0,1% -4,2%Electricity 4 4 4 4 4 5 5 1,2% -1,5% 0,8% 0,6% 0,3% 0,3%Heat 0 0 0 0 0 0 0 1,9% 7,1% 0,0% -0,2% -0,3% -0,2%Biomass & Other 0 1 0 0 1 1 1 4,6% -4,1% 0,6% 3,0% 3,1% 2,9%
Buildings 6 6 7 8 9 9 10 0,5% 2,2% 0,3% 1,2% 0,9% 0,8%Coal 0 0 0 0 0 0 0 -7,8% -3,9% -2,2% n.s. n.s. n.s.Oil 1 0 0 0 0 0 0 -5,1% 0,0% -3,1% -4,2% -5,4% -6,0%Gas 0 0 0 0 0 0 0 n.s. 36,3% 11,8% 7,3% 0,6% -4,2%Electricity 4 5 6 6 7 8 8 1,1% 2,0% 0,4% 1,3% 1,0% 1,0%Heat 0 0 0 0 1 1 1 6,5% 12,3% 1,1% 3,3% 3,2% 2,0%Biomass & Other 1 1 1 1 1 1 1 1,5% 2,1% -0,4% 0,0% -0,5% -1,0%
Agriculture 1 1 1 1 1 1 1 4,2% 0,6% 0,5% 1,1% 0,7% 0,6%Coal 0 0 0 0 0 0 0 n.s. n.s. n.s. n.s. n.s. n.s.Oil 0 1 1 1 0 0 0 2,7% 0,4% 0,2% -2,6% -4,2% -4,2%Gas 0 0 0 0 0 0 0 n.s. n.s. -4,7% -1,7% -2,9% -2,9%Electricity 0 0 0 0 0 0 0 12,0% 0,1% 1,0% 3,5% 2,6% 1,8%Heat 0 0 0 0 0 0 0 n.s. n.s. n.s. n.s. n.s. n.s.Biomass & Other 0 0 0 0 0 0 0 n.s. 10,2% 18,6% 22,6% 6,3% 2,6%
Transport 3 4 5 5 5 4 4 1,8% 1,7% 0,8% -0,8% -1,2% -1,3%Coal 0 0 0 0 0 0 0 n.s. n.s. n.s. n.s. n.s. n.s.Oil 3 4 5 5 4 3 2 1,8% 1,5% -0,1% -2,5% -3,1% -4,3%Gas 0 0 0 0 0 0 0 n.s. n.s. n.s. n.s. n.s. n.s.Electricity 0 0 0 0 0 1 1 -0,4% 1,1% 7,5% 14,1% 4,8% 2,6%Heat 0 0 0 0 0 0 0 n.s. n.s. n.s. n.s. n.s. n.s.Biomass & Other 0 0 0 0 1 1 1 n.s. n.s. 16,2% 5,3% 2,1% 1,9%
Energy Branch Consumption 3 4 5 7 9 9 7 3,1% 2,4% 2,4% 3,2% 0,2% -2,8%Other Transformation & Losses 4 10 13 15 18 20 22 24 2,3% 1,2% 2,0% 1,2% 0,8% 0,7%
2 does not include international aviation and maritime bunkers; includes non-energy uses3 ratio of renewable energy over final energy demand increased by distribution losses and self consumption of electricity and steam plants4 includes statistical differences
86
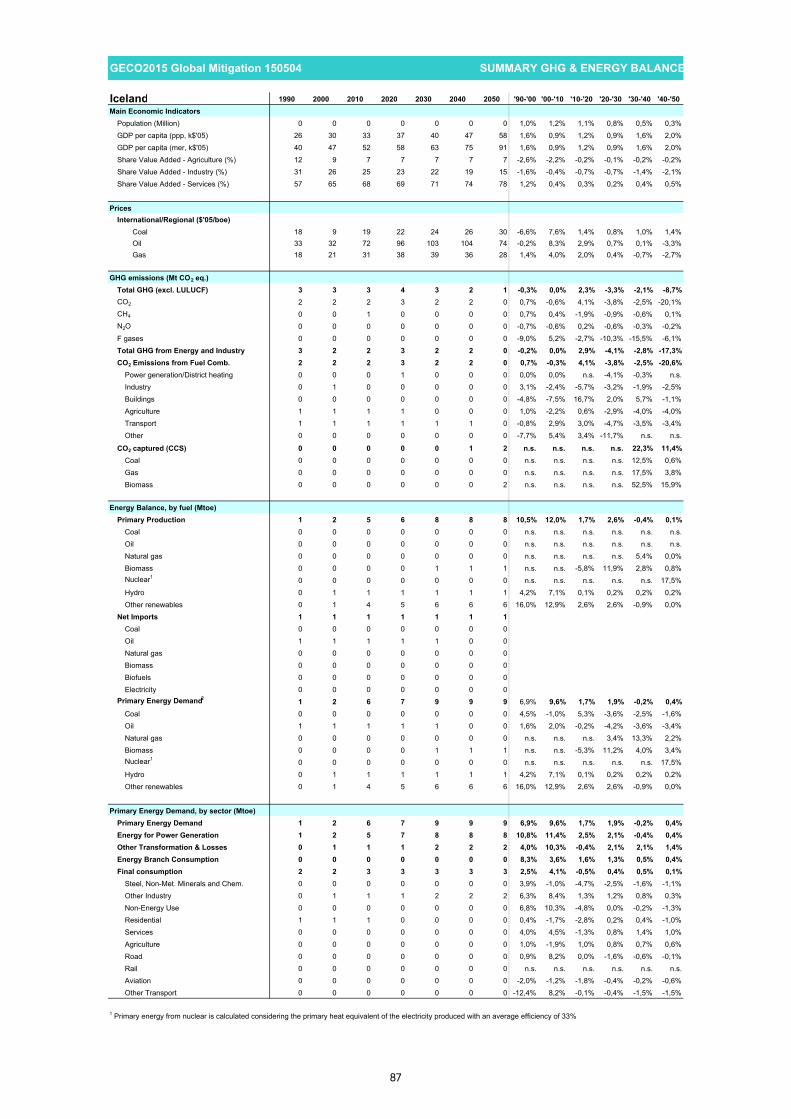
GECO2015 Global Mitigation 150504 SUMMARY GHG & ENERGY BALANCE##### 100
Iceland 1990 2000 2010 2020 2030 2040 2050 '90-'00 '00-'10 '10-'20 '20-'30 '30-'40 '40-'50Main Economic Indicators
Population (Million) 0 0 0 0 0 0 0 1,0% 1,2% 1,1% 0,8% 0,5% 0,3%GDP per capita (ppp, k$'05) 26 30 33 37 40 47 58 1,6% 0,9% 1,2% 0,9% 1,6% 2,0%GDP per capita (mer, k$'05) 40 47 52 58 63 75 91 1,6% 0,9% 1,2% 0,9% 1,6% 2,0%Share Value Added - Agriculture (%) 12 9 7 7 7 7 7 -2,6% -2,2% -0,2% -0,1% -0,2% -0,2%Share Value Added - Industry (%) 31 26 25 23 22 19 15 -1,6% -0,4% -0,7% -0,7% -1,4% -2,1%Share Value Added - Services (%) 57 65 68 69 71 74 78 1,2% 0,4% 0,3% 0,2% 0,4% 0,5%
PricesInternational/Regional ($'05/boe)
Coal 18 9 19 22 24 26 30 -6,6% 7,6% 1,4% 0,8% 1,0% 1,4%Oil 33 32 72 96 103 104 74 -0,2% 8,3% 2,9% 0,7% 0,1% -3,3%Gas 18 21 31 38 39 36 28 1,4% 4,0% 2,0% 0,4% -0,7% -2,7%
GHG emissions (Mt CO2 eq.)Total GHG (excl. LULUCF) 3 3 3 4 3 2 1 -0,3% 0,0% 2,3% -3,3% -2,1% -8,7%CO2 2 2 2 3 2 2 0 0,7% -0,6% 4,1% -3,8% -2,5% -20,1%CH4 0 0 1 0 0 0 0 0,7% 0,4% -1,9% -0,9% -0,6% 0,1%N2O 0 0 0 0 0 0 0 -0,7% -0,6% 0,2% -0,6% -0,3% -0,2%F gases 0 0 0 0 0 0 0 -9,0% 5,2% -2,7% -10,3% -15,5% -6,1%Total GHG from Energy and Industry 3 2 2 3 2 2 0 -0,2% 0,0% 2,9% -4,1% -2,8% -17,3%CO2 Emissions from Fuel Comb. 2 2 2 3 2 2 0 0,7% -0,3% 4,1% -3,8% -2,5% -20,6%
Power generation/District heating 0 0 0 1 0 0 0 0,0% 0,0% n.s. -4,1% -0,3% n.s.Industry 0 1 0 0 0 0 0 3,1% -2,4% -5,7% -3,2% -1,9% -2,5%Buildings 0 0 0 0 0 0 0 -4,8% -7,5% 16,7% 2,0% 5,7% -1,1%Agriculture 1 1 1 1 0 0 0 1,0% -2,2% 0,6% -2,9% -4,0% -4,0%Transport 1 1 1 1 1 1 0 -0,8% 2,9% 3,0% -4,7% -3,5% -3,4%Other 0 0 0 0 0 0 0 -7,7% 5,4% 3,4% -11,7% n.s. n.s.
CO2 captured (CCS) 0 0 0 0 0 1 2 n.s. n.s. n.s. n.s. 22,3% 11,4%Coal 0 0 0 0 0 0 0 n.s. n.s. n.s. n.s. 12,5% 0,6%Gas 0 0 0 0 0 0 0 n.s. n.s. n.s. n.s. 17,5% 3,8%Biomass 0 0 0 0 0 0 2 n.s. n.s. n.s. n.s. 52,5% 15,9%
Energy Balance, by fuel (Mtoe)Primary Production 1 2 5 6 8 8 8 10,5% 12,0% 1,7% 2,6% -0,4% 0,1%
Coal 0 0 0 0 0 0 0 n.s. n.s. n.s. n.s. n.s. n.s.Oil 0 0 0 0 0 0 0 n.s. n.s. n.s. n.s. n.s. n.s.Natural gas 0 0 0 0 0 0 0 n.s. n.s. n.s. n.s. 5,4% 0,0%Biomass 0 0 0 0 1 1 1 n.s. n.s. -5,8% 11,9% 2,8% 0,8%Nuclear1 0 0 0 0 0 0 0 n.s. n.s. n.s. n.s. n.s. 17,5%Hydro 0 1 1 1 1 1 1 4,2% 7,1% 0,1% 0,2% 0,2% 0,2%Other renewables 0 1 4 5 6 6 6 16,0% 12,9% 2,6% 2,6% -0,9% 0,0%
Net Imports 1 1 1 1 1 1 1Coal 0 0 0 0 0 0 0Oil 1 1 1 1 1 0 0Natural gas 0 0 0 0 0 0 0Biomass 0 0 0 0 0 0 0Biofuels 0 0 0 0 0 0 0Electricity 0 0 0 0 0 0 0
Primary Energy Demand2 1 2 6 7 9 9 9 6,9% 9,6% 1,7% 1,9% -0,2% 0,4%Coal 0 0 0 0 0 0 0 4,5% -1,0% 5,3% -3,6% -2,5% -1,6%Oil 1 1 1 1 1 0 0 1,6% 2,0% -0,2% -4,2% -3,6% -3,4%Natural gas 0 0 0 0 0 0 0 n.s. n.s. n.s. 3,4% 13,3% 2,2%Biomass 0 0 0 0 1 1 1 n.s. n.s. -5,3% 11,2% 4,0% 3,4%Nuclear1 0 0 0 0 0 0 0 n.s. n.s. n.s. n.s. n.s. 17,5%Hydro 0 1 1 1 1 1 1 4,2% 7,1% 0,1% 0,2% 0,2% 0,2%Other renewables 0 1 4 5 6 6 6 16,0% 12,9% 2,6% 2,6% -0,9% 0,0%
Primary Energy Demand, by sector (Mtoe)Primary Energy Demand 1 2 6 7 9 9 9 6,9% 9,6% 1,7% 1,9% -0,2% 0,4%Energy for Power Generation 1 2 5 7 8 8 8 10,8% 11,4% 2,5% 2,1% -0,4% 0,4%Other Transformation & Losses 0 1 1 1 2 2 2 4,0% 10,3% -0,4% 2,1% 2,1% 1,4%Energy Branch Consumption 0 0 0 0 0 0 0 8,3% 3,6% 1,6% 1,3% 0,5% 0,4%Final consumption 2 2 3 3 3 3 3 2,5% 4,1% -0,5% 0,4% 0,5% 0,1%
Steel, Non-Met. Minerals and Chem. 0 0 0 0 0 0 0 3,9% -1,0% -4,7% -2,5% -1,6% -1,1%Other Industry 0 1 1 1 2 2 2 6,3% 8,4% 1,3% 1,2% 0,8% 0,3%Non-Energy Use 0 0 0 0 0 0 0 6,8% 10,3% -4,8% 0,0% -0,2% -1,3%Residential 1 1 1 0 0 0 0 0,4% -1,7% -2,8% 0,2% 0,4% -1,0%Services 0 0 0 0 0 0 0 4,0% 4,5% -1,3% 0,8% 1,4% 1,0%Agriculture 0 0 0 0 0 0 0 1,0% -1,9% 1,0% 0,8% 0,7% 0,6%Road 0 0 0 0 0 0 0 0,9% 8,2% 0,0% -1,6% -0,6% -0,1%Rail 0 0 0 0 0 0 0 n.s. n.s. n.s. n.s. n.s. n.s.Aviation 0 0 0 0 0 0 0 -2,0% -1,2% -1,8% -0,4% -0,2% -0,6%Other Transport 0 0 0 0 0 0 0 -12,4% 8,2% -0,1% -0,4% -1,5% -1,5%
1 Primary energy from nuclear is calculated considering the primary heat equivalent of the electricity produced with an average efficiency of 33%
87

GECO2015 Global Mitigation 150504 SUMMARY GHG & ENERGY BALANCE##### 100
Iceland 1990 2000 2010 2020 2030 2040 2050 '90-'00 '00-'10 '10-'20 '20-'30 '30-'40 '40-'50Power Generation
Fuel Inputs Therm. Power (Mtoe) 0 0 0 1 1 1 1 15,7% 12,9% 6,9% 1,5% 2,4% 2,2%Coal 0 0 0 0 0 0 0 n.s. n.s. n.s. -3,1% -3,7% -2,7%Oil 0 0 0 0 0 0 0 0,0% 0,0% 45,1% -11,4% n.s. n.s.Gas 0 0 0 0 0 0 0 n.s. n.s. n.s. 2,1% 14,7% 2,6%Biomass & Waste 0 0 0 0 0 0 0 n.s. n.s. n.s. 7,5% 9,1% 7,8%Other 0 0 0 0 1 1 1 16,0% 12,9% 2,5% 2,4% -1,1% 0,0%
Gross Elec. Generation (TWh e) 5 8 17 20 23 25 27 5,5% 8,3% 1,7% 1,3% 1,0% 0,7%Coal 0 0 0 1 0 0 0 n.s. n.s. n.s. -3,1% -3,9% -2,9%
of which CCS 0 0 0 0 0 0 0 n.s. n.s. n.s. n.s. 10,7% -0,5%Oil 0 0 0 0 0 0 0 -1,8% -8,8% 57,5% -11,5% n.s. n.s.Gas 0 0 0 0 0 2 2 n.s. n.s. n.s. 2,4% 14,6% 2,5%
of which CCS 0 0 0 0 0 0 0 n.s. n.s. n.s. n.s. 16,7% 4,0%Biomass & Waste 0 0 0 0 0 1 2 n.s. n.s. n.s. 8,0% 9,6% 8,4%
of which CCS 0 0 0 0 0 0 1 n.s. n.s. n.s. n.s. n.s. 14,2%Nuclear 0 0 0 0 0 0 0 n.s. n.s. n.s. n.s. n.s. n.s.Hydro 4 6 13 13 13 13 13 4,2% 7,1% 0,1% 0,2% 0,2% 0,2%Wind 0 0 0 1 2 3 2 n.s. n.s. n.s. 11,2% 5,0% -0,3%Solar 0 0 0 0 0 0 0 n.s. n.s. n.s. 15,9% 6,0% 3,2%Other 0 1 4 6 7 7 7 16,0% 12,9% 2,5% 2,4% -1,0% 0,4%
Generation Capacity (GWe) 1 1 3 4 6 7 7 3,9% 6,6% 5,4% 2,4% 2,3% 0,1%Coal 0 0 0 0 0 0 0 n.s. n.s. n.s. 0,8% 0,0% -14,7%
of which CCS 0 0 0 0 0 0 0 n.s. n.s. n.s. n.s. 12,4% 0,4%Oil 0 0 0 0 0 0 0 0,4% 0,1% 8,8% 0,0% 0,0% -1,5%Gas 0 0 0 0 0 1 1 n.s. n.s. n.s. 4,6% 13,9% 1,5%
of which CCS 0 0 0 0 0 0 0 n.s. n.s. n.s. n.s. 18,0% 4,5%Biomass & Waste 0 0 0 0 0 0 0 n.s. n.s. n.s. 7,7% 8,2% 7,6%
of which CCS 0 0 0 0 0 0 0 n.s. n.s. n.s. n.s. n.s. 14,6%Nuclear 0 0 0 0 0 0 0 n.s. n.s. n.s. n.s. n.s. n.s.Hydro 1 1 2 2 2 2 2 3,5% 5,9% 0,2% 0,2% 0,2% 0,2%Wind 0 0 0 0 1 1 1 n.s. n.s. n.s. 11,1% 4,9% -0,3%Solar 0 0 0 0 0 0 0 n.s. n.s. n.s. 15,9% 6,0% 3,2%Other 0 0 1 2 2 2 2 14,3% 12,8% 10,9% 2,9% 1,4% -0,1%
Total Final Consumption 2 (Mtoe) 2 2 3 3 3 3 3 2,5% 4,1% -0,5% 0,4% 0,5% 0,1%Coal 0 0 0 0 0 0 0 4,5% -1,0% -9,9% -6,2% -3,3% -2,1%Oil 1 1 1 1 1 0 0 1,6% 2,0% -0,7% -4,0% -3,4% -3,4%Gas 0 0 0 0 0 0 0 n.s. n.s. n.s. 8,5% 7,6% -0,5%Electricity 0 1 1 2 2 2 2 5,9% 8,6% 1,8% 1,3% 1,0% 0,7%Heat 1 1 1 0 0 0 0 1,0% -0,9% -4,8% 0,1% 0,1% -1,1%Biomass & Other 0 0 0 0 0 0 0 n.s. n.s. -5,8% 10,3% 2,8% 0,7%Share of Renewables 3 (%) 28% 36% 58% 61% 73% 75% 78% 2,2% 5,0% 0,5% 1,8% 0,3% 0,4%
Industry (incl. non-energy use) 0 1 2 2 2 2 2 5,8% 7,1% -0,2% 0,9% 0,6% 0,1%Coal 0 0 0 0 0 0 0 4,5% -1,0% -9,9% -6,2% -3,3% -2,1%Oil 0 0 0 0 0 0 0 4,5% 4,6% -6,2% -3,9% -3,0% -3,3%Gas 0 0 0 0 0 0 0 n.s. n.s. n.s. 7,8% 7,5% 1,3%Electricity 0 0 1 1 2 2 2 7,4% 10,1% 1,3% 1,2% 0,7% 0,3%Heat 0 0 0 0 0 0 0 2,4% -4,8% 0,0% -0,2% -0,3% -0,2%Biomass & Other 0 0 0 0 0 0 0 n.s. n.s. n.s. 11,3% 2,2% -0,4%
Buildings 1 1 1 1 1 1 1 1,0% -0,2% -2,3% 0,4% 0,8% -0,2%Coal 0 0 0 0 0 0 0 n.s. n.s. n.s. n.s. n.s. n.s.Oil 0 0 0 0 0 0 0 -4,8% -7,5% 12,4% -3,4% 2,0% -0,4%Gas 0 0 0 0 0 0 0 n.s. n.s. n.s. 8,8% 7,6% -1,4%Electricity 0 0 0 0 0 0 0 2,4% 1,6% 3,4% -0,2% 1,2% 1,9%Heat 1 1 1 0 0 0 0 0,9% -0,6% -5,2% 0,1% 0,1% -1,2%Biomass & Other 0 0 0 0 0 0 0 n.s. n.s. n.s. 11,2% -1,7% -9,9%
Agriculture 0 0 0 0 0 0 0 1,0% -1,9% 1,0% 0,8% 0,7% 0,6%Coal 0 0 0 0 0 0 0 n.s. n.s. n.s. n.s. n.s. n.s.Oil 0 0 0 0 0 0 0 1,0% -2,2% 0,6% -2,9% -4,0% -4,0%Gas 0 0 0 0 0 0 0 n.s. n.s. n.s. n.s. n.s. n.s.Electricity 0 0 0 0 0 0 0 0,9% 1,1% 1,9% 4,1% 3,6% 2,6%Heat 0 0 0 0 0 0 0 n.s. n.s. n.s. n.s. n.s. n.s.Biomass & Other 0 0 0 0 0 0 0 n.s. n.s. n.s. 24,3% 6,2% 2,6%
Transport 0 0 0 0 0 0 0 0,0% 8,0% -0,1% -1,5% -0,6% -0,1%Coal 0 0 0 0 0 0 0 n.s. n.s. n.s. n.s. n.s. n.s.Oil 0 0 0 0 0 0 0 0,0% 2,9% 3,0% -4,7% -3,5% -3,4%Gas 0 0 0 0 0 0 0 n.s. n.s. n.s. n.s. n.s. n.s.Electricity 0 0 0 0 0 0 0 n.s. n.s. n.s. 11,8% 4,0% 2,6%Heat 0 0 0 0 0 0 0 n.s. n.s. n.s. n.s. n.s. n.s.Biomass & Other 0 0 0 0 0 0 0 n.s. n.s. -12,1% 4,2% 1,2% 1,0%
Energy Branch Consumption 0 0 0 0 0 0 0 8,3% 3,6% 1,6% 1,3% 0,5% 0,4%Other Transformation & Losses 4 0 1 1 1 2 2 2 4,0% 10,3% -0,4% 2,1% 2,1% 1,4%
2 does not include international aviation and maritime bunkers; includes non-energy uses3 ratio of renewable energy over final energy demand increased by distribution losses and self consumption of electricity and steam plants4 includes statistical differences
88

GECO2015 Global Mitigation 150504 SUMMARY GHG & ENERGY BALANCE##### 100
Switzerland 1990 2000 2010 2020 2030 2040 2050 '90-'00 '00-'10 '10-'20 '20-'30 '30-'40 '40-'50Main Economic Indicators
Population (Million) 7 7 8 9 9 10 11 0,7% 0,9% 1,0% 0,9% 0,8% 0,7%GDP per capita (ppp, k$'05) 35 36 39 42 48 52 56 0,4% 0,8% 0,8% 1,1% 0,9% 0,8%GDP per capita (mer, k$'05) 48 50 55 59 67 73 78 0,4% 0,8% 0,8% 1,1% 0,9% 0,8%Share Value Added - Agriculture (%) 15 9 5 5 5 5 5 -4,7% -5,5% -0,1% -0,1% -0,1% -0,1%Share Value Added - Industry (%) 31 27 26 24 22 20 19 -1,6% -0,2% -0,6% -1,0% -0,9% -0,8%Share Value Added - Services (%) 54 64 69 70 73 75 76 1,8% 0,7% 0,2% 0,3% 0,3% 0,2%
PricesInternational/Regional ($'05/boe)
Coal 18 9 19 22 24 26 30 -6,6% 7,6% 1,4% 0,8% 1,0% 1,4%Oil 33 32 72 96 103 104 74 -0,2% 8,3% 2,9% 0,7% 0,1% -3,3%Gas 18 21 31 38 39 36 28 1,4% 4,0% 2,0% 0,4% -0,7% -2,7%
GHG emissions (Mt CO2 eq.)Total GHG (excl. LULUCF) 52 50 52 50 40 27 17 -0,3% 0,3% -0,3% -2,2% -3,7% -4,5%CO2 44 43 44 42 33 21 12 -0,2% 0,2% -0,4% -2,2% -4,5% -5,6%CH4 5 4 4 4 3 3 3 -1,7% -0,3% -0,3% -2,1% 0,2% -1,3%N2O 3 3 3 3 3 3 3 -0,9% -0,1% 0,3% -0,4% 0,4% -1,5%F gases 0 1 1 2 1 0 0 11,5% 6,1% 1,7% -9,8% -14,4% -3,5%Total GHG from Energy and Industry 46 45 46 44 34 21 12 -0,2% 0,3% -0,4% -2,4% -4,6% -5,5%CO2 Emissions from Fuel Comb. 41 41 41 40 31 19 11 0,0% 0,2% -0,5% -2,3% -4,7% -5,8%
Power generation/District heating 1 0 0 2 3 1 1 -4,2% -0,8% 20,4% 3,3% -13,0% -2,9%Industry 5 5 5 5 5 4 3 0,0% -0,7% -0,5% -0,3% -2,2% -2,0%Buildings 19 17 17 12 9 6 4 -1,3% 0,2% -3,2% -2,8% -4,2% -4,9%Agriculture 0 0 0 0 0 0 0 -0,8% 1,7% 1,3% -1,8% -2,9% -3,0%Transport 15 17 17 18 13 8 4 1,3% 0,3% 0,6% -3,6% -4,3% -5,8%Other 1 1 1 1 1 0 - 1 4,0% 2,1% 0,1% -2,4% -10,7% n.s.
CO2 captured (CCS) 0 0 0 0 1 3 3 n.s. n.s. n.s. n.s. 14,2% 0,5%Coal 0 0 0 0 1 2 1 n.s. n.s. n.s. 57,3% 12,7% -8,0%Gas 0 0 0 0 0 1 0 n.s. n.s. n.s. n.s. 14,5% -11,0%Biomass 0 0 0 0 0 0 2 n.s. n.s. n.s. n.s. 26,8% 17,1%
Energy Balance, by fuel (Mtoe)Primary Production 10 12 13 14 18 21 25 1,6% 0,4% 0,8% 2,7% 1,6% 1,7%
Coal 0 0 0 0 0 0 0 n.s. n.s. n.s. n.s. n.s. n.s.Oil 0 0 0 0 0 0 0 n.s. n.s. n.s. n.s. n.s. n.s.Natural gas 0 0 0 0 0 0 0 n.s. n.s. n.s. n.s. 5,7% 0,4%Biomass 1 2 2 2 5 5 6 2,3% 2,7% -0,3% 8,2% -0,7% 1,9%Nuclear1 6 7 7 8 8 9 11 1,1% 0,0% 1,1% 0,3% 1,8% 1,2%Hydro 3 3 3 3 3 3 3 2,1% -0,1% -0,1% 0,0% 0,0% 0,0%Other renewables 0 0 0 0 2 4 5 11,1% 10,9% 21,4% 14,3% 7,9% 4,0%
Net Imports 14 13 14 13 10 6 1Coal 0 0 0 1 1 1 0Oil 12 11 10 9 6 3 2Natural gas 2 2 3 3 3 3 2Biomass 0 0 0 0 - 1 - 2 - 3Biofuels 0 0 0 0 0 0 0Electricity 0 - 1 0 0 0 0 0
Primary Energy Demand2 24 25 26 26 28 27 26 0,4% 0,4% 0,0% 0,5% -0,4% -0,2%Coal 0 0 0 1 1 1 0 -9,1% 1,1% 16,8% 2,6% -1,4% -7,0%Oil 12 11 10 9 6 3 2 -0,8% -0,6% -1,3% -4,1% -5,6% -7,6%Natural gas 2 2 3 3 3 3 2 4,0% 2,1% 0,0% 1,5% -1,9% -2,5%Biomass 1 2 2 2 4 3 3 2,3% 2,7% -1,9% 8,2% -3,0% -1,6%Nuclear1 6 7 7 8 8 9 11 1,1% 0,0% 1,1% 0,3% 1,8% 1,2%Hydro 3 3 3 3 3 3 3 2,1% -0,1% -0,1% 0,0% 0,0% 0,0%Other renewables 0 0 0 0 2 4 5 11,1% 10,9% 21,4% 14,3% 7,9% 4,0%
Primary Energy Demand, by sector (Mtoe)Primary Energy Demand 24 25 26 26 28 27 26 0,4% 0,4% 0,0% 0,5% -0,4% -0,2%Energy for Power Generation 10 11 12 12 16 17 20 1,5% 0,2% 0,7% 2,4% 1,1% 1,3%Other Transformation & Losses 5 5 5 5 8 10 11 0,6% -0,8% 1,9% 3,8% 1,9% 1,6%Energy Branch Consumption 0 1 1 1 1 1 1 3,4% 1,4% 0,1% 0,3% -0,4% 0,0%Final consumption 19 20 21 21 20 19 18 0,5% 0,7% -0,1% -0,2% -0,5% -0,6%
Steel, Non-Met. Minerals and Chem. 1 1 1 1 1 1 1 1,2% 1,0% -0,5% -0,6% -1,0% -1,1%Other Industry 2 3 3 3 3 3 3 1,7% -0,4% 0,4% 1,4% 0,6% 0,2%Non-Energy Use 1 1 1 1 0 0 0 0,2% -0,5% -0,6% -0,4% -1,0% -1,7%Residential 6 6 6 6 6 5 5 -0,6% 1,5% -1,4% -0,1% -0,6% -0,8%Services 3 3 4 4 4 4 4 -0,1% 0,9% 0,0% 0,6% 0,1% 0,0%Agriculture 0 0 0 0 0 0 0 3,1% 0,5% 1,3% 0,9% 0,7% 0,6%Road 5 5 6 6 5 5 4 1,4% 0,4% 0,9% -1,4% -1,6% -1,7%Rail 0 0 0 0 0 0 0 0,3% 1,8% 0,6% 1,2% 0,8% 0,7%Aviation 0 0 0 0 0 0 0 -4,9% -2,8% 1,1% -1,2% -1,4% -2,3%Other Transport 0 0 0 0 0 0 0 2,3% -1,0% 0,8% -0,5% -2,3% -2,8%
1 Primary energy from nuclear is calculated considering the primary heat equivalent of the electricity produced with an average efficiency of 33%
89

GECO2015 Global Mitigation 150504 SUMMARY GHG & ENERGY BALANCE##### 100
Switzerland 1990 2000 2010 2020 2030 2040 2050 '90-'00 '00-'10 '10-'20 '20-'30 '30-'40 '40-'50Power Generation
Fuel Inputs Therm. Power (Mtoe) 1 1 1 1 3 1 1 2,3% 2,4% -2,0% 10,9% -8,8% -5,7%Coal 0 0 0 0 1 0 0 n.s. n.s. n.s. 2,7% -1,9% -20,1%Oil 0 0 0 0 0 0 0 -12,5% -9,2% n.s. n.s. n.s. n.s.Gas 0 0 0 0 1 1 0 5,4% 0,9% 6,1% 10,5% -2,8% -2,1%Biomass & Waste 1 1 1 0 2 0 0 3,7% 2,8% -12,2% 17,9% -22,7% 2,2%Other 0 0 0 0 0 0 0 n.s. n.s. n.s. n.s. n.s. n.s.
Gross Elec. Generation (TWh e) 56 68 68 76 96 113 131 1,9% 0,1% 1,1% 2,4% 1,6% 1,4%Coal 0 0 0 2 3 2 0 n.s. n.s. n.s. 2,7% -2,2% -19,8%
of which CCS 0 0 0 0 1 2 0 n.s. n.s. n.s. n.s. 11,8% -19,9%Oil 0 0 0 0 0 0 0 -5,2% -11,1% n.s. n.s. n.s. n.s.Gas 0 1 1 1 4 3 3 10,0% 2,0% 3,6% 10,1% -2,0% -2,2%
of which CCS 0 0 0 0 0 1 0 n.s. n.s. n.s. n.s. 15,9% -11,9%Biomass & Waste 1 2 2 1 6 0 1 8,1% 3,3% -8,0% 18,6% -22,2% 3,4%
of which CCS 0 0 0 0 0 0 0 n.s. n.s. n.s. n.s. n.s. 27,6%Nuclear 24 26 26 30 31 38 42 1,1% 0,0% 1,2% 0,6% 1,8% 1,2%Hydro 31 38 38 37 37 37 37 2,1% -0,1% -0,1% 0,0% 0,0% 0,0%Wind 0 0 0 2 11 24 33 n.s. 42,0% 37,8% 16,0% 8,0% 3,5%Solar 0 0 0 1 4 9 14 21,3% 22,0% 28,8% 10,1% 8,2% 4,8%Other 0 0 0 0 0 0 0 n.s. n.s. n.s. 27,1% 23,2% 15,5%
Generation Capacity (GWe) 16 19 20 26 34 46 55 1,5% 0,5% 2,8% 2,7% 3,1% 1,9%Coal 0 0 0 1 1 1 1 n.s. n.s. 26,3% 2,2% 1,8% 0,4%
of which CCS 0 0 0 0 0 1 1 n.s. n.s. n.s. n.s. 19,2% 8,6%Oil 0 0 0 1 1 1 1 5,2% 5,3% 11,9% 2,1% 0,0% 0,8%Gas 0 0 0 1 2 2 3 8,7% 2,0% 13,6% 4,3% 3,6% 2,7%
of which CCS 0 0 0 0 0 0 1 n.s. n.s. n.s. n.s. 22,8% 12,3%Biomass & Waste 0 0 0 2 3 3 2 6,9% 2,8% 15,7% 4,8% 1,6% -3,6%
of which CCS 0 0 0 0 0 0 0 n.s. n.s. n.s. n.s. n.s. 32,9%Nuclear 3 3 3 4 4 5 5 0,8% 0,2% 1,8% 0,1% 2,0% 1,2%Hydro 13 15 15 15 15 15 15 1,4% 0,3% 0,0% 0,0% 0,0% 0,0%Wind 0 0 0 1 5 10 14 n.s. 31,2% 38,0% 15,9% 7,9% 3,4%Solar 0 0 0 1 4 8 13 21,3% 22,0% 28,8% 10,2% 8,2% 4,8%Other 0 0 0 0 0 0 0 n.s. n.s. n.s. n.s. 22,6% 15,0%
Total Final Consumption 2 (Mtoe) 19 20 21 21 20 19 18 0,5% 0,7% -0,1% -0,2% -0,5% -0,6%Coal 0 0 0 0 0 0 0 -8,8% 1,1% 5,5% 2,3% -0,5% 0,4%Oil 12 11 11 10 7 4 2 -0,2% -0,3% -1,2% -3,7% -4,6% -5,3%Gas 1 2 3 3 3 2 2 3,9% 2,3% -0,5% 0,1% -1,6% -2,6%Electricity 4 5 5 6 7 9 10 1,1% 1,3% 1,1% 2,4% 1,7% 1,5%Heat 0 0 1 1 1 2 2 3,1% 5,0% 1,4% 3,8% 3,2% 2,1%Biomass & Other 1 1 1 2 2 2 2 1,2% 2,4% 2,3% 3,7% 0,5% -3,1%Share of Renewables 3 (%) 18% 21% 21% 24% 34% 43% 52% 1,5% 0,0% 1,1% 3,7% 2,4% 1,7%
Industry (incl. non-energy use) 4 4 4 4 5 5 5 1,3% 0,0% 0,0% 0,6% 0,0% -0,2%Coal 0 0 0 0 0 0 0 -9,0% 1,0% 5,9% 2,5% -0,5% 0,4%Oil 1 1 1 1 1 1 0 1,2% -1,8% -2,2% -1,9% -3,0% -3,0%Gas 1 1 1 1 1 1 1 2,3% 1,5% -0,4% -0,1% -0,6% -0,1%Electricity 1 2 2 2 2 2 3 0,5% 0,6% 1,2% 1,7% 1,0% 0,9%Heat 0 0 0 0 0 0 0 10,6% 1,7% 0,0% -0,2% -0,3% -0,2%Biomass & Other 0 0 0 0 0 1 0 11,0% -0,1% -1,2% 1,5% 1,5% -4,6%
Buildings 9 9 10 9 9 9 9 -0,4% 1,2% -0,9% 0,2% -0,3% -0,5%Coal 0 0 0 0 0 0 0 -4,5% 3,1% -4,2% -14,1% n.s. n.s.Oil 5 4 4 3 2 1 0 -2,1% -0,5% -4,1% -4,5% -6,1% -5,7%Gas 1 1 2 2 2 1 1 3,8% 2,7% -0,7% 0,3% -2,1% -4,2%Electricity 2 3 3 3 4 5 5 1,6% 1,7% 0,9% 1,6% 1,2% 1,4%Heat 0 0 1 1 1 1 2 0,8% 6,3% 1,8% 4,7% 3,6% 2,3%Biomass & Other 1 0 1 1 1 1 0 -3,4% 3,9% 2,7% 1,3% -1,5% -8,3%
Agriculture 0 0 0 0 0 0 0 3,1% 0,5% 1,3% 0,9% 0,7% 0,6%Coal 0 0 0 0 0 0 0 n.s. n.s. n.s. n.s. n.s. n.s.Oil 0 0 0 0 0 0 0 n.s. n.s. n.s. n.s. n.s. n.s.Gas 0 0 0 0 0 0 0 n.s. 1,7% 1,3% -1,8% -2,9% -3,0%Electricity 0 0 0 0 0 0 0 1,2% 0,1% 1,1% 2,0% 1,8% 1,4%Heat 0 0 0 0 0 0 0 n.s. n.s. n.s. n.s. n.s. n.s.Biomass & Other 0 0 0 0 0 0 0 40,5% -5,0% 2,1% 10,1% 5,2% 2,6%
Transport 5 6 6 7 6 5 4 1,2% 0,4% 0,9% -1,3% -1,4% -1,5%Coal 0 0 0 0 0 0 0 n.s. n.s. n.s. n.s. n.s. n.s.Oil 5 6 6 6 4 3 1 1,3% 0,2% 0,6% -3,6% -4,3% -5,8%Gas 0 0 0 0 0 0 0 n.s. n.s. n.s. n.s. n.s. n.s.Electricity 0 0 0 0 1 2 2 0,3% 1,9% 3,2% 10,2% 4,5% 2,6%Heat 0 0 0 0 0 0 0 n.s. n.s. n.s. n.s. n.s. n.s.Biomass & Other 0 0 0 0 1 1 1 n.s. n.s. 15,0% 13,5% 2,3% 0,9%
Energy Branch Consumption 0 1 1 1 1 1 1 3,4% 1,4% 0,1% 0,3% -0,4% 0,0%Other Transformation & Losses 4 5 5 5 5 8 10 11 0,6% -0,8% 1,9% 3,8% 1,9% 1,6%
2 does not include international aviation and maritime bunkers; includes non-energy uses3 ratio of renewable energy over final energy demand increased by distribution losses and self consumption of electricity and steam plants4 includes statistical differences
90

GECO2015 Global Mitigation 150504 SUMMARY GHG & ENERGY BALANCE##### 100
Russia 1990 2000 2010 2020 2030 2040 2050 '90-'00 '00-'10 '10-'20 '20-'30 '30-'40 '40-'50Main Economic Indicators
Population (Million) 148 147 144 140 134 127 121 -0,1% -0,2% -0,3% -0,5% -0,5% -0,5%GDP per capita (ppp, k$'05) 13 9 14 19 26 33 34 -3,8% 5,1% 3,1% 3,3% 2,1% 0,5%GDP per capita (mer, k$'05) 6 4 6 9 12 15 15 -3,8% 5,1% 3,1% 3,3% 2,1% 0,5%Share Value Added - Agriculture (%) 17 6 4 4 3 3 3 -9,0% -5,0% -0,7% -0,7% -0,4% -0,1%Share Value Added - Industry (%) 48 38 35 35 32 31 30 -2,4% -0,9% 0,0% -0,7% -0,6% -0,2%Share Value Added - Services (%) 35 56 61 62 64 66 67 4,7% 1,0% 0,0% 0,4% 0,3% 0,1%
PricesInternational/Regional ($'05/boe)
Coal 18 9 19 22 24 26 30 -6,6% 7,6% 1,4% 0,8% 1,0% 1,4%Oil 33 32 72 96 103 104 74 -0,2% 8,3% 2,9% 0,7% 0,1% -3,3%Gas 18 21 31 38 39 36 28 1,4% 4,0% 2,0% 0,4% -0,7% -2,7%
GHG emissions (Mt CO2 eq.)Total GHG (excl. LULUCF) 3 331 2 175 2 275 2 225 1 520 975 461 -4,2% 0,4% -0,2% -3,7% -4,3% -7,2%CO2 2 489 1 605 1 662 1 691 1 164 718 289 -4,3% 0,4% 0,2% -3,7% -4,7% -8,7%CH4 588 433 488 394 244 164 101 -3,0% 1,2% -2,1% -4,7% -3,9% -4,7%N2O 213 109 110 118 105 91 71 -6,5% 0,2% 0,7% -1,2% -1,4% -2,5%F gases 41 29 14 22 7 1 1 -3,5% -6,9% 4,4% -10,7% -17,0% -4,5%Total GHG from Energy and Industry 3 013 2 022 2 133 2 076 1 390 866 385 -3,9% 0,5% -0,3% -3,9% -4,6% -7,8%CO2 Emissions from Fuel Comb. 2 285 1 478 1 520 1 542 1 055 638 239 -4,3% 0,3% 0,1% -3,7% -4,9% -9,4%
Power generation/District heating 807 594 579 551 310 122 - 33 -3,0% -0,3% -0,5% -5,6% -8,9% n.s.Industry 229 176 203 217 166 121 68 -2,6% 1,4% 0,7% -2,7% -3,1% -5,6%Buildings 336 170 138 128 78 37 14 -6,6% -2,1% -0,7% -4,8% -7,2% -9,2%Agriculture 49 21 14 15 12 8 5 -8,3% -4,1% 1,1% -2,6% -4,2% -4,7%Transport 229 127 170 200 178 141 84 -5,7% 2,9% 1,7% -1,2% -2,3% -5,0%Other 634 391 418 430 311 209 101 -4,7% 0,7% 0,3% -3,2% -3,9% -7,0%
CO2 captured (CCS) 0 0 0 0 35 147 275 n.s. n.s. n.s. n.s. 15,6% 6,5%Coal 0 0 0 0 10 49 72 n.s. n.s. n.s. n.s. 17,4% 4,0%Gas 0 0 0 0 25 76 90 n.s. n.s. n.s. n.s. 11,8% 1,8%Biomass 0 0 0 0 0 23 113 n.s. n.s. n.s. 11,7% n.s. 17,4%
Energy Balance, by fuel (Mtoe)Primary Production 1 228 961 1 266 1 365 1 415 1 392 1 235 -2,4% 2,8% 0,8% 0,4% -0,2% -1,2%
Coal 140 111 155 181 149 144 140 -2,3% 3,5% 1,5% -2,0% -0,3% -0,3%Oil 510 325 511 531 495 423 349 -4,4% 4,6% 0,4% -0,7% -1,6% -1,9%Natural gas 524 472 536 577 608 597 476 -1,0% 1,3% 0,7% 0,5% -0,2% -2,2%Biomass 8 5 4 10 39 76 108 -5,5% -1,0% 8,8% 14,6% 6,9% 3,7%Nuclear1 31 35 45 47 99 112 111 1,0% 2,7% 0,4% 7,8% 1,2% -0,1%Hydro 14 14 14 15 18 19 20 0,0% 0,2% 0,4% 1,5% 0,8% 0,4%Other renewables 0 0 0 5 8 22 31 7,6% 24,2% 26,5% 6,0% 10,2% 3,8%
Net Imports - 349 - 344 - 568 - 646 - 778 - 824 - 743Coal 39 9 - 41 - 64 - 80 - 84 - 84Oil - 249 - 199 - 372 - 365 - 343 - 299 - 260Natural gas - 138 - 154 - 153 - 213 - 346 - 418 - 370Biomass 0 0 0 - 1 - 5 - 17 - 23Biofuels 0 0 0 - 1 - 3 - 4 - 5Electricity - 1 - 1 - 2 - 1 - 1 - 1 - 1
Primary Energy Demand2 879 617 698 720 637 567 491 -3,5% 1,2% 0,3% -1,2% -1,2% -1,4%Coal 178 120 114 117 69 60 56 -3,9% -0,5% 0,2% -5,2% -1,4% -0,7%Oil 261 126 139 166 152 123 89 -7,0% 1,0% 1,8% -0,9% -2,0% -3,3%Natural gas 386 319 383 364 263 178 106 -1,9% 1,8% -0,5% -3,2% -3,8% -5,0%Biomass 8 5 4 9 34 59 85 -5,5% -1,0% 7,8% 14,2% 5,7% 3,7%Nuclear1 31 35 45 47 99 112 111 1,0% 2,7% 0,4% 7,8% 1,2% -0,1%Hydro 14 14 14 15 18 19 20 0,0% 0,2% 0,4% 1,5% 0,8% 0,4%Other renewables 0 0 0 5 8 22 31 7,6% 24,2% 26,5% 6,0% 10,2% 3,8%
Primary Energy Demand, by sector (Mtoe)Primary Energy Demand 879 617 698 720 637 567 491 -3,5% 1,2% 0,3% -1,2% -1,2% -1,4%Energy for Power Generation 328 254 274 267 257 255 254 -2,5% 0,8% -0,3% -0,4% -0,1% 0,0%Other Transformation & Losses 126 75 115 134 152 167 172 -5,0% 4,4% 1,5% 1,3% 0,9% 0,3%Energy Branch Consumption 184 152 159 160 123 96 71 -1,9% 0,4% 0,1% -2,6% -2,5% -2,9%Final consumption 605 400 416 449 412 374 318 -4,1% 0,4% 0,8% -0,8% -1,0% -1,6%
Steel, Non-Met. Minerals and Chem. 102 78 88 92 71 58 49 -2,7% 1,2% 0,4% -2,5% -2,0% -1,8%Other Industry 128 65 52 55 52 50 48 -6,5% -2,2% 0,4% -0,5% -0,3% -0,4%Non-Energy Use 40 36 60 72 72 68 56 -1,0% 5,2% 1,8% 0,1% -0,7% -1,8%Residential 168 140 111 108 88 72 57 -1,8% -2,3% -0,3% -2,1% -1,9% -2,4%Services 62 25 37 42 46 46 41 -8,7% 3,9% 1,4% 0,9% -0,1% -1,2%Agriculture 22 9 6 7 8 8 9 -8,3% -4,4% 1,4% 1,3% 0,8% 0,4%Road 55 34 48 58 60 57 48 -4,5% 3,4% 1,9% 0,3% -0,4% -1,9%Rail 12 5 7 7 7 7 7 -7,6% 2,1% 0,7% 0,5% -0,1% -0,8%Aviation 9 5 5 6 6 5 3 -6,9% 1,4% 2,2% -0,5% -2,3% -3,6%Other Transport 7 1 1 1 1 1 1 -14,7% -1,5% 0,9% -0,3% -2,6% -4,2%
1 Primary energy from nuclear is calculated considering the primary heat equivalent of the electricity produced with an average efficiency of 33%
91

GECO2015 Global Mitigation 150504 SUMMARY GHG & ENERGY BALANCE##### 100
Russia 1990 2000 2010 2020 2030 2040 2050 '90-'00 '00-'10 '10-'20 '20-'30 '30-'40 '40-'50Power Generation
Fuel Inputs Therm. Power (Mtoe) 283 206 214 201 132 103 92 -3,1% 0,4% -0,6% -4,1% -2,5% -1,1%Coal 66 65 48 46 19 17 17 -0,2% -3,0% -0,4% -8,5% -1,1% 0,1%Oil 46 12 4 8 6 2 0 -12,6% -10,2% 7,0% -2,9% -8,7% -15,0%Gas 170 127 160 146 104 71 46 -2,9% 2,4% -0,9% -3,4% -3,7% -4,4%Biomass & Waste 0 2 2 1 3 12 29 29,4% 1,7% -12,6% 20,6% 13,4% 9,5%Other 0 0 0 0 0 0 0 7,6% 24,2% 9,7% 3,3% 0,9% -0,2%
Gross Elec. Generation (TWh e) 1 082 875 1 035 1 205 1 291 1 375 1 431 -2,1% 1,7% 1,5% 0,7% 0,6% 0,4%Coal 157 176 166 173 81 78 82 1,1% -0,6% 0,4% -7,4% -0,3% 0,5%
of which CCS 0 0 0 0 11 54 80 n.s. n.s. n.s. n.s. 16,8% 4,0%Oil 129 33 9 35 26 10 2 -12,7% -11,9% 14,1% -3,0% -8,7% -14,8%Gas 512 370 521 600 496 386 274 -3,2% 3,5% 1,4% -1,9% -2,5% -3,4%
of which CCS 0 0 0 0 51 164 208 n.s. n.s. n.s. n.s. 12,3% 2,4%Biomass & Waste 0 0 0 2 15 55 142 n.s. n.s. n.s. 21,8% 13,8% 10,0%
of which CCS 0 0 0 0 0 21 88 n.s. n.s. n.s. n.s. n.s. 15,6%Nuclear 118 131 170 177 393 447 441 1,0% 2,7% 0,4% 8,3% 1,3% -0,1%Hydro 166 165 168 176 204 221 230 0,0% 0,2% 0,4% 1,5% 0,8% 0,4%Wind 0 0 0 40 65 138 171 n.s. 25,4% n.s. 5,0% 7,8% 2,2%Solar 0 0 0 0 9 38 85 n.s. n.s. n.s. 39,0% 15,3% 8,5%Other 0 0 1 1 2 2 3 7,6% 24,2% 9,7% 4,0% 2,5% 3,7%
Generation Capacity (GWe) 0 211 229 274 303 350 375 n.s. 0,8% 1,8% 1,0% 1,4% 0,7%Coal 0 42 42 38 28 17 12 n.s. 0,0% -1,0% -3,0% -5,0% -3,0%
of which CCS 0 0 0 0 1 7 12 n.s. n.s. n.s. n.s. 17,4% 4,9%Oil 0 16 16 14 7 7 6 n.s. 0,0% -1,3% -6,5% -1,0% -0,7%Gas 0 89 103 133 125 114 80 n.s. 1,5% 2,6% -0,6% -0,9% -3,4%
of which CCS 0 0 0 0 7 24 35 n.s. n.s. n.s. n.s. 13,7% 4,1%Biomass & Waste 0 0 0 0 2 7 19 n.s. n.s. n.s. 22,1% 14,0% 9,8%
of which CCS 0 0 0 0 0 3 11 n.s. n.s. n.s. n.s. n.s. 15,4%Nuclear 0 20 23 23 51 56 55 n.s. 1,4% 0,3% 8,1% 1,1% -0,3%Hydro 0 44 45 49 57 61 64 n.s. 0,2% 0,8% 1,5% 0,8% 0,4%Wind 0 0 0 16 26 56 69 n.s. n.s. n.s. 5,2% 7,9% 2,1%Solar 0 0 0 0 7 31 70 n.s. n.s. n.s. 39,3% 15,3% 8,4%Other 0 0 0 0 0 0 0 n.s. 14,6% 8,2% 3,5% 1,4% 4,3%
Total Final Consumption 2 (Mtoe) 605 400 416 449 412 374 318 -4,1% 0,4% 0,8% -0,8% -1,0% -1,6%Coal 68 29 25 28 16 10 7 -8,3% -1,4% 1,0% -5,5% -4,2% -4,0%Oil 149 91 103 122 113 95 70 -4,8% 1,3% 1,6% -0,8% -1,7% -3,0%Gas 109 90 110 110 78 51 27 -1,9% 2,0% -0,1% -3,3% -4,2% -6,3%Electricity 68 50 60 70 75 81 84 -2,9% 1,8% 1,5% 0,7% 0,7% 0,4%Heat 203 137 115 113 110 108 97 -3,9% -1,8% -0,1% -0,3% -0,2% -1,1%Biomass & Other 8 3 2 7 20 28 33 -9,3% -2,8% 11,5% 11,3% 3,5% 1,7%Share of Renewables 3 (%) 6% 8% 7% 8% 14% 23% 34% 2,0% -0,9% 1,8% 5,5% 5,0% 3,9%
Industry (incl. non-energy use) 270 179 201 218 195 176 153 -4,0% 1,1% 0,9% -1,1% -1,0% -1,4%Coal 28 19 21 24 15 10 7 -3,9% 1,1% 1,4% -4,7% -3,8% -4,0%Oil 44 36 37 45 45 44 40 -2,0% 0,4% 1,9% 0,1% -0,4% -0,9%Gas 52 43 66 69 53 39 22 -1,9% 4,5% 0,4% -2,6% -3,0% -5,5%Electricity 41 27 28 32 31 31 31 -4,2% 0,5% 1,3% -0,4% 0,0% 0,0%Heat 105 55 48 47 46 44 42 -6,4% -1,4% -0,1% -0,3% -0,4% -0,3%Biomass & Other 0 1 0 2 6 9 11 n.s. -2,4% 13,0% 14,0% 4,0% 2,7%
Buildings 231 166 148 151 134 118 98 -3,3% -1,1% 0,2% -1,1% -1,3% -1,9%Coal 40 10 4 3 1 0 0 -13,1% -8,6% -1,4% -13,4% -17,2% -17,5%Oil 14 7 6 7 6 3 1 -7,0% -0,6% 0,4% -1,9% -6,0% -8,0%Gas 57 47 43 40 25 12 4 -1,9% -0,8% -0,8% -4,7% -7,2% -9,6%Electricity 15 18 26 31 33 34 33 1,7% 3,8% 1,8% 0,8% 0,3% -0,3%Heat 98 82 67 66 65 64 54 -1,7% -2,0% -0,1% -0,3% 0,0% -1,7%Biomass & Other 7 2 2 4 6 5 5 -10,8% -3,2% 8,7% 4,4% -0,8% -0,9%
Agriculture 22 9 6 7 8 8 9 -8,3% -4,4% 1,4% 1,3% 0,8% 0,4%Coal 1 0 0 0 0 0 0 -7,1% -11,4% 3,3% -5,7% -7,5% -7,5%Oil 14 6 4 4 3 2 1 -8,7% -4,2% 1,1% -2,6% -4,3% -4,8%Gas 1 1 1 1 1 0 0 -0,8% 0,9% 0,8% -1,7% -3,0% -3,5%Electricity 6 3 1 2 2 3 4 -7,7% -6,2% 2,2% 3,6% 2,7% 1,7%Heat 0 0 0 0 0 0 0 n.s. n.s. n.s. n.s. n.s. n.s.Biomass & Other 1 0 0 0 2 3 3 -15,8% 1,1% 2,9% 21,6% 6,0% 2,4%
Transport 82 46 61 73 75 71 58 -5,7% 3,0% 1,8% 0,2% -0,6% -1,9%Coal 0 0 0 0 0 0 0 n.s. n.s. n.s. n.s. n.s. n.s.Oil 77 42 56 66 59 46 28 -5,8% 2,8% 1,7% -1,2% -2,3% -5,0%Gas 0 0 0 0 0 0 0 n.s. n.s. n.s. n.s. n.s. n.s.Electricity 6 3 5 6 9 13 17 -5,5% 4,5% 1,3% 4,6% 3,4% 2,9%Heat 0 0 0 0 0 0 0 n.s. n.s. n.s. n.s. n.s. n.s.Biomass & Other 0 0 0 1 7 11 14 n.s. n.s. n.s. 18,8% 5,3% 1,9%
Energy Branch Consumption 184 152 159 160 123 96 71 -1,9% 0,4% 0,1% -2,6% -2,5% -2,9%Other Transformation & Losses 4 126 75 115 134 152 167 172 -5,0% 4,4% 1,5% 1,3% 0,9% 0,3%
2 does not include international aviation and maritime bunkers; includes non-energy uses3 ratio of renewable energy over final energy demand increased by distribution losses and self consumption of electricity and steam plants4 includes statistical differences
92

GECO2015 Global Mitigation 150504 SUMMARY GHG & ENERGY BALANCE##### 100
Ukraine 1990 2000 2010 2020 2030 2040 2050 '90-'00 '00-'10 '10-'20 '20-'30 '30-'40 '40-'50Main Economic Indicators
Population (Million) 52 49 46 43 40 37 34 -0,5% -0,6% -0,6% -0,8% -0,9% -0,8%GDP per capita (ppp, k$'05) 8 4 6 8 11 16 23 -7,5% 4,9% 2,7% 3,4% 4,0% 3,6%GDP per capita (mer, k$'05) 3 1 2 3 4 5 8 -7,5% 4,9% 2,7% 3,4% 4,0% 3,6%Share Value Added - Agriculture (%) 26 17 8 8 7 6 5 -4,0% -7,0% -0,3% -1,8% -1,5% -0,9%Share Value Added - Industry (%) 45 36 31 30 29 28 26 -2,0% -1,5% -0,5% -0,2% -0,4% -0,6%Share Value Added - Services (%) 30 47 60 62 64 66 69 4,6% 2,6% 0,3% 0,3% 0,3% 0,3%
PricesInternational/Regional ($'05/boe)
Coal 18 9 19 22 24 26 30 -6,6% 7,6% 1,4% 0,8% 1,0% 1,4%Oil 33 32 72 96 103 104 74 -0,2% 8,3% 2,9% 0,7% 0,1% -3,3%Gas 18 21 31 38 39 36 28 1,4% 4,0% 2,0% 0,4% -0,7% -2,7%
GHG emissions (Mt CO2 eq.)Total GHG (excl. LULUCF) 995 445 392 315 223 191 132 -7,7% -1,3% -2,2% -3,4% -1,6% -3,6%CO2 788 345 301 244 180 156 106 -7,9% -1,4% -2,1% -3,0% -1,4% -3,8%CH4 149 74 63 41 19 13 9 -6,7% -1,7% -4,1% -7,4% -3,8% -3,2%N2O 57 26 28 29 24 22 17 -7,7% 0,9% 0,4% -1,9% -1,1% -2,6%F gases 0 0 1 1 0 0 0 -5,6% 17,0% 4,4% -11,1% -16,9% -5,1%Total GHG from Energy and Industry 891 408 358 282 194 166 114 -7,5% -1,3% -2,4% -3,6% -1,5% -3,7%CO2 Emissions from Fuel Comb. 717 308 261 205 142 124 82 -8,1% -1,6% -2,4% -3,6% -1,4% -4,0%
Power generation/District heating 216 79 90 72 29 24 7 -9,6% 1,3% -2,2% -8,9% -1,7% -11,3%Industry 196 83 60 48 47 41 30 -8,3% -3,2% -2,1% -0,2% -1,5% -2,9%Buildings 60 44 40 28 20 15 9 -3,0% -1,0% -3,6% -3,0% -3,2% -4,8%Agriculture 23 3 4 5 4 2 2 -17,2% 2,4% 0,7% -2,5% -3,9% -3,9%Transport 60 20 21 18 15 14 11 -10,4% 0,5% -1,6% -1,7% -1,0% -2,5%Other 163 79 46 33 27 28 23 -7,0% -5,2% -3,2% -2,0% 0,3% -2,0%
CO2 captured (CCS) 0 0 0 0 3 20 42 n.s. n.s. n.s. n.s. 22,3% 7,5%Coal 0 0 0 0 2 16 28 n.s. n.s. n.s. n.s. 21,3% 5,7%Gas 0 0 0 0 0 3 10 n.s. n.s. n.s. n.s. 25,2% 12,0%Biomass 0 0 0 0 0 1 4 n.s. n.s. n.s. n.s. 37,0% 15,4%
Energy Balance, by fuel (Mtoe)Primary Production 113 77 80 88 85 94 101 -3,7% 0,4% 0,9% -0,3% 1,0% 0,7%
Coal 63 37 34 35 14 11 8 -5,2% -0,8% 0,3% -9,0% -1,8% -3,6%Oil 5 4 4 4 4 3 2 -3,4% -0,4% 1,2% -0,6% -1,8% -3,0%Natural gas 23 15 16 16 16 15 14 -4,4% 1,1% -0,2% -0,4% 0,0% -1,2%Biomass 0 0 1 2 2 3 3 -2,2% 19,1% 1,3% 3,4% 2,7% 0,5%Nuclear1 20 20 24 29 47 56 65 0,2% 1,4% 2,2% 4,9% 1,7% 1,6%Hydro 1 1 1 1 1 1 1 0,7% 1,4% 0,5% 0,6% 0,1% 0,1%Other renewables 0 0 0 0 2 4 7 n.s. n.s. 36,4% 14,0% 10,4% 5,5%
Net Imports 145 53 50 27 33 37 37Coal 17 - 3 2 - 2 7 7 7Oil 62 8 10 7 6 7 7Natural gas 69 48 39 22 20 23 22Biomass 0 0 0 0 0 1 1Biofuels 0 0 0 0 0 0 0Electricity - 2 0 0 - 1 - 1 - 1 - 1
Primary Energy Demand2 258 130 131 115 119 132 138 -6,6% 0,1% -1,3% 0,3% 1,0% 0,5%Coal 80 34 36 33 21 18 15 -8,1% 0,5% -0,8% -4,6% -1,3% -1,8%Oil 67 12 14 11 10 10 9 -15,9% 1,2% -1,7% -1,1% -0,1% -1,3%Natural gas 92 62 55 38 36 39 35 -3,8% -1,2% -3,6% -0,7% 0,8% -0,8%Biomass 0 0 1 2 2 4 5 -2,2% 19,1% 1,4% 3,9% 3,9% 2,6%Nuclear1 20 20 24 29 47 56 65 0,2% 1,4% 2,2% 4,9% 1,7% 1,6%Hydro 1 1 1 1 1 1 1 0,7% 1,4% 0,5% 0,6% 0,1% 0,1%Other renewables 0 0 0 0 2 4 7 n.s. n.s. 36,4% 14,0% 10,4% 5,5%
Primary Energy Demand, by sector (Mtoe)Primary Energy Demand 258 130 131 115 119 132 138 -6,6% 0,1% -1,3% 0,3% 1,0% 0,5%Energy for Power Generation 83 45 50 51 60 75 87 -6,0% 1,2% 0,2% 1,6% 2,2% 1,5%Other Transformation & Losses 25 16 24 27 31 38 44 -4,6% 4,6% 1,0% 1,4% 1,8% 1,6%Energy Branch Consumption 63 32 20 14 13 15 15 -6,5% -4,9% -3,0% -0,8% 1,2% -0,1%Final consumption 163 75 75 66 65 67 67 -7,4% 0,0% -1,4% 0,0% 0,3% -0,1%
Steel, Non-Met. Minerals and Chem. 29 14 24 21 22 22 21 -6,9% 5,3% -1,3% 0,3% 0,2% -0,6%Other Industry 61 24 8 7 7 8 9 -8,8% -10,4% -1,3% 0,5% 1,3% 1,0%Non-Energy Use 6 1 6 4 4 4 4 -15,4% 16,5% -3,7% 0,3% 0,6% 0,0%Residential 32 24 24 19 17 16 15 -2,8% 0,0% -2,1% -1,1% -0,9% -0,9%Services 4 3 4 5 5 6 7 -3,3% 4,3% 2,4% 1,0% 1,5% 1,3%Agriculture 9 2 2 2 2 2 3 -16,6% 1,2% 1,0% 1,0% 1,3% 1,4%Road 18 6 7 6 6 7 7 -9,6% 1,1% -1,1% -0,2% 0,5% 0,0%Rail 2 1 1 1 1 1 1 -6,9% -0,5% 1,8% 1,1% 1,3% 1,0%Aviation 0 0 0 0 0 0 0 n.s. n.s. n.s. n.s. n.s. 1,2%Other Transport 1 0 0 0 0 0 0 n.s. n.s. -0,9% 0,0% -0,8% -1,4%
1 Primary energy from nuclear is calculated considering the primary heat equivalent of the electricity produced with an average efficiency of 33%
93

GECO2015 Global Mitigation 150504 SUMMARY GHG & ENERGY BALANCE##### 100
Ukraine 1990 2000 2010 2020 2030 2040 2050 '90-'00 '00-'10 '10-'20 '20-'30 '30-'40 '40-'50Power Generation
Fuel Inputs Therm. Power (Mtoe) 62 23 26 21 10 14 14 -9,3% 1,0% -2,2% -6,8% 3,1% 0,0%Coal 37 15 19 15 5 5 5 -8,6% 2,4% -2,4% -11,0% 0,8% 0,2%Oil 13 0 0 1 1 1 1 -30,9% -3,6% 8,9% 1,2% 3,9% -4,0%Gas 12 8 6 5 4 7 7 -4,2% -2,7% -2,1% -1,1% 4,6% -0,2%Biomass & Waste 0 0 0 0 0 1 1 n.s. n.s. -4,4% 5,9% 6,3% 3,6%Other 0 0 0 0 0 0 0 n.s. n.s. n.s. n.s. n.s. n.s.
Gross Elec. Generation (TWh e) 299 171 189 215 265 349 434 -5,4% 1,0% 1,3% 2,1% 2,8% 2,2%Coal 114 52 70 60 21 23 25 -7,6% 3,0% -1,4% -10,1% 1,1% 0,6%
of which CCS 0 0 0 0 2 14 23 n.s. n.s. n.s. n.s. 20,1% 5,5%Oil 48 1 1 2 3 4 3 -30,9% -5,6% 12,8% 1,3% 4,1% -3,7%Gas 50 30 16 22 23 34 42 -5,0% -6,3% 3,3% 0,5% 4,1% 2,2%
of which CCS 0 0 0 0 1 9 28 n.s. n.s. n.s. n.s. 25,8% 12,3%Biomass & Waste 0 0 0 0 2 4 5 n.s. n.s. 4,7% 13,4% 8,5% 4,5%
of which CCS 0 0 0 0 0 1 3 n.s. n.s. n.s. n.s. n.s. 13,8%Nuclear 76 77 89 112 186 223 262 0,2% 1,4% 2,3% 5,2% 1,8% 1,7%Hydro 11 11 13 14 15 15 15 0,7% 1,4% 0,5% 0,6% 0,1% 0,1%Wind 0 0 0 4 16 42 66 n.s. 42,8% 34,9% 14,2% 10,1% 4,8%Solar 0 0 0 1 2 6 16 n.s. n.s. 53,0% 10,2% 13,1% 9,9%Other 0 0 0 0 0 0 0 n.s. n.s. n.s. n.s. 17,1% 16,8%
Generation Capacity (GWe) 0 52 54 49 66 88 110 n.s. 0,3% -1,0% 3,1% 2,8% 2,2%Coal 0 22 22 13 13 13 7 n.s. 0,0% -4,8% -0,5% 0,3% -6,3%
of which CCS 0 0 0 0 0 2 4 n.s. n.s. n.s. n.s. 20,9% 8,2%Oil 0 1 1 0 1 1 2 n.s. 0,0% -7,2% 3,1% 5,7% 5,7%Gas 0 14 12 11 12 14 18 n.s. -1,0% -1,2% 1,3% 1,5% 2,5%
of which CCS 0 0 0 0 0 1 4 n.s. n.s. n.s. n.s. 26,4% 14,0%Biomass & Waste 0 0 0 0 0 0 1 n.s. n.s. 2,1% 12,9% 8,4% 4,3%
of which CCS 0 0 0 0 0 0 0 n.s. n.s. n.s. n.s. n.s. 13,8%Nuclear 0 11 13 16 26 31 36 n.s. 1,6% 2,0% 5,1% 1,5% 1,5%Hydro 0 5 5 6 6 6 6 n.s. 1,5% 0,5% 0,6% 0,1% 0,1%Wind 0 0 0 2 7 17 28 n.s. n.s. 33,6% 14,0% 10,0% 4,9%Solar 0 0 0 1 1 5 13 n.s. n.s. 52,8% 10,1% 12,9% 9,8%Other 0 0 0 0 0 0 0 n.s. n.s. n.s. n.s. 16,6% 16,2%
Total Final Consumption 2 (Mtoe) 163 75 75 66 65 67 67 -7,4% 0,0% -1,4% 0,0% 0,3% -0,1%Coal 39 16 14 15 13 11 8 -8,5% -1,0% 0,2% -0,9% -2,2% -3,1%Oil 43 11 12 10 9 8 8 -13,0% 1,5% -2,1% -1,3% -0,4% -1,1%Gas 33 26 25 15 14 14 12 -2,6% -0,2% -4,9% -0,9% -0,3% -1,5%Electricity 18 10 11 13 16 22 27 -5,8% 1,7% 1,5% 2,2% 2,8% 2,2%Heat 31 13 11 11 11 10 9 -8,0% -1,8% 0,1% -0,2% -0,9% -1,1%Biomass & Other 0 0 1 1 2 3 4 -2,2% 15,4% 2,2% 3,8% 4,1% 2,3%Share of Renewables 3 (%) 2% 3% 4% 5% 8% 12% 17% 2,9% 4,3% 2,8% 3,7% 4,6% 3,3%
Industry (incl. non-energy use) 97 40 38 32 33 35 34 -8,5% -0,6% -1,7% 0,3% 0,5% -0,1%Coal 30 13 14 14 13 11 8 -7,8% 0,4% -0,1% -0,3% -2,0% -3,1%Oil 15 2 2 1 1 2 3 -16,8% -0,2% -5,8% 1,0% 3,0% 2,7%Gas 23 12 11 6 7 8 9 -6,5% -1,2% -5,0% 0,7% 2,2% 0,3%Electricity 13 5 6 5 6 8 9 -8,4% 0,9% -0,5% 1,7% 2,1% 1,5%Heat 16 7 5 5 5 5 5 -8,0% -3,0% 0,0% -0,2% -0,3% -0,2%Biomass & Other 0 0 0 0 0 1 1 n.s. n.s. -8,7% 14,4% 24,2% 3,6%
Buildings 36 27 28 24 23 22 22 -2,9% 0,5% -1,4% -0,6% -0,3% -0,3%Coal 8 3 1 1 0 0 0 -9,9% -13,4% 5,3% -11,0% -16,1% -16,3%Oil 2 0 1 1 1 1 1 -13,8% 12,8% -2,7% -0,6% 0,4% -1,8%Gas 10 14 14 9 7 5 3 3,2% 0,5% -4,8% -2,2% -3,3% -5,5%Electricity 1 3 5 7 8 11 14 8,5% 3,7% 3,3% 1,9% 3,0% 2,4%Heat 14 6 6 6 6 5 4 -8,1% -0,5% 0,1% -0,2% -1,4% -2,0%Biomass & Other 0 0 1 1 1 0 0 -2,2% 14,5% 0,0% -2,2% -4,5% -6,7%
Agriculture 9 2 2 2 2 2 3 -16,6% 1,2% 1,0% 1,0% 1,3% 1,4%Coal 1 0 0 0 0 0 0 n.s. n.s. 0,3% -5,0% -7,5% -7,5%Oil 6 1 1 1 1 1 0 -15,7% 1,5% 0,8% -2,5% -3,9% -3,9%Gas 0 0 0 0 0 0 0 n.s. n.s. -0,3% -1,7% -2,6% -2,6%Electricity 2 0 0 0 1 1 2 -15,9% -4,2% 2,4% 7,2% 5,3% 3,3%Heat 0 0 0 0 0 0 0 n.s. n.s. n.s. n.s. n.s. n.s.Biomass & Other 0 0 0 0 0 0 1 n.s. n.s. 2,1% 24,8% 7,1% 3,1%
Transport 21 7 8 8 8 8 8 -9,9% 1,1% -0,8% 0,0% 0,6% 0,2%Coal 0 0 0 0 0 0 0 n.s. n.s. 1,0% 0,0% 0,0% 0,0%Oil 20 7 8 6 5 5 4 -10,3% 1,1% -1,6% -1,7% -1,0% -2,5%Gas 0 0 0 0 0 0 0 n.s. n.s. n.s. n.s. n.s. n.s.Electricity 1 1 1 1 1 2 3 -4,7% 0,1% 2,7% 4,4% 3,8% 3,1%Heat 0 0 0 0 0 0 0 n.s. n.s. n.s. n.s. n.s. n.s.Biomass & Other 0 0 0 0 1 1 2 n.s. n.s. n.s. 11,2% 3,8% 3,6%
Energy Branch Consumption 63 32 20 14 13 15 15 -6,5% -4,9% -3,0% -0,8% 1,2% -0,1%Other Transformation & Losses 4 25 16 24 27 31 38 44 -4,6% 4,6% 1,0% 1,4% 1,8% 1,6%
2 does not include international aviation and maritime bunkers; includes non-energy uses3 ratio of renewable energy over final energy demand increased by distribution losses and self consumption of electricity and steam plants4 includes statistical differences
94

GECO2015 Global Mitigation 150504 SUMMARY GHG & ENERGY BALANCE##### 100
Other CIS 1990 2000 2010 2020 2030 2040 2050 '90-'00 '00-'10 '10-'20 '20-'30 '30-'40 '40-'50Main Economic Indicators
Population (Million) 77 81 88 97 103 107 110 0,6% 0,8% 1,0% 0,6% 0,4% 0,3%GDP per capita (ppp, k$'05) 5 3 6 10 16 23 30 -4,0% 7,4% 4,6% 4,8% 3,6% 2,5%GDP per capita (mer, k$'05) 2 1 3 4 6 9 12 -4,0% 7,4% 4,7% 4,8% 3,6% 2,5%Share Value Added - Agriculture (%) 20 20 9 7 6 5 5 -0,4% -7,5% -2,2% -1,9% -0,9% -0,5%Share Value Added - Industry (%) 26 35 43 41 39 37 35 2,9% 2,1% -0,5% -0,5% -0,6% -0,6%Share Value Added - Services (%) 53 45 48 52 55 58 60 -1,6% 0,6% 0,8% 0,6% 0,5% 0,4%
PricesInternational/Regional ($'05/boe)
Coal 18 9 19 22 24 26 30 -6,6% 7,6% 1,4% 0,8% 1,0% 1,4%Oil 33 32 72 96 103 104 74 -0,2% 8,3% 2,9% 0,7% 0,1% -3,3%Gas 18 21 31 38 39 36 28 1,4% 4,0% 2,0% 0,4% -0,7% -2,7%
GHG emissions (Mt CO2 eq.)Total GHG (excl. LULUCF) 972 574 785 834 755 549 274 -5,1% 3,2% 0,6% -1,0% -3,1% -6,7%CO2 733 397 535 598 560 388 165 -5,9% 3,0% 1,1% -0,7% -3,6% -8,2%CH4 173 132 193 169 134 106 75 -2,6% 3,8% -1,3% -2,3% -2,3% -3,5%N2O 63 43 54 62 59 54 34 -3,8% 2,4% 1,4% -0,5% -0,9% -4,5%F gases 3 1 3 5 2 0 0 -9,0% 10,0% 6,0% -9,4% -18,0% -5,9%Total GHG from Energy and Industry 846 491 674 713 641 446 207 -5,3% 3,2% 0,6% -1,1% -3,6% -7,4%CO2 Emissions from Fuel Comb. 708 383 508 566 532 363 146 -6,0% 2,9% 1,1% -0,6% -3,8% -8,7%
Power generation/District heating 255 151 164 202 169 74 - 15 -5,1% 0,8% 2,1% -1,8% -7,9% n.s.Industry 137 53 72 79 69 52 18 -9,0% 3,1% 0,9% -1,3% -2,7% -9,9%Buildings 168 81 119 118 113 84 47 -7,1% 4,0% -0,1% -0,4% -2,9% -5,7%Agriculture 11 8 8 10 8 6 4 -2,8% -0,3% 2,1% -1,6% -3,5% -3,8%Transport 59 32 45 54 52 47 34 -6,0% 3,5% 1,8% -0,4% -1,0% -3,1%Other 78 58 100 104 120 99 58 -3,0% 5,6% 0,3% 1,5% -1,9% -5,2%
CO2 captured (CCS) 0 0 0 0 24 117 223 n.s. n.s. n.s. n.s. 16,9% 6,7%Coal 0 0 0 0 15 66 91 n.s. n.s. n.s. n.s. 15,8% 3,2%Gas 0 0 0 0 9 38 62 n.s. n.s. n.s. n.s. 15,4% 5,0%Biomass 0 0 0 0 0 12 69 n.s. n.s. n.s. 11,1% n.s. 19,2%
Energy Balance, by fuel (Mtoe)Primary Production 230 208 328 353 367 364 322 -1,0% 4,6% 0,7% 0,4% -0,1% -1,2%
Coal 56 39 47 58 41 49 60 -3,5% 1,9% 2,1% -3,3% 1,7% 2,1%Oil 50 65 151 140 120 93 66 2,7% 8,7% -0,8% -1,5% -2,5% -3,4%Natural gas 119 98 123 143 171 168 128 -2,0% 2,3% 1,5% 1,8% -0,2% -2,7%Biomass 1 2 2 5 17 23 27 6,5% 0,0% 12,5% 13,4% 2,6% 1,9%Nuclear1 0 1 1 2 9 14 15 n.s. 2,2% 10,1% 17,5% 4,8% 0,7%Hydro 4 4 5 5 6 6 6 -0,3% 2,0% 0,4% 1,3% 0,2% 0,0%Other renewables 0 0 0 0 2 11 20 n.s. n.s. 53,7% 40,7% 16,1% 6,0%
Net Imports 23 - 60 - 136 - 144 - 129 - 128 - 96Coal - 3 - 16 - 10 - 9 - 13 - 25 - 37Oil 48 - 30 - 111 - 95 - 75 - 56 - 39Natural gas - 23 - 15 - 15 - 39 - 41 - 52 - 45Biomass 0 0 0 0 0 6 25Biofuels 0 0 0 0 0 0 0Electricity 1 1 0 0 0 0 0
Primary Energy Demand2 254 149 192 209 238 236 226 -5,2% 2,6% 0,9% 1,3% -0,1% -0,4%Coal 52 23 37 49 29 24 24 -8,0% 4,9% 2,9% -5,1% -1,9% -0,1%Oil 98 35 40 45 45 37 27 -9,7% 1,3% 1,1% -0,1% -1,9% -3,2%Natural gas 96 83 108 104 131 116 83 -1,5% 2,6% -0,4% 2,3% -1,2% -3,3%Biomass 1 2 2 5 17 29 52 6,4% 0,0% 12,2% 13,6% 5,4% 6,0%Nuclear1 0 1 1 2 9 14 15 n.s. 2,2% 10,1% 17,5% 4,8% 0,7%Hydro 4 4 5 5 6 6 6 -0,3% 2,0% 0,4% 1,3% 0,2% 0,0%Other renewables 0 0 0 0 2 11 20 n.s. n.s. 53,7% 40,7% 16,1% 6,0%
Primary Energy Demand, by sector (Mtoe)Primary Energy Demand 254 149 192 209 238 236 226 -5,2% 2,6% 0,9% 1,3% -0,1% -0,4%Energy for Power Generation 86 56 63 72 84 98 114 -4,2% 1,1% 1,4% 1,6% 1,5% 1,5%Other Transformation & Losses 30 18 23 29 43 52 65 -4,8% 2,3% 2,4% 4,1% 1,9% 2,1%Energy Branch Consumption 23 20 36 37 45 41 33 -1,5% 6,3% 0,3% 1,8% -0,9% -2,3%Final consumption 188 99 123 138 151 150 142 -6,2% 2,2% 1,1% 0,9% -0,1% -0,6%
Steel, Non-Met. Minerals and Chem. 7 6 14 16 11 8 7 -2,4% 9,7% 1,0% -3,7% -2,8% -1,1%Other Industry 51 23 23 27 31 33 34 -7,7% 0,2% 1,5% 1,5% 0,5% 0,3%Non-Energy Use 15 7 6 6 8 9 8 -7,6% -1,6% 1,1% 2,5% 0,7% -0,7%Residential 12 27 30 31 32 29 27 8,1% 1,1% 0,2% 0,2% -0,8% -1,0%Services 75 21 30 33 40 39 34 -11,8% 3,4% 1,0% 1,8% -0,3% -1,4%Agriculture 8 5 5 6 8 9 11 -4,5% -0,4% 2,3% 2,3% 1,8% 1,5%Road 17 9 13 16 18 19 18 -6,3% 4,0% 2,1% 1,2% 0,3% -0,8%Rail 2 1 1 1 2 2 2 -7,4% 1,5% 2,5% 2,3% 1,4% 0,8%Aviation 0 0 0 1 1 1 1 0,4% -1,8% 4,9% 4,9% 2,9% -0,1%Other Transport 0 0 0 0 0 0 0 -12,5% 21,9% 3,9% 2,6% 0,0% -1,5%
1 Primary energy from nuclear is calculated considering the primary heat equivalent of the electricity produced with an average efficiency of 33%
95

GECO2015 Global Mitigation 150504 SUMMARY GHG & ENERGY BALANCE##### 100
Other CIS 1990 2000 2010 2020 2030 2040 2050 '90-'00 '00-'10 '10-'20 '20-'30 '30-'40 '40-'50Power Generation
Fuel Inputs Therm. Power (Mtoe) 82 51 57 64 67 67 73 -4,6% 1,0% 1,3% 0,4% 0,0% 0,9%Coal 28 16 19 30 21 21 22 -5,5% 1,9% 4,6% -3,5% -0,1% 0,8%Oil 21 7 1 3 4 2 1 -10,7% -20,3% 15,5% 3,5% -6,1% -9,2%Gas 33 29 37 31 41 39 35 -1,4% 2,6% -1,5% 2,6% -0,4% -1,0%Biomass & Waste 0 0 0 0 1 5 14 n.s. n.s. -3,4% 29,4% 15,4% 11,1%Other 0 0 0 0 0 0 0 n.s. n.s. n.s. n.s. n.s. n.s.
Gross Elec. Generation (TWh e) 295 200 252 335 440 546 674 -3,8% 2,4% 2,9% 2,8% 2,2% 2,1%Coal 73 38 69 122 92 96 105 -6,3% 6,1% 5,8% -2,8% 0,4% 1,0%
of which CCS 0 0 0 0 18 75 104 n.s. n.s. n.s. n.s. 15,5% 3,3%Oil 68 23 2 13 18 10 4 -10,3% -20,9% 19,7% 3,4% -6,1% -9,0%Gas 103 87 118 129 192 206 207 -1,7% 3,1% 0,9% 4,1% 0,7% 0,0%
of which CCS 0 0 0 0 20 92 162 n.s. n.s. n.s. n.s. 16,4% 5,8%Biomass & Waste 0 0 0 0 6 24 72 n.s. n.s. n.s. 30,3% 15,7% 11,6%
of which CCS 0 0 0 0 0 12 56 n.s. n.s. n.s. n.s. n.s. 16,5%Nuclear 0 2 2 7 35 55 58 n.s. 2,2% 10,5% 17,9% 4,6% 0,6%Hydro 51 50 61 63 72 73 73 -0,3% 2,0% 0,4% 1,3% 0,2% 0,0%Wind 0 0 0 1 20 60 101 n.s. n.s. 50,5% 38,6% 11,6% 5,4%Solar 0 0 0 0 5 22 52 n.s. n.s. n.s. 41,1% 15,9% 9,1%Other 0 0 0 0 0 0 1 n.s. n.s. n.s. 41,2% 18,2% 16,4%
Generation Capacity (GWe) 0 66 72 76 99 138 174 n.s. 0,9% 0,4% 2,7% 3,4% 2,4%Coal 0 14 15 21 22 21 16 n.s. 0,3% 3,6% 0,4% -0,3% -2,8%
of which CCS 0 0 0 0 2 10 16 n.s. n.s. n.s. n.s. 16,0% 4,2%Oil 0 8 9 7 5 5 5 n.s. 1,2% -2,8% -3,2% 0,4% -0,4%Gas 0 28 31 29 34 39 36 n.s. 1,1% -0,7% 1,7% 1,4% -0,9%
of which CCS 0 0 0 0 3 12 23 n.s. n.s. n.s. n.s. 17,0% 6,4%Biomass & Waste 0 0 0 0 1 3 10 n.s. n.s. n.s. 30,5% 15,7% 11,7%
of which CCS 0 0 0 0 0 2 8 n.s. n.s. n.s. n.s. n.s. 16,7%Nuclear 0 0 0 1 6 8 9 n.s. 0,0% 10,3% 17,7% 4,4% 0,4%Hydro 0 15 17 17 20 20 20 n.s. 1,0% 0,3% 1,3% 0,2% 0,0%Wind 0 0 0 0 8 24 41 n.s. n.s. 48,9% 38,5% 11,5% 5,3%Solar 0 0 0 0 4 16 37 n.s. n.s. n.s. 41,3% 15,8% 9,1%Other 0 0 0 0 0 0 0 n.s. n.s. n.s. n.s. 17,7% 15,8%
Total Final Consumption 2 (Mtoe) 188 99 123 138 151 150 142 -6,2% 2,2% 1,1% 0,9% -0,1% -0,6%Coal 24 7 17 19 9 4 2 -11,2% 8,8% 1,2% -7,4% -7,2% -5,7%Oil 61 23 33 36 34 30 23 -9,5% 3,9% 0,7% -0,4% -1,3% -2,7%Gas 52 39 40 42 50 42 23 -2,8% 0,2% 0,4% 1,9% -1,8% -5,7%Electricity 23 13 16 22 29 36 44 -5,2% 2,0% 2,9% 2,8% 2,2% 2,2%Heat 27 15 15 16 16 18 19 -5,7% 0,2% 0,2% 0,0% 1,3% 0,6%Biomass & Other 1 2 1 4 13 20 30 6,4% -1,0% 11,9% 12,2% 4,1% 4,1%Share of Renewables 3 (%) 5% 7% 6% 8% 15% 25% 42% 4,8% -1,3% 1,7% 6,7% 5,6% 5,3%
Industry (incl. non-energy use) 73 35 43 49 50 50 50 -7,0% 2,1% 1,3% 0,2% -0,1% -0,1%Coal 19 6 12 14 7 4 2 -10,5% 6,8% 1,9% -6,6% -6,1% -5,3%Oil 22 7 6 5 6 7 7 -11,4% -1,5% -0,8% 1,9% 1,0% -0,6%Gas 12 11 12 13 16 15 9 -0,7% 0,8% 0,7% 2,1% -0,9% -4,9%Electricity 13 5 8 10 12 14 17 -8,6% 3,6% 2,7% 2,2% 1,5% 1,5%Heat 7 5 5 5 5 5 5 -1,9% 0,1% 0,0% -0,2% -0,3% -0,2%Biomass & Other 0 0 0 1 3 5 10 n.s. -0,1% 16,6% 12,5% 5,5% 7,9%
Buildings 87 49 60 64 71 68 60 -5,7% 2,2% 0,6% 1,1% -0,5% -1,2%Coal 5 1 5 4 1 0 0 -14,0% 15,9% -0,6% -10,8% -16,0% -16,2%Oil 18 3 11 11 9 7 4 -15,3% 12,6% -0,5% -1,6% -3,3% -4,1%Gas 39 28 28 28 34 27 14 -3,3% -0,1% 0,2% 1,8% -2,3% -6,2%Electricity 4 5 6 8 10 12 15 2,6% 0,7% 3,2% 2,4% 2,1% 2,4%Heat 21 10 10 10 10 13 14 -7,3% 0,2% 0,3% 0,1% 2,0% 0,9%Biomass & Other 1 1 1 3 7 10 13 5,1% -1,4% 9,6% 9,4% 3,3% 2,6%
Agriculture 8 5 5 6 8 9 11 -4,5% -0,4% 2,3% 2,3% 1,8% 1,5%Coal 0 0 0 0 0 0 0 -26,3% 43,6% -0,6% -5,0% -7,5% -7,5%Oil 2 2 2 3 2 2 1 0,3% -1,7% 2,5% -1,4% -3,5% -3,8%Gas 1 0 0 0 0 0 0 -17,0% 3,8% 1,3% -0,6% -2,1% -2,5%Electricity 4 2 2 3 4 6 7 -5,6% -0,6% 2,5% 3,5% 3,1% 2,4%Heat 0 0 0 0 0 0 0 n.s. n.s. n.s. n.s. n.s. n.s.Biomass & Other 0 0 0 0 1 2 2 8,4% 13,0% 3,9% 29,8% 7,3% 3,0%
Transport 20 10 15 19 21 23 21 -6,2% 3,6% 2,2% 1,5% 0,5% -0,6%Coal 0 0 0 0 0 0 0 -10,0% 13,3% 1,2% 0,0% 0,0% 0,0%Oil 19 10 14 17 16 15 11 -6,0% 3,5% 1,8% -0,4% -1,0% -3,2%Gas 0 0 0 0 0 0 0 n.s. n.s. n.s. n.s. n.s. n.s.Electricity 1 0 1 1 2 4 5 -10,8% 6,5% 4,4% 8,2% 5,1% 3,4%Heat 0 0 0 0 0 0 0 n.s. n.s. n.s. n.s. n.s. n.s.Biomass & Other 0 0 0 0 3 4 5 n.s. n.s. n.s. 19,8% 3,6% 2,8%
Energy Branch Consumption 23 20 36 37 45 41 33 -1,5% 6,3% 0,3% 1,8% -0,9% -2,3%Other Transformation & Losses 4 30 18 23 29 43 52 65 -4,8% 2,3% 2,4% 4,1% 1,9% 2,1%
2 does not include international aviation and maritime bunkers; includes non-energy uses3 ratio of renewable energy over final energy demand increased by distribution losses and self consumption of electricity and steam plants4 includes statistical differences
96
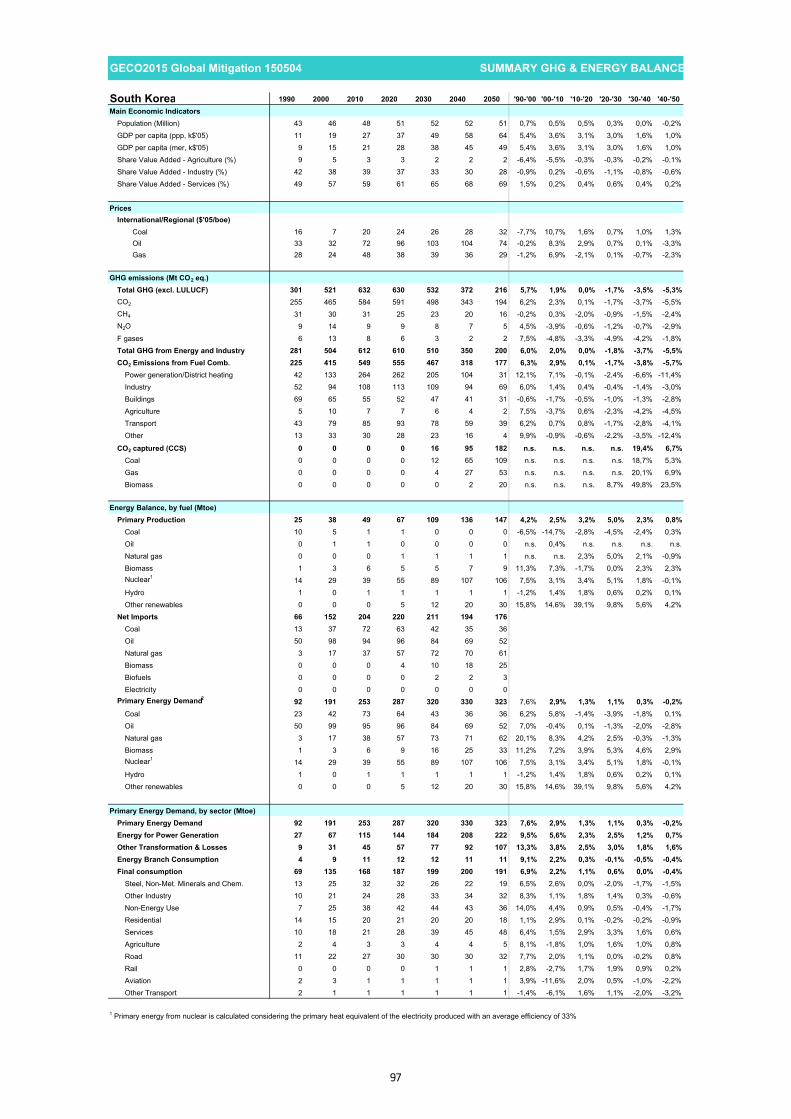
GECO2015 Global Mitigation 150504 SUMMARY GHG & ENERGY BALANCE##### 100
South Korea 1990 2000 2010 2020 2030 2040 2050 '90-'00 '00-'10 '10-'20 '20-'30 '30-'40 '40-'50Main Economic Indicators
Population (Million) 43 46 48 51 52 52 51 0,7% 0,5% 0,5% 0,3% 0,0% -0,2%GDP per capita (ppp, k$'05) 11 19 27 37 49 58 64 5,4% 3,6% 3,1% 3,0% 1,6% 1,0%GDP per capita (mer, k$'05) 9 15 21 28 38 45 49 5,4% 3,6% 3,1% 3,0% 1,6% 1,0%Share Value Added - Agriculture (%) 9 5 3 3 2 2 2 -6,4% -5,5% -0,3% -0,3% -0,2% -0,1%Share Value Added - Industry (%) 42 38 39 37 33 30 28 -0,9% 0,2% -0,6% -1,1% -0,8% -0,6%Share Value Added - Services (%) 49 57 59 61 65 68 69 1,5% 0,2% 0,4% 0,6% 0,4% 0,2%
PricesInternational/Regional ($'05/boe)
Coal 16 7 20 24 26 28 32 -7,7% 10,7% 1,6% 0,7% 1,0% 1,3%Oil 33 32 72 96 103 104 74 -0,2% 8,3% 2,9% 0,7% 0,1% -3,3%Gas 28 24 48 38 39 36 29 -1,2% 6,9% -2,1% 0,1% -0,7% -2,3%
GHG emissions (Mt CO2 eq.)Total GHG (excl. LULUCF) 301 521 632 630 532 372 216 5,7% 1,9% 0,0% -1,7% -3,5% -5,3%CO2 255 465 584 591 498 343 194 6,2% 2,3% 0,1% -1,7% -3,7% -5,5%CH4 31 30 31 25 23 20 16 -0,2% 0,3% -2,0% -0,9% -1,5% -2,4%N2O 9 14 9 9 8 7 5 4,5% -3,9% -0,6% -1,2% -0,7% -2,9%F gases 6 13 8 6 3 2 2 7,5% -4,8% -3,3% -4,9% -4,2% -1,8%Total GHG from Energy and Industry 281 504 612 610 510 350 200 6,0% 2,0% 0,0% -1,8% -3,7% -5,5%CO2 Emissions from Fuel Comb. 225 415 549 555 467 318 177 6,3% 2,9% 0,1% -1,7% -3,8% -5,7%
Power generation/District heating 42 133 264 262 205 104 31 12,1% 7,1% -0,1% -2,4% -6,6% -11,4%Industry 52 94 108 113 109 94 69 6,0% 1,4% 0,4% -0,4% -1,4% -3,0%Buildings 69 65 55 52 47 41 31 -0,6% -1,7% -0,5% -1,0% -1,3% -2,8%Agriculture 5 10 7 7 6 4 2 7,5% -3,7% 0,6% -2,3% -4,2% -4,5%Transport 43 79 85 93 78 59 39 6,2% 0,7% 0,8% -1,7% -2,8% -4,1%Other 13 33 30 28 23 16 4 9,9% -0,9% -0,6% -2,2% -3,5% -12,4%
CO2 captured (CCS) 0 0 0 0 16 95 182 n.s. n.s. n.s. n.s. 19,4% 6,7%Coal 0 0 0 0 12 65 109 n.s. n.s. n.s. n.s. 18,7% 5,3%Gas 0 0 0 0 4 27 53 n.s. n.s. n.s. n.s. 20,1% 6,9%Biomass 0 0 0 0 0 2 20 n.s. n.s. n.s. 8,7% 49,8% 23,5%
Energy Balance, by fuel (Mtoe)Primary Production 25 38 49 67 109 136 147 4,2% 2,5% 3,2% 5,0% 2,3% 0,8%
Coal 10 5 1 1 0 0 0 -6,5% -14,7% -2,8% -4,5% -2,4% 0,3%Oil 0 1 1 0 0 0 0 n.s. 0,4% n.s. n.s. n.s. n.s.Natural gas 0 0 0 1 1 1 1 n.s. n.s. 2,3% 5,0% 2,1% -0,9%Biomass 1 3 6 5 5 7 9 11,3% 7,3% -1,7% 0,0% 2,3% 2,3%Nuclear1 14 29 39 55 89 107 106 7,5% 3,1% 3,4% 5,1% 1,8% -0,1%Hydro 1 0 1 1 1 1 1 -1,2% 1,4% 1,8% 0,6% 0,2% 0,1%Other renewables 0 0 0 5 12 20 30 15,8% 14,6% 39,1% 9,8% 5,6% 4,2%
Net Imports 66 152 204 220 211 194 176Coal 13 37 72 63 42 35 36Oil 50 98 94 96 84 69 52Natural gas 3 17 37 57 72 70 61Biomass 0 0 0 4 10 18 25Biofuels 0 0 0 0 2 2 3Electricity 0 0 0 0 0 0 0
Primary Energy Demand2 92 191 253 287 320 330 323 7,6% 2,9% 1,3% 1,1% 0,3% -0,2%Coal 23 42 73 64 43 36 36 6,2% 5,8% -1,4% -3,9% -1,8% 0,1%Oil 50 99 95 96 84 69 52 7,0% -0,4% 0,1% -1,3% -2,0% -2,8%Natural gas 3 17 38 57 73 71 62 20,1% 8,3% 4,2% 2,5% -0,3% -1,3%Biomass 1 3 6 9 16 25 33 11,2% 7,2% 3,9% 5,3% 4,6% 2,9%Nuclear1 14 29 39 55 89 107 106 7,5% 3,1% 3,4% 5,1% 1,8% -0,1%Hydro 1 0 1 1 1 1 1 -1,2% 1,4% 1,8% 0,6% 0,2% 0,1%Other renewables 0 0 0 5 12 20 30 15,8% 14,6% 39,1% 9,8% 5,6% 4,2%
Primary Energy Demand, by sector (Mtoe)Primary Energy Demand 92 191 253 287 320 330 323 7,6% 2,9% 1,3% 1,1% 0,3% -0,2%Energy for Power Generation 27 67 115 144 184 208 222 9,5% 5,6% 2,3% 2,5% 1,2% 0,7%Other Transformation & Losses 9 31 45 57 77 92 107 13,3% 3,8% 2,5% 3,0% 1,8% 1,6%Energy Branch Consumption 4 9 11 12 12 11 11 9,1% 2,2% 0,3% -0,1% -0,5% -0,4%Final consumption 69 135 168 187 199 200 191 6,9% 2,2% 1,1% 0,6% 0,0% -0,4%
Steel, Non-Met. Minerals and Chem. 13 25 32 32 26 22 19 6,5% 2,6% 0,0% -2,0% -1,7% -1,5%Other Industry 10 21 24 28 33 34 32 8,3% 1,1% 1,8% 1,4% 0,3% -0,6%Non-Energy Use 7 25 38 42 44 43 36 14,0% 4,4% 0,9% 0,5% -0,4% -1,7%Residential 14 15 20 21 20 20 18 1,1% 2,9% 0,1% -0,2% -0,2% -0,9%Services 10 18 21 28 39 45 48 6,4% 1,5% 2,9% 3,3% 1,6% 0,6%Agriculture 2 4 3 3 4 4 5 8,1% -1,8% 1,0% 1,6% 1,0% 0,8%Road 11 22 27 30 30 30 32 7,7% 2,0% 1,1% 0,0% -0,2% 0,8%Rail 0 0 0 0 1 1 1 2,8% -2,7% 1,7% 1,9% 0,9% 0,2%Aviation 2 3 1 1 1 1 1 3,9% -11,6% 2,0% 0,5% -1,0% -2,2%Other Transport 2 1 1 1 1 1 1 -1,4% -6,1% 1,6% 1,1% -2,0% -3,2%
1 Primary energy from nuclear is calculated considering the primary heat equivalent of the electricity produced with an average efficiency of 33%
97
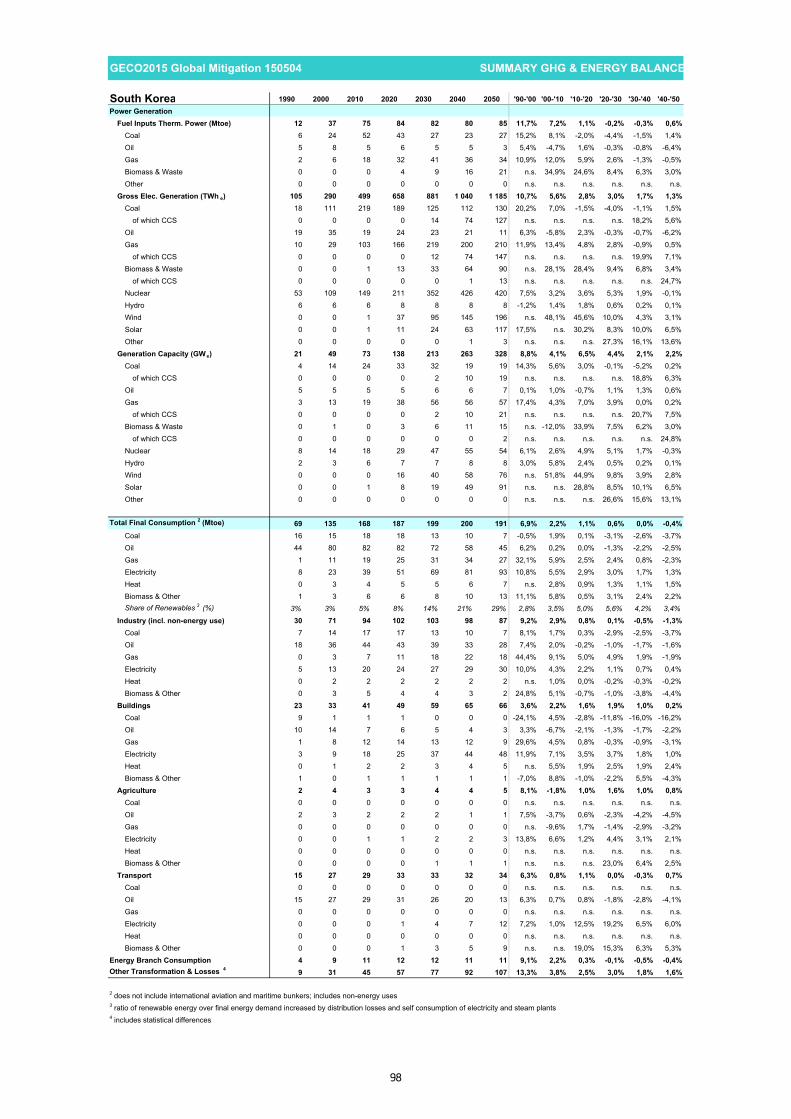
GECO2015 Global Mitigation 150504 SUMMARY GHG & ENERGY BALANCE##### 100
South Korea 1990 2000 2010 2020 2030 2040 2050 '90-'00 '00-'10 '10-'20 '20-'30 '30-'40 '40-'50Power Generation
Fuel Inputs Therm. Power (Mtoe) 12 37 75 84 82 80 85 11,7% 7,2% 1,1% -0,2% -0,3% 0,6%Coal 6 24 52 43 27 23 27 15,2% 8,1% -2,0% -4,4% -1,5% 1,4%Oil 5 8 5 6 5 5 3 5,4% -4,7% 1,6% -0,3% -0,8% -6,4%Gas 2 6 18 32 41 36 34 10,9% 12,0% 5,9% 2,6% -1,3% -0,5%Biomass & Waste 0 0 0 4 9 16 21 n.s. 34,9% 24,6% 8,4% 6,3% 3,0%Other 0 0 0 0 0 0 0 n.s. n.s. n.s. n.s. n.s. n.s.
Gross Elec. Generation (TWh e) 105 290 499 658 881 1 040 1 185 10,7% 5,6% 2,8% 3,0% 1,7% 1,3%Coal 18 111 219 189 125 112 130 20,2% 7,0% -1,5% -4,0% -1,1% 1,5%
of which CCS 0 0 0 0 14 74 127 n.s. n.s. n.s. n.s. 18,2% 5,6%Oil 19 35 19 24 23 21 11 6,3% -5,8% 2,3% -0,3% -0,7% -6,2%Gas 10 29 103 166 219 200 210 11,9% 13,4% 4,8% 2,8% -0,9% 0,5%
of which CCS 0 0 0 0 12 74 147 n.s. n.s. n.s. n.s. 19,9% 7,1%Biomass & Waste 0 0 1 13 33 64 90 n.s. 28,1% 28,4% 9,4% 6,8% 3,4%
of which CCS 0 0 0 0 0 1 13 n.s. n.s. n.s. n.s. n.s. 24,7%Nuclear 53 109 149 211 352 426 420 7,5% 3,2% 3,6% 5,3% 1,9% -0,1%Hydro 6 6 6 8 8 8 8 -1,2% 1,4% 1,8% 0,6% 0,2% 0,1%Wind 0 0 1 37 95 145 196 n.s. 48,1% 45,6% 10,0% 4,3% 3,1%Solar 0 0 1 11 24 63 117 17,5% n.s. 30,2% 8,3% 10,0% 6,5%Other 0 0 0 0 0 1 3 n.s. n.s. n.s. 27,3% 16,1% 13,6%
Generation Capacity (GWe) 21 49 73 138 213 263 328 8,8% 4,1% 6,5% 4,4% 2,1% 2,2%Coal 4 14 24 33 32 19 19 14,3% 5,6% 3,0% -0,1% -5,2% 0,2%
of which CCS 0 0 0 0 2 10 19 n.s. n.s. n.s. n.s. 18,8% 6,3%Oil 5 5 5 5 6 6 7 0,1% 1,0% -0,7% 1,1% 1,3% 0,6%Gas 3 13 19 38 56 56 57 17,4% 4,3% 7,0% 3,9% 0,0% 0,2%
of which CCS 0 0 0 0 2 10 21 n.s. n.s. n.s. n.s. 20,7% 7,5%Biomass & Waste 0 1 0 3 6 11 15 n.s. -12,0% 33,9% 7,5% 6,2% 3,0%
of which CCS 0 0 0 0 0 0 2 n.s. n.s. n.s. n.s. n.s. 24,8%Nuclear 8 14 18 29 47 55 54 6,1% 2,6% 4,9% 5,1% 1,7% -0,3%Hydro 2 3 6 7 7 8 8 3,0% 5,8% 2,4% 0,5% 0,2% 0,1%Wind 0 0 0 16 40 58 76 n.s. 51,8% 44,9% 9,8% 3,9% 2,8%Solar 0 0 1 8 19 49 91 n.s. n.s. 28,8% 8,5% 10,1% 6,5%Other 0 0 0 0 0 0 0 n.s. n.s. n.s. 26,6% 15,6% 13,1%
Total Final Consumption 2 (Mtoe) 69 135 168 187 199 200 191 6,9% 2,2% 1,1% 0,6% 0,0% -0,4%Coal 16 15 18 18 13 10 7 -0,5% 1,9% 0,1% -3,1% -2,6% -3,7%Oil 44 80 82 82 72 58 45 6,2% 0,2% 0,0% -1,3% -2,2% -2,5%Gas 1 11 19 25 31 34 27 32,1% 5,9% 2,5% 2,4% 0,8% -2,3%Electricity 8 23 39 51 69 81 93 10,8% 5,5% 2,9% 3,0% 1,7% 1,3%Heat 0 3 4 5 5 6 7 n.s. 2,8% 0,9% 1,3% 1,1% 1,5%Biomass & Other 1 3 6 6 8 10 13 11,1% 5,8% 0,5% 3,1% 2,4% 2,2%Share of Renewables 3 (%) 3% 3% 5% 8% 14% 21% 29% 2,8% 3,5% 5,0% 5,6% 4,2% 3,4%
Industry (incl. non-energy use) 30 71 94 102 103 98 87 9,2% 2,9% 0,8% 0,1% -0,5% -1,3%Coal 7 14 17 17 13 10 7 8,1% 1,7% 0,3% -2,9% -2,5% -3,7%Oil 18 36 44 43 39 33 28 7,4% 2,0% -0,2% -1,0% -1,7% -1,6%Gas 0 3 7 11 18 22 18 44,4% 9,1% 5,0% 4,9% 1,9% -1,9%Electricity 5 13 20 24 27 29 30 10,0% 4,3% 2,2% 1,1% 0,7% 0,4%Heat 0 2 2 2 2 2 2 n.s. 1,0% 0,0% -0,2% -0,3% -0,2%Biomass & Other 0 3 5 4 4 3 2 24,8% 5,1% -0,7% -1,0% -3,8% -4,4%
Buildings 23 33 41 49 59 65 66 3,6% 2,2% 1,6% 1,9% 1,0% 0,2%Coal 9 1 1 1 0 0 0 -24,1% 4,5% -2,8% -11,8% -16,0% -16,2%Oil 10 14 7 6 5 4 3 3,3% -6,7% -2,1% -1,3% -1,7% -2,2%Gas 1 8 12 14 13 12 9 29,6% 4,5% 0,8% -0,3% -0,9% -3,1%Electricity 3 9 18 25 37 44 48 11,9% 7,1% 3,5% 3,7% 1,8% 1,0%Heat 0 1 2 2 3 4 5 n.s. 5,5% 1,9% 2,5% 1,9% 2,4%Biomass & Other 1 0 1 1 1 1 1 -7,0% 8,8% -1,0% -2,2% 5,5% -4,3%
Agriculture 2 4 3 3 4 4 5 8,1% -1,8% 1,0% 1,6% 1,0% 0,8%Coal 0 0 0 0 0 0 0 n.s. n.s. n.s. n.s. n.s. n.s.Oil 2 3 2 2 2 1 1 7,5% -3,7% 0,6% -2,3% -4,2% -4,5%Gas 0 0 0 0 0 0 0 n.s. -9,6% 1,7% -1,4% -2,9% -3,2%Electricity 0 0 1 1 2 2 3 13,8% 6,6% 1,2% 4,4% 3,1% 2,1%Heat 0 0 0 0 0 0 0 n.s. n.s. n.s. n.s. n.s. n.s.Biomass & Other 0 0 0 0 1 1 1 n.s. n.s. n.s. 23,0% 6,4% 2,5%
Transport 15 27 29 33 33 32 34 6,3% 0,8% 1,1% 0,0% -0,3% 0,7%Coal 0 0 0 0 0 0 0 n.s. n.s. n.s. n.s. n.s. n.s.Oil 15 27 29 31 26 20 13 6,3% 0,7% 0,8% -1,8% -2,8% -4,1%Gas 0 0 0 0 0 0 0 n.s. n.s. n.s. n.s. n.s. n.s.Electricity 0 0 0 1 4 7 12 7,2% 1,0% 12,5% 19,2% 6,5% 6,0%Heat 0 0 0 0 0 0 0 n.s. n.s. n.s. n.s. n.s. n.s.Biomass & Other 0 0 0 1 3 5 9 n.s. n.s. 19,0% 15,3% 6,3% 5,3%
Energy Branch Consumption 4 9 11 12 12 11 11 9,1% 2,2% 0,3% -0,1% -0,5% -0,4%Other Transformation & Losses 4 9 31 45 57 77 92 107 13,3% 3,8% 2,5% 3,0% 1,8% 1,6%
2 does not include international aviation and maritime bunkers; includes non-energy uses3 ratio of renewable energy over final energy demand increased by distribution losses and self consumption of electricity and steam plants4 includes statistical differences
98

GECO2015 Global Mitigation 150504 SUMMARY GHG & ENERGY BALANCE##### 100
China 1990 2000 2010 2020 2030 2040 2050 '90-'00 '00-'10 '10-'20 '20-'30 '30-'40 '40-'50Main Economic Indicators
Population (Million) 1 166 1 281 1 360 1 433 1 454 1 436 1 386 0,9% 0,6% 0,5% 0,1% -0,1% -0,4%GDP per capita (ppp, k$'05) 1 3 7 13 22 32 41 8,9% 9,5% 6,8% 5,3% 3,7% 2,5%GDP per capita (mer, k$'05) 1 1 3 6 10 14 18 8,6% 9,3% 6,8% 5,3% 3,7% 2,5%Share Value Added - Agriculture (%) 22 13 10 8 7 7 7 -5,1% -3,0% -1,7% -0,9% -0,4% -0,2%Share Value Added - Industry (%) 34 42 45 43 37 30 26 2,1% 0,8% -0,6% -1,5% -1,8% -1,7%Share Value Added - Services (%) 44 45 45 49 56 62 67 0,3% 0,0% 0,9% 1,3% 1,1% 0,8%
PricesInternational/Regional ($'05/boe)
Coal 16 7 20 24 26 28 32 -7,7% 10,7% 1,6% 0,7% 1,0% 1,3%Oil 33 32 72 96 103 104 74 -0,2% 8,3% 2,9% 0,7% 0,1% -3,3%Gas 28 24 48 38 39 36 29 -1,2% 6,9% -2,1% 0,1% -0,7% -2,3%
GHG emissions (Mt CO2 eq.)Total GHG (excl. LULUCF) 3 936 5 225 10 639 14 402 10 901 7 063 3 949 2,9% 7,4% 3,1% -2,7% -4,2% -5,6%CO2 2 598 3 779 8 359 12 120 9 707 6 190 3 418 3,8% 8,3% 3,8% -2,2% -4,4% -5,8%CH4 1 011 1 039 1 636 1 419 749 551 419 0,3% 4,6% -1,4% -6,2% -3,0% -2,7%N2O 314 356 467 537 411 304 103 1,3% 2,8% 1,4% -2,6% -3,0% -10,3%F gases 13 51 177 326 34 18 10 14,8% 13,3% 6,3% -20,3% -6,2% -5,7%Total GHG from Energy and Industry 3 160 4 436 9 635 13 293 10 086 6 411 3 590 3,4% 8,1% 3,3% -2,7% -4,4% -5,6%CO2 Emissions from Fuel Comb. 2 300 3 234 6 716 9 719 7 304 4 199 2 105 3,5% 7,6% 3,8% -2,8% -5,4% -6,7%
Power generation/District heating 615 1 280 3 281 4 899 3 107 1 132 174 7,6% 9,9% 4,1% -4,5% -9,6% -17,1%Industry 867 992 1 765 2 379 1 898 1 113 553 1,4% 5,9% 3,0% -2,2% -5,2% -6,8%Buildings 446 326 482 615 488 406 274 -3,1% 4,0% 2,5% -2,3% -1,8% -3,8%Agriculture 96 47 81 95 68 40 23 -6,8% 5,5% 1,7% -3,3% -5,3% -5,4%Transport 115 229 463 780 895 803 586 7,1% 7,3% 5,4% 1,4% -1,1% -3,1%Other 162 359 644 950 847 705 495 8,3% 6,0% 4,0% -1,1% -1,8% -3,5%
CO2 captured (CCS) 0 0 0 0 459 2 206 3 598 n.s. n.s. n.s. n.s. 17,0% 5,0%Coal 0 0 0 0 442 2 008 2 877 n.s. n.s. n.s. n.s. 16,3% 3,7%Gas 0 0 0 0 17 128 324 n.s. n.s. n.s. n.s. 22,3% 9,7%Biomass 0 0 0 0 0 70 398 n.s. n.s. n.s. 1,4% n.s. 18,9%
Energy Balance, by fuel (Mtoe)Primary Production 997 1 244 2 247 2 701 2 840 3 079 3 244 2,2% 6,1% 1,9% 0,5% 0,8% 0,5%
Coal 636 834 1 667 1 803 1 084 873 853 2,7% 7,2% 0,8% -5,0% -2,1% -0,2%Oil 137 161 201 202 151 87 42 1,6% 2,3% 0,0% -2,9% -5,4% -6,9%Natural gas 13 22 77 152 381 433 415 5,8% 13,2% 7,0% 9,6% 1,3% -0,4%Biomass 200 203 205 216 249 308 357 0,1% 0,1% 0,5% 1,5% 2,1% 1,5%Nuclear1 0 4 19 127 583 837 942 n.s. 15,9% 20,7% 16,5% 3,7% 1,2%Hydro 11 19 62 118 157 157 156 5,8% 12,5% 6,7% 2,9% 0,0% -0,1%Other renewables 0 1 15 82 235 383 478 40,5% 30,9% 18,8% 11,1% 5,0% 2,2%
Net Imports - 128 - 47 156 858 1 038 882 639Coal - 108 - 104 - 80 348 366 176 107Oil - 22 59 234 449 549 530 402Natural gas 1 - 2 4 63 76 99 65Biomass 0 0 0 - 1 43 64 48Biofuels 0 0 0 0 4 14 17Electricity 0 - 1 - 1 - 1 - 1 - 1 - 1
Primary Energy Demand2 868 1 197 2 404 3 559 3 878 3 961 3 882 3,3% 7,2% 4,0% 0,9% 0,2% -0,2%Coal 528 730 1 587 2 151 1 450 1 049 960 3,3% 8,1% 3,1% -3,9% -3,2% -0,9%Oil 115 220 435 651 700 616 445 6,7% 7,1% 4,1% 0,7% -1,3% -3,2%Natural gas 14 21 81 215 457 532 481 4,0% 14,7% 10,2% 7,8% 1,5% -1,0%Biomass 200 203 205 215 292 372 405 0,1% 0,1% 0,5% 3,1% 2,4% 0,9%Nuclear1 0 4 19 127 583 837 942 n.s. 15,9% 20,7% 16,5% 3,7% 1,2%Hydro 11 19 62 118 157 157 156 5,8% 12,5% 6,7% 2,9% 0,0% -0,1%Other renewables 0 1 15 82 235 383 478 40,5% 30,9% 18,8% 11,1% 5,0% 2,2%
Primary Energy Demand, by sector (Mtoe)Primary Energy Demand 868 1 197 2 404 3 559 3 878 3 961 3 882 3,3% 7,2% 4,0% 0,9% 0,2% -0,2%Energy for Power Generation 168 350 931 1 634 2 002 2 363 2 673 7,6% 10,3% 5,8% 2,1% 1,7% 1,2%Other Transformation & Losses 50 115 377 670 939 1 175 1 373 8,6% 12,6% 5,9% 3,4% 2,3% 1,6%Energy Branch Consumption 55 117 215 335 349 344 333 7,9% 6,2% 4,5% 0,4% -0,1% -0,3%Final consumption 703 850 1 618 2 317 2 511 2 455 2 263 1,9% 6,7% 3,7% 0,8% -0,2% -0,8%
Steel, Non-Met. Minerals and Chem. 150 237 567 779 727 580 456 4,7% 9,1% 3,2% -0,7% -2,2% -2,4%Other Industry 117 125 256 454 571 622 631 0,6% 7,5% 5,9% 2,3% 0,9% 0,1%Non-Energy Use 46 62 134 177 191 175 140 3,0% 8,0% 2,8% 0,7% -0,8% -2,2%Residential 300 283 355 388 356 327 286 -0,6% 2,3% 0,9% -0,9% -0,8% -1,3%Services 25 41 98 176 245 312 348 4,9% 9,3% 6,0% 3,4% 2,4% 1,1%Agriculture 31 18 32 39 43 46 47 -5,2% 5,7% 2,3% 1,0% 0,5% 0,2%Road 21 59 136 234 282 289 261 11,1% 8,7% 5,6% 1,9% 0,3% -1,0%Rail 12 9 12 17 20 22 23 -2,2% 2,7% 3,3% 1,9% 1,2% 0,4%Aviation 1 4 11 24 39 47 43 22,1% 10,3% 7,9% 4,9% 2,0% -0,8%Other Transport 2 12 17 29 37 35 28 16,9% 3,8% 5,3% 2,6% -0,7% -2,3%
1 Primary energy from nuclear is calculated considering the primary heat equivalent of the electricity produced with an average efficiency of 33%
99

GECO2015 Global Mitigation 150504 SUMMARY GHG & ENERGY BALANCE##### 100
China 1990 2000 2010 2020 2030 2040 2050 '90-'00 '00-'10 '10-'20 '20-'30 '30-'40 '40-'50Power Generation
Fuel Inputs Therm. Power (Mtoe) 157 326 835 1 306 1 027 985 1 097 7,6% 9,9% 4,6% -2,4% -0,4% 1,1%Coal 144 310 811 1 183 785 670 710 8,0% 10,1% 3,9% -4,0% -1,6% 0,6%Oil 12 13 6 16 28 34 25 0,7% -8,3% 11,3% 5,6% 2,0% -2,9%Gas 1 1 15 59 143 162 193 7,5% 28,1% 14,3% 9,4% 1,2% 1,8%Biomass & Waste 0 1 4 48 71 119 168 n.s. 16,8% 28,5% 4,0% 5,3% 3,5%Other 0 0 0 0 0 0 0 n.s. n.s. n.s. n.s. n.s. n.s.
Gross Elec. Generation (TWh e) 621 1 356 4 226 8 130 11 189 13 695 15 824 8,1% 12,0% 6,8% 3,2% 2,0% 1,5%Coal 443 1 062 3 273 5 063 3 561 3 102 3 372 9,1% 11,9% 4,5% -3,5% -1,4% 0,8%
of which CCS 0 0 0 0 510 2 212 3 215 n.s. n.s. n.s. n.s. 15,8% 3,8%Oil 49 46 13 69 120 148 111 -0,5% -11,7% 18,0% 5,6% 2,2% -2,8%Gas 3 6 69 274 740 938 1 199 7,6% 28,2% 14,8% 10,5% 2,4% 2,5%
of which CCS 0 0 0 0 48 353 908 n.s. n.s. n.s. n.s. 22,1% 9,9%Biomass & Waste 0 2 3 200 305 535 804 n.s. 3,3% 50,4% 4,3% 5,8% 4,2%
of which CCS 0 0 0 0 0 62 315 n.s. n.s. n.s. n.s. n.s. 17,7%Nuclear 0 17 74 502 2 355 3 390 3 814 n.s. 16,0% 21,1% 16,7% 3,7% 1,2%Hydro 127 222 722 1 376 1 823 1 831 1 811 5,8% 12,5% 6,7% 2,9% 0,0% -0,1%Wind 0 1 70 561 2 004 2 930 2 846 n.s. n.s. 23,1% 13,6% 3,9% -0,3%Solar 0 0 1 85 279 804 1 808 26,7% 27,8% 57,0% 12,6% 11,2% 8,4%Other 0 0 0 0 3 17 59 n.s. n.s. 0,2% 34,0% 17,5% 13,5%
Generation Capacity (GWe) 149 336 1 012 1 896 3 209 3 726 4 424 8,5% 11,7% 6,5% 5,4% 1,5% 1,7%Coal 92 225 707 1 020 1 147 687 629 9,3% 12,1% 3,7% 1,2% -5,0% -0,9%
of which CCS 0 0 0 0 68 317 557 n.s. n.s. n.s. n.s. 16,7% 5,8%Oil 18 20 15 11 17 26 33 1,1% -2,9% -3,4% 5,1% 4,0% 2,4%Gas 3 8 31 67 141 226 283 11,7% 14,3% 7,9% 7,7% 4,9% 2,3%
of which CCS 0 0 0 0 6 46 133 n.s. n.s. n.s. n.s. 22,6% 11,2%Biomass & Waste 0 0 0 27 41 72 109 n.s. 0,0% 49,5% 4,3% 5,8% 4,2%
of which CCS 0 0 0 0 0 8 42 n.s. n.s. n.s. n.s. n.s. 17,8%Nuclear 0 2 10 65 297 419 468 n.s. 16,6% 20,4% 16,5% 3,5% 1,1%Hydro 36 79 216 412 537 541 536 8,2% 10,5% 6,7% 2,7% 0,1% -0,1%Wind 0 0 31 239 843 1 223 1 175 n.s. 57,2% 22,5% 13,4% 3,8% -0,4%Solar 0 0 1 57 185 529 1 183 26,7% 31,7% 52,1% 12,5% 11,1% 8,4%Other 0 0 0 0 0 2 8 n.s. n.s. n.s. 33,3% 17,0% 13,0%
Total Final Consumption 2 (Mtoe) 703 850 1 618 2 317 2 511 2 455 2 263 1,9% 6,7% 3,7% 0,8% -0,2% -0,8%Coal 354 337 623 793 548 295 173 -0,5% 6,3% 2,4% -3,6% -6,0% -5,2%Oil 85 179 370 553 586 504 359 7,7% 7,6% 4,1% 0,6% -1,5% -3,4%Gas 10 15 52 116 226 269 198 4,3% 13,6% 8,3% 6,9% 1,8% -3,0%Electricity 41 89 297 578 797 980 1 137 8,0% 12,8% 6,9% 3,3% 2,1% 1,5%Heat 13 28 76 113 143 176 194 7,7% 10,6% 4,1% 2,3% 2,1% 1,0%Biomass & Other 200 202 201 164 211 231 203 0,1% -0,1% -2,0% 2,5% 0,9% -1,3%Share of Renewables 3 (%) 32% 27% 18% 17% 25% 33% 38% -1,4% -4,1% -0,7% 4,1% 2,6% 1,5%
Industry (incl. non-energy use) 312 423 957 1 410 1 488 1 377 1 227 3,1% 8,5% 3,9% 0,5% -0,8% -1,1%Coal 226 267 542 713 520 287 170 1,7% 7,3% 2,8% -3,1% -5,8% -5,1%Oil 38 69 141 187 189 157 109 6,0% 7,4% 2,9% 0,1% -1,8% -3,6%Gas 7 9 26 51 123 159 123 2,2% 11,1% 6,7% 9,3% 2,6% -2,6%Electricity 30 59 203 400 529 612 680 7,2% 13,1% 7,0% 2,8% 1,5% 1,1%Heat 11 19 45 56 68 78 84 5,9% 9,1% 2,1% 2,0% 1,4% 0,7%Biomass & Other 0 0 0 4 60 82 61 n.s. n.s. n.s. 29,8% 3,3% -3,0%
Buildings 325 324 453 564 601 639 634 0,0% 3,4% 2,2% 0,6% 0,6% -0,1%Coal 105 60 69 68 21 3 1 -5,4% 1,3% -0,1% -11,2% -16,4% -16,6%Oil 7 23 47 61 53 43 30 12,9% 7,2% 2,7% -1,5% -2,1% -3,3%Gas 2 5 26 65 102 110 75 10,3% 17,0% 9,8% 4,7% 0,7% -3,8%Electricity 8 24 82 159 230 307 377 12,2% 13,1% 6,8% 3,8% 2,9% 2,1%Heat 3 9 31 57 75 97 110 13,4% 13,2% 6,5% 2,7% 2,6% 1,2%Biomass & Other 200 202 200 154 120 78 41 0,1% -0,1% -2,6% -2,5% -4,2% -6,4%
Agriculture 31 18 32 39 43 46 47 -5,2% 5,7% 2,3% 1,0% 0,5% 0,2%Coal 11 5 9 9 5 2 1 -7,2% 5,3% 0,5% -6,0% -8,5% -8,5%Oil 16 8 14 18 15 10 6 -6,4% 5,6% 2,6% -1,8% -4,2% -4,7%Gas 0 0 0 0 0 0 0 n.s. n.s. 5,0% -0,3% -2,2% -2,7%Electricity 4 5 8 11 16 20 22 2,2% 6,2% 3,0% 3,4% 2,2% 1,0%Heat 0 0 0 0 0 0 0 n.s. n.s. n.s. n.s. n.s. n.s.Biomass & Other 0 0 0 0 7 14 18 n.s. n.s. n.s. 33,0% 6,7% 2,4%
Transport 35 84 176 303 378 394 356 9,1% 7,7% 5,6% 2,2% 0,4% -1,0%Coal 11 4 3 3 2 2 2 -8,4% -3,3% -0,4% -2,0% -2,0% -2,0%Oil 24 78 168 287 329 295 213 12,6% 8,0% 5,5% 1,4% -1,1% -3,2%Gas 0 0 0 0 0 0 0 n.s. n.s. n.s. n.s. n.s. n.s.Electricity 1 1 3 8 22 41 58 9,6% 10,3% 8,6% 11,0% 6,2% 3,6%Heat 0 0 0 0 0 0 0 n.s. n.s. n.s. n.s. n.s. n.s.Biomass & Other 0 0 1 5 24 57 83 n.s. n.s. 17,0% 16,6% 9,2% 4,0%
Energy Branch Consumption 55 117 215 335 349 344 333 7,9% 6,2% 4,5% 0,4% -0,1% -0,3%Other Transformation & Losses 4 50 115 377 670 939 1 175 1 373 8,6% 12,6% 5,9% 3,4% 2,3% 1,6%
2 does not include international aviation and maritime bunkers; includes non-energy uses3 ratio of renewable energy over final energy demand increased by distribution losses and self consumption of electricity and steam plants4 includes statistical differences
100
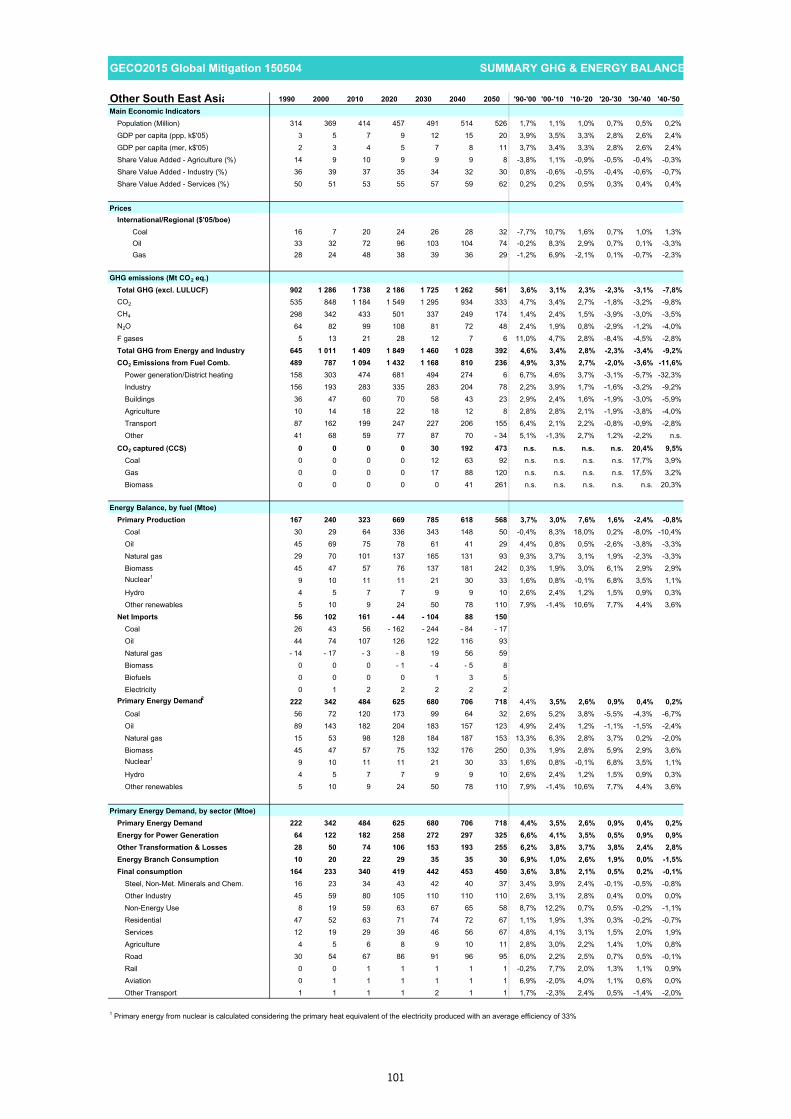
GECO2015 Global Mitigation 150504 SUMMARY GHG & ENERGY BALANCE##### 100
Other South East Asia 1990 2000 2010 2020 2030 2040 2050 '90-'00 '00-'10 '10-'20 '20-'30 '30-'40 '40-'50Main Economic Indicators
Population (Million) 314 369 414 457 491 514 526 1,7% 1,1% 1,0% 0,7% 0,5% 0,2%GDP per capita (ppp, k$'05) 3 5 7 9 12 15 20 3,9% 3,5% 3,3% 2,8% 2,6% 2,4%GDP per capita (mer, k$'05) 2 3 4 5 7 8 11 3,7% 3,4% 3,3% 2,8% 2,6% 2,4%Share Value Added - Agriculture (%) 14 9 10 9 9 9 8 -3,8% 1,1% -0,9% -0,5% -0,4% -0,3%Share Value Added - Industry (%) 36 39 37 35 34 32 30 0,8% -0,6% -0,5% -0,4% -0,6% -0,7%Share Value Added - Services (%) 50 51 53 55 57 59 62 0,2% 0,2% 0,5% 0,3% 0,4% 0,4%
PricesInternational/Regional ($'05/boe)
Coal 16 7 20 24 26 28 32 -7,7% 10,7% 1,6% 0,7% 1,0% 1,3%Oil 33 32 72 96 103 104 74 -0,2% 8,3% 2,9% 0,7% 0,1% -3,3%Gas 28 24 48 38 39 36 29 -1,2% 6,9% -2,1% 0,1% -0,7% -2,3%
GHG emissions (Mt CO2 eq.)Total GHG (excl. LULUCF) 902 1 286 1 738 2 186 1 725 1 262 561 3,6% 3,1% 2,3% -2,3% -3,1% -7,8%CO2 535 848 1 184 1 549 1 295 934 333 4,7% 3,4% 2,7% -1,8% -3,2% -9,8%CH4 298 342 433 501 337 249 174 1,4% 2,4% 1,5% -3,9% -3,0% -3,5%N2O 64 82 99 108 81 72 48 2,4% 1,9% 0,8% -2,9% -1,2% -4,0%F gases 5 13 21 28 12 7 6 11,0% 4,7% 2,8% -8,4% -4,5% -2,8%Total GHG from Energy and Industry 645 1 011 1 409 1 849 1 460 1 028 392 4,6% 3,4% 2,8% -2,3% -3,4% -9,2%CO2 Emissions from Fuel Comb. 489 787 1 094 1 432 1 168 810 236 4,9% 3,3% 2,7% -2,0% -3,6% -11,6%
Power generation/District heating 158 303 474 681 494 274 6 6,7% 4,6% 3,7% -3,1% -5,7% -32,3%Industry 156 193 283 335 283 204 78 2,2% 3,9% 1,7% -1,6% -3,2% -9,2%Buildings 36 47 60 70 58 43 23 2,9% 2,4% 1,6% -1,9% -3,0% -5,9%Agriculture 10 14 18 22 18 12 8 2,8% 2,8% 2,1% -1,9% -3,8% -4,0%Transport 87 162 199 247 227 206 155 6,4% 2,1% 2,2% -0,8% -0,9% -2,8%Other 41 68 59 77 87 70 - 34 5,1% -1,3% 2,7% 1,2% -2,2% n.s.
CO2 captured (CCS) 0 0 0 0 30 192 473 n.s. n.s. n.s. n.s. 20,4% 9,5%Coal 0 0 0 0 12 63 92 n.s. n.s. n.s. n.s. 17,7% 3,9%Gas 0 0 0 0 17 88 120 n.s. n.s. n.s. n.s. 17,5% 3,2%Biomass 0 0 0 0 0 41 261 n.s. n.s. n.s. n.s. n.s. 20,3%
Energy Balance, by fuel (Mtoe)Primary Production 167 240 323 669 785 618 568 3,7% 3,0% 7,6% 1,6% -2,4% -0,8%
Coal 30 29 64 336 343 148 50 -0,4% 8,3% 18,0% 0,2% -8,0% -10,4%Oil 45 69 75 78 61 41 29 4,4% 0,8% 0,5% -2,6% -3,8% -3,3%Natural gas 29 70 101 137 165 131 93 9,3% 3,7% 3,1% 1,9% -2,3% -3,3%Biomass 45 47 57 76 137 181 242 0,3% 1,9% 3,0% 6,1% 2,9% 2,9%Nuclear1 9 10 11 11 21 30 33 1,6% 0,8% -0,1% 6,8% 3,5% 1,1%Hydro 4 5 7 7 9 9 10 2,6% 2,4% 1,2% 1,5% 0,9% 0,3%Other renewables 5 10 9 24 50 78 110 7,9% -1,4% 10,6% 7,7% 4,4% 3,6%
Net Imports 56 102 161 - 44 - 104 88 150Coal 26 43 56 - 162 - 244 - 84 - 17Oil 44 74 107 126 122 116 93Natural gas - 14 - 17 - 3 - 8 19 56 59Biomass 0 0 0 - 1 - 4 - 5 8Biofuels 0 0 0 0 1 3 5Electricity 0 1 2 2 2 2 2
Primary Energy Demand2 222 342 484 625 680 706 718 4,4% 3,5% 2,6% 0,9% 0,4% 0,2%Coal 56 72 120 173 99 64 32 2,6% 5,2% 3,8% -5,5% -4,3% -6,7%Oil 89 143 182 204 183 157 123 4,9% 2,4% 1,2% -1,1% -1,5% -2,4%Natural gas 15 53 98 128 184 187 153 13,3% 6,3% 2,8% 3,7% 0,2% -2,0%Biomass 45 47 57 75 132 176 250 0,3% 1,9% 2,8% 5,9% 2,9% 3,6%Nuclear1 9 10 11 11 21 30 33 1,6% 0,8% -0,1% 6,8% 3,5% 1,1%Hydro 4 5 7 7 9 9 10 2,6% 2,4% 1,2% 1,5% 0,9% 0,3%Other renewables 5 10 9 24 50 78 110 7,9% -1,4% 10,6% 7,7% 4,4% 3,6%
Primary Energy Demand, by sector (Mtoe)Primary Energy Demand 222 342 484 625 680 706 718 4,4% 3,5% 2,6% 0,9% 0,4% 0,2%Energy for Power Generation 64 122 182 258 272 297 325 6,6% 4,1% 3,5% 0,5% 0,9% 0,9%Other Transformation & Losses 28 50 74 106 153 193 255 6,2% 3,8% 3,7% 3,8% 2,4% 2,8%Energy Branch Consumption 10 20 22 29 35 35 30 6,9% 1,0% 2,6% 1,9% 0,0% -1,5%Final consumption 164 233 340 419 442 453 450 3,6% 3,8% 2,1% 0,5% 0,2% -0,1%
Steel, Non-Met. Minerals and Chem. 16 23 34 43 42 40 37 3,4% 3,9% 2,4% -0,1% -0,5% -0,8%Other Industry 45 59 80 105 110 110 110 2,6% 3,1% 2,8% 0,4% 0,0% 0,0%Non-Energy Use 8 19 59 63 67 65 58 8,7% 12,2% 0,7% 0,5% -0,2% -1,1%Residential 47 52 63 71 74 72 67 1,1% 1,9% 1,3% 0,3% -0,2% -0,7%Services 12 19 29 39 46 56 67 4,8% 4,1% 3,1% 1,5% 2,0% 1,9%Agriculture 4 5 6 8 9 10 11 2,8% 3,0% 2,2% 1,4% 1,0% 0,8%Road 30 54 67 86 91 96 95 6,0% 2,2% 2,5% 0,7% 0,5% -0,1%Rail 0 0 1 1 1 1 1 -0,2% 7,7% 2,0% 1,3% 1,1% 0,9%Aviation 0 1 1 1 1 1 1 6,9% -2,0% 4,0% 1,1% 0,6% 0,0%Other Transport 1 1 1 1 2 1 1 1,7% -2,3% 2,4% 0,5% -1,4% -2,0%
1 Primary energy from nuclear is calculated considering the primary heat equivalent of the electricity produced with an average efficiency of 33%
101
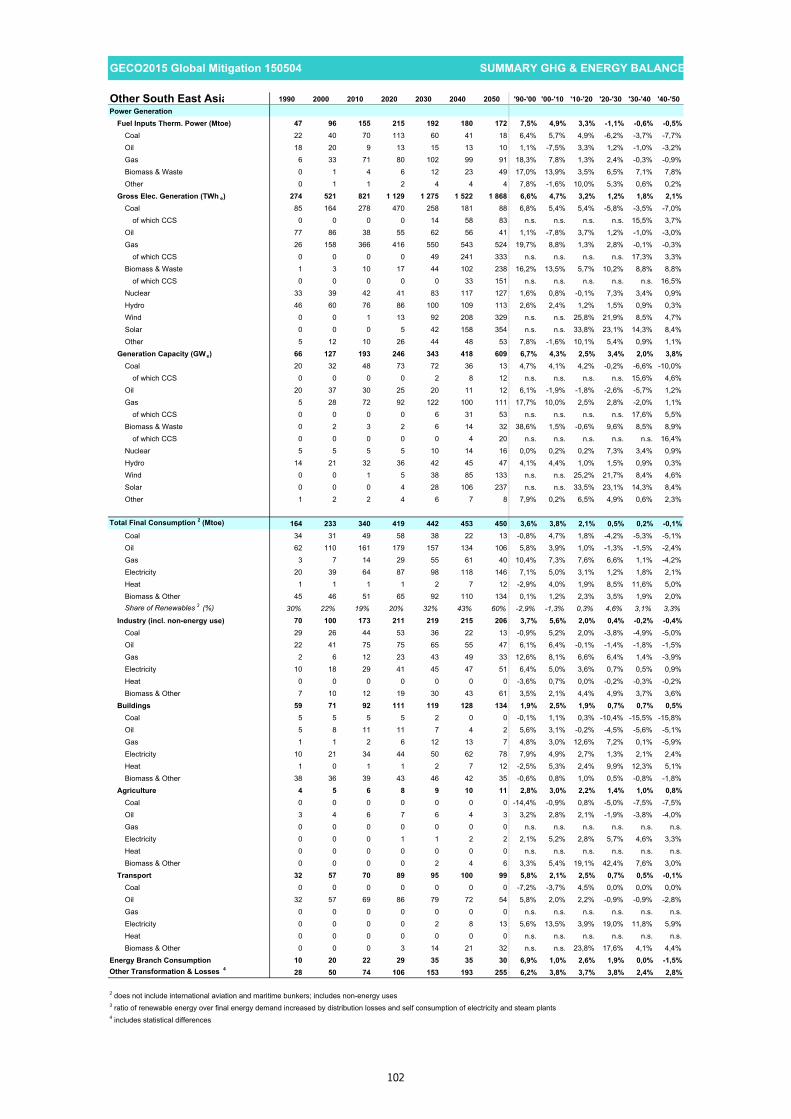
GECO2015 Global Mitigation 150504 SUMMARY GHG & ENERGY BALANCE##### 100
Other South East Asia 1990 2000 2010 2020 2030 2040 2050 '90-'00 '00-'10 '10-'20 '20-'30 '30-'40 '40-'50Power Generation
Fuel Inputs Therm. Power (Mtoe) 47 96 155 215 192 180 172 7,5% 4,9% 3,3% -1,1% -0,6% -0,5%Coal 22 40 70 113 60 41 18 6,4% 5,7% 4,9% -6,2% -3,7% -7,7%Oil 18 20 9 13 15 13 10 1,1% -7,5% 3,3% 1,2% -1,0% -3,2%Gas 6 33 71 80 102 99 91 18,3% 7,8% 1,3% 2,4% -0,3% -0,9%Biomass & Waste 0 1 4 6 12 23 49 17,0% 13,9% 3,5% 6,5% 7,1% 7,8%Other 0 1 1 2 4 4 4 7,8% -1,6% 10,0% 5,3% 0,6% 0,2%
Gross Elec. Generation (TWh e) 274 521 821 1 129 1 275 1 522 1 868 6,6% 4,7% 3,2% 1,2% 1,8% 2,1%Coal 85 164 278 470 258 181 88 6,8% 5,4% 5,4% -5,8% -3,5% -7,0%
of which CCS 0 0 0 0 14 58 83 n.s. n.s. n.s. n.s. 15,5% 3,7%Oil 77 86 38 55 62 56 41 1,1% -7,8% 3,7% 1,2% -1,0% -3,0%Gas 26 158 366 416 550 543 524 19,7% 8,8% 1,3% 2,8% -0,1% -0,3%
of which CCS 0 0 0 0 49 241 333 n.s. n.s. n.s. n.s. 17,3% 3,3%Biomass & Waste 1 3 10 17 44 102 238 16,2% 13,5% 5,7% 10,2% 8,8% 8,8%
of which CCS 0 0 0 0 0 33 151 n.s. n.s. n.s. n.s. n.s. 16,5%Nuclear 33 39 42 41 83 117 127 1,6% 0,8% -0,1% 7,3% 3,4% 0,9%Hydro 46 60 76 86 100 109 113 2,6% 2,4% 1,2% 1,5% 0,9% 0,3%Wind 0 0 1 13 92 208 329 n.s. n.s. 25,8% 21,9% 8,5% 4,7%Solar 0 0 0 5 42 158 354 n.s. n.s. 33,8% 23,1% 14,3% 8,4%Other 5 12 10 26 44 48 53 7,8% -1,6% 10,1% 5,4% 0,9% 1,1%
Generation Capacity (GWe) 66 127 193 246 343 418 609 6,7% 4,3% 2,5% 3,4% 2,0% 3,8%Coal 20 32 48 73 72 36 13 4,7% 4,1% 4,2% -0,2% -6,6% -10,0%
of which CCS 0 0 0 0 2 8 12 n.s. n.s. n.s. n.s. 15,6% 4,6%Oil 20 37 30 25 20 11 12 6,1% -1,9% -1,8% -2,6% -5,7% 1,2%Gas 5 28 72 92 122 100 111 17,7% 10,0% 2,5% 2,8% -2,0% 1,1%
of which CCS 0 0 0 0 6 31 53 n.s. n.s. n.s. n.s. 17,6% 5,5%Biomass & Waste 0 2 3 2 6 14 32 38,6% 1,5% -0,6% 9,6% 8,5% 8,9%
of which CCS 0 0 0 0 0 4 20 n.s. n.s. n.s. n.s. n.s. 16,4%Nuclear 5 5 5 5 10 14 16 0,0% 0,2% 0,2% 7,3% 3,4% 0,9%Hydro 14 21 32 36 42 45 47 4,1% 4,4% 1,0% 1,5% 0,9% 0,3%Wind 0 0 1 5 38 85 133 n.s. n.s. 25,2% 21,7% 8,4% 4,6%Solar 0 0 0 4 28 106 237 n.s. n.s. 33,5% 23,1% 14,3% 8,4%Other 1 2 2 4 6 7 8 7,9% 0,2% 6,5% 4,9% 0,6% 2,3%
Total Final Consumption 2 (Mtoe) 164 233 340 419 442 453 450 3,6% 3,8% 2,1% 0,5% 0,2% -0,1%Coal 34 31 49 58 38 22 13 -0,8% 4,7% 1,8% -4,2% -5,3% -5,1%Oil 62 110 161 179 157 134 106 5,8% 3,9% 1,0% -1,3% -1,5% -2,4%Gas 3 7 14 29 55 61 40 10,4% 7,3% 7,6% 6,6% 1,1% -4,2%Electricity 20 39 64 87 98 118 146 7,1% 5,0% 3,1% 1,2% 1,8% 2,1%Heat 1 1 1 1 2 7 12 -2,9% 4,0% 1,9% 8,5% 11,6% 5,0%Biomass & Other 45 46 51 65 92 110 134 0,1% 1,2% 2,3% 3,5% 1,9% 2,0%Share of Renewables 3 (%) 30% 22% 19% 20% 32% 43% 60% -2,9% -1,3% 0,3% 4,6% 3,1% 3,3%
Industry (incl. non-energy use) 70 100 173 211 219 215 206 3,7% 5,6% 2,0% 0,4% -0,2% -0,4%Coal 29 26 44 53 36 22 13 -0,9% 5,2% 2,0% -3,8% -4,9% -5,0%Oil 22 41 75 75 65 55 47 6,1% 6,4% -0,1% -1,4% -1,8% -1,5%Gas 2 6 12 23 43 49 33 12,6% 8,1% 6,6% 6,4% 1,4% -3,9%Electricity 10 18 29 41 45 47 51 6,4% 5,0% 3,6% 0,7% 0,5% 0,9%Heat 0 0 0 0 0 0 0 -3,6% 0,7% 0,0% -0,2% -0,3% -0,2%Biomass & Other 7 10 12 19 30 43 61 3,5% 2,1% 4,4% 4,9% 3,7% 3,6%
Buildings 59 71 92 111 119 128 134 1,9% 2,5% 1,9% 0,7% 0,7% 0,5%Coal 5 5 5 5 2 0 0 -0,1% 1,1% 0,3% -10,4% -15,5% -15,8%Oil 5 8 11 11 7 4 2 5,6% 3,1% -0,2% -4,5% -5,6% -5,1%Gas 1 1 2 6 12 13 7 4,8% 3,0% 12,6% 7,2% 0,1% -5,9%Electricity 10 21 34 44 50 62 78 7,9% 4,9% 2,7% 1,3% 2,1% 2,4%Heat 1 0 1 1 2 7 12 -2,5% 5,3% 2,4% 9,9% 12,3% 5,1%Biomass & Other 38 36 39 43 46 42 35 -0,6% 0,8% 1,0% 0,5% -0,8% -1,8%
Agriculture 4 5 6 8 9 10 11 2,8% 3,0% 2,2% 1,4% 1,0% 0,8%Coal 0 0 0 0 0 0 0 -14,4% -0,9% 0,8% -5,0% -7,5% -7,5%Oil 3 4 6 7 6 4 3 3,2% 2,8% 2,1% -1,9% -3,8% -4,0%Gas 0 0 0 0 0 0 0 n.s. n.s. n.s. n.s. n.s. n.s.Electricity 0 0 0 1 1 2 2 2,1% 5,2% 2,8% 5,7% 4,6% 3,3%Heat 0 0 0 0 0 0 0 n.s. n.s. n.s. n.s. n.s. n.s.Biomass & Other 0 0 0 0 2 4 6 3,3% 5,4% 19,1% 42,4% 7,6% 3,0%
Transport 32 57 70 89 95 100 99 5,8% 2,1% 2,5% 0,7% 0,5% -0,1%Coal 0 0 0 0 0 0 0 -7,2% -3,7% 4,5% 0,0% 0,0% 0,0%Oil 32 57 69 86 79 72 54 5,8% 2,0% 2,2% -0,9% -0,9% -2,8%Gas 0 0 0 0 0 0 0 n.s. n.s. n.s. n.s. n.s. n.s.Electricity 0 0 0 0 2 8 13 5,6% 13,5% 3,9% 19,0% 11,8% 5,9%Heat 0 0 0 0 0 0 0 n.s. n.s. n.s. n.s. n.s. n.s.Biomass & Other 0 0 0 3 14 21 32 n.s. n.s. 23,8% 17,6% 4,1% 4,4%
Energy Branch Consumption 10 20 22 29 35 35 30 6,9% 1,0% 2,6% 1,9% 0,0% -1,5%Other Transformation & Losses 4 28 50 74 106 153 193 255 6,2% 3,8% 3,7% 3,8% 2,4% 2,8%
2 does not include international aviation and maritime bunkers; includes non-energy uses3 ratio of renewable energy over final energy demand increased by distribution losses and self consumption of electricity and steam plants4 includes statistical differences
102
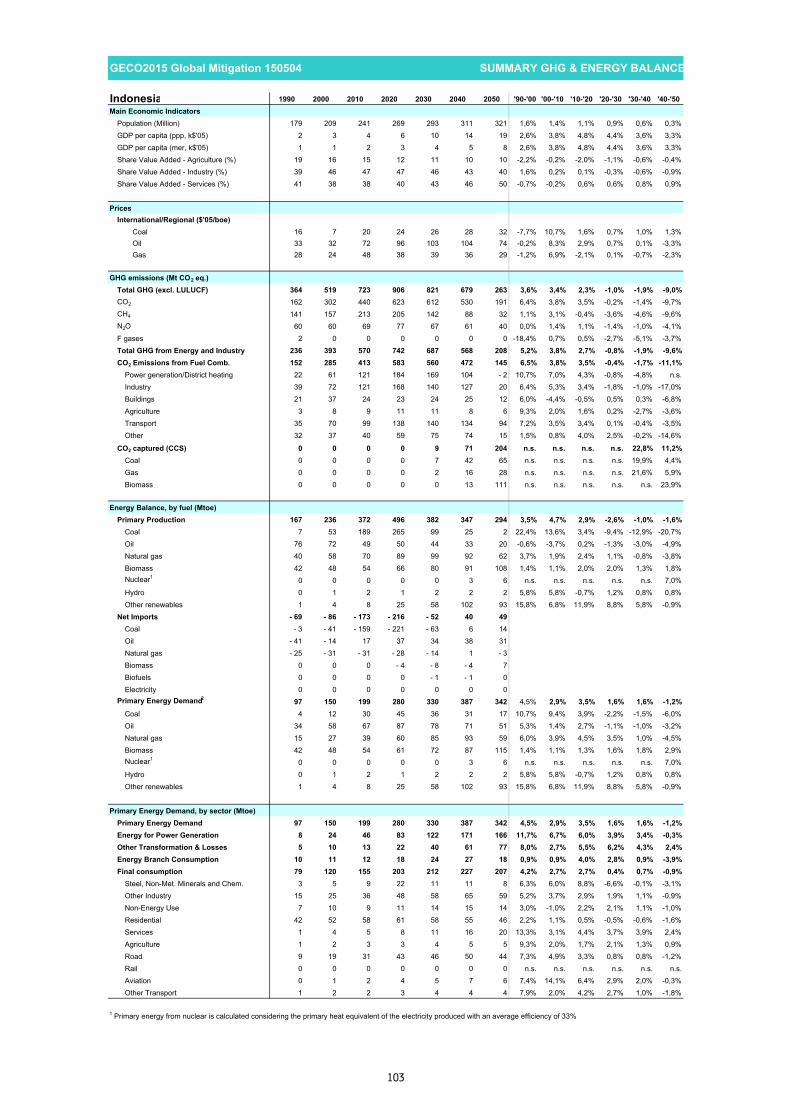
GECO2015 Global Mitigation 150504 SUMMARY GHG & ENERGY BALANCE##### 100
Indonesia 1990 2000 2010 2020 2030 2040 2050 '90-'00 '00-'10 '10-'20 '20-'30 '30-'40 '40-'50Main Economic Indicators
Population (Million) 179 209 241 269 293 311 321 1,6% 1,4% 1,1% 0,9% 0,6% 0,3%GDP per capita (ppp, k$'05) 2 3 4 6 10 14 19 2,6% 3,8% 4,8% 4,4% 3,6% 3,3%GDP per capita (mer, k$'05) 1 1 2 3 4 5 8 2,6% 3,8% 4,8% 4,4% 3,6% 3,3%Share Value Added - Agriculture (%) 19 16 15 12 11 10 10 -2,2% -0,2% -2,0% -1,1% -0,6% -0,4%Share Value Added - Industry (%) 39 46 47 47 46 43 40 1,6% 0,2% 0,1% -0,3% -0,6% -0,9%Share Value Added - Services (%) 41 38 38 40 43 46 50 -0,7% -0,2% 0,6% 0,6% 0,8% 0,9%
PricesInternational/Regional ($'05/boe)
Coal 16 7 20 24 26 28 32 -7,7% 10,7% 1,6% 0,7% 1,0% 1,3%Oil 33 32 72 96 103 104 74 -0,2% 8,3% 2,9% 0,7% 0,1% -3,3%Gas 28 24 48 38 39 36 29 -1,2% 6,9% -2,1% 0,1% -0,7% -2,3%
GHG emissions (Mt CO2 eq.)Total GHG (excl. LULUCF) 364 519 723 906 821 679 263 3,6% 3,4% 2,3% -1,0% -1,9% -9,0%CO2 162 302 440 623 612 530 191 6,4% 3,8% 3,5% -0,2% -1,4% -9,7%CH4 141 157 213 205 142 88 32 1,1% 3,1% -0,4% -3,6% -4,6% -9,6%N2O 60 60 69 77 67 61 40 0,0% 1,4% 1,1% -1,4% -1,0% -4,1%F gases 2 0 0 0 0 0 0 -18,4% 0,7% 0,5% -2,7% -5,1% -3,7%Total GHG from Energy and Industry 236 393 570 742 687 568 208 5,2% 3,8% 2,7% -0,8% -1,9% -9,6%CO2 Emissions from Fuel Comb. 152 285 413 583 560 472 145 6,5% 3,8% 3,5% -0,4% -1,7% -11,1%
Power generation/District heating 22 61 121 184 169 104 - 2 10,7% 7,0% 4,3% -0,8% -4,8% n.s.Industry 39 72 121 168 140 127 20 6,4% 5,3% 3,4% -1,8% -1,0% -17,0%Buildings 21 37 24 23 24 25 12 6,0% -4,4% -0,5% 0,5% 0,3% -6,8%Agriculture 3 8 9 11 11 8 6 9,3% 2,0% 1,6% 0,2% -2,7% -3,6%Transport 35 70 99 138 140 134 94 7,2% 3,5% 3,4% 0,1% -0,4% -3,5%Other 32 37 40 59 75 74 15 1,5% 0,8% 4,0% 2,5% -0,2% -14,6%
CO2 captured (CCS) 0 0 0 0 9 71 204 n.s. n.s. n.s. n.s. 22,8% 11,2%Coal 0 0 0 0 7 42 65 n.s. n.s. n.s. n.s. 19,9% 4,4%Gas 0 0 0 0 2 16 28 n.s. n.s. n.s. n.s. 21,6% 5,9%Biomass 0 0 0 0 0 13 111 n.s. n.s. n.s. n.s. n.s. 23,9%
Energy Balance, by fuel (Mtoe)Primary Production 167 236 372 496 382 347 294 3,5% 4,7% 2,9% -2,6% -1,0% -1,6%
Coal 7 53 189 265 99 25 2 22,4% 13,6% 3,4% -9,4% -12,9% -20,7%Oil 76 72 49 50 44 33 20 -0,6% -3,7% 0,2% -1,3% -3,0% -4,9%Natural gas 40 58 70 89 99 92 62 3,7% 1,9% 2,4% 1,1% -0,8% -3,8%Biomass 42 48 54 66 80 91 108 1,4% 1,1% 2,0% 2,0% 1,3% 1,8%Nuclear1 0 0 0 0 0 3 6 n.s. n.s. n.s. n.s. n.s. 7,0%Hydro 0 1 2 1 2 2 2 5,8% 5,8% -0,7% 1,2% 0,8% 0,8%Other renewables 1 4 8 25 58 102 93 15,8% 6,8% 11,9% 8,8% 5,8% -0,9%
Net Imports - 69 - 86 - 173 - 216 - 52 40 49Coal - 3 - 41 - 159 - 221 - 63 6 14Oil - 41 - 14 17 37 34 38 31Natural gas - 25 - 31 - 31 - 28 - 14 1 - 3Biomass 0 0 0 - 4 - 8 - 4 7Biofuels 0 0 0 0 - 1 - 1 0Electricity 0 0 0 0 0 0 0
Primary Energy Demand2 97 150 199 280 330 387 342 4,5% 2,9% 3,5% 1,6% 1,6% -1,2%Coal 4 12 30 45 36 31 17 10,7% 9,4% 3,9% -2,2% -1,5% -6,0%Oil 34 58 67 87 78 71 51 5,3% 1,4% 2,7% -1,1% -1,0% -3,2%Natural gas 15 27 39 60 85 93 59 6,0% 3,9% 4,5% 3,5% 1,0% -4,5%Biomass 42 48 54 61 72 87 115 1,4% 1,1% 1,3% 1,6% 1,8% 2,9%Nuclear1 0 0 0 0 0 3 6 n.s. n.s. n.s. n.s. n.s. 7,0%Hydro 0 1 2 1 2 2 2 5,8% 5,8% -0,7% 1,2% 0,8% 0,8%Other renewables 1 4 8 25 58 102 93 15,8% 6,8% 11,9% 8,8% 5,8% -0,9%
Primary Energy Demand, by sector (Mtoe)Primary Energy Demand 97 150 199 280 330 387 342 4,5% 2,9% 3,5% 1,6% 1,6% -1,2%Energy for Power Generation 8 24 46 83 122 171 166 11,7% 6,7% 6,0% 3,9% 3,4% -0,3%Other Transformation & Losses 5 10 13 22 40 61 77 8,0% 2,7% 5,5% 6,2% 4,3% 2,4%Energy Branch Consumption 10 11 12 18 24 27 18 0,9% 0,9% 4,0% 2,8% 0,9% -3,9%Final consumption 79 120 155 203 212 227 207 4,2% 2,7% 2,7% 0,4% 0,7% -0,9%
Steel, Non-Met. Minerals and Chem. 3 5 9 22 11 11 8 6,3% 6,0% 8,8% -6,6% -0,1% -3,1%Other Industry 15 25 36 48 58 65 59 5,2% 3,7% 2,9% 1,9% 1,1% -0,9%Non-Energy Use 7 10 9 11 14 15 14 3,0% -1,0% 2,2% 2,1% 1,1% -1,0%Residential 42 52 58 61 58 55 46 2,2% 1,1% 0,5% -0,5% -0,6% -1,6%Services 1 4 5 8 11 16 20 13,3% 3,1% 4,4% 3,7% 3,9% 2,4%Agriculture 1 2 3 3 4 5 5 9,3% 2,0% 1,7% 2,1% 1,3% 0,9%Road 9 19 31 43 46 50 44 7,3% 4,9% 3,3% 0,8% 0,8% -1,2%Rail 0 0 0 0 0 0 0 n.s. n.s. n.s. n.s. n.s. n.s.Aviation 0 1 2 4 5 7 6 7,4% 14,1% 6,4% 2,9% 2,0% -0,3%Other Transport 1 2 2 3 4 4 4 7,9% 2,0% 4,2% 2,7% 1,0% -1,8%
1 Primary energy from nuclear is calculated considering the primary heat equivalent of the electricity produced with an average efficiency of 33%
103

GECO2015 Global Mitigation 150504 SUMMARY GHG & ENERGY BALANCE##### 100
Indonesia 1990 2000 2010 2020 2030 2040 2050 '90-'00 '00-'10 '10-'20 '20-'30 '30-'40 '40-'50Power Generation
Fuel Inputs Therm. Power (Mtoe) 7 19 37 57 62 64 65 11,3% 6,7% 4,5% 0,9% 0,3% 0,1%Coal 2 8 19 32 26 23 15 13,7% 8,3% 5,4% -2,1% -1,1% -4,4%Oil 4 5 8 7 8 7 7 1,5% 6,3% -1,5% 0,7% -1,2% 0,1%Gas 0 6 9 15 22 19 19 39,3% 4,1% 5,7% 3,6% -1,1% -0,3%Biomass & Waste 0 0 0 0 2 6 18 n.s. 31,8% 21,9% 20,0% 12,9% 11,1%Other 0 0 1 2 5 9 7 15,8% 6,8% 11,6% 8,1% 5,1% -2,5%
Gross Elec. Generation (TWh e) 33 93 170 278 367 492 622 11,1% 6,2% 5,1% 2,8% 3,0% 2,4%Coal 10 34 68 129 114 106 70 13,3% 7,2% 6,6% -1,3% -0,7% -4,1%
of which CCS 0 0 0 0 9 46 68 n.s. n.s. n.s. n.s. 18,2% 4,1%Oil 15 18 35 31 33 29 30 1,8% 6,5% -1,2% 0,7% -1,2% 0,2%Gas 1 26 40 70 104 100 107 42,9% 4,4% 5,8% 4,0% -0,4% 0,7%
of which CCS 0 0 0 0 2 29 68 n.s. n.s. n.s. n.s. 28,9% 8,9%Biomass & Waste 0 0 0 1 8 30 89 n.s. n.s. n.s. 21,2% 13,4% 11,6%
of which CCS 0 0 0 0 0 10 58 n.s. n.s. n.s. n.s. n.s. 19,8%Nuclear 0 0 0 0 0 12 22 n.s. n.s. n.s. n.s. n.s. 6,3%Hydro 6 10 18 17 19 20 22 5,8% 5,8% -0,7% 1,2% 0,8% 0,8%Wind 0 0 0 2 21 63 108 n.s. n.s. n.s. 26,2% 11,7% 5,5%Solar 0 0 0 0 7 31 96 n.s. n.s. n.s. 33,3% 16,7% 12,0%Other 1 5 9 28 61 101 80 15,8% 6,8% 11,6% 8,1% 5,2% -2,3%
Generation Capacity (GWe) 13 25 34 62 89 125 179 6,9% 3,0% 6,2% 3,6% 3,5% 3,7%Coal 2 8 13 31 34 30 11 16,1% 5,4% 8,9% 1,1% -1,1% -9,5%
of which CCS 0 0 0 0 1 6 11 n.s. n.s. n.s. n.s. 18,8% 5,6%Oil 7 5 6 9 10 9 8 -4,6% 2,4% 5,0% 0,8% -1,6% -1,0%Gas 1 8 10 13 17 16 19 32,6% 2,0% 2,0% 3,2% -0,4% 1,3%
of which CCS 0 0 0 0 0 4 9 n.s. n.s. n.s. n.s. 29,2% 9,8%Biomass & Waste 0 0 0 0 1 4 12 n.s. n.s. n.s. 21,3% 13,6% 11,2%
of which CCS 0 0 0 0 0 1 8 n.s. n.s. n.s. n.s. n.s. 19,3%Nuclear 0 0 0 0 0 2 3 n.s. n.s. n.s. n.s. n.s. 6,1%Hydro 3 4 4 4 5 5 5 2,9% -1,2% 1,0% 1,2% 0,8% 0,8%Wind 0 0 0 1 8 26 43 n.s. n.s. n.s. 26,1% 11,6% 5,4%Solar 0 0 0 0 4 21 65 n.s. n.s. n.s. 33,8% 16,8% 12,2%Other 0 0 1 4 8 12 13 9,9% 12,7% 12,8% 7,9% 3,9% 0,3%
Total Final Consumption 2 (Mtoe) 79 120 155 203 212 227 207 4,2% 2,7% 2,7% 0,4% 0,7% -0,9%Coal 2 5 13 15 12 10 4 8,1% 10,7% 1,7% -2,1% -2,2% -8,2%Oil 27 48 61 83 74 68 48 6,1% 2,3% 3,2% -1,1% -0,8% -3,4%Gas 6 12 16 23 32 39 19 6,7% 3,2% 4,0% 3,3% 2,0% -7,2%Electricity 2 7 13 21 27 37 47 10,8% 6,5% 5,0% 2,8% 3,0% 2,5%Heat 0 0 0 1 3 7 8 n.s. n.s. n.s. 16,1% 8,6% 1,1%Biomass & Other 42 48 53 60 63 66 80 1,4% 1,0% 1,2% 0,5% 0,5% 2,0%Share of Renewables 3 (%) 59% 45% 37% 33% 38% 44% 62% -2,7% -1,8% -1,2% 1,3% 1,5% 3,6%
Industry (incl. non-energy use) 25 40 55 81 83 91 81 4,8% 3,1% 4,0% 0,2% 0,9% -1,1%Coal 2 5 13 15 12 10 4 8,0% 10,7% 1,7% -2,1% -2,2% -8,2%Oil 9 13 15 24 17 15 12 3,8% 1,9% 4,8% -3,7% -1,1% -2,3%Gas 6 11 16 22 27 33 15 6,7% 3,2% 3,3% 2,4% 1,8% -7,3%Electricity 1 3 4 8 9 11 12 8,9% 4,2% 5,6% 2,1% 1,5% 0,6%Heat 0 0 0 0 0 0 0 n.s. n.s. n.s. n.s. n.s. n.s.Biomass & Other 7 9 6 12 17 22 38 1,8% -3,0% 6,7% 3,5% 2,8% 5,4%
Buildings 43 55 63 69 69 71 67 2,7% 1,2% 0,9% 0,1% 0,2% -0,6%Coal 0 0 0 0 0 0 0 n.s. n.s. n.s. n.s. n.s. n.s.Oil 7 12 7 6 4 3 1 5,9% -4,5% -2,2% -3,8% -3,2% -7,3%Gas 0 0 0 2 5 7 3 8,1% 14,4% 27,3% 11,0% 3,3% -6,6%Electricity 1 4 8 13 17 23 30 12,6% 7,9% 4,7% 2,7% 2,9% 2,6%Heat 0 0 0 1 3 7 8 n.s. n.s. n.s. 16,1% 8,6% 1,1%Biomass & Other 35 40 47 47 40 31 24 1,3% 1,7% 0,0% -1,7% -2,5% -2,5%
Agriculture 1 2 3 3 4 5 5 9,3% 2,0% 1,7% 2,1% 1,3% 0,9%Coal 0 0 0 0 0 0 0 n.s. n.s. n.s. n.s. n.s. n.s.Oil 1 2 3 3 3 3 2 9,3% 2,0% 1,6% 0,2% -2,7% -3,6%Gas 0 0 0 0 0 0 0 n.s. n.s. n.s. n.s. n.s. n.s.Electricity 0 0 0 0 0 0 1 n.s. n.s. n.s. 40,5% 14,3% 6,8%Heat 0 0 0 0 0 0 0 n.s. n.s. n.s. n.s. n.s. n.s.Biomass & Other 0 0 0 0 1 2 3 n.s. n.s. n.s. 39,1% 10,8% 4,3%
Transport 11 21 35 50 56 61 54 7,4% 5,1% 3,6% 1,1% 0,9% -1,2%Coal 0 0 0 0 0 0 0 n.s. n.s. n.s. n.s. n.s. n.s.Oil 11 21 35 49 50 48 33 7,4% 5,1% 3,4% 0,1% -0,5% -3,5%Gas 0 0 0 0 0 0 0 n.s. n.s. n.s. n.s. n.s. n.s.Electricity 0 0 0 0 1 3 5 n.s. n.s. n.s. n.s. 14,9% 6,7%Heat 0 0 0 0 0 0 0 n.s. n.s. n.s. n.s. n.s. n.s.Biomass & Other 0 0 0 1 5 11 16 n.s. n.s. n.s. 21,8% 7,4% 3,8%
Energy Branch Consumption 10 11 12 18 24 27 18 0,9% 0,9% 4,0% 2,8% 0,9% -3,9%Other Transformation & Losses 4 5 10 13 22 40 61 77 8,0% 2,7% 5,5% 6,2% 4,3% 2,4%
2 does not include international aviation and maritime bunkers; includes non-energy uses3 ratio of renewable energy over final energy demand increased by distribution losses and self consumption of electricity and steam plants4 includes statistical differences
104

GECO2015 Global Mitigation 150504 SUMMARY GHG & ENERGY BALANCE##### 100
India 1990 2000 2010 2020 2030 2040 2050 '90-'00 '00-'10 '10-'20 '20-'30 '30-'40 '40-'50Main Economic Indicators
Population (Million) 869 1 042 1 206 1 353 1 476 1 566 1 620 1,8% 1,5% 1,2% 0,9% 0,6% 0,3%GDP per capita (ppp, k$'05) 1 2 3 5 9 14 20 3,7% 6,0% 4,9% 5,6% 4,6% 3,7%GDP per capita (mer, k$'05) 0 1 1 2 3 5 6 3,7% 6,0% 4,9% 5,6% 4,6% 3,7%Share Value Added - Agriculture (%) 29 23 18 15 13 12 12 -2,3% -2,4% -1,8% -1,3% -0,6% -0,3%Share Value Added - Industry (%) 26 26 28 26 24 20 16 -0,2% 0,6% -0,6% -0,9% -1,7% -2,2%Share Value Added - Services (%) 44 51 54 59 63 68 72 1,4% 0,7% 0,8% 0,6% 0,7% 0,6%
PricesInternational/Regional ($'05/boe)
Coal 16 7 20 24 26 28 32 -7,7% 10,7% 1,6% 0,7% 1,0% 1,3%Oil 33 32 72 96 103 104 74 -0,2% 8,3% 2,9% 0,7% 0,1% -3,3%Gas 28 24 48 38 39 36 29 -1,2% 6,9% -2,1% 0,1% -0,7% -2,3%
GHG emissions (Mt CO2 eq.)Total GHG (excl. LULUCF) 1 276 1 771 2 653 3 173 3 347 2 839 1 325 3,3% 4,1% 1,8% 0,5% -1,6% -7,3%CO2 605 1 032 1 822 2 349 2 658 2 291 973 5,5% 5,8% 2,6% 1,2% -1,5% -8,2%CH4 506 552 611 588 486 374 240 0,9% 1,0% -0,4% -1,9% -2,6% -4,4%N2O 156 177 202 207 188 172 112 1,3% 1,3% 0,2% -0,9% -0,9% -4,2%F gases 10 10 18 30 15 2 1 0,6% 5,8% 5,5% -6,8% -18,8% -5,9%Total GHG from Energy and Industry 795 1 254 2 113 2 622 2 839 2 387 1 024 4,7% 5,4% 2,2% 0,8% -1,7% -8,1%CO2 Emissions from Fuel Comb. 553 949 1 664 2 111 2 342 1 948 723 5,6% 5,8% 2,4% 1,0% -1,8% -9,4%
Power generation/District heating 228 520 926 1 143 1 150 748 153 8,6% 5,9% 2,1% 0,1% -4,2% -14,7%Industry 143 185 374 496 629 619 253 2,6% 7,3% 2,9% 2,4% -0,2% -8,6%Buildings 74 89 129 134 136 128 75 1,9% 3,7% 0,4% 0,1% -0,6% -5,2%Agriculture 4 13 10 10 10 8 5 13,1% -3,1% 0,8% 0,1% -2,8% -3,8%Transport 82 93 150 231 291 304 216 1,3% 4,9% 4,4% 2,3% 0,4% -3,3%Other 22 48 77 97 126 141 20 8,3% 4,7% 2,4% 2,6% 1,1% -17,7%
CO2 captured (CCS) 0 0 0 0 10 197 722 n.s. n.s. n.s. n.s. 34,2% 13,9%Coal 0 0 0 0 8 116 273 n.s. n.s. n.s. n.s. 31,0% 8,9%Gas 0 0 0 0 3 65 153 n.s. n.s. n.s. n.s. 38,2% 8,9%Biomass 0 0 0 0 0 16 296 n.s. n.s. n.s. n.s. n.s. 34,2%
Energy Balance, by fuel (Mtoe)Primary Production 286 382 513 600 664 726 780 2,9% 3,0% 1,6% 1,0% 0,9% 0,7%
Coal 99 161 238 281 243 164 100 5,0% 4,0% 1,7% -1,4% -3,8% -4,9%Oil 35 38 43 44 36 27 18 0,8% 1,2% 0,2% -1,9% -2,9% -3,9%Natural gas 11 23 42 45 40 37 32 8,0% 6,2% 0,8% -1,2% -0,8% -1,4%Biomass 133 149 170 173 194 219 245 1,1% 1,3% 0,1% 1,2% 1,2% 1,1%Nuclear1 2 4 7 18 66 130 161 10,7% 4,4% 10,0% 14,0% 7,0% 2,2%Hydro 6 6 10 16 19 21 21 0,4% 4,4% 5,2% 1,8% 0,6% 0,3%Other renewables 0 0 3 23 64 128 203 32,5% 31,3% 23,6% 10,8% 7,1% 4,8%
Net Imports 24 74 189 320 525 650 573Coal 0 - 1 52 94 89 41 16Oil 24 74 121 143 188 206 160Natural gas 0 0 16 51 196 318 233Biomass 0 0 0 31 49 74 144Biofuels 0 0 0 0 4 11 19Electricity 0 0 0 0 0 0 0
Primary Energy Demand2 310 456 702 920 1 190 1 376 1 354 4,0% 4,4% 2,7% 2,6% 1,5% -0,2%Coal 98 160 291 375 332 205 115 5,0% 6,1% 2,6% -1,2% -4,7% -5,6%Oil 59 113 164 187 224 233 178 6,6% 3,8% 1,3% 1,8% 0,4% -2,7%Natural gas 11 23 57 97 236 355 266 8,0% 9,4% 5,3% 9,3% 4,2% -2,9%Biomass 133 149 170 204 243 293 389 1,1% 1,3% 1,8% 1,8% 1,9% 2,9%Nuclear1 2 4 7 18 66 130 161 10,7% 4,4% 10,0% 14,0% 7,0% 2,2%Hydro 6 6 10 16 19 21 21 0,4% 4,4% 5,2% 1,8% 0,6% 0,3%Other renewables 0 0 3 23 64 128 203 32,5% 31,3% 23,6% 10,8% 7,1% 4,8%
Primary Energy Demand, by sector (Mtoe)Primary Energy Demand 310 456 702 920 1 190 1 376 1 354 4,0% 4,4% 2,7% 2,6% 1,5% -0,2%Energy for Power Generation 67 148 266 383 539 666 749 8,2% 6,0% 3,7% 3,5% 2,1% 1,2%Other Transformation & Losses 24 48 85 152 248 362 481 7,3% 6,0% 5,9% 5,0% 3,8% 2,9%Energy Branch Consumption 8 17 29 37 55 68 59 7,4% 5,4% 2,8% 3,9% 2,2% -1,4%Final consumption 254 323 467 600 763 880 843 2,5% 3,7% 2,6% 2,4% 1,4% -0,4%
Steel, Non-Met. Minerals and Chem. 26 38 65 85 94 94 73 4,0% 5,4% 2,7% 1,0% 0,0% -2,5%Other Industry 47 53 99 147 211 249 222 1,3% 6,4% 4,1% 3,7% 1,7% -1,2%Non-Energy Use 12 30 38 45 62 73 63 9,1% 2,5% 1,6% 3,3% 1,6% -1,4%Residential 123 144 172 176 185 191 176 1,6% 1,8% 0,3% 0,5% 0,3% -0,8%Services 14 14 26 43 65 91 117 0,6% 6,2% 5,1% 4,1% 3,5% 2,6%Agriculture 6 11 14 19 24 28 32 7,5% 2,1% 2,9% 2,3% 1,7% 1,3%Road 21 28 46 74 103 123 122 2,7% 5,1% 4,9% 3,3% 1,9% -0,1%Rail 4 2 4 6 8 12 16 -6,2% 5,4% 4,0% 4,1% 3,7% 3,0%Aviation 1 1 2 3 7 13 17 3,0% 8,5% 8,3% 7,8% 5,9% 2,5%Other Transport 1 1 1 2 4 5 5 -0,5% 8,8% 5,8% 5,2% 3,1% -0,2%
1 Primary energy from nuclear is calculated considering the primary heat equivalent of the electricity produced with an average efficiency of 33%
105
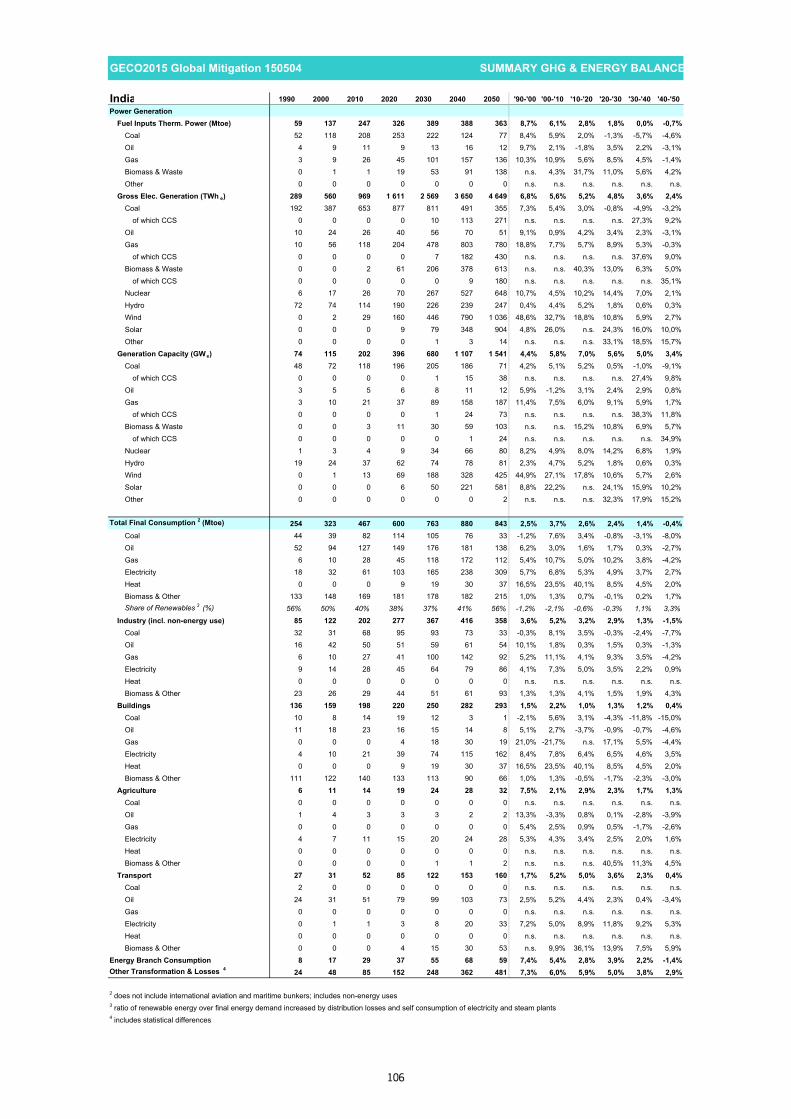
GECO2015 Global Mitigation 150504 SUMMARY GHG & ENERGY BALANCE##### 100
India 1990 2000 2010 2020 2030 2040 2050 '90-'00 '00-'10 '10-'20 '20-'30 '30-'40 '40-'50Power Generation
Fuel Inputs Therm. Power (Mtoe) 59 137 247 326 389 388 363 8,7% 6,1% 2,8% 1,8% 0,0% -0,7%Coal 52 118 208 253 222 124 77 8,4% 5,9% 2,0% -1,3% -5,7% -4,6%Oil 4 9 11 9 13 16 12 9,7% 2,1% -1,8% 3,5% 2,2% -3,1%Gas 3 9 26 45 101 157 136 10,3% 10,9% 5,6% 8,5% 4,5% -1,4%Biomass & Waste 0 1 1 19 53 91 138 n.s. 4,3% 31,7% 11,0% 5,6% 4,2%Other 0 0 0 0 0 0 0 n.s. n.s. n.s. n.s. n.s. n.s.
Gross Elec. Generation (TWh e) 289 560 969 1 611 2 569 3 650 4 649 6,8% 5,6% 5,2% 4,8% 3,6% 2,4%Coal 192 387 653 877 811 491 355 7,3% 5,4% 3,0% -0,8% -4,9% -3,2%
of which CCS 0 0 0 0 10 113 271 n.s. n.s. n.s. n.s. 27,3% 9,2%Oil 10 24 26 40 56 70 51 9,1% 0,9% 4,2% 3,4% 2,3% -3,1%Gas 10 56 118 204 478 803 780 18,8% 7,7% 5,7% 8,9% 5,3% -0,3%
of which CCS 0 0 0 0 7 182 430 n.s. n.s. n.s. n.s. 37,6% 9,0%Biomass & Waste 0 0 2 61 206 378 613 n.s. n.s. 40,3% 13,0% 6,3% 5,0%
of which CCS 0 0 0 0 0 9 180 n.s. n.s. n.s. n.s. n.s. 35,1%Nuclear 6 17 26 70 267 527 648 10,7% 4,5% 10,2% 14,4% 7,0% 2,1%Hydro 72 74 114 190 226 239 247 0,4% 4,4% 5,2% 1,8% 0,6% 0,3%Wind 0 2 29 160 446 790 1 036 48,6% 32,7% 18,8% 10,8% 5,9% 2,7%Solar 0 0 0 9 79 348 904 4,8% 26,0% n.s. 24,3% 16,0% 10,0%Other 0 0 0 0 1 3 14 n.s. n.s. n.s. 33,1% 18,5% 15,7%
Generation Capacity (GWe) 74 115 202 396 680 1 107 1 541 4,4% 5,8% 7,0% 5,6% 5,0% 3,4%Coal 48 72 118 196 205 186 71 4,2% 5,1% 5,2% 0,5% -1,0% -9,1%
of which CCS 0 0 0 0 1 15 38 n.s. n.s. n.s. n.s. 27,4% 9,8%Oil 3 5 5 6 8 11 12 5,9% -1,2% 3,1% 2,4% 2,9% 0,8%Gas 3 10 21 37 89 158 187 11,4% 7,5% 6,0% 9,1% 5,9% 1,7%
of which CCS 0 0 0 0 1 24 73 n.s. n.s. n.s. n.s. 38,3% 11,8%Biomass & Waste 0 0 3 11 30 59 103 n.s. n.s. 15,2% 10,8% 6,9% 5,7%
of which CCS 0 0 0 0 0 1 24 n.s. n.s. n.s. n.s. n.s. 34,9%Nuclear 1 3 4 9 34 66 80 8,2% 4,9% 8,0% 14,2% 6,8% 1,9%Hydro 19 24 37 62 74 78 81 2,3% 4,7% 5,2% 1,8% 0,6% 0,3%Wind 0 1 13 69 188 328 425 44,9% 27,1% 17,8% 10,6% 5,7% 2,6%Solar 0 0 0 6 50 221 581 8,8% 22,2% n.s. 24,1% 15,9% 10,2%Other 0 0 0 0 0 0 2 n.s. n.s. n.s. 32,3% 17,9% 15,2%
Total Final Consumption 2 (Mtoe) 254 323 467 600 763 880 843 2,5% 3,7% 2,6% 2,4% 1,4% -0,4%Coal 44 39 82 114 105 76 33 -1,2% 7,6% 3,4% -0,8% -3,1% -8,0%Oil 52 94 127 149 176 181 138 6,2% 3,0% 1,6% 1,7% 0,3% -2,7%Gas 6 10 28 45 118 172 112 5,4% 10,7% 5,0% 10,2% 3,8% -4,2%Electricity 18 32 61 103 165 238 309 5,7% 6,8% 5,3% 4,9% 3,7% 2,7%Heat 0 0 0 9 19 30 37 16,5% 23,5% 40,1% 8,5% 4,5% 2,0%Biomass & Other 133 148 169 181 178 182 215 1,0% 1,3% 0,7% -0,1% 0,2% 1,7%Share of Renewables 3 (%) 56% 50% 40% 38% 37% 41% 56% -1,2% -2,1% -0,6% -0,3% 1,1% 3,3%
Industry (incl. non-energy use) 85 122 202 277 367 416 358 3,6% 5,2% 3,2% 2,9% 1,3% -1,5%Coal 32 31 68 95 93 73 33 -0,3% 8,1% 3,5% -0,3% -2,4% -7,7%Oil 16 42 50 51 59 61 54 10,1% 1,8% 0,3% 1,5% 0,3% -1,3%Gas 6 10 27 41 100 142 92 5,2% 11,1% 4,1% 9,3% 3,5% -4,2%Electricity 9 14 28 45 64 79 86 4,1% 7,3% 5,0% 3,5% 2,2% 0,9%Heat 0 0 0 0 0 0 0 n.s. n.s. n.s. n.s. n.s. n.s.Biomass & Other 23 26 29 44 51 61 93 1,3% 1,3% 4,1% 1,5% 1,9% 4,3%
Buildings 136 159 198 220 250 282 293 1,5% 2,2% 1,0% 1,3% 1,2% 0,4%Coal 10 8 14 19 12 3 1 -2,1% 5,6% 3,1% -4,3% -11,8% -15,0%Oil 11 18 23 16 15 14 8 5,1% 2,7% -3,7% -0,9% -0,7% -4,6%Gas 0 0 0 4 18 30 19 21,0% -21,7% n.s. 17,1% 5,5% -4,4%Electricity 4 10 21 39 74 115 162 8,4% 7,8% 6,4% 6,5% 4,6% 3,5%Heat 0 0 0 9 19 30 37 16,5% 23,5% 40,1% 8,5% 4,5% 2,0%Biomass & Other 111 122 140 133 113 90 66 1,0% 1,3% -0,5% -1,7% -2,3% -3,0%
Agriculture 6 11 14 19 24 28 32 7,5% 2,1% 2,9% 2,3% 1,7% 1,3%Coal 0 0 0 0 0 0 0 n.s. n.s. n.s. n.s. n.s. n.s.Oil 1 4 3 3 3 2 2 13,3% -3,3% 0,8% 0,1% -2,8% -3,9%Gas 0 0 0 0 0 0 0 5,4% 2,5% 0,9% 0,5% -1,7% -2,6%Electricity 4 7 11 15 20 24 28 5,3% 4,3% 3,4% 2,5% 2,0% 1,6%Heat 0 0 0 0 0 0 0 n.s. n.s. n.s. n.s. n.s. n.s.Biomass & Other 0 0 0 0 1 1 2 n.s. n.s. n.s. 40,5% 11,3% 4,5%
Transport 27 31 52 85 122 153 160 1,7% 5,2% 5,0% 3,6% 2,3% 0,4%Coal 2 0 0 0 0 0 0 n.s. n.s. n.s. n.s. n.s. n.s.Oil 24 31 51 79 99 103 73 2,5% 5,2% 4,4% 2,3% 0,4% -3,4%Gas 0 0 0 0 0 0 0 n.s. n.s. n.s. n.s. n.s. n.s.Electricity 0 1 1 3 8 20 33 7,2% 5,0% 8,9% 11,8% 9,2% 5,3%Heat 0 0 0 0 0 0 0 n.s. n.s. n.s. n.s. n.s. n.s.Biomass & Other 0 0 0 4 15 30 53 n.s. 9,9% 36,1% 13,9% 7,5% 5,9%
Energy Branch Consumption 8 17 29 37 55 68 59 7,4% 5,4% 2,8% 3,9% 2,2% -1,4%Other Transformation & Losses 4 24 48 85 152 248 362 481 7,3% 6,0% 5,9% 5,0% 3,8% 2,9%
2 does not include international aviation and maritime bunkers; includes non-energy uses3 ratio of renewable energy over final energy demand increased by distribution losses and self consumption of electricity and steam plants4 includes statistical differences
106

GECO2015 Global Mitigation 150504 SUMMARY GHG & ENERGY BALANCE##### 100
Rest South Asia 1990 2000 2010 2020 2030 2040 2050 '90-'00 '00-'10 '10-'20 '20-'30 '30-'40 '40-'50Main Economic Indicators
Population (Million) 266 340 401 462 518 562 591 2,5% 1,7% 1,4% 1,1% 0,8% 0,5%GDP per capita (ppp, k$'05) 1 1 2 3 5 8 13 1,9% 3,4% 3,7% 5,6% 5,5% 4,7%GDP per capita (mer, k$'05) 0 0 1 1 2 3 4 1,9% 3,4% 3,7% 5,6% 5,5% 4,7%Share Value Added - Agriculture (%) 29 26 22 17 12 11 10 -1,1% -1,7% -2,6% -2,9% -1,6% -0,9%Share Value Added - Industry (%) 23 24 24 27 29 28 25 0,4% -0,2% 1,3% 0,7% -0,3% -1,1%Share Value Added - Services (%) 48 50 54 56 58 61 65 0,4% 0,9% 0,3% 0,4% 0,5% 0,6%
PricesInternational/Regional ($'05/boe)
Coal 16 7 20 24 26 28 32 -7,7% 10,7% 1,6% 0,7% 1,0% 1,3%Oil 33 32 72 96 103 104 74 -0,2% 8,3% 2,9% 0,7% 0,1% -3,3%Gas 28 24 48 38 39 36 29 -1,2% 6,9% -2,1% 0,1% -0,7% -2,3%
GHG emissions (Mt CO2 eq.)Total GHG (excl. LULUCF) 345 450 600 708 811 784 450 2,7% 2,9% 1,7% 1,4% -0,3% -5,4%CO2 87 151 227 337 471 504 262 5,7% 4,2% 4,1% 3,4% 0,7% -6,3%CH4 216 245 306 298 276 229 157 1,3% 2,3% -0,3% -0,8% -1,8% -3,7%N2O 41 53 66 71 63 50 30 2,7% 2,2% 0,8% -1,2% -2,2% -5,1%F gases 1 1 1 1 1 1 1 -2,1% 3,0% 0,1% 1,5% -1,0% -1,0%Total GHG from Energy and Industry 148 237 347 455 576 575 303 4,8% 3,9% 2,7% 2,4% 0,0% -6,2%CO2 Emissions from Fuel Comb. 80 140 207 306 424 444 211 5,8% 4,0% 4,0% 3,3% 0,4% -7,2%
Power generation/District heating 20 44 69 92 121 113 23 8,4% 4,5% 2,9% 2,8% -0,7% -14,9%Industry 23 35 53 73 110 131 102 4,0% 4,4% 3,2% 4,2% 1,7% -2,4%Buildings 12 17 28 43 64 69 23 3,5% 4,7% 4,7% 4,0% 0,8% -10,3%Agriculture 2 2 5 5 6 5 4 3,3% 6,1% 1,3% 1,2% -1,6% -2,7%Transport 19 35 42 78 103 103 63 6,0% 2,1% 6,3% 2,8% 0,0% -4,8%Other 3 7 11 15 21 24 - 4 8,6% 4,2% 3,3% 3,7% 1,1% n.s.
CO2 captured (CCS) 0 0 0 0 4 59 157 n.s. n.s. n.s. 54,2% 29,5% 10,2%Coal 0 0 0 0 4 38 67 n.s. n.s. n.s. n.s. 26,5% 5,7%Gas 0 0 0 0 1 17 33 n.s. n.s. n.s. 54,1% 36,1% 7,1%Biomass 0 0 0 0 0 4 57 n.s. n.s. n.s. 10,9% n.s. 30,0%
Energy Balance, by fuel (Mtoe)Primary Production 58 78 111 119 126 149 181 3,1% 3,6% 0,6% 0,6% 1,6% 2,0%
Coal 1 1 2 4 6 9 9 1,8% 3,0% 8,4% 4,2% 3,5% -0,5%Oil 3 3 3 4 4 3 3 1,0% 1,3% 0,6% -0,6% -1,1% -1,5%Natural gas 16 27 48 58 46 42 38 5,6% 5,7% 2,0% -2,3% -1,0% -1,0%Biomass 36 44 53 41 42 43 48 2,0% 2,0% -2,6% 0,3% 0,4% 0,9%Nuclear1 0 1 1 6 18 30 34 21,2% 5,5% 20,9% 11,7% 5,2% 1,3%Hydro 2 2 4 5 6 7 8 0,5% 7,1% 1,9% 1,4% 1,1% 1,4%Other renewables 0 0 0 1 4 15 42 n.s. n.s. 53,2% 20,7% 13,2% 11,1%
Net Imports 10 21 25 48 106 139 96Coal 1 1 4 9 13 18 14Oil 11 23 30 46 60 62 46Natural gas - 2 - 3 - 8 - 8 33 57 33Biomass 0 0 0 1 0 0 0Biofuels 0 0 0 0 1 2 4Electricity 0 0 0 0 0 0 0
Primary Energy Demand2 68 99 137 166 233 288 277 3,9% 3,2% 2,0% 3,4% 2,1% -0,4%Coal 2 3 5 13 19 27 23 1,3% 8,0% 9,4% 3,8% 3,3% -1,7%Oil 14 26 33 50 63 65 48 6,4% 2,3% 4,1% 2,5% 0,3% -3,0%Natural gas 14 24 40 50 79 99 70 5,9% 5,2% 2,3% 4,6% 2,3% -3,3%Biomass 36 44 53 42 42 44 48 2,0% 2,0% -2,4% 0,2% 0,3% 0,9%Nuclear1 0 1 1 6 18 30 34 21,2% 5,5% 20,9% 11,7% 5,2% 1,3%Hydro 2 2 4 5 6 7 8 0,5% 7,1% 1,9% 1,4% 1,1% 1,4%Other renewables 0 0 0 1 4 15 42 n.s. n.s. 53,2% 20,7% 13,2% 11,1%
Primary Energy Demand, by sector (Mtoe)Primary Energy Demand 68 99 137 166 233 288 277 3,9% 3,2% 2,0% 3,4% 2,1% -0,4%Energy for Power Generation 10 19 31 44 73 112 145 6,8% 5,1% 3,7% 5,1% 4,4% 2,6%Other Transformation & Losses 5 11 18 27 48 76 99 7,5% 5,5% 4,1% 6,0% 4,7% 2,7%Energy Branch Consumption 0 1 1 1 2 3 3 10,0% -1,1% 3,7% 4,4% 3,3% 0,5%Final consumption 60 83 113 133 177 209 192 3,3% 3,1% 1,6% 3,0% 1,7% -0,9%
Steel, Non-Met. Minerals and Chem. 3 4 7 8 10 11 7 2,7% 4,8% 2,1% 1,4% 1,0% -3,5%Other Industry 7 11 18 24 41 51 48 4,9% 4,7% 2,7% 5,6% 2,3% -0,7%Non-Energy Use 4 5 5 7 12 16 16 4,2% 0,0% 2,6% 5,3% 3,1% -0,1%Residential 38 48 60 55 57 57 44 2,4% 2,3% -0,8% 0,3% -0,1% -2,6%Services 1 2 4 5 8 12 13 5,1% 6,5% 2,7% 4,9% 4,0% 0,8%Agriculture 1 1 2 3 4 5 7 2,0% 6,5% 2,0% 3,5% 3,1% 2,5%Road 6 10 15 29 44 53 52 6,0% 3,9% 6,8% 4,2% 2,0% -0,2%Rail 0 0 1 1 1 1 1 1,4% 2,5% 0,5% 2,0% 2,3% 1,9%Aviation 0 0 0 0 1 2 3 1,4% 0,1% 5,8% 8,0% 7,4% 3,6%Other Transport 0 0 0 1 1 1 1 4,9% 10,0% 2,7% 4,8% 3,6% 0,3%
1 Primary energy from nuclear is calculated considering the primary heat equivalent of the electricity produced with an average efficiency of 33%
107

GECO2015 Global Mitigation 150504 SUMMARY GHG & ENERGY BALANCE##### 100
Rest South Asia 1990 2000 2010 2020 2030 2040 2050 '90-'00 '00-'10 '10-'20 '20-'30 '30-'40 '40-'50Power Generation
Fuel Inputs Therm. Power (Mtoe) 8 16 26 33 44 60 60 7,8% 4,8% 2,4% 3,1% 3,1% 0,1%Coal 0 0 0 5 8 15 14 17,8% 11,9% 31,9% 6,4% 6,1% -0,7%Oil 2 8 10 10 11 10 8 12,5% 2,6% 0,6% 0,8% -1,4% -2,1%Gas 5 8 16 17 24 32 27 4,8% 6,4% 1,2% 3,1% 2,8% -1,6%Biomass & Waste 0 0 0 0 1 3 11 n.s. n.s. n.s. 18,3% 16,3% 13,1%Other 0 0 0 0 0 0 0 n.s. n.s. n.s. n.s. n.s. n.s.
Gross Elec. Generation (TWh e) 52 95 159 236 403 663 876 6,2% 5,3% 4,0% 5,5% 5,1% 2,8%Coal 0 0 1 21 41 74 70 20,3% 11,7% 40,1% 6,9% 6,1% -0,5%
of which CCS 0 0 0 0 5 42 69 n.s. n.s. n.s. n.s. 24,7% 5,0%Oil 8 32 41 46 49 43 35 14,2% 2,4% 1,1% 0,7% -1,3% -2,0%Gas 19 36 64 77 117 170 153 6,4% 6,0% 1,9% 4,2% 3,8% -1,0%
of which CCS 0 0 0 0 2 46 93 n.s. n.s. n.s. n.s. 35,9% 7,2%Biomass & Waste 0 0 0 1 3 16 56 n.s. n.s. n.s. 19,7% 17,0% 13,6%
of which CCS 0 0 0 0 0 3 44 n.s. n.s. n.s. n.s. n.s. 30,2%Nuclear 0 2 3 24 74 122 137 21,2% 5,5% 21,4% 12,0% 5,2% 1,2%Hydro 24 25 50 60 70 78 90 0,5% 7,1% 1,9% 1,4% 1,1% 1,4%Wind 0 0 0 7 40 109 192 n.s. 40,3% 54,1% 19,7% 10,4% 5,9%Solar 0 0 0 1 9 51 140 n.s. 7,8% 46,6% 27,8% 18,9% 10,6%Other 0 0 0 0 0 0 1 n.s. n.s. n.s. 28,0% 17,4% 14,6%
Generation Capacity (GWe) 13 24 34 53 90 165 276 6,5% 3,5% 4,8% 5,4% 6,2% 5,3%Coal 0 0 0 3 6 10 13 n.s. 10,7% 21,3% 7,2% 6,1% 2,6%
of which CCS 0 0 0 0 1 6 13 n.s. n.s. n.s. n.s. 24,6% 8,9%Oil 3 7 8 15 17 16 19 7,9% 2,2% 6,2% 1,1% -0,2% 1,6%Gas 4 9 14 16 21 29 39 7,6% 4,0% 1,5% 2,7% 3,5% 2,8%
of which CCS 0 0 0 0 0 6 17 n.s. n.s. n.s. n.s. 36,1% 11,3%Biomass & Waste 0 0 0 0 0 2 8 n.s. n.s. 19,8% 19,8% 16,9% 14,6%
of which CCS 0 0 0 0 0 0 6 n.s. n.s. n.s. n.s. n.s. 31,4%Nuclear 0 0 0 3 10 16 17 13,7% 0,0% 21,2% 11,8% 5,0% 1,0%Hydro 5 7 11 13 15 17 20 3,7% 4,0% 2,1% 1,4% 1,1% 1,4%Wind 0 0 0 3 17 44 78 n.s. 29,2% 53,4% 19,4% 10,3% 5,8%Solar 0 0 0 0 5 30 82 n.s. n.s. n.s. 27,6% 18,9% 10,7%Other 0 0 0 0 0 0 0 n.s. n.s. n.s. n.s. 16,8% 14,1%
Total Final Consumption 2 (Mtoe) 60 83 113 133 177 209 192 3,3% 3,1% 1,6% 3,0% 1,7% -0,9%Coal 2 2 5 9 11 12 8 0,3% 8,5% 5,6% 2,2% 0,6% -3,1%Oil 11 17 22 37 49 53 39 4,6% 2,3% 5,5% 2,9% 0,7% -3,1%Gas 8 14 22 29 49 60 39 5,6% 4,7% 3,0% 5,3% 1,9% -4,2%Electricity 3 6 11 17 29 48 64 6,1% 6,9% 4,1% 5,5% 5,1% 2,9%Heat 0 0 0 0 0 1 13 n.s. n.s. n.s. n.s. n.s. 31,1%Biomass & Other 36 44 52 40 39 36 29 2,0% 1,9% -2,6% -0,4% -0,6% -2,2%Share of Renewables 3 (%) 65% 57% 51% 35% 28% 27% 43% -1,3% -1,0% -3,7% -2,3% -0,1% 4,5%
Industry (incl. non-energy use) 14 21 30 39 62 77 71 4,2% 3,7% 2,6% 4,7% 2,3% -0,9%Coal 2 2 5 8 11 12 8 0,5% 7,9% 5,9% 2,5% 0,8% -3,1%Oil 2 3 3 3 5 9 12 6,0% -2,7% 1,9% 5,7% 5,0% 3,4%Gas 6 9 14 16 28 37 32 4,7% 3,8% 1,8% 5,6% 2,7% -1,5%Electricity 1 2 4 6 9 12 14 4,5% 7,9% 3,8% 4,1% 2,8% 1,3%Heat 0 0 0 0 0 0 0 n.s. n.s. n.s. n.s. n.s. n.s.Biomass & Other 3 4 5 5 8 8 4 4,2% 2,1% 0,1% 5,5% -0,2% -5,8%
Buildings 39 50 64 60 66 69 57 2,5% 2,6% -0,6% 0,8% 0,6% -1,9%Coal 0 0 0 0 0 0 0 -11,7% 31,7% 0,5% -6,7% -14,0% -16,2%Oil 2 2 2 4 4 5 2 -0,1% 0,2% 4,8% 1,8% 0,9% -7,9%Gas 2 4 8 13 21 23 7 7,8% 6,4% 4,8% 5,0% 0,8% -11,1%Electricity 2 3 6 9 14 21 24 8,4% 6,2% 4,3% 4,2% 4,0% 1,3%Heat 0 0 0 0 0 1 13 n.s. n.s. n.s. n.s. n.s. 31,1%Biomass & Other 33 40 47 34 25 19 10 1,9% 1,7% -3,2% -2,8% -2,8% -6,3%
Agriculture 1 1 2 3 4 5 7 2,0% 6,5% 2,0% 3,5% 3,1% 2,5%Coal 0 0 0 0 0 0 0 n.s. n.s. n.s. n.s. n.s. n.s.Oil 1 1 1 2 2 2 1 3,1% 6,2% 1,3% 1,2% -1,6% -2,7%Gas 0 0 0 0 0 0 0 n.s. 2,8% 2,0% 1,6% -0,4% -1,4%Electricity 0 0 1 1 2 3 5 0,1% 7,1% 3,1% 5,0% 4,8% 3,8%Heat 0 0 0 0 0 0 0 n.s. n.s. n.s. n.s. n.s. n.s.Biomass & Other 0 0 0 0 0 1 1 n.s. n.s. n.s. 42,8% 12,5% 5,3%
Transport 6 11 16 30 46 57 57 5,7% 3,9% 6,5% 4,2% 2,2% 0,0%Coal 0 0 0 0 0 0 0 n.s. n.s. n.s. n.s. n.s. n.s.Oil 6 11 16 29 38 38 23 5,7% 3,5% 6,4% 2,8% 0,0% -4,9%Gas 0 0 0 0 0 0 0 n.s. n.s. n.s. n.s. n.s. n.s.Electricity 0 0 0 0 3 11 21 -7,2% n.s. n.s. 41,2% 12,4% 6,5%Heat 0 0 0 0 0 0 0 n.s. n.s. n.s. n.s. n.s. n.s.Biomass & Other 0 0 1 1 5 8 13 n.s. n.s. 9,9% 12,3% 5,6% 5,2%
Energy Branch Consumption 0 1 1 1 2 3 3 10,0% -1,1% 3,7% 4,4% 3,3% 0,5%Other Transformation & Losses 4 5 11 18 27 48 76 99 7,5% 5,5% 4,1% 6,0% 4,7% 2,7%
2 does not include international aviation and maritime bunkers; includes non-energy uses3 ratio of renewable energy over final energy demand increased by distribution losses and self consumption of electricity and steam plants4 includes statistical differences
108
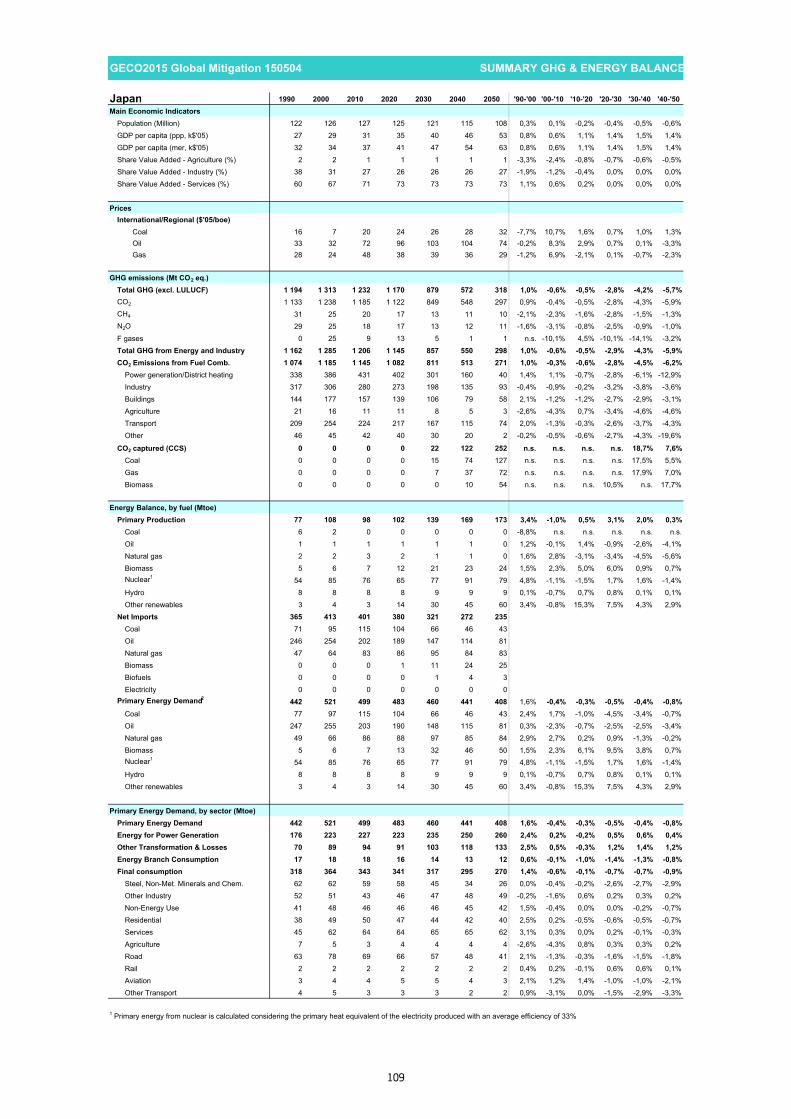
GECO2015 Global Mitigation 150504 SUMMARY GHG & ENERGY BALANCE##### 100
Japan 1990 2000 2010 2020 2030 2040 2050 '90-'00 '00-'10 '10-'20 '20-'30 '30-'40 '40-'50Main Economic Indicators
Population (Million) 122 126 127 125 121 115 108 0,3% 0,1% -0,2% -0,4% -0,5% -0,6%GDP per capita (ppp, k$'05) 27 29 31 35 40 46 53 0,8% 0,6% 1,1% 1,4% 1,5% 1,4%GDP per capita (mer, k$'05) 32 34 37 41 47 54 63 0,8% 0,6% 1,1% 1,4% 1,5% 1,4%Share Value Added - Agriculture (%) 2 2 1 1 1 1 1 -3,3% -2,4% -0,8% -0,7% -0,6% -0,5%Share Value Added - Industry (%) 38 31 27 26 26 26 27 -1,9% -1,2% -0,4% 0,0% 0,0% 0,0%Share Value Added - Services (%) 60 67 71 73 73 73 73 1,1% 0,6% 0,2% 0,0% 0,0% 0,0%
PricesInternational/Regional ($'05/boe)
Coal 16 7 20 24 26 28 32 -7,7% 10,7% 1,6% 0,7% 1,0% 1,3%Oil 33 32 72 96 103 104 74 -0,2% 8,3% 2,9% 0,7% 0,1% -3,3%Gas 28 24 48 38 39 36 29 -1,2% 6,9% -2,1% 0,1% -0,7% -2,3%
GHG emissions (Mt CO2 eq.)Total GHG (excl. LULUCF) 1 194 1 313 1 232 1 170 879 572 318 1,0% -0,6% -0,5% -2,8% -4,2% -5,7%CO2 1 133 1 238 1 185 1 122 849 548 297 0,9% -0,4% -0,5% -2,8% -4,3% -5,9%CH4 31 25 20 17 13 11 10 -2,1% -2,3% -1,6% -2,8% -1,5% -1,3%N2O 29 25 18 17 13 12 11 -1,6% -3,1% -0,8% -2,5% -0,9% -1,0%F gases 0 25 9 13 5 1 1 n.s. -10,1% 4,5% -10,1% -14,1% -3,2%Total GHG from Energy and Industry 1 162 1 285 1 206 1 145 857 550 298 1,0% -0,6% -0,5% -2,9% -4,3% -5,9%CO2 Emissions from Fuel Comb. 1 074 1 185 1 145 1 082 811 513 271 1,0% -0,3% -0,6% -2,8% -4,5% -6,2%
Power generation/District heating 338 386 431 402 301 160 40 1,4% 1,1% -0,7% -2,8% -6,1% -12,9%Industry 317 306 280 273 198 135 93 -0,4% -0,9% -0,2% -3,2% -3,8% -3,6%Buildings 144 177 157 139 106 79 58 2,1% -1,2% -1,2% -2,7% -2,9% -3,1%Agriculture 21 16 11 11 8 5 3 -2,6% -4,3% 0,7% -3,4% -4,6% -4,6%Transport 209 254 224 217 167 115 74 2,0% -1,3% -0,3% -2,6% -3,7% -4,3%Other 46 45 42 40 30 20 2 -0,2% -0,5% -0,6% -2,7% -4,3% -19,6%
CO2 captured (CCS) 0 0 0 0 22 122 252 n.s. n.s. n.s. n.s. 18,7% 7,6%Coal 0 0 0 0 15 74 127 n.s. n.s. n.s. n.s. 17,5% 5,5%Gas 0 0 0 0 7 37 72 n.s. n.s. n.s. n.s. 17,9% 7,0%Biomass 0 0 0 0 0 10 54 n.s. n.s. n.s. 10,5% n.s. 17,7%
Energy Balance, by fuel (Mtoe)Primary Production 77 108 98 102 139 169 173 3,4% -1,0% 0,5% 3,1% 2,0% 0,3%
Coal 6 2 0 0 0 0 0 -8,8% n.s. n.s. n.s. n.s. n.s.Oil 1 1 1 1 1 1 0 1,2% -0,1% 1,4% -0,9% -2,6% -4,1%Natural gas 2 2 3 2 1 1 0 1,6% 2,8% -3,1% -3,4% -4,5% -5,6%Biomass 5 6 7 12 21 23 24 1,5% 2,3% 5,0% 6,0% 0,9% 0,7%Nuclear1 54 85 76 65 77 91 79 4,8% -1,1% -1,5% 1,7% 1,6% -1,4%Hydro 8 8 8 8 9 9 9 0,1% -0,7% 0,7% 0,8% 0,1% 0,1%Other renewables 3 4 3 14 30 45 60 3,4% -0,8% 15,3% 7,5% 4,3% 2,9%
Net Imports 365 413 401 380 321 272 235Coal 71 95 115 104 66 46 43Oil 246 254 202 189 147 114 81Natural gas 47 64 83 86 95 84 83Biomass 0 0 0 1 11 24 25Biofuels 0 0 0 0 1 4 3Electricity 0 0 0 0 0 0 0
Primary Energy Demand2 442 521 499 483 460 441 408 1,6% -0,4% -0,3% -0,5% -0,4% -0,8%Coal 77 97 115 104 66 46 43 2,4% 1,7% -1,0% -4,5% -3,4% -0,7%Oil 247 255 203 190 148 115 81 0,3% -2,3% -0,7% -2,5% -2,5% -3,4%Natural gas 49 66 86 88 97 85 84 2,9% 2,7% 0,2% 0,9% -1,3% -0,2%Biomass 5 6 7 13 32 46 50 1,5% 2,3% 6,1% 9,5% 3,8% 0,7%Nuclear1 54 85 76 65 77 91 79 4,8% -1,1% -1,5% 1,7% 1,6% -1,4%Hydro 8 8 8 8 9 9 9 0,1% -0,7% 0,7% 0,8% 0,1% 0,1%Other renewables 3 4 3 14 30 45 60 3,4% -0,8% 15,3% 7,5% 4,3% 2,9%
Primary Energy Demand, by sector (Mtoe)Primary Energy Demand 442 521 499 483 460 441 408 1,6% -0,4% -0,3% -0,5% -0,4% -0,8%Energy for Power Generation 176 223 227 223 235 250 260 2,4% 0,2% -0,2% 0,5% 0,6% 0,4%Other Transformation & Losses 70 89 94 91 103 118 133 2,5% 0,5% -0,3% 1,2% 1,4% 1,2%Energy Branch Consumption 17 18 18 16 14 13 12 0,6% -0,1% -1,0% -1,4% -1,3% -0,8%Final consumption 318 364 343 341 317 295 270 1,4% -0,6% -0,1% -0,7% -0,7% -0,9%
Steel, Non-Met. Minerals and Chem. 62 62 59 58 45 34 26 0,0% -0,4% -0,2% -2,6% -2,7% -2,9%Other Industry 52 51 43 46 47 48 49 -0,2% -1,6% 0,6% 0,2% 0,3% 0,2%Non-Energy Use 41 48 46 46 46 45 42 1,5% -0,4% 0,0% 0,0% -0,2% -0,7%Residential 38 49 50 47 44 42 40 2,5% 0,2% -0,5% -0,6% -0,5% -0,7%Services 45 62 64 64 65 65 62 3,1% 0,3% 0,0% 0,2% -0,1% -0,3%Agriculture 7 5 3 4 4 4 4 -2,6% -4,3% 0,8% 0,3% 0,3% 0,2%Road 63 78 69 66 57 48 41 2,1% -1,3% -0,3% -1,6% -1,5% -1,8%Rail 2 2 2 2 2 2 2 0,4% 0,2% -0,1% 0,6% 0,6% 0,1%Aviation 3 4 4 5 5 4 3 2,1% 1,2% 1,4% -1,0% -1,0% -2,1%Other Transport 4 5 3 3 3 2 2 0,9% -3,1% 0,0% -1,5% -2,9% -3,3%
1 Primary energy from nuclear is calculated considering the primary heat equivalent of the electricity produced with an average efficiency of 33%
109

GECO2015 Global Mitigation 150504 SUMMARY GHG & ENERGY BALANCE##### 100
Japan 1990 2000 2010 2020 2030 2040 2050 '90-'00 '00-'10 '10-'20 '20-'30 '30-'40 '40-'50Power Generation
Fuel Inputs Therm. Power (Mtoe) 111 125 140 135 119 105 112 1,2% 1,1% -0,3% -1,2% -1,3% 0,7%Coal 25 47 61 52 34 27 29 6,7% 2,5% -1,6% -4,1% -2,2% 0,8%Oil 51 28 18 17 10 12 4 -5,9% -4,1% -0,5% -4,9% 1,1% -11,2%Gas 33 47 56 61 66 52 56 3,5% 1,8% 0,8% 0,8% -2,2% 0,7%Biomass & Waste 2 3 4 5 8 13 21 2,9% 3,5% 1,5% 5,1% 4,4% 5,5%Other 0 0 0 1 1 1 1 6,8% -2,4% 12,9% 3,4% 0,1% 1,2%
Gross Elec. Generation (TWh e) 842 1 059 1 120 1 141 1 248 1 362 1 517 2,3% 0,6% 0,2% 0,9% 0,9% 1,1%Coal 117 232 304 286 182 131 142 7,1% 2,7% -0,6% -4,4% -3,2% 0,7%
of which CCS 0 0 0 0 16 76 138 n.s. n.s. n.s. n.s. 16,6% 6,2%Oil 248 137 97 75 45 50 16 -5,8% -3,4% -2,6% -4,9% 1,0% -11,0%Gas 167 251 305 323 353 280 331 4,2% 1,9% 0,6% 0,9% -2,3% 1,7%
of which CCS 0 0 0 0 20 101 201 n.s. n.s. n.s. n.s. 17,7% 7,1%Biomass & Waste 11 15 23 26 40 60 103 3,8% 4,4% 1,2% 4,3% 4,0% 5,6%
of which CCS 0 0 0 0 0 9 45 n.s. n.s. n.s. n.s. n.s. 17,4%Nuclear 202 322 288 255 306 361 313 4,8% -1,1% -1,2% 1,8% 1,7% -1,4%Hydro 96 97 91 97 105 106 107 0,1% -0,7% 0,7% 0,8% 0,1% 0,1%Wind 0 0 5 33 134 228 289 n.s. 46,9% 20,4% 15,2% 5,4% 2,4%Solar 0 0 4 37 70 131 194 41,7% 27,0% 25,7% 6,4% 6,5% 4,0%Other 2 3 3 9 13 15 23 6,8% -2,4% 12,9% 3,8% 1,4% 4,4%
Generation Capacity (GWe) 197 261 287 330 407 443 521 2,9% 0,9% 1,4% 2,1% 0,8% 1,6%Coal 31 50 63 69 62 21 20 4,9% 2,5% 0,8% -1,1% -10,1% -0,8%
of which CCS 0 0 0 0 2 10 19 n.s. n.s. n.s. n.s. 16,8% 6,6%Oil 78 79 56 44 36 31 27 0,2% -3,4% -2,5% -1,9% -1,4% -1,5%Gas 17 37 60 73 81 60 69 8,2% 5,0% 2,0% 1,1% -2,9% 1,3%
of which CCS 0 0 0 0 2 13 27 n.s. n.s. n.s. n.s. 18,0% 7,5%Biomass & Waste 3 3 5 4 6 8 14 1,8% 4,1% -0,8% 3,8% 3,4% 5,2%
of which CCS 0 0 0 0 0 1 6 n.s. n.s. n.s. n.s. n.s. 17,5%Nuclear 31 45 49 41 48 56 48 3,9% 0,8% -1,7% 1,6% 1,5% -1,6%Hydro 38 46 48 53 57 58 58 2,0% 0,3% 1,0% 0,8% 0,1% 0,1%Wind 0 0 2 14 57 96 120 n.s. 32,7% 19,8% 15,0% 5,4% 2,3%Solar 0 0 4 32 58 110 162 43,4% 27,1% 24,2% 6,4% 6,5% 4,0%Other 0 1 1 1 2 2 3 7,0% 0,0% 9,1% 3,9% 1,4% 3,8%
Total Final Consumption 2 (Mtoe) 318 364 343 341 317 295 270 1,4% -0,6% -0,1% -0,7% -0,7% -0,9%Coal 50 46 47 45 26 14 8 -0,8% 0,3% -0,4% -5,5% -6,2% -5,1%Oil 184 210 171 163 130 97 74 1,3% -2,0% -0,5% -2,2% -2,9% -2,7%Gas 15 23 34 34 37 39 34 4,2% 4,1% -0,2% 0,9% 0,5% -1,4%Electricity 64 81 86 89 98 107 119 2,3% 0,6% 0,3% 0,9% 0,9% 1,1%Heat 1 1 1 2 2 5 8 0,4% -2,8% 3,5% 4,2% 6,9% 5,6%Biomass & Other 3 3 3 8 24 33 27 0,1% 0,5% 11,0% 11,5% 3,5% -2,1%Share of Renewables 3 (%) 5% 4% 5% 8% 19% 31% 38% -1,2% 1,0% 6,3% 8,7% 4,7% 2,1%
Industry (incl. non-energy use) 155 160 148 150 137 127 116 0,3% -0,8% 0,1% -0,9% -0,8% -0,9%Coal 49 45 47 45 26 14 8 -0,7% 0,3% -0,4% -5,4% -6,1% -5,1%Oil 71 76 62 59 50 42 37 0,7% -2,0% -0,5% -1,6% -1,8% -1,1%Gas 4 5 8 11 19 25 23 2,9% 4,4% 2,9% 5,9% 2,6% -1,0%Electricity 29 31 29 31 34 37 40 0,7% -0,8% 0,9% 0,9% 0,8% 0,9%Heat 0 0 0 0 0 0 0 n.s. n.s. n.s. n.s. n.s. n.s.Biomass & Other 3 3 3 4 8 9 8 0,4% 0,4% 3,3% 7,6% 1,9% -1,9%
Buildings 83 110 113 111 110 107 102 2,8% 0,3% -0,2% -0,1% -0,2% -0,5%Coal 1 1 1 0 0 0 0 -4,4% -1,8% -1,2% -13,4% -17,2% -17,5%Oil 36 42 30 27 20 15 10 1,6% -3,4% -1,1% -2,6% -3,1% -3,8%Gas 11 18 26 23 18 14 11 4,7% 4,0% -1,4% -2,6% -2,5% -2,1%Electricity 34 48 56 56 58 61 67 3,6% 1,4% 0,0% 0,4% 0,5% 0,9%Heat 1 1 1 2 2 5 8 0,4% -2,8% 3,5% 4,2% 6,9% 5,6%Biomass & Other 0 0 0 4 11 13 6 -7,5% -7,9% n.s. 11,7% 1,5% -6,9%
Agriculture 7 5 3 4 4 4 4 -2,6% -4,3% 0,8% 0,3% 0,3% 0,2%Coal 0 0 0 0 0 0 0 n.s. n.s. n.s. n.s. n.s. n.s.Oil 7 5 3 4 3 2 1 -2,6% -4,3% 0,7% -3,4% -4,6% -4,6%Gas 0 0 0 0 0 0 0 n.s. n.s. n.s. n.s. n.s. n.s.Electricity 0 0 0 0 0 1 1 -0,3% -5,7% 1,4% 14,9% 5,7% 2,7%Heat 0 0 0 0 0 0 0 n.s. n.s. n.s. n.s. n.s. n.s.Biomass & Other 0 0 0 0 1 2 2 n.s. n.s. n.s. 45,1% 6,4% 2,6%
Transport 72 88 78 77 66 57 48 2,0% -1,2% -0,2% -1,5% -1,5% -1,8%Coal 0 0 0 0 0 0 0 n.s. n.s. n.s. n.s. n.s. n.s.Oil 71 87 77 74 57 39 25 2,0% -1,2% -0,3% -2,6% -3,7% -4,3%Gas 0 0 0 0 0 0 0 n.s. n.s. n.s. n.s. n.s. n.s.Electricity 1 2 2 2 5 8 12 1,0% 0,4% 1,8% 10,2% 4,8% 3,3%Heat 0 0 0 0 0 0 0 n.s. n.s. n.s. n.s. n.s. n.s.Biomass & Other 0 0 0 1 4 9 11 n.s. n.s. 23,1% 22,3% 9,5% 1,4%
Energy Branch Consumption 17 18 18 16 14 13 12 0,6% -0,1% -1,0% -1,4% -1,3% -0,8%Other Transformation & Losses 4 70 89 94 91 103 118 133 2,5% 0,5% -0,3% 1,2% 1,4% 1,2%
2 does not include international aviation and maritime bunkers; includes non-energy uses3 ratio of renewable energy over final energy demand increased by distribution losses and self consumption of electricity and steam plants4 includes statistical differences
110

GECO2015 Global Mitigation 150504 SUMMARY GHG & ENERGY BALANCE##### 100
Australia-NZ 1990 2000 2010 2020 2030 2040 2050 '90-'00 '00-'10 '10-'20 '20-'30 '30-'40 '40-'50Main Economic Indicators
Population (Million) 27 31 36 41 47 52 56 1,5% 1,6% 1,4% 1,2% 1,0% 0,9%GDP per capita (ppp, k$'05) 18 22 25 30 35 41 46 1,8% 1,3% 1,8% 1,8% 1,4% 1,3%GDP per capita (mer, k$'05) 19 23 26 31 37 42 48 1,8% 1,3% 1,8% 1,8% 1,4% 1,3%Share Value Added - Agriculture (%) 5 4 2 2 2 2 2 -1,8% -6,8% -0,5% -0,8% -0,5% -0,4%Share Value Added - Industry (%) 31 27 27 27 25 24 23 -1,4% 0,1% 0,0% -0,6% -0,5% -0,6%Share Value Added - Services (%) 64 69 71 71 73 74 76 0,8% 0,3% 0,0% 0,2% 0,2% 0,2%
PricesInternational/Regional ($'05/boe)
Coal 16 7 20 24 26 28 32 -7,7% 10,7% 1,6% 0,7% 1,0% 1,3%Oil 33 32 72 96 103 104 74 -0,2% 8,3% 2,9% 0,7% 0,1% -3,3%Gas 28 24 48 38 39 36 29 -1,2% 6,9% -2,1% 0,1% -0,7% -2,3%
GHG emissions (Mt CO2 eq.)Total GHG (excl. LULUCF) 471 559 613 595 491 343 131 1,7% 0,9% -0,3% -1,9% -3,5% -9,2%CO2 296 384 436 437 386 267 94 2,6% 1,3% 0,0% -1,2% -3,6% -9,9%CH4 140 138 133 114 78 59 29 -0,2% -0,3% -1,6% -3,7% -2,8% -6,6%N2O 29 35 36 31 22 17 7 1,8% 0,2% -1,4% -3,4% -2,8% -8,3%F gases 6 3 8 13 5 1 0 -7,2% 10,9% 5,1% -8,6% -17,4% -4,9%Total GHG from Energy and Industry 353 438 500 486 409 279 102 2,2% 1,3% -0,3% -1,7% -3,7% -9,5%CO2 Emissions from Fuel Comb. 283 369 417 418 369 253 84 2,7% 1,2% 0,0% -1,2% -3,7% -10,4%
Power generation/District heating 134 188 214 177 141 70 8 3,4% 1,3% -1,9% -2,2% -6,8% -19,1%Industry 47 55 54 70 74 61 21 1,5% -0,1% 2,6% 0,5% -1,9% -10,2%Buildings 11 12 14 15 17 15 9 1,7% 1,3% 0,7% 1,2% -1,4% -4,9%Agriculture 5 6 8 9 7 5 3 1,7% 2,7% 1,6% -2,7% -4,1% -4,2%Transport 71 87 95 102 78 59 37 2,1% 0,8% 0,7% -2,5% -2,8% -4,4%Other 16 21 32 46 52 44 5 2,6% 4,5% 3,5% 1,3% -1,6% -18,9%
CO2 captured (CCS) 0 0 0 0 11 70 158 n.s. n.s. n.s. n.s. 20,0% 8,6%Coal 0 0 0 0 5 27 36 n.s. n.s. n.s. n.s. 17,5% 2,8%Gas 0 0 0 0 6 28 39 n.s. n.s. n.s. n.s. 17,0% 3,3%Biomass 0 0 0 0 0 15 84 n.s. n.s. n.s. 6,9% n.s. 19,0%
Energy Balance, by fuel (Mtoe)Primary Production 212 270 319 372 395 361 337 2,4% 1,7% 1,6% 0,6% -0,9% -0,7%
Coal 140 177 226 223 189 133 84 2,4% 2,5% -0,2% -1,7% -3,5% -4,5%Oil 39 46 31 38 39 31 20 1,7% -3,8% 1,9% 0,4% -2,4% -4,3%Natural gas 21 32 43 85 114 113 98 4,3% 3,0% 7,0% 3,0% -0,1% -1,4%Biomass 6 8 8 13 26 50 90 2,1% 0,5% 4,7% 7,2% 6,6% 6,1%Nuclear1 0 0 0 0 1 3 4 n.s. n.s. n.s. 25,6% 9,5% 3,5%Hydro 3 4 3 4 4 4 4 0,8% -0,9% 0,5% 0,7% 0,3% 0,1%Other renewables 2 3 6 9 21 28 37 3,2% 8,8% 4,4% 8,6% 2,9% 2,7%
Net Imports - 108 - 141 - 171 - 206 - 210 - 170 - 139Coal - 103 - 128 - 175 - 190 - 167 - 118 - 74Oil - 1 - 5 17 18 6 4 4Natural gas - 4 - 8 - 13 - 33 - 47 - 47 - 44Biomass 0 0 0 0 0 - 6 - 18Biofuels 0 0 0 0 - 1 - 3 - 7Electricity 0 0 0 0 0 0 0
Primary Energy Demand2 104 129 148 166 185 191 198 2,2% 1,4% 1,1% 1,1% 0,3% 0,3%Coal 37 49 51 32 21 15 10 3,0% 0,4% -4,5% -4,2% -3,5% -4,2%Oil 38 41 49 56 46 35 24 0,8% 1,6% 1,4% -1,9% -2,5% -3,9%Natural gas 17 24 30 52 67 66 54 3,4% 2,2% 5,6% 2,6% -0,2% -1,9%Biomass 6 8 8 13 26 44 72 2,1% 0,5% 4,7% 7,0% 5,3% 5,2%Nuclear1 0 0 0 0 1 3 4 n.s. n.s. n.s. 25,6% 9,5% 3,5%Hydro 3 4 3 4 4 4 4 0,8% -0,9% 0,5% 0,7% 0,3% 0,1%Other renewables 2 3 6 9 21 28 37 3,2% 8,8% 4,4% 8,6% 2,9% 2,7%
Primary Energy Demand, by sector (Mtoe)Primary Energy Demand 104 129 148 166 185 191 198 2,2% 1,4% 1,1% 1,1% 0,3% 0,3%Energy for Power Generation 42 57 70 70 83 91 105 3,1% 2,1% -0,1% 1,7% 1,0% 1,4%Other Transformation & Losses 15 16 18 21 36 52 74 0,9% 0,8% 1,7% 5,5% 3,8% 3,5%Energy Branch Consumption 7 9 14 20 23 22 19 3,1% 4,5% 3,4% 1,5% -0,2% -1,4%Final consumption 70 87 93 109 116 118 118 2,1% 0,7% 1,6% 0,6% 0,2% 0,0%
Steel, Non-Met. Minerals and Chem. 9 9 9 10 9 7 6 0,4% 0,3% 0,8% -1,0% -1,8% -2,2%Other Industry 16 21 20 27 35 39 43 2,7% -0,8% 3,3% 2,4% 1,2% 0,8%Non-Energy Use 5 6 6 8 8 8 7 2,9% -0,2% 2,4% 0,5% -0,3% -1,1%Residential 10 12 13 14 15 15 15 1,6% 1,0% 0,5% 0,5% 0,3% 0,1%Services 4 6 8 9 11 13 15 3,4% 3,0% 1,1% 2,1% 1,5% 1,4%Agriculture 2 2 3 3 4 4 4 1,9% 2,3% 2,1% 1,0% 0,8% 0,7%Road 22 26 29 32 29 26 24 1,9% 0,8% 1,1% -1,0% -0,9% -1,1%Rail 1 1 1 1 1 1 1 1,5% 3,4% 0,9% 0,6% 0,2% 0,0%Aviation 1 2 3 3 3 2 2 5,0% 1,4% 1,5% -1,1% -1,3% -1,9%Other Transport 1 1 1 1 1 1 1 -2,4% 6,5% 1,8% 0,3% -1,6% -2,1%
1 Primary energy from nuclear is calculated considering the primary heat equivalent of the electricity produced with an average efficiency of 33%
111
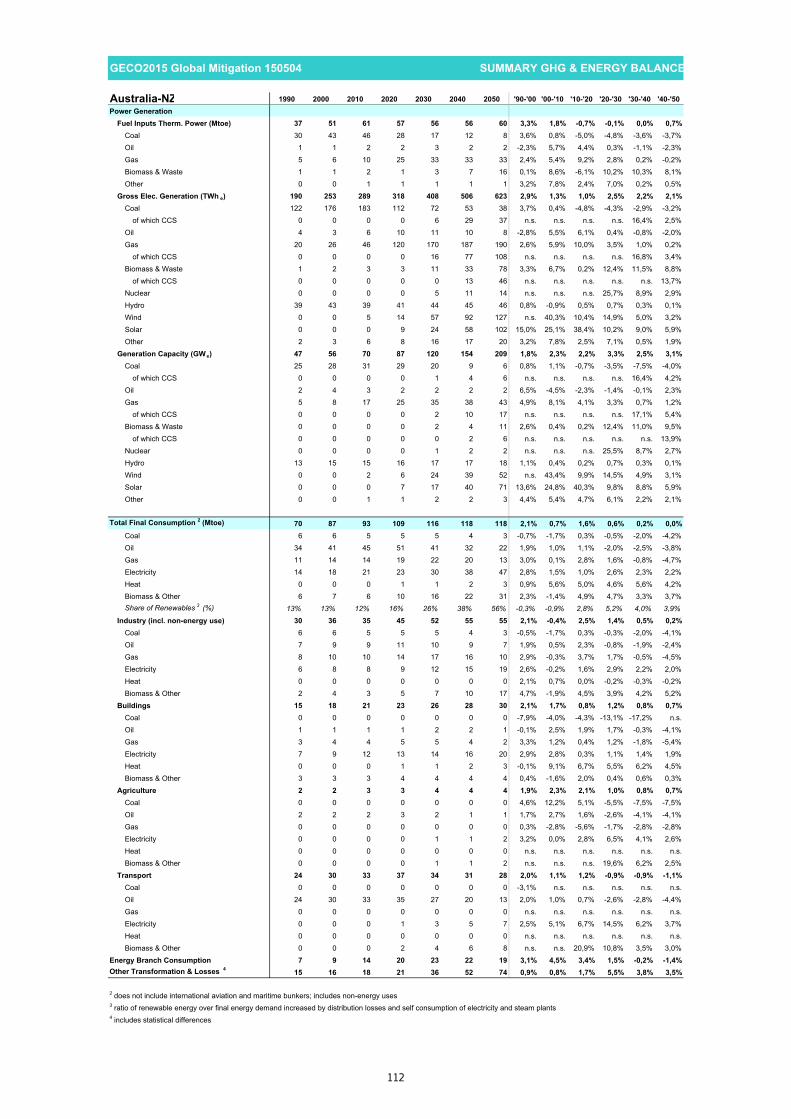
GECO2015 Global Mitigation 150504 SUMMARY GHG & ENERGY BALANCE##### 100
Australia-NZ 1990 2000 2010 2020 2030 2040 2050 '90-'00 '00-'10 '10-'20 '20-'30 '30-'40 '40-'50Power Generation
Fuel Inputs Therm. Power (Mtoe) 37 51 61 57 56 56 60 3,3% 1,8% -0,7% -0,1% 0,0% 0,7%Coal 30 43 46 28 17 12 8 3,6% 0,8% -5,0% -4,8% -3,6% -3,7%Oil 1 1 2 2 3 2 2 -2,3% 5,7% 4,4% 0,3% -1,1% -2,3%Gas 5 6 10 25 33 33 33 2,4% 5,4% 9,2% 2,8% 0,2% -0,2%Biomass & Waste 1 1 2 1 3 7 16 0,1% 8,6% -6,1% 10,2% 10,3% 8,1%Other 0 0 1 1 1 1 1 3,2% 7,8% 2,4% 7,0% 0,2% 0,5%
Gross Elec. Generation (TWh e) 190 253 289 318 408 506 623 2,9% 1,3% 1,0% 2,5% 2,2% 2,1%Coal 122 176 183 112 72 53 38 3,7% 0,4% -4,8% -4,3% -2,9% -3,2%
of which CCS 0 0 0 0 6 29 37 n.s. n.s. n.s. n.s. 16,4% 2,5%Oil 4 3 6 10 11 10 8 -2,8% 5,5% 6,1% 0,4% -0,8% -2,0%Gas 20 26 46 120 170 187 190 2,6% 5,9% 10,0% 3,5% 1,0% 0,2%
of which CCS 0 0 0 0 16 77 108 n.s. n.s. n.s. n.s. 16,8% 3,4%Biomass & Waste 1 2 3 3 11 33 78 3,3% 6,7% 0,2% 12,4% 11,5% 8,8%
of which CCS 0 0 0 0 0 13 46 n.s. n.s. n.s. n.s. n.s. 13,7%Nuclear 0 0 0 0 5 11 14 n.s. n.s. n.s. 25,7% 8,9% 2,9%Hydro 39 43 39 41 44 45 46 0,8% -0,9% 0,5% 0,7% 0,3% 0,1%Wind 0 0 5 14 57 92 127 n.s. 40,3% 10,4% 14,9% 5,0% 3,2%Solar 0 0 0 9 24 58 102 15,0% 25,1% 38,4% 10,2% 9,0% 5,9%Other 2 3 6 8 16 17 20 3,2% 7,8% 2,5% 7,1% 0,5% 1,9%
Generation Capacity (GWe) 47 56 70 87 120 154 209 1,8% 2,3% 2,2% 3,3% 2,5% 3,1%Coal 25 28 31 29 20 9 6 0,8% 1,1% -0,7% -3,5% -7,5% -4,0%
of which CCS 0 0 0 0 1 4 6 n.s. n.s. n.s. n.s. 16,4% 4,2%Oil 2 4 3 2 2 2 2 6,5% -4,5% -2,3% -1,4% -0,1% 2,3%Gas 5 8 17 25 35 38 43 4,9% 8,1% 4,1% 3,3% 0,7% 1,2%
of which CCS 0 0 0 0 2 10 17 n.s. n.s. n.s. n.s. 17,1% 5,4%Biomass & Waste 0 0 0 0 2 4 11 2,6% 0,4% 0,2% 12,4% 11,0% 9,5%
of which CCS 0 0 0 0 0 2 6 n.s. n.s. n.s. n.s. n.s. 13,9%Nuclear 0 0 0 0 1 2 2 n.s. n.s. n.s. 25,5% 8,7% 2,7%Hydro 13 15 15 16 17 17 18 1,1% 0,4% 0,2% 0,7% 0,3% 0,1%Wind 0 0 2 6 24 39 52 n.s. 43,4% 9,9% 14,5% 4,9% 3,1%Solar 0 0 0 7 17 40 71 13,6% 24,8% 40,3% 9,8% 8,8% 5,9%Other 0 0 1 1 2 2 3 4,4% 5,4% 4,7% 6,1% 2,2% 2,1%
Total Final Consumption 2 (Mtoe) 70 87 93 109 116 118 118 2,1% 0,7% 1,6% 0,6% 0,2% 0,0%Coal 6 6 5 5 5 4 3 -0,7% -1,7% 0,3% -0,5% -2,0% -4,2%Oil 34 41 45 51 41 32 22 1,9% 1,0% 1,1% -2,0% -2,5% -3,8%Gas 11 14 14 19 22 20 13 3,0% 0,1% 2,8% 1,6% -0,8% -4,7%Electricity 14 18 21 23 30 38 47 2,8% 1,5% 1,0% 2,6% 2,3% 2,2%Heat 0 0 0 1 1 2 3 0,9% 5,6% 5,0% 4,6% 5,6% 4,2%Biomass & Other 6 7 6 10 16 22 31 2,3% -1,4% 4,9% 4,7% 3,3% 3,7%Share of Renewables 3 (%) 13% 13% 12% 16% 26% 38% 56% -0,3% -0,9% 2,8% 5,2% 4,0% 3,9%
Industry (incl. non-energy use) 30 36 35 45 52 55 55 2,1% -0,4% 2,5% 1,4% 0,5% 0,2%Coal 6 6 5 5 5 4 3 -0,5% -1,7% 0,3% -0,3% -2,0% -4,1%Oil 7 9 9 11 10 9 7 1,9% 0,5% 2,3% -0,8% -1,9% -2,4%Gas 8 10 10 14 17 16 10 2,9% -0,3% 3,7% 1,7% -0,5% -4,5%Electricity 6 8 8 9 12 15 19 2,6% -0,2% 1,6% 2,9% 2,2% 2,0%Heat 0 0 0 0 0 0 0 2,1% 0,7% 0,0% -0,2% -0,3% -0,2%Biomass & Other 2 4 3 5 7 10 17 4,7% -1,9% 4,5% 3,9% 4,2% 5,2%
Buildings 15 18 21 23 26 28 30 2,1% 1,7% 0,8% 1,2% 0,8% 0,7%Coal 0 0 0 0 0 0 0 -7,9% -4,0% -4,3% -13,1% -17,2% n.s.Oil 1 1 1 1 2 2 1 -0,1% 2,5% 1,9% 1,7% -0,3% -4,1%Gas 3 4 4 5 5 4 2 3,3% 1,2% 0,4% 1,2% -1,8% -5,4%Electricity 7 9 12 13 14 16 20 2,9% 2,8% 0,3% 1,1% 1,4% 1,9%Heat 0 0 0 1 1 2 3 -0,1% 9,1% 6,7% 5,5% 6,2% 4,5%Biomass & Other 3 3 3 4 4 4 4 0,4% -1,6% 2,0% 0,4% 0,6% 0,3%
Agriculture 2 2 3 3 4 4 4 1,9% 2,3% 2,1% 1,0% 0,8% 0,7%Coal 0 0 0 0 0 0 0 4,6% 12,2% 5,1% -5,5% -7,5% -7,5%Oil 2 2 2 3 2 1 1 1,7% 2,7% 1,6% -2,6% -4,1% -4,1%Gas 0 0 0 0 0 0 0 0,3% -2,8% -5,6% -1,7% -2,8% -2,8%Electricity 0 0 0 0 1 1 2 3,2% 0,0% 2,8% 6,5% 4,1% 2,6%Heat 0 0 0 0 0 0 0 n.s. n.s. n.s. n.s. n.s. n.s.Biomass & Other 0 0 0 0 1 1 2 n.s. n.s. n.s. 19,6% 6,2% 2,5%
Transport 24 30 33 37 34 31 28 2,0% 1,1% 1,2% -0,9% -0,9% -1,1%Coal 0 0 0 0 0 0 0 -3,1% n.s. n.s. n.s. n.s. n.s.Oil 24 30 33 35 27 20 13 2,0% 1,0% 0,7% -2,6% -2,8% -4,4%Gas 0 0 0 0 0 0 0 n.s. n.s. n.s. n.s. n.s. n.s.Electricity 0 0 0 1 3 5 7 2,5% 5,1% 6,7% 14,5% 6,2% 3,7%Heat 0 0 0 0 0 0 0 n.s. n.s. n.s. n.s. n.s. n.s.Biomass & Other 0 0 0 2 4 6 8 n.s. n.s. 20,9% 10,8% 3,5% 3,0%
Energy Branch Consumption 7 9 14 20 23 22 19 3,1% 4,5% 3,4% 1,5% -0,2% -1,4%Other Transformation & Losses 4 15 16 18 21 36 52 74 0,9% 0,8% 1,7% 5,5% 3,8% 3,5%
2 does not include international aviation and maritime bunkers; includes non-energy uses3 ratio of renewable energy over final energy demand increased by distribution losses and self consumption of electricity and steam plants4 includes statistical differences
112

GECO2015 Global Mitigation 150504 SUMMARY GHG & ENERGY BALANCE##### 100
North Africa Non-producers 1990 2000 2010 2020 2030 2040 2050 '90-'00 '00-'10 '10-'20 '20-'30 '30-'40 '40-'50Main Economic Indicators
Population (Million) 33 39 43 48 53 55 57 1,6% 1,0% 1,2% 0,8% 0,5% 0,3%GDP per capita (ppp, k$'05) 3 4 5 7 11 16 23 1,7% 3,7% 2,9% 4,4% 4,2% 3,5%GDP per capita (mer, k$'05) 2 2 3 4 6 8 12 1,6% 3,7% 2,9% 4,4% 4,2% 3,5%Share Value Added - Agriculture (%) 18 14 13 10 8 7 6 -2,8% -0,5% -2,3% -2,4% -1,6% -0,9%Share Value Added - Industry (%) 33 30 30 30 30 26 22 -1,2% 0,2% 0,1% -0,3% -1,1% -1,7%Share Value Added - Services (%) 48 57 57 59 62 67 71 1,6% 0,0% 0,4% 0,5% 0,7% 0,7%
PricesInternational/Regional ($'05/boe)
Coal 18 9 19 22 24 26 30 -6,6% 7,6% 1,4% 0,8% 1,0% 1,4%Oil 33 32 72 96 103 104 74 -0,2% 8,3% 2,9% 0,7% 0,1% -3,3%Gas 18 21 31 38 39 36 28 1,4% 4,0% 2,0% 0,4% -0,7% -2,7%
GHG emissions (Mt CO2 eq.)Total GHG (excl. LULUCF) 58 78 101 117 122 100 62 3,0% 2,6% 1,5% 0,4% -2,0% -4,6%CO2 37 54 74 90 98 79 48 3,7% 3,3% 1,9% 0,9% -2,2% -4,8%CH4 13 16 18 18 17 16 13 2,1% 1,3% -0,1% -0,6% -0,6% -2,2%N2O 8 8 8 9 7 5 2 0,4% 0,5% 0,4% -2,9% -2,8% -11,0%F gases 0 0 0 0 0 0 0 n.s. n.s. n.s. -8,6% -0,5% -0,2%Total GHG from Energy and Industry 45 64 87 103 110 89 57 3,5% 3,0% 1,7% 0,6% -2,1% -4,4%CO2 Emissions from Fuel Comb. 32 47 66 79 86 65 37 3,9% 3,4% 1,9% 0,8% -2,7% -5,4%
Power generation/District heating 12 17 24 33 37 24 12 3,9% 3,4% 3,4% 1,1% -4,3% -6,6%Industry 8 8 11 11 14 13 10 0,5% 2,9% -0,3% 2,5% -0,2% -2,9%Buildings 3 5 8 6 8 7 5 5,9% 4,1% -2,2% 1,8% -0,6% -3,9%Agriculture 2 4 7 8 7 5 4 6,3% 6,9% 1,7% -1,6% -3,3% -3,5%Transport 6 11 15 19 19 15 11 6,1% 2,8% 2,7% -0,1% -2,4% -3,3%Other 2 2 1 1 1 1 - 4 2,3% -4,9% -0,4% 1,2% -5,8% n.s.
CO2 captured (CCS) 0 0 0 0 5 32 53 n.s. n.s. n.s. n.s. 21,0% 5,1%Coal 0 0 0 0 3 18 23 n.s. n.s. n.s. n.s. 19,9% 2,7%Gas 0 0 0 0 2 12 21 n.s. n.s. n.s. n.s. 21,6% 5,3%Biomass 0 0 0 0 0 1 8 n.s. n.s. n.s. n.s. 43,1% 18,9%
Energy Balance, by fuel (Mtoe)Primary Production 6 7 9 12 18 23 28 0,6% 2,3% 3,3% 4,1% 2,9% 1,8%
Coal 0 0 0 0 0 0 0 -24,1% n.s. n.s. n.s. n.s. n.s.Oil 5 4 4 6 7 8 8 -2,2% 0,3% 3,8% 2,3% 1,0% -0,3%Natural gas 0 2 2 3 4 6 6 17,5% 3,6% 1,5% 3,4% 3,6% 0,6%Biomass 1 1 2 2 3 4 4 3,5% 3,4% 2,2% 4,9% 0,8% -0,1%Nuclear1 0 0 0 0 0 0 0 n.s. n.s. n.s. n.s. 33,3% 9,7%Hydro 0 0 0 0 0 0 0 -4,7% 16,8% -1,6% 1,5% 0,6% 0,5%Other renewables 0 0 0 1 3 6 10 26,0% 32,4% 16,8% 11,2% 7,4% 5,6%
Net Imports 5 11 17 20 23 25 25Coal 1 3 3 5 5 6 7Oil 4 7 11 9 7 3 1Natural gas 1 1 3 5 9 12 12Biomass 0 0 0 0 1 2 5Biofuels 0 0 0 0 0 1 1Electricity 0 0 0 0 0 0 0
Primary Energy Demand2 12 17 26 32 41 49 53 3,9% 4,0% 2,1% 2,6% 1,8% 0,9%Coal 1 3 3 5 5 6 7 8,4% 0,2% 6,3% 0,5% 1,9% 0,2%Oil 8 10 15 15 14 11 8 2,2% 4,0% -0,3% -0,5% -2,3% -3,1%Natural gas 1 3 5 7 13 17 18 8,2% 6,0% 4,2% 5,5% 3,1% 0,1%Biomass 1 1 2 2 4 6 9 3,5% 3,4% 3,4% 6,2% 3,6% 3,5%Nuclear1 0 0 0 0 0 0 0 n.s. n.s. n.s. n.s. 33,3% 9,7%Hydro 0 0 0 0 0 0 0 -4,7% 16,8% -1,6% 1,5% 0,6% 0,5%Other renewables 0 0 0 1 3 6 10 26,0% 32,4% 16,8% 11,2% 7,4% 5,6%
Primary Energy Demand, by sector (Mtoe)Primary Energy Demand 12 17 26 32 41 49 53 3,9% 4,0% 2,1% 2,6% 1,8% 0,9%Energy for Power Generation 4 5 8 12 17 25 32 3,7% 4,3% 3,7% 3,8% 3,9% 2,3%Other Transformation & Losses 2 2 4 6 10 16 22 2,6% 5,8% 5,0% 5,9% 4,5% 3,5%Energy Branch Consumption 0 0 0 1 1 1 1 3,1% 2,6% 1,8% 2,8% 2,5% 1,5%Final consumption 9 13 20 23 29 34 36 4,4% 4,0% 1,8% 2,3% 1,4% 0,7%
Steel, Non-Met. Minerals and Chem. 0 0 2 2 3 3 3 0,1% 18,1% 1,0% 2,8% 1,1% -0,3%Other Industry 3 3 3 4 5 6 7 1,5% -0,5% 1,5% 3,9% 2,0% 0,3%Non-Energy Use 0 0 1 1 1 1 1 8,2% 4,5% -0,6% 1,6% 0,0% -2,0%Residential 2 3 5 5 6 6 6 4,8% 4,0% 0,4% 1,6% 0,9% 0,2%Services 0 0 1 2 3 4 5 6,8% 9,8% 3,3% 4,3% 3,6% 3,0%Agriculture 1 1 2 3 3 4 4 6,3% 7,0% 1,8% 1,7% 1,4% 1,1%Road 2 4 5 7 8 9 9 5,8% 2,7% 3,4% 1,5% 0,8% 0,7%Rail 0 0 0 0 0 0 0 5,2% 2,9% 1,2% 1,2% 0,9% 0,5%Aviation 0 0 0 0 0 0 0 n.s. n.s. n.s. n.s. n.s. n.s.Other Transport 0 0 0 1 1 1 1 9,4% 3,6% 3,0% 2,7% 0,8% -0,4%
1 Primary energy from nuclear is calculated considering the primary heat equivalent of the electricity produced with an average efficiency of 33%
113

GECO2015 Global Mitigation 150504 SUMMARY GHG & ENERGY BALANCE##### 100
North Africa Non-producers 1990 2000 2010 2020 2030 2040 2050 '90-'00 '00-'10 '10-'20 '20-'30 '30-'40 '40-'50Power Generation
Fuel Inputs Therm. Power (Mtoe) 4 5 8 11 14 19 21 3,8% 3,8% 3,3% 2,9% 3,1% 1,1%Coal 1 2 3 5 5 5 6 10,9% 2,7% 5,5% -0,5% 1,8% 0,3%Oil 2 1 1 1 1 2 1 -5,9% 1,4% -7,7% 7,7% 2,8% -0,9%Gas 1 2 4 5 8 12 13 9,2% 5,7% 3,7% 4,6% 3,4% 1,2%Biomass & Waste 0 0 0 0 0 0 1 n.s. n.s. n.s. 37,1% 21,5% 8,8%Other 0 0 0 0 0 0 0 n.s. n.s. n.s. n.s. n.s. n.s.
Gross Elec. Generation (TWh e) 15 23 39 58 95 151 211 4,3% 5,1% 4,1% 5,1% 4,7% 3,4%Coal 2 9 11 21 21 26 27 14,8% 2,4% 6,6% -0,1% 2,1% 0,4%
of which CCS 0 0 0 0 3 20 26 n.s. n.s. n.s. n.s. 19,6% 2,6%Oil 8 5 5 2 5 7 6 -5,8% 0,9% -6,8% 7,3% 3,0% -0,4%Gas 4 9 18 27 44 65 78 9,6% 6,9% 4,0% 5,2% 4,0% 1,8%
of which CCS 0 0 0 0 5 34 58 n.s. n.s. n.s. n.s. 21,5% 5,5%Biomass & Waste 0 0 0 0 0 2 6 n.s. n.s. n.s. 37,8% 22,2% 9,1%
of which CCS 0 0 0 0 0 1 5 n.s. n.s. n.s. n.s. n.s. 14,4%Nuclear 0 0 0 0 0 0 0 n.s. n.s. n.s. n.s. n.s. n.s.Hydro 1 1 4 3 4 4 4 -4,7% 16,8% -1,6% 1,5% 0,6% 0,5%Wind 0 0 1 4 16 28 47 n.s. 23,5% 18,3% 15,5% 5,5% 5,4%Solar 0 0 0 1 5 19 41 n.s. n.s. 22,5% 23,1% 14,1% 8,2%Other 0 0 0 0 0 0 1 n.s. n.s. n.s. 42,4% 18,6% 15,7%
Generation Capacity (GWe) 4 7 10 14 26 42 70 6,8% 3,5% 3,4% 6,2% 4,8% 5,4%Coal 1 3 3 3 4 3 4 10,9% 0,0% 1,5% 2,0% -1,5% 1,6%
of which CCS 0 0 0 0 0 3 4 n.s. n.s. n.s. n.s. 19,5% 4,1%Oil 1 1 1 1 1 1 2 -2,9% 5,5% 1,0% -0,3% 0,1% 5,7%Gas 1 2 4 5 8 10 15 10,7% 6,9% 3,5% 3,9% 2,7% 3,7%
of which CCS 0 0 0 0 1 4 9 n.s. n.s. n.s. n.s. 21,7% 7,2%Biomass & Waste 0 0 0 0 0 0 1 n.s. n.s. n.s. 38,1% 21,7% 9,2%
of which CCS 0 0 0 0 0 0 1 n.s. n.s. n.s. n.s. n.s. 14,5%Nuclear 0 0 0 0 0 0 0 n.s. n.s. n.s. n.s. n.s. n.s.Hydro 1 2 2 2 2 3 3 4,3% 1,4% 1,0% 1,5% 0,6% 0,5%Wind 0 0 0 2 7 12 20 n.s. 18,7% 17,4% 15,7% 5,4% 5,3%Solar 0 0 0 0 3 11 25 n.s. n.s. 22,7% 22,9% 14,0% 8,2%Other 0 0 0 0 0 0 0 n.s. n.s. n.s. n.s. 18,0% 15,2%
Total Final Consumption 2 (Mtoe) 9 13 20 23 29 34 36 4,4% 4,0% 1,8% 2,3% 1,4% 0,7%Coal 0 1 0 0 1 1 1 2,8% -28,5% 33,3% 8,6% 2,0% -0,2%Oil 6 9 14 14 13 9 6 4,3% 4,3% 0,3% -1,0% -3,0% -3,6%Gas 0 1 1 2 4 5 4 6,1% 5,9% 6,0% 7,5% 2,5% -2,4%Electricity 1 2 3 5 7 12 16 5,2% 5,6% 3,6% 4,9% 4,6% 3,3%Heat 0 0 0 1 1 2 3 n.s. n.s. n.s. 5,6% 5,9% 3,1%Biomass & Other 1 1 2 2 3 5 6 3,5% 3,4% 1,7% 5,5% 3,2% 2,4%Share of Renewables 3 (%) 10% 9% 11% 13% 21% 30% 41% -1,2% 1,6% 1,8% 4,9% 3,5% 3,4%
Industry (incl. non-energy use) 3 4 6 6 9 10 10 2,0% 3,3% 1,1% 3,3% 1,6% 0,0%Coal 0 1 0 0 1 1 1 2,8% -28,5% 33,3% 8,6% 2,0% -0,2%Oil 2 2 3 3 2 2 1 0,0% 5,8% -2,8% -1,6% -3,6% -4,1%Gas 0 0 1 1 2 3 3 5,1% 5,5% 3,6% 6,8% 3,3% -1,4%Electricity 1 1 1 2 3 4 5 4,3% 3,1% 4,7% 4,4% 3,1% 2,2%Heat 0 0 0 0 0 0 0 n.s. n.s. n.s. n.s. n.s. n.s.Biomass & Other 0 0 0 0 0 0 0 n.s. 1,1% 6,1% 8,1% -1,5% -2,6%
Buildings 2 4 6 7 8 10 11 5,0% 4,9% 1,1% 2,3% 1,8% 1,3%Coal 0 0 0 0 0 0 0 n.s. n.s. n.s. n.s. n.s. n.s.Oil 1 2 2 1 1 1 0 5,7% 3,9% -5,0% -3,4% -4,6% -3,6%Gas 0 0 0 1 2 2 2 10,1% 6,9% 11,0% 8,5% 1,4% -4,0%Electricity 0 1 2 2 3 5 6 6,4% 7,7% 2,8% 3,1% 3,6% 3,7%Heat 0 0 0 1 1 2 3 n.s. n.s. n.s. 5,6% 5,9% 3,1%Biomass & Other 1 1 2 1 1 1 0 2,9% 3,6% -0,9% -1,8% -4,7% -5,9%
Agriculture 1 1 2 3 3 4 4 6,3% 7,0% 1,8% 1,7% 1,4% 1,1%Coal 0 0 0 0 0 0 0 n.s. n.s. n.s. n.s. n.s. n.s.Oil 1 1 2 3 2 2 1 6,3% 6,9% 1,7% -1,6% -3,3% -3,5%Gas 0 0 0 0 0 0 0 n.s. n.s. 0,9% -0,8% -2,0% -2,2%Electricity 0 0 0 0 1 1 1 6,1% 6,9% 1,9% 8,3% 6,0% 3,9%Heat 0 0 0 0 0 0 0 n.s. n.s. n.s. n.s. n.s. n.s.Biomass & Other 0 0 0 0 1 1 2 n.s. n.s. n.s. 46,1% 7,9% 3,2%
Transport 2 4 6 8 9 10 10 6,0% 2,8% 3,3% 1,6% 0,8% 0,6%Coal 0 0 0 0 0 0 0 n.s. n.s. n.s. n.s. n.s. n.s.Oil 2 4 6 7 7 6 4 6,0% 2,8% 2,7% -0,2% -2,5% -3,4%Gas 0 0 0 0 0 0 0 n.s. n.s. n.s. n.s. n.s. n.s.Electricity 0 0 0 0 1 2 3 2,8% 2,6% 5,7% 25,1% 11,3% 4,3%Heat 0 0 0 0 0 0 0 n.s. n.s. n.s. n.s. n.s. n.s.Biomass & Other 0 0 0 0 1 2 3 n.s. n.s. n.s. 12,6% 6,1% 4,1%
Energy Branch Consumption 0 0 0 1 1 1 1 3,1% 2,6% 1,8% 2,8% 2,5% 1,5%Other Transformation & Losses 4 2 2 4 6 10 16 22 2,6% 5,8% 5,0% 5,9% 4,5% 3,5%
2 does not include international aviation and maritime bunkers; includes non-energy uses3 ratio of renewable energy over final energy demand increased by distribution losses and self consumption of electricity and steam plants4 includes statistical differences
114

GECO2015 Global Mitigation 150504 SUMMARY GHG & ENERGY BALANCE##### 100
North Africa Producers 1990 2000 2010 2020 2030 2040 2050 '90-'00 '00-'10 '10-'20 '20-'30 '30-'40 '40-'50Main Economic Indicators
Population (Million) 31 37 43 51 56 60 63 1,9% 1,6% 1,6% 1,0% 0,7% 0,5%GDP per capita (ppp, k$'05) 7 7 9 11 16 22 29 -0,6% 2,3% 2,2% 4,2% 3,4% 2,6%GDP per capita (mer, k$'05) 3 3 4 5 7 10 13 -0,7% 2,3% 2,0% 4,2% 3,4% 2,6%Share Value Added - Agriculture (%) 8 5 9 8 7 6 6 -3,4% 4,6% -0,7% -1,6% -0,9% -0,5%Share Value Added - Industry (%) 33 36 51 47 42 36 30 1,0% 3,6% -0,8% -1,1% -1,6% -1,8%Share Value Added - Services (%) 59 58 40 45 51 58 64 -0,2% -3,7% 1,1% 1,3% 1,3% 1,0%
PricesInternational/Regional ($'05/boe)
Coal 18 9 19 22 24 26 30 -6,6% 7,6% 1,4% 0,8% 1,0% 1,4%Oil 33 32 72 96 103 104 74 -0,2% 8,3% 2,9% 0,7% 0,1% -3,3%Gas 18 21 31 38 39 36 28 1,4% 4,0% 2,0% 0,4% -0,7% -2,7%
GHG emissions (Mt CO2 eq.)Total GHG (excl. LULUCF) 144 182 245 319 317 226 124 2,3% 3,0% 2,7% -0,1% -3,3% -5,8%CO2 91 119 173 256 265 182 99 2,8% 3,8% 4,0% 0,3% -3,6% -6,0%CH4 48 57 64 54 47 39 24 1,7% 1,2% -1,6% -1,4% -1,7% -5,0%N2O 5 5 7 8 4 3 1 0,9% 2,5% 1,4% -6,4% -3,4% -8,8%F gases 1 1 1 1 1 1 1 4,0% 3,0% 1,0% -1,5% -1,1% -1,0%Total GHG from Energy and Industry 136 174 236 308 307 218 121 2,5% 3,1% 2,7% 0,0% -3,4% -5,7%CO2 Emissions from Fuel Comb. 83 110 157 236 241 158 79 2,8% 3,6% 4,1% 0,2% -4,1% -6,7%
Power generation/District heating 18 32 53 68 76 47 19 5,8% 5,3% 2,5% 1,1% -4,8% -8,4%Industry 10 14 19 24 20 16 11 3,2% 3,2% 2,2% -2,0% -2,3% -3,4%Buildings 9 13 19 24 22 14 8 3,8% 4,0% 2,2% -0,9% -4,4% -5,1%Agriculture 0 0 0 0 0 0 0 0,9% 17,7% 3,6% -1,1% -2,8% -3,1%Transport 17 22 37 75 79 51 25 2,5% 5,1% 7,5% 0,5% -4,3% -6,9%Other 28 29 29 44 44 31 16 0,2% 0,0% 4,3% 0,1% -3,4% -6,7%
CO2 captured (CCS) 0 0 0 0 11 56 88 n.s. n.s. n.s. n.s. 17,6% 4,7%Coal 0 0 0 0 1 12 22 n.s. n.s. n.s. n.s. 24,5% 6,8%Gas 0 0 0 0 10 37 40 n.s. n.s. n.s. n.s. 14,6% 0,8%Biomass 0 0 0 0 0 7 25 n.s. n.s. n.s. n.s. n.s. 14,4%
Energy Balance, by fuel (Mtoe)Primary Production 178 218 245 291 312 310 229 2,1% 1,2% 1,8% 0,7% -0,1% -3,0%
Coal 0 0 0 0 0 0 0 n.s. n.s. n.s. n.s. n.s. n.s.Oil 137 149 166 180 174 163 99 0,9% 1,0% 0,8% -0,3% -0,7% -4,8%Natural gas 41 69 79 110 127 125 99 5,3% 1,4% 3,4% 1,4% -0,2% -2,3%Biomass 0 0 0 1 8 12 12 4,4% 1,2% 17,4% 20,8% 4,0% 0,2%Nuclear1 0 0 0 0 0 1 1 n.s. n.s. n.s. 30,4% 9,1% 4,2%Hydro 0 0 0 0 0 0 0 -8,8% 12,4% 6,8% 2,1% 1,0% 0,9%Other renewables 0 0 0 0 2 9 18 n.s. n.s. 19,7% 37,1% 15,8% 6,9%
Net Imports - 144 - 174 - 184 - 197 - 202 - 202 - 128Coal 0 1 0 1 2 4 6Oil - 119 - 127 - 135 - 136 - 128 - 130 - 79Natural gas - 25 - 48 - 50 - 62 - 75 - 77 - 59Biomass 0 0 0 0 - 1 0 3Biofuels 0 0 0 0 0 1 1Electricity 0 0 0 0 0 0 0
Primary Energy Demand2 34 44 61 95 110 107 101 2,6% 3,3% 4,6% 1,5% -0,2% -0,6%Coal 0 1 0 1 2 4 6 2,5% -4,0% 10,0% 7,5% 8,6% 3,8%Oil 17 22 31 44 47 33 20 2,5% 3,3% 3,7% 0,6% -3,5% -4,8%Natural gas 16 21 29 49 52 48 40 2,6% 3,3% 5,3% 0,6% -0,8% -1,9%Biomass 0 0 0 1 7 12 15 4,4% 1,2% 16,4% 20,4% 5,2% 2,7%Nuclear1 0 0 0 0 0 1 1 n.s. n.s. n.s. 30,4% 9,1% 4,2%Hydro 0 0 0 0 0 0 0 -8,8% 12,4% 6,8% 2,1% 1,0% 0,9%Other renewables 0 0 0 0 2 9 18 n.s. n.s. 19,7% 37,1% 15,8% 6,9%
Primary Energy Demand, by sector (Mtoe)Primary Energy Demand 34 44 61 95 110 107 101 2,6% 3,3% 4,6% 1,5% -0,2% -0,6%Energy for Power Generation 7 12 20 28 37 50 60 5,8% 5,5% 3,2% 2,9% 3,0% 1,9%Other Transformation & Losses 4 6 8 14 24 31 39 3,6% 2,8% 6,5% 5,0% 2,9% 2,2%Energy Branch Consumption 9 9 7 12 13 13 12 -0,8% -1,6% 4,9% 1,0% -0,3% -1,1%Final consumption 18 24 37 61 68 63 58 2,9% 4,5% 5,1% 1,1% -0,7% -0,8%
Steel, Non-Met. Minerals and Chem. 1 1 1 1 1 1 1 -1,6% 4,0% 2,8% -3,3% -2,4% -2,0%Other Industry 3 4 6 8 8 7 6 3,3% 4,7% 3,5% -0,9% -0,8% -1,0%Non-Energy Use 3 4 5 6 7 7 7 3,1% 0,6% 2,5% 1,4% 0,2% -0,6%Residential 4 6 8 10 11 10 9 4,6% 3,2% 2,7% 0,2% -0,9% -0,7%Services 0 1 3 5 7 9 11 5,0% 17,8% 6,1% 4,0% 2,6% 2,4%Agriculture 0 0 0 0 0 1 1 0,9% 10,0% 1,4% 2,6% 2,2% 1,9%Road 7 8 13 28 32 27 22 2,1% 5,1% 7,6% 1,5% -1,7% -2,3%Rail 0 0 0 0 0 0 0 1,2% 9,4% 1,9% 0,4% 0,0% -0,4%Aviation 0 0 0 1 1 1 1 4,1% n.s. 8,7% 2,4% 1,3% -0,3%Other Transport 0 0 0 0 0 0 0 0,9% 10,0% 4,5% 1,8% -0,3% -1,3%
1 Primary energy from nuclear is calculated considering the primary heat equivalent of the electricity produced with an average efficiency of 33%
115

GECO2015 Global Mitigation 150504 SUMMARY GHG & ENERGY BALANCE##### 100
North Africa Producers 1990 2000 2010 2020 2030 2040 2050 '90-'00 '00-'10 '10-'20 '20-'30 '30-'40 '40-'50Power Generation
Fuel Inputs Therm. Power (Mtoe) 7 12 20 28 35 40 41 5,8% 5,5% 3,2% 2,3% 1,4% 0,3%Coal 0 0 0 0 1 4 6 n.s. n.s. n.s. 14,6% 11,7% 4,5%Oil 3 5 7 4 4 5 4 5,1% 3,9% -5,8% 1,9% 0,5% -0,9%Gas 4 7 14 24 28 28 25 6,3% 6,4% 5,7% 1,8% 0,0% -1,2%Biomass & Waste 0 0 0 0 1 3 6 n.s. n.s. n.s. 41,5% 15,3% 6,7%Other 0 0 0 0 0 0 0 n.s. n.s. n.s. n.s. n.s. n.s.
Gross Elec. Generation (TWh e) 27 43 80 133 199 296 397 4,6% 6,4% 5,3% 4,1% 4,0% 3,0%Coal 0 0 0 1 6 17 27 n.s. n.s. n.s. 14,7% 11,5% 4,7%
of which CCS 0 0 0 0 1 13 27 n.s. n.s. n.s. n.s. 24,7% 7,2%Oil 11 13 20 16 19 20 19 1,5% 4,3% -2,2% 2,0% 0,6% -0,7%Gas 16 30 60 115 147 158 144 6,4% 7,1% 6,7% 2,5% 0,7% -0,9%
of which CCS 0 0 0 0 21 89 100 n.s. n.s. n.s. n.s. 15,7% 1,2%Biomass & Waste 0 0 0 0 4 16 32 n.s. n.s. n.s. 42,5% 15,6% 7,0%
of which CCS 0 0 0 0 0 7 22 n.s. n.s. n.s. n.s. n.s. 12,5%Nuclear 0 0 0 0 1 2 2 n.s. n.s. n.s. 30,4% 6,8% 1,0%Hydro 0 0 0 0 0 0 0 -8,8% 12,4% 6,8% 2,1% 1,0% 0,9%Wind 0 0 0 0 10 34 68 n.s. n.s. n.s. 41,8% 12,7% 7,1%Solar 0 0 0 1 11 48 103 n.s. n.s. 15,5% 31,5% 15,4% 8,0%Other 0 0 0 0 0 0 0 n.s. n.s. n.s. n.s. 18,1% 15,4%
Generation Capacity (GWe) 8 11 20 25 42 76 139 2,7% 6,3% 2,3% 5,5% 6,1% 6,1%Coal 0 0 0 0 1 2 4 n.s. n.s. n.s. 14,9% 11,0% 6,7%
of which CCS 0 0 0 0 0 2 4 n.s. n.s. n.s. n.s. 24,3% 9,3%Oil 4 4 4 4 4 4 6 -0,5% -0,1% -1,1% 0,0% 1,5% 3,7%Gas 4 6 15 20 26 24 31 5,8% 9,1% 2,7% 2,5% -0,8% 2,9%
of which CCS 0 0 0 0 3 11 18 n.s. n.s. n.s. n.s. 15,9% 4,9%Biomass & Waste 0 0 0 0 1 2 4 n.s. n.s. n.s. 42,7% 15,1% 7,5%
of which CCS 0 0 0 0 0 1 3 n.s. n.s. n.s. n.s. n.s. 13,0%Nuclear 0 0 0 0 0 0 0 n.s. n.s. n.s. 30,1% 6,6% 0,8%Hydro 0 0 0 0 0 0 0 -0,4% 0,0% -0,5% 2,1% 1,0% 0,9%Wind 0 0 0 0 4 14 28 n.s. n.s. n.s. 41,6% 12,8% 7,1%Solar 0 0 0 0 7 29 64 n.s. n.s. 15,5% 31,7% 15,5% 8,1%Other 0 0 0 0 0 0 0 n.s. n.s. n.s. n.s. 17,5% 14,9%
Total Final Consumption 2 (Mtoe) 18 24 37 61 68 63 58 2,9% 4,5% 5,1% 1,1% -0,7% -0,8%Coal 0 0 0 1 1 1 1 -3,2% -0,5% 6,5% 0,8% -0,2% -0,5%Oil 11 14 21 36 38 26 15 2,1% 4,0% 5,6% 0,5% -3,7% -5,1%Gas 4 7 11 15 13 9 6 4,6% 4,7% 3,4% -1,8% -2,9% -4,2%Electricity 2 2 5 8 12 19 26 4,7% 7,1% 5,3% 4,2% 4,6% 3,1%Heat 0 0 0 0 0 2 3 n.s. n.s. n.s. n.s. 24,1% 4,3%Biomass & Other 0 0 0 1 5 6 7 4,4% 1,2% 15,7% 16,0% 3,3% 1,1%Share of Renewables 3 (%) 1% 1% 1% 2% 10% 26% 44% 0,8% -2,7% 7,1% 20,5% 9,7% 5,5%
Industry (incl. non-energy use) 7 9 12 16 16 15 14 2,7% 2,8% 3,0% -0,1% -0,4% -0,9%Coal 0 0 0 1 1 1 1 -3,2% -0,5% 6,5% 0,8% -0,2% -0,5%Oil 2 3 4 4 5 5 5 2,1% 1,5% 1,8% 1,3% 0,1% 0,3%Gas 3 5 7 8 6 5 4 3,7% 3,2% 2,3% -2,5% -2,0% -3,5%Electricity 1 1 1 3 3 3 4 2,7% 5,2% 6,9% 1,2% 0,7% 0,8%Heat 0 0 0 0 0 0 0 n.s. n.s. n.s. n.s. n.s. n.s.Biomass & Other 0 0 0 0 1 1 1 n.s. n.s. n.s. 19,0% 2,1% -0,6%
Buildings 4 6 11 15 18 19 20 4,6% 5,3% 3,6% 1,5% 0,6% 0,9%Coal 0 0 0 0 0 0 0 n.s. n.s. n.s. n.s. n.s. n.s.Oil 2 3 3 3 2 1 1 2,3% 1,4% -1,6% -0,6% -5,1% -4,9%Gas 1 2 4 7 6 4 2 6,9% 7,4% 5,0% -1,0% -4,0% -5,2%Electricity 1 1 3 5 7 9 13 6,6% 7,9% 4,8% 3,4% 2,9% 3,2%Heat 0 0 0 0 0 2 3 n.s. n.s. n.s. n.s. 24,1% 4,3%Biomass & Other 0 0 0 1 2 2 1 4,4% 1,2% 11,5% 9,1% 0,0% -4,4%
Agriculture 0 0 0 0 0 1 1 0,9% 10,0% 1,4% 2,6% 2,2% 1,9%Coal 0 0 0 0 0 0 0 n.s. n.s. n.s. n.s. n.s. n.s.Oil 0 0 0 0 0 0 0 0,9% 12,1% 2,8% -1,4% -3,4% -3,7%Gas 0 0 0 0 0 0 0 n.s. n.s. 4,7% -0,6% -2,1% -2,4%Electricity 0 0 0 0 0 1 1 1,0% 8,8% 0,9% 2,9% 2,6% 2,2%Heat 0 0 0 0 0 0 0 n.s. n.s. n.s. n.s. n.s. n.s.Biomass & Other 0 0 0 0 0 0 0 n.s. n.s. n.s. n.s. 8,2% 3,4%
Transport 7 8 14 29 34 29 23 2,1% 5,5% 7,5% 1,6% -1,6% -2,1%Coal 0 0 0 0 0 0 0 n.s. n.s. n.s. n.s. n.s. n.s.Oil 7 8 14 29 30 19 9 2,1% 5,5% 7,5% 0,5% -4,4% -7,0%Gas 0 0 0 0 0 0 0 n.s. n.s. n.s. n.s. n.s. n.s.Electricity 0 0 0 0 2 6 9 3,0% 6,5% 7,4% 34,7% 13,1% 4,0%Heat 0 0 0 0 0 0 0 n.s. n.s. n.s. n.s. n.s. n.s.Biomass & Other 0 0 0 0 2 4 5 n.s. n.s. n.s. 27,8% 5,9% 3,4%
Energy Branch Consumption 9 9 7 12 13 13 12 -0,8% -1,6% 4,9% 1,0% -0,3% -1,1%Other Transformation & Losses 4 4 6 8 14 24 31 39 3,6% 2,8% 6,5% 5,0% 2,9% 2,2%
2 does not include international aviation and maritime bunkers; includes non-energy uses3 ratio of renewable energy over final energy demand increased by distribution losses and self consumption of electricity and steam plants4 includes statistical differences
116

GECO2015 Global Mitigation 150504 SUMMARY GHG & ENERGY BALANCE##### 100
Egypt 1990 2000 2010 2020 2030 2040 2050 '90-'00 '00-'10 '10-'20 '20-'30 '30-'40 '40-'50Main Economic Indicators
Population (Million) 56 66 78 91 103 113 122 1,6% 1,7% 1,6% 1,2% 1,0% 0,8%GDP per capita (ppp, k$'05) 3 4 6 7 10 16 21 2,6% 3,1% 1,7% 4,3% 4,1% 3,2%GDP per capita (mer, k$'05) 1 1 2 2 3 4 6 2,6% 3,1% 1,7% 4,3% 4,1% 3,2%Share Value Added - Agriculture (%) 19 17 14 13 10 8 8 -1,4% -1,8% -1,0% -2,5% -1,6% -0,9%Share Value Added - Industry (%) 29 33 38 38 37 34 29 1,5% 1,3% 0,2% -0,2% -1,0% -1,4%Share Value Added - Services (%) 52 50 48 49 53 58 63 -0,4% -0,3% 0,1% 0,7% 0,9% 0,9%
PricesInternational/Regional ($'05/boe)
Coal 18 9 19 22 24 26 30 -6,6% 7,6% 1,4% 0,8% 1,0% 1,4%Oil 33 32 72 96 103 104 74 -0,2% 8,3% 2,9% 0,7% 0,1% -3,3%Gas 18 21 31 38 39 36 28 1,4% 4,0% 2,0% 0,4% -0,7% -2,7%
GHG emissions (Mt CO2 eq.)Total GHG (excl. LULUCF) 139 171 279 319 320 285 203 2,0% 5,1% 1,3% 0,0% -1,1% -3,3%CO2 94 116 205 249 269 243 177 2,1% 5,9% 1,9% 0,8% -1,0% -3,1%CH4 25 36 48 43 34 28 20 3,7% 3,0% -1,1% -2,4% -2,0% -3,2%N2O 18 17 23 25 17 15 6 -0,7% 3,2% 0,6% -3,6% -1,5% -8,2%F gases 2 2 2 2 0 0 0 -2,8% 4,8% -0,1% -21,0% -14,5% -6,6%Total GHG from Energy and Industry 120 145 251 289 291 258 190 1,9% 5,6% 1,4% 0,1% -1,2% -3,0%CO2 Emissions from Fuel Comb. 84 101 181 217 225 193 136 1,8% 6,0% 1,8% 0,3% -1,5% -3,5%
Power generation/District heating 22 27 66 87 83 53 22 2,0% 9,4% 2,9% -0,5% -4,4% -8,5%Industry 26 26 31 40 51 53 43 -0,1% 1,8% 2,5% 2,5% 0,5% -2,1%Buildings 10 12 18 10 10 8 5 1,8% 3,8% -5,3% 0,0% -2,8% -4,2%Agriculture 0 0 10 10 9 6 4 n.s. 45,7% 0,4% -1,5% -3,2% -3,5%Transport 15 28 38 47 48 48 42 6,1% 3,2% 2,1% 0,3% 0,0% -1,3%Other 11 8 18 23 24 25 19 -2,5% 8,1% 2,1% 0,5% 0,3% -2,4%
CO2 captured (CCS) 0 0 0 0 10 63 120 n.s. n.s. n.s. n.s. 19,9% 6,7%Coal 0 0 0 0 2 16 35 n.s. n.s. n.s. n.s. 23,9% 7,8%Gas 0 0 0 0 8 43 69 n.s. n.s. n.s. n.s. 17,9% 5,0%Biomass 0 0 0 0 0 4 15 n.s. n.s. n.s. n.s. 56,6% 15,3%
Energy Balance, by fuel (Mtoe)Primary Production 53 56 89 109 128 138 135 0,5% 4,8% 2,0% 1,6% 0,7% -0,2%
Coal 0 0 0 0 0 0 0 n.s. n.s. n.s. n.s. n.s. n.s.Oil 44 38 36 31 21 16 13 -1,4% -0,7% -1,4% -3,8% -2,6% -1,9%Natural gas 7 15 50 72 94 101 93 7,8% 13,2% 3,7% 2,7% 0,7% -0,9%Biomass 1 1 2 2 4 4 5 2,3% 1,9% 1,2% 7,7% 1,1% 1,3%Nuclear1 0 0 0 0 0 0 0 n.s. n.s. n.s. n.s. 40,6% 11,3%Hydro 1 1 1 1 1 2 2 3,3% -0,5% 1,6% 1,2% 0,3% 0,2%Other renewables 0 0 1 3 8 15 23 14,1% 32,0% 18,9% 10,5% 6,6% 4,4%
Net Imports - 21 - 15 - 16 - 19 - 21 - 11 2Coal 1 1 1 3 6 9 11Oil - 21 - 15 - 4 - 2 9 14 16Natural gas 0 0 - 12 - 20 - 37 - 39 - 32Biomass 0 0 0 0 1 4 6Biofuels 0 0 0 0 0 1 1Electricity 0 0 0 0 0 0 0
Primary Energy Demand2 32 41 73 90 108 127 137 2,4% 6,0% 2,1% 1,8% 1,7% 0,8%Coal 1 1 1 3 6 9 11 3,1% -1,4% 13,0% 7,7% 4,4% 2,5%Oil 23 23 32 29 30 30 29 0,0% 3,3% -0,7% 0,3% 0,1% -0,5%Natural gas 7 14 38 52 57 63 61 7,9% 10,1% 3,2% 1,0% 0,9% -0,3%Biomass 1 1 2 2 5 8 11 2,1% 1,9% 2,7% 9,8% 4,4% 3,3%Nuclear1 0 0 0 0 0 0 0 n.s. n.s. n.s. n.s. 40,6% 11,3%Hydro 1 1 1 1 1 2 2 3,3% -0,5% 1,6% 1,2% 0,3% 0,2%Other renewables 0 0 1 3 8 15 23 14,1% 32,0% 18,9% 10,5% 6,6% 4,4%
Primary Energy Demand, by sector (Mtoe)Primary Energy Demand 32 41 73 90 108 127 137 2,4% 6,0% 2,1% 1,8% 1,7% 0,8%Energy for Power Generation 9 12 28 40 47 62 77 3,1% 8,9% 3,6% 1,7% 2,7% 2,2%Other Transformation & Losses 6 7 13 16 22 34 48 1,4% 6,8% 1,8% 3,5% 4,1% 3,6%Energy Branch Consumption 1 3 7 9 9 10 10 9,6% 8,1% 2,7% 0,8% 1,0% 0,0%Final consumption 23 31 49 61 76 90 96 3,1% 4,6% 2,2% 2,3% 1,6% 0,7%
Steel, Non-Met. Minerals and Chem. 1 1 1 1 3 3 2 1,0% -0,5% 7,4% 6,7% 0,0% -5,0%Other Industry 10 10 12 17 22 26 27 0,4% 2,2% 3,2% 2,8% 1,5% 0,4%Non-Energy Use 2 3 7 9 11 13 13 4,0% 7,7% 2,5% 2,9% 1,5% 0,1%Residential 5 7 11 11 13 15 16 3,0% 5,3% 0,3% 1,6% 1,2% 0,8%Services 0 1 2 4 5 8 12 11,3% 7,6% 3,9% 4,0% 4,2% 3,9%Agriculture 0 0 4 4 5 6 7 9,9% 28,3% 1,0% 2,0% 1,8% 1,5%Road 5 8 11 14 15 17 17 4,9% 3,6% 2,0% 0,5% 1,2% 0,1%Rail 0 0 0 0 0 0 0 n.s. n.s. n.s. n.s. n.s. n.s.Aviation 0 0 1 1 1 2 2 8,0% 2,5% 3,8% 2,9% 4,0% 1,7%Other Transport 0 1 0 0 1 1 1 n.s. -6,4% 1,8% 2,9% 1,1% -0,2%
1 Primary energy from nuclear is calculated considering the primary heat equivalent of the electricity produced with an average efficiency of 33%
117

GECO2015 Global Mitigation 150504 SUMMARY GHG & ENERGY BALANCE##### 100
Egypt 1990 2000 2010 2020 2030 2040 2050 '90-'00 '00-'10 '10-'20 '20-'30 '30-'40 '40-'50Power Generation
Fuel Inputs Therm. Power (Mtoe) 8 11 26 36 38 45 52 3,1% 9,4% 3,1% 0,6% 1,8% 1,5%Coal 0 0 0 1 2 4 7 n.s. n.s. n.s. 10,7% 9,4% 5,2%Oil 4 2 5 4 3 3 3 -6,9% 10,1% -3,7% -0,7% -1,4% -1,3%Gas 4 9 21 32 33 37 40 8,3% 9,2% 4,1% 0,3% 1,2% 0,8%Biomass & Waste 0 0 0 0 0 2 4 n.s. n.s. n.s. 44,2% 13,8% 7,2%Other 0 0 0 0 0 0 0 n.s. n.s. n.s. n.s. n.s. n.s.
Gross Elec. Generation (TWh e) 42 78 147 212 282 394 543 6,3% 6,5% 3,8% 2,9% 3,4% 3,2%Coal 0 0 0 3 8 20 33 n.s. n.s. n.s. 10,8% 9,2% 5,4%
of which CCS 0 0 0 0 2 15 33 n.s. n.s. n.s. n.s. 22,1% 8,0%Oil 13 22 31 15 14 12 11 5,2% 3,3% -6,8% -0,8% -1,4% -1,1%Gas 19 42 101 158 173 205 239 8,3% 9,2% 4,6% 0,9% 1,7% 1,5%
of which CCS 0 0 0 0 23 117 193 n.s. n.s. n.s. n.s. 17,7% 5,2%Biomass & Waste 0 0 0 0 2 8 18 n.s. n.s. n.s. 45,1% 14,2% 7,5%
of which CCS 0 0 0 0 0 4 13 n.s. n.s. n.s. n.s. n.s. 12,9%Nuclear 0 0 0 0 0 0 0 n.s. n.s. n.s. n.s. n.s. n.s.Hydro 10 14 13 15 17 18 18 3,3% -0,5% 1,6% 1,2% 0,3% 0,2%Wind 0 0 1 19 58 91 125 n.s. 23,7% 32,4% 11,8% 4,6% 3,3%Solar 0 0 0 1 9 40 98 n.s. n.s. 30,7% 24,9% 15,7% 9,4%Other 0 0 0 0 0 0 0 n.s. n.s. n.s. n.s. 19,0% 16,4%
Generation Capacity (GWe) 12 15 27 52 80 113 172 2,5% 6,0% 7,0% 4,4% 3,5% 4,3%Coal 0 0 0 0 1 3 5 n.s. n.s. n.s. 11,0% 9,1% 5,5%
of which CCS 0 0 0 0 0 2 5 n.s. n.s. n.s. n.s. 22,3% 8,3%Oil 4 2 5 6 4 3 4 -7,4% 9,0% 1,3% -3,7% -2,3% 3,6%Gas 5 10 18 34 40 41 48 8,3% 6,2% 6,5% 1,7% 0,1% 1,7%
of which CCS 0 0 0 0 3 16 30 n.s. n.s. n.s. n.s. 18,3% 6,5%Biomass & Waste 0 0 0 0 0 1 2 n.s. n.s. n.s. 45,3% 14,1% 7,2%
of which CCS 0 0 0 0 0 1 2 n.s. n.s. n.s. n.s. n.s. 12,6%Nuclear 0 0 0 0 0 0 0 n.s. n.s. n.s. n.s. n.s. n.s.Hydro 3 3 3 3 4 4 4 0,3% 0,2% 1,2% 1,2% 0,3% 0,2%Wind 0 0 1 9 26 40 54 n.s. 40,0% 31,5% 11,7% 4,4% 3,1%Solar 0 0 0 1 5 22 55 n.s. n.s. 32,2% 24,4% 15,8% 9,5%Other 0 0 0 0 0 0 0 n.s. n.s. n.s. n.s. 18,5% 15,8%
Total Final Consumption 2 (Mtoe) 23 31 49 61 76 90 96 3,1% 4,6% 2,2% 2,3% 1,6% 0,7%Coal 1 1 1 2 4 5 4 1,0% -0,5% 10,8% 7,1% 1,4% -0,5%Oil 16 20 25 24 25 26 25 2,2% 2,3% -0,2% 0,4% 0,2% -0,4%Gas 2 4 11 16 20 20 16 5,0% 11,0% 3,6% 2,1% 0,4% -2,5%Electricity 3 6 11 16 21 29 41 5,9% 6,9% 3,8% 2,9% 3,5% 3,3%Heat 0 0 0 1 2 4 4 n.s. n.s. n.s. 5,7% 5,9% 0,0%Biomass & Other 1 1 2 2 5 6 7 2,1% 1,8% 2,6% 8,4% 2,9% 1,3%Share of Renewables 3 (%) 9% 8% 7% 11% 20% 28% 35% -0,5% -1,7% 4,5% 6,2% 3,2% 2,5%
Industry (incl. non-energy use) 12 14 20 27 36 42 42 1,1% 3,6% 3,1% 3,1% 1,4% 0,0%Coal 1 1 1 2 4 5 4 1,0% -0,5% 10,8% 7,1% 1,4% -0,5%Oil 7 7 4 4 5 7 9 -0,9% -4,3% -1,5% 3,6% 3,2% 2,2%Gas 2 4 10 14 17 18 14 4,4% 11,2% 3,3% 1,8% 0,5% -2,4%Electricity 1 2 4 6 8 10 13 3,8% 5,2% 4,8% 3,0% 2,9% 2,7%Heat 0 0 0 0 0 0 0 n.s. n.s. n.s. n.s. n.s. n.s.Biomass & Other 1 1 1 1 2 2 1 2,5% 1,8% 3,8% 7,4% -2,3% -5,1%
Buildings 5 8 13 15 19 23 28 3,9% 5,6% 1,1% 2,3% 2,2% 2,0%Coal 0 0 0 0 0 0 0 n.s. n.s. n.s. n.s. n.s. n.s.Oil 3 4 5 2 1 1 0 1,3% 3,3% -8,4% -3,6% -5,8% -4,5%Gas 0 0 1 2 2 2 1 16,9% 9,8% 6,4% 4,4% -0,9% -4,1%Electricity 2 3 7 9 12 16 22 7,5% 7,9% 3,1% 2,3% 3,1% 3,4%Heat 0 0 0 1 2 4 4 n.s. n.s. n.s. 5,7% 5,9% 0,0%Biomass & Other 1 1 1 1 1 1 0 1,8% 1,8% 0,3% 3,2% -4,5% -7,2%
Agriculture 0 0 4 4 5 6 7 9,9% 28,3% 1,0% 2,0% 1,8% 1,5%Coal 0 0 0 0 0 0 0 n.s. n.s. n.s. n.s. n.s. n.s.Oil 0 0 3 3 3 2 1 n.s. 45,7% 0,4% -1,5% -3,2% -3,5%Gas 0 0 0 0 0 0 0 n.s. n.s. n.s. n.s. n.s. n.s.Electricity 0 0 0 1 1 2 3 6,9% 6,9% 4,4% 7,3% 5,3% 3,5%Heat 0 0 0 0 0 0 0 n.s. n.s. n.s. n.s. n.s. n.s.Biomass & Other 0 0 0 0 1 1 2 n.s. n.s. n.s. 50,9% 8,5% 3,5%
Transport 5 9 12 15 16 19 20 5,9% 3,0% 2,1% 0,8% 1,5% 0,3%Coal 0 0 0 0 0 0 0 n.s. n.s. n.s. n.s. n.s. n.s.Oil 5 9 12 15 16 16 14 5,9% 3,0% 2,1% 0,3% 0,0% -1,3%Gas 0 0 0 0 0 0 0 n.s. n.s. n.s. n.s. n.s. n.s.Electricity 0 0 0 0 0 1 2 n.s. n.s. n.s. n.s. 15,1% 6,0%Heat 0 0 0 0 0 0 0 n.s. n.s. n.s. n.s. n.s. n.s.Biomass & Other 0 0 0 0 1 2 3 n.s. n.s. 46,0% 20,5% 15,2% 5,3%
Energy Branch Consumption 1 3 7 9 9 10 10 9,6% 8,1% 2,7% 0,8% 1,0% 0,0%Other Transformation & Losses 4 6 7 13 16 22 34 48 1,4% 6,8% 1,8% 3,5% 4,1% 3,6%
2 does not include international aviation and maritime bunkers; includes non-energy uses3 ratio of renewable energy over final energy demand increased by distribution losses and self consumption of electricity and steam plants4 includes statistical differences
118

GECO2015 Global Mitigation 150504 SUMMARY GHG & ENERGY BALANCE##### 100
Rest Sub Saharian Africa 1990 2000 2010 2020 2030 2040 2050 '90-'00 '00-'10 '10-'20 '20-'30 '30-'40 '40-'50Main Economic Indicators
Population (Million) 473 622 816 1 067 1 365 1 710 2 088 2,8% 2,8% 2,7% 2,5% 2,3% 2,0%GDP per capita (ppp, k$'05) 1 1 2 2 3 4 7 0,0% 3,0% 3,1% 3,9% 4,0% 4,0%GDP per capita (mer, k$'05) 1 0 1 1 1 2 3 -0,2% 2,9% 3,1% 3,9% 4,0% 4,0%Share Value Added - Agriculture (%) 31 27 22 14 9 7 5 -1,5% -1,7% -4,4% -4,5% -3,1% -2,1%Share Value Added - Industry (%) 29 34 36 38 41 42 41 1,7% 0,7% 0,6% 0,6% 0,2% -0,2%Share Value Added - Services (%) 40 40 41 47 50 52 54 -0,2% 0,5% 1,4% 0,5% 0,3% 0,4%
PricesInternational/Regional ($'05/boe)
Coal 18 9 19 22 24 26 30 -6,6% 7,6% 1,4% 0,8% 1,0% 1,4%Oil 33 32 72 96 103 104 74 -0,2% 8,3% 2,9% 0,7% 0,1% -3,3%Gas 18 21 31 38 39 36 28 1,4% 4,0% 2,0% 0,4% -0,7% -2,7%
GHG emissions (Mt CO2 eq.)Total GHG (excl. LULUCF) 542 679 861 1 121 1 143 1 054 472 2,3% 2,4% 2,7% 0,2% -0,8% -7,7%CO2 107 134 202 355 520 613 237 2,3% 4,2% 5,8% 3,9% 1,7% -9,1%CH4 310 393 453 517 405 293 172 2,4% 1,4% 1,3% -2,4% -3,2% -5,2%N2O 124 151 204 247 217 148 62 2,0% 3,1% 1,9% -1,3% -3,7% -8,4%F gases 2 1 2 3 2 1 0 -5,8% 6,0% 5,9% -3,8% -13,0% -4,6%Total GHG from Energy and Industry 243 319 436 662 779 779 335 2,8% 3,2% 4,3% 1,6% 0,0% -8,1%CO2 Emissions from Fuel Comb. 99 126 188 334 485 559 176 2,4% 4,1% 5,9% 3,8% 1,4% -10,9%
Power generation/District heating 20 26 44 103 157 142 4 2,4% 5,6% 8,7% 4,3% -1,0% -30,0%Industry 21 19 27 43 72 101 32 -1,1% 3,6% 4,6% 5,4% 3,4% -10,9%Buildings 12 17 23 36 50 58 36 3,5% 3,4% 4,4% 3,3% 1,6% -4,8%Agriculture 2 3 3 4 4 3 2 5,1% -0,9% 1,6% 0,3% -2,1% -2,7%Transport 34 49 77 123 166 218 200 3,6% 4,7% 4,8% 3,1% 2,8% -0,9%Other 9 12 13 26 36 36 - 98 2,9% 0,7% 7,3% 3,5% -0,2% n.s.
CO2 captured (CCS) 0 0 0 0 7 104 421 n.s. n.s. n.s. n.s. 30,6% 15,1%Coal 0 0 0 0 5 48 88 n.s. n.s. n.s. n.s. 24,8% 6,2%Gas 0 0 0 0 2 31 56 n.s. n.s. n.s. n.s. 31,9% 6,2%Biomass 0 0 0 0 0 25 277 n.s. n.s. n.s. n.s. n.s. 27,2%
Energy Balance, by fuel (Mtoe)Primary Production 303 398 582 701 758 834 918 2,8% 3,9% 1,9% 0,8% 1,0% 1,0%
Coal 6 5 3 31 18 23 22 -1,0% -5,0% 25,4% -5,0% 2,1% -0,3%Oil 146 190 284 289 260 226 170 2,7% 4,1% 0,2% -1,0% -1,4% -2,8%Natural gas 4 12 42 71 101 117 101 12,1% 13,2% 5,4% 3,6% 1,5% -1,5%Biomass 143 185 244 298 355 422 534 2,6% 2,8% 2,0% 1,8% 1,8% 2,4%Nuclear1 0 0 0 0 0 0 2 n.s. n.s. n.s. 36,1% 32,2% 15,8%Hydro 4 5 8 9 11 13 16 3,1% 4,0% 1,9% 1,8% 1,7% 2,1%Other renewables 0 0 1 4 13 33 74 3,0% 13,1% 12,9% 11,2% 10,1% 8,5%
Net Imports - 121 - 162 - 262 - 303 - 241 - 193 - 174Coal - 1 - 1 1 - 17 3 7 4Oil - 120 - 156 - 234 - 216 - 169 - 117 - 67Natural gas 0 - 5 - 30 - 40 - 37 - 14 - 11Biomass 0 0 0 - 28 - 26 - 54 - 85Biofuels 0 0 0 - 3 - 12 - 16 - 16Electricity 0 0 1 0 0 0 0
Primary Energy Demand2 182 236 319 398 517 640 744 2,7% 3,1% 2,2% 2,6% 2,2% 1,5%Coal 5 4 4 14 22 30 26 -1,6% -0,4% 13,0% 4,8% 3,2% -1,5%Oil 26 34 50 73 91 109 103 2,8% 4,0% 3,8% 2,2% 1,8% -0,6%Natural gas 4 8 12 31 64 103 90 7,2% 4,4% 10,2% 7,5% 4,9% -1,4%Biomass 143 185 244 269 329 368 450 2,6% 2,8% 1,0% 2,0% 1,1% 2,0%Nuclear1 0 0 0 0 0 0 2 n.s. n.s. n.s. 36,1% 32,2% 15,8%Hydro 4 5 8 9 11 13 16 3,1% 4,0% 1,9% 1,8% 1,7% 2,1%Other renewables 0 0 1 4 13 33 74 3,0% 13,1% 12,9% 11,2% 10,1% 8,5%
Primary Energy Demand, by sector (Mtoe)Primary Energy Demand 182 236 319 398 517 640 744 2,7% 3,1% 2,2% 2,6% 2,2% 1,5%Energy for Power Generation 11 14 24 48 82 137 219 3,0% 5,5% 7,0% 5,5% 5,3% 4,8%Other Transformation & Losses 7 9 14 35 93 159 272 3,2% 4,1% 9,4% 10,3% 5,5% 5,5%Energy Branch Consumption 2 3 3 7 11 14 13 6,2% 0,6% 7,9% 3,8% 3,1% -0,9%Final consumption 173 223 301 356 433 509 544 2,6% 3,0% 1,7% 2,0% 1,6% 0,7%
Steel, Non-Met. Minerals and Chem. 2 1 1 2 3 5 5 -2,3% 0,1% 2,5% 5,4% 4,5% 1,4%Other Industry 19 23 32 46 63 82 94 1,9% 3,6% 3,6% 3,1% 2,7% 1,4%Non-Energy Use 1 1 1 2 3 5 6 0,5% -0,1% 4,7% 5,3% 4,9% 2,1%Residential 134 172 227 243 267 278 266 2,6% 2,8% 0,7% 0,9% 0,4% -0,4%Services 3 5 9 14 23 34 43 5,9% 5,0% 5,1% 5,0% 3,9% 2,3%Agriculture 1 2 2 3 3 3 4 4,0% 1,1% 1,2% 1,5% 1,6% 1,5%Road 12 18 26 43 65 92 110 3,8% 4,0% 5,0% 4,2% 3,5% 1,8%Rail 0 0 0 0 0 0 1 -4,9% 1,2% 1,2% 2,0% 2,5% 2,7%Aviation 0 1 1 2 4 9 14 3,0% 5,7% 8,0% 7,7% 7,4% 5,0%Other Transport 0 0 0 1 1 1 1 4,7% 4,1% 5,0% 4,6% 3,7% 1,2%
1 Primary energy from nuclear is calculated considering the primary heat equivalent of the electricity produced with an average efficiency of 33%
119

GECO2015 Global Mitigation 150504 SUMMARY GHG & ENERGY BALANCE##### 100
Rest Sub Saharian Africa 1990 2000 2010 2020 2030 2040 2050 '90-'00 '00-'10 '10-'20 '20-'30 '30-'40 '40-'50Power Generation
Fuel Inputs Therm. Power (Mtoe) 7 9 15 34 59 91 127 3,0% 5,8% 8,3% 5,4% 4,5% 3,4%Coal 2 2 2 10 16 22 21 -1,1% 1,3% 16,2% 4,4% 3,4% -0,4%Oil 2 4 7 9 11 11 16 4,5% 7,2% 2,8% 2,2% -0,7% 4,2%Gas 2 3 6 14 28 46 48 4,5% 6,9% 9,6% 6,9% 5,1% 0,5%Biomass & Waste 0 0 0 1 3 13 42 8,3% 1,9% 3,3% 18,9% 14,4% 12,8%Other 0 0 0 0 0 0 0 2,9% 13,0% 10,5% 3,1% 0,2% -2,3%
Gross Elec. Generation (TWh e) 66 90 147 276 503 907 1 490 3,1% 5,1% 6,5% 6,2% 6,1% 5,1%Coal 6 5 6 42 72 103 102 -1,6% 1,6% 21,5% 5,5% 3,7% -0,1%
of which CCS 0 0 0 0 7 55 99 n.s. n.s. n.s. n.s. 23,5% 6,0%Oil 8 12 27 40 50 46 70 4,1% 8,2% 4,2% 2,1% -0,7% 4,2%Gas 7 12 24 72 155 264 277 5,1% 7,1% 11,6% 8,0% 5,5% 0,5%
of which CCS 0 0 0 0 4 72 144 n.s. n.s. n.s. n.s. 35,0% 7,2%Biomass & Waste 0 1 1 2 15 60 209 6,6% 3,1% 7,0% 20,3% 15,0% 13,3%
of which CCS 0 0 0 0 0 20 141 n.s. n.s. n.s. n.s. n.s. 21,3%Nuclear 0 0 0 0 0 0 0 n.s. n.s. n.s. n.s. n.s. n.s.Hydro 44 59 87 105 126 150 184 3,1% 4,0% 1,9% 1,8% 1,7% 2,1%Wind 0 0 0 6 49 147 275 21,5% 8,5% n.s. 23,5% 11,6% 6,5%Solar 0 0 0 4 30 130 359 n.s. 31,2% 30,7% 23,9% 15,8% 10,7%Other 0 0 1 4 6 7 14 2,9% 13,0% 10,5% 3,6% 2,3% 6,7%
Generation Capacity (GWe) 24 24 39 71 136 281 519 0,2% 5,0% 6,1% 6,7% 7,5% 6,3%Coal 2 2 2 6 11 16 18 -0,3% 1,1% 11,8% 6,0% 4,0% 1,0%
of which CCS 0 0 0 0 1 8 17 n.s. n.s. n.s. n.s. 23,8% 8,6%Oil 4 6 9 21 28 33 34 2,8% 4,5% 8,8% 2,9% 1,6% 0,3%Gas 3 1 7 14 28 52 64 -7,2% 19,8% 6,8% 6,8% 6,6% 2,1%
of which CCS 0 0 0 0 0 10 26 n.s. n.s. n.s. n.s. 36,0% 10,1%Biomass & Waste 0 0 0 0 2 9 35 -1,3% 3,3% 6,3% 20,5% 15,2% 14,9%
of which CCS 0 0 0 0 0 3 22 n.s. n.s. n.s. n.s. n.s. 23,1%Nuclear 0 0 0 0 0 0 0 n.s. n.s. n.s. n.s. n.s. n.s.Hydro 15 15 20 24 28 34 42 0,3% 3,0% 1,7% 1,8% 1,7% 2,1%Wind 0 0 0 2 20 61 114 n.s. 12,9% n.s. 23,6% 11,6% 6,4%Solar 0 0 0 2 17 74 210 n.s. 28,8% 32,2% 23,6% 15,8% 10,9%Other 0 0 0 1 1 1 2 3,6% 12,3% 9,4% 3,2% 3,1% 7,4%
Total Final Consumption 2 (Mtoe) 173 223 301 356 433 509 544 2,6% 3,0% 1,7% 2,0% 1,6% 0,7%Coal 3 2 2 3 6 8 5 -2,1% -3,0% 5,3% 7,6% 3,5% -5,1%Oil 21 28 41 61 77 95 84 2,9% 3,8% 4,0% 2,3% 2,1% -1,2%Gas 1 2 3 10 25 40 27 5,3% 6,0% 11,3% 9,3% 5,0% -3,8%Electricity 4 6 11 20 36 65 108 3,5% 6,0% 6,1% 6,2% 6,1% 5,2%Heat 0 0 0 0 1 4 16 n.s. n.s. n.s. 31,1% 14,5% 14,4%Biomass & Other 143 185 243 262 289 298 305 2,6% 2,8% 0,8% 1,0% 0,3% 0,2%Share of Renewables 3 (%) 84% 84% 82% 75% 69% 64% 73% 0,0% -0,2% -1,0% -0,8% -0,8% 1,4%
Industry (incl. non-energy use) 22 25 35 50 69 91 105 1,5% 3,3% 3,6% 3,3% 2,9% 1,4%Coal 2 1 1 2 5 8 5 -2,8% -1,8% 6,7% 8,4% 3,8% -5,1%Oil 5 4 6 7 8 9 7 -0,4% 2,7% 2,3% 1,2% 1,1% -2,1%Gas 1 1 3 6 14 24 17 2,3% 8,3% 7,1% 7,9% 5,6% -3,2%Electricity 2 3 5 9 16 27 42 1,9% 5,0% 7,3% 6,0% 5,3% 4,3%Heat 0 0 0 0 0 0 0 n.s. n.s. n.s. n.s. n.s. n.s.Biomass & Other 12 15 20 25 25 24 35 2,7% 3,0% 2,0% 0,3% -0,6% 3,8%
Buildings 137 177 236 258 290 311 308 2,6% 2,9% 0,9% 1,2% 0,7% -0,1%Coal 0 0 0 0 0 0 0 -1,0% -4,5% -1,8% -6,2% -13,5% -15,8%Oil 3 5 7 8 8 6 4 3,2% 4,3% 1,9% -1,0% -2,2% -4,8%Gas 0 0 0 4 11 17 10 n.s. -6,5% 30,8% 11,3% 4,3% -4,8%Electricity 2 3 6 10 17 29 48 5,2% 6,9% 5,2% 5,6% 5,3% 5,0%Heat 0 0 0 0 1 4 16 n.s. n.s. n.s. 31,1% 14,5% 14,4%Biomass & Other 131 169 222 235 253 255 231 2,6% 2,8% 0,6% 0,8% 0,1% -1,0%
Agriculture 1 2 2 3 3 3 4 4,0% 1,1% 1,2% 1,5% 1,6% 1,5%Coal 0 0 0 0 0 0 0 5,0% -8,1% -3,7% -3,0% -6,5% -7,5%Oil 0 1 1 1 1 1 1 5,2% 2,3% 2,5% 0,6% -1,8% -2,5%Gas 0 0 0 0 0 0 0 n.s. n.s. n.s. n.s. n.s. n.s.Electricity 0 0 0 0 1 1 1 2,5% 3,2% 3,2% 4,8% 5,3% 4,4%Heat 0 0 0 0 0 0 0 n.s. n.s. n.s. n.s. n.s. n.s.Biomass & Other 1 1 1 1 1 2 2 3,2% 2,3% 0,1% 1,6% 2,6% 1,9%
Transport 13 19 28 46 71 103 126 3,7% 4,0% 5,1% 4,4% 3,8% 2,1%Coal 0 0 0 0 0 0 0 -22,1% -7,3% -3,7% 0,0% 0,0% 0,0%Oil 13 19 28 44 60 79 72 3,8% 4,0% 4,8% 3,1% 2,8% -0,9%Gas 0 0 0 0 0 0 0 n.s. n.s. n.s. n.s. n.s. n.s.Electricity 0 0 0 0 1 7 17 n.s. 4,7% 35,9% 40,4% 17,3% 9,0%Heat 0 0 0 0 0 0 0 n.s. n.s. n.s. n.s. n.s. n.s.Biomass & Other 0 0 0 2 9 17 37 n.s. n.s. 36,6% 19,5% 6,2% 8,4%
Energy Branch Consumption 2 3 3 7 11 14 13 6,2% 0,6% 7,9% 3,8% 3,1% -0,9%Other Transformation & Losses 4 7 9 14 35 93 159 272 3,2% 4,1% 9,4% 10,3% 5,5% 5,5%
2 does not include international aviation and maritime bunkers; includes non-energy uses3 ratio of renewable energy over final energy demand increased by distribution losses and self consumption of electricity and steam plants4 includes statistical differences
120

GECO2015 Global Mitigation 150504 SUMMARY GHG & ENERGY BALANCE##### 100
South Africa 1990 2000 2010 2020 2030 2040 2050 '90-'00 '00-'10 '10-'20 '20-'30 '30-'40 '40-'50Main Economic Indicators
Population (Million) 37 45 51 55 58 61 63 2,0% 1,4% 0,7% 0,5% 0,5% 0,4%GDP per capita (ppp, k$'05) 8 7 9 12 18 25 30 -0,2% 2,1% 2,5% 4,6% 3,1% 1,9%GDP per capita (mer, k$'05) 5 5 6 7 11 15 18 -0,2% 2,1% 2,5% 4,6% 3,1% 1,9%Share Value Added - Agriculture (%) 5 3 3 2 2 2 2 -3,4% -2,4% -0,6% -0,9% -0,4% -0,2%Share Value Added - Industry (%) 40 32 30 27 22 19 16 -2,3% -0,6% -1,0% -1,8% -1,9% -1,5%Share Value Added - Services (%) 55 65 68 71 75 79 82 1,6% 0,4% 0,4% 0,6% 0,5% 0,3%
PricesInternational/Regional ($'05/boe)
Coal 18 9 19 22 24 26 30 -6,6% 7,6% 1,4% 0,8% 1,0% 1,4%Oil 33 32 72 96 103 104 74 -0,2% 8,3% 2,9% 0,7% 0,1% -3,3%Gas 18 21 31 38 39 36 28 1,4% 4,0% 2,0% 0,4% -0,7% -2,7%
GHG emissions (Mt CO2 eq.)Total GHG (excl. LULUCF) 362 408 493 463 386 242 128 1,2% 1,9% -0,6% -1,8% -4,6% -6,1%CO2 293 334 414 393 340 205 105 1,3% 2,2% -0,5% -1,4% -4,9% -6,5%CH4 50 57 63 52 30 23 19 1,2% 1,0% -1,9% -5,2% -2,6% -2,1%N2O 17 16 15 17 15 13 4 -0,3% -0,6% 1,3% -1,6% -1,4% -10,4%F gases 1 1 2 1 0 0 0 -4,7% 5,7% -1,5% -11,0% -3,1% -1,3%Total GHG from Energy and Industry 330 376 459 427 356 215 114 1,3% 2,0% -0,7% -1,8% -4,9% -6,2%CO2 Emissions from Fuel Comb. 280 325 402 379 325 192 95 1,5% 2,1% -0,6% -1,5% -5,1% -6,8%
Power generation/District heating 142 188 242 206 173 72 10 2,8% 2,6% -1,6% -1,7% -8,4% -17,7%Industry 51 43 39 32 25 16 11 -1,6% -1,1% -1,8% -2,5% -4,3% -3,7%Buildings 11 8 18 16 8 5 4 -3,2% 7,8% -1,2% -6,8% -4,1% -1,7%Agriculture 3 4 3 4 4 3 2 1,7% -0,3% 1,6% -1,3% -3,4% -3,9%Transport 34 44 56 66 64 48 33 2,5% 2,4% 1,7% -0,3% -2,8% -3,8%Other 39 39 45 54 52 47 35 0,0% 1,4% 2,0% -0,5% -0,9% -3,1%
CO2 captured (CCS) 0 0 0 0 20 109 190 n.s. n.s. n.s. n.s. 18,6% 5,8%Coal 0 0 0 0 19 89 117 n.s. n.s. n.s. n.s. 16,6% 2,8%Gas 0 0 0 0 1 6 15 n.s. n.s. n.s. n.s. 25,6% 9,8%Biomass 0 0 0 0 0 14 59 n.s. n.s. n.s. n.s. n.s. 15,7%
Energy Balance, by fuel (Mtoe)Primary Production 119 164 161 177 191 222 241 3,2% -0,2% 0,9% 0,8% 1,5% 0,8%
Coal 108 148 146 155 137 126 127 3,3% -0,1% 0,6% -1,3% -0,9% 0,1%Oil 0 1 0 0 0 0 0 n.s. -16,6% 2,1% 1,7% 0,6% -0,4%Natural gas 2 1 0 1 9 27 30 -0,8% -10,5% 11,7% 19,9% 12,0% 1,2%Biomass 8 9 11 13 21 28 31 1,9% 1,3% 2,0% 5,0% 2,8% 1,2%Nuclear1 2 3 3 4 16 26 27 4,4% -0,7% 1,7% 15,5% 5,0% 0,2%Hydro 0 0 0 1 1 1 1 3,3% 2,6% 7,0% 3,0% 0,2% 0,3%Other renewables 0 0 0 2 7 14 23 n.s. n.s. 38,7% 10,9% 7,6% 5,5%
Net Imports - 32 - 49 - 14 - 34 - 29 - 46 - 49Coal - 40 - 52 - 32 - 54 - 48 - 48 - 53Oil 9 2 15 15 16 11 6Natural gas - 1 0 2 5 3 - 9 - 7Biomass 0 0 0 0 - 1 - 1 4Biofuels 0 0 0 0 0 1 1Electricity 0 1 0 0 0 0 0
Primary Energy Demand2 87 115 147 143 161 175 192 2,8% 2,5% -0,3% 1,2% 0,8% 0,9%Coal 68 96 114 102 90 78 74 3,6% 1,7% -1,1% -1,3% -1,4% -0,4%Oil 9 3 15 15 16 11 6 -11,6% 19,0% 0,1% 0,3% -3,6% -5,2%Natural gas 0 1 3 6 11 18 23 10,9% 7,8% 7,3% 6,5% 4,9% 2,5%Biomass 8 9 11 13 20 27 35 1,9% 1,3% 1,9% 4,8% 2,7% 2,8%Nuclear1 2 3 3 4 16 26 27 4,4% -0,7% 1,7% 15,5% 5,0% 0,2%Hydro 0 0 0 1 1 1 1 3,3% 2,6% 7,0% 3,0% 0,2% 0,3%Other renewables 0 0 0 2 7 14 23 n.s. n.s. 38,7% 10,9% 7,6% 5,5%
Primary Energy Demand, by sector (Mtoe)Primary Energy Demand 87 115 147 143 161 175 192 2,8% 2,5% -0,3% 1,2% 0,8% 0,9%Energy for Power Generation 38 51 64 61 76 97 120 3,0% 2,4% -0,6% 2,3% 2,5% 2,1%Other Transformation & Losses 21 36 53 56 70 83 101 5,5% 3,9% 0,5% 2,3% 1,8% 1,9%Energy Branch Consumption 2 3 3 3 4 5 7 2,1% 1,0% 0,8% 2,4% 2,4% 2,4%Final consumption 52 58 67 68 75 79 86 1,0% 1,5% 0,1% 1,1% 0,4% 0,9%
Steel, Non-Met. Minerals and Chem. 10 7 9 9 8 6 6 -3,2% 1,5% 0,4% -1,5% -2,5% -0,7%Other Industry 13 14 14 12 13 13 12 0,8% 0,5% -1,6% 0,7% 0,0% -0,7%Non-Energy Use 4 6 4 1 2 2 1 3,3% -3,8% -9,8% 1,9% 0,0% -2,1%Residential 10 12 15 14 15 15 13 1,2% 2,4% -0,3% 0,2% 0,0% -0,9%Services 3 5 6 7 9 12 15 4,8% 2,0% 1,2% 2,8% 2,8% 2,0%Agriculture 1 1 2 2 2 3 3 1,5% 1,0% 1,6% 2,4% 1,6% 1,2%Road 9 11 16 20 24 24 32 1,9% 3,5% 2,2% 1,7% 0,2% 2,7%Rail 0 1 0 1 1 1 1 5,1% -4,2% 2,4% 2,8% 1,9% 1,0%Aviation 0 1 1 1 2 3 3 5,7% 5,5% 3,0% 5,2% 2,7% -0,3%Other Transport 0 0 0 0 0 0 0 n.s. n.s. n.s. n.s. n.s. n.s.
1 Primary energy from nuclear is calculated considering the primary heat equivalent of the electricity produced with an average efficiency of 33%
121

GECO2015 Global Mitigation 150504 SUMMARY GHG & ENERGY BALANCE##### 100
South Africa 1990 2000 2010 2020 2030 2040 2050 '90-'00 '00-'10 '10-'20 '20-'30 '30-'40 '40-'50Power Generation
Fuel Inputs Therm. Power (Mtoe) 36 47 61 54 52 56 68 2,9% 2,6% -1,2% -0,3% 0,7% 2,0%Coal 36 47 61 50 43 34 32 2,8% 2,6% -1,9% -1,6% -2,2% -0,7%Oil 0 0 0 1 2 3 4 n.s. n.s. 32,0% 10,8% 3,5% 3,1%Gas 0 0 0 2 6 12 17 n.s. n.s. n.s. 9,8% 6,6% 3,7%Biomass & Waste 0 0 0 1 1 7 15 n.s. -0,9% 21,5% 6,3% 18,8% 8,1%Other 0 0 0 0 0 0 0 n.s. n.s. n.s. n.s. n.s. n.s.
Gross Elec. Generation (TWh e) 167 210 260 274 382 531 715 2,3% 2,1% 0,5% 3,4% 3,3% 3,0%Coal 156 193 242 210 190 158 150 2,2% 2,3% -1,4% -1,0% -1,8% -0,5%
of which CCS 0 0 0 0 20 99 135 n.s. n.s. n.s. n.s. 17,4% 3,1%Oil 0 0 0 3 9 13 18 n.s. n.s. 32,1% 11,0% 3,8% 3,4%Gas 0 0 0 12 33 66 98 n.s. n.s. n.s. 11,0% 7,0% 4,1%
of which CCS 0 0 0 0 2 16 41 n.s. n.s. n.s. n.s. 25,8% 10,0%Biomass & Waste 0 0 0 3 6 33 76 n.s. n.s. n.s. 7,3% 19,7% 8,6%
of which CCS 0 0 0 0 0 15 55 n.s. n.s. n.s. n.s. n.s. 14,2%Nuclear 8 13 12 14 64 105 106 4,4% -0,7% 1,8% 16,1% 5,1% 0,1%Hydro 3 4 5 10 13 14 14 3,3% 2,6% 7,0% 3,0% 0,2% 0,3%Wind 0 0 0 17 42 79 135 n.s. n.s. n.s. 9,6% 6,4% 5,6%Solar 0 0 0 5 24 63 115 n.s. n.s. 37,3% 16,7% 10,0% 6,2%Other 0 0 0 0 0 1 2 n.s. n.s. n.s. 34,1% 18,6% 15,6%
Generation Capacity (GWe) 35 41 44 62 98 149 228 1,7% 0,7% 3,4% 4,7% 4,2% 4,4%Coal 31 37 38 41 40 29 27 1,8% 0,2% 0,7% -0,1% -3,2% -0,6%
of which CCS 0 0 0 0 3 14 23 n.s. n.s. n.s. n.s. 17,9% 5,0%Oil 0 0 0 1 1 3 5 29,8% 0,0% 8,7% 5,9% 6,3% 6,9%Gas 0 0 2 3 5 11 20 n.s. n.s. 4,6% 4,3% 8,5% 6,2%
of which CCS 0 0 0 0 0 2 6 n.s. n.s. n.s. n.s. 25,9% 11,2%Biomass & Waste 0 0 0 0 1 4 10 n.s. n.s. n.s. 7,3% 19,3% 8,8%
of which CCS 0 0 0 0 0 2 7 n.s. n.s. n.s. n.s. n.s. 14,4%Nuclear 2 2 2 2 9 15 14 0,0% 0,0% 1,4% 15,8% 4,9% -0,1%Hydro 2 2 2 3 5 5 5 0,3% 0,1% 5,2% 3,0% 0,2% 0,3%Wind 0 0 0 7 18 34 59 n.s. n.s. n.s. 9,7% 6,5% 5,5%Solar 0 0 0 4 20 48 88 n.s. n.s. 44,5% 16,0% 9,5% 6,1%Other 0 0 0 0 0 0 0 n.s. n.s. n.s. n.s. 18,0% 15,1%
Total Final Consumption 2 (Mtoe) 52 58 67 68 75 79 86 1,0% 1,5% 0,1% 1,1% 0,4% 0,9%Coal 17 16 13 11 6 2 2 -0,9% -2,0% -1,8% -5,8% -8,2% -4,5%Oil 15 16 23 24 23 18 12 0,7% 3,9% 0,3% -0,5% -2,6% -3,6%Gas 0 1 2 2 4 5 5 5,6% 7,6% 2,2% 5,0% 2,8% -0,5%Electricity 12 16 18 19 27 37 51 3,0% 1,4% 0,5% 3,4% 3,4% 3,2%Heat 0 0 0 0 1 1 2 n.s. n.s. 21,0% 6,7% 5,8% 2,3%Biomass & Other 8 9 11 11 15 15 14 1,8% 1,3% 0,4% 3,2% -0,3% -0,2%Share of Renewables 3 (%) 16% 17% 16% 20% 29% 38% 47% 0,8% -0,5% 2,1% 3,9% 2,8% 2,1%
Industry (incl. non-energy use) 27 27 27 23 23 21 19 -0,1% 0,0% -1,7% 0,0% -0,8% -0,8%Coal 15 14 9 7 5 2 2 -0,4% -3,9% -2,4% -4,3% -7,1% -4,0%Oil 4 2 4 2 2 2 1 -5,3% 6,2% -6,7% -0,6% -1,6% -2,3%Gas 0 1 2 2 3 4 3 5,5% 8,0% 1,2% 3,9% 2,2% -0,5%Electricity 7 8 10 9 10 11 12 1,6% 2,0% -0,8% 1,1% 0,9% 0,4%Heat 0 0 0 0 0 0 0 n.s. n.s. n.s. n.s. n.s. n.s.Biomass & Other 1 2 2 2 3 2 1 1,3% 1,4% 0,9% 3,0% -2,8% -5,5%
Buildings 14 17 21 21 24 27 28 2,2% 2,3% 0,2% 1,1% 1,2% 0,5%Coal 2 1 3 3 1 0 0 -4,6% 8,2% -0,2% -10,4% -15,5% -15,8%Oil 1 1 1 1 1 0 0 1,6% 7,1% -6,6% -3,0% -1,2% -0,1%Gas 0 0 0 0 1 1 1 8,2% -4,9% 27,1% 11,7% 4,8% -0,5%Electricity 4 7 7 9 12 17 20 5,1% 0,8% 1,7% 3,5% 2,9% 2,1%Heat 0 0 0 0 1 1 2 n.s. n.s. 21,0% 6,7% 5,8% 2,3%Biomass & Other 6 8 9 8 8 7 4 1,9% 1,3% -1,0% 0,4% -1,8% -4,7%
Agriculture 1 1 2 2 2 3 3 1,5% 1,0% 1,6% 2,4% 1,6% 1,2%Coal 0 0 0 0 0 0 0 3,3% -0,3% -0,8% -5,0% -7,5% -7,5%Oil 1 1 1 1 1 1 1 1,6% -0,3% 1,7% -1,1% -3,4% -3,8%Gas 0 0 0 0 0 0 0 n.s. n.s. n.s. n.s. n.s. n.s.Electricity 0 0 1 1 1 1 2 0,8% 4,5% 1,3% 4,2% 3,4% 2,4%Heat 0 0 0 0 0 0 0 n.s. n.s. n.s. n.s. n.s. n.s.Biomass & Other 0 0 0 0 0 1 1 n.s. n.s. n.s. 46,8% 8,0% 3,1%
Transport 10 13 17 22 27 28 36 2,2% 3,3% 2,3% 2,0% 0,5% 2,4%Coal 0 0 0 0 0 0 0 n.s. n.s. n.s. n.s. n.s. n.s.Oil 10 12 17 20 20 15 10 2,2% 3,5% 1,7% -0,3% -2,7% -3,8%Gas 0 0 0 0 0 0 0 n.s. n.s. n.s. n.s. n.s. n.s.Electricity 0 0 0 0 3 8 17 2,9% -4,0% 4,6% 20,7% 10,1% 7,9%Heat 0 0 0 0 0 0 0 n.s. n.s. n.s. n.s. n.s. n.s.Biomass & Other 0 0 0 1 4 5 8 n.s. n.s. n.s. 13,7% 2,7% 4,8%
Energy Branch Consumption 2 3 3 3 4 5 7 2,1% 1,0% 0,8% 2,4% 2,4% 2,4%Other Transformation & Losses 4 21 36 53 56 70 83 101 5,5% 3,9% 0,5% 2,3% 1,8% 1,9%
2 does not include international aviation and maritime bunkers; includes non-energy uses3 ratio of renewable energy over final energy demand increased by distribution losses and self consumption of electricity and steam plants4 includes statistical differences
122

GECO2015 Global Mitigation 150504 SUMMARY GHG & ENERGY BALANCE##### 100
Mediterranean Middle East 1990 2000 2010 2020 2030 2040 2050 '90-'00 '00-'10 '10-'20 '20-'30 '30-'40 '40-'50Main Economic Indicators
Population (Million) 25 33 43 52 59 65 70 2,8% 2,7% 2,0% 1,3% 1,0% 0,8%GDP per capita (ppp, k$'05) 6 8 9 10 13 16 21 2,8% 1,3% 0,9% 2,5% 2,7% 2,6%GDP per capita (mer, k$'05) 4 5 6 7 8 11 14 2,9% 1,0% 1,1% 2,5% 2,7% 2,6%Share Value Added - Agriculture (%) 6 3 1 2 2 2 2 -4,6% -13,2% 10,5% -1,1% -0,9% -0,7%Share Value Added - Industry (%) 6 8 10 12 12 11 11 2,7% 2,5% 2,1% -0,3% -0,4% -0,5%Share Value Added - Services (%) 89 89 89 86 86 87 87 0,0% 0,1% -0,4% 0,1% 0,1% 0,1%
PricesInternational/Regional ($'05/boe)
Coal 16 7 20 24 26 28 32 -7,7% 10,7% 1,6% 0,7% 1,0% 1,3%Oil 33 32 72 96 103 104 74 -0,2% 8,3% 2,9% 0,7% 0,1% -3,3%Gas 28 24 48 38 39 36 29 -1,2% 6,9% -2,1% 0,1% -0,7% -2,3%
GHG emissions (Mt CO2 eq.)Total GHG (excl. LULUCF) 106 167 201 220 209 158 90 4,7% 1,9% 0,9% -0,5% -2,7% -5,5%CO2 87 142 172 189 184 138 78 5,0% 2,0% 0,9% -0,3% -2,9% -5,5%CH4 12 17 19 18 17 15 11 4,1% 0,8% -0,4% -0,7% -1,1% -3,2%N2O 6 6 7 8 7 5 1 0,8% 1,3% 1,3% -2,3% -2,6% -13,9%F gases 1 1 3 4 1 0 0 3,4% 6,5% 3,0% -17,5% -6,0% -5,4%Total GHG from Energy and Industry 98 158 190 207 197 148 87 4,9% 1,9% 0,9% -0,5% -2,8% -5,2%CO2 Emissions from Fuel Comb. 83 134 163 179 173 126 69 4,9% 2,0% 0,9% -0,3% -3,1% -5,9%
Power generation/District heating 29 59 88 105 102 68 29 7,3% 4,1% 1,8% -0,3% -3,9% -8,1%Industry 8 14 16 14 17 17 16 5,3% 1,0% -1,1% 2,0% 0,1% -0,8%Buildings 14 18 19 14 14 13 9 2,4% 0,8% -3,1% -0,4% -0,9% -3,2%Agriculture 1 1 2 2 2 1 1 3,9% 2,5% 4,3% -1,9% -3,6% -3,7%Transport 20 30 32 37 32 23 14 4,0% 0,5% 1,4% -1,3% -3,5% -4,5%Other 10 11 7 7 6 4 - 1 1,2% -4,1% -0,4% -1,3% -3,8% n.s.
CO2 captured (CCS) 0 0 0 0 8 51 102 n.s. n.s. n.s. n.s. 20,2% 7,2%Coal 0 0 0 0 6 35 63 n.s. n.s. n.s. n.s. 19,0% 6,2%Gas 0 0 0 0 2 14 30 n.s. n.s. n.s. n.s. 21,9% 7,7%Biomass 0 0 0 0 0 2 9 n.s. n.s. n.s. n.s. 46,0% 17,0%
Energy Balance, by fuel (Mtoe)Primary Production 25 37 41 38 44 48 55 4,0% 1,0% -0,7% 1,4% 1,0% 1,4%
Coal 0 0 0 0 0 0 0 n.s. n.s. n.s. n.s. n.s. n.s.Oil 23 31 28 22 17 10 4 3,1% -0,7% -2,6% -2,3% -5,7% -7,6%Natural gas 2 5 10 10 14 16 17 13,1% 6,7% 0,3% 2,8% 1,7% 0,7%Biomass 0 0 1 3 4 4 3 3,0% 18,5% 14,2% 3,2% -0,2% -0,1%Nuclear1 0 0 0 0 2 5 9 n.s. n.s. n.s. 24,7% 9,4% 5,5%Hydro 0 0 0 0 0 0 0 1,5% -0,6% 0,2% 1,0% 0,6% 0,4%Other renewables 0 1 1 2 7 13 21 4,8% 6,8% 6,7% 10,2% 7,5% 4,5%
Net Imports 2 7 18 27 34 40 44Coal 2 7 8 14 13 16 17Oil 0 0 6 10 8 9 9Natural gas 0 0 5 4 11 10 12Biomass 0 0 0 0 1 3 5Biofuels 0 0 0 0 1 1 1Electricity 0 0 0 0 0 0 0
Primary Energy Demand2 27 44 59 65 77 88 99 4,8% 3,0% 1,0% 1,7% 1,3% 1,2%Coal 2 7 8 14 13 16 17 11,2% 1,5% 5,9% -0,2% 1,9% 0,7%Oil 23 31 34 32 25 19 13 3,1% 1,0% -0,8% -2,2% -2,9% -3,6%Natural gas 1 5 15 14 24 27 29 13,2% 11,0% -0,3% 5,5% 0,8% 1,0%Biomass 0 0 1 3 5 7 8 2,9% 18,5% 14,0% 6,2% 3,5% 2,3%Nuclear1 0 0 0 0 2 5 9 n.s. n.s. n.s. 24,7% 9,4% 5,5%Hydro 0 0 0 0 0 0 0 1,5% -0,6% 0,2% 1,0% 0,6% 0,4%Other renewables 0 1 1 2 7 13 21 4,8% 6,8% 6,7% 10,2% 7,5% 4,5%
Primary Energy Demand, by sector (Mtoe)Primary Energy Demand 27 44 59 65 77 88 99 4,8% 3,0% 1,0% 1,7% 1,3% 1,2%Energy for Power Generation 9 19 31 36 46 59 74 7,0% 5,1% 1,7% 2,5% 2,4% 2,3%Other Transformation & Losses 5 8 11 14 21 30 41 5,0% 3,6% 2,2% 4,1% 3,5% 3,3%Energy Branch Consumption 2 2 2 2 3 3 3 3,7% 1,3% 0,1% 0,8% 0,5% 0,9%Final consumption 18 29 37 41 48 55 61 5,0% 2,5% 0,9% 1,7% 1,3% 1,1%
Steel, Non-Met. Minerals and Chem. 0 1 1 1 1 1 1 17,7% -1,1% -0,6% 0,7% 0,7% 0,6%Other Industry 3 4 6 6 9 11 14 2,6% 3,3% 1,4% 3,0% 2,6% 2,1%Non-Energy Use 1 4 4 3 4 4 5 11,9% -0,6% -1,2% 1,6% 1,1% 0,3%Residential 3 6 8 8 9 11 12 6,3% 3,2% 0,2% 1,3% 1,5% 1,3%Services 4 4 6 6 8 10 12 2,3% 3,0% 0,3% 2,4% 2,1% 1,9%Agriculture 0 1 1 1 2 2 2 4,6% 3,1% 5,0% 1,8% 1,7% 1,6%Road 6 9 12 14 15 15 15 3,5% 3,3% 1,9% 0,9% -0,2% -0,1%Rail 0 0 0 0 0 0 0 n.s. n.s. n.s. n.s. n.s. n.s.Aviation 0 0 0 0 0 0 0 32,1% -12,3% 2,0% 3,2% 3,1% 1,6%Other Transport 0 0 0 0 0 0 0 n.s. 5,8% 1,2% 1,2% -0,2% -0,9%
1 Primary energy from nuclear is calculated considering the primary heat equivalent of the electricity produced with an average efficiency of 33%
123

GECO2015 Global Mitigation 150504 SUMMARY GHG & ENERGY BALANCE##### 100
Mediterranean Middle East 1990 2000 2010 2020 2030 2040 2050 '90-'00 '00-'10 '10-'20 '20-'30 '30-'40 '40-'50Power Generation
Fuel Inputs Therm. Power (Mtoe) 9 18 29 33 37 40 43 7,2% 5,1% 1,3% 1,2% 0,7% 0,9%Coal 2 6 7 13 12 15 16 10,6% 1,7% 5,8% -0,5% 1,8% 0,6%Oil 6 9 9 8 6 5 3 4,4% 0,1% -0,7% -3,6% -1,7% -4,0%Gas 1 2 13 11 18 18 22 13,8% 18,1% -1,3% 4,9% 0,0% 1,8%Biomass & Waste 0 0 0 1 1 2 3 n.s. n.s. 46,1% 5,8% 7,2% 3,2%Other 0 0 0 0 0 0 0 n.s. n.s. n.s. n.s. n.s. n.s.
Gross Elec. Generation (TWh e) 38 85 136 165 234 333 458 8,5% 4,8% 2,0% 3,5% 3,6% 3,2%Coal 10 29 34 63 60 71 75 10,9% 1,6% 6,2% -0,4% 1,6% 0,6%
of which CCS 0 0 0 0 7 40 74 n.s. n.s. n.s. n.s. 18,7% 6,4%Oil 21 42 40 36 25 21 14 7,1% -0,5% -1,0% -3,6% -1,8% -3,8%Gas 3 10 58 52 87 92 125 13,6% 19,1% -1,0% 5,2% 0,6% 3,1%
of which CCS 0 0 0 0 5 39 83 n.s. n.s. n.s. n.s. 21,8% 7,9%Biomass & Waste 0 0 0 2 4 9 14 n.s. n.s. n.s. 6,3% 7,7% 3,7%
of which CCS 0 0 0 0 0 1 5 n.s. n.s. n.s. n.s. n.s. 14,3%Nuclear 0 0 0 1 9 21 36 n.s. n.s. n.s. 24,8% 9,3% 5,5%Hydro 3 4 4 4 4 4 4 1,5% -0,6% 0,2% 1,0% 0,6% 0,4%Wind 0 0 0 5 28 59 82 11,6% 16,8% n.s. 19,8% 7,6% 3,3%Solar 0 0 0 3 16 55 106 n.s. n.s. 25,8% 20,4% 13,1% 6,7%Other 0 0 0 0 0 0 2 n.s. n.s. n.s. 45,1% 20,4% 17,1%
Generation Capacity (GWe) 11 21 27 39 60 93 145 6,4% 2,9% 3,7% 4,4% 4,5% 4,5%Coal 2 4 5 10 11 10 11 7,8% 1,2% 7,0% 1,3% -0,7% 0,8%
of which CCS 0 0 0 0 1 5 11 n.s. n.s. n.s. n.s. 18,6% 7,4%Oil 7 10 6 6 5 4 4 3,4% -5,0% 0,9% -2,4% -3,1% -0,2%Gas 1 5 15 18 19 15 21 17,3% 12,3% 1,8% 0,5% -2,5% 3,9%
of which CCS 0 0 0 0 1 5 12 n.s. n.s. n.s. n.s. 21,9% 9,1%Biomass & Waste 0 0 0 0 1 1 2 n.s. n.s. n.s. 6,3% 7,4% 3,7%
of which CCS 0 0 0 0 0 0 1 n.s. n.s. n.s. n.s. n.s. 14,3%Nuclear 0 0 0 0 1 3 5 n.s. n.s. n.s. 24,6% 9,1% 5,2%Hydro 1 2 2 2 2 2 2 4,6% -2,0% 0,1% 1,1% 0,6% 0,4%Wind 0 0 0 2 12 25 35 n.s. 18,1% n.s. 19,9% 7,7% 3,4%Solar 0 0 0 2 10 33 64 n.s. n.s. 24,8% 20,3% 13,0% 6,7%Other 0 0 0 0 0 0 0 n.s. n.s. n.s. n.s. 19,9% 16,6%
Total Final Consumption 2 (Mtoe) 18 29 37 41 48 55 61 5,0% 2,5% 0,9% 1,7% 1,3% 1,1%Coal 0 0 0 0 1 1 2 30,2% 4,0% 7,9% 6,8% 2,6% 2,3%Oil 14 20 24 23 19 14 10 3,5% 2,0% -0,6% -1,6% -3,1% -3,1%Gas 1 3 2 3 6 8 7 12,8% -3,6% 4,1% 7,9% 3,1% -1,0%Electricity 3 6 10 12 17 24 34 8,4% 4,8% 2,1% 3,6% 3,8% 3,3%Heat 0 1 1 2 3 4 5 4,8% 6,6% 3,9% 3,8% 2,9% 2,9%Biomass & Other 0 0 0 2 3 4 4 2,9% 12,8% 13,7% 6,3% 2,7% 0,7%Share of Renewables 3 (%) 4% 4% 5% 11% 20% 31% 40% -0,8% 3,1% 7,0% 6,4% 4,6% 2,3%
Industry (incl. non-energy use) 5 9 10 11 14 17 20 7,2% 1,2% 0,3% 2,4% 2,0% 1,6%Coal 0 0 0 0 1 1 2 30,2% 4,0% 7,9% 6,8% 2,6% 2,3%Oil 4 5 6 5 5 4 4 3,1% 1,8% -2,2% -0,3% -1,1% -0,5%Gas 0 2 2 2 3 4 4 55,4% -3,6% 0,3% 5,8% 3,6% 0,5%Electricity 1 2 3 4 5 7 9 7,3% 3,7% 2,9% 3,2% 3,3% 3,3%Heat 0 0 0 0 0 0 0 n.s. n.s. n.s. n.s. n.s. n.s.Biomass & Other 0 0 0 0 0 1 0 n.s. n.s. n.s. 0,6% 3,9% -1,4%
Buildings 7 10 14 14 17 21 24 4,4% 3,1% 0,3% 1,8% 1,8% 1,6%Coal 0 0 0 0 0 0 0 n.s. n.s. n.s. n.s. n.s. n.s.Oil 4 5 6 4 2 1 1 3,4% 0,9% -4,6% -4,9% -5,4% -3,7%Gas 1 0 0 1 3 4 3 -9,1% -4,0% 18,3% 10,6% 2,6% -3,0%Electricity 2 4 6 7 9 12 16 9,1% 5,4% 1,2% 2,0% 2,7% 3,0%Heat 0 1 1 2 3 4 5 4,8% 6,6% 3,9% 3,8% 2,9% 2,9%Biomass & Other 0 0 0 1 1 1 0 2,9% -0,5% 16,2% 2,0% -0,8% -7,4%
Agriculture 0 1 1 1 2 2 2 4,6% 3,1% 5,0% 1,8% 1,7% 1,6%Coal 0 0 0 0 0 0 0 n.s. n.s. n.s. n.s. n.s. n.s.Oil 0 0 0 1 1 0 0 3,9% 2,5% 4,3% -1,9% -3,6% -3,7%Gas 0 0 0 0 0 0 0 n.s. n.s. n.s. n.s. n.s. n.s.Electricity 0 0 0 1 1 1 1 5,8% 3,9% 6,0% 3,1% 3,0% 2,6%Heat 0 0 0 0 0 0 0 n.s. n.s. n.s. n.s. n.s. n.s.Biomass & Other 0 0 0 0 0 0 1 n.s. n.s. n.s. 44,0% 7,7% 3,2%
Transport 6 9 12 14 16 15 15 3,7% 3,0% 1,9% 0,9% -0,2% 0,0%Coal 0 0 0 0 0 0 0 n.s. n.s. n.s. n.s. n.s. n.s.Oil 6 9 12 13 12 8 5 3,7% 2,7% 1,4% -1,3% -3,5% -4,6%Gas 0 0 0 0 0 0 0 n.s. n.s. n.s. n.s. n.s. n.s.Electricity 0 0 0 0 2 5 7 n.s. n.s. 28,9% 22,0% 8,1% 4,1%Heat 0 0 0 0 0 0 0 n.s. n.s. n.s. n.s. n.s. n.s.Biomass & Other 0 0 0 1 2 2 3 n.s. n.s. 7,6% 9,8% 3,0% 2,3%
Energy Branch Consumption 2 2 2 2 3 3 3 3,7% 1,3% 0,1% 0,8% 0,5% 0,9%Other Transformation & Losses 4 5 8 11 14 21 30 41 5,0% 3,6% 2,2% 4,1% 3,5% 3,3%
2 does not include international aviation and maritime bunkers; includes non-energy uses3 ratio of renewable energy over final energy demand increased by distribution losses and self consumption of electricity and steam plants4 includes statistical differences
124

GECO2015 Global Mitigation 150504 SUMMARY GHG & ENERGY BALANCE##### 100
Persian Gulf Countries 1990 2000 2010 2020 2030 2040 2050 '90-'00 '00-'10 '10-'20 '20-'30 '30-'40 '40-'50Main Economic Indicators
Population (Million) 109 137 174 209 240 267 290 2,3% 2,4% 1,9% 1,4% 1,1% 0,8%GDP per capita (ppp, k$'05) 10 11 13 15 20 24 28 1,0% 2,3% 1,5% 2,5% 2,0% 1,3%GDP per capita (mer, k$'05) 4 5 6 7 9 11 13 1,4% 2,2% 1,7% 2,5% 2,0% 1,3%Share Value Added - Agriculture (%) 9 6 1 1 1 1 0 -5,1% -15,7% -5,7% -0,7% -0,4% -0,3%Share Value Added - Industry (%) 42 49 50 50 48 46 45 1,5% 0,1% 0,1% -0,4% -0,4% -0,3%Share Value Added - Services (%) 48 45 49 49 51 53 55 -0,7% 0,9% -0,1% 0,4% 0,4% 0,3%
PricesInternational/Regional ($'05/boe)
Coal 16 7 20 24 26 28 32 -7,7% 10,7% 1,6% 0,7% 1,0% 1,3%Oil 33 32 72 96 103 104 74 -0,2% 8,3% 2,9% 0,7% 0,1% -3,3%Gas 28 24 48 38 39 36 29 -1,2% 6,9% -2,1% 0,1% -0,7% -2,3%
GHG emissions (Mt CO2 eq.)Total GHG (excl. LULUCF) 745 1 175 1 956 2 239 1 978 1 577 968 4,7% 5,2% 1,4% -1,2% -2,2% -4,8%CO2 562 927 1 608 1 893 1 679 1 313 791 5,1% 5,7% 1,6% -1,2% -2,4% -4,9%CH4 143 206 304 295 261 232 165 3,7% 4,0% -0,3% -1,2% -1,2% -3,3%N2O 31 38 39 45 34 29 10 2,1% 0,2% 1,4% -2,6% -1,7% -10,1%F gases 9 4 6 6 4 3 2 -7,9% 3,6% 0,8% -5,1% -3,4% -2,1%Total GHG from Energy and Industry 697 1 119 1 896 2 170 1 914 1 519 940 4,9% 5,4% 1,4% -1,2% -2,3% -4,7%CO2 Emissions from Fuel Comb. 529 879 1 497 1 739 1 491 1 110 623 5,2% 5,5% 1,5% -1,5% -2,9% -5,6%
Power generation/District heating 151 271 513 536 490 294 89 6,0% 6,6% 0,4% -0,9% -5,0% -11,2%Industry 117 168 308 408 363 343 244 3,7% 6,3% 2,9% -1,2% -0,6% -3,4%Buildings 54 105 146 156 112 82 46 7,0% 3,3% 0,7% -3,2% -3,1% -5,5%Agriculture 13 12 16 18 14 10 6 -0,1% 2,8% 1,1% -2,4% -3,8% -4,1%Transport 129 189 308 356 283 204 114 3,9% 5,0% 1,5% -2,3% -3,2% -5,6%Other 65 135 206 263 228 178 123 7,5% 4,3% 2,5% -1,4% -2,5% -3,6%
CO2 captured (CCS) 0 0 0 0 78 339 580 n.s. n.s. n.s. n.s. 15,9% 5,5%Coal 0 0 0 0 4 43 109 n.s. n.s. n.s. n.s. 26,2% 9,7%Gas 0 0 0 0 74 265 323 n.s. n.s. n.s. n.s. 13,7% 2,0%Biomass 0 0 0 0 0 31 148 n.s. n.s. n.s. 5,6% n.s. 16,9%
Energy Balance, by fuel (Mtoe)Primary Production 919 1 302 1 618 2 124 2 290 2 401 1 872 3,5% 2,2% 2,8% 0,8% 0,5% -2,5%
Coal 1 1 1 0 0 0 0 3,6% -1,4% -7,6% n.s. n.s. n.s.Oil 843 1 140 1 242 1 549 1 464 1 440 1 051 3,1% 0,9% 2,2% -0,6% -0,2% -3,1%Natural gas 75 161 372 563 768 859 681 7,9% 8,7% 4,2% 3,2% 1,1% -2,3%Biomass 0 0 2 8 47 68 74 -2,3% 24,5% 15,8% 19,2% 3,6% 0,8%Nuclear1 0 0 0 1 3 6 9 n.s. n.s. n.s. 6,1% 7,9% 4,9%Hydro 1 0 1 2 2 2 2 -6,9% 12,9% 3,3% 2,2% 0,9% 0,8%Other renewables 0 0 0 0 6 27 55 n.s. 42,1% 7,6% 38,4% 16,7% 7,5%
Net Imports - 719 - 969 -1 046 -1 431 -1 603 -1 691 -1 184Coal 0 1 2 4 9 20 34Oil - 715 - 953 - 968 -1 276 -1 251 -1 261 - 922Natural gas - 4 - 16 - 79 - 157 - 358 - 458 - 335Biomass 0 0 0 0 - 3 7 37Biofuels 0 0 0 0 0 2 3Electricity 0 0 0 0 0 0 0
Primary Energy Demand2 201 334 572 693 687 710 688 5,2% 5,5% 1,9% -0,1% 0,3% -0,3%Coal 1 1 2 4 9 20 34 10,8% 4,2% 6,3% 8,4% 8,0% 5,7%Oil 128 187 274 273 213 178 128 3,9% 3,9% -0,1% -2,4% -1,8% -3,2%Natural gas 72 145 293 406 411 401 346 7,3% 7,3% 3,3% 0,1% -0,2% -1,5%Biomass 0 0 2 8 44 75 111 -2,3% 24,5% 15,1% 19,0% 5,5% 4,0%Nuclear1 0 0 0 1 3 6 9 n.s. n.s. n.s. 6,1% 7,9% 4,9%Hydro 1 0 1 2 2 2 2 -6,9% 12,9% 3,3% 2,2% 0,9% 0,8%Other renewables 0 0 0 0 6 27 55 n.s. 42,1% 7,6% 38,4% 16,7% 7,5%
Primary Energy Demand, by sector (Mtoe)Primary Energy Demand 201 334 572 693 687 710 688 5,2% 5,5% 1,9% -0,1% 0,3% -0,3%Energy for Power Generation 57 102 193 212 233 269 299 6,0% 6,6% 1,0% 0,9% 1,5% 1,0%Other Transformation & Losses 20 36 56 82 107 138 170 5,7% 4,6% 3,8% 2,7% 2,6% 2,1%Energy Branch Consumption 21 42 73 96 95 93 83 7,2% 5,6% 2,9% -0,1% -0,2% -1,1%Final consumption 134 213 367 461 447 463 454 4,7% 5,6% 2,3% -0,3% 0,4% -0,2%
Steel, Non-Met. Minerals and Chem. 4 8 18 22 19 19 17 7,9% 9,0% 2,2% -1,5% -0,1% -0,9%Other Industry 36 52 87 118 122 135 141 3,7% 5,3% 3,1% 0,3% 1,1% 0,4%Non-Energy Use 18 27 57 77 81 91 93 3,9% 7,8% 3,1% 0,6% 1,1% 0,2%Residential 21 44 72 85 73 71 68 7,5% 5,0% 1,7% -1,4% -0,3% -0,5%Services 8 15 24 31 36 42 46 6,4% 5,3% 2,5% 1,4% 1,5% 0,9%Agriculture 4 5 8 10 11 13 14 1,1% 4,5% 2,2% 1,7% 1,3% 1,1%Road 43 63 101 117 104 92 75 3,9% 4,9% 1,5% -1,2% -1,2% -2,0%Rail 0 0 0 0 0 0 0 n.s. 36,9% 2,0% 2,4% 1,8% 1,1%Aviation 1 1 1 1 1 1 0 2,0% 1,2% 1,2% -2,5% -0,4% -2,0%Other Transport 0 1 0 0 0 0 0 n.s. -30,1% -0,9% -0,4% -1,4% -2,4%
1 Primary energy from nuclear is calculated considering the primary heat equivalent of the electricity produced with an average efficiency of 33%
125

GECO2015 Global Mitigation 150504 SUMMARY GHG & ENERGY BALANCE##### 100
Persian Gulf Countries 1990 2000 2010 2020 2030 2040 2050 '90-'00 '00-'10 '10-'20 '20-'30 '30-'40 '40-'50Power Generation
Fuel Inputs Therm. Power (Mtoe) 56 101 192 209 222 235 232 6,1% 6,6% 0,9% 0,6% 0,5% -0,1%Coal 0 0 0 1 3 7 11 22,3% -3,1% 18,8% 15,7% 10,1% 4,9%Oil 24 41 77 56 42 37 19 5,3% 6,6% -3,1% -3,0% -1,1% -6,3%Gas 32 61 115 152 174 175 169 6,6% 6,6% 2,8% 1,3% 0,1% -0,3%Biomass & Waste 0 0 0 0 4 15 32 n.s. n.s. 50,3% 45,1% 13,9% 7,7%Other 0 0 0 0 0 0 0 n.s. n.s. n.s. n.s. n.s. n.s.
Gross Elec. Generation (TWh e) 202 380 748 1 012 1 220 1 535 1 877 6,5% 7,0% 3,1% 1,9% 2,3% 2,0%Coal 0 0 0 3 13 33 54 22,2% -3,1% 23,8% 15,7% 9,8% 5,1%
of which CCS 0 0 0 0 4 25 54 n.s. n.s. n.s. n.s. 21,1% 8,0%Oil 91 153 246 235 174 156 84 5,3% 4,9% -0,4% -3,0% -1,1% -6,0%Gas 103 222 486 745 916 989 1 006 8,0% 8,1% 4,4% 2,1% 0,8% 0,2%
of which CCS 0 0 0 0 156 590 766 n.s. n.s. n.s. n.s. 14,2% 2,6%Biomass & Waste 0 0 0 0 19 73 158 n.s. n.s. n.s. 46,1% 14,1% 8,1%
of which CCS 0 0 0 0 0 32 114 n.s. n.s. n.s. n.s. n.s. 13,7%Nuclear 0 0 0 6 10 21 31 n.s. n.s. n.s. 6,3% 7,2% 4,1%Hydro 9 4 14 20 24 27 29 -6,9% 12,9% 3,3% 2,2% 0,9% 0,8%Wind 0 0 0 1 33 107 204 n.s. 18,5% 17,2% 42,0% 12,4% 6,7%Solar 0 0 1 2 29 130 309 n.s. n.s. 4,4% 33,8% 16,0% 9,1%Other 0 0 0 0 0 0 2 n.s. n.s. n.s. 55,2% 19,3% 17,0%
Generation Capacity (GWe) 68 99 186 236 282 359 532 3,8% 6,5% 2,4% 1,8% 2,4% 4,0%Coal 0 0 0 0 2 4 7 n.s. n.s. n.s. 15,9% 9,4% 5,3%
of which CCS 0 0 0 0 0 3 7 n.s. n.s. n.s. n.s. 20,8% 8,2%Oil 32 39 64 71 51 43 31 2,0% 5,1% 1,1% -3,2% -1,7% -3,2%Gas 33 55 110 149 177 159 182 5,4% 7,2% 3,0% 1,7% -1,0% 1,4%
of which CCS 0 0 0 0 20 75 109 n.s. n.s. n.s. n.s. 14,2% 3,8%Biomass & Waste 0 0 0 0 3 10 21 n.s. n.s. n.s. 46,4% 13,7% 8,1%
of which CCS 0 0 0 0 0 4 15 n.s. n.s. n.s. n.s. n.s. 13,7%Nuclear 0 0 0 1 2 3 5 n.s. n.s. n.s. 6,1% 7,0% 3,9%Hydro 4 5 11 14 17 19 21 2,5% 9,1% 2,5% 2,2% 0,9% 0,8%Wind 0 0 0 0 14 43 82 n.s. n.s. 15,9% 41,7% 12,3% 6,6%Solar 0 0 1 1 17 77 184 n.s. n.s. 5,0% 35,0% 16,0% 9,1%Other 0 0 0 0 0 0 0 n.s. n.s. n.s. n.s. 18,8% 16,5%
Total Final Consumption 2 (Mtoe) 134 213 367 461 447 463 454 4,7% 5,6% 2,3% -0,3% 0,4% -0,2%Coal 0 1 1 3 5 11 20 6,4% 6,1% 6,2% 7,2% 7,5% 6,4%Oil 92 129 188 214 179 155 125 3,5% 3,8% 1,3% -1,8% -1,4% -2,1%Gas 28 57 125 167 146 133 97 7,5% 8,2% 3,0% -1,4% -0,9% -3,1%Electricity 14 26 51 69 83 105 130 6,4% 7,0% 3,0% 1,9% 2,4% 2,2%Heat 0 0 0 0 0 7 11 n.s. n.s. n.s. n.s. 33,6% 5,5%Biomass & Other 0 0 1 8 35 53 70 -2,3% 18,9% 21,4% 15,5% 4,4% 2,8%Share of Renewables 3 (%) 1% 0% 1% 2% 11% 21% 35% -9,7% 10,1% 9,5% 19,0% 7,1% 5,1%
Industry (incl. non-energy use) 58 86 161 217 222 245 251 4,1% 6,5% 3,0% 0,2% 1,0% 0,2%Coal 0 1 1 3 5 11 20 6,2% 6,3% 6,2% 7,3% 7,5% 6,4%Oil 30 42 66 76 72 78 82 3,5% 4,6% 1,5% -0,6% 0,8% 0,5%Gas 25 38 85 121 111 108 83 4,4% 8,3% 3,7% -0,9% -0,2% -2,6%Electricity 3 5 9 14 17 21 26 7,2% 6,5% 4,3% 1,9% 2,2% 1,9%Heat 0 0 0 0 0 0 0 n.s. n.s. n.s. n.s. n.s. n.s.Biomass & Other 0 0 0 2 17 27 41 n.s. n.s. n.s. 21,8% 4,9% 4,0%
Buildings 29 58 96 116 109 113 113 7,2% 5,1% 1,9% -0,6% 0,3% 0,0%Coal 0 0 0 0 0 0 0 n.s. -7,3% -2,0% -13,4% n.s. n.s.Oil 15 19 17 16 10 8 5 2,6% -1,5% -0,6% -4,4% -2,6% -4,7%Gas 3 19 40 45 34 25 13 21,5% 7,8% 1,4% -2,7% -3,3% -5,9%Electricity 11 20 39 50 55 63 76 6,1% 7,0% 2,5% 0,9% 1,5% 1,8%Heat 0 0 0 0 0 7 11 n.s. n.s. n.s. n.s. 33,6% 5,5%Biomass & Other 0 0 0 4 10 11 8 -2,3% 6,0% 28,0% 8,1% 0,9% -2,4%
Agriculture 4 5 8 10 11 13 14 1,1% 4,5% 2,2% 1,7% 1,3% 1,1%Coal 0 0 0 0 0 0 0 n.s. n.s. n.s. n.s. n.s. n.s.Oil 4 4 5 5 4 3 2 -0,1% 2,3% 1,0% -2,4% -3,9% -4,2%Gas 0 0 0 0 0 0 0 n.s. n.s. 1,5% -1,3% -2,4% -2,7%Electricity 0 1 2 4 5 6 8 8,1% 9,3% 4,2% 2,8% 2,7% 2,2%Heat 0 0 0 0 0 0 0 n.s. n.s. n.s. n.s. n.s. n.s.Biomass & Other 0 0 0 0 2 3 5 n.s. n.s. n.s. 46,5% 6,4% 2,6%
Transport 43 64 102 118 105 92 75 4,0% 4,8% 1,5% -1,2% -1,2% -2,0%Coal 0 0 0 0 0 0 0 n.s. n.s. n.s. n.s. n.s. n.s.Oil 43 64 101 117 93 67 37 4,0% 4,7% 1,5% -2,3% -3,2% -5,6%Gas 0 0 0 0 0 0 0 n.s. n.s. n.s. n.s. n.s. n.s.Electricity 0 0 0 0 6 14 21 n.s. 37,9% 31,0% 30,4% 9,1% 4,2%Heat 0 0 0 0 0 0 0 n.s. n.s. n.s. n.s. n.s. n.s.Biomass & Other 0 0 1 1 6 12 17 n.s. n.s. 5,4% 16,3% 6,6% 3,6%
Energy Branch Consumption 21 42 73 96 95 93 83 7,2% 5,6% 2,9% -0,1% -0,2% -1,1%Other Transformation & Losses 4 20 36 56 82 107 138 170 5,7% 4,6% 3,8% 2,7% 2,6% 2,1%
2 does not include international aviation and maritime bunkers; includes non-energy uses3 ratio of renewable energy over final energy demand increased by distribution losses and self consumption of electricity and steam plants4 includes statistical differences
126

References BGR (German Federal Institute for Geosciences and Natural Resources) (2013). Energy Study 2013. Reserves, resources and availability of energy resources. 112 p. Hannover. Available on (15-05-2014): http://www.bgr.bund.de/EN/Themen/Energie/Downloads/energiestudie_2013_en.pdf?__blob=publicationFile&v=2
BP (2014). Statistical Review of World Energy 2014. Available on (15-05-2015): http://www.bp.com/en/global/corporate/about-bp/energy-economics/statistical-review-of-world-energy.html
Dellink, R., Lanzi, E., Chateau, J., Bosello, F., Parrado, R., de Bruin, K. (2014). “Consequences of Climate Change Damages for Economic Growth: A Dynamic Quantitative Assessment”, OECD Economics Department Working Papers, No. 1135, OECD Publishing. http://dx.doi.org/10.1787/5jz2bxb8kmf3-en
EC (2013). EU Energy, Transport and GHG emissions Trends to 2050, Reference Scenario 2013. DG for Energy, DG for Climate Action and DG for Mobility and Transport. Available on (07-07-2014): http://ec.europa.eu/energy/observatory/trends_2030/doc/trends_to_2050_update_2013.pdf
EC JRC (Joint Research Centre) (2014a). Emissions Database for Global Atmospheric Research (EDGAR), v4.2 and v4.2 FT2010. Available on (accessed on 11-07-2014): http://edgar.jrc.ec.europa.eu/
EC JRC (Joint Research Centre) (2014b). ETRI 2014 Energy Technology Reference Indicator projections for 2010-2050. Report EUR 26950 EN. ISBN 978-92-79-44403-6. doi: 10.2790/057687
Enerdata (2014). Global Energy & CO2 Data. Available on (09-2014): http://globaldata.enerdata.net/global-energy/database/
EIA (US Energy Information Administration) (2014). Petroleum and other liquids. Data, Spot prices. Available on (accessed 09-2014): http://www.eia.gov/dnav/pet/pet_pri_spt_s1_d.htm
FAO (Food and Agriculture Organisation of the United Nations) (2014). FAOSTAT Emissions Land Use database. Database available on (11-07-2014): http://faostat3.fao.org/faostat-gateway/go/to/home/E
IEA (International Energy Agency) (2014). IEA online energy statistics. Database available on (09-2014): http://www.iea.org/statistics/
IMF (2014). World Economic Outlook - Recovery strengthens, Remains Uneven, April 2014. Database available on (accessed on 07-07-2014): http://www.imf.org/external/pubs/ft/weo/2014/01/weodata/index.aspx
Labat, A., Kitous, A., Perry, M., Saveyn, B., Vandyck, T., and Vrontisi, Z. (2015). GECO2015. Global Energy and Climate Outlook. Road to Paris. JRC Scientific and Policy Reports, EUR 27239 EN. ISBN 978-92-79-48233-5 (PDF). doi:10.2791/198028
127
NREL (National Renewable Energy Laboratory) (2013). Global CFDDA-based Onshore and Offshore Wind Potential Supply Curves by Country, Class, and Depth (quantities in GW and PWh). DOE Opendata, OpenEI.
Available on (15-05-2015): http://en.openei.org/datasets/dataset/global-cfdda-based-onshore-and-offshore-wind-potential-supply-curves-by-country-class-and-depth-q
OECD (Organisation for Economic Co-operation and Development) (2013). Economic Outlook No 93, Long term Baseline Projections, June 2013. Database available on (07-07-2014): http://stats.oecd.org/Index.aspx?DataSetCode=EO95_LTB
OECD (2014). Uranium 2014: Resources, Production and Demand. A Joint Report by the OECD Nuclear Energy Agency and the International Atomic Energy Agency. © OECD 2014, NEA No. 7209 Available on (04-2015): https://www.oecd-nea.org/ndd/pubs/2014/7209-uranium-2014.pdf
Pietzcker, R.C., Stetter, D., Manger, S., Luderer, G. (2014). Using the sun to decarbonize the power sector: The economic potential of photovoltaics and concentrating solar power. Applied Energy 135, 704–720. doi:10.1016/j.apenergy.2014.08.011
UN (United Nations) (2013). Department of Economic and Social Affairs, Population Division. World Population Prospects: The 2012 Revision. Data available on (24-03-2015): http://esa.un.org/wpp/Excel-Data/population.htm
UNFCCC (United Nations Framework Convention on Climate Change) (2014). Greenhouse Gas Inventory Data, Flexible Queries. Database available on (accessed on 11-07-2014): http://unfccc.int/di/FlexibleQueries.do
USGS (US Geological Survey) (2013). World Petroleum Assessment. Available on (24-03-2015): http://energy.usgs.gov/OilGas/AssessmentsData/WorldPetroleumAssessment.aspx and http://pubs.usgs.gov/dds/dds-069/dds-069-ff/
World Bank (2014). World data bank, World development indicators. Available on (07-07-2014): http://databank.worldbank.org/data/views/reports/tableview.aspx
WEC (World Energy Council) (2013a). World Energy Resources: 2013 Survey. ISBN: 978 0 946121 29 8. Available on (15-05-2015): http://www.worldenergy.org/data/resources/resource/coal/
WEC (2013b). World Energy Perspective, Cost of Energy Technologies: 2013 Survey. ISBN: 978 0 94612 130 4. Available on (15-05-2015): http://www.worldenergy.org/publications/2013/world-energy-perspective-cost-of-energy-technologies/
128

Europe Direct is a service to help you find answers to your questions about the European Union
Freephone number (*): 00 800 6 7 8 9 10 11
(*) Certain mobile telephone operators do not allow access to 00 800 numbers or these calls may be billed.
A great deal of additional information on the European Union is available on the Internet.
It can be accessed through the Europa server http://europa.eu.
How to obtain EU publications
Our publications are available from EU Bookshop (http://bookshop.europa.eu),
where you can place an order with the sales agent of your choice.
The Publications Office has a worldwide network of sales agents.
You can obtain their contact details by sending a fax to (352) 29 29-42758.
European Commission
EUR 27242 EN – Joint Research Centre – Institute for Prospective Technological Studies
Title: GECO2015. GHG and energy balances
Author: Alban Kitous
Luxembourg: Publications Office of the European Union
2015– 128pp. – 21.0 x 29.7 cm
EUR – Scientific and Technical Research series – ISSN 1831-9424 (online)
ISBN 978-92-79-48245-8 (PDF)
doi:10.2791/72487

JRC Mission As the Commission’s in-house science service, the Joint Research Centre’s mission is to provide EU policies with independent, evidence-based scientific and technical support throughout the whole policy cycle. Working in close cooperation with policy Directorates-General, the JRC addresses key societal challenges while stimulating innovation through developing new methods, tools and standards, and sharing its know-how with the Member States, the scientific community and international partners.
Serving society Stimulating innovation Supporting legislation
LF-NA
-27
24
2-E
N-N
ISBN 978-92-79-48245-8
doi:10.2791/72487