geared for change: energy efficiency in canada's commercial building sector
DESCRIPTION
A report by the National Round Table on the Environment and the EconomyTRANSCRIPT

GEARED FOR CHANGEENERGY EFFICIENCY IN CANADA’S COMMERCIAL BUILDING SECTOR
A report by the National Round Table on the Environment and the Economy and
Sustainable Development Technology Canada

© National Round Table on the Environment and the Economyand Sustainable Development Technology Canada 2009
All rights reserved. No part of this work covered by the copyright herein may be reproduced or used in any form or by any means – graphic, electronic or mechanical, including photocopying, recording, taping or information retrieval systems – without the prior written permission of the publisher.
Library and Archives Canada Cataloguing in Publication
Geared for Change: Energy Efficiency in Canada’s Commercial Building Sector.
Text in English and French on inverted pages.
Title on added t.p. : Dans l’engrenage du changement: Efficacité énergétique dans le secteur des bâtiments commerciaux du Canada.
Report prepared by the National Round Table on the Environment and the Economy and Sustainable Development Technology Canada.
Design by Le Collectif
ISBN 978-0-662-06382-7
Cat. no.: En134-42/2008
1. Commercial building--Energy consumption--Canada. 2. Energy policy--Canada. 3. Greenhouse gas mitigation--Government policy--Canada. I. National Round Table on the Environment and the Economy (Canada).II. Sustainable Development Technology Canada.III. Title: Geared for Change: Energy Efficiency in Canada’s Commercial Building Sector.
TJ163.5 B84 E53 2008 333.79'6890971 C2008-980392-2E
National Round Table on the Environment and the Economy
344 Slater Street, Suite 200 Tel.: (613) 992-7189Ottawa, Ontario Fax: (613) 992-7385Canada K1R 7Y3 E-mail: [email protected]
WWW.NRTEE-TRNEE.CA
Sustainable Development Technology Canada
45 O’Connor Street, Suite 1850 Tel.: (613) 234-6313Ottawa, Ontario Fax: (613) 234-0303Canada K1P 1A4
WWW.SDTC.CA
Disclaimer: The views expressed in this document do not necessarily represent
those of the organizations with which individual Round Table and SDTC
members are associated or otherwise employed.

As Chair of the NRTEE, I am pleased to introduce Geared for Change: Energy Efficiency in Canada’s Commercial Building Sector, which presents a viable carbon emission and energy efficiency policy pathway for the commercial building sector.
This report is the culmination of a collaborative research project undertaken by the NRTEE and Sustainable Development Technology Canada (SDTC), and was based on a perceived need for sound policy targeted at increasing energy efficiency in the commercial building sector. By capitalizing on the policy and technology knowledge and expertise of the NRTEE and SDTC in the development of the report, we conclude that it is possible to achieve substantial emissions reductions from this sector.
Our conclusions are the product of our own research and the informed input that we received from Canadians. This report provides clear policy recommendations for the Government of Canada in addressing Canada’s emission reduction targets for 2050 and is consistent with our other reports on this target. As energy consumption in existing commercial buildings and demand for new buildings continues to increase, it is clear that the adoption and implementation of a comprehensive policy pathway for energy efficiency is crucial for Canada’s success in reducing carbon emissions and energy use from this major economic sector.
For Canada to meet its deep, long-term emission reduction targets, every sector of the economy must do its share. Geared for Change provides, for the first time, a detailed analysis that will help governments make the right policy choices enabling the commercial building sector to deploy the technologies necessary to achieve substantial energy efficiency gains and make a real contribution to Canada’s climate policy goals.
Combining SDTC’s technology and market expertise with the NRTEE’s policy advisory role and convening authority, we have together generated a comprehensive path forward for the federal government to bring about significant energy efficiency achievements in Canada’s commercial building sector. Through original economic modeling, extensive stakeholder consultation, and national and international policies assessment, this report sets out a clear energy efficiency policy pathway for Canada, to ensure this important economic sector contributes strongly to greenhouse gas emission reductions and moves us all towards a cleaner, healthier environment.
DAVID McLAUGHLINNRTEE PRESIDENT AND CEO
BOB PAGE, Ph.D.NRTEE CHAIR
messages

Canada has the potential to lead the way in reducing the environmental footprint of its growing commercial building sector. Across the country, energy efficient technologies that could make a real difference by reducing both costs and greenhouse gas emissions are being developed, although they face many obstacles on the path to industry-wide adoption.
Sustainable Development Technology Canada (SDTC) funds promising energy efficient technologies in their development and demonstration stages to help them make it to the market. However, funding alone is not enough. There also needs to be strong commitment by all levels of government and concrete, sector-specific action to make sure that these technologies are adopted. The result will be that Canadians can enjoy the significant environmental and economic benefits that they bring.
Conveying this message to policy makers is crucial and requires input from key players working on all aspects of the environmental sector. By collaborating to write this report, SDTC and the NRTEE built on each other’s expertise to determine the steps that must be taken by governments to establish and implement a policy pathway for energy efficiency in the commercial building sector. SDTC’s SD Business Case™ on Eco-Efficiency in Commercial Buildings, released in November 2007, established the industry’s vision for the future and the technical and non-technical needs that should be fulfilled in order to achieve this vision. Teaming up with the NRTEE allowed the technical information contained in the report to be taken one step further. It contributed to the development of concrete recommendations that will be made directly to policy makers, which SDTC could not have done alone.
These recommendations, if followed, would ensure that municipal, provincial and federal governments take targeted actions to reduce the environmental impacts of the commercial building sector, which contributes to 13% of the country’s carbon emissions. Also, they would ensure that the technological solutions that exist in Canada to reduce these emissions are adopted and their environmental benefits maximized. This will reduce the cost of business within office buildings, hospitals and schools, just to name a few.
Strong policy is needed to pull through ready and waiting technology.
VICKY SHARPESDTC PRESIDENT AND CEO

Table of ConTenTs
EXECUTIVE SUMMARY
1.0 INTRODUCTION 1
1.1 Background1.2 The SDTC-NRTEE Partnership1.3 Purpose1.4 Project Scope1.5 Research Process
2.0 COMMERCIAL BUILDING SECTOR PROFILE 11
2.1 Market Profile2.2 Market Drivers for Energy Efficiency2.3 Energy Consumption2.4 Carbon Emissions and Electricity Use2.5 Government Jurisdiction for Commercial Buildings
3.0 BARRIERS TO INVESTMENT IN ENERGY EFFICIENCY 21
3.1 Energy Efficiency Potential3.2 Energy Efficiency Technology Adoption Barriers 3.2.1 Risk Management 3.2.2 Information Gaps 3.2.3 The Commercial Building Value Chain and the Principal-Agent Relationship 3.2.4 First-mover Disadvantage 3.2.5 Market Price Signals 3.2.6 Institutional and Regulatory Barriers3.3 Summary of Investment Barriers
4.0 ENERGY EFFICIENCY POLICIES AND EVALUATION 31
4.1 Market-wide Price Signals4.2 Command and Control Regulations 4.2.1 Building Energy Codes 4.2.2 Minimum Energy Performance Standards (MEPS) 4.2.3 Mandatory Energy Labelling 4.2.4 Mandatory Energy Performance for Public Buildings4.3 Subsidies 4.3.1 Capital and Fiscal Incentives 4.3.2 Research, Development and Commercialization (RD&C) Strategies 4.3.3 Public Education and Skills Training4.4 Voluntary Actions 4.4.1 Information and Performance 4.4.2 Building Commissioning4.5 Policy Evaluation Summary

5.0 INTERNATIONAL POLICY TRENDS 47
5.1 Japan5.2 The European Union (EU)5.3 Australia5.4 The United States (US) 5.4.1 Federal Initiatives 5.4.2 State and Municipal Initiatives5.5 Common Factors across Regions
6.0 POLICY MODELLING ANALYSIS 55
6.1 Baseline and Reference Cases6.2 Carbon Price Scenario6.3 Complementary Policies Scenario6.4 Combined Scenario6.5 Regulatory Scenario
7.0 POLICY RECOMMENDATIONS 65
8.0 POLICY PATHWAY 73
9.0 ENDNOTES 77
10.0 APPENDIX 85
10.1 The National Round Table on the Environment and the Economy: About Us10.2 NRTEE Members10.3 Sustainable Development Technology Canada: About Us10.4 SDTC Board of Directors10.5 Energy Efficiency in Canada’s Commercial Building Sector: Program Participants
11.0 POLICY PATHWAY DIAGRAM 93

geaReD foR CHange
WHY COMMERCIAL BUILDINGS ?WHAT DID WE FIND ?WHAT DID WE CONCLUDE ?WHAT DID WE LEARN ? WHAT DO WE RECOMMEND ?


GHG
Canada’s commercial building sector is a significant energy user and producer of carbon emissions. It accounts for 14% of end-use energy consumption and 13% of the country’s carbon emissions. Energy efficient technologies exist that could reduce costs to businesses and consumers while reducing the environmental impact of this major economic sector. But these technologies are not being taken up, with the result that energy use and carbon emissions continue to grow.
Climate policy makers need to consider not just long-term national greenhouse gas (GHG) reduction targets, but specific policies and actions on a sector-by-sector basis to get the deep emission reductions already set by the Government of Canada. To be successful in reducing GHG emissions and helping to address climate change, Canada must move from national-level policy approaches to detailed sectoral policy pathways. As each sector of the Canadian economy contributes its own unique share of national emissions, adopting such an approach will help identify the issues, characteristics, and barriers that must be addressed to implement sustainable and effective climate policy plans.
For the first time, such a sectoral approach has been undertaken. The National Round Table on the Environment and the Economy (NRTEE) and Sustainable Development Technology Canada (SDTC) collaborated to develop a viable carbon emission and energy efficiency policy pathway for use in the commercial buildings sector by federal government decision makers. It addresses specific technology adoption barriers that prevent energy efficiency technologies from being instituted, tests the feasibility of applying specific emission reduction target sets to one sector of the Canadian economy and how they can be attained, and recommends focused policy instruments to achieve them. This report sets the stage for the collaborative research project undertaken by the two organizations, linking NRTEE’s policy advisory role and convening power with SDTC’s proven “clean tech” expertise and market knowledge.
In 2006, the NRTEE published a report on long-term energy use in Canada, stating that energy efficiency measures should be used to reduce carbon emissions from the commercial sector by 58% below the projected business-as-usual scenario in 2050, a target of 53 megatonnes of CO
2 emissions per year by 2050.a In 2007, SDTC released a business case report on commercial
buildings stating an industry vision for the sector of reducing emissions to 36 Mt CO2e in
2030.b These targets must be achieved in a context where the population is increasing and greater stress is being placed on buildings and energy infrastructures. Statistics Canada estimates that Canada’s population will increase by 10 million people between now and 2050, and it can be assumed that Canadians will continue to expect efficient, reliable, and affordable energy resources.
In order to achieve reduction targets for carbon emissions and energy use in commercial buildings as the population and the economy grow, future communities will have greater emphasis on achieving efficiency for systems as a whole, and on creating systems that are more adaptable and resilient. Energy efficiency will be maximized and smaller-scale urban energy systems located closer to and within buildings will be used. Clustered, higher density, self-reliant, mixed-use developments will help to achieve a more efficient, accessible, and affordable use of energy. Building performance will be high, and occupants will enjoy better quality air and work spaces.
a NRTEE (2006). Advice on a Long-term Strategy on Energy and Climate Change. NRTEE: Ottawa.b SDTC (2007). SD Business Case™: Eco-Efficiency in Commercial Buildings. SDTC: Ottawa.
Canada’s commercial building sector is a significant energy user and producer of carbon emissions. It accounts for 14% of end-use energy consumption and 13% of the country’s carbon emissions.
WHY COMMERCIAL
BUILDINGS?

GHG

We found a sector that is fragmented and diverse, growing and innovating, with energy efficiency technologies that can help in efforts to reduce emissions, but with technology adoption barriers embedded. Economic growth and population growth will continue to increase demand for energy in existing commercial buildings and for new buildings in Canada. As the economy becomes more service-oriented and knowledge-based, workers are moving from industrial facilities to office buildings, adding to the challenge of achieving deep absolute emissions reductions from the commercial sector.
Between 1990 and 2005, energy consumption increased by 25% and carbon emissions increased by 27% in the sector. Between 1990 and 2003, energy intensity increased from 1.69 gigajoules per square meter to 1.84 GJ/m2, but by 2005 it decreased to 1.62 GJ/m2, indicating improvement in recent years. Key drivers affecting energy use and related emissions included population and economic growth, extreme temperatures, and energy prices. Space heating is the primary use of energy for the sector; however, electricity consumption from auxiliary equipment is on the rise.
Canada’s commercial building sector is complex and includes a variety of building types, ranging from offices to hospitals and schools. Stakeholder groups are equally diverse, ranging from investors, builders, engineers and architects, to real estate agents, tenants, and building operators. All levels of government are involved in a complex partnership around urban design issues. The federal government is often part of policy design, whereas provincial, territorial and municipal governments tend to implement and enforce policy instruments. Further adding to the complexity of the sector is the fact that educators such as schools of architecture and engineering have an impact on how policy instruments are implemented by practitioners. The resulting fragmented supply chain and regulatory framework make it clear that a single carbon emission reduction policy is insufficient; that a policy package made up of a number of programs and instruments is required.
Energy efficiency in commercial buildings touches the responsibility of all levels of government in Canada. This multi-jurisdictional governing framework makes it difficult in turn for developers and owners to stay abreast of applicable policies and available resources regarding energy efficiency.
Other barriers to technology adoption identified in this report range from issues related to risk management, information gaps, complexities in the commercial building value chain, financial costs related to being the first mover in the market, energy pricing that does not account for environmental externalities, and institutional and regulatory barriers caused by existing policy frameworks.
Energy efficiency in commercial buildings touches the responsibility of all levels of government in Canada.
WHAT DID WE FIND
?

GHG

Our national and international research, direct stakeholder consultation, and original
economic modelling concluded that by incorporating a market-wide carbon price signal
and mandating high efficiency performance standards for all new and existing commercial
buildings in Canada, it will be possible to reach the target of 53 Mt CO2 emissions per year by
2050 or 66% below business-as-usual levels set by the NRTEE in 2006. The industry vision of
achieving 36 Mt CO2e/year by 2030, or 50% below 2007 levels identified by SDTC in 2007 will
require stringent regulations and significant commitment from the industry, but is not an
impossible goal.
Based on the examination of four different policy scenarios we conducted, no one measure on
its own is sufficient to wring the necessary emission reductions from the sector and achieve
our targets. This includes a carbon price, regulations, subsidies, voluntary measures and
information programs. The most effective is a combination of the first two—a carbon price
coupled with increasingly stringent regulations—but with the application of focused technol-
ogy subsidies or incentives.
Energy efficiency has an important role to play in reducing energy consumption, thus reduc-
ing both strains on existing utility infrastructures and carbon emissions. Policies that target
an increased use of renewable energy, cogeneration, and on-site energy generation will also
be important for achieving maximum emissions reductions from commercial buildings.
Strong government leadership, multi-jurisdictional engagement, and a performance-based
accountability framework linked to monitoring and evaluation will be factors for successful
implementation. The Government of Canada will have to take an assertive position on energy
efficiency in commercial buildings; work with provinces, territories, and municipalities; and
dedicate resources to develop a more integrated strategy aimed at achieving absolute emis-
sions reductions from this sector. But it is doable.
... by incorporating a market-wide carbon price signal and mandating high efficiency performance standards for all new and existingcommercial buildings in Canada, it will be possible to reach thetarget of 53 Mt CO
2 emissions per year by 2050 or 66% below
business-as-usual levels set by the NRTEE in 2006.
WHaT DID We ConClUDe
?

GHG

There is no one “silver bullet” policy for achieving deep absolute emissions reductions
from energy efficiency in the commercial sector. Energy efficiency policy success in other
global regions has been achieved by maximizing the synergistic impacts of groups of policies
rather than one policy instrument on its own. Command and control regulatory policies are
effective in the commercial sector, but need supporting information programs and price sig-
nals. Whenever subsidies are implemented, issues related to free ridership and the rebound
effect need to be taken into account in program design.
A silo-based approach to energy policy that considers buildings separate from urban form,
transportation infrastructure, and the communities they operate within will not
maximize energy solutions in the long term. Similarly, energy pricing policies that only
address the environmental costs of carbon-intensive energy forms will not capture broader
costs to society in the long term. In order to achieve absolute emissions reductions, the scope
of policy measures included in this report needs to be expanded to include renewable energy,
cogeneration of energy, and on-site energy generation equipment where possible. New
practices in policy development related to community-level design practices and energy
pricing will be required to achieve deep absolute reductions with minimal social costs
from commercial buildings.
Policy instruments may have differing levels of priority across regions and commercial
building sub-sectors. Due to the fact that sources of electricity generation vary across the
country, some provinces/ territories may be more or less motivated to improve the efficiency
of their electricity use for the purpose of reducing GHG emissions. Also, because public
institutions often have different investment motivators from those for privately-owned build-
ings, some policies may be more effective in certain sub-sectors. A more detailed analysis on
program design will help to identify where these differences lie and how to address them.
Energy efficiency policy monitoring and evaluation needs to be improved in Canada. It
can ensure that policies remain dynamic and up-to-date for maximum performance and
relevant to current market characteristics. Post-implementation evaluations of energy policy
have been inconsistent in Canada. More transparent and higher quality data collection is re-
quired to provide a baseline for comparison and to elaborate the monitoring and evaluation
procedures for policy impacts. Increased stringency in policy monitoring and evaluation is
required to show the non-energy benefits of policy such as reductions in GHG emissions and
indoor air quality.
Policy certainty is required in order for industry to increase investment in energy
efficiency. Especially in the retrofitting of existing buildings, significant investment is
required in order to update inefficient technologies and improve the energy intensity of the
building. Policy certainty regarding impending regulations or the application of a carbon
price signal is required to allow the industry time to make the investments and to reduce the
risk of non-compliance. Without this certainty, incentive to invest is clearly diminished.
Greater integration between government departments and levels in Canada needs to take
place to leverage resources and increase symmetry across provincial/territorial borders. Streamlined processes would facilitate domestic trade and manufacturing for industry. Infor-
mation sharing across borders would alleviate some of the burden from governments related
to researching best practices and developing new curricula for practitioners. The federal
government has a role to play in providing integrated information resources for industry that
simplify standards and processes for energy efficiency. The NRTEE-SDTC collaboration for this
project was an effective example of leveraging resources and sharing information and could
be used as a model for other government departments and agencies.
WHaT DID We leaRn
?

GHG

Research conducted to examine the effectiveness of policy instruments in terms of decreasing
energy use and carbon emissions while minimizing economic costs leads to our recommenda-
tion of a comprehensive policy package to increase energy efficiency in Canada’s commercial
building sector. This package consists of a range of instruments from each of the following
policy types:
The NRTEE and SDTC jointly recommend our research and report to the federal government
as advice for considering the adoption and implementation of a policy pathway for energy
efficiency in Canada’s commercial building sector.
WHaT Do We ReCommenD
?
Applying a market-wide price signal for effective and cost-efficient emission
reductions from the sector, especially when complemented by other policy
instruments.
Adopting specific command and control regulations including codes, minimum
performance standards, and mandatory energy labelling, which we found to be
the most effective policy instruments for increasing energy efficiency in com-
mercial buildings due to their cost-effectiveness and their high impact on emis-
sions reductions.
Targeting subsidies where appropriate, such as capital and fiscal incentives,
technology funds, and funding for educational programs and skills development.
All can be effective to a certain degree depending upon design. Subsidies should
be non-technology specific so they do not act as barriers to innovation, they
should account for issues related to free ridership and the rebound effect, and
should be closely monitored and evaluated so they can be updated or removed
when appropriate.
Utilizing information programs to drive voluntary actions can be cost-efficient and
have lasting impacts on energy use and emissions reductions; however, their direct
impacts are often very difficult to quantify. They should be used to complement
other policy instruments set out above, rather than act on their own.
1
2
3
4

1
InTRoDUCTIon
1.1 BACKGROUND1.2 THE SDTC-NRTEE PARTNERSHIP1.3 PURPOSE1.4 PROJECT SCOPE1.5 RESEARCH PROCESS

2
1.0
3
1.0 INTRODUCTION
1.1 baCKgRoUnD
Nearly half a million commercial and institutional buildings in Canada provide the spaces for our education, healthcare, government, and business services. But they also consume significant amounts of energy and produce significant amounts of carbon emissions, and are too often constructed to inefficient standards. Despite the availability of technologies to increase the energy efficiency of Canada’s commercial and institutional buildings, their adoption has been limited. Research demonstrates significant energy efficiency potential from existing technology in the commercial building sector. However, industry consultation reveals that other, non-technical barriers exist that prevent the uptake of this technology. As a result, these buildings operate with energy efficiency well below what is possible. It is time for a Canadian policy agenda that promotes energy efficiency in commercial and institutional buildings in order to reduce energy use and carbon emissions, and to provide economic benefits to building owners and tenants.
Key organizations worldwide are recognizing the potential for buildings to contribute to lowering energy consumption and carbon emissions.
The • Intergovernmental Panel on Climate Change (IPCC) dedicated a chapter to residential and commercial buildings in its 2007 report, noting that energy efficiency “encompasses the most diverse, largest and most cost-effective mitigation opportunities in buildings.”1
The • Commission for Environmental Cooperation (CEC) released a North American report in spring 2008 revealing that buildings (including both commercial and residential) are responsible for 33% of all energy used and 35% of greenhouse (GHG) emissions in Canada.2
The • World Business Council for Sustainable Development (WBCSD) has initiated a project dedicated to Energy Efficiency in Buildings: Business realities and opportunities.3 It recognizes that commercial buildings represent 13% of the world’s energy demand and despite the availability of new technologies and practices to increase energy efficiency, few are being implemented to scale.
Within Canada, the need for an enhanced climate change policy agenda including energy efficiency was recognized by the Government of Canada in April 2007 in its Turning the Corner Plan4 and its Regulatory Framework for Air Emissions5. The actions contained within these plans commit Canada to GHG emission reduction targets of 60%-70% below 2006 levels by 2050, and to increased stringency of minimum energy performance standards for select energy-using products and indoor air quality standards.
The Council of Energy Ministers recognizes that economic growth will continue to put upward pressure on the demand for energy in commercial buildings. In 2007, ministers agreed that energy efficiency and conservation have the potential to reduce energy demand in Canada by an amount equal to almost 25% of today’s energy use by 2030.6 The Council states that:
“Governments can play a vital role in advancing energy efficiency, as investors in programs that stimulate actions, and as policymakers and regulators who help shape the marketplace and reduce barriers to action.”7
Despite the availability of technologies to increase the energyefficiency of Canada’s commercial and institutional buildings, their adoption has been limited.

4
Despite widespread recognition that energy efficiency has the potential to greatly reduce energy use and related emissions, a comprehensive policy roadmap has yet to be developed for the Government of Canada. There is a need for a comprehensive set of long-term, action-oriented recommendations for achieving the emission reduction target of the commercial building sector. This report identifies a policy package for advancing energy efficiency in the commercial building sector by identifying and addressing technology adoption barriers, and provides long-term analysis for policy makers of the sector’s potential impacts on carbon emissions. The policy recommendations focus on end use emissions, rather than those generated from energy production.
This report provides a high-level analysis of the effectiveness of policy instruments in promoting energy efficiency in commercial buildings, and offers direction for establishing a long-term strategic plan for emissions reductions from the sector. It does not contain a full cost-benefit analysis of all policy recommendations and does not outline the details of program design for their implementation. If adopted, the recommendations contained in this report will result in long-term policy certainty for industry, which is crucial for making investment decisions. The following information is included in this report in order to develop a realistic and achievable policy pathway:
• The current energy performance of the sector;• The main drivers for and barriers against investment in energy efficiency;• Best practices for monitoring and evaluating energy efficiency policies;• International trends in energy efficiency policy development; and,• Recommendations for the Government of Canada to increase the energy performance of commercial buildings.
1.2 THe sDTC-nRTee PaRTneRsHIP
Sustainable Development Technology Canada (SDTC) and the National Round Table on the Environment and the Economy (NRTEE) have collaborated to recommend a long-term policy framework with specific, sequenced steps for advancing energy efficiency in Canada’s commercial buildings. This is the first collaboration between the two organizations and is indicative of a growing need to break down government silos in order to successfully meet the climate policy challenge. The work contained in this report builds on past research by the two organizations and provides joint recommendations for federal policies to increase the uptake of energy efficiency technology in the commercial building sector.
The NRTEE was established in 1988 by the federal government “to play the role of catalyst in identifying, explaining and promoting, in all sectors of Canadian society and in all regions of Canada, principles and practices of sustainable development.”8 It has evolved as a credible organization for government policy recommendations related to climate change due to its ability to balance and integrate diverse stakeholder perspectives based on objective research. The SDTC Technology Fund was established in 2001 to act as the primary catalyst in building a sustainable development technology infrastructure in Canada. To date, SDTC and its partners have invested over $1 billion in the Canadian clean-tech market, giving it the financial presence to drive real and significant gains in the market.
There is a need for a comprehensive set of long-term, action-oriented recommendations for achieving the emission reduction target of the commercial building sector.

5
The top-line, business-as-usual (BAU) scenario for the commercial building sector was 127 MtCO
2/year in 2050 and the emissions reduction target set for the commercial sector was
58% below BAU, i.e. 53 MtCO2/year in 2050. 10 The breakdown of emissions reductions was
outlined as follows:
• 22% from existing building retrofits and energy management; • 20% from integrated building systems for energy efficiency in new buildings; and,• 16% from electrical efficiency in lighting and equipment.
The NRTEE recommended that further research be done to examine the feasibility of developing and implementing new policies for each sector to achieve reduction targets. This report represents the first sector-level study conducted to test the findings of the 2006 publication.
In 2007 the NRTEE released its report Getting to 2050: Canada’s Transition to a Low-emission Future, which recommends that a carbon price signal be applied in Canada to achieve the government’s emissions reductions targets. Findings from the report indicate that other market failures and barriers reduce responsiveness to price signals in the building sector, and therefore complementary policies and regulatory measures are required in order to reach its emission reduction potential. This conclusion instigated the development of this report.
FIGURE 1
NRTEE GHG Reduction Wedge Diagram9
In 2006, the NRTEE released a report titled Advice on a Long-term Strategy on Energy and Climate Change. The report’s objective was to analyze the feasibility of the government’s commitment to reduce GHG emissions by 60% below 2006 levels by 2050. It identified energy efficiency as a key “wedge” for achieving reduction targets, as shown in Figure 1.
TARGET
ENERGY INTENSITY
CARBON CAPTURE
URBAN FORM
NUCLEAR
COGENERATION
BIOFUELS AND FUELS
RESIDUAL
RENEWABLE ELECTRICITY
ENERGY EFF. AND CONSERVATION
2005 2010 2015 2020 2025 2030 2035 2040 2045 2050
YEAR
1,400
1,200
1,000
800
600
400
200
0ME
GAT
ON
ES
CO
2 E
MIS
SIO
NS
(M
tCO
2e)

6
Based on the fact that this report stems from the intention to gauge the feasibility of the 2050 Government of Canada targets and the sectoral projections identified by the NRTEE in 2006, the target referenced in the proceeding sections is 53 MtCO
2e per year by 2050. However, the
aggressive industry vision identified by SDTC is not overlooked, and this report also assesses the impact of public policy on achieving it.
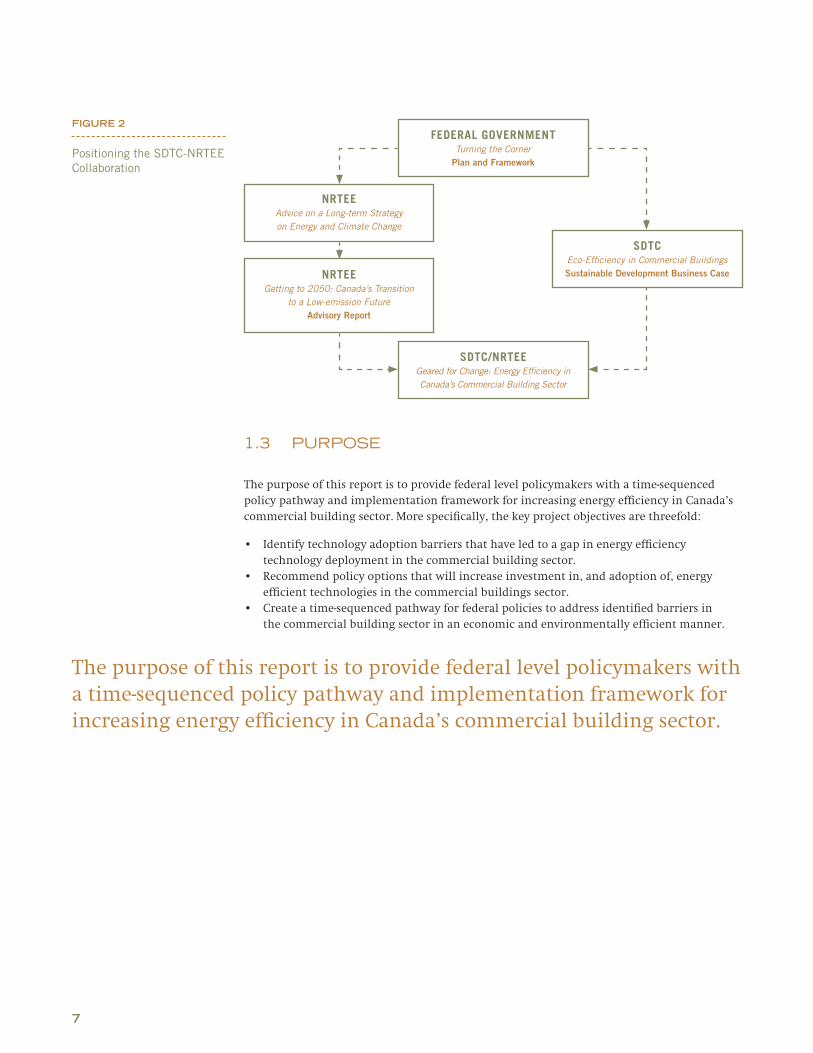
Figure 2 illustrates how this report reinforces past research by the two organizations and will fill a gap in sector level policy recommendations to increase technology uptake and reduce carbon emissions from commercial buildings.
TABLE 1
Non-technical Needs for Increasing Eco-efficiency in Commercial Buildings
SDTC released the fifth in a series of SD Business Case™ reports in fall 2007 on investment priorities for sustainable technologies in commercial buildings. The Eco-Efficiency in Commercial Buildings report highlights where investments should be made in emerging sustainable technologies in the commercial sector. An industry vision was developed based on stakeholder consultation, including a target of 35.7 MtCO
2e/year in 2030. The model
projection for the BAU referenced by SDTC was 109.7 MtCO2e/year in 2030; therefore, the
industry vision indicated a possible reduction of 74 MtCO2e/year (68%) below the BAU
scenario by 2030.
The SDTC report also identifies a number of critical non-technology issues and market barriers that need to be addressed. These relate to the need for supportive policies, codes and standards, and methods of practice that will help the financial community make more informed investment decisions, and help Canada achieve its economic and environmental objectives. The needs identified by the 2007 SD Business Case™ are listed in Table 1 and they serve as a starting point for the research and analysis in this report.
Price on carbon
Integrated supply chain
Integrated building practices
Improved building code and greater enforcement
Continuous reporting
Information exchange
Sustainability ethic in education
7
1.3 PURPose
The purpose of this report is to provide federal level policymakers with a time-sequenced policy pathway and implementation framework for increasing energy efficiency in Canada’s commercial building sector. More specifically, the key project objectives are threefold:
Identify technology adoption barriers that have led to a gap in energy efficiency • technology deployment in the commercial building sector.
Recommend policy options that will increase investment in, and adoption of, energy • efficient technologies in the commercial buildings sector.
Create a time-sequenced pathway for federal policies to address identified barriers in • the commercial building sector in an economic and environmentally efficient manner.
The purpose of this report is to provide federal level policymakers with a time-sequenced policy pathway and implementation framework for increasing energy efficiency in Canada’s commercial building sector.
FIGURE 2
Positioning the SDTC-NRTEE Collaboration
FEDERAL GOVERNMENTTurning the Corner
Plan and Framework
NRTEEAdvice on a Long-term Strategy on Energy and Climate Change
SDTCEco-Efficiency in Commercial BuildingsSustainable Development Business Case NRTEE
Getting to 2050: Canada’s Transitionto a Low-emission Future
Advisory Report
SDTC/NRTEEGeared for Change: Energy Efficiency in Canada’s Commercial Building Sector

8
1.4 PRojeCT sCoPe
For this report, commercial buildings are defined as structures that are used, in all or in part, for activities focusing on the exchange of goods and/or services for a profit. Examples of commercial buildings are stores, office buildings, restaurants, hotels, stadiums and warehouses. Buildings in which 50% or more of floor space is devoted to commercial activities are considered commercial buildings.11
Institutional buildings are defined as structures that are used, in all or in part, for activities focusing on not-for-profit services in the public’s interest. Examples of institutional buildings are schools, hospitals, group foster homes, buildings used for religious worship and courthouses. Buildings in which 50% or more of floor space is devoted to institutional activities are considered institutional buildings.12
For the purposes of this report the term commercial buildings is used to refer to both commercial and institutional buildings. Buildings of all sizes are considered in the research, from both rural and urban environments. Industrial buildings and multi-unit residential buildings are excluded to remain consistent with the definition used by Natural Resources Canada (NRCan). The research and analysis contained in the report focuses on the energy consumption and carbon emissions generated during the operational life of the building since more than 80 percent of energy is consumed during this phase;13 construction and demolition phases of the life cycle are excluded. The primary focus for mitigation measures in this report is on energy efficiency, rather than on cogeneration, on-site energy generation, and renewable energy.
The public policy instruments referred to in this report are deliberate acts to use regulatory, non-regulatory, and financial instruments to influence consumer and industry behaviours in order to achieve greater energy efficiency. The scope of the research contained in this report is limited to exploring policies that will influence the wider use of existing technologies in the commercial sector. It does not attempt to provide a full cost-benefit analysis of each policy instrument, but uses secondary research, stakeholder consultation, and original modelling to support recommendations. Specific program design based on such analysis falls outside the scope of this report.

9
FIGURE 3
Context for the Project Scope
Figure 3 illustrates how the report focuses on the federal government’s role within a broader context. Environmental and market conditions drive the need for energy efficiency policies at all levels of government, each with different governing roles. Industry drivers are highlighted as different from the government ones, meaning that in order for policies to effectively change industry behaviour they must appeal to the primary motives of the individual companies and firms that are affected.
• CEO Values• Internal skills• Shareholders• Competition• ROI/ Profitability• Consumer preferences
• Climate change• Energy supply• Market competition• Technology availability• International trends
• Price signals• Command and control instruments• Subsidies• Promotion of voluntary actions

10
1.5 ReseaRCH PRoCess
The research and analysis feeding this report is based on four major components:
1. Stakeholder Consultation: An Expert Advisory Committee met three times during the course of the project to review research, test findings, and provide advice on the project objectives and recommendations. Individual stakeholder consultations were also used to inform the process. Among those, the Real Property Association of Canada (REALpac) convened a group of commercial real estate investors to provide recommendations and comments to the NRTEE and SDTC in July 2008.
2. Data Collection: Data was compiled from a number of sources including NRCan, Statistics Canada, SDTC, and a range of Canadian and international publications. They were used to develop assumptions about the anticipated policy impacts on energy efficiency in commercial buildings for the economic modelling component of the report.
3. Literature Reviews: Research was commissioned to examine best practices in energy efficiency policy evaluation, along with international trends in energy efficiency policy for buildings. The findings were derived from a review of government reports and statistics, reports from industry associations, academic papers, and recent media articles.
4. Economic Modelling: Stakeholder consultations and literature reviews were used to develop a list of policy options for original economic modelling. The purpose of the modelling was to forecast expected impacts of the policies on energy efficiency technology deployment in Canada’s commercial buildings under four scenarios:
• The effects of a carbon price on the sector;• The effects of the recommended policy measures on the sector;• The combined effects of the carbon price and the policy measures; and,• The combined effects of the carbon price and sector-wide performance regulations .
The following sections provide detailed information about the emissions generated by energy-using activities in the commercial building sector, as well as the barriers preventing adoption of energy efficient technologies, best practices for evaluating policies, and recommendations for federal policies in Canada.

CommeRCIal bUIlDIngseCToR PRofIle
2.1 MARKET PROFILE2.2 MARKET DRIVERS FOR ENERGY EFFICIENCY2.3 ENERGY CONSUMPTION2.4 CARBON EMISSIONS AND ELECTRICITY USE 2.5 GOVERNMENT JURISDICTION FOR COMMERCIAL BUILDINGS

2.0

13
2.0 COmmERCIAL BUILDING SECTOR PROFILE
The Commercial Building Sector Profile provides an overview of the commercial building market in Canada and is useful for understanding how energy is currently used, where carbon emissions are produced, past trends, and target areas for increasing efficiency. Between 1990 and 2005, energy use in the commercial and institutional building sector increased from 867 petajoules (PJ)c per year to 1159 PJ per year14, despite the availability of energy efficiency technologies. During the same time, carbon emissions from the sector increased from 47.7 to 65.3 Mt (including electricity-allocated emissions).15
Figure 4 illustrates the direct relationship between energy consumption and carbon emissions from 1990 to 2005. The increases are mainly attributable to an increase in the number of new buildings, growing auxiliary loads, higher occupant densities and sub-optimal building control. It is notable that by 2004-2005, energy consumption and carbon emissions began to decrease slightly. Several factors could be responsible for this decline including a decrease in the number of new buildings and/or an increase in the use of efficient technologies.
The Commercial Building sector exhibits a number of characteristics that make it a reasonable choice for a sectoral case study on building a policy pathway for Canada:
This sector shows significant potential for cost-effective emission reductions. • There are relatively few end-use decision makers in this market compared to the •
residential and transportation sectors. A manageable number of existing and well-understood technologies can be deployed over •
a wide geographic area using existing distribution channels.The impacts of performance improvements can be realized sooner and with greater •
public awareness than in other sectors (e.g., the Industrial Buildings sector).The sector lends itself to “policy leveraging,” meaning that a few strategically inserted •
policies can have multiple positive effects throughout the sector.
c A joule is the international unit of a measure of energy – the energy produced by the power of 1 watt flowing for a
second. There are 3.6 million joules in one kilowatt hour. One petajoule (PJ) equals 1 x 10¹⁵ joules and one gigajoule (GJ)
equals 1 x 10⁹ joules.
FIGURE 4
Commercial Building Carbon Emissions andEnergy Consumption(1990-2005)16
CO2 Emissions Energy Consumption
1991 1993 1995 1997 1999 2001 2003 2005
70
65
75
60
55
50
45
40
35
30
25
1200
1150
1100
1050
1000
950
900
850
800
PJ
MtC
O2e

14
2.1 maRKeT PRofIle
The majority of public data in Canada pertaining to energy use in the commercial building sector is collected and analyzed by NRCan’s Office of Energy Efficiency (OEE). The Commercial and Institutional Consumption of Energy Survey is conducted by NRCan and Statistics Canada, and is a key source of information on the sector. Its most recent version was released in June 2007 and includes statistics up to the year 2005. It states that as of 2005 there were 440, 863 commercial and institutional buildings in Canada, covering a floor space of 672 million square metres.
Table 2 highlights other key statistics from Canada’s commercial building sector that are pertinent for understanding the characteristics of the existing stock. These statistics help to determine emission mitigation potential from the sector and to develop effective policy instruments. Energy consumption refers to the absolute amount of energy consumed by the commercial building sector each year in joules. Energy intensity refers to the amount of energy used per unit of activity (e.g., floor space) per year.17
TABLE 2
Key National Commercial Building Statistics18,19
1,153 million PJAnnual energy consumption
in 2005
65.3 MtCO2eAnnual GHG emissions including
electricity in 2005
36.8 MtCO2e Annual GHG emissions excluding
electricity in 2005
1.54 GJ/m2/yearAverage energy intensity in 2005
$17.6 billionAnnual energy cost for Canada’s
commercial building sector
1.5%Annual growth of
new buildings
2% Annual rate of retrofits in existing buildings
$28.8 billion (up 22% from 2003)
Value of building permits 2007*
* Includes commercial, institutional, and governmental building permits.
The commercial building sector has been divided into thirteen sub-sectors for the purposes of the analysis contained in this report:
Transportation Services• Communication• Electric Utilities• Gas Utilities • Water and Other Utilities• Wholesale• Retail•
FIRE (Finance, Insurance & Real Estate)• Offices – Business Service• Education• Health and Social• Food, Lodging, Recreation• Government•

15
2.2 maRKeT DRIveRs foR eneRgY effICIenCY
Four primary drivers influence energy consumption and market characteristics for the commercial building sector in Canada.20
Population growth• is the single-largest influencer of energy consumption due to its impact on the number of new commercial and institutional buildings. Urbanization trends also impact building location and density.
Economic growth • patterns have increased demand for new buildings. Auxiliary equipment is linked to greater productivity and represents a key growth area for electrical consumption in commercial buildings. Global economic trends are moving Canada towards a service- and knowledge-based economy, which impacts the number and type of buildings constructed, as well as the quantity and type of energy-consuming equipment that is needed to support these new roles.
Extreme temperatures • in Canada’s northern climate result in drastic shifts for space cooling and heating requirements. Currently, there is a net demand for space heating in buildings; however, global warming could have implications for energy used in regulating the temperature of buildings over time.
Energy price• increases can provide incentives for improved energy efficiency; global price increases in natural gas are an example. Canadian electricity prices are less sensitive to global pricing. In some regions prices have been capped at artificially low levels below production costs, which negatively impacts investment in energy efficiency.
2.3 eneRgY ConsUmPTIon
Space heating accounts for over half of all energy used in Canada’s commercial buildings. Auxiliary equipment such as computers, printers, and other personal electronic devices is a growing source of energy consumption.d The major end-use energy activities for commercial buildings are included in the following list. Auxiliary equipment is included in the substitutable and non-substitutable loads categories.
Space heating• Space cooling• Water heating• Lighting• Refrigeration• Substitutable loads• e Non-Substitutable loads• f
d Auxiliary equipment consists of appliances plugged directly into an electrical outlet. They consume electricity and
give off heat, which places an additional load on air conditioning equipment. Computers account for about 55% of the
auxiliary load.
e Substitutable loads includes devices that can use another energy form other than electricity (i.e., gas stoves and dryers)
f Non-substitutable loads include devices that consume electricity and can’t readily use any other form of energy. This
end-use can be considered mainly “plug load” including other large electricity-consuming devices found in commercial
buildings, such as elevators.

16
Figure 5 illustrates the portion of energy consumed by each end-use activity. Approximately 85% of energy supplied to buildings is in the form of electricity and natural gas, as shown in Figure 6.
FIGURE 5
Commercial Building Energy Consumption by End Use21
FIGURE 6
Commercial Building Energy Consumption by Fuel Type22
SPACE HEATING, 51%
AIR CONDITIONING, 7%
LIGHTING, 8%
REFRIGERATION, 9%
WATER HEATING, 14%
ELECTRIC, 36%
LPG (LIQUIFIED PETROLEUM GAS), 2%
OIL, 10%
GAS, 52%
OTHER NON-SUBSTITUTABLES, 7%
OTHER SUBSTITUTABLES, 5%

17
Building age is an important factor for energy consumption because the energy intensity of buildings changes over time based on standards and available technologies. Figure 7 identifies changes in energy intensity of Canadian buildings over time and lists the number of buildings in the current stock for each construction period. It shows that 71% of Canada’s commercial buildings were constructed after 1970, and that those built post-2000 have the lowest energy intensity of any construction period,23 likely resulting from stringent standards and the availability of efficient technologies.
Policy program design should consider the fact that incorporating high efficiency technologies and design practices in new construction is often a more practical and affordable option than retrofitting an existing building. However, commercial building retrofits occur on average about every twenty years in order for building owners to maintain asset value and attract tenants, and each capital renewal point represents an opportunity to increase the energy efficiency of a building. Policy makers should consider this opportunity for installing efficient equipment in program design in order to avoid imposing premature retrofits that are not economically feasible for business owners.
FIGURE 7
Energy Intensity (GJ/m2/year) by Building Age24
Note that the number directly under each column denotes the number of buildings of each age group that currently exists in Canada.
1
20,584PRIOR
TO 1920
2
1.8
1.6
1.4
1.2
53,7151920 -1959
53,2311960 -1969
85,4081970 -1979
YEAR OF CONSTRUCTION
EN
ER
GY
INTE
NS
ITY
(GJ/
m2/Y
EA
R)
92,8601980 -1989
83,1251990 -1999
51,9392000 -2004

18
2.4 CaRbon emIssIons anD eleCTRICITY Use
The primary objective of this report is to identify a policy pathway for achieving the CO2
emission reduction target of 53 MtCO2 emissions per year by 2050 from the commercial
building sector. To do so, it is imperative to understand how carbon emissions are generated by the sector, and how they can be reduced with the incorporation of efficient technologies and design practices.
Carbon emissions from the commercial building sector are generated from a range of energy intensive operational activities, hence the correlation between energy efficiency and CO
2
emission mitigation. In 2006, carbon emissions from the commercial building sector were 60.4 Mt (including allocated electricity emissions).25 Of those, 33.6 Mt (56%) were from direct fuel use (for example, the on-site combustion of natural gas for space and water heating), while the balance of 26.8 Mt (44%) were allocated from the production of electricity.
This report accounts for both direct and allocated emissions in its modelling analysis and Figure 8 shows the amount of each by sub-sector. This figure also illustrates the breakdown of carbon emissions from commercial buildings by sub-sector. It shows that the FIRE (Finance, Insurance, and Real Estate) and Retail sub-sectors emit the highest quantities of CO
2 emissions
from the sector, followed by the Education sub-sector and the Food, Lodging and Recreation sub-sector. The utilities sub-sectors are the lowest emitters from the overall sector.
FIGURE 8
Direct and AllocatedEmissions by Sub-sector (2008)26
TRAN
SPORT
ATIO
N SER
VICE
S
COMMUNIC
ATIO
N
ELEC
TRIC
UTI
LITI
ES
GAS U
TILI
TIES
WATER
& O
THER
UTI
LITI
ES
WHOLESA
LE
RETAI
L
FIRE
(FIN
ANCE
, INSU
RANCE
AND R
EAL ES
TATE
)
OFFIC
ES -
BUSINES
S SE
RVICE
S
EDUCA
TION
HEALT
H & S
OCIAL
FOOD, L
ODGING, R
ECREA
TION
GOVERNMEN
T
20
DIRECT
15
10
5
Mt
CO
2e
ALLOCATED

19
Figure 9 illustrates the breakdown of electricity generation by fuel type across the country. Due to the high carbon intensity of their electricity generation, Alberta, Saskatchewan, Prince Edward Island, and Nova Scotia have high motivation to increase energy efficiency in their buildings, whereas British Columbia, Manitoba, Québec, and Newfoundland and Labrador, have less direct incentive to increase the efficient use of electricity in order to reduce emissions.
FIGURE 9
Canada’s ElectricityGeneration by FuelType (2003)27
As noted previously in Figure 6, electricity accounts for about 36% of the energy consumed by Canada’s commercial buildings, based on 2008 estimates. This electricity is generated from a number of sources and to varying degrees in different regions. Some provinces, such as British Columbia, Manitoba, Québec, and Newfoundland and Labrador, produce most of their electricity from emissions-free hydroelectric sources.
HYDRO NUCLEAR COAL OIL NATURAL GAS OTHER
20
From a policy design perspective, varying degrees of incentive for reducing electricity use in relation to carbon emissions should be considered. It is also important to note that besides reducing carbon emissions from those regions that are dependent on high-carbon-intensity electricity generation, there are other indirect environmental benefits from decreased electricity demand during peak hours. Reducing energy consumption by increasing energy efficiency in the Commercial Buildings sector would have three benefits:
It would displace coal and natural gas production, thereby reducing GHG emissions. • It would make emissions-free electricity available for use in other sectors of the economy.• It would provide an injection of much-needed capital into the deteriorating electricity grid.•
2.5 goveRnmenT jURIsDICTIon foR CommeRCIal bUIlDIngs
Urban design issues are addressed with a complex partnership between the federal, provincial, and municipal governments. The federal level is often involved in policy design, whereas the provincial and territorial governments address municipal affairs, and the municipalities enforce policy instruments. The efficient use of natural resources and the reduction of regional pollutants and CO
2 emissions is a national concern. This report focuses
on policy options for the federal level; however, the Canadian regulatory framework and incentive programs for energy use by commercial buildings span all levels of government, making it a challenge for builders to stay informed of policy changes and available resources.
Canadian provinces, territories, and municipalities have jurisdictional control over building codes, site plan approvals, and building permitting and inspecting processes. For the most part, building codes are developed at the provincial and territorial level, and are implemented at the municipal level. Often, provincial building codes are based on the Model National Building Code, which is prepared centrally under the Canadian Commission on Building and Fire Codes.
The main principles of Canada’s federal energy policy as set out by NRCan include having a market orientation, a respect for jurisdictional authority and for the role that provinces play and, where necessary, targeted intervention in the market process to achieve specific policy objectives.28 Environmental sustainability is a policy objective that can merit government intervention, which applies to energy efficiency. The OEE, housed within NRCan, is the main federal resource for regulation, information, and incentives aimed at energy efficiency in commercial buildings. This report reinforces the federal role in this sector.

baRRIeRs To InvesTmenT In eneRgY effICIenCY
3.1 ENERGY EFFICIENCY POTENTIAL3.2 ENERGY EFFICIENCY TECHNOLOGY ADOPTION BARRIERS3.3 SUMMARY OF INVESTMENT BARRIERS

3.0

23
3.0 BARRIERS TO INvESTmENT IN ENERGy EFFICIENCy
This section identifies technology adoption barriers for investment in energy efficiency in Canada’s commercial buildings. Addressing these investment barriers will maximize carbon emission reductions from energy efficiency in the sector and help to determine the most effective and appropriate public policy response to overcome them.
3.1 eneRgY effICIenCY PoTenTIal
A range of barriers to investment affect the impact that efficiency measures in commercial buildings can have on energy consumption and carbon emissions. Energy efficiency potential should be considered in the development of targets and there are three ways to measure it:
Technical potential• refers to the level of efficiency that current and emerging technologies are capable of achieving. It does not focus on the costs or practical feasibility of installing the technology.
Economic potential• refers to the portion of the technical potential that could be achieved cost-effectively in the absence of market barriers. The achievement of the economic potential requires additional policies and measures to break down market barriers.
Achievable potential• considers the economic costs and incorporates other factors that influence participation and penetration of policies such as time delays in technology adoption related to available skills, political will, and perceived risk. The achievable potential is generally the method applicable to making most policy decisions.
The Rebound Effect should be considered in the determination of energy efficiency potential to avoid overestimating the impacts of a policy instrument on reducing energy consumption and carbon emissions. The term Rebound Effect is used to describe “the increased use of a more efficient product resulting from the implied decrease in the price of use.”29 For example, if cost savings are incurred as a result of investing in higher efficiency technologies, other energy-using equipment may be purchased with the available cash that offsets the energy savings. Also, even if more efficient equipment is installed, the consumer may not operate it at optimal performance levels. Finally, if over time energy consumption decreases, the price of energy could drop and cost saving incentives would be lost.
3.2 eneRgY effICIenCY TeCHnologY aDoPTIon baRRIeRs
The following section highlights six barriers to energy efficiency technology adoption found to be affecting wide-scale deployment of available technologies in the commercial building sector:
Risk management;• Information gaps and lack of awareness;• The commercial building value chain and the “principal-agent relationship”;• First-mover disadvantage;• Market price signals; and,• Institutional and regulatory barriers.•
24
3.2.1 RIsK managemenT
This section identifies technology adoption barriers for investment in energy efficiency in Canada’s commercial buildings. Addressing these investment barriers will maximize carbon emission reductions from energy efficiency in the sector and help to determine the most effective and appropriate public policy response to overcome them.
Technical risk:• Investment in new technologies can be perceived to have higher levels of risk because of the greater uncertainties associated with unproven performance.
Financial risk:• The overall cost-effectiveness of the technology is largely dependent upon first cost (relative to the incumbent) and the ease with which companies and individuals can adopt the technology. Investing time in learning new operating processes can be costly to firms, and discount rates are often higher for building projects that differ from the norm. Although general industry perception is that the construction of energy efficient buildings is more costly, Canada Green Building Council reviews of LEED®g certified buildings show that the life-cycle cost of these buildings tend to be lower.
Market risk:• This refers to the ability and willingness of the market to adopt new technologies. Declines in the real estate market and the general economy can lower the value of investment and may deter potential investors fromt the real property sector.
3.2.2 InfoRmaTIon gaPs
Three specific barriers related to information are present in the market for energy efficiency in commercial buildings. These include problems related to a lack of information, an uneven allocation of information between stakeholders, and highly complex information.
Lack of Information: There is a lack of complete data and information regarding energy and electricity use within commercial buildings in Canada. No public mandatory energy use reporting mechanisms are in place and, as a result, much of the available data in Canada is held by utilities, energy service companies (ESCOs), industry associations, and building owners. This lack of available information about how and why decisions are made and what influences them means that it is an ongoing challenge for researchers and policy makers to draw meaningful conclusions about the motivations for incorporating energy efficiency at the firm level in the commercial sector.
The problem associated with this data gap is threefold: first, policy makers and researchers have very weak and incomprehensive baseline data in order to evaluate policy impacts and track progress over time; second, building tenants, operators, and owners are often not aware of how much energy they are using and/or their energy consumption patterns, and so are not aware of opportunities for savings and are unmotivated to change behaviours; and third, market information is unavailable to firms seeking to develop products to improve energy efficiency. Statistics Canada and NRCan have worked to produce the Commercial and Institutional Building Energy Use Survey (CIBEUS), the most comprehensive survey pertaining to energy use in the sector. Although aggregate statistics collected in this survey are generally considered reliable and accurate, attempts to break them down in more detail sometimes result in statistics that are considered unacceptable for the purposes of cost-benefit analyses.
g Leadership in Energy and Environmental Design (LEED®) is administered in Canada by the Canada Green Building
Council.
25
Uneven Allocation of Information: There is a lack of awareness about the energy efficiency technologies and practices among commercial building stakeholder groups. This may be partially attributed to a wide discrepancy in available resources and education programs. Formal training varies among stakeholder groups and some may have specialized education in the environmental management of buildings, while others may have very limited understanding of the role of energy efficiency in commercial buildings and how itcan be maximized.
Complex Information: The technical nature of energy efficiency in commercial buildings necessitates an understanding of available equipment options, design practices for systems integration, and an awareness of how systems can be optimized. Although those involved in the design, construction, and operation of buildings typically have a better technical understanding of the systems than the individuals that occupy the buildings, there is still a general lack of understanding of how well buildings are performing (relative to optimum levels) and how to get them to perform better. This relates to the issue of technical risknoted earlier.
The overlapping jurisdictional control over commercial buildings noted in the sector profile also contributes to the issue of complex information. Stakeholders agree that a barrier to investment is the policy uncertainty present in the market, and the difficulty in discerning which policies and resources are applicable/available.
Identifying energy efficiency as a priority in the design phase of building construction can ultimately save costs and be more effective in terms of ensuring the best equipment selection. However, in order for integrated design processes to occur, communication between the project’s architects, engineers, building contractors and the trades must be open and continuous, which is not often the case. The traditional silos-based approach to building design and construction leads to different communication vehicles and channels for disseminating information.
3.2.3 THe CommeRCIal bUIlDIng valUe CHaIn anD THe PRInCIPal-agenT RelaTIonsHIP
The commercial building value chain is very complex, comprising a number of stakeholders whose interests are sometimes competing. This complexity results in a technology adoption gap often referred to as the “principal-agent” or “split incentives” problem. The problem is described as the level to which the incentives of the agent charged with purchasing the energy efficiency measures are aligned with those who benefit from it. This is a particular challenge in the commercial building sector since motivations for energy efficiency are different depending on which party is paying for energy consumption. In the construction phase of building development capital costs for equipment are of primary concern, whereas during the operating phase energy consumption costs take priority. From the perspective of the initial capital investor during building construction, the return on asset (ROA) equation is top of mind and time periods for expected return tend to be very short (1-3 years), especially if the building is to be sold in the short term. If the building owners expect their tenants to pay for their own energy consumption it is not in their interest to invest in high-efficiency technologies since they will not reap the savings. Instead, they are motivated to install technologies with the lowest capital costs, which may not be the most energy efficient options.

26
Table 3 summarizes the key elements of the commercial building value chain and identifies the primary drivers and implications for energy efficiency. This uneven distribution of information leads to competing priorities and different ways of understanding the value of energy efficiency. Factors such as the focus on first costs, fragmentation in the supply chain and regulatory framework, the principal-agent relationship, and lack of feedback in the value chain will all have to be addressed by policy makers in order to increase energy efficiency in commercial buildings
TABLE 3
Existing Value Chain for Commercial Buildings30
PRIMARY DRIVERS IMPLICATIONSEXISTING VALUE CHAIN
FacilityManager
Architect
Tenant orOccupant
Investor Owner Developer
Engineer Contractor
Operator
GAP
ROI, and perceived risk from new technologies, processes
and approaches.
Reluctance to change without strong evidence to support
decision.
First Cost and client satisfactionFocus on aesthetics (i.e. amount of glass area, visual impacts of
building orientation, etc.)
First Cost and delivery datesStrong incentive to use “off the
shelf” designs, equipment and practices.
Operating Costs and client satisfaction
Reluctance to change without clear directions and support from
senior management.
Operating Costs and indoor environmental quality (IEQ)
Increasing dissatisfaction, sometimes resulting
in legal action.
27
3.2.4 fIRsT-moveR DIsaDvanTage
The higher first-cost hurdle for innovators and first movers is an impediment to effective market transformation. When firms choose to construct highly efficient buildings with innovative technologies and design practices, they
Often face higher financing costs through heavy discounting (due to higher perceived • levels of risk);
Potentially place their intellectual property at risk (the costs of developing unique and • proprietary solutions may not be protected from competitors if the information is placed in the public domain);
Experience longer transaction time for dealing with longer permitting and administrative • processes; and
Experience costly delays through trial and error.•
Innovators are unlikely to recoup these costs through the sale of their buildings since they are part of the learning curve and not necessarily worth a premium to potential customers. From a business perspective, it is often more advantageous to allow other firms to incur the first-mover costs and then follow in their trail based on best practices and lessons learned. As a result, the market transformation is slower, and fewer companies are willing to take a leadership role.
It is notable that in institutional buildings including those in the education, government, and health and social sub-sectors, the first-mover disadvantage may not be as important a barrier due to the fact that knowledge can be shared based on the experiences of others, and tight resources may be stretched further since building owners and operators are not faced with first-mover costs. However, if low upfront costs are sought by managers of institutional buildings, the first-mover disadvantage may be as significant a barrier as in the private sector. A solution for overcoming this hurdle is to place emphasis on lifecycle accounting for technology selection.

28
3.2.5 maRKeT PRICe sIgnals
High energy prices drive energy efficiency investment in commercial buildings. However, market price signals can have additional impacts on energy efficiency. Three main price signals in the Canadian energy market have an impact on buying decisions:
Subsidized Energy Prices• : Government subsidies to the oil and gas industry31 can shield the real cost of energy production from commercial building energy consumers, resulting in a lack of incentive for them to invest in energy efficient options, or for utilities to invest in new energy infrastructure.
Average Cost Billing• : Billing practices based on the average costs of energy production rather than on real-time or marginal costs reduce incentives for behavioural change since, as a result, building owners and operators do not care about when they consume energy, even though it costs more to produce energy during peak periods.
Environmental Externalities• : Environmental and health cost impacts resulting from the production and use of energy in the economy are not incorporated into energy prices, resulting in artificially low energy prices.32 For example, health costs to society resulting from the continued use of fossil fuels have been estimated in the billions of dollars.33 Consumers incur artificially low energy costs, and are less inclined to invest in energy-saving technologies and practices.
3.2.6 InsTITUTIonal anD RegUlaToRY baRRIeRs
The industry cites a number of current policies as institutional and regulatory barriers to investment in energy efficiency. Policies with short-term objectives can become outdated over time; for example, those promoting specific technologies can discourage overall innovation and may force consumers away from purchasing the most efficient alternative. Stakeholders have pointed to inadequate building code standards, slow bureaucratic permitting processes, and complex governing jurisdiction as key barriers to energy efficiency.
It is important to note that even effective policy instruments require continuous monitoring and evaluation in order to improve over time. Building codes and equipment standards are considered effective policy instruments for driving improvements in energy efficiency;34 however, stakeholders often point to the lengthy process for updating these codes and standards as barriers to market transformation. As in the case with permitting processes, building codes that do not recognize innovative technologies and alternative system designs can make approvals more cumbersome for builders who are trying to achieve high energy efficiency performance.

29
3.3 sUmmaRY of InvesTmenT baRRIeRs
From an investment perspective, the single-largest barrier to broader and deeper investments in this sector is market uncertainty. Investors are reluctant to engage in any sector that is perceived to be unstable or inequitable in terms of providing acceptable return on investment (ROI). Stakeholders have identified three main pre-conditions for investment:
Pricing Certainty• : Long-term capital investments (either for new energy efficient buildings or emerging sustainable technologies) are based on having a reliable and quantifiable pricing environment in order to make informed decisions.
Policy Certainty• : Changes and/or inconsistencies in policy design and execution often drive away capital investments due to the higher levels of risk exposure.
Policy Fairness• : Companies require a “level playing field” in order to maintain their competitiveness. They are less concerned with the policies themselves, and more concerned with having the policies applied equally and fairly throughout the market.
Table 4 sets out the main categories and types of energy efficiency technology adoption barriers identified by SDTC and the NRTEE. It includes the barriers outlined in Section 3.3, as well as several others that were identified through stakeholder consultation and research.
TABLE 4
Summary of Energy Efficiency Technology Adoption Barriers in the CommercialBuilding Sector
CATEGORY BARRIERS TO TECHNOLOGY ADOPTION
Market, technical, and financial risk •
Level of positive external/personal recognition for “doing the right thing” by installing •
the efficiency measure(s)
Level of perceived risk that the efficient product may not perform as promised•
Lack of complete data and information•
Lack of public understanding of infrastructure needs and resource constraints, •
i.e. the functionality, cost, drivers and challenges are unknown to the public
Skills and labour shortage in the construction industry•
Lack of training resources (time, available education, funding) for building operators, •
inspectors, and trades
Lack of interdisciplinary programs to promote integrated design processes between •
universities and colleges
Low awareness of available products and services•
Availability of installation and inspection services•
Low awareness of benefits: cost and co-benefit•
Required technical ability to assess the options•
Consumer preferences that do not value energy efficiency•
Existence of a viable infrastructure of trade allies•
Risk Management
Information Gaps

30
CATEGORY BARRIERS TO TECHNOLOGY ADOPTION
Level to which the incentives of the agent charged with purchasing the efficiency measures •
align with those of the person(s) that would benefitValue Chain and Principal-agent Relationship
Lack of enabling tools and techniques to facilitate market adoption of sustainable •
energy solutions
Need to foster acceleration of advanced technologies•
Lack of performance monitoring of technology systems•
Access to appropriate financing•
Size of required energy efficiency investment vs. asset base•
Payback ratio – actual vs. required•
Level of effort/hassle required to become informed, select products, choose contractor(s), •
and install
Energy pricing at levels that do not integrate externalities associated with the whole lifecycle •
(full-cost accounting)
Energy pricing signals that do not reflect real-time costs •
Codes, standards, and permitting processes that prohibit implementation of innovative energy •
efficiency technologies
Constitutional jurisdiction for buildings includes all levels of government and results •
in different standards across the country
Lack of long-term policy development due to short-term political agendas•
Limited horizontal cooperation/coordination to integrate policies and implementation•
Disconnect between longevity of infrastructure and short-term horizons on crucial decisions, •
such as budget allocations for maintenance and rehabilitation and rate structures
Insurance industry acceptable practice, standards or levels of infrastructure service may •
lead to liability perceptions for professional designers, municipalities, developers
First-mover Disadvantage
Market Price Signals
Institutional and Regulatory

eneRgY effICIenCY PolICIes anD evalUaTIon
4.1 MARKET-WIDE PRICE SIGNALS4.2 COMMAND AND CONTROL REGULATIONS4.3 SUBSIDIES4.4 VOLUNTARY ACTIONS4.5 POLICY EVALUATION SUMMARY
4.0

33
4.0 ENERGy EFFICIENCy POLICIES AND EvALUATION
This section provides a high-level analysis of the economic and environmental effectiveness of policy types available to decision makers for impacting investment in energy efficiency: market-wide price signals, command and control regulations, subsidies, and voluntary actions. The purpose of this section is to provide an overview of the policy instruments that have been used to promote energy efficiency, and an indication of how Canada fares in energy efficiency policy evaluation. As well, examples of effective energy efficiency policy instruments are included, based on secondary research, to guide the choice of recommendations in this report. This analysis is not meant to be a full cost-benefit evaluation, but is based on domestic and international research that highlights the policy types that are deemed to be most effective in reducing emissions with economic efficiency.
4.1 maRKeT-WIDe PRICe sIgnals
Market-wide price signals seek to send messages to consumers and producers in the form of commodity prices about increasing supply or reducing demand for those commodities. In the case of energy efficiency in commercial buildings, full-cost energy and emission pricing, emissions and energy taxes, and cap-and-trade systems are the most common price signal
options targeted at reducing CO2 emissions. In 2007 the NRTEE conducted an analysis that
led to the assertion that “strong, consistent and economy-wide emission pricing is required as soon as possible if cost-effective emission reductions are to be sustained to mid-century and likely beyond.”35 In 2007, SDTC found that establishing a clear and consistent price on carbon was the single most important factor in driving a shift toward sustained efficiencies36. Without such an economy-wide emission pricing policy, it is highly unlikely that the Government of Canada’s targets of reaching overall emission levels 60-70% below those of 2006 will be achieved.
4.2 CommanD anD ConTRol RegUlaTIons
The Organization for Economic Co-operation and Development (OECD) defines command and control regulations as “institutional rules with the purpose to influence directly the environmental performance of polluters by regulating processes and products used by prohibiting or limiting the discharge of certain pollutants and/or restricting activities to certain periods, areas, etc.”37 Several European researchers who conducted extensive analyses of the cost-effectiveness and environmental effectiveness of policy instruments designed to reduce GHG emissions in buildings38 found that command and control regulations are generally effective in the building sector if applied well, but their cost-effectiveness can be limited by high enforcement costs. The rebound effect can limit their effectiveness, but its impact has not been found to be strong enough to offset energy use/ GHG emission mitigation from this policy type.39
Without such an economy-wide emission pricing policy, it is highly unlikely that the Government of Canada’s targets of reaching overall emission levels 60-70% below those of 2006 will be achieved.

34
4.2.1 bUIlDIng eneRgY CoDes
As a policy instrument, building energy codes are used to entrench best practice energy efficiency measures and/or techniques that are commonly used within the building construction industry. Energy codes can produce a shift in the average efficiency of the market by eliminating the option of having an energy use performance below that mandated by the code.
Research has found that building codes can significantly improve energy efficiency in new buildings;40 however, implementation must be well prepared and enforcement, monitoring and verification, and regular updates are necessary for them to remain effective. The development and implementation of building energy codes requires substantial investment in two main areas:
Development and adoption: This includes the creation of new code proposals and support • of the process through which codes are adopted; and
Compliance: This typically includes a broad range of education and training efforts and • infrastructure activities.
The National Building Code (NBC) of Canada forms the basis for provincial building codes and sets the technical provisions for the design and construction of new buildings. It also applies to the alteration, change of use, and demolition of existing buildings. Provinces and municipalities are not required to adopt the NBC, although most choose to either adopt it or apply a higher degree of stringency to their own codes. The NBC does not address energy efficiency, which has led to the development of the Model National Energy Code for Buildings (MNECB). Released in 1997 as a federal voluntary standard that specifies comprehensive minimum energy-efficiency standards for new commercial building construction, the MNECB is published and maintained by the National Research Council’s Institute for Research in Construction (NRC-IRC). To date, the City of Vancouver and the Province of Ontario have referenced it in their building regulations. The MNECB was developed and is maintained by the National Research Council’s Institute for Research in Construction (NRC-IRC) and it provides minimum energy efficiency standards for commercial buildings in Canada.
There has been limited quantitative post-implementation evaluation of building energy codes. However, extensive analysis of available data by researchers at the Central European University41 revealed that building energy codes are highly effective in CO
2 emission
reduction. For example, in 2000 alone, building codes in the US accounted for a reduction of 79.6 megatonnes of CO
2 from the commercial and residential sectors. The EU has documented
a savings of 35-45 Mt, and up to 60% energy savings for all new buildings.42
The cost-effectiveness of building codes is considered “medium”h based on the need for compliance monitoring and enforcement, and regular updates. An approximate cost to society of USD$46-109 per tonne of CO
2 has been estimated in the US. 43 It is important to note
that building energy codes do not offer an incentive for performance improvement beyond the minimum target, and they are only effective when enforced. Some recent assessments indicate that in order to have a significant impact on the overall built environment within a reasonable amount of time, building codes should apply to both new and existing buildings.44 Germany is one of the few countries with regulations that apply to existing buildings (i.e., when more than 20% of the building area is affected by renovation, new construction codes must be followed).
h<25USD/t CO2 eq
Research has found that building codes can significantly improve energy efficiency in new buildings...

35
4.2.2 mInImUm eneRgY PeRfoRmanCe sTanDaRDs (mePs)
Minimum energy performance standards (MEPS) are used to regulate the energy used by building equipment. MEPS have the greatest impacts on energy efficiency because they affect all purchasing decisions.45 Typically, MEPS can be implemented at a very low cost because the mechanisms are already in place and in many cases program standards exist so new testing and certification is not required. Standards are typically self-enforcing since the burden of testing and certification falls on the manufacturer.
The main piece of legislation in Canada targeted at increasing the energy efficiency of buildings is the Energy Efficiency Act, which is managed by NRCan’s Office of Energy Efficiency (OEE). Canada has regulated MEPS since 1995 under the Energy Efficiency Act in order to eliminate shipment of inefficient, energy-using products that are either imported into Canada, or manufactured in Canada and transported between provinces for the purpose of sale or lease. To date, the standards have been amended nine times to incorporate additional products or to increase the stringency of standards. NRCan has calculated that by 2010 these MEPS will have achieved a reduction in GHG emissions of 25.6 Mt per year.46 The Turning the Corner Plan commits to improving energy efficiency standards under the Energy Efficiency Act and NRCan’s minister is expected to introduce amendments to the Act including new energy performance standards for equipment.
MEPS are comparable to appliance standards, which have been found to be among the most cost-effective and widespread instruments used to reduce emissions. Analyses conducted in the US, the EU and Australia have reported net economic benefits to society resulting from the application of appliance standards.47 Contributing to these economic benefits are attributes such as low transaction costs and relatively easy control due to the limited number of manufacturers.
4.2.3 manDaToRY eneRgY labellIng
Mandatory certification and labelling programs have been found to be effective, both in terms of cost and GHG emissions reductions, especially when combined with other policy instruments such as MEPS, building codes, or subsidies. For example, tighter labelling standards in Australia are expected to result in emissions reductions of 204 Mt CO
2 between
2005 and 2020, with net economic benefits.48 An indirect benefit of mandatory labelling is the transparency of information related to energy consumption, which is necessary for determining the impacts of policy instruments via monitoring and evaluation processes, and opportunities for improvement. As of October 1, 2008 England and Wales introduced mandatory energy certificates, a form of labelling. These certificates rate a building’s energy efficiency from A to G, as well as its potential rating with select improvements. All public buildings are required to publicly display their certificates; all other buildings will require a certificate when purchased, sold, or rented.49
Canada’s ecoENERGY for Buildings and Houses program is an information-based initiative offering training, labelling, and rating of houses and buildings. A 2008 NRTEE report50 noted that actual impacts on emissions from information programs are difficult to assess and can be overestimated due to the fact that direct impacts are not easily quantified. There may be other reasons for changes in behaviour that happen concurrently with the information programs, so estimated impacts of mandatory energy labelling should be conservative.


and the ecoEnergy Retrofit Incentive for Buildings was implementedterminated

38
building code. The assessment revealed total costs of $6.7 billion and total savings of $36 billion, resulting in a cost-benefit ratio of 5:4.57 The ACEEE concluded that tax credits “should stimulate the development and deployment of new technologies that might not otherwise be implemented, rather than subsidize actions that would occur even if the tax credits were not provided (i.e., free riders). Credits should be applied to leverage private sector investments on a large scale in order to maximize energy and economic savings, emissions reductions, and other benefits over the long run.”58 Furthermore, they noted that to be effective, tax incentives should
stimulate commercialization of advanced technologies;• establish performance criteria and pay for results;• pay substantial incentives;• choose technologies where first cost is a major barrier;• be flexible in terms of who receives the credit;• complement other policy initiatives;• select priorities but “hedge” bets; and• allow adequate time before phasing out the incentives.•
4.3.2 ReseaRCH, DeveloPmenT anD CommeRCIalIzaTIon
(RD&C) sTRaTegIes
In Canada, the federal government has been a major funder and catalyst of energy efficiency technology RD&C for many years. These programs analyze, plan, and build market infrastructure; fund and promote the adoption of new technologies; and review, evaluate, and report on results.
Technology funds are established to increase innovation of new technologies or dissemination of commercially viable ones. The $550 million SD Tech Fund™ executed and managed by SDTC is aimed at supporting the late-stage development and pre-commercial demonstration of clean technology solutions, which include products and processes that contribute to clean air, water and land, and that address climate change and improve the productivity and global competitiveness of Canadian industry. The ecoENERGY Technology Initiative is a $230-million investment in science and technology by the Government of Canada to accelerate the development and market readiness of technology solutions in clean energy. The Initiative is a component of an effort to support long-term solutions to reducing and eliminating air pollutants from energy production and use. Among the eight priority areas is the “built environment,”59 focusing on the integration of renewable energy technologies into buildings and community systems.
The $550 million SD Tech Fund™ executed and managed by SDTC is aimed at supporting the late-stage development and pre-commercial demonstration of clean technology solutions

39
The NRCan CANMET Energy Technology Centre (CETC) is a vital component of RD&C for energy efficiency in Canada. Its technology development activities are performed on a cost-shared basis through in-house R&D or by providing funding support to technology partners. CETC activities focus on reducing the costs of existing technologies by performing applied research or by undertaking more fundamental research where new technologies and concepts offer significant future market potential. Deployment and commercialization activities serve to increase market penetration of proven, cost-effective technologies, through support for standards development, technical workshops, training and full-scale implementation.
Technology deployment delivery activities have four main goals:
Create and package knowledge to make it accessible to users;• Condition public policies and institutions to facilitate the delivery of energy efficient •
and renewable technologies;Reinforce the market to promote energy efficient and clean energy technologies •
and practices; andInfluence end-users to adopt energy efficient and clean energy technologies and practices.•
Desired effects of research, development, and commercialization strategies include the following:
Accelerate private sector technology development and deployment.;• Provide opportunity for development and deployment of technologies that would not •
otherwise have occurred.; andDevelop a technology transfer infrastructure. •
The evaluation of technology deployment strategies has always been challenging due to the complexities of establishing a causal chain of impacts. A recent American study has established some groundwork for a robust evaluation framework of technology deployment initiatives.60 The proposed framework focuses on linking program outputs to short-term and long-term outcomes, measuring partner and target audience response to program outputs, designing sound evaluations, and assigning credit for the program effects that are directly attributable to the program.
There is empirical evidence from work done in the US that RD&C strategies do indeed generate significant incremental energy performance in the built environment. The US Department of Energy conducts annual performance analyses of its RD&C activities. In FY 2004, the “buildings technology” category of initiatives was forecast to generate annual secondary energy savings amounting to about 1583 PJ by 2030. This finding shows that government funding can have a positive impact on technology penetration in the market over time.


41
4.4 volUnTaRY aCTIons
4.4.1 InfoRmaTIon anD PeRfoRmanCe
Voluntary actions include information and marketing tools that make codes, standards and labels available to organizations that are committed to minimizing the energy use of their buildings. These performance or prescriptive standards are promoted, supported and adopted on a voluntary basis with the idea that market innovators will take a lead and push an eventual transition to widespread adoption. The greater the degree of perceived value of the standards to building buyers and tenants, the greater their expected level of uptake becomes. The international ENERGY STAR® label identifies products that meet premium levels of energy efficiency. In Canada, NRCan administers the label, and most ENERGY STAR® products are 10–50 % more efficient than the minimum regulated standard in Canada.
Information programs tend to have relatively low costs, but their emission reduction effectiveness can be limited as well, depending on uptake levels. However, they are often implemented with other policy measures such as MEPS and can promote long-term behavioural changes.63
The effectiveness of voluntary policy instruments is widely contested, but in the buildings sector they can be useful when regulatory instruments are difficult to enact or enforce, and when they are effectively designed.64 Voluntary actions can be combined with other policy instruments to increase their effectiveness, and can also be used to help industry prepare for regulation.
4.4.2 bUIlDIng CommIssIonIng
Buildings go through a commissioning process prior to being handed over to the owner. The purpose is to ensure all of the systems are operating as designed and intended. However, there are factors that can have a negative impact on system performance (and energy consumption). Often the equipment that is installed is not of the same quality or performance characteristics as originally specified, but is cheaper to purchase or install. This results in lower building performance from the start. Also, as buildings age, the performance of the systems and equipment deteriorates. If the building is not re-commissioned on a regular basis, performance can drop below sub-standard levels. These two conditions are the driving force behind a call for retro-commissioning or continuous commissioning
... continuously monitoring and maintaining energy systems couldreduce annual energy bills by 5 to 25% or more.

42
standards in Canada. A recent study found that continuously monitoring and maintaining energy systems could reduce annual energy bills by 5 to 25% or more.65 Currently in Canada, continuous commissioning is done solely on a voluntary basis.
In some regions, such as in the US, commissioning is supported by utility energy efficiency programs, making it a subsidized activity. In 2004, a US analysis was conducted to review the performance of 175 (106 existing, 69 new) commissioning projects across the country, representing a total floor space of over 30 million square feet. The following metrics were reported as a result of the analysis:66
Annual costs of $0.27/ft• 2 for existing buildings and $1.00/ft2 for new construction;Annual savings of $0.27• /ft2 for existing buildings and $0.05/ft2 for new construction; andAnnual energy savings of 15% in existing buildings.•
Commissioning evaluation studies have found that realized energy savings can be significantly lower than program goals and claims. Some have high attrition rates among initially recruited projects, few of which ultimately tend to be successfully completed. Projects that are completed are often found to have only implemented a small number of the recommended measures. Others tend to be ineffectively implemented or negated by subsequent changes. It should be noted that the delivery of commissioning was in many instances supported by utility energy efficiency programs. Some of the reported non-energy benefits are improved equipment life, reduced numbers of change orders and warranty claims, increased productivity and safety, and improved indoor air quality.
4.5 PolICY evalUaTIon sUmmaRY
Effective policy and program evaluation is a cornerstone of managing public and taxpayer resources and is a fundamental requirement for performance assessment as the basis for decision making. Inflexible policies that are not regularly updated can act as regulatory and institutional barriers to maintaining high performance standards in commercial buildings. Therefore, ongoing policy monitoring and evaluation are crucial to adapting to changes in the market and in available technologies.
Since 2001, government-wide Treasury Board requirements have been in place for:
Senior management to establish an appropriate evaluation capacity; • Increased scope of evaluations to cover policies, programs, and initiatives; and• increased emphasis on performance monitoring and early results. •

43
All regulatory departments and agencies are expected to show that a recommended policy option maximizes the net economic, environmental, and social benefits to Canadians, business, and government over time more than any other type of regulatory or non-regulatory action. As a best practice, departments and agencies are expected to prepare an accounting statement of policy performance. Regulatory authorities must demonstrate that the benefits to Canadians outweigh the costs and that they have structured the regulatory program so that the cost-benefit analysis is maximized.
The cost-benefit analysisi employs the following steps:
Identify the public policy issues and related risks;• Define the baseline measure;• Identify the objectives the policy intends to achieve;• Develop alternative regulatory and non-regulatory p;olicy options and how they affect •
the baseline scenario;Conduct an impact analysis for the costs, benefits, and stakeholders; and• Prepare an accounting statement.•
An interim review of the Treasury Board evaluation policy conducted in 200367 identified some significant shortcomings and barriers with respect to the capacity of departments to carry out effective evaluation. A clear link exists between departmental capacity and resourcing, and the ability to effectively carry out the evaluation function.
The current federal evaluation policy represents a suitable platform for effective and rigorous evaluations of energy efficiency policy, both regulatory and non-regulatory instruments. However, no evidence was found that the federal policy is being carried out in a meaningful fashion. Energy policy regulatory instruments have not been consistently subjected to post-implementation analyses, and only a handful of non-regulatory instruments have been subject to evaluations. Indeed, there is no evidence to suggest that the evaluations being applied today include an estimation of the value of non-energy benefits (e.g. reduced GHG emissions).68
The evaluation of energy efficiency policy instruments and program types is limited in Canada, particularly with regard to the scope (only a small number of initiatives have been subject to evaluations) and rigour (very few evaluations are designed and implemented at the level of rigour now accepted by leading utility regulatory agencies as best practice).
i Other countries and international communities such as the United States, Australia, the European Commission, etc.
have also come to recommend that a cost-benefit analysis be the centre of regulatory analysis. A cost-benefit analysis has
become one of the key analytical tools employed to assist in making this determination before approval is given for any
significant new regulation.

44
Several key barriers were identified by the Treasury Board policy review as impediments to effective policy evaluation in the Canadian federal government:
Insufficient number of staff;• Low budget;• Inadequate staff skillset;• New priorities and issues;• Lack of available professional services; and• Lack of access to training.•
In order for the Canadian government to build on its evaluation accomplishments and learn from its own experience as well as from international experience, several principles to govern the decision-making process need to be adopted including recognition that program evaluation should be:
A core function of public management processes;• Embedded in the decision-making process;• Linked to budgeting and expenditure management;• Granted independence from program administrators (while keeping in mind that •
internal evaluation can result in greater ownership of findings); andCredible and of the highest quality possible.•
Given the important role of energy efficiency as a cost-effective future resource to reduce energy consumption and carbon emissions, it would follow that the public investment in various policy instruments should be carefully assessed. The absence of consistently rigorous evaluation of energy efficiency policy will ultimately undermine confidence in performance and lead to ineffective policy choices. Again, it is important to emphasize the importance of policy evaluation and reporting in the program design process so that cost-benefit analyses can be based on actual results in the market.
Energy efficiency policy evaluation is best represented by North American utility energy efficiency programs. The breadth, depth and rigour to which these programs have been and continue to be evaluated are being driven by state and provincial government and utility regulatory requirements. They represent best practices for the following reasons:
They have government and regulatory mandates to be carried out;• There are sufficient financial resources allocated to support the evaluations; and• Rigorous commitment to supporting continuous improvement is in place.•

45
California is a leader in evaluation, measurement and verification requirements and protocols for energy efficiency policy. The California Evaluation Framework provides a consistent, systemized, cyclical approach for planning and conducting evaluations of California’s energy efficiency and resource acquisition programs.69 The primary purposes for conducting evaluations of energy programs in Californiaj are to reliably document program effects, and to improve program designs and operations to be more cost-effective at obtaining energy resources. Program effects and generated savings are documented, as are the efficiency of the program processes and longer-term and lasting changes made on the market.
From a policy perspective, although profiling and monitoring program performance metrics is required for effective evaluation, it is also essential to focus on understanding what drives program success or failure. Even leaders in energy efficiency strive to improve policy performance. Recent provincial, state and regional energy plans call for energy efficiency to play a central part to meeting long-term energy demand:
The provincial • BC Energy Plan calls for BC Hydro to acquire 50% of incremental resource needs through energy conservation/ efficiency by 2020.70
The • US Northwest’s latest energy plan calls for meeting all demand growth through demand-side management and energy efficiency.
The • California Energy Commission concluded that the state goal should be to achieve all cost-effective energy efficiency.71 The “Integrated Energy Policy Report” calls for the state to “adopt statewide energy efficiency targets for 2016 equal to 100 percent of economic potential, to be achieved by a combination of state and local standards, utility programs, and other strategies”.72
In July 2008 the • Council of the Federation announced its support of energy efficiency as a key component of climate policy. Premiers committed to achieving a 20% increase in energy efficiency by 2020, primarily by way of building codes and minimum standards for energy-using equipment.73
Policy instruments available to governments for the promotion of energy efficiency in commercial buildings fall under a general typology as described in this section and outlined in Table 5. They form the basis for potential policy solutions to encourage greater energy efficiency in the commercial building sector; however, research has revealed that their individual effectiveness varies based on program design and implementation. Regular evaluation and reporting mechanisms are necessary to monitor actual emissions reductions attributable to each instrument, and to guard against the Rebound Effect or issues related to free ridership. A policy package including instruments from all policy types may be optimal to maximize emissions reductions.
j All program evaluation efforts associated with California’s energy programs fall under one or both of these overall
purposes for conducting evaluations.

46
TABLE 5
Energy Efficiency Policy Typology
Policy Type Policy Instruments Barriers Addressed Policy EvaluationResults
Emission pricing•
Cap and trade system•
Carbon tax•
Energy tax•
Full-cost energy pricing •
for all energy forms
Capital and fiscal •
incentives
Technology funds for •
R&D, development, and
commercialization
Funding for public •
education and skills
training
Voluntary disclosure •
of information
Energy performance •
above minimum
standards
Voluntary building •
commissioning
Building energy codes•
Minimum Energy •
Performance Standards
(MEPS)
Mandatory energy •
labelling
Mandatory energy •
performance for public
buildings
Market uncertainty•
Lack of environmental •
externalities in pricing
Financial and •
technical risk
Transaction costs•
Financing•
Skills shortages•
Public good nature •
of knowledge
Information gaps•
Market uncertainty•
Information gaps•
Institutional and •
regulatory barriers
(i.e. if codes and
standards are updated
regularly and allow for
flexibility)
Value chain and •
principal-agent
problems
High cost-effectiveness•
High emissions •
reductions
Potentially high •
enforcement costs
(low cost-effectiveness)
High environmental •
effectiveness
Need to account for •
the Rebound Effect
Results for cost- •
effectiveness and
emissions reductions
vary based on
program design
Need to account •
for free ridership
Program evaluation •
particularly important
Low costs•
Difficult to quantify •
impacts on emission
reductions
Should be combined •
with other instruments
for maximum impact
Market-wide Price Signals
Command & Control Regulations
Subsidies
Voluntary Actions

InTeRnaTIonalPolICY TRenDs
5.1 JAPAN5.2 THE EUROPEAN UNION (EU)5.3 AUSTRALIA5.4 THE UNITED STATES (US)5.5 COMMON FACTORS ACROSS REGIONS
5.0

49
5.0 INTERNATIONAL POLICy TRENDS
Energy efficiency is a rapidly developing area for policy development and although many policies have not yet been subject to rigorous evaluation, Canada can look to global regions for trends in energy efficiency policy in order to be aware of innovative developments and potential best practices. Specific research was commissioned to identify emerging international trends in energy policy for buildings in order to position recommendations within a global context. Four regions were selected for this work based on their unique policy approaches for advancing energy efficiency. Several examples of policy instruments employed by each region are reviewed. This section does not attempt to identify best practices or examples of successful policy implementation, due to limitations in data and resources required to do so. However, several indicators are identified within the regions that are instrumental in approving, establishing, and implementing policy programs.
5.1 jaPan
The number of energy efficient buildings in Japan is growing rapidly, due in part to its Energy Conservation Law, which is a form of command and control regulation that came into force in 2003 as a way to strengthen energy management. It specifies requirements for energy control systems in commercial buildings and emphasizes the rational use of energy related to the prevention of heat loss and efficient energy use in buildings. The Law authorizes local governments to provide guidance and advice to commercial energy users, and has become a documented success. The Law was amended in 2003 in part to promote the engagement of ESCO projectsk with subsidies, low-interest loans, and tax incentives for energy conservation measures. In 2006, mandatory energy conservation measures were released to strengthen the Law. Buildings with a total floor space of 2,000 m2 or larger are now required to report conservation measures in new construction, extension or rebuilding. If deemed insufficient, instructions are given for energy compliance and performance reports are required periodically.74
The Top Runner Program is a leading Japanese regulatory tool designed to help achieve the goals of the Energy Conservation Law. Rather than setting a minimum efficiency requirement for equipment, it identifies products with the highest energy efficiency ratings in the market and sets them as the market standard. That standard then becomes the requirement imposed on manufacturers. Given the ambitious nature of this policy, notable energy savings impacts have been associated with the introduction of the program.75 The program has achieved energy efficiency improvements of over 50% for some products, while total energy savings are expected to reach 2.2% of the country’s total energy use by 2010.76 It is considered to be flexible, dynamic and adaptive, and allows failures and shortcomings to be addressed and remedied. Also, market stakeholders are involved in helping to set the targets and standard requirements, which ensures that awareness and commitment levels are high.77
The Energy Conservation Centre of Japan (ECCJ) was established to promote rational energy use, and to act as a resource for technical advice to local governments. The ECCJ has also adopted a list of policies entitled the Fundamental Policies for Rational Use of Energy, which
k An ESCO project is an energy-saving business activity on a private basis offering comprehensive energy-related services
to clients.

50
outlines various measures for builders, owners and local governments to encourage adoption of energy efficiency measures. Local governments are also encouraged to support capital investment, technology, research and development, and education as it relates to energy conservation.
5.2 THe eURoPean UnIon (eU)
The EU administration has acknowledged that it will be impossible to meet Europe’s climate and energy security goals without including policy action targeted at buildings. In 2003 the Commission introduced the Energy Performance of Buildings Directive (EPBD), which aims to increase the energy performance of public, commercial and private buildings in all Member States. It has played a critical role in EU policy and legislation by standardizing and strengthening building energy efficiency requirements and has become known as one of the most advanced and comprehensive pieces of regulation targeted at the improvement of energy efficiency in buildings78.
The EPBD consists of four main actions:
The establishment of a common methodology for calculating the energy performance • of buildings.
The application of new methods for minimum energy performance standards for new • buildings. Commercial retrofits must match efficiency levels of new buildings. This is unique because it is one of the few policies worldwide to target existing buildings79.
The establishment of certification schemes for new and existing buildings and the • requirement to display energy performance certificates in public buildings. These certificates are intended to address the landlord/tenant barrier by facilitating the transfer of information on the relative energy performance of buildings. Information from the certification process must be made available for new and existing commercial buildings and for dwellings when they are constructed, sold, or rented.
The establishment of regular inspections and assessments of boilers and heating/cooling • equipment.
The EPBD buildings platform was established to offer support to national policy makers implementing the directive. The EU has begun to issue warnings to countries that have been slow to implement the directive or adopt it as part of their legislation. The region is also working to harmonize building codes between countries to streamline processes and to mandate energy efficiency in all codes. It has investigated the possibility of designing a harmonized building code at the European level and has set up a platform for information exchange on energy performance standardization and legislation among the prominent national players to develop suggestions for a European model code.

51
5.3 aUsTRalIa
In response to drought and increasing water shortages, the Australian government has implemented policies to mitigate negative climate-change impacts, including energy conservation and GHG mitigation in buildings. In June 2005 it released the Ecologically Sustainable Development (ESD) Design Guide for Australian Government Buildings,80 which stipulates how the government intends to show leadership in minimizing the environmental impacts of its own buildings and operations.
The Green Building Council of Australia (GBCA)l is the nation’s leading authority on green buildings and works very closely with the government to promote the importance of energy efficiency in buildings. Central to its work is the development of the Green Star environmental rating system for buildings, a national comprehensive environmental rating scheme for buildings.
In 2000, the Australian government reached an agreement with industry and state/territorial governments to adopt a two-pronged approach to reducing GHG emissions from buildings. The first was the introduction of mandatory minimum energy performance requirements through the Building Code of Australia (BCA), and the second was the encouragement of best practice voluntary initiatives by industry. Industry was supportive of this two-pronged approach, taking the view that building-related matters should be consolidated in the BCA wherever possible.
Energy efficiency measures were introduced in January 2003 following extensive consultations and the BCA has now been amended to include energy efficiency measures for all building classifications. All new and substantially refurbished buildings, whether owned or leased by the Australian government, must meet minimum energy performance standards based on the Australian Building Greenhouse Rating Scheme (ABGR)m or other approved scheme. The Voluntary Building Industry Initiatives Programmen is designed to promote energy efficiency practices among building and construction practitioners.
l Launched in 2002, the GBCA is a national, not-for-profit organization that is committed to developing a sustainable
property industry for Australia by encouraging the adoption of green building practices through market based solutions.
It is uniquely supported by both industry and governments across the country.
m The Australian Building Greenhouse Rating System (ABGR) is an energy efficiency and greenhouse gas emissions
standard that addresses commercial building design, operation, and maintenance best practices to minimize greenhouse
gas emissions. Since 2000, ABGR has been rating buildings according to their actual energy performance over
12 consecutive months.
n Projects developed with the support of the Australian Government under this program include:
* WERS Window Energy Rating Scheme
* EDG Environmental Design Guides
* BDAA Marketing Sustainable Design Workshops
* BDP Making Energy Pay
* HIA GreenSmart Professional Accreditation Course
* MBA Energy Wise-Dollar Wise Training Course
* LBPP Lighting Best Practice Project
* WELS Water Efficiency Labeling and Standards

52
5.4 THe UnITeD sTaTes (Us)
5.4.1 feDeRal InITIaTIves
Legislation governing the built environment is notably progressive in the US. The Energy Independence and Security Act adopted in December 2007 aims to cut energy use in federal buildings in the US by 30% by 2015, and requires new and renovated federal buildings to reduce their reliance on energy from fossil fuels. The energy bill requires that new buildings consume 30% less energy stipulated by existing codes. As a supporting measure, the Federal Energy Management Program (FEMP) provides guidelines and tools to assist federal facilities to achieve these goals. The National Association of State Energy Officials (NASEO) provides a forum for the exchange of information and ideas. The National Association of Counties has initiated a County Energy Efficiency Network designed to leverage resources and provide technical assistance, local training, staff support and financial assistance to counties implementing energy management strategies.
In 2007, the Energy Efficiency and Conservation Block Grant (EECBG)0 authorized $2 billion in grants to communities and states as part of the US Energy Security Act. Municipalities can apply for program funding to encourage energy efficiency and conservation in commercial, residential and municipal buildings. The Commercial Building Tax Deduction,p also written into the Act, establishes a tax deduction for expenses related to the design and installation of energy efficient commercial building systems.
The Energy Policy and Conservation Act (EPCA) was amended in 1992 and left a profound impact on the use of building energy codes in the US. Under the EPCA every state was required to certify before October 1994 that its energy codes would meet or exceed the requirements of the ASHRAE Standard 90.1-1989. At the time it was estimated that the EPCA could lead to a 20% reduction in energy use in half the new commercial buildings built between 1995 and 2010.81 Although an evaluation of the projected savings is unavailable, the package of US energy codes and the 90 series of ASHRAE Standards is by far the most widely adopted model used in other countries in the development of national energy codes.82
Appliance labelling has been successful in driving market transformation.83 Of the energy efficiency schemes, the best-known is the Energy Star Program, which was launched in 1992, operated jointly by the US environmental protection agency (EPA) and the Department of Energy (DOE).84 The Program was initially designed to identify and promote energy efficient products, and later expanded to cover building components, systems and services installations. The Energy Star Program is a government-backed voluntary scheme that is well accepted by industry. According to published data, more than 600 buildings have earned the label, and the administrator of the Energy Star program is already working with organizations that represent approximately 17% of building square footage in the US85. In recent years, the EPA has licensed the Energy Star trademark to several countries, including Japan, New Zealand, Australia and Taiwan, and to the EU86.
The High Performance Green Building Act was recently passed in the United States to legislate the creation of an Office of High-Performance Green Buildings within the General Services Administration (GSA) that would coordinate research and development on ways for government buildings to become more sustainable. As part of the Act, GSA announced that all future construction within its $12 billion portfolio must be LEED®-certified87.
o EECBG is a program, as part of the Energy Independence and Security Act, which provides block grants to cities and
states to improve energy efficiency and encourage other environmentally beneficial practices. Grants could also be used to
provide energy audits and energy technical assistance.
p As part of this deduction, a building owner may claim a tax deduction for expenditures made as part of a building
designed to reduce the total annual energy used in the operation of the building.

53
5.4.2 sTaTe anD mUnICIPal InITIaTIves
US constitutional jurisdiction for buildings crosses federal, state, and municipal levels and several exemplary policy initiatives have been adopted at local levels. California has demonstrated strong leadership in making energy efficiency a priority in energy policy and its energy efficiency programs are considered the most successful in the US. The State’s 2005 Energy Action Plan II establishes energy efficiency as the state’s top priority procurement resource and is endorsed by the Governor, California’s Public Utilities Commission (CPUC) and the California Energy Commission (CEC).q The new administrative structure calls for utilities to invest in energy efficiency whenever it is a cheaper alternative to new power plants and it is recognized as “the most ambitious energy efficiency and conservation campaign in the history of the utility industry in the US.”r It directs the CEC to adopt new building standards for implementation in 2008 that include new energy efficiency measures, cost-effective technologies and photovoltaic systems. The 2004 Green Building Initiative commits California to a series of actions that will result in a 20% reduction in the energy use of state- and privately-owned buildings by 2015.s California is currently developing policy to mandate that all new and a significant proportion of commercial buildings be net zero energy consumers by 2030.
Tax credits are used as policy tools to increase investment in energy efficiency in Oregon and New York State. Oregon provides two tax credits for efficient buildings: a Sustainable Building Tax Credit for buildings achieving LEED® certification, which is based on the gross square footage of the project space; and the State Business Energy Tax Credit, which is also available to projects that fulfill certain energy conservation, equipment efficiency and renewable energy systems requirements. New York State has a Green Building Tax Credit program based on a dollar amount per square foot for commercial buildings larger than 20,000 square feet. Its goals are to support the installation of photovoltaic panels in new construction and innovation in existing buildings. Since 1999, New York has provided more than $92 million in federal and state funds to provide assistance for projects affecting more than 137 million square feet of building space.
The City of Chicago introduced a green permit program in 2005 to overcome permit approval barriers for green buildings. It was the first of its kind in the US and has a rapidly growing program that has helped to significantly accelerate the growth of private sector green building development in the city. Chicago has also developed a comprehensive Green Building Education and Awareness Program that highlights the work of green builders and seeks to drive demand for their products. Today, Chicago leads the nation in number of LEED® registered projects.
q CEC is the state’s principal energy planning agency responsible for developing and implementing building and appliance
energy efficiency standards. It licenses power plants, implements renewable energy programs, and supports the state’s
energy efficiency research and development programs.
r California Energy Commission (CEC). (2005). “Options for Energy Efficiency in Existing Buildings”. CEC
s California Energy Commission (CEC). (2005).
54
5.5 Common faCToRs aCRoss RegIons
A number of common factors emerge as contributors to innovative policy strategies. They include the following:
Government Leadership• In all cases governments established the promotion of energy efficiency as a key priority target for policy development. Government buy-in is particularly important in the implementation and enforcement of command and control regulations and building codes.
Stakeholder Collaboration• Stakeholder collaboration with governments was a key element of programs considered to be successful by the regions. While local governments are responsible for developing legislation, stakeholder organizations such as green building councils and relevant industry associations were considered critical to successful promotion and implementation of the new policies.
Coordinating Role • Many of the countries examined have established federally legislated bodies responsible for policy execution, program development, and public information with respect to energy efficiency and energy use in buildings. These agencies helped to coordinate, organize, manage, and streamline energy efficiency policy.
Measurement and Verification Protocol • Measurement and verification protocols proved effective in updating programs and policies. To remain current with emerging technologies and practices policy tools were monitored, evaluated, and upgraded regularly. Long-term funding, an institutional structure to deliver initiatives, and specified input processes and review cycles are important components of measurement and verification protocols.
Diverse Portfolio of Policy Instruments • The efficacy of individual policy measures was considered to be highest when combined within a package of other policy instruments. Combining regulatory, fiscal/market-based, and information-related instruments helps to capture the advantages of the single instrument as well as reduce the impact of their shortcomings.
Setting Legally Binding Targets• Setting annual targets for emissions reductions and energy savings was an underlying component of innovative programming in several regions. These targets establish a common goal and can be considered a motivating factor for many associations, agencies, and private sector firms.

PolICY moDellIng analYsIs
6.1 BASELINE AND REFERENCE CASES6.2 CARBON PRICE SCENARIO6.3 COMPLEMENTARY POLICIES SCENARIO6.4 COMBINED SCENARIO6.5 REGULATORY SCENARIO

6.0

57
6.0 POLICy mODELLING ANALySIS
An original modelling study was commissioned by the NRTEE and SDTC to assess the impacts of the report’s policy instrument recommendations on carbon reductions from the commercial building sector. This analysis tests the feasibility of achieving the target of 53 MtCO
2 emissions per year by 2050 with the policy instruments included in the modelling.
In 2008, emissions were estimated to be 75 MtCO2. Four scenarios were modelled in order to
identify the best combination of policies for emissions reductions:
Applying a price on carbon (section 6.2, Carbon Price Scenario);1. Applying a suite of complementary policies targeted at the buildings sector; 2.
(without a price on carbon) (section 6.3, Complementary Policies Scenario)Applying both a price on carbon and the complementary policies 3.
(section 6.4, Combined Scenarios); andApplying a price on carbon and mandatory sector-wide minimum standard 4.
regulations (section 6.5, Regulatory Scenario).
The following sections summarize the findings from that modelling work, which are considered in the recommended policy pathway.
6.1 baselIne anD RefeRenCe Cases
The economic modelling analysis for this report references a Business-As-Usual (BAU) baseline case where no policies, regulations, prices or incentives are implemented, and CO
2 emissions
and energy use follow historic growth patterns. Under the baseline case, emissions in the commercial building sector increase from the 2008 total of 75 Mt to almost 95 Mt by 2020 and to 155 Mt by 2050. This number is higher than the BAU estimate of 127 Mt of CO
2
emissions by 2050 included in the 2006 NRTEE report, which may be partially attributable to a higher assumed economic growth rate, resulting in an increase in the number of new buildings expected.
The modelling analysis also includes a reference case in addition to the BAU, which takes into account the estimated emissions reductions from the range of policies and programs contained in the federal government’s Turning the Corner plan and its Regulatory Framework for Air Emissions, as well as selected provincial initiatives.t The reference case assumes that these plans will be implemented as outlined by the government, and that the estimated emissions reductions will be attained; therefore, the complementary policies modelled for this report targeted specifically at the commercial building sector are in addition to those in the plans.
t The modelling results that are presented here are all based upon the baseline and reference case modelling that was
completed by ICF International in analysing the impacts of the Turning the Corner plan.

58
According to the assumptions in the reference case, in 2020 absolute emissions decrease to 68 MtCO
2 (compared with 94 Mt in the BAU); however, emissions continue to grow with the
economy. In both the baseline and reference cases, the economy is assumed to grow at a rate of 2.1% per annum. By 2035, absolute carbon emissions increase from 2008 levels of 75 Mt, reaching 105 Mt by 2050. The large decrease in emissions from 2009 to 2012 is due to the required 18% reduction in emission intensity in the power sector outlined in the government plan.u It should be noted that the small difference between the reference and baseline scenarios in 2008 is due to the implementation of some government policies prior to 2008. Figure 10 illustrates the CO
2 emissions from the BAU and reference cases in MtCO
2e over time.
Note that while overall cumulative emissions reductions occur, the reference case still sees an increase in emissions from current levels over time, and by 2050.
u The only commercial sub-sector that maintains an absolute emission reduction is Education, which achieves a 5% reduc-
tion from 2008 levels.
FIGURE 10
Total Commercial Sector Emissions under theBaseline andReference Cases
Mt
CO
2e
2014 2020 2026 2032 2038 2044 2050
155 MtCO2
105 MtCO2
53 MtCO2
180
160
140
120
100
80
60
40
20
BASELINE REFERENCE
TARGET

59
6.2 CaRbon PRICe sCenaRIo
The first scenario modelled in this study was the implementation of a market-wide price on carbon. Assumptions used in the modelling analysis followed the NRTEE “Fast and Deep” scenario,88 which was chosen based on NRTEE research conducted in 2007 that found the prices as outlined in Table 6 to be the most effective in achieving deep emissions reductions. The “Fast and Deep” pricing scenario is designed to achieve the government’s absolute target of 20% overall, Canada-wide emissions reductions by 2020, and 65% reduction by 2050 from 2006 levels.
Applying a carbon price reduces emissions further from the baseline and reference scenarios.When the carbon price scenario is applied to the commercial building sector, total emissions decrease by just over 10% by 2050, relative to the reference scenario (Figure 11). However, when compared to the BAU scenario, emission reductions amount to 39% by 2050 (95 MtCO
2e per year). Both are short of the target of 66% below the BAU scenario by 2050,
i.e. 53 MtCO2 emissions per year by 2050.
TABLE 6
Carbon Price Scenario Assumptions
FIGURE 11
Total Emission Reductions under the Carbon Price Scenario
Emission Charges(2003$/tonne)
2011-2015
$18
2016-2020
$88
2021-2025
$176
2026-2030
$264
2031-2035
$317
2036-2040
$317
2041-2045
$317
2046-2050
$317
2014 2020 2026 2032 2038 2044 2050
155 MtCO2
53 MtCO2
Mt
CO
2e
180
160
140
120
100
80
60
40
20
REFERENCEBASELINE CARBON PRICE
105 MtCO2
95 MtCO2
TARGET

60
The carbon price scenario does not have a noticeable impact prior to 2020, as the reductions that would have been driven by the carbon price are achieved by the expected government policies contained in the reference case. These findings align with previous NRTEE work identifying that other market barriers reduce responsiveness to price signals in the sector, and therefore complementary regulatory policies are required in order to reach its emission reduction potential.
Other findings resulting from modelling the carbon price scenario are:
Total energy demand from the sector decreases by 7% by 2050, with space heating • contributing the most significant decrease at 124 PJ (or 11%) from 2008 levels.
Electricity demand increases by 4% by 2050 relative to the reference case, as new • buildings begin to select electricity for substitutable loads and heating requirements over more expensive natural gas sources. In provinces such as Alberta and Nova Scotia where the current energy mix is more carbon intensive, the motivation to switch to cleaner electricity sources may be more intense.
Investment in building infrastructure and equipment increases, growing • to approximately 11% above the reference case by 2050.
These findings have implications for policy design and help to prepare industry for possible emerging trends.
6.3 ComPlemenTaRY PolICIes sCenaRIo
Based on input from stakeholder consultation and findings from the research and analysis contained in this report, the NRTEE and SDTC identified the following policies to address energy efficiency technology adoption barriers present in Canada’s commercial building sector. These policies could encourage downstream energy efficiency investments and provide a stronger business case for accelerating upstream (i.e. RD&C) investments. They consist of command and control regulations and several types of subsidies that were deemed effective in the policy evaluation section of this report.
Due to the difficulty in quantifying the direct impacts of information programs on carbon emission reductions, they were omitted from the modelling analysis. Eight policy instruments were included in the modelling scenario:
Mandatory efficiency standards in building equipment1. Incorporation of energy into Canada’s National Building Code2. Application of accelerated Capital Cost Allowance rates to equipment3. Application of high performance standards to public buildings4. Provision of resources to increase skills development in the workforce5. Provision of resources to expedite the building permit process6. Implementation of an energy efficiency tax credit7. Promotion of the Canadian building commissioning industry8.

61
When all eight policies are modelled, emissions reach 86 MtCO2 per year by 2050, a reduction
of 19% below the reference scenario. Relative to the baseline (BAU) scenario, emissions are reduced by 45%. However, while absolute reductions are sustained for a period, total emissions climb back up to 2008 levels by 2042, and increase to 86 Mt in 2050 as illustrated in Figure 12. Emissions are lowest in 2018, amounting to 63 MtCO
2e; however, absolute
emission reductions are not attained by 2050, again resulting in an emission level much higher than the targeted 53 Mt.
Other findings resulting from the Complementary Policies Scenario that have implications for policy development include the following:
Fuel expenditures decrease significantly, dropping by 15% from the reference case;• The largest decrease in energy demand occurs in space heating, similar to the result •
found in the carbon price scenario;There are relatively significant emissions reductions related to water heating (14%) •
and air cooling (33%); andEmission intensity decreases across all sub-sectors, by 17% on average, with the greatest •
increases in efficiency occurring in the Finance, Insurance and Real Estate (FIRE), Offices and Wholesales sub-sectors.
FIGURE 12
Total Commercial Building Emissions under theComplementaryPolicies Scenario
When all eight policies are modelled, emissions reach 86 MtCO2 per
year by 2050, a reduction of 19% below the reference scenario.
2014 2020 2026 2032 2038 2044 2050
105 MtCO2
86 MtCO2
155 MtCO2
53 MtCO2
Mt
CO
2e
180
160
140
120
100
80
60
40
20
REFERENCEBASELINE POLICIES
TARGET

62
6.4 CombIneD sCenaRIo
To further assess the impact of both carbon pricing and complementary policies, a modelling scenario combining the two was conducted. When the complementary commercial building policies are modelled with the market-wide carbon price signal, emission reductions are the greatest, reaching 82 MtCO
2e, or 24% below the reference case and 47% below the BAU case by
2050v as shown in Figure 13. Absolute decreases in emissions compared to 2008 levels in 2050 are achieved in the Food, Lodging, Recreation, Education, and FIRE sub-sectors as illustrated in Figure 14. All other sub-sectors increase in absolute emissions by 2050 as compared to 2008 levels due to an increase in the number of new buildings related to population and economic growth.
FIGURE 13
Combined Impacts of aCarbon Price andComplementary Policies
v The total reduction under this scenario is not the combined total of the carbon price and policy sce-narios. Instead, some of the reductions that were driven by the price on carbon overlap with those driven by the policies; in essence, they overlap.
When the complementary commercial building policies are modelled with the market-wide carbon price signal, emission reductions are the greatest, reaching 82 MtCO
2e, or 24% below the reference case and 47%
below the BAU case by 2050.
2014 2020 2026 2032 2038 2044 2050
155 MtCO2
53 MtCO2
Mt
CO
2e
180
160
140
120
100
80
60
40
20
POLICIESCARBON PRICEREFERENCEBASELINE COMBINED
105 MtCO295 MtCO286 MtCO282 MtCO2
TARGET

63
FIGURE 14
Absolute Changes inEmissions per BuildingSub-sector from 2008levels in 2050
6.5 RegUlaToRY sCenaRIo
Modelling results for the combined scenario are not sufficient to achieve the emission reduction target of 53 MtCO
2e per year by 2050, but the policies contained in it can play a
role in preparing the industry for more stringent regulatory measures. A second modelling analysis applying mandatory regulations together with an economy-wide carbon price was conducted for the commercial building sector to assess the effectiveness of this more stringent approach in realizing significant emission reductions. The scenario combined the “fast and deep” emissions price that was used for the carbon price scenario with the addition of the basic LEED® certification as a regulation for all new buildings.
This modelling analysis also accounted for the incorporation of renewable energy and cogeneration to achieve emissions reductions. Figure 15 shows the results of this regulatory scenario. By 2050, emissions in the commercial building sector decreased by 65% from 2008 levels in this analysis, thus exceeding the sector target of 66% below BAU by 2050. This scenario also shows the feasibility of the industry vision captured by SDTC that targets an emission reduction of 50% below the 2007 level by 2030.
-2 -1 0 1 2
Mt CO2e
TRANSPORTATION SERVICES
COMMUNICATION
ELECTRIC UTILITIES
GAS UTILITIES
WATER & OTHER UTILITIES
WHOLESALE
RETAIL
FIRE (FINANCE, INSURANCE AND REAL ESTATE)
OFFICES - BUSINESS SERVICES
EDUCATION
HEALTH & SOCIAL
FOOD, LODGING, RECREATION
GOVERNMENT

64
FIGURE 15
Combined Impact of aCarbon Price andRegulations
Given the current low levels of industry awareness and energy efficiency technology deployment, it is unrealistic to implement immediate sector-wide mandatory regulations on all new and existing commercial buildings, despite the identified environmental benefits of doing so. Neither the building industry nor Canadian governments are prepared for a scenario in which all buildings have to be immediately retrofitted. Time is required to ensure that skilled workers, information resources, and technologies are available in the required quantities, etc. A phased approach to regulation will be required, with the policy recommendations contained in this report feeding into the process in order to ensure that economic competitiveness is maintained over time.
A phased approach to regulation will be required, with the policyrecommendations contained in this report feeding into the process in order to ensure that economic competitiveness is maintained over time.
Note: Due to the fact that the Regulatory Scenario modelling did not account for electricity allocated emis-sions, the absolute emissions numbers are different; therefore, the % change in MtCO2e was used as the value on the x-axis for consistency in comparing findings from the other scenarios modelled.
2015 2020 2025 2030 2035 2040 2045
% C
HA
NG
E I
N M
tC0
2e
200%
INDUSTRY VISION:50% BELOW 2007LEVELS BY 2030
TARGET:66% BELOW BAUIN 2050
180%
160%
140%
120%
100%
80%
60%
40%
20%
BAU F&D, PLUS REGS

PolICY ReCommenDaTIons
RECOMMENDATION 1: IMPLEMENT AN ECONOMY-WIDE PRICE SIGNAL
RECOMMENDATION 2: INCORPORATE COMMAND AND CONTROL REGULATIONS
RECOMMENDATION 3: USE A VARIETY OF SUBSIDIES TO OVERCOME FINANCIAL RISKS
RECOMMENDATION 4: PROMOTE VOLUNTARY ACTIONS AND INFORMATION RESOURCES

7.0

67
7.0 POLICy RECOmmENDATIONS
The following policy recommendations include a range of instruments that, when combined, form a policy pathway for increasing both upstream and downstream investments in energy efficiency in commercial buildings. They are intended to fit within a broader, multi-sector energy policy strategy that includes the use of renewable energy, on-site energy generation, and energy sharing, in order to reduce energy use and related emissions. This broader policy should include pricing reforms for all energy types to reflect their full economic, environmental, and social costs. This report includes high-level policy recommendations and does not address issues of program design. Further analysis may be required by program administrators to determine implementation and evaluation details.
When the four broad categories of policy instruments are compared, market-wide price signals are found to be the most effective for reducing emissions in the commercial building sector, and to have high net benefits to society of mitigation. Command and control instruments can also lead to effective and cost-efficient reductions of carbon emissions in the sector, especially when combined with regulatory measures. Subsidies such as fiscal instruments and incentives have varying results, in large part due to their program design structure.89 Although the list of policy instruments identified in this report does include several subsidies, it is important to note that they should be phased out when appropriate, should not be technology-specific, and their design should consider free ridership rebound and other additionality issues. Voluntary actions and information programs can lead to long-term behaviour change and some emissions reductions at relatively low costs; however, their impacts are difficult to quantify so they were not included in the modelling analysis, but are still included in the recommended suite of policies outlined below.
... market-wide price signals are found to be the most effective forreducing emissions in the commercial building sector, and to have high net benefits to society of mitigation. Command and controlinstruments can also lead to effective and cost-efficient reductions of carbon emissions in the sector, especially when combined withregulatory measures.
Emissions price•
Carbon/ energy tax•
Cap and trade system•
ECONOMY-WIDE PRICE SIGNALS
Building codes•
MEPS•
Mandatory labelling•
Mandatory performance •
for public buildings
Sector-wide performance •
regulations
COMMAND & CONTROL REGULATIONS
Capital & fiscal incentives•
Tech funds •
Funding for education •
& info programs
SUBSIDIES
Information & •
performance
Voluntary building •
commissioning
VOLUNTARY ACTIONS

68
ReCommenDaTIon 1
IMPLEMENT AN ECONOMY-WIDE PRICE SIGNAL
Past research by SDTC and the NRTEE, as well as the modelling analysis conducted for this report, reveals that a strong and consistent price on carbon emissions is required to achieve the emissions reductions targets established by the Government of Canada. Such an emissions price would also result in GHG reductions for the commercial building sector. Further research is currently underway by the NRTEE as to the most appropriate program design for implementing this economic signal and is expected to be released publicly in early 2009.
ReCommenDaTIon 2
INCORPORATE COMMAND AND CONTROL REGULATIONS
a) Incorporate Energy Efficiency into Canada’s National Building Code
The National Building Code (NBC) is used as a model by most provinces/territories from which to base their codes, making it an important policy tool for reaching other governing jurisdictions. We recommend that the code incorporate energy efficiency as a core objective and that it be updated at least every five years with increased minimum standards. It must be stringently enforced and adapted to reflect changes in technology and building design practices. Provinces should be encouraged to accelerate updates to their codes to keep up to date with technology advancements and to enhance enforcement mechanisms.
b) Establish Higher Efficiency Standards for Building Equipment
Research shows that command and control policy instruments are successful for increasing energy efficiency, both in terms of cost and environmental effectiveness.90 We recommend that minimum efficiency performance standards (MEPS) be applied to an increased number of energy-using technologies in commercial buildings including lighting, heating, ventilating and air conditioning (HVAC) systems, and auxiliary equipment. Since most of the energy-consuming equipment in buildings is imported to Canada, updated performance standards need to be applied to imports of applicable products. Success factors for this policy measure include aggressive measures that enable innovation, and frequent, continuous updates to the scope and stringency of the MEPS.
c) Implement a Building Labelling Program
Lack of available data for assessing energy consumption in commercial buildings is a barrier to policy monitoring and evaluation that can be addressed with mandatory labelling. We recommend that buildings be required to publicly expose information about the amount and type of energy they consume, so that tenants and investors can make informed buying decisions. Building labels can be valuable marketing tools for industry and help to create baseline data for comparison and for setting policy targets. These labels can also be integral to developing market-based policies and emissions trading certificate schemes for buildings.
69
d) Apply Mandatory Performance Standards to Public Buildings
The Government of Canada manages more than 45,000 buildings, representing more than 10% of the country’s total commercial and institutional stock. Since April 2005 all new federal buildings have been required to meet the Canada Green Building Council’s LEED® Gold certification, which results in energy efficiencies over 30% higher than the one set by the MNECB. Existing government buildings are also subject to third party certification; however, the rate of retrofits needs to be accelerated, life-cycle accounting needs to be incorporated, and performance maintenance issues need to be addressed. We recommend that the government demonstrate leadership in energy efficiency performance by committing to mandatory building commissioning and labelling for its building stock. Procurement practices need to value energy efficiency products above other options, and government departments and agencies require greater flexibility for upgrading their buildings.
e) Implement Sector-wide Performance Regulations
According to the modelling analysis contained in this report, in the absence of mandatory, sector-wide performance regulations, CO
2 emissions reductions from the commercial
building sector will not attain the targeted reduction of 53 Mt per year by 2050 identified by the NRTEE, or the industry vision identified by SDTC of 36 Mt in 2030. Despite this acknowledgement, the sector requires policy certainty regarding impending regulations and the time to prepare for their implementation. We therefore recommend that a regulatory framework for the commercial building sector be developed in the short term, to be implemented sector-wide by 2030. Emphasis on performance-based regulations is important in order to reduce the risk of sub-optimal performance in buildings over time.
ReCommenDaTIon 3
USE A VARIETY OF SUBSIDIES TO OVERCOME FINANCIAL RISKS
a) Apply Accelerated Capital Cost Allowance Rates to Equipment
We recommend that fiscal instruments such as capital cost allowances (CCAs) be used to speed up the write-off period of energy efficient equipment. This tool has been applied to efficient and renewable energy producing equipment in industrial processesw and accelerated amortization rates should be applied to efficient energy-using equipment in the commercial building sector. In a survey conducted by the Real Property Association of Canada (REALpac)x, accelerated CCA rates were given the highest priority for federal level policy recommendations related to increasing investment. To be successful, the benefits of accelerated CCAs need to be communicated to building developers, owners, and investors. Classes eligible for new rates should be non-technology specific in order to leave the decision authority for technology selection in the hands of consumers.
w Class 43.1 provides an accelerated rate of write-off (30% per year, on a declining balance basis) for investments that
produce heat for use in an industrial process or electricity by using fossil fuel efficiently or by using renewable energy
sources. The specific criteria are set out in Schedule II of the Income Tax Regulations.
x REALpac is Canada’s senior national industry association for owners of investment real estate. Its green survey was
administered during the summer of 2008 and was distributed to 1400 members, of which 100 responded.
70
y Legislation passed in 2000, Part II of Chapter 63 of the Laws of 2000, establishes a Green Building Tax Credit to be
allowable against various business and personal income taxes. The Green Building Tax Credit provides for tax credits to
owners and tenants of eligible buildings and tenant spaces which meet certain “green” standards. Total aggregate credits
are $25 million and a certificate from a licensed architect or engineer is required each year to guarantee performance is
upheld.
b) Use Capital and Fiscal Incentives to Overcome Financial Risks
Similar to the model used in New York State,y we recommend that Canada consider offering a tax incentive to building owners and tenants who operate or inhabit energy efficient spaces. The total aggregate spending would be capped and eligible taxpayers would be required to submit proof of performance with their tax return in the form of a commissioning certificate or other third-party verification.
c) Provide Loan Guarantees to Offset Capital Costs
In order to overcome financing barriers, we recommend that the federal government follow Japan’s example and work with the energy service companies (ESCOs) in Canada to provide financial guarantees to mobilize green lease programs. These loans offset upfront costs to accelerate equipment switching in existing buildings and investment in efficient technologies in new buildings. ESCOs provide an assessment of the current levels of building efficiency and recommend areas for improvement where cost savings can be incurred. The loan repayment schedules are set based on the expected payback from upgrading the equipment. Once the loan is repaid the company reaps the ongoing cost benefits. Monitoring mechanisms to ensure the equipment is installed and functioning properly are key requirements for the implementation of this policy instrument and to ensure that free ridership is minimized.
d) Provide Funding to Create an Advanced Investment Strategy for RD&C
Research, development and commercialization (RD&C) strategies are vital for continuous technology advancement and improvements in energy efficiency over time. We recommend that a long term strategy for energy efficient commercial building equipment, fuel switching technologies, and energy sharing technologies be established now to prepare for an uncertain and changing future Canadian industry. Funding mechanisms, support resources, demonstration projects and procurement opportunities are all required for a comprehensive RD&C strategy.
This long-term RD&C strategy should seek to foster two types of energy investments:
Upstream Investments:1. Investments made in emerging sustainable technologies, which have a longer timeline to market entry but have a greater potential for larger and more sustained emissions reductions. Today’s emerging technologies will eventually become the market norm, and help to raise industry standards. SDTC focuses on this type of investment, and serves to accelerate these technologies into the market.
Downstream Investments:2. Purchases made by end-users (e.g. building owners) of technologies currently on the market. These technologies are readily available but often lack the strong environmental attributes required to make deep reductions in emissions.

71
The driving forces and market challenges can be quite different in each case, but both forms of investment are required as part of a comprehensive approach to improve Canada’s energy efficiency and to reduce emissions. From a policy design perspective, this means that a range of policy options to optimize market impacts over time must be considered in the long-term strategy.
e) Provide Resources to Increase Skills Development
Canada is facing a labour shortage in the construction sector,91 making it difficult to find workers to complete projects let alone ones who are knowledgeable in advanced energy efficiency technologies and operating processes. Building operators, contractors and inspectors are particularly in need of increased training in energy efficiency. Integrated design processes require that practitioners from all phases of the project work together to maximize efficiency. Given that the construction industry is slow to change and major worker shortages are expected, we recommend that the federal government play a role in providing funding and information resources to education providers and industry that are developing curricula to train practitioners in energy efficiency. Training courses targeted at the current workforce and industry incentives to provide training to its employees will be required to improve operating performance in commercial buildings. We also recommend that governments provide funding to Canadian universities and colleges to support development of new integrated design programs where future engineers and architects work with future contractors, trades people, and building inspectors and operators.
ReCommenDaTIon 4
PROMOTE VOLUNTARY ACTIONS AND INFORMATION RESOURCES
a) Promote Energy Efficiency through Information Programs and Campaigns
Targeted information is required to better inform commercial building investors, owners, operators and tenants about available government services and the benefits of using them. There is a general lack of information about the quantity and type of energy used in commercial buildings and the potential impacts of reducing it. We recommend that the federal and other levels of government invest in educating the public and industry about how to select, install, and monitor energy efficient equipment in order to address the barrier of high transaction costs. Better information also needs to be made available about how Canadian buildings compare to those in other countries in terms of energy performance, and opportunities for improvement.

72
b) Provide Resources to Expedite the Building Permit Process
Building officials charged with approving permits are often overworked and do not have resources for training or updating the permitting process. As a result they may be ill-equipped to deal with building processes that do not adhere to standard practices, which causes delays in the application process. For each month a permit is delayed the cost can range from an interest equivalent of 7-20% depending on the stage of the project.z The extra clarification required can also cost time and money to the developer. Although the federal government cannot directly expedite the permitting process for efficient projects as this falls within provincial and municipal jurisdictions, we recommend that it encourage information sharing between and develop resources for building inspectors and other officials in the provinces/territories and municipalities. A database of best practices and case examples for “green permits” would be valuable to overcome time delays experienced with building permits. Benefits for building developers from such resources will be time and dollar savings, as well as a stronger ability to confirm project scheduling dates with buyers and/or tenants.
c) Create a Service Centre for Building Performance
The commercial building industry is frustrated with current policy fragmentation and lack of an accessible unified information resource about available programs, tax policies, inspection processes, and other publicly funded services. Much like the Service Canada model for providing a single delivery network of government services and benefits, we recommend that a resource for green building performance supported by all governments provide information about codes and standards, tradeoffs between energy efficiency and water use, waste generation, air quality, etc. Such a service centre would contribute to removing technology adoption barriers associated with the lack of and complexity of available information.
d) Establish and Regulate Building Commissioning Standards
Underperforming systems are frequently cited barriers to energy efficiency. Despite the fact that commissioning has been linked to both economic and environmental benefits, the industry is very young in Canada and awareness of it is low. It is recommended that the federal government work with relevant organizations to develop standards for commissioning practitioners and processes, and to build capacity of the building commissioning industry. Once standards and capacity are established, we recommend that regulation be established for mandatory building commissioning as part of the construction process. Capital and fiscal incentives can then be linked to commissioning reports, which may serve as pre-requisites to tax credits or other financial instruments to promote energy efficiency.
z Estimate based on stakeholder consultation.

PolICY PaTHWaY
The primary objective for this work was to create a time-sequenced pathway for federal policies to address identified barriers in the commercial building sector in an economic and environmentally efficient manner.

8.0

75
A comprehensive, integrated approach to guide policy makers
is essential to develop the most effective policy framework to
secure carbon emission reductions from the commercial building
sector and improve energy efficiency. Figure 16 is a graphical
representation of this pathway, which incorporates the policy
recommendations derived from the research and analysis con-
tained in this report.
Together, the market-wide carbon price signal and comple-
mentary policy recommendations form the basis for the policy
pathway. Policy recommendations are included for immediate
implementation so that emissions reductions can be incurred in
the short term and the industry can be prepared for a new,
mandatory regulatory framework. Between 2025 and 2030 as
emissions begin to rise again following implementation of the
initial policy suite, mandatory regulations will be required
in order to continue a downward trend in emissions from
commercial buildings. If implemented, this policy pathway has
the potential to result in significant, absolute carbon emission
reductions from commercial buildings. It will decrease energy
consumption within this sector, and help build a new industry
in energy efficiency, renewable energy, and cogeneration
equipment for Canada.
The primary objective for this work was to create a time-sequenced pathway for federal policies to address identified barriers in the commercial building sector in an economic and environmentally efficient manner.

76
A D
ETA
CH
AB
LE
VE
RS
ION
OF T
HIS
PO
LIC
Y P
ATH
WAY D
IAG
RA
M C
AN
BE
FO
UN
D I
N S
EC
TIO
N 1
1 O
F T
HE
RE
PO
RT.
Po
lIC
Y P
aT
HW
aY
fo
R g
Hg
Re
DU
CT
Ion
sR
ES
ULT
ING
FR
OM
EN
ER
GY
EF
FIC
IEN
CY
IN C
OM
ME
RC
IAL
BU
ILD
ING
S
20
09
20
10
20
15
20
20
20
25
20
30
20
35
20
40
20
45
20
50
50
%
10
0%
15
0%
20
0%
Cre
ate
serv
ice
cente
r fo
r buil
din
g per
form
ance
Acc
eler
ate
CC
A r
ates
Pro
vide
reso
urc
es t
o ex
ped
ite
the
buil
din
g per
mit
pro
cess
Imple
men
t buil
din
g la
bel
ling
pro
gram
Inco
rpor
ate
ener
gy e
ffic
iency
into
Can
ada'
s N
atio
nal
Buil
din
g C
ode
Pro
mot
e en
ergy
eff
icie
ncy
thro
ugh
info
rmat
ion
pro
gram
s an
d ca
mpai
gns
Updat
e eq
uip
men
t st
andar
ds
(ME
PS
)
App
ly m
anda
tory
per
form
ance
sta
ndar
ds t
o pu
blic
bui
ldin
gs
Est
abli
sh a
nd
regu
late
buil
din
g co
mm
issi
onin
g st
andar
ds
Use
fis
cal a
nd c
apit
al in
cent
ives
to
over
com
e ri
sks
Pro
vide
reso
urc
es t
o in
crea
se s
kill
s dev
elop
men
t
Updat
e eq
uip
men
t st
andar
ds
(ME
PS
)
Imple
men
t se
cto
r-w
ide
per
form
ance
reg
ula
tion
s
Pro
vide
loan
guar
ante
es t
o of
fset
cap
ital
cos
ts
Imple
men
t an
eco
nom
y-w
ide
pri
ce s
ignal
Pro
vide
fundin
g to
cre
ate
an a
dva
nce
d in
vest
men
t st
rate
gy f
or R
D&
C
BAU
Em
issi
ons
begi
n to
clim
b ag
ain
by 2
03
0 w
itho
ut m
anda
tory
se
ctor
-wid
e re
gula
tion
s
Man
dato
ry r
egul
atio
ns r
esul
t in
abs
olut
e em
issi
ons
redu
ctio
ns
20
7%
10
9%
35
%
% CHANGE IN EMISSIONS (MtCO2e) POLICY INSTRUMENTS
Pol
icie
s ar
e re
quir
ed in
the
shor
t-te
rm t
o pr
epar
e th
e se
ctor
for
regu
lati
ons
CAR
BO
N
PR
ICIN
G+
REG
S
20
09
20
10
20
15
20
20
20
25
20
30
20
35
20
40
20
45
20
50
Eco
nom
y-w
ide
pri
ce s
ignal
sC
omm
and
& c
ontr
ol r
egula
tion
sVo
lunta
ry a
ctio
ns
& i
nfo
rmat
ion
reso
urc
esS
ubsi
die
s
CAR
BO
NP
RIC
ING
+P
OLI
CIE
S

enDnoTes

9.0

79
1 Levine et al. (2007). Residential and commercial buildings. In Climate Change 2007: Mitigation. Contribution of Working Group III to the Fourth Assessment Report of the IPCC. Cambridge University Press: Cambridge, UK and New York, USA.
2 Canadian Environmental Commission (CEC) (2008). Green Building in North America: Opportunities and Challenges. CEC: Montréal.
3 WBCSD (2007). Energy Efficiency in Buildings: Business realities and opportunities, Summary Report. Accessed at: http://www.wbcsd.org/DocRoot/JE5VEiMxqIxeMoOWfcYT/ EEB-Facts-and-trends.pdf on November 26, 2008.
4 Environment Canada (2007). Turning the Corner: Canada’s plan to reduce greenhouse gas emissions and air pollution. Government of Canada: Ottawa.
5 Environment Canada (2007). Regulatory Framework for Air Emissions. Government of Canada: Ottawa.
6 NRCan (2007). “Energy Minister’s Conference: Collaborating on Canada’s Energy Future”. Accessed at: http://www.nrcan-rncan.gc.ca/media/newcom/2007/200790-eng.php on October 6, 2008.
7 Council of Energy Ministers (2007). Moving Forward on Energy Efficiency in Canada: A Foundation for Action. Government of Canada: Ottawa, p. 3.
8 Justice Canada (1993). “National Round Table on the Environment and the Economy Act”. Accessed at: http://laws.justice.gc.ca/en/ShowFullDoc/cs/n-16.4///en on October 28, 2008.
9 NRTEE (2006). Advice on a Long-term Strategy on Energy and Climate Change. Accessed at: http://www.nrtee-trnee.ca/eng/publications/wedge-advisory-note/ecc-wedge-advisory-note.pdf on November 26, 2008.
10 ICF Consulting Canada Inc. (2006). Energy-Related Greenhouse Gas Emissions in Canada in 2050 – A Low-Emission Scenario. Prepared for the NRTEE, August 15, 2008, pp.116-118.
11 NRCan (2002). “Appendix D: Glossary”. Commercial and Institutional Building Energy Use Survey, Detailed Statistical Report. Government of Canada: Ottawa.
12 Ibid.
13 SDTC (2007). Commercial Buildings — Eco-Efficiency SD Business Case™ Sustainable Development Business Case Report. SDTC: Ottawa, p.17.
14 NRCan, Office of Energy Efficiency (2007). “Commercial/ Institutional Sector Canada, Table 2: Secondary Energy Use and GHG Emissions by Activity Type – Including Electricity-Related Emissions”. Accessed at: http://www.oee.nrcan.gc.ca/corporate/statistics/neud/dpa/tablestrends2/com_ca_2_e_2.cfm?attr=0 on October 8, 2008.
15 Ibid.
16 Ibid.
17 NRCan (2008). “Appendix D: Glossary”. Industrial Consumption of Energy Survey. Government of Canada: Ottawa. Accessed at: http://www.oee.nrcan.gc.ca/publications/statistics/ice05/ appendixd.cfm?attr=0 on October 14, 2008.

80
18 NRCan (2007). Commercial and Institutional Consumption of Energy Survey, 2005 Summary Report – June, 2007. Government of Canada: Ottawa. Accessed at: http://oee.nrcan.gc.ca/ Publications/statistics/cices06/chapter1.cfm?attr=0 on October 8, 2008.
19 Statistics Canada (2008). “Value of Building Permits by Type”. Accessed at: http://www40.statcan.gc.ca/l01/cst01/manuf16-eng.htm on November 26, 2008.
20 SDTC (2007) Commercial Buildings — Eco-Efficiency SD Business Case™ Sustainable Development Business Case Report. SDTC: Ottawa, p.17.
21 ICF International (2008). “Policy Options for Energy Efficiency in Canada’s Commercial Buildings: Final Report”. Prepared for the NRTEE, August 15, p.8.
22 Ibid.
23 NRCan (2007). Commercial and Institutional Consumption of Energy Survey, 2005 Summary Report – June, 2007. Government of Canada: Ottawa. Accessed at: http://oee.nrcan.gc.ca/Pub-lications/statistics/cices06/chapter5.cfm?attr=0 on October 8, 2008.
24 Ibid.
25 NRCan, Office of Energy Efficiency (2007). “Commercial/ Institutional Sector Canada, Table 2: Secondary Energy Use and GHG Emissions by Activity Type – Including Electricity-Related Emissions”. Accessed at: http://www.oee.nrcan.gc.ca/corporate/statistics/neud/dpa/tablestrends2/com_ca_2_e_2.cfm?attr=0 on November 4, 2008.
26 ICF International (2008). “Policy Options for Energy Efficiency in Canada’s Commercial Buildings: Final Report”. Prepared for the NRTEE, August 15, 2008, p.7.
27 National Energy Board (2006). Emerging Technologies in Electricity Generation. Government of Canada: Ottawa, p.3.
28 NRCan (2008). “Overview of Canada’s Energy Policy”. Accessed at: http://www.nrcan-rncan.gc.ca/com/eneene/owevue-eng.php on October 6, 2008.
29 NRTEE (2008). “Appendix B”. Response of the National Round Table on the Environment and the Economy to its Obligations Under the Kyoto Protocol Implementation Act. NRTEE: Ot-tawa, p.30. Accessed at: http://www.nrtee-trnee.ca/eng/publications/KPIA-2008/kpia-2008.pdf on November 26, 2008.
30 SDTC (2007). Commercial Buildings — Eco-Efficiency SD Business Case™ Sustainable Development Business Case Report. SDTC: Ottawa, p.38.
31 Pembina Institute (2005). Government Spending on Canada’s Oil and Gas Industry: Under-mining Canada’s Kyoto Commitment. Prepared for Climate Action Network Canada. Accessed at: http://pubs.pembina.org/reports/GovtSpendingOnOilAndGasFullReport.pdf on October 22, 2008.
32 OECD (2003). “Glossary of Statistical Terms”. Accessed at: http://stats.oecd.org/glossary/detail.asp?ID=824 on August 5, 2008.

81
33 David Suzuki Foundation (2007). Prescription for a Healthy Canada. David Suzuki Foundation: Vancouver. Accessed at: http://www.davidsuzuki.org/health/National_Strategy.asp on November 26, 2008.
34 Urge-Vorsatz, D. Koeppel, S. Mirasgedis, S. (2007). “Appraisal of policy instruments for reducing buildings’ CO2 emissions”. Building Research & Information 35:4 pp. 458-477.
35 NRTEE (2007). Getting to 2050: Canada’s Transition to a Low-emission Future. NRTEE: Ottawa, p.11.
36 SDTC (2007). Commercial Buildings — Eco-Efficiency SD Business Case™ Sustainable Development Business Case Report. SDTC: Ottawa, p.37.
37 Organisation for Economic Co-operation and Development (OECD) (1989). Economic Instruments for Environmental Protection. OECD: Paris.
38 Urge-Vorsatz, D. Koeppel, S. Mirasgedis, S. (2007). “Appraisal of policy instruments for reducing buildings’ CO2 emissions”. Building Research & Information 35:4, pp.458-477.
39 Ibid.
40 OECD (2003). Environmentally Sustainable Buildings – Challenges and Policie. OECD: Paris.
41 Urge-Vorsatz, D. Koeppel, S. Mirasgedis, S. (2007). “Appraisal of policy instruments for reducing buildings’ CO2 emissions”. Building Research & Information 35:4, pp.458-477.
42 Ibid.
43 Ibid.
44 IEA (2005). Evaluating Energy Efficiency Policy Measures & DSM Programmes - Evaluation Guidebook. IEA:Paris, vol. 1.
45 Nadel, S., deLaski,, A., Eldridge, M., Kleisch, J. (2006). Leading the way: continued oppor-tunities for new state appliance and equipment efficiency standards. ACEEE: Washington.
46 Canada Gazette (2008). “Regulations Amending the Energy Efficiency Regulations”. Accessed at: http://gazetteducanada.gc.ca/partI/2008/20080329/html/regle4-e.html on November 26, 2008.
47 Urge-Vorsatz, D. Koeppel, S. Mirasgedis, S. “Is there a silver bullet? – A comparative assessment of twenty policy instruments applied worldwide for enhancing energy efficiency in buildings”. Accessed at: http://web.ceu.hu/envsci/projects/UNEPP/policypaperECEEE.pdf on November 26, 2008.
48 Urge-Vorsatz, D. Koeppel, S. Mirasgedis, S. (2007). “Appraisal of policy instruments for reducing buildings’ CO2 emissions”. Building Research & Information 35:4, pp.458-477.
49 Communities and Local Government, UK (2008). “Energy Performance of Buildings”. Accessed at: http://www.communities.gov.uk/planningandbuilding/theenvironment/ energyperformance/ on October 16, 2008.

82
50 NRTEE (2008). Response of the National Round Table on the Environment and the Economy to its Obligations Under the Kyoto Protocol Implementation Act. NRTEE: Ottawa.
51 Communities and Local Government, UK (2008). “Energy Performance of Buildings”. Accessed at: http://www.communities.gov.uk/planningandbuilding/theenvironment/ energyperformance/ on October 16, 2008.
52 NRTEE (2008). “Appendix B”. Response of the National Round Table on the Environment and the Economy to its Obligations Under the Kyoto Protocol Implementation Act. NRTEE: Ottawa, p.30. Accessed at: http://www.nrtee-trnee.ca/eng/publications/KPIA-2008/kpia-2008.pdf on November 26, 2008.
53 Urge-Vorsatz, D. Koeppel, S. Mirasgedis, S. (2007). “Appraisal of policy instruments for reducing buildings’ CO2 emissions”. Building Research & Information 35:4, pp.458-477.
54 Urge-Vorsatz, D. Koeppel, S. Mirasgedis, S. “Is there a silver bullet? – A comparative assessment of twenty policy instruments applied worldwide for enhancing energy efficiency in buildings”. Accessed at: http://web.ceu.hu/envsci/projects/UNEPP/policypaperECEEE.pdf on November 26, 2008.
55 NRTEE (2008). Response of the National Round Table on the Environment and the Economy to its Obligations Under the Kyoto Protocol Implementation Act. NRTEE: Ottawa. Accessed at: http://www.nrtee-trnee.ca/eng/publications/KPIA-2008/kpia-2008.pdf on November 26, 2008.
56 Finance Canada (2005). “Annex 4 –A Framework for Evaluation of Environmental Tax Proposals”. Budget 2005. Government of Canada: Ottawa. Accessed at: http://www.fin.gc.ca/budget05/bp/bpa4e.htm on November 26, 2008.
57 Quinlan, P. Geller, H. Nadel, S. (2001). Tax Incentives for Innovative Energy-Efficient Technologies (Updated). ACEEE Report No. E013. ACEEE: Washington, DC.
58 Ibid.
59 NRCan, Office of Energy Research and Development (2008). EcoEnergy Technology Initiative (A New Federal World). Accessed at: http://www2.nrcan.gc.ca/ES/OERD/English/ View.asp?x=1603 on October 22, 2008.
60 Reed, J., Jordan, G., Vine, E. (2007). Impact Evaluation Framework for Technology Deploy-ment Programs. Accessed at: http://www.cee1.org/eval/impact_framework_tech_deploy_2007_main.pdf on November 26, 2008.
61 POLLARA (2002). “Determining Impact Attribution for the Canadian Industry Program for Energy Conservation (CIPEC).”
62 Mills, E. et al. (2005). “The Cost-Effectiveness of Commissioning New and Existing Commercial Buildings: Lessons from 224 Buildings”. National Conference on Building Commissioning: May 4-6, 2005.

83
63 Urge-Vorsatz, D. Koeppel, S. Mirasgedis, S. “Is there a silver bullet? – A comparative assessment of twenty policy instruments applied worldwide for enhancing energy efficiency in buildings.” Accessed at: http://web.ceu.hu/envsci/projects/UNEPP/policypaperECEEE.pdf on November 26, 2008.
64 Intergovernmental Panel on Climate Change (IPCC) (2007). Climate Change 2007: Mitigation - Contribution of Working Group III to the Fourth Assessment Report of the IPCC. Cambridge University Press: NY. Accessed at: http://www.ipcc.ch/ipccreports/ar4-wg3.htm on November 26, 2008.
65 E Source Energy Business Intelligence (2001). Automated Building Diagnostics: Improving Energy Performance and Occupant Comfort. E Source: Boulder.
66 Mills, E. et al. (2004). “The Cost-Effectiveness of Commercial Buildings Commissioning: A Meta-Analysis of Energy and Non-Energy Impacts in Existing Buildings and New Construction in the United States: Lessons from 224 Buildings”. National Conference on Building Commis-sioning: May 4-6, 2005. Accessed at: http://www.peci.org/ncbc/proceedings/2005/19_Piette_NCBC2005.pdf on October 15, 2008.
67 Treasury Board Secretariat of Canada (TBS) (2003). “Interim Evaluation of the Treasury Board Evaluation Policy”. Accessed at: http://www.tbs-sct.gc.ca/eval/tools_outils/int-prov_e.asp on November 26, 2008.
68 Marbek Resources (2008).
69 TecMarket Works et al. (2004). The California Evaluation Framework, p.1. Accessed at: http://www.cee1.org/eval/CEF.pdf on November 26, 2008.
70 BC Government (2007). B.C. Energy Plan-A Vision for Clean Energy Leadership, p.5. Ac-cessed at: http://www.energyplan.gov.bc.ca/ on November 26, 2008.
71 California Energy Commission, (2007). Integrated Energy Policy Report Executive Summary. Accessed at: http://www.energy.ca.gov/2007publications/CEC-100-2007-008/CEC-100-2007-008-CMF-ES.PDF on November 26, 2008.
72 Ibid.
73 The Council of the Federation, (2008). “Climate Change: Fulfilling Council of the Federation Commitments.” Accessed at: http://www.councilofthefederation.ca/pdfs/COMMUNIQUE_EN_climate_changeJuly13%5B1%5Dclean.pdf on August 18, 2008.
74 Miki, T. (2006). “Energy Efficiency and Conservation Policy in Japan”, Energy Efficiency and Conservation Division Energy Division. Accessed at: http://www.nedo.go.jp/kokusai/kouhou/181206/session02/2-1.pdf November 26, 2008.
75 Nordqvist J. (2007). The top-runner policy concept: pass it down. Paper presented at the ECEEE Summer Study 2007, France.
76 Urge-Vorsatz, D. Koeppel, S. Mirasgedis, S.. “Is there a silver bullet? – A comparative assessment of twenty policy instruments applied worldwide for enhancing energy efficiency in buildings.” Accessed at: http://web.ceu.hu/envsci/projects/UNEPP/policypaperECEEE.pdf on November 26, 2008.

84
77 Nordqvist J. (2007). The top-runner policy concept: pass it down. Paper presented at the ECEEE Summer Study 2007, France.
78 European Insulation Manufacturers Association (EURIMA), (2008).“Eurima’s Position on the recast of the EPBD.” EURIMA: Belgium.
79 Ibid.
80 Australian Government Department of the Environment and Water Resources (2007). ESD Design Guide: Office and Public Buildings. Commonwealth of Australia.
81 The American Institute of Architects. (AIA) (2008). “Local Leaders in Sustainability: Green Incentives”. AIA: Washington, DC.
82 Bailie, A., Peters, R. (2006). “Successful Strategies for Energy Efficiency: A Review of Approaches in Other Jurisdictions and Recommendations for Canada”. Pembina Institute: Drayton Valley.
83 Urge-Vorsatz. D., Koeppel, S. (2007). “Appraisal of policy instruments for reducing buildings CO2 emissions”. Building Research & Information. 35:4, pp.458-477.
84 Waide, P. (2006). Energy Efficiency in the North American Existing Building Stock. International Energy Agency: Paris.
85 W.L. Lee, F.W.H. Yik. (2004). “Regulatory and voluntary approaches to for enhancing building energy efficiency”. Progress in Energy and Combustion Science 30, pp.477–499.
86 Ibid.
87 US Department of Energy, Office of Energy Efficiency and Renewable Energy. “High Performance Buildings”. Accessed at: http://www.eere.energy.gov/buildings/highperformance/ on November 26, 2008.
88 NRTEE (2008). Getting to 2050: Canada’s Transition to a Low-emission Future. NRTEE: Ottawa.
89 Urge-Vorsatz, D. Koeppel, S. Mirasgedis, S. (2007). “Appraisal of policy instruments for reducing buildings’ CO2 emissions”. Building Research & Information 35:4, pp.458-477.
90 IPCC (2007). “Residential and commercial buildings”, IPCC 4th Assessment, Chapter 6. Accessed at: http://www.ipcc.ch/pdf/assessment-report/ar4/wg3/ar4-wg3-chapter6.pdf on November 5, 2008.
91 Adair, J. (2008). “Dealing with Canada’s Construction Labour Shortage”. Accessed at: http://realtytimes.com/rtpages/20060112_labourshortage.htm on November 3, 2008.

aPPenDIX
10.1 THE NATIONAL ROUND TABLE ON THE ENVIRONMENT AND THE ECONOMY: ABOUT US10.2 NRTEE MEMBERS10.3 SUSTAINABLE DEVELOPMENT TECHNOLOGY CANADA: ABOUT US10.4 SDTC BOARD OF DIRECTORS10.5 ENERGY EFFICIENCY IN CANADA’S COMMERCIAL BUILDING SECTOR: PROGRAM PARTICIPANTS

10.0

87
10.0 APPENDIX
10.1 naTIonal RoUnD Table on THe envIRonmenT anD THe eConomY: aboUT Us
Concerns about climate change, air quality, and water availability have made Canadians and their governments increasingly aware of the need to reconcile economic and environmental objectives. That need for reconciliation—and the process of working towards it—is the National Round Table on the Environment and the Economy’s raison d’être.
A Solutions-Focused MediatorThe NRTEE has been focused on sustaining Canada’s prosperity without borrowing resources from future generations or compromising their ability to live securely.
Our mission is to generate and promote sustainable development solutionsto advance Canada’s environmental and economic interests simultaneously,
through the development of innovative policy research and advice.
We accomplish that mission by fostering sound and well-researched reports on priority issues and by offering advice to governments on how best to reconcile the often divergent challenges of economic prosperity and environmental conservation.
A Unique ConvenerThe NRTEE brings together a group of distinguished sustainability leaders active in businesses, universities, environmental groups, labour, public policy, and Aboriginal communities across Canada. Our members are appointed by the federal government for a mandate of up to three years. They meet in a round table format that offers a safe haven for discussion and encourages the unfettered exchange of ideas leading to consensus. This is how we reconcile positions that have traditionally been at odds.
A Trusted Coalition-BuilderWe also reach out to expert organizations, industries and individuals that share our vision for sustainable development. These partners help spark our creativity, challenge our thinking, keep us grounded in reality, and help generate the momentum needed for success.
An Impartial Catalyst of ChangeThe NRTEE is in the unique position of being an independent policy advisory agency that advises the federal government on sustainable development solutions. We raise awareness among Canadians and their governments about the challenges of sustainable development. We advocate for positive change. We strive to promote credible and impartial policy solutions that are in the best interest of all Canadians.
A National and International Leading ForceWe are also at the forefront of a prospective new international research network that will bring together some of the world’s most renowned sustainability research institutes. This will build our research and capacity, give us access to new thinking and proven solutions in other countries that could benefit Canada. Armed with a proven track-record in generating environment and economic solutions, we now seek to use our influence and credibility to move forward Canada’s environmental and economic priorities in concert with the world.
An Independent LeaderThe NRTEE Act enforces the independent nature of the Round Table and its work. The President and CEO is accountable to Parliament and reports, at this time, through the Minister of the Environment. The NRTEE is not an agency of Environment Canada or any other federal government department, but its estimates and reporting obligations are included within the broader environmental portfolio of government.

88
10.2 nRTee membeRs
NRTEE ChairBob Page, PhD.TransAlta Professor of Environmental Management and SustainabilityEnergy and Environmental Systems GroupInstitute for Sustainable Energy, Environment and EconomyUniversity of CalgaryCalgary, Alberta
NRTEE Vice-ChairDavid Chernushenko PresidentGreen & Gold Inc. Ottawa, Ontario
Janet BenjaminPresidentVireo Technologies Inc., and Immediate Past President of the Association of Professional EngineersNorth Vancouver, British Columbia
The Honourable Pauline Browes, P.C.DirectorWaterfront Regeneration TrustToronto, Ontario
Elizabeth BrubakerExecutive DirectorEnvironment ProbeToronto, Ontario
Angus BruneauCorporate DirectorSt. John’s, Newfoundland and Labrador
Anthony DaleVice PresidentPolicy and Public AffairsOntario Hospital AssociationToronto, Ontario
Francine DorionSt-Bruno-de-Montarville, Quebec
Robert DubéPresidentAtout Personnel Montreal, Quebec
Timothy HaigPresident and CEOBIOX Corporation
Vice-Chair (Past Chair)Canadian Renewable Fuels AssociationOakville, Ontario
Christopher HilkenePresidentClean Water FoundationToronto, Ontario
Mark JaccardProfessorSchool of Resource and Environmental ManagementSimon Fraser UniversityVancouver, British Columbia
Donald MacKinnonPresidentPower Workers’ UnionToronto, Ontario
Ken McKinnonChair Yukon Environmental and Socio-Economic Assessment BoardWhitehorse, Yukon
Richard Prokopanko DirectorCorporate Affairs and SustainabilityRio Tinto Alcan Inc.Vancouver, British Columbia
Wishart RobsonClimate Change AdvisorNexen Inc.Calgary, Alberta
Robert SlaterAdjunct ProfessorEnvironmental PolicyCarleton UniversityOttawa, Ontario
Robert SopuckVice-President of Policy (Western Canada)Delta Waterfowl Foundation Winnipeg, Manitoba
David McLaughlinPresident & CEO

89
10.3 sUsTaInable DeveloPmenT TeCHnologY CanaDa: aboUT Us
Sustainable Development Technology Canada (SDTC) is an arm’s-length foundation which has received $1.05 billion from the Government of Canada as part of its commitment to create a healthy environment and a high quality of life for all Canadians. SDTC operates two funds aimed at the development and demonstration of innovative technological solutions. The $550 million SD Tech Fund™ supports projects that address climate change, air quality, clean water, and clean soil. The $500 million NextGen Biofuels Fund™ supports the establishment of first-of-kind large demonstration-scale facilities for the production of next-generation renewable fuels.
WE MEET THE NEED
Canada has significant potential to develop and use clean technologies. This is indicated by the activity we have seen. Since 2002, the SD Tech Fund has received 1,497 applications from groups comprised of 4,425 companies and institutions, with total requested funding exceeding $3.5 billion for technologies in 57 different categories. We have heard from applicants in every province and two territories.
The benefits extend to all Canadians and around the world. Clean technologies contribute to the economy both domestically and internationally, increasing productivity and competitiveness of industry while simultaneously reducing environmental impact.
We bridge the gap in the innovation chain. SDTC helps bring new technologies to market by supporting them through the critical phase of pre-commercialization. Private sector capital does not extend to this costly, high-risk stage, creating a funding and capacity gap.
The SD Tech Fund is building the backbone of a clean tech infrastructure in Canada. By funding groups of companies (consortia) that represent all elements of a technology’s supply chain, we help develop practical solutions that are more likely to attain market success.
WHAT WE HAVE ACHIEVED
SDTC has achieved tangible early results. In 2005, we saw the successful completion of seven projects where technologies met their performance requirements, exceeding typical success rates. In 2006 and 2007, respectively two and seven more projects were successfully completed.
Our projects achieve multiple goals at once. We recognize that clean air, climate change, clean water and/or clean soil are inextricably linked. That’s why 88% of our SD Tech Fund portfolio combines these benefits in some way.
We have a broad economic impact. In six years, we have selected 155 projects proposing technology solutions for major economic sectors of Canada: Energy Exploration and Production; Power Generation; Industrial, Commercial and Residential Energy Utilization; Transportation; Agriculture; Forestry and Wood Products; and Waste Management.

90
The SD Tech Fund has achieved substantial leveraging of its funds. We have placed $383M over thirteen rounds of funding. This has been leveraged by $928M from consortia members, with 83 percent of that from industry (a strong indication that industry supports our model). Our contributions range from $153K to $13.9M in projects whose total eligible costs range from $332K to $49M.
WE ARE ACCOUNTABLE
We are accountable. We report to Parliament through the Minister of Natural Resources and make our Annual Report, Annual Report Supplement, and Corporate Plan – Executive Summary available to the public through our website and at our Annual Public meeting. We have adopted best practices through our Corporate Performance Evaluation Plan, and have successfully completed compliance audits.
10.4 sDTC boaRD of DIReCToRs
Chairman, SDTCJuergen PuetterPresident, Chairman and CEOAeolis Wind Power Corporation
Ken OgilvieIndependent consultant
David BerthiaumeCEOOLEOTEK inc.
Michael J. BrownChairman of the BoardChrysalix Energy Management Inc.
Dr. Angus A. Bruneau, O.C.Corporate Director
Charles S. Coffey, O.C.Community Volunteer
Kenneth Ross CreelmanManaging DirectorMarwood Ltd.
Professor David Johnston, C.C.PresidentUniversity of Waterloo
David KerrCorporate DirectorBrookfield Asset Management
Jane E. PagelSenior Vice PresidentGovernment and Corporate RelationsJacques Whitford Ltd.
David PollockExecutive DirectorTatamagouche Social Justice Training and Retreat Centre
Dr. Dipak RoyChairmanD-TA Enterprises Inc.
DirectorSensorCom Inc.
DirectorPersonica Inc.
Dr. Jacques SimoneauExecutive Vice President, InvestmentBusiness Development Bank of Canada
Catherine SmithCommunity Volunteer

91
10.5 eneRgY effICIenCY In CanaDa’s CommeRCIal bUIlDIng seCToR: PRogRam PaRTICIPanTs
Martin AdelaarPrincipalMarbek Resources
John ApplebyChiefEnd-Use Market AnalysisNatural Resources Canada
Anne AugerVice President, LEEDCanada Green Building Council
Katherine BalpatakyResearch AssociateNRTEE
Dale BeuginPolicy AdvisorNRTEE
Gudrin BildfellPlannerAmico Properties Inc.
Michael BrooksExecutive DirectorReal Property Association of Canada
Michael ButtersPresidentMBC Energy and Environment
Chris CanersAssociateICF International
Jim ClarkSenior OfficerProgram DevelopmentNatural Resources Canada
Chris ConwayVice PresidentGovernment RelationsReal Property Association of Canada
Robert DubéNRTEE Member, andPresident, Atout personnel
Denise EdwardsAdministrative AssistantNRTEE
Jeremy EdwardsAssociateProperty AcquisitionsISG Secure Capital
Ken ElseyPresident and CEOCanadian Energy Efficiency Alliance
Marion FraserPresidentFraser and Company
Danny HarveyProfessorUniversity of Toronto
Amy HuAssistantClimate Change ProgramDavid Suzuki Foundation
Bill HumberChairCenter for the Built Environment and Civil Engineering TechnologySeneca College
Phil JagoDirectorBuildings DivisionNatural Resources Canada
Ann KellySenior AdvisorCustomer CouncilCanadian Electricity Association
Louis MarmenDirectorGas MarketsCanadian Gas Association
Rodney McDonaldManagerSustainable Strategy & PolicyHOK
David McLaughlinPresident and CEONRTEE
Julia McNallyManagerPlanning, Codes and Standards Conservations and Sector DevelopmentOntario Power Authority
Thomas MuellerPresident Canada Green Building Council
Diana Osler-ZorteaPresidentBOMA Canada
Lesley RogersVice-PresidentEfficiency NB
Nada SuticManagerGreen InitiativesBOMA Toronto
Annika TamlynPolicy AdvisorNRTEE
Marie-Lyne TremblayDeputy DirectorBuildings ProgramNatural Resources Canada
Rick WhittakerVice PresidentInvestmentsSDTC
Glen J. WoodSenior AssociateICF International


PolICY PaTHWaYDIagRam

11.0

GHG

POLICY PATHWAY FOR GHG REDUCTIONSRESULTING FROM ENERGY EFFICIENCY IN COMMERCIAL BUILDINGS
2009 2010 2015 2020 2025 2030 2035 2040 2045 2050
50%
100%
150%
200%
Create service center for building performance
Accelerate CCA rates
Provide resources to expedite the building permit process
Implement building labelling program
Incorporate energy efficiency into Canada's National Building Code
Promote energy efficiency through information programs and campaigns
Update equipment standards (MEPS)
Apply mandatory performance standards to public buildings
Establish and regulate building commissioning standards
Use fiscal and capital incentives to overcome risks
Provide resources to increase skills development
Update equipment standards (MEPS)
Implement sector-wide performance regulations
Provide loan guarantees to offset capital costs
Implement an economy-wide price signal
Provide funding to create an advanced investment strategy for RD&C
BAU
Emissions begin to climb againby 2030 without mandatory
sector-wide regulations
Mandatory regulations result in absolute emissions
reductions
207%
109%
35%
% C
HA
NG
E I
N E
MIS
SIO
NS
(M
tCO
2e)
PO
LIC
Y I
NS
TR
UM
EN
TS
Policies are required in theshort-term to prepare the sector
for regulations
CARBON PRICING
+REGS
2009 2010 2015 2020 2025 2030 2035 2040 2045 2050
Economy-wide price signals Command & control regulations Voluntary actions & information resourcesSubsidies
CARBONPRICING
+POLICIES

ANNEX
MODELLING SCENARIOASSUMPTIONS FOR POLICY DESIGN
GEARED FOR CHANGEENERGY EFFICIENCY IN CANADA’S COMMERCIAL BUILDING SECTOR

Policy and program design will be a requirednext step for implementing the energy efficiencymeasures contained in this report. Various scenarios that considered the effectiveness of selected policy measures in reducing carbon emissions fromcommercial and institutional buildings weremodelled in the research for this work, andrecommendations were derived from the results.The assumptions implicit in the scenarios werebased on input from stakeholder consultationsand the project’s advisory committee, a literaturereview, and secondary research conducted by ICFInternational and J&C Nyboer. Assumptions forthe scenarios are outlined in detail in this Annexin order to help guide program designers in policy development for increasing energy efficiency in the commercial building sector.

BASELINE AND REFERENCE SCENARIOS
The main analysis in this report builds on previous modelling work that ICF International conducted for the federal government using the Energy 2020 model to assess the impact of the Turning the Corner plan, the Regulatory Framework for Air Emissions, and select provincial policies.1 This combined impact is referred to as the reference scenario.
The baseline scenario is the “do nothing” option; that is, where no policies, regulations, prices, or incentives are implemented, and greenhouse gas emissions and energy use follow historic growth patterns.
Under all scenarios, economic growth is assumed at a rate of 2.1% per year.
CARBON PRICE SCENARIO
As noted on page 59 of the report, the carbon price scenario assumes the “Fast and Deep” pricing scheme published by the NRTEE in its 2007 report Getting to 2050: Canada’s Transition to a Low-emission Future.2
COMPLEMENTARY POLICIES SCENARIO
The complementary policies scenario contains eight policy measures. Assumptions about their impacts on carbon emission reductions were conservative, due to difficulties in making precise forecasts and a desire to identify the sector’s achievable potential for emissions reductions.
This scenario does not analyze the use of building-integrated renewable energy technologies and does not explicitly encourage greater use of district heating systems.
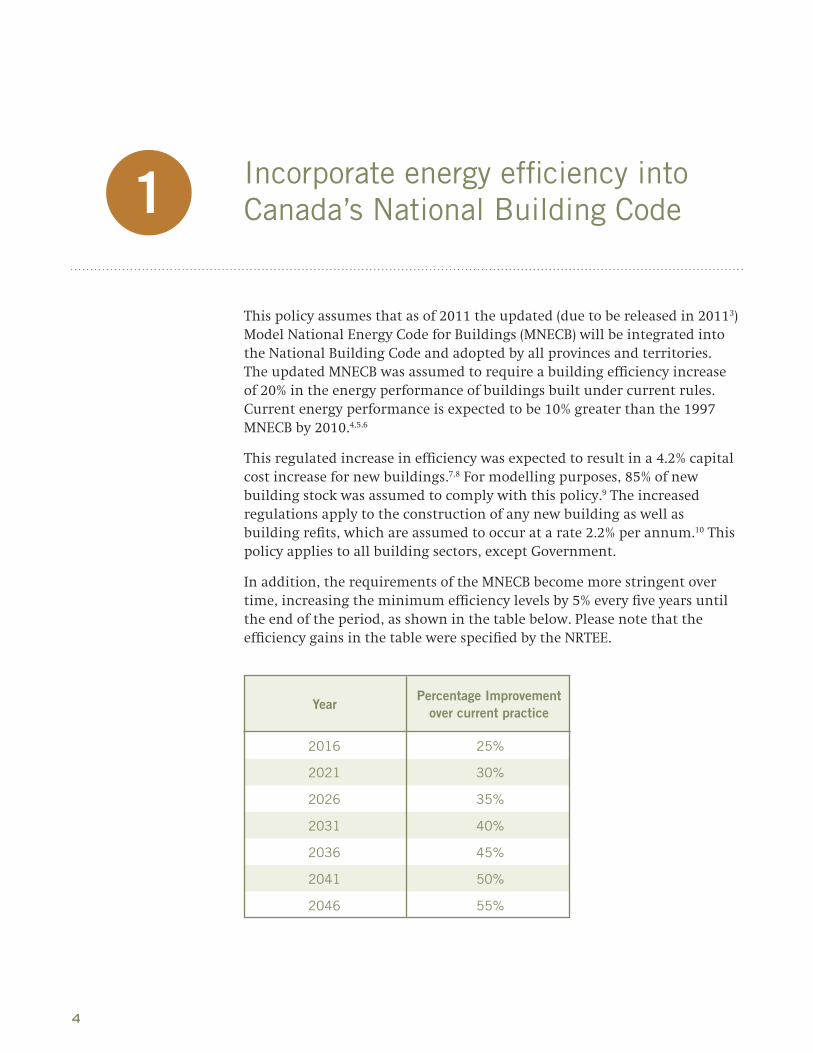
4
Incorporate energy efficiency into Canada’s National Building Code1
This policy assumes that as of 2011 the updated (due to be released in 20113) Model National Energy Code for Buildings (MNECB) will be integrated into the National Building Code and adopted by all provinces and territories. The updated MNECB was assumed to require a building efficiency increase of 20% in the energy performance of buildings built under current rules. Current energy performance is expected to be 10% greater than the 1997 MNECB by 2010.4,5,6
This regulated increase in efficiency was expected to result in a 4.2% capital cost increase for new buildings.7,8 For modelling purposes, 85% of new building stock was assumed to comply with this policy.9 The increased regulations apply to the construction of any new building as well as building refits, which are assumed to occur at a rate 2.2% per annum.10 This policy applies to all building sectors, except Government.
In addition, the requirements of the MNECB become more stringent over time, increasing the minimum efficiency levels by 5% every five years until the end of the period, as shown in the table below. Please note that the efficiency gains in the table were specified by the NRTEE.
2016 25%
2021 30%
2026 35%
2031 40%
2036 45%
2041 50%
2046 55%
YearPercentage Improvement
over current practice

5
Establish higher efficiency standards for building equipment2
Under this policy, the minimum efficiency standards for building appliances and equipment are increased by regulation. The average equipment and appliance efficiency increases over time and is driven by the replacement rate, starting between 2009 and 2015. An incremental change is applied in 2035 (again as specified by the NRTEE), further increasing the minimum equipment standards for energy efficiency.
The efficiency of heating, ventilation, and air conditioning (HVAC) equipment is increased by 8.5%,11,12 while chillers are increased by 9%13,14 over current levels. In 2035, the minimum efficiency of HVAC equipment is increased by a further 12%, while the minimum efficiency of chillers is increased by another 13%.
Starting in 2015, regulation increases minimum furnace efficiency by 15%, with a 10% increase in capital costs.15 A further 21% incremental increase occurs in 2035, with an identical cost increase.
Boilers with a capacity of less than 5 million Btu per hour increase their efficiency by 5% in 201516,17 and a further 7% in 2035, while larger boilers increase their minimum efficiency by 10% in 2015, with an incremental increase of 14% in 2035. Regulated changes in boiler efficiencies result in an increased capital cost of 10% for each incremental increase.18
In addition, plug-load efficiency increases by 25% over current levels,19 with no increase in cost.20 In 2035, minimum plug-load efficiency is increased a further 35% over the levels established in 2015.
This policy assumes that starting in 2009, standard fluorescent lighting efficiency increases by 30%, regular high-intensity discharge (HID) efficiency increases by 8%, and existing high-bay lighting supplied by HID fixtures increases by 40%. The policy also assumes that lighting controls are applied to all standard fluorescent lighting systems, over a period of 10 years, following the increases to the lighting efficiency regulation. Lighting efficiency is further increased in the same manner in 2035, with increases of 42% from current T12 lighting energy use; 11% for HID bulbs, and 56% for high-bay HID lighting.

6
Apply accelerated capital cost allowance rates to equipment
Establish and regulate building commissioning standards
3
4
Beginning in 2010, this policy sets the capital cost allowance rate for Class 1 equipment to 20%, and for Class 8 equipment to 35%.21, 22 All building sectors were considered eligible for this incentive.
This policy requires that 70% of the existing building stock in all sub-sectors except Government undertake a commissioning process, resulting in building energy savings of 15%.23 The policy was applied over a 20-year period beginning in 2010.
Estimated commissioning costs of 1% and 4% for new and existing buildings respectively were translated into an increased annual operating cost of 0.4% per building.24 Buildings were assumed to incur the cost of commissioning every five years in order to maintain the level of initially realized energy savings.

7
Apply mandatory performance standards to public buildings
Provide resources to expedite the building permit process
5
6
New government buildings are assumed to perform at LEED® Gold efficiency (34% higher than current practice),25 with a monitoring program that ensures this level of performance is maintained. This policy requires a capital cost increase of 9.9%.26,27 It assumes that 60%28 of existing buildings in the Government sector increase their energy efficiency by 11%29 over a 10-year period, beginning in 2010.
A 25% increase in plug-load efficiency is assumed due to the mandatory use of, at minimum, ENERGY STAR® rated equipment, with no cost increase. 30
This policy was quantified in modelling terms through a discounted capital cost, using the analogue of decreased building permit fees.31 Average commercial building permitting costs were estimated as $167,000 per building.32,33,34 Beginning in 2011, this policy assumes that at efficiency levels of 30%, 40%, and 50% above current practice, discounts of 10%, 20%, and 30%, respectively, would be offered from the building permit cost. 35

8
Provide resources to increase skills development
Use capital and fiscal incentives to overcome financial risks
7
8
Research determined that with an investment of $1,400 per trainee for skills development, decreases in energy intensity could be achieved in terms of electricity and fuel consumption. Electricity savings of 0.18 kWh per square foot (equivalent to 0.614 thousand Btu) could be achieved, as well as energy fuel savings of 0.71 Btu per square foot.36 Based on the energy intensity of the average commercial building (approximately 135 MBtu per square foot),37 the above amounts to approximately 1% reduction in energy use per building.
This policy assumes a 70% compliance rate and is incrementally implemented over a 20-year period, beginning in 2015.
A tax incentive policy was modelled where, to qualify, the building must have an optimal performance that meets or exceeds the MNECB guidelines by 20%. The required improvement would rise along with the MNECB over time maintaining a 20% greater efficiency level. This policy provides a tax credit equal to the value of 7% of the capital cost of the building, credited over five years,38 with a cap of $40 million per annum.39 This policy, which excludes the Government sector, is implemented starting in 2015.
The policy assumes that an investment of 7% of the capital cost of the building will increase the efficiency of the existing building to 20% greater than MNECB guidelines, and that the average commercial building construction cost is equal to $188 per square foot ($2,023 per m2).40 Seven per cent of the average cost yields $142 per square metre. Therefore, accounting for the fact that the assumed program spending cap is $40 million per annum, 281,690 square metres of the 217,649,622 m2 total floor area in Canada (minus the Government sector) is eligible annually.41

9
COMBINED SCENARIO
The combined scenario results from implementing the carbon price and complementary policies scenarios. The assumptions are consistent with the modelling work conducted for each scenario on its own. The total reduction is not equal to the combined total of the carbon price and complementary policy scenarios due to the fact that there is some overlap between them.
REGULATORY SCENARIO
The regulatory scenario was the result of modelling work conducted by J&C Nyboer with the hybrid CIMS model. The effects of the “Fast and Deep” carbon pricing scenario were assessed, including all direct combustion and its system-wide effect on relative electricity and fossil fuel prices for the commercial and institutional buildings sector, with the addition of the basic LEED® standard as a regulation for all new buildings.
The carbon pricing scenario used for the regulatory scenario (shown below) is in 2005 dollars. The prices are slightly higher than those used in the previous modelling work, as outlined below:
According to research that accompanies this scenario, without complementary regulations in Canada, an emissions pricing system would likely fail in the commercial and institutional buildings sector. Regulations that eliminate a subset of equipment choices may be justified where information or search costs are particularly high. Research has found that application of this type of regulation in certain situations can lead to net societal benefits.42
2011-2015
2016-2020
2021-2025
2026-2030
2031-2035
2036-2040
2041-2045
2046-2050
18
115
215
300
300
300
300
300
Fast and deep pricing path

10
1 Environment Canada (2008). Turning the Corner: Regulatory Framework for Industrial Greenhouse Gas Emissions. Ottawa: Government of Canada. Accessed at http://www.ec.gc.ca/doc/virage-corner/2008-03/541_eng.htm.
2 NRTEE (2007). Getting to 2050: Canada’s Transition to a Low-emission Future. Ottawa: NRTEE.
3 National Research Council of Canada. Model National Energy Code for Buildings. “Updating of 1997 Model National Energy Code for Buildings of Canada.” Accessed at http://www.nationalcodes.ca/mnecb/call_for_nominations_e.shtml. Note: The original MNECB was published in 1997; this will be the first update of the code.
4 National Climate Change Process, Analysis and Modelling Group (1999). Canada’s Emissions Outlook: An Update. pp.13–14. Accessed at http://www.nrcan.gc.ca/es/ceo/outlook.pdf.
5 PWGSC (2007). “Sustainable Development Strategy 2007–2009,” ch. 3. Accessed at http://www.tpsgc-pwgsc.gc.ca/sd-env/sds2007/strategy/sdd-sds2007-ch3-e.html. The PWGSC will, at a minimum, construct buildings that are 30% more efficient than MNECB (which equates 20% based on current practice, according to endnote 1).
6 Fraser Basin Council; and Community Energy Association (2007). Energy Efficiency & Buildings – A Resource for BC’s Local Governments. Fraser Basin Council: Vancouver. Accessed at http://www.fraserbasin.bc.ca/publications/documents/caee_manual_2007.pdf. For the Canadian version of LEED-NC, the energy requirements are based on either MNECB or ASHRAE 90.1-1999, with a minimumefficiency of 25% higher than MNECB for LEED® certification.
7 Life-Cycle Economic Assessment of Energy Performance Standards Applied to British Columbia (2004). Phase II – Cost Effectiveness of Achieving CBIP in Vancouver. BC Government.
8 The American Chemistry Council (April 16, 2003). Analyzing the Cost of Obtaining LEED Certification. Accessed at http://www.cleanair-coolplanet.org/for_communities/LEED_links/AnalyzingtheCostofLEED.pdf.] This report estimates the cost premium for a LEED Certified building at 4.5% to 11%.
9 NRCan, Personal Communication with ICF (2008). It is estimated that 15-20% of buildings are not complying with the code due to lack of enforcement.
10 NRCan, Analysis and Modelling Division (2006). Canada’s Energy Outlook: The Reference Case 2006. Ottawa: Government of Canada.
11 NRCan, ENERGY STAR® (Undated). “Energy Star® for Light Commercial HVAC, Fact Sheet for Building Owners and Property Managers.” Accessed at http://www.energystar.gov/ia/partners/manuf_res/LCHVACFS3.pdf.
12 NRCan, ENERGY STAR® (2008). “Light Commercial Heating & Cooling for Consumers.” Accessed at http://www.energystar.gov/index.cfm?c=lchvac.pr_lchvac.
13 New Buildings Institute, Inc. (2003). Energy Benchmark for High Performance Buildings, version 1.0.White Salmon, WA: NBI
14 U.S. Department of Energy, Federal Energy Management Program (FEMP). “How to Buy an Energy-Efficient Water-Cooled Chiller.” Accessed at http://www1.eere.energy.gov/femp/procurement/eep_wc_chillers.html. The average value between the chiller that just meets the ASHRAE 90.1 standard and the recommended efficiency was assumed to be the current practice.
15 United States Environmental Protection Agency (2008). “Clean Energy Strategies for Local Government, Section 6.6 Energy-Efficient Product Procurement.” Accessed at http://www.epa.gov/cleanrgy/documents/webcasts/section_6_6_procurement_2-22.pdf.
16 Energy Information Administration (1995). Commercial Buildings Energy Consumption Survey. Accessed at http://www.eia.doe.gov/emeu/cbecs/. US Government.
17 American Council for an Energy Efficient Economy (2008). “Energy-Efficient Lighting and Lighting Design.” Online Guide to Energy-Efficient Commercial Equipment. Accessed at http://www.aceee.org/ogeece/ch2_index.htm.
18 United States Environmental Protection Agency (2008). “Clean Energy Strategies for Local Government, Section 6.6 Energy-Efficient Product Procurement.” Accessed at http://www.epa.gov/cleanrgy/documents/webcasts/section_6_6_procurement_2-22.pdf.
19 NRCan, ENERGY STAR® (2008). Accessed at http://www.energystar.gov/index.cfm?c=home.index. ENERGY STAR products in the commercial sector are on average 30% more efficient than conventional models. On recommendation from Mike Butters, we are using 25%.
20 NRCan, ENERGY STAR® (2005). Guide to an Energy-Smart Office. Ottawa: Government of Canada. Accessed at http://oee.nrcan.gc.ca/publications/equipment/m144-63-2004e.cfm. “The cost premium for all types of ENERGY STAR labelled equipment compared with conventional equipment is $0.”

21 Library of Canada, Parliament Information and Research Service (2006). “Appendix A, Common Capital Cost Allowance Classes.” En Brief, April 3, 2006. Accessed at http://www.parl.gc.ca/information/library/PRBpubs/prb0606-e.htm#appendixa.
22 Alberta Innovative Manufacturing Works (2008). Accessed at http://www.manufacturinginnovation.ca.
23 Mills, E., N. Bourassa, M. Piette, H. Friedman, T. Haasl, T. Powell, and D. Claridge (2004). “The Cost-Effectiveness of Commissioning New and Existing Commercial Buildings: Lessons from 224 Buildings.” National Conference on Building Commissioning: May 4–6, 2005.
24 Building Commissioning (2008). “Commissioning Costs and Budgets”. Accessed at http://buildingcommissioning.wordpress.com/ .Values used on recommendation of NRTEE.
25 Turner, C.. and M. Frankel (2008). Energy Performance of LEED® for New Construction Buildings – Final Report. Prepared for U.S. Green Building Council. p. 16. Accessed at https://www.usgbc.org/ShowFile.aspx?DocumentID=3930. This assumes that the buildings in the United States are also being built at 10% above the MNECB level. Silver would represent a 22% increase from current practice.
26 The American Chemistry Council (2003). Analyzing the Cost of Obtaining LEED Certification. This report concludes that the cost premium for a LEED Certified building is between 4.5% and 11%.
27 This calculation assumes a 25% federal, 25% provincial, and 50% municipal split in floor area.
28 Building Owners and Management Association (BOMA), Personal Communication with ICF (2008).
29 BOMA Toronto news. (2007). Accessed at http://www.naylornetwork.com/bto-nwl/printFriendly.asp?projID=525.
30 NRCan, ENERGY STAR® (2005). Guide to an Energy-Smart Office. Ottawa: Government of Canada. Accessed at http://oee.nrcan.gc.ca/publications/equipment/m144-63-2004e.cfm. “The cost premium for all types of ENERGY STAR® labelled equipment compared with conventional equipment is $0.”
31 It was assumed that an expedited green building permitting process would result in reduced financing costs during building planning and construction, which ultimately reduce capital costs.
32 NRCan, Office of Energy Efficiency (2002). Commercial and Institutional Building Energy Use Survey 2000 - Detailed Statistical Report 2002. Ottawa: Government of Canada.
33 Statistics Canada (2007). “Value of Building Permits.” CANSIM, table (for fee) 026-0008 and Catalogue no 64-001-X. Accessed at http://www40.statcan.gc.ca/l01/cst01/manuf15a-eng.htm.
34 City of Toronto (2008). “Toronto 2008 Building Fee Schedule,” Note: This calculation estimates the total number of meters squared of new building floor area built each year, and applies an averaged building permit cost from the City of Toronto.
35 Goodland, H. (2007). “Builders save on City of Calgary Permits for BuiltGreen Homes.” Accessed at http://www.sustainablebuildingcentre.com/blog/helen_goodland_30.
36 Mills, E., N. Bourassa, M. Piette, H. Friedman, T. Haasl, T. Powell, and D. Claridge (2004). “The Cost-Effectiveness of Commissioning New and Existing Commercial Buildings: Lessons from 224 Buildings.” National Conference on Building Commissioning: May 4–6, 2005.
37 NRCan. Office of Energy Efficiency (2007). Commercial and Institutional Consumption of Energy Survey - Summary Report, June 2007. Ottawa: Government of Canada.
38 New York State Department of Environment Conservation. (2008). “New York State Green Building Tax Credit.” Accessed at http://www.dec.ny.gov/energy/1540.html.
39 NRTEE, Personal communication with ICF (2008).
40 Carrik, A. (2008). Reed Construction Data. “Cost Increases for Four Institutional Building Categories.” Accessed at http://www.reedconstructiondata.com/news/2008/04/cost-increases-for-four-institutional-building-categories/.
41 NRCan, Office of Energy Efficiency (2002). Commercial and Institutional Building Energy Use Survey 2000 - Detailed Statistical Report 2002. Ottawa: Government of Canada.
42 Moxnes, E. (2004). “Estimating customer costs or benefits of energy efficiency standards,” Journal of Economic Psychology, 25(6), 707–724.
