ge oil & gas · ge oil & gas this document contains “forward-looking statements” –...
TRANSCRIPT
Imagination at work.
Rafael Santana, VP & CEO Turbomachinery Solutions
Marco Caccavale, General Manager Africa
May 7, 2014 – JP Morgan OTC Investor Dinner
GE Oil & Gas
This document contains “forward-looking statements” – that is, statements related to future, not past, events. In this context, forward-looking statements often address our expected future
business and financial performance and financial condition, and often contain words such as “expect,” “anticipate,” “intend,” “plan,” “believe,” “seek,” “see,” or “will.” Forward-looking statements
by their nature address matters that are, to different degrees, uncertain. For us, particular uncertainties that could cause our actual results to be materially different than those expressed in our
forward-looking statements include: current economic and financial conditions, including volatility in interest and exchange rates, commodity and equity prices and the value of financial assets;
potential market disruptions or other impacts arising in the United States or Europe from developments in sovereign debt situations; the impact of conditions in the financial and credit markets
on the availability and cost of General Electric Capital Corporation’s (GECC) funding and on our ability to reduce GECC’s asset levels as planned; the impact of conditions in the housing market
and unemployment rates on the level of commercial and consumer credit defaults; pending and future mortgage securitization claims and litigation in connection with WMC, which may affect
our estimates of liability, including possible loss estimates; our ability to maintain our current credit rating and the impact on our funding costs and competitive position if we do not do so; the
adequacy of our cash flows and earnings and other conditions which may affect our ability to pay our quarterly dividend at the planned level or to repurchase shares at planned levels; GECC’s
ability to pay dividends to GE at the planned level; our ability to convert pre-order commitments/wins into orders; the price we realize on orders since commitments/wins are stated at list prices;
the level of demand and financial performance of the major industries we serve, including, without limitation, air and rail transportation, power generation, oil and gas production, real estate
and healthcare; the impact of regulation and regulatory, investigative and legal proceedings and legal compliance risks, including the impact of financial services regulation; our capital
allocation plans, as such plans may change including with respect to the timing and size of share repurchases, acquisitions, joint ventures, dispositions and other strategic actions; our success in
completing announced transactions and integrating acquired businesses; our ability to complete the staged exit from our North American Retail Finance business or the acquisition of the
Thermal, Renewables and Grid businesses of Alstom as planned; the impact of potential information technology or data security breaches; and numerous other matters of national, regional and
global scale, including those of a political, economic, business and competitive nature. These uncertainties may cause our actual future results to be materially different than those expressed in
our forward-looking statements. We do not undertake to update our forward-looking statements.
This document includes certain forward-looking projected financial information that is based on current estimates and forecasts. Actual results could differ materially.
GE’s Investor Relations website at www.ge.com/investor and our corporate blog at www.gereports.com, as well as GE’s Facebook page and Twitter accounts, contain a significant amount of
information about GE, including financial and other information for investors. GE encourages investors to visit these websites from time to time, as information is updated and new information
is posted.

We fuel the future. We push the boundaries of technology to bring energy to the world.
2 GE Oil & Gas JP Morgan OTC Dinner | May 2014
© 2014 General Electric Company

Investing in oil and gas
20 years of continuous growth built on a solid foundation of technology
3
1994 A Turbomachinery
company
$1
1997 Developed
a Service model
$2
2004 Expanded in Inspection
Technologies
$4
Well Support
Pressure Control
Electrical Submersible Pumps
Logging Services
2011 The “new”
GE Oil & Gas
$15
2012 GE Oil & Gas
became stand-alone GE segment
$18
2013 Continue to build out
capabilities to focus on specific segments
$20
2008 Entered the Drilling
& Production segment
2007
$10
(Orders $ in billions)
Cameron Reciprocating Compression Division (anticipated closing 2014)
Nuovo
Pignone
X 7
GE Oil & Gas JP Morgan OTC Dinner | May 2014 © 2014 General Electric Company

GE Oil & Gas — a snapshot
4
M&C $4.4B
DTS $1.5B
TMS $5.6B
D&S $3.4B
SS $4.1B
GE Oil & Gas 2013 (orders)
Orders 2013: $20B — 8%V
Double-digit growth in 2013: revenues (11%) and op profit (13%)
45,000+ employees
Turbomachinery Solutions (orders mix evolution)
Lufkin $0.7B
'02 '13
Service
Equipment
$2.8B
$5.6B
78% 53%
47%
22%

Turbomachinery Solutions 6,000+ PEOPLE
ACROSS 6 CONTINENTS
Offshore
Adjacent
segments Pipeline
Floating LNG
AN INTEGRATED BUSINESS
HIGH-TECH PRODUCTS &
SERVICES
PROJECT MANAGEMENT
CONTRACTUAL & MAINTENANCE
SERVICES & UPGRADES
SERVING KEY
SEGMENTS
LNG Onshore
DRIVERS
Aeroderivative Gas Turbines
Heavy Duty Gas Turbines
Synchronous & Induction Electric Motors
COMPRESSORS
Centrifugal & Axial
Integrated
Direct Drive High Speed
Subsea
Turbo expanders
TURN-KEY SOLUTIONS
Industrial Modules Waste Heat Recovery
OUR PORTFOLIO
GE Oil & Gas JP Morgan OTC Dinner | May 2014 © 2014 General Electric Company
5
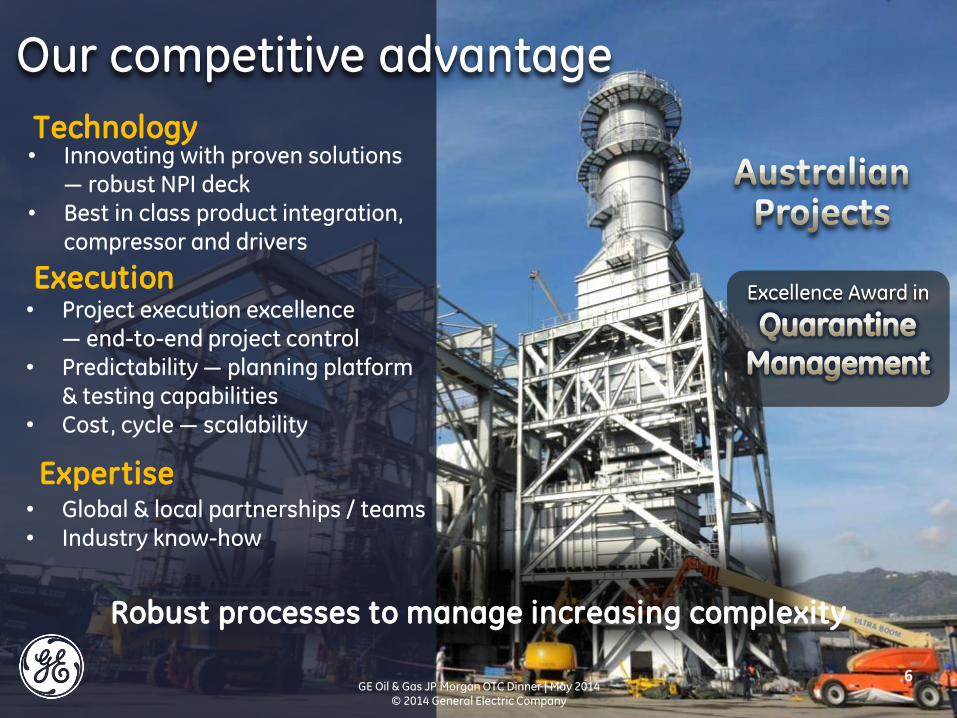
Robust processes to manage increasing complexity
Our competitive advantage
• Project execution excellence — end-to-end project control
• Predictability — planning platform & testing capabilities
• Cost, cycle — scalability
• Innovating with proven solutions — robust NPI deck
• Best in class product integration, compressor and drivers
Technology
Execution Excellence Award in
Expertise • Global & local partnerships / teams • Industry know-how
GE Oil & Gas JP Morgan OTC Dinner | May 2014 © 2014 General Electric Company
6

35% Subsea production
by 2018
Industry mega-trends
Unconventionals production by 2018
50%
80 MMboe/da
of new production capacity needed by
2020
5x Increase in capex per barrel of new capacity
2008–2016
4-7% rate of industry growth between
now and 2020
7 GE Oil & Gas JP Morgan OTC Dinner | May 2014
© 2014 General Electric Company
Sources: CERA, Frost & Sullivan, Deloitte, Rystad, Roland Berger Trend Compendium 2030 and GE Oil & Gas analysis

Our customers’ expectations
Dependable partner — safety, integrity, quality and predictable execution
Innovation & technology — cost effective, new and improved solutions
Global and local — scale and localization
IOCs
NOCs
Independents
GE Oil & Gas JP Morgan OTC Dinner | May 2014 © 2014 General Electric Company
8

Environmental regulations
Labor shortage
Harsh/remote locations
Different customers, common challenges
9
Providing solutions to enable our customers’ success
GE Oil & Gas JP Morgan OTC Dinner | May 2014 © 2014 General Electric Company

LNG
Traditional
approach 18 months Commissioning time
5 years Project duration
1,700 x Project site acreage
GE Oil & Gas JP Morgan OTC Dinner | May 2014 © 2014 General Electric Company
10

Systems solution applied to different environments
EXTREME ENVIRONMENTS
SHALE GAS
OFFSHORE
GE Oil & Gas JP Morgan OTC Dinner | May 2014 © 2014 General Electric Company
11

Systems solution applied to different environments
GE Oil & Gas JP Morgan OTC Dinner | May 2014 © 2014 General Electric Company
OFFSHORE
SHALE GAS
EXTREME ENVIRONMENTS
12

<3 months Commissioning time
<2 years Project duration
Up to 30% Project site acreage
From Equipment
to Systems
into Micro-plants
GE Oil & Gas JP Morgan OTC Dinner | May 2014 © 2014 General Electric Company
13

• Composite materials
• Enhanced combustion
Winning in Offshore
Aviation & Power Water
Power Conversion
Electrification
Knowledge services
M&C,
Software CoE
Durability, weight &
efficiency
• Power density
• Active magnetic bearings
• Predictive maintenance
• Unmanned operations
SeaSmartTM Offshore Package
Enhanced efficiency & reduced weight
GE Oil & Gas JP Morgan OTC Dinner | May 2014 © 2014 General Electric Company
14

15 GE Proprietary and Confidential Information
© 2013 General Electric Company – For Internal Use Only
Keeping ahead of industry trends
Applying proven GE technology & expertise to deliver transformational solutions
Shell Prelude Freeport LNG
GE Oil & Gas JP Morgan OTC Dinner | May 2014 © 2014 General Electric Company
15

Expertise: services driving Predictivity
Installed base & data acquisition … the foundation
Connectivity & big data … software & analytics
Experience & insight … industry expertise
+
+
++ Services
• 100,000+ machinery control & protection systems
• 10,000+ compressors
• 5,000 turbines
• ~7,000 engineers
• Deep OEM domain knowledge & service expertise
• Integrated software architecture
After market services & installed base
Applying GE services experience to the total portfolio
GE Oil & Gas JP Morgan OTC Dinner | May 2014 © 2014 General Electric Company
16

Investing to bring GE technology to the oil and gas industry
Technology - our differentiator Incubating new solutions for harsher, more extreme environments with our customers
17
Reducing equipment footprint & costs for Total’s Martin Linge offshore project in the North Sea
1st System integrated electric motor driven compressor for offshore
Reducing C02 emissions for Petrobras while enhancing oil recovery
Highest mass flow CO2 centrifugal pump – up to 540 bar capability
World’s largest LNG Compressor Power
Providing enhanced efficiency for the Gorgon project with a 96.3 MW power compressor
Highest pressure sour gas re-injection train – 820 bar
Designed, system integrated & tested the
Kashagan Project reinjection module systems
'03-'05 '10-'12 '13-'15
$1.1B
$370M
++
Our technology spend
GE Oil & Gas JP Morgan OTC Dinner | May 2014 © 2014 General Electric Company

18 GE Proprietary and Confidential Information
© 2013 General Electric Company – For Internal Use Only
Turbomachinery leading customer solutions
• Strategically positioned to take on major industry trends
Business growth ($ in billions) • Leading through technology &
expertise — services knowledge
• Inside Customers — fostering continuous improvement & flexible solutions
• Differentiated project execution, product testing and scalable supply chain capabilities
Positioned to drive profitable growth
Orders $4.8
‘12 ‘13
$5.6
++
‘14
GE Oil & Gas JP Morgan OTC Dinner | May 2014 © 2014 General Electric Company
18

Localizing to drive global capacity
Australia Supporting
development of the world’s largest LNG
exporter by 2020
Russia Partnering to develop local
manufacturing capabilities
Brazil Investing in research
& manufacturing/ packaging
capabilities
Sub-Saharan
Africa Investing to
expand manufacturing
capabilities
South East Asia
24/7 Monitoring & Diagnostic iCenter
Algeria turbomachinery
services
GE Oil & Gas JP Morgan OTC Dinner | May 2014 © 2014 General Electric Company
19

Africa – the time is right
Consumer demand
rising from fast
growing economies
E&P production values
and infrastructure
growth
Increasing capital
and technology
intensity
• Downstream is up: 2 new refineries in Angola and Nigeria
• Petrochem/fertilizers to support agriculture growth
• Connect gas to power in the private sector … virtual pipeline
• Continued growth of upstream (SS/TMS developments)
• More SSA countries are finding offshore oil and gas: Ghana,
Tanzania, Mozambique, Gabon…
• East Africa LNG transforming global gas trade
• Quick monetization of gas through LNG solutions
• Artificial lift for aging/marginal wells
• Subsea ultra-deep and pre-salt technology key
which means…
$860B
$430B
$45B
$1.4T
$540B
$93B
Africa’s consumer spending power
Production value of Africa’s oil, gas
and mineral sectors
Annual investment: infrastructure
development and maintenance
7% of world production
6.8% of global industry spend
12% of GE Oil & Gas order book
SSA has 7 of 10 fastest-growing global economies (2011-2015)
Ethiopia 8.1 Mozambique 7.7 Tanzania 7.2 Congo 7.0
Ghana 7.0 Zambia 6.9 Nigeria 6.8
% %
© 2014 General Electric Company 20 Sources: The Economist; IMF, EIA, International Energy Statistics, 2012; McKinsey Global Institute, “Lions on the Move: The Progress and Potential of African Economies,” June 2010; Africa’s Infrastructure: A Time for Transformation,” Agence Française de Développement and the World Bank, 2010
GE Oil & Gas JP Morgan OTC Dinner | May 2014

GE Oil & Gas in Sub-Saharan Africa Financials
2013 +$2B +$2B
Nigeria
Rest of Region
Angola
Flow & Services
Projects
Our key locations
West Africa Nigeria 2 Service shops
Ghana 1 Office
Nigeria
Chad
Eq. Guinea
Congo
Angola
Kenya
Tanzania
Ghana
South Africa
IC Cameroon
Mozambique
Central Africa Angola 1 Service shop 1 Cust. base 1 Mfg. JV
Chad 1 Cust. base
Congo 1 Cust. Base
Eq. Guinea 1 Service shop 1 JV East Africa
Kenya 1 Office
Tanzania 1 Office
Mozambique 1 Office
South Africa South Africa 1 Service shop
Part of MENAT region
21
Cameroon 1 Office Ivory Coast 1 Office
GE Oil & Gas JP Morgan OTC Dinner | May 2014 © 2014 General Electric Company
0
20
40
60
80
100
120
'11 '12 '13 '14 '15 '16
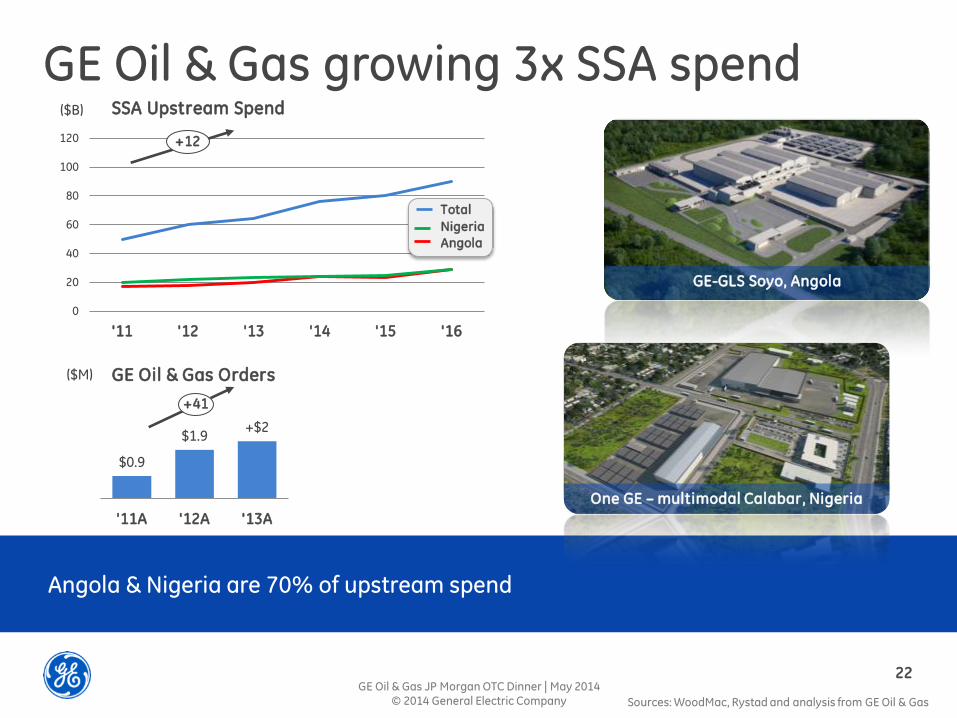
GE Oil & Gas growing 3x SSA spend
Angola & Nigeria are 70% of upstream spend
SSA Upstream Spend
+12
$0.9
$1.9 +$2
'11A '12A '13A
+41
GE-GLS Soyo, Angola
($B)
GE Oil & Gas Orders ($M)
Nigeria
Angola
One GE – multimodal Calabar, Nigeria
22
Sources: WoodMac, Rystad and analysis from GE Oil & Gas
Total
GE Oil & Gas JP Morgan OTC Dinner | May 2014 © 2014 General Electric Company

East Africa onshore rifts
East Africa deepwater
South Africa shale
Gabon pre-salt
Angola Kwanza pre-salt
What’s next – and after next
One-third of world’s new oil discoveries since 2000 have been in Africa
Exploration hot spots
> 15 bboe
2 – 15 bboe
0.7 – 2 bboe
< 0.7 bboe
Nigeria
Chad
Eq. Guinea
Congo
Angola
Gabon DRC
Cameroon Ghana Cote
d’Ivoire
Namibia
South Africa
Madagascar
Tanzania
Somalia Kenya
Ethiopia
Uganda
Recoverable reserves
23
Source: WoodMac
GE Oil & Gas JP Morgan OTC Dinner | May 2014 © 2014 General Electric Company

Follow new trends & geographies
$6B of opportunities in the next 5 years
24
Oil and gas availability + Consumer demand Refining & Petrochem
SSA Connect gas to power demand Virtual Pipeline
Oil availability + Consumer demand New Refinery
Ghana OCPT find Subsea and Turbomachinery
Tanzania Block 1 find Subsea and Turbomachinery
Mozambique Area 1 & 4 find Subsea and Turbomachinery
Trends Geographies
GE Oil & Gas JP Morgan OTC Dinner | May 2014 © 2014 General Electric Company

GE Oil & Gas SSA PATH
Fastest Growing Region for Oil & Gas industry
SSA path
Flow & Services
+$2B
Projects
Projects
Flow & Services
Trends New Geo
++
Grow
Localize
Build
2013 <2020
• Positioned to follow the trends
• Deploy expertise in Region • Country/ site development focus • Execution capability in SSA entities
• Angola JV facility • ONE GE Nigeria facility • Training partnerships
• Build Talent- Leadership programs
25 GE Oil & Gas JP Morgan OTC Dinner | May 2014
© 2014 General Electric Company
