ge energy multilin p30 phasor data concentrator · theory of operation ... sampling rates, phasors)...
TRANSCRIPT

GE Digital Energy's Quality Management System is
registered to ISO9001:2000
QMI # 005094
GE Energy
GE Digital Energy
215 Anderson Avenue, Markham, Ontario
Canada L6E 1B3
Tel: (905) 294-6222 Fax: (905) 201-2098
Internet: http://www.gedigitalenergy.com
Reference manualP30 revision: 1.10
Manual P/N: 1601-0267-A2
GE publication code: GEK-113585A
Copyright © 2012 GE Digital Energy
*1601-9103-A2*
Multilin P30 Phasor DataConcentrator

© 2012 GE Digital Energy Incorporated. All rights reserved.
GE Digital Energy - Multilin P30 Phasor Data Concentrator Reference Manual for revision 1.10.
Multilin P30, EnerVista, EnerVista Launchpad, and EnerVista P30 Setup are registered trademarks of GE Digital Energy Inc.
The contents of this manual are the property of GE Digital Energy Inc. This documentation is furnished on license and may not be reproduced in whole or in part without the permission of GE Digital Energy. The content of this manual is for informational use only and is subject to change without notice.
Part number: 1601-0267-A2 (June 2012)

MULTILIN P30 PHASOR DATA CONCENTRATOR – INSTRUCTION MANUAL
General Safety Precautions• Failure to observe and follow the instructions provided in the equipment manual(s)
could cause irreversible damage to the equipment and could lead to property damage, personal injury and/or death.
• Before attempting to use the equipment, it is important that all danger and caution indicators are reviewed.
• If the equipment is used in a manner not specified by the manufacturer or functions abnormally, proceed with caution. Otherwise, the protection provided by the equipment may be impaired and can result in impaired operation and injury.
• Caution: Hazardous voltages can cause shock, burns or death.
• Installation/service personnel must be familiar with general device test practices, electrical awareness and safety precautions must be followed.
• Before performing visual inspections, tests, or periodic maintenance on this device or associated circuits, isolate or disconnect all hazardous live circuits and sources of electric power.
• Failure to shut equipment off prior to removing the power connections could expose you to dangerous voltages causing injury or death.
• All recommended equipment that should be grounded must have a reliable and un-compromised grounding path for safety purposes, protection against electromagnetic interference and proper device operation.
• Equipment grounds should be bonded together and connected to the facility’s main ground system for primary power.
• Keep all ground leads as short as possible.
• At all times, equipment ground terminal must be grounded during device operation and service.
• In addition to the safety precautions mentioned all electrical connections made must respect the applicable local jurisdiction electrical code.

MULTILIN P30 PHASOR DATA CONCENTRATOR – INSTRUCTION MANUAL
Safety words and definitionsThe following symbols used in this document indicate the following conditions:
Indicates a hazardous situation which, if not avoided, will result in death or serious injury.
Note Indicates a hazardous situation which, if not avoided, could result in death or serious injury.
Note Indicates a hazardous situation which, if not avoided, could result in minor or moderate injury.
Note Indicates significant issues and practices that are not related to personal injury.
NOTE
Indicates general information and practices, including operational information and practices, that are not related to personal injury.

MULTILIN P30 PHASOR DATA CONCENTRATOR – INSTRUCTION MANUAL TOC–1
Table of Contents
1. MULTILIN P30 GENERAL
Introduction.......................................................................................................................... 1 - 1Overview................................................................................................................................ 1 - 2Description of the P30 System .................................................................................... 1 - 3
EnerVista P30 Setup ............................................................................................................... 1 - 3Multilin P30 Synchrophasor Data Concentrator ....................................................... 1 - 4Multilin P30 Historian............................................................................................................. 1 - 7EnerVista Synchrophasor Viewer (ESV) ......................................................................... 1 - 8Multilin P30 Order Codes...................................................................................................... 1 - 12
P30 System Specifications ............................................................................................ 1 - 13Concentrator Card .................................................................................................................. 1 - 13Historian Card ........................................................................................................................... 1 - 13Applications Card .................................................................................................................... 1 - 14SATA SSD and SATA SSD Carrier Card............................................................................ 1 - 14Power Supply............................................................................................................................. 1 - 14Testing and Certification ...................................................................................................... 1 - 15Physical ........................................................................................................................................ 1 - 16Environmental........................................................................................................................... 1 - 16
2. MULTILIN P30 INSTALLATION
Hardware Description ..................................................................................................... 2 - 1Concentrator Processor ....................................................................................................... 2 - 2Historian Processor ................................................................................................................ 2 - 4Power Supplies ......................................................................................................................... 2 - 5
Mechanical Installation................................................................................................... 2 - 6Dimensions................................................................................................................................. 2 - 7Handling/Safety Precautions............................................................................................. 2 - 8Mounting ..................................................................................................................................... 2 - 9
Electrical Installation........................................................................................................ 2 - 11Control Power............................................................................................................................ 2 - 12Critical Fail Relay...................................................................................................................... 2 - 12
Serial Communications................................................................................................... 2 - 13Command Line Interface ..................................................................................................... 2 - 13Sample Wiring Diagram ....................................................................................................... 2 - 17
Ethernet Communications ............................................................................................ 2 - 18Concentrator Processor ....................................................................................................... 2 - 18Historian Processor ................................................................................................................ 2 - 19
IRIG-B....................................................................................................................................... 2 - 20Historian Local Clock ............................................................................................................. 2 - 21
3. MULTILIN P30 SECURITY
User Roles ............................................................................................................................. 3 - 2Password Complexity Policy......................................................................................... 3 - 3Lockout................................................................................................................................... 3 - 4Remote Authentication................................................................................................... 3 - 5Local Authentication........................................................................................................ 3 - 7Historian Security .............................................................................................................. 3 - 8Firmware Upgrade Security.......................................................................................... 3 - 9
4. THE ENERVISTA P30 SETUP INTERFACE
Handling the EnerVista P30 Setup Software ........................................................ 4 - 1Hardware and Software Requirements........................................................................ 4 - 1Installing the EnerVista P30 Setup Software .............................................................. 4 - 2

TOC–2 MULTILIN P30 PHASOR DATA CONCENTRATOR – INSTRUCTION MANUAL
Connecting EnerVista P30 Setup Software to the Multilin P30...........................4 - 3Viewing Multilin P30 Device Definition information .................................................4 - 5Working with settings and settings files .......................................................................4 - 6Upgrading....................................................................................................................................4 - 13
5. P30 CONCENTRATOR SETTINGS
Multilin P30 setup...............................................................................................................5 - 1Security .........................................................................................................................................5 - 1Event recorder ...........................................................................................................................5 - 2Communication ........................................................................................................................5 - 4Installation...................................................................................................................................5 - 4
System setup........................................................................................................................5 - 6Power system.............................................................................................................................5 - 6Inputs .............................................................................................................................................5 - 7Pseudo PMUs .............................................................................................................................5 - 8PMU manager............................................................................................................................5 - 10Outputs .........................................................................................................................................5 - 11
6. P30 CONCENTRATOR COMMANDS
Basic commands................................................................................................................6 - 2IRIG-B commands..............................................................................................................6 - 3
7. P30 CONCENTRATOR ACTUAL VALUES
Status.......................................................................................................................................7 - 1Remote input status ...............................................................................................................7 - 1Remote output status ............................................................................................................7 - 2Ethernet ........................................................................................................................................7 - 2Synchronization ........................................................................................................................7 - 2
Metering..................................................................................................................................7 - 4Inputs .............................................................................................................................................7 - 4Pseudo PMUs .............................................................................................................................7 - 5Outputs .........................................................................................................................................7 - 6Trending........................................................................................................................................7 - 7
Records ...................................................................................................................................7 - 10Event recorder ...........................................................................................................................7 - 10Event recording.........................................................................................................................7 - 10
Product information..........................................................................................................7 - 16Model information ...................................................................................................................7 - 16Firmware revisions ..................................................................................................................7 - 16
8. P30 CONCENTRATOR MAINTENANCE
Upgrading P30 Concentrator Firmware..................................................................8 - 1Process for Upgrading P30 Concentrator firmware................................................8 - 1
Certificates ............................................................................................................................8 - 4
9. P30 HISTORIAN CONFIGURATION
Configuring Historian - the main steps....................................................................9 - 1Set up and start hardware...................................................................................................9 - 1Configure P30 Historian Network Settings...................................................................9 - 2Log into the P30 Historian....................................................................................................9 - 2Change P30 Historian login credentials ........................................................................9 - 2Set up Multilin P30 Historian users ..................................................................................9 - 3P30 Historian storage requirements...............................................................................9 - 10P30 Historian tag naming conventions .........................................................................9 - 10Verify Multilin P30 Historian operation...........................................................................9 - 12

MULTILIN P30 PHASOR DATA CONCENTRATOR – INSTRUCTION MANUAL TOC–3
Configure P30 Historian settings ..................................................................................... 9 - 12P30 Historian commands .................................................................................................... 9 - 14
10. P30 HISTORIAN OPERATING CONSIDERATIONS
P30 Historian storage requirements ........................................................................ 10 - 1P30 Historian card power cycling.............................................................................. 10 - 3Operational log files ......................................................................................................... 10 - 4Data validity indication within ESV............................................................................ 10 - 5
11. P30 HISTORIAN MAINTENANCE
Upgrading P30 Historian firmware ........................................................................... 11 - 1Process for Upgrading P30 Historian Firmware ....................................................... 11 - 2
Retrieve Historian log files............................................................................................. 11 - 8
12. ENERVISTA SYNCHROPHASOR VIEWER (ESV)
EnerVista Synchrophasor Viewer System Requirements ............................... 12 - 1Installing the ESV application....................................................................................... 12 - 3Using the ESV application.............................................................................................. 12 - 5
Visualization preparation..................................................................................................... 12 - 9ESV Worksheet management............................................................................................ 12 - 11Visualization object creation in ESV................................................................................ 12 - 15Visualization object configuration in ESV..................................................................... 12 - 25Historical visualization in ESV ............................................................................................ 12 - 52P30 Historian Expression Operators overview in ESV ............................................ 12 - 53Building an Historian Expression in ESV Showing the Angular Difference Between Two
Synchrophasors .................................................................................................................... 12 - 57
13. MULTILIN P30 THEORY OF OPERATION
Up sampling ......................................................................................................................... 13 - 1Data interpolation for missing data.......................................................................... 13 - 2Down sampling................................................................................................................... 13 - 3Handling of STAT bits ....................................................................................................... 13 - 4Client/PMU configuration change ............................................................................. 13 - 6
APPENDIX. APPLICATION EXAMPLE
Certificate Management and FreeRADIUS.net setup ....................................... A - 1Setting up a simple RADIUS server.................................................................................. A - 2

TOC–4 MULTILIN P30 PHASOR DATA CONCENTRATOR – INSTRUCTION MANUAL

MULTILIN P30 PHASOR DATA CONCENTRATOR – INSTRUCTION MANUAL 1–1
Multilin P30
Chapter 1: Multilin P30 General
GE Energy
Multilin P30 General
Introduction
The Multilin P30 is an IEEE C37.118 compliant synchrophasor data concentrator whose primary function is to communicate with Phasor Measurement Units (PMUs) and process synchrophasor data streams collected from a variety of PMUs. The system is intended to provide reliable and secure synchrophasor data management for Optimized Wide Area System monitoring and Post Event Analysis. The Multilin P30 is unique in the industry in that it can be ordered with an embedded Historian complete with 256 GB of solid-state storage.This manual is intended for users of the Multilin P30 and operators of electrical transmission systems, who are:
• Power Engineers or Technicians familiar with Power Engineering concepts, including electrical power measurements (voltages, currents, phase angles, frequencies, sampling rates, phasors) and communications concepts (LAN settings, TCP/IP, IEEE C37.118),
• skilled in the use of Windows platforms, and conventional “point-and-click” interfaces, as well as web interfaces,
• involved in day-to-day transmission system operation activities, including system planning, fault analysis, and system operations.

1–2 MULTILIN P30 PHASOR DATA CONCENTRATOR – INSTRUCTION MANUAL
OVERVIEW CHAPTER 1: MULTILIN P30 GENERAL
Overview
The Multilin P30 system collects, processes, and reports Synchrophasor data for Wide Area System monitoring applications.Synchrophasor data from a variety of PMUs are time-aligned, structured, and transmitted to upstream synchrophasor devices, which can be other Multilin P30 s, Super PDCs, visualization devices, external historians, or external applications.The Multilin P30 can be installed at the Substation Level, or at a Regional Control Center.GE’s synchrophasor data concentrator, Multilin P30 , acquires synchrophasor data from various Phasor Measurement Units (PMUs), such as the D60, G60, L30, L90, and N60 relays, and from other PMU devices with different reporting rates. The Multilin P30 can accommodate reporting rates between 1 and 120 Hz. All PMU data sent to the Multilin P30 must comply with IEEE C37.118.

CHAPTER 1: MULTILIN P30 GENERAL DESCRIPTION OF THE P30 SYSTEM
MULTILIN P30 PHASOR DATA CONCENTRATOR – INSTRUCTION MANUAL 1–3
Description of the P30 System
The Multilin P30 system is an IEEE C37.118 PDC. This Multilin P30 system can communicate with IEEE C37.118 standard compliant PMU/DC devices, such as the D60, G60, L30, L90, and N60 relays, or any other PMU/DC devices. The primary functions of the Multilin P30 are to:
• communicate with PMUs and other PDCs (eg: super-PDC)
• acquire synchrophasor data from up to 40 PMUs at different reporting rates (up to 120 Hz for 60Hz, and 100 Hz for 50 Hz)
• time-align synchrophasor data from various Phasor Measurement Units (PMUs)
• filter and process the received synchrophasor data as required, if configured by the user
• structure/aggregate output datasets from the available input data
• transmit structured/aggregated output datasets to up to eight (8) output streams at various reporting rates
• archive and visualize the PMU data if it is ordered with the optional Historian device and visualization tool for various real-time synchrophasor visualization applications.
The Multilin P30 system can be classified into the following subsystems:
• Multilin P30 Concentrator
• EnerVista P30 Setup
• Multilin P30 Historian
• EnerVista Synchrophasor Viewer (ESV).
EnerVista P30 SetupThe EnerVista P30 Setup software allows users to interface with GE’s Multilin P30 system. The user can add a PMU to the Multilin P30 input streaming device list, just by entering the IP address of the PMU and specifying the communication protocol - TCP or UDP. Moreover, a user can retrieve the configuration data of up to 40 PMUs and map them to corresponding output datasets. The setup software can be used to configure the Multilin P30 in both online and offline mode. To use online mode, there must be a network connection between the EnerVista P30 Setup software and the Multilin P30 hardware.Configuration is retrieved from the specified server. Please refer to the EnerVista P30 Setup Interface section on how to configure the Multilin P30 using the EnerVista P30 Setup software.
NOTE
NOTE: The Multilin P30 is supplied with a serial port that must be used to set its initial console port IP address as well as the IP Address of an embedded Historian if it has been ordered.
NOTE
NOTE: The Multilin P30 system supports 2 Ethernet ports. Although both ports support data communication, the Multilin P30 system can be configured only through the console port using the EnerVista P30 Setup tool. The console port is port 1 on the synchrophasor processor board.

1–4 MULTILIN P30 PHASOR DATA CONCENTRATOR – INSTRUCTION MANUAL
DESCRIPTION OF THE P30 SYSTEM CHAPTER 1: MULTILIN P30 GENERAL
The con
Multilin P30 Synchrophasor Data Concentrator
P30 ConcentratorArchitecture The Multilin P30 Concentrator is composed of three separate modules; the Input Module,
the Data Processing Module and the Output Module. The figure below shows the Multilin P30 architecture.
Figure 1: Multilin P30 Architecture
PDC
Historian
Applications
Data ProcessingModule
1. Time Alignment2. Data Structuring3. Diagnostics
Input Module1. Data Reception2. Data Extraction3. Data Buffering
Ethernet Switch
Ethernet Switch
PDC
PMUs
PDC PDC SuperPDC
External Systems
C37.118 C37.118
C37.118
C37.118
(Optional)
860700A1.cdr
Concentrator
Output Module1. Data Broadcast
C37.118
C37.118C37.118
C37.118 C37.118
(Optional)
C37.118
C37.118

CHAPTER 1: MULTILIN P30 GENERAL DESCRIPTION OF THE P30 SYSTEM
MULTILIN P30 PHASOR DATA CONCENTRATOR – INSTRUCTION MANUAL 1–5
Input ModuleThis module acquires synchrophasor data from various Phasor Measurement Units (PMUs), such as the D60, G60, L30, L90, and N60 relays, and from other PMU devices with different reporting rates from 1 to 120 Hz and based on IEEE C37.118. A maximum of 40 PMUs is supported at the input. An aggregated frame from a device with multiple PMUs is also accepted, however the total number of PMUs configured with the Multilin P30 should not exceed 40. Moreover, all PMU data sent to the Multilin P30 must comply with IEEE C37.118. The Multilin P30 supports 2 Ethernet ports: Console (Port 1) and Port 2. The console port supports both the EnerVista P30 Setup interface to configure the Multilin P30, as well as data communication, if required. Port 2 supports only data communication. Typically these ports will be connected to a network device (Ethernet switch/router). The Multilin P30 is also supplied with a serial port that must be used to set the initial console port IP address of it and an embedded Historian if this has been ordered.
NOTE
NOTE: The Multilin P30 should be connected to an IRIG-B signal (with UTC time stamp) in order to receive, time-align and send concentrated data.
Please refer to the Configuring Serial/Ethernet Communications sections for information on how to set up communications with the Multilin P30.For first-time handshaking between the Multilin P30 and a PMU, the Multilin P30 sends a Command to turn off PMU transmission. It then sends a command frame to the PMU to request new configuration (CFG2) frame. Once the PMU receives these commands, it must send the configuration (CFG2) frames to the Multilin P30 . After receiving both frames, the Multilin P30 sends a command signal to the PMU to initiate the phasor data transmission. The Input Module extracts the data packets from various devices and buffers the extracted data for a limited time. The receipt of a PMU packet is time-stamped to the nearest microsecond of GPS time. This is facilitated using a GPS Clock board in the Multilin P30 chassis.
Data ProcessingModule This module provides two major functions: time alignment and data structuring. The
Multilin P30 supports different reporting rates from each of the 40 possible inputs (from PMUs), and allows the user to configure a unique reporting rate from each of the Multilin P30 's 8 outputs. The time alignment function provides a unified data rate. The Data Processing Module aligns the different rate data streams into a single data rate according to the Multilin P30 output configuration set by the user. For example, for system visualization, 10 points/sec may be enough but 30 points/sec is required for stability analysis. The data structuring function combines synchronized measurement data from multiple measurement devices into a single binary data stream; in other words, it is the concentrating function.The Multilin P30 data processing module also provides a small, finite amount of data buffering to account for network characteristics that may prevent PMU data from arriving when it is expected.The Multilin P30 also provides the capability to enable data filtering, what a user may elect to use when the provisioned data input rate is greater than the provisioned data output rate. Filtering is not required when the output-reporting rate is equal to, or higher than the input reporting rate. If the filtering option is selected and the Multilin P30 output rate is less than the Multilin P30 input rate, the concentrated data can only be established for each Multilin P30 output:
• when the PMU data for all the PMUs configured for that output is received for the corresponding time stamp and prior (N-1)/2 and later (N-1)/2 time stamps where N is the filter length and the (present time – first packet arrival time) is less than the configured wait time
• when (present time – first packet arrival time) is equal to configured wait time while all the PMU data has not been received, and the missing data is interpolated.

1–6 MULTILIN P30 PHASOR DATA CONCENTRATOR – INSTRUCTION MANUAL
DESCRIPTION OF THE P30 SYSTEM CHAPTER 1: MULTILIN P30 GENERAL
NOTE
NOTE: Please refer to the Theory of Operation section for more details.
Internally, the Multilin P30 normalizes all received data to 120Hz reporting rate. For the PMUs with reporting rate less than 120 Hz, when the PMU data is received for two consecutive time stamps (based on reporting rate), the data is up-sampled for the time interval between two consecutive time stamps.For instance, for the PMU with reporting rate of 30 Hz, when data is received for time stamps corresponding to times [21:20:48 , 0 ms] and [21:20:48 , 033333 ms], data will be up-sampled for time stamps [21:20:48 , 008333 ms], [21:20:48 , 016667 ms] and [21:20:48 , 025000 ms].Refer to the Theory of Operation chapter of this manual for further details about up-sampling, down-sampling, etc.
Output ModuleThe Multilin P30 Output Module is responsible for transmitting the concentrated PMU data to other PDCs or SuperPDCs based on the preset configuration. The Data Concentrator supports up to eight (8) C37.118 clients. Should it be ordered, the embedded Historian will consume one of these outputs. Outputs can be configured for either TCP or UDP operation. The data set and wait time must be configured separately for each output.For first-time handshaking between any client and the Multilin P30 server, the client either sends a Command frame to the Multilin P30 to request a CFG2 frame, or sends two Command frames to the Multilin P30 to request both the CFG1 and CFG2 frames. Once the Multilin P30 server receives these Commands, it sends the CFG1 and CFG2 frames to the client. The data encoded in these frames will be representative of the Multilin P30 output configuration, as provisioned by the user in EnerVista P30 Setup , based on the client configuration preset by the user. After receiving both frames, the client sends a Command signal to the Multilin P30 to initiate the concentrated phasor data transmission. The Multilin P30 then starts the data transmission.The Multilin P30 wait time feature allows PMU data to be buffered for a user-defined time (between 1ms and 5 seconds), until all expected data has arrived.The wait time buffering allows users to force the Multilin P30 to send all concentrated data in time-stamp order, on each of the Multilin P30 outputs. If the wait time is provisioned, the Multilin P30 will not send output data, for a given timestamp, or any subsequent timestamp, until every input PMU to be concentrated on the output has arrived.
NOTE
NOTE: Please see section SETTINGS > MULTILIN P30 SETUP > SYSTEM SETUP > OUTPUTS to determine how to configure the output wait time feature.
If all requisite data has not arrived by the time the configured wait time has elapsed, then the Multilin P30 will interpolate the missing data, and set Bit-9 of the STAT word in compliance with IEEE C37.118.2 Draft 3.2 (May 2011).
P30 DiagnosisReporting Using the
Pseudo PMUThe Multilin P30 also provides system and network diagnostic information. The Multilin P30 treats alarms and diagnostic information in a way that makes it very convenient to monitor the Multilin P30 in a wide area system. Alarms and Diagnostics can be configured to be transported in 'pseudo-PMU packets' that are created at the Multilin P30 itself. The user can select all or some of these pseudo PMUs to be concentrated into a Multilin P30 output which can be sent to other upstream devices, the Historian, or to any monitoring software.Pseudo PMU contains data that is generated within the Multilin P30 to provide the client with information on the status of the Multilin P30 as well as communication between Multilin P30 and PMUs. Such information includes diagnostic information and status. These data are time-stamped by the Multilin P30 . The Multilin P30 processes this information as

CHAPTER 1: MULTILIN P30 GENERAL DESCRIPTION OF THE P30 SYSTEM
MULTILIN P30 PHASOR DATA CONCENTRATOR – INSTRUCTION MANUAL 1–7
it processes information coming from any other PMU. Pseudo PMUs do not contain any phasor information but just analogs and digitals. The Multilin P30 supports four Pseudo PMUs each of which contains 0 phasors, 16 analogs, and 32 digitals. No special requirements are necessary for the visualization of pseudo PMUs in the ESV.
NOTE
NOTE: Please refer to section SETTINGS > MULTILIN P30 SETUP > SYSTEM SETUP > PSEUDO PMU for more information.
Multilin P30 HistorianThe Multilin P30 can be ordered with GE's own Proficy Historian, and an optimized collector for C37.118 synchrophasor data. All Multilin P30 s that are ordered with a Historian are also supplied with 256GB of solid state storage. The embedded Historian is a client of the Data Concentrator. When an optional Historian card is ordered, the concentrator card becomes the data source, from which the Historian Collector for C37.118 data will retrieve phasor data and collect them into the Historian server. The data is then made accessible to clients by the Historian server.Both the Historian Collector and the Historian Server run on the optional Historian processor board.The Historian Collector can accommodate a variable number of Historian tags. The number of Historian tags ordered will depend on the number of PMUs from which the Multilin P30 collects data.
NOTE
NOTE: The EnerVista P30 Setup software provides the user with an interactive bandwidth calculator that displays the number of tags remaining to be used, as input data is concentrated on the Historian output.
When configured, the collector automatically gathers all phasors, analog channels, digital channels, STAT words, FREQ and DFREQ fields that appear in C37.118 data frames, that are received from the Concentrator card. Digital channels marked as invalid in the DIGUNIT field of the configuration frame are not collected.Nominal line frequency in the FNOM field of configuration frames is collected each time a CFG-2 frame is received. If no CFG-2 frame has been received for 24 hours, the last known value of nominal line frequency is added to Historian. Similarly, the ANUNIT and DIGUNIT fields in a CFG-2 frame are collected with the same 24-hour auto-repeating.The CFGCNT field of the configuration frame is also collected, but no auto-repeating algorithm is applied, as the field is meant to reflect the actual time that a configuration change occurs.No other fields in the data frame are collected, nor are any fields in any other type of C37.118 frame.
NOTE
NOTE: The user is responsible for configuring the Historian output port on the Multilin P30 .
The Historian-Multilin P30 relationship mimics the relationship between a DC and PMU in the C37.118 standard; in this case the Historian serves as the client, and the DC as the server. The Concentrator interface to the Historian is designed to accommodate a wide range of data transmission rates that vary according to the configuration of the Historian output port. The Concentrator interface supports a range of transmission rates between 1 Hz and 120 Hz.The number of Historian tag writes per second that are supported will depend on the version of Historian software installed on your Multilin P30 system. At a minimum the Historian processor will support 100,000 tag writes per second.

1–8 MULTILIN P30 PHASOR DATA CONCENTRATOR – INSTRUCTION MANUAL
DESCRIPTION OF THE P30 SYSTEM CHAPTER 1: MULTILIN P30 GENERAL
FASTPATH: The Multilin P30 Historian processor is a Windows based software system. Proper care is required to ensure its reliable operation. Before removing power on the Multilin P30 please shut down the Multilin P30 Historian processor in the correct manner, by using the “Shut Down” function available in the EnerVista P30 Setup software.
Proper care is required to ensure reliable operation.
EnerVista Synchrophasor Viewer (ESV)The EnerVista Synchrophasor Viewer (ESV) is a software application that provides for visualizing synchrophasor, digital, and analog data collected from substation Phasor Measurement Units (PMUs).The ESV application facilitates visualization of data by means of the following user-configurable graphic objects:
• Phasor Display: A combination of the following:
– A polar plot containing up to 16 rotating hands, each of which indicates a given synchrophasor’s magnitude along with either its absolute angle or its angle relative to another displayed synchrophasor
– A table listing the angle and magnitude values of each displayed synchrophasor, along with the moving average of each displayed synchrophasor's angle
• Trend Chart: A line graph displaying time-synchronized phasor, digital, and/or analog measurements over a configurable time span.
Additional graphic objects allow you to visualize PMU status as well as Phasor Data Concentrator (PDC) Historian operational statistics.The ESV application also provides a Historical Playback feature that synchronizes all created objects and worksheets, whether currently displayed or not, to show data starting from a user-specified time in the past through any time up to and including live time.OPERATIONAL OVERVIEWPower transmission line data acquired by Phasor Measurement Units (PMUs) installed at substations can be visualized by means of the EnerVista Synchrophasor Viewer (ESV). This data is time-synchronized to the microsecond based on GPS clocks. The data is then collected, filtered, and time-aligned by a Phasor Data Concentrator (PDC), the Multilin P30 Phasor Data Concentrator which then streams the data to a Historian data collector that stores the data in a Historian repository. You can access this data for visualization in ESV using a number of graphic objects.All data and graphic animations in ESV are based on Display Time. Display Time has different meanings depending on viewing mode. In live mode (the default), Display Time is the current system time. In historical playback mode, Display Time corresponds to a moment in the past that progresses dynamically within a user-specified period designated by way of the Dynamic Graphic Replay (DGR) control.APPLICATION CAPACITYEach Multilin P30 can connect to multiple PMUs; each installation of ESV can access up to 16 Multilin P30 Historians simultaneously; and each Multilin P30 Historian can be accessed by up to seven ESV users at once. For detailed information on system specifications and limitations, see the appropriate sections of this Instruction Manual.ESV INSTALLATIONFor detailed ESV installation instructions, please refer to chapter 8 of this Instruction Manual.APPLICATION START-UPAfter the EnerVista Synchrophasor Viewer (ESV) is installed on your computer, it can be started by way of either the corresponding desktop icon or the corresponding program path from the Windows Start button.

CHAPTER 1: MULTILIN P30 GENERAL DESCRIPTION OF THE P30 SYSTEM
MULTILIN P30 PHASOR DATA CONCENTRATOR – INSTRUCTION MANUAL 1–9
To start ESV from the desktop icon
1. Insert the hardware license key in the computer's USB port.FASTPATH: Without the hardware license key, the ESV application runs in demo mode, which limits
session time to two hours. Connection of the key by way of an external USB hub is not supported.
FASTPATH: Do not remove the key from your node while the ESV application is running, as doing so may damage the key.
2. Double-click the EnerVista Synchrophasor Viewer icon. The application opens to display the main window.
To start ESV from the Start button
1. Insert the hardware license key in the computer's USB port.
NOTE
NOTE: Without the hardware license key, the ESV application runs in demo mode, which limits session time to two hours. Connection of the key by way of an external USB hub is not supported.
FASTPATH: Do not remove the key from your node while the ESV application is running, as doing so may damage the key.
2. Click the Windows Start button.
3. Point to Programs (or All Programs, depending on operating system), then EnerVista Synchrophasor Viewer, then click EnerVista Synchrophasor Viewer. The application opens to display the main window.
NOTE
NOTE: If the most recently configured worksheet contains visualization objects that draw data from Historians for which you have not saved your login credentials, one or more dialog boxes will appear, in which you must enter your User Name [preceded by the appropriate Domain Name followed by a backslash (that is, DomainName\UserName), if applicable to your environment] and Password for the corresponding Historian, then click OK, after starting the application.
MAIN WINDOW OVERVIEWThe image below highlights the main components of the EnerVista Synchrophasor Viewer (ESV) main window. The table below provides a description of each component.

1–10 MULTILIN P30 PHASOR DATA CONCENTRATOR – INSTRUCTION MANUAL
DESCRIPTION OF THE P30 SYSTEM CHAPTER 1: MULTILIN P30 GENERAL
KEY COMPONENT DESCRIPTION
A Worksheet Title Read-only display of the active worksheet's name.
B Last Worksheet/Next Worksheet
Toolbar buttons used to navigate between worksheets opened during the current session.
C Historical Playback Toolbar button for opening the control used to replay data in all created objects and worksheets—whether currently displayed or not—across a user-specified time frame.
D Connect to P30 Historian Toolbar button for opening the control used to establish connection to the Phasor Data Concentrator (PDC) Historian(s) containing time-synchronized phasor, digital, and analog data.*
E Add Phasor Display Toolbar button used to create a Phasor Display visualization object for configuration.
F Add Trend Chart Toolbar button used to create a Trend Chart visualization object for configuration.
G Add PMU Status Toolbar button used to create a Phasor Measurement Unit (PMU) Status visualization object.
H Add P30 Historian Statistics Toolbar button used to create a PDC Historian Statistics visualization object for configuration.
I Save Toolbar button used to save the active worksheet as currently populated and configured with visualization objects.
J Question Mark Icon Toolbar button for opening the application help file to the welcome topic.
K Underscore Icon Toolbar button for minimizing the application window.
L X Icon Toolbar button for closing the application.

CHAPTER 1: MULTILIN P30 GENERAL DESCRIPTION OF THE P30 SYSTEM
MULTILIN P30 PHASOR DATA CONCENTRATOR – INSTRUCTION MANUAL 1–11
* You must connect to the applicable Multilin P30 Historian(s) before you can perform any visualization tasks.WORKSHEET OVERVIEWThe worksheet is the foundation of the EnerVista Synchrophasor Viewer (ESV) work environment. Similar in concept to a canvas, a ESV worksheet can contain one or multiple visualization objects. The first time you start ESV, the application opens a blank worksheet ready to be populated with visualization objects.Whenever you navigate away from a worksheet, the application automatically saves the worksheet as currently populated and configured. Back and forward buttons in the ESV toolbar allow for navigation between worksheets accessed during a given session.When you close ESV, the application saves the worksheet that was active at the time of closure and earmarks that worksheet as the one to be displayed when the application is next started.The maximum number of objects that can be created per worksheet is a function of the amount of data being visualized overall and the hardware limitations of the user’s computer.
FASTPATH: After changing or deleting worksheet objects, there is no way to revert to previous worksheet states. Therefore, if you think you might have some future use for a worksheet in its current state, you may want to consider duplicating it and modifying the copy, rather than modifying the original worksheet.
APPLICATION CLOSUREWhen you have completed your visualization work for a given session, close the application by taking the following step:
• Click the “X” in the upper-right corner of the application window. The currently displayed worksheet is saved, and then the application closes.
M Worksheet Container for one or multiple visualization objects.
N Worksheets Navigation Panel Toggle pane displaying all saved worksheets and providing the means to refresh, open, create, duplicate, rename, or delete worksheets.
O Message Bar Means of conveying information on application status, with activity notifications being displayed in green, error notifications being displayed in red, and all notifications fading with age.
P Resize Handle Control for resizing the application window while maintaining aspect ratio.
KEY COMPONENT DESCRIPTION

1–12 MULTILIN P30 PHASOR DATA CONCENTRATOR – INSTRUCTION MANUAL
DESCRIPTION OF THE P30 SYSTEM CHAPTER 1: MULTILIN P30 GENERAL
Multilin P30 Order Codes

CHAPTER 1: MULTILIN P30 GENERAL P30 SYSTEM SPECIFICATIONS
MULTILIN P30 PHASOR DATA CONCENTRATOR – INSTRUCTION MANUAL 1–13
P30 System Specifications
Concentrator CardGENERALComputer Type: ...................................................6U VME single board computerInstallation Type: .................................................Dual slot
CPUFloating Point Unit: .............................................EmbeddedEncryption/Decryption: ....................................Support provided
MEMORYSDRAM: ....................................................................1 GBBoot Flash:..............................................................8 MBFirmware Flash: ...................................................256 MBCompact Flash: ....................................................16 GBNVRAM: ....................................................................16 MBEEPROM:..................................................................Included
HEAT SINKType:..........................................................................Natural convection
SERIAL COMMUNICATIONNumber: ..................................................................1 portConnector Type: ..................................................DB9
ETHERNET COMMUNICATIONNumber: ..................................................................2 ports
Two fiber/copper ports - 10/100/1000BASE-T or 100BASE-FXConnector Type: ..................................................Copper: RJ45
Fiber: ST
IRIG-B ADAPTERSignal Type:............................................................DC Shift
Historian CardCPUUnit Type: ................................................................6U VME single board computerType:..........................................................................Triple slot
MEMORYSDRAM: ....................................................................4 GBFlash Drive: ............................................................16 GB
ETHERNET COMMUNICATIONNumber: ..................................................................2 10/100/1000BASE-TX ports (on front panel)Connector Type: ..................................................RJ45
INPUT/OUTPUTPorts: .........................................................................2 SATA ports (rear) through connector PO
COM1 EIA-232/485 (simplified) port on front panel (connector Type: RJ-12)One USB port on front panel
Logical Connections: .........................................Up to 7 ESV sessions

1–14 MULTILIN P30 PHASOR DATA CONCENTRATOR – INSTRUCTION MANUAL
P30 SYSTEM SPECIFICATIONS CHAPTER 1: MULTILIN P30 GENERAL
Applications CardCPUUnit Type:................................................................6U VME single board computerType: ......................................................................... Triple slot
MEMORYSDRAM: ....................................................................4 GBFlash Drive: ............................................................16 GB
ETHERNET COMMUNICATIONNumber: ..................................................................2 10/100/1000BASE-TX ports (on front panel)Connector Type: ..................................................RJ45
INPUT/OUTPUTPorts:.........................................................................2 SATA ports (rear) through connector PO
COM1 EIA-232/485 (simplified) port on front panel (connector Type: RJ-12)One USB port on front panel
SATA SSD and SATA SSD Carrier CardGENERALDrives: ......................................................................2 solid-state drives (SSDs) MTBF: ........................................................................10 years at 40°C and 55% humidityTotal SSD Capacity:............................................256 GB
Power SupplyHIGH RANGE POWER SUPPLY INPUTSNominal:..................................................................100 to 240 VAC (50/60 Hz)
125, 220, 250 VDCOperational Range:............................................85 to 264 VAC (48 to 62 Hz)
88 to 280 VDCPower Rating: .......................................................130 VA maxHold-up time:........................................................>2 msCooling: ...................................................................Natural convection
LOW RANGE POWER SUPPLY INPUTNominal:..................................................................48 VDCOperational Range:............................................36 to 72 VDCPower Rating: .......................................................120 W max
OUTPUT CONTACTS (FORM C CRITICAL FAILURE RELAY)Carry Current for 0.2 s:.....................................30 A per ANSI C37.90Carry Current - Continuous: ..........................8 AOperate Time: ......................................................< 10 msContact Material: ................................................ silver alloy

CHAPTER 1: MULTILIN P30 GENERAL P30 SYSTEM SPECIFICATIONS
MULTILIN P30 PHASOR DATA CONCENTRATOR – INSTRUCTION MANUAL 1–15
Testing and CertificationAPPROVALS
TYPE TESTS
Applicable Council Directive According to:
CE ComplianceLow voltage directive EN60255-5/EN60255-27
EMC Directive EN61000-6-4/EN61000-6-5
ANSICommunication networking devices installed in Electric Power Substations
IEEE1613
ISO Manufactured under a registered quality program ISO9001
TEST REFERENCE STANDARD TEST LEVEL
Dielectric voltage withstand 2 KVAC/2828 V DC
Impulse voltage withstand IEEE C37.90/ EN60255-5/ EN60255-27 up to 5 KV
Insulation resistance Test 500 V DC
Damped Oscillatory IEC60255-22-1 2.5 KV CM, 1 KV DM
Electrostatic Discharge EN61000-4-2 Level 4
RF immunity EN61000-4-3 Level 4
Fast Transient Disturbance EN61000-4-4 Level 4
Surge Immunity EN61000-4-5 Level 3
Conducted RF Immunity EN61000-4-6 Level 3
Radiated & Conducted Emissions CISPR11 Class A
Sinusoidal Vibration IEC60255-21-1 Class 1
Shock & Bump IEC60255-21-2 Class 1
Siesmic IEC60255-21-3 Class 2
Power magnetic Immunity IEC61000-4-8 Level 5
Voltage Dip & interruption IEC61000-4-11 0, 40, 70, 80% dips, 250/300cycle interrupts
Mains Frequency Immunity IEC61000-4-16 30 to300
Ripple on DC power port Immunity test IEC61000-4-17 15%
Voltage dips and short interruptions on DC power port
IEC61000-4-29 Dip 10ms to 1s, Int 1ms to 1s & Voltage variations
Environmental (Cold) IEC60068-2-1 0°C, 16 hrs
Environmental (Cold storage) IEC60068-2-1 -40°C, 16 hrs
Environmental (Dry heat) IEC60068-2-2 60°C, 16hrs
Environmental (Dry heat storage) IEC60068-2-2 85°C, 16hrs
Relative Humidity Cyclic IEC60068-2-30 6day variant 2
RF Immunity IEEE/ANSIC37.90.2 20V/m 80 to 1Ghz
SWC Damped Oscillatory IEEE/ANSIC37.90.1 2.5 KV CM, 2.5 KV DM
SWC EFT IEEE/ANSIC37.90.1 4 KV, 2.5Khz
Altitude MIL-STD-810E 2000 m to 12192 m

1–16 MULTILIN P30 PHASOR DATA CONCENTRATOR – INSTRUCTION MANUAL
P30 SYSTEM SPECIFICATIONS CHAPTER 1: MULTILIN P30 GENERAL
PhysicalDIMENSIONSSize: ...........................................................................483 mm (19") Standard VME chassisWeight: ....................................................................17.33 kg [38.2 lb]
EnvironmentalOPERATING ENVIRONMENT
Ambient temperatures:
Storage: -40°C to 85°C
Operating: 0°C to 60°C
Humidity Operating up to 95% (non condensing) @ 55°C (As per IEC60068-2-30 Variant 2, 6days)
Altitude: 2000m (max)
Pollution Degree: II
Overvoltage Category: II
Insulation class: 1
Ingress Protection: 40

MULTILIN P30 PHASOR DATA CONCENTRATOR – INSTRUCTION MANUAL 2–1
Multilin P30
Chapter 2: Multilin P30 Installation
GE Energy
Multilin P30 Installation
Hardware Description
The Multilin P30 is a multi-processor computing platform comprising multiple single board computers: a Synchrophasor Processor Single Board Computer and one other Single Board Computer - a Historian - are housed in one standard 19” (483 mm) 6U rack mounted chassis. To alleviate maintenance concerns, the P30’s design has eliminated the need for any moving parts, and it is cooled entirely by natural-convection (for mounting requirements for cooling, see the Mechanical Installation > Mounting section below).In addition to its processor cards, the Multilin P30 device supports 2, 128 GB solid-state drives connected to the Historian processor, should it be ordered, to serve as its archive location.Finally, though the base model of the Multilin P30 has 1 power supply (DC or Universal), it can be equipped with a fully redundant, current sharing mate.
NOTE
NOTE: The components of the Multilin P30 are not customer serviceable. Under no circumstances should components be added or removed from the system by non-GE personnel.
NOTE
NOTE: The components of the Multilin P30 are not hot-pluggable. Under no circumstances should components be added or removed while power is supplied to the device.

2–2 MULTILIN P30 PHASOR DATA CONCENTRATOR – INSTRUCTION MANUAL
HARDWARE DESCRIPTION CHAPTER 2: MULTILIN P30 INSTALLATION
Concentrator Processor
The Concentrator Processor is located in the left-most slot of the Multilin P30 chassis. A description of all ports and LEDs is provided below.
• A PMC slot, which will be populated with an Ethernet expansion module if the Multilin P30 is ordered with 4 Ethernet ports
• Two 100BASE-FX fiber ports or two 10/100/1000BASE-T copper ports
• Link/Activity LEDs:
– For Fiber ST connectors, the LEDs are adjacent to the ports
– For RJ-45 connectors, LEDs are built into the connectors
• DB9 connector for RS232 maintenance port
• LEDs for Power (PWR), Ready (RDY) and IRIG-B Sync (IRIG)
Though physically available, use of the USB port is not supported on the Multilin P30.
Figure 1: Concentrator Processor
GE Energy Overview
Syncrophasor Processor
Input Power Board
Historian
Spacer
SATA card
Application
PSU #1
PSU #2
Spacer

CHAPTER 2: MULTILIN P30 INSTALLATION HARDWARE DESCRIPTION
MULTILIN P30 PHASOR DATA CONCENTRATOR – INSTRUCTION MANUAL 2–3
Table 1: Concentrator Status LED Indicators
Table 2: Concentrator Link / Activity Status LED Indicators
LED Color Setting Description
PWR Green On SVDC is present.
Off SVDC is not present.
RDY Green On When the READY light is continuously “On” it means that the device is up and running and the configuration has been successfully loaded. As a result there should be communication with PMUs, and clients should be able to connect to the Multilin P30.
Off If the READY light is “Off” it means that there is a problem with the configuration and there will be no communication to the PMUs. Clients will not therefore be able to connect to the Multilin P30 . The configuration may be corrupted and if so, it will be necessary to use the serial console port to reconfigure.
Blinking If the READY light is “Blinking” it means that although the configuration has been successfully loaded, the unit has not been enabled. There will be no communication to the PMUs and clients will not be able to connect to the Multilin P30 . Please use the EnerVista P30 Setup program to enable it by means of the UNIT PROGRAMMED setting.
IRIG Green Flashing Flashes at 1 HZ when a valid IRIG-B signal is detected.
Off IRIG-B Watchdog Timer has timed out.
ST Fiber Ethernet LEDs (100BASE-FX)
LINK1 Green On 100BASE-FX link up.
LINK2 Off 100BASE-FX link down.
ACT1 Yellow On Ethernet activity detected.
ACT2 Off No Ethernet activity.
RJ-45 Copper Ethernet LEDs (10/100/1000BASE-T)
LINK Orange/Green On Orange for 1000BASE-T link-up. Green for 100BASE-TX link-up.
Off 10BASE-T link-up or link down.
ACT Yellow On Ethernet activity detected.
Off No Ethernet activity.

2–4 MULTILIN P30 PHASOR DATA CONCENTRATOR – INSTRUCTION MANUAL
HARDWARE DESCRIPTION CHAPTER 2: MULTILIN P30 INSTALLATION
Historian Processor
The Historian Processor is located to the right of the Concentrator processor in the Multilin P30 chassis. A description of all ports and LEDs is provided below:
Figure 2: Historian Processor
The Historian Processor provides the following front panel interfaces:
Front Panel LED Description
Serial Ports COM: 1xEIA-232/EIA-485 UART interface for CPU on RJ-12 connector
Gigabit Ethernet Two 10/100/1000BASE-T(X) ports on RJ45
USB USB 2.0 interface
Reset Reset pushbutton
LEDs 5 LEDs reporting the board CPU health status and activity
CPU LED COLOR DESCRIPTION
L1 RED Permanent error on CPU subsystem (CATERR)
GREEN Power-up start
AMBER Reset state on CPU subsystem
BLINKING CPLD activity (I2C, SMI, or COM)
OFF No error, no CPLD activity
L2 RED CPLD Watchdog reset timer expired
GREEN Normal operation mode
AMBER Factory test mode
BLINKING SATA activity
OFF No error, no SATA activity
L3 RED CPU frequency limited to 1.2 GHz
GREEN 1000BASE-T rear LAN link
AMBER 10/100 BASE-T(X) rear LAN link
BLINKING LAN activity on rear
OFF No error, no rear LAN activity/link
L4 RED PBIT failed
GREEN Normal operation mode
AMBER ALMA2f VME FPGA downloading
BLINKING PCI and VME buses activity
OFF No error, no PCI activity
L5 RED Power failure
GREEN Normal operation mode
AMBER VITA57 FPGA downloading
BLINKING PCI-X activity
OFF No error, no PCI-X activity

CHAPTER 2: MULTILIN P30 INSTALLATION HARDWARE DESCRIPTION
MULTILIN P30 PHASOR DATA CONCENTRATOR – INSTRUCTION MANUAL 2–5
Power Supplies
The Multilin P30 can be ordered with either a low voltage DC power supply or a high voltage universal AC/DC power supply. Additionally the device may be ordered with a fully redundant power supply. The Multilin P30 ’s power supply and its mate (if installed) are located adjacent to the input power board. A LED indicator has been provided to show the status of the supply. The input power requirements are also clearly indicated on the front of each supply.
Figure 3: High voltage power supply
Figure 4: Low voltage power supply
Power Supply LED Description:
• Green: Power good
• Red: Power fault
NOTE
NOTE: Critical power supply failures are communicated through contact outputs provided on the input power board.
NOTE
NOTE: The Multilin P30 cannot be ordered with 2 different power supplies. The redundant power supply must be the same model as its mate.

2–6 MULTILIN P30 PHASOR DATA CONCENTRATOR – INSTRUCTION MANUAL
MECHANICAL INSTALLATION CHAPTER 2: MULTILIN P30 INSTALLATION
Mechanical Installation
The Multilin P30 is based on an industry standard VME mechanical design and takes the form of a standard 6U 19” VME chassis. Furthermore, the hardware has been designed so all its input and output ports face to the rear, once the Multilin P30 is mounted.

CHAPTER 2: MULTILIN P30 INSTALLATION MECHANICAL INSTALLATION
MULTILIN P30 PHASOR DATA CONCENTRATOR – INSTRUCTION MANUAL 2–7
DimensionsFigure 5: Multilin P30 dimensions

2–8 MULTILIN P30 PHASOR DATA CONCENTRATOR – INSTRUCTION MANUAL
MECHANICAL INSTALLATION CHAPTER 2: MULTILIN P30 INSTALLATION
Handling/Safety PrecautionsELECTROSTATIC DISCHARGE NOTICEElectrostatic discharge can damage the Multilin P30 unit. To prevent ESD please read the following cautions and warning:
FASTPATH: When working with the chassis of a unit not in operation, the unit must be placed on a grounded anti-static mat. If the chassis cannot be placed on a grounded anti-static mat, connect a grounding strap between the electrical input ground and the facility electrical service ground.
IMPORTANT: Depending on the chassis, open equipment enclosures and chassis can expose hazardous voltage which may cause electric shock to the installer. Be sure line power to the equipment is disconnected before servicing the chassis and components.
FIBER/LASER NOTICEFor fiber optic / laser devices, note the following warnings and notes:
CAUTION: Products containing Class 1 optical/laser devices comply with:
- IEC60825-1
Invisible laser radiation may be emitted from disconnected fibers or optical/laser devices. Do not stare into beams or view directly with optical instruments as this may permanently damage your eyes.
CAUTION: It is important to disconnect or remove all cables before removing or installing a board containing an optical/laser transceiver.
Do not leave an optical/laser transceiver uncovered except when inserting or removing a cable. The safety/dust plugs keep the port clean and prevent accidental exposure to laser light.
NOTE
NOTE: Protect optical/laser devices by inserting clean dust plugs into the optical/laser device after the cables are extracted from them. Be sure to clean the optic surfaces of the fiber cables before plugging the dust plugs back into the optical bores of another device. Avoid getting dust and other contaminants into the optical bores of your device. The optics will not work correctly when obstructed with dust.

CHAPTER 2: MULTILIN P30 INSTALLATION MECHANICAL INSTALLATION
MULTILIN P30 PHASOR DATA CONCENTRATOR – INSTRUCTION MANUAL 2–9
MountingFigure 6: Multilin P30 mounting
The Multilin P30’s enclosure is intended for indoor use only. Do not place the Multilin P30 in environments where unusual conditions exist (windblown dust and dirt, liquids, etc.).The Multilin P30 is mounted with 10-32 screws, to a standard VME rack mount system. Ensure that it is protected from falling debris during installation; small metal particles can drop through the ventilation holes at the top of the Multilin P30 possibly damaging, or interfering with, safe operation of the unit. If you cover the unit for maintenance, remove the cover before operation in order to provide necessary airflow for cooling.To mount the Multilin P30 in a rack:
1. Unpack the Multilin P30.
2. Inspect the Multilin P30 for damage. Report any damage immediately to GE.
3. Align the Multilin P30 in the desired position in a 19” mounting rack.
4. Holding the Multilin P30 firmly in place in the rails of the mounting rack, install and tighten the eight rack screws.
NOTE
NOTE: The Multilin P30 requires 2U of free space between any devices/obstructions that may reside above and below it. (1 RU = 1.75 inches (44.5mm))
NOTE
NOTE: Use of this equipment in a manner not specified by GE may impair the intended operation of the device.
NOTE
NOTE: For reasonable clearance, allow at least 14” of total cabinet depth to provide clearance for hardware and cables on the rear of the Multilin P30.

2–10 MULTILIN P30 PHASOR DATA CONCENTRATOR – INSTRUCTION MANUAL
MECHANICAL INSTALLATION CHAPTER 2: MULTILIN P30 INSTALLATION
You are now ready to connect all power and communication wiring to the back of the Multilin P30 . Please refer to relevant sections of this manual.

CHAPTER 2: MULTILIN P30 INSTALLATION ELECTRICAL INSTALLATION
MULTILIN P30 PHASOR DATA CONCENTRATOR – INSTRUCTION MANUAL 2–11
Electrical Installation
All electrical connections to the Multilin P30 must be made on the device’s input power board.

2–12 MULTILIN P30 PHASOR DATA CONCENTRATOR – INSTRUCTION MANUAL
ELECTRICAL INSTALLATION CHAPTER 2: MULTILIN P30 INSTALLATION
To make the terminal block connections, you will have to remove the protective plastic safety cover. Ensure that the cover is replaced once the desired connections are made. The power input board is clearly marked with the purpose of each terminal block position.
Control PowerAs indicated by the input power board silkscreen, all input power connections are to be made at the upper terminal block. The Multilin P30 may accept either DC or AC input power depending on the power supply that is ordered with the device. Please refer to the product order code for further information.Vdc-/ACL Input:
• Negative if DC input
• Line if AC input
Vdc+/ACN Input:
• Positive if DC input
• Neutral if AC input
NOTE
NOTE: Ensure ground connection on power input terminal is always assigned.
NOTE
NOTE: Ensure the ground stud connection on the input power board is always connected before operating the Multilin P30 .
Critical Fail RelayThe Multilin P30 provides DC GOOD outputs for each power supply to indicate when either of the power supplies fitted in the device fail to provide DC power to its single board computers. The DC GOOD outputs are provided via a FORM-C, dry contact output so that users can choose to drive external signals via either a normally-closed or normally-open contact output. All connections to the DC good signal must be made to the lower terminal block:
The NO1/NC1 signals pertain to the power supply closes to the left-hand side (facing) power supply, while the N02/NC2 signals pertain to the right-hand power supply.

CHAPTER 2: MULTILIN P30 INSTALLATION SERIAL COMMUNICATIONS
MULTILIN P30 PHASOR DATA CONCENTRATOR – INSTRUCTION MANUAL 2–13
Serial Communications
The Multilin P30 Phasor Data Concentrator is equipped with a serial port for initial commissioning and rudimentary diagnostics. A standard DB9 interface is supplied for serial connection. A null modem cable must be used to connect a PC to the P30 Data Concentrator.A terminal program must be used on an external PC to communicate with the concentrator board via serial communications. The following serial port parameters must be provisioned in the terminal program for it to operate with the Multilin P30:
• 19200bps
• 8 data bits
• 1 stop bits
• No parity bit
NOTE
NOTE: The serial port cannot be used to communicate with the P30 from the EnerVista P30 Setup software.
Command Line InterfaceThe Multilin P30 Phasor Data Concentrator has been equipped with a Command Line Interface (CLI) to simplify initial commissioning of the device. The CLI is not intended as a means for complete device configuration, but only as a means to setup Ethernet communications with the device, and as a means to reset the device back to factory defaults should a user want to default the system.Because the CLI is intended as a means of initial configuration, default passwords will be required when logging into the CLI for the first time. Please see the Security section of this manual to obtain the default local passwords required.The CLI is exclusively available on the serial port interface of the Multilin P30 Concentrator board. The following operations are specifically supported:
• Authentication of local users
• Setting IP / DHCP parameters of Concentrator card console port
• Setting IP / DHCP parameters of Historian card network port
• Setting IP / DHCP parameters of Application card network port
• Listing the MAC addresses of the concentrator card
• Setting the system to factory default.
NOTE
NOTE: In order to access any given command, users must be logged into the system with the appropriate privileges. Please see the Security section for further details.
The CLI also provides a Command Completion feature for user convenience. When you type the first few characters of a command and press the tab key, it will print all matching commands which start with the same characters as entered by the user. This is case sensitive.
Commands Login OperationThis operation is required to gain access to the CLI. The user must login with a locally defined user ID and password. The user will be unable to proceed with any further CLI commands without logging in.
NOTE
NOTE: The user may have to press the ENTER key in order to make the login command visible, if he is connecting to the P30 serial port after the machine has already bootstrapped.

2–14 MULTILIN P30 PHASOR DATA CONCENTRATOR – INSTRUCTION MANUAL
SERIAL COMMUNICATIONS CHAPTER 2: MULTILIN P30 INSTALLATION
GetIPThis command is used to retrieve the IP Address, subnet mask and gateway for the concentrator console port.Example:
To retrieve the IP address information for the console port use the following command (no parameters are required):GetIPThe following output will be displayed on the serial console after this command is executed if DHCP is disabled:systemIP: 3.94.248.138 netmask: 255.255.255.0 gateway: 3.94.248.1 DHCP: Disabled
The following output will be displayed on serial console after this command is executed if DHCP is enabled:systemIP: 3.94.248.138 netmask: 255.255.255.0 DHCP: EnabledPlease note that when DHCP is enabled, the P30 will not display the gateway address assigned to the P30 console port.
SetIPThis command is used to set the IP Address, subnet mask, and gateway for the Concentrator console port.The console port is defined as an Ethernet port. No ports other than Ethernet port 1 will accept management traffic from EnerVista P30 Setup for security reasons.Example:
To set a static IP address use the following command:GECLI #> SetIP "3.94.248.138 netmask 255.255.255.0 gateway 3.94.248.1"The following output will be displayed on the serial console after this command is executed:GECLI #> Console port network parameters were changed successfullyPlease execute command SetActiveConfiguration to activate your changes|systemIP:3.94.248.138 netmask: 255.255.255.0 gateway: 3.94.248.1To enable dhcp use the following command:GECLI #> SetIP “dhcp”The following output will be displayed on serial console after this command is executed:GECLI #> Console port network parameters were changed successfullyPlease execute command SetActiveConfiguration to activate your changessystemIP:dhcp

CHAPTER 2: MULTILIN P30 INSTALLATION SERIAL COMMUNICATIONS
MULTILIN P30 PHASOR DATA CONCENTRATOR – INSTRUCTION MANUAL 2–15
SetHistorianIPThis command is used to set the IP parameters for the console port of the on-board Historian should the Multilin P30 be equipped with one.Example:
GECLI #> SetHistorianIP "3.94.248.136 netmask 255.255.0.0 gateway 3.94.244.1"To enable dhcp GECLI #> SetHistorianIP "dhcp"
SetApplicationCardIPThis command is used to set the IP parameters for the console port of the Application card.Example:
GECLI #> SetApplicationCardIP "3.94.248.136 netmask 255.255.0.0 gateway 3.94.244.1"To enable dhcp GECLI #> SetApplicationCardIP “dhcp”
SetActiveConfigurationThis command is used to activate new configuration changes which were performed using the Multilin P30 CLI interface.The command will reboot the system so that new parameters can be activated.Example:
GECLI #> SetActiveConfiguration
SetFactoryDefaultsThis command is used to restore the Multilin P30 Concentrator to factory defaults. Note that this includes all settings, local passwords, certificates, and events. As this will reset the console port network parameters, the Multilin P30 will need to be provisioned via the CLI before it is used with EnerVista P30 Setup . This command does not require any parameters. After executing this command, the user must execute the SetActiveConfiguration command to complete the process. If not executed, the process will be completed the next time the Multilin P30 Concentrator is powered on.Example:
SetFactoryDefaultsThe following output is displayed on serial console after this command is executed:GECLI #> Local users passwords set to default values copying file /romfs/Pdc.xml -> /tffs0/Pdc.xmlConfiguration parameters were set to default values successfully
ShowMacAddressThis command is used to display the MAC addresses of all the Ethernet ports installed on the Concentrator board. The command can be used to help troubleshoot the network setup. Note that Concentrator boards may be ordered in both 2-port and 4-port configurations.Example:
Mac Address for port 0:- MAC from NVRAM: 00:D0:1C:0B:72:0E
Mac Address for port 1:- MAC from NVRAM: 00:D0:1C:0B:72:0FMac Address for port 2:

2–16 MULTILIN P30 PHASOR DATA CONCENTRATOR – INSTRUCTION MANUAL
SERIAL COMMUNICATIONS CHAPTER 2: MULTILIN P30 INSTALLATION
- MAC from NVRAM: FF:FF:FF:FF:FF:FF
Mac Address for port 3:- MAC from NVRAM: FF:FF:FF:FF:FF:FFMac Address for port 4:- MAC from NVRAM: 00:D0:1C:0B:72:10
logoutEnter the logout command to exit the Multilin P30 CLI prompt. As the Multilin P30 does not allow simultaneous logins, the CLI user must logout to allow EnerVista P30 Setup to connect to the device.

CHAPTER 2: MULTILIN P30 INSTALLATION SERIAL COMMUNICATIONS
MULTILIN P30 PHASOR DATA CONCENTRATOR – INSTRUCTION MANUAL 2–17
Sample Wiring Diagram

2–18 MULTILIN P30 PHASOR DATA CONCENTRATOR – INSTRUCTION MANUAL
ETHERNET COMMUNICATIONS CHAPTER 2: MULTILIN P30 INSTALLATION
Ethernet Communications
The diagram below shows the external communications surrounding a typical/expected network.
Concentrator Processor
The Multilin P30 Concentrator Processor standard configuration provides 2 Ethernet interfaces, either 10/100/1000BT or 100BASE-FX. In each case, port 1 and port 2 are both intended to support IEEE c37.118 client and server traffic. Users may wish to connect these ports to a standard Ethernet switch to provide a large fan in to accommodate up to 40 unique inputs. Refer to Chapter 5 - System Setup in this manual to determine how to map c37.118 traffic to an individual Ethernet port on the Multilin P30 device’s concentrator processor.Management traffic from EnerVista P30 Setup software is only supported on Ethernet Port 1 of the Concentrator processor. As such, to communicate with the concentrator, the Synchrophasor Processor console port must be reachable from the PC on which the EnerVista P30 Setup software is installed.

CHAPTER 2: MULTILIN P30 INSTALLATION ETHERNET COMMUNICATIONS
MULTILIN P30 PHASOR DATA CONCENTRATOR – INSTRUCTION MANUAL 2–19
In the case where the EnerVista P30 Setup software PC is directly connected to the console port, its IP address must be on the same subnet as the console port.For security reasons, all management traffic between the EnerVista P30 Setup software and the concentrator port is encrypted.
NOTE
NOTE: To balance traffic between both ports on the syncrhophasor processor, GE recommends assigning each physical interface to a separate IP subnet. In this way traffic originating from separate subnetworks may be balanced across both ports. This recommendation applies to both inputs and outputs on the synchrophasor proocessor.
NOTE
NOTE: Certain relays may be configured to operate in Half-Duplex mode. To reduce transmission delay in the overall system, GE recommends setting all Ethernet ports to operate in full-duplex mode.
Historian Processor
The Multilin P30 Historian processor is equipped with two 10/100BT Ethernet interfaces. These ports may be connected to a LAN to provide access to the data stored within the Historian. The ports are also required to provide the EnerVista P30 Setup software with access to the Historian for configuration and firmware upgrades. By default both Historian Ethernet ports are preconfigured for DHCP. The Historian console port must be on the same network as the Concentrator console port and the PC for EnerVista to properly communicate with the device.The Multilin P30 Historian is also preconfigured with a default computer name, to simplify initial configuration of the device on a Windows Network. Please see the Historian section of this manual for further information. Users may wish to add the Historian Processor to an existing Windows Domain.
NOTE
NOTE: Because the Historian processor is a “headless” Windows system, RDP (Windows Remote Desktop Protocol) access is required for any Windows-related configuration.
NOTE
NOTE: GE recommends that the Historian be left in its factory default state. For security purposes, all critical Windows operating system parameters are defaulted to the factory default state when the Multilin P30 is restarted, with three exceptions. The following changes persist through a restart:
1. Network configuration changes made with EnerVista P30 Setup.
2. Network configuration changes made via the CLI.
3. Changes made during a computer management session (refer to the Historian Commands section).
NOTE
NOTE: In order to allow configuration of certain Historian features such as compression and dead-banding, the EnerVista P30 Setup software requires access to port 1 on the Historian. Likewise, the GE EnerVista Synchrophasor Viewer (ESV) software also requires front panel Ethernet access to visualize data stored within the Historian. The EnerVista Synchrophasor Viewer software can be provisioned with the IP address of one of the Historian Ethernet ports. Please refer to the EnerVista Synchrophasor Viewer section of this manual for further details on the ESV software operation and its use.

2–20 MULTILIN P30 PHASOR DATA CONCENTRATOR – INSTRUCTION MANUAL
IRIG-B CHAPTER 2: MULTILIN P30 INSTALLATION
IRIG-B
The Multilin P30 is intended to operate with a DC-Shift IRIG-B input; AM IRIG-B signals are not supported. Users must ensure that a valid IRIG-B signal is provided to the Multilin P30 for correct operation.IRIG-B inputs can be provided via either a BNC connection or a two wire connection on the Multilin P30 device’s power input board (PIB).
NOTE
NOTE: Initial Power-up: Because the IRIG-B standard does not account for the current year, users must set the Multilin P30 device’s current year via the EnerVista P30 Setup program. The Multilin P30 will record an event in its event recorder if the year has not been set since power-up.GE strongly recommends setting the year in EnerVista P30 Setup each time the Multilin P30 has been powered-off and powered-on again.
During ordinary operation, the Multilin P30 will inform users through its event recorder feature, of problems it detects with the IRIG-B signal. Should the quality of the signal become degraded, while the physical input is still connected to the Multilin P30 , an event will be generated. A separate event is also generated when the Multilin P30 detects a complete loss of signal.The Multilin P30 maintains an internal timing mechanism to keep time, that can be leveraged when the external IRIG-B signal is degraded or lost, mid-operation. As such the Multilin P30 will continue to operate even when the IRIG-B signal is lost, but will mark all output time quality bits referenced in the C37.118 standard as required.Should the external IRIG-B signal be restored, the Multilin P30 raises the appropriate event to indicate to the user that the external timing is once again available.The Multilin P30 device’s software algorithms can accommodate up to 2ms of drift between its internal timing mechanism and an external timing reference.
NOTE
NOTE: The Multilin P30 flushes all its internal PMU buffers if, upon regaining an external timing reference, it detects greater than a 2ms difference between its own internal mechanism and the external reference. Should the internal PMU buffers be flushed, the Multilin P30 will write an appropriate event to its event recorder to inform the user.
NOTE
NOTE: The P30 must be connected to a valid IRIG-B signal in order to carry out any installation / commissioning of the device.

CHAPTER 2: MULTILIN P30 INSTALLATION IRIG-B
MULTILIN P30 PHASOR DATA CONCENTRATOR – INSTRUCTION MANUAL 2–21
Historian Local Clock
NOTE
NOTE: The clock on the Multilin P30 must be within five minutes of the clock on the PC for EnerVista P30 Setup to communicate properly. See Section 6 - IRIG-B Commands for details on setting the clock.
The Historian card's local clock is synchronized to the concentrator's clock so that it is stable and accurate, which is necessary for the Historian card to function properly. The Historian Server will not start on boot-up until the difference between its clock and the concentrator's clock is less than a certain threshold indicating that the clocks are synchronized. Collection of data from the concentrator card by the Historian card will not start on boot-up until their clocks are synchronized and the concentrator has received at least one valid update from an IRIG-B signal.
NOTE
NOTE: The start-up of the Historian Server without the concentrator receiving an IRIG-B input on boot-up is to allow viewing of previously archived data.
If the Historian card is added to a Windows Domain, the clock(s) in the domain time server(s) must be synchronized with an IRIG-B clock, with an error margin of 10 seconds. If this requirement cannot be met, the system registry of the Historian card must be modified in a computer management session after the card joins the domain, as follows:Edit:HKEY_LOCAL_MACHINE\SYSTEM\CurrentControlSet\Services\W32Time\Parameters\Type, so that its value is NTP (of type REG_SZ).

2–22 MULTILIN P30 PHASOR DATA CONCENTRATOR – INSTRUCTION MANUAL
IRIG-B CHAPTER 2: MULTILIN P30 INSTALLATION

MULTILIN P30 PHASOR DATA CONCENTRATOR – INSTRUCTION MANUAL 3–1
Multilin P30
Chapter 3: Multilin P30 Security
GE Energy
Multilin P30 Security
The Multilin P30 has been designed with advanced security features that provide:
• Centralized user profiles (Customer Furnished RADIUS server required)
• Secure local passwords
• Encrypted data transmission between EnerVista P30 Setup software and the Data Concentrator
• Secure firmware upgrades.
The Multilin P30 can be accessed using remote or local user IDs. Remote user IDs must reside on an external RADIUS server, and must be provided with the requisite user role (described below). Roles can be specified in the RADIUS server’s configuration file for users.The Multilin P30 is supplied with 4 default local accounts. While it is not possible to provide additional local accounts or rename the accounts, it is possible to change the password for Administrator, Observer, and Engineer user accounts (see Section 5: Settings > EnerVista P30 Setup > Security).This connection uses a local account. The duration of the user session is controlled by an inactivity timer. If the Multilin P30 determines that no activity has occurred for the user-configurable duration, the session will be closed and the user will be automatically logged out. The Inactivity Timeout setting has a minimum of 2 minutes, a maximum of 30 minutes, and a default value of 5 minutes.
NOTE
NOTE: EnerVista P30 Setup software functions that poll the Multilin P30 device, are considered to be activities that will prevent the inactivity timer from starting. For example, if the Trending screen is left active, the inactivity timer will be reset each time the Multilin P30 is polled by the software.

3–2 MULTILIN P30 PHASOR DATA CONCENTRATOR – INSTRUCTION MANUAL
USER ROLES CHAPTER 3: MULTILIN P30 SECURITY
User Roles
The Multilin P30 provides user roles to limit levels of access to various device functions. The table below lists the roles that are supported and their corresponding capabilities.The restore account has been supplied to reset the Multilin P30 to factory default settings. Its password can never be reset, and it requires physical access to the Multilin P30 to be used via the serial port and CLI interface.
Table 1: Ethernet Interface Permissions
* This action applies only to Local Administrators.
Table 2: Command Line Interface permissions
NOTE
NOTE: R = ReadW = WriteX = eXecute
Remote user accounts cannot change their own remote passwords from the Multilin P30 , as these passwords must changed at the RADIUS server itself.
NOTE
NOTE: EnerVista P30 Setup will allow only Administrators to write an offline settings file.
Observer Engineer Administrator Factory Restore
Security Settings R R RW R -
Local Administrator Password - - W* - -
Local Engineer Password - - W* - -
Local Observer Password - - W* - -
Restore Password - - - - -
Event Recorder Settings R RW RW R -
Network Settings R RW RW R -
Installation Settings R RW RW R -
Historian Settings R RW RW R -
Power System Settings R RW RW R -
Input Configuration Settings R RW RW R -
Pseudo PMU Settings R RW RW R -
PMU Manager Settings R RW RW R -
Output Configuration Settings R RW RW R -
PMU Selection Settings R RW RW R -
Basic Commands (Clear Event Recorder) - X X - -
Basic Commands (Apply Configuration) - - X X -
Date and Time Commands - X X - -
Actual Values R R R R -
Firmware Update - - W - -
Restore Observer Engineer Administrator Factory
SetHistorianIP X
SetApplicationCardIP X
SetIP X
SetFactoryDefaults X X X X X
SetActiveConfig X X

CHAPTER 3: MULTILIN P30 SECURITY PASSWORD COMPLEXITY POLICY
MULTILIN P30 PHASOR DATA CONCENTRATOR – INSTRUCTION MANUAL 3–3
Password Complexity Policy
The Multilin P30 includes a static password complexity policy to which all user passwords must adhere. The password complexity policy requires an alpha-numeric password (for all accesses - front panel and network ports) that meets the following requirements:
• Passwords cannot contain the user's account name that exceed two consecutive characters.
• Passwords must be at least six (to 245) characters in length.
• Passwords must contain characters from three of the following four categories:
– English uppercase characters (A through Z)
– English lowercase characters (a through z).
– Base 10 digits (0 through 9).
– Non-alphabetic characters (for example, ~, !, @, #, $,%, &).

3–4 MULTILIN P30 PHASOR DATA CONCENTRATOR – INSTRUCTION MANUAL
LOCKOUT CHAPTER 3: MULTILIN P30 SECURITY
Lockout
The Multilin P30 provides a security feature for protecting against login attacks from a remote IP address (over Ethernet). If the P30 detects 3 failed authentication attempts from a single IP address within 3 minutes, it will block all subsequent authentication attempts from that IP address for the following 3 minutes. Lockout information is volatile, and does not survive a device restart.The Multilin P30 firmware contains the following configuration parameter for notification of failed authentication attempts:
• Failed Authentications: A threshold number of failed authentication attempts that indicates when a Pseudo PMU signal will be asserted. On restart of the Multilin P30, the pseudo PMU is cleared. See the Pseudo PMU and P30 Concentrator Settings sections for more information.
The Multilin P30 does not protect against invalid login attempts from serial terminals.

CHAPTER 3: MULTILIN P30 SECURITY REMOTE AUTHENTICATION
MULTILIN P30 PHASOR DATA CONCENTRATOR – INSTRUCTION MANUAL 3–5
Remote AuthenticationFASTPATH: Remote Authentication connection requires IRIG-B in order to function. Without IRIG-B, the
user will NOT be able to connect to the Multilin P30.
To use a RADIUS server, users must provide the system with the IP address of the RADIUS server that contains the user accounts to be used with the Multilin P30.
NOTE
NOTE: Configuration of RADIUS authentication requires an administrative understanding of RADIUS.
.
NOTE
NOTE: A user with Administrator permissions may provide the IP address information of the RADIUS server that is to be used with the Multilin P30.
The Multilin P30 has been designed to automatically direct authentication requests based on user names. In this respect, local account names on the Multilin P30 should be considered as reserved, and not provided on a RADIUS server.The Multilin P30 automatically detects whether an authentication request should be handled remotely or locally. When an external RADIUS server is used for central account management and remote authentication, the Multilin P30 will forward all authentication requests for non-local user accounts to a remote RADIUS server, and no authentication will be managed at the Multilin P30 itself.
As there are only 4 local accounts possible on the Multilin P30, if the user ID credential does not match one of the 4 local accounts, the Multilin P30 will automatically forward the request to a RADIUS server should one be provided. If the User ID matches a local account, the PDC will authenticate login requests locally.If a RADIUS server is provided in the Multilin P30, but is unreachable over the network, remote authentication requests will be denied. In this situation, it is suggested that users leverage local Multilin P30 accounts to gain access to the Multilin P30 system.
NOTE
NOTE: Administrator will remain active even after Local Authentication is disabled.
EnerVista P30Setup
Multilin P30 RADIUS Server
User Login
Login OK and User Role
User Authentication
Response with User Role

3–6 MULTILIN P30 PHASOR DATA CONCENTRATOR – INSTRUCTION MANUAL
REMOTE AUTHENTICATION CHAPTER 3: MULTILIN P30 SECURITY
NOTE
NOTE: See the specific RADIUS server instructions for information on how to provide user accounts and user roles on the RADIUS server itself. User roles provided in the server must conform to those specified above.
Remote user IDs must reside on an external RADIUS server, and must be provided with the requisite user role (described below). Users can be specified in the RADIUS server’s configuration file for users. Roles can be specified in the RADIUS server dictionary. Roles that can be specified on the RADIUS server are: Administrator, Engineer, Observer.
FASTPATH: Multilin P30 user ID length is limited to a maximum of 50 characters.
Example (FreeRADIUS):In the file ‘users’:
exampleusername User-Password == "examplepassword" GE-PDC-USER-Role = Administrator,
In the file ‘dictionary.ge’: # GE-PDC-USER-Role VALUE GE-PDC-USER-Role Administrator 2 VALUE GE-PDC-USER-Role Engineer 1 VALUE GE-PDC-USER-Role Observer 0
NOTE
NOTE: Restore account role cannot be created remotely, and is confined to the local system.
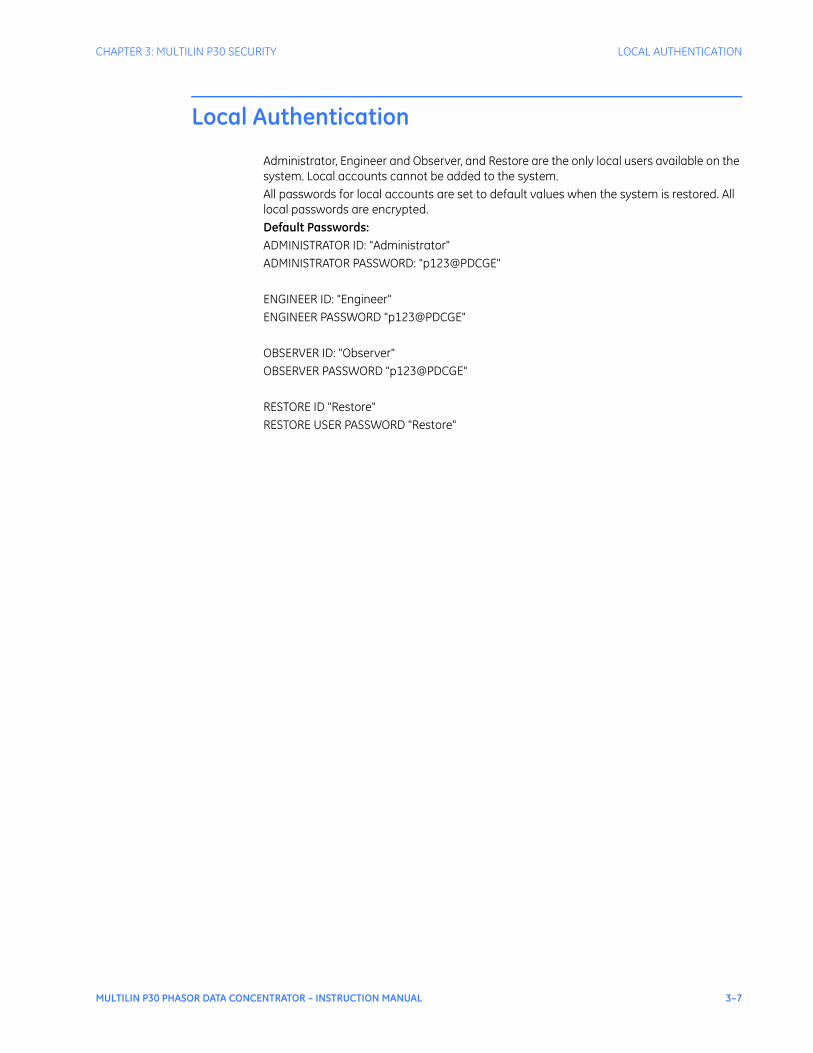
CHAPTER 3: MULTILIN P30 SECURITY LOCAL AUTHENTICATION
MULTILIN P30 PHASOR DATA CONCENTRATOR – INSTRUCTION MANUAL 3–7
Local Authentication
Administrator, Engineer and Observer, and Restore are the only local users available on the system. Local accounts cannot be added to the system.All passwords for local accounts are set to default values when the system is restored. All local passwords are encrypted.Default Passwords:ADMINISTRATOR ID: "Administrator" ADMINISTRATOR PASSWORD: "p123@PDCGE"
ENGINEER ID: "Engineer"ENGINEER PASSWORD "p123@PDCGE"
OBSERVER ID: "Observer"OBSERVER PASSWORD "p123@PDCGE"
RESTORE ID "Restore"RESTORE USER PASSWORD "Restore"

3–8 MULTILIN P30 PHASOR DATA CONCENTRATOR – INSTRUCTION MANUAL
HISTORIAN SECURITY CHAPTER 3: MULTILIN P30 SECURITY
Historian Security
Should the Multilin P30 be equipped with a Historian processor card, user access to the Historian can be directly managed by an existing Windows Domain if the card is added to that Windows Domain.By default the Multilin P30 Historian has been preconfigured with the local groups shown below. These local groups have specific permissions and capabilities assigned to them. Please see the table below for the permission assigned to each group:
NOTE
NOTE: R = ReadW = WriteX = eXecute
Default local account on passwords:UID: “Administrator” PASSWORD: “p123@PDCGE”
PDCPowerUser Administrator
Settings RW RW
File Retrieval R R
Product Info R R
Stop Historian Application X X
Start Historian Application X X
Restart Historian Application X X
Revert Pending Configuration X X
Enable/Disable Remote Desktop - X
Recreate Archive Files - X
Restart Historian Card - X
Shutdown Historian Card - X
Start Computer Management Session - X
Firmware Update - X

CHAPTER 3: MULTILIN P30 SECURITY FIRMWARE UPGRADE SECURITY
MULTILIN P30 PHASOR DATA CONCENTRATOR – INSTRUCTION MANUAL 3–9
Firmware Upgrade Security
To ensure that it cannot be hijacked by illegitimate firmware, the Multilin P30 will prevent the installation of unauthorized firmware during field firmware upgrades. The Multilin P30 recognizes only firmware that is signed by GE, which can be obtained from the GE website. Operation of this feature is transparent to the user.The firmware upgrade process has also been designed to be recoverable, by using 2 firmware storage banks. If either a power or communication interruption occurs during the firmware upgrade process, the system may be recovered by rebooting the Multilin P30 system so that firmware from the unaffected bank replaces that of the affected bank.

3–10 MULTILIN P30 PHASOR DATA CONCENTRATOR – INSTRUCTION MANUAL
FIRMWARE UPGRADE SECURITY CHAPTER 3: MULTILIN P30 SECURITY

MULTILIN P30 PHASOR DATA CONCENTRATOR – INSTRUCTION MANUAL 4–1
Multilin P30
Chapter 4: The EnerVista P30 Setup Interface
GE Energy
The EnerVista P30 Setup Interface
Handling the EnerVista P30 Setup Software
As a hardened, embedded systems device, the Multilin P30 does not incorporate an external keypad for user input. As such a PC must be used to download settings through the Multilin P30’s communications port. The EnerVista P30 Setup software is available from GE Digital Energy to make this as convenient as possible. With EnerVista P30 Setup running, it is possible to:
• Program and modify settings
• Load and save setting files to and from a disk
• Read actual values
• Monitor status
• Get help on any topic
• Upgrade the PDC firmware.
The EnerVista P30 Setup software allows immediate access to all Multilin P30 features with easy to use pull down menus in the familiar Windows environment. This section provides the necessary information to install EnerVista P30 Setup , upgrade the Multilin P30 firmware, and write and edit Setting files.The EnerVista P30 Setup software can operate without a Multilin P30 connected to the computer. In such a case, settings may be saved to a file for future use. If a Multilin P30 is connected to a PC and communication is enabled, the Multilin P30 can be programmed from the setting screens. In addition, measured values, and status can be displayed with the actual value screens.
Hardware and Software RequirementsThe following requirements must be met for the EnerVista P30 Setup software.
• Microsoft Windows™ 7 (32-bit) / XP SP3 (32-bit)
• At least 2 GB of hard disk space
• At least 1 GB of RAM

4–2 MULTILIN P30 PHASOR DATA CONCENTRATOR – INSTRUCTION MANUAL
HANDLING THE ENERVISTA P30 SETUP SOFTWARE CHAPTER 4: THE ENERVISTA P30 SETUP INTERFACE
• Microsoft .NET 2.0
• An Administrator account - required to install the application
• A Standard /Administrator account - required to execute the application once installed.
NOTE
NOTE: Itanium systems are not supported.
The EnerVista P30 Setup software can be installed from either the GE EnerVista CD or the GE Digital Energy website at http://www.gedigitalenergy.com.
Installing the EnerVista P30 Setup SoftwareAfter ensuring the minimum requirements indicated above, use the following procedure to install the EnerVista P30 Setup software from the enclosed GE EnerVista CD.
1. Insert the GE EnerVista CD into your CD-ROM drive.
2. Click the Install Now button and follow the installation instructions to install the no-charge EnerVista software on the local PC.
3. When installation is complete, start the EnerVista Launchpad application.
4. Click the IED Setup section of the LaunchPad toolbar.
5. In the EnerVista Launchpad window, click the Add Product button and select the Multilin P30 as shown below. Select the Web option to ensure the most recent software release, or select CD if you do not have a web connection, then click the Add Now button to list software items for the Multilin P30.

CHAPTER 4: THE ENERVISTA P30 SETUP INTERFACE HANDLING THE ENERVISTA P30 SETUP SOFTWARE
MULTILIN P30 PHASOR DATA CONCENTRATOR – INSTRUCTION MANUAL 4–3
6. EnerVista Launchpad will obtain the latest installation software from the Web or CD and automatically start the installation process. A status window with a progress bar will be shown during the downloading process.
7. Select the complete path, including the new directory name, where the EnerVista P30 Setup software will be installed.
8. Click on Next to begin the installation. The files will be installed in the directory indicated, and the installation program will automatically create icons and add EnerVista P30 Setup software to the Windows start menu.
9. The Multilin P30 device will be added to the list of installed IEDs in the EnerVista Launchpad window, as shown below.
If you are going to communicate from your computer to the Multilin P30:
10. Launch EnerVista P30 Setup from LaunchPad.
Connecting EnerVista P30 Setup Software to the Multilin P30Ensure there is a TCP/IP link between the EnerVista P30 Setup computer and the Multilin P30 Concentrator. If the Historian option has been purchased, ensure there is also a TCP/IP link between the EnerVista P30 Setup computer and the Multilin P30 Historian.

4–4 MULTILIN P30 PHASOR DATA CONCENTRATOR – INSTRUCTION MANUAL
HANDLING THE ENERVISTA P30 SETUP SOFTWARE CHAPTER 4: THE ENERVISTA P30 SETUP INTERFACE
Configuring SerialCommunications
The EnerVista P30 Setup program cannot be used to connect to the Multilin P30 via serial communications. However, serial communications must be used with a terminal emulator program to prepare the Multilin P30 for Ethernet communications.Please refer to the CLI section of this manual to learn how to prepare the Multilin P30 for Ethernet TCP/IP communications using EnerVista.
Using the QuickConnect Feature
The Quick Connect button can be used to establish a fast connection through the Multilin P30 ’s console Ethernet port (port 1).
NOTE
NOTE: The “Quick Connect” connection is normally used as a temporary connection. When the user quits EnerVista P30 Setup the device will be removed from the environment.
The following window will appear when the QuickConnect button is pressed:
When connected, a new Site called “Quick Connect” will appear in the Site List window. The Multilin P30 Site Device has now been configured via the Quick Connect feature for Ethernet communications. Proceed to Configuring Ethernet Communications below, to begin communications.
Configuring EthernetCommunications
Before starting, verify that there is a working Ethernet link between the Multilin P30 and the EnerVista P30 Setup computer.
NOTE
NOTE: EnerVista P30 Setup supports a maximum of four concurrent connections to Multilin P30 devices.
If the Multilin P30 Historian option has been purchased, ensure that there is also a TCP/IP link between the Multilin P30 Historian and the EnerVista P30 Setup computer.
NOTE
NOTE: The Multilin P30 supports a maximum of one concurrent TCP/IP session.
1. Complete the procedure outlined in the “Configuring serial communications” section.
2. Click on the Device Setup button to open the Device Setup window and click the Add Site button to define a new site.
3. Enter the desired site name in the “Site Name" field. If desired, a short description of the site can also be entered. In this example, we will use “Substation 1” as the site name.
4. The new site will appear in the upper-left list.
5. Click the Add Device button to define the new device.
6. Enter the desired name in the "Device Name" field, and a description (optional).
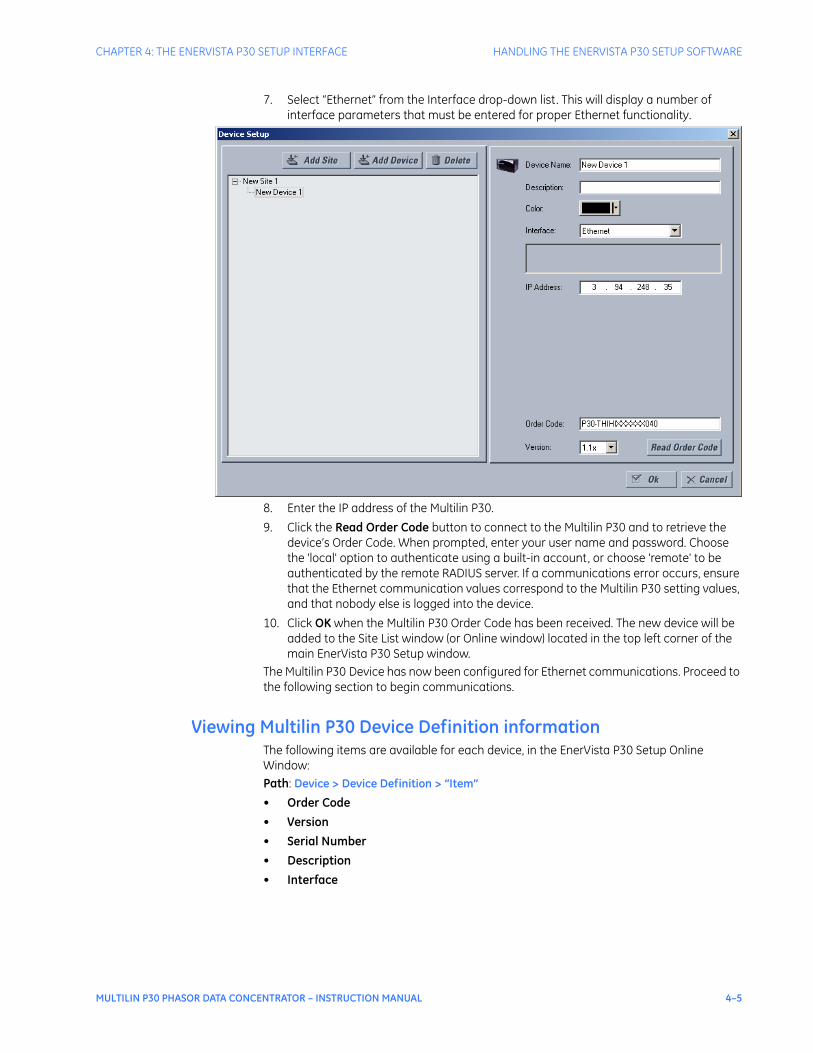
CHAPTER 4: THE ENERVISTA P30 SETUP INTERFACE HANDLING THE ENERVISTA P30 SETUP SOFTWARE
MULTILIN P30 PHASOR DATA CONCENTRATOR – INSTRUCTION MANUAL 4–5
7. Select “Ethernet” from the Interface drop-down list. This will display a number of interface parameters that must be entered for proper Ethernet functionality.
8. Enter the IP address of the Multilin P30.
9. Click the Read Order Code button to connect to the Multilin P30 and to retrieve the device’s Order Code. When prompted, enter your user name and password. Choose the 'local' option to authenticate using a built-in account, or choose 'remote' to be authenticated by the remote RADIUS server. If a communications error occurs, ensure that the Ethernet communication values correspond to the Multilin P30 setting values, and that nobody else is logged into the device.
10. Click OK when the Multilin P30 Order Code has been received. The new device will be added to the Site List window (or Online window) located in the top left corner of the main EnerVista P30 Setup window.
The Multilin P30 Device has now been configured for Ethernet communications. Proceed to the following section to begin communications.
Viewing Multilin P30 Device Definition informationThe following items are available for each device, in the EnerVista P30 Setup Online Window:Path: Device > Device Definition > “Item”
• Order Code
• Version
• Serial Number
• Description
• Interface

4–6 MULTILIN P30 PHASOR DATA CONCENTRATOR – INSTRUCTION MANUAL
HANDLING THE ENERVISTA P30 SETUP SOFTWARE CHAPTER 4: THE ENERVISTA P30 SETUP INTERFACE
Working with settings and settings filesWhen configuration changes are performed in EnerVista P30 Setup, it must be activated for the changes to be applied. This can be done by sending a command called “Activate New Configuration,” as explained in the Command section of this manual. The lower-right portion of the P30 Setup window indicates the revision number of the settings file that is being edited as well as the revision number of the settings file that was most recently activated. "Editing Rev" will automatically be incremented every time a setting window is saved and when a settings file is written to the device. If the revision numbers do not match, send the "Activate New Configuration" command to apply pending changes.
Please refer to the Configuring Serial/Ethernet Communications sections for information on how to setup communications with the Multilin P30.
Entering settings intoEnerVista P30 Setup
The Power System Setup page will be used as an example to illustrate the entering of settings. In this example, we will be changing the power system frequency settings.
1. Establish communications with the relay. When prompted, enter your user name and password. Choose the 'local' option to authenticate using a built-in account, or choose 'remote' to be authenticated by the remote RADIUS server.
2. Select the System Setup > Power System menu item.
3. Select the power system frequency by clicking the down arrow in the parameter box. For setpoints requiring non-numerical pre-set values, clicking anywhere within the settings value box displays a drop-down selection menu arrow. Select the desired value from this list.

CHAPTER 4: THE ENERVISTA P30 SETUP INTERFACE HANDLING THE ENERVISTA P30 SETUP SOFTWARE
MULTILIN P30 PHASOR DATA CONCENTRATOR – INSTRUCTION MANUAL 4–7
4. In some cases, clicking the arrow at the end of the box displays a numerical keypad interface that allows the user to enter a value within the settings range displayed near the top of the keypad: Click = to exit from the keypad and keep the new value. Click on X to exit from the keypad and retain the old value.
5. For settings requiring an alphanumeric text string (e.g. "P30 name"), the value may be entered directly within the settings value box.
6. Click on Save to save the values into the Multilin P30. Click YES to accept any changes and exit the window. Click Restore to retain previous values. Click Default to restore default values.
7. For online devices, settings must be "activated" for the saved changes to take effect. This is explained in the “Activating Settings” section below.
File support Opening any EnerVista P30 Setup file will automatically launch the application or provide focus to the already opened application. If the file is a settings file which had been removed from the Settings List tree menu, it will be added back to the Settings List tree.New files will be automatically added to the tree.

4–8 MULTILIN P30 PHASOR DATA CONCENTRATOR – INSTRUCTION MANUAL
HANDLING THE ENERVISTA P30 SETUP SOFTWARE CHAPTER 4: THE ENERVISTA P30 SETUP INTERFACE
Activating Settings When working with online devices, saved settings remain in a “Pending” state until they are activated; changes do not take effect until they are activated. When connected to an online device, this information is shown in the Status bar in the lower-right portion of the application window. As this status information applies only to online devices, it is left blank when working with settings files.Concentrator: The Concentrator maintains two revision numbers: one for the revision of the pending settings file, and one for the revision of the active settings file. The former increments every time settings are changed, and is displayed to the right of the text "Editing Rev". This can be compared with the most recently activated settings file revision, which is shown to the right of the text "Active Rev". If these two revision numbers do not match, there is a pending configuration change on the device. To activate settings, send the “Activate New Configuration” command, which is available via the following path: Device > Commands > Basic Commands.
NOTE
NOTE: Pending changes will automatically be activated if power is lost.
Historian: If the P30 contains a Historian card, the software indicates "Pending" if there are setting changes that require the Historian application to be restarted, "Activated" if there are no pending changes, or "Disconnected" if EnerVista P30 Setup is not currently communicating with the Historian. To activate pending changes for the Historian, send the "Restart Historian" command, which is available via the following path: Device > Commands > Historian.Example: The screen below shows the Historian pending a change (note the boxes at the bottom right of the screen).

CHAPTER 4: THE ENERVISTA P30 SETUP INTERFACE HANDLING THE ENERVISTA P30 SETUP SOFTWARE
MULTILIN P30 PHASOR DATA CONCENTRATOR – INSTRUCTION MANUAL 4–9
The screen below shows the Historian change activated after the “Restart Historian” button has been pressed (again, note the boxes at the bottom right of the screen).
Using settings files The EnerVista P30 Setup software interface supports three ways of handling changes to Multilin P30 settings:
• In off-line mode (Multilin P30 disconnected) to create or edit Multilin P30 Settings files for later download to communicating Multilin P30.
• Directly modifying Multilin P30 settings while connected to a communicating Multilin P30 then saving the settings when complete.
• Creating/Editing Settings files while connected to a communicating Multilin P30 then saving them to the Multilin P30 when complete.
Settings files are organized on the basis of file names assigned by the user. A Settings file contains data pertaining to the following types of relay settings:
• Device Definition
• Product Setup
• Historian (if ordered)
• System Setup.
Downloading andsaving settings files
FASTPATH: It is highly recommended to save a settings file before performing a firmware update, changing settings, or restoring factory defaults.
The settings files in the EnerVista P30 Setup window are accessed in the Files Window. Use the following procedure to download and save settings files to a local PC:
1. Ensure that the site and corresponding device(s) have been properly defined and configured as shown in Connecting EnerVista P30 Setup to the Multilin P30 above.
2. Select the desired device from the site list.

4–10 MULTILIN P30 PHASOR DATA CONCENTRATOR – INSTRUCTION MANUAL
HANDLING THE ENERVISTA P30 SETUP SOFTWARE CHAPTER 4: THE ENERVISTA P30 SETUP INTERFACE
3. Select Online > Read Device Settings from the Device menu item, or right-click on the device and select Read Device Settings to obtain settings information from the device.
4. After a few seconds of data retrieval, the software will request the name and destination path of the settings file. The corresponding file extension will be automatically assigned. Press Receive to complete the process. A new entry will be added to the tree in the File pane, showing path and file name for the settings file.
Adding settings filesto the environment
The EnerVista P30 Setup software provides the capability to review and manage a large group of settings files. Use the following procedure to add an existing file to the list:
1. In the files pane, right-click on Files and select the Add Existing Setting File item as shown:
2. The “Open” dialog box will appear, prompting the user to select a previously saved settings file. As with any other MS Windows® application, browse for the file to be added then click Open. The new file and complete path will be added to the file list.
Creating a newsettings file
The EnerVista P30 Setup software allows the user to create new settings files independent of a connected device. These can be uploaded to a relay at a later date. The following procedure illustrates how to create new settings files:

CHAPTER 4: THE ENERVISTA P30 SETUP INTERFACE HANDLING THE ENERVISTA P30 SETUP SOFTWARE
MULTILIN P30 PHASOR DATA CONCENTRATOR – INSTRUCTION MANUAL 4–11
1. In the File pane, right click on File and select the New Settings File item. The following box will appear, allowing for the configuration of the settings file for the correct firmware version. It is important to define the correct firmware version to ensure that settings not available in a particular version are not downloaded into the Multilin P30.
2. Select the Firmware Version, and Order Code options for the new settings file.
3. For future reference, enter some useful information in the Description box to facilitate the identification of the device and the purpose of the file.
4. If this file is to be used with a specific Multilin P30 , enter the Serial Number of the device. The Serial Number Lock will prevent the file from being uploaded to a device with a different Serial Number.
5. To select a file name and path for the new file, click the button beside the “File Name” box.
6. Select the file name and path to store the file, or select any displayed file name to replace an existing file. All Multilin P30 settings files should have the extension ‘P30’ (for example, ‘P301.P30’).
7. Click OK to complete the process. Once this step is completed, the new file, with a complete path, will be added to the EnerVista P30 Setup software environment.
Upgrading settingsfiles to a new revision
NOTE
NOTE: This window allows the user to upgrade the firmware version, change the Serial Number lock and modify the Order Code. Note that some previously configured settings can be lost when making a change to the Order Code.
It is often necessary to upgrade the revision of a previously saved settings file after the Multilin P30 firmware has been upgraded. This is illustrated in the following procedure:
1. Establish communications with the Multilin P30.
2. Select the Device Definition > Version menu item and record the Firmware Revision.

4–12 MULTILIN P30 PHASOR DATA CONCENTRATOR – INSTRUCTION MANUAL
HANDLING THE ENERVISTA P30 SETUP SOFTWARE CHAPTER 4: THE ENERVISTA P30 SETUP INTERFACE
3. Load the settings file to be upgraded, into the EnerVista P30 Setup environment as described in the section, Adding Settings Files to the Environment.
4. From the main window menu bar, select the Offline > Edit Settings File Properties menu item and note the File Version of the settings file. If this version is different from the Firmware Revision noted in step 2, select a New File Version that matches the Firmware Revision from the pull-down menu.
5. For example, if the firmware revision shows Firmware Revision 1.0x) and the current settings file revision is 1.20, change the settings file revision to “1.2x”.
6. Enter any special comments about the settings file in the "Description" field.
7. Select the desired firmware version from the "New File Version" field.
8. Update the Device Serial Number to which the file will be locked.
9. When complete, click OK to convert the settings file to the desired revision. See Loading Settings from a File below, for instructions on loading this settings file into the Multilin P30.
Loading settings froma file
An error message will occur when attempting to download a settings file with a revision number that does not match the Multilin P30 firmware. If the firmware has been upgraded since saving the settings file, see Upgrading Settings Files to a New Revision for instructions on changing the revision number of a settings file.The following procedure illustrates how to load settings from a file. Before loading a settings file, it must first be added to the EnerVista P30 Setup environment as described in the section, Adding Setpoints Files to the Environment.
1. Select the previously saved settings file from the “File” pane of the EnerVista P30 Setup software main window.
2. Select the Offline > Edit Settings File Properties menu item and verify that the corresponding file is fully compatible with the hardware and firmware version of the target device. If the versions are not identical, see Upgrading Settings Files to a New Revision for details on changing the settings file version.
3. Right-click on the selected file and select the Write Settings File to Device item.

CHAPTER 4: THE ENERVISTA P30 SETUP INTERFACE HANDLING THE ENERVISTA P30 SETUP SOFTWARE
MULTILIN P30 PHASOR DATA CONCENTRATOR – INSTRUCTION MANUAL 4–13
4. Select the target device from the list of devices shown and click Send.If there are no incompatibilities between the target device and the settings file, the data will be transferred to the device. An indication of the percentage completed will be shown at the bottom of the main window.
UpgradingFor firmware upgrading details, please refer to Chapter 8 - Maintenance.

4–14 MULTILIN P30 PHASOR DATA CONCENTRATOR – INSTRUCTION MANUAL
HANDLING THE ENERVISTA P30 SETUP SOFTWARE CHAPTER 4: THE ENERVISTA P30 SETUP INTERFACE

MULTILIN P30 PHASOR DATA CONCENTRATOR – INSTRUCTION MANUAL 5–1
Multilin P30
Chapter 5: P30 Concentrator Settings
GE Energy
P30 Concentrator Settings
Multilin P30 setup
SecurityEnerVista PDC Path: Device > Settings > Product Setup > Security
Figure 1: Enervista Security menu
Active Authentication Method: Indicates whether the current session is using local or remote (RADIUS) authentication.RADIUS IP Address: RADIUS will not be used if left at the default value: 0.0.0.0.
5–2 MULTILIN P30 PHASOR DATA CONCENTRATOR – INSTRUCTION MANUAL
MULTILIN P30 SETUP CHAPTER 5: P30 CONCENTRATOR SETTINGS
Authentication Port*: RADIUS IP Address Authentication PortAccounting Port*: RADIUS Accounting PortVendor ID*: IANA RADIUS Vendor ID or locally assigned (local) IDRADIUS Authentication Method: The authentication protocol the Multilin P30 will use to authenticate with the RADIUS server. Only EAP TTLS is supported..Timeout*: Timeout in seconds in between re-transmission requests.Retries*: Number of retries before the Multilin P30 considers the RADIUS server to be unreachable.RADIUS Authentication (Shared) Secret: The shared secret as configured on the RADIUS server.Local Authentication*: If enabled, users can log in using three different built-in accounts: Administrator, Engineer and Observer. A RADIUS server is not required. If disabled, the local Engineer and Observer accounts will be denied access. The local Administrator will continue to have access to the device.
NOTE
NOTE: Before setting Local Authentication to “Disabled,” first enable, configure, and test RADIUS. Test your RADIUS connection by logging in with a remote account.
FASTPATH: If Local Authentication is Disabled and the RADIUS server is not reachable, you will be temporarily locked out of the Multilin P30 . To recover, log in with the local Administrator account, and update the RADIUS configuration.
Local Administrator Password: For Administrator authentication.Local Engineer Password: For Engineer authentication.Local Observer Password: For Observer authentication.Inactivity Timeout: The length of inactivity required to return to an unauthorized state.Failed Authentications: A threshold number of failed authentication attempts that indicates when a Pseudo PMU signal will be asserted. See the Pseudo PMU section for more information.Factory Service Mode: When enabled (yes/checked selection) the device can go into Factory Service Mode. For this setting to become enabled a Supervisor authentication is necessary.* This RADIUS/Local authentication setting will NOT be transferred to the device when writing an offline settings file to the device.PASSWORDSEnerVista P30 Setup will indicate any password requirement deficiencies. See Section 3 - Security for further Password details.USER ROLESSee Section 3 - Security for further details on User Roles.LOCKOUTSee Section 3 - Security for further details on Lockout.
Event recorderThe event recorder Settings menu can be opened from the EnerVista path shown below:EnerVista P30 Path: Device > Settings > Product Setup > Event Recorder

CHAPTER 5: P30 CONCENTRATOR SETTINGS MULTILIN P30 SETUP
MULTILIN P30 PHASOR DATA CONCENTRATOR – INSTRUCTION MANUAL 5–3
Figure 2: EnerVista Event Recorder menu
The setting options details of each item on the Event Recorder menu are as follows:
• Event Recorder: This setting enables or disables the event recording feature. By default, event recording is enabled. The user can see the recorded events in Device > Actual Values > Records > Event Recorder. Refer to the section, Diagnosis and Event Recording in this manual for further details on different types of events.
• Clear Event Records: This setting enables or disables the command to clear the Event Recorder. By default this is disabled, so the button for clearing the Event Recorder with the path, Device > Commands > Basic Commands > Clear Event Recorder, is disabled.
NOTE
NOTE: In order to clear Event Records, the aforementioned must be set to “Enabled,” which will enable the command, “Clear Event Recorder”.
• Minimum Severity: Each event has been given a severity level in a particular event category, which can be: Critical, Major, Minor, Status. The parameter set in this field implies the minimum severity required for an event to be captured. For example, if Minimum Severity is set to Minor, the events having a severity of Minor, Major and Critical will be recorded by the Event Recorder in all categories. Refer to the section Diagnosis and Event Recording in this manual, for further details on the severity level of each event.
NOTE
NOTE: Set the Minimum Severity parameter to Status in order to record all events from all categories.
Below are the settings for the different Event categories. These settings enable or disable logging of individual categories of events. The default value of all of these event categories is Enabled, which implies that all events will be logged if Minimum Severity is set to “Status”.
• Self-Test Events: Enable or disable logging of Self-Test events.
• Security Events: Enable or disable clearing of Security events.
• System Events: Enable or disable clearing of System events.
• Communication Events: Enable or disable clearing of Communication events.
• P30 Client Events: Enable or disable clearing of the event when the Device is acting as a Server.
• P30 Server Events: Enable or disable logging of Server events.

5–4 MULTILIN P30 PHASOR DATA CONCENTRATOR – INSTRUCTION MANUAL
MULTILIN P30 SETUP CHAPTER 5: P30 CONCENTRATOR SETTINGS
CommunicationThe settings menus in the Path Device > Settings > Product Setup > Communication are discussed in this sub-section.
Network The Communication Network menu allows the user to set the Ethernet ports of the device.The Network settings menu can be opened from the EnerVista path shown below:Path: Device > Settings > Product Setup > Communication > Network
Figure 3: EnerVista Communication Network Setting menu
• IP Assignment*: This setting has the following options: Disabled (Port 2 only), Static (Port 1 and Port 2), DHCP (Port 1 only).
NOTE
NOTE: Port 1 can be used as a console port to configure the device, or for data communication, whereas Port 2 can be used only for data communication.
NOTE
NOTE: IP address, Subnet Mask, and Gateway are ignored if IP Assignment is set to DHCP.
NOTE
NOTE: The P30 can be configured only through Ethernet Port 1, using the EnerVista P30 Setup tool.
• IP Address*: If IP Assignment is set to Static, a static IP (IPv4) can be assigned in this field.
• IP Subnet Mask*: If IP Assignment is set to Static, an IP subnet mask can be set according to the standard IPv4 format.
• Gateway IP Address*: If IP Assignment is set to Static, a Gateway IP address can be set according to standard IPv4 format.
* These Console Port settings will NOT be transferred to the device when writing an offline settings file to the device.
InstallationTo safeguard against installation of the device without any entered settings, the device allows only output streaming of data if it is set to “Programmed”. This setting is defaulted to “Not Programmed” at the factory. EnerVista Path: Device > Settings > Product Setup > Installation

CHAPTER 5: P30 CONCENTRATOR SETTINGS MULTILIN P30 SETUP
MULTILIN P30 PHASOR DATA CONCENTRATOR – INSTRUCTION MANUAL 5–5
Figure 4: EnerVista Installation Setting menu
NOTE
NOTE: The Multilin P30 will not stream data to its output until Installation > Multilin P30 Settings is set to “Programmed”.

5–6 MULTILIN P30 PHASOR DATA CONCENTRATOR – INSTRUCTION MANUAL
SYSTEM SETUP CHAPTER 5: P30 CONCENTRATOR SETTINGS
System setup
This section describes the settings for Multilin P30 system setup, which includes the Power System, Input to the Multilin P30 , Pseudo PMU, PMU manager, and Multilin P30 Output Streams.
NOTE
NOTE: In order for the Multilin P30 to operate, two commands from the Commands section (refer to Basic Commands and IRIG-B Commands) must be issued:
1. Set the date:
– Configure the device
– Set Installation to “Programmed”
2. Activate the configuration...
Power systemThe Power System Setting menu is available from the path shown below. It is essential that the user set the power system frequency under which the Multilin P30 will be used. This setting has a direct effect on the data collection rates and filtering functionality of the Multilin P30 :Path: Device > Settings > System Setup > Power System
Figure 5: Typical Power System screen
Frequency: The nominal frequency of the Power System in which the Multilin P30 device is installed. The Multilin P30 has been designed to operate in either 50Hz or 60Hz power system frequencies.
NOTE
NOTE: When the user changes the Frequency setting, a message displays stating that the data rate will be defaulted.

CHAPTER 5: P30 CONCENTRATOR SETTINGS SYSTEM SETUP
MULTILIN P30 PHASOR DATA CONCENTRATOR – INSTRUCTION MANUAL 5–7
InputsThe Multilin P30 supports a maximum of either 8 or 40 PMUs depending on the Order Code. This screen provides settings for each of the 8 or 40 Multilin P30 inputs. Each input can support up to 4 PMUs.
NOTE
NOTE: The The EnerVista P30 Setup tool prevents the user from saving the settings if it would result in more than the allowed (8 or 40 depending upon the Order Code) configured PMUs. Up to 4 PMUs can be supported from an input device.
The Device Input Settings menu can be found on the path below:Path: Device > Settings > System Setup > Inputs > Input X-X > Input X
There are total 8 or 40 identical Input screens. The user has to set the items below in order to read the configuration of an input device.
Inputs X to X
Input X...
• Function: Each Input can be enabled or disabled. The default value is Disabled, which must be changed to Enabled before configuring the input device to the Multilin P30 .
• Name: The user can enter any name for a particular input device, using up to 32 characters. This field is for the user’s reference only.

5–8 MULTILIN P30 PHASOR DATA CONCENTRATOR – INSTRUCTION MANUAL
SYSTEM SETUP CHAPTER 5: P30 CONCENTRATOR SETTINGS
• Description: The user can enter the description of a particular input device using up to 32 characters. This field is for the user’s reference only.
• Protocol: The IEEE C37.118-2005 standard supports two transport protocols: UDP and TCP. Either protocol can be selected to communicate with the input device.
• Server IP Address: The server, or input device, IP address must be specified in order to communicate with an input device. The default IP address is set to 0.0.0.0
• Port: The communication port number of the input device should be specified in this field. The port number should be for either UDP or TCP, depending on the selection made in the previous Protocol setting field.
• ID Code: The ID Code of the input device must be specified in this field.
• PMU Configuration: The PMU configuration field has a “Read” button. When this button is pressed, EnerVista P30 Setup sends a command to the input device requesting a configuration file based on above mentioned input device settings. Upon receiving this configuration file, the EnerVista P30 Setup automatically shows the configuration of the input device.
FASTPATH: The PMU Configuration button must be pressed for all PMUs after a firmware upgrade.
• Rx Timeout: The maximum time the P30 waits for a response to a CFG-2 frame request.
• Data Timeout: Once communication to the PMU server is started correctly (CFG2 is received, and sample transmission is started), this is the maximum time between data frames. If a data frame is not received during that interval, communication is reset.
Pseudo PMUsThe Pseudo PMU contains advanced features for diagnostic and status information on the Multilin P30 device itself. Pseudo PMUs do not contain any phasor information; just analogs and digitals. The Multilin P30 supports four Pseudo PMUs, each Pseudo PMU containing 0 phasors, 16 analogs, and 32 digitals. These values are time-stamped by the Multilin P30 which processes this information as it processes information coming from any other PMU. Refer to the section on “Diagnosis and Event Recording” for more details on pseudo PMU data and status. The EnerVista path of the Pseudo PMU is as follows: PATH: Device > Settings > System Setup > Pseudo PMU
Pseudo PMU X...

CHAPTER 5: P30 CONCENTRATOR SETTINGS SYSTEM SETUP
MULTILIN P30 PHASOR DATA CONCENTRATOR – INSTRUCTION MANUAL 5–9
• Station Name: The station name (STN field according to IEEE C37.118-2005) of the Pseudo PMU should be assigned in this field.
• ID Code: The PMU ID Code (according to IEEE C37.118-2005) can be assigned in this field. As explained earlier, each Pseudo PMU contains 16 analog (Data), and 32 digital (Status) channels.
• Function: Each channel can be enabled or disabled for this field.
NOTE
NOTE: Upon enabling/disabling Data or Status channels, EnerVista P30 Setup dynamically increases/decreases the number of channels, to ensure that all channels are consecutive.
• Signal: Refer to section Diagnosis and Event Recording for more details on Pseudo PMU data and status description. The corresponding ID Codes (of PMU/Input device/Output device) must be specified wherever stated in the list below. If the data or status is related to the Multilin P30 , it does not require any ID code.
NOTE
NOTE: When saving an Input/Pseudo PMU/Output screen, the EnerVista P30 Setup software checks to ensure that the Save action will not result in a system with a duplicate ID Code. The following ID Codes are considered:
– All Input Device ID Codes
– All Input PMU ID Codes
– All Pseudo PMU ID Codes
– All Output Device ID Codes.
There is one exception: If an Input has a single PMU, this Input’s ID Code may match its PMU ID Code.
• Data X: Analog data channels can be added, up to 16 per Pseudo PMU. Diagnostic signals can be added as input to these channels. The available diagnostic signals are:
– Average Communication and PMU Latency: PMU ID Code; must be specified. The averaging process is performed over the last second.
– Communication and PMU Latency Variance: Input ID Code of a device; must be specified. The process is performed over the last second.
– Input Data Rate: Total Input data received from PMUs over the last second (kbps); no need for any ID Code.
– Output Data Rate: Total Output data sent to PDC clients over the last second (kbps); no need for any ID Code.
– Missing Message Rate: Number of missing messages within the last second. Output ID Code (this can be configured in Device > Settings > System Setup > Outputs > Output X > Basic Configuration); a specific PMU ID Code of interest must be specified.
– Interpolated Message Rate: Messages interpolated within the last second. Output ID Code (this can be configured in Device > Settings > System Setup > Outputs> Output X > Basic Configuration); a specific PMU ID Code of interest must be specified.
• Status X: The total number of Multilin P30 status or digitals supported by a Pseudo PMU is 32. The value will be high, (i.e. 1) if TRUE, and low, (i.e. 0) if FALSE. Available device statuses are:
– Multilin P30 IRIG-B Failure {1: failure, 0: detected}
– Ethernet 1 Link Failure {1: failure, 0: detected}
– Ethernet 2 Link Failure {1: failure, 0: detected}
– Nominal Frequency Out of Range: PMU ID Code; must be specified {1: true, 0: false}

5–10 MULTILIN P30 PHASOR DATA CONCENTRATOR – INSTRUCTION MANUAL
SYSTEM SETUP CHAPTER 5: P30 CONCENTRATOR SETTINGS
– Data Rate Out of Range: Input ID Code of a device; must be specified {1: true, 0: false}
– Missing Message Exceeded: Output ID Code (this can be configured in Device > Settings > System Setup > Outputs> Output X > Basic Configuration); a specific PMU ID Code of interest must be specified {1: true, 0: false}
– Missing Message Detected: Output ID Code; a specific PMU ID Code of interest must be specified {1: true, 0: false}
– Average Communication and PMU Latency Exceeded: Input ID Code of a device; must be specified {1: true, 0: false}
– Data Interpolation Detected: Output ID Code; must be specified {1: true, 0: false}
– Failed Authentication {1: Exceeded failed authentication limit, 0: Normal}
• Channel Name: Custom name; specified for each channel in this field.
NOTE
NOTE: When saving, EnerVista P30 Setup ensures that within one Pseudo PMU, all channel names are unique.
PMU managerThe PMU manager of the Multilin P30 allows setting values related to each PMU/input device. The EnerVista P30 Setup program shows only PMUs that have been configured in the Input Configuration screen. The EnerVista path for the PMU manager is as shown below:PATH: Device > Settings > System Setup > PMU Manager
• Latency Threshold: The allowable latency of each input device can be specified in milliseconds. The default parameter for this setting is 300 ms. The value can be set between 0 to 10000 ms. The Multilin P30 waits for the data message from the input device until this setting value is reached. Upon elapse, the latency threshold is reached for a particular input device, and the status of a Pseudo PMU “Average Communication & PMU Latency Exceeded” will be set to high.

CHAPTER 5: P30 CONCENTRATOR SETTINGS SYSTEM SETUP
MULTILIN P30 PHASOR DATA CONCENTRATOR – INSTRUCTION MANUAL 5–11
OutputsThe Multilin P30 supports a total of 8 outputs, and can be connected as a server to up to 8 clients.
Output X Outputs menu list Output 1 – 8: Each output has two types of configuration screen:
1. Basic configuration
2. PMU selection.Both of these Settings menus are explained below:
Basic configurationPATH: Device > Settings > System Setup > Outputs > Output X > Basic Configuration
The Basic Configuration screen contains settings based on the 'Destination' setting, which can either be External, Historian, or Application. The screen below shows settings for one of eight Multilin P30 outputs when streaming data to an external client.
• Function: The output port can be enabled or disabled.
• Destination: The destination can be set to External, Historian or Application. If Output X of the Multilin P30 must be sent to “Historian”, set it to “Historian,” and for an Application card, set it to “Application”.
• Name and Description: The user can set the output stream name and description in these fields. These parameters are for the user’s reference only.
• ID Code: The ID Code value of the Multilin P30 device acting as a server for Output X, must be entered in this field.
• Data Rate: The output reporting rate of Output X, in terms of frames or samples per second.
• Maximum Wait Time (msec): This is the maximum time the output stream should wait for configured PMUs to enter into the stream.
• Filtering: Filtering is an option that can be enabled or disabled by the user. Normally, filtering is not required when output-reporting rate is equal to, or higher than, the input report rate. Filters are not applied to the digital signals. More information about filtering can be found from the Theory of Operation section.

5–12 MULTILIN P30 PHASOR DATA CONCENTRATOR – INSTRUCTION MANUAL
SYSTEM SETUP CHAPTER 5: P30 CONCENTRATOR SETTINGS
NOTE
NOTE: Filtering is recommended when either the Multilin P30 output rate is less than the Multilin P30 input rate, or it is not an integer factor of the Multilin P30 input rate e.g. input 20 and output 30, for each P30 output.
• Nagle (TCP stacking): The Nagle algorithm can be enabled or disabled by the user for TCP/IP network connection. If the Nagle is enabled, it improves the efficiency of TCP/IP networks by combining small frames, and sending them all at once.
• Draft Features: The STAT bit information, from IEEE C37.118.2 Draft Version, can be enabled or disabled. If enabled, the enhanced STAT bit information proposed in this draft version is used, e.g. Bit-9 is set if the missing data is interpreted, and Bit 6-8 are recognized as PMU TQ (Time Quality). Refer to IEEE C37.118.2/D3.2, May 2011 for more details.
For details of the handling of STAT bits by the Multilin P30 , please refer to the section entitled Handling of STAT Bits, in the Theory of Operation section of this manual.
NOTE
NOTE: The Draft Version applies only to the STAT bits in the latest draft. Other functionalities proposed in this draft standard (e.g. CFG-3), are not yet supported.
NOTE
NOTE: When setting the destination of an Output to the Historian, Draft Features must be set to Enabled.
• Tags Remaining: This value is for the Historian only, and represents the percentage of tags that are still available for use on the Historian. The screen cannot be saved if more tags are configured than are available.
• Bandwidth Remaining: This value is for the Historian only and is an approximation of the bandwidth remaining. As this approaches zero, there is risk that the Historian will not be able to archive data as fast as the data arrives. This approximation is only available when phasor, analog, frequency, and frequency ROC compression are disabled. Compression can be turned on/off in the Historian Compression screen.
NOTE
NOTE: If the Order Code contains the Historian option, the Destination can be set to Historian, and the Tags and Bandwidth Remaining (in percentage) will be shown to the user.
NOTE
NOTE: When saving, EnerVista P30 Setup ensures that the Port is not used by another Output (applies to enabled Outputs only).
NOTE
NOTE: Max. Wait Time (ms) must be greater than 2 x 1000/Data Rate.
PMU selectionEnerVista PATH (1) : Device > Settings > System Setup > Outputs > Output X > PMU Selection > PMU X-X > PMU X
EnerVista PATH (2) : Device > Settings > System Setup > Outputs > Output X > PMU Selection > Pseudo PMU 1-4 > Pseudo PMU X

CHAPTER 5: P30 CONCENTRATOR SETTINGS SYSTEM SETUP
MULTILIN P30 PHASOR DATA CONCENTRATOR – INSTRUCTION MANUAL 5–13
This window allows the user to specify which PMUs and which channels will be in the output.
• ID Code: This field shows the ID Code of the PMU X. This is not a user-programmable field.
• Interpolation: If enabled, Multilin P30 will interpolate the missing messages up to the missing message threshold. If filtering is enabled (Basic Configuration screen), this setting will be ignored and data will automatically be interpolated.
• Missing Message Threshold: Maximum number of missing messages allowed before events to be logged. Once this threshold is reached, Pseudo PMU can report this condition, if configured to do so. Refer to section Diagnosis and Event Recording, as well as the Pseudo PMU settings.
• Tags Remaining: This value is for the Historian only, and represents the percentage of tags that are still available for use on the Historian. The screen cannot be saved if more tags are configured than available.
• Bandwidth Remaining: This value is for the Historian only and is an approximation of the bandwidth remaining. As this approaches zero, there is risk that the Historian will not be able to archive data as fast as the data arrives. This approximation is only available when phasor and analog compression is disabled.
NOTE
NOTE: If the Order Code contains the Historian option and the Destination is set to Historian, the Tags and Bandwidth Remaining (in percentage) will be shown to the user.
5–14 MULTILIN P30 PHASOR DATA CONCENTRATOR – INSTRUCTION MANUAL
SYSTEM SETUP CHAPTER 5: P30 CONCENTRATOR SETTINGS
• PMU Selection: PMU X can be included or excluded from Output X using this field.
• Station Name: The original Station Name (STN), according to CFG-2. This is not a user-programmable field.
• Output Station Name: The Multilin P30 provides flexibility to the user for renaming the station name (STN) of the PMU (if required), by inserting a value in this field.
• PMU Format: The Output PMU data format can be configured to either rectangular or polar.
• Phasor Format: The Output phasor data format can be configured to either 16-bit integer or 32-bit floating point.
• Analog Format: The Output analog data format can be configured to either 16-bit integer or 32-bit floating point.
• Freq/Dfreq Format: The Output Frequency and rate-of-change of frequency data formats can be configured to either 16-bit integer or 32-bit floating point.
The PMU X window at Output X also tabulates a list of channels configured in PMU X. The user can enable or disable a channel, as well as rename a channel, in this table.
• Channel: If enabled, the channel of the PMU X will be added into Output X as a part of the PMU X frame.
• Channel Name: The original name of the channel, according to CFG-2. This is not a user-programmable field.
• Output Channel Name: The user can rename the Output channel name before sending it through Output X. By default, the output channel name matches the channel name.
NOTE
NOTE: EnerVista P30 Setup will automatically reformat the string to meet naming requirements if the destination is set to Historian. For all output types, EnerVista P30 Setup will remove leading and trailing spaces from the name.

MULTILIN P30 PHASOR DATA CONCENTRATOR – INSTRUCTION MANUAL 6–1
Multilin P30
Chapter 6: P30 Concentrator Commands
GE Energy
P30 Concentrator Commands
The Multilin P30 Phasor Data Concentrator facilitates commands that the user can send to the Multilin P30 using the EnerVista P30 Setup tool. The commands are classified in three main categories:
1. Basic commands
2. IRIG-B commands
3. Historian commands. These commands are explained below.

6–2 MULTILIN P30 PHASOR DATA CONCENTRATOR – INSTRUCTION MANUAL
BASIC COMMANDS CHAPTER 6: P30 CONCENTRATOR COMMANDS
Basic commands
The EnerVista setup path and menu figure for basic commands are shown below: Each item below is a button:PATH: Device > Commands > Basic Commands
• Clear Event Recorder: By pressing the “Clear” button, the Multilin P30 clears all events provided the “Clear Event Recorder” setting in the Device > Settings > Product Setup > Event Recorder is enabled.
• Activate New Configuration: In the case of any change in configuration of the Multilin P30 (e.g. output datasets), the user has to activate a new configuration using this command. The “Activate New Configuration” button requires administrative access.
NOTE
NOTE: During the process of activating the new configuration in the Multilin P30, the Multilin P30 device doesn’t communicate with any input or output device.

CHAPTER 6: P30 CONCENTRATOR COMMANDS IRIG-B COMMANDS
MULTILIN P30 PHASOR DATA CONCENTRATOR – INSTRUCTION MANUAL 6–3
IRIG-B commands
The IRIG-B year can be set initially using the IRIG-B command. The EnerVista path for this command window is shown below:PATH: Device > Commands > IRIG-B Commands
• Date: The current date and time on the Multilin P30.
• IRIG-B Year: Enter the value of current year (for IRIG-B).
• Set IRIG-B Year: Pressing the Set button sends the above IRIG-B Year to the Multilin P30. The time is updated immediately.

6–4 MULTILIN P30 PHASOR DATA CONCENTRATOR – INSTRUCTION MANUAL
IRIG-B COMMANDS CHAPTER 6: P30 CONCENTRATOR COMMANDS

MULTILIN P30 PHASOR DATA CONCENTRATOR – INSTRUCTION MANUAL 7–1
Multilin P30
Chapter 7: P30 Concentrator Actual Values
GE Energy
P30 Concentrator Actual Values
NOTE
NOTE: EnerVista P30 Setup will not display any screen if there are pending configuration changes.
Status
The status menu of the EnerVista P30 Setup tool allows the user to check the status of the Multilin P30 components, remote input and output devices connected to the Multilin P30 , the Ethernet ports, and synchronization (IRIG-B) input. The details for each item are explained below:
Remote input statusThe Input Devices status configured in the Multilin P30 can be obtained using the following EnerVista path:PATH: Device > Actual Values > Status > Remote Input Devices
The current state of up to 40 Remote Input Devices is shown here:
Figure 1: Remote Input Status screen
The list of remote devices will be populated based on the input devices configured in the Multilin P30 . The device “Name” column shows the corresponding device name based on the configuration file (STN value).

7–2 MULTILIN P30 PHASOR DATA CONCENTRATOR – INSTRUCTION MANUAL
STATUS CHAPTER 7: P30 CONCENTRATOR ACTUAL VALUES
Remote output statusThe status of all the TCP-configured output streams (up to 8) can be obtained using the following EnerVista path:PATH: Device > Actual Values > Status > Remote Output Status
Figure 2: Remote Output Status screen
This window shows all the TCP-configured outputs. If set to “UDP,” the program shows "N/A" in the status field. Names are based on the outputs configuration.
NOTE
NOTE: The status is available if the output protocol is set to TCP and not UDP. This is specified in the Output Configuration screen (setting: "Transport Protocol").
EthernetThe status of all Ethernet communication ports can be monitored from the following EnerVista path:PATH: Device > Actual Values > Status > Ethernet
These values indicate the status of the primary and secondary Ethernet links.
This window shows the list of all Ethernet ports available on the Multilin P30.
SynchronizationThe status of all synchronization sources is available in EnerVista using the following path:PATH: Device > Actual Values > Status > Synchronization

CHAPTER 7: P30 CONCENTRATOR ACTUAL VALUES STATUS
MULTILIN P30 PHASOR DATA CONCENTRATOR – INSTRUCTION MANUAL 7–3
The status of the IRIG-B time synchronization signal is available in this window. This status can be either “Fail” (if IRIG-B is not connected or there is a failure in the connection) or “OK” (IRIG-B is available).

7–4 MULTILIN P30 PHASOR DATA CONCENTRATOR – INSTRUCTION MANUAL
METERING CHAPTER 7: P30 CONCENTRATOR ACTUAL VALUES
Metering
The EnerVista P30 Setup tool allows metering of Inputs from PMUs, Pseudo PMUs, Outputs, and Trending. All these metering options are explained below:
InputsThe Multilin P30 supports a maximum of either 8 or 40 Input PMUs depending on the Order Code. This screen provides status for each of the 8[40] Multilin P30 inputs.
Input X PMU X to X
PMU XThe input device status window can be found from the following path:PATH: Device > Actual Values > Metering > Inputs > PMU x-x > PMU x
NOTE
NOTE: Only a single input can be metered at any one time.
• The Station Name (STN), is determined based on the configuration file, and is not an actual value.
• The ID Code and Timestamp are based on the data frame.
• Other items are based on STAT bits of data frame -
– Unlocked Time is based on STAT bit 5-4 from the data frame (00 = sync locked, best quality 01 = Unlocked for 10 s, 10 = Unlocked for 100 s, 11 = Unlocked over 1000 s)
– Test Mode is displayed based on STAT bit-15
– Internal Error is shown if STAT bit-14 is high
– Time Sync Error based on STAT bit-13
– Sorting Type based on STAT bit-12
– Configuration Changed from STAT bit-10
– Trigger Detected from STAT bit-11
– Time Quality from STAT bits 8-6 according to IEEE C37.118.2 Draft 3.2 May 2011.

CHAPTER 7: P30 CONCENTRATOR ACTUAL VALUES METERING
MULTILIN P30 PHASOR DATA CONCENTRATOR – INSTRUCTION MANUAL 7–5
• Channel names are determined based on the configuration file. Values of all these channels (up to 20 phasor, 16 analogs, 32 digitals, 1 Freq, 1 Dfreq) are based on the received data frame.
The EnerVista P30 Setup program ensures that all data shown on the screen are from the same time stamp.
Pseudo PMUsAs explained before, there are 4 Pseudo PMUs, each containing 0 phasors, 16 analogs, and 32 digitals.
Pseudo PMU X Pseudo PMU data and status can be monitored using the following EnerVista path:PATH: Device > Actual Values > Metering > Pseudo PMU > Pseudo PMU X

7–6 MULTILIN P30 PHASOR DATA CONCENTRATOR – INSTRUCTION MANUAL
METERING CHAPTER 7: P30 CONCENTRATOR ACTUAL VALUES
Figure 3: Pseudo PMU screen
All the configured channels, i.e. data and status channels, can be viewed in this window. The signal names are based on configuration of the Pseudo PMU. TheEnerVista P30 Setup program ensures that all data shown on the screen are from the same time stamp.
OutputsThe Multilin P30 supports a total of 8 outputs, and can be connected as a server for up to 8 client connections.
Output X PMU X to X
PMU XThe Outputs menu lists Output 1 to 8, and each output can have multiple PMUs configured on that output stream. These can be observed from the EnerVista path shown below:PATH: Device > Actual Values > Metering > Outputs > Output x > PMU x-x > PMU x
NOTE
NOTE: The PMU number in the Metering > Outputs tree corresponds with the position of the PMU (in a concentrated frame) as seen by an output device. For example, consider the case where three PMUs are configured on the Input configuration screens, and only PMU 1 and PMU 3 are included via the PMU Selection windows (PMU 2 is excluded). Metering > Outputs > ... > PMU 1 will show the data from PMU 1 and Metering > Outputs > ... > PMU 2 will show the data from PMU 3. Similarly, data from Pseudo PMU 2 could be shown in Metering > Outputs > ... > Pseudo PMU 1 if Pseudo PMU 2 is the first included Pseudo PMU.

CHAPTER 7: P30 CONCENTRATOR ACTUAL VALUES METERING
MULTILIN P30 PHASOR DATA CONCENTRATOR – INSTRUCTION MANUAL 7–7
NOTE
NOTE: Only a single output can be metered at any one time.
NOTE
NOTE: The EnerVista P30 Setup program ensures that all data shown on the screen are from the same time stamp.
TrendingThe Trending window is a commissioning tool that allows phasors, analogs, and digitals to be plotted over time. A single input PMU and a single output PMU can be monitored at the same time. For each, up to three channels can be displayed.
NOTE
NOTE: The Trending window cannot be opened unless the other metering screens are first closed.

7–8 MULTILIN P30 PHASOR DATA CONCENTRATOR – INSTRUCTION MANUAL
METERING CHAPTER 7: P30 CONCENTRATOR ACTUAL VALUES
Trending can be viewed in EnerVista using the path shown below:PATH: Device > Actual Values > Metering > Trending
Inputs: Up to three channels of a specific PMU may be monitored. Outputs: Up to three channels of a specific Output PMU may be monitored. For each output, the PMU number corresponds with the Input PMU number, not the position of the PMU (in a concentrated frame) as seen by an output device.Cursor 1: Show the values of the channels at cursor 1 on the plot.Cursor 2: Show the values of the channels at cursor 2 on the plot. Delta: Show the difference of the values at the two cursors (cursor 2 - cursor 1). Note that when Delta is selected, the timestamp field will not show the time difference. To see timestamps for each cursor, select either Cursor 1 or Cursor 2.Zoom In: Zooms in to show fewer samples on the x-axis. If 60 seconds are displayed, clicking the Zoom In button will update the screen to show only the most recent 30 seconds.Zoom Out: Zooms out to show more samples on the x-axis. If 30 seconds are displayed, clicking the Zoom Out button once will update the screen to show the most recent 60 seconds.Reset: Clears the trending plot.Run/Stop: Enables/disables retrieval of data.Sample Rate: The polling frequency. Note that the interval is only approximate; network conditions and loading can reduce the actual rate. Use the cursors to see the exact timestamp.Trending Plot Cursors: Click and drag the two cursors (vertical lines on the plot) to reposition them. The corresponding values are shown alongside each channel name.Trending Plot X-Axis: The x-axis of the trending plot represents the sample number, with the most recent sample on the right. As data points are equally spaced, cursors should be used to determine values at specific moments in time.

CHAPTER 7: P30 CONCENTRATOR ACTUAL VALUES METERING
MULTILIN P30 PHASOR DATA CONCENTRATOR – INSTRUCTION MANUAL 7–9
Trending Plot Y-Axis: The P30 trending display has been optimized to enhance the user visualization experience. Up to 12 lines (6 channels, each with magnitude and angle) are scaled independently on the y-axis such that both the maximum and minimum values are visible on the screen. The first line is scaled to 96% of the total viewable range. Each additional line is automatically scaled to use 8% less of the total range (y-axis) on the display. Therefore, the second line will be scaled to 88% (96% - 8%) of the total viewable range. If the third line is plotted, it will be scaled to 80% (96% - 8% - 8%).The viewable range that a line is scaled to can be expressed as the following function: f(x) = 0.96 - (0.08*(line number - 1))(x), where x = total range of an empty trending chart.As shown in the following diagram, two lines of the same magnitude will be displayed with different heights on the trending chart. This feature makes it possible to visualize the trend of all data that is plotted, regardless of magnitude:

7–10 MULTILIN P30 PHASOR DATA CONCENTRATOR – INSTRUCTION MANUAL
RECORDS CHAPTER 7: P30 CONCENTRATOR ACTUAL VALUES
Records
The Event Records menu shows the contextual data associated with up to the last 8192 events, listed in chronological order from most recent to oldest. If all 8192 Event Records have been filled, the oldest record is removed as a new record is added. Each event record shows the event identifier/sequence number, cause, and date/time stamp associated with the event trigger. Refer to the COMMANDS > CLEAR RECORDS menu for clearing Event Records.
NOTE
NOTE: The EnerVista P30 Setup program displays time in UTC.
Event recorder
NOTE
NOTE: The event recorder must be enabled in the event recorder settings function, to enable the Multilin P30 to capture the sequence of events.
PATH: Device > Actual Values > Records > Event Recorder
The Multilin P30 supports 4 severities of events: Critical, Major, Minor, and Status. Multilin P30 events are date- and time-stamped to the nearest microsecond. Recording of minor, major, and critical severity levels is enabled by default.
Event recordingThe events recorded by the Multilin P30 are classified in following categories:
• System events
• Self-test (diagnostics) events
CHAPTER 7: P30 CONCENTRATOR ACTUAL VALUES RECORDS
MULTILIN P30 PHASOR DATA CONCENTRATOR – INSTRUCTION MANUAL 7–11
• Communications events
• P30 client events
• P30 server events
• Security events.
The categories of Multilin P30 events are explained below:
System events 1. Concentrator Power-On Event: This event is generated each time the concentrator software is restarted or shut down either by soft or hard reset/shut down. Ideally, this event is posted to the event recorder after the concentrator software has been initialized/shutdown. Event name: Power-ON Event severity: status
2. Configuration Change Uploaded: This event is generated when a new Multilin P30 configuration has been uploaded to the Multilin P30 from the set-up software. Changes to the concentrator configuration will not take effect until the Activate New Configuration command is issued or the Multilin P30 is restarted. Event name: Configuration change uploadedEvent severity: minor
3. Firmware Updated: Generated when a new firmware image has been installed on the Multilin P30 Concentrator card, and the firmware upgrade has been committed. This event will be posted to the event recorder only after the firmware has been completely updated on the Concentrator card. Event name: Firmware updatedEvent severity: minor
NOTE
NOTE: If firmware uploaded to the Multilin P30 is the same version that was previously running on the device, this event will not be generated.
4. Firmware Upgrade Pending Restart: Generated when a new firmware binary has been uploaded to the Multilin P30 Concentrator card, but has not been committed. Though the upgrade can be reverted at this time, by uploading and committing the previous version of firmware, this event can only be addressed by restarting the Concentrator card. Event name: Firmware upgrade pending restartEvent severity: minor
NOTE
NOTE: If firmware uploaded to the Multilin P30 is the same version that was previously running on the device, this event will not be cleared.
5. Events Cleared: This event is generated when a user clear all events in the event recorder. Event name: Events clearedEvent severity: minor
6. Clock Synchronized Event: This event is generated each time the date/time is changed, either by EnerVista P30 Setup software or IRIG-B. Event name: Real Time Clock synchronizedEvent severity: status
7. Firmware upgrade checksum failure: This event is generated when a firmware binary has been uploaded to the Multilin P30 but after the secure firmware signature has been validated, the checksum for the firmware binary is invalid. The checksum is validated by an API provided by the BSP provider. This event can be raised even though an invalid firmware event is not raised. Event name: Firmware upgrade checksum failureEvent severity: major

7–12 MULTILIN P30 PHASOR DATA CONCENTRATOR – INSTRUCTION MANUAL
RECORDS CHAPTER 7: P30 CONCENTRATOR ACTUAL VALUES
Self-test (Diagnostics)events
1. Invalid Order Code: This event is generated when the Concentrator card has been programmed with an invalid order code. Call GE Digital Energy Support to resolve this event. Event name: Invalid Order CodeEvent severity: critical
2. Inter-Card Communication Failure: This event is generated when the Concentrator card has unexpectedly missed a pre-determined number of heartbeat packets from the Historian or Application card, and additionally, when the heartbeat has been restored. Event name: Inter-Card Communication LostEvent severity: major
3. Equipment Mismatch: This event is generated when the Concentrator card detects that the installed equipment does not match the system Order Code. Upon start-up the Concentrator card tests communication to both the Application card and the Historian card. If response messages are received from cards not indicated by the Order Code, or if no heartbeat messages are received from cards indicated by the Order Code, the event is generated. The Concentrator periodically checks whether extra equipment, equipment not indicated in the Order Code, has been inserted into the system, and generates this event as required. The event is also generated when (a) a heartbeat message is left un-recovered for an extended period of time, (b) the software detects the wrong PMC card type compared to the one specified in the Order Code, or (c) the PMC is missing. Event name: Equipment MismatchEvent severity: major
4. Unit Not Programmed: This event is generated when critical Multilin P30 settings have not been commissioned. The Multilin P30 logic should check that these settings are installed each time the device is started and the firmware has been initialized. This event may be generated along with an Invalid Configuration event. Event name: Unit Not ProgrammedEvent severity: critical
5. IRIG-B Failure: This event is generated when the Multilin P30 detects that there is a change in the IRIG-B status. The event value will show the current state. A value of 1 shows that the signal has been lost or is no longer fit for the purpose. A value will be 0 when an IRIG-B signal has been detected. The Multilin P30 ’s functionality is severely compromised when a suitable IRIG-B signal is unavailable. (For example, Remote Authentication will not function without an IRIG-B signal.)Event name: IRIG-B LostEvent severity: critical
6. Firmware Watchdog: This event is generated when the Concentrator’s watchdog mechanism has detected that a task has become unresponsive. A task may have become unresponsive if another task has failed to relinquish control of the processor, blocking it indefinitely. Event name: Firmware WatchdogEvent severity: critical
7. Firmware Version Mismatch: The Multilin P30 will normally have one system firmware version, which will comprise different sub-versions that correspond to the components installed in the system as indicated by the Order Code. Sub-versions may correspond to each system image including: Historian, Concentrator, and Application. Firmware version management ensures that per the system version, the correct sub-versions are installed on each system component. Checking occurs on the Multilin P30 Concentrator card. Firmware version control logic is updated per the Concentrator card firmware release, as required. Any firmware version mismatch will generate an event that will be posted to the Event Recorder as soon as the mismatch

CHAPTER 7: P30 CONCENTRATOR ACTUAL VALUES RECORDS
MULTILIN P30 PHASOR DATA CONCENTRATOR – INSTRUCTION MANUAL 7–13
is detected. Event name: Firmware Version MismatchEvent severity: critical
8. IRIG-B Year Not Set: If the unit is in the programmed state, the firmware will check the value of current year at system start-up. If this value is less than 2012, it will log an event with a value of 1 to indicate that the IRIG-B year has not been set. This event is also generated each time the IRIG-B year value is changed by the EnerVista software.Event name: IRIG-B Year SynchronizedEvent severity: critical
Communicationsevents
1. Console Ethernet Link Failure: This event is generated whenever the console Ethernet port on the Concentrator cannot detect an Ethernet link. Event name: Console Ethernet Link FailEvent severity: major
2. Ethernet 2 Link Failure: This event is generated whenever Ethernet port 2 on the Concentrator cannot detect an Ethernet link or has detected an Ethernet link and it is enabled. Event name: Ethernet 2 Link FailEvent severity: major
3. Ethernet 5 Link Failure: This event is generated whenever the backplane port on the Concentrator cannot detect an Ethernet link with the Historian or has detected an Ethernet link and it is enabled. Users can enable this event if the Multilin P30 Order Code indicates that a Historian card has been installed. Event name: Historian Ethernet Link FailureEvent severity: major
4. Ethernet 6 Link Failure: This event is generated whenever the backplane port on the Concentrator cannot detect an Ethernet link with the Application card or has detected an Ethernet link and it is enabled. Users can enable this event if the Multilin P30 Order Code indicates that an Application card has been installed. Event name: Application Ethernet Link FailureEvent severity: major
P30 Client events 1. Multilin P30 Client State: This event is generated when a Multilin P30 client has changed to a known state. Events can be generated for up to 40 PMU clients. Reporting cannot be enabled / disabled for individual Multilin P30 clients. States that are reported correspond to the individual states specified in the IEEE c37.118-2005 standard. Event name: Multilin P30 Client StateEvent severity: status
2. Multilin P30 Client ID Code Out of Range: This event is generated when a user inputs an ID code which is not valid. Valid values are 1 to 65534. Event name: PMU ID Code Out of RangeEvent severity
3. Data Rate Out of Range: This event is generated when data transmission is out of range. Allowable range for 60 Hz is 120, 60, 30, 20, 15, 12, 10, 5, 4, 2, 1 and for 50 Hz is 100, 50, 25, 10, 5, 2, 1. Event name: Data Rate Out of RangeEvent severity: major
4. Client Configuration Mismatch: This event is generated when a client has been configured (via the EnerVista P30 Setup software) and the prescribed configuration for a PMU does not match the data in the configuration frame that is received from the PMU. The event remains in the raised state so long as the mismatch persists. If the mismatch subsides due to a client’s providing a correction or an updated

7–14 MULTILIN P30 PHASOR DATA CONCENTRATOR – INSTRUCTION MANUAL
RECORDS CHAPTER 7: P30 CONCENTRATOR ACTUAL VALUES
configuration from the PMU, this event is transitioned to the lowered state. Event name: Client Configuration MismatchEvent severity: major
5. Client Configuration Change: Is generated when configuration change (bit-10) of a PMU is received. The event remains in the raised state until the Multilin P30 starts receiving/understanding the data frames of the new configuration. Event name: Client Configuration ChangeEvent severity: major
P30 Server events 1. Multilin P30 Server State: This event is generated when a Multilin P30 server has changed to a known state. Events can be generated for up to 7 PMU servers (Historian server is considered separately). Reporting cannot be enabled / disabled for individual Multilin P30 clients. States that are reported will correspond to the individual states specified in the IEEE c37.118-2005 standard. Event name: PDC server stateEvent severity: status
2. Historian Server State: This event is generated when the Multilin P30 server, dedicated to the Historian connection, has changed to a known state. This event cannot be enabled on a Multilin P30 where the Order Code does not indicate a Historian. States that are reported will correspond to the individual states specified in the IEEE c37.118-2005 standard. Event name: PDC Historian stateEvent severity: status
3. TCP Client Window Full: This event may be generated when the client stops accepting data on a TCP socket. The Multilin P30 can diagnose this situation. In some cases a client connected to the Multilin P30 may not keep pace with the data that the Multilin P30 is streaming to it . If this occurs the client may stop responding because the client’s TCP window is full. Users should examine the affected PMU when this event is raised. The event remains in the raised state so long as the condition persists. If the condition subsides, this event is transitioned to the lowered state.Event name: TCP Client Window Full Event severity: major
Security events 1. Remote Authentication Unsuccessful: This event is generated when a valid user has been authenticated or denied access by the remote RADIUS server. The event is posted to the Event Recorder only after the RADIUS server has sent an unsuccessful authentication response back to the Multilin P30 Concentrator card.Event name: Remote Authentication DeniedEvent severity: minor
2. RADIUS Server Unreachable: This event is generated when any request to a configured RADIUS server has expired without a response from said server. The event is posted to the Event Recorder immediately after the security infrastructure has detected that a request has expired. Event name: RADIUS Server Time OutEvent severity: major
3. Local User Database Change: This event is generated when any change has been made to the local user database, including password changes.Event name: Local User Database UpdateEvent severity: status
4. Local Authentication Unsuccessful: This event is generated when a user has been denied authentication against the local user database. or has been authenticated. The event is posted to the Event Recorder only after the local authentication mechanism

CHAPTER 7: P30 CONCENTRATOR ACTUAL VALUES RECORDS
MULTILIN P30 PHASOR DATA CONCENTRATOR – INSTRUCTION MANUAL 7–15
has indicated that an unsuccessful /successful authentication has taken place. Event name: Local Authentication FailureEvent severity: minor
5. Invalid Firmware Uploaded: This event is generated when a firmware binary has been uploaded to the Multilin P30 but the secure firmware upgrade feature determines that the binary uploaded is invalid. Event name: Invalid Firmware UploadEvent severity: major
6. Concentrator IP Address Changed: This event is generated when the Concentrator console port IP Address is changed by the Serial port CLI application. Event name: Concentrator IP ChangedEvent severity: minor
7. Unauthorized Command Attempted: This event is generated when a user attempts to execute a command for which it does not have privileges. Event name: Unauthorized CommandEvent severity: major

7–16 MULTILIN P30 PHASOR DATA CONCENTRATOR – INSTRUCTION MANUAL
PRODUCT INFORMATION CHAPTER 7: P30 CONCENTRATOR ACTUAL VALUES
Product information
Product Information includes information about Multilin P30 Historian firmware revisions, and Multilin P30 model information. This information menu depends completely upon the Order Code, i.e. Whether the Historian is included or not. If the Historian in not included, information about the Historian will not be displayed.
Model informationMultilin P30 Model Information details of can be viewed using the following EnerVista path:PATH: Device > Actual Values > Product Info > Model Information
The Order Code and Serial Number of the entire Multilin P30 system are shown at the top. Following this, is the individual Multilin P30 Concentrator information such as, Serial number, Manufacturing data, Operating time, Date of Last Setting change, and MAC addresses of the ordered Ethernet interfaces. Information about the Historian is available if it has been ordered as a part of the Multilin P30 system. If such is the case, the Serial number, Manufacturing date, and MAC addresses are available to the user.
Firmware revisionsFirmware Revision details can be obtained using the following EnerVista path:PATH: Device > Actual Values > Product Info > Firmware Revisions

CHAPTER 7: P30 CONCENTRATOR ACTUAL VALUES PRODUCT INFORMATION
MULTILIN P30 PHASOR DATA CONCENTRATOR – INSTRUCTION MANUAL 7–17
The System Revision value shows the revision level of the Multilin P30 system, whereas the Multilin P30 revision implies the Multilin P30 Concentrator firmware revision level. In addition, other firmware-related details such as modification file number, boot program revision, compile date, and boot date are also available to the user. If the Historian option is selected, the user can also check the Historian firmware revision number, and operating system versions.

7–18 MULTILIN P30 PHASOR DATA CONCENTRATOR – INSTRUCTION MANUAL
PRODUCT INFORMATION CHAPTER 7: P30 CONCENTRATOR ACTUAL VALUES

MULTILIN P30 PHASOR DATA CONCENTRATOR – INSTRUCTION MANUAL 8–1
Multilin P30
Chapter 8: P30 Concentrator Maintenance
GE Energy
P30 Concentrator Maintenance
Upgrading P30 Concentrator Firmware
To upgrade the Multilin P30 Concentrator firmware, follow the procedures listed in this section. Upon successful completion of this procedure, the Multilin P30 will have new Concentrator firmware installed with the factory default setpoints.The latest firmware files are available from the GE Digital Energy website at http:// www.gedigitalenergy.com.
NOTE
NOTE: The user should save the Concentrator files to an offline settings file so that they may be restored after the upgrade has completed.
Process for Upgrading P30 Concentrator firmwareTo upgrade the Multilin P30 Concentrator firmware, follow the procedures listed in this section. EnerVista P30 Setup software prevents incompatible firmware from being loaded into a Multilin P30 device, while the Multilin P30 secure firmware upload feature will ensure that only official GE firmware can be loaded into the device.
NOTE
NOTE: An event will be posted to the event recorded if an attempt is made to load invalid firmware to the Multilin P30. Please see the Event Recorder section of this document for details.
FASTPATH: Before upgrading firmware, it is very important to save the current Multilin P30 settings to a file on your PC, as a backup procedure. After the firmware has been upgraded, it may be necessary to load this file back into the Multilin P30. Refer to Downloading and Saving Settings Files for details on saving device settings to a file.
NOTE
NOTE: Stopping operation of the Multilin P30 before starting a firmware upgrade is required. The Multilin P30 may be halted by setting the programmed state to “not programmed,” then activating the configuration.
Loading new firmware into the Multilin P30 flash memory is accomplished as follows:

8–2 MULTILIN P30 PHASOR DATA CONCENTRATOR – INSTRUCTION MANUAL
UPGRADING P30 CONCENTRATOR FIRMWARE CHAPTER 8: P30 CONCENTRATOR MAINTENANCE
1. From the maintenance branch in the online setting tree select “Update Firmware”.
2. Select the latest firmware image obtained from GE, and click the OPEN button.
3. In the “Update Firmware” dialog that appears, select the “Concentrator” radio button. Click Proceed to begin the firmware upgrade process.One of the following messages will appear on the screen:
– “The configuration files on the device are not supported by this firmware version. The device will be restored to Factory Defaults*. Are you sure you want to update the firmware?” [Only this option will reset the IP address.]Scenarios: Upgrading between non-consecutive major releases. e.g. 1.00 to 1.20 or 1.00 to 2.00 When downgrading the firmware. e.g. 2.00 to 1.10
– “The configuration files on the device are not supported by this firmware version. They will be converted to work with this firmware version. Are you sure you want to update the firmware?” Scenario: Upgrading between consecutive major releases. e.g. 1.0x to 1.1x
– “The configuration files on the device are supported by this firmware version. No configuration changes are necessary during the update. Are you sure you want to update the firmware?” Scenario: Upgrading between minor releases. e.g. 1.10 to 1.11
– “Firmware version 1.00 is not supported. No changes will be made to the device.Scenario: When attempting to install a version that is not supported by the device or software. e.g. 1.10 to 1.00
* Factory Defaults will be applied to the entire device, including:All settings (As noted above, before upgrading firmware, it is very important to save the current Multilin P30 settings as a backup, to a file on your PC for possible loading back into the PC once the upgrade has taken place.)EventsLocal PasswordsRADIUS Shared secretRADIUS CA CertificateFiles not supported by the current firmware version (example: If you downgrade from V5.00 to V1.10, files specific to V5.00 will be deleted.)
NOTE
NOTE: The IP Address will be reset. After the firmware update, the user must use the CLI to reset the IP Address (for details, see Chapter 2: Serial Communications > Command Line Interface).

CHAPTER 8: P30 CONCENTRATOR MAINTENANCE UPGRADING P30 CONCENTRATOR FIRMWARE
MULTILIN P30 PHASOR DATA CONCENTRATOR – INSTRUCTION MANUAL 8–3
4. A dialog will indicate that the firmware upgrade is in progress.
5. Upon a successful update, the user will be prompted to restart the Multilin P30 to apply the changes immediately, or to restart the device at a later time. A restart is required to activate the new firmware.
6. To activate the new firmware at a later time, click the Activate New Configuration button.

8–4 MULTILIN P30 PHASOR DATA CONCENTRATOR – INSTRUCTION MANUAL
CERTIFICATES CHAPTER 8: P30 CONCENTRATOR MAINTENANCE
Certificates
• The “Certificate Management” window allows the user to upload or delete the CA Certificate used by the P30 during RADIUS authentication.
• The RADIUS certificate is a X.509 v3 certificate type, that has a file extension .der, and is signed by the Certificate Authority (CA). The Multilin P30 Client automatically renames this file in accordance with GE naming requirements.
• The RADIUS Server side must be configured according to standard procedures in order to use this certificate. This is part of the RADIUS Server configuration and is not provided by GE.
NOTE
NOTE: For a RADIUS server application example, please refer to Appendix A of this reference manual.

MULTILIN P30 PHASOR DATA CONCENTRATOR – INSTRUCTION MANUAL 9–1
Multilin P30
Chapter 9: P30 Historian Configuration
GE Energy
P30 Historian Configuration
Configuring Historian - the main steps
Before using the ESV application, you must configure the Multilin P30 Historian. This process involves the following seven main steps:
1. Set up and start hardware
2. Configure Multilin P30 Historian network settings
3. Log in to the Multilin P30 Historian.
NOTE
NOTE: Interfacing with the Multilin P30 Historian must be done over the network by way of Remote Desktop Protocol (RDP)
4. Change Multilin P30 Historian login credentials and, optionally, computer name
5. Set up Multilin P30 Historian users
6. Adjust Multilin P30 Historian configuration settings
7. Verify Multilin P30 Historian operation.
Set up and start hardware
1. Plug one end of an Ethernet cable in the front port of the chassis, and the other end in the applicable network switch.
2. Power on the VME chassis. The Multilin P30 Historian is started automatically when power is applied to the VME chassis.
3. The Multilin P30 Historian card starts automatically.
4. Complete the steps outlined under Configure Multilin P30 Historian Network Settings.
5. Complete the steps outlined under Log in to the Multilin P30 Historian.

9–2 MULTILIN P30 PHASOR DATA CONCENTRATOR – INSTRUCTION MANUAL
CONFIGURING HISTORIAN - THE MAIN STEPS CHAPTER 9: P30 HISTORIAN CONFIGURATION
Configure P30 Historian Network Settings
The Historian Network settings can be configured via the serial port and through EnerVista P30 Setup. Refer to the Serial Communications > Command Line Interface section for instructions on how to set up the Historian IP Address using SetHistorianIP CLI Command.To configure via EnerVista P30 Setup:
1. Connect to the Concentrator in the same chassis as the Multilin P30 Historian.
2. The Historian network settings can be sent to the P30 Historian using the Historian Commands window (Device > Commands > Historian). If this is the first time the network settings are being configured, click Cancel when prompted for the Historian User Name/Password (there is no need to authenticate with the Historian as the new Historian network parameters will be sent via the Concentrator).
3. Enter the new network parameters and press the Set button to apply them immediately. Record the IP Address, as it will be needed when logging in to the Multilin P30 Historian.
4. Close the Historian Commands window.
Log into the P30 Historian
1. From EnerVista P30 Setup, open the Historian Commands window (Device > Commands > Historian).
2. Press the Enable Remote Desktop button to allow RDP connections directly to the Historian.
NOTE
NOTE: To prevent unauthorized users from attempting to access the Multilin P30 Historian, RDP connections will be accepted only for a limited amount of time. See the Historian Commands section for more information.
3. Start Windows Remote Desktop Connection. The Remote Desktop Connection dialog box appears.
4. In the Computer field, enter the IP address of the Multilin P30 Historian.
5. Click Connect. The “Logon to Windows” dialog box appears.
6. Enter “Administrator” as the Username and “p123@PDCGE” as the Password, then click OK. The Multilin P30 Historian desktop appears.
FASTPATH: Installation of additional software to the Historian card may lead to unexpected behavior including system error after adding files to the desktop. Such installation is therefore NOT recommended or supported.
7. Complete the steps outlined under Change Multilin P30 Historian Login Credentials.
Change P30 Historian login credentials
NOTE
NOTE: The Multilin P30 Historian password should be changed upon initial login in as well as after re-imaging.
1. Press CTRL + ALT + END.
2. Select “Change Password”.

CHAPTER 9: P30 HISTORIAN CONFIGURATION CONFIGURING HISTORIAN - THE MAIN STEPS
MULTILIN P30 PHASOR DATA CONCENTRATOR – INSTRUCTION MANUAL 9–3
3. Enter the applicable values in the Old Password, New Password, and Confirm New Password fields, and then click OK. See the Security section of this manual for default passwords.
4. Optionally, change the Multilin P30 Historian name, as follows:
a. Click Start, then select Control Panel.
b. Click System. The “System Properties” dialog box appears
c. On the “Computer Name” tab, click Change. The “Computer Name” dialog box appears.
d. Enter the desired Computer Name in the corresponding field.
NOTE
NOTE: The name can contain no more than 15 characters, and may not contain any of the following characters: /\[]":;|<>+=,?*_
5. Proceed as applicable based on whether user authentication and security for the Multilin P30 Historian are to be controlled locally or by the domain server:
a. If authentication and security are to be controlled locally, click OK to close the Computer Name dialog box, and then proceed to step 9.
OR
b. If authentication and security are to be controlled by the domain server, click the Domain option, and then proceed to step 6.
6. In the Domain text field, type the domain name, then click OK. A dialog box appears, prompting you to provide a domain administrator username and password.
7. In the corresponding fields, enter the domain administrator Username and Password, then click OK.
8. Click OK. The “Computer Name” dialog box closes.
9. In the “System Properties” dialog box, click OK. A dialog box appears, prompting you to indicate whether you want to restart the computer.
10. Click Yes, unless you wish to continue with step 11 below.
11. Complete the steps under Set up Multilin P30 Historian User s.
Set up Multilin P30 Historian usersMultilin P30 Historian users can fall into one or more of the following groups based on differing levels of privilege:
• Administrators: provides privileges to access the Multilin P30 Historian card by way of RDP for the purpose of performing Windows administrative tasks including setting up users
• iH Readers: provides privileges for reading data from the Multilin P30 Historian card
• PDCPowerUsers: provides limited administrative privileges, including the ability to change configuration settings of the Multilin P30 Historian card
• PDCAdmins: provides full administrative privileges, including the ability to re-image the Multilin P30 Historian card
• iH Security: provides full administrative privileges to the Multilin P30 Historian server
NOTE
NOTE: The iH Security group should be reserved for troubleshooting purposes by the way of the Historian Administrator tool.
The process for setting up Multilin P30 Historian users differs based on whether user authentication and security are to be controlled locally or by domain server. This section provides a separate set of instructions for each context.

9–4 MULTILIN P30 PHASOR DATA CONCENTRATOR – INSTRUCTION MANUAL
CONFIGURING HISTORIAN - THE MAIN STEPS CHAPTER 9: P30 HISTORIAN CONFIGURATION
User setup in a localcontext 1. Complete steps 1 through 6 under Log in to the Multilin P30 Historian, using the login
credentials newly established under Change Multilin P30 Historian Login Credentials.
2. On the Multilin P30 Historian desktop, double-click the “Administrative Console” icon. The “Administrative Console” window appears.
3. In the left (navigation) pane, expand the Local Users and Groups (Local) folder, then click the “Users” subfolder.
4. In the right pane, right-click, then select “New User”. The “New User” dialog appears.
5. Specify credentials for the Multilin P30 Historian user by entering the following information in the corresponding fields:
a. User name
NOTE
NOTE: This designation will subsequently be used by the user when establishing connection between the ESV application and the Multilin P30 Historian, which must be done from within the application post install and before any application features can be used.
b. Full name
c. Description
d. Password
NOTE
NOTE: This password will subsequently be used by the user when establishing connection between the ESV application and the Multilin P30 Historian, which must be done from within the application post install and before any application features can be used.
e. Confirm password
6. Click Create.
7. Repeat steps 3 through 6 for each Multilin P30 Historian user you want to add.
8. Designate Windows administrator users, as follows:
a. In the left (navigation) pane and within the Local Users and Groups (Local) folder, click the Groups folder. The right pane refreshes to display the list of groups.
b. In the right pane, right-click the “Administrators” listing, then select “Add to Group”. The “Administrators” dialog box appears.
c. Click Add. The “Select Users” dialog box appears.
d. In the text field, enter the name of the user you want to assign Windows administrator privileges to, being sure to preface the name with that of the Multilin P30 Historian followed by a backslash (for example, PDCHistorian1\PDCHistorian User1).
NOTE
NOTE: You may enter a portion of the user’s name, then click Check Names to access a dialog box from which you can select the desired user.
e. Click OK. The “Select Users” dialog box closes, and the selected user’s name is added to the “Members” pane in the “Administrators” dialog box.
f. Repeat steps 8c through 8e for each user to whom you want to assign Windows administrator privileges.
g. When you are finished designating Windows administrator users, click OK to close the “Administrators” dialog box.
9. Designate Multilin P30 Historian read-only users, as follows:
a. In the left (navigation) pane and within the “Local Users and Groups (Local)” folder, click the “Groups” folder. The right pane refreshes to display the list of groups.
b. In the right pane, right-click the iH Readers listing, then select “Add to Group”. The iH Readers dialog box appears.

CHAPTER 9: P30 HISTORIAN CONFIGURATION CONFIGURING HISTORIAN - THE MAIN STEPS
MULTILIN P30 PHASOR DATA CONCENTRATOR – INSTRUCTION MANUAL 9–5
c. Click Add. The “Select Users” dialog box appears.
d. In the text field, enter the name of the user to whom you want to assign read-only privileges, being sure to preface the name with that of the Multilin P30 Historian followed by a backslash (for example, PDCHistorian1\PDCHistorian User1).
e. Click OK. The “Select Users” dialog box closes, and the selected user’s name is added to the “Members” pane in the “iH Readers” dialog box.
f. Repeat steps 9.3 through 9.5 for each user to whom you want to assign read-only privileges.
g. When you are finished designating Multilin P30 Historian read-only users, click OK to close the “iH Readers” dialog box.
10. Designate Multilin P30 Historian limited-administrator users, as follows:
a. In the left (navigation) pane and within the “Local Users and Groups (Local)” folder, click the Groups folder. The right pane refreshes to display the list of groups.
b. In the right pane, right-click the PDCPowerUsers listing, then select “Add to Group”. The “PDCPowerUsers’ dialog box appears.
c. Click Add. The “Select Users” dialog box appears.
d. In the text field, enter the name of the user to whom you want to assign limited-administrator privileges, being sure to preface the name with that of the Multilin P30 Historian followed by a backslash (for example, PDCHistorian1\PDCHistorianUser1).
e. Click OK. The “Select Users” dialog box closes, and the selected user’s name is added to the “Member” pane in the “PDCPowerUsers” dialog box.
f. Repeat steps 10.3 through 10.5 for each user to whom you want to assign limited-administrator privileges.
g. When you are finished designating Multilin P30 Historian limited-administrator users, click OK to close the “PDCPowerUsers” dialog box.
11. Designate Multilin P30 Historian full-administrator users, as follows:
a. In the left (navigation) pane and within the “Local Users and Groups (Local)” folder, click the Groups folder. The right pane refreshes to display the list of groups.
b. In the right pane, right-click the PDCAdmins listing, then select “Add to Group”. The “PDCAdmins” dialog box appears.
c. Click Add. The “Select Users” dialog box appears.
d. In the text field, enter the name of the user to whom you want to assign full-administrator privileges, being sure to preface the name with that of the Multilin P30 Historian followed by a backslash (for example, PDCHistorian1\PDCHistorianUser1).
e. Click OK. The “Select Users” dialog box closes, and the selected user’s name is added to the Members pane in the “PDCAdmins” dialog box.
f. Repeat steps 11.3 through 11.5 for each user to whom you want to assign full-administrator privileges.
g. When you are finished designating Multilin P30 Historian full-administrator users, click OK to close the “PDCAdmins” dialog box.
12. Designate Multilin P30 Historian server troubleshooting users, as follows:
a. In the left (navigation) pane and within the “Local Users and Groups (Local)” folder, click the Groups folder. The right pane refreshes to display the list of groups.
b. In the right pane, right-click the “iH Security” listing, then select “Add to Group”. The “iH Security” dialog box appears.
c. Click Add. The “Select Users” dialog box appears.
d. In the text field, enter the name of the user to whom you want to assign PDC Historian server troubleshooting privileges, being sure to preface the name with

9–6 MULTILIN P30 PHASOR DATA CONCENTRATOR – INSTRUCTION MANUAL
CONFIGURING HISTORIAN - THE MAIN STEPS CHAPTER 9: P30 HISTORIAN CONFIGURATION
that of the Multilin P30 Historian followed by a backslash (for example, PDCHistorian1\PDCHistorian User1).
e. Click OK. The “Select Users” dialog box closes, and the selected user’s name is added to the “Members” pane in the “iH Security” dialog box.
f. Repeat steps 12.3 through 12.5 for each user to whom you want to assign Multilin P30 Historian server troubleshooting privileges.
g. When you are finished designating Multilin P30 Historian server troubleshooting users, click OK to close the “iH Security” dialog box.
13. Close the “Administrative Console” window.
14. End the management session by restarting the computer.
15. Complete the steps outlined under Adjust Multilin P30 Historian Archive and Configuration Settings.
NOTE
NOTE: To modify user and group settings after this point, you must first start another management session by way of the corresponding desktop icon.
User setup in adomain context In preparation for Multilin P30 Historian user setup in a domain context, it is recommended
that you establish five domain user groups based on the following Multilin P30 Historian–related privilege levels:
• Administrators: provides privileges to access the Multilin P30 Historian card by way of RDP for the purpose of performing Windows administrative tasks including setting up users
• iH Readers: provides privileges for reading data from the Multilin P30 Historian card but no administrative privileges
• PDCPowerUsers: provides limited administrative privileges, including the ability to change configuration settings of Multilin P30 Historian card, but no privileges to read data from the card
• PDCAdmins: provides full administrative privileges, including the ability to re-image the Multilin P30 Historian card, but no privileges to read data from the card
• iH Security: provides full administrative privileges to the Multilin P30 Historian server
NOTE
NOTE: The iH Security group should be reserved for troubleshooting purposes by way of the Historian Administrator.
After you have established the requisite domain groups, take the following steps to set up Multilin P30 Historian users.
1. Complete steps 1 through 6 under Log in to the Multilin P30 Historian, using the login credentials newly established under Change Multilin P30 Historian Login Credentials.
2. On the Multilin P30 Historian desktop, double-click the Administrative Console icon. The “Administrative Console” window appears.
3. In the left (navigation) pane and within the “Local Users and Groups (Local)” folder, click the Groups folder. The right pane refreshes to display the list of groups.
4. Designate the Windows administrator domain group, as follows:
a. In the right pane, right-click the “Administrators” listing, then select “Add to Group”. The “Administrators” dialog box appears.
b. Click Add. The “Select Users” dialog box appears.
c. In the text field, enter the name of previously created Windows administrator domain group, being sure to preface the name with that of the domain followed by a backslash (for example, DomainName\DomainGroupName).

CHAPTER 9: P30 HISTORIAN CONFIGURATION CONFIGURING HISTORIAN - THE MAIN STEPS
MULTILIN P30 PHASOR DATA CONCENTRATOR – INSTRUCTION MANUAL 9–7
NOTE
NOTE: You may enter a portion of the group’s name, then click Check Names to access a dialog box from which you can select the desired user.
d. Click OK. The “Select Users” dialog box closes, and the selected domain group’s name is added to the “Members” pane in the “Administrators” dialog box.
e. When you are finished designating the Windows administrator domain group, click OK to close the “Administrators” dialog box.
5. Designate the Multilin P30 Historian read-only domain group as follows:
a. In the right pane, right-click the “iH Reader”s listing, then select “Add to Group”. The “iH Readers” dialog box appears.
b. Click Add. The “Select Users” dialog box appears.
c. In the text field, enter the name of the previously created Multilin P30 Historian read-only domain group, being sure to preface the name with that of the domain followed by a backslash (for example, DomainName\DomainGroupName).
NOTE
NOTE: You may enter a portion of the group’s name, then click Check Names to access a dialog box from which you can select the desired group.
d. Click OK. The “Select Users” dialog box closes, and the selected domain group’s name is added to the “Members” pane in the “iH Readers” dialog box.
e. When you are finished designating the Multilin P30 Historian read-only domain group, click OK to close the “iH Readers” dialog box.
6. Designate the Multilin P30 Historian limited-administrator domain group as follows:
a. In the right pane, right-click the PDCPowerUsers listing, then select “Add to Group”. The “PDCPowerUsers” dialog box appears.
b. Click Add. The “Select Users” dialog box appears.
c. In the text field, enter the name of the previously created Multilin P30 Historian limited-administrator domain group, being sure to preface the name with that of the domain followed by a backslash (for example, DomainName\DomainGroupName).
NOTE
NOTE: You may enter a portion of the group’s name, then click Check Names to access a dialog box from which you can select the desired group.
d. Click OK. The “Select Users” dialog box closes, and the selected domain group’s name is added to the “Members” pane in the “PDCPowerUsers” dialog box.
e. When you are finished designating the Multilin P30 Historian limited-administrator domain group, click OK to close the “PDCPowerUsers” dialog box.
7. Designate the Multilin P30 Historian full-administrator domain group as follows:
a. In the right pane, right-click the PDCAdmins listing, then select “Add to Group”. The “PDCAdmins” dialog box appears. Click Add. The “Select Users” dialog box appears.
b. In the text field, enter the name of the previously created Multilin P30 Historian full-administrator domain group, being sure to preface the name with that of the domain followed by a backslash (for example, DomainName\DomainGroupName).
NOTE
NOTE: You may enter a portion of the group’s name, then click Check Names to access a dialog box from which you can select the desired group.
c. Click OK. The “Select Users” dialog box closes, and the selected domain group’s name is added to the “Members” pane in the “PDCAdmins” dialog box.
d. When you are finished designating the Multilin P30 Historian full-administrator domain group, click OK to close the “PDCAdmins” dialog box.
9–8 MULTILIN P30 PHASOR DATA CONCENTRATOR – INSTRUCTION MANUAL
CONFIGURING HISTORIAN - THE MAIN STEPS CHAPTER 9: P30 HISTORIAN CONFIGURATION
8. Designate the Multilin P30 Historian server troubleshooting domain group, as follows:
a. In the right pane, right-click the iH Security listing, then select “Add to Group”. The “iH Security” dialog box appears.
b. Click Add. The “Select Users” dialog box appears.
c. In the text field, enter the name of the previously created Multilin P30 Historian server troubleshooting domain group, being sure to preface the name with that of the domain followed by a backslash (for example, DomainName\DomainGroupName).
NOTE
NOTE: You may enter a portion of the group’s name, then click Check Names to access a dialog box from which you can select the desired group.
d. Click OK. The “Select Users” dialog box closes, and the selected domain group’s name is added to the “Members” pane in the “iH Security” dialog box.
e. When you are finished designating the Multilin P30 Historian server troubleshooting domain group, click OK to close the “iH Security” dialog box.
9. Close the “Administrative Console” window.
10. End the management session by restarting the computer.
11. Complete the steps outlined under Adjust Multilin P30 Historian Configuration Settings.
P30 Historian tagnames Multilin P30 Historian tags are named based on fields in the C37.118 CFG-2 file. For details,
see Historian Tag Naming Conventions below.
P30 Historian tagnaming conventions Phasors and other measurements that can be visualized in the EnerVista Synchrophasor
Viewer (ESV) are each assigned an identifying string called a Historian tag.There are three main types of Historian tag:
• PMU configuration tags
• Data tags
• P30 Historian statistic tags.
In the case of PMU configuration and data tags, the first component in the name is always the PMUBaseName, which is the C37.118 station name (STN) followed by the PMU ID code (IDCODE), separated by a period, for example, STATION_A.10. In the case of Multilin P30 Historian statistic tags, the first component in the name is always PDCBaseName, which is the C37.118 PDC ID code (IDCODE) prefaced by the literal string PDC, for example, PDC56.Following are the Historian tag naming conventions and corresponding examples.PMU Configuration Tags
Parameter Naming Convention Example
Nominal Frequency PMUBaseName “.” FNOM STATION_A.10.FNOM
Configuration Count PMUBaseName “.” CFGCNT STATION_A.10.CFGCNT
Digital Configuration PMUBaseName “.” CHNAM “.” D STATION_A.10.CHA.D
Analog Configuration PMUBaseName “.” CHNAM “.” A STATION_A.10.CHB.A
Phasor Configuration PMUBaseName “.” CHNAM “.” P STATION_A.10.CHC.P

CHAPTER 9: P30 HISTORIAN CONFIGURATION CONFIGURING HISTORIAN - THE MAIN STEPS
MULTILIN P30 PHASOR DATA CONCENTRATOR – INSTRUCTION MANUAL 9–9
Data Tags
Multilin P30 Historian Statistic Tags
Measurement Naming Convention Example
Current Phasor Magnitude PMUBaseName “.” CHNAM “.” IM STATION_A.10.PHAI.IM
Current Phasor Angle PMUBaseName “.” CHNAM “.” IA STATION_A.10.PHAI.IA
Voltage Phasor Magnitude PMUBaseName “.” CHNAM “.” VM STATION_A.10.PHAV.VM
Voltage Phasor Angle PMUBaseName “.” CHNAM “.” VA STATION_A.10.PHAV.VA
Analog RMS PMUBaseName “.” CHNAM “.” AR STATION_A.10.PHM1.AR
Analog Instantaneous Value PMUBaseName “.” CHNAM “.” AI STATION_A.10.PHM2.AI
Digital Open PMUBaseName “.” CHNAM “.” DO STATION_A.10.BK1.DO
Digital Closed PMUBaseName “.” CHNAM “.” DC STATION_A.10.BK2.DC
Frequency PMUBaseName “.” FREQ STATION_A.10.FREQ
Rate of Change of Frequency PMUBaseName “.” DFREQ STATION_A.10.DFREQ
PMU Status PMUBaseName “.” STAT STATION_A.10.STAT
Trigger Bit PMUBaseName “.” TB STATION_A.10.DB
Measurement Naming Convention Example
Number of tag updates written to the Historian since the data collector service last started.
PDCBaseName.TotalSamples Written
PDC56.TotalSamplesWritten
Number of tag updates written to the Historian in the last ten seconds.
PDCBaseName.SamplesWritten LastTenSeconds
PDC56.SamplesWrittenLastTen Seconds
Size of the queue between the Concentrator and Historian.
PDCBaseName.CurrentQueueSize PDC56.CurrentQueueSize
Number of C37.118 data frames sent out of chronological order since the data collector service last started.
PDCBaseName.OutofOrderFrameCount
PDC56.OutofOrderFrameCount
Total number of C37.118 data frames processed by the Historian since the data collector service last started.
PDCBaseName.TotalDataFrames Processed
PDC56.TotalDataFrames Processed
Total number of bad C37.118 data frames since the data collector service last started.
PDCBaseName.BadFrameCount PDC56.BadFrameCount
Total number of C37.118 data frames discarded due to queue overrun since the data collector service last started.
PDCBaseName.DiscardedFrame Count
PDC56.DiscardedFrameCount
The number of milliseconds the current C37.118 data frame waited in the queue between the data collector service and the Historian.
PDCBaseName.WaitingTime PDC56.WaitingTime
Timestamp of the C37.118 data frame just processed.
PDCBaseName.CurrentData FrameTimestamp
PDC56.CurrentDataFrame Timestamp
Collector heartbeat since the data collector service last started.
PDCBaseName.Heartbeat PDC56.Heartbeat

9–10 MULTILIN P30 PHASOR DATA CONCENTRATOR – INSTRUCTION MANUAL
CONFIGURING HISTORIAN - THE MAIN STEPS CHAPTER 9: P30 HISTORIAN CONFIGURATION
P30 Historian storage requirements
Each sampled value for a Multilin P30 Historian tag requires a number of bytes for storage on a drive, which includes bytes for the value, timestamp, and quality field for each logged sample.Overall drive sizing requirements are a function of the following:
• Number of PMUs
• Number of phasor channels
• Number of analog channels
• Number of digital channels
• Data rate.
For a reference on calculating drive-sizing requirements, see Chapter 11 - Theory of Operation - P30 Historian Storage Requirements. Note that the equations provided are based on default compression settings. These compression settings are configurable.
P30 Historian tag naming conventions
Phasors and other measurements that can be visualized in the EnerVista Synchrophasor Viewer (ESV) are each assigned an identifying string called a Historian tag.There are three main types of Historian tag:
• PMU configuration tags
• Data tags
• PDC Historian statistic tags.
In the case of PMU configuration and data tags, the first component in the name is always the PMUBaseName, which is the C37.118 station name (STN) followed by the PMU ID code (IDCODE), separated by a period, for example, STATION_A.10. In the case of Multilin P30 Historian statistic tags, the first component in the name is always PDCBaseName, which is the C37.118 PDC ID code (IDCODE) prefaced by the literal string PDC, for example, PDC56.Following are the Historian tag naming conventions and corresponding examples.PMU Configuration Tags
Parameter Naming Convention Example
Nominal Frequency PMUBaseName “.” FNOM STATION_A.10.FNOM
Configuration Count PMUBaseName “.” CFGCNT STATION_A.10.CFGCNT
Digital Configuration PMUBaseName “.” CHNAM “.” D STATION_A.10.CHA.D
Analog Configuration PMUBaseName “.” CHNAM “.” A STATION_A.10.CHB.A
Phasor Configuration PMUBaseName “.” CHNAM “.” P STATION_A.10.CHC.P

CHAPTER 9: P30 HISTORIAN CONFIGURATION CONFIGURING HISTORIAN - THE MAIN STEPS
MULTILIN P30 PHASOR DATA CONCENTRATOR – INSTRUCTION MANUAL 9–11
Data Tags
Multilin P30 Historian Statistic Tags
Measurement Naming Convention Example
Current Phasor Magnitude PMUBaseName “.” CHNAM “.” IM STATION_A.10.PHAI.IM
Current Phasor Angle PMUBaseName “.” CHNAM “.” IA STATION_A.10.PHAI.IA
Voltage Phasor Magnitude PMUBaseName “.” CHNAM “.” VM STATION_A.10.PHAV.VM
Voltage Phasor Angle PMUBaseName “.” CHNAM “.” VA STATION_A.10.PHAV.VA
Analog RMS PMUBaseName “.” CHNAM “.” AR STATION_A.10.PHM1.AR
Analog Instantaneous Value PMUBaseName “.” CHNAM “.” AI STATION_A.10.PHM2.AI
Digital Open PMUBaseName “.” CHNAM “.” DO STATION_A.10.BK1.DO
Digital Closed PMUBaseName “.” CHNAM “.” DC STATION_A.10.BK2.DC
Frequency PMUBaseName “.” FREQ STATION_A.10.FREQ
Rate of Change of Frequency PMUBaseName “.” DFREQ STATION_A.10.DFREQ
PMU Status PMUBaseName “.” STAT STATION_A.10.STAT
Trigger Bit PMUBaseName “.” TB STATION_A.10.DB
Measurement Naming Convention Example
Number of tag updates written to the Historian since the data collector service last started.
PDCBaseName.TotalSamples Written
PDC56.TotalSamplesWritten
Number of tag updates written to the Historian in the last ten seconds.
PDCBaseName.SamplesWritten LastTenSeconds
PDC56.SamplesWrittenLastTen Seconds
Size of the queue between the Concentrator and Historian.
PDCBaseName.CurrentQueueSize PDC56.CurrentQueueSize
Number of C37.118 data frames sent out of chronological order since the data collector service last started.
PDCBaseName.OutofOrderFrameCount
PDC56.OutofOrderFrameCount
Total number of C37.118 data frames processed by the Historian since the data collector service last started.
PDCBaseName.TotalDataFrames Processed
PDC56.TotalDataFrames Processed
Total number of bad C37.118 data frames since the data collector service last started.
PDCBaseName.BadFrameCount PDC56.BadFrameCount
Total number of C37.118 data frames discarded due to queue overrun since the data collector service last started.
PDCBaseName.DiscardedFrame Count
PDC56.DiscardedFrameCount
The number of milliseconds the current C37.118 data frame waited in the queue between the data collector service and the Historian.
PDCBaseName.WaitingTime PDC56.WaitingTime
Timestamp of the C37.118 data frame just processed.
PDCBaseName.CurrentData FrameTimestamp
PDC56.CurrentDataFrame Timestamp
Collector heartbeat since the data collector service last started.
PDCBaseName.Heartbeat PDC56.Heartbeat

9–12 MULTILIN P30 PHASOR DATA CONCENTRATOR – INSTRUCTION MANUAL
CONFIGURING HISTORIAN - THE MAIN STEPS CHAPTER 9: P30 HISTORIAN CONFIGURATION
Verify Multilin P30 Historian operation
1. Ensure that the Concentrator card is working properly.
2. On the Multilin P30 Historian desktop, double-click the Restart Collector Service icon.
3. From the Multilin P30 Historian desktop, click Start, point to All Programs followed by Proficy Historian 4.5, and then select Historian Administrator. The Proficy Historian Administrator window appears.
4. Near the top of the window, verify that the Receive Rate is reflecting positive activity.
5. Close the Proficy Historian Administrator window.
6. Log off from the communications connection.
Configure P30 Historian settings
NOTE
NOTE: The clock on the Multilin P30 must be within five minutes of the clock on the PC for EnerVista P30 Setup to communicate properly. See Section 6 - IRIG-B Commands for details on setting the clock.
1. From EnerVista P30 Setup , configure the Multilin P30 Historian Settings.
2. Complete the steps outlined under Verify Multilin P30 Historian Operation.
Range validation Path: Device > Settings > Historian > Range Validation
This screen allows configuration of Range Validation within the Multilin P30 Historian.
Figure 1: Typical Range Validation screen
Voltage Phasor Magnitude Enabled: Whether range-validation of phasor magnitude is enabled for voltage phasors.Voltage Phasor Magnitude Low: The lowest possible value of phasor magnitude (in Volts).Voltage Phasor Magnitude High: The highest possible value of phasor magnitude (in Volts).

CHAPTER 9: P30 HISTORIAN CONFIGURATION CONFIGURING HISTORIAN - THE MAIN STEPS
MULTILIN P30 PHASOR DATA CONCENTRATOR – INSTRUCTION MANUAL 9–13
Current Phasor Magnitude Enabled: Whether range-validation of phasor magnitude is enabled for current phasors.Current Phasor Magnitude Low: The lowest possible value of phasor magnitude (in Amperes).Curent Phasor Magnitude High: The highest possible value of phasor magnitude (in Amperes).Phasor Angle Enabled: Whether range-validation of phasor angle is enabled.Phasor Angle Low: The lowest possible value of phasor angle (in Radians).Phasor Angle High: The highest possible value of phasor angle (in Radians).Analog Enabled: Whether range-validation of phasor analog channels is enabled.Analog Low: The lowest possible value of analog channel.Analog High: The highest possible value of analog channel.Frequency Enabled: Whether range-validation of frequency field of PMU data blocks is enabled.Frequency Low: The lowest possible value of frequency field of PMU data blocks.Frequency High: The highest possible value of frequency field of PMU data blocks.Frequency ROC Enabled: Whether range-validation of DFREQ field of PMU data blocks is enabled.Frequency ROC Low: The lowest possible value of DFREQ field of PMU data blocks.Frequency ROC High: The highest possible value of DFREQ field of PMU data blocks.
Compression Path: Device > Settings > Historian > Compression
This screen allows configuration of Compression within the Multilin P30 Historian.Historian compression allows the user to store the synchrophasor data only if there is change in value. This results in a longer overall period for data storage in the Historian, as compared with the shorter period offered using continuous storage. Compression can be set to True/False (i.e. Enabled/Disabled respectively) for each data type coming from the synchrophasor data frame. If compression is enabled, the deadband for the compression should be provided. A sample is compressed away if its value does not deviate from the previous value by this deadband. Zero is a valid value for the deadband.
Figure 2: Typical Compression screen

9–14 MULTILIN P30 PHASOR DATA CONCENTRATOR – INSTRUCTION MANUAL
CONFIGURING HISTORIAN - THE MAIN STEPS CHAPTER 9: P30 HISTORIAN CONFIGURATION
Voltage Phasor Magnitude Enabled: Whether the Historian compresses phasor magnitudes.Voltage Phasor Magnitude Deadband: If compression is enabled, the deadband for the compression.Current Phasor Magnitude Enabled: Whether the Historian compresses phasor magnitudes.Current Phasor Magnitude Deadband: If compression is enabled, the deadband for the compression.Phasor Angle Enabled: Whether the Historian compresses phasor angles.Phasor Angle Deadband: If compression is enabled, the deadband for the compression.Analog Enabled: Whether the Historian compresses analog channels.Analog Deadband: If compression is enabled, the deadband for the compression.Unsigned Fixed Point Analog Values: If analog channels are in fixed point format, whether to interpret the two bytes as a signed or unsigned integer before applying the scaling factor.Digital Enabled: Whether the Historian compresses digital channels.STATWord Enabled: Whether the Historian compresses stat words.Frequency Enabled: Whether the Historian compresses frequencies.Frequency Deadband: If compression is enabled, the deadband for the compression.Frequency ROC Enabled: Whether the Historian compresses DFREQ values.Frequency ROC Deadband: If compression is enabled, the deadband for the compression.Bad Quality Sample Enabled: Whether the Historian compresses bad quality samples.
Factory settings Path: Device > Settings > Historian > Factory Settings
The Factory Settings screen contains settings that should only be changed by the GE Digital Energy support team. The settings are provided for special scenarios where the standard configuration is not appropriate.
P30 Historian commandsThe following section describes the aspects of an installed Historian Processor Card that can be affected by the EnerVista P30 Setup software.These features will be required to perform routine maintenance on the Historian card, and to gain access to the Embedded Windows XP desktop, should users wish to access the Historian software directly.

CHAPTER 9: P30 HISTORIAN CONFIGURATION CONFIGURING HISTORIAN - THE MAIN STEPS
MULTILIN P30 PHASOR DATA CONCENTRATOR – INSTRUCTION MANUAL 9–15
PATH: Device > Commands > Historian
To view the network configuration of the Historian console port, the user must first issue the Read Network Configuration command. This will populate the IP Assignment, IP Subnet Mask, and Gateway IP Address fields. IP Assignment: Indicates whether the Historian console port is using Static or DHCP IP assignment.IP Address: The IP of the Historian console port.IP Subnet Mask: The subnet mask of the Historian console port.Gateway IP Address: The IP of the gateway used by the Historian console port.Read Network Configuration: Press the Read button to send a command to retrieve the network configuration. To change the network configuration of the Historian console port, the user must first enter the IP Assignment, IP Address, IP Subnet Mask and Gateway IP Address fields. Once complete, use the “Set Network Configuration” command to immediately update the Historian console port network configuration.IP Assignment: Indicates whether the Historian console port is using Static or DHCP IP assignment.IP Address: The IP of the Historian console port.IP Subnet Mask: The subnet mask of the Historian console port.Gateway IP Address: The IP of the gateway used by the Historian console port.Set Network Configuration: Press the Set button to send a command to immediately apply the above network configuration.RDP Session Timeout: The number of seconds to allow new “Remote Desktop” connections.Enable Remote Desktop: Allow “Windows Remote Desktop Connection” to access the Historian.Disable Remote Desktop: Stop “Windows Remote Desktop Connection” from accessing the Historian.Recreate Archive Files: Deletes all archive files. This should be used if the archive files have been damaged (from a power failure, etc.) and are beyond repair. Use caution with this command, as it will delete archived data.

9–16 MULTILIN P30 PHASOR DATA CONCENTRATOR – INSTRUCTION MANUAL
CONFIGURING HISTORIAN - THE MAIN STEPS CHAPTER 9: P30 HISTORIAN CONFIGURATION
Restart Historian: Restart the Historian application. This must be done to activate any Historian settings changes made with EnerVista P30 Setup.Stop Historian: Stop the Historian application.Start Historian: Start the Historian application.Restart Historian Card: Gracefully restart the Historian.Shut Down Historian Card: Gracefully power down the Historian. This should be done before disconnecting power from the Multilin P30.Start Computer Management Session: Reboots the Historian and automatically enables RDP for 15 minutes. Any changes made during this session will be retained after reboot. This would typically be used for computer management tasks, such as renaming the computer or joining a domain.

MULTILIN P30 PHASOR DATA CONCENTRATOR – INSTRUCTION MANUAL 10–1
Multilin P30
Chapter 10: P30 Historian operating considerations
GE Energy
P30 Historian operating considerations
P30 Historian storage requirements
Each sampled value for a Multilin P30 Historian tag requires a number of bytes for storage on a drive, which includes bytes for the value, timestamp, and quality field for each logged sample.Overall drive sizing requirements are a function of the following:
• Number of PMUs
• Number of phasor channels
• Number of analog channels
• Number of digital channels
• Data rate.
The table below summarizes the average byte count required to store one sample of the different PDC tag types.
Notice that depending on whether the incoming formats (as defined in the FORMAT field of a CFG-2 file) of phasor magnitudes, analogs, and frequencies are floating point or fixed point, sample values will be stored as float or scaled in Historian archives. Also notice that numbers of bytes per sample value listed above are average, since multiple sample values may share the storage of timestamps and/or quality and this sharing could be uneven.
Tag Type Data Type for Tag’s Sample Value Bytes
Phasor Magnitudes (Float/Scaled); Angles (Scaled) 14/12
Analog Float/Scaled 8/6
Digital Integer 6
Frequency Float/Scaled 8/6
Frequency Rate of Change Float/Scaled 8/6
PMU Status Word Integer 6
Trigger Bit Integer 6

10–2 MULTILIN P30 PHASOR DATA CONCENTRATOR – INSTRUCTION MANUAL
P30 HISTORIAN STORAGE REQUIREMENTS CHAPTER 10: P30 HISTORIAN OPERATING CONSIDERATIONS
The storage consumption rate Z (in bytes per second) is determined by the following equation, assuming archive compression is disabled and all continuous quantities are sent in floating point numbers:
or if compression for phasor channels, analog channels, and frequencies are disabled, and CmpRatioD is the same as DATA_RATE:
The formula to determine storage space in units of bytes is,X = Z x DATA_RETENTION x 86400Where DATA_RETENTION is the number of days retained in the PDC. The reader should note that in addition to X bytes, there needs to be some more space required on the Data Storage Card to account for other overhead, such as log files, buffer files, configuration files, etc., up to about 10 GB.

CHAPTER 10: P30 HISTORIAN OPERATING CONSIDERATIONS P30 HISTORIAN CARD POWER CYCLING
MULTILIN P30 PHASOR DATA CONCENTRATOR – INSTRUCTION MANUAL 10–3
P30 Historian card power cycling
Non-programmatic shut-down of the Multilin P30 Historian card, including by way of power loss, may result in corruption of the two most recently created data archive files. In such an instance, these two archive files are “parked” to prevent undesirable outcomes related to data corruption, and two new empty archive files are created in place of the parked files, to be populated in sequence after the Multilin P30 Historian card is restarted.
NOTE
NOTE: Only two archive files can be parked at any given time. For example, after two successive non-programmatic shut-down events, only the two latest archive files will be parked, and the prior two parked archive files will be deleted. Frequent successive parking operations will result in additional data loss.
One symptom of non-programmatic shut-down is a gap in data in Trend Chart objects. To determine whether a non-programmatic shut-down of the Multilin P30 Historian card has occurred, take the following steps:
1. By way of EnerVista P30 Setup , enable RDP for the given Multilin P30 .Historian
2. Remote Desktop into the Multilin P30.
3. Navigate to F:\Proficy Historian Data\Archives\Parked, then proceed as applicable:
– If the Parked folder does not contain files, non-programmatic shut-down has not occurred, and no further action is required on your part.
OR
– If the Parked folder does contain files, non-programmatic shut-down has occurred at some point. Proceed to step 4.
4. Compare the Date Modified value for the archive files against the gap in Trend Chart data and, if the time frames coincide and you need to recover the data, contact GE Technical Support.

10–4 MULTILIN P30 PHASOR DATA CONCENTRATOR – INSTRUCTION MANUAL
OPERATIONAL LOG FILES CHAPTER 10: P30 HISTORIAN OPERATING CONSIDERATIONS
Operational log files
Several log files provide information on operation of the ESV application, as follows:
NOTE
NOTE: When contacting GE technical support you may be asked to retrieve the contents of some or all of these files.
• DataArchiver-##.txt: This file logs statistics and errors related to operation of the Multilin P30 Historian.
• Collector.watchdog.#.log: This file logs activity of the Multilin P30 Collector’s watchdog, which monitors the Collector and Historian Archiver to ensure that both are running, attempts to restart them if this is not the case, and restarts the system if the restart attempt fails.
• Collector.#.log: This file logs activity of the Multilin P30 Historian Collector, specifically failure of the Collector to connect to Historian; location that the Collector’s configuration file is loaded from; and shut-down of the Collector.
• Stats.#.log: This file logs statistics, including explanations, related to operation of the Multilin P30 Collector.

CHAPTER 10: P30 HISTORIAN OPERATING CONSIDERATIONS DATA VALIDITY INDICATION WITHIN ESV
MULTILIN P30 PHASOR DATA CONCENTRATOR – INSTRUCTION MANUAL 10–5
Data validity indication within ESV
Each Multilin P30 Historian tag sample includes a quality field. This field is used by the ESV application to determine the validity of a tag’s sampled value for the time requested and, if necessary, adjust visualization to indicate when values are invalid or unknown. For details, see Multilin P30 Historian Tag Quality in Chapter 12.

10–6 MULTILIN P30 PHASOR DATA CONCENTRATOR – INSTRUCTION MANUAL
DATA VALIDITY INDICATION WITHIN ESV CHAPTER 10: P30 HISTORIAN OPERATING CONSIDERATIONS

MULTILIN P30 PHASOR DATA CONCENTRATOR – INSTRUCTION MANUAL 11–1
Multilin P30
Chapter 11: P30 Historian Maintenance
GE Energy
P30 Historian Maintenance
Upgrading P30 Historian firmware
To upgrade the Multilin P30 Historian firmware, follow the procedures listed in this section. Upon successful completion of this procedure, the Multilin P30 will have new Historian firmware installed with the factory default setpoints.The latest firmware files are available from the GE Digital Energy website at http:// www.gedigitalenergy.com.
NOTE
NOTE: The user should save the Historian files to an offline settings file so that they may be restored after the upgrade has completed.

11–2 MULTILIN P30 PHASOR DATA CONCENTRATOR – INSTRUCTION MANUAL
UPGRADING P30 HISTORIAN FIRMWARE CHAPTER 11: P30 HISTORIAN MAINTENANCE
Process for Upgrading P30 Historian Firmware1. Ensure that all firmware files (PDCUpdate.xml and any *.wim files) are in a single
folder..

CHAPTER 11: P30 HISTORIAN MAINTENANCE UPGRADING P30 HISTORIAN FIRMWARE
MULTILIN P30 PHASOR DATA CONCENTRATOR – INSTRUCTION MANUAL 11–3
2. In EnerVista P30 Setup, go to Maintenance > Update firmware.

11–4 MULTILIN P30 PHASOR DATA CONCENTRATOR – INSTRUCTION MANUAL
UPGRADING P30 HISTORIAN FIRMWARE CHAPTER 11: P30 HISTORIAN MAINTENANCE
3. Select “Historian Image files (*.xml)” from “Files of type:” then select PDCUpdate.xml.

CHAPTER 11: P30 HISTORIAN MAINTENANCE UPGRADING P30 HISTORIAN FIRMWARE
MULTILIN P30 PHASOR DATA CONCENTRATOR – INSTRUCTION MANUAL 11–5
4. Historian firmware files can include the Historian Application, the Historian Operating System, or both. Select what you would like to upgrade. EnerVista P30 Setup will restrict allowable updates based on the current version of the Historian and the new firmware files.

11–6 MULTILIN P30 PHASOR DATA CONCENTRATOR – INSTRUCTION MANUAL
UPGRADING P30 HISTORIAN FIRMWARE CHAPTER 11: P30 HISTORIAN MAINTENANCE
5. The image is now being uploaded to the Historian.

CHAPTER 11: P30 HISTORIAN MAINTENANCE UPGRADING P30 HISTORIAN FIRMWARE
MULTILIN P30 PHASOR DATA CONCENTRATOR – INSTRUCTION MANUAL 11–7
6. The image is now successfully restored. Please wait for 20 minutes. If the Historian Operating System was NOT updated, you may go ahead and use the device.
7. If the Historian Operating System WAS updated, after 20 minutes login to the console and issue the SetHistorianIP command with the appropriate parameters. For example: SetHistorianIP “3.94.248.121 netmask 255.255.255.0 gateway 3.94.248.1”

11–8 MULTILIN P30 PHASOR DATA CONCENTRATOR – INSTRUCTION MANUAL
RETRIEVE HISTORIAN LOG FILES CHAPTER 11: P30 HISTORIAN MAINTENANCE
Retrieve Historian log files
Clicking the “Retrieve Log Files” button will save all Historian Log Files to the selected location.

MULTILIN P30 PHASOR DATA CONCENTRATOR – INSTRUCTION MANUAL 12–1
Multilin P30
Chapter 12: EnerVista Synchrophasor Viewer (ESV)
GE Energy
EnerVista Synchrophasor Viewer (ESV)
REQUIRED HISTORIAN VERSIONThe EnerVista Synchrophasor Viewer (ESV) application requires Historian version 4.5. This is the version of Historian client tools that is included as part of the ESV setup package.HARDWARE LICENSE KEY NOTESA hardware license key is required in order to run the ESV application. Typically, you install the key as the first step in running the ESV installation. If you are using Windows Server 2008 R2, note that you first must download and install a HASP driver from Aladdin Knowledge Systems, Inc. (http://www3.safenetinc.com/support/hasp/enduser.aspx) in order for the key to be recognized. For further information on using the hardware license key, see the corresponding topic in the ESV electronic help.
EnerVista Synchrophasor Viewer System Requirements
HARDWARE REQUIREMENTSThe minimum EnerVista Synchrophasor Viewer hardware requirements are:
• Pentium 4–based 3-GHz CPU
• 2 GB RAM
• 4 GB free hard disk space
• CD-ROM Drive
• NETBIOS-compatible or TCP/IP-compatible network interface adapter
• Ethernet adapter
• Additional ports for I/O hardware
• SVGA or better color graphics monitor, 24-bit graphics card capable of 800x600 resolution and at least 65,535 colors
• Two-button mouse or compatible pointing device (such as a touch screen)
SOFTWARE REQUIREMENTSThis section describes the minimum software requirements for the ESV application, including the operating system.

12–2 MULTILIN P30 PHASOR DATA CONCENTRATOR – INSTRUCTION MANUAL
ENERVISTA SYNCHROPHASOR VIEWER SYSTEM REQUIREMENTS CHAPTER 12: ENERVISTA SYNCHROPHASOR VIEWER (ESV)
Supported Operating Systems:Any of the following operating systems, with specified service packs or revisions, fulfill the operating system minimum requirements:
• Microsoft Windows 7, Professional (x86 and x64)
• Microsoft Windows 7, Enterprise (x86 and x64)
• Microsoft Windows 7, Ultimate (x86 and x64)
• Windows XP, Professional, SP3 (x86)
Additional Required Software:
• Microsoft .NET Framework 4.0 SP1
NOTE
NOTE: This version is included as part of the ESV setup package and will be installed automatically, if necessary.
• Proficy CIMPLICITY 8.2
NOTE
NOTE: A supported version of Proficy CIMPLICITY is included as part of the ESV setup package and will be installed automatically if Proficy CIMPLICITY is not already installed. For information on how the ESV installation manages pre-existence of Proficy CIMPLICITY, refer to the Release Notes tab and, specifically, Installing the Application, below.
• Proficy Historian 4.5
NOTE
NOTE: This version of Historian client tools is included as part of the ESV setup package.
• Microsoft Excel 2003, 2007, or 2010
NOTE
NOTE: Excel is required for exporting Multilin P30 Historian data to spreadsheet format, but is not required for core functionality of the ESV application.

CHAPTER 12: ENERVISTA SYNCHROPHASOR VIEWER (ESV) INSTALLING THE ESV APPLICATION
MULTILIN P30 PHASOR DATA CONCENTRATOR – INSTRUCTION MANUAL 12–3
Installing the ESV application
Take the following steps to install the ESV application.
1. Insert the hardware license key in the computer's USB port.
NOTE
NOTE: Connection of the key by way of an external USB hub is not supported. A message box appears, informing you that the device driver software is being installed, followed a short time later by a second message box, informing you that the device is ready to use.
NOTE
NOTE: If you are using Windows Server 2008 R2, you first must download and install a HASP driver from Aladin Knowledge Systems, Ltd. in order for the key to be recognized.
NOTE
NOTE: The license takes effect after the restart at the end of the installation process.
2. Insert the EnerVista Synchrophasor Viewer installation DVD into the computer's CD-ROM/DVD drive.
3. In the root of the ESV installation DVD, double-click InstallFrontEnd.exe. The EnerVista Synchrophasor Viewer Installation page appears.
4. Click EnerVista Synchrophasor Viewer Install. A page prompting you to designate the desired installation location appears.
NOTE
NOTE: The default of C:\Program Files\Proficy is the recommended location.
NOTE
NOTE: If a non-supported version of Proficy CIMPLICITY pre-exists on the computer, a dialog box prompting you to uninstall the program appears in place of the installation location dialog box. In this case, the installation terminates upon closure of the dialog box, after which you must remove the pre-existing version before recommencing the ESV installation. If a supported version of Proficy CIMPLICITY pre-exists on the computer, a dialog box appears prompting you to indicate whether you want to continue using that version. In this case, either select No to quit the installation and uninstall the pre-existing version of CIMPLICITY manually before recommencing the ESV installation, or select Yes to continue using the pre-existing version.
5. After confirming the installation location, click OK. A progress bar indicating installation procession of Proficy CIMPLICITY and any other supporting components, as required, appears, after which the Proficy Historian Setup page appears.
NOTE
NOTE: It can take up to 10 minutes for the Proficy Historian Setup page to appear. Proficy Historian setup on the ESV node is required to install client tools that allow ESV to connect and communicate with Multilin P30 Historians residing in your application.
6. Click Next to begin the Proficy Historian setup.
7. Leave the default feature selections unchanged, then click Next.
8. Leave the default directory unchanged, then click Next. A dialog box appears, prompting you to enter the name of the Historian Server to be used as the default for Excel Add-in.
9. Enter default, then click Next.
10. Click Next. A progress bar appears, indicating procession of the Proficy Historian installation, then the “Finish” page appears.
12–4 MULTILIN P30 PHASOR DATA CONCENTRATOR – INSTRUCTION MANUAL
INSTALLING THE ESV APPLICATION CHAPTER 12: ENERVISTA SYNCHROPHASOR VIEWER (ESV)
11. Click Finish. A progress bar appears, indicating installation procession of other Proficy support components, after which the Proficy Historian SIM 1 Setup page appears.
12. Click Next.
13. Click Yes, to accept the terms of the License Agreement.
14. Click Next. A progress bar appears, indicating procession of the Proficy Historian SIM 1 installation, then the “EnerVista Synchrophasor Viewer Setup” page appears.
15. Select, “I accept the terms of the License Agreement,” then click Install. A progress bar appears, indicating procession of the ESV installation, then the “Finish” page appears.
16. Click Finish. A dialog box prompting you to indicate whether you want to restart the computer appears.
17. Click Yes. After restarting the computer, you can start using the ESV software, assuming you have already configured the Multilin P30 Historian as outlined in Chapter 8 of this Instruction Manual.

CHAPTER 12: ENERVISTA SYNCHROPHASOR VIEWER (ESV) USING THE ESV APPLICATION
MULTILIN P30 PHASOR DATA CONCENTRATOR – INSTRUCTION MANUAL 12–5
Using the ESV application
PREREQUISITES FOR APPLICATION USEBefore you can use the EnerVista Synchrophasor Viewer (ESV) application to visualize power transmission line data, you must establish connection between the application and the Multilin P30 Historian(s) containing the data in question. For instructions on establishing connection between the ESV application and Multilin P30 Historians, see Visualization Preparation in the ESV electronic help.
P30 HISTORIAN DATA EXPORT TO EXCELYou can export data from Multilin P30 Historian archives to a spreadsheet worksheet by way of a Microsoft Excel add-in provided as part of the ESV installation package.Add-in Installation InstructionsAssuming Excel is resident on the computer at the time of ESV installation, the Historian add-in for Excel is automatically installed as part of running ESV setup. If Excel is installed subsequent to ESV installation, you must manually install the add-in, as follows:
1. On the root of the ESV installation DVD, navigate to the following location: Install\Setup\Historian45\ClientTools.
2. Double-click setup.exe.
3. In the dialog displaying the list of installed components, select the check box for the Excel add-in, then follow the displayed instructions to complete the installation.
Add-in Activation InstructionsBefore using the add-in to export data from Multilin P30 Historian archives, you must activate it . This process differs depending on the version of Excel. This section provides a separate set of instructions for each supported version of Excel.Microsoft Excel 2010
1. Open a new Excel 2010 worksheet.
2. Click the File tab, click Options, then click the Add-Ins category.
3. In the “Manage” box, click Excel Add-ins, then click Go. The “Add-Ins” dialog box appears.
4. From the “Add-Ins available” box, select “Historian Add-In”.
TIP
TIP: If the Historian Add-In is not listed, click the Browse button to locate the Historian.xla file (typically located in C:\Program Files\Proficy\Proficy Historian).
5. Click OK. The Historian menu is added to the Excel toolbar, and the add-in is ready to use.
NOTE
NOTE: If you uninstall Historian after installing the Excel add-in as described, ensure that you clear the “Historian” check box in the “Excel Add-Ins” dialog. If you do not clear this option, you will receive an error each time you open Excel.
Microsoft Excel 2007
1. Open a new Excel 2007 worksheet.
2. Click the Microsoft Office button, then click Excel Options.
3. Click the Add-Ins category.
4. In the “Manage” box, click Excel Add-ins, then click Go. The “Add-Ins” dialog box appears.
5. From the “Add-Ins available” box, select “Historian Add-In”.
12–6 MULTILIN P30 PHASOR DATA CONCENTRATOR – INSTRUCTION MANUAL
USING THE ESV APPLICATION CHAPTER 12: ENERVISTA SYNCHROPHASOR VIEWER (ESV)
TIP
TIP: If the Historian Add-In is not listed, click the Browse button to locate the Historian.xla file (typically located in C:\Program Files\Proficy\Proficy Historian).
6. Click OK. The Historian menu is added to the Excel toolbar, and the add-in is ready to use.
NOTE
NOTE: If you uninstall Historian after installing the Excel add-in as described, ensure that you clear the “Historian” check box in the “Excel Add-Ins” dialog. If you do not clear this option, you will receive an error each time you open Excel.
Microsoft Excel 2003
1. Open a new worksheet.
2. From the “Tools” menu, select “Add-Ins”.
3. In the “Manage” box, click Excel Add-ins, then click Go. The “Add-Ins” dialog box appears.
4. Select “Historian Add-In”.
TIP
TIP: If the Historian Add-In is not listed, click the Browse button to locate the Historian.xla file (typically located in C:\Program Files\Proficy\Proficy Historian).
5. Click OK. The Historian menu is added to the Excel toolbar, and the add-in is ready to use.
NOTE
NOTE: If you uninstall Historian after installing the Excel add-in as described, ensure that you clear the “Historian” check box in the “Excel Add-Ins” dialog. If you do not clear this option, you will receive an error each time you open Excel.
USING ADD-INFor detailed instructions on using the Excel add-in, please see the Historian electronic help, accessed by way of Start > All Programs (or Programs, depending on the operating system) > Proficy Historian 4.5 > Historian Electronic Book.Following are some general notes on using the Historian add-in for Excel:
• This add-in should NOT be used to import data to the Multilin P30 Historian archives from Excel.
• In using the add-in to retrieve data from Historian archives for use in an Excel spreadsheet, you must specify the tag(s) that you want to retrieve data for. You can either manually specify tags when building data-retrieval queries, or programmatically locate and select one or more tags for extraction from Historian to a spreadsheet prior to building data-retrieval queries. In the latter case, you can then specify tags for data-retrieval queries by selecting the desired tags on the spreadsheet itself. For instructions on retrieving tags for this purpose, please see Searching Tags in the Using the Historian Excel Add-in section of the Historian electronic help.
• The Historian add-in for Excel allows you to build the following types of data-retrieval queries:
– Raw Data: Retrieves values after application of collector and archive compression, but before application of any interpolation, smoothing, or other signal-processing calculations. Raw-data queries can be executed against only one tag at a time.
– Calculated Data: Retrieves data resulting from user-specified calculations on raw data values in archives. Calculated-data queries can be executed against one or more tags at a time.
– Current Values: Retrieves the most recently updated value. Current-data queries can be executed against one or more tags at a time.

CHAPTER 12: ENERVISTA SYNCHROPHASOR VIEWER (ESV) USING THE ESV APPLICATION
MULTILIN P30 PHASOR DATA CONCENTRATOR – INSTRUCTION MANUAL 12–7
NOTE
NOTE: If you execute a calculated-data or current-value retrieval query while multiple worksheets are open, the Excel add-in may become unstable and lock up. This is a known Excel issue. To prevent Excel lockup while executing queries by way of the Excel Add-in, work with only one Excel document open at a time.
NOTE
NOTE: Filtered-data retrieval queries are not supported at this time.
• As part of building data-retrieval queries using the Historian add-in for Excel, you must specify the worksheet area that the data should be exported to. If you specify too few cells to contain the data, only the amount of data that can fit in the designated area is retrieved. Conversely, if you specify too many cells, all data is retrieved, but any "blank" cells within the overall designated area are rendered unavailable for population purposes going forward, unless you select the cells and execute the delete command.
NOTE
NOTE: If you are retrieving either raw or calculated data, you can avoid having to designate destination cells in the active spreadsheet by exporting rather than querying data. When you do so, data is exported to a new worksheet .csv file, or an .xml file, and the data is automatically deposited at the "top" of the file. For related instructions, please see Exporting Data in the Using the Historian Excel Add-in section of the Historian electronic help.
• In 32-bit environments, the maximum number of rows returned by the add-in is 32,767; in 64-bit environments, this limitation does not apply.
SYSTEM SPECIFICATIONS AND LIMITATIONSEach Multilin P30 Historian can connect to multiple PMUs; each installation of ESV can access up to 16 Historians simultaneously; and each Historian can be accessed by up to seven ESV users at once.By default, ESV retrieves data from the Multilin P30 Historian for display in visualization objects once per second. You can adjust this setting to be as short as 0.25 seconds or as long as 10 seconds. (For instructions, see the topic on changing worksheet refresh rate in the ESV electronic help.) If the data in the PDC Historian has not been updated within the specified time frame, ESV will display the most current data available, with a maximum latency of 10 seconds.The optimal screen resolution for visualization objects is 1440 x 900 pixels.All Multilin P30 Historian timestamps are based on Coordinated Universal Time (UTC). The ESV application displays timestamps based on the time zone setting of the local node being used to visualize data, adjusting for daylight savings time as necessary.
WORK ENVIRONMENTThe worksheet is the foundation of the ESV work environment. Similar in concept to a canvas, a ESV worksheet can contain one or multiple visualization objects. The first time you start ESV, the application opens a blank worksheet ready to be populated with visualization objects. Whenever you navigate away from a worksheet, the application automatically saves the worksheet as currently populated and configured. Back and forward buttons in the ESV toolbar allow for navigation between worksheets accessed during a given session.When you close ESV, the application saves the worksheet that was active at the time of closure and earmarks that worksheet as the one to be displayed when the application is next started.The maximum number of objects that can be created per worksheet is a function of the amount of data being visualized overall and the hardware limitations of the user's computer.

12–8 MULTILIN P30 PHASOR DATA CONCENTRATOR – INSTRUCTION MANUAL
USING THE ESV APPLICATION CHAPTER 12: ENERVISTA SYNCHROPHASOR VIEWER (ESV)
REMOVING THE APPLICATIONTake the following steps to uninstall the ESV application:
1. From the Start menu, open the Control Panel, then select “Add or Remove Programs” (or Programs followed by Programs and Features, depending on the operating system).
2. Remove the following programs in the order indicated:
– EnerVista Synchrophasor Viewer install
– Proficy Change Management Client API
– Proficy Driver Server
– Proficy HMI/SCADA - CIMPLICITY
– Proficy Historian
NOTE
NOTE: Do NOT uninstall Proficy Keyless License unless instructed to do so. Also, in the event that an uninstall process fails, restart the computer and retry WITHOUT opening the ESV application.
3. After all programs have been removed, restart the computer to complete the removal of all ESV-related components.
NOTE
NOTE: Existing worksheets are not removed as part of uninstalling the ESV application. If you subsequently re-install the application to a different location, however, the ESV will not be able to locate pre-existing worksheets unless you move them from the original to the new installation directory. If you install a newer version of the application, note that worksheets created in earlier versions may not be compatible.
ESV ELECTRONIC HELPThere are two ways to access the ESV electronic help:
• Interface Icon: Click the “?” icon within the program interface components.
• Program Group: From the Start menu, point to (All) Programs, then EnerVista Synchrophasor Viewer Install, then click EnerVista Synchrophasor Viewer Help.
There are several ways to use the help:
• Table of Contents: The table of contents is organized into books and pages. Double-click a book to expand it and display the books and pages nested below it. Click a page to display the corresponding topic.
• Index: To access the online help index, click the Index tab in the left-hand pane. In the ESV help index, you can search for topics by keyword. Type a keyword in the box, or select one from the list . When you find the topic that you want, double-click it to display that topic. If more than one topic applies to the keyword, the Topics Found dialog box appears listing all topics that apply to that keyword.
• Full-text Search: To access the online help full-text search, click the Search tab in the left-hand pane. Use the Search tab to perform full-text searches in the help. If your search results include too many results, you can enter additional terms to narrow down the list. Click the “right arrow” button to add boolean terms to your search expression, such as AND, OR, NEAR, and NOT. If you want to search for a specific phrase, enclose the phrase in quotation marks.

CHAPTER 12: ENERVISTA SYNCHROPHASOR VIEWER (ESV) USING THE ESV APPLICATION
MULTILIN P30 PHASOR DATA CONCENTRATOR – INSTRUCTION MANUAL 12–9
Visualization preparation
Visualizationpreparation overview
Power transmission line data acquired by Phasor Measurement Units (PMUs) installed at substations can be visualized using the EnerVista Synchrophasor Viewer (ESV). This data is time-synchronized to the microsecond based on GPS clocks. The data is then collected, filtered, and time-aligned by a Phasor Data Concentrator (PDC), which then streams the data to a Historian data collector that stores the data in a Historian repository. Before you can use PVP to visualize power transmission line data, you must first establish a connection to the Historian(s) containing the data in question.
P30 Historian tagquality
Each Multilin P30 Historian tag sample has a timestamp, value, and quality field. Client applications that use Historian data, such as the EnerVista Synchrophasor Viewer (ESV), use the quality field to determine the validity of a tag’s sampled value for the time requested.If a Historian tag sample being visualized in a PVP object is of either bad or unknown quality, the text value displayed for the sample is either ####, ****, or ????, and the graphical indicator either disappears (in the case of a Trend Chart object) or turns black. This is also the case if the connection between the PVP application and a Multilin P30 Historian is lost, under which circumstance an additional indicator in the form of a red banner reading No Connection is displayed diagonally across any affected Multilin P30 Historian Statistics objects.The quality of a Historian tag sample is considered bad or unknown under the following conditions:
• The sample's value falls outside a user-configurable range.
• The time quality value in bits 8 through 6 of the STAT word for the PMU that originated the data frame encompassing the sample equals 011, 100, 101, 110, or 111 (binary).
• Bit 14 or 15 in the PMU STAT word for the PMU that originated the sample equals True.
• The Historian card loses communication with the Data Concentrator that would have streamed the sample.
• A transmission error such as a failed CRC check is detected in the data frame containing the sample.
To connect toHistorians
Before you can use the EnerVista Synchrophasor Viewer (ESV) to visualize synchrophasor and other measurements, you must establish connection between the ESV and the Historian(s) containing the data. To do so, take the following steps:
1. On the main ESV toolbar, click Configure PDC Historians. The “Cimplicity Options” dialog box appears.
2. Click the Historian Connections tab.
3. Click Add. The “Add Historian Connection” dialog box appears.
4. Complete the following:
– In the “Connection Name” field, enter an identifying name of your choice for the Historian.
NOTE
NOTE: Certain characters are prohibited. For details, consult Illegal Characters for Historian Connection Name, below.
– In the “Server Name” field, enter the node name or IP address for the Historian.
NOTE
NOTE: The node name is preferred.
– Set the “Specify Username/Password” option based on your organization's security policy:

12–10 MULTILIN P30 PHASOR DATA CONCENTRATOR – INSTRUCTION MANUAL
USING THE ESV APPLICATION CHAPTER 12: ENERVISTA SYNCHROPHASOR VIEWER (ESV)
– **Click Test. Assuming all information you entered is correct, a dialog box appears, confirming that the connection is ready.
– Click OK. The confirmation dialog box closes.
– Click OK. The “Add Historian Connection” dialog box closes.
5. For each Historian to which you want to connect, repeat steps 3 and 4.
6. When you have connected to all desired Historians, click OK to close the “Cimplicity Options” dialog box.
ILLEGAL CHARACTERS FOR HISTORIAN CONNECTION NAMEWhen specifying a connection name as part of connecting to Historian(s) for use with the EnerVista Synchrophasor Viewer (ESV), the following characters are prohibited:
If your organization's security policy allows for local password storage:
If your organization's security policy does not allow for local password storage:
1. Enable the option by selecting the corresponding check box.
2. Type your Username [preceded by the appropriate domain name followed by a backslash (that is, DomainName\UserName), if applicable to your environment] and Password in the corresponding fields.
Proceed to step ** below.

CHAPTER 12: ENERVISTA SYNCHROPHASOR VIEWER (ESV) USING THE ESV APPLICATION
MULTILIN P30 PHASOR DATA CONCENTRATOR – INSTRUCTION MANUAL 12–11
ESV Worksheet management
NOTE
NOTE: For a general overview of the EnerVista Synchrophasor Viewer, including the Worksheet Management overview, please refer to Chapter 1 - Description of the Multilin P30 System > EnerVista Synchrophasor Viewer.
The worksheet is the foundation of the EnerVista Synchrophasor Viewer (ESV) work environment. Similar in concept to a canvas, an ESV worksheet can contain one or multiple visualization objects.
Character Description
NULL SOH STX ETX EOT ENQ ACK BEL BS HT LF VT FF CR SO SI DLE DC1 DC2 DC3 DC4 NAK SYN ETB CAN EM SUB ESC FS GS RS US SP “ $ & ‘ ( ) * + . / : < = > ? @ [ \ ] ^ { | } DEL
ASCII: 0; NULL ASCII: 1; Start of Heading ASCII: 2; Start of Text ASCII: 3; End of Text ASCII: 4; End of Transmit ASCII: 5; Enquiry ASCII: 6; Acknowledge ASCII: 7; Bell ASCII: 8; Back Space ASCII: 9; Horizontal Tab ASCII: 10; Line Feed ASCII: 11; Vertical Tab ASCII: 12; FORM FEED ASCII: 13; CARRIAGE RETURN ASCII: 14; SHIFT OUT ASCII: 15; SHIFT IN ASCII: 16; DATA LINE ESCAPE ASCII: 17; DEVICE CONTROL 1 ASCII: 18; DEVICE CONTROL 2 ASCII: 19; DEVICE CONTROL 3 ASCII: 20; DEVICE CONTROL 4 ASCII: 21; NEGATIVE ACKNOWLEDGE ASCII: 22; SYNCHRONOUS IDLE ASCII: 23; END OF TRANSMIT BLOCK ASCII: 24; CANCEL ASCII: 25; END OF MEDIUM ASCII: 26; SUBSTITUTE ASCII: 27; ESCAPE ASCII: 28; FILE SEPARATOR ASCII: 29; GROUP SEPARATOR ASCII: 30; RECORD SEPARATOR ASCII: 31; UNIT SEPARATOR ASCII: 32; SPACE ASCII: 34; DOUBLE QUOTATION MARK ASCII: 36; DOLLAR SIGN ASCII: 38; AMPERSAND ASCII: 39; APOSTROPHE OR SINGLE QUOTE ASCII: 40; LEFT PARENTHESIS ASCII: 41; RIGHT PARENTHESIS ASCII: 42; ASTERISK OR MULTIPLY ASCII: 43; PLUS SIGN ASCII: 46; PERIOD ASCII: 47; FORWARD SLASH ASCII: 58; COLON ASCII: 60; LESS THAN SIGN ASCII: 61; EQUAL SIGN ASCII: 62; GREATER THAN SIGN ASCII: 63; QUESTION MARK ASCII: 64; AT SIGN ASCII: 91; LEFT BRACKET ASCII: 92; BACKWARD SLASH ASCII: 93; RIGHT BRACKET ASCII: 94; CARET ASCII: 123; LEFT BRACE ASCII: 124; PIPE ASCII: 125; RIGHT BRACE ASCII:127; DELETE

12–12 MULTILIN P30 PHASOR DATA CONCENTRATOR – INSTRUCTION MANUAL
USING THE ESV APPLICATION CHAPTER 12: ENERVISTA SYNCHROPHASOR VIEWER (ESV)
Tasks related to worksheet management are performed primarily from the Worksheets panel, which provides controls for doing any of the following:
• Open a worksheet
• Create a worksheet
• Duplicate the currently displayed worksheet
• Rename the currently displayed worksheet
• Delete a worksheet
• Refresh list of available worksheets
The main application toolbar provides for performing the following additional worksheet-related tasks:
• Navigate between worksheets
• Save worksheetsCAUTION: After changing or deleting worksheet objects, there is no way to revert to previous
worksheet states. Therefore, if you think you might have future use for worksheet objects in their current states, you may want to consider duplicating the worksheet and changing object configuration on the worksheet copy, rather than doing so on the original worksheet.
TO CREATE A WORKSHEETTo create a new worksheet ready to be populated with visualization objects, take the following steps:
1. In a blank area of the displayed worksheet, right-click, point to Worksheets, and then select Create New. The Create New dialog box appears.
NOTE
NOTE: You can also access this dialog box by clicking the double-headed arrow on the Worksheets panel, and then clicking Create New.
2. Enter the desired name for the worksheet.
TIP
TIP: If you want to put the worksheet in a group other than the initial default group of PDC, preface the worksheet's name with the desired group name followed by a backslash (for example, My Group Name\My Worksheet Name). Subgroups are not supported.
3. Click OK. A new, blank worksheet appears.
NOTE
NOTE: The worksheet group and name are displayed in the main toolbar (see Main Window Overview).
TO OPEN A WORKSHEETIn the EnerVista Synchrophasor Viewer (ESV), one worksheet is always displayed, and only one worksheet can be displayed at a time. Whenever you open a worksheet, the previously displayed worksheet is automatically saved before the other worksheet appears.To open a worksheet, take the following steps:
1. Click the double-headed arrow on the Worksheets panel. The panel expands, displaying a list of all worksheets.
2. Click the worksheet that you want to open, then click Open.
TIP
TIP: If you do not see the worksheet in the list, click the plus-sign (+) beside the parent group to expand it and show all child worksheets.

CHAPTER 12: ENERVISTA SYNCHROPHASOR VIEWER (ESV) USING THE ESV APPLICATION
MULTILIN P30 PHASOR DATA CONCENTRATOR – INSTRUCTION MANUAL 12–13
NOTE
NOTE: You can also open a worksheet by double-clicking it in the list. The Worksheets panel collapses, the selected worksheet opens, and the objects on the worksheet refresh to reflect data for the Display Time.
NOTE
NOTE: If the worksheet contains visualization objects that draw data from Historians for which you have not saved your login credentials, one or more dialog boxes will appear, in which you must enter your User name [preceded by the appropriate domain name followed by a backslash (that is, DomainName\UserName), if applicable to your environment] and Password for the corresponding Historian, and then click OK, before proceeding with your work. If you choose to cancel this prompt, you will not be able to access data in the corresponding Historian until you either navigate away from the worksheet or close and then reopen the application.
TO DUPLICATE A WORKSHEETIf the currently displayed worksheet as configured with visualization objects would serve as a good basis for a new worksheet, you can duplicate the displayed worksheet by taking the following steps:
1. Open the worksheet that you want to use as the source for a new, duplicate worksheet.
2. In a blank area of the displayed worksheet, right-click, point to Worksheets, and then select Duplicate. The Duplicate dialog box appears.
NOTE
NOTE: You can also access this dialog box by clicking the double-headed arrow on the Worksheets panel, and then clicking Duplicate Current.
3. Enter the desired name for the new worksheet.
TIP
TIP: If you want to put the worksheet in a group other than the initial default group of Multilin P30 s, preface the worksheet's name with the desired group name followed by a backslash (for example, My Group Name\My Worksheet Name). Subgroups are not supported.
4. Click OK. The source worksheet is automatically saved, the Worksheets panel collapses, and then a new worksheet appears, reflecting the same visualization objects that were configured for the source worksheet.
NOTE
NOTE: The worksheet group and name are displayed in the main toolbar (see Main Window Overview).
TO NAVIGATE BETWEEN WORKSHEETSAfter you have viewed more than one worksheet during a given session, toolbar buttons provide for accessing worksheets previously viewed during the same session. To navigate between worksheets viewed during a given session, take the following steps.At any time after accessing more that one worksheet during a given session, proceed as applicable, depending on the desired direction of navigation:
• To navigate to the worksheet that was open immediately prior to the currently displayed worksheet:
Click Last Worksheet in the main toolbar.
NOTE
NOTE: The “Last Worksheet” button becomes active only after you have opened more than one worksheet in a given session.
The worksheet accessed immediately prior appears.
• To navigate to the worksheet that you most recently navigated away from by way of the Last Worksheet button:
Click Next Worksheet in the main toolbar.

12–14 MULTILIN P30 PHASOR DATA CONCENTRATOR – INSTRUCTION MANUAL
USING THE ESV APPLICATION CHAPTER 12: ENERVISTA SYNCHROPHASOR VIEWER (ESV)
NOTE
NOTE: The “Next Worksheet” button becomes active only after you have used the Last Worksheet button.
The worksheet accessed immediately prior appears.
NOTE
NOTE: If you delete or rename a worksheet accessed during the session and then use the Last Worksheet and/or Next Worksheet button to navigate between worksheets, a warning message will be displayed if the navigation reaches the point of the deleted or renamed worksheet.
NOTE
NOTE: If the worksheet contains visualization objects that draw data from Historians for which you have not saved your login credentials, one or more dialog boxes will appear, in which you must enter your User name [preceded by the appropriate domain name followed by a backslash (that is, DomainName\UserName), if applicable to your environment] and Password for the corresponding Historian, and then click OK, before proceeding with your work. If you choose to cancel this prompt, you will not be able to access data in the corresponding Historian until you either navigate away from the worksheet or close and then reopen the application.
TO RENAME A WORKSHEETYou can rename the currently displayed worksheet by taking the following steps:
1. In a blank area of the displayed worksheet, right-click, point to Worksheets, then select Rename. The “Rename” dialog box appears.
NOTE
NOTE: You can also access this dialog box by clicking the double-headed arrow on the Worksheets panel, then clicking Rename Current.
2. Enter the desired new name for the worksheet.
TIP
TIP: If you also want to put the renamed worksheet in a different group, preface the worksheet's name with the desired group name followed by a backslash (for example, My Group Name\My Worksheet Name). Subgroups are not supported.
3. Click OK. The worksheet is renamed, as reflected in the mail toolbar.
NOTE
NOTE: If the renamed worksheet was the only worksheet in a given group and you designated a new group for the worksheet, the worksheet's prior group is deleted.
NOTE
NOTE: If you rename a worksheet and then use the “Last Worksheet” and/or “Next Worksheet” toolbar buttons to navigate between worksheets opened in the same session, a warning message will be displayed if the navigation reaches the point of the renamed worksheet.
TO REFRESH THE WORKSHEET LISTAny time you create, rename, duplicate, or delete a worksheet within the EnerVista Synchrophasor Viewer (ESV), the list of available worksheets in the Worksheets panel automatically refreshes accordingly. You can also manually refresh the list at any time by taking the following steps.
1. Click the double-headed arrow on the Worksheets panel. The panel expands, displaying a list of all available worksheets organized by group.
2. Click Refresh. The worksheet list refreshes to display all available worksheets.
TO DELETE A WORKSHEETIf you no longer need a worksheet, you can delete it by taking the following steps:
1. Click the double-headed arrow on the Worksheets panel. The panel expands, displaying a list of all available worksheets.
2. Click the \worksheet that you want to delete.

CHAPTER 12: ENERVISTA SYNCHROPHASOR VIEWER (ESV) USING THE ESV APPLICATION
MULTILIN P30 PHASOR DATA CONCENTRATOR – INSTRUCTION MANUAL 12–15
TIP
TIP: If you do not see the worksheet in the list, click the plus-sign (+) beside the parent group to expand it and show all child worksheets.
3. Click Delete Selected. A dialog box appears, prompting you to confirm whether you want to complete the deletion process.
4. Click Yes. The dialog box closes, and the Worksheets panel collapses.
NOTE
NOTE: If you delete the currently displayed worksheet, the worksheet that was open immediately prior appears in place of the deleted worksheet.
NOTE
NOTE: If the deleted worksheet was the only worksheet in a given group, the group is also deleted.
NOTE
NOTE: If you delete a worksheet then use the “Last Worksheet” and/or “Next Worksheet” toolbar buttons to navigate between worksheets opened in the same session, a warning message will be displayed if the navigation reaches the point of the deleted worksheet.
Visualization object creation in ESVIn the EnerVista Synchrophasor Viewer (ESV), you can create the following visualization objects, alone or in combination, for display on a given worksheet:
• Phasor Display object
• Trend Chart object
• Multilin P30 Historian Statistics object
• PMU Status object
Regardless of the object being created, the basic process is the same, namely, generate the object itself then choose the data to be visualized in the object.
Phasor display objectcreation The image below highlights the main components of a Phasor Display object.
Phasor Display Object Description

12–16 MULTILIN P30 PHASOR DATA CONCENTRATOR – INSTRUCTION MANUAL
USING THE ESV APPLICATION CHAPTER 12: ENERVISTA SYNCHROPHASOR VIEWER (ESV)
To Create a Phasor Display Object:Assuming you have already established connection with the Historian(s) containing data for the synchrophasors you want to visualize, take the following steps to create a Phasor Display reflecting data for those synchrophasors.
1. On the main tool bar, click Add Phasor Display. The application populates the worksheet with a blank Phasor Display object.
2. Right click within the Phasor Display object, then select Select Phasors. The Select Phasors dialog box appears.
KEY COMPONENT DESCRIPTION
A Display Time In live mode (the default), the current system time; in historical playback mode, a moment in the past that progresses dynamically within a user-specified time period designated by way of the Dynamic Graphic Replay (DGR) control (see Historical Visualization Overview).
B Polar plot Circular dial containing up to 16 rotating hands, each of which indicates a given synchrophasor's magnitude (as reflected by length) along with either its absolute angle or its angle relative to another displayed synchrophasor.
C Angular scale Ring around the perimeter of the polar plot that indicates angle in either degrees or radians, based on user preference, and contains a triangular icon for each displayed synchrophasor to highlight the corresponding angle.
D Radial scales Two lines reaching outward from the center of the polar plot and indicating magnitude for either voltage synchrophasors [measured in kilovolts (kV)] or current synchrophasors [measured in amperes (Amps)]. NOTE: If the magnitude of a phasor exceeds the radial scale limits, a slowly blinking triangular icon is displayed at the terminal end of the corresponding hand in the polar plot, just beyond the smaller triangular icon highlighting the phasor's angle. For instructions on adjusting scaling, see To change polar plot radial scale.
E Rotate Plot Button for toggling the zero point of the polar plot to either the default position of 3 o’clock, for which the positive angular direction (and positive indicator rotation) is counter-clockwise, or 12 o’clock, for which the positive angular direction (and positive indicator rotation) is clockwise.
F Best Scaling Button for adjusting the polar plot radial scale limits to best encapsulate the synchrophasors currently displayed.
G Question mark icon Button for opening the application help file to the topic describing the Phasor Display object.
H Phasor table A grid listing the phasor name along with the angle, magnitude, and moving average of each displayed synchrophasor.
I Color designator In the phasor table, an oval indicator of the color currently assigned to the corresponding phasor as reflected in the polar plot.
J Ref. In the phasor table, a check box that when enabled, sets the phasor in the corresponding row as the reference point that all other displayed phasor angles are measured against.
K ∆ In the phasor table, a check box that when enabled for two synchrophasors, results in the display below the polar plot of a text value for the current angular difference between the two phasors as well as a corresponding arc and triangular indicators of the chosen synchrophasors around the outside of the plot.
L Deg./Rad. Button used to toggle the object's angular measurement unit between degrees and radians.
M Double-headed arrow
In the upper-right corner of the phasor table, a button used to toggle between hiding and showing the value columns in the table.
N Θ Avg In the phasor table, a column displaying the moving average of a synchrophasor's angle over a user-configurable time span reaching backward from the Display Time and defaulting to 2 seconds.

CHAPTER 12: ENERVISTA SYNCHROPHASOR VIEWER (ESV) USING THE ESV APPLICATION
MULTILIN P30 PHASOR DATA CONCENTRATOR – INSTRUCTION MANUAL 12–17
3. From the PDC drop-down list, select the PDC Historian containing the data for the synchrophasor you want to visualize.
NOTE
NOTE: If you have not saved your login credentials for the selected Historian or have not previously logged in to the Historian during the current session, a dialog box will appear, in which you must enter your User name [preceded by the appropriate domain name followed by a backslash (that is, DomainName\UserName), if applicable to your environment] and Password, and then click OK, before continuing. If you choose to cancel this prompt, you will not be able to access data in the corresponding Historian until you either navigate away from the worksheet or close and then reopen the application.
4. Use the additional provided search filters alone or in combination to locate a synchrophasor you want to visualize, as follows:
– PMU: After selecting the applicable PDC from the corresponding filter, choose the PMU through which data for the synchrophasor you want to visualize is collected.
– Data Type: Type V or I or click the drop-down arrow to choose either V: Voltage or I: Current, depending on the type of synchrophasor you want to visualize.
– Name Filter: Enter the Historian tag name for the synchrophasor you want to visualize.
TIP
TIP: You can enter either a partial or full name.
5. Click Browse. The Available Tags pane is populated with all Historian tags matching the criteria you specified.
NOTE
NOTE: For further Information, refer to Historian Tag Naming Conventions.
6. In the Available Tags pane, click the listing for each synchrophasor you want to visualize in the current object. The selected synchrophasor is displayed in the “Selected Tags” pane.
NOTE
NOTE: To clear a synchrophasor from the “Selected Tags” pane, click the corresponding tag listing in the pane.
7. Progress as applicable depending on whether you want to visualize additional phasors not located based on your most recently specified search criteria:
• If you want to visualize additional synchrophasors
A. Repeat steps 3 through 6 until you have designated all synchrophasors that you want to visualize in the current object.B. Click OK. The “Select Phasors” dialog box closes and the “Phasor Display” object reflects data for all selected synchrophasors as of the Display Time.
• If you do not want to visualize additional synchrophasors
A. Click OK. The “Select Phasors” dialog box closes and the “Phasor Display” object reflects data for all selected synchrophasors as of the Display Time.

12–18 MULTILIN P30 PHASOR DATA CONCENTRATOR – INSTRUCTION MANUAL
USING THE ESV APPLICATION CHAPTER 12: ENERVISTA SYNCHROPHASOR VIEWER (ESV)
Trend chart objectcreation
Trend Chart DescriptionThe image below highlights the main components of a Trend Chart object.
KEY COMPONENT DESCRIPTION
A Slider bars On the X axis of the chart, movable vertical lines that can be used to ascertain data values at specific points in time, as well as the difference in data values between two points in time.
B Display Time In live mode (the default), the current system time; in historical playback mode, a moment in the past that progresses dynamically within a user-specified time period designated by way of the Dynamic Graphic Replay (DGR) control (see Historical Visualization Overview).
C Trend Options Expandable panel that provides for quick access at runtime to common settings such as duration, legend and grid display, and resumption of play after pausing or zooming.
D Y axis(es) User-configurable vertical scale of data value.
E Data display region Area where color-coded trend lines represent the values of user-specified data elements within a user-configured time span (that is, duration).
F X axis(es) User-configurable scale of duration.
G Legend User-configurable color-coded listing of displayed data element names as well as corresponding data values at the point(s) in time marked by the slider bar(s). Assuming both slider bars are in use, the difference in data values between the two points in time marked by the slider bars is also displayed.
H Scroll arrows Buttons that allow you to shift the time span for the data being viewed in the chart either by a configured percentage backward or forward (single left or right arrow, respectively) or fully backward or forward (double left or right arrow, respectively) relative to the current duration setting.
I Question mark icon Button for opening the application help file to the topic describing the Trend Chart object.
J Slider bar value indicators Text reflecting the positioning of each slider bar as a date and time value.

CHAPTER 12: ENERVISTA SYNCHROPHASOR VIEWER (ESV) USING THE ESV APPLICATION
MULTILIN P30 PHASOR DATA CONCENTRATOR – INSTRUCTION MANUAL 12–19
To Create a Trend Chart ObjectTo create and populate a Trend Chart object, take the following steps:
1. On the main EnerVista Synchrophasor Viewer tool bar, click Add Trend Chart. The worksheet area refreshes to display a blank Trend Chart object.
2. Right-click within the data display area of the object, then select Trend Control Properties. The “CIMPLICITY Trend Chart Control Properties” dialog box appears, displaying the “Lines” tab.
3. In the toolbar below the table on the “Lines” tab, click Create a new line. The table refreshes to display an entry for the newly created trend line.
4. From the “Line Type” drop-down list, select the applicable option based on whether you want the trend line to reflect straight data or data as the function of an expression:
NOTE
NOTE: Line types other than Historian and Historian Expression are not applicable to the EnerVista Synchrophasor Viewer.
5. Proceed as applicable based on whether the trend line you are creating will be based on straight data or data as the function of an expression:
If you want the trend line to reflect straight data:
If you want the trend line to reflect data as the function of an expression:
A. Select “Historian”.B. If the “Use Connections” option is not already enabled, as indicated by a check mark in the corresponding check box, select the check box.
A. Select “Historian Expression”. The dialog box refreshes to display the “Expression” field.

12–20 MULTILIN P30 PHASOR DATA CONCENTRATOR – INSTRUCTION MANUAL
USING THE ESV APPLICATION CHAPTER 12: ENERVISTA SYNCHROPHASOR VIEWER (ESV)
If the trend line will be based on straight data: If the trend line will be based on data as the function an expression:
A. From the Connection drop-down list , select the Historian containing the desired phasor, digital, or analog data element (that is, tag).NOTE: If you have not saved your login credentials for the selected Historian or have not previously logged in to the Historian during the current session, a dialog box will appear, in which you must enter your User name [preceded by the appropriate domain name followed by a backslash (that is, DomainName\UserName), if applicable to your environment] and Password, and then click OK, before continuing. If you choose to cancel this prompt, you will not be able to access data in the corresponding Historian until you either navigate away from the worksheet or close and then reopen the application.
B. Click the ellipsis button beside the Tag ID field. The “Select a Tag” dialog box appears.
C. Click Browse. The pane in the lower area of the “Select a Tag” dialog box refreshes to display a table listing the tags contained in the Historian.NOTE: For information, see Historian tag naming conventions.
D. In the table of tags, click the listing for the desired tag.
E. Click OK. The “Select a Tag” dialog box closes, and the table on the Lines tab refreshes to display the selected tag in the entry created at step 3.
A. Click the button directly to the right of the Expression field. The “Edit Expression” dialog box appears.
B. In the Edit Expression dialog box, click Historian. The “Select a Tag” dialog box appears.
C. From the Connection drop-down list, select the Historian containing the phasor, digital, or analog data point (that is, tag) that you want to use in the expression.NOTE: If you have not saved your login credentials for the selected Historian or have not previously logged in to the Historian during the current session, a dialog box will appear, in which you must enter your User name [preceded by the appropriate domain name followed by a backslash (that is, DomainName\UserName), if applicable to your environment] and Password, and then click OK, before continuing. If you choose to cancel this prompt, you will not be able to access data in the corresponding Historian until you either navigate away from the worksheet or close and then reopen the application.
D. Click Browse. The pane in the lower area of the “Select a Tag” dialog box refreshes to display a table listing the tags contained in the Historian. NOTE: For information, see Historian tag naming conventions.
E. In the table of tags, click the listing for the tag that you want to use in the expression.
F. Click OK. The “Select a Tag” dialog box closes, and the input field of the “Edit Expression” dialog box refreshes to display the selected tag. NOTE: All Historian tags must be fully qualified by the Historian connection name and must be enclosed in single quotes.
G. Repeat steps B through F for each tag that you want to include as part of the expression.
H. In the input field of the “Expression Editor” dialog box, position your cursor at the location where you want to insert the desired expression operator.
I. Below the input field in the “Expression Editor” dialog box, double-click the box containing the operator you want to include in the expression.NOTE: For information on expression operators, see Expression Operators Overview.The selected operator is inserted in the input field at the location of your cursor.
J. Repeat steps H and I for each operation you want to perform as part of the expression.
K. Insert other required terms into the expression, by positioning your cursor at the location where you want to insert the term, and then entering it .
L. When you are finished building the expression, click OK. The Expression Editor dialog box closes, and the table on the Lines tab refreshes to display the designated expression in the entry created at step 3.
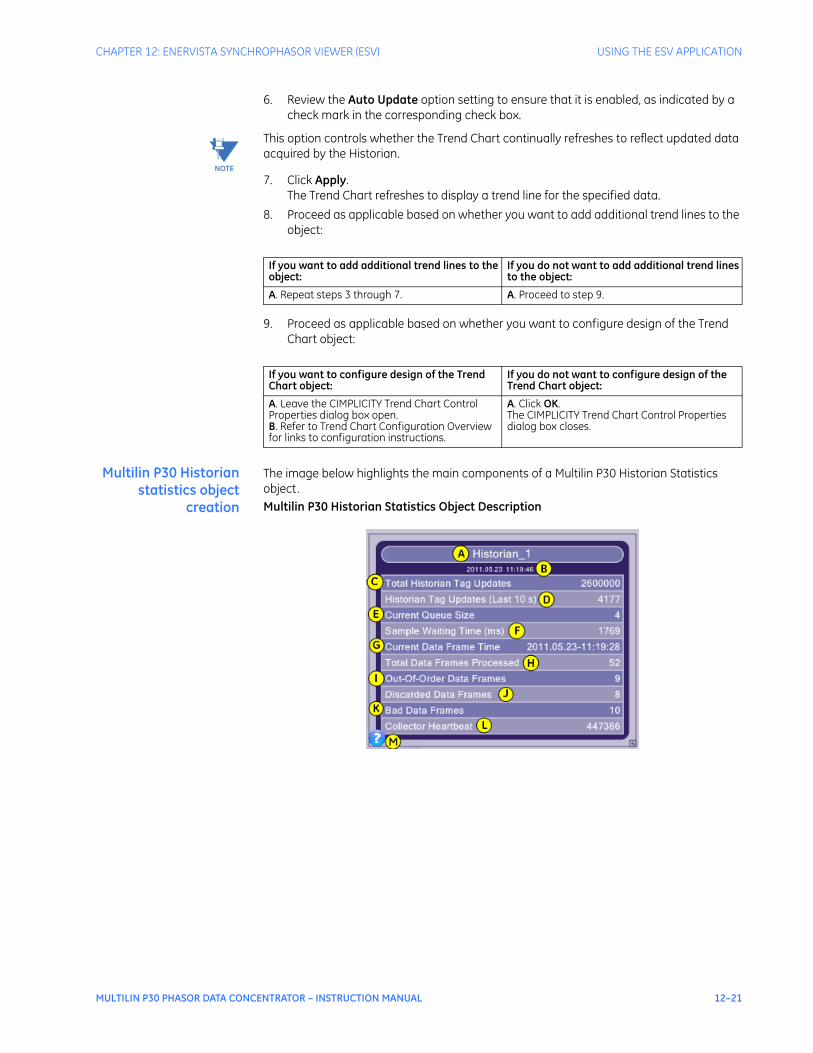
CHAPTER 12: ENERVISTA SYNCHROPHASOR VIEWER (ESV) USING THE ESV APPLICATION
MULTILIN P30 PHASOR DATA CONCENTRATOR – INSTRUCTION MANUAL 12–21
6. Review the Auto Update option setting to ensure that it is enabled, as indicated by a check mark in the corresponding check box.
NOTE
NOTE: This option controls whether the Trend Chart continually refreshes to reflect updated data acquired by the Historian.
7. Click Apply. The Trend Chart refreshes to display a trend line for the specified data.
8. Proceed as applicable based on whether you want to add additional trend lines to the object:
9. Proceed as applicable based on whether you want to configure design of the Trend Chart object:
Multilin P30 Historianstatistics object
creation
The image below highlights the main components of a Multilin P30 Historian Statistics object. Multilin P30 Historian Statistics Object Description
If you want to add additional trend lines to the object:
If you do not want to add additional trend lines to the object:
A. Repeat steps 3 through 7. A. Proceed to step 9.
If you want to configure design of the Trend Chart object:
If you do not want to configure design of the Trend Chart object:
A. Leave the CIMPLICITY Trend Chart Control Properties dialog box open.B. Refer to Trend Chart Configuration Overview for links to configuration instructions.
A. Click OK. The CIMPLICITY Trend Chart Control Properties dialog box closes.

12–22 MULTILIN P30 PHASOR DATA CONCENTRATOR – INSTRUCTION MANUAL
USING THE ESV APPLICATION CHAPTER 12: ENERVISTA SYNCHROPHASOR VIEWER (ESV)
To create a Multilin P30 Historian Statistics objectTo create and populate a Multilin P30 Historian Statistics object, take the following steps:
1. On the main toolbar, click Add Multilin P30 Historian Statistics. The worksheet area refreshes to display a blank PDC Historian Statistics object.
2. Right-click within the object itself, then choose Select P30. The “Select P30” dialog box appears.
3. From the Multilin P30 Connection drop-down list, select the Multilin P30 Historian in which data for the desired Multilin P30 is stored.
NOTE
NOTE: If you have not saved your login credentials for the selected Historian or have not previously logged in to the Historian during the current session, a dialog box will appear, in which you must enter your User Name [preceded by the appropriate domain Name followed by a backslash (that is, DomainName\UserName), if applicable to your environment] and Password, and then click OK, before continuing. If you choose to cancel this prompt, you will not be able to access data in the corresponding Historian until you either navigate away from the worksheet or close, then reopen, the application.
4. From the Multilin P30 drop-down list, select the Historian tag for the desired Multilin P30 .
NOTE
NOTE: For further Information, refer to Historian Tag Naming Conventions.
5. Click OK. The Multilin P30 Historian Statistics object refreshes to display data for the selected Multilin P30 .
Key Component Description
A Object Title User-specified connection name for the Multilin P30 Historian being visualized.
B Display Time In live mode (the default), the current system time; in historical playback mode, a moment in the past that progresses dynamically within a user-specified time period designated by way of the Dynamic Graphic Replay (DGR) control (see Historical Visualization Overview).
C Total Historian Tag Updates Number of measurement updates written to the Historian since the data collector service last started.
D Historian Tag Updates (last 10 s) Number of measurement updates written to the Historian in the last ten seconds.
E Current Queue Size Number of measurement updates pending between the Concentrator and Historian.
F Sample Waiting Time (ms) Number of milliseconds the current C37.118 data frame spent waiting in the queue between the data collector service and the Historian.
G Current Data Frame Time Date and time stamp of the most recently archived C37.118 data frame.
H Total Data Frames Processed Number of C37.118 data frames processed by the Historian since the data collector service last started.
I Out-of-Order Data Frames Number of C37.118 data frames sent out of chronological order since the data collector service last started.
J Discarded Data Frames Number of C37.118 data frames disposed of due to queue overrun since the data collector service last started.
K Bad Data Frames Number of defective C37.118 data frames since the data collector service last started.
L Collector Heartbeat Counter to confirm ongoing communication between the data collector and the Historian since the data collector service last started.
M Question Mark Icon Button for opening the application help file to the topic describing the Multilin P30 Historian Statistics object.

CHAPTER 12: ENERVISTA SYNCHROPHASOR VIEWER (ESV) USING THE ESV APPLICATION
MULTILIN P30 PHASOR DATA CONCENTRATOR – INSTRUCTION MANUAL 12–23
PMU status objectcreation PMU Status Object Description
The IEEE C37.118 Standard mandates that each PMU data block include a STAT word containing complete status information for that data block. The EnerVista Synchrophasor Viewer (ESV) PMU Status object uses this STAT word to indicate the status of the PMU, with the bits that compose the STAT word denoting the state of discrete PMU attributes. The PMU Status object displays state information starting with the most significant bits to the least significant bits in the STAT word, excluding bits 12 and 9. The four least significant bits (03-00) are used to indicate the state of the Trigger attribute. In each case, attribute state is indicated by a combination of a colored animated icon and descriptive text that change dynamically with changes in state.
NOTE
NOTE: If the Multilin P30 Concentrator loses communication with the Multilin P30 Historian, the animated icons turn black, and the descriptive text changes.
NOTE
NOTE: If the animated icons of both the Data and Error attributes are red, it may indicate a disconnect between the PMU and the Multilin P30 . For descriptions of other states that this scenario may indicate, see items E and F in the following table.The image below highlights the main components of a PMU Status object.
Key Feature Purpose
A Object Title Historian tag for the PMU.
B Display Time In live mode (the default), the current system time; in historical playback mode, a moment in the past that progresses dynamically within a user-specified time period designated by way of the Dynamic Graphic Replay (DGR) control (see Historical Visualization Overview).
C Frequency Text indicator of Frequency.
D ∆F/∆t Text indicator of change in Frequency per second.
E Data Status Combination of an animated icon and text reflecting the validity of PMU data as indicated by bit 15 of the STAT word, with green indicating Valid and red indicating Invalid or Test data.
F Error Status Combination of an animated icon and text reflecting whether any internal and/or configuration errors have been detected in the PMU as indicated by bit 14 of the STAT word, with green and None denoting the absence, and red and PMU Error denoting the presence of such errors.
G Sync Error Status Combination of an animated icon and text reflecting whether the PMU clock has drifted as indicated by bit 13 of the STAT word, with green and None denoting the absence of time drift , and red and Lost Sync denoting the presence of time drift.

12–24 MULTILIN P30 PHASOR DATA CONCENTRATOR – INSTRUCTION MANUAL
USING THE ESV APPLICATION CHAPTER 12: ENERVISTA SYNCHROPHASOR VIEWER (ESV)
To Create a PMU Status ObjectTo create and populate a PMU Status object, take the following steps:
1. On the main toolbar, click Add PMU Status. The worksheet area refreshes to display a blank “PDC Status” object.
2. Right-click within the object itself, then choose Select PMU. The “Select PMU” dialog box appears.
3. From the Multilin P30 drop-down list, select the Multilin P30 Historian in which data for the desired PMU is stored.
NOTE
NOTE: If you have not saved your login credentials for the selected Historian or have not previously logged in to the Historian during the current session, a dialog box will appear, in which you must enter your User name [preceded by the appropriate domain name followed by a backslash (that is, DomainName\UserName), if applicable to your environment] and Password, then click OK, before continuing. If you choose to cancel this
H Trigger Status Combination of an animated icon and text reflecting whether a triggering event has been detected in the PMU as indicated by bit 11 of the STAT word, with green and None denoting the absence of such an event, and yellow denoting the presence of such an event, the nature of which is denoted by one of the following descriptions:• Manual
• Magnitude Low
• Magnitude High
• Phase Angle ∆
• Freq. High/Low
• ∆f/∆t High
• Reserved
• Digital
• User DefinedI Configuration Status Combination of an animated icon and text reflecting whether PMU
configuration has Not Changed (green) or Changed (yellow) as indicated by bit 10 of the STAT word.
J Time Quality Status Combination of an animated icon and text reflecting the extent of time error in the PMU as indicated by bits 8–6 of the STAT word, as follows:
Icon Color - Green: Not Applicable (that is, the PMU is not compliant with the C37.118.2 Standard) OR Error < 100 ns OR Error < 1 μs
Icon Color - Yellow: Error < 10 μs OR Error < 100 μs OR Error < 1 ms
Icon Color - Orange: Error < 10 ms
Icon Color - Red: Error > 10 ms
K Unlocked Time Status Combination of an animated icon and text reflecting the time span that the PMU clock was unlocked for as indicated by bit 11 of the STAT word, with green denoting 0 s, yellow denoting 10 s, orange denoting 100 s, and red denoting greater than 1,000 s.
L Question Mark Icon Button for opening the application help file to the topic describing the PMU Status object
Key Feature Purpose

CHAPTER 12: ENERVISTA SYNCHROPHASOR VIEWER (ESV) USING THE ESV APPLICATION
MULTILIN P30 PHASOR DATA CONCENTRATOR – INSTRUCTION MANUAL 12–25
prompt, you will not be able to access data in the corresponding Historian until you either navigate away from the worksheet or close and then reopen the application. The display pane below refreshes to list Historian tags for all applicable PMUs.
NOTE
NOTE: For further Information, refer to Historian Tag Naming Conventions.
4. In the list of PMU tags, click the entry for the desired PMU. The Selected PMU field near the top of the dialog box refreshes to display the chosen PMU tag.
5. Click OK. The PMU Status object refreshes to display data for the selected PMU.
Visualization object configuration in ESV
General configuration Configuration tasks that relate either to the application in general or to all visualization objects are as follows:
• Managing display and size of the application window
• Sizing visualization objects
• Positioning visualization objects on worksheets
• Deleting visualization objects from worksheets
• Displaying the worksheet clock.
TO CONFIGURE THE APPLICATION WINDOWIn terms of configuring the application window, you can do any of the following:
• Minimize the window
• Maximize the window
• Customize the size of the window.
To Minimize the Window:
1. Click the “Bar” at the upper-right corner of the window.
NOTE
NOTE: You can also right-click in a blank area of the worksheet, then select Minimize.
The window collapses to its icon on the Taskbar.
NOTE
NOTE: To restore the window to its previous state, click the icon on the Taskbar
To maximize the Window:
1. Right-click in a blank area of the worksheet, then select Maximize. The window refreshes to its full size.
NOTE
NOTE: To restore the window to its previous state, right-click in a blank area of the worksheet, then select Restore.
To Customize the Size of the Window:
1. Click and hold the “Control Tab” at the lower-right corner of the window, then drag the Control Tab until the window is sized as desired.
NOTE
NOTE: This control maintains the aspect ratio of the window.
TO REPOSITION VISUALIZATION OBJECTS ON A WORKSHEETIf the positioning of visualization objects on a worksheet does not meet your needs, you can move the objects by taking the following step:
1. Click the object, hold down your mouse button, then drag the object to the desired position on the worksheet.

12–26 MULTILIN P30 PHASOR DATA CONCENTRATOR – INSTRUCTION MANUAL
USING THE ESV APPLICATION CHAPTER 12: ENERVISTA SYNCHROPHASOR VIEWER (ESV)
NOTE
NOTE: In a Trend Chart object, click just inside any of the edges.
TO RESIZE VISUALIZATION OBJECTSTo size a visualization object to best suit your needs, take the following step:
1. Click and hold the “Corner Arrow Control” on the lower-right corner of the object, then drag your mouse until the object is the desired size.
NOTE
NOTE: This control maintains the aspect ratio of the object.
TO DELETE VISUALIZATION OBJECTS FROM A WORKSHEETIf you no longer need a visualization object, you can delete it from its worksheet by taking the following steps:
CAUTION: After you have deleted an object, there is no way to recover it. Therefore, if you think you might have future use for the object, you may want to consider duplicating the worksheet and deleting the object from the copy, rather than deleting the object from the original worksheet.
1. Right-click within the object.
NOTE
NOTE: In a Trend Chart object, right-click above the data display area.
2. Select Delete This Object. A dialog box appears, prompting you to confirm whether you want to complete the deletion process.
3. Click Yes. The object is deleted from the worksheet.
TO CHANGE THE WORKSHEET REFRESH INTERVALBy default, the EnerVista Synchrophasor Viewer (ESV) retrieves data from the Multilin P30 Historian for display in visualization objects once per second. You can adjust this setting to be as short as 0.25 seconds or as long as 10 seconds, allowing you find an optimal balance between data updates and system performance based on the number and complexity of the objects configured.To change the worksheet refresh interval, take the following steps:
1. Right-click in a blank area of the worksheet, point to Settings, then select Worksheet Refresh Interval. The “Worksheet Refresh Interval” dialog box appears.
2. Enter the desired refresh interval value in seconds.
NOTE
NOTE: You can designate a value from 0.25 to 10 seconds.
3. Click OK. The “Worksheet Refresh Interval” dialog box closes, and the worksheet refresh interval reflects the newly designated value.
NOTE
NOTE: If the data in the Multilin P30 Historian has not been updated within the specified time frame, PVP will display the most current data available, with a maximum latency of 10 seconds.
Phasor display objectconfiguration
At a minimum, Phasor Display configuration involves generating the object itself, then choosing the synchrophasors that you want to visualize in the object.After completing these initial steps, you have a number of options for configuring the corresponding data. Specifically, you can do any of the following:
• Change polar plot radial scale
• Change polar plot rotation
• Change angular scale measurement unit
• Change the reference synchrophasor
• View angular difference between two synchrophasors

CHAPTER 12: ENERVISTA SYNCHROPHASOR VIEWER (ESV) USING THE ESV APPLICATION
MULTILIN P30 PHASOR DATA CONCENTRATOR – INSTRUCTION MANUAL 12–27
• Change time span for determining synchrophasor moving average
• Hide values in the Phasor Display table
• View an obscured synchrophasor indicator in a polar plot
• Change the color indicator for a displayed synchrophasor
• Change Phasor Display object title
• Replay the visualization for a historical period of your choosing
TO CHANGE POLAR PLOT RADIAL SCALEIf, after creating and populating a Phasor Display object with data of your choosing, you find that the polar plot radial scale does not exactly meet your visualization needs, you have several options for changing the scale. Specifically, you can do any of the following:
• Have the application calculate and adjust the scale to best encapsulate the displayed synchrophasor(s), thereby optimizing the scale
• Change the voltage scale based on a new maximum limit of your choosing
• Change the current scale based on a new maximum limit of your choosing
NOTE
NOTE: If, after completing any of these rescaling procedures, the magnitude of a phasor changes such that it exceeds the radial scale limits, a slowly blinking triangular icon is displayed at the terminal end of the corresponding hand in the polar plot, just beyond the smaller triangular icon highlighting the phasor's angle. If the polar plot configuration makes it difficult to discern the affected phasor, you can position your mouse pointer over the blinking icon to display identifying text below the phasor table. In this way, you can ascertain the phasor's magnitude by consulting the corresponding listing in the table and, if desired, further adjust the radial scale to encompass the phasor's magnitude.
To Programmatically Optimize the Polar Plot Radial Scale
1. Below the polar plot, click Best Scaling. The polar plot refreshes to reflect the optimal radial scale for visualizing magnitude of the currently displayed synchrophasor(s).
To Change Voltage Scale Based on a New Maximum Limit of your Choosing
1. Right click within the Phasor Display, then point to Display Configuration, then select Voltage Scale. The “Manual Scale” dialog box appears.
2. In the text entry field, type the desired maximum voltage value in kilovolts.
3. Click OK. The polar plot refreshes to reflect an application-calculated voltage scale based on the newly specified maximum value.
To Change Current Scale Based on a New Maximum Limit of your Choosing
1. Right click within the Phasor Display, then point to Display Configuration, then select Current Scale. The “Manual Scale” dialog box appears.
2. In the text entry field, type the desired maximum current value in amperes.
3. Click OK. The polar plot refreshes to reflect an application-calculated current scale based on the newly specified maximum value.
TO CHANGE POLAR PLOT ROTATIONBy default, the zero point of the polar plot in a Phasor Display object is set to 3 o’clock, for which the positive angular direction (and positive indicator rotation) is counter-clockwise. You can, however, change the zero point to 12 o’clock, thereby changing the positive angular direction (and positive indicator rotation) of the plot to clockwise. To do so, take the following step:

12–28 MULTILIN P30 PHASOR DATA CONCENTRATOR – INSTRUCTION MANUAL
USING THE ESV APPLICATION CHAPTER 12: ENERVISTA SYNCHROPHASOR VIEWER (ESV)
1. Below the polar plot, click Rotate Plot. The polar plot refreshes to change the zero point from 3 o’clock to 12 o’clock and therefore the positive angular direction (and positive indicator rotation) from counter-clockwise to clockwise.
TIP
TIP: To change the zero point of the polar plot back to 3 o’clock (and, therefore, the positive angular direction and positive indicator rotation from clockwise to counter-clockwise), click the Rotate Plot button again.
TO CHANGE ANGULAR SCALE MEASUREMENT UNITIf, after creating and populating a Phasor Display object, you want to change the default angular scale measurement unit from degrees to radians, take the following step:
1. In the phasor table, above the Angle column, click Deg. The polar plot scale and the values in the phasor table are refreshed to reflect radians as the angular measurement unit.
NOTE
NOTE: To change the angular scale measurement unit back to degrees, click Rad. above the “Angle” column in the phasor table.
TO CHANGE THE REFERENCE SYNCHROPHASORIf after creating a Phasor Display object, you want to select or change the reference synchrophasor, take the following step:
1. In “Ref.” column of the “Phasor Display” table, click the check box corresponding to the synchrophasor that you want to set as the reference. The table and polar plot are updated to reflect a value of 0 for the newly designated reference synchrophasor, and the values for all other displayed synchrophasors are refreshed based on their angles compared to that of the newly designated reference synchrophasor.
NOTE
NOTE: The values shown are for the Display Time.
TIP
TIP: To change to a different reference phasor, select the check box in the “Ref.” column for that phasor to insert an X; to set the reference phasor back to absolute, clear the previously selected “Ref.” column check box.
TO VIEW THE ANGULAR DIFFERENCE BETWEEN TWO SYNCHROPHASORSIf after creating and populating a Phasor Display object, you want the application to calculate and display the angular difference between synchrophasors, take the following step:
1. In the ∆ column of the Phasor Display table, select the check box corresponding to the synchrophasor(s) for which you want the application to calculate and display the angular delta.
NOTE
NOTE: You can select one or two synchrophasors. In the former case, the angular delta is calculated based on the value of the chosen synchrophasor as compared to zero; in the latter case the angular delta is calculated based on the values of the chosen synchrophasors.
The delta value is displayed below the polar plot, and arc and delta indicators are displayed on the perimeter of the plot.
TIP
TIP: To end the calculation and display of angular delta, clear the check box(es) selected in the ∆ column of the table.

CHAPTER 12: ENERVISTA SYNCHROPHASOR VIEWER (ESV) USING THE ESV APPLICATION
MULTILIN P30 PHASOR DATA CONCENTRATOR – INSTRUCTION MANUAL 12–29
TO CHANGE MOVING AVERAGE TIME-SPANThe default time-span against which the application calculates synchrophasor angle moving average in a Phasor Display object is 2 seconds. You can, however, change this time-span to a minimum of 1 second and a maximum of 60 seconds. To do so, take the following steps:
1. Right click within the Phasor Display, then point to Display Configuration, then select Set Hist. Avg. Span. The Multilin P30 Historical Average Span dialog box appears.
2. In the text entry field, enter the time span against which you want the application to calculate synchrophasor moving average.
3. Click OK. The Moving Average column of the Phasor Display table refreshes to reflect updated values based on the newly designated time span.
NOTE
NOTE: If you selected a reference synchrophasor in the Phasor Display table, moving average will be relative to the reference; otherwise, moving average will be absolute.
TO HIDE VALUES IN A PHASOR DISPLAY TABLEIf after creating and populating a Phasor Display object you want to configure the table to hide the synchrophasor values, take the following step:
1. In the upper-right corner of the Phasor Display table, click the double-arrow button. The table refreshes to hide the Angle, Magn., and Θ Avg. columns.
NOTE
NOTE: To display angle, magnitude, and moving average values in the table again, click the double-arrow button a second time.
TO VIEW AN OBSCURED SYNCHROPHASOR INDICATOR IN A POLAR PLOTIf more than one of the synchrophasors being visualized in a Phasor Display object are of the same or very similar magnitude and angle, the corresponding hand indicator for one of the synchrophasors may obscure those of the others in the polar plot. To view any such obscured synchrophasor indicator, take the following step:
1. In the first column of the “Phasor Display” table, double-click the colored oval for the obscured synchrophasor. The polar plot refreshes to display the hand indicator for the corresponding synchrophasor on top of all hand indicators in the plot.
TO CHANGE THE COLOR INDICATOR FOR A DISPLAYED SYNCHROPHASORIf after creating and populating a Phasor Display object you want change the color used by the application to identify a synchrophasor in the table and polar plot, take the following steps.
1. In the first column of the “Phasor Display” table, right-click the colored oval for the synchrophasor to which you want to assign a new identifying color, then select Select Color. The “Select Color” dialog box appears.
2. In the “Select Color” dialog box, click the color that you want to assign to the synchrophasor in question. The Phasor Display object refreshes to reflect the new color for the synchrophasor in the corresponding hand and triangular indicator on the polar plot, and the colored oval in the first column of the table.
NOTE
NOTE: If you subsequently want to cancel a color change, right-click the colored oval then select Default Color.

12–30 MULTILIN P30 PHASOR DATA CONCENTRATOR – INSTRUCTION MANUAL
USING THE ESV APPLICATION CHAPTER 12: ENERVISTA SYNCHROPHASOR VIEWER (ESV)
TO CHANGE PHASOR DISPLAY TITLEIf after creating a Phasor Display you want to change the object's title, take the following steps:
1. Right click within the Phasor Display object, then point to Display Configuration, then select Set Display Title. The PDC UI dialog box appears.
2. In the text entry field of the Multilin P30 UI dialog box, enter the desired object title.
3. Click OK. The Phasor Display object refreshes to reflect the specified title.
Trend chart objectconfiguration
At a minimum, Trend Chart configuration involves generating the object itself then specifying the data you want to visualize as trend lines in the object.After completing these initial steps, you have a number of options for configuring the object. Specifically, you can do any of the following:
• Add and map one or more axes
• Add trend lines to the object
• Delete trend lines from the object
• Change axis mapping
• Change axis scaling
• Change the appearance of trend lines
• Modify axis label name and appearance
• Control display of certain object components
• Change data retrieval mode
• Change data sample interval
• Change automatic update interval
• Control progression in the object
• Zoom the view in the object
• Shift the time span for which data is being viewed
• Ascertain at a glance the difference in a given measurement's value between two points in time
• Change the distance from the slider bar that you can position the mouse pointer and still grab the bar
• Enable primary axis synchronization
• Enforce a single duration setting
• Replay the visualization for a historical period of your choosing.
TO ADD LINES TO A TREND CHART OBJECTIf, after creating and populating a Trend Chart object, you want to add trend lines to the object, you can do either of the following:
• Add lines from scratch
• Duplicate existing lines as the basis for new lines
To Add Trend Lines from Scratch:If, after creating and populating a Trend Chart object, you want to add trend lines to the object from scratch, take the following steps:
1. Right-click within the data display area of the Trend Chart object, then select Trend Control Properties The CIMPLICITY “Trend Chart Control Properties” dialog box appears, displaying the Lines tab.

CHAPTER 12: ENERVISTA SYNCHROPHASOR VIEWER (ESV) USING THE ESV APPLICATION
MULTILIN P30 PHASOR DATA CONCENTRATOR – INSTRUCTION MANUAL 12–31
2. Below the displayed table on the Lines tab, click Create a new line. The table refreshes to display an entry for the newly created trend line.
3. From the “Line Type” drop-down list, select the applicable option based on whether you want the trend line to reflect straight data or data as the function of an expression:
NOTE
NOTE: Line types other than Historian and Historian Expression are not applicable to the EnerVista Synchrophasor Viewer.
4. Proceed as applicable based on whether the trend line you are creating will be based on straight data or data as the function of an expression:
If you want the trend line to reflect straight data:
If you want the trend line to reflect data as the function of an expression:
A. Select Historian.B. If the “Use Connections” option is not already enabled, as indicated by a check mark in the corresponding check box, select the check box.
A. Select Historian Expression. The dialog box refreshes to display the “Expression” field.

12–32 MULTILIN P30 PHASOR DATA CONCENTRATOR – INSTRUCTION MANUAL
USING THE ESV APPLICATION CHAPTER 12: ENERVISTA SYNCHROPHASOR VIEWER (ESV)
If the trend line will be based on straight data:
If the trend line will be based on data as the function an expression:
A. From the Connection drop-down list , select the Historian containing the desired phasor, digital, or analog data element (that is, tag). NOTE: If you have not saved your login credentials for the selected Historian or have not previously logged in to the Historian during the current session, a dialog box will appear, in which you must enter your User Name [preceded by the appropriate domain name followed by a backslash (that is, DomainName\UserName), if applicable to your environment] and Password, then click OK, before continuing. If you choose to cancel this prompt, you will not be able to access data in the corresponding Historian until you either navigate away from the worksheet or close, then reopen, the application.
B. Click the ellipsis button beside the “Tag ID” field. The “Select a Tag” dialog box appears.
C. Click Browse. The pane in the lower area of the Select a Tag dialog box refreshes to display a table listing the tags contained in the Historian.NOTE: For information, see Historian tag naming conventions.
D. In the table of tags, click the listing for the desired tag.
E. Click OK. The “Select a Tag” dialog box closes, and the table on the “Lines” tab refreshes to display the selected tag in the entry created in step 2.
A. Click the button directly to the right of the Expression field. The “Edit Expression” dialog box appears.
B. In the Edit Expression dialog box, click Historian. The “Select a Tag” dialog box appears.
C. From the “Connection” drop-down list, select the Historian containing the phasor, digital, or analog data point (that is, tag) that you want to use in the expression.NOTE: If you have not saved your login credentials for the selected Historian or have not previously logged in to the Historian during the current session, a dialog box will appear, in which you must enter your User Name [preceded by the appropriate domain name followed by a backslash (that is, DomainName\UserName), if applicable to your environment] and Password, and then click OK, before continuing. If you choose to cancel this prompt, you will not be able to access data in the corresponding Historian until you either navigate away from the worksheet or close, then reopen, the application.
D. Click Browse. The pane in the lower area of the “Select a Tag” dialog box refreshes to display a table listing the tags contained in the Historian.NOTE: For information, see Historian tag naming conventions.
E. In the table of tags, click the listing for the tag that you want to use in the expression.
F. Click OK. The “Select a Tag” dialog box closes, and the input field of the “Edit Expression” dialog box refreshes to display the selected tag.NOTE: All Historian tags must be fully qualified by the Historian connection name and must be enclosed in single quotes.
G. Repeat steps B through F for each tag that you want to include as part of the expression.
H. In the input field of the “Expression Editor” dialog box, position your cursor at the location where you want to insert the desired expression operator.
I. Below the input field in the “Expression Editor” dialog box, double-click the box containing the operator you want to include in the expression.NOTE: For information on expression operators, see Expression Operators Overview.
The selected operator is inserted in the input field at the location of your cursor.
J. Repeat steps H and I for each operation you want to perform as part of the expression.
K. Insert other required terms into the expression, by positioning your cursor at the location where you want to insert the term, then entering it.
L. When you are finished building the expression, click OK. The “Expression Editor” dialog box closes, and the table on the “Lines” tab refreshes to display the designated expression in the entry created in step 2.

CHAPTER 12: ENERVISTA SYNCHROPHASOR VIEWER (ESV) USING THE ESV APPLICATION
MULTILIN P30 PHASOR DATA CONCENTRATOR – INSTRUCTION MANUAL 12–33
5. Review the “Auto Update” option setting to ensure that it is enabled, as indicated by a check mark in the corresponding check box.
NOTE
NOTE: This option controls whether the Trend Chart object continually refreshes to reflect updated data acquired by the Historian.
6. Click Apply. The Trend Chart refreshes to display a trend line for the specified data.
7. Proceed as applicable based on whether you want to add additional trend lines to the object:
8. Proceed as applicable based on the axes to which the newly-added trend line should be mapped:
To Duplicate Existing Trend Lines as the Basis for New LinesIf an existing line in a Trend Chart object would serve as a good basis for a new trend line in the same object, you can duplicate the line by taking the following steps:
1. Right-click within the data display area of the Trend Chart object, then select Trend Control Properties. The “CIMPLICITY Trend Chart Control Properties” dialog box appears, displaying the Lines tab.
2. In the table, click the row corresponding to the trend line that you want to duplicate.
3. Below the displayed table on the Lines tab, click Duplicate the selected line.
4. Configure the newly added line as desired.
NOTE
NOTE: Refer to Trend Chart Configuration Overview for a list of configuration options.
5. When you are finished configuring the newly added trend line, click Apply. The Trend Chart refreshes to display the newly added trend line.
6. Click OK.
TO DELETE LINES FROM A TREND CHART OBJECTIf, after creating and populating a Trend Chart object, you want to delete one or more lines from the object, take the following steps.
1. Right-click within the data display area of the object, then select Trend Control Properties. The “CIMPLICITY Trend Chart Control Properties” dialog box appears, displaying the “Line” tab.
2. In the table, click the row corresponding to the trend line that you want to delete.
3. Below the table, click Delete the selected line. The table refreshes to reflect deletion of the selected line.
NOTE
NOTE: If you decide you do not want to delete the line after all, click Cancel.
If you want to add additional trend lines to the object:
If you do not want to add additional trend lines to the object:
A. Repeat steps 3 through 6 A. Proceed to step 8
If the trend line should be mapped to the primary (that is, Chart) X and Y axes:
If the trend line should be mapped to a secondary X and/or Y axis:
A. Click OK. The “CIMPLICITY Trend Chart Control Properties” dialog box closes, fully revealing the Trend Chart.
A. Leave the “CIMPLICITY Trend Chart Control Properties” dialog box open, then complete the steps outlined under either To Add and Map Axes in a Trend Chart Object or To Change Axis Mapping in a Trend Chart Object, as applicable.

12–34 MULTILIN P30 PHASOR DATA CONCENTRATOR – INSTRUCTION MANUAL
USING THE ESV APPLICATION CHAPTER 12: ENERVISTA SYNCHROPHASOR VIEWER (ESV)
4. Click Apply. The Trend Chart refreshes to reflect deletion of the selected trend line.
5. Proceed as applicable based on whether you want to delete additional trend lines:
TO ADD AND MAP AXES IN A TREND CHART OBJECTIn certain circumstances, such as when visualizing different types of data within the same Trend Chart, you may want to add one or more Y or X axes. To do so, take the following steps:
NOTE
NOTE: The following procedure assumes that the “CIMPLICITY Trend Chart Control Properties” dialog box is already open. If this is not the case, right-click within the data display area of the object, then select Trend Control Properties to open the dialog box.
1. Click the Axis tab.
2. In the toolbar below the displayed table, click Create a new axis. The “New Axis” dialog box appears.
3. In the “Axis ID” field, enter the desired name for the axis.
NOTE
NOTE: This is the name that will be reflected in the table on the “Axis” tab for the purpose of identifying the axis, rather than the axis label to be displayed in the Trend Chart object itself. You can assign the latter in step 6.
4. Specify the desired Axis Type by selecting either the Y Axis (for value) or X Axis (for time) option.
5. Click OK. The table on the Axis tab refreshes to reflect the newly created axis.
6. If desired, specify a Label for the new axis by entering the desired name in the corresponding field.
7. Proceed as applicable depending on whether you are adding a Y axis or an X axis:
8. Review the number of Ticks specified to be displayed on the scale, and, if desired, change the number.
NOTE
NOTE: The default number of ticks is 0. When you specify a number greater than 0, ticks are displayed at even intervals on the scale.
9. Review the “Numbered Option” setting, and, if desired, change the setting by selecting the check box to enable, or by clearing the check box, to disable.
If you want to delete additional trend lines: If you do not want to delete additional trend lines:
A. Repeat steps 2 through 4. A. Click OK.
If you are adding a Y-axis: In you are adding an X-axis:
A. Review the Autoscale option setting, and, if desired, change the setting by selecting the check box to enable or by clearing the check box to disable.NOTE: Enabled by default , this option results in automatic calculation of optimal upper and lower scale limits based on the data being visualized in the Trend Chart. If you disable the option, you can customize scale limits by entering the desired values in the Default lower limit and Default upper limit fields.
A. Review the Duration setting and, if desired, specify a different setting by entering it directly in the corresponding field.NOTE: Duration format is ddd:hh:mm:ss, where:
ddd - day number: 0–365hh - Hours: 0–24mm - minutes: 0–59ss - seconds: 0–59
TIP: If you have configured the Trend Chart with multiple lines, setting the duration to 1 day or longer may result in a brief delay in data display, during which the Trend Chart goes blank.

CHAPTER 12: ENERVISTA SYNCHROPHASOR VIEWER (ESV) USING THE ESV APPLICATION
MULTILIN P30 PHASOR DATA CONCENTRATOR – INSTRUCTION MANUAL 12–35
NOTE
NOTE: Enabled by default, this option results in a number being displayed beside each tick mark to reflect the value of the mark within the scale.
10. Proceed as applicable, based on whether you want to add another axis to the Trend Chart object:
11. In the toolbar below the table of axes, click Line-Axis Mapping. The “Line-Axis Mapping” dialog box appears.
12. Map each trend line to the desired axis, as follows:
– In the Lines pane, click the trend line to be mapped.
– From either the Configured X-axis or Configured Y-axis drop-down list, as applicable, select the axis to which the trend line should be mapped.
13. When you are finished mapping trend lines to axes, click OK. The Line-Axis Mapping dialog box closes.
14. Click Apply. The Trend Chart refreshes to reflect the newly created axis and trend line mappings.
NOTE
NOTE: If you do not see the new axis, verify that the applicable Single axis setting(s) are disabled, and that the Y-axis display option is set to Multiple.
15. Proceed as applicable based on whether you want to further configure design of the Trend Chart object:
TO CHANGE AXIS MAPPING IN A TREND CHART OBJECTWhen you add data to a Trend Chart object, the corresponding trend line is by default mapped to the primary X- and Y-axes (that is, the Chart X-Axis and the Chart Y-Axis). If you have specified more than one X- or Y-axis, however, you can map trend lines to the appropriate axes by taking the following steps:
1. Begin as applicable, based on the mode in which you are working:
2. In the Line-Axis Mapping dialog box, map each trend line to the desired axis, as follows:
– In the Lines pane, click the trend line to be mapped.
– From either the Configured X-axis or Configured Y-axis drop-down list, as applicable, select the axis to which the trend line should be mapped.
If you want to add another axis to the object: If you do not want to add another axis to the object:
A. Repeat steps 2 through 9. A. Proceed to step 11.
If you want to further configure design of the Trend Chart object:
If you do not want to further configure design of the Trend Chart object:
A. Leave the “CIMPLICITY Trend Chart Control Properties” dialog box open.
B. Refer to Trend Chart Configuration Overview for a list of configuration options.
A. Click OK to close the “CIMPLICITY Trend Chart Control Properties” dialog box.
If the CIMPLICITY Trend Chart Control Properties dialog box is not open:
If the CIMPLICITY Trend Chart Control Properties dialog box is open:
A. Right-click within the data display or axis areas of the Trend Chart object, then select Line/Axis Mapping. The “Line-Axis Mapping” dialog box appears.
A. Click the Axis tab.
B. In the toolbar below the axes table, click Line-Axis Mapping. The “Line-Axis Mapping” dialog box appears.

12–36 MULTILIN P30 PHASOR DATA CONCENTRATOR – INSTRUCTION MANUAL
USING THE ESV APPLICATION CHAPTER 12: ENERVISTA SYNCHROPHASOR VIEWER (ESV)
3. When you are finished mapping trend lines to axes, click OK. The “Line-Axis Mapping” dialog box closes.
4. Proceed as applicable based on the mode you were working in when you began the axis mapping process:
TO CHANGE AXIS SCALING IN A TREND CHART OBJECTIf after creating and populating a Trend Chart object you find that the scaling of one or more axes does not meet your visualization needs, you can do any of the following:
• Customize duration as represented on the X-axis
• Set a pre-configured duration as represented on the X-axis
• Set custom minimum and maximum limits on the Y-axis
• Optimize the Y-axis scale
• Set the Y-axis scale to reflect percentage
To Customize Duration as Represented on the X-AxisBy default, the duration across which a Trend Chart object displays data, as reflected on the X-axis, is 5 minutes. If a different duration better meets your visualization needs, you can change the time span of any X-axis in the object. To do so, take the following steps:
1. Begin as applicable, based on the mode in which you are working.
2. In the table listing the axes in the object, click the row corresponding to the X-axis whose duration you want to change.
3. In the “Duration” field below the axis table, enter the desired time span for the X-axis.
NOTE
NOTE: Duration format is ddd:hh:mm:ss, where:
– ddd - day number: 0–365
– hh - Hours: 0–24
– mm - minutes: 0–59
– ss - seconds: 0–59
4. Click Apply. The Trend Chart refreshes to update the display of all trend lines associated with the axis to reflect the newly specified duration.
TIP
TIP: If you have configured the Trend Chart with multiple lines, and have set the duration to 1 day or longer, a brief delay in data display may result, during which the Trend Chart goes blank.
NOTE
NOTE: If the axis is a secondary X-axis and does not reflect the newly specified duration, check the Single Time Duration option to ensure that it is disabled.
5. Proceed as applicable based on whether you want to change the duration for another X-axis in the Trend Chart object:
If the CIMPLICITY Trend Chart Control Properties dialog box was not open:
If the CIMPLICITY Trend Chart Control Properties dialog box was open:
The Trend Chart object refreshes to reflect the newly designated mapping(s) after you complete step 3, and no further action is required.
A. Click OK. The dialog box closes and the Trend Chart object refreshes to reflect the newly designated mapping(s).
If the CIMPLICITY Trend Chart Control Properties dialog box is not open:
If the CIMPLICITY Trend Chart Control Properties dialog box is open:
A. Right-click within the data display area of the object, then choose Timing. The “X-Axis” dialog box appears.
A. Click the “Axis” tab.

CHAPTER 12: ENERVISTA SYNCHROPHASOR VIEWER (ESV) USING THE ESV APPLICATION
MULTILIN P30 PHASOR DATA CONCENTRATOR – INSTRUCTION MANUAL 12–37
To Set a Pre-configured Duration as Represented on the X-AxisBy default, the duration across which a Trend Chart object displays data, as reflected on the X-axis, is 5 minutes. If a different duration better meets your visualization needs, you can change the time span assigned to the primary X-axis (that is, the Chart X-Axis) and, in turn, any data mapped to that axis, to one of several pre-configured values, specifically, 1 second, 1 minute, 1 hour, or 1 day. To do so, take the following steps.
1. Click the double-headed arrow on the “Trend Options” panel. The panel expands.
2. In the “Duration” area of the expanded “Trend Options” panel, click the corresponding button to assign the primary X-axis a duration of 1 Sec., 1 Min., 1 Hr., or 1 Day. The Trend Chart refreshes to update the display of all trend lines associated with the primary X-axis to reflect the newly specified duration.
TIP
TIP: If you have configured the Trend Chart with multiple lines, setting the duration to 1 day or longer may result in a brief delay in data display, during which the Trend Chart goes blank.
3. When you are satisfied with the duration setting, click the double-headed arrow on the “Trend Options” panel. The “Trend Options” panel collapses to fully reveal the chart area.
To Set Custom Minimum and Maximum Limits on the Y-axisIf after creating and populating a Trend Chart object you find that the scaling of one or more Y-axes does not meet your visualization needs, you can specify custom lower and upper scale limits. To do so, take the following steps:
1. Begin as applicable based on the mode in which you are working:
2. In the displayed table, click the entry for the Y-axis whose scale you want to change.
3. If the Autoscale option is enabled, disable it by clearing the corresponding check box.
4. Specify the desired Default upper limit and Default lower limit for the scale by entering the values in the corresponding fields.
5. Click Apply. The Trend Chart refreshes to reflect the new axis scale and adjust the positioning of all associated trend lines accordingly.
6. Proceed as applicable based on whether you want to customize scaling of another Y-axis in the Trend Chart object:
To set optimal upper and lower scale limits on the Y-axisIn a Trend Chart object, Y-axis scaling is by default set to reflect automatic calculation of optimal upper and lower scale limits based on the data mapped to the axis(es). If you disable this Autoscale option and subsequently want to enable it , take the following steps:
If you want to change the duration for another X axis in the object:
If you do not want to change the duration for another X axis in the object:
A. Repeat steps 2 through 4. A. Click OK. The dialog box closes, fully revealing the Trend Chart object.
If the CIMPLICITY Trend Chart Control Properties dialog box is not open:
If the CIMPLICITY Trend Chart Control Properties dialog box is open:
A. Right-click within the Y-axis area of the object and then select Limits. The “Y-Axis” dialog box appears.
A. Click the Axis tab
If you want to customize scaling of another Y-axis in the object:
If you do not want to customize scaling of another Y-axis in the object:
A. Repeat steps 2 through 5. A. Click OK to close the dialog box.

12–38 MULTILIN P30 PHASOR DATA CONCENTRATOR – INSTRUCTION MANUAL
USING THE ESV APPLICATION CHAPTER 12: ENERVISTA SYNCHROPHASOR VIEWER (ESV)
1. Complete the applicable steps based on the mode in which you are working:
To Set the Y-axis to Reflect PercentageBy default, the primary Y-axis (that is, the Chart Y-Axis) in a Trend Chart object is configured to reflect values for the lines that you map to the axis. If preferred, you can set the axis scale to reflect percentage instead. To do so, take the following steps:
1. Right-click within the data display area of the object, then select Trend Control Properties. The “CIMPLICITY Trend Chart Control Properties” dialog box appears.
2. Click the Chart tab, then click the Advanced button.
3. Set the Y-axis display option to Percent configured.
4. Click OK to close the “Advanced” dialog box.
5. Click OK. The primary Y-axis refreshes to reflect percentage, and all other Y-axes in the chart are hidden.
TO ASCERTAIN VALUE DELTAS ACROSS TIME IN A TREND CHART OBJECTIf you want to ascertain at a glance the difference in a given measurement's value between two points in time, you can do so by taking the following steps:
1. In the data display area of the Trend Chart object, point to the vertical slider bar until a double-headed arrow appears.
2. Click and drag the slider bar to the desired point in time, as indicated by the left slider bar value indicator near the bottom of the object, then repeat with the other slider bar until it is positioned at the desired point in time, as indicated by the right slider bar value indicator near the bottom of the object. The legend below the data display area dynamically updates to show each measurement's value at the two points in time marked by the slider bars as well as the Slider Value Delta in the corresponding columns.
NOTE
NOTE: If you previously adjusted your display settings to hide the legend and/or the Slider Value Delta column within the legend, refer to To Control Display of Components in a Trend Chart Object for instructions on showing the necessary component(s).
TO CHANGE LINE APPEARANCE IN A TREND CHART OBJECTIf, after specifying data to be displayed in a Trend Chart object, you find that the presentation attributes of the corresponding trend line(s) do not meet your visualization needs, you have several options for changing line appearance. Specifically, you can do any of the following:
If the CIMPLICITY Trend Chart Control Properties dialog box is not open:
If the CIMPLICITY Trend Chart Control Properties dialog box is open:
A. Right-click within the Y-axis area of the object, point to Autoscale, then select the listing for the Y-axis for which you want to set optimal upper and lower axis limits. The object refreshes to display optimal upper and lower limits for the selected Y-axis.
B. Repeat step 1A for each Y-axis for which you want to set optimal upper and lower axis limits.
A. Click the Axis tab.
B. In the table of axes, click the row containing the Y-axis for which you want to set optimal upper and lower limits. The dialog box refreshes to display the “Limits” area.
C. Select the Autoscale check box.
D. Click Apply. The object refreshes to display optimal upper and lower limits for the selected Y-axis.
E. Repeat steps 1B through 1D for each Y-axis for which you want to set optimal upper and lower axis limits.
F. Click OK.
CHAPTER 12: ENERVISTA SYNCHROPHASOR VIEWER (ESV) USING THE ESV APPLICATION
MULTILIN P30 PHASOR DATA CONCENTRATOR – INSTRUCTION MANUAL 12–39
• Change line color
• Change line style (that is, solid versus broken)
• Change line width (that is, thickness)
• Change line curve type
To Change Line Color in a Trend Chart ObjectIf, after specifying data to be displayed in a Trend Chart object, you want to change the color of the corresponding trend line, take the following steps:
NOTE
NOTE: The following procedure assumes that the “CIMPLICITY Trend Chart Control Properties” dialog box is already open. If this is not the case, right-click within the data display area of the object, then select Trend Control Properties to open the dialog box.
1. Click the Lines tab.
2. In the “Color” column of the table, click the colored box for the trend line whose color you want to change. A drop-down arrow appears beside the box.
3. Click the drop-down arrow beside the colored box. A color selection dialog box appears.
4. On the “Palette” tab In the color selection dialog box, click the color that you want to assign to the trend line. The color selection dialog box closes and the corresponding box in the table changes to reflect the selected color.
5. Click Apply. The Trend Chart refreshes to reflect the selected color for the line.
6. Proceed as applicable, based on whether you want to change the color of additional trend lines in the object:
7. Proceed as applicable, based on whether you want to further configure design of the Trend Chart object:
To Change Trend Line Style, Width, and/or Curve TypeIf, after specifying data to be displayed in a Trend Chart object, you want to change the style (that is, solid versus broken), width (that is, thickness), and/or curve type of a displayed trend line, take the following steps:
NOTE
NOTE: The following procedure assumes that the “CIMPLICITY Trend Chart Control Properties” dialog box is already open. If this is not the case, right-click within the data display area of the object, then select Trend Control Properties to open the dialog box.
1. Click the Lines tab.
2. In the table, click the row corresponding to the trend line whose style, width, and/or curve type you want to change.
3. Below the table, click Display. The “Line Display” dialog box appears.
If you want to change the color of additional trend lines in the object:
If you do not want to change the color of additional trend lines in the object:
A. Repeat steps 2 through 5. A. Proceed to step 7.
If you want to further configure design of the Trend Chart object:
If you do not want to further configure design of the Trend Chart object:
A. Leave the “CIMPLICITY Trend Chart Control Properties” dialog box open.
B. Refer to Trend Chart Configuration Overview for a list of configuration options.
A. Click OK to close the “CIMPLICITY Trend Chart Control Properties” dialog box.

12–40 MULTILIN P30 PHASOR DATA CONCENTRATOR – INSTRUCTION MANUAL
USING THE ESV APPLICATION CHAPTER 12: ENERVISTA SYNCHROPHASOR VIEWER (ESV)
4. Proceed as applicable, based on whether you want to change the style, width, and/or curve type for the trend line:
5. Click OK. The “Line Display” dialog box closes.
6. Click Apply. The Trend Chart refreshes to reflect the selected style, width, and/or curve type for the trend line.
7. Proceed as applicable, based on whether you want to change the style, width, and/or curve type of additional trend lines in the object:
8. Proceed as applicable, based on whether you want to further configure design of the Trend Chart object:
TO CONTROL DISPLAY OF COMPONENTS IN A TREND CHART OBJECTYou can control display of the following Trend Chart components:
• Trend lines in the data display area
• Chart axes
• Chart grid
• Chart scroll buttons
• Second chart slider bar
• Object legend
• Trend lines in the object legend
• Columns in the object legend
• Column headings in the object legend
• Slider bar value indicators
To Change the Trend Line’s... Do This...
Style Click the drop-down arrow beside the “Style” field, then select the desired option.
Width Click the drop-down arrow beside the “Width” field, then select the desired option.
Curve Type Click the drop-down arrow beside the “Expansion” field, then select the desired option:
- Step: Connects data points in a stepped curve.
OR
- Smooth: Connects data points in a smooth curve. The legend will always display the last actual value to the left of the cursor, such that the value in the legend does not reflect the line interpolation.
If you want to change the style, width, and/or curve type of additional trend lines in the object:
If you do not want to change the style, width, and/or curve type of additional trend lines in the object:
A. Repeat steps 2 through 6. A. Proceed to step 8.
If you want to further configure design of the Trend Chart object:
If you do not want to further configure design of the Trend Chart object:
A. Leave the “CIMPLICITY Trend Chart Control Properties” dialog box open.
B. Refer to Trend Chart Configuration Overview for a list of configuration options.
A. Click OK to close the “CIMPLICITY Trend Chart Control Properties” dialog box.

CHAPTER 12: ENERVISTA SYNCHROPHASOR VIEWER (ESV) USING THE ESV APPLICATION
MULTILIN P30 PHASOR DATA CONCENTRATOR – INSTRUCTION MANUAL 12–41
To Control Display of Trend Lines in the Data Display Area of a Trend Chart ObjectYou can control which, if any, trend lines are displayed in the data display area of a Trend Chart object. To do so, take the following steps:
1. Take the steps applicable to the mode you are working in:
To Control Display of Trend Chart AxesYou can control which axes are displayed in a Trend Chart object. To do so, take the following steps:
1. Right-click within the X-axis or Y-axis area of the object, as applicable, point to Show, then select the listing for the axis that you want to either display (as indicated by a check mark) or hide (as indicated by a cleared check mark).
2. Repeat step 1 until the display of axes meets your requirements.
NOTE
NOTE: You can also hide all Y-axes except the primary axis (that is, the Chart Y-Axis) at once, by taking the following steps:
• Right-click within the data display area of the object, then select Trend Control Properties. The CIMPLICITY “Trend Chart Control Properties” dialog box appears.
• Click the Chart tab, then click Advanced. The “Advanced” dialog appears.
• Set the Y-axis display option to Single.
• Click OK to close the “Advanced” dialog box.
• Click OK.
To Control Display of the Trend Chart GridYou can control whether the grid is displayed in the data display area of a Trend Chart object. To do so, take the following step:
1. Right-click within the data display area of the object, point to Show, then select Grid to either display the grid (as indicated by a check mark) or hide the grid (as indicated by a cleared check mark).
NOTE
NOTE: You can also control display of the grid by clicking the double-headed arrow on the “Trend Options” panel, clicking Toggle Grid, then clicking the double-headed arrow on the “Trend Options” panel to close the panel.
To Control Display of Trend Chart Scroll ButtonsYou can control whether a Trend Chart displays the buttons used to shift the time span for the data being viewed in a Trend Chart object either fractionally or fully backward or forward relative to the current duration setting. To do so, take the following step:
If the “CIMPLICITY Trend Chart Control Properties” dialog box is not open:
If the “CIMPLICITY Trend Chart Control Properties” dialog box is open:
A. Right-click within the data display area of the object, point to Show followed by Line, then select the listing for the line that you want to either display (as indicated by a check mark) or hide (as indicated by a cleared check mark).
NOTE: If you have not yet added data to the object, no lines will be available for selection.
The data display area of the object refreshes to either display or hide the trend line.
B. Repeat step 1A for each trend line for which you want to change display settings.
A. Click the Lines tab.
B. In the table of lines, select or clear the Visible check box to display or hide, respectively, the corresponding line in the data display area of the object.
C. Click Apply. The data display area of the object refreshes to either display or hide the trend line.
D. Repeat steps 1B and 1C for each trend line for which you want to change display settings.
E. When you are satisfied with the trend line display settings, click OK to close the dialog box.

12–42 MULTILIN P30 PHASOR DATA CONCENTRATOR – INSTRUCTION MANUAL
USING THE ESV APPLICATION CHAPTER 12: ENERVISTA SYNCHROPHASOR VIEWER (ESV)
1. Right-click within the data display area of the object, point to Show, and then select Scroll Buttons to either display the scroll buttons (as indicated by a check mark) or hide the scroll buttons (as indicated by a cleared check mark).
To Control Display of the Second Slider Bar in a Trend Chart ObjectYou can control whether to display the second slider bar, which allows for ascertaining at a glance the difference in a given measurement's value between two points in time. To do so, take the following step:
1. Right-click within the data display area of the object, point to Show, then select 2nd Slider to either display the second slider bar (as indicated by a check mark) or hide the second slider bar (as indicated by a cleared check mark).
To Control Display of Trend Chart LegendYou can control whether the legend is displayed in a Trend Chart object. To do so, take the following step:
1. Right-click within the legend area or the data display area of the object, then select Legend to either display the legend (as indicated by a check mark) or hide the legend (as indicated by a cleared check mark).
NOTE
NOTE: You can also control display of the legend by clicking the double-headed arrow on the “Trend Options” panel, clicking Toggle Legend, then clicking the double-headed arrow on the “Trend Options” panel to close the panel.
To Control Display of Trend Lines in a Trend Chart LegendYou can control which, if any, trend lines are displayed in the legend of a Trend Chart object. To do so, take the following steps:
1. Take the steps applicable to the mode in which you are working:
To Control Display of Columns in a Trend Chart LegendYou can customize the legend in a Trend Chart object to display or hide columns. To do so, take the following steps:
1. Right-click within the legend area of the object, point to Show Fields, then select the listing for the legend column that you want to either display (as indicated by a check mark) or hide (as indicated by a cleared check mark).
2. Repeat step 1 until the legend is configured as desired.To Control Display of Column Headings in a Trend Chart LegendYou can control whether column headings are displayed in the legend of a Trend Chart object. To do so, take the following step:
1. Right-click within the legend area of the object, then select Title to either display the legend column headings (as indicated by a check mark) or hide the legend column headings (as indicated by a cleared check mark).
If the “CIMPLICITY Trend Chart Control Properties” dialog box is not open:
If the “CIMPLICITY Trend Chart Control Properties” dialog box is open:
A. Right-click within the legend area of the object, point to Add Lines, then select the listing for the line that you want to either display (as indicated by a check mark) or hide (as indicated by a cleared check mark). The object legend refreshes to either display or hide the trend line.
B. Repeat step 1A for each trend line for which you want to change display settings.
A. Click the Lines tab.
B. In the table of lines, select or clear the In legend check box to display or hide, respectively, the corresponding line in the object legend.
C. Click Apply. The object legend refreshes to either display or hide the trend line.
D. Repeat steps 1B and 1C for each trend line for which you want to change display settings.
E. When you are satisfied with the trend line display settings, click OK to close the dialog box.

CHAPTER 12: ENERVISTA SYNCHROPHASOR VIEWER (ESV) USING THE ESV APPLICATION
MULTILIN P30 PHASOR DATA CONCENTRATOR – INSTRUCTION MANUAL 12–43
To Control Display of Slider Bar Value Indicators in a Trend Chart ObjectYou can control whether a Trend Chart object displays the text reflecting positioning of each slider bar as a date and time value. To do so, take the following step:
1. Right-click within the legend area of the object, then select Status to either display the slider bar value indicators (as indicated by a check mark) or hide the slider bar value indicators (as indicated by a cleared check mark).
NOTE
NOTE: You can also control display of slider bar value indicators by right-clicking within the data display area of the object, pointing to Show, then selecting Legend Status.
TO CHANGE AXIS LABEL AND APPEARANCE IN A TREND CHART OBJECTIf, after specifying data to be displayed in a Trend Chart object, you find that the names and/or presentation attributes of the object axes do not meet your visualization needs, you can do any of the following:
• Change axis label text
• Change axis label font settings
• Change axis color
To Change Axis Label TextIf, after specifying data to be displayed in a Trend Chart object, you find that the names of the object axes do not meet your visualization needs, you can change axis labels by taking the following steps.
1. Begin as applicable, based on the mode in which you are working:
2. In the table of axes, click the row containing the axis whose label text you want to change.
3. In the Label field, enter the desired name for the axis.
4. Click Apply. The Trend Chart object refreshes to reflect the newly specified label text for the selected axis.
5. Proceed as applicable, based on whether you want to change the label text for additional axes in the object:
To Change Axis Label FontIf, after specifying data to be displayed in a Trend Chart object, you find that the font settings of the axis labels do not meet your visualization needs, you can change the settings by taking the following steps:
NOTE
NOTE: The following procedure assumes that the “CIMPLICITY Trend Chart Control Properties” dialog box is already open. If this is not the case, right-click within the data display area of the object, then select “Trend Control Properties” to open the dialog box.
1. Click the Axis tab.
2. In the table of axes, click the row containing the axis whose label font you want to change.
If the “CIMPLICITY Trend Chart Control Properties” dialog box is not open:
If the “CIMPLICITY Trend Chart Control Properties” dialog box is open:
A. Right-click within the X- or Y-axis area, as applicable, then select Label. The applicable “Axis Labels” dialog box appears.
A. Click the Axis tab.
If you want to change the label text for additional axes in the object:
If you do not want to change the label text for additional axes in the object:
A. Repeat steps 2 through 4. A. Click OK.
12–44 MULTILIN P30 PHASOR DATA CONCENTRATOR – INSTRUCTION MANUAL
USING THE ESV APPLICATION CHAPTER 12: ENERVISTA SYNCHROPHASOR VIEWER (ESV)
3. In the toolbar below the table of axes, click the square “Aa” button. The “Font” dialog box appears.
4. Select the desired Font family, Font Style, and Size from the corresponding drop-down lists, then click OK to close the “Font” dialog box.
5. Click Apply. The Trend Chart object refreshes to reflect the newly specified label font settings for the selected axis.
6. Proceed as applicable, based on whether you want to change the label font settings for additional axes in the object:
To Change Axis ColorIf, after specifying data to be displayed in a Trend Chart object, you find that the colors of the object axes do not meet your visualization needs, you can change the axis color by taking the following steps:
1. Begin as applicable, based on the mode in which you are working:
2. In the Color column of the table, click the colored box for the axis whose color you want to change. A drop-down arrow appears beside the box.
3. Click the drop-down arrow beside the colored box. A color selection dialog box appears.
4. On the Palette tab In the color selection dialog box, double-click the color that you want to assign to the axis. The color selection dialog box closes and the corresponding box in the axis table changes to reflect the selected color.
5. Click Apply. The Trend Chart refreshes to reflect the selected color for the axis.
6. Proceed as applicable, based on whether you want to change the color of additional axes in the object:
TO CONTROL PROGRESSION IN A TREND CHART OBJECTIn controlling progression in a Trend Chart object, you can do the following:
• Temporarily pause progression
• Resume progression
To Temporarily Pause Progression in a Trend Chart ObjectIf you need time to examine Trend Chart data, you can pause progression in the object by taking the following step:
1. Right-click within the data display area of the object, then select Pause.
If you want to change the label font for additional axes in the object:
If you do not want to change the label font for additional axes in the object:
A. Repeat steps 2 through 5. A. Click OK.
If the “CIMPLICITY Trend Chart Control Properties” dialog box is not open:
If the CIMPLICITY Trend Chart Control Properties dialog box is open:
A. Right-click within the X- or Y-axis area, as applicable, then select Label. The applicable “Axis Labels” dialog box appears.
A. Click the Axis tab.
If you want to change the color of additional axes in the object:
If you do not want to change the color of additional axes in the object:
A. Repeat steps 2 through 5. A. Click OK.

CHAPTER 12: ENERVISTA SYNCHROPHASOR VIEWER (ESV) USING THE ESV APPLICATION
MULTILIN P30 PHASOR DATA CONCENTRATOR – INSTRUCTION MANUAL 12–45
To Resume Progression in a Trend Chart ObjectAfter temporarily pausing progression in a Trend Chart object, you can reestablish progression by taking the following step:
1. Do either of the following:
– Right-click within the data display area of the object, then select Pause.
OR
– Click the double-headed arrow on the “Trend Options” panel, click Clear Pause/Zoom, then click the double-headed arrow on the “Trend Options” panel to close the panel. Progression resumes and is synchronized to the Display Time.
TO SHIFT THE TIME SPAN IN A TREND CHART OBJECTIf you want to shift the time span for the data being viewed in a Trend Chart object either fractionally or fully backward or forward relative to the duration setting of the primary X-axis (that is, the Chart X-Axis), take the following step:
1. While the Trend Chart object is either running or paused, click the applicable scroll button below the data display area:
– [<] Shifts the time span backward by a configured percentage relative to the duration associated with the primary X-axis
TIP
TIP: The default scroll percentage is 50, which you can modify as outlined under To change scrolling percentage in a Trend Chart object.
– [<<] Shifts the time span backward fully relative to the duration associated with the primary X-axis
– [>]Shifts the time span forward by a configured percentage relative to the duration associated with the primary X-axis
NOTE
NOTE: If you are viewing a time span predating the current system time by more than the duration associated with the primary X-axis, clicking this button or the button described below will result in trend lines disappearing at the right-most side of the chart, because the time span will have shifted to the future.
– [>>]Shifts the time span forward fully relative to the duration associated with the primary X axis
TO CHANGE SCROLLING PERCENTAGE IN A TREND CHART OBJECTBy default, the percentage that the time span in a Trend Chart object shifts when you click either the [<] or [>] scroll button is 50. If a different percentage better meets your visualization needs, you can change this setting by taking the following steps.
NOTE
NOTE: The following procedure assumes that the “CIMPLICITY Trend Chart Control Properties” dialog box is already open. If this is not the case, right-click within the data display area of the object, select Trend Control Properties, then take the following steps.
1. Click the Chart tab.
2. Click Advanced. The “Advanced” dialog box appears.
3. Specify the desired “Scroll Percentage” setting by entering the value in the corresponding field.
4. Click OK to close the “Advanced” dialog box.
5. Click OK to close the “CIMPLICITY Trend Chart Control Properties” dialog box.

12–46 MULTILIN P30 PHASOR DATA CONCENTRATOR – INSTRUCTION MANUAL
USING THE ESV APPLICATION CHAPTER 12: ENERVISTA SYNCHROPHASOR VIEWER (ESV)
TO ZOOM THE VIEW IN A TREND CHART OBJECTIf you need to more closely examine data for a time span within the overall duration that a Trend Chart object is currently set to visualize, you can temporarily freeze progression in the object and adjust the display area to show only the desired time span and trend lines magnified accordingly. To do so, take the following step:
1. In the data display area of the Trend Chart object, click and drag to highlight the time span and trend line(s) that you want to examine. Progression pauses and the duration is adjusted based on your selection, while the affected trend line(s) are magnified, and all other object components are changed accordingly.
TIP
TIP: To cause trend lines to display data based on zoom level—such that if the view is zoomed out, an interpolated retrieval mode is used to optimize performance, whereas if the view is zoomed in to examine data over a very short duration, raw mode is used to show the actual measured samples at high resolution—set the data retrieval mode to one of the hybrid options, being sure to enable the Auto Sample Interval option as part of the process.
NOTE
NOTE: To cancel zooming and resume progression in the object, either right-click within the display area of the object, then select Unzoom, or click the double-headed arrow on the “Trend Options” panel, click Clear Pause/Zoom, and then click the double-headed arrow on the “Trend Options” panel to close the panel.
TO CHANGE AUTOMATIC UPDATE INTERVAL IN A TREND CHART OBJECTIn relation to trend lines whose Auto update setting is enabled, the automatic update interval is the time period between data updates. The default setting is 5 seconds. If a different interval better suits your visualization needs, you can change this setting on a per-line basis by taking the following steps:
FASTPATH: A setting lower than 5 seconds may cause a degradation in stability.
NOTE
NOTE: The following procedure assumes that the “CIMPLICITY Trend Chart Control Properties” dialog box is already open. If this is not the case, right-click within the data display area of the object, then select Trend Control Properties to open the dialog box.
1. Click the Chart tab.
2. Adjust the Auto update interval setting by entering the desired value in the corresponding field.
TIP
TIP: Auto update interval format is hh:mm:ss, where:
– hh - Hours: 0–24
– mm - minutes: 0–59
– ss - seconds: 0–59
NOTE
NOTE: This setting determines the time between data updates in trend lines whose Auto update option is enabled, but does not change the shape of the trend lines or the number of data points represented.
3. Click OK. The dialog box closes, and the Trend Chart updates all affected lines according to the newly designated interval.
TO CHANGE DATA RETRIEVAL MODE IN A TREND CHART OBJECTThe default mode of retrieving data for display in a Trend Chart object is Hybrid Lab. If this setting does not meet your visualization needs, you can change it on a per-line basis.

CHAPTER 12: ENERVISTA SYNCHROPHASOR VIEWER (ESV) USING THE ESV APPLICATION
MULTILIN P30 PHASOR DATA CONCENTRATOR – INSTRUCTION MANUAL 12–47
NOTE
NOTE: One of several hybrid modes can be used to return data in the Trend Object based on zoom level, such that if the view is zoomed out, an interpolated retrieval mode is used to optimize performance, whereas if the view is zoomed in to examine data over a very short duration, raw mode is used to show the actual measured samples at high resolution. This may prove particularly helpful when visualizing synchrophasor data, which is sampled at very high rates. Note that this functionality requires the Auto sample interval option to be enabled.
To change data retrieval mode in a Trend Chart object, take the following steps.
NOTE
NOTE: The following procedure assumes that the “CIMPLICITY Trend Chart Control Properties” dialog box is already open. If this is not the case, right-click within the data display area of the object, then select Trend Control Properties to open the dialog box.
1. Click the Lines tab.
2. In the table of lines, click the row containing the line whose data retrieval mode you want to change.
3. Below the table of lines, click Display. The “Line Display” dialog box appears.
4. From the “Retrieval Mode” drop-down list, select the desired option:
NOTE
NOTE: Raw mode is NOT supported in the EnerVista Synchrophasor Viewer. To view raw data, instead choose one of the Hybrid modes, then while viewing the chart, zoom in to examine data over a very short duration. When you do so, the actual measured samples are shown at high resolution. The default and recommended retrieval mode is Hybrid Lab.
RETRIEVAL MODE
PLOTTED VALUE
Raw Average
Definition Arithmetic average of raw tags in the sample interval.
Comment This is useful only when a sufficient number of raw samples are collected.
Minimum
Definition Minimum value in the sample interval.
Comment The value may be a raw value or an interpolated value.
Maximum
Definition Maximum value in the sample interval.
Comment The value may be a raw value or an interpolated value.
Lab
Definition Actual collected raw values.
Comment Interval timestamps are the same as in interpolated sampling; it is the values that can be different. Since lab sampling will return real collected values, it is more accurate when a sufficient number of raw samples are stored.
Use Interpolated sampling for highly compressed data.
Average
Definition Average of the raw samples.
Comment There is special logic for time weighting and for computing the value at the start of the sample interval.NOTE: This is useful for computing an average on compressed data.
Trend
Definition Raw minimum and raw maximum value for each specified interval.

12–48 MULTILIN P30 PHASOR DATA CONCENTRATOR – INSTRUCTION MANUAL
USING THE ESV APPLICATION CHAPTER 12: ENERVISTA SYNCHROPHASOR VIEWER (ESV)
Comment Use to maximize performance when retrieving data points for plotting.IMPORTANT: A start time, end time, and an interval or number of samples must be specified.
Trend sampling always returns an even number of samples, rounded up when necessary. If for instance, you request one sample in a specified time interval, trending returns two samples. The graphical output from a request for seen samples is the same as the output for eight samples.
Interpolated
Definition Evenly spaced interpolated values based on the sampling interval configured for the trend line.
Comment Compression requires interpolation. Even if you are not using compression, you can use interpolation if you want samples spaced on intervals other than the collection rate. If you only want actual collected values to be returned, use Lab sampling.
Typically, you use interpolated queries when data is not collected on a set time schedule, or if you want to see the results returned in an interval that is less than the collection rate.
For example, these instances show when you can use interpolated mode to make evenly spaced values:
– An Historian tag is collected as unsolicited. In this case, we really do not know what the time interval is between collected values.
– The Historian deadband and/or archive compression for a tag results in non-evenly spaced collection intervals.
– An Historian tag is collected once per 8 hours, but you want to see it displayed in 1-hour intervals with a linear slope between points.
Raw Standard Deviation
Definition Arithmetic standard deviation of raw values for each calculation interval.
Comment
Standard Deviation
Definition Time-weighted standard deviation for each calculation interval.
Comment This is useful for computing a standard deviation on compressed data.
Count
Definition Number of raw samples in the interval.
Comment This addresses only the count and not values or qualities of the samples. Count is useful for analyzing the distribution of the raw data samples.
Raw Total
Definition Arithmetic sum of raw values for each interval.
Comment Use this mode to compute an accurate total when a sufficient number of raw samples are collected.
Total
Definition Time-weighted total for each calculation interval.
RETRIEVAL MODE
PLOTTED VALUE

CHAPTER 12: ENERVISTA SYNCHROPHASOR VIEWER (ESV) USING THE ESV APPLICATION
MULTILIN P30 PHASOR DATA CONCENTRATOR – INSTRUCTION MANUAL 12–49
5. If you have selected a calculated retrieval mode, and you want 1,000 samples to be retrieved for the corresponding trend line even when some portion of the display area is zoomed, causing the duration to change accordingly, ensure that the Default Sample Interval Enable option is enabled, as indicated by a check mark in the corresponding check box.
6. Click OK. The “Line Display” dialog box closes.
7. Click Apply. The Trend Chart refreshes to reflect the selected retrieval mode for the trend line.
8. Proceed as applicable, based on whether you want to change the data retrieval mode for additional trend lines in the object:
Comment The collected value must be a rate. This calculation mode determines a count from the collected rate.
Hybrid Lab
Definition Hybrid of the Raw and Lab sample modes that:
– returns Lab values if the actual number of stored samples is more than the requested number of samples based on the Trend Chart duration,
OR
– returns Raw values if the actual number of stored samples is fewer than or equal to the requested number of samples based on the Trend Chart duration.
Hybrid Trend
Definition Hybrid of the Raw and Trend sample modes that:
– returns Trend values if the actual number of stored samples is more than the requested number of samples based on the Trend Chart duration,
OR
– returns Raw values if the actual number of stored samples is fewer than or equal to the requested number of samples based on the Trend Chart duration.
Hybrid Interpolated
Definition Hybrid of the Raw and Interpolated sample modes that:
– returns interpolated values if the actual number of stored samples is more than the requested number of samples based on the Trend Chart duration,
OR
– returns Raw values if the actual number of stored samples is fewer than or equal to the requested number of samples based on the Trend Chart duration.
RETRIEVAL MODE
PLOTTED VALUE

12–50 MULTILIN P30 PHASOR DATA CONCENTRATOR – INSTRUCTION MANUAL
USING THE ESV APPLICATION CHAPTER 12: ENERVISTA SYNCHROPHASOR VIEWER (ESV)
TO CHANGE DATA SAMPLE INTERVAL IN A TREND CHART OBJECTSample interval is the time over which data is collected for calculation or combination to obtain a single point of data in a trend line. The default sample interval is 1 second. If a different sample interval better suits your visualization needs, you can change this setting on a per-line basis by taking the following steps.
NOTE
NOTE: The following procedure assumes that the “CIMPLICITY Trend Chart Control Properties” dialog box is already open. If this is not the case, right-click within the data display area of the object, then select Trend Control Properties to open the dialog box.
1. Click the Lines tab.
2. In the table of lines, click the row containing the line whose data sample interval you want to change.
3. Below the table of lines, click Display. The “Line Display” dialog box appears.
4. If the Auto sample interval option is enabled, disable it by clearing the corresponding check box.
NOTE
NOTE: Disabling this option prevents what may be the desired behavior of 1,000 samples being retrieved for the trend line even when some portion of the data display area is zoomed, causing the duration to change accordingly.
5. Adjust the Sample interval setting by specifying the desired numerical value and unit of time (that is, second, minute, or hour) in the corresponding fields.
FASTPATH: The designated sample interval should limit the number of data points displayed on any given trend line to approximately 1,000.
Example: If the X-axis that the trend line is associated with is configured to show 2 days of data (Duration setting of 02:00:00:00) at a sample interval of 1 second (00:00:01), there will be 172,800 values to plot. However, the server limit is approximately 5,000 data points. So in this scenario, a reasonable sample interval would be 2 minutes (00:02:00) or higher, that is, 1,440 data points to plot across the chart.
6. Click OK. The “Line Display” dialog box closes.
7. Click Apply. The Trend Chart refreshes to reflect changes in the corresponding trend line based on the selected sample interval.
8. Proceed as applicable, based on whether you want to change the data sample interval for additional trend lines in the object:
TO ENABLE PRIMARY AXIS SYNCHRONIZATION IN A TREND CHART OBJECTIn a Trend Chart object, you can configure multiple X- and Y-axes, and trend lines are synchronized to whichever axes you specify. If it better suits your visualization needs to synchronize all trend lines to the primary X and/or Y axis (that is, the Chart X-Axis and/or Chart Y-Axis), regardless of the axis(es) that you have mapped lines to, you can do so by taking the following steps.
If you want to change the data retrieval mode for additional trend lines in the object:
If you do not want to change the data retrieval mode for additional trend lines in the object:
A. Repeat steps 2 through 7. A. Click OK.
If you want to change the data sample interval for additional trend lines in the object:
If you do not want to change the data sample interval for additional trend lines in the object:
A. Repeat steps 2 through 7. A. Click OK to close the dialog box.

CHAPTER 12: ENERVISTA SYNCHROPHASOR VIEWER (ESV) USING THE ESV APPLICATION
MULTILIN P30 PHASOR DATA CONCENTRATOR – INSTRUCTION MANUAL 12–51
NOTE
NOTE: The following procedure assumes that the “CIMPLICITY Trend Chart Control Properties” dialog box is already open. If this is not the case, right-click within the data display area of the object, then select Trend Control Properties to open the dialog box.
1. Click the Chart tab.
2. Click Advanced. The “Advanced” dialog box appears.
3. Select the Single X-axis defined and/or Single Y-axis defined check box.
NOTE
NOTE: The Single X-axis defined option is mutually exclusive with the Single Time Duration option, such that if you enable the former, the latter becomes unavailable.
4. Click OK to close the Advanced dialog box.
5. Click OK. The Trend Chart object refreshes to display only the primary X- and/or Y-axis and synchronizes all trend lines accordingly.
NOTE
NOTE: If you select to synchronize all trend lines to the primary Y-axis, and the Autoscale option is enabled, the axis rescales to encompass the values of all trend lines in the object. In this scenario, if the scale of any secondary axis to which one or more trend lines are mapped is markedly different from that of the primary Y-axis, those trend lines may be positioned at the far extreme of the scale, rendering them more difficult to discern. In this case, disabling the Autoscale option for the primary Y-axis and specifying scale limits well outside the values of the trend lines should make the lines easier to discern. For instructions, see To add and map axes in a Trend Chart object.
TO ENFORCE A SINGLE DURATION SETTING IN A TREND CHART OBJECTIf you have configured multiple X-axes for a Trend Chart object, you can, by default, establish different durations for each axis. If you prefer that all axes reflect the duration specified for the primary X-axis (that is, the Chart X-Axis), take the following steps.
NOTE
NOTE: The following procedure assumes that the “CIMPLICITY Trend Chart Control Properties” dialog box is already open. If this is not the case, right-click within the data display area of the object, then select Trend Control Properties to open the dialog box.
1. Click the Chart tab.
2. Click Advanced. The “Advanced” dialog box appears.
3. Select the Single Time Duration check box.
NOTE
NOTE: This option is unavailable if the Single X-axis defined option is enabled, because a single X-axis requires a single time duration.
4. Click OK to close the Advanced dialog box.
5. Click OK. The Trend Chart object refreshes all axes to reflect the duration specified for the primary X-axis.
NOTE
NOTE: The Single time duration option does not alter the configured duration settings of secondary X-axes, such that if you want to subsequently disable the option, the secondary X-axes will again reflect their respective duration settings.
TO CHANGE SLIDER BAR GRAB MARGIN IN A TREND CHART OBJECTBy default, the distance from the slider bar that you can position the mouse pointer and still grab the bar is 2 pixels. If a different distance better meets your needs, you can change this setting by taking the following steps.

12–52 MULTILIN P30 PHASOR DATA CONCENTRATOR – INSTRUCTION MANUAL
USING THE ESV APPLICATION CHAPTER 12: ENERVISTA SYNCHROPHASOR VIEWER (ESV)
NOTE
NOTE: The following procedure assumes that the “CIMPLICITY Trend Chart Control Properties” dialog box is already open. If this is not the case, right-click within the data display area of the object, then select Trend Control Properties to open the dialog box.
1. Click the Chart tab.
2. Click Advanced. The “Advanced” dialog box appears.
3. Specify the desired Slider Grab Margin setting by entering a value between 0 and 10 in the corresponding field.
NOTE
NOTE: Slider bar grab margin is measured in pixels.
4. Click OK to close the “Advanced” dialog box.
5. Click OK.
Historical visualization in ESVThe Historical Playback feature synchronizes all created visualization objects and worksheets—whether currently displayed or not—to show data starting from a specified time in the past through any time up to and including live time. When this feature is enabled, any object created or worksheet opened will reflect data for the specified historical time frame until you either disable the feature or the close the EnerVista Synchrophasor Viewer (ESV) session.
TO ENABLE HISTORICAL PLAYBACKTake the following steps to enable Historical Playback of all created visualization objects:
1. On the main toolbar, click Historical Playback. The “CIMPLICITY DGR” dialog box appears.
2. In the “Mode” area, select Historical Replay. After initialization (which may take some time), the dialog box refreshes to make available the “Time Definition input area,” and play pauses in all created visualization objects.
3. In the corresponding fields, specify the desired time frame for which you want to visualize data:
– Start date / End date: Either enter the date components directly in the field, or click the drop-down arrow, then select the date from the displayed calendar.
– Start time / End time: Either enter the time components directly in the field, or click the time component that you want to change, then click the up or down arrow beside the field until the desired value is displayed.
4. Click Set Start and End Date Time. All created objects refresh to reflect the specified start time as the Display Time.
5. Optionally, adjust the Playback Speed by clicking the slider control, holding down the mouse button, then dragging the control until the desired playback speed is displayed.
6. Proceed as applicable, based on the desired visualization mode:

CHAPTER 12: ENERVISTA SYNCHROPHASOR VIEWER (ESV) USING THE ESV APPLICATION
MULTILIN P30 PHASOR DATA CONCENTRATOR – INSTRUCTION MANUAL 12–53
7. When you are finished visualizing historical data, disable Historical Playback mode in one of the following ways:
– In the Mode area of the “CIMPLICITY DGR” dialog box, select Live.
– Close the EnerVista Synchrophasor Viewer application.
NOTE
NOTE: The preceding two methods leave the “CIMPLICITY DGR” dialog box open and your “Historical Playback” configuration settings in place, should you want to subsequently replay visualization using the same settings.
– Close the “CIMPLICITY DGR” dialog box.
P30 Historian Expression Operators overview in ESVExpressions can be used to perform a variety of calculations on the data for one or more Historian tags in order to visualize the results in a Trend Chart line. The tables below show the operators used to build such expressions. The section below: Building an Historian Expression Showing the Angular Difference Between Two Synchrophasors, is an example that illustrates how to build an Historian expression for determining the phase angle difference between two voltage synchrophasors, which facilitates visualizing interconnection-wide views of grid stress. This is a common application of synchrophasor data.
ARITHMETIC OPERATORS
To visualize data in continuous playback mode:
To visualize data in jog playback mode:
A. Click [>]. All created visualization objects automatically play back data based on the specified historical period and playback speed.TIPS: - You can pause and then resume playback from either the pause time or the beginning of the specified historical period. To do the former, click the “Pause” button followed by [>]; to do the latter, click the “Stop” button followed by [>].
- To specify a different historical period, playback must be stopped by clicking the “Stop” button.
A. In the Jog Interval field, enter the time span that you want the visualization playback to progress by in each start/stop cycle.NOTES: - You can specify a value down to the microsecond.
- If the Jog Interval field is not available, pause or stop playback by clicking “Pause” or “Stop” buttons, respectively.
B. Click the “Play/Pause” button. All created visualization objects play back data for the specified time span, then playback pauses.NOTE: If you needed to pause or stop playback at step 6A, playback resumes either from pause time or the beginning of the specified historical period, respectively.
C. Repeat step 6B as required to meet your visualization needs.
- Returns Difference between X and Y
Format <expr1>-<expr2>
Example: To determine angular difference between voltage phasors: ‘\\MyHistorianConnection\StationA.10.PhaseA.VA’ - ‘\\MyHistorianConnection\StationB.14.PhaseA.VA’
* Returns Product of X and Y
Format <expr1>*<expr2>

12–54 MULTILIN P30 PHASOR DATA CONCENTRATOR – INSTRUCTION MANUAL
USING THE ESV APPLICATION CHAPTER 12: ENERVISTA SYNCHROPHASOR VIEWER (ESV)
/ Returns Quotient of X and Y
Format <expr1>/<expr2>
NOTE: The result of dividing two integers in an expression will be an integer. If you want the result to be a floating tag, multiply the numerator by 1.0 before dividing.
Example:‘\\MyHistorianConnection\StationA.10.PhaseA.IM’ is set to 6. ‘\\MyHistorianConnection\StationA.14.PhaseA.IM’ is set to 4.
Results:‘\\MyHistorianConnection\StationA.10.PhaseA.IM ‘\\MyHistorianConnection\StationA.14.PhaseA.IM = 1 (‘\\MyHistorianConnection\StationA.10.PhaseA.IM/‘*1.0 T‘\\MyHistorianConnection\StationA.14.PhaseA.IM = 1.5
^ Returns Value of X raised to the power of Y
Format <expr1>^<expr2>
| Will be substituted by double quotes in an expression
+ Returns Sum of X and Y
Format <expr1>+<expr2>
ABS Returns Absolute value of X
Format ABS(expr)
Example:ABS(-2.6) returns 2.6
CEIL Returns Nearest integer greater than, or equal to, X
Format CEIL (expr)
Example:CEIL(2.3) returns 3CEIL(-2.3) returns -2
FLR Returns Nearest integer less than, or equal to, X
Format FLR(expr)
Examples:FLR(2.6) returns 2FLR(-2.6) returns -3
MAX Returns Maximum comparing X and Y
Format <expr1> MAX <expr2>
Example:3 MAX 4 returns 4
MIN Returns Minimum comparing X and Y
Format <expr1> MIN <expr2>
Example:3 MIN 4 returns 3
MOD Returns Value of X modulo Y
Format <expr1> MOD <expr2>
Example:9 MOD 8 returns 1
RND Returns Integer nearest to X
Format RND(expr)
Example:RND(2.6) returns 3RND(-2.6) returns -3

CHAPTER 12: ENERVISTA SYNCHROPHASOR VIEWER (ESV) USING THE ESV APPLICATION
MULTILIN P30 PHASOR DATA CONCENTRATOR – INSTRUCTION MANUAL 12–55
BITWISE OPERATORS
CONVERSION OPERATOR
SQR Returns Square root of X
Format SQR(<expr>)
TRUNC
Returns Value of X with the fractional part removed; the result is its integer value.
Format TRUNC(expr)
Examples:TRUNC(2.6) returns 2TRUNC(-2.6) returns -2
BAND Performs Bitwise AND of X and Y
Format <expr1>AND<expr2>
BOR Performs Bitwise OR of X and Y
Format <expr1>OR<expr2>
BNOT Performs Bitwise NOT of X and Y
Format <expr1>NOT<expr2>
BXOR Performs Bitwise XOR of X and Y
Format <expr1>XOR<expr2>
SHL Performs Value of X shifted left by Y bits
Format <expr1>SHL<expr2>
Example:2 SHL 1 returns 4
NOTE: When SHL goes out of range the:• Tag becomes unavailable
• Tag Control Pane is starred
• Core status log notes that it is unavailable.SHR Performs Value of X shifted right by Y bits
Format <expr1>SHR<expr2>
Example:2 SHR 1 returns 1
NOTE: When SHR goes out of range the:• Tag becomes unavailable
• Tag Control Pane is starred
• Core status log notes that it is unavailable.
VAL Returns Numeric value of a text string.
NOTE: VAL converts a variable that consists of numbers in text string format to a numeric format that can be included in calculations.
Format VAL(expr)

12–56 MULTILIN P30 PHASOR DATA CONCENTRATOR – INSTRUCTION MANUAL
USING THE ESV APPLICATION CHAPTER 12: ENERVISTA SYNCHROPHASOR VIEWER (ESV)
LOGICAL OPERATORS
QUALITY OPERATORS
RELATIONAL OPERATORS
AND Performs Logical AND of X and Y
Format <expr1>AND<expr2>
NOT Performs Logical NOT of X
Format NOT<expr>
OR Performs Logical OR of X and Y
Format <expr1>OR<expr2>
XOR Performs Logical XOR of X and Y
Format <expr1>XOR<expr2>
GetQualityBit Gets Quality Bit for the specified bit index
NOTE: GetQualityBit retrieves the quality of the specified expression for a given bit number. The bit number ranges from 0 to 31.
Format
GetQualityBit(<expression>,<bit index>)
IsAvailable Returns
If X is available
Format
IsAvailable(<value>)
QL Retrieves
The quality (32 bit integer) returned for the wrapped expression.
Format
QLS[<expr>]
EQ Returns True if X is equal to Y
Format <expr1>EQ<expr2>
GE Returns True if X is greater than or equal to Y
Format <expr1>GE<expr2>
GT Returns True if X is greater than Y
Format <expr1>GT<expr2>
LE Returns True if X is less than or equal to Y
Format <expr1>LE<expr2>
LT Returns True if X is less than Y
Format <expr1>LT<expr2>
NE Returns True if X is not equal to Y
Format <expr1>NE<expr2>
CHAPTER 12: ENERVISTA SYNCHROPHASOR VIEWER (ESV) USING THE ESV APPLICATION
MULTILIN P30 PHASOR DATA CONCENTRATOR – INSTRUCTION MANUAL 12–57
SCIENTIFIC OPERATORS
TIMESTAMP OPERATORS
Building an Historian Expression in ESV Showing the Angular Difference Between Two Synchrophasors
Expressions can be used to perform a variety of calculations on the data for one or more Historian tags in order to visualize the results in a Trend Chart line. The tables below show the operators used to build such expressions. The section below: Building an Historian Expression Showing the Angular Difference Between Two Synchrophasors, is an example that illustrates how to build an Historian expression for determining the phase angle difference between two voltage synchrophasors, which facilitates visualizing interconnection-wide views of grid stress. This is a common application of synchrophasor data.
1. Right-click within the data display area of the Trend Chart object, then select Trend Control Properties. The “CIMPLICITY Trend Chart Control Properties” dialog box appears, displaying the Lines tab.
ACOS Returns Arc cosine (angle in radians) of X radians.
Format ACOS(<expr>)
ASIN Returns Arc sine (angle in radians) of X radians.
Format ASIN(<expr>)
ATAN Returns Arc tangent (angle in radians) of X radians.
Format ATAN(<expr>)
COS Returns Cosine (angle in radians) of X radians.
Format COS(<expr>)
EXP Returns Value of e raised to the power of X.
NOTE: EXP is the exponential (ex) value of an expression where X is the expression.
Format EXP(<expr>)
LOG Returns Natural logarithm (base e) of X.
Format LOG(<expr>)
LOG10 Returns Base 10 logarithm of X.
Format LOG10(<expr>)
SIN Returns Sine (angle in radians) of X radians.
Format SIN(<expr>)
TAN Returns Tangent (angle in radians) of X radians.
Format TAN(<expr>)
CalcSpan Returns An unsigned 64-bit integer containing a timestamp (in decimicroseconds) that represents the span of that duration.
Format CalcSpan[<days>,<hours>,<minutes>,<seconds>,<fracsec>]
CalcStamp Returns An unsigned 64-bit integer containing the timestamp (in decimicroseconds) that represents them.
Format CalcStamp[<year>,<month>,<day>,<hour>,<minute>,<second>,<fracsec>]
TS Retrieves
Timestamp returned for the wrapped expression.
Format TS(<expr>)

12–58 MULTILIN P30 PHASOR DATA CONCENTRATOR – INSTRUCTION MANUAL
USING THE ESV APPLICATION CHAPTER 12: ENERVISTA SYNCHROPHASOR VIEWER (ESV)
2. Below the displayed table on the Lines tab, click Create a new line. The table refreshes to display an entry for the newly created trend line.
3. From the “Line Type” drop-down list, select Historian Expression.
NOTE
NOTE: Line types other than Historian and Historian Expression are not applicable to the ESV.
The dialog box refreshes to display the “Expression” field.
4. Click the button directly to the right of the “Expression” field. The “Edit Expression” dialog box appears.
5. In the Edit Expression dialog box, click Historian. The “Select a Tag” dialog box appears.
6. From the Connection drop-down list, select the Historian containing the synchrophasor (that is, tag) that you want to use in the expression.

CHAPTER 12: ENERVISTA SYNCHROPHASOR VIEWER (ESV) USING THE ESV APPLICATION
MULTILIN P30 PHASOR DATA CONCENTRATOR – INSTRUCTION MANUAL 12–59
NOTE
NOTE: If you have not saved your login credentials for the selected Historian and have not previously logged in to the Historian during the current session, a dialog box will appear, in which you must enter your User Name [preceded by the appropriate Domain Name followed by a backslash (that is, DomainName\UserName), if applicable to your environment) and Password, then click OK, before continuing. If you choose to cancel this prompt, you will not be able to access data in the corresponding Historian until you either navigate away from the worksheet or close, then reopen, the application.
7. Click Browse. The pane in the lower area of the “Select a Tag” dialog box refreshes to display a table listing the tags contained in the Historian.
NOTE
NOTE: For information, see Historian tag naming conventions.
8. In the table of tags, click the listing for the tag that you want to use in the expression.
9. Click OK. The “Select a Tag” dialog box closes, and the Input field of the “Edit Expression” dialog box refreshes to display the selected tag.
NOTE
NOTE: All Historian tags must be fully qualified by the Historian connection name and must be enclosed in single quotes.
10. Below the Input field in the “Expression Editor” dialog box, double-click the box containing the minus sign.
NOTE
NOTE: For information on expression operators, see Expression Operators Overview.
The operator is inserted in the Input field at the location of your cursor.
11. Repeat steps 5 through 9 for the second tag that you want to include as part of the expression. After this, the “Edit Expression” dialog box reflects the complete expression for visualizing the angular difference between the selected synchrophasors.

12–60 MULTILIN P30 PHASOR DATA CONCENTRATOR – INSTRUCTION MANUAL
USING THE ESV APPLICATION CHAPTER 12: ENERVISTA SYNCHROPHASOR VIEWER (ESV)
NOTE
NOTE: As illustrated in the image below, expressions can use synchrophasor data from more than one Multilin P30 Historian.
12. Click OK. The “Expression Editor” dialog box closes, and the table on the Lines tab refreshes to display the designated expression in the entry created at step 2.
13. Review the Auto Update option, setting to ensure that it is enabled, as indicated by a check mark in the corresponding check box.
NOTE
NOTE: This option controls whether the Trend Chart object continually refreshes to reflect updated data acquired by the Historian.
14. Click Apply. The Trend Chart refreshes to display a trend line for the specified expression.
15. Click OK. The “CIMPLICITY Trend Chart Control Properties” dialog box closes, fully revealing the Trend Chart.

MULTILIN P30 PHASOR DATA CONCENTRATOR – INSTRUCTION MANUAL 13–1
Multilin P30
Chapter 13: Multilin P30 Theory of Operation
GE Energy
Multilin P30 Theory of Operation
Up sampling
The data obtained from the PMUs installed at different geographical locations, may have multiple reporting rates and different time delays over the network. However, the Multilin P30 must align and structure all these received PMU data at one user-defined output rate. One solution to address the different rates it to “Up-sample” all rates to a common rate. On a 60 Hz system, 120 frames/sec is the least common multiple of all standardized reporting rates (100 frames/sec for a 50 Hz system). To address the variable data-arrival latency, a user-defined wait-time is also implemented to ensure that communication channel-delayed PMU data can be included in the aggregated data frames.The Multilin P30 uses an up-sampling algorithm for this feature, which is not applied to the data if the input and output data rates are identical. In addition, if the Multilin P30 sends any up-sampled data, it also sets STAT bit-9 for that corresponding PMU. This will be set (if standard Draft support is enabled while configuration is outputting) to indicate that inserted data has been interpolated, not actually measured.

13–2 MULTILIN P30 PHASOR DATA CONCENTRATOR – INSTRUCTION MANUAL
DATA INTERPOLATION FOR MISSING DATA CHAPTER 13: MULTILIN P30 THEORY OF OPERATION
Data interpolation for missing data
When the relationship (present time – stored arrival time) is greater than, or equal to, the configured wait time - while all the PMU data for a given time stamp (slot) has not been received, and sufficient buffered data exists - missing data will be interpolated. If we consider N to be the FIR filter length used in the Multilin P30 firmware, then data for both prior (N-1)/2 and post (N-1)/2 time stamps are generally required for data interpolation. However the Multilin P30 firmware carries out the operation so long as the amount of missing data is less than, or equal to, 1+2*(120/Reporting Rate -1). In the case where missing data is obtained from interpolation, the Multilin P30 indicates this by setting the C37.118.2 STAT bit-9 (Draft 2 of the C37.118 specification must be enabled in the EnerVista P30 Setup software) for the corresponding PMU. In this way users are informed of when data has been interpolated by the Multilin P30 , and is not actually received from a PMU.In cases where data cannot be interpolated, the Multilin P30 inserts invalid data into the configured output, and sets STAT bit 15.

CHAPTER 13: MULTILIN P30 THEORY OF OPERATION DOWN SAMPLING
MULTILIN P30 PHASOR DATA CONCENTRATOR – INSTRUCTION MANUAL 13–3
Down sampling
Filtering is an option and it is applied when it is selected by user.
NOTE
NOTE: It is recommended when either the Multilin P30 output rate is less than the Multilin P30 input rate or it is not an integer factor of the Multilin P30 input rate (e.g. input 20 and output 30, for each Multilin P30 output). Filtering is not required when the output-reporting rate is equal to, or higher than, the input reporting rate. Filters are not applied to the digitals.
Even though the data is up-sampled to 120Hz, the up-sampled data will not be used if filtering and up-sampled data are not essentially required. The filter is calculated using the following equation:
Where Y is the output of the FIR filter and X is the input phasor to the FIR filter, b=[b0, b1, b2, …… bL-1] which is the filter coefficient, L is the length of the filter (number of taps), n is the phasor index number. Note that L is purposely selected as an odd number, so that (L-1) is divisible by 2 (i.e. make the filter symmetrical so as to eliminate the phase shift of the filter).Note that when the report rate is set to 60 Hz, the number of taps of the FIR filter is 9, i.e. totally 9 phasors are required as the input to the filter. These 9 phasors include the present phasor X(n), 4 historical phasors: X(n-1), X(n-2), X(n-3), X(n-4) and 4 future phasors: X(n+1), X(n+2), X(n+3), X(n+4). The output of the filter: Y(n)=b0*X(n-4) + b1*X(n-3) + b2*X(n-2) + b3*X(n-1) + b4*X(n)+ b5*X(n+1) + b6*X(n+2) + b7*X(n+3) + b8*X(n+4).

13–4 MULTILIN P30 PHASOR DATA CONCENTRATOR – INSTRUCTION MANUAL
HANDLING OF STAT BITS CHAPTER 13: MULTILIN P30 THEORY OF OPERATION
Handling of STAT bits
The Basic Configuration screen (see the System Setup > Outputs section) contains a setting - “Draft Features” - based on the IEEE C37.118.2 Draft Version (D3.2, released in May 2011).
The STAT bit information, from the IEEE C37.118.2 Draft Version, can be enabled or disabled. If enabled, the enhanced STAT bit information proposed in this Draft Version is used. For example, Bit-9 is set if the missing data is interpreted, and Bits 6 to 8 are recognized as PMU TQ (Time Quality). Refer to IEEE C37.118.2/D3.2, May 2011 for more details.
NOTE
NOTE: The Draft Version applies only to the STAT bits in the latest draft. Other functionalities proposed in this draft standard (e.g. CFG-3) are not yet supported.
1. STAT bit-15 (Data Valid) can be set to high by the Multilin P30 if the PMU connection is lost or valid data is not received. Moreover, the Multilin P30 also inserts invalid data, mag-1 and angle-360, in the data field.
2. STAT bit-14 (PMU Error) is allowed to pass through if received “high”. The ESV >> PMU status window flashes “Internal or Configuration Error” if this bit is high.
3. STAT bits-14 and 15 both are set to 1 by the Multilin P30 if the Multilin P30 has lost connection with a particular PMU. This way, the ESV knows that there is a connection loss between the PMU and the Multilin P30; not between the Historian and the Concentrator.
4. STAT bit-13 (PMU Sync Error) is allowed to pass through the Multilin P30 ; the Multilin P30 does not change this bit in any case. The ESV >> PMU status window flashes the “Time Sync Error” item which is on the list.
5. STAT bit-12 (Data Sorting Type) is not used by Multilin P30 v1.0. Currently the Multilin P30 simply discards the message if the time stamp received is not within the +/- 1ms tolerance required by the Multilin P30 . This bit is passed through by the Multilin P30.
6. STAT bit-11 (PMU Trigger Pickup). The Multilin P30 does not use this bit; it is simply set to zero under all conditions. The ESV has the provision to display when this bit is high, but the bit is passed through by the Multilin P30.

CHAPTER 13: MULTILIN P30 THEORY OF OPERATION HANDLING OF STAT BITS
MULTILIN P30 PHASOR DATA CONCENTRATOR – INSTRUCTION MANUAL 13–5
7. STAT bit-10 (Configuration Changed) received from the PMU, is passed through the Multilin P30 . No masking/resetting is done on this bit.
8. Bit-9 (Data Modified Indicator) will be set to high by the Multilin P30 in the case where the data frame (for the corresponding time stamp of the aggregated frame) is not received from a client/ PMU, and the Multilin P30 has interpolated the data. In this case, the Draft Version setting must be enabled (otherwise it's masked). It is also set to “high” for filtered data.
9. The Multilin P30 passes through STAT bits 6 to 8, as received from the PMU (per the C37.118-2005 standard), where either the C37.118.2 Draft 3.2 version is not enabled in the Multilin P30 OR the Draft version is enabled in the Multilin P30 Client/PMU. On the other hand, if the Multilin P30 Client/PMU is not compliant with the C37.118.2 Draft 3.2, the Multilin P30 can still send Time Quality (TQ) using STAT bits 6 to 8 (if the Draft version is enabled during Output configuration), by obtaining this information from the FRACSEC TQ nibble.
10. STAT bits-4 and 5 (Unlocked Time). The Multilin P30 allows these bits to pass through. The ESV >> PMU status window shows “Unlock time” close to the display of “Time Sync Error”.
11. STAT bits-0 to 3 (Trigger Reason) are not used by the Multilin P30. The Multilin P30 simply allows these bits to pass through.
12. The Pseudo PMU also supports 8 STAT bits which represent the TQ of the Multilin P30 device, as well as STAT bit-13 (of the Pseudo PMU), representing the status of the synchronization source for the Multilin P30. The remaining STAT bits are unused for Pseudo PMUs, and are hence set to 0.

13–6 MULTILIN P30 PHASOR DATA CONCENTRATOR – INSTRUCTION MANUAL
CLIENT/PMU CONFIGURATION CHANGE CHAPTER 13: MULTILIN P30 THEORY OF OPERATION
Client/PMU configuration change
If the Multilin P30 receives the STAT Bit-10 high from a PMU, the Multilin P30 logs the event “Client Configuration Change,” and sends a STOP data command to the particular PMU which sent the indication of a configuration change. Subsequent to the STOP command the Multilin P30 requests the PMU to send a new CFG-2 frame. Upon receipt of this frame, the Multilin P30 updates the internal buffers and sends a START command to the PMU. If a change in configuration is possible automatically, the received data frame is interpreted by the Multilin P30 , otherwise user intervention is required upon recognition of the Client Configuration Change event in the system Event Recorder.
NOTE
NOTE: The unit must be set to the “Programmed” mode before the configuration change is activated.
If the user sees continuous invalid data for a particular PMU, the user should go to Product Setup > Installation, and set “Unit not programmed”.
Then the user should go to System Setup > Inputs and click on the Read button to read the new configurations and configure the outputs accordingly.
The user should then press the button in Command > Activate New Configuration.

CHAPTER 13: MULTILIN P30 THEORY OF OPERATION CLIENT/PMU CONFIGURATION CHANGE
MULTILIN P30 PHASOR DATA CONCENTRATOR – INSTRUCTION MANUAL 13–7
This will reboot the Multilin P30 and establish a connection again, with a new configuration. Make sure that the unit is again set to “Programmed” in order to enable its inputs and outputs.
1. Automatic reconfiguration by the Multilin P30 : if there is change of the time base (TIME_BASE); Data rate change (DATA_RATE); Data format change (rectangular/polar OR int/float) (FORMAT)
2. Other than the above, the following items require manual reconfiguration: number of PMUs included in data frame (NUM_PMU), PHNMR, ANNMR, DGNMR, CHNMR, FNOM, Data scale change (PHUNIT, ANUNIT, DIGUNIT).
NOTE
NOTE: Upon receipt of a configuration change (STAT bit-10) from a client/PMU, the Multilin P30 latches an event “Client Configuration Change” in the Event Recorder for the corresponding Client/PMU. Upon this event occurring, the user should confirm if any of the output streams is affected by this Client/PMU configuration change (continuous streaming of INVALID data from the Multilin P30 ). If the answer is “yes,” the user should again manually configure the corresponding Multilin P30 inputs and outputs.

13–8 MULTILIN P30 PHASOR DATA CONCENTRATOR – INSTRUCTION MANUAL
CLIENT/PMU CONFIGURATION CHANGE CHAPTER 13: MULTILIN P30 THEORY OF OPERATION

MULTILIN P30 PHASOR DATA CONCENTRATOR – INSTRUCTION MANUAL a–1
Multilin P30
Appendix A: Application example
GE Energy
Application example
Certificate Management and FreeRADIUS.net setup
Multilin P30 can act as a RADIUS client and has the ability to authenticate users with a central/remote RADIUS server using EAP-TTLS protocol. Authentication is performed with the help of certificates.Initial Setup:Any cryptography application like OpenSSL etc can be used to create certificates. First, a private key and certificate request are created for the server. The certificate request contains the public key, and the server’s information (name, email, organization etc.).The certificate request is then sent to a certificate authority (CA) for their digital signature. If the request is sent to a well-known CA, then upon receiving payment from the RADIUS server’s administrator, the CA verifies the information and signs the certificate. The administrator can choose not to use external well known CA’s services and create a local CA instead. The signed certificate of the server along with CA’s public certificate are then sent back to the RADIUS server administrator. Finally, the CA’s public certificate is uploaded on to the Multilin P30. In this example, a local CA is created and used to sign the server’s certificate request.

a–2 MULTILIN P30 PHASOR DATA CONCENTRATOR – INSTRUCTION MANUAL
CERTIFICATE MANAGEMENT AND FREERADIUS.NET SETUP APPENDIX A: APPLICATION EXAMPLE
Authentication:The Multilin P30 user initiates the authentication process by providing user credentials. P30 then tries to establish a trust relationship with the radius server. The RADIUS server identifies itself via a certificate which it sends to the Multilin P30. This certificate holds the server’s information:
• version
• public key
• subject
• serial number
• valid from
• valid until
• key-usage
• signature algorithm
• “issuer” (i.e. CA) etc.
TheMultilin P30 then validates server’s identity by verifying the server’s certificate against the CA’s certificate that it has. If both the server and CA’s certificates are signed by the same trusted authority (CA), a client side trust relationship is successfully established.
Setting up a simple RADIUS serverThe following example demonstrates how one could set up a test bench RADIUS server. A proper RADIUS server should only be deployed by qualified IT professionals. The third party tools and services mentioned below are for demonstration purposes and do not imply endorsement by GE.
OpenSSL OpenSSL is used to create certificates. Download and install the windows port of OpenSSL (Win32 OpenSSL v1.0.1) from the following location: http://www.slproweb.com/products/Win32OpenSSL.html
RADIUS server Download and install FreeRADIUS.net (Windows version) from the following location: http://freeradius.net/
Certificatemanagement
Create Private Key for ServerTo create a private key:openssl genrsa –out server.key 4096Here:
1. RSA based private key is generated
2. It is not a password protected key.Create Certificate Request for ServerTo create a certificate request:openssl req –new –key server.key –out server.csr

APPENDIX A: APPLICATION EXAMPLE CERTIFICATE MANAGEMENT AND FREERADIUS.NET SETUP
MULTILIN P30 PHASOR DATA CONCENTRATOR – INSTRUCTION MANUAL a–3
While using the above command, you will be asked to enter the following information that will be incorporated into the certificate request. What you enter here is called a Distinguished Name or a DN. All this information is sent with the certificate request. The two 'extra' attributes ("A challenge password" and "An optional company name") are left blank for this example.Example:
Create a Signed Certificate for ServerCA certificates (assuming it to be your root certificate from CA) are created and later used to sign the server’s certificate request.
1. Create a private key for the root CA: openssl genrsa -out ca.key 4096
2. Create a public certificate and self-sign it: openssl req -new -x509 -days 3650 -key ca.key -out ca.crt While using the above command, you will be asked to enter information that will be incorporated into your certificate. Please make sure that while entering this information (as depicted in the previous step) at least the Common Name (CN) of the CA and the Server certificate does NOT match. This will avoid possible naming collision and related errors later on.
3. Use server’s certificate request (server.csr) that was created in the previous section and sign it with CA: openssl x509 –req –days 3650 –in server.csr –CA ca.crt –CAkey ca.key –set_serial 01 –out server.crt
[Here, x509 tool is used to add a digital signature to the certificate:
• –req, with this option, a certificate request is expected instead of the certificate (by default).
• –in, specifies the input file to read the certificate from.
• –CA, specifies the CA certificate to be used for signing. When this option is present, x509 behaves like a “mini CA”. The input file is signed by this CA using this option: that is its issuer name is set to be the subject name of the CA and it is digitally signed using the CA’s private key. This option is normally combined with the –req option. Without the –req option, the input is a certificate which must be self-signed.
• –CAkey, when the -CA option is used to sign a certificate, it uses a serial number specified in a file. This file consists of one line containing an even number of hex digits with the serial number to use. After each use, the serial number is incremented and written out to the file again.
• –set_serial, specifies the serial number to use.
• –out, specifies the output file to write to.
• –days, specifies the number of days the certificate is valid for.]

a–4 MULTILIN P30 PHASOR DATA CONCENTRATOR – INSTRUCTION MANUAL
CERTIFICATE MANAGEMENT AND FREERADIUS.NET SETUP APPENDIX A: APPLICATION EXAMPLE
RADIUS serverconfiguration
Transfer Certificates to ServerCopy the following files onto the FreeRADIUS.net server under the directory containing the certificates. In this example, <Path_to_Radius>\etc\raddb\certs\FreeRADIUS.net\DemoCerts:
1. server.key
2. server.crt
3. ca.crtConfigurationModify the following files to configure RADIUS server:
• RADIUSD.CONF Locate the “bind_address” field and set it to your server’s IP address.
• USERS.CONF Add users in this file. It is available under <Path_to_Radius>\etc\raddb directory. Adding the following text configures a user “Tester” which has “Administrator” role:Tester: ->User-Password == “Testing” ->GE-PDC-USER-Role = Administrator
• CLIENTS.CONF Add clients in this file. It is available under <Path_to_Radius>\etc\raddb directory.
The following text defines a RADIUS client (Multilin P30 ) with the assumption that its IP-address is 10.0.0.2 and subnet mask is 255.255.255.0. The “secret” that is specified here should also be configured on the Multilin P30 for successful authentication. client 10.0.0.2/24 { secret = testing123 shortname = private-network-1 }
• DICTIONARY.GE Create a file called “dictionary.ge” under <Path_to_Radius>\etc\raddb and add the following content to it:

APPENDIX A: APPLICATION EXAMPLE CERTIFICATE MANAGEMENT AND FREERADIUS.NET SETUP
MULTILIN P30 PHASOR DATA CONCENTRATOR – INSTRUCTION MANUAL a–5
Add the following line (as shown in the figure below) to the “dictionary” file present under <Path_to_Radius>\etc\raddb:$INCLUDE dictionary.ge
• EAP.CONF The file is available under <Path_to_Radius>\etc\raddb directory. Locate the “tls” block and add respective entries to “private_key_file”, ” certificate_file” and “CA_file” fields as shown below:

a–6 MULTILIN P30 PHASOR DATA CONCENTRATOR – INSTRUCTION MANUAL
CERTIFICATE MANAGEMENT AND FREERADIUS.NET SETUP APPENDIX A: APPLICATION EXAMPLE
Start ServerThe following file can be used to start the RADIUS server in debug mode:<Path_to_Radius>/start_radiusd_debug.batIt is recommended to first run the RADIUS server in debug mode, otherwise, you will not be able to see what is going on and you will not be able to correct any problems.
P30 (RADIUS client)configuration
The CA’s public certificate needs to be transferred to Multilin P30. Since the Multilin P30 accepts the certificates in DER format, we must first convert the signed certificate from PEM format to DER:
openssl x509 -in ca.crt -inform PEM -out ca.der -outform DERPlace the DER file (ca.der) on the Multilin P30 device via EnerVista P30 Setup (Device -> Maintenance -> Certificates).Finally update the Remote RADIUS shared secret (as set up in clients.conf) via EnerVista P30 Setup.