ge 3q'17 supplemental information · supplemental information * non-gaap financial measures....
TRANSCRIPT
Imagination at work.
2. Orders & backlog by segment
3. Equipment orders
4. Equipment/services revenue by segment Q3’17
5. Equipment/services revenue by segment Q3’17 YTD
6. Industrial revenue & operating profit*
7. Industrial & Ind’l segments organic op profit growth*
8. Industrial segment organic revenue growth*
9. Organic revenue by segment*
10. BHGE & GE Oil & Gas reporting walk*
11. Oil & Gas ex. BHI revenue and operating profit*
12. Units summary – orders
13. Units summary – sales
14. Regional summary
15. Corporate revenue & operating profit (cost)*
16. Operating & Industrial operating + Verticals earnings & EPS*
17. GE effective tax rate (ex. GE Capital)*
18. Industrial structural cost*
19. GE Capital segment results
20. GE Capital segment assets
21. 2017 Operating framework
22-27 Non-GAAP supplemental information*
GE 3Q'17supplemental information
* Non-GAAP financial measures. See the following pages for reconciliations of these measures to the most directly comparable GAAP financial measures. Also see the Non-GAAP supplemental materials section for descriptions of non-GAAP financial measures and the reasons we believe that they provide useful information to investors.
Imagination at work.
2
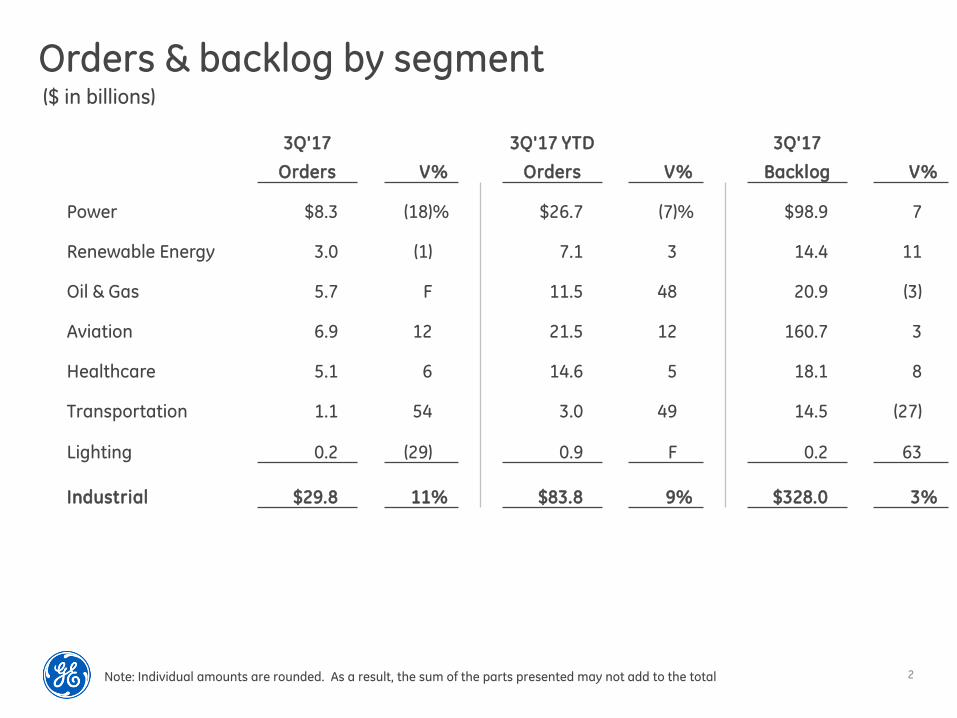
Orders & backlog by segment($ in billions)
3Q'17 3Q'17 YTD 3Q'17
Orders V% Orders V% Backlog V%
Power $8.3 (18)% $26.7 (7)% $98.9 7%
Renewable Energy 3.0 (1)% 7.1 3% 14.4 11%
Oil & Gas 5.7 F% 11.5 48% 20.9 (3)%
Aviation 6.9 12% 21.5 12% 160.7 3%
Healthcare 5.1 6% 14.6 5% 18.1 8%
Transportation 1.1 54% 3.0 49% 14.5 (27)%
Lighting 0.2 (29)% 0.9 F% 0.2 63%
Industrial $29.8 11% $83.8 9% $328.0 3%
Note: Individual amounts are rounded. As a result, the sum of the parts presented may not add to the total
3
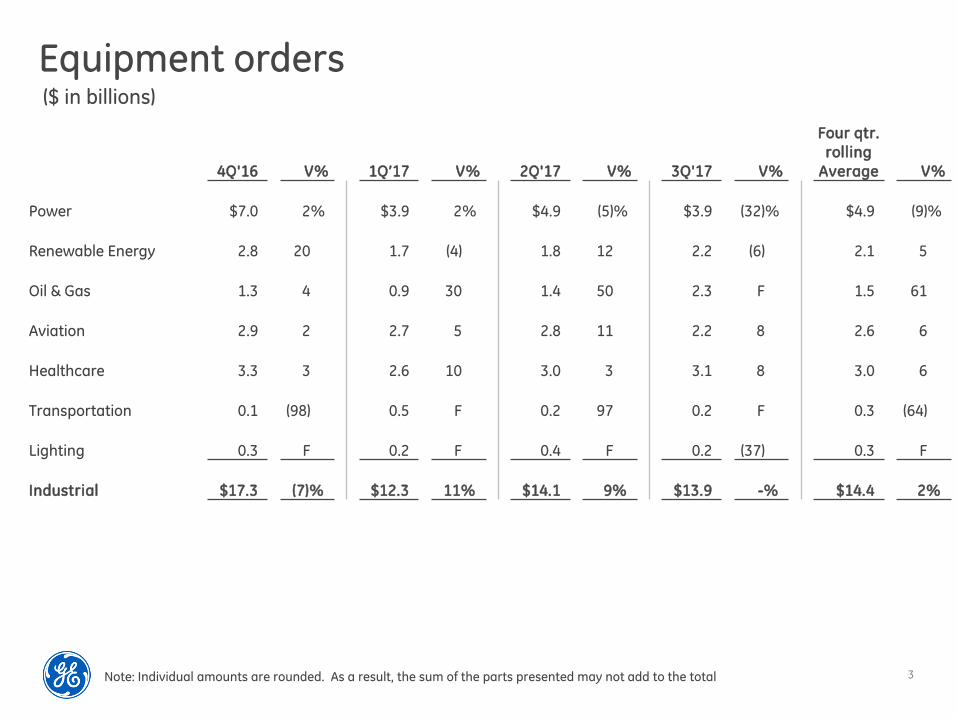
Equipment orders($ in billions)
4Q'16 V% 1Q’17 V% 2Q'17 V% 3Q'17 V%
Four qtr.rolling
Average V%
Power $7.0 2% $3.9 2% $4.9 (5)% $3.9 (32)% $4.9 (9)%
Renewable Energy 2.8 20% 1.7 (4)% 1.8 12% 2.2 (6)% 2.1 5%
Oil & Gas 1.3 4% 0.9 30% 1.4 50% 2.3 F% 1.5 61%
Aviation 2.9 2% 2.7 5% 2.8 11% 2.2 8% 2.6 6%
Healthcare 3.3 3% 2.6 10% 3.0 3% 3.1 8% 3.0 6%
Transportation 0.1 (98)% 0.5 F% 0.2 97% 0.2 F% 0.3 (64)%
Lighting 0.3 F% 0.2 F% 0.4 F% 0.2 (37)% 0.3 F%
Industrial $17.3 (7)% $12.3 11% $14.1 9% $13.9 -% $14.4 2%
Note: Individual amounts are rounded. As a result, the sum of the parts presented may not add to the total
4
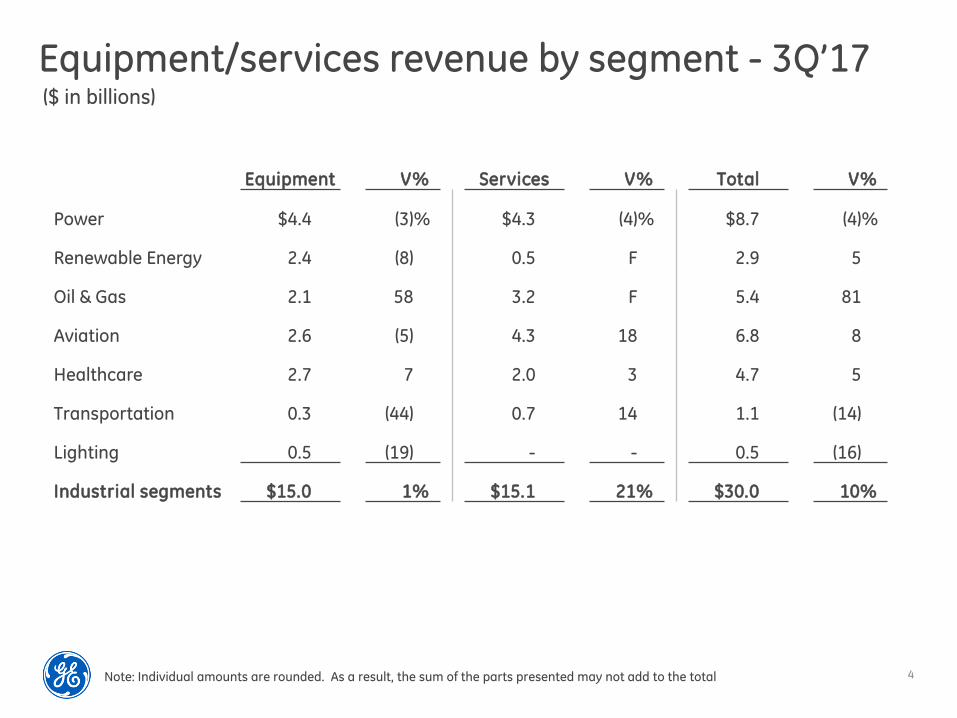
($ in billions)
Equipment/services revenue by segment - 3Q’17
Equipment V% Services V% Total V%
Power $4.4 (3)% $4.3 (4)% $8.7 (4)%
Renewable Energy 2.4 (8)% 0.5 F% 2.9 5%
Oil & Gas 2.1 58% 3.2 F% 5.4 81%
Aviation 2.6 (5)% 4.3 18% 6.8 8%
Healthcare 2.7 7% 2.0 3% 4.7 5%
Transportation 0.3 (44)% 0.7 14% 1.1 (14)%
Lighting 0.5 (19)% - -% 0.5 (16)%
Industrial segments $15.0 1% $15.1 21% $30.0 10%
Note: Individual amounts are rounded. As a result, the sum of the parts presented may not add to the total
5
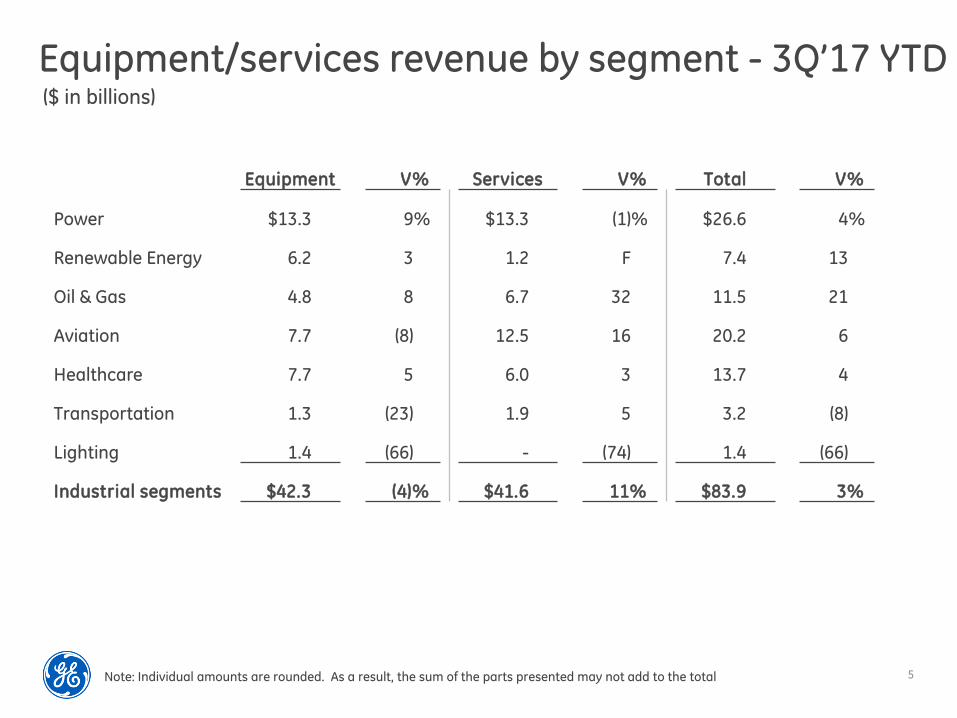
($ in billions)
Equipment/services revenue by segment - 3Q’17 YTD
Equipment V% Services V% Total V%
Power $13.3 9% $13.3 (1)% $26.6 4%
Renewable Energy 6.2 3% 1.2 F% 7.4 13%
Oil & Gas 4.8 8% 6.7 32% 11.5 21%
Aviation 7.7 (8)% 12.5 16% 20.2 6%
Healthcare 7.7 5% 6.0 3% 13.7 4%
Transportation 1.3 (23)% 1.9 5% 3.2 (8)%
Lighting 1.4 (66)% - (74)% 1.4 (66)%
Industrial segments $42.3 (4)% $41.6 11% $83.9 3%
Note: Individual amounts are rounded. As a result, the sum of the parts presented may not add to the total

6
3Q'17 3Q'16 V% 3Q'17 YTD 3Q'16 YTD V%Revenue
GE total revenue (GAAP) $31,603 $27,172 16% $84,506 $82,382 3%
Less: GE Capital earnings (loss) 24 26 (195) (1,466)
GE revenue excl. GE Capital earnings (loss)(Industrial revenue) (GAAP) 31,580 27,146 16% 84,701 83,849 1%
Less: gains on disposals 1,897 208 1,899 3,395Adjusted Industrial revenue (non-GAAP) 29,682 26,938 10% 82,801 80,453 3%
CostsGE total costs and expenses 29,903 24,909 20% 80,344 75,977 6%Less: GE interest and other financial charges 718 483 1,918 1,490
Industrial costs excluding interest and other financial charges (GAAP) 29,185 24,426 19% 78,426 74,488 5%
Less: non-operating pension costs (pre-tax) 570 511 1,708 1,534Less: restructuring and other charges 2,294 683 4,022 2,557Less: noncontrolling interests 140 76 236 275
Adjusted Industrial costs (non-GAAP) $26,181 $23,156 13% $72,459 $70,121 3%
Industrial profit (GAAP) $2,394 $2,720 (12)% $6,275 $9,361 (33)%Industrial profit margins (GAAP) 7.6% 10.0% (2.4)pts. 7.4% 11.2% (3.8)pts.
Industrial operating profit (non-GAAP) $3,501 $3,782 (7)% $10,342 $10,332 -%Industrial operating profit margins (non-GAAP) 11.8% 14.0% (2.2)pts. 12.5% 12.8% (0.3)pts.
($ in millions)
Non-GAAP reconciliation
Industrial revenue & operating profit
Note: Individual amounts are rounded. As a result, the sum of the parts presented may not add to the total
7
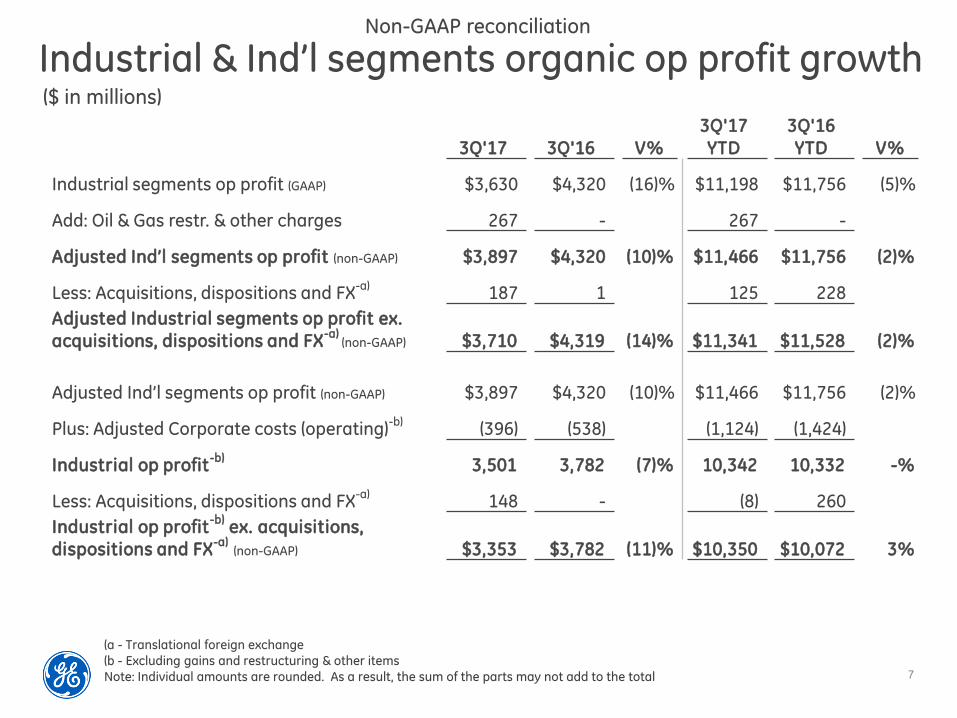
(a - Translational foreign exchange
(b - Excluding gains and restructuring & other items
Note: Individual amounts are rounded. As a result, the sum of the parts may not add to the total
Industrial & Ind’l segments organic op profit growth
3Q'17 3Q'16 V%3Q'17 YTD
3Q'16 YTD V%
Industrial segments op profit (GAAP) $3,630 $4,320 (16)% $11,198 $11,756 (5)%
Add: Oil & Gas restr. & other charges 267 - 267 -
Adjusted Ind’l segments op profit (non-GAAP) $3,897 $4,320 (10)% $11,466 $11,756 (2)%
Less: Acquisitions, dispositions and FX-a)
187 1 125 228
Adjusted Industrial segments op profit ex. acquisitions, dispositions and FX
-a)(non-GAAP) $3,710 $4,319 (14)% $11,341 $11,528 (2)%
Adjusted Ind’l segments op profit (non-GAAP) $3,897 $4,320 (10)% $11,466 $11,756 (2)%
Plus: Adjusted Corporate costs (operating)-b)
(396) (538) (1,124) (1,424)
Industrial op profit-b)
3,501 3,782 (7)% 10,342 10,332 -%
Less: Acquisitions, dispositions and FX-a)
148 - (8) 260
Industrial op profit-b)
ex. acquisitions, dispositions and FX
-a) (non-GAAP) $3,353 $3,782 (11)% $10,350 $10,072 3%
Non-GAAP reconciliation
($ in millions)

8
($ in millions)
Industrial segments organic revenue growth
(a- Translational foreign exchange
Note: Individual amounts are rounded. As a result, the sum of the parts presented may not add to the total
Non-GAAP reconciliation
3Q'17 3Q'16 V% 3Q'17 YTD 3Q'16 YTD V%
Industrial segments revenue (GAAP) $30,046 $27,335 10% $83,943 $81,667 3%
Less the effects of:
Acquisitions, dispositions and FX-a)
3,135 63 3,225 2,874
Industrial segments revenue excluding the
effects of acquisitions, dispositions
and FX-a)
(non-GAAP) $26,911 $27,272 (1)% $80,718 $78,793 2%
9
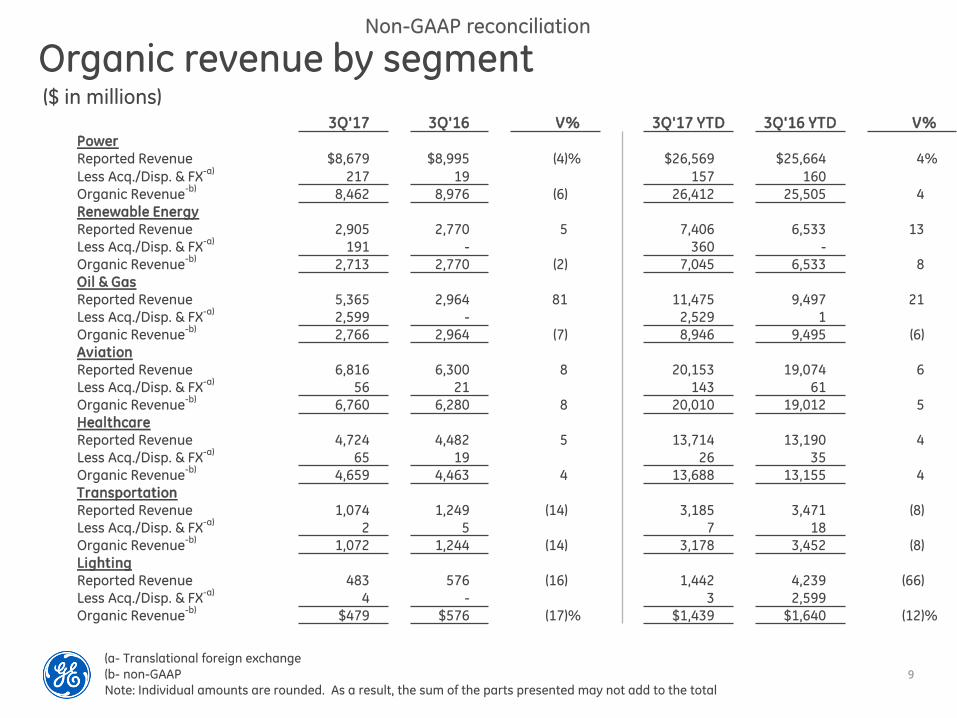
Organic revenue by segment($ in millions)
Non-GAAP reconciliation
(a- Translational foreign exchange
(b- non-GAAP
Note: Individual amounts are rounded. As a result, the sum of the parts presented may not add to the total
3Q'17 3Q'16 V% 3Q'17 YTD 3Q'16 YTD V%PowerReported Revenue $8,679 $8,995 (4)% $26,569 $25,664 4%
Less Acq./Disp. & FX-a)
217 19 157 160Organic Revenue
-b)8,462 8,976 (6)% 26,412 25,505 4%
Renewable EnergyReported Revenue 2,905 2,770 5% 7,406 6,533 13%Less Acq./Disp. & FX
-a)191 - 360 -
Organic Revenue-b)
2,713 2,770 (2)% 7,045 6,533 8%Oil & GasReported Revenue 5,365 2,964 81% 11,475 9,497 21%Less Acq./Disp. & FX
-a)2,599 - 2,529 1
Organic Revenue-b)
2,766 2,964 (7)% 8,946 9,495 (6)%AviationReported Revenue 6,816 6,300 8% 20,153 19,074 6%Less Acq./Disp. & FX
-a)56 21 143 61
Organic Revenue-b)
6,760 6,280 8% 20,010 19,012 5%HealthcareReported Revenue 4,724 4,482 5% 13,714 13,190 4%Less Acq./Disp. & FX
-a)65 19 26 35
Organic Revenue-b)
4,659 4,463 4% 13,688 13,155 4%TransportationReported Revenue 1,074 1,249 (14)% 3,185 3,471 (8)%Less Acq./Disp. & FX
-a)2 5 7 18
Organic Revenue-b)
1,072 1,244 (14)% 3,178 3,452 (8)%LightingReported Revenue 483 576 (16)% 1,442 4,239 (66)%Less Acq./Disp. & FX
-a)4 - 3 2,599
Organic Revenue-b)
$479 $576 (17)% $1,439 $1,640 (12)%

10
BHGE & GE Oil & Gas reporting walk($ in millions)
BHGE reported operating income $(122)
Less: restructuring & other charges (362)
BHGE adjusted operating income $240
BHGE reported operating income $(122)
Add: definitional & basis differences (27)
Less: BHGE Class A minority interest (113)
GE Oil & Gas op profit (GAAP) $(36)
Less: restructuring (GE share) (267)
GE Oil & Gas op profit , ex. restr. (non-GAAP) $231
3Q’17
Non-GAAP reconciliation
Note: Individual amounts are rounded. As a result, the sum of the parts presented may not add to the total
11
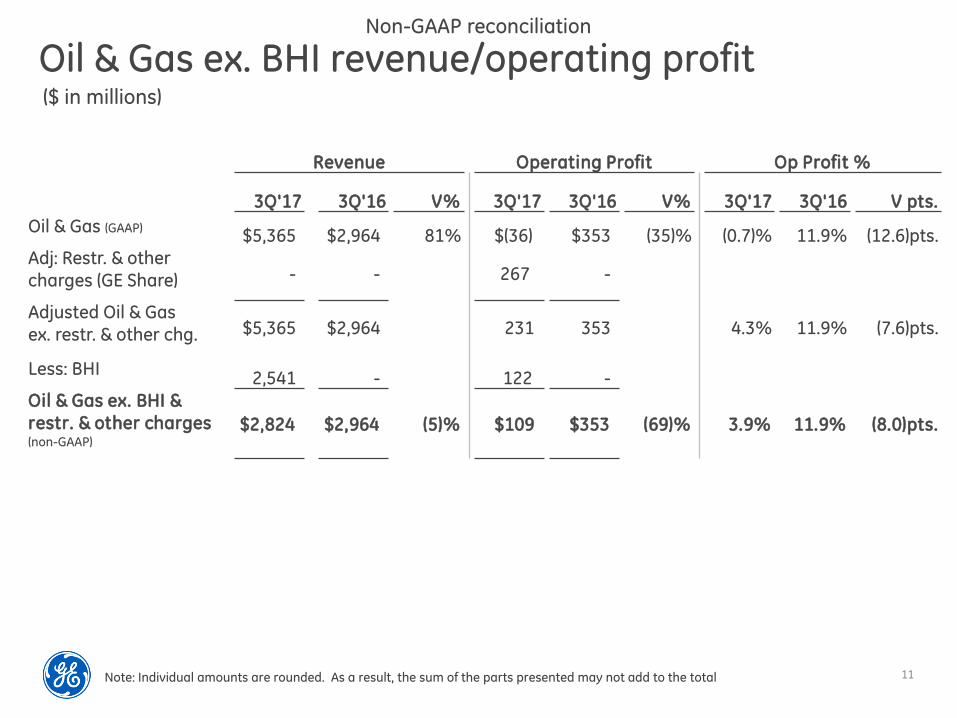
Oil & Gas ex. BHI revenue/operating profitNon-GAAP reconciliation
($ in millions)
Note: Individual amounts are rounded. As a result, the sum of the parts presented may not add to the total
Revenue Operating Profit Op Profit %
3Q'17 3Q'16 V% 3Q'17 3Q'16 V% 3Q'17 3Q'16 V pts.
Oil & Gas (GAAP)$5,365 $2,964 81% $(36) $353 (35)% (0.7)% 11.9% (12.6)pts.
Adj: Restr. & other charges (GE Share) - - 267 -
Adjusted Oil & Gas ex. restr. & other chg. $5,365 $2,964 231 353 4.3% 11.9% (7.6)pts.
Less: BHI2,541 - 122 -
Oil & Gas ex. BHI & restr. & other charges(non-GAAP)
$2,824 $2,964 (5)% $109 $353 (69)% 3.9% 11.9% (8.0)pts.
12
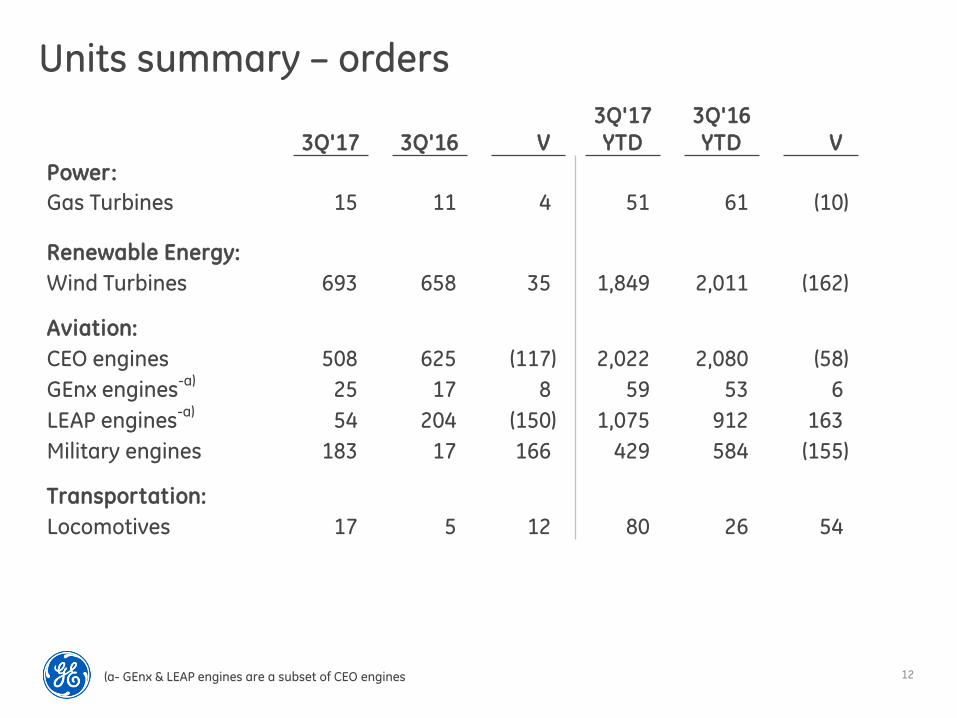
Units summary – orders
3Q'17 3Q'16 V)3Q'17 YTD
3Q'16 YTD V)
Power:
Gas Turbines 15 11 4) 51 61 (10)
Renewable Energy:
Wind Turbines 693 658 35) 1,849 2,011 (162)
Aviation:
CEO engines 508 625 (117) 2,022 2,080 (58)
GEnx engines-a)
25 17 8) 59 53 6)
LEAP engines-a)
54 204 (150) 1,075 912 163)
Military engines 183 17 166) 429 584 (155)
Transportation:
Locomotives 17 5 12) 80 26 54)
(a- GEnx & LEAP engines are a subset of CEO engines
13
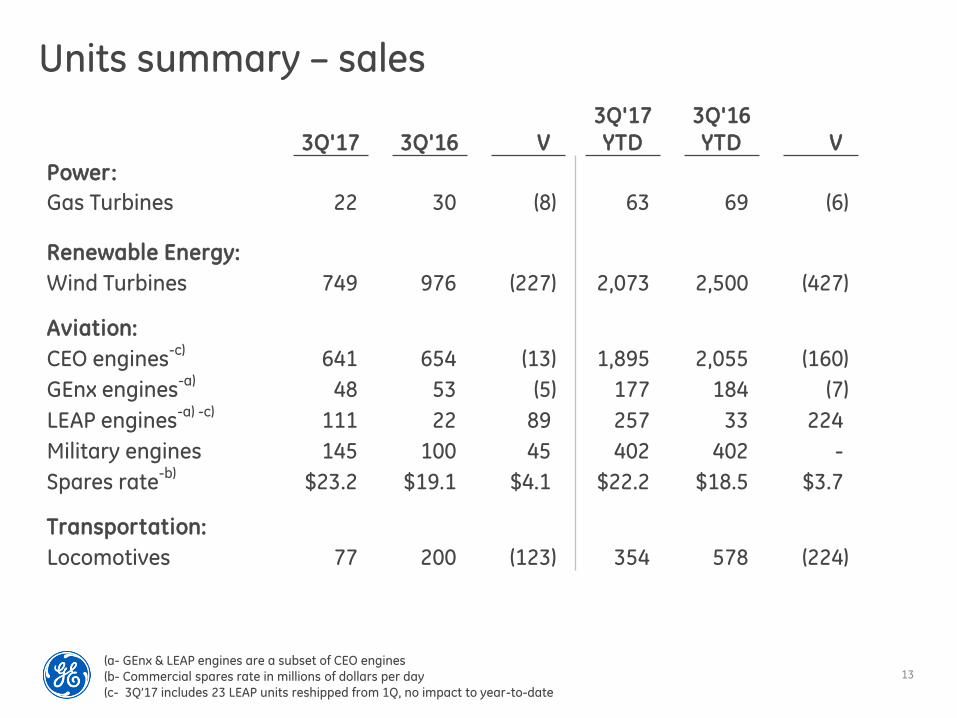
Units summary – sales
3Q'17 3Q'16 V)3Q'17 YTD
3Q'16 YTD V)
Power:
Gas Turbines 22 30 (8) 63 69 (6)
Renewable Energy:
Wind Turbines 749 976 (227) 2,073 2,500 (427)
Aviation:
CEO engines-c)
641 654 (13) 1,895 2,055 (160)
GEnx engines-a)
48 53 (5) 177 184 (7)
LEAP engines-a) -c)
111 22 89) 257 33 224)
Military engines 145 100 45) 402 402 -)
Spares rate-b)
$23.2 $19.1 $4.1) $22.2 $18.5 $3.7)
Transportation:
Locomotives 77 200 (123) 354 578 (224)
(a- GEnx & LEAP engines are a subset of CEO engines
(b- Commercial spares rate in millions of dollars per day
(c- 3Q’17 includes 23 LEAP units reshipped from 1Q, no impact to year-to-date
14
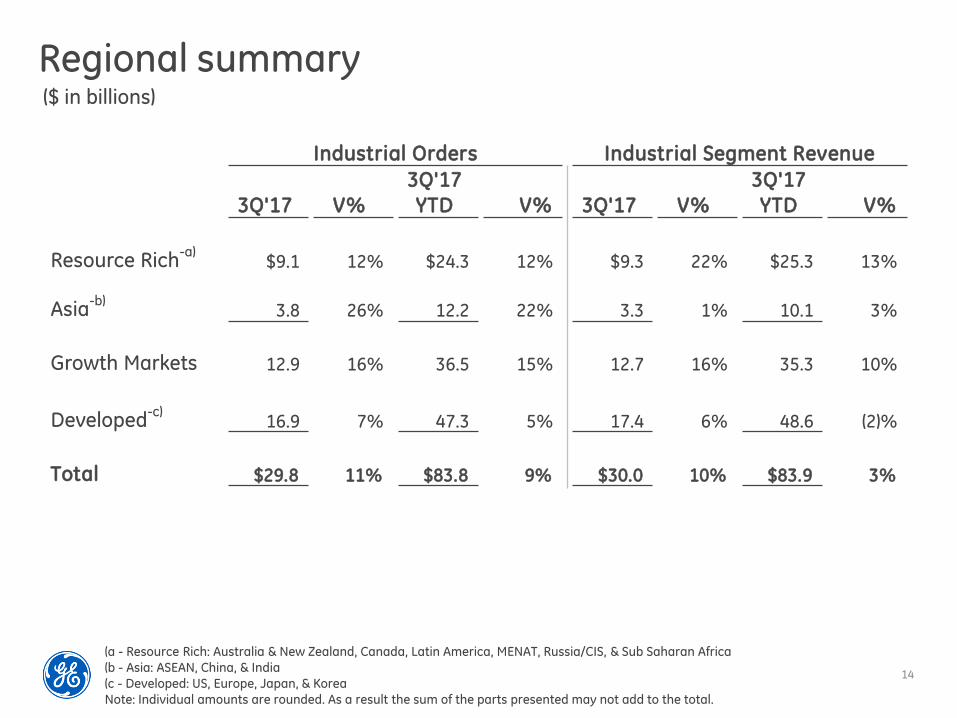
Regional summary($ in billions)
Industrial Orders Industrial Segment Revenue
3Q'17 V%3Q'17
YTD V% 3Q'17 V%3Q'17
YTD V%
Resource Rich-a)
$9.1 12% $24.3 12% $9.3 22% $25.3 13%
Asia-b)
3.8 26% 12.2 22% 3.3 1% 10.1 3%
Growth Markets 12.9 16% 36.5 15% 12.7 16% 35.3 10%
Developed-c)
16.9 7% 47.3 5% 17.4 6% 48.6 (2)%
Total $29.8 11% $83.8 9% $30.0 10% $83.9 3%
(a - Resource Rich: Australia & New Zealand, Canada, Latin America, MENAT, Russia/CIS, & Sub Saharan Africa
(b - Asia: ASEAN, China, & India
(c - Developed: US, Europe, Japan, & Korea
Note: Individual amounts are rounded. As a result the sum of the parts presented may not add to the total.
15
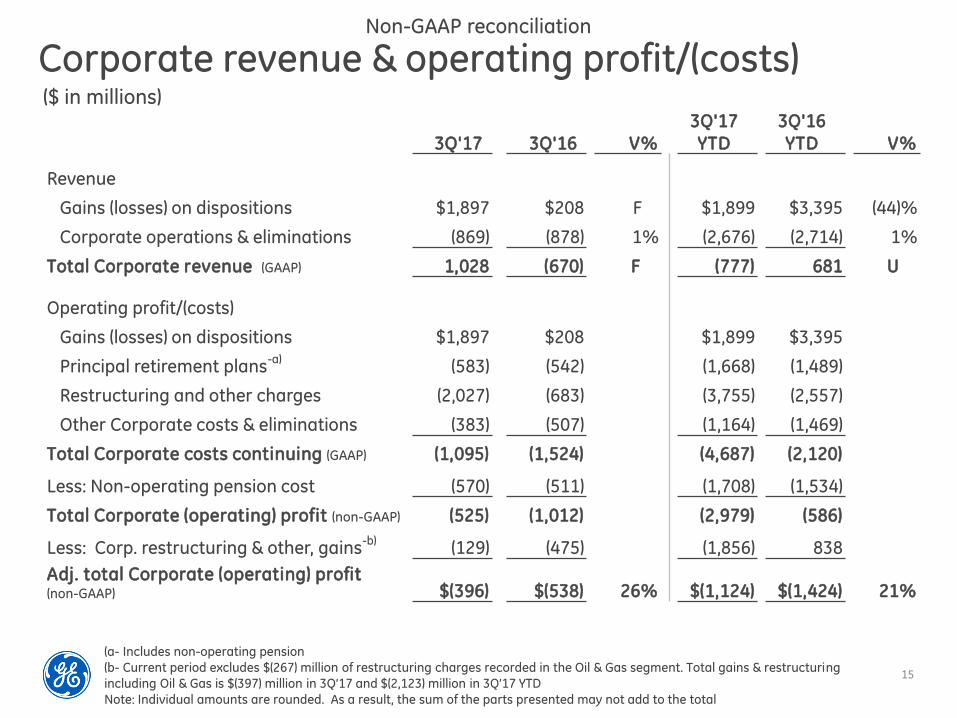
3Q'17 3Q'16 V%3Q'17 YTD
3Q'16 YTD V%
Revenue
Gains (losses) on dispositions $1,897 $208 F% $1,899 $3,395 (44)%
Corporate operations & eliminations (869) (878) 1% (2,676) (2,714) 1%
Total Corporate revenue (GAAP) 1,028 (670) F% (777) 681 U%
Operating profit/(costs)
Gains (losses) on dispositions $1,897 $208 $1,899 $3,395
Principal retirement plans-a)
(583) (542) (1,668) (1,489)
Restructuring and other charges (2,027) (683) (3,755) (2,557)
Other Corporate costs & eliminations (383) (507) (1,164) (1,469)
Total Corporate costs continuing (GAAP) (1,095) (1,524) (4,687) (2,120)
Less: Non-operating pension cost (570) (511) (1,708) (1,534)
Total Corporate (operating) profit (non-GAAP) (525) (1,012) (2,979) (586)
Less: Corp. restructuring & other, gains-b)
(129) (475) (1,856) 838
Adj. total Corporate (operating) profit (non-GAAP) $(396) $(538) 26% $(1,124) $(1,424) 21%
($ in millions)
Corporate revenue & operating profit/(costs)Non-GAAP reconciliation
(a- Includes non-operating pension
(b- Current period excludes $(267) million of restructuring charges recorded in the Oil & Gas segment. Total gains & restructuring
including Oil & Gas is $(397) million in 3Q’17 and $(2,123) million in 3Q’17 YTD
Note: Individual amounts are rounded. As a result, the sum of the parts presented may not add to the total

16
3Q'17 3Q'16 V%3Q'17
YTD3Q'16
YTD V%Earnings from continuing operations
attributable to common shareholders (GAAP) $1,905 $2,097 (9)% $4,101 $5,645 (27)%
Adj: non-operating pensions costs (net of tax) (371) (332) (1,111) (997)
Operating earnings (non-GAAP) 2,276 2,429 (6)% 5,212 6,642 (22)%
Adj: Other GE Capital earnings (loss) (non-GAAP) (275) (441) (1,573) (2,881)
Industrial operating plus Verticals earnings $2,550 $2,870 (11)% $6,784 $9,523 (29)% (non-GAAP)
Industrial operating earnings (non-GAAP) $2,252 $2,404 (6)% $5,407 $8,109 (33)%
GE Capital Verticals earnings (non-GAAP) $299 $466 (36)% $1,377 $1,414 (3)%
Earnings per share (EPS) - diluted-a)
Continuing EPS (GAAP) $0.22 $0.23 (4)% $0.47 $0.61 (23)%
Adj: non-operating pensions costs (net of tax) (0.04) (0.04) (0.13) (0.11)
Operating EPS (non-GAAP) 0.26 0.27 (4)% 0.59 0.72 (18)%
Adj: Other GE Capital earnings (loss) (non-GAAP) (0.03) (0.05) (0.18) (0.31)Industrial operating plus Verticals EPS (non-GAAP) $0.29 $0.32 (9)% $0.77 $1.03 (25)%
Industrial operating EPS (non-GAAP) $0.26 $0.27 (4)% $0.61 $0.88 (31)% GE Capital Verticals EPS (non-GAAP) $0.03 $0.05 (40)% $0.16 $0.15 7%
Operating & Industrial operating + Verticals earnings & EPS
Non-GAAP reconciliation
(a - Earnings per share amounts are computed independently. As a result, the sum of per share amounts may not equal the total
($ in millions except earnings per share)
17
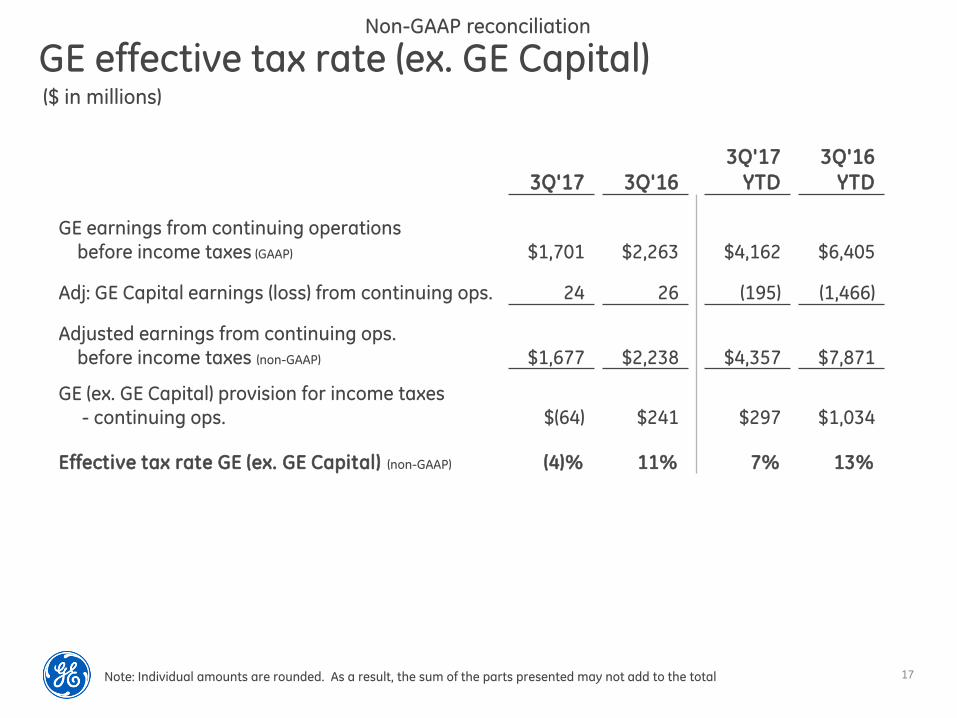
GE effective tax rate (ex. GE Capital)($ in millions)
Non-GAAP reconciliation
3Q'17 3Q'163Q'17
YTD3Q'16
YTD
GE earnings from continuing operationsbefore income taxes (GAAP) $1,701 $2,263 $4,162 $6,405
Adj: GE Capital earnings (loss) from continuing ops. 24 26 (195) (1,466)
Adjusted earnings from continuing ops.before income taxes (non-GAAP) $1,677 $2,238 $4,357 $7,871
GE (ex. GE Capital) provision for income taxes- continuing ops. $(64) $241 $297 $1,034
Effective tax rate GE (ex. GE Capital) (non-GAAP) (4)% 11% 7% 13%
Note: Individual amounts are rounded. As a result, the sum of the parts presented may not add to the total
18
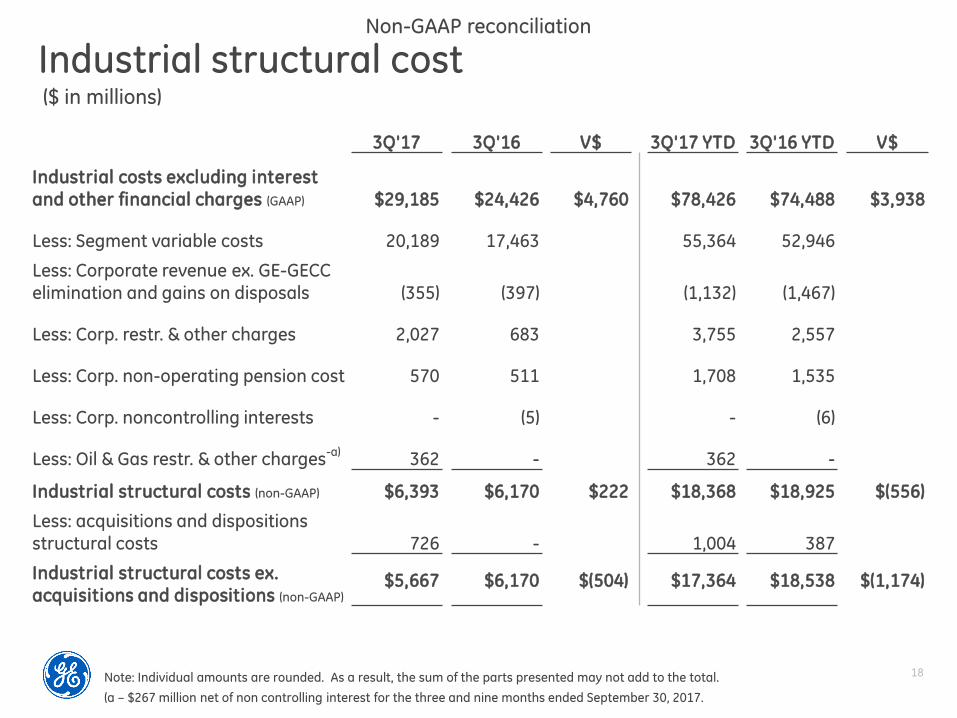
Industrial structural cost($ in millions)
Non-GAAP reconciliation
3Q'17 3Q'16 V$ 3Q'17 YTD 3Q'16 YTD V$
Industrial costs excluding interest and other financial charges (GAAP) $29,185 $24,426 $4,760 $78,426 $74,488 $3,938
Less: Segment variable costs 20,189 17,463 55,364 52,946
Less: Corporate revenue ex. GE-GECC elimination and gains on disposals (355) (397) (1,132) (1,467)
Less: Corp. restr. & other charges 2,027 683 3,755 2,557
Less: Corp. non-operating pension cost 570 511 1,708 1,535
Less: Corp. noncontrolling interests - (5) - (6)
Less: Oil & Gas restr. & other charges-a)
362 - 362 -
Industrial structural costs (non-GAAP) $6,393 $6,170 $222 $18,368 $18,925 $(556)
Less: acquisitions and dispositions structural costs 726 - 1,004 387
Industrial structural costs ex. acquisitions and dispositions (non-GAAP)
$5,667 $6,170 $(504) $17,364 $18,538 $(1,174)
Note: Individual amounts are rounded. As a result, the sum of the parts presented may not add to the total.
(a – $267 million net of non controlling interest for the three and nine months ended September 30, 2017.

19
GECAS $259 $341 (24)%
EFS (35) 72 U
Industrial Finance 133 111 20
Other-a) (58) (58) -
Verticals 299 466 (36)%
Other continuing operations–b) (275) (441) 38
Capital segment profit/(loss) 24 26 (8)%
Earnings/(loss) from discontinued ops. (105) (103) (2)
GE Capital net earnings/(loss) $(81) $(78) (4)%
attributable to GE common shareowners
3Q’17 3Q’16 V%
(a – Includes run-off insurance business and allocated corporate costs
(b – Includes impact of preferred stock dividends
Note: Individual amounts are rounded. As a result, the sum of the parts presented may not add to the total
GE Capital segment results($ in millions) – net earnings
20
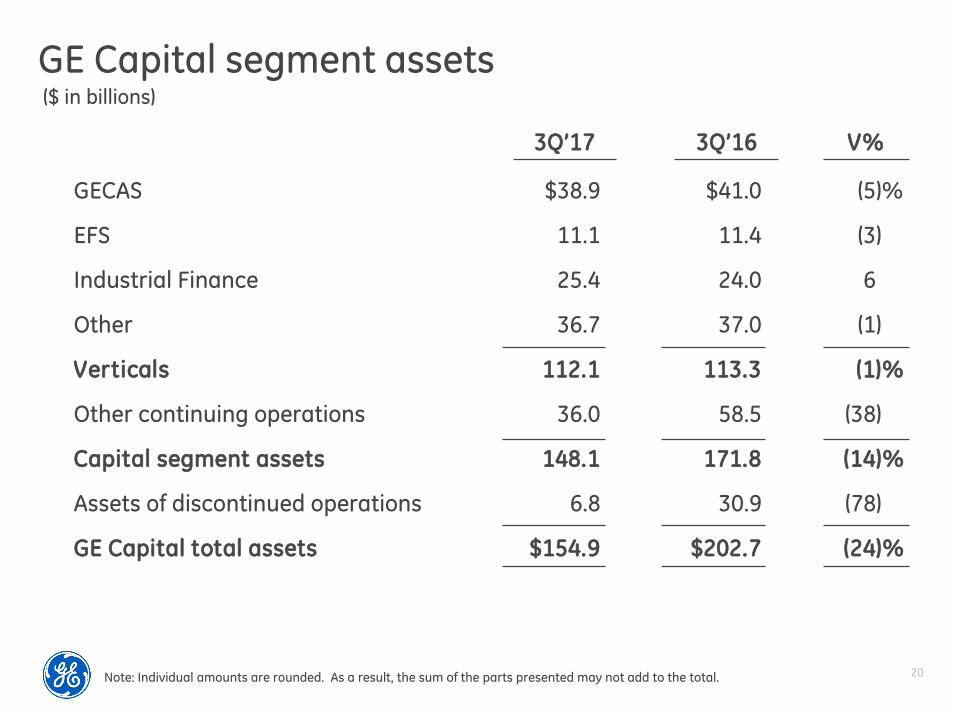
GECAS $38.9 $41.0 (5)%
EFS 11.1 11.4 (3)
Industrial Finance 25.4 24.0 6
Other 36.7 37.0 (1)
Verticals 112.1 113.3 (1)%
Other continuing operations 36.0 58.5 (38)
Capital segment assets 148.1 171.8 (14)%
Assets of discontinued operations 6.8 30.9 (78)
GE Capital total assets $154.9 $202.7 (24)%
Note: Individual amounts are rounded. As a result, the sum of the parts presented may not add to the total.
GE Capital segment assets($ in billions)
3Q’17 3Q’16 V%
21
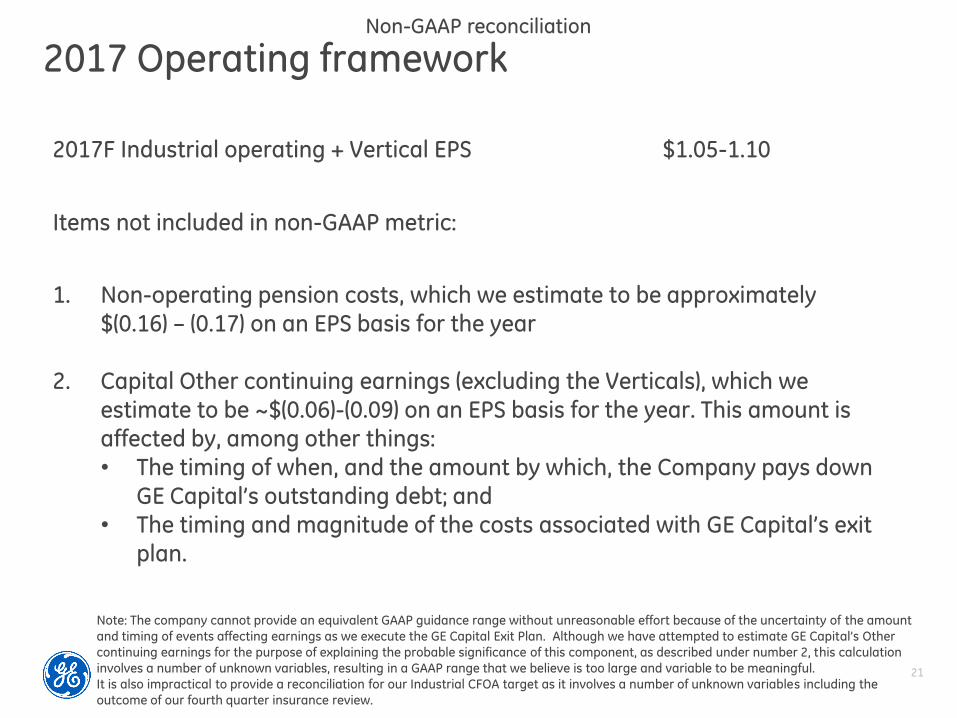
2017 Operating framework
Note: The company cannot provide an equivalent GAAP guidance range without unreasonable effort because of the uncertainty of the amount
and timing of events affecting earnings as we execute the GE Capital Exit Plan. Although we have attempted to estimate GE Capital’s Other
continuing earnings for the purpose of explaining the probable significance of this component, as described under number 2, this calculation
involves a number of unknown variables, resulting in a GAAP range that we believe is too large and variable to be meaningful.
It is also impractical to provide a reconciliation for our Industrial CFOA target as it involves a number of unknown variables including the
outcome of our fourth quarter insurance review.
2017F Industrial operating + Vertical EPS $1.05-1.10
Items not included in non-GAAP metric:
1. Non-operating pension costs, which we estimate to be approximately $(0.16) – (0.17) on an EPS basis for the year
2. Capital Other continuing earnings (excluding the Verticals), which we estimate to be ~$(0.06)-(0.09) on an EPS basis for the year. This amount is affected by, among other things:• The timing of when, and the amount by which, the Company pays down
GE Capital’s outstanding debt; and• The timing and magnitude of the costs associated with GE Capital’s exit
plan.
Non-GAAP reconciliation
22
Non-GAAP supplemental information
In an effort to provide investors with additional information regarding the company’s results as determined by generally accepted accounting principles (GAAP), the company also discusses, in its earnings press release and earnings presentation materials, the following Non-GAAP information which management believes provides useful information to investors.
Operating and non-operating pension costs We have provided the operating and non-operating components of cost for our principal pension plans. Operating pension costs comprise the services cost of benefits earned, prior services cost amortization and curtailment loss for our principal pension plans. Non-operating pension costs comprise the expected return on plan assets, interest cost on benefit obligations and net actuarial loss amortization for our principal pension plans. We believe that the operating components of pension costs better reflects the ongoing services-related costs of providing pension benefits to our employees. We believe that the operating and non-operating components of cost for our principal pension plans, considered along with the corresponding GAAP measure, provide management and investors with additional information for comparison of our pension plan costs and operating results with the pension plan costs and operating results of other companies.
Adjusted corporate costs (operating)
Operating corporate costs exclude non-services-related pension costs of our principal pension plans, which comprise interest costs, expected return on plan assets and amortization of actuarial gains/losses. services cost, prior services cost and curtailment loss components of our principal pension plans are included in operating corporate costs. We believe that these components of pension cost better reflect the ongoing services-related costs of providing pension benefits to our employees. Accordingly, we believe that our measure of operating corporate costs provides management and investors with a useful measure of the operational costs incurred outside of our businesses. We believe that this measure, considered along with thecorresponding GAAP measure, provides management and investors with additional information for comparison of our operating corporate costs to the operating corporate costs of other companies.
We also believe that adjusting operating corporate costs to exclude the effects of items that are not closely associated withongoing corporate operations, such as earnings of previously divested businesses, gains and losses on disposed and held for sale businesses, and restructuring and other charges, provides management and investors with a meaningful measure that increases the period-to-period comparability of our ongoing corporate costs.
23
Non-GAAP supplemental information
Industrial Segment Organic Revenue GrowthOrganic revenue growth measures revenue excluding the effects of acquisitions, business dispositions and currency exchange rates. We believe that this measure provides management and investors with a more complete understanding of underlying operating results and trends of established, ongoing operations by excluding the effect of acquisitions, dispositions and currency exchange, which activities are subject to volatility and can obscure underlying trends. We also believe that presenting organic revenue growth separately for our industrial businesses provides management and investors with useful information about the trends of our industrial businesses and enables a more direct comparison to other non-financial businesses and companies. Management recognizes that the term "organic revenue growth" may be interpreted differently by other companies and under different circumstances. Although this may have an effect on comparability of absolute percentage growth from company to company, we believe that these measures are useful in assessing trends of the respective businesses or companies and may therefore be a useful tool in assessing period-to-period performance trends.
Industrial and Industrial Segment Organic Operating Profit GrowthAdjusted industrial segment organic operating profit measures industrial segment operating profit growth excluding the effects of Oil & Gas restructuring and other charges, acquisitions, business dispositions and currency exchange rates. We believe that this measure provides management and investors with a more complete understanding of underlying operating
results and trends of established, ongoing operations by excluding the effect of Oil & Gas restructuring and other charges, acquisitions, dispositions and currency exchange, which activities are subject to volatility and can obscure underlying trends. We also believe that presenting adjusted industrial segment organic operating profit growth separately provides management and investors with useful information about the trends of our industrial businesses and enables a more direct comparison to other non-financial businesses and companies. Management recognizes that the term "adjusted industrial organic operating profit" may be interpreted differently by other companies and under different circumstances. Although this may have an effect on comparability of absolute percentage growth from company to company, we believe that these measures are useful in assessing trends of the respective businesses or companies and may therefore be a useful tool in
assessing period-to-period performance trends.
24
Non-GAAP supplemental informationIndustrial Cash Flows from Operating Activities (Industrial CFOA)We define “Industrial CFOA” as GE’s cash from operating activities (continuing operations) less the amount of dividends received by GE from GE Capital. This reflects the effects of intercompany transactions, which include, but are not limited to, the following: GE Capital working capital solutions to optimize GE cash management; GE Capital enabled GE industrial orders; aircraft engines, power equipment, renewable energy equipment and healthcare equipment manufactured by GE that are installed on GE Capital investments, including leased equipment; expenses related to parent-subsidiary pension plans; buildings and equipment leased between GE and GE Capital, including sale-leaseback transactions; information technology (IT) and other services sold to GE Capital by GE; and various investments, loans and allocations of GE corporate overhead costs.We believe that investors may find it useful to compare GE’s operating cash flows without the effect of GE Capital dividends,since these dividends are not representative of the operating cash flows of our industrial businesses and can vary from period to period based upon the results of the financial services businesses. We also believe that investors may find it useful to compare Industrial CFOA excluding the effects of deal taxes and contributions to our GE Pension Plan as well as this measure with Oil & Gas on a BHGE dividend basis. Management recognizes that these measures may not be comparable to cash flow results of companies which contain both industrial and financial services businesses, but believes that this comparison is aided by the provision of additional information about the amounts of dividends paid by our financial services business and the separate presentation in our financial statements of the GE Capital cash flows. Management believe that our measure of Industrial CFOA and Industrial CFOA excl. deal-related taxes and GE Pension Plan contributions as well as this measure with Oil & Gas on a BHGE dividend basis provides management and investors with useful measures to compare the capacity of our industrial operations to generate operating cash flow with the operating cash flow of other non-financial businesses and companies and as such provides useful measures to supplement the reported GAAP CFOA measure.
25
Non-GAAP supplemental informationFree cash flow (FCF)We define FCF as GE’s cash from operating activities (continuing operations) less GE additions to property, plant and equipment, which are included in cash flows from investing activities. We believe that FCF is a useful financial metric to assess our ability to pursue opportunities to enhance our growth. We believe that presenting FCF plus proceeds from business dispositions provides investors with useful information about the company’s actual performance against performance targets. We also believe that presenting FCF separately for our industrial businesses provides management and investors with useful information about the trends of our industrial businesses and enables a more direct comparison to other non-financial businesses and companies. We also believe that investors may find it useful to compare FCF and Industrial FCF excluding the effects of deal taxes and contributions to our GE Pension Plan. Management recognizes that the term FCF may be interpreted differently by other companies and under different circumstances. Although this may have an effect on comparability of absolute percentage growth from company to company, we believe that these measures are useful in assessing trends of the respective businesses or companies and may therefore be a useful tool in assessing period-to-period performance trends.
26
Non-GAAP supplemental information
Industrial operating earnings and EPS and GE Capital operating earnings (loss) and EPSOperating earnings (loss) excludes non-services related pension costs of our principal pension plans comprising interest cost, expected return on plan assets and amortization of actuarial gains/losses. The services cost, prior services cost and curtailment loss components of our principal pension plans are included in operating earnings. We believe that these components of pension cost better reflect the ongoing services-related costs of providing pension benefits to our employees. As such, we believe that our measure of operating earnings (loss) provides management and investors with a useful measure of the operational results of our business. Other components of GAAP pension cost are mainly driven by capital allocation decisions and market performance, and we manage these separately from the operational performance of our businesses. Neither GAAP nor operating pension costs are necessarily indicative of the current or future cash flow requirements related to our pension plan. We also believe that this measure, considered along with the corresponding GAAP measure, provides management and investors with additional information for comparison of our operating results to the operating results of other companies.
We believe that presenting operating earnings and operating EPS separately for our industrial and financial services businesses also provides management and investors with useful information about the relative size of our industrial and financial services businesses in relation to the total company.
GE Industrial Operating + Verticals EPSVerticals represents the GE Capital businesses that we expect to retain (GECAS, Energy Financial services, Industrial Finance, and run-off insurance activities). We believe that presenting Industrial operating + Vertical earnings-per-share amounts provides management and investors with a useful measure to evaluate the performance of the businesses we expect to retain after the disposition of most of our financial services business. We also believe that adjusting Industrial operating earnings + Verticals earnings and EPS to exclude the effects of items that are not closely associated with ongoing operations, such as gains on disposed businesses and restructuring and other charges, provides management and investors with a meaningful
measure that increases period-to-period comparability.

27
Non-GAAP supplemental information
Industrial Operating Profit & Operating Profit MarginWe have presented our Industrial operating profit and operating profit margin excluding gains, non-operating pension costs (pre-tax), restructuring and other charges, and noncontrolling interests. We believe that Industrial operating profit and operating profit margin adjusted for these items are meaningful measures because they increase the comparability of period-to-period results
GE effective tax rate (ex. GE Capital)We believe that the GE effective tax rate is best analyzed in relation to GE earnings before income taxes excluding the GE Capital net earnings from continuing operations, as GE tax expense does not include taxes on GE Capital earnings. Management believes that in addition to the Consolidated and GE Capital tax rates, this supplemental measure provides investors with useful information as it presents the GE effective tax rate that can be used in comparing the GE results to othernon-financial services businesses.
Structural CostsIndustrial structural costs include segment structural costs excluding the impact of business acquisitions and dispositions, plus total Corporate operating profit excluding non-operating pension costs, restructuring and other charges and gains. To
establish a consistent baseline, the 2016 amount excluded Appliances (which the Company sold in the second quarter of 2016), and the 2017 amount will exclude significant transactions such as Baker Hughes, LM Wind Power, and additive manufacturing (Arcam & Concept Laser). We believe that Industrial structural costs are a meaningful measure as they are broader than selling, general and administrative costs and represent the total structural costs in the Industrial segments and Corporate that generally do not vary with volume.
Oil & Gas Excluding BHI Revenue and Operating ProfitOil & Gas excluding BHI revenue and operating profit measures Oil & Gas segment revenue and operating profit excluding the
effects of BHI as well as Oil & Gas restructuring and other charges. We believe that this measure provides management and investors with a more complete understanding of underlying operating results and trends of established, ongoing operations of our Oil & Gas segment by excluding the effect of BHI and Oil & Gas restructuring and other charges, which activities are subject to volatility and can obscure underlying trends.