gce statistics teachers guide teacher resource bank
TRANSCRIPT
V 1.0
AQA Advanced Subsidiary GCE Statistics (5381)
AQA Advanced GCE Statistics (6381)
abc General Certificate of Education
Statistics
Teachers� Guide
Further copies of this specification booklet are available from: Aldon House, 39, Heald Grove, Rusholme, Manchester, M14 4PB. © Assessment and Qualifications Alliance 2004 COPYRIGHT AQA retains the copyright on all its publications, including the specifications. However, the registered centres for AQA are permitted to copy material from this specification booklet for their own internal use. Set and published by the Assessment and Qualifications Alliance. Printed in Great Britain by Page Brothers, Mill Cross Lane, Norwich, Norfolk, NR6 6SA The Assessment and Qualifications Alliance (AQA) is a company limited by guarantee registered in England and Wales 3644723 and a registered charity number 1073334. Registered address AQA, Devas Street, Manchester M15 6EX. Dr Michael Cresswell Director General.
Advanced Subsidiary and A Level, Teachers� Guide - Statistics
Copyright © 2004 AQA and its licensors 3
Contents Background Information
1 Introduction 4 2 Where to find information 6 3 Contact points 8
Assessment of the Course 4 Specification at a Glance 9 5 Assessment issues 10 6 Coursework issues 12 7 Key dates 15 8 Finding the right questions in AQA past papers 16
Organisation of the Course 9 Delivery of the course 22 10 Resources 41 11 Relating the content to old AQA specifications 43 Other Information 12 AS and A Level Mathematics 45 13 FSMQ and AS Use of Mathematics 46 14 Glossary of Terms 47
Statistics - Advanced Subsidiary and A Level, Teachers� Guide
4 Copyright © 2004 AQA and its licensors
Background Information 1 Introduction
1.1 Who is this Teachers� Guide
designed for? This Teachers� Guide has been provided to assist teachers and lecturers in their preparation for the delivery of courses based on the new AQA Advanced Subsidiary (AS) and Advanced Level (A Level) in Statistics. The guide should be read in conjunction with the Specification and the Specimen Material. These are available in hard copy and on the AQA website www.aqa.org.uk.
1.2 Why are new GCE Mathematics specifications being introduced?
All Advanced Supplementary and Advanced Level syllabuses were replaced from September 2000 by GCE specifications following the Dearing �Review of Qualifications for 16-18 Year Olds� and the subsequent consultation �Qualifying for Success�. The GCE Mathematics specifications, complying with criteria produced by the Qualifications and Curriculum Authority (QCA), were associated with various problems, but particularly a significant reduction in take-up of Mathematics in the post-16 age group. As a consequence, QCA has rewritten the criteria and all awarding bodies in England, Northern Ireland and Wales have developed new GCE Mathematics specifications for first teaching from September 2004.
1.3 Why are AS and A Level Statistics not available in the new GCE Mathematics specifications?
The rewritten QCA criteria do not permit the inclusion of subject awards in Statistics within GCE Mathematics. AQA currently offers AS Statistics and A Level Statistics within AQA GCE Mathematics and Statistiscs B (6320) and wishes to continue this provision. AQA has therefore developed a separate GCE Statistics specification, offering qualifications in AS Statistics and A Level Statistics. It is derived from AQA GCE Mathematics and Statistics B (6320), in order to maintain, wherever possible, those features which are known to be attractive to teachers and their students.
1.4 Why study Statistics? The AQA senior examiners for this specification believe that Statistics is a worthwhile subject in its own right but is also an excellent support study for other subjects. The content of the AS specification has been selected to include statistical knowledge, skills and techniques which are needed for the study of other subjects, such as Biology, Economics, Geography, Psychology and Business Studies. The A2 specification is designed to give an understanding of the calculation of statistical measures, as well as their application and interpretation, without requiring knowledge of Pure Mathematics beyond GCSE.
Statistics qualifications may appeal to the student who wishes to pursue the study of a numerate post-16 subject, but does not want to study Pure Mathematics. The emphasis of the AS and A Level qualifications in this specification is on using and applying Statistics, including, for example, the interpretation of outcomes in context.
The following page is designed to support teachers who want to make a case in their school or college for the introduction or continued provision of courses in Statistics, particularly AS Statistics.
Advanced Subsidiary and A Level, Teachers� Guide - Statistics
Copyright © 2004 AQA and its licensors 5
Why is AS Statistics a valuable addition to post-16 provision? AS Statistics provides:
• an accessible AS qualification in a numerate subject for post-GCSE students who do not wish to study Pure Maths;
It may be more suitable than AS Maths for students who have done GCSE Maths Intermediate Tier. These students usually find the course more accessible than AS Maths, since no pure maths beyond GCSE is required. This accessibility has been enhanced since the new GCSE Maths gives students a very good working knowledge of Statistics. • useful support for students studying many other subjects, such as GCE Biology, Psychology, Economics, Geography, and Business Studies;
The content in AS Statistics is more relevant to many students than that in AS Maths. For Biology and Psychology where a significant part of the course involves the use of statistics, the knowledge and skills taught by an AS Statistics course can be vital. The relevance of Statistics has been recognised by Medical Schools for which it is now a preferred subject.
• a possible route forward for students who, having started AS Maths, find they do not wish to continue with pure maths and would give it up without an alternative;
Since S1 is common between AS Statistics and AS Maths, courses can be structured to facilitate transfers. A move to AS Statistics, even after October half term, is generally successful. Having this route available within a centre ensures high retention for maths subjects.
• the first part of an A Level qualification in Statistics.
With the AQA specification, students who are successful at AS Statistics can continue to A Level Statistics.
In addition: • textbooks are available; • many past papers are available from AQA (the new specification is a follow-on from AQA�s previous
provision); • AQA provides teacher support in a variety of forms, including on �newer� topics; • where it is offered, AS Statistics often becomes a popular option, increasing numbers studying with the
maths dept after GCSE.
Statistics - Advanced Subsidiary and A Level, Teachers� Guide
6 Copyright © 2004 AQA and its licensors
2 Where to find information 2.1 Specification,
Specimen Material and Teachers� Guide
This Teachers� Guide is intended to complement the information in the Specification and in the Specimen Material. The Specification gives full details of the teaching and learning modules, and of the assessment units that lead to the qualifications AS Statistics and A Level Statistics. The Specimen Material contains an example of the question paper and the mark scheme for each assessment unit, together with an assessment grid showing how the paper covers the subject content of the module and how it complies with the specified proportions of different types of assessment.
The Teachers� Guide supplements these documents with information such as the design of courses based on the Specification, guidance about specific content, resources and administrative matters. It also gives details of how the Specification relates to AQA Specifications which pre-date it, and of which past paper questions are appropriate for practice assessments on the Specification content.
2.2 Formulae Booklet Formulae that candidates can look up and statistical tables they can use during examinations are published in a Formulae Booklet. Candidates should have a copy of the Formulae Booklet whenever they sit an AS or A2 Statistics question paper. Teachers will want to use the Formulae Booklet in class- and home-work so that students become familiar with it.
AQA has issued a new Formulae Booklet for use with this Specification and the new GCE Mathematics specification. It is different to the book issued for the C2K specifications, for example, it contains additional Pure Maths formulae. Therefore it is important to use the Formulae Booklet which is appropriate to the specification (old or new). The Formulae Booklets for the new specifications are blue, whereas those for the old specifications are white.
The new Formulae Booklet will be available for the start of teaching in September 2004. Centres should order these from the Guildford Despatch department. Centres will need to obtain sufficient copies to provide one copy for classroom and homework use for each student, plus an appropriate number of copies to be kept by the Examinations Officer as clean copies for examination use only. Each year, centres will be given the opportunity to order top-up supplies.
2.3 Practice papers Since the content of this new specification is largely the same as that in AQA�s GCE Mathematics and Statistics B specification (6320), a large number of past papers are available which are relevant to this specification. Therefore AQA has not prepared any practice papers for the units in this specification.
In order to assist teachers in finding appropriate questions for the new units from past papers, AQA has prepared an index which lists past paper questions against the sections of the Specification. See section 8 of this Teachers� Guide.
Advanced Subsidiary and A Level, Teachers� Guide - Statistics
Copyright © 2004 AQA and its licensors 7
2.4 Coursework packs Coursework is optional for this specification. It forms part of the assessment for unit SS1A. Some details of the coursework requirements are included in the Specification. Further information is given in a Coursework pack prepared for SS1A. The pack contains details of AQA-recommended tasks, together with samples of candidates� work showing how it is assessed against the coursework criteria. Copies of the coursework pack will be sent early in the Autumn term to all centres making Estimated Entries for the above unit. Copies are also available from the GCE Mathematics subject department.
2.5 Coursework Advisers Every centre undertaking coursework is assigned a Coursework Adviser, who should be consulted if a centre wishes to use a coursework task not on the AQA-recommended list, but who can also advise on other matters such as the extent to which it is appropriate to guide students and the application of the coursework criteria when marking students� work.
2.6 Website Information about this GCE Statistics specification can be found at www.aqa.org.uk/qual/gceasa/statistics.html
2.7 Meetings AQA regularly holds two kinds of meetings for teachers of AS and A Level Statistics. Each Autumn, teacher standardisation meetings are held to ensure that teachers have a good understanding of the standard required for coursework. When a centre first does coursework for this specification, AQA requires that a representative from the centre attends one of these meetings. Centres will be invited on the basis of Estimated Entries information. There is no charge for these meetings.
AQA also holds support meetings. These give advice on aspects of teaching the specification content, information about administrative matters, and feedback on candidate performance in past papers. There may be a charge for these meetings. Details about the meetings are posted to the AQA website, and meetings are bookable online.
2.8 Examinations Update This booklet is sent 4 times a year to Examinations Officers. Any changes to administrative requirements or to the specification content are notified to centres through the Update. Where information is subject specific, separate sheets are included for distribution to Heads of Department. The Update is also published on the AQA website, with, if appropriate, links to the relevant page for the subject.
2.9 Mailing List The GCE Mathematics subject department has a mailing list of named individuals who wish to be kept up-to-date with developments in AQA GCE Mathematics and GCE Statistics. From time to time, information published elsewhere is also sent direct to individuals on the list. Contact the GCE Mathematics subject department if you wish to be added to the list.
Statistics - Advanced Subsidiary and A Level, Teachers� Guide
8 Copyright © 2004 AQA and its licensors
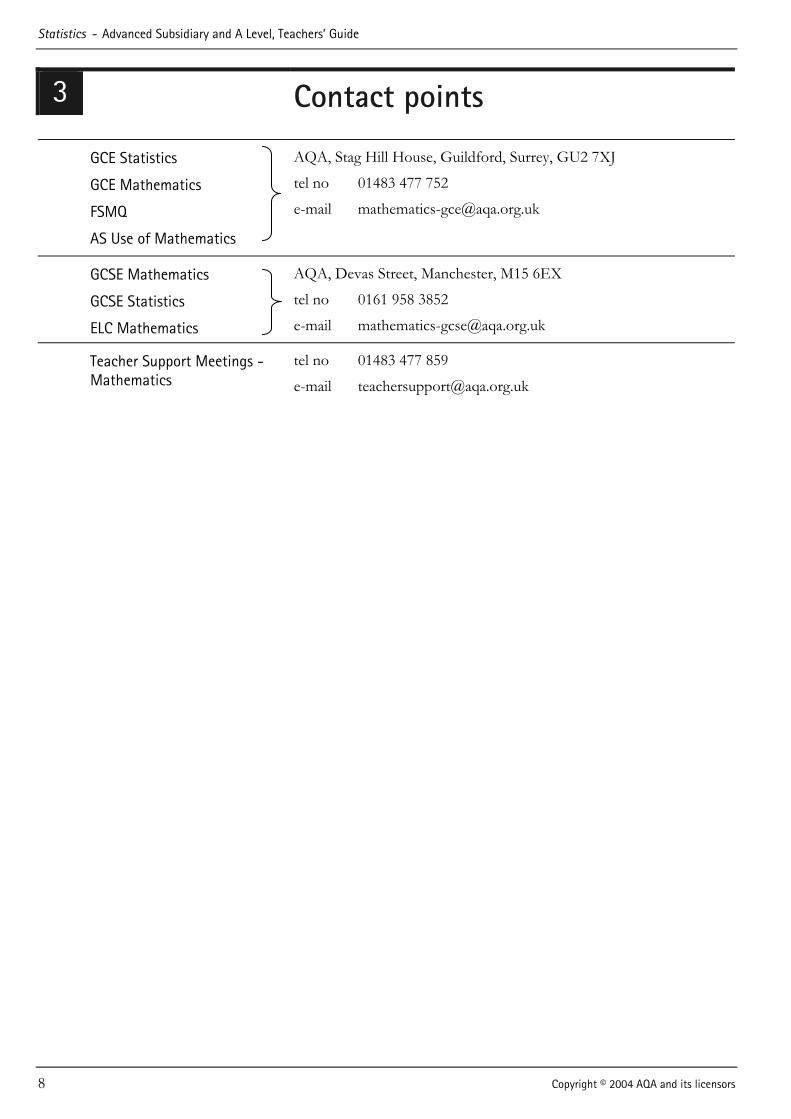
3 Contact points
GCE Statistics
GCE Mathematics
FSMQ
AS Use of Mathematics
AQA, Stag Hill House, Guildford, Surrey, GU2 7XJ
tel no 01483 477 752
e-mail [email protected]
GCSE Mathematics
GCSE Statistics
ELC Mathematics
AQA, Devas Street, Manchester, M15 6EX
tel no 0161 958 3852
e-mail [email protected]
Teacher Support Meetings -Mathematics
tel no 01483 477 859
e-mail [email protected]
Advanced Subsidiary and A Level, Teachers� Guide - Statistics
Copyright © 2004 AQA and its licensors 9
Assessment of the Course 4
Specification at a Glance Statistics
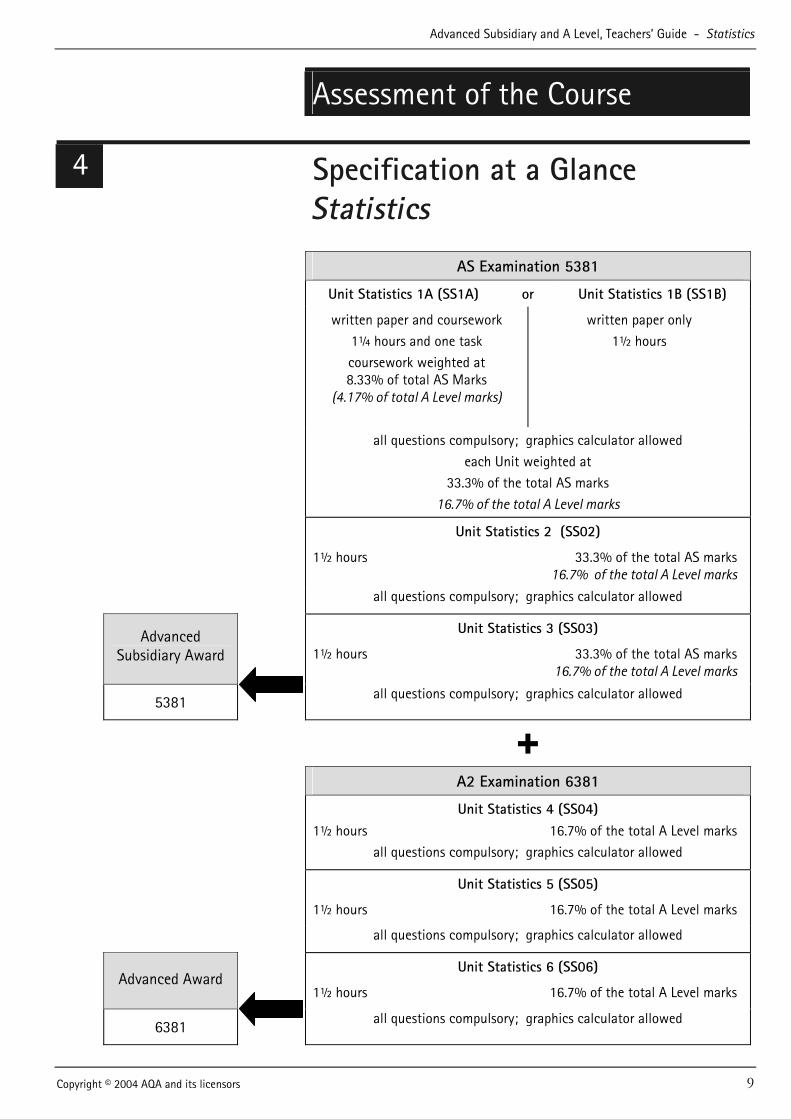
AS Examination 5381
Unit Statistics 1A (SS1A) or Unit Statistics 1B (SS1B)
written paper and coursework
1¼ hours and one task
coursework weighted at 8.33% of total AS Marks
(4.17% of total A Level marks)
written paper only
1½ hours
all questions compulsory; graphics calculator allowed
each Unit weighted at
33.3% of the total AS marks
16.7% of the total A Level marks
Unit Statistics 2 (SS02)
1½ hours 33.3% of the total AS marks 16.7% of the total A Level marks
all questions compulsory; graphics calculator allowed
Advanced Subsidiary Award
Unit Statistics 3 (SS03)
1½ hours 33.3% of the total AS marks 16.7% of the total A Level marks
5381 all questions compulsory; graphics calculator allowed
+ A2 Examination 6381
Unit Statistics 4 (SS04) 1½ hours 16.7% of the total A Level marks
all questions compulsory; graphics calculator allowed
Unit Statistics 5 (SS05)
1½ hours 16.7% of the total A Level marks
all questions compulsory; graphics calculator allowed
Advanced Award Unit Statistics 6 (SS06)
1½ hours 16.7% of the total A Level marks
6381 all questions compulsory; graphics calculator allowed

Statistics - Advanced Subsidiary and A Level, Teachers� Guide
10 Copyright © 2004 AQA and its licensors
5 Assessment Issues
5.1 Introduction This section covers a number of issues which relate to assessment
units, including their aggregation into subject awards.
5.2 Calculators For this specification, candidates are allowed to use any calculator which complies with the rules in the JCQ Instructions for the Conduct of Examinations. These rules allow both scientific and graphics calculators, but AQA recommends that candidates use a graphics calculator for GCE Statistics.
The use of a calculator is encouraged for the direct calculation of means, standard deviations, variances, correlation coefficients and regression coefficients. However, students should not simply copy answers from advanced statistical calculators without explanation. An indication of the method used should be shown for calculations such as normal probabilities, confidence intervals and hypothesis tests. Without this, candidates risk losing all the marks if for example a mis-key means they get the wrong answer. For the same reason, �checking� of results should be encouraged, for example, to ensure that mis-keys are detected.
5.3 Coursework and non-coursework units
Statistics 1 can be assessed either by written paper and coursework (unit code with A) or by written paper only (unit code with B). Both versions of the written paper assess the whole content of the relevant teaching module, whether or not coursework is included in the assessment. However, it is likely that the B papers, which have 75 marks compared to 60 for the A papers, will have a higher proportion of marks on parts of the content which candidates will have to use in coursework such as interpreting results in context.
5.4 Common Statistics 1 unit The Statistics 1 assessment units, SS1A and SS1B, in this specification are identical to the Statistics 1 units, MS1A and MS1B, in the AQA GCE Mathematics specification. (The teaching module is also identical.)
In any given examination series, candidates can be entered for only one of SS1A, SS1B, MS1A or MS1B, but over different series they can take any of the versions of S1. So candidates can have several results for each of the entry codes SS1A, SS1B, MS1A and MS1B.
When AQA receives a subject award entry, results for SS1A/B will be used only for aggregations within the GCE Statistics specification and results for MS1A/B only for aggregations within the GCE Mathematics specification. So aggregation of a GCE Statistics subject award will not �use up� results for MS1A/B; and aggregation of a GCE Mathematics subject award will not �use up� results for SS1A/B.
Advanced Subsidiary and A Level, Teachers� Guide - Statistics
Copyright © 2004 AQA and its licensors 11
5.5 Transfer of S1 results Centres will be able to request that a result under one entry code is transferred to the code for the equivalent unit from the other specification e.g. from MS1A to SS1A, or from SS1B to MS1B. This is so that students who start, for example, an AS Maths course and do MS1A but who decide to change to AS Statistics can use their result for MS1A as a result for SS1A.
AQA will not transfer results from one entry code to another unless asked by a centre. This is to prevent AQA�s computer using up a candidate�s result for, say, SS1A towards AS Maths when the candidate wanted to use it for AS Statistics. For example, the candidate might be taking AS Maths with C1, C2 and D1 at the same time as AS Statistics with S1, S2 and S3.
Where the assessment is the same, the associated documentation will be the same. Common codes will be used when a document could be used for either GCE Statistics or GCE Maths. The common codes are:
for Statistics 1A writtten paper MS/SS1A/W for Statistics 1A courswork MS/SS1A/C for Statistics 1B written paper MS/SS1B .
These or similar codes will appear on the exam papers, attendance lists, candidate record forms and so on. This means that centres won�t have to make sure the exam paper given to each candidate matches the entry code they were entered under.
5.6 Aggregation rules Aggregation rules determine how unit results are combined to give subject award outcomes. The rules for GCE Statistics are the same as those for any GCE specification. They can be found on the Joint Council for Qualifications (JCQ) website at www.jcgq.org.uk/ Publications_and_Common_Docs/Procedures_&_rules.pdf
Where a candidate has two or more results for a unit, the best result is used for any subject awards (AS Statistics and/or A Level Statistics). After aggregation, all results for units included in the subject award(s) are �used up� and are not available for any future subject award(s) at the same level (AS or A Level).
Note that for aggregation purposes SS1A and SS1B are treated as one unit. In other words aggregating AS and/or A Level statistics will �use up� all results for SS1A and for SS1B. As stated earlier (section 5.5), results for MS1A and MS1B will be unaffected by aggregating AS or A Level Statistics subject awards.

Statistics - Advanced Subsidiary and A Level, Teachers� Guide
12 Copyright © 2004 AQA and its licensors
6 Coursework Issues
6.1 Introduction One of the units in this specification, Statistics 1, may include
coursework as part of the assessment.
Some advantages of candidates undertaking coursework are:
• it provides the opportunity to conduct an extended piece of mathematical reasoning;
• it enhances understanding of the particular area of content;
• it develops the Key Skills and generates evidence for their assessment;
• it provides the opportunity to attempt �real-life� problems and interpret them within context.
In Statistics 1, teachers may enter some candidates for the option of coursework plus the written paper and others for the written paper only. Where candidates begin coursework but are unable to finish, or perform poorly, teachers are able to change their entries for such candidates to the non-coursework option.
For those taking the coursework option, the submission of one piece of coursework is required. A piece of coursework is expected to represent approximately 8 to 10 hours� work.
Coursework in this specification will be largely familiar to centres who previously taught AQA GCE Mathematics Specification A (6300). Most of the tasks remain the same, although one has changed. The main difference is that Statistics 1 is now assessed at AS standard instead of A2 standard.
It is hoped that centres choosing to try coursework for the first time will be comfortable with the format and systems, and will find the transition to coursework reasonably straightforward.
6.2 Tasks A number of AQA recommended tasks are included in the Teachers� Coursework Guidance Pack. Teachers may wish to choose a task and have all their candidates undertake it, or they may leave it up to individual candidates which task they choose to pursue.
Alternatively, teachers may wish to propose a different task. Where this is the case, they should submit the proposed alternative to their Coursework Adviser for approval at least six weeks before it is to be undertaken by candidates. The Coursework Adviser will consider whether the alternative task enables candidates to meet all the assessment criteria and will respond to centres accordingly.
Advanced Subsidiary and A Level, Teachers� Guide - Statistics
Copyright © 2004 AQA and its licensors 13
6.3 Support from AQA AQA provides the following support for centres.
Teachers� Coursework
Guidance Pack A Teachers� Coursework Guidance Pack is available, containing:
• a number of AQA recommended tasks; • exemplar materials showing how the marking criteria are to be
applied; • notes for students, which may be given to candidates; • notes for teachers, which should not be given to candidates. Centres who advise AQA of their intention to enter using the
Estimated Entries Form supplied to Examinations Officers will automatically be sent a Teachers� Coursework Guidance Pack the first time they enter. Where an Estimated Entries Form has not been completed, centres should telephone AQA for a copy of the appropriate pack.
Teachers� Standardisation Meetings
Free Teachers� Standardisation meetings run every Autumn Term for new centres or those who have had problems in the previous year, to include:
• feedback to centres on the moderation process; • further guidance on the application of the marking criteria; • marking exercises, written commentaries and further exemplar
materials. In the first year of the specification, all centres must attend one of
these meetings before marking coursework.
Coursework Advisers Coursework Advisers are available who can offer support and guidance on the marking criteria and can approve alternative tasks centres may wish to use. The GCE Statistics subject department (see Contact Points section) should be contacted for details of the Coursework Adviser allocated to your centre.
6.4 Key Skills Undertaking coursework can develop candidates� Key Skills and generate evidence for their assessment. For example, in attempting a piece of coursework, a student may need to:
• Research information for assumptions made using either electronic sources such as the internet (IT3.1) or from written materials (C3.2).
• Discuss the tasks in groups in the initial stages, before writing up (C3.1a).
• Plan and collect relevant data and information ensuring that the sample size used is appropriate (N3.1).
• Ensure that an appropriate range of calculations is attempted and that answers are quoted to appropriate levels of accuracy (N3.2).
• Write up an extended document which may include charts, diagrams, spreadsheets, etc using a range of presentational techniques and media (C3.3, N3.3, IT3.3).
Statistics - Advanced Subsidiary and A Level, Teachers� Guide
14 Copyright © 2004 AQA and its licensors
• Interpret their results and relate them back to the original task
(N3.3). • Consider if any method of validation is available to check their
results. This may include electronic methods such as e-mailing. (IT3.1)
• Write coherently and effectively using accurate English skills (C3.3).
Taken as a whole, the piece of coursework submitted by a candidate may provide a significant proportion of the evidence needed for success to be achieved in Key Skills Qualifications.
6.5 Administration Candidates should not use pencil in their coursework, except in diagrams. Coursework may be written in dark ink or word processed.
Candidates� coursework should have the pages numbered and should be fastened using staples or treasury tags in the top left hand corner. Please do not use plastic wallets or folders.
Coursework must be annotated (in red pen) to show where marks have been awarded. Candidates� calculations must be checked and errors taken into account in the marking. Teachers� annotation is very helpful to the moderation process and helps enable moderators to endorse centres� marking.
A Candidate Record Form must be completed for each candidate, with the declaration signed by the candidate to confirm the work is their own, and details given by the teacher of any additional assistance given. There are two marking grids included: the first is less detailed and its completion is mandatory; the other is more detailed and is optional. Completion of the marking grids greatly helps the moderation process.
A Centre Declaration Sheet, to confirm that internal standardisation has taken place within the centre, must also be sent to the moderator, even when only one teacher marks coursework at the centre.
Candidate Record Forms and Centre Declaration Sheets are available on the website www.aqa.org.uk.
Centres must submit their marks and, unless all their candidates are carrying forward coursework marks from previous sessions, a sample of coursework to the moderator. A deadline exists for receipt of the materials by the moderator and centres should ensure that they are aware of and meet the deadline. Where a particular issue arises which may lead to late submission, centres should request an extension to the coursework deadline in writing to AQA.
Further details of the moderation process are available in the Specification and more detailed series-specific instructions will be sent to Examinations Officers before the submission is due.
6.6 Guidance Notes for Candidates
Guidance notes for candidates on undertaking Statistics coursework are available in the Teachers� Coursework Guidance Pack.
Advanced Subsidiary and A Level, Teachers� Guide - Statistics
Copyright © 2004 AQA and its licensors 15
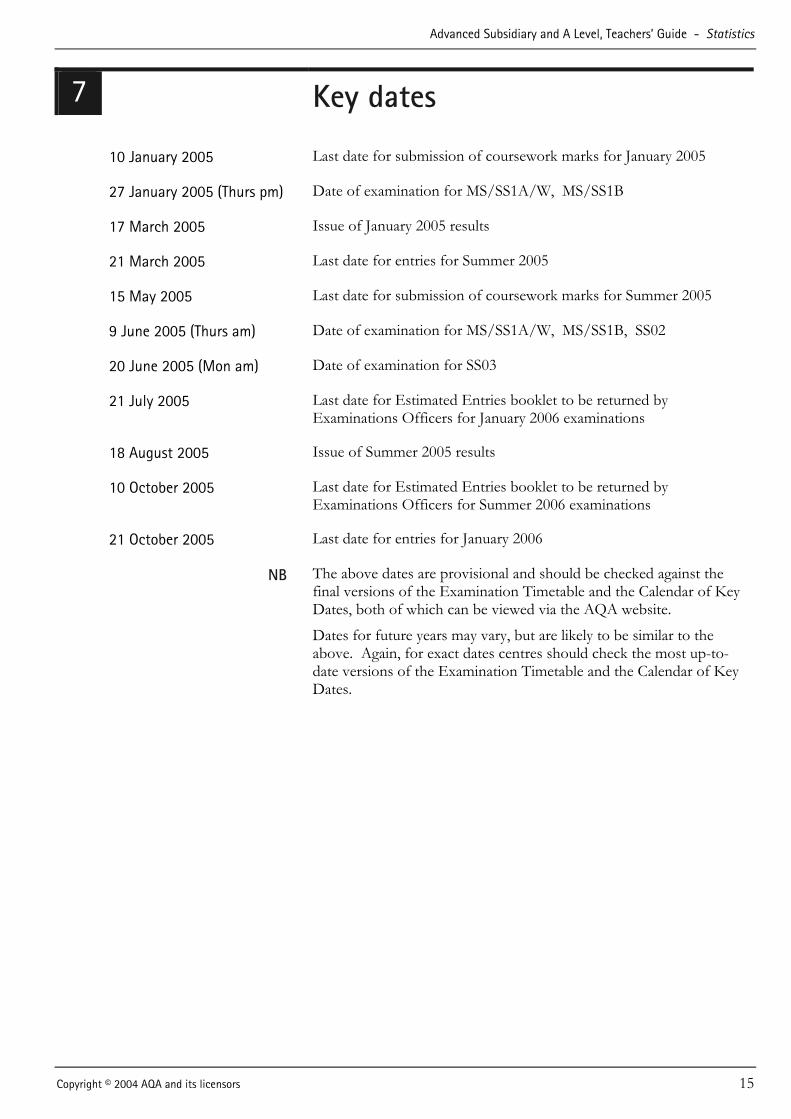
7 Key dates
10 January 2005 Last date for submission of coursework marks for January 2005
27 January 2005 (Thurs pm) Date of examination for MS/SS1A/W, MS/SS1B
17 March 2005 Issue of January 2005 results
21 March 2005 Last date for entries for Summer 2005
15 May 2005 Last date for submission of coursework marks for Summer 2005
9 June 2005 (Thurs am) Date of examination for MS/SS1A/W, MS/SS1B, SS02
20 June 2005 (Mon am) Date of examination for SS03
21 July 2005 Last date for Estimated Entries booklet to be returned by Examinations Officers for January 2006 examinations
18 August 2005 Issue of Summer 2005 results
10 October 2005 Last date for Estimated Entries booklet to be returned by Examinations Officers for Summer 2006 examinations
21 October 2005 Last date for entries for January 2006
NB The above dates are provisional and should be checked against the final versions of the Examination Timetable and the Calendar of Key Dates, both of which can be viewed via the AQA website.
Dates for future years may vary, but are likely to be similar to the above. Again, for exact dates centres should check the most up-to-date versions of the Examination Timetable and the Calendar of Key Dates.
Statistics - Advanced Subsidiary and A Level, Teachers� Guide
16 Copyright © 2004 AQA and its licensors
8 Finding the right questions in
AQA past papers
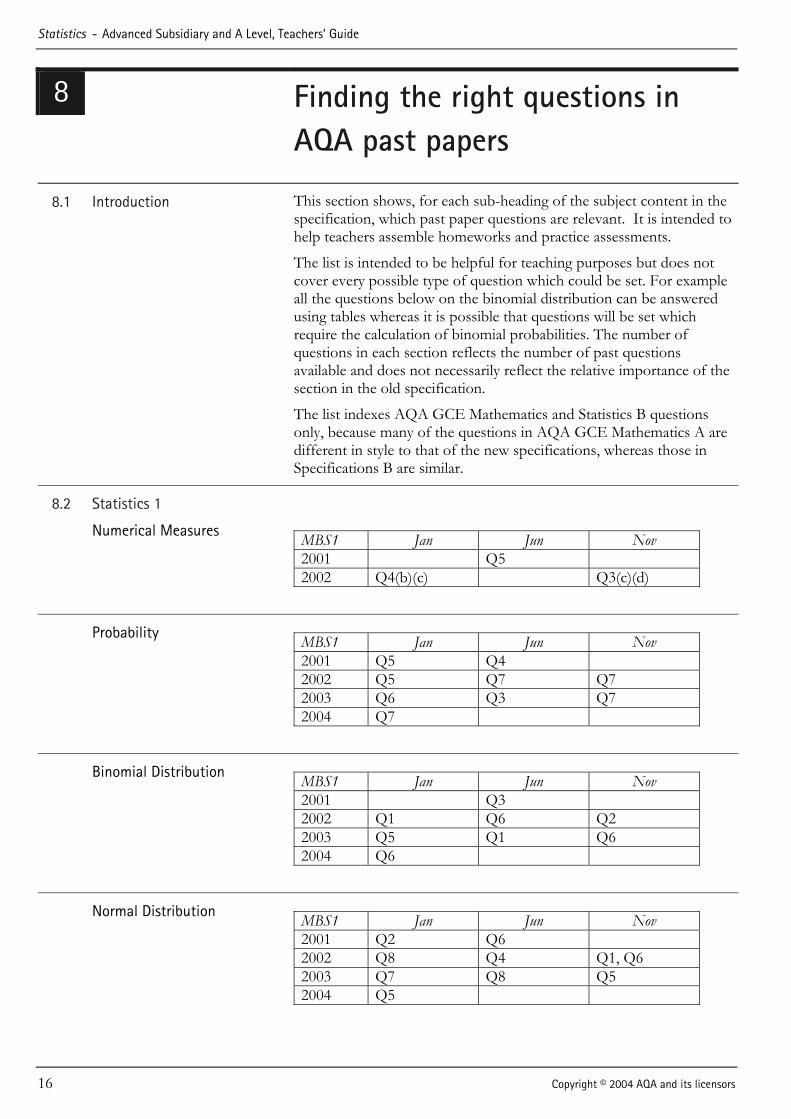
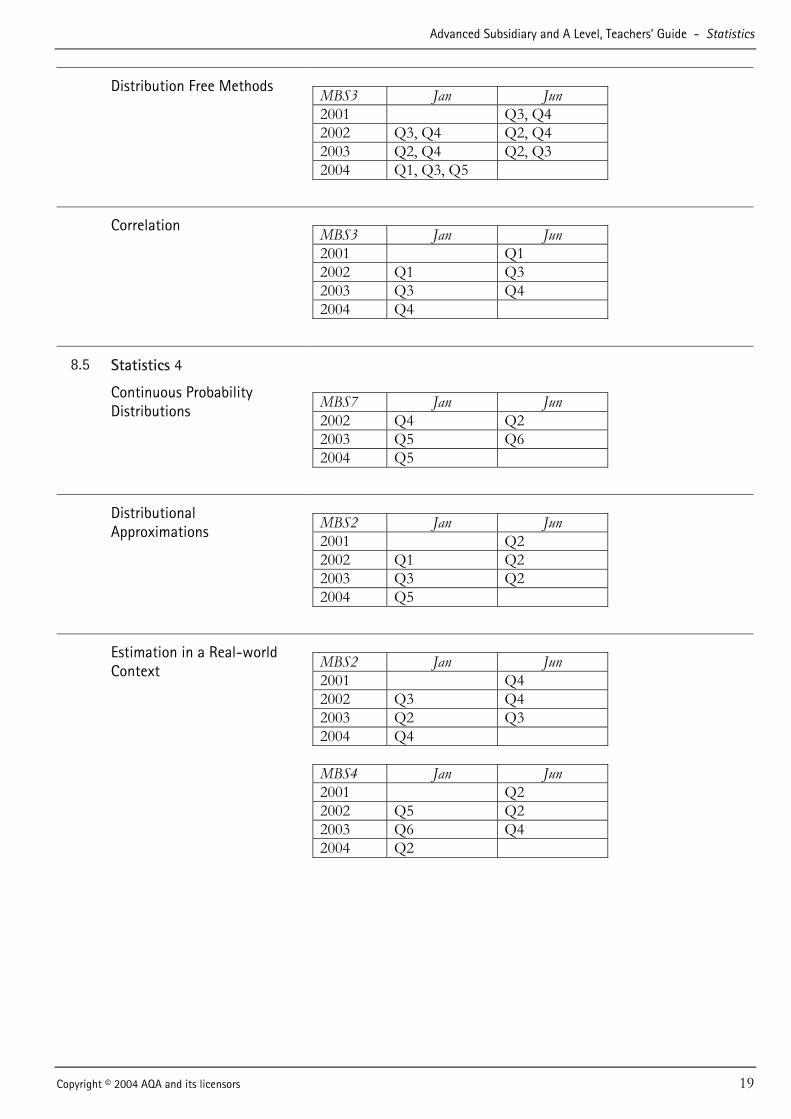
8.1 Introduction This section shows, for each sub-heading of the subject content in the specification, which past paper questions are relevant. It is intended to help teachers assemble homeworks and practice assessments.
The list is intended to be helpful for teaching purposes but does not cover every possible type of question which could be set. For example all the questions below on the binomial distribution can be answered using tables whereas it is possible that questions will be set which require the calculation of binomial probabilities. The number of questions in each section reflects the number of past questions available and does not necessarily reflect the relative importance of the section in the old specification.
The list indexes AQA GCE Mathematics and Statistics B questions only, because many of the questions in AQA GCE Mathematics A are different in style to that of the new specifications, whereas those in Specifications B are similar.
8.2 Statistics 1
Numerical Measures MBS1 Jan Jun Nov 2001 Q5 2002 Q4(b)(c) Q3(c)(d)
Probability MBS1 Jan Jun Nov 2001 Q5 Q4 2002 Q5 Q7 Q7 2003 Q6 Q3 Q7 2004 Q7
Binomial Distribution MBS1 Jan Jun Nov 2001 Q3 2002 Q1 Q6 Q2 2003 Q5 Q1 Q6 2004 Q6
Normal Distribution MBS1 Jan Jun Nov 2001 Q2 Q6 2002 Q8 Q4 Q1, Q6 2003 Q7 Q8 Q5 2004 Q5
Advanced Subsidiary and A Level, Teachers� Guide - Statistics
Copyright © 2004 AQA and its licensors 17
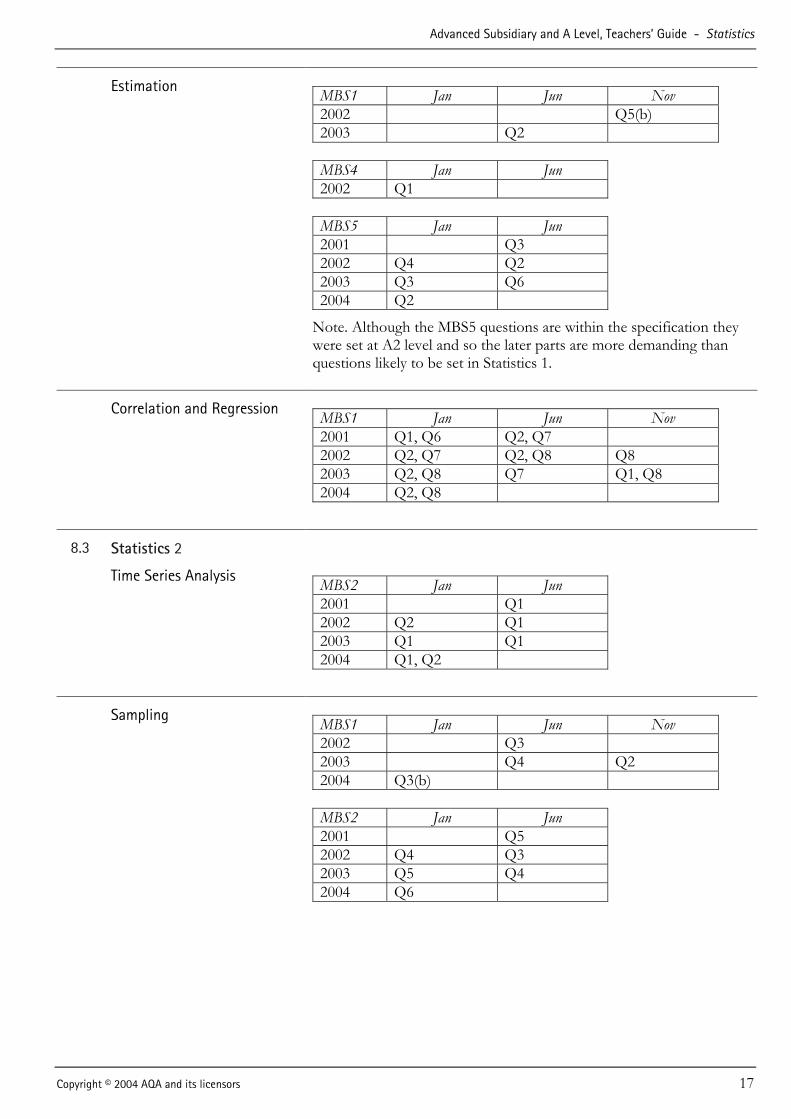
Estimation MBS1 Jan Jun Nov 2002 Q5(b) 2003 Q2
MBS4 Jan Jun 2002 Q1
MBS5 Jan Jun 2001 Q3 2002 Q4 Q2 2003 Q3 Q6 2004 Q2
Note. Although the MBS5 questions are within the specification they were set at A2 level and so the later parts are more demanding than questions likely to be set in Statistics 1.
Correlation and Regression MBS1 Jan Jun Nov 2001 Q1, Q6 Q2, Q7 2002 Q2, Q7 Q2, Q8 Q8 2003 Q2, Q8 Q7 Q1, Q8 2004 Q2, Q8
8.3 Statistics 2
Time Series Analysis MBS2 Jan Jun 2001 Q1 2002 Q2 Q1 2003 Q1 Q1 2004 Q1, Q2
Sampling MBS1 Jan Jun Nov 2002 Q3 2003 Q4 Q2 2004 Q3(b)
MBS2 Jan Jun 2001 Q5 2002 Q4 Q3 2003 Q5 Q4 2004 Q6
Statistics - Advanced Subsidiary and A Level, Teachers� Guide
18 Copyright © 2004 AQA and its licensors
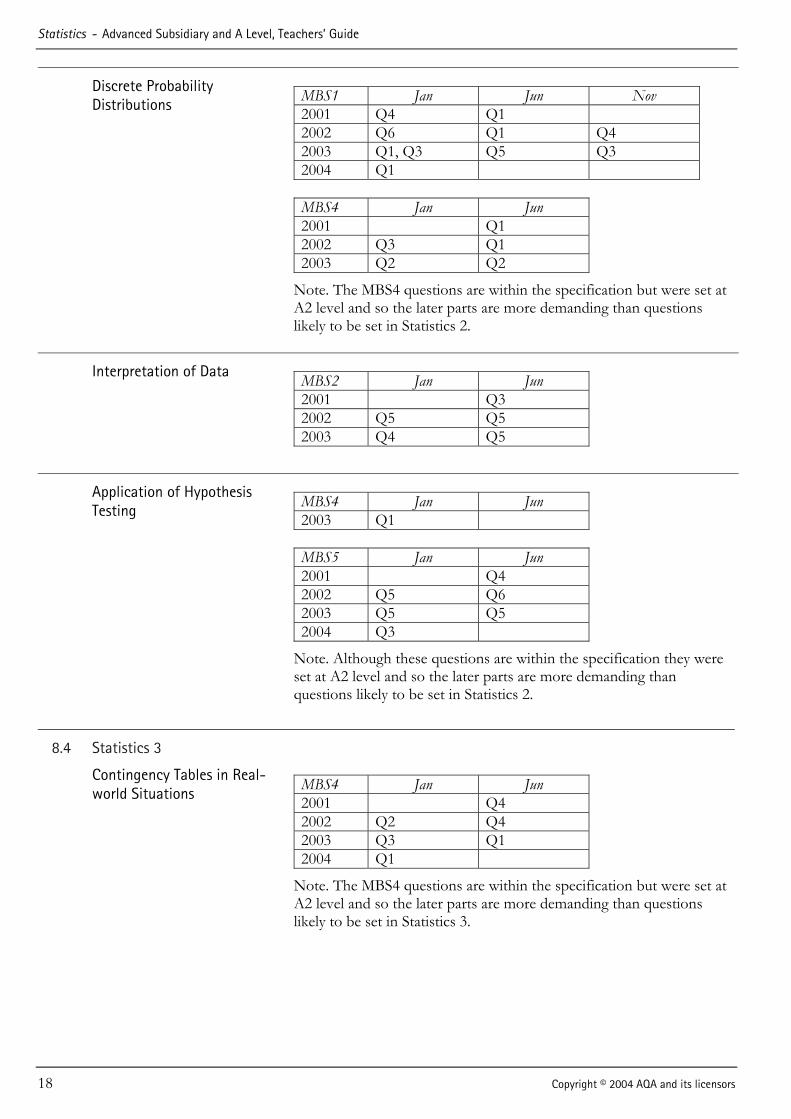
Discrete Probability Distributions
MBS1 Jan Jun Nov 2001 Q4 Q1 2002 Q6 Q1 Q4 2003 Q1, Q3 Q5 Q3 2004 Q1
MBS4 Jan Jun 2001 Q1 2002 Q3 Q1 2003 Q2 Q2
Note. The MBS4 questions are within the specification but were set at A2 level and so the later parts are more demanding than questions likely to be set in Statistics 2.
Interpretation of Data MBS2 Jan Jun 2001 Q3 2002 Q5 Q5 2003 Q4 Q5
Application of Hypothesis Testing
MBS4 Jan Jun 2003 Q1
MBS5 Jan Jun 2001 Q4 2002 Q5 Q6 2003 Q5 Q5 2004 Q3
Note. Although these questions are within the specification they were set at A2 level and so the later parts are more demanding than questions likely to be set in Statistics 2.
8.4 Statistics 3
Contingency Tables in Real-world Situations
MBS4 Jan Jun 2001 Q4 2002 Q2 Q4 2003 Q3 Q1 2004 Q1
Note. The MBS4 questions are within the specification but were set at A2 level and so the later parts are more demanding than questions likely to be set in Statistics 3.
Advanced Subsidiary and A Level, Teachers� Guide - Statistics
Copyright © 2004 AQA and its licensors 19
Distribution Free Methods MBS3 Jan Jun 2001 Q3, Q4 2002 Q3, Q4 Q2, Q4 2003 Q2, Q4 Q2, Q3 2004 Q1, Q3, Q5
Correlation MBS3 Jan Jun 2001 Q1 2002 Q1 Q3 2003 Q3 Q4 2004 Q4
8.5 Statistics 4
Continuous Probability Distributions
MBS7 Jan Jun 2002 Q4 Q2 2003 Q5 Q6 2004 Q5
Distributional Approximations
MBS2 Jan Jun 2001 Q2 2002 Q1 Q2 2003 Q3 Q2 2004 Q5
Estimation in a Real-world Context
MBS2 Jan Jun 2001 Q4 2002 Q3 Q4 2003 Q2 Q3 2004 Q4
MBS4 Jan Jun 2001 Q2 2002 Q5 Q2 2003 Q6 Q4 2004 Q2
Statistics - Advanced Subsidiary and A Level, Teachers� Guide
20 Copyright © 2004 AQA and its licensors
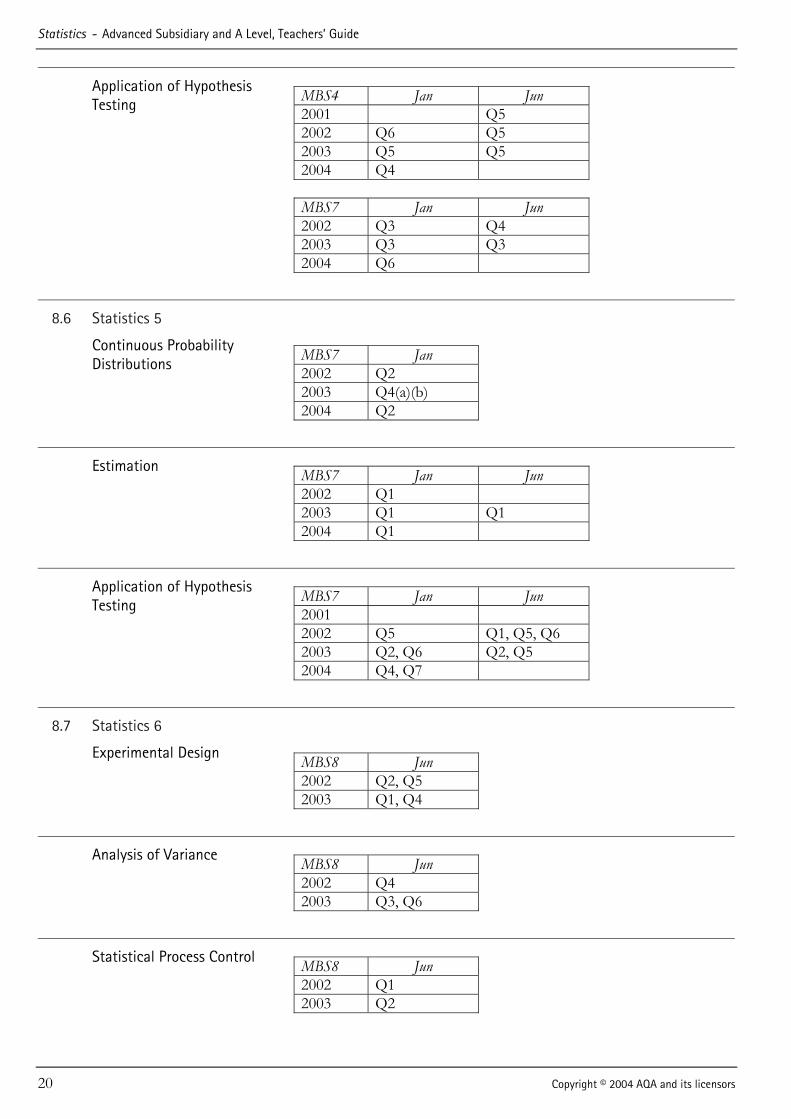
Application of Hypothesis Testing
MBS4 Jan Jun 2001 Q5 2002 Q6 Q5 2003 Q5 Q5 2004 Q4
MBS7 Jan Jun 2002 Q3 Q4 2003 Q3 Q3 2004 Q6
8.6 Statistics 5
Continuous Probability Distributions
MBS7 Jan 2002 Q2 2003 Q4(a)(b) 2004 Q2
Estimation MBS7 Jan Jun 2002 Q1 2003 Q1 Q1 2004 Q1
Application of Hypothesis Testing
MBS7 Jan Jun 2001 2002 Q5 Q1, Q5, Q6 2003 Q2, Q6 Q2, Q5 2004 Q4, Q7
8.7 Statistics 6
Experimental Design MBS8 Jun 2002 Q2, Q5 2003 Q1, Q4
Analysis of Variance MBS8 Jun 2002 Q4 2003 Q3, Q6
Statistical Process Control MBS8 Jun 2002 Q1 2003 Q2
Advanced Subsidiary and A Level, Teachers� Guide - Statistics
Copyright © 2004 AQA and its licensors 21
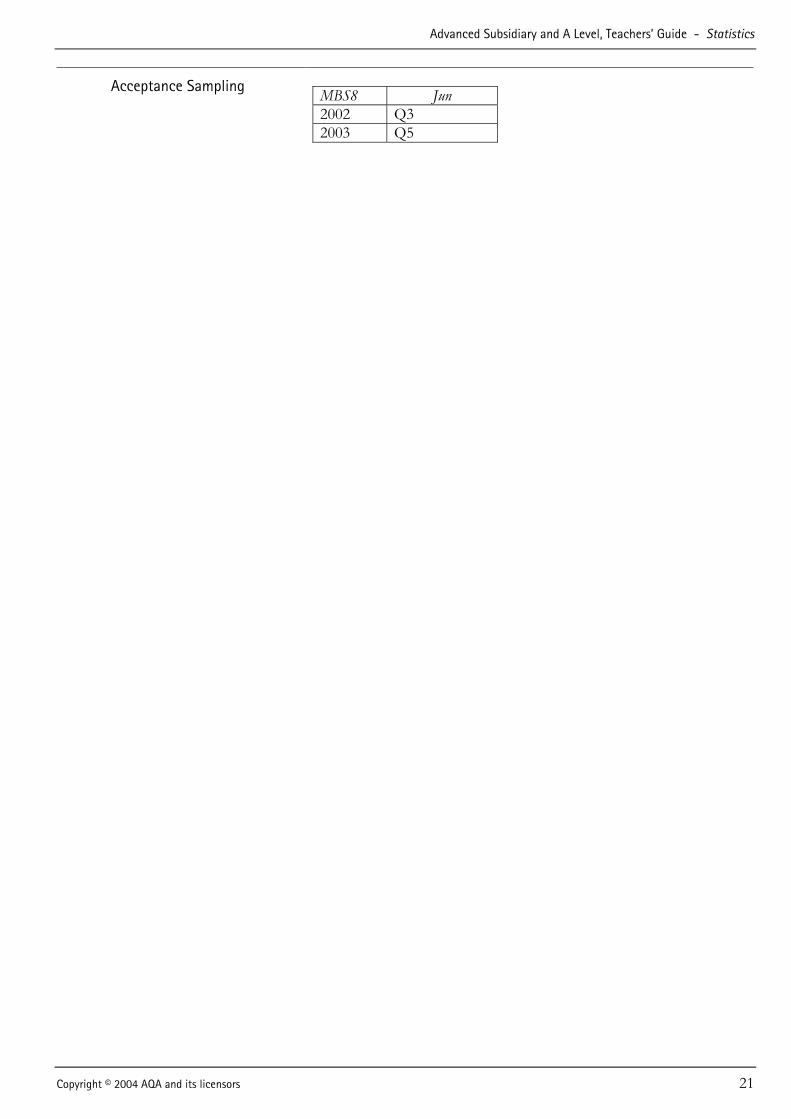
Acceptance Sampling MBS8 Jun 2002 Q3 2003 Q5
Statistics - Advanced Subsidiary and A Level, Teachers� Guide
22 Copyright © 2004 AQA and its licensors
Organisation of the Course
9 Delivery of the course
9.1 Introduction The purpose of these outline schemes of work is to provide advice
and guidance to teachers, not to prescribe and restrict their approach to the specification. Please bear in mind that there is no requirement to use these schemes, which are suggestions only and are by no means the only approaches possible.
9.2 AS Statistics The AS Statistics course is probably taught in most schools/colleges over a 32 week maximum time period with, say, around 4.5 hours per week typically giving 3 lessons of 1.5 hours each week. This provides around 144 hours teaching per academic year. The Statistics modules are equally weighted so need approximately equal teaching time
However, the terms are commonly unevenly balanced with an Autumn term of 14/15 weeks, a Spring term of 12/13 weeks (but with an exam series during that time) and a short Summer term of about 5 weeks prior to the main exam period in late May � mid June. Care must be taken to introduce the course gradually with SS1A/B to ensure that the basic grounding is there but also to introduce topics from the second module, SS02, in the Autumn term, so that time constraints do not prevent the full course being covered by the summer exam period.
SS1A/B can be successfully taken after one term�s study or it may be taken at the end of the year, together with SS02 and SS03.
A suggested outline scheme of work for one teacher taking an AS class throughout the year is shown in the first table.
If two teachers share the AS Statistics teaching, then a suggested scheme of work for an AS class throughout the year is given in the second table.
Advanced Subsidiary and A Level, Teachers� Guide - Statistics
Copyright © 2004 AQA and its licensors 23
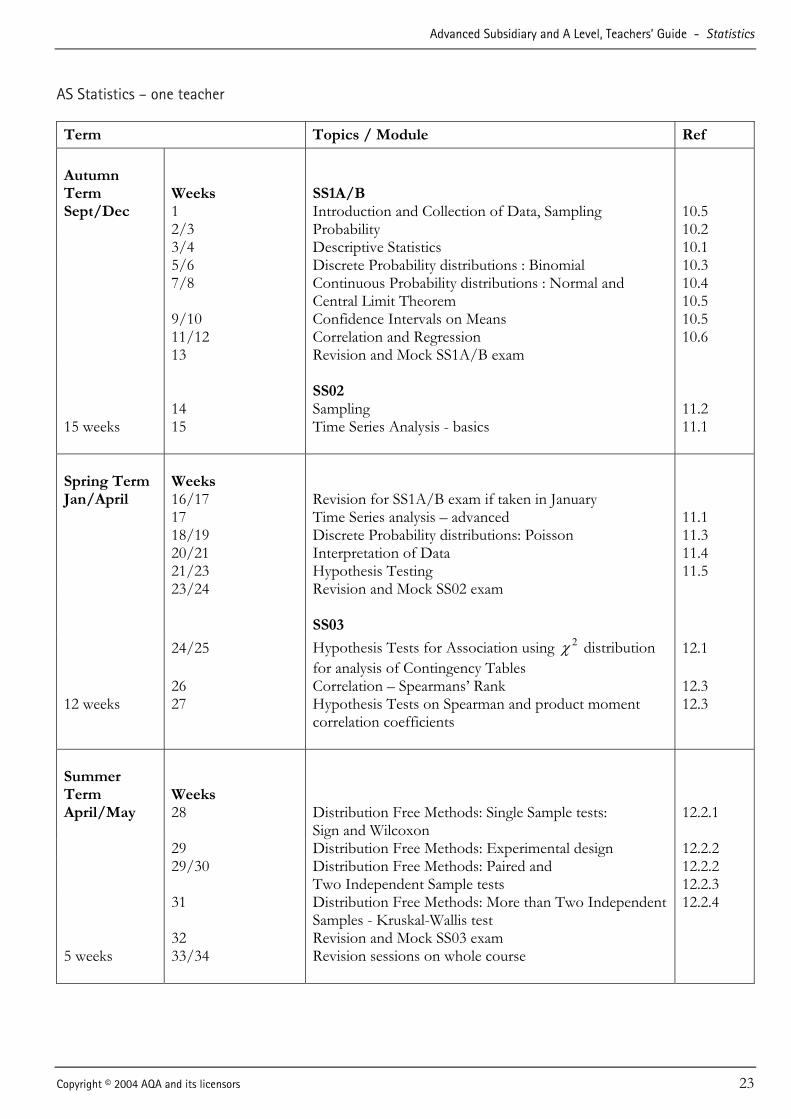
AS Statistics � one teacher Term Topics / Module Ref
Autumn Term Sept/Dec
Weeks 1
SS1A/B Introduction and Collection of Data, Sampling
10.5
2/3 Probability 10.2 3/4 Descriptive Statistics 10.1 5/6 Discrete Probability distributions : Binomial 10.3 7/8 Continuous Probability distributions : Normal and
Central Limit Theorem 10.4 10.5
9/10 11/12 13
Confidence Intervals on Means Correlation and Regression Revision and Mock SS1A/B exam
10.5 10.6
15 weeks
14 15
SS02 Sampling Time Series Analysis - basics
11.2 11.1
Spring Term Jan/April
Weeks 16/17
Revision for SS1A/B exam if taken in January
17 Time Series analysis � advanced 11.1 18/19 Discrete Probability distributions: Poisson 11.3 20/21 Interpretation of Data 11.4 21/23 Hypothesis Testing 11.5 23/24 Revision and Mock SS02 exam
SS03
24/25 Hypothesis Tests for Association using 2χ distribution for analysis of Contingency Tables
12.1
26 Correlation � Spearmans� Rank 12.3 12 weeks
27 Hypothesis Tests on Spearman and product moment correlation coefficients
12.3
Summer Term April/May
Weeks 28
Distribution Free Methods: Single Sample tests: Sign and Wilcoxon
12.2.1
29 Distribution Free Methods: Experimental design 12.2.2 29/30 Distribution Free Methods: Paired and
Two Independent Sample tests 12.2.2 12.2.3
31 Distribution Free Methods: More than Two Independent Samples - Kruskal-Wallis test
12.2.4
32 Revision and Mock SS03 exam 5 weeks
33/34 Revision sessions on whole course

Statistics - Advanced Subsidiary and A Level, Teachers� Guide
24 Copyright © 2004 AQA and its licensors
AS Statistics � two teachers
Teacher 1
Term Topics/Module Ref
Autumn Term
Week 1/4
SS1A/B Descriptive Statistics and Collection of Data
10.1, 10.5
4/8 Continuous Probability Distributions:Normal and CLT 10.4, 10.5 9/12 Confidence Intervals on Means 10.5 13 Revision and Mock SS1A/B exam 15 weeks
14/15
SS02 Sampling
11.2
Spring Term
Week 16/17
Revision for SS1A/B exam if taken in January
17/21 Hypothesis Testing 11.5 22 Revision of SS02
23/25
SS03 Distribution Free Methods: Single Sample tests: Sign and Wilcoxon
12.2.1
12 weeks
26/27 Distribution Free Methods: Experimental design Also introduce Paired tests
12.2.2
Summer Term
Week 28/29
Distribution Free Methods: Paired tests and Two Independent Sample tests
12.2.2 12.2.3
30/31 Independent Samples, Kruskal-Wallis test 12.2.4 32 Revision and Mock SS03 exam 33/34
Revision sessions on whole course
Advanced Subsidiary and A Level, Teachers� Guide - Statistics
Copyright © 2004 AQA and its licensors 25
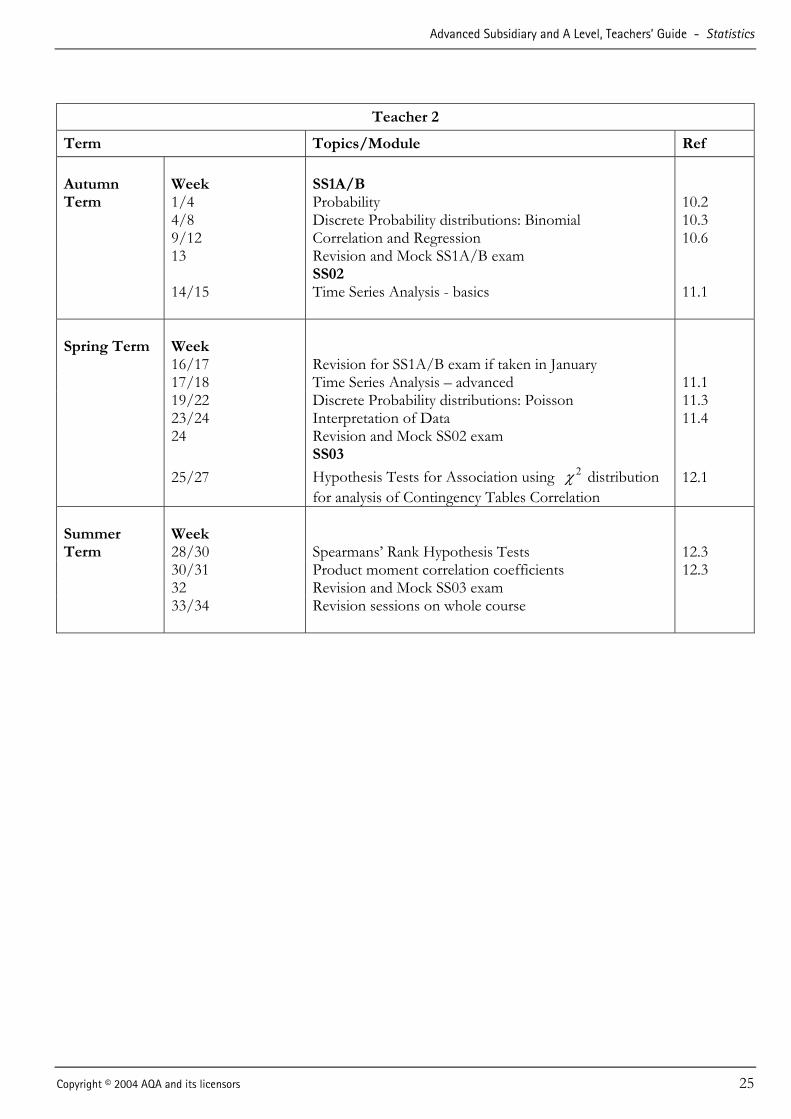
Teacher 2
Term Topics/Module Ref
Autumn Term
Week 1/4
SS1A/B Probability
10.2
4/8 Discrete Probability distributions: Binomial 10.3 9/12 Correlation and Regression 10.6 13 Revision and Mock SS1A/B exam
14/15
SS02 Time Series Analysis - basics
11.1
Spring Term
Week 16/17
Revision for SS1A/B exam if taken in January
17/18 Time Series Analysis � advanced 11.1 19/22 Discrete Probability distributions: Poisson 11.3 23/24 Interpretation of Data 11.4 24 Revision and Mock SS02 exam
25/27
SS03
Hypothesis Tests for Association using 2χ distribution for analysis of Contingency Tables Correlation
12.1
Summer Term
Week 28/30
Spearmans� Rank Hypothesis Tests
12.3
30/31 Product moment correlation coefficients 12.3 32 Revision and Mock SS03 exam 33/34
Revision sessions on whole course

Statistics - Advanced Subsidiary and A Level, Teachers� Guide
26 Copyright © 2004 AQA and its licensors
9.3 A2 Statistics units The A2 Statistics course is probably taught in most schools/colleges over a 33 week maximum time period with, say, around 4.5 hours per week typically giving 3 lessons of 1.5 hours each week. This provides around 148.5 hours teaching per academic year. The terms are commonly unevenly balanced with many centres utilising 2 weeks post exam time in the summer term of year 12 to start A2 teaching and then an Autumn term of 14/15 weeks, a Spring term of 12/13 weeks (but with an exam series during that time) and a short Summer term of about 5 weeks prior to the main exam period in mid June. SS04 can be successfully taken after one term�s study or it may be taken at the end of the year, together with SS05 and SS06.
The Statistics modules are equally weighted and therefore SS04 can be taught for the majority of the Autumn term but also some topics, from the module SS05, will need to be introduced in the Autumn term.
A suggested scheme of work for one teacher taking an A2 class throughout the year is shown in the following table.
Term Topics / Module Ref
Summer term after the AS exams
Weeks 37/38
SS04 Distributional Approximations
13.2
Autumn term Sep/Dec
1/2
Estimation � Approx confidence intervals for Binomial and Poisson
13.3
3/4 Estimation � Approx confidence intervals for mean based on sample from Normal distribution with unknown standard deviation � t distribution
13.3
5/6 Hypothesis test for mean based on sample form Normal distribution with unknown standard deviation � t distribution
13.4
7/9 Hypothesis tests for Binomial proportion and Poisson mean � exact or Normal approximation
13.4
10/11 Continuous probability distributions � linear combinations
13.1
12/13 Revision and Mock SS04 exam
14
SS05 Confidence Intervals for variance and standard deviation based on sample from Normal distribution � using 2χ
14.2
15 weeks 15 Hypothesis tests for variance and standard deviation based on sample from Normal distribution � using 2χ
14.3

Advanced Subsidiary and A Level, Teachers� Guide - Statistics
Copyright © 2004 AQA and its licensors 27
Spring Term Jan/April
Weeks
16/18
Revision for SS04 exam if taken in January � to include revision of all hypothesis testing (to include tests on variance and standard deviation)
19/20 Continuous Probability distributions � Rectangular and Exponential
14.1
20/23 2χ Goodness of Fit test � for Binomial, Poisson, Rectangular, Exponential, Normal and specific discrete
14.3
23/24 Two independent samples test � for variances, using F and for means, using z or t
14.3
25 Revision and Mock SS05 exam
SS06 12 weeks
26 26/27
Experimental design Analysis of paired comparisons using t test Revision of sign test and Wilcoxon signed-rank test
15.1 15.1
Summer Term April/May
Weeks 28/29
Statistical Process control � Control Charts
15.3
30/31 Acceptance Sampling 15.4 32/33 Analysis of Variance � one-factor, two-factor and Latin
Square design 15.2
5 weeks 34 Revision and Mock SS06 exam Revision sessions on whole course
Statistics - Advanced Subsidiary and A Level, Teachers� Guide
28 Copyright © 2004 AQA and its licensors
9.4 Notes on subject content The following notes are provided on particular sections of the subject content about which some teachers have indicated they would value additional guidance.
Time Series Analysis There is probably more interest in time series analysis than in any other area of statistics. This is because nearly all organisations, whether large businesses, government, local authorities or corner shopkeepers, need to forecast future demand for goods and services.
Whilst statistical methods may be used to project past patterns into the future, there is no guarantee, or even likelihood, that these past patterns will continue. It is nearly always useful to make a forecast based on statistical methods, but it is unwise to make exaggerated claims for the likely accuracy of such a forecast.
Time series are often thought of as being composed of some or all of the following elements:
Trend a long-term smooth movement
Seasonal variation ice cream sales may be higher in the summer than the winter; a market stall may take more money on a Saturday than a Monday
Short term variation variation about the trend which is neither regular nor random
Random variation by definition these cannot be forecast
Candidates should be aware that the division of a time series into these elements has a large subjective element and the meaning of the terms is heavily dependent on the context. For example, in terms of climatic change, 20 years might be regarded as short-term and 1000 years as long-term, whereas a corner shop might regard a week as short-term and a year as long-term.
There are many alternative methods of dealing with seasonal variation
but candidates will only be expected to use a simple additive model and to estimate the magnitude of seasonal effects by comparing observations with the appropriate moving average. Nothing more complex than the example in the specimen assessment unit SS02 will be set.
If seasonal variation is present, it is usually best to attempt to remove
it (or to deseasonalise the data) before examining trend and other forms of variation. The simplest form of trend is a straight line. Questions could be set which require the use of simple linear regression to estimate trend, alternatively estimating trend by eye (as in the specimen question) will be sufficient.
Only a descriptive treatment of short-term and random variation is required.
Advanced Subsidiary and A Level, Teachers� Guide - Statistics
Copyright © 2004 AQA and its licensors 29
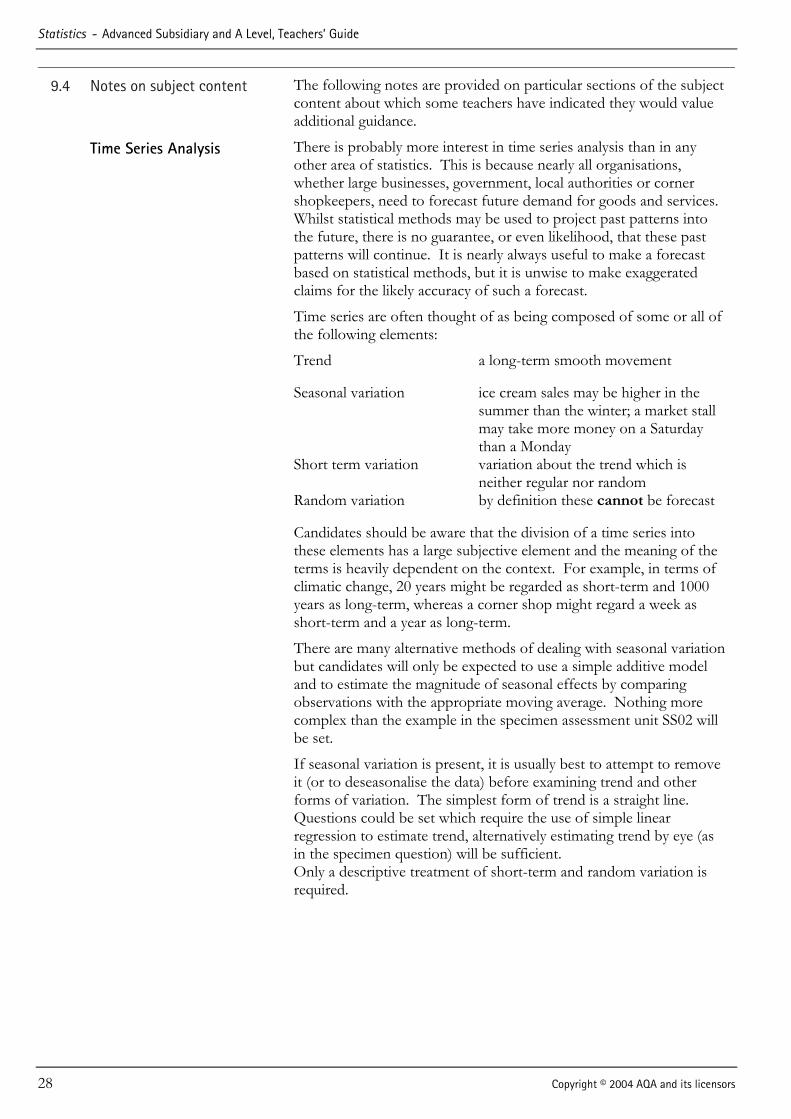
Example: Plot points illustrating a time series which exhibits:
(i) random variation about an upward linear trend; (ii) short-term variation about a downward linear tend; (iii) seasonal variation about an upward linear trend; (iv) random variation about a non-linear upward trend.
Distribution Free Methods Defining distribution free tests (also known as non-parametric tests) is
not easy. The term applies to a group of tests which do not assume that the population from which the sample(s) are taken is normally distributed. They also do not require data measured on a ratio scale, and ranking is sufficient. They may, however, require some other assumptions to be made.
Tests, such as the t-test and F-test, which require more assumptions are generally more powerful (that is more likely to reject a false null hypothesis) than the equivalent distribution free test. However, the difference in power is in some cases quite small.
Sign Test A soft drinks dispenser is set to dispense 200 ml of liquid. The contents of a random sample of 20 drinks were measured in ml.
202 196 192 194 199 203 190 191 194 199193 189 188 187 204 199 197 191 204 195
Does the machine need resetting?
A t-test could be used to test the hypothesis that the mean of all drinks is 200 ml. This would require the assumption of a normal distribution. As there are approximately 20 observations, it would be reasonable to assume that the mean was approximately normally distributed. However, an alternative approach which does not require this assumption is the sign test. This tests a hypothesis about the population median.
Statistics - Advanced Subsidiary and A Level, Teachers� Guide
30 Copyright © 2004 AQA and its licensors
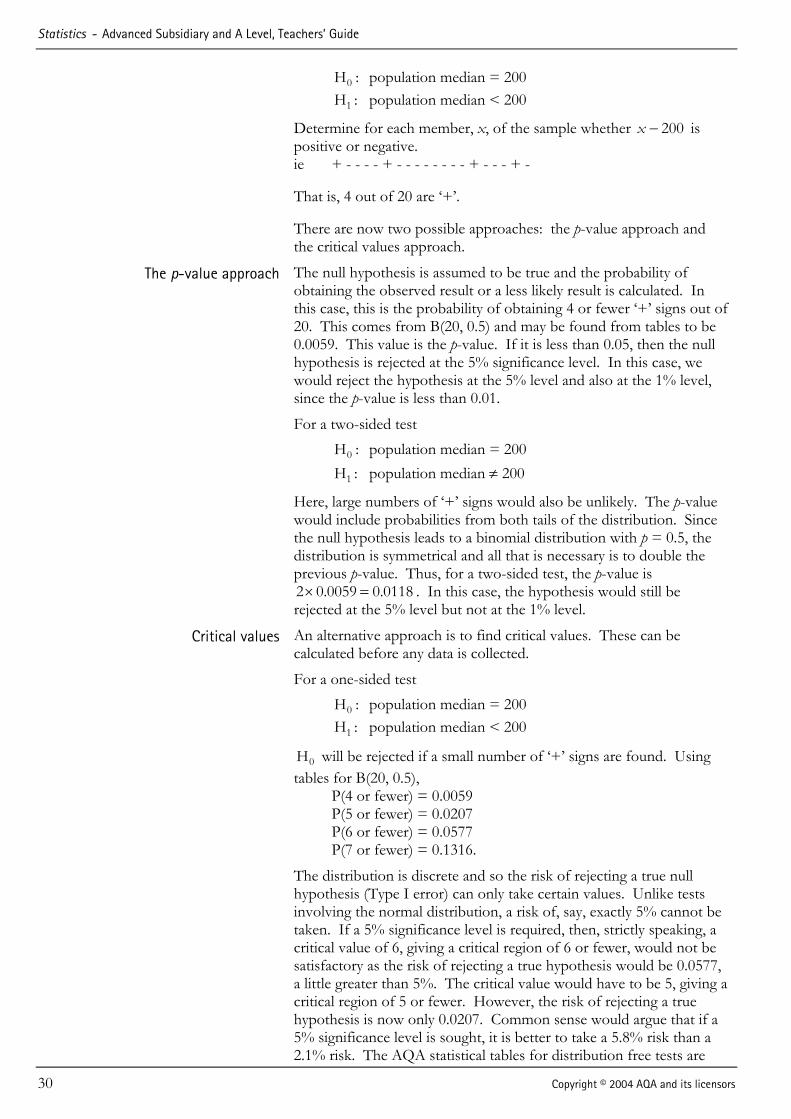
0H : population median = 200 1H : population median < 200
Determine for each member, x, of the sample whether 200−x is positive or negative.
ie + - - - - + - - - - - - - - + - - - + -
That is, 4 out of 20 are �+�.
There are now two possible approaches: the p-value approach and the critical values approach.
The p-value approach The null hypothesis is assumed to be true and the probability of obtaining the observed result or a less likely result is calculated. In this case, this is the probability of obtaining 4 or fewer �+� signs out of 20. This comes from B(20, 0.5) and may be found from tables to be 0.0059. This value is the p-value. If it is less than 0.05, then the null
hypothesis is rejected at the 5% significance level. In this case, we would reject the hypothesis at the 5% level and also at the 1% level, since the p-value is less than 0.01.
For a two-sided test
0H : population median = 200 1H : population median ≠ 200
Here, large numbers of �+� signs would also be unlikely. The p-value would include probabilities from both tails of the distribution. Since the null hypothesis leads to a binomial distribution with p = 0.5, the distribution is symmetrical and all that is necessary is to double the previous p-value. Thus, for a two-sided test, the p-value is
01180005902 .. =× . In this case, the hypothesis would still be rejected at the 5% level but not at the 1% level.
Critical values An alternative approach is to find critical values. These can be calculated before any data is collected.
For a one-sided test
0H : population median = 200 1H : population median < 200
0H will be rejected if a small number of �+� signs are found. Using tables for B(20, 0.5),
P(4 or fewer) = 0.0059 P(5 or fewer) = 0.0207 P(6 or fewer) = 0.0577 P(7 or fewer) = 0.1316.
The distribution is discrete and so the risk of rejecting a true null hypothesis (Type I error) can only take certain values. Unlike tests involving the normal distribution, a risk of, say, exactly 5% cannot be taken. If a 5% significance level is required, then, strictly speaking, a critical value of 6, giving a critical region of 6 or fewer, would not be satisfactory as the risk of rejecting a true hypothesis would be 0.0577, a little greater than 5%. The critical value would have to be 5, giving a critical region of 5 or fewer. However, the risk of rejecting a true hypothesis is now only 0.0207. Common sense would argue that if a 5% significance level is sought, it is better to take a 5.8% risk than a 2.1% risk. The AQA statistical tables for distribution free tests are
Advanced Subsidiary and A Level, Teachers� Guide - Statistics
Copyright © 2004 AQA and its licensors 31
constructed on the common sense basis of taking a risk as near as possible to the required value. [Statistical purists would disagree and argue that the risk should always be less than or equal to the stated significance level.]
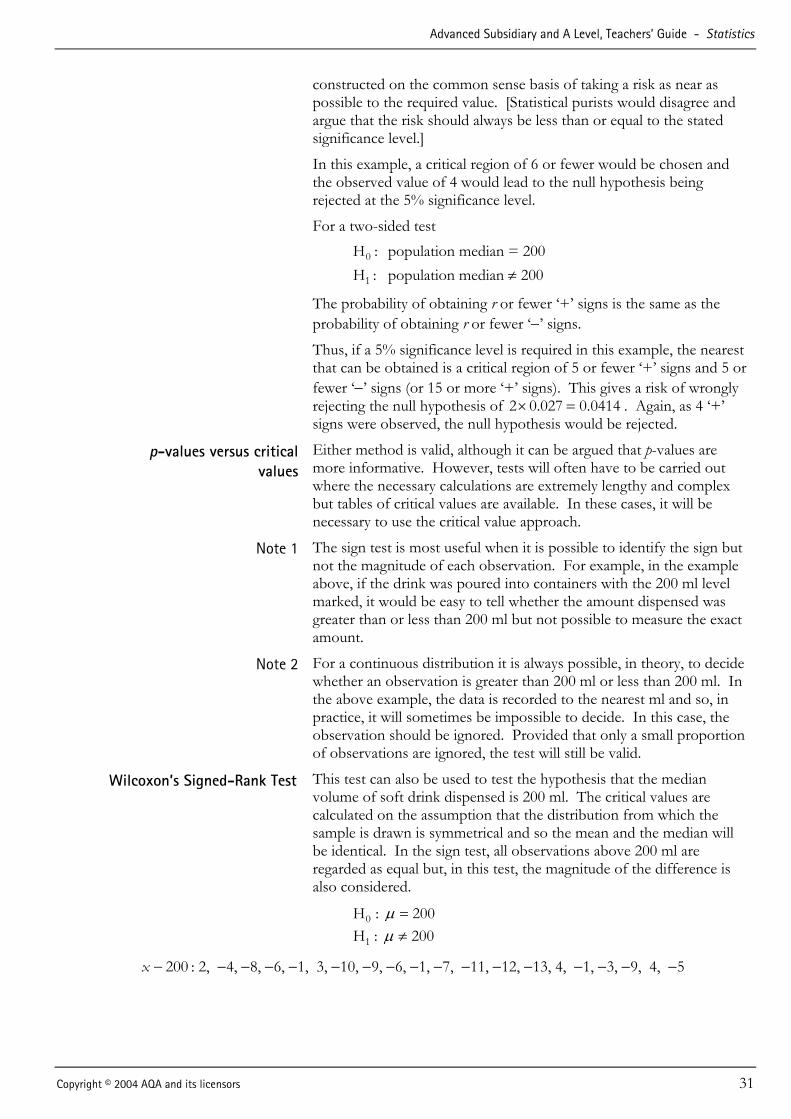
In this example, a critical region of 6 or fewer would be chosen and the observed value of 4 would lead to the null hypothesis being rejected at the 5% significance level.
For a two-sided test
0H : population median = 200 1H : population median ≠ 200
The probability of obtaining r or fewer �+� signs is the same as the probability of obtaining r or fewer �−� signs.
Thus, if a 5% significance level is required in this example, the nearest that can be obtained is a critical region of 5 or fewer �+� signs and 5 or fewer �−� signs (or 15 or more �+� signs). This gives a risk of wrongly rejecting the null hypothesis of 0414.0027.02 =× . Again, as 4 �+� signs were observed, the null hypothesis would be rejected.
p-values versus critical values
Either method is valid, although it can be argued that p-values are more informative. However, tests will often have to be carried out where the necessary calculations are extremely lengthy and complex but tables of critical values are available. In these cases, it will be necessary to use the critical value approach.
Note 1 The sign test is most useful when it is possible to identify the sign but not the magnitude of each observation. For example, in the example above, if the drink was poured into containers with the 200 ml level marked, it would be easy to tell whether the amount dispensed was greater than or less than 200 ml but not possible to measure the exact amount.
Note 2 For a continuous distribution it is always possible, in theory, to decide whether an observation is greater than 200 ml or less than 200 ml. In the above example, the data is recorded to the nearest ml and so, in practice, it will sometimes be impossible to decide. In this case, the observation should be ignored. Provided that only a small proportion of observations are ignored, the test will still be valid.
Wilcoxon�s Signed-Rank Test This test can also be used to test the hypothesis that the median volume of soft drink dispensed is 200 ml. The critical values are calculated on the assumption that the distribution from which the sample is drawn is symmetrical and so the mean and the median will be identical. In the sign test, all observations above 200 ml are regarded as equal but, in this test, the magnitude of the difference is also considered.
200 :H0 =µ 200 :H1 ≠µ
200−x : 2, −4, −8, −6, −1, 3, −10, −9, −6, −1, −7, −11, −12, −13, 4, −1, −3, −9, 4, −5
Statistics - Advanced Subsidiary and A Level, Teachers� Guide
32 Copyright © 2004 AQA and its licensors
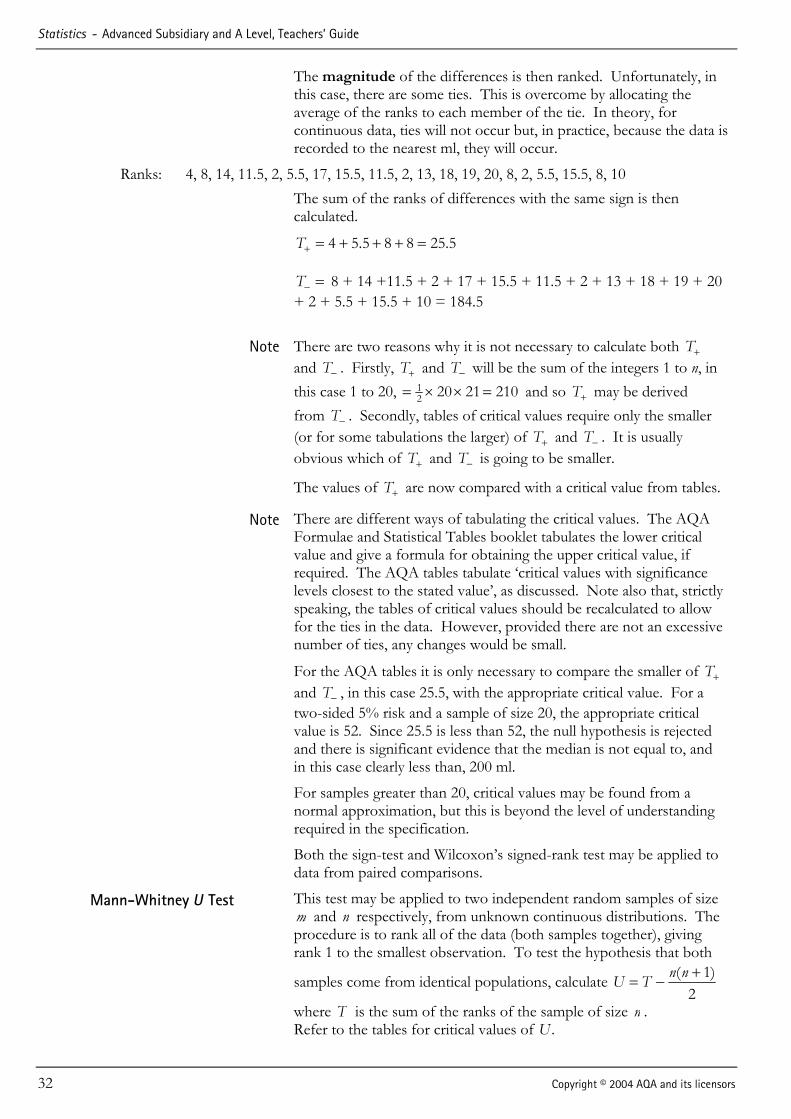
The magnitude of the differences is then ranked. Unfortunately, in this case, there are some ties. This is overcome by allocating the average of the ranks to each member of the tie. In theory, for continuous data, ties will not occur but, in practice, because the data is recorded to the nearest ml, they will occur.
Ranks: 4, 8, 14, 11.5, 2, 5.5, 17, 15.5, 11.5, 2, 13, 18, 19, 20, 8, 2, 5.5, 15.5, 8, 10
The sum of the ranks of differences with the same sign is then calculated.
5.25885.54 =+++=+T
=−T 8 + 14 +11.5 + 2 + 17 + 15.5 + 11.5 + 2 + 13 + 18 + 19 + 20 + 2 + 5.5 + 15.5 + 10 = 184.5
Note There are two reasons why it is not necessary to calculate both +T
and −T . Firstly, +T and −T will be the sum of the integers 1 to n, in this case 1 to 20, 21021202
1 =××= and so +T may be derived from −T . Secondly, tables of critical values require only the smaller (or for some tabulations the larger) of +T and −T . It is usually obvious which of +T and −T is going to be smaller.
The values of +T are now compared with a critical value from tables.
Note There are different ways of tabulating the critical values. The AQA Formulae and Statistical Tables booklet tabulates the lower critical value and give a formula for obtaining the upper critical value, if required. The AQA tables tabulate �critical values with significance levels closest to the stated value�, as discussed. Note also that, strictly speaking, the tables of critical values should be recalculated to allow for the ties in the data. However, provided there are not an excessive number of ties, any changes would be small.
For the AQA tables it is only necessary to compare the smaller of +T and −T , in this case 25.5, with the appropriate critical value. For a
two-sided 5% risk and a sample of size 20, the appropriate critical value is 52. Since 25.5 is less than 52, the null hypothesis is rejected and there is significant evidence that the median is not equal to, and in this case clearly less than, 200 ml.
For samples greater than 20, critical values may be found from a normal approximation, but this is beyond the level of understanding required in the specification.
Both the sign-test and Wilcoxon�s signed-rank test may be applied to data from paired comparisons.
Mann-Whitney U Test This test may be applied to two independent random samples of size m and n respectively, from unknown continuous distributions. The procedure is to rank all of the data (both samples together), giving rank 1 to the smallest observation. To test the hypothesis that both
samples come from identical populations, calculate 2
)1( +−= nnTU
where T is the sum of the ranks of the sample of size n .
Refer to the tables for critical values of .U
Advanced Subsidiary and A Level, Teachers� Guide - Statistics
Copyright © 2004 AQA and its licensors 33
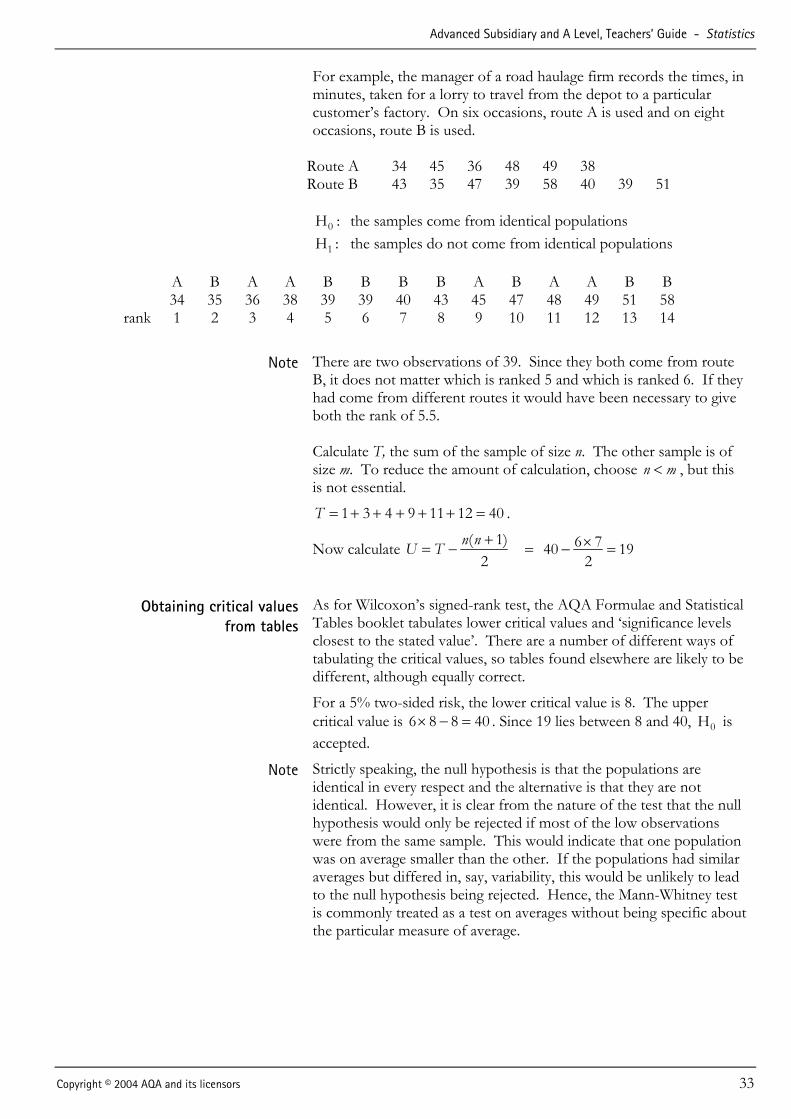
For example, the manager of a road haulage firm records the times, in minutes, taken for a lorry to travel from the depot to a particular customer�s factory. On six occasions, route A is used and on eight occasions, route B is used.
Route A 34 45 36 48 49 38 Route B 43 35 47 39 58 40 39 51
0H : the samples come from identical populations
1H : the samples do not come from identical populations
A B A A B B B B A B A A B B 34 35 36 38 39 39 40 43 45 47 48 49 51 58
rank 1 2 3 4 5 6 7 8 9 10 11 12 13 14
Note There are two observations of 39. Since they both come from route B, it does not matter which is ranked 5 and which is ranked 6. If they had come from different routes it would have been necessary to give both the rank of 5.5. Calculate T, the sum of the sample of size n. The other sample is of size m. To reduce the amount of calculation, choose mn < , but this is not essential.
4012119431 =+++++=T .
Now calculate 2
)1( +−= nnTU 192
7640 =×−=
Obtaining critical values from tables
As for Wilcoxon�s signed-rank test, the AQA Formulae and Statistical Tables booklet tabulates lower critical values and �significance levels closest to the stated value�. There are a number of different ways of tabulating the critical values, so tables found elsewhere are likely to be different, although equally correct.
For a 5% two-sided risk, the lower critical value is 8. The upper critical value is 40886 =−× . Since 19 lies between 8 and 40, 0H is accepted.
Note Strictly speaking, the null hypothesis is that the populations are identical in every respect and the alternative is that they are not identical. However, it is clear from the nature of the test that the null hypothesis would only be rejected if most of the low observations were from the same sample. This would indicate that one population was on average smaller than the other. If the populations had similar averages but differed in, say, variability, this would be unlikely to lead to the null hypothesis being rejected. Hence, the Mann-Whitney test is commonly treated as a test on averages without being specific about the particular measure of average.
Statistics - Advanced Subsidiary and A Level, Teachers� Guide
34 Copyright © 2004 AQA and its licensors
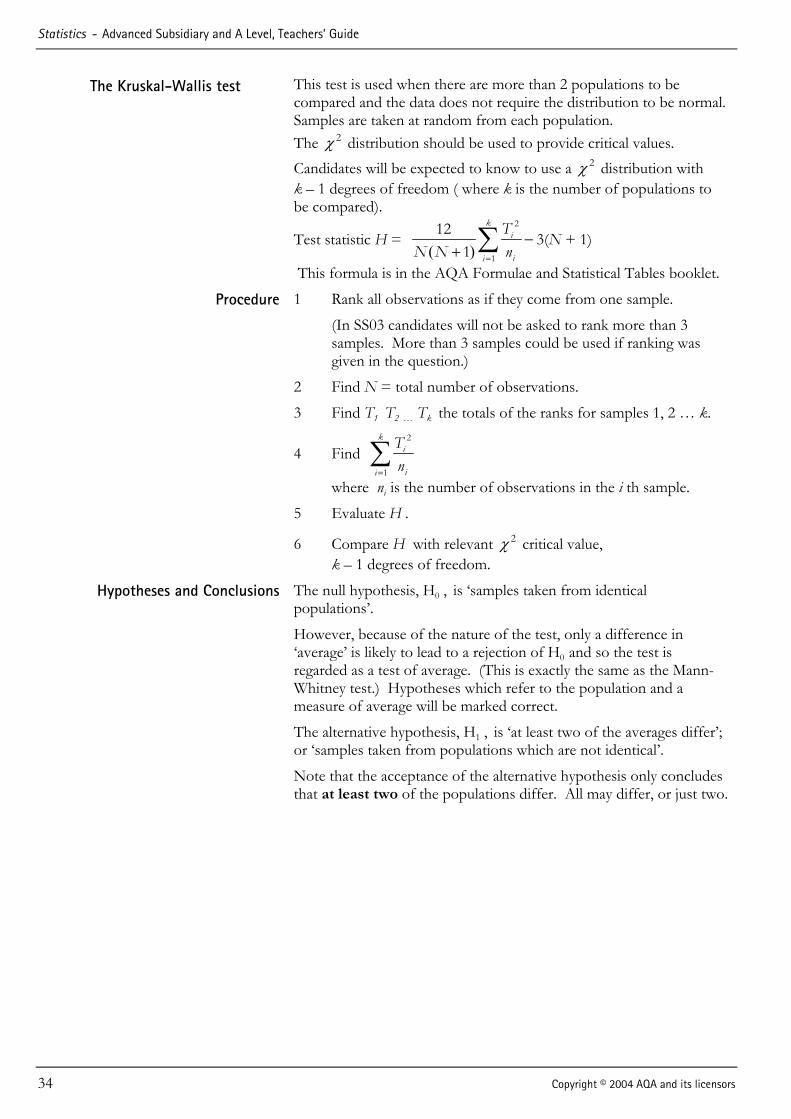
The Kruskal-Wallis test This test is used when there are more than 2 populations to be compared and the data does not require the distribution to be normal. Samples are taken at random from each population. The 2χ distribution should be used to provide critical values. Candidates will be expected to know to use a 2χ distribution with k � 1 degrees of freedom ( where k is the number of populations to be compared).
Test statistic H = ( ) =
−+ ∑
ki
ii
TN N n
2
1
121
3(N + 1)
This formula is in the AQA Formulae and Statistical Tables booklet.
Procedure 1 Rank all observations as if they come from one sample.
(In SS03 candidates will not be asked to rank more than 3 samples. More than 3 samples could be used if ranking was given in the question.)
2 Find N = total number of observations.
3 Find T1 T2 � Tk the totals of the ranks for samples 1, 2 � k.
4 Find =∑
ki
ii
Tn
2
1
where ni is the number of observations in the i th sample.
5 Evaluate H .
6 Compare H with relevant 2χ critical value, k � 1 degrees of freedom.
Hypotheses and Conclusions The null hypothesis, H0 , is �samples taken from identical populations�.
However, because of the nature of the test, only a difference in �average� is likely to lead to a rejection of H0 and so the test is regarded as a test of average. (This is exactly the same as the Mann-Whitney test.) Hypotheses which refer to the population and a measure of average will be marked correct.
The alternative hypothesis, H1 , is �at least two of the averages differ�; or �samples taken from populations which are not identical�.
Note that the acceptance of the alternative hypothesis only concludes that at least two of the populations differ. All may differ, or just two.
Advanced Subsidiary and A Level, Teachers� Guide - Statistics
Copyright © 2004 AQA and its licensors 35
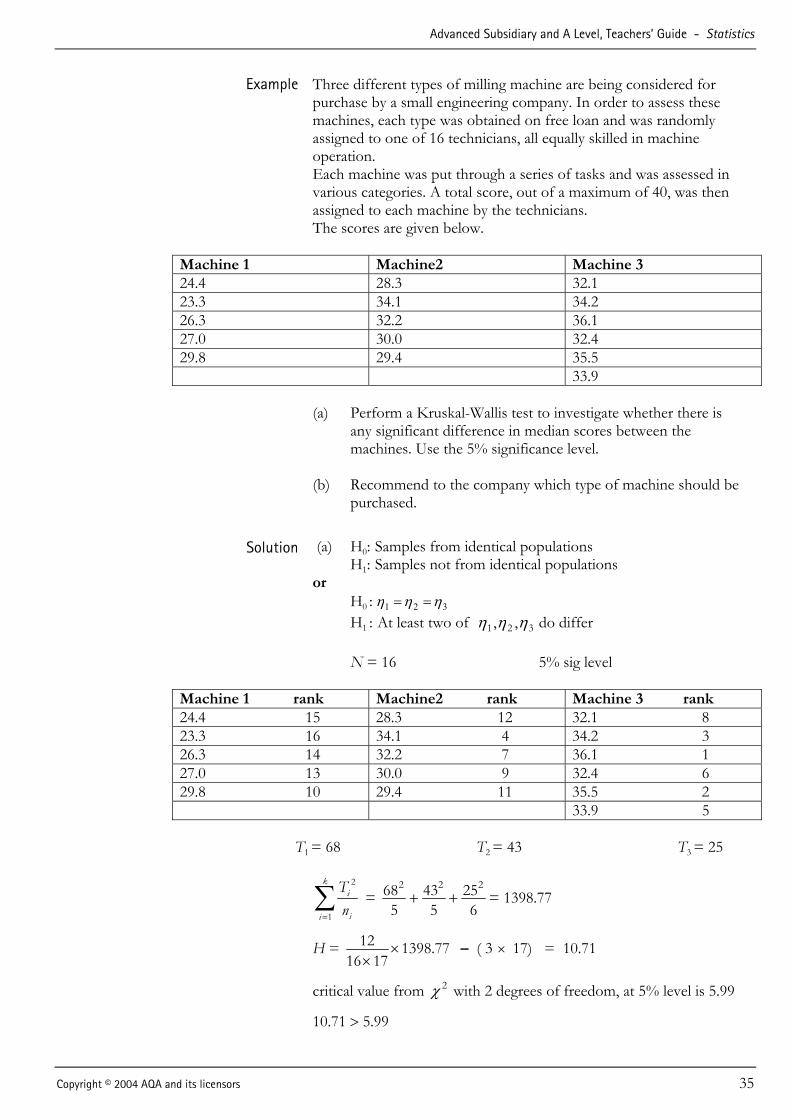
Example Three different types of milling machine are being considered for purchase by a small engineering company. In order to assess these machines, each type was obtained on free loan and was randomly assigned to one of 16 technicians, all equally skilled in machine operation. Each machine was put through a series of tasks and was assessed in various categories. A total score, out of a maximum of 40, was then assigned to each machine by the technicians. The scores are given below.
Machine 1 Machine2 Machine 3 24.4 28.3 32.1 23.3 34.1 34.2 26.3 32.2 36.1 27.0 30.0 32.4 29.8 29.4 35.5 33.9
(a) Perform a Kruskal-Wallis test to investigate whether there is
any significant difference in median scores between the machines. Use the 5% significance level.
(b) Recommend to the company which type of machine should be
purchased.
Solution (a) H0: Samples from identical populations H1: Samples not from identical populations or H0 : 321 ηηη == H1 : At least two of 321 ,, ηηη do differ N = 16 5% sig level
Machine 1 rank Machine2 rank Machine 3 rank 24.4 15 28.3 12 32.1 8 23.3 16 34.1 4 34.2 3 26.3 14 32.2 7 36.1 1 27.0 13 30.0 9 32.4 6 29.8 10 29.4 11 35.5 2 33.9 5
T1 = 68 T2 = 43 T3 = 25
=∑
ki
ii
Tn
2
1
= 6
255
435
68 222++ = 1398.77
H = 77.13981716
12 ××
� ( 3 × 17) = 10.71
critical value from 2χ with 2 degrees of freedom, at 5% level is 5.99
10.71 > 5.99
Statistics - Advanced Subsidiary and A Level, Teachers� Guide
36 Copyright © 2004 AQA and its licensors
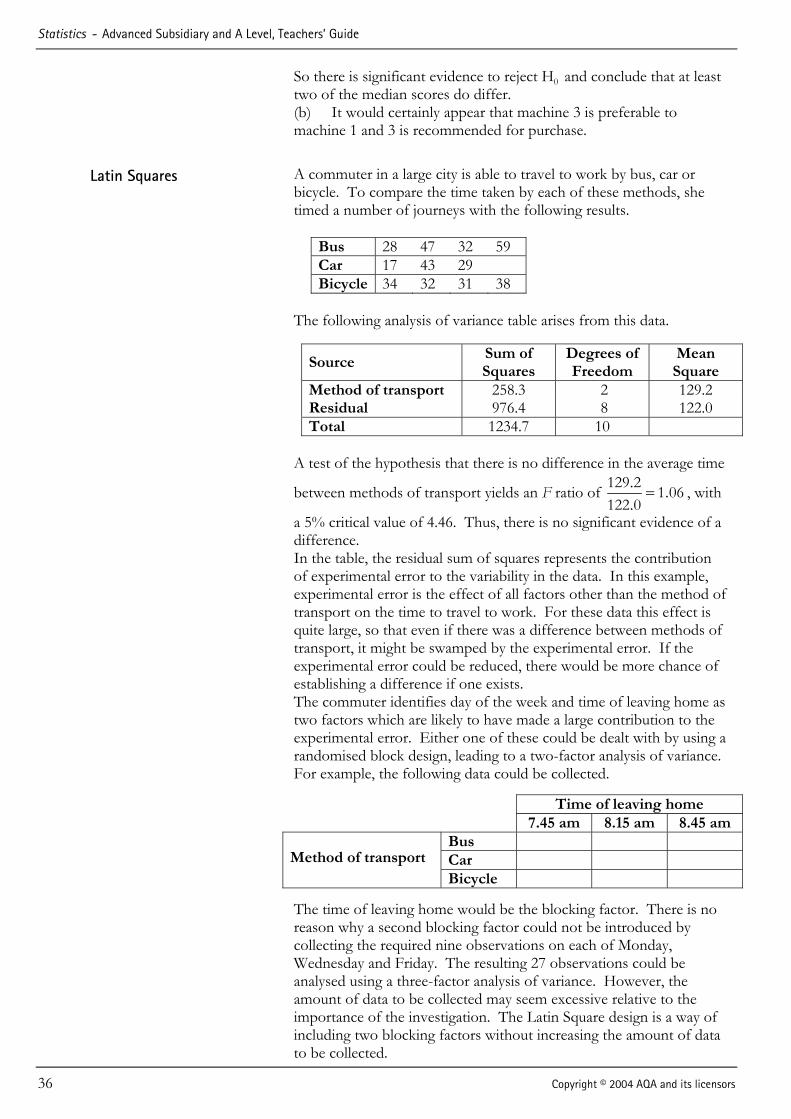
So there is significant evidence to reject H0 and conclude that at least two of the median scores do differ. (b) It would certainly appear that machine 3 is preferable to machine 1 and 3 is recommended for purchase.
Latin Squares A commuter in a large city is able to travel to work by bus, car or bicycle. To compare the time taken by each of these methods, she timed a number of journeys with the following results.
Bus 28 47 32 59 Car 17 43 29 Bicycle 34 32 31 38
The following analysis of variance table arises from this data.
Source Sum of Squares
Degrees of Freedom
Mean Square
Method of transport 258.3 2 129.2 Residual 976.4 8 122.0 Total 1234.7 10
A test of the hypothesis that there is no difference in the average time
between methods of transport yields an F ratio of . ..=
129 2 1 06122 0
, with
a 5% critical value of 4.46. Thus, there is no significant evidence of a difference.
In the table, the residual sum of squares represents the contribution of experimental error to the variability in the data. In this example, experimental error is the effect of all factors other than the method of transport on the time to travel to work. For these data this effect is quite large, so that even if there was a difference between methods of transport, it might be swamped by the experimental error. If the experimental error could be reduced, there would be more chance of establishing a difference if one exists.
The commuter identifies day of the week and time of leaving home as two factors which are likely to have made a large contribution to the experimental error. Either one of these could be dealt with by using a randomised block design, leading to a two-factor analysis of variance. For example, the following data could be collected.
Time of leaving home 7.45 am 8.15 am 8.45 am
Bus Car Method of transport Bicycle
The time of leaving home would be the blocking factor. There is no reason why a second blocking factor could not be introduced by collecting the required nine observations on each of Monday, Wednesday and Friday. The resulting 27 observations could be analysed using a three-factor analysis of variance. However, the amount of data to be collected may seem excessive relative to the importance of the investigation. The Latin Square design is a way of including two blocking factors without increasing the amount of data to be collected.
Advanced Subsidiary and A Level, Teachers� Guide - Statistics
Copyright © 2004 AQA and its licensors 37
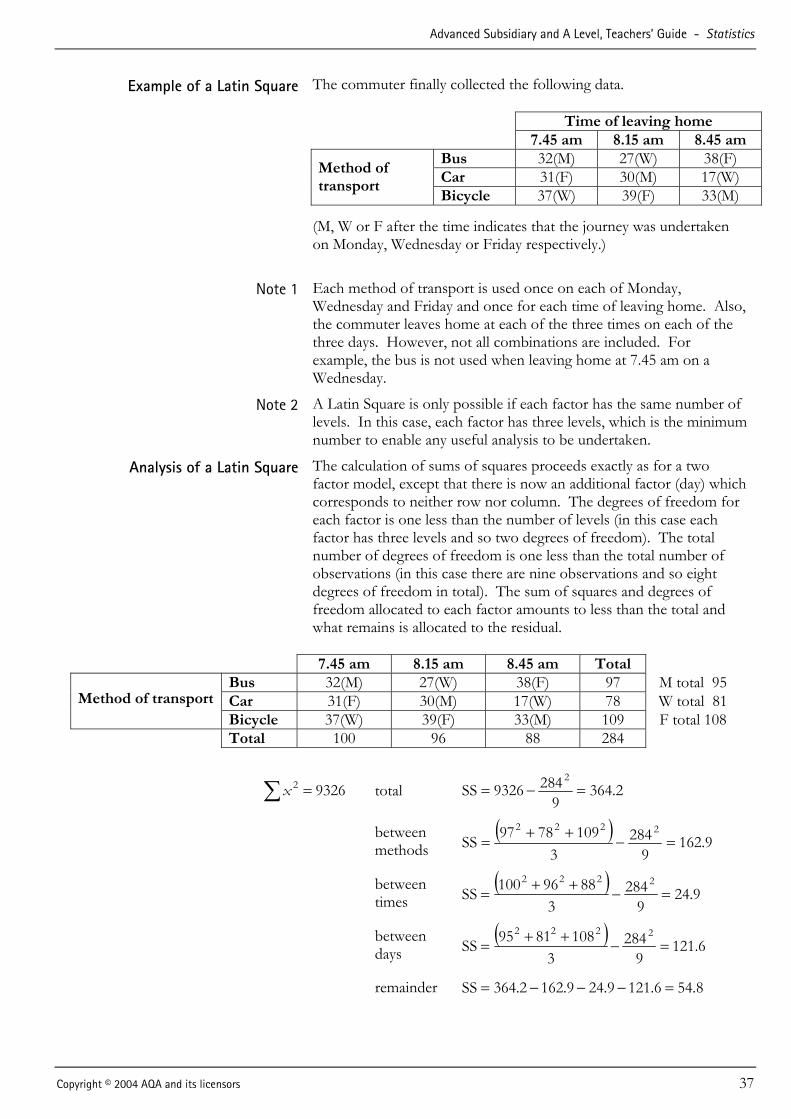
Example of a Latin Square The commuter finally collected the following data.
Time of leaving home 7.45 am 8.15 am 8.45 am
Bus 32(M) 27(W) 38(F) Car 31(F) 30(M) 17(W) Method of
transport Bicycle 37(W) 39(F) 33(M)
(M, W or F after the time indicates that the journey was undertaken on Monday, Wednesday or Friday respectively.)
Note 1 Each method of transport is used once on each of Monday, Wednesday and Friday and once for each time of leaving home. Also, the commuter leaves home at each of the three times on each of the three days. However, not all combinations are included. For example, the bus is not used when leaving home at 7.45 am on a Wednesday.
Note 2 A Latin Square is only possible if each factor has the same number of levels. In this case, each factor has three levels, which is the minimum number to enable any useful analysis to be undertaken.
Analysis of a Latin Square The calculation of sums of squares proceeds exactly as for a two factor model, except that there is now an additional factor (day) which corresponds to neither row nor column. The degrees of freedom for each factor is one less than the number of levels (in this case each factor has three levels and so two degrees of freedom). The total number of degrees of freedom is one less than the total number of observations (in this case there are nine observations and so eight degrees of freedom in total). The sum of squares and degrees of
freedom allocated to each factor amounts to less than the total and what remains is allocated to the residual.
7.45 am 8.15 am 8.45 am Total
Bus 32(M) 27(W) 38(F) 97 M total 95 Car 31(F) 30(M) 17(W) 78 W total 81 Method of transport Bicycle 37(W) 39(F) 33(M) 109 F total 108
Total 100 96 88 284
∑ = 93262x total 2.3649
2849326SS2=−=
between methods
( ) 9.1629
2843
1097897SS2222=−
++=
between times
( ) 9.249
2843
8896100SS2222=−++=
between days
( ) 6.1219
2843
1088195SS2222=−++=
remainder 8.546.1219.249.1622.364SS =−−−=
Statistics - Advanced Subsidiary and A Level, Teachers� Guide
38 Copyright © 2004 AQA and its licensors
Source Sum of Squares
Degrees of Freedom
Mean Square
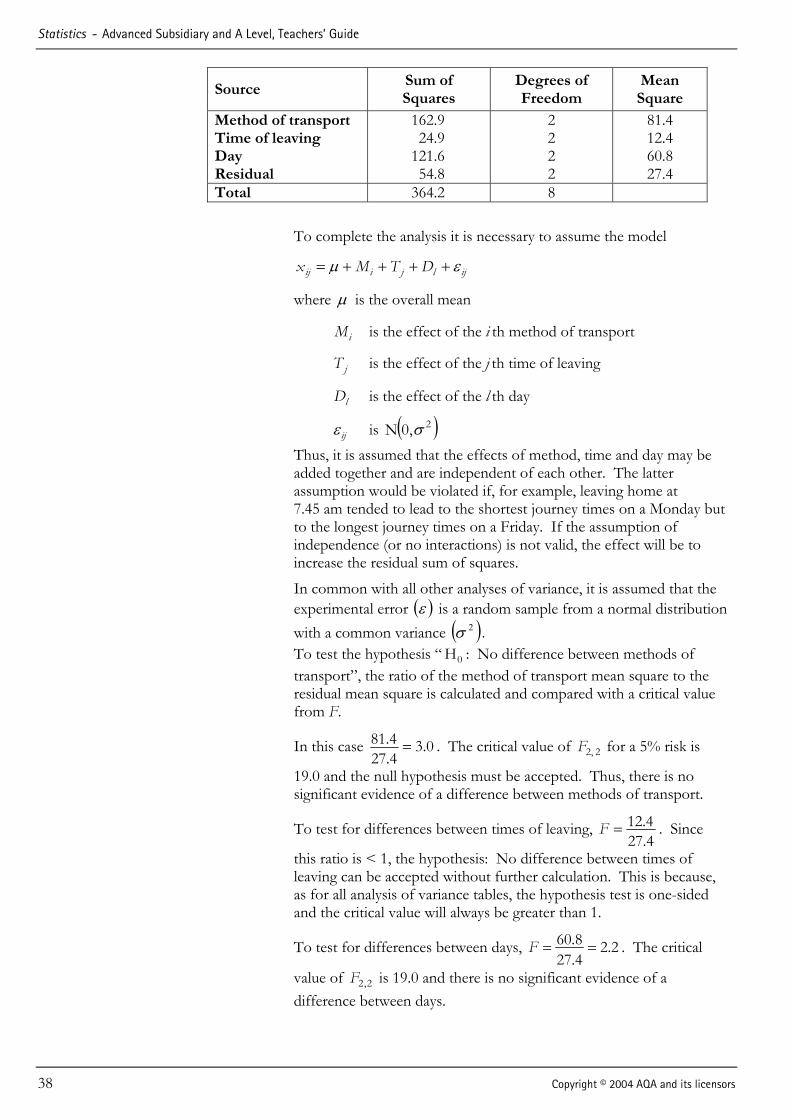
Method of transport 162.9 2 81.4 Time of leaving 24.9 2 12.4 Day 121.6 2 60.8 Residual 54.8 2 27.4 Total 364.2 8
To complete the analysis it is necessary to assume the model
ijljiij DTMx εµ ++++=
where µ is the overall mean
iM is the effect of the i th method of transport
jT is the effect of the j th time of leaving
lD is the effect of the l th day
ijε is ( )2,0N σ
Thus, it is assumed that the effects of method, time and day may be added together and are independent of each other. The latter assumption would be violated if, for example, leaving home at 7.45 am tended to lead to the shortest journey times on a Monday but to the longest journey times on a Friday. If the assumption of independence (or no interactions) is not valid, the effect will be to increase the residual sum of squares.
In common with all other analyses of variance, it is assumed that the experimental error ( )ε is a random sample from a normal distribution with a common variance ( )2σ .
To test the hypothesis � 0H : No difference between methods of transport�, the ratio of the method of transport mean square to the residual mean square is calculated and compared with a critical value from F.
In this case 0.34.274.81 = . The critical value of 2 2,F for a 5% risk is
19.0 and the null hypothesis must be accepted. Thus, there is no significant evidence of a difference between methods of transport.
To test for differences between times of leaving, 4.274.12=F . Since
this ratio is < 1, the hypothesis: No difference between times of leaving can be accepted without further calculation. This is because, as for all analysis of variance tables, the hypothesis test is one-sided and the critical value will always be greater than 1.
To test for differences between days, 2.24.278.60 ==F . The critical
value of 2,2F is 19.0 and there is no significant evidence of a difference between days.
Advanced Subsidiary and A Level, Teachers� Guide - Statistics
Copyright © 2004 AQA and its licensors 39
Note 1 For a Latin Square with only 3 levels of each factor, the critical values are large and so only very marked differences are likely to lead to a rejection of the null hypothesis. This problem does not arise for larger Latin Squares. For example, if each factor is at 5 levels, there are 4 degrees of freedom for each factor and 12 degrees of freedom for the residual. The critical value of 12 4,F for a 5% risk is 3.26.
Note 2 Although Latin Squares have been introduced in the context of one main factor of interest and two blocking factors, they may equally be used where there are two or three main factors of interest. However, the assumption of independence (or no interactions) should not be forgotten.
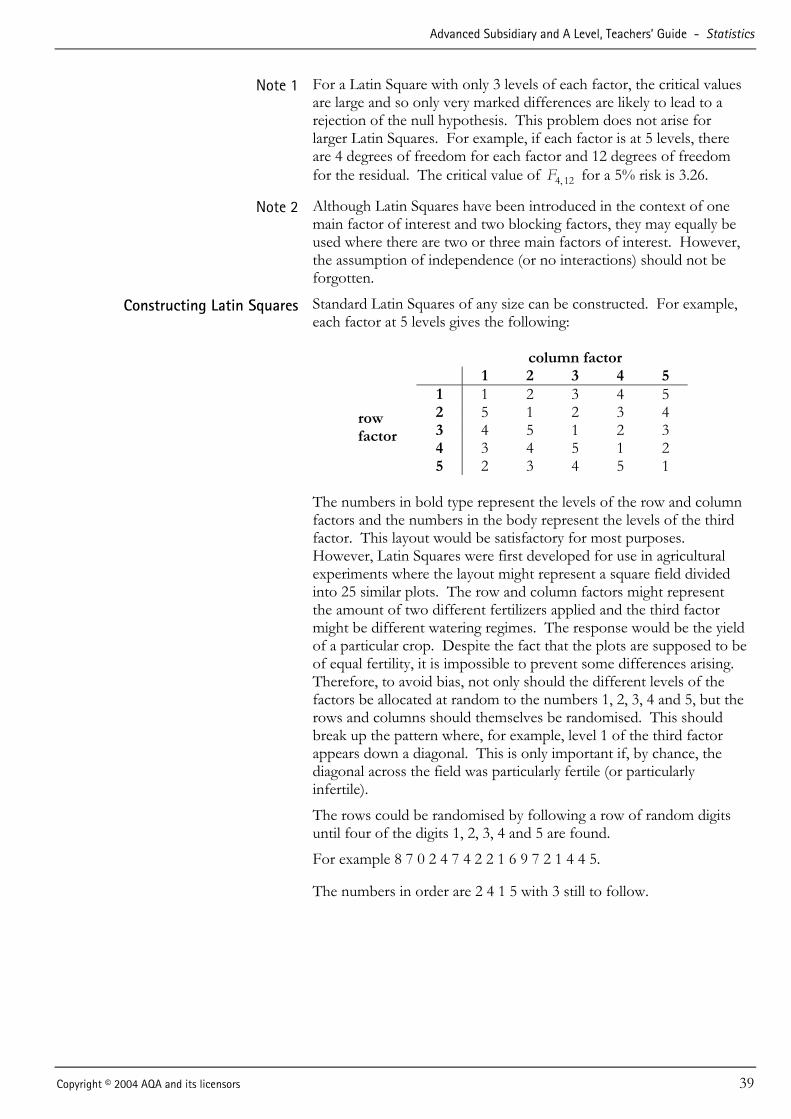
Constructing Latin Squares Standard Latin Squares of any size can be constructed. For example, each factor at 5 levels gives the following:
column factor 1 2 3 4 5
1 1 2 3 4 5 2 5 1 2 3 4 3 4 5 1 2 3 4 3 4 5 1 2
row factor
5 2 3 4 5 1
The numbers in bold type represent the levels of the row and column factors and the numbers in the body represent the levels of the third factor. This layout would be satisfactory for most purposes. However, Latin Squares were first developed for use in agricultural experiments where the layout might represent a square field divided into 25 similar plots. The row and column factors might represent the amount of two different fertilizers applied and the third factor might be different watering regimes. The response would be the yield of a particular crop. Despite the fact that the plots are supposed to be of equal fertility, it is impossible to prevent some differences arising. Therefore, to avoid bias, not only should the different levels of the factors be allocated at random to the numbers 1, 2, 3, 4 and 5, but the rows and columns should themselves be randomised. This should break up the pattern where, for example, level 1 of the third factor appears down a diagonal. This is only important if, by chance, the diagonal across the field was particularly fertile (or particularly infertile).
The rows could be randomised by following a row of random digits until four of the digits 1, 2, 3, 4 and 5 are found.
For example 8 7 0 2 4 7 4 2 2 1 6 9 7 2 1 4 4 5.
The numbers in order are 2 4 1 5 with 3 still to follow.
Statistics - Advanced Subsidiary and A Level, Teachers� Guide
40 Copyright © 2004 AQA and its licensors
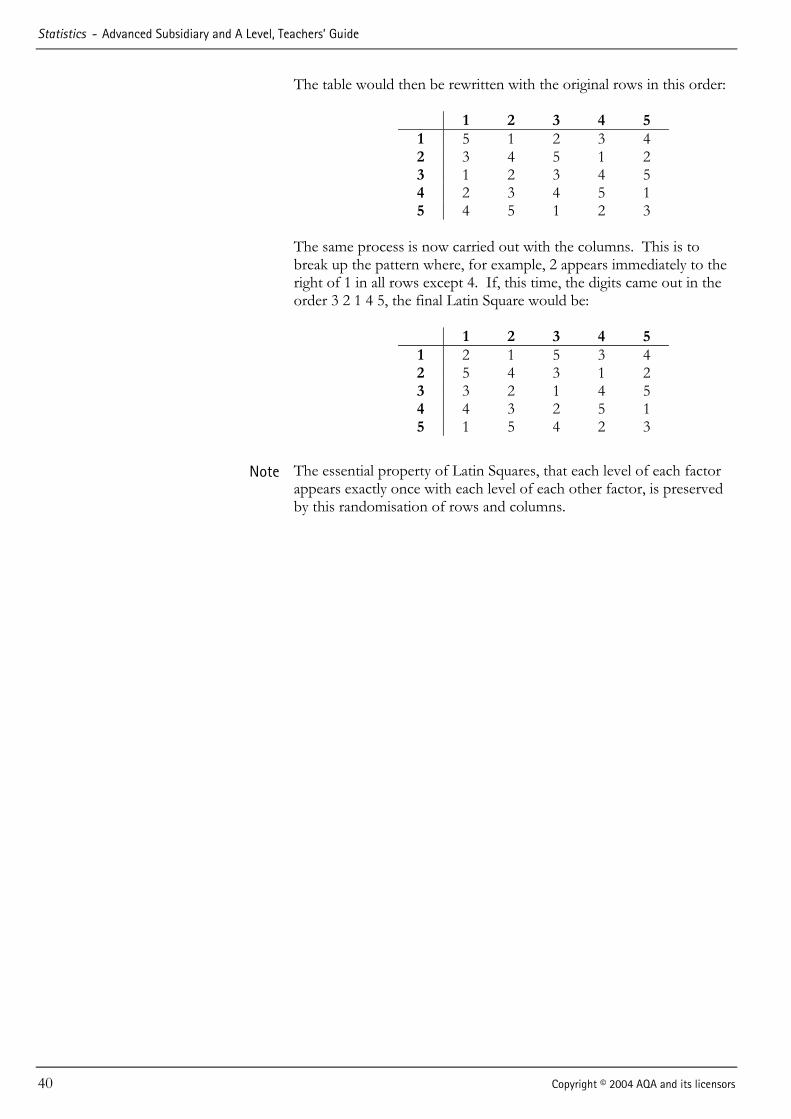
The table would then be rewritten with the original rows in this order:
1 2 3 4 5 1 5 1 2 3 4 2 3 4 5 1 2 3 1 2 3 4 5 4 2 3 4 5 1 5 4 5 1 2 3
The same process is now carried out with the columns. This is to break up the pattern where, for example, 2 appears immediately to the right of 1 in all rows except 4. If, this time, the digits came out in the order 3 2 1 4 5, the final Latin Square would be:
1 2 3 4 5 1 2 1 5 3 4 2 5 4 3 1 2 3 3 2 1 4 5 4 4 3 2 5 1 5 1 5 4 2 3
Note The essential property of Latin Squares, that each level of each factor appears exactly once with each level of each other factor, is preserved by this randomisation of rows and columns.
Advanced Subsidiary and A Level, Teachers� Guide - Statistics
Copyright © 2004 AQA and its licensors 41
10 Resources
10.1 Introduction A list of recommended resources is given below. The information
listed is correct at the time of going to press.
10.2 Textbooks The books listed below have been produced specifically for the units in this specification. Note that the book published by Oxford University Press has been officially endorsed by AQA. ADVANCED MATHS FOR AQA: STATISTICS S1 Upton and Cook, Oxford University Press, 2004 ISBN: 0199149372 STATISTICS 1 FOR AQA Corporate Author SMP, Cambridge University Press, 2004 ISBN: 052160527X ADVANCING MATHS FOR AQA: STATISTICS 1 2ND EDITION Williamson, Buqué, Miller and Worth, Heinemann 2004 ISBN: 0435513389 ADVANCING MATHS FOR AQA: STATISTICS 2 & 3 2ND EDITION Williamson and Buqué, Heinemann 2004 ISBN: 0435513400 The books listed below were written to match the old AQA GCE Mathematics and Statistics B specification, and between them cover most of the topics on this new GCE Statistics specification. For details on how to relate the content of the new specification to the old, please see Chapter 11 of this guide. ADVANCING MATHS FOR AQA: STATISTICS 1 Williamson, Buqué, Miller and Worth, Heinemann 2000 ISBN: 0435513125 ADVANCING MATHS FOR AQA: STATISTICS 2 Williamson, Heinemann 2001 ISBN: 0435513133 ADVANCING MATHS FOR AQA: STATISTICS 3 & 6 Buqué, Heinemann 2001 ISBN: 0435513141 ADVANCING MATHS FOR AQA: STATISTICS 4 Williamson and Buqué, Heinemann 2002 ISBN: 043551315X ADVANCING MATHS FOR AQA: STATISTICS 7 Williamson and White, Heinemann 2002 ISBN: 0435513222
Statistics - Advanced Subsidiary and A Level, Teachers� Guide
42 Copyright © 2004 AQA and its licensors
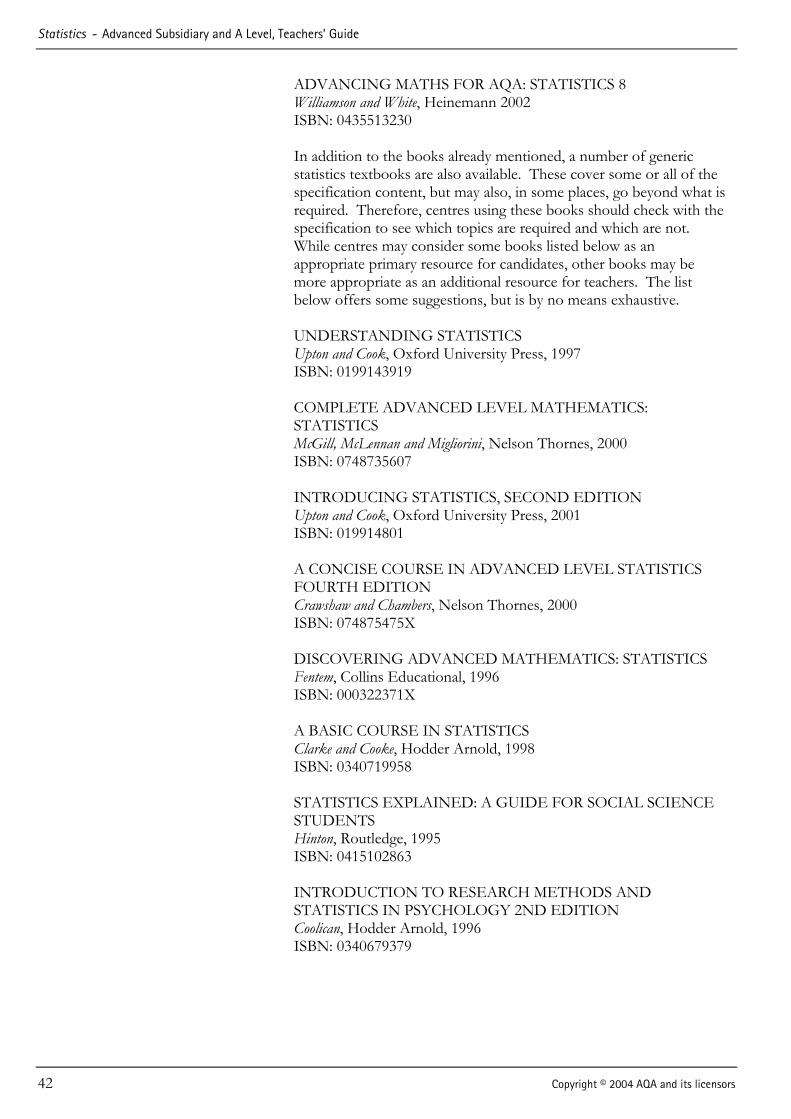
ADVANCING MATHS FOR AQA: STATISTICS 8 Williamson and White, Heinemann 2002 ISBN: 0435513230 In addition to the books already mentioned, a number of generic statistics textbooks are also available. These cover some or all of the specification content, but may also, in some places, go beyond what is required. Therefore, centres using these books should check with the specification to see which topics are required and which are not. While centres may consider some books listed below as an appropriate primary resource for candidates, other books may be more appropriate as an additional resource for teachers. The list below offers some suggestions, but is by no means exhaustive. UNDERSTANDING STATISTICS Upton and Cook, Oxford University Press, 1997 ISBN: 0199143919 COMPLETE ADVANCED LEVEL MATHEMATICS: STATISTICS McGill, McLennan and Migliorini, Nelson Thornes, 2000 ISBN: 0748735607 INTRODUCING STATISTICS, SECOND EDITION Upton and Cook, Oxford University Press, 2001 ISBN: 019914801 A CONCISE COURSE IN ADVANCED LEVEL STATISTICS FOURTH EDITION Crawshaw and Chambers, Nelson Thornes, 2000 ISBN: 074875475X DISCOVERING ADVANCED MATHEMATICS: STATISTICS Fentem, Collins Educational, 1996 ISBN: 000322371X A BASIC COURSE IN STATISTICS Clarke and Cooke, Hodder Arnold, 1998 ISBN: 0340719958 STATISTICS EXPLAINED: A GUIDE FOR SOCIAL SCIENCE STUDENTS Hinton, Routledge, 1995 ISBN: 0415102863 INTRODUCTION TO RESEARCH METHODS AND STATISTICS IN PSYCHOLOGY 2ND EDITION Coolican, Hodder Arnold, 1996 ISBN: 0340679379

Advanced Subsidiary and A Level, Teachers� Guide - Statistics
Copyright © 2004 AQA and its licensors 43
11 Relating the content to old
AQA specifications 11.1 Relationship to previous
specification
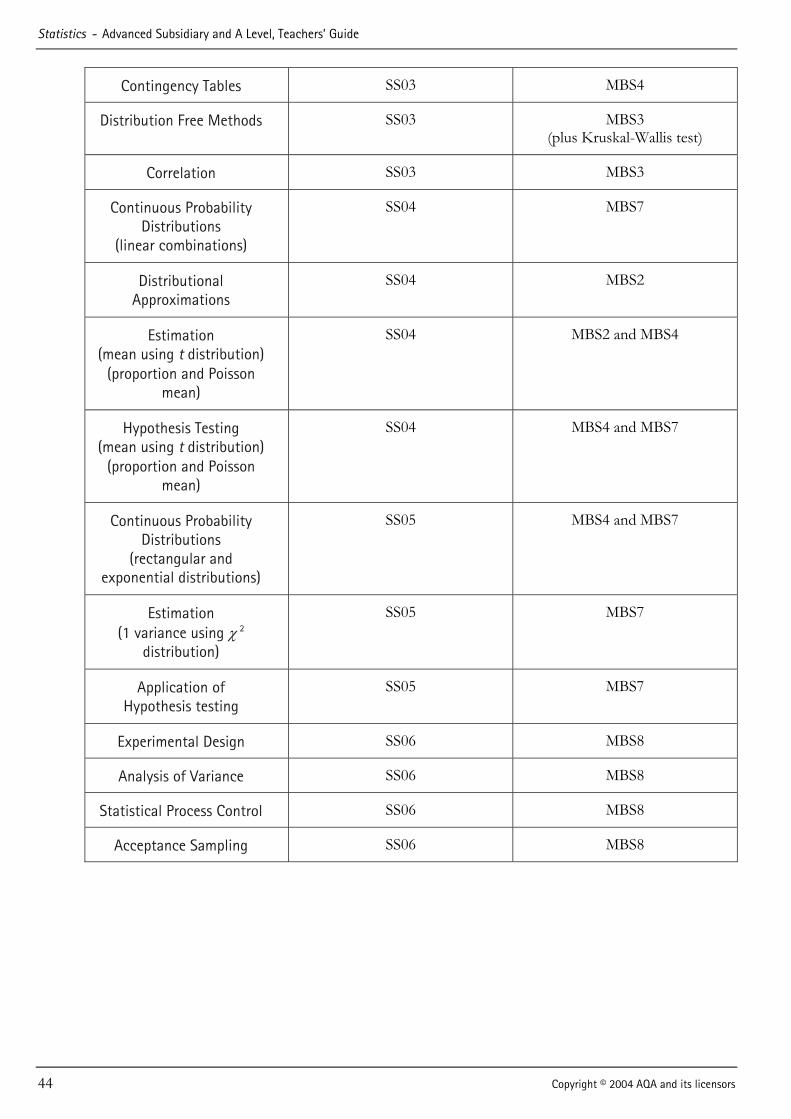
The following table runs through the GCE Statistics specification, listing each topic in order and in each case giving the unit where the topic appears on the old GCE Mathematics and Statistics B specification. In some cases, in reaching the new topic, the old topic has been modified in some way. In such cases, the modifications made to the old topic are also listed.
(Note that, as the Statistics topics in GCE Mathematics A were divided up very differently to how they are on this new specification, a comparison with that specification has not been included.)
Topic New unit code Unit in GCE Mathematics and Statistics B
Numerical Measures (some now in GCSE Maths)
SS1A/SS1B MBS1
Probability SS1A/SS1B MBS1 (plus set notation)
Binomial Distribution SS1A/SS1B MBS1 (plus use of formulae)
Normal Distribution SS1A/SS1B MBS1
Estimation SS1A/SS1B MBS4 (CI for mean using normal)
Correlation and Regression SS1A/SS1B MBS1
Time Series Analysis SS02 MBS2
Sampling SS02 MBS1 and MBS2
Discrete Probability Distribution
(includes Poisson)
SS02 MBS1 and MBS4
Interpretation of Data (includes drawing diagrams)
SS02 MBS1 and MBS2
Hypothesis Testing SS02 MBS4 (minus contingency tables)
Statistics - Advanced Subsidiary and A Level, Teachers� Guide
44 Copyright © 2004 AQA and its licensors
Contingency Tables SS03 MBS4
Distribution Free Methods SS03 MBS3 (plus Kruskal-Wallis test)
Correlation SS03 MBS3
Continuous Probability Distributions
(linear combinations)
SS04 MBS7
Distributional Approximations
SS04 MBS2
Estimation (mean using t distribution)
(proportion and Poisson mean)
SS04 MBS2 and MBS4
Hypothesis Testing (mean using t distribution)
(proportion and Poisson mean)
SS04 MBS4 and MBS7
Continuous Probability Distributions
(rectangular and exponential distributions)
SS05 MBS4 and MBS7
Estimation (1 variance using χ 2
distribution)
SS05 MBS7
Application of Hypothesis testing
SS05 MBS7
Experimental Design SS06 MBS8
Analysis of Variance SS06 MBS8
Statistical Process Control SS06 MBS8
Acceptance Sampling SS06 MBS8
Advanced Subsidiary and A Level, Teachers� Guide - Statistics
Copyright © 2004 AQA and its licensors 45
Other Information
12 AS and A Level Mathematics
12.1 GCE Mathematics AQA GCE Mathematics (6360) is a flexible specification offering AS
and A Level qualifications in Mathematics, Further Mathematics, and Pure Mathematics.
The Mathematics qualifications consist of two-thirds compulsory Pure units and one-third Applied units: Decision, Mechanics or Statistics. For those aiming for a full A Level, there is the option to follow a single application or a mixture of two.
The Further Mathematics qualifications are even more flexible, with a choice of Pure units, and a flexible ratio of Pure to Applied. Again, candidates can either follow a single application in depth or choose a broader mix of two or three applications.
The Pure Mathematics qualifications are based on a combination of the Pure units used in Mathematics and those used in Further Mathematics. While most of these units are compulsory, for those aiming for the full A Level there is some choice over the final A2 unit.
For further details of this specification, please contact the GCE Mathematics subject department.
Statistics - Advanced Subsidiary and A Level, Teachers� Guide
46 Copyright © 2004 AQA and its licensors
13 FSMQ and AS Use of
Mathematics 13.1 Free Standing Mathematics
Qualifications FSMQs (Free Standing Mathematics Qualifications) are qualifications aimed primarily at candidates who want to continue the study of Mathematics after GCSE, but do not want to embark on a full AS or A Level course, at least not immediately.
As a guide, approximately 60 hours teacher-candidate contact time is recommended for each FSMQ. 50% of the assessment is by coursework portfolio, with the other 50% being by written paper. Qualifications are available at 3 different levels: Foundation, Intermediate and Advanced.
Foundation level is designed for candidates of ability equivalent to G � D at GCSE. There are three Foundation level FSMQs currently available: Managing Money, Working in 2 and 3 dimensions, and Making Sense of Data.
Intermediate level is designed for candidates of ability equivalent to C � A* at GCSE. There are five Intermediate level FSMQs currently available: Calculating Finances, Solving Problems in Shape and Space, Handling and Interpreting Data, Making Connections in Mathematics, and Using Algebra, Functions and Graphs.
Advanced level is designed to be of a similar standard to AS level. There are three Advanced level FSMQs currently available: Using and Applying Statistics, Working with Algebraic and Graphical Techniques, and Modelling with Calculus.
For further details about these qualifications, please contact the GCE Mathematics subject department.
13.2 AS Use of Mathematics AS Use of Mathematics is made up of an Applying Mathematics unit, assessed by 2 written papers, along with two of the Advanced level FSMQs.
For further details about this qualification, please contact the GCE Mathematics subject department.

Advanced Subsidiary and A Level, Teachers� Guide - Statistics
Copyright © 2004 AQA and its licensors 47
14 Glossary of Terms
Advanced Subsidiary This is the first half of the Advanced Level course.
A2 This is the second half of the Advanced Level course.
Aims The broad educational or vocational purposes of a qualification.
Assessment Objectives The criteria used to evaluate candidates� attainments.
Assessment Unit The smallest part of a qualification that can be separately certificated.
C2K Shorthand for the GCE specifications introduced for first teaching from September 2000.
Coursework Tasks set and undertaken during the course which are integral to the course of study.
Entry Codes The codes to be used when entering candidates for each unit and each qualification.
External Assessment A form of independent assessment in which an awarding body sets or defines assignments, tests or examinations, specifies the conditions under which they are to be taken (including details of supervision and duration), and assesses candidates� responses.
Internal Assessment A form of assessment that does not meet the definition of external assessment for a general or vocational qualification.
Internal Standardisation The requirement for centres to standardise assessment across different teachers and teaching groups to ensure that all candidates at each centre have been judged against the same standards.
Moderation The process through which internal assessment is monitored by an awarding body to ensure that internal assessment is valid, reliable, fair and consistent with required standards.
Module Specified teaching and learning requirements associated with an identifiable part of a qualification.
Shelf-life of units The length of time a unit can be stored and put towards a subsequent qualification. For this specification, the shelf-life of units is restricted only by the life of the specification.
Specification The complete description of the content, assessment arrangements and performance requirements for a qualification. This has replaced the term �syllabus�.
Staged Assessment Assessment arrangements in which assessment units are taken throughout a period of learning.
Synoptic Assessment A form of assessment which tests candidates� understanding of the connections between the different elements of a subject.