gc3 biology in eukaryotes and prokaryotes -...
TRANSCRIPT

3
GC3 Biology in Eukaryotes and Prokaryotes
Eran Elhaik1,2 and Tatiana Tatarinova3
1McKusick - Nathans Institute of Genetic Medicine, Johns Hopkins University School of Medicine, Baltimore,
2Department of Mental Health, Johns Hopkins University Bloomberg School of Public Health,
3Faculty of Advanced Technology, University of Glamorga 1,2USA
3Wales
1. Introduction
In this chapter we describe the distribution of Guanine and Cytosine (GC) content in the third codon position (GC3) distributions in different species, analyze evolutionary trends and discuss differences between genes and organisms with distinct GC3 levels. We scrutinize previously published theoretical frameworks and construct a unified view of GC3 biology in eukaryotes and prokaryotes.
2. The wobble position
2.1 Why is GC3 referred to as the wobble position
The genetic code, the set of rules by which information encoded in genetic material, is found in every cell of every living organism. This code consists of all possible combinations of tri-nucleotide sequences in coding regions, called codons. With a few exceptions, such as start- and stop-codons, a triplet codon in a DNA sequence specifies a single amino acid – protein’s building block. The human genome, for example, consists of one start- and three stop-codons out of (34) 64 codons. With each codon promoting the binding of specific tRNA to the ribosome, the cell would theoretically need almost 64 types of tRNAs, each with different anticodons to complement the available codons. However, because only 20 amino acids are encoded, there is a significant degeneracy of the genetic code so that the third base is less discriminatory for the amino acid than the other two bases. This third position in the codon is therefore referred to as the wobble position. At this position U’s and C’s may be read
by a G in the anticodon. Similarly, A’s and G’s may be read by a U or (pseudouridine) in the anticodon.
2.2 Identification of the mRNA codons by tRNA
For most amino acids, there are specific enzymes ligating their cognate amino acid to the tRNA molecule-bearing anticodon that correspond to that amino acid. These enzymes and the unique structure of each tRNA ensure that a particular tRNA is the substrate for its
www.intechopen.com

DNA Methylation – From Genomics to Technology 56
cognate synthetase and not for all other syntheses present in the cell (Shaul et al. 2010). Like in the genetic code, there is much redundancy in the types of tRNA molecules required per cell. Because the wobble base positions are capable of binding to several codons, a minimum set of 31 tRNA are required to unambiguously translate all the codons instead of 61 types tRNA molecule required to match each codon. This redundancy in tRNA anticodons is accomplished, in part, by using inosine, which can pair with U, C, or A, at the third position of the mRNA (Ikemura 1985).
3. Biological role of GC3: Codon usage, codon bias, mRNA, gene expression, gene and promoter organization, gene function, and methylation
Deviations from unimodal bell-shaped distributions of GC3 appear in many species (Aota
and Ikemura 1986; Belle, Smith, and Eyre-Walker 2002; Jorgensen, Schierup, and Clark
2007). This bimodality in homeotherm (termed, "warm-blooded", at that time) vertebrates
was originally explained by the presence of isochores – long (>300,000 bp) and relatively
homogeneous stretches of DNA (Mouchiroud, Fichant, and Bernardi 1987). Although there
are similarities between genes in high-GC human isochores and GC3-rich genes in grasses,
the isochore hypothesis does not fully explain the existence of GC3-rich genes in grasses:
first, there is no correlation between GC contents of open reading frames (ORFs) and the
flanking regions; second, most species with isochores do not have a GC3-rich peak
(Tatarinova et al. 2010). Therefore, the remaining possible causes of bimodality may be
elucidated by comparing genes in different GC3 classes, such as GC3-rich and GC3-poor
classes. These classes differ in nucleotide composition and compositional gradient along
coding regions (Figure 1). GC3-rich class genes have a significantly higher frequency of CG
dinucleotides (potential targets for methylation); therefore, there is an additional regulatory
mechanism for GC3-rich genes. Springer et al. 2005 reported that out of eight classes of
methyl-CpG-binding domain proteins present in dicots, only six exist in monocots,
suggesting a difference between dicots and monocots in silencing of methylated genes.
In 2010 Tatarinova, Alexandrov, Bouck and Feldmann proposed the following explanation of relationship between DNA methylation and GC3 content. Two competing processes may affect the frequency of methylation targets: the GC-based mismatch repair mechanism and AT-biased mutational pressure. In recombining organisms (e.g., grasses and homeotherms vertebrates), the GC content of coding and regulatory regions is enhanced because of the action of the GC-based mismatch repair mechanism; this effect is especially pronounced for GC3. Recombination has been shown to be a driving force for the increase in GC3 in many organisms. Repair (recombination) happens all over the genome with a certain precision, leading to an increase in GC content. If repair did not occur in defense-related genes, the organism may fail to survive or to reproduce. However, if repair did not happen in genes that are not essential for survival, and, consequently, their GC content remained the same, it may not be detrimental to the organism. AT-biased mutational pressure, resulting from cytosine deamination or oxidative damage to C and G bases, counteracts the influence of recombination; and in most asexually-reproducing species and self-pollinating plants, AT bias is the winning process. Our analysis from aligning Indica and Japonica indicates that genomic regions under higher selective pressure are more frequently recombining and therefore increasing their GC3 content (Tatarinova et al. 2010). This mechanism may explain the pronounced differences in GC3 between A. thaliana and its closest relatives. Comparison
www.intechopen.com

GC3 Biology in Eukaryotes and Prokaryotes 57
of the nucleotide compositions of coding regions in A. thaliana, R. sativus, B. rapa, and B. napus reveals that the GC3 values of R. sativus, B. rapa, and B. napus genes are on average 0.05 higher than those of the corresponding A. thaliana orthologs.
Fig. 1. GC3 gradient from 5' to 3' ends of coding regions. At the 5' end of the open reading frame, high GC3 genes of rice, sorghum, and banana have a slight positive gradient, whereas low GC3 genes in arabidopsis, rice, sorghum, and banana become more AT3-rich (From Tatarinova et al 2010)
www.intechopen.com

DNA Methylation – From Genomics to Technology 58
An important difference between A. thaliana and Brassica and Raphanus is that the latter two genera are self-incompatible, whereas A. thaliana is self-pollinating. Self-pollination in arabidopsis keeps its recombination rates low and thus reduces the GC3 content of its genes. Self-pollination is also reported in some grasses, such as wheat, barley and oats. Analysis of recombination in wheat showed that the genome contains areas of high and low recombination. Grasses have an efficient reproductive mechanism and high genetic variability that enables them to adapt to different climates and soil types. We hypothesize that since self-pollination generally lowers recombination rates, evolutionary pressure will selectively maintain high recombination rates for some genes. Analysis of highly recombinogenic genomic regions of wheat, barley, maize, and oat identified several genes of agronomic importance in these regions (including resistance genes against obligate biotrophs and genes encoding seed storage proteins) (Keller and Feuillet 2000). In addition to the methylation-driven growth of high-GC3 genes, we hypothesize that the development of GC3-richness in some genes may, if unbalanced by AT-bias, work as a feed-forward mechanism. Once GC3-richness appears in genes under selective pressure, it provides additional transcriptional advantage. GC pairs differ from AT pairs in that guanine binds to cytosine with three hydrogen bonds, while adenine forms only two bonds with thymine. This additional hydrogen bond makes GC pairs more stable; thus GC-rich genes will have different biochemical properties from AT-rich genes. When an AT pair is replaced by a GC pair in the third position of a codon, the protein sequence remains largely unchanged, but an additional hydrogen bond is introduced. This additional bond can make transcription more efficient and reliable, change the array of RNA binding proteins or significantly alter the three-dimensional folding of the messenger RNA. In this case, those plant species that thrive and adapt successfully to harsh environments demonstrate a strong preference for GC in the third position of the codon.
High GC3 content provides more targets for methylation. The correlation between methylation and GC3 is supported by Stayssman et al. (2009), who reported a positive correlation between methylation of internal unmethylated regions and expression of the host gene. In this paper the authors have demonstrated a positive correlation between GC3 and variability of gene expression; they also found that GC3-rich genes are more enriched in CG than the low-GC3-poor gene class. Therefore, GC3-rich genes provide more targets for de novo methylation, which can serve as an additional mechanism of transcriptional regulation and affect the variability of gene expression. Overall, additional transcriptional regulation makes species more adaptable to external stresses.
4. Genome-wide view
4.1 GC3 in animals
The GC3 varies substantially within animal genomes. Animals can be divided to homeotherms-those that maintain a stable internal body temperature, like mammals and birds, and sometimes termed “warm-blooded” and poikilotherms - those whose internal temperature varies considerably and are often termed “cold-blooded.” These differences were integrated into molecular evolution by Mouchiroud et al. (1987) who argued that in poikilotherm vertebrate, genes are mostly GC-poor and are harbored by GC-poor intergenic regions, whereas most genes of homeothermy vertebrates are GC-rich and found predominantly on the scant GC-rich intergenic regions. Because GC3 was shown to be
www.intechopen.com

GC3 Biology in Eukaryotes and Prokaryotes 59
correlated to the GC content of the gene, it became the primary tool to study the differences between homeotherms and poikilotherms. Indeed, poikilotherms were shown to have lower GC3 than homeotherms on average, although some poikilotherms exhibit higher GC3 values than homeotherms. Most poikilotherms also exhibit a lower variation in GC3 and a correlation to the GC content of the first two codon positions, indicating a systemic compositional variation across their genome (Belle, Smith, and Eyre-Walker 2002).
GC3 exhibits a wide variation in different animals compared with the average GC content
(Figure 2). In humans, GC3 ranges from 22 to 97% compared with the range of GC content (32-
80%), and in zebrafish the GC3 range is more limited 27-92% (μ=56%,σ=8%) yet still wider than
the GC content range (34-68%) (Figure 3) (Elhaik, Landan, and Graur 2009). Because GC3 is
mostly unconstrained by functional requirements, that is, by the need to code specific amino
acids and because GC3 exhibits a non-uniform distribution, the third-codon position became a
natural candidate to investigate the forces that shaped the composition of the genome.
GC3 GC content
Species No. of genes Mean σ Range Mean σ Range Homo sapiens 17,451 0.6 0.17 0.22-0.97 0.45 0.06 0.32-0.8 Bos Taurus 5,522 0.62 0.16 0.25-0.97 0.43 0.06 0.33-0.76 Mus musculus 17,009 0.59 0.11 0.21-0.96 0.43 0.05 0.27-0.76 Rattus norvegicus
8,983 0.59 0.11 0.23-0.96 0.42 0.06 0.33-0.73
Gallus gallus 3,036 0.56 0.15 0.28-0.99 0.42 0.05 0.36-0.8 Danio rerio 4,344 0.56 0.08 0.27-0.92 0.35 0.02 0.34-0.68
Fig. 2. GC3 and GC content for 6 Vertebrate Taxa. From (Elhaik, Landan, and Graur 2009).
Fig. 3. GC content in codon positions: GC1 (green), GC2 (turquoise), GC3 (blue), and 200-kb flanking regions (dashed red) in human. From (Elhaik, Landan, and Graur 2009).
www.intechopen.com
DNA Methylation – From Genomics to Technology 60
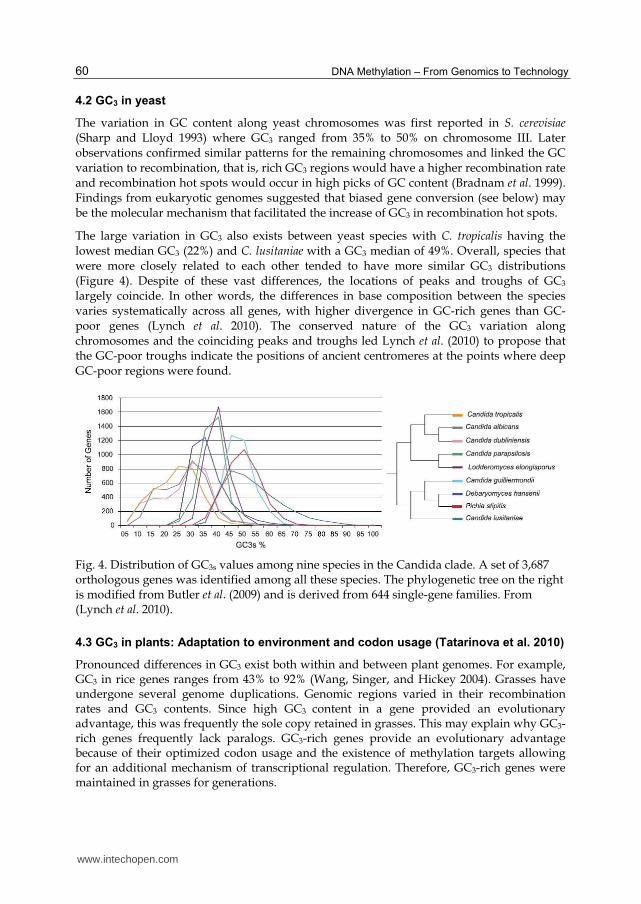
4.2 GC3 in yeast
The variation in GC content along yeast chromosomes was first reported in S. cerevisiae (Sharp and Lloyd 1993) where GC3 ranged from 35% to 50% on chromosome III. Later observations confirmed similar patterns for the remaining chromosomes and linked the GC variation to recombination, that is, rich GC3 regions would have a higher recombination rate and recombination hot spots would occur in high picks of GC content (Bradnam et al. 1999). Findings from eukaryotic genomes suggested that biased gene conversion (see below) may be the molecular mechanism that facilitated the increase of GC3 in recombination hot spots.
The large variation in GC3 also exists between yeast species with C. tropicalis having the lowest median GC3 (22%) and C. lusitaniae with a GC3 median of 49%. Overall, species that were more closely related to each other tended to have more similar GC3 distributions (Figure 4). Despite of these vast differences, the locations of peaks and troughs of GC3 largely coincide. In other words, the differences in base composition between the species varies systematically across all genes, with higher divergence in GC-rich genes than GC-poor genes (Lynch et al. 2010). The conserved nature of the GC3 variation along chromosomes and the coinciding peaks and troughs led Lynch et al. (2010) to propose that the GC-poor troughs indicate the positions of ancient centromeres at the points where deep GC-poor regions were found.
Fig. 4. Distribution of GC3s values among nine species in the Candida clade. A set of 3,687 orthologous genes was identified among all these species. The phylogenetic tree on the right is modified from Butler et al. (2009) and is derived from 644 single-gene families. From (Lynch et al. 2010).
4.3 GC3 in plants: Adaptation to environment and codon usage (Tatarinova et al. 2010)
Pronounced differences in GC3 exist both within and between plant genomes. For example, GC3 in rice genes ranges from 43% to 92% (Wang, Singer, and Hickey 2004). Grasses have undergone several genome duplications. Genomic regions varied in their recombination rates and GC3 contents. Since high GC3 content in a gene provided an evolutionary advantage, this was frequently the sole copy retained in grasses. This may explain why GC3-rich genes frequently lack paralogs. GC3-rich genes provide an evolutionary advantage because of their optimized codon usage and the existence of methylation targets allowing for an additional mechanism of transcriptional regulation. Therefore, GC3-rich genes were maintained in grasses for generations.
www.intechopen.com

GC3 Biology in Eukaryotes and Prokaryotes 61
The evolutionary forces affecting development of plants are realized through introducing new mutations during meiotic recombination and fixation with the help of DNA methylation and transcriptional mechanisms. The presence of GC3-rich genes is not likely to be a consequence of chromosomal isochores or horizontal gene transfer. Regardless of their initial origin, GC3-rich genes in recombining species possessed a self-maintaining mechanism that over time could only increase their drift towards even higher GC3 values. This uncompensated drift may explain the pronounced bimodality of some rapidly-evolving species. Competing forces acting in grasses make GC3 distribution distinctly bimodal; GC3-rich genes are more transcriptionally regulated, provide more targets for methylation and accumulate more mutations than GC3-poor genes.
4.4 GC3 in prokaryotes
In prokaryotic genomes the nucleotide composition varies from the extremely low GC content
(15%) in obligatory intracellular bacteria to the high GC content (75%) in Proteobacteria and
from 27% to 66% in Archaea. (http://www.ncbi.nlm.nih.gov/genomes/lproks.cgi). The base
compositional deviations show tremendous variation even at the nucleotide level of the
three codon positions. With GC1 follows a global tendency of monotonic decrease versus the
increase of the genomic GC content and the GC2 follows a global monotonic increase, as
expected. The GC3 positions range from 10% to 90% (Muto and Osawa 1987) and exhibit a
more complicated pattern that decreases first and increases last with a global minimum at
about 40% of the genomic GC content (Ma and Chen 2005).
In many organisms, alternative synonymous codons are not used with equal frequency, hence
the codon usage is considered biased. This bias exists not only between different organisms,
but often among genes within a genome (Suzuki, Saito, and Tomita 2009). Different factors
have been proposed to contribute to synonymous codon usage bias, including replication
strand bias, translational selection, and GC composition (Ermolaeva 2001). Because codon
third positions are largely degenerate - 70% of changes at third codon positions are
synonymous and they are commonly considered correlated with synonymous codon usage
bias, although in practicality, the strength of this correlation varies widely among species
(Suzuki, Saito, and Tomita 2007). The large deviations in base composition of these sites were
also thought to reveal the underlying mutational bias of the genome and served as the basis
for the original formulation of the neutral theory (Sueoka 1962; Sueoka 1988).
4.5 The isochore theory
Prior to the publication of the draft human genome (Lander et al. 2001), scientists were
limited to the study of genes and short (<500 bp) flanking regions. The publication of the
draft human genome (Lander et al. 2001) in 2001 was quickly followed by the publications of
fully sequenced genomes from other species (e.g., Chimpanzee, mouse, and cow), which
enabled us to study the evolution of genomes whole biological entities, rather than as a
collection of genes. One of the most common ways to describe a genome is by means of the
nucleotide distribution, particularly the distribution of GC content. In the absence of
genomic data, inferences made on short fragments were based on the assumption that these
fragments represent the compositional complexity of the entire genome (e.g., Aissani et al.
1991; Mouchiroud and Bernardi 1993). The GC content patterns emerging from these
www.intechopen.com

DNA Methylation – From Genomics to Technology 62
analyses were used by Bernardi and colleagues (Macaya, Thiery, and Bernardi 1976; Thiery,
Macaya, and Bernardi 1976; Bernardi et al. 1985) to explain the differences between the
genome organization of “warm-blooded” and “cold-blooded” vertebrates (Cuny et al. 1981;
Bernardi et al. 1985; Bernardi 2000) with the first described as a mosaic of GC-poor and GC-
rich isochores and the later as devoid of GC-rich isochores (Bernardi et al. 1985).
Because GC3 is mostly unconstrained by functional requirements, that is, by the need to
code specific amino acids, the third-codon position was a natural candidate for a predictive
proxy of flanking GC content. In spite of the lack of correlation between GC3 and large
flanking regions of “isochoric regions” harboring the genes (Bernardi 1993a), over time it
became a common belief that such a relationship exists. Over the next two decades GC3 was
used extensively as the primary means to predict isochore structure, surprisingly enough,
even after full genome sequences were made available. Many of the theories concerning the
evolution of isochores are also based on studies that used GC3 as a predictor for isochore
composition or that simply assumed the existence of isochores. (Bernardi 2001; Ponger,
Duret, and Mouchiroud 2001; D'Onofrio 2002; D'Onofrio, Ghosh, and Bernardi 2002;
Hamada et al. 2003; Romero et al. 2003; Federico et al. 2004; Chojnowski et al. 2007; Fortes et
al. 2007)
Two opposite explanations were proposed to explain the formation of isochores. The first
view was that isochores may simply reflect variable mutation processes among genomic
regions, consistent with the neutral model (Wolfe, Sharp, and Li 1989; Sueoka and
Kawanishi 2000; Galtier et al. 2001). Alternatively, isochores were posited as results of
natural selection for certain compositional environment required by certain genes (Matassi,
Sharp, and Gautier 1999). It should be noted that these hypotheses are not mutually
exclusive; two or more of the processes could be acting together (Eyre-Walker and Hurst
2001). For example, the most accepted hypothesis for the unequal usage of synonymous
codons in bacterial genomes is that the unequal usage is the result of a very complex balance
among different evolutionary forces (mutation and selection) (Suzuki, Saito, and Tomita
2007). Several hypothesis derive from the selectionist view, such as the biased gene
conversion hypothesis (Galtier et al. 2001), the thermodynamic stability hypothesis (Bernardi
and Bernardi 1986; Bernardi 1993b), the transposable elements hypothesis (Duret and Hurst
2001), the recombination hypothesis (Eyre-Walker 1993) and the cytosine deamination
hypothesis (Fryxell and Zuckerkandl 2000).
The presumed relationship between GC3 and isochores has been used numerous times in
the literature to study isochore function and evolution until Elhaik et al. (2009) showed that
no such relationship exists. By testing the relationship between GC3 and the GC content of
the flanking regions of the genes of 6 animals, the authors demonstrated that GC3 explains a
very small proportion of the variation in GC content of long genomic sequences flanking the
genes. The predictive power either decreases rapidly the further one gets from the gene or
does not exist at all. These findings also implied that the isochore theory cannot be discussed
without further analysis of the complete genomic data. Indeed, further analyses showed that
the descriptions of the human or vertebrate genomes as mosaics of isochores are erroneous
(Cohen et al. 2005; Elsik et al. 2009; Elhaik, Graur, and Josić 2010; Elhaik et al. 2010). Due to
the lack of predictive power of GC3, new genomic studies scan the entire genomic structure
www.intechopen.com

GC3 Biology in Eukaryotes and Prokaryotes 63
using automatic algorithms rather than rely on unreliable proxies. The emerging view of the
mammalian genome depicts an assortment of compositionally nonhomogeneous domains
with numerous short compositionally homogeneous domains and relatively few long one
(Elsik et al. 2009; Elhaik et al. 2010). Similar results were found for invertebrate genomes
(Sodergren et al. 2006a; Sodergren et al. 2006b; Richards et al. 2008; Kirkness et al. 2010;
Werren et al. 2010; Smith et al. 2011a; Smith et al. 2011b; Suen et al. 2011).
5. Applications of GC3 in everyday’s biology
Although the role of GC3 as a proxy to large flanking regions was severely minimized, the
question of which processes determine the GC content in 4-fold degenerate codons remains
unanswered. It was therefore proposed to use GC3 to detect sites under selection. The
rationale is simple, if genomic GC-content is solely a consequence of mutation bias and the
base composition is at equilibrium, then we expect equal numbers of synonymous
mutations at 4-fold sites to be segregating within a species (Hildebrand, Meyer, and Eyre-
Walker 2010), whereas deviation from such prediction may indicate selection. GC3 remains a
very useful tool to estimate codon usage bias and species diversity (Suzuki, Saito, and
Tomita 2009).
GC3 is useful for detection of recent horizontal gene transfer (HGT) events. Horizontal gene transfer occurs when an organism incorporates genetic material from another organism without being the offspring of that organism. Recently acquired genes retain nucleotide composition of the original genome and their identification is important for accurate reconstruction of phylogenetic trees, epidemiology, and genetic engineering.
GC3 can also be used for gene prediction and genome annotation. In monocots, many genes
demonstrate a negative GC gradient, that is, the GC content declines along the orientation of
transcription. It is important to detect the presence of GC-rich sequences at the 5’ end of
genes because it influences the conformation of chromatin, the expression level of genes,
and the recombination rate. Performance of genome annotation programs is often affected
by 5'-3' gradients of nucleotide composition of coding region (Figure 1). Rare tissue-specific
and stress-specific genes (that may not have mRNA support) are likely to belong to GC3-rich
class, and have a distinct pattern on the 5'-3'. If the gene-finding program is tailored to the
more prevalent GC3-poor genes, de-novo identification of these rare, but probably extremely
important for stress response and adaptation, GC3-rich genes will be hindered (Souvorov et
al 2011).
6. References
Alvarez-Valin, F., G. Lamolle, and G. Bernardi. 2002. Isochores, GC3 and mutation biases in
the human genome. Gene. 300:161-168.
Aota, S., and T. Ikemura. 1986. Diversity in G + C content at the third position of codons in
vertebrate genes and its cause. Nucleic Acids Res. 14:6345-6355.
Belle, E. M., N. Smith, and A. Eyre-Walker. 2002. Analysis of the phylogenetic distribution of
isochores in vertebrates and a test of the thermal stability hypothesis. Journal of
Molecular Evolution. 55:356-363.
www.intechopen.com
DNA Methylation – From Genomics to Technology 64
Bernardi, G., S. Hughes, and D. Mouchiroud. 1997. The major compositional transitions in
the vertebrate genome. Journal of Molecular Evolution. 44 Suppl 1:S44-51.
Carlini, D. B., Y. Chen, and W. Stephan. 2001. The Relationship Between Third-Codon
Position Nucleotide Content, Codon Bias, mRNA Secondary Structure and Gene
Expression in the Drosophilid Alcohol Dehydrogenase Genes Adh and Adhr.
Genetics. 159:623-633.
Duret, L., D. Mouchiroud, and C. Gautier. 1995. Statistical analysis of vertebrate sequences
reveals that long genes are scarce in GC-rich isochores. Journal of Molecular
Evolution. 40:308-317.
Elhaik, E., G. Landan, and D. Graur. 2009. Can GC Content at Third-Codon Positions Be
Used as a Proxy for Isochore Composition? Molecular Biology and Evolution.
26:1829-1833.
Graur, D., and W.-H. Li. 2000. Fundamentals of molecular evolution. Sinauer, Sunderland,
Mass.
Ikemura, T. 1985. Codon usage and tRNA content in unicellular and multicellular
organisms. Molecular Biology and Evolution. 2:13-34.
Lercher, M. J., N. G. C. Smith, A. Eyre-Walker, and L. D. Hurst. 2002. The Evolution of
Isochores: Evidence From SNP Frequency Distributions. Genetics. 162:1805-1810.
Lynch, D. B., M. E. Logue, G. Butler, and K. H. Wolfe. 2010. Chromosomal G + C content
evolution in yeasts: systematic interspecies differences, and GC-poor troughs at
centromeres. Genome Biol Evol. 2:572-583.
Mouchiroud D., D'Onofrio G, Aïssani B, Macaya G, Gautier C, Bernardi G: The distribution
of genes in the human genome. Gene 1991, 100:181-7.
Romiguier, J., V. Ranwez, E. J. Douzery, and N. Galtier. 2010. Contrasting GC-content
dynamics across 33 mammalian genomes: Relationship with life-history traits and
chromosome sizes. Genome Research.
Shaul, S., D. Berel, Y. Benjamini, and D. Graur. 2010. Revisiting the operational RNA code
for amino acids: Ensemble attributes and their implications. RNA. 16:141-153.
Stayssman R, Nejman D, Roberts D, Steinfeld I, Blum B, Benvenisty N, Simon I, Yakhili Z,
Cedar H: Developmental programming of CpG island methylation profiles in the
human genome. Nature Structural & Molecular Biology 2009, 16(5):564-571
Tatarinova, T. V., N. N. Alexandrov, J. B. Bouck, and K. A. Feldmann. 2010. GC3 biology in
corn, rice, sorghum and other grasses. BMC Genomics. 11:308.
Aissani, B., G. D'Onofrio, D. Mouchiroud, K. Gardiner, C. Gautier, and G. Bernardi. 1991.
The compositional properties of human genes. Journal of Molecular Evolution.
32:493-503.
Aota, S., and T. Ikemura. 1986. Diversity in G + C content at the third position of codons in
vertebrate genes and its cause. Nucleic Acids Res. 14:6345-6355.
Belle, E. M., N. Smith, and A. Eyre-Walker. 2002. Analysis of the phylogenetic distribution of
isochores in vertebrates and a test of the thermal stability hypothesis. Journal of
Molecular Evolution. 55:356-363.
Bernardi, G. 1993a. The isochore organization of the human genome and its evolutionary
history--a review. Gene. 135:57-66.
Bernardi, G. 2001. Misunderstandings about isochores. Part 1. Gene. 276:3-13.
www.intechopen.com

GC3 Biology in Eukaryotes and Prokaryotes 65
Bernardi, G. 1993b. The vertebrate genome: isochores and evolution. Molecular Biology and
Evolution. 10:186-204.
Bernardi, G. 2000. Isochores and the evolutionary genomics of vertebrates. Gene. 241:3-17.
Bernardi, G., and G. Bernardi. 1986. Compositional constraints and genome evolution.
Journal of Molecular Evolution. 24:1-11.
Bernardi, G., B. Olofsson, J. Filipski, M. Zerial, J. Salinas, G. Cuny, M. Meunier-Rotival, and
F. Rodier. 1985. The mosaic genome of warm-blooded vertebrates. Science. 228:953-
958.
Bradnam, K. R., C. Seoighe, P. M. Sharp, and K. H. Wolfe. 1999. G+C content variation along
and among Saccharomyces cerevisiae chromosomes. Molecular Biology and
Evolution. 16:666-675.
Chojnowski, J. L., J. Franklin, Y. Katsu, T. Iguchi, L. J. Guillette, Jr., R. T. Kimball, and E. L.
Braun. 2007. Patterns of vertebrate isochore evolution revealed by comparison of
expressed mammalian, avian, and crocodilian genes. Journal of Molecular
Evolution. 65:259-266.
Cohen, N., T. Dagan, L. Stone, and D. Graur. 2005. GC composition of the human genome:
in search of isochores. Molecular Biology and Evolution. 22:1260-1272.
Cuny, G., P. Soriano, G. Macaya, and G. Bernardi. 1981. The major components of the mouse
and human genomes: Preparation, basic properties and compositional
heterogeneity. European Journal of Biochemistry. 115:227-233.
D'Onofrio, G. 2002. Expression patterns and gene distribution in the human genome. Gene.
300:155-160.
D'Onofrio, G., T. C. Ghosh, and G. Bernardi. 2002. The base composition of the genes is
correlated with the secondary structures of the encoded proteins. Gene. 300:179-
187.
Duret, L., and L. D. Hurst. 2001. The elevated GC content at exonic third sites is not evidence
against neutralist models of isochore evolution. Molecular Biology and Evolution.
18:757-762.
Elhaik, E., D. Graur, and K. Josić. 2010. Comparative testing of DNA segmentation
algorithms using benchmark simulations. Molecular Biology and Evolution.
27:1015-1024.
Elhaik, E., D. Graur, K. Josic, and G. Landan. 2010. Identifying compositionally
homogeneous and nonhomogeneous domains within the human genome using a
novel segmentation algorithm. Nucl. Acids Res.:gkq532.
Elhaik, E., G. Landan, and D. Graur. 2009. Can GC Content at Third-Codon Positions Be
Used as a Proxy for Isochore Composition? Molecular Biology and Evolution.
26:1829-1833.
Elsik, C. G.R. L. TellamK. C. Worley et al. 2009. The genome sequence of taurine cattle: a
window to ruminant biology and evolution. Science. 324:522-528.
Ermolaeva, M. D. 2001. Synonymous codon usage in bacteria. Curr Issues Mol Biol. 3:91-97.
Eyre-Walker, A. 1993. Recombination and mammalian genome evolution. Proc Biol Sci.
252:237-243.
Eyre-Walker, A., and L. D. Hurst. 2001. The evolution of isochores. Nat Rev Genet. 2:549-
555.
www.intechopen.com

DNA Methylation – From Genomics to Technology 66
Federico, C., S. Saccone, L. Andreozzi, S. Motta, V. Russo, N. Carels, and G. Bernardi. 2004.
The pig genome: compositional analysis and identification of the gene-richest
regions in chromosomes and nuclei. Gene. 343:245-251.
Fortes, G., C. Bouza, P. Martínez, and L. Sánchez. 2007. Diversity in isochore structure
among cold-blooded vertebrates based on GC content of coding and non-coding
sequences. Genetica. 129:281-289.
Fryxell, K. J., and E. Zuckerkandl. 2000. Cytosine deamination plays a primary role in the
evolution of mammalian isochores. Molecular Biology and Evolution. 17:1371-
1383.
Galtier, N., G. Piganeau, D. Mouchiroud, and L. Duret. 2001. GC-content evolution in
mammalian genomes: the biased gene conversion hypothesis. Genetics. 159:907-
911.
Hamada, K., T. Horiike, H. Ota, K. Mizuno, and T. Shinozawa. 2003. Presence of isochore
structures in reptile genomes suggested by the relationship between GC contents
of intron regions and those of coding regions. Genes and Genetic Systems. 78:195-
198.
Hildebrand, F., A. Meyer, and A. Eyre-Walker. 2010. Evidence of Selection upon Genomic
GC-Content in Bacteria. PLoS Genet. 6:e1001107.
Jorgensen, F. G., M. H. Schierup, and A. G. Clark. 2007. Heterogeneity in regional GC
content and differential usage of codons and amino acids in GC-poor and GC-rich
regions of the genome of Apis mellifera. Molecular Biology and Evolution. 24:611-
619.
Kirkness, E. F.B. J. HaasW. Sun et al. 2010. Genome sequences of the human body louse and
its primary endosymbiont provide insights into the permanent parasitic lifestyle.
Proceedings of the National Academy of Sciences of the United States of America.
107:12168-12173.
Lander, E. S.L. M. LintonB. Birren et al. 2001. Initial sequencing and analysis of the human
genome. Nature. 409:860-921.
Lynch, D. B., M. E. Logue, G. Butler, and K. H. Wolfe. 2010. Chromosomal G + C content
evolution in yeasts: systematic interspecies differences, and GC-poor troughs at
centromeres. Genome Biol Evol. 2:572-583.
Ma, B. G., and L. L. Chen. 2005. The most deviated codon position in AT-rich bacterial
genomes: a function related analysis. Journal of Biomolecular Structure and
Dynamics. 23:143-149.
Macaya, G., J. P. Thiery, and G. Bernardi. 1976. An approach to the organization of
eukaryotic genomes at a macromolecular level. Journal of Molecular Biology.
108:237-254.
Matassi, G., P. M. Sharp, and C. Gautier. 1999. Chromosomal location effects on gene
sequence evolution in mammals. Current Biology. 9:786-791.
Mouchiroud, D., and G. Bernardi. 1993. Compositional properties of coding sequences and
mammalian phylogeny. Journal of Molecular Evolution. 37:109-116.
Mouchiroud, D., G. Fichant, and G. Bernardi. 1987. Compositional compartmentalization
and gene composition in the genome of vertebrates. Journal of Molecular
Evolution. 26:198-204.
www.intechopen.com

GC3 Biology in Eukaryotes and Prokaryotes 67
Muto, A., and S. Osawa. 1987. The guanine and cytosine content of genomic DNA and
bacterial evolution. Proceedings of the National Academy of Sciences of the United
States of America. 84:166-169.
Ponger, L., L. Duret, and D. Mouchiroud. 2001. Determinants of CpG islands: expression in
early embryo and isochore structure. Genome Research. 11:1854-1860.
Richards, S.R. A. GibbsG. M. Weinstock et al. 2008. The genome of the model beetle and pest
Tribolium castaneum. Nature. 452:949-955.
Romero, H., A. Zavala, H. Musto, and G. Bernardi. 2003. The influence of translational
selection on codon usage in fishes from the family Cyprinidae. Gene. 317:141-147.
Sharp, P. M., and A. T. Lloyd. 1993. Regional base composition variation along yeast
chromosome III: evolution of chromosome primary structure. Nucleic Acids Res.
21:179-183.
Smith, C. D.A. ZiminC. Holt et al. 2011a. Draft genome of the globally widespread and
invasive Argentine ant (Linepithema humile). Proceedings of the National
Academy of Sciences of the United States of America.
Smith, C. R.C. D. SmithH. M. Robertson et al. 2011b. Draft genome of the red harvester ant
Pogonomyrmex barbatus. Proceedings of the National Academy of Sciences of the
United States of America.
Sodergren, E.G. M. Weinstock E. H. Davidson et al. 2006a. Insights into social insects from
the genome of the honeybee Apis mellifera. Nature. 443:931-949.
Sodergren, E.G. M. WeinstockE. H. Davidson et al. 2006b. The genome of the sea urchin
Strongylocentrotus purpuratus. Science. 314:941-952.
Souvorov, A; Tatusova, T; Zaslasky, L; Smith-White, B. Glycine max and Zea mays Genome
Annotation with Gnomon, ISMB/ECCB 2011.
Suen, G.C. TeilingL. Li et al. 2011. The Genome Sequence of the Leaf-Cutter Ant Atta
ephalotes Reveals Insights into Its Obligate Symbiotic Lifestyle. PLoS Genet.
7:e1002007.
Sueoka, N. 1988. Directional mutation pressure and neutral molecular evolution.
Proceedings of the National Academy of Sciences of the United States of America.
85:2653-2657.
Sueoka, N. 1962. On the genetic basis of variation and heterogeneity of DNA base
composition. Proceedings of the National Academy of Sciences of the United States
of America. 48:582-592.
Sueoka, N., and Y. Kawanishi. 2000. DNA G+C content of the third codon position and
codon usage biases of human genes. Gene. 261:53-62.
Suzuki, H., R. Saito, and M. Tomita. 2007. Variation in the correlation of G + C composition
with synonymous codon usage bias among bacteria. EURASIP J Bioinform Syst
Biol.61374.
Suzuki, H., R. Saito, and M. Tomita. 2009. Measure of synonymous codon usage diversity
among genes in bacteria. BMC Bioinformatics. 10:167.
Tatarinova, T. V., N. N. Alexandrov, J. B. Bouck, and K. A. Feldmann. 2010. GC3 biology in
corn, rice, sorghum and other grasses. BMC Genomics. 11:308.
Thiery, J. P., G. Macaya, and G. Bernardi. 1976. An analysis of eukaryotic genomes by
density gradient centrifugation. Journal of Molecular Biology. 108:219-235.
www.intechopen.com

DNA Methylation – From Genomics to Technology 68
Wang, H. C., G. A. Singer, and D. A. Hickey. 2004. Mutational bias affects protein evolution
in flowering plants. Molecular Biology and Evolution. 21:90-96.
Werren, J. H.S. RichardsC. A. Desjardins et al. 2010. Functional and evolutionary insights
from the genomes of three parasitoid Nasonia species. Science. 327:343-348.
Wolfe, K. H., P. M. Sharp, and W. H. Li. 1989. Mutation rates differ among regions of the
mammalian genome. Nature. 337:283-285.
www.intechopen.com

DNA Methylation - From Genomics to TechnologyEdited by Dr. Tatiana Tatarinova
ISBN 978-953-51-0320-2Hard cover, 400 pagesPublisher InTechPublished online 16, March, 2012Published in print edition March, 2012
InTech EuropeUniversity Campus STeP Ri Slavka Krautzeka 83/A 51000 Rijeka, Croatia Phone: +385 (51) 770 447 Fax: +385 (51) 686 166www.intechopen.com
InTech ChinaUnit 405, Office Block, Hotel Equatorial Shanghai No.65, Yan An Road (West), Shanghai, 200040, China
Phone: +86-21-62489820 Fax: +86-21-62489821
Epigenetics is one of the most exciting and rapidly developing areas of modern genetics with applications inmany disciplines from medicine to agriculture. The most common form of epigenetic modification is DNAmethylation, which plays a key role in fundamental developmental processes such as embryogenesis and alsoin the response of organisms to a wide range of environmental stimuli. Indeed, epigenetics is increasingregarded as one of the major mechanisms used by animals and plants to modulate their genome and itsexpression to adapt to a wide range of environmental factors. This book brings together a group of experts atthe cutting edge of research into DNA methylation and highlights recent advances in methodology andknowledge of underlying mechanisms of this most important of genetic processes. The reader will gain anunderstanding of the impact, significance and recent advances within the field of epigenetics with a focus onDNA methylation.
How to referenceIn order to correctly reference this scholarly work, feel free to copy and paste the following:
Eran Elhaik and Tatiana Tatarinova (2012). GC3 Biology in Eukaryotes and Prokaryotes, DNA Methylation -From Genomics to Technology, Dr. Tatiana Tatarinova (Ed.), ISBN: 978-953-51-0320-2, InTech, Availablefrom: http://www.intechopen.com/books/dna-methylation-from-genomics-to-technology/gc3-biology-in-eukaryotes-and-prokaryotes