gavin astin 29 september 2011 derailment risk model frequency analysis and scenario development
TRANSCRIPT

Gavin Astin 29 September 2011
Derailment Risk Model
Frequency analysis and scenario development
Freight train derailment risk model29 September 2011
Agenda
2
1. Background
2. Frequency Assessment
3. Consequence / Impact Assessment
4. Summary
Freight train derailment risk model29 September 2011
Risk Model Structure
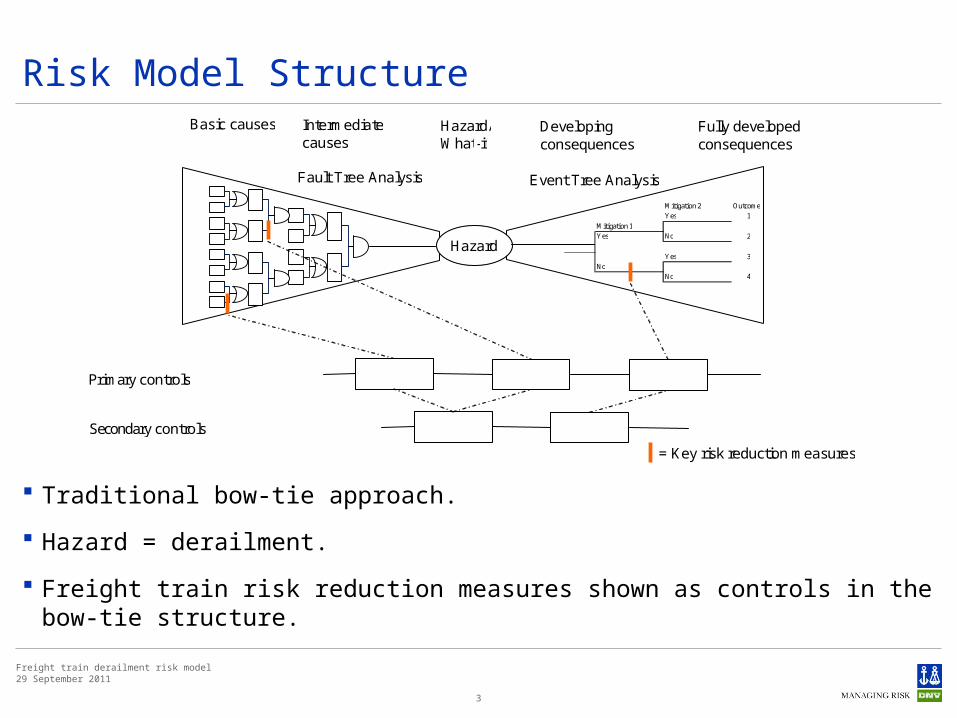
Traditional bow-tie approach.
Hazard = derailment.
Freight train risk reduction measures shown as controls in the bow-tie structure.
3
Hazard
Basic causes Intermediate causes
Hazard/ What - if
Fully developed consequences
Developing consequences
Primary controls
Secondary controls
Fault Tree Analysis Event Tree Analysis Mitigation 2 Outcome Yes 1
Mitigation 1 Yes No 2
Yes 3 No
No 4
= Key risk reduction measures
Freight train derailment risk model29 September 2011
4
Background to Risk Model Data
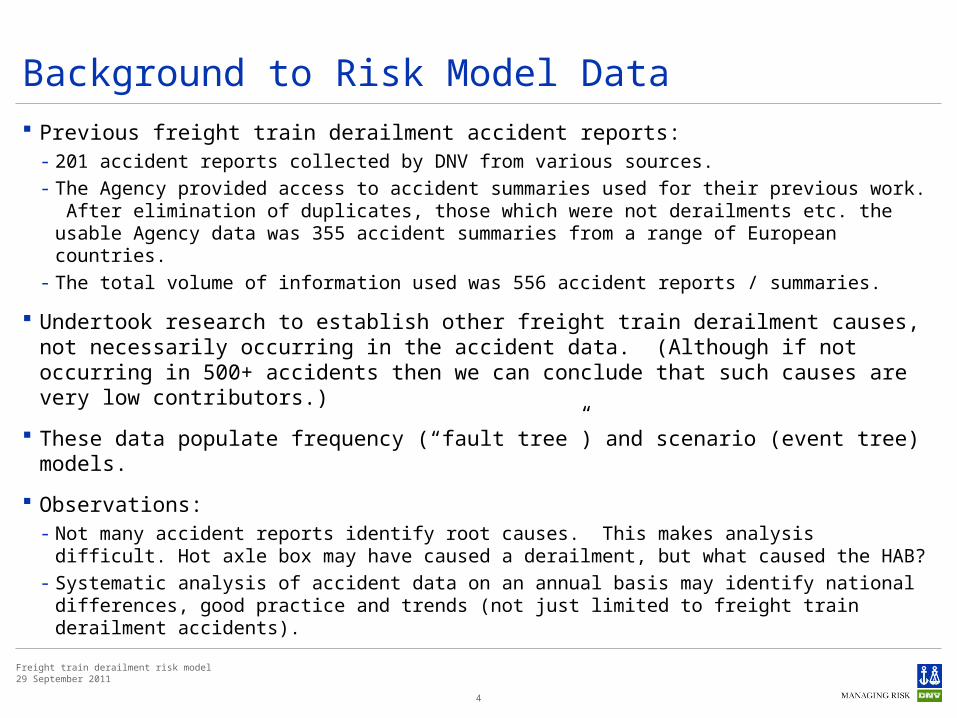
Previous freight train derailment accident reports:- 201 accident reports collected by DNV from various sources.- The Agency provided access to accident summaries used for their previous work. After
elimination of duplicates, those which were not derailments etc. the usable Agency data was 355 accident summaries from a range of European countries.
- The total volume of information used was 556 accident reports / summaries.
Undertook research to establish other freight train derailment causes, not necessarily occurring in the accident data. (Although if not occurring in 500+ accidents then we can conclude that such causes are very low contributors.)
These data populate frequency (“fault tree”) and scenario (event tree) models.
Observations:- Not many accident reports identify root causes. This makes analysis difficult. Hot axle box
may have caused a derailment, but what caused the HAB? - Systematic analysis of accident data on an annual basis may identify national differences,
good practice and trends (not just limited to freight train derailment accidents).
Freight train derailment risk model29 September 2011
Agenda
5
1. Background
2. Frequency Assessment
3. Consequence / Impact Assessment
4. Summary
Freight train derailment risk model29 September 2011
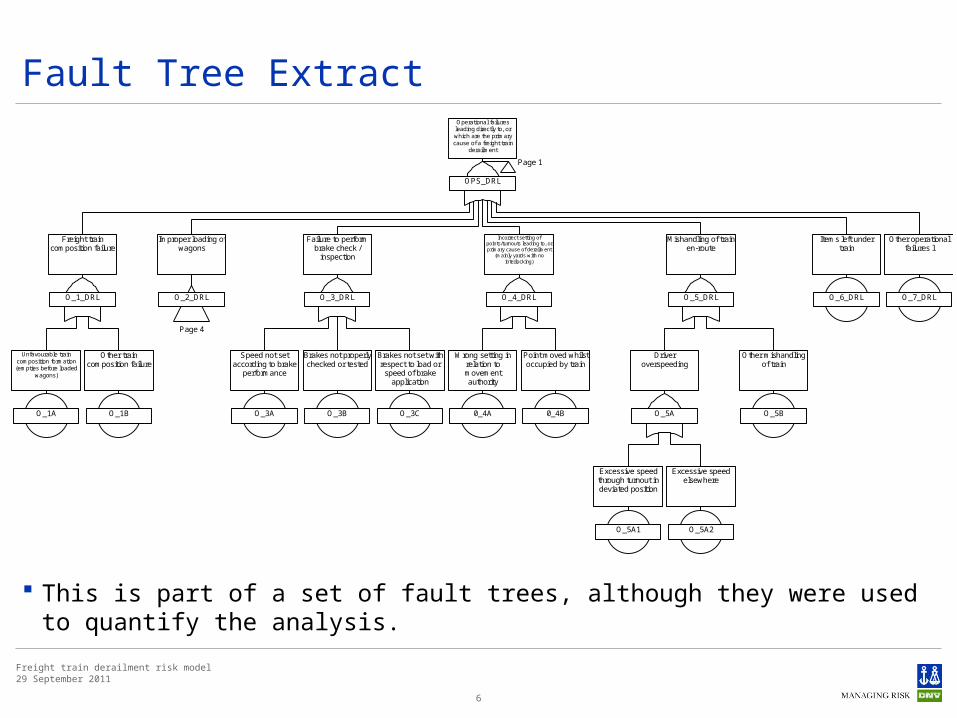
Fault Tree Extract
6
OPS_DRL
Operational failures leading directly to, or which are the primary cause of a freight train
derailment
Page 1
O_1_DRL
Freight train composition failure
O_2_DRL
Improper loading of wagons
Page 4
O_3_DRL
Failure to perform brake check /
inspection
O_4_DRL
Incorrect setting of points/turnouts leading to, or primary cause of derailment
(mainly yards with no interlocking)
O_5_DRL
Mishandling of train en-route
O_6_DRL
Items left under train
O_7_DRL
Other operational failures l
O_1A
Unfavourable train composition formation (empties before loaded
wagons)
O_1B
Other train composition failure
O_3A
Speed not set according to brake
performance
O_3B
Brakes not properly checked or tested
O_3C
Brakes not set with respect to load or
speed of brake application
0_4A
Wrong setting in relation to movement authority
0_4B
Point moved whilst occupied by train
O_5A
Driver overspeeding
O_5B
Other mishandling of train
O_5A1
Excessive speed through turnout in deviated position
O_5A2
Excessive speed elsewhere
This is part of a set of fault trees, although they were used to quantify the analysis.
Freight train derailment risk model29 September 2011
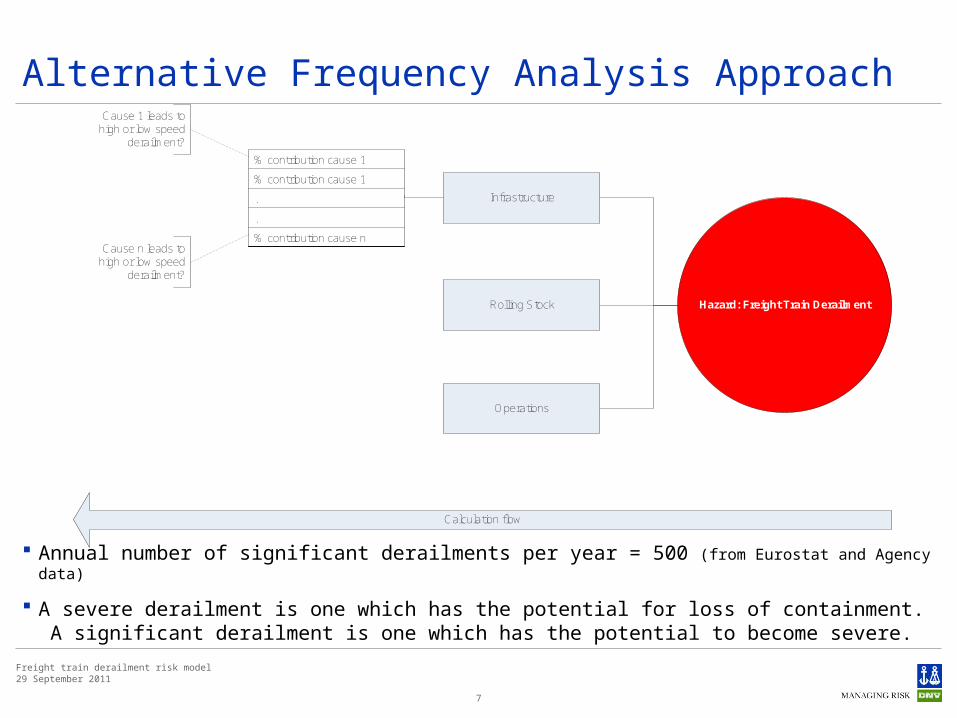
Alternative Frequency Analysis Approach
7
Hazard: Freight Train Derailment
Infrastructure
Rolling Stock
Operations
% contribution cause 1
% contribution cause 1
.
.
% contribution cause n
Cause 1 leads to high or low speed
derailment?
Cause n leads to high or low speed
derailment?
Calculation flow
Annual number of significant derailments per year = 500 (from Eurostat and Agency data)
A severe derailment is one which has the potential for loss of containment. A significant derailment is one which has the potential to become severe.
Freight train derailment risk model29 September 2011
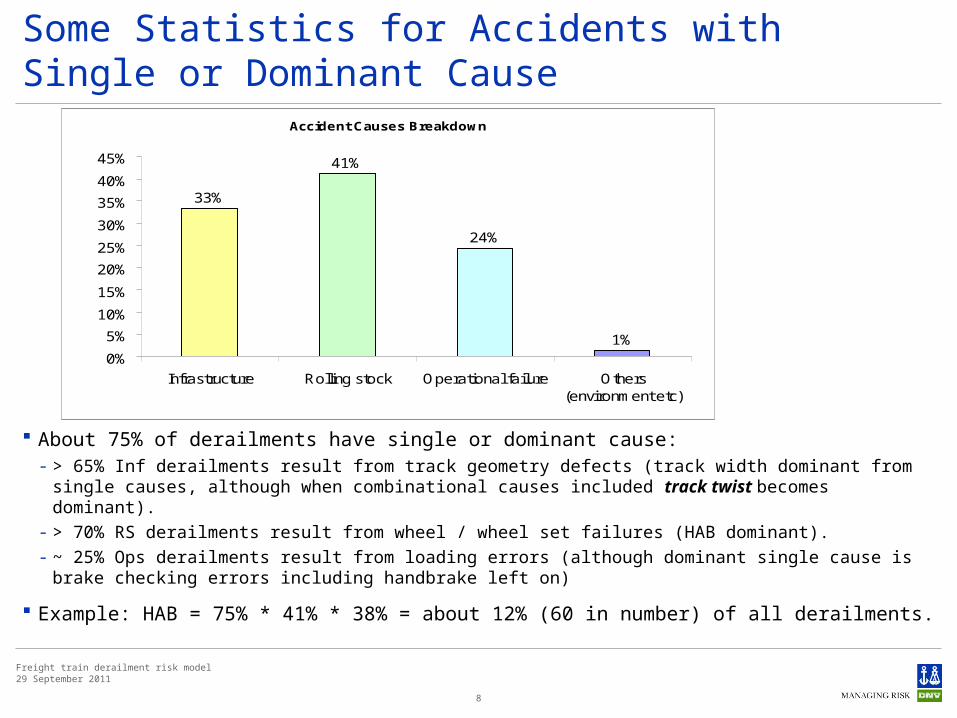
Some Statistics for Accidents with Single or Dominant Cause
About 75% of derailments have single or dominant cause:- > 65% Inf derailments result from track geometry defects (track width dominant from single
causes, although when combinational causes included track twist becomes dominant).- > 70% RS derailments result from wheel / wheel set failures (HAB dominant).- ~ 25% Ops derailments result from loading errors (although dominant single cause is brake
checking errors including handbrake left on)
Example: HAB = 75% * 41% * 38% = about 12% (60 in number) of all derailments.
8
Accident Causes Breakdown
33%
41%
24%
1%0%
5%
10%
15%
20%
25%
30%
35%
40%
45%
Infrastructure Rolling stock Operational failure Others(environment etc)
Freight train derailment risk model29 September 2011
Some Statistics for Accidents with Several Causes
Track geometry defects appear in about 50% of accidents where more than one cause is present, with track twist the most significant appearing in about 30%.
Wheel profile defects appear in about 20% of accidents where more than one cause is present.
Wagon wrongly loaded appears in about 10% of accidents where more than one cause is present.
Train mishandling appears in 10% of accidents where more than one cause is present.
Our assumption is that removal of a one of these causes will prevent the derailment.
9

Freight train derailment risk model29 September 2011
10
Derailment Frequency Assessment Results
Derail numbers.docx
Freight train derailment risk model29 September 2011
Agenda
11
1. Background
2. Frequency Assessment
3. Consequence / Impact Assessment
4. Summary
Freight train derailment risk model29 September 2011
12
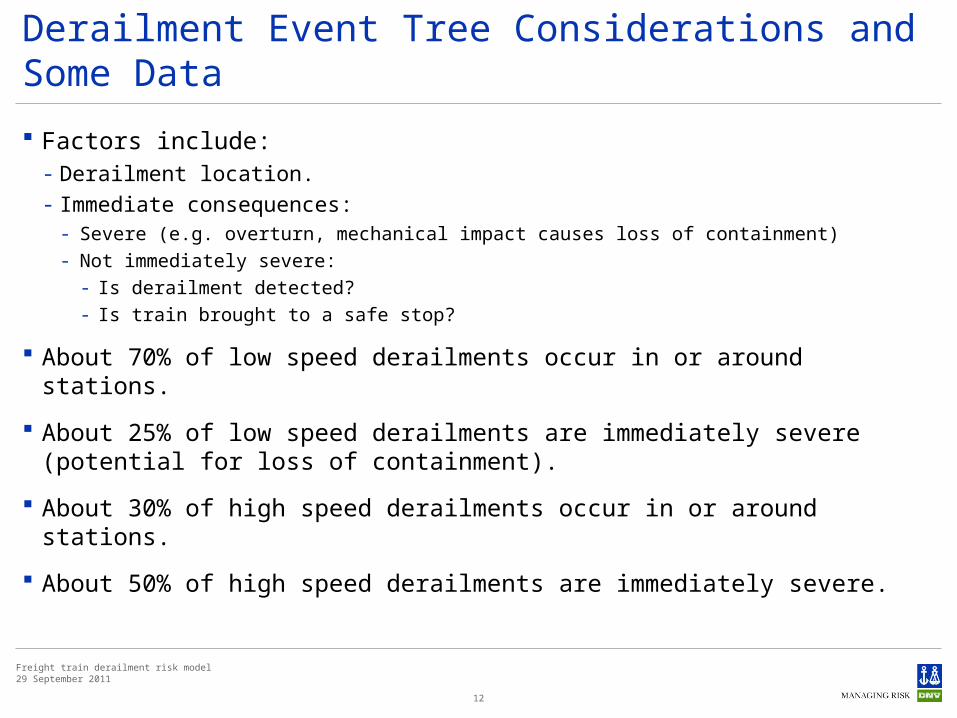
Derailment Event Tree Considerations and Some Data
Factors include:- Derailment location.- Immediate consequences:
- Severe (e.g. overturn, mechanical impact causes loss of containment)- Not immediately severe:
- Is derailment detected?- Is train brought to a safe stop?
About 70% of low speed derailments occur in or around stations.
About 25% of low speed derailments are immediately severe (potential for loss of containment).
About 30% of high speed derailments occur in or around stations.
About 50% of high speed derailments are immediately severe.
Freight train derailment risk model29 September 2011
13
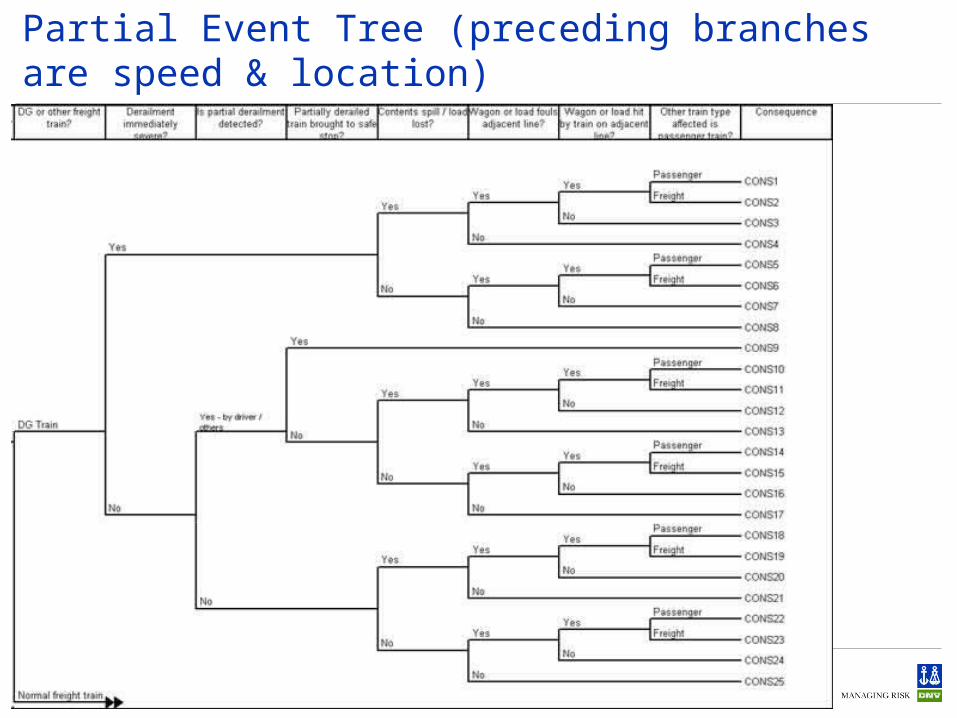
Partial Event Tree (preceding branches are speed & location)
Freight train derailment risk model29 September 2011
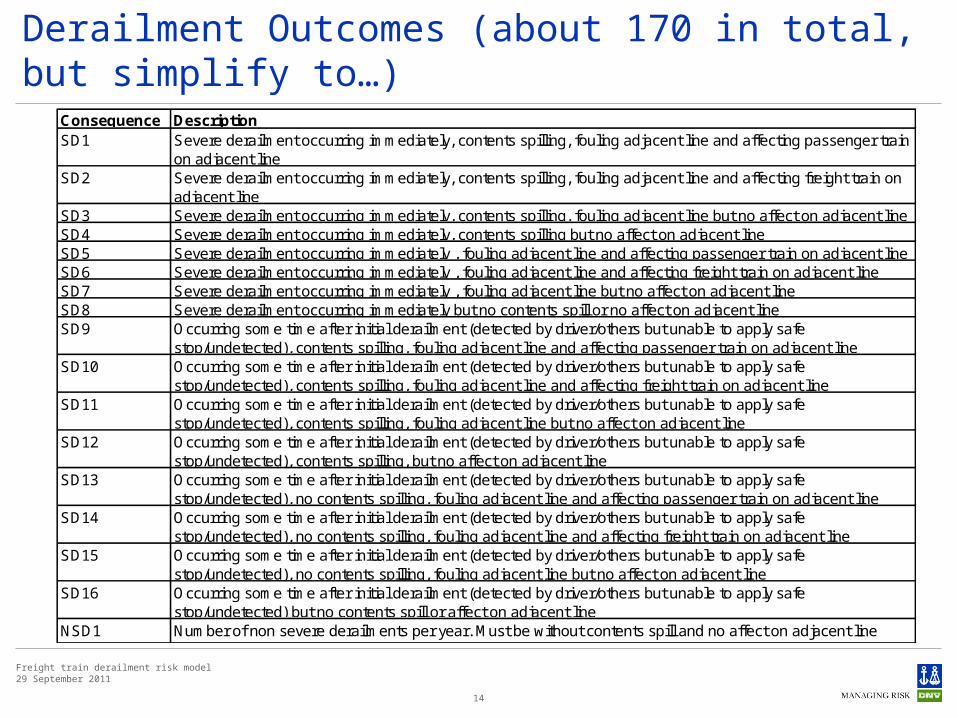
Derailment Outcomes (about 170 in total, but simplify to…)
14
Consequence DescriptionSD1 Severe derailment occurring immediately, contents spilling, fouling adjacent line and affecting passenger train
on adjacent lineSD2 Severe derailment occurring immediately, contents spilling, fouling adjacent line and affecting freight train on
adjacent lineSD3 Severe derailment occurring immediately, contents spilling, fouling adjacent line but no affect on adjacent lineSD4 Severe derailment occurring immediately, contents spilling but no affect on adjacent lineSD5 Severe derailment occurring immediately , fouling adjacent line and affecting passenger train on adjacent lineSD6 Severe derailment occurring immediately , fouling adjacent line and affecting freight train on adjacent lineSD7 Severe derailment occurring immediately , fouling adjacent line but no affect on adjacent lineSD8 Severe derailment occurring immediately but no contents spill or no affect on adjacent lineSD9 Occurring some time after initial derailment (detected by driver/others but unable to apply safe
stop/undetected), contents spilling, fouling adjacent line and affecting passenger train on adjacent lineSD10 Occurring some time after initial derailment (detected by driver/others but unable to apply safe
stop/undetected), contents spilling, fouling adjacent line and affecting freight train on adjacent lineSD11 Occurring some time after initial derailment (detected by driver/others but unable to apply safe
stop/undetected), contents spilling, fouling adjacent line but no affect on adjacent lineSD12 Occurring some time after initial derailment (detected by driver/others but unable to apply safe
stop/undetected), contents spilling, but no affect on adjacent lineSD13 Occurring some time after initial derailment (detected by driver/others but unable to apply safe
stop/undetected), no contents spilling, fouling adjacent line and affecting passenger train on adjacent lineSD14 Occurring some time after initial derailment (detected by driver/others but unable to apply safe
stop/undetected), no contents spilling, fouling adjacent line and affecting freight train on adjacent lineSD15 Occurring some time after initial derailment (detected by driver/others but unable to apply safe
stop/undetected), no contents spilling, fouling adjacent line but no affect on adjacent lineSD16 Occurring some time after initial derailment (detected by driver/others but unable to apply safe
stop/undetected) but no contents spill or affect on adjacent lineNSD1 Number of non severe derailments per year. Must be without contents spill and no affect on adjacent line
Freight train derailment risk model29 September 2011
15
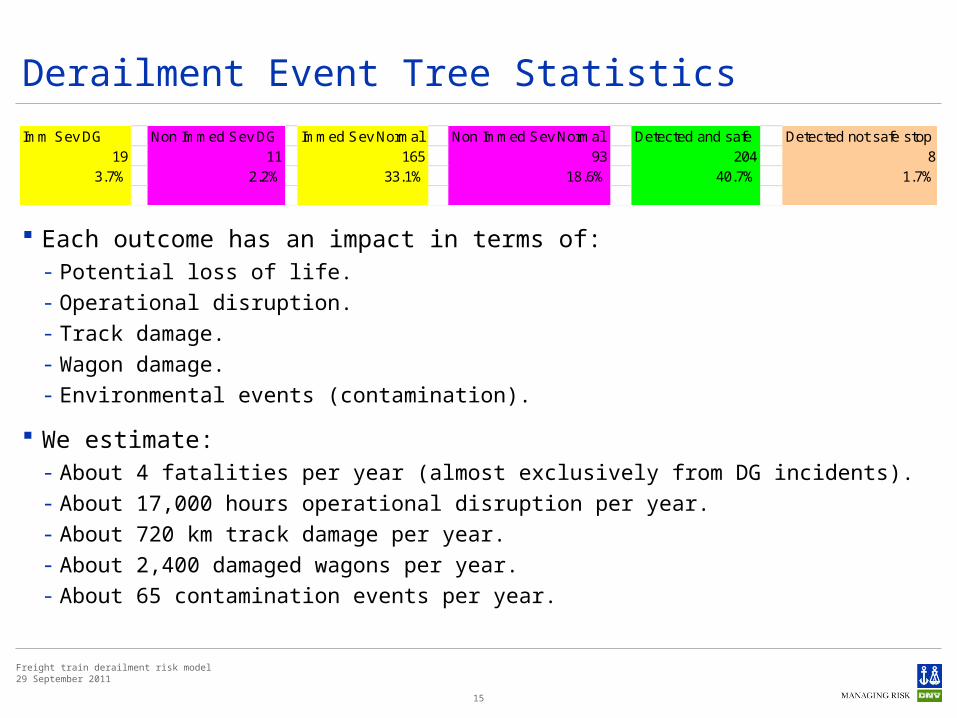
Derailment Event Tree Statistics
Imm Sev DG Non Immed Sev DG Immed Sev Normal Non Immed Sev Normal Detected and safe Detected not safe stop19 11 165 93 204 8
3.7% 2.2% 33.1% 18.6% 40.7% 1.7%
Each outcome has an impact in terms of:- Potential loss of life.- Operational disruption.- Track damage.- Wagon damage.- Environmental events (contamination).
We estimate:- About 4 fatalities per year (almost exclusively from DG incidents).- About 17,000 hours operational disruption per year.- About 720 km track damage per year.- About 2,400 damaged wagons per year.- About 65 contamination events per year.

Freight train derailment risk model29 September 2011
Agenda
16
1. Background
2. Frequency Assessment
3. Consequence / Impact Assessment
4. Summary

Freight train derailment risk model29 September 2011
17
Summing Up
Risk model predicts impacts.
Benefits of identified measures are determined in terms of avoided derailments / reduced impacts.
Potential costs of new measures are defined by the application scope, measure cost and maintenance parameters and effectiveness of each measure
Hazard
Basic causes Intermediate causes
Hazard/ What - if
Fully developed consequences
Developing consequences
Primary controls
Secondary controls
Fault Tree Analysis Event Tree Analysis Mitigation 2 Outcome Yes 1
Mitigation 1 Yes No 2
Yes 3 No
No 4
= Key risk reduction measures
Freight train derailment risk model29 September 2011
18
End of Session - Any Questions
Freight train derailment risk model29 September 2011
19
Safeguarding life, property and the environment
www.dnv.com