gather more data on the students. intercorrelational table … study could not have been completed...
TRANSCRIPT

I
.II... .....
UOCUPI2/4? IINSUP46
ED 032 043 JC 690 303
By-Rice. Cary A.A Study of the Predictive Validity of the Washington Pre -Colkge Test for Introductory Courses at YakimaValley College.
Spons Agency-Washington Pre-College Testing Prooram Seetz.Pub Date Feb 68Note-113p.EDRS Price MF-5025 FiC -S5.75Descriptors,-*Ji;:ior Coneges. *Pvicr:ve .slid/, :::Te41-4Identifiers- *Washincton Pre-College Test
This studyls purposes were to determine the predictive validity of the WashingtonPre-College Test (WPCT) for 16 introductory courses at Yakima Valley College. todemonstrate the importance of a coordinated program of institutional research. andto help the WPCT program gather more data on the students. The predictorintercorrelational table and the predictor criterion matrix both showed that adifferential weighting favoring cumulative high school CPA's and verbal subtests couldbe used to predict academic behavior reasonably accurately. The specific CPA's were
the best predictors; the quantitative skills were the least useful. MechanicalReasoning, Spatial Ability, Reading Speed, Age, and Sex were unique variables. Multipleregression equations, coefficients of multiple correlation, and percentage ofaccountable variance by each contributing predictor variable were computed foreach criterion area. The percentile tables showed females higher in all measured high
school areas and verbal subtest scores, with males higher in quantitative measures.The total group table coincided with the male table; the college total' table was almostidentical with a junior college table, but different from an all-college table consistingmainly of 4-year students. The findings suggest the test battery is predictirg studentcollege performance reasonably well. A locally constructed battery couldaossiblyincrease the validity, but not enough to warrant the time and money spent.
U.S. DEPARTMENT OF HEALTH, EDUCATION & WELFARE
OffICE OF EDUCATION
THIS DOCUMENT HAS MEN REPRODUCED EXACTLY AS RECEIVED FROM THE
PERSON OR ORGANIZATION ORIGINATING IL POINTS OF VIEW OR OPINIONS
STATED DO NOT NECESSARILY REPRESENT OFFICIAL OFFICE Of EDUCATION
POSITION OR POLICY.
A STUDY OF THE PREDICTIVE VALIDITY OF THEWASHINGTON PRE-COLLEGE TEST F'OR DITRODUZTORY CO"uRSES
AT YAKIMA. VALLEY COLLEGE
by
Gary A. Rice
Associate Director of Institutional Research and TestingYakima Valley College
This study was supported byWashington Pre-College Testing Program
Seattle, WashingtonFebruary 1968
-.11%
LOS rt,:: LLIS
AUG 2 21909
CLEARINGHOUSzi FORJUI:o!c.7 _07 0 --r,r

ACKNOTTLEDGaNTS
I -wish to gratefully acknowledge the assistance given to me
by many people in the completion of this project. To identify each
i-14duay 11^11A amo"nt of 44m =nrrsonnvill space,
but I araccrtain =oh of them. knows *11=4- i =-1 vpr..c4a+11m, nr
their efforts.
It is, however, necessary and appropriate to extend special
recognition to several groups and individuals. First, thanks to
the tiashinaton Pre-College Testing Program f,x the financial and
technical support. Specifically I wish to acknowledge the assist-
ance of Dr. Thomas Langen and Mr. Renny Greeiimum in performing
the calculations and helDing interpret their significance.
This study could not have been completed without the total
support of Yakima Valley College. The administration of the college
was most generous in allowing the freedom and flexibility to pursue
this project and faculty colleagues provided much needed encourage-
ment and assistance. hr. Paul Aspevig gave a great deal of help
in designing the data layout and gathering the criterion information
to be used in the --mailm-ion, Mr. Robert Seamons and lir. Al Perry
also devoted much of their time to program our college computer and
provide some of the statistics included in this report.

I cannot express my appreciation in words alone to the
members of the registrar's staff and the other secretaries and
.3=e.cr.t assistants who actually carried on the task of hand-
2a.c. 41.4=~,,m=4-4^71 And helloing a pr erpaare 4* C^.1" "1""ww.0
sentation. They all worked under pressure to meet deadlines
and carried out their tasks with a high degree of accuracy.
In view of all of these personal contributions I must say
that whatever credit and benefit may be gained from these find-
ings should be shared by all those involved.
Gary A. Rice

RESEARCH ABSTRACT
A STUDY OF THE PREDICTIVE VALIDITY OF THE
WASHINGTON PRE-COLLEGE TEST FOR INTRODUCTORY COURSES
AT YAKIMA VALLEY COLLEGE
February 1968
The study attemptad to ..c(16..p14h a thet-1A p,rpcma:
A?::.7.rmine the pmA4,4-417a vA1 4Aity of the ILP.C.T. for 16
introductory courses at Y.V.C,, (2) demonstrate the potential
of and need for a coordinated program of institutional research,
and (3) assist the 14.P.C.T.P. to gather more information about
the junior college student.
The predictor intercrrelation table and predictor criterion
matrix both indicated that a differential weighting favoring high
school cumulative averages and verbal subtests could be used to
predict academic behavior with reasonable acuracy. The specific
high school cumulative averages proved to be the best predictors
while the quantitative skills showed the least relationship to
academic success. Mechanical Reasoning, Spatial Ability, Reading
Speed, Age and Sex seemed to be unique variables.
Multiple regression equations, coefficients of multiple
correlation, and percentage of accountable variance by each con-
tributing predictor variable were computed for each criterion area.
The percentile tables generated on Y.V.C. students showed the
females consistently higher in all measured high school areas and
verbal subtest scores with males higher in quantitative measures.
The total group table coincided with the male table. The Y.V.C.
total table was almost identical with a community college table
but different from an all-college table consisting mainly of
four-year students.
The findings suggested that the W.P.C.T. test battery is
reasonably predicting student performance at Y.V.C. A locally
constructed battery could possibly enhance the predictive validity,
but the increment of increase would not warrent the expendizure
in time, facilities and money.
Gary A. Rice

TABLE OF CONTENTS
PAGE
ACKNUALDGMENTS
RESFaCH ABSTRACT iii
TABLE OF CONTENTS iv
LIST OF TABLES vi
CHAPTER
I. A STUDY OF THE PREDICTIVE VALIDITY OF THE
IMSHINGTON PRE-COLLEGE TEST FOR INTRODIETORY
COURSES AT YAKIMA VALLEY COLLEGE
Introduction 1
History & Organizational Structure of the1
The Coanunity Colleges and the W.P.C.T.P. 3
Purposes of the Study 7
Sources of Data and Methods of Research 11
Summary 15
II. RELATED RESEARCH 16
III. THE RELATIONSHIP BETWEEN PREDICTOR AND CRITERION
VARIABLES
Introduction 28
The Predictor Variables 29

CHAPTER PAGE
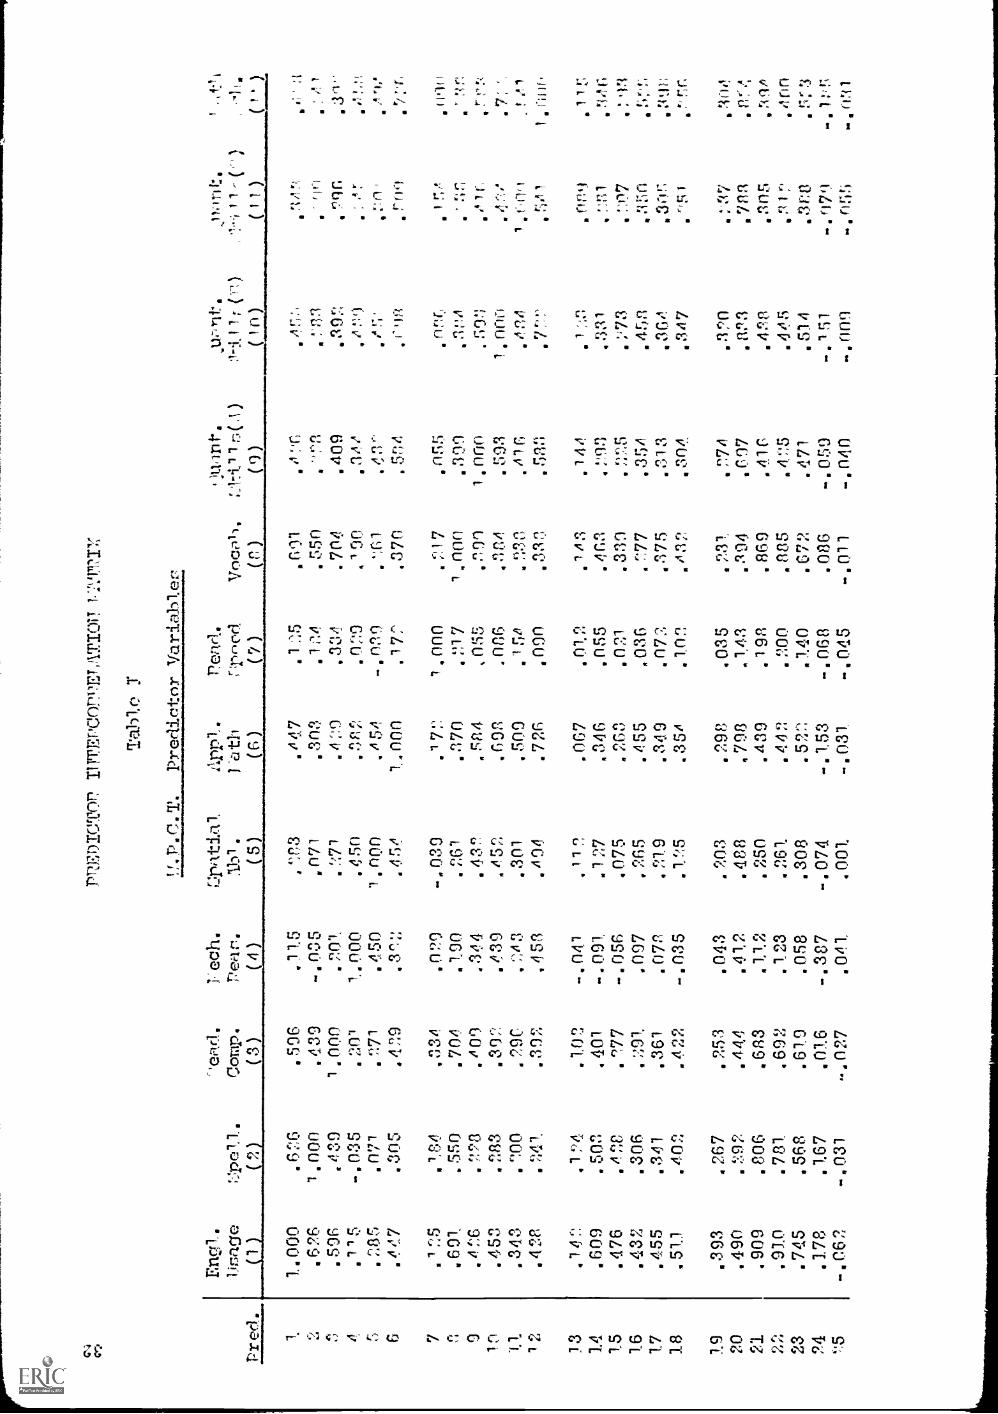
The Predictor Intercorrelation }iatrix 31
The Criterion Course Variables 36
The Criterion-Predictor Correlation Matrix 38
The Criterion Intercorrelation 'Matrix 45
Summary 51
IV. MULTIPLE REGRESSION ANALYSIS
Introduction 52
Determination of Degree of Significance Between
Y. V. C . and Tr. P. C . T. Criteria
Summary
V. DEVELOPMENT OF PERCENTILE TABLES BASED ON YAKIMAVhLLEY COLLEGE NOM GROUP
Introduction
Comparison of Y.V.C. Pero ntile Tables forMale, Female and Total Group
Comparison of Y. V. C . and U. P C T. Percentile
Tables
Summary
55
59
60
61
62
65
VI. CONCLUSIONS AND RECOMMENDATIONS
Conclusions 67
Recommendations 69
APPENDIX, A 71
APPENDIX B 89
BIBLIOGRAPHY 102

LIST OF TABLES
TABLE PAGE
I Predictor Intercorrelation Matrix (1-12) 32
I Predi%.ty4 Matrix (13-25) 33
11 Y.V.C. Criterion Predictor Matrix (1-12) 40
II Y.V.C. Criterion Predictor Matrix (13-25) 41
III Criterion Intercorrelation Matrix (26-34) 47
III Criterion Intercorrelation Matrix (35-41) 48
IV Mean, Standard Deviation and :Number for EachPredictor Variable 49
V Number, Mean, Standard Error of the }lean,Standard Deviation and Standard Error ofEstimate for Each Criterion Variable 50
VI F Ratio Table for Significant Difference BetweenIndependent Variance 57
APPENDIX A 71
VII Predictor & Criterion Code Numbers for theRegression Equations and Predictor Selection 72
Trrwmr.vlii Art AppreQ.LaL JAJJA
IX General Biology
X Introduction to Business
XI Principles of Accounting
XII Inorganic Chemistry
XIII Economic Geography
XIV Introduction to Education
XV College English
XVI Personal Health
XVII History of ?acific Northwest
XVIII College Algebra
73
74
75
76
77
78
79
80
81
82
83
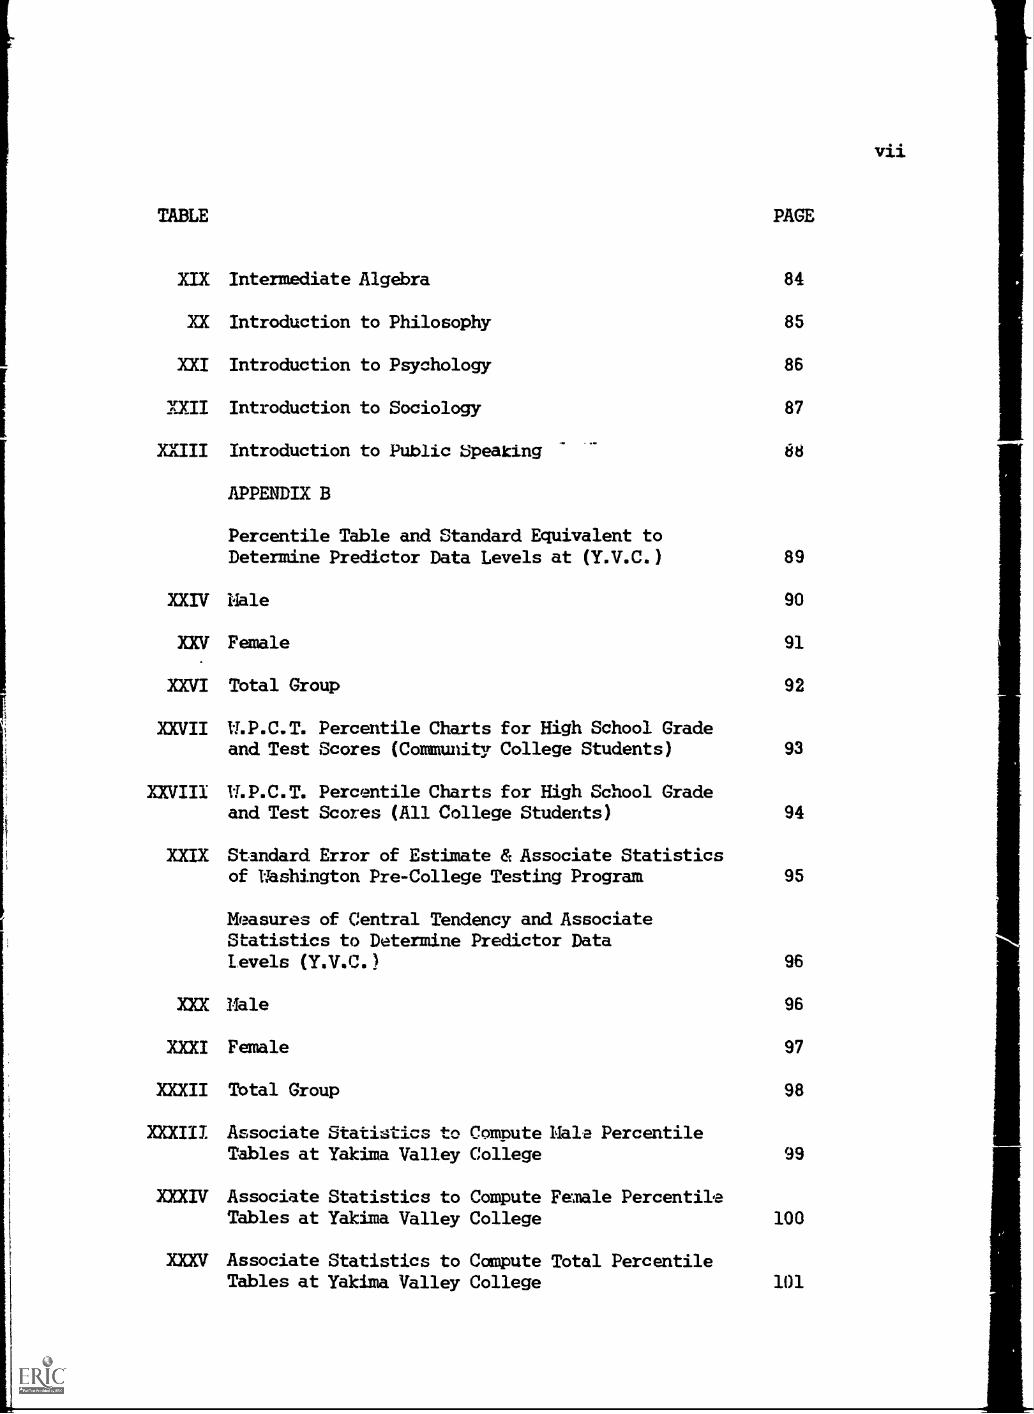
TABLE PAGE
XIX Intermediate Algebra 84
XX Introduction to Philosophy 85
XXI Introduction to Psychology 86
XXII Introduction to Sociology 87
XXIII Introduction to Public bpeating 88
APPENDIX B
Percentile Table and Standard Equivalent toDetermine Predictor Data Levels at (Y.V.C.) 89
XXIV Male 90
XXV Female 91
XXVI Total Group 92
XXVII W.P.C.T. Percentile Charts for High School Gradeand Test Scores (Community College Students) 93
XXVIII W.P.C.T. Percentile Charts for High School Gradeand Test Scores (All College Students)
XXIX Standard Error of Estimate & Associate Statisticsof Washington Pre-College Testing Program
94
95
Measures of Central Tendency and AssociateStatistics to Determine Predictor DataLevels (Y.V.C.) 96
XXX Hale 96
XXXI Female 97
XXXII Total Group 98
XXXIII Associate Statistics to Compute Male PercentileTables at Yakima Valley College 99
XXXIV Associate Statistics to Compute Female PercentileTables at Yakima Valley College
XXXV Associate Statistics to Compute Total PercentileTables at Yakima Valley College
100
101
vii

A STUDY OF THE PREDICTIVE VALIDITY OF THEWASHINGTON PRE-COLLEGE TEST FOR INTRODUCTORY COLIZSES
AT YAKITIG VALLEY COLLEGE
CRADWR
INTRODWTION
The public institutions of higher education in the State of
Washington currently utilize, in varying capacities, a state-wide
testing program, the Washington Pre-College Testing Program
(W.P.C.T.P.). An understanding of how the program developed to
its current status anc the role it plays in assisting the college-
bound student to make realistic academic decisions based on the
best empirical evidence available is germane to this paper and will
be presented in this chapter.
History and Organization Structure of the W.P.C.T.P.1
The W.P.C.T.P. is a unique and extensive state-wide testing
program in Washington. The program originated in the admissions
research work of Dr. August Dvorak and the psychometric research
work of Dr. Paul Horst at the University of Washington. Dr. Horst
1Gary A. Rice. "The Washington Pre-College Testing Program andthe Community Colleges", presentation at National A. P. G.A. Conven-
tion, Detroit, April 1968.

2
designed the theoretical model of differential prediction which
underlies the development of the program. His method proved
quite successful at the University and several other colleges
throughout the state then determined that the test results and
grade predictions were equally valid for their entering fresh-
men. The high schools also became interested in the Differential
Guidance Program and, because of the expanding interest, procedures
were instigated to develop the test battery into an instrument
which would be valid on a state-wide basis. The W.P.C.T.P. came
into being in January, 1960, as a cooperative testing effort of
the colleges and high schools within the state.
The program has grown at a very rapid rate since its inception
having tested approximately 34,000 high school seniors and college
freshmen during 1966-67 alone. However, this program despite its
size, has constantly emphasized its desire to provide only a
supplement to an effective guidance and counseling program at all
levels of secondary and higher education rather than dominate any
such program. With the full recognition of the role of the test
battery and its interpretation the colleges and high schools can
utilize one instrument and its resultant data report for multiple
uses. This would then enable each institution to avoid the necessity
of developing its own costly and burdensome testing program. Also
the great duplication of effort and variety of norm groups which
would result from such a multiplicity of individual programs could
be circumvented. Thuc the 11.P.C.T.P. can serve a variety of
functions among the colleges and universities of the state in

3
addition to its usefulness to the high school counselor.
Although the test battery originated at the University of
Washington and the normative data was derived from this population
the test scores and grade predictions proved valid and reliable at
other four-year institutions. Two dissertations have shown that
the predictions were valid at Seattle University2 and Western Wash-
ington State College3, and both authors pointed out that it was
not necessary to develop separate regression formulas for these
institutions. These and other local studies supported the conten-
tion that the battery can accurately predict at the four-year level
in Washington.
The Community Colleges and the W.P.C.T.P.
The state is witnessing tremendous growth and expansion among
the two-year community and junior colleges. In fact the community
colleges have grown more in proportional size and curriculum than
any other institution of higher education. This condition is true
not only in Washington but in most of the western states. Currently
there are twenty-two community colleges in existence in Washington,
three having opened their doors for the first time in the fall of 1967.
2Herbert Reas. "A Follow -Up Study of the Washington Pre-College
Differential Guidance Tests at Seattle University." Dissertation,University of Washington, 1962.
3James Lounsberry. "An Evaluation of the Accuracy of the Differ-ential Prediction Test Battery in Predicting Grades for Students
at Western Washington State College." Dissertation, University of
Washington, 1962.

4
These two-year colleges serve a very unique but necessary function
in education. As the amount of knowledge continues to increase
society is demanding more of education to discover and transmit
this ever-changing knowledge and produce people who are trained
to utilize their learning potential. This situation is producing
some very interesting paradoxes, however, since the increasing
complexity of knowledge requires increased time to prepare the
individual for any given profession and more rigorous requirements
must be met to gain admission to these training programs. This
latter condition, means that less people are capable of initially
qualifying for entrance but the institutions of society are
demanding more trained people and higher and higher levels of
competence for those they employ. Thus the law of supply and
demand greatly affects the programs of the universities. The
current trend seems to be for the universities to concentrate
their efforts and competent faculty at the upper division and
graduate levels and raise their entrance requirements to insure
that those who enter have a high probability of success. There-
fore the vast majority of college-bound youth are faced with
meeting very high entrance standards and having some sophisticated
learning skills. These requirements are inducing a large number
of students to enter the two-year colleges to begin their college
education with plans to transfer to a four-year school after
completion of their basic requirements. Other factors besides
the one stated above which influence the decision to attend a
community or junior college are finances, course deficiencies,
smaller class size, and more individualized counseling and

5
irstraction to acquire basic learning skills and emotional maturity.
The net result of this combination of factors is a great influx of
students at the community colleges of Washington. This surge of
enrollment accompanied with the state law requiring the community
colleges to have an open-door admissions policy produces some unique
problems. These colleges are faced with a wide continuum of ability
levels and the majority of student, are not emotionally or motiva-
tionally ready to cope with college material. Also most entering
students have been previously conditioned by a variety of social
institutions to think only in terms of an academic transfer program
and they tend to ignore or minimize the value of many available
vocational-technical programs. This observation is not made to
imply that vocational-technical programs are inferior to academic
transfer programs. The study4conducted by Drs. Clifford and
Patricia Lunneborg concluded that the current W.P.C.T, predictor
variables predict as well in the vocational-technical areas as
in the college transfer course areas. Apparently the same skills
are necessary for successful performance in both areas.
These rAnd mesny other related problems are forcing the community
colleges to develop techniques to properly place students into
programs tailored to their specific needs. Increasingly the two-
year colleges are utilizing the results and the program
itself to provide some assistance in this area. A survey of
the uses of the ii.P.C.T. by all state-supported and private
4Dr. Clifford Lunneborg and Dr. Patricia Lunneborg. "Predicting
Community College Vocational Criteria with Traditional AcademicVariables." Bureau of Testing Project No. 366-500, Universityof Nhuh' on Nar^h 1967.
6
colleges and universities was conducted in 1964 and a follow -up
was made in 1967 (Survey of W.P.C.T. uses - Rice). The results
showed that the two-year colleges were making the greatest pro-
portional use of the test results and the predominant use was for
sectioning and placement.
The fact that the test battery was originally designed for
four-year colleges and normative data was based on a highly select
population raises some serious questions about using the same data
to predict the behavior of junior college and community college stu-
dents. The assumption has to be made that the two populations are
the same before the data can be said to have equal validity for both.
The accuracy of that assumption can be questioned when referring to
the 2.5 high school grade point average as a minimum requirement
to enter the university vs. the open door policy of the community
colleges which must even allow entrance to those students finishing
high school by social promotion.
A study conducted by Batie5in 1965 involved ten community
colleges in a comparison of predicted and achieved grades in thirty-
two disciplines. A comparison of correlation coefficients with
those Stained at the University of Washington disclosed that the
William Batie. "A Study of the Achievement of Washington StateCommunity College Students Compared with Their Performance onthe Washington Pre-College Test." Study supported by the W.P.C.T.P.,January 1965.
difference between the two was .06 or less in twenty-two of the
thirty-two areas. In the remaining ten areas four correlation coef-
ficients were found to be higher for the community colleges than
for the university. Nevertheless the question of whether a signi-
ficant difference exists between the two-year colleges and the
four-year colleges and universities still persists. A related
question is whether there is a significant difference between stu-
dent populations of the Washington community and junior colleges.
Purposes of the Study
Several broad objectives were involved in the conception
and development of this project. An understanding of these goals
is necessary to appreciate the need to obtain sone tentative
answers to some of the questions which this study will explore.
First there is an acute awareness that the community colleges
in Washington are in their infancy with regard to a definition of
the role(s) and the function they are to perform. A multiplicity
of parameters are being discovered which demand consideration and
action. These include enrollment projections, budget and finance,
long-range planning, student characteristics and needs, academic
and vocational-technical offerings, etc., to cite a few examples.
Dr. John Segar5 noted that the college is forced to be sensitive
to the needs of several seemingly divergent groups: (1) The high
6Dr. John Segar. 'The Concept of Institutional Research."
Presentation at the annual meeting of Northwest Association of
Junior Colleges, Portland, December 1967.

8
schools, (2) The colleges and universities, and (3) The community
served by the college. In addition to an assessment of the effect
these groups have on the development of institutional objectives the
college needs to be aware of its impact on these groups, especially
the latter. Three questions need to be frankly asked by a college:
(1) Where are we going? (2) How are we doing? (3) Why are we
doing it? Because of the current inability to provide definitive
answers to these questions the colleges are forced to make many
arbitrary decisions and probability is thus increased that these
decisions may be wrong.
The lack of empirical knowledge to make decisions leads to
the second major purpose of the study. There is a definite need
to develop a position and program of in3titutional research at
the junior college level. Hopefully this study will demonstrate
that a program of institutional research at this level can provide
information upon which more objective decisions may be made.
The Suver7reporz has identified many problem areas of common
concern to the community colleges of Washington and indicated a
need for inter- and intra- college cooperation to attempt to locate
some solutions. The cooperative efforts of those persons at each
college who desire to combine their abilities and talents to seek
ANIIMMYININIIMIONINIMMONY
7J. Allen Silver. "Problems and Needs of Washington Community
Colleges: An Exploratory Survey of Important Research Areas."
Occasional Paper 02, Center for the Development pf Community
College Education, University of Washington, June 1967.
9
answers is one of the first priorities which must be sought.
This study is a first small step at one institution to begin
this search.
The two broad objectives cited earlier formed the basis
for this particular study since the fundamental task of any
institutional research program is to locate the institution at
its present level and develop guidelines for proceeding from
that point. Thus the first task of the college is to define
its goals in behavioral terms and then locate the data to
evaluate performance toward these goals.
As a pragmatic first step in a limited area of defining
the college in its current position this study is attempting
to take the grades students have earned in sixteen introductory
courses at Yakima Valley College and relating it to the data
provided by the W.P.C.T.P. as part of the Y.V.C. admissions
requirements. Within this context this study will address
itself to two questions: (1) How well do the test results
function to predict academic performance in the criterion areas
at Yakima Valley College and (2) Does a statistically signifi-
cant difference exist betw1en the test's ability to predict at
Y.V.C. vs. the University of Washington.
Part of the study will involve an analysis of the predictor
criterion matrix to see which variables provide the best measures
for estimating successful performance in each of the sixteen criter-
ion areas. A predictor intercorrelation matrix will also be pre-
sented as will a criterion intercorrelation matrix.

10
A second phase of the study will involve the calculation and
presentation of a regression equation expressed in standard score
(Beta) and raw score (b) form for each criterion area. In addition,
the corrected multiple coefficient of correlation, corrected
multiple coefficient of determination and percentage of variance
contributed by each variable in each criterion area will be computed.
If the data lends itself to the proper conditions and assump-
tions an atterirt will be made to determine if a statistically signi-
ficant difference exists between the data reported by the Er.P.C.T.P.
as part of its current processing procedure and the data obtained
by the study. If the difference is not found to be significantly
different then there is reason to use those equations already
designed by the program and based on a large number of cases to
enhance their predictive accuracy. If, however, there is a
statistically significant difference and the sample size is large
enough to infer reliability then consideration could be given to
develop separate equations based on a Yakima Valley College popu-
lation.
The third phase of the study will consist of the development
of percentile tables in standard score form for male, female, and
total group based on a Yakima Valley Collega norm group. A compari-
son will also be made between the percentile tables generated by the
data of this study and the percentile tables for all college students
and community college students which appear in the 1967-68 W.P.C.T.P.
Student Instruction Booklet.

Sources of Data and Methods of Research
After a delineation of the purpose for the study and the
definition of study parameters, the next task was to decide what
data would, be needed and what statistics should be computed.
The first determination was the selection of criterion areas
to be included. The decision was made to limit the criterion areas
to the introductory courses with the exceptions of both Intermediate
and College Algebra and Introduction to Business and Principles of
Accounting. These exceptions were included because the number of
students involved in each area was sufficient to attach some degree
of significance to the findings, and one course was not a prerequisite
for entering the other.
It was finally decided to include sixteen introductory courses
which were drawn from each of the seven college transfer or academic
curriculum divisions: Business Administration, Creative Arts, Lan-
guage and Literature, Natural Sciences, Physical Education, Physical
Sciences, and Social Sciences. In addition to selecting criterion
areas from each academic division, the particular courses which were
chosen were selected on the basis of greatest enrollment to help
insure greater reliability and validity in the statistics. The
sixteen criterion areas chosen were: Art Appreciation, General
Biology, Introduction to Business, Principles of Accounting, Inorganic
Chemistry, Economic Geograp.iy, Introduction to Education, College
English, Personal Health, History of the Pacific Northwest, Inter-
mediate Algebra, College Algebra, Introduction to Philosophy, Intro-
duction to Psychology, Introduction to Sociology, and Introduction
to Public Speaking.

The study was designed to include all students at Yakima
Valley College who had taken one or more of the sixteen intro-
ductory courses during either Fall, Winter or Spring Quarter of
the 1966-67 school year. It was recognized that many students
would be involved in each quarter as long as they were enrolled
in one of the criterion areas. For this reason the original design
required a separation by quarter to see how large this factor might
be. However, after the data was separated in this manner it was
noted that the number of cases was so small as to make any derived
statistics meaningless so the decision was made to combine the
three quarters to obtain more valid data.
After the decisionscited above were reached the W.P.C.T.P.
was contacted about the possibility of assistance in computing
the requested statistics and supplying technical advice. The
questions were referred to the Er.P.C.T. Research Committee and a
research proposal was prepared and submitted to them. This body
met to act on the proposal and generously grante. an allocation
of funds in the amount: of $760.00 to pay for the cost of computer
time and preparation of data. In addition, Dr. Thomas Langen,
Renny Green mum and the other 'members of the program extended
an offer to assist with the many technical aspects of the study.
After the assistance of the W.P.C.T.P. was secured the next
step was to determine the actual form the data should be in before
submission for computation, Since the W.P.C.T.P. central office
had a master file of every individual who had taken the test from
the program's inception it was necessary and advisable to prepare the
X.Y.C. criterion cards to coincide with their data format. The card
would not have to contain each of the test scores and high school
grade averages since this information was already available on data
cards at the central office. The only information necessary would
be the student's 144P.C.T.identification number so the computer could
draw and merge the data from storage. Therefore, seven columns on
each criterion card were allocated for this identification number.
A small computer program was written at Y.V.C. to extract
the data for any student who had taken awn of the criterion courses
during fall, winter or spring quarter of 1966-67 and also indicate
the grade the student earned.
The following data was then entered on the criterion card in a
format designed to be compatible with the Mr.P.C.T. master card layout:
Quarter code, W.P.C.T. student identification number, sex, Yakima
Valley College student identification number and first name, middle
initial, and last name. If the student enrolled and completed one
or more of the sixteen criterion courses during any one or more of
the quarters included in the study,. the earned grade was implanted
in a designated column. The grade was coded in the following manner
(A-4, B-3, C-2, D-1, F, WF, AUF-0). Non-graded withdrawals and
audits were not included since they did not influence the student's
college grade point average. However, grades earned in repeat
courses were included since they did enter into the final g.p.a.
calculation.

14
The specially designed criterion data cards were submitted to
the Ii.P.C.T.P. central office with the request that the following
calculations be performed and/or information provided:
1. A predictor intercorrelation matrix.
2. A predictor-criterion correlation matrix.
3 A criterion intercorrelation matrix.
4. The mean, standard deviation, and number of students
involved for each predictor and criterion variable.
5. A coefficient of multiple correlation (corrected),
and coefficient of multiple determination between
the predictor variables and each criterion course.
6. The regression weights in stauslard score form (Beta
weights) and raw score form (b weights) and thepercentage of variance accounted for by each variable
in the regression equation for each criterion area.
7. The generation of Yakima. Valley College percentile
norms in standard rcore form for male, female and
built into their computer program such as cumulative frequency, cumula-
requested and even supplied additional data which they had previously
and skewness. The data was returned to Yakima Valley College for
interpretation and this paper represents an analysis of the findings.
tive percentage, mean, median, mode, range, semi- inteiquartile range
The If.P.C.T.P. promptly performed all of the calculations
confidence Yakima Valley College can place in the
test scores now provided by the program.
total population.
8. If the data meets the conditions necessary for its
computation, tests for the existence of a statis-
tically significant difference between the Beta
weight values computed for this study and their
counterparts now generated by she
Hopefully this will indicate the degree of

15
Summary
Surveys and rotor l comunication among personnel at the
junior college level indicated that the Washington Pre-College Test
was being utilized in a variety of ways but the haunting question
confronting all users was whether the results were really applicable
to a junior college population. This situation resulted from the
fact that the program utilized a norm group drawn primarily from
the University of Washington.
In all fairness to the program, however, it should be noted that
they have becceLe cognizant of the expanding two-year colleges and
the ramifications of their existance and function and have taken
steps to incorporate data from these community and junior colleges.
Such steps include the development of prediction equations in seven
vocational-technical areas and the plan to expand their predictions
to more areas once data is available, development of two-year college
percentile tables based on data supplied by six community colleges in
the state, several other ILP.C.T.P. sponsored and conducted projects
of interest to the two-year colleges currently under way, and their
encouragement of individual college projects to promote an interest
in utilizing research methods to seek answers.
This paper thus represents an attempt to accomplish a three-
fold purpose: (1) to determine the predictive validity of the
W.P.C.T. for introductory courses at Yakima Valley College,
(2) demonstrate the potential of and need for a coordinated program
ur institutional research at Y.V.C., and (3) assist the W.P.C.T.P.
to gather more information about the junior college student.
RELATED RESEARCH
CHAPTER II
As stated earlier in Chapter I, the community colleges of
Washington as well as other parts of the United States are just
beginning to be recognized as unique but vital institutions of
higher education. Because of this fact they are growing at a
tremendous rate bvit, in many cases, this growth has not neces-
sarily been anticipated and thoroughly planned. There are
several reasons for the apparent lack of foresight. One is
that the colleges have not had tangible guidelines upon which
to base their programs. A second very important reason is the
lack of an organized and systematic attempt to locate the insti-
tution at its present state and define its areas of expansion and
development. The community colleges are just now beginning to
ask some penetrating questions which require some answers and
this necessitates setting up some formal procedures to seek
data and provide same tentative solutions. This has not been
done in any organized way to date resulting in a paucity of
surveys and research projects devoted to the community college
problems. To cite a specific example of a deficit area, organized
research to ascertain ways of predicting student behavior so that
student abilities and needs could be identified is sadly lacking.
A related concern is the problem of proper placement of a student
into a course or program tailored to fit his needs. Even acknowledg-
ing the lack of available information, however, it is necessary to

17
search the literature to locate relevant studies and information con-
cerning predictability of community college student potential which
will provide a reference point for the findings of this project.
Reference has already been made to a community college study
by William Batie1. The results of the study disclosed that a corre-
lation coefficient difference of .06 or less between predicted and
achieved grades existed for twenty-two of thirty-two course areas and
four of the remaining ten areas actually had higher correlation coeffic-
ients for the community colleges than for the University of Washington.
These results certainly would not be anticipated on an a priori basis.
Drs. Clifford and Patricia Lunneborg conducted a recent study2,
also referred to earlier, and concluded that the current predictors of
the W.P.C.T. test battery predict success in the vocational-technical
areas of the junior colleges almost as well as they predict college
transfer course areas.
Batie. "A Study of the Achievement of Washington State
Community College Students Compared with Their Performance on the
Washington Pre-College Teat." Study supported by the W.P.C.T.P.,
January 1965.
2Dr. Clifford Lunneborg and Dr. Patricia Lunneborg. "Predicting
Ccomunity College Vocational Criteria with Traditional Academic
Variables." Bureau of Testing Project No. 366-500, University of
Washington, liarch 1967.

In an unpublished study submitted to the W.P.C.T.P. central
office, Gary Rice3obtained a correlation coefficient of .79 between
predicted and obtained grades in introductory poychology. The
study involved the total population of students (300) enrolled in
Introductory Psychology during the Fall Quarter 1965-66 at Yakima
Valley College.
Drs. Clifford and Patricia Lunneborg began two studies
related to the community colleges in April 1967, under the sponsor-
ship of the W.P.C.T.P. The first one4 was designed to develop
community college percentile tables for males, females, and a total
sample of students who entered Clark, Everett, High line, Lower
Columbia, Skagit Valley and Yakima Valley Colleges, between 1963 and
1965. The total sample numbered 8,900, with 5,600 males and 3,330
females. The percentile table for the total sample has now been
included in the 1967-68 W.P.C.T.P. Student Instruction Booklet: for
distribution to high school seniors and college freshmen through-
3Garir A. Rice. "Predicted vs. Obtained Grades in Introductory
Psychology at Yakima Valley College." Yakima Valley College,
Associate Director of Institutional Research and Testing, Yakima
Valley College.
4Dr. Clifford Lunneborg and Dr. Patricia Lunneborg. "Coimiunity
College Norms 1963-65 for the Washington Pre-College (W.P.C.)
Teat Battery and High School Grades." Bureau of Testing Project
No. 366-520, Universil,:y of *Washington, April 1967.

19
out the state. This table will be referred to in Chapter V of this
report and a copy of it may be seen in Appendix B.
The second studys grew out of the recognition by the W.P.C.T.P.
central office that the growing enrollments and utilization of the
test results by the two-year colleges necessitated an expansion of
the general academic guidance battery so it would be functional for
the comaamity colleges. This study was part of the program's con-
tinuing evaluation of the predictor variables currently in use and
the testing of experimental variables to determine the kind and
amount of unique contribution they make toward differential predic-
tion. It was determined from data gathered to the date of this
study that two enployment aptitude tests, G.A.T.B. tool and form
matching, were unique enough and contributed enough new variance to
the established battery to warrant the accumulation of additional
criterion data. This data is currently being gathered.
The problems of testing and prediction in the community
colleges are not novel or unique to Washington. Other states are
also facing these questions and searching for answers.
sDrs. Clifford and Patricia Lunneborg. "Uniqueness of Selected
Employment Aptitude Tests to a General Academic Guidance Battery."
Bureau of Testing Project No. 366-590, University of Washington,April 1967.

An evaluation and advisory service field studies report 14119
prepared by Dean Seibel6and published by Educational Testing Service.
The study was based on a selected sample of sixty-three public and
private junior colleges in eighteen states. The findings disclosed
that the needs that seemed of most concern to public iunior colleges
were needs for differential guidance tests, subject-matter achievement
tests, more research on tests, in-service measurement training for
faculty, and the need to make test results more useful. The report
concluded:
It seems evident that standardized tests are widely
and extensively used in both public and independent
junior colleges. Although the colleges experience some
problems in using the tests and are somewhat critical
of them, it seems reasonable to conclude that standard-
ized tests are meeting many of the junior college
evaluation needs. Generally, the tests are used success-
fully in admission, guidance, placement and, to some
extent, research. They are used most intensively during
an initial period extending through the first semesterand very little thereafter.
But, apparently the situation is far from satisfactory.
Aside from the problems such as lack of appropriate
norms, difficulty in locating or selecting appropriate
tests, and inadequate use of test information, thejunior colleges feel that there is need for new kinds
of tests and for tests to meet new kinds of measure-
ment objectives.
6Dean Seibel. "Testing Practices and Problems in Jimior Colleges- -
A Survey." Field Studies Report FSR-2, Educational Testing Service,
Princeton, New Jersey, September 1966.
1
20
21
This awareness of the need to define the problem areas of
common concern to the community colleges and the corollary of
developing new techniques7to approach these problems is a very
real concern to the two-year institutions. The junior colleges
of California have produced a document which attempts to identify
problem areas and the State of Washington has completed the same
type of survey in the Suver8report which defined some thirty-
eight areas where community colleges sought information. These
thirty-eight areaa could be combined into three large categories
of need: long-range planning, student needs, and faculty concerns,
Much more research is needed in all of these areas and the community
colleges are just now beginning to embark upon some projects which
will shed some light on these ill-defined questions.
7John E. Dobbin and William U. Turnbull. "The Need for New
Appraisal Techniques in Junior Colleges." Reprint from JuniorCollege Student Personnel Programs (A Report to Carnegie Corp-oration), American Association of Junior Colleges, 14shington,
D. C., November 1965.
8J. Allen Suver. "Problems and Needs of Washington Community
Colleges: An Exploratory Survey of Important Research Areas."Occasional Paper #2, Center for the Development of CommunityCollege Education, University of Uhshington, June 1967.

22
One particularly pressing need for the community colleges
is knowledge of student characteristics at each institution.
Unless the college has some awareness of the population with which
it is dealing it is meaningless to attempt to predict what behavior
could be expected. The State Office of Public Instruction (Allan W.
Eetcalf and Ray E. Jongeward)9prepared a statewide composite of
community college student characteristics. Approximately three-
fourths of the two thousand students included in the study were
"Academic Students" i.e., their enrollments were predominantly in
academic transfer courses. The remaining number were enrolled in
approved vocational courses with the exception of 48 enrollees in
courses considered as "Adult Education" or "Community Service". The
median age of full-time students was 19.5 for males and 19.0 for fe-
males. The median age for part-time students was 25 5 for males and
31.9 for ferries. The vast majority of students were legal residents
of the state.
In general the enrollment patterns show that some-
what over half ... enrollees are full-time "Academic
Students". As one might expect, "Vocational Students"tend to be older and more likely to attend on a part-time basis. The proportion of women tends to be greater
9Louis Bruno, "Community College Student Characteristics."
Research Report 01-05, Office of State Superintendent of Public
Instruction, Olympia, April 1965.
23
in the part-time and the vocational programs as well as
in the higher age groups. The young, recent high school
graduates tend to be in academic programs with declared
intent to attend four-year colleges in the future.
This composite superficially appears to describe the gross
characteristics of Yakima Valley College students. However, the
fact that it does raises some pressing questions; the majority
of high school students entering Y.V.C. state their intention
to transfer but the feedback from the four-year institutions
disclose that only a small percentage actually reach the upper
division level. The question then arises as to the fate of the
vast majority who just seem to disappear. Besides the necessity
for a follow-up of these people it may be possible to assist this
undefined majority to a greater degree if they can be identified
and initially directed to programs where their probability for
success is greater.
The desire to know the academic potential and actual perform-
ance of junior college students is so great that it has prompted
the national testing programs to commit their staff and facilities
to this endeavor. Dean Seibel, Director of the Evaluation and
Advisory Service for Educational Testing Service10
published a
field studies report on the academic ability and performance of
10Dean Seibel. "A Study of the Academic Ability and Performance
of Junior College Students." Field Studies Report--FSR-1,educational Testing Service, Princeton, New Jersey, October 1965.

24
junior college students. This report was part of a large research
project supported by the College Entrance Examination Board. The
study involved a selected sample of nearly 10,000 seniors in 147
high schools who took the College Board Preliminary Scholastic
Aptitude test in the fall of 1960. A sub - sample of about 2,500
seniors was followed through the first year after graduation from
high school. The students in the sub-sample who enrolled in college
went to 439 different four-year colleges and 67 different two-year
colleges. The findings indicated that the proportion of students
completing the fr<shman year in good standing is smaller among
junior colleges (61 per cent) than among students enrolled in four-
year institutions (78 per cent). The proportion of students dis-
missed for academic reasons is approximately the same for the two
levels but the proportion on probation is nearly twice as great for
junior college freshmen. The author felt this indicated that although
the junior college must take punitive academic measures against a
higher proportion of students they tend to be less severe in these
measures and more disposed to give students a "second chance".
The ability measures indicated that the level of seniors who
enrolled in junior colleges was above that of students who did not
attend college, but at about the same level as the total group of
high school seniors. Seniors who were successful at the first year
of junior colleges were, in general, of considerably higher 4bility
than those who experienced academic difficulty. Finally th, average
ability level of seniors who enrolled in four-year colleges wls
higher than the level of junior college students.
25
The American College Testing Frogram has also devoted a
great deal of money and effort to conduct research aimed at the
junior colleges. In fact, three of the A.C.T. Research Reports
by Richards, Jr., Rand and Rand,11
Richards, Jr. , Rand and Rand,12
and Hoyt and Efunday13
were devoted to a description of the junior
colleges.
The first A.C.T. study was a description of 581 accredited
two-year colleges. The thirty-si:: variables included in the
study were selected on the basis of current use in characterizing
institutions. After a thorough comparison of all the variables
the overall finding disclosed that junior colleges are different
from four-year colleges and it would not be appropriate to apply
a classification scheme developed for one type of college to the
other type.
The Richards, Jr., Rand and Rand report attempted to examine
the geographical distribution of various junior college character-
istics to determine if regional differences existed. This study
11James P. Richards, Jr., Lorraine IL Rand, and Leonard P. Rand.
"A Description of Junior Colleges." A.C.T. Research Report No. 5,American College Testing Program, July 1965.
12James P. Richards, Jr., LeoLard P. Rand, and Lorraine M. Rand.
"Regional Differences in Junior Colleges." A.C.T. Research ReportNo. 9, American College Testing Program, December 1955.
13Donald P. Evt and Leo Munday. "Academic Description and Pre-
diction in Junior Colleges." A.C.T. Research Report No. 10,American College Testing Program. February 1966.

26
was the result of the previous research project which had factor
analyzed the original 36 variables into 6 categories; Cultural
Affluence, Technological Specialization, Size, Age, Transfer Emphasis,
and Business Orientation. The firings emphasized that stratified
random sampling frcm each region of the country is necessary before
statements about regional differences can be made. However, the
results may provide clues to needs of students or of society that
are not being net by existing junior colleges in any given region
of the country.
The Hoyt and Runday report cited here had approximately the
same purpose as the study produced by Seibel10:
the academic
description and prediction of academic ability and performance in
junior colleges. The A.C.T. data from 85 junior colleges was
compared with those for 205 four-year colleges. These junior college
students, like the Seibel students, were found to be somewhat less
able academically than their peers in four-year colleges. However,
differwIces among junior colleges in academic potential were so
great that the least able students in one junior college would be
well above average in another.
The study also concluded that students within individual
junior colleges had more diverse academic talents than was typical
of students in four-year institutions. However, grade point average
in both junior colleges and four-year colleges were quite similar
(about a "C").
There must be other published and unpublished research studies
27
devoted to the community and junior colleges but it is felt that
the sources cited previously should demonstrate the need for
studies such as this one at the Yakima Valley College. However,
for the interested reader there are related project abstracts on
file in the Educational Retreival Information Center (E.R.I.C.)
at U.C.L.A. by Mall14
, Young15
Jost16
, Wilson and Gelso
IRNielson- , and Morgenfeld19.
14Lincoln H. Hall. "Performances of Average Students in a
Junior College and in Four-Year Institutions." California
Bureau of Pupil Services, Sacramento, E,R.I.C. No. JC670-820.
15Edwin P. Young. "Interrelationships Between Selected Psycho-
logical and Academic Measures in an Experimental Program for
"Low Ability Students". Los Angeles City College, E.R.I.C.
No. JC660-047.
16Erwin Jost. "High Verbal Aptitude and Grade Achievement,
A Study of the Grade Achievement of 200 First-Semester College
of San Mateo Freshmen Who Ranked High in Verbal Aptitude as
Measured by the School and College Ability Tests and Cooperative
English Tests." College of San Mateo, E.R.I.C. No. 2C660-083.
17Ray Wilson and Charles J. Gelso. "The Prediction of Grades
in College Algebra--A. Continuation and Extension. "South
George College, Douglas, E.R.I.C. No. JC670-436.
18Marjorie L. Nielson. Supplemental Guidance Manual Based
on Institutional Research." Everett Junior College, Washington
E.R.I.C. No. JC670-407.
19George R. Morgenfeld. "The Prediction of Junior College
Achievement from Adjusted Secondary School Grade Averages."
Arizona University, Tucson, E.R.I.C. No. JC670-890.
PRE RELATIONSHIP BEVEEN TIM PREDICTORAUD CRITERION VARIABLES
Chapter III
INTRODUCTION
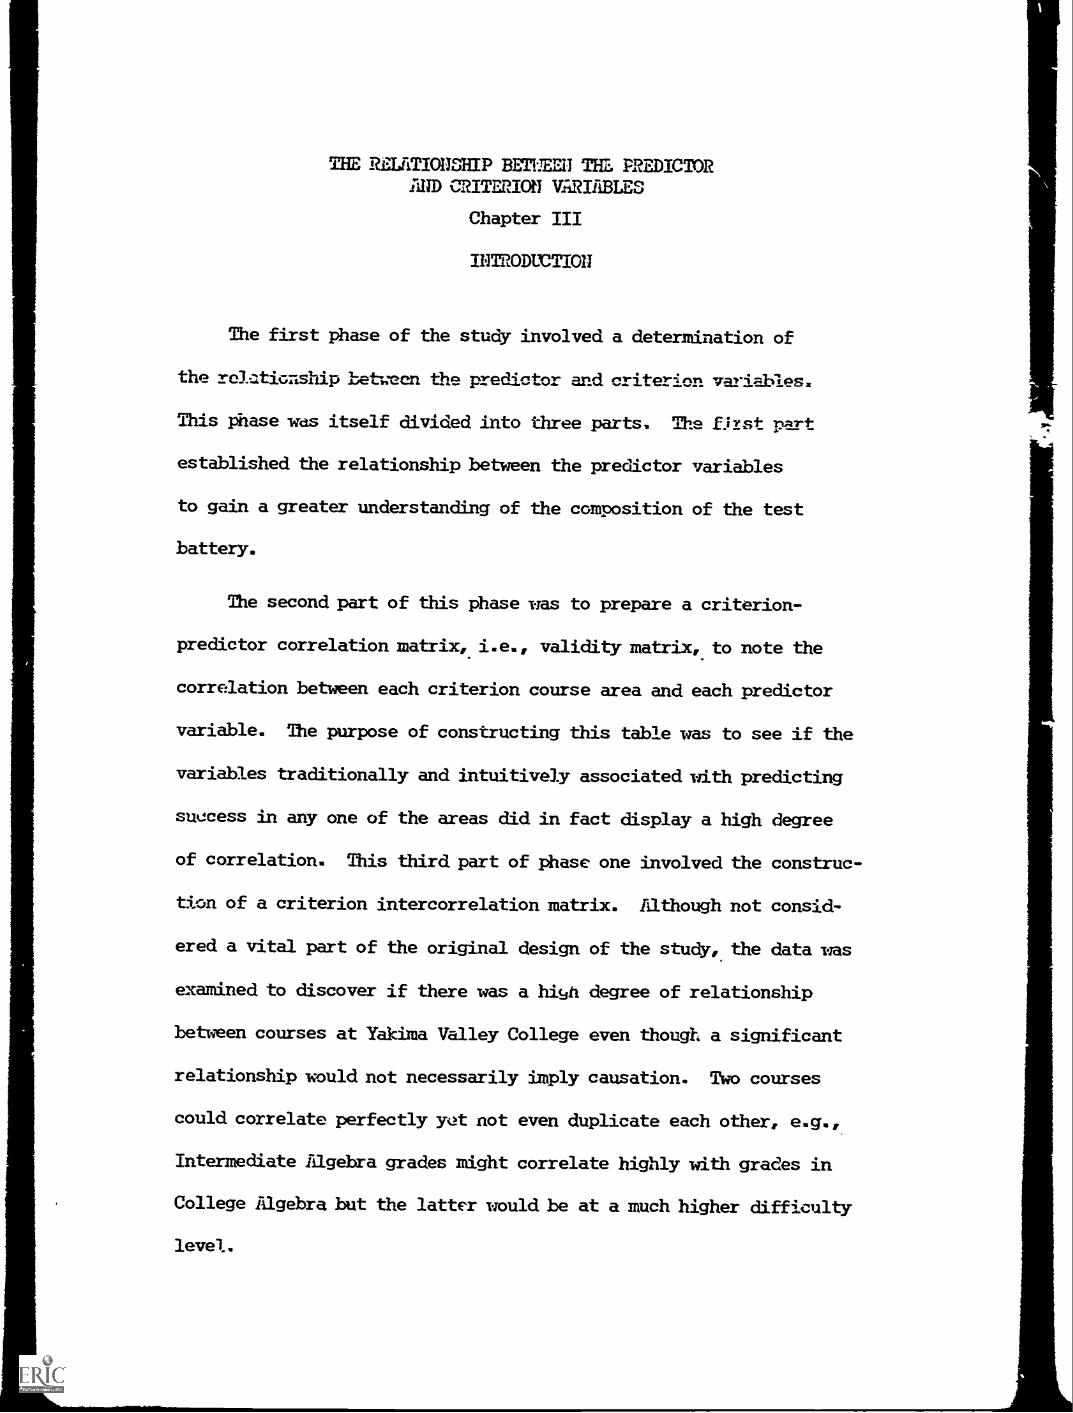
The first phase of the study involved a determination of
the rolatiGnship Let.3-con the predictor and criterion variables.
This phase was itself divided into three perts. The first part
established the relationship between the predictor variables
to gain a greater understanding of the composition of the test
battery.
The second part of this phase was to prepare a criterion-
predictor correlation matrix, i.e., validity matrix, to note the
correlation between each criterion course area and each predictor
variable. The purpose of constructing this table was to see if the
variables traditionally and intuitively associated with predicting
success in any one of the areas did in fact display a high degree
of correlation. This third part of phase one involved the construc-
tion of a criterion intercorrelation matrix. Although not consid-
ered a vital part of the original design of the study, the data was
examined to discover if there was a hiWi degree of relationship
between courses at Yakima Valley College even though a significant
relationship mould not necessarily imply causation. Two courses
could correlate perfectly y.lt not even duplicate each other, e.g.,
Intermediate Algebra grades might correlate highly with grades in
College Algebra but the latter would be at a much higher difficulty
level.

29
The Predictor Variables'
The test battery itself is currently composed of nine subtests
which require approximately 5.?: to 6 bouts to administer. This battery
was prepared to Er.P.C.T.P. specifications by the Educational Testing
ervice and is not available zorrc.rciallv.
The nine subtests of the 1-I.P.C.T. battery are: (1) Vocabulary,
a test of antonyms; (2) English Ufage, the use of grammar, punctua-
tion, word choice, and capitalization; (3) Snelling, the selection
of one mispelled word from a group of five words; (4) Reading, a
test of both speed and comprehension, (scores are reported for both on
the data rePort); (5) Quantitative Skills; (6) implied Mathematics,
the application of arithmetic and elementary algebra to simple practi-
cal problems; (7) Mathematics Achieveident, an hour test of general
mathematics, algebra and geometry; (8) Spatial Ability; and
(9) Mechanical Reasoning. The test on quantitative skills includes
three types of items: items of data sufficiency, items requiring
the examinee to determine the relative size of two given quantities,
and items in which the examinee determines the relationship among two,
three, or four variables when given four sets of data for the variables.
In addition to the above subtests which produce ten scores on the data
report there are also three composite scores: (1) English Composite,
a weighted average of the English usage, spelling and vocabulary
subtests; (2) Verbal Composite, L. weighted average of the Vocabulary,
1Dr. William Kline. "The Washington Pre-College Testing Program."
Paper presented at National Council on Measurement in Education
Conference, Chicago, February 1965.

30
English Usage, SPelling, and Reading Comprehension subtests; and
(3) Quantitative Composite, a weighted average of each part of the
quantitative skills subtest, applied mathematics, and mathematics
achievement. All scores, including the three composite scores, are
in standard score form with mean of 50 and a standard deviation of
10.. The program has selected the subtests cited above by a method
of predictor selection. ti large number of variables are initially
included but only those that possess high correlation with the
criterion and low relationship with the other predictors are
retained for prediction. In this way the test battery has been
developed which contains and maintains predictors measuring as many
different elements relating to college success as possible yet is
reasonable in terms of administration time, economy of cost, and
flexibility for multiple uses. The Er.P.C.T.P. is continuing to
gather data and experiment with other variables to determine their
contribution to the battery. If the new variables add significantly
to the test's predictability they will be considered for inclusion.
Thus the IT.P.C.11.P. is constantly looking for ways to improve the
instrument they have.
The student's performance on the test is statistically combined
with his high school cumulative performance in six areas and overall
performance as of the end of his junior year The six major high
school areas include: (1) English, (2) Foreign Language, (3) Mathema-
tics, (4) Natural Sciences, (5) Social Sciences, and (6) Electives.
The average grade of six semesters' work in each area is expressed as
a grade point average. In addition to the high school averages and
test scores the student's age and sex are also included as predictor
variables. This study also asked that the calculations include the
all-university prediction as a predictor variable although it was
recognized that the score was statistically derived from the other
predictor variables: For a more complete description of each xe-
dictor variable the reader is referred to the U.P.C.T. Counselors
Manual2which is published annually by the program for use by the
high school counselors and college student advisors.
The Predictor Intercorrelation Matrix
Before considering Table I the reader's attention is directed
to Table IV which presents the mean, standard deviation, and number
for each predictor variable.
Table I shows the relationship between the predictor variables.
As indicated earlier this will show the correlation among the predictor
variables and give the reader an overall idea of the make-up of the
entire battery.
A logical question which is raised when evaluating Table I is:
"Mat is considered a high or low correlation coefficient?" An
answer to this question would have to be that each coefficient is
21rashington Pre-College Testing Program. Counselor's Manual, 1967-68.
Pr
ed.
1.is
age
(1)
( 2
)C
orap
,(3
)
ech.
.
('1)
1 (;) 3
1.00
0.6
76 SO
S
.11
r.28
5.4
47
.6'2
61,
non
.430
-.03
5n7
1.3
05
.506
,439
1.00
0.
2,n1
'271
.4,1
9
.11.
5-.
035
.70
1.1.
.000
.450 3%
7.1
".':
5.1
.84
,(1
20.6
01.
.550
7 0
4.1
900
.4`:
6
.4,5
7.3
433.
1 0
.302 29
0
.344
.430
;';/1
12.4
28:8
41:
408
IC1
.307
,45
3
13.1
4n,
1 f-
,11
.1.0
2-.
no
1.4
.609
.503
.401
-.09
1.15
.476
.428
277
-.05
616
.432
.306
.:9
1..09
71,
7.4
55.3
41.3
61.0
7818
.511
.40P
..4
22-.
035
.393
.76
725
3.0
4320
.490
.444
.41,
221
.909
.806
.683
r.
.910
,781
.60
223
23.7
45.5
68.6
1.0
.058
.178
.1.6
7.0
16-.
387
-.06
7-.
031
-.02
7.0
41
Pr!
EnT
Cr.
CO
T?
1.:"
."1"
.917
/:
P .C
. T.
(5)
,IT
,3,
071
271
.45
01.
000
.45
4
-.03
076
1
6."4
,7,
.301 A04
011
..,
.127
.075
.20
5.
21.9
1,25
.20
3.48
8.
250
.flo
i..30
8-.
074
.00
1.
Itc-1
:111
(,)
3'
Pre
dict
or V
aria
bler
,
:1",
-t1
1 r.
,(t )
(`1)
yur
it
(1
)
1101
11: I
1 -
(1
)
-11
()
AP
P1.
1 -c
Dtli
(6)
nprlo
ci,
(7)
(7)
.A
4.7
.803
.4 :(
3.f)
8`'
A v
1,40
00
2'51
:704
:
.003
,50
0.7
26
,007
.346
.20
7.4
55.3
49.3
54
.2,9
8.7
98.4
39.4
4n.5
2'2
-.15
3-
.031
,
.1 :'
,5,i
ist4
.334
.0:
-:0
...r1
20.1
T'''
1. n
no.
217
n55
.080 r
,000
.(0
.2.0
55n2
-1
.036
.n72
,.1
02
.035
14.3
.192
.70
0.1
.40
-.06
8-.
045
.ro
Yi
.55r
).7
(14
1on
.tfi
i.3
70
),n0
0.3
01,33
4.
233
1 A
"a
.1
.407
.339
,n7
7.3
75.
An
2
231.
,404
.869
.785
.072
.086
-.01
1
,',1
1
.409
.5r1
,4
ns5'
sin:
307)
593
,41
r,
.5n8
,144
,:9
:1,
%!:
,5
.354
,313
.304
,
.007
.410
.471
-.05
0-
n40
,A
, r,:
SO
7,,.
()
01A
0,3
non
.0,7
4
3:11
.
492
.304
.347
.120 72
3.4
PS.4
45 514
- .1
91 rill0
`; r.
r "
..t,
/04
1i
,4
,1
1.,1
1'
r
,.,]
07
3or,
.'is
,
:';47
.783
Snr
.3P
8
nr;
,
31"
,!.
.,"
4,1
.7:
tlA M '3
2
.31r
,
.1n4
,co
3
()N
I

CO
3.
'11:
0IC
TO
" T
IITE
I.'C
or.n
.r;!1
',;91
1:(:
)1, I
'1
Arr
ir17-
Mble T - Continuod
Pre
d.
Uiu
hComporato :1,17cro.ge:1
(17)
(1.8
)oct.
(19)
Wrt.
( 20 )
.0
V r
f
(13)
Sn(71.
(14)
(15)
rrt th
(16)
Vorho1
y's ("
n)'!;
1.1.42
.609
.476
.4n,:!
.455
,511
.303
.400
90'1
.91n
.746
17:"
r, ti
.1 t4.
.50
3.42.8
.nor,
.341
.402
.267
e,ne
,-,
.,90
6.7
n,.
.1C7
3.10
.401
."77
291
.n61.
.42"
.253
.A.44
.nsn
.nr
in.611
.ron
It 5-.041
.1 1 2
-.091 !17
- . 056
.075
,007
.265
.078
."19
-.035
.1 "5
.043
.?01
.41.
2..1
s8.1
1?1?
."T,1
orol
6.067
.146
-6n
.455
.n49
354
.!7 98
7(42
7.0 u-
.055
.021
.030
.n7','!
.1 fr
.nn,
.1ii,
.19P
.".ft
il-1
/in.,1
11,1
..143
.463
.nng
.?77
.375
.4n"
,...
,,fr
.n14
.flC9
.11
r 17
'.
'':.
t"
9.144
"93
oor
.135
4.3
1_.1
f301
1."
7(4
.607
Aic
.4! :
,.4
7r...
11rH
10
.1
nn33
1,.*
:,73
.458
.364
.347
3('0
01.1
3.4:In
.44!)
.610
-. 15,1
11.
.089
.281
,.2
07.350
.305
.251
..,13
7.7
spsi
r,.R
1-.2
_(07
,.1
15
1.00
0
.346
.261
.293
.').3:3
.525
.266
,,:',9
8
.195
356
,`;10
.304
.184
.1-Y
-:4
.146
,R,14
.161
'inn
t.
r.- ,I,,
r,
.'
,,
.:,1
"R
.1r!
'rvI7
1A
"61
T.000
.660
.613
.659
.777
551
.379
.n10
1' fl
.-;
.ri
' I'' ,
%
15
.23S
.660
1. 000
.591
55n
.570
.4:1R
.915
.470
./7A
.7m
174
16
.61n
.591
1.000
.571
.570
.455
,Sol
,n
OP
Ji1)
47n1
.n.rin
17
.195
.659
.555
571
1..000
.656
.492
.406
.459
.,151
,.778
.1174
18
219
.777
.570
570
.656
1.no
n.5
17.17P
.524
,r,
.plA
.1 ;' 4
19
.1R
4.5
51.4
-,,3
.455
.492
.517
1.nn
0.3
45,3
51:4
Ft
.r
Fin
0q,-
-)21
1.1
A6
.379
.295
.501
.406
.378
.`45
1.000
.461
A.r
in.Sri,
.114
21.1
63.6
10.4
79.3
98.4
59.5
24.3
51.461
1.000
.90
1,.7
75.1
7!'
.151
.605
.474
.394
.455
.522
.348
.470
.99'
1.1.
001'
1.7
74.1
5r,
23.2
68.8
49.7
03.7
01.
.778
.814
.66n
.566
.775
.774
1.nn
n.n
5.3
47.2
44.1
74.0
90.0
74.1
.34
.099
- .114
.17
3.1
56.
:1 !I
1. f
11-1
1.1
-.03
1-.
109
-.06
3-.
047
-.11
98-.
102
-.08
8-.
044
-.04
6-.
Ns
.nnn
.nr
li
lM; L )

34
relative to the variable under consideration. For example, the
correlation of .726 between (Applied Mathematics) and (Mathematics
Achievement) is quite high but it is not possible to conclude a
cause-effect relationship between the two subtests. The same inter-
pretation of implied causation holds for the correlation coefficient
between English Usage and Spelling.
The reader will note an extremely high correlation coefficient
between English Usage and Verbal Composite (.909) and likewise
between the former and English Composite (.910). This is to be
expected however, since English Usage is part of the subtests which
comprise both composite scores. Attention is also drawn to the
coefficients relating Reading Speed and all other predictor variables.
With the exception of Reading Comprehension, which shows an expected
degree of relationship, the coefficients do not deviate greatly from
"no" relationship. This would suggest that Reading SPeed makes a
unique but almost negligible contribution to the test battery.
The overall impression gained from surveying Table I is that
the subtests having a predominantly verbal orientation intercorrelate
to a moderate degree. Apparently the verbal ability one has or the
verbal aptitude skills he is able to acquire underlie successful
performance on each of the verbal subtests and are also reflected in
high school verbal area success. For example, note the correlation
coefficients between English Usage and the following: Spelling,
Reading Comprehension, Vocabulary, High School English, High School
Social Science, Verbal Composite and English Composite.

35
Mile identifying underlying skills it is interesting to note
the correlations between the All-University Prediction and the
predictor variables. If a comparison is made by considering the
predominately verbal test scores iinich consist of English Usage,
Spelling, Reading Comprehension, Vocabulary, Verbal Composite, and
English Composite; a quantitative group composed of Applied Mathema-
tics, Mathematics Achievement, and Quantitative Composite; and a
group made up of the cumulative high school averages with the
All- University Prediction, the differences are illuminating. First,
the group of high school averages correlate highest with a prediction
of success in college. The verbal subtests have a moderate correla-
tion with the composite prediction and the quantitative group showed
the least relationship. This suggests the well-documented conclusion
that high school grades and the verbal skills seem to have a more
significant relationship to college success than do the quantitative
skills. This differential weighting is one reason why the W.P.C.T.P.
chose to utilize high school grades in combination with verbal and
quantitative subtests to generate variable 23 on the student's data
sheet.
Sex and age show some d,...gree of relationship with each of the
predictor variables and thus add to the predictive validity of the
test battery. Even though sex is a contributing factor, a study
by Langen3concluded that gen=ating separate regression equations
for males and females did not appreciably enhance the predictability
3Dr. Thomas Langen. "An Investigation of Additional Predictor and
Criterion Variables for the Washington Pre-College Testing Programwith Subdivision by Sex and Extent of Achievement." Study Supportedby Washington Pre-College Testing Program, May 196b.

36
of the test.
To summarize, it appears that each predictor variable now
included in the current test battery is serving a useful function
in increasing the predictive ability of the instrument.
The Criterion Course Variables
Before considering Table II it is necessary to define the
criterion courses which were included in the study. The descrip-
tion of each criterion has been taken from the Yakima Valley College
Catalog, 1967-684 and is as follows:
1rt Appreciation - Designed to lead to an understanding andappreciation of art with special emphasis on thecontemporary period of painting, sculpture, architecture,and the decorative arts. For non-majors.
General Biology - Investigations into the nature of lifeand those phenomena common to all living things.
Jntroduction toDaginess - Survey of business objectives,policies, organizations and procedures.
Inorganic Chemistry - The principles of chemistry for thosewho plan to take a year or more of chemistry courses, Pre-requisites: satisfactory grade in high school chemistry orin Chemistry 103; Math 101 or qualified to enter Math 104by adequate placement score or permission of instructor.
Economic Geography - Location and characteristics of theraw materials, resources and resulting exchange of inter-national economic cooperation and conflict.
Introduction to Education - Includes units on teaching asa profession, history and philosophy of education, obser-vation of classroom procedures and Washington's educationalsystem. Recommended not to be taken until third quarterstanding.
4Yakima Valley College Catalog, 1967-68.

37
English Composition - Required of all freshmen who qualifyon the basis of college entrance examination scores oradequate achievement in English 10, 50, or 51. Studentwriting progresses from simple exposition, using variousrhetorical methods, to longer compositions requiringcritical thinking and research.
Emphasizes the command of basic rhetorical principles inexpository writing; use of particular details, examples,comparisons and contrasts, and development of thesis orsupport of central idea. Study of short stories, novels,plays, and poetry for ideas and for the observation ofartistic technique.
Personal Health for Men - The approaches to healthfulliving. The laws of hygiene as they apply to the indi-vidual. Health information affords guidance in theformation of health habits and attitudes.
Personal Health for Women - Personal health and hygienewith emphasis on the physiology of the human system in-cluding the digestive system and the problem of nutrition;the reproductive system and social and hygienic aspects ofsex.
History of Washington and the Pacific Northwest - A, historyof the Pacific Northwest with emphasis on the history ofthe state of Washington. This course provides a backgroundfor those who plan to teach state history and governmentand meets the requirements of state certification.
Intermediate Algebra - Review of elementary algebra, linearsimultaneous equations, rational exponents, radicals, graphs,binomincl theorem, logarithms. Prerequisite: one yearhigh school algebra or Math 101. No credit received bystudents having completed third semester high school algebra.
College Algebra - Definitions, axioms, and laws of algebra,the complex number system, functions and graphs, polynominalsand theory of equations, determinants. Prerequisite: Math 101or advanced high school algebra.
Introduction to Philosophy - An introduction to problemsof human thought which have continuing significance.
Gerrn-al Psychology - An introduction to the science of behavior.
Principles of Sociology, - Basic principles of social relation-ships.
Introduction to Public Speaking - Audience analysis, choiceand organization of material, delivery. Frequent speechesare given before the eass for criticism. SpeecL majors orstudents transferring to Washington State University orUniversity of Washington are advised to take Speech 100instead of Speech 140.
These criterion courses are normally taken by most students some-
time in their two-year course of study and thus are fairly representa-
tive of the academic areas offered at Yakima Valley College. The courses
are one quarter in length and the final grade is either A, B, C, D, F.
14F, or AUF. Most of the criterion courses require only a minimal
amount of high school course work in their specific areas. Only
English and Mathematics require a minimum W.P.C.T. standard score for
placenent. For English the current critical cutting score is a 45
or above on the English Composite score for admission to college
English and 44 or below for a non-transfer English sequence course.
The mathematics courses currently require a standard score of 53 and
above can the mathematics achievement subtest for entrance into college
algebra while a score of 52 and below requires the student to enter
intermediate algebra. An exception is made for those students who
have completed two years of high school algebra.
The Criterion-Predictor Correlation Matrix
Part two of the first phase was considered a very important
facet of the entire study. One of the stated purposes of this pro-
ject was the determination of the test battery's ability to affer-
entially predict student behavior at Yakima Valley College. The
construction of a criterion- predictor correlation matrix to establish
the relationship between each predictor variable with each criterion
39
was a preliminary step leading to the development of regression
equations to predict performance in each criterion course area.
Fefore proceeding with an analysis of Table II the reader is
refe7rcd to Table V to note the meEa, standard deviation and number
of scores involved in each criterion course area. Returning to
peruse Table II one needs to be cognizant of the number of scores
in each criterion area sin.:%, any significance is contingent on
the sz:ple Eccau7.-li the sa=ple size is fairly small, one
should. he somrn:hct cautious about broad generalizations for Intro-
duction to BUsiness, Inorganic Chemistry, Introduction to Education,
and Introduction to Philosophy.
The same caution should be applied to the interpretation of
1:7,,e moan and standard deviation values for each criterion area.
Also the fact that the grades were reported in whole numbers
(4, 3, 2, 1, 0) for a single course introduces error since it would
be impossible for any person to obtain a mean grade for any of the
courses in the study except Intermediate Algebra. iiith these
cautions in mind, however, it js interesting to note the difference
bet:men the mean values of ,he different criterion areas. There is
a range of mean values from 1.89 for Inorganic Chemistry to 2.80 for
Introduction to Education. Al-7o, with the exception of Inorganic
Chemist:7, the =.71a values for all of the other criterion areas lie
.71-2ove 2.0O. Tais ray sugrrEst some trend in grading practices in all
of the cer7ces at Yelima Valley College, but there is not enough
data a:zilable to maze any firm statements.
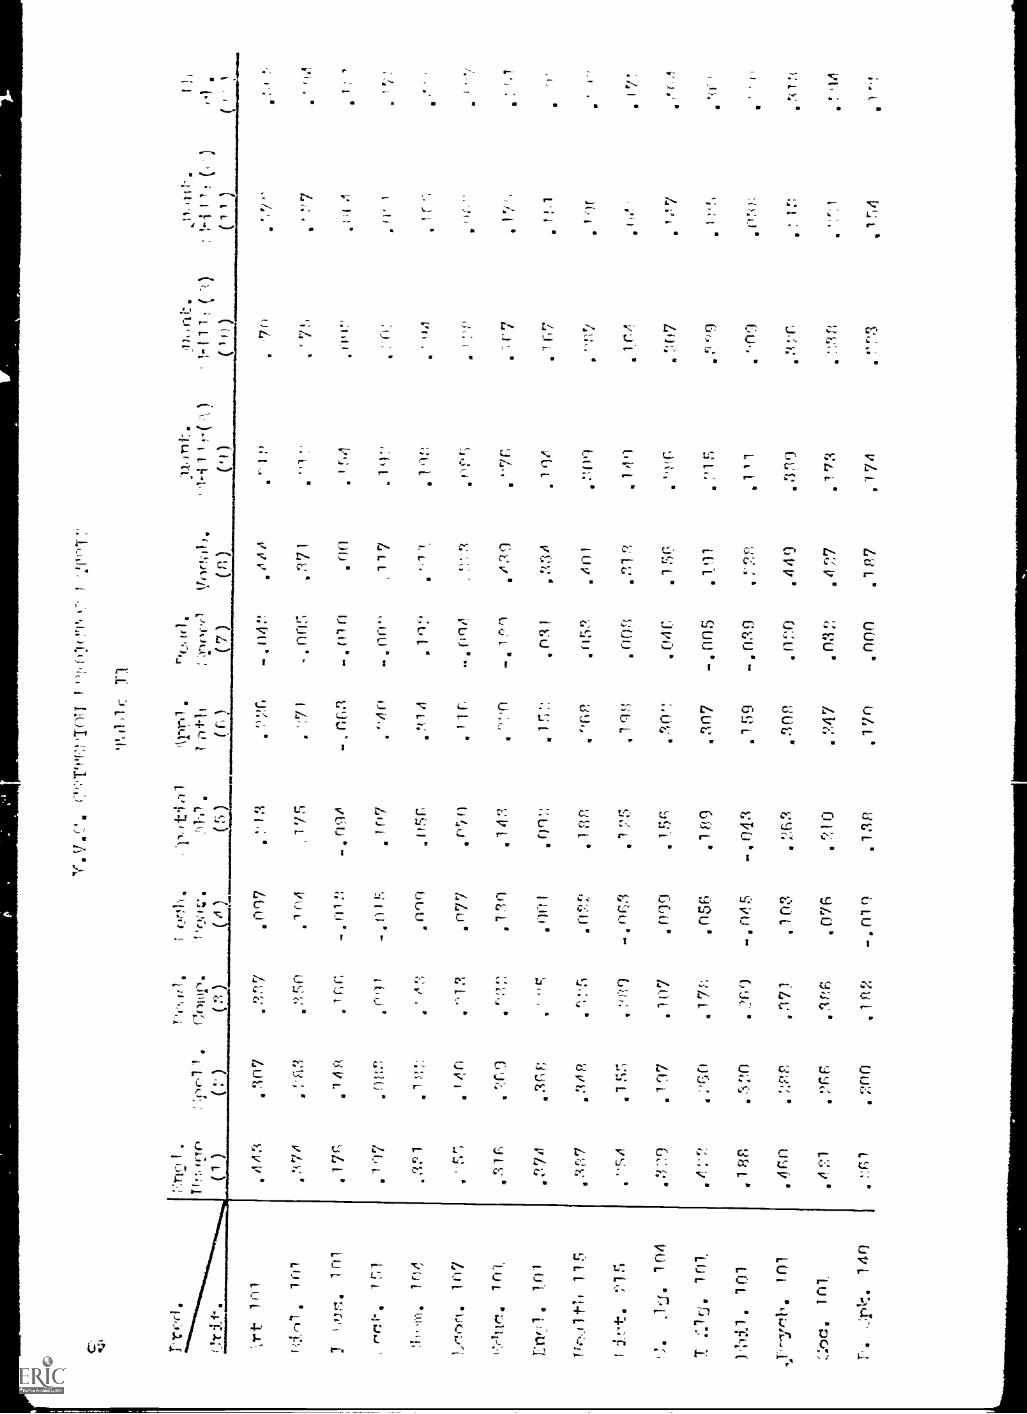
;..i
aV
'_.; t6
'1,,..,,,;a
v/, La
Lti L'
UO
U6
U/11
6
13t; L6
6 LIU.-
;','Lit6
VI, ;
.a
raj;,:a
}1:/., LLi,,i/
'<:i;u'
0i'e,;9/.,0
J4L;
j'acj'::w
;.
.11'*
6',.r. "1,.'
.6;1." '
()VI/
6
0'.; Li 'U
/4 Ul :,;
66
.6
.'Ii L1
LLL:6
61
16
5
:1/90'(:ftt.16
GU
'.L
L'(3{:;;
6
6036 -
69 L6
-iiti
6 -() 4.1(.'
6L
b; C;
6
t J:;6
DV
L.6.-Iia,'
11'6: V
5
.t.0 1aD
c-,":;
u:ivLU
1kli-j--1
.1
LO L
a11:044
,.0,4
,,1
Cy.. t.:
613 L6
990',341,
UrJ."
6
'd:, ;vi
131.4;'ili I.
I1:: 1ita
1,j,_,-
;41a
,aI
ib i
;'")a
il
a40;
a
ii',;,6
VJ'L
6
L. ii tI
1.1111:6
'.)',,,
'I.; L v6
3 DO
I
Jf:; L6
j VO
6
i uv'
oti '4
.,.
a
i39.,a
:AM
5
',.-111.0L
6
IA t
6
'z)(.,ii.6
.;.:;IJ6
1.;;;JL,a
6G0
1 oha
i. -
Co',,:
'
/,01.
V . .4
:4 ill :1;vLi -
ii:
b vt;a
6;,i,:'
/1 'nli*
VS,
6:,i,tou:::...1
L .;
i../_i L
vi, ia
0-.2.44
1 r_;u...J l
t? 4 i.;L
iii.
'k' 1:
4 I '.-6
J/,..6
I:ftv.uci t
6-iw
;6
';1716r) k1 L
6.,
.111(4
li'.1.',6
J L 1.;
vuL17.1:
ti.L.;
64-'4
L L
'tutra
,1
kl I,;,;
1
(.)..)"ti6
vuti.
'.1 l1
6( i 4d
Ll,L)"k; L"
6
ui/ 1;4'1,;
,6
.',.:L. i
6
';'.,L
LL
I 1L
iQi.fi
VI)
I. L.,1
I.6
11 L i;a
JS11
61_)1,,U
r',-.;v
,6
L 41.;friJ I.
.1`11"111
',,j;:W6
v i,t."
,II
IA) I "
VS 1
6
01)"
LI. L
'
',LIU
' -0v,,
4'
1J Li)W
it.)' -
40 i6
vLAJ
' -it
i Li ' -'..)Ji
6
i:iI
I/a '"
I C"..)
6
,:i1/1.16
LOG
I-.
,.d, k
L'..; i6
-I;.-).-
;h.*L1J I.
°'.'--'cl-'iI:
a.
i;'
Iif
.'
i jiu(2/11JU
a 'I L
:,a
';;/, LiR
J LP
U.,i I:
e1;13,
;6
vi,.:6
Lo I6
L'-)E,;1
6
1I
v vvill
4.4;61.
,;a
/AA
) 'i, ; r;
a/,4
V V
Vto L
4.-:'04
araetwom
moo
tL
((
)( (
)( la )
inelmom
ecoomm
oomootw
o.1
( 4 )(
'j )(
j )( V
( ': )(
..1:1: 4;( '(-: )
L.
)
aI." ';-)M
_Aa 14.:L
a\ .
[ I-' I.:1r I 'II,1.11,20
Iill 4,I.
i: L . J 4-;':
:
L). 1.171:741.111. if
1../...0.1
i.1(
' );
LI
1.'"1:
0- );
L LI 64.
)...4i
L 1..1,6 i
i I :iiit,,,A(i.)01...7!
;114.° i
Ii
I./.141 'L
C'
.:11-/'
'I C414 f A
i,i."-k
5 .t#.'(.), y
"i_ruli.).)
L'
Jo,'}1.1 1'0
)I.)

* 'r f
f.,,
(lnul
f'(1 "3)
(.4 A )
\T't T
O,
.(196.
0,,r l*,
:/1,(";'11;i1
7'7%.,1
111"
1cyr,
.r,4!),:37n
.0
**7
.-49
,'not.151
OP
1..
!''`-/ -.
'!'1.n'19
'.:Iirla.11-'4
.-3)!-:,
.45n
,;-Jort,107
.rol...;42
rrilm,
!Ill.r'
.4nr,
f',67.4S
8
::95.4119
-.n-s.464
.'.!,59
.455
.071
.424
.079),37
.17::',.?.
467
.044.471.
T.
-.1.40
I.060
.4:16
1"1*
rr-'111
-
(crwir:-.11-r1
fliu.I
, :h:,-;:i
J...
._'(-21,''',1crlf.:.
411.-.1.,:r I:.''.,-_,-, c
L'iii-0
.rrocl.
,70%( 1 r; )
( '1,)
(17)(1 ri )
(19)( r0 )
(:°)(A ,)
III
I:1 ,,
iLSIL
.A.M
.Ii)
,..111.111
it-,11)1
1M1
RP
1:ngl
Tth 11.5
rtirt.%
1.S
c%O
r!104
11.g. 101
101
T)sych,
1.01
'101
.rN
4r,.
,5:str,.
,,,1
9,,,.3 :.4
),4 '
f r.(!1j
.4nri,5no
.n44(-:kr,
..,,,-Innqr,
.!7,1,r11,,
.irr,-:
.',";(1,.n011
.nci7
.1c,ii
.17 --,,-, 1
'.-:ril.1,74
.1n91 riA
,/19.1,
r)I
442
."T
t1
:,:11,1
,34,6
.5n! 57
.R1 0
.Ann
.5'47
.14,5
.1,11r=';
335
,411,
.f.;17
.455
:195
,:',9()
.:31r1
rAfl
,,,,,),
.1:)1
.4,:4 r.
.'209
-:108
`111'i3
,4n"-'
.3 z-1S
.:::-1,7
'1;7
.R
9'1
.309
...1,
:,7r,
. il ii4
.461
.(-):1.n
177
1:tr,
'1
117,,11,17(1
.357.8 ,,:r1
.414.447
.'-,,,.12
.:3074iiR
.A
A ii
r,;ri:4l(','
() )11:
f A
."T
S.1n7
.888.447
,A14
,1:',9rT
69:3nn
An7
,nio. . 0, ,r,
,, ii
.315A
ss.4no
.4f',9.3,1O
,sr;
:;7 P,
!`13:-)..
A R
P.17:;
.079','"/"4
.8(14.45
.371.376
. :IS36,-)
AS
1-1,A
SS
.485.
itk
'..n7i
.,:r
8 !::().'280
a ',),8?,!,',5:4
:34 ".".ros
I!'7I!'-',
.A71
.362,.45n
.4R4
.34 ;.
AS
,.46:".
.476,
r)37.1111-,
-,0Py il.376
.86t-;.
A 44
.4,57,3(39
.:414
446.4A
rinns
!WI
011:,1,1,1,
.:,,n5.
P5:3
.37P,
,Arin
3 n.179
.!!47"fin
.4 :-"1Inr,4
.u-4im
tle

42
The standard deviation values for each criterion area are also
quite interesting. With the exceptions of Introduction to Business,
Economic Geography, and College English, all standard deviation
values exceed 1.00. Although these deviation values probably are
not larger than those derived from the total Er.P.C. sample they do
indicate a wide diversity of academic abilities and a real problem
exists to develop each individual to his fullest potential.
To gain the most benefit from Table II one should examine
each correlation coefficient individually to see what relationship
exists between each predictor variable and each criterion variable.
It might be well to consider dividing this table into the
three major groups as was done in Table I. It will then be
possible to determine if the same differential weighting of verbal
areas predicts academic success as well for specific two-year intro-
ductory courses as it does for establishing the All-College predic-
tion based on university students.
Upon examination of the seven high school cumulative averages
the first observation which draws attention is that the high school
cumulative G.P.A. shows only slight relationship with any o the
criterion courses. Apparently the high school composite has less
relevance for predicting academic behavior than the specific
elements which comprise it. A cursory examination reveals that
high school English and high school Social Science have the highest
coefficients with most of the criterion courses. Of course there
are exceptions such as a coefficient of .526 between high school
1
43
Mathematics and Inorganic Chemistry, which might be anticipated.
However, when the regression equations are developed in the next
chapter the specific variables which contribute most significantly
in predicting each criterion grade will be identified.
The predictor variables cited earlier which are primarily
verbal appear to correlate to a moderate degree with most of the
criterion areas. Moo exceptions to this are Introduction to
Business and Principles of Accounting. It is interesting to note
that these verbal subtests correlate more highly with Intermediate
and College Algebra than they do with Introduction to Business and
Principles of Accounting, although it is popularly assumed that the
same skills are necessary for successful performance in all four
course areas. The same effect will be illustrated in the regression
equations for these criterion courses. Reading Speed, although
considered as part of the verbal group appears to be a unique
variable here as well as in Table I. In fact, this variable shows
only a slight relationship with all of the criterion courses and
the relationship is negative in 50% of then cases. On the surface
this would appear to be the variable which could most easily be
eliminated without unduly influencing the differential predicta-
bility of the battery, but before this is done the possibility
should be checked that Reading Speed mity be a significant suppressor
variable and should thus be retained.
The quantitative variables referred to earlier shwa lesser
degree el: relationship with the criterion areas than does the
verbal group. Even in those criterion areas like Inorganic Chemistry,
Intermediate and College Algebra, where it might be anticipated that
44
a moderately high correlation would exist such does not appear to
be the case. In fact, English Usage appears to correlate with
these criterion areas to an equal or greater degree than met of
the quantitatively oriented subtests.
One observes also that Mechanical Reasoning and Spatial Ability
seam to have very little relationship with any of the criterion
courses. This mould imply that these subtests are apparently measur-
ing unique abilities that lie outside of the areas traditionally
considered to measure potential for success in a college or university
curriculum. However these variables may also be suppressor variables
and, when considered within the cortext of the regression equation,
be quite useful in prediction.
The All-College prediction appears to be the best single indi-
cator of success in each of the criterion courses. Since it is a
weighted composite of the high school cumulative averages of the sub-
test scores this would be expected. at the size of the individual
correlation coefficients definitely supports the conclusion that the
W.P.C.T. is measuring those abilities and achievement levels which
are necessary to predict successful behavior in the college transfer
courses offered by Yakima Valley College,
The predictor variables Sex and Age also seem to fit into the
same category as Reading Speed. The relationship of each of these
variables with each of the criteria is slight to negligible and,
in some cases, a negative relationship exists. It is understood,
however, that their inclusion and interaction with other predictor

45
variables enhances the battery predictability but, when considered
separately, their contribution is mall.
A comparison of the validity coefficents in Table XXIX
for the criterion areas predicted by the W.P.C.T.P. and comparable
all-college criterion areas included in Table II of this study
leads to the inference that the test battery is predicting as well
if not slightly better at Y.V.C. than at the University of Welting-.
ton. Those criterion areas where an approximate comparison could be
made included General Biology, Inorganic Chemistry, Economic Geography,
College English, College Algebra, Introduction to Psychology, and
Introduction to Sociology.
Also, it appears that the predictor variables have approximately
the same differential weight in predicting student academic perform-
ance at Yakima Valley College as at the University of Washington.
The specific high school cumulative averages appear to be the best
predictors, followed by those subtests which attempt to measure verbal
skills and finally those subtests which assess quantitative skills
levels.
The all-college prediction, which is a composite score that
gives more differential weight to verbal skills, but includes all
predictor variables, appears to have the highest overall relationship
with all of the criterion courses.
The Criterion Intercorrelation Matrix
The data for a criterion intercorrelation matrix was also pre-
&Iced as a by- product of obtaining the data for Tables I and II.

46
In most cases, however, the number of subjects involved in the compu-
tation of t.:e correlation coefficients was so small that the derived
index number was insignificant. however, some of the criterion corre-
lations contained enough cases so that some interpretation could be
made. Therefore, the discussion for Table III will be confined to
only those correlation coefficients with a number of cases exceeding
100.
A correlation of .500 was obtained between General Biology and
College English. In addition, Biology correlated well with Health
and Psychology as might be expected.
College English has a fairly good relationship with College
Algebra, Psychology and Public Speaking. There was also a moderate
relation between College English and Health and Hi*toxy of the
Pacific Northwest.
Health Education has a moderate relationship with History,
Psychology, Sociology and Public Speaking.
Psychology has a moderate correlation with Sociology and a
slight relationship with Public Speaking.
The rest of the correlation coefficients have not been inter-
.
preted because of the small sample which resulted in dubious signifi-
cance.

:Tuz/p-F
.jgoop uo-p.u.Lo.x.,tooin.3:C
LE-F
ueotic oz.T.cap oq. o Ica:T
ook:I yououo
-
1.14iiL'J ii
ji.:, v4(.:
60'd '
ON
>
:x..,1:; `I.,, ii'
'6' Lv
,..')Iii.: 6
UU
S
,..i,:.,1(...,.
a%I
6 i;;L:t_,.., v
'Jill/
891-766',P
.38V
' in9'6V
'
191
L9;:',
39C`
0 LC9 C
CJU
Z
'JG',.
::: LIL,9',;
I.',.:;',31
6098
:G
frL,S
'Cl';'
000000'
0;n
60'
96L6 Lc..-:
960;SS
i".vv,::
/.7,1)-;,., z-39
91.,,:a
9 LS;A
-.
89O
ct I`.7i
/.v '
..iiJuL
IL, fr; .
1; .1/ '
,ii;',:6
;ij!li
(,, v.;
l'Aio
90v'
,0 .
t" i4 .1
1.1"..1:
, , aLot.,
Lith) * L
61;.; a
t:,
1
1.0.(3
( 4.
4 t o1
4,1;_;
u091
u4 fr
L; V
S
6 9i
t)k);
UU
UL
.
L;tjt;
a
L9'.-.;
98 , :.; `
d606
Ott;
,1: t.ri7
90 1 `
lit,
k, L,
U 1,C
;
UU
UL
L. L
c;
Li'ru"
ii L 'y
Uir C
1> v Y
095'
r'09
6Y9
1.9!.-;
L./.,'
uuu'IuO
ul
6 Li/
9G9 '
L'c: V "
090 -
'6"i/,`,'
Ve,i;
98c;"
LT
/ 0
00J
uuiL
L9 L '
L',-; i
9L,&
V9(; '
660
L9(;
060'
-friv
61'`?
'LS. L a
000L
000'
iti(ifi
0,::i>
96 fr
OO
S
8LC8
U46
SL9'
Liv, L
'-
UU
0
0001 L
Gov'
v6:
1.; L L
L14
r,r1.1
" L13U.,4
(vik;L
U L
;71 R.
(1.v)Z
U L
61007
(uyVU
I1110L
D
( Lig )L
21( E
c; )
LOI
:.;fu
( Z(-;' )
LO
L
LO
W
;.a,:i.,viicixxirieeik.,cyozahia
LO"00;7
.1..)1'401:2
I
LV
L'13
IsZ
o' rj
91 I 44 -L
LUL
ii3u2
UI
'mitY
.71
LCit
'11007
PO
LettraLiD
:LS L
"L:rta
-L0'1'10i:a
4.111
(9t7,)10L
411

kg,
o00 6I
00C'
(.:9j,'
1-7T/C6
09P
00C
000'L
96E'
661:'
0b)
:9,:;'
96E'
000'L
Lb
:;(:i.
vv::,'
Hi'
LW
000'1
9;_i',
(.3C.'
1008
91.;.;'
6'i7'
L'
L'zi'
i71
9 ,3E'
190'
f,,v,
--;0,.i'
KU,'
9T7C
(;.;1"
04
Ctrl''
SL''
froc.:;*
L9 L'
046
4Jva
,;Li:4
Li','
9ne
r:vi
601J;
OVP'
`(::Lii
OS"
-.
l_:_,l'..i,'.
19 L'
86:.;*..6 L
LPL
a9fr°
u9C
ZLL"
6VL°-
LUL
();,1.3OLD
Low "
9CV'
LIAL
K.;'
9L1m-
'131.6
Oar
(.).c.
9:.;
Jr.):C
6335
0-PC
L;1L
;7;J,J '
9jG'
59V
Mi'
( LV)
(0V)
(6)
030OvL
10
WI.
0.40,,a34
LTLId
g1V
LW
909'
0.61
I:4(Z
'd
10E'
"417'
viz '
10-1
500;_;
91?;'
SEE'
S-in'
101 21-1L3d
6"c;V"-
190'
*18
LOL wiTLIJ
000'1
It:.ii°
C,9;.:"
1:01 'LIU I
10'
000'1
17,&t,'
T/01
'451,
'3
(79"
C,::.!T,'
0002L
91F,
64,c-r11I
9170
68E'
L(4v°
SlL 441e011
M'
L6'?'
99E'
I0L
"Il3u.7,
0,,;'1 '-
913 v
31/9
TOL
'DnLY,!1
(Dtic;'
LOC
96L'
L01
Lic.,DJ,
96i;,"
*c,a"
099'
POI
'11PDLLT)
619'
9L'6'
050°-
1SI '400
960'
915'
v9'
101 '211U 1
u9 C'
f.:9i.;''
OW
LO1 '10 Td
J(i178
91,C
80.17'
101 421
(L6)
()(S1;
L01PU
1S
1.';
"5
I,
""Tif
4
co

49
MEAN, STANDARD DEVIATION AND NUMBER
FOR EACH PREDICTOR VARIABLE
TABLE IV
TableVariable Mean S. D.
Engl. Usage 33.24 15.42 1678
Spelling 13.78 8.15 1667
Reading Comp. 8.96 5.67 1667
Mechanical Reas. 8.29 7.04 1656
Spatial Ability 9.44 4.56 1667
Appl. Math 9.28 4.83 1675
Reading Speed 25.26 5.63 1678
Vocabulary 41.95 17.31 1675
Quant. Skills (A) 5.0 3.13 1663
Quant. Skills (B) 11.62 5.71 1673
Quant. Skills (C) 4.15 3.57 1638
Math Achievement 10.97 8.62 1668
G.P.A. 19.53 10.73 1361
English 23.80 6.80 1624
Foreign Language 21.55 8.73 1419
Math 21.31 7.17 1623
Natural Science 22.50 7.17 1611
Social Science 24.15 7.21 1625
Elect. 27.47 6.55 1597
Quart. 47.34 7.90 1678
Verbal 46.39 9.20 1678
English 46.35 9.26 1678
All -U. Pred. 18.46 4.54 1625
Sex .26 .44 1678
Age 17.42 2.63 1678
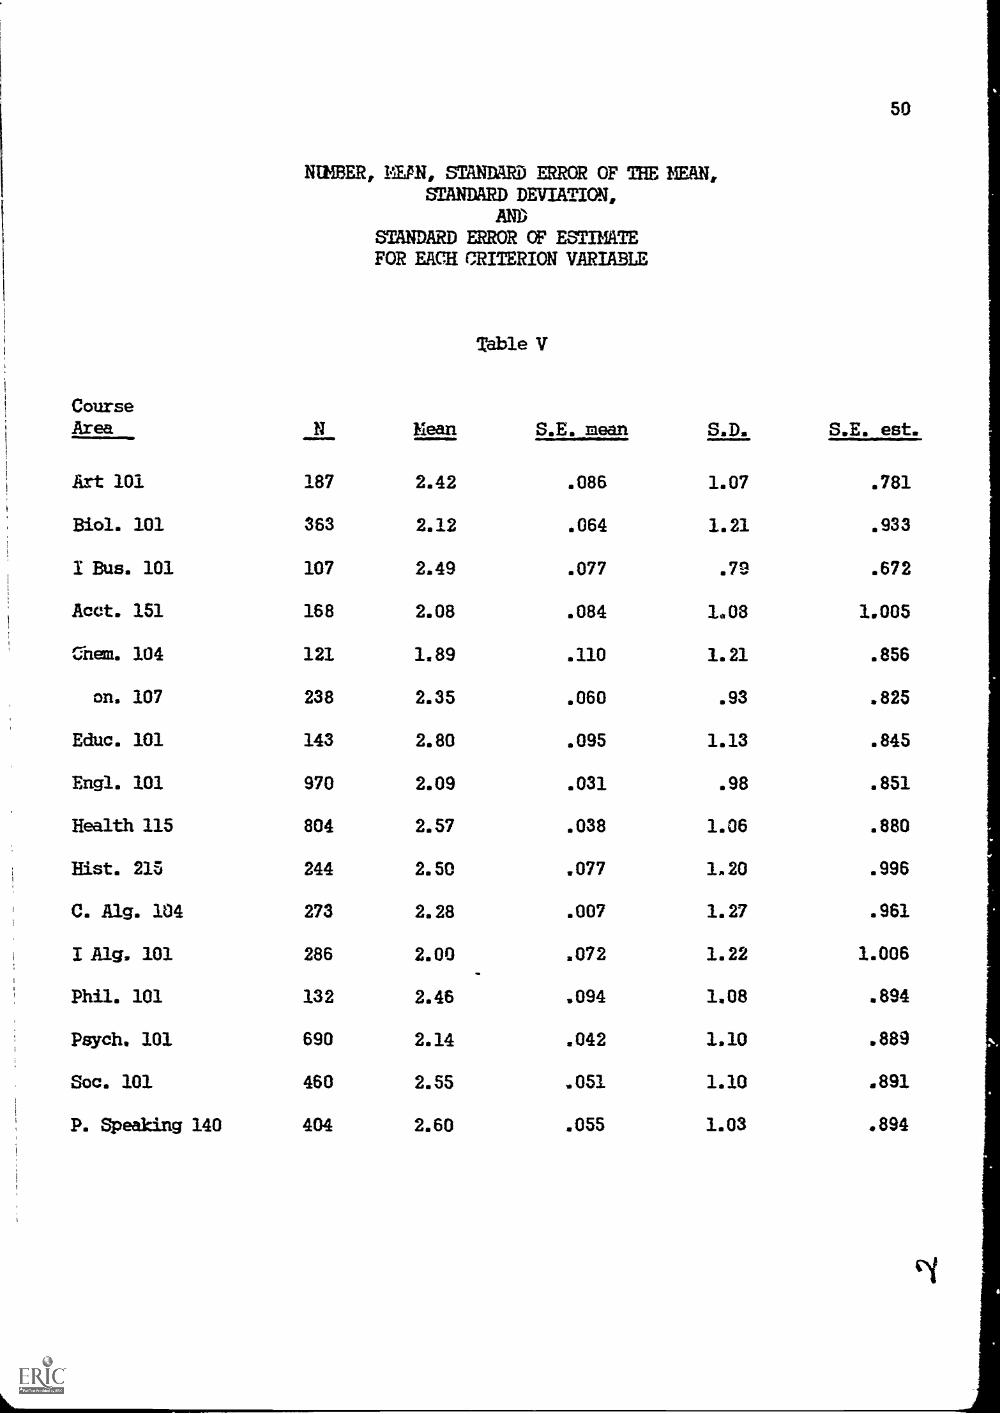
50
NUMBER, IAN, MANDARD N..s. OF SliE ?SEAN,
STANDARD DEVIATION,AND
STANDARD ERROR OF ESTIMATEFOR EACH CRITERION VARIABLE
Table V
CourseArea N Mean S.E. mean S.D. S.E. est.
Art 101 187 2.42 .086 1.07 .781
Biol. 101 363 2.12 .064 1.21 .933
1 Bus. 101 107 2.49 .077 .79 .672
Acct. 151 168 2.08 .084 1.08 1.005
Chem. 104 121 1.89 .110 1.21 .856
on. 107 238 2.35 .060 .93 .825
Educ. 101 143 2.80 .095 1.13 .845
Engl. 101 970 2.09 .031 .98 .851
Health 115 804 2.57 .038 1.06 .880
Hist. 215 244 2.50 .077 1.20 .996
C. Alg. 104 273 2.28 .007 1.27 .961
I Alg. 101 286 2.00 .072 1.22 1.006
Phil. 101 132 2.46 .094 1.08 .894
Psych. 101 690 2.14 .042 1.10 .889
Soc. 101 460 2.55 .051 1.10 .891
P. Speaking 140 404 2.60 .055 1.03 .894
51
SUM iraY
The predictor intercorrelation table and the criterion-
predictor correlation telae both indicated that a differential
weighting favoripg high school cumaative averages and verbal
factors could be used to predict academic behavior with a reasonable
degree of accuracy. The specific high school cumulative grade area,
appears to be the b -lot predLotor variables -while those subtests
assessing quantitative skills showed the least relationship to aca-
demic success. Mechanical Reasoning, Spatial Ability, Reading Speed,
Age and Sex seemed to be unique 7ariables which contributed to the
overall predictability of the test, but showed only a minimal rela-
tionship with the criteria when considered individually. More needs
to be known about these variables before statements can be made for
their inclusion or exclusion from the test battery.
The data from the criterion-predictor matrix lead to the
impression that the current Er.P.C.T. is doin-j reasonably well in
predicting student performance at Yakima Valley College. The
regression equations, percent6ge of variance contributed by each
variable and coefficient of multiple correlation for each criterion
will either substantiate or cast doubt on the accuracy of this
observation. This is the secrnd phase of the study 1.:hich will
be presented in the next chapter.

MULTIPLE REGRESSION ANALYSIS
Chapter IV
INTRODUCTION
Chapter III summarized that the predictor variables which
comprise the Ef.P.C.T. dc e reasonably good job in predicting
student academic behavior at Y.V.C. This conciuJion led to
phase two of the project which was the establishment of regres-
equations to more accurately determine the relative contri-
bution of each predictor variable in estimating the grade to be
achieved in each Y.V.C. criterion area.
The regression equations were generated for each criterion
area and they can be found in Appendix A. Incidently, all of the
composite scores, English Composite, Verbal Composite, Quantitative
Composite, and High School Cumulative Grade Point Average were
excluded as predictor variables because they were derived from a
weighted combinationof other predictor variables.
The tables in Appendix A indicate the regression equations
(Beta and b weights), percentage of variance, and multiple correla-
tion (corrected, uncorrected) for each criterion course area. The
first statistic to note on each table is the corrected coefficient
of multiple correlation (Rc). This coefficient indicates the strength
of relationship between the criterion and all of the predictors taken
together. Rc is related to the intercorrelations of the predictor
variables (see Table I) as well as to their correlations with the
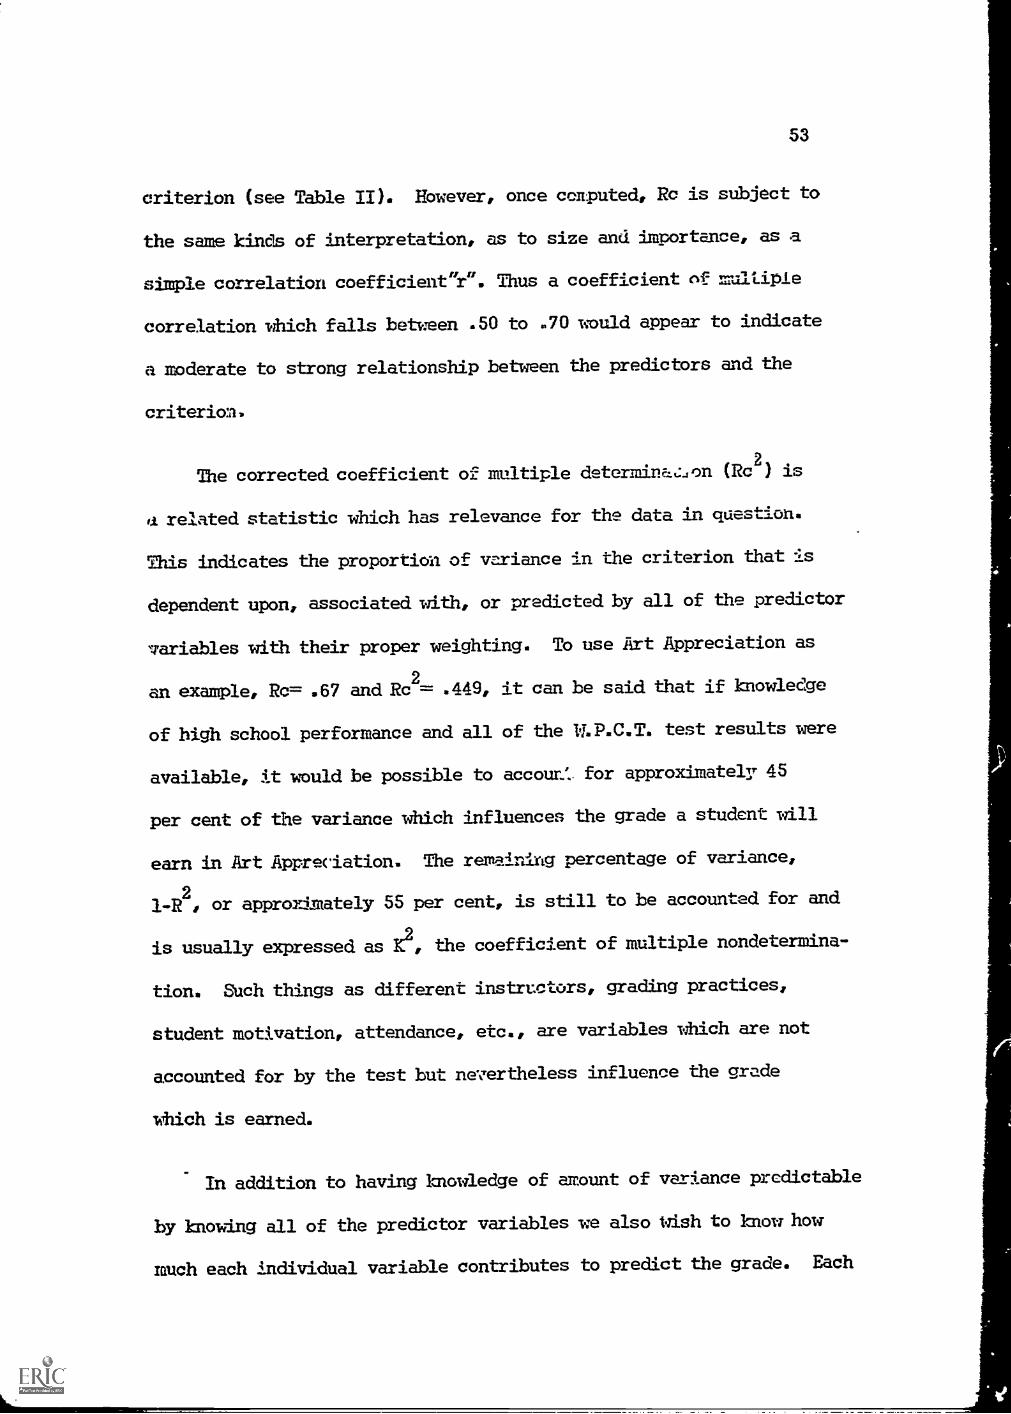
53
criterion (see Table II). However, once conputed, Re is subject to
the same kinds of interpretation, as to size and importance, as a
simple correlation coefficient "r ". Thus a coefficient of railtipie
correlation which falls between .50 to .70 would appear to indicate
a moderate to strong relationship between the predictors and the
criterion,
The corrected coefficient of multiple determinon (Rc2) is
d related statistic which has relevance for the data in question.
This indicates the proportion of variance in the criterion that is
dependent upon, associated with, or predicted by all of the predictor
variables with their proper weighting. To use Art Appreciation as
an example, Re= .67 and Rc2=
.449, it can be said that if knowledge
of high school performance and all of the W.P.C.T. test results were
available, it would be possible to accoun: for approximately 45
per cent of the variance which influences the grade a student will
earn in Art Appreciation. The remainiAg percentage of variance,
1-R2, or approximately 55 per cent, is still to be accounted for and
is usually expressed as le, the coefficient of multiple nondetermina-
tion. Such things as different instrmtors, grading practices,
student motivation, attendance, etc., are variables which are not
accounted for by the test but nevertheless influence the grade
'which is earned.
In addition to having knowledge of amount of variance predictable
by knowing all of the predictor variables we also Wish to know how
much each individual variable contributes to predict the grade. Each
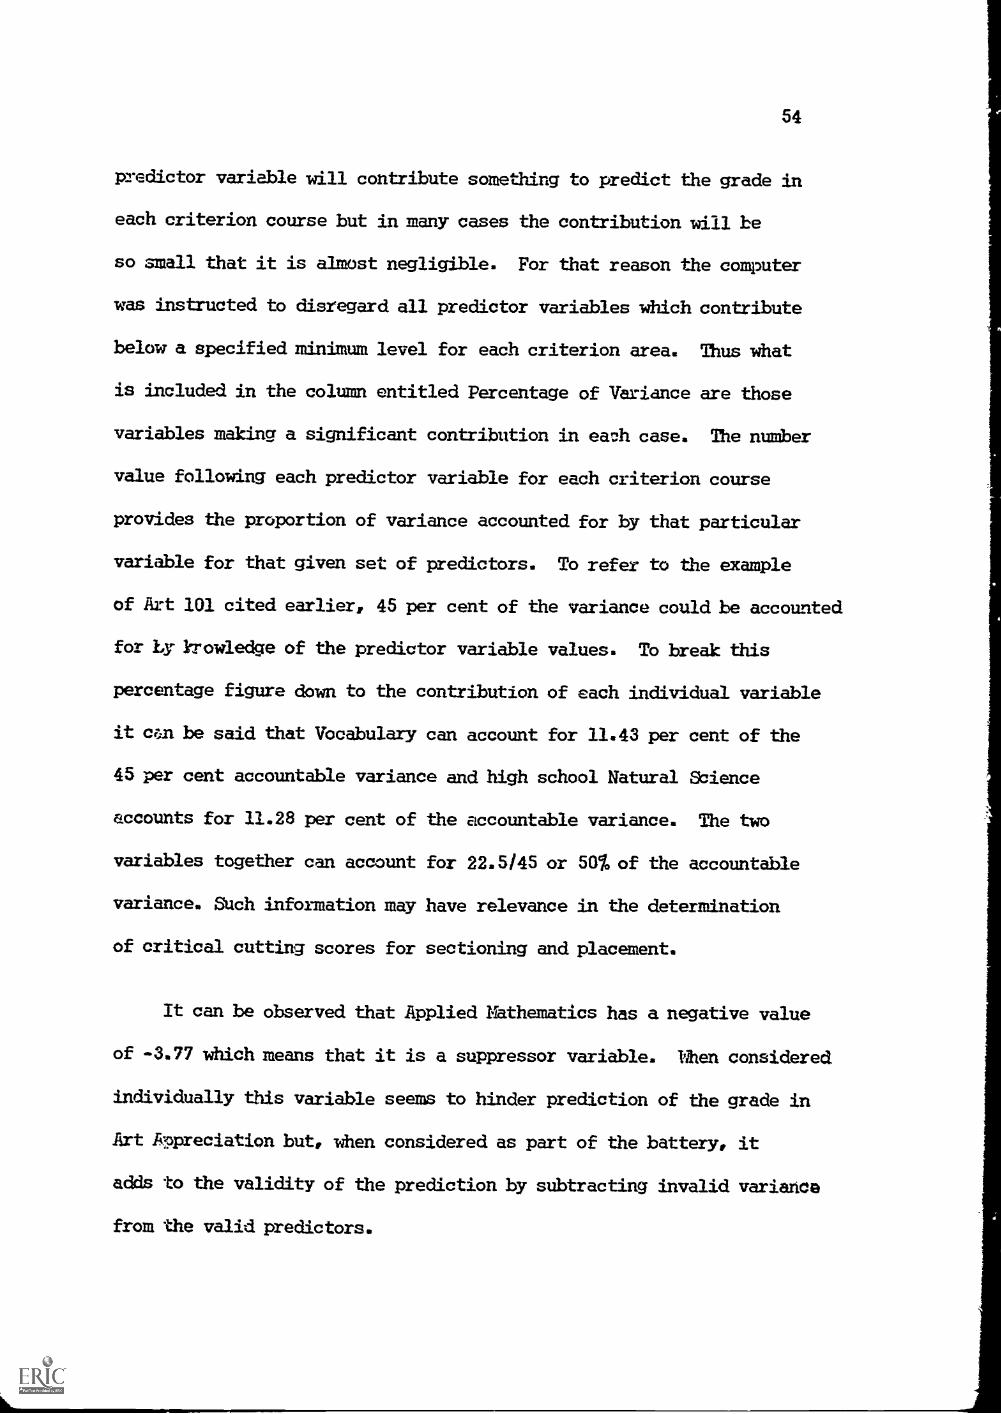
54
predictor variable will contribute something to predict the grade in
each criterion course but in many cases the contribution will he
so small that it is almost negligible. For that reason the computer
was instructed to disregard all predictor variables which contribute
below a specified minimum level for each criterion area. Thus what
is included in the column entitled Percentage of Variance are those
variables making a significant contribution in each case. The number
value following each predictor variable for each criterion course
provides the proportion of variance accounted for by that particular
variable for that given set of predictors. To refer to the example
of Art 101 cited earlier, 45 per cent of the variance could be accounted
for Itykrowledge of the predictor variable values. To break this
percentage figure down to the contribution of each individual variable
it c?:,.n be said that Vocabulary can account for 11.43 per cent of the
45 per cent accountable variance and high school Natural Science
accounts for 11.28 per cent of the accountable variance. The two
variables together can account for 22.5/45 or 501, of the accountable
variance. Such information may have relevance in the determination
of critical cutting scores for sectioning and placement.
It can be observed that Applied Mathematics has a negative value
of -3.77 which means that it is a suppressor variable. Men considered
individually this variable seems to hinder prediction of the grade in
Art Alppreciation but, when considered as part of the battery, it
adds to the validity of the prediction by subtracting invalid variance
from the valid predictors.

55
Finally it is necessary to present sortie information about the
regression equations for each criterion course. The equations have
been written in both raw score (b) and standard score (Beta) form
for each criterion variable. For purposes of this discussion, refer-
ence will only be made to the Beta weight values.
The main reason for developing a regression equation is to
predict the most likely criterion value from known measurements
in the predictor values. If the multiple coefficient of correlation
value was 1.00 ue could predict the criterion grade with complete
accuracy and the errors of prediction would be zero. If Rc= 0.00,
predictions would be futile. Between these extremes predictions
can be made with some degree of error and the higher the correlation
the more accurate the prediction.
To interpret the Beta weight regression equation for Art 101
we may say that for every unit increase in Applied Mathematics,
Art 101 decreases by .1663 unit; for a unit increase in Reading Speed,
Art 101 decreases by .1554 unit; for a unit increase in Vocabulary,
Art 101 increases by .2569 unit, etc. Thus if the standard score value
for each of the indicated predictor variables were known we could predict
the student's grade in Art Appreciation within the limits of the standard
error of multiple estimate.
Determination of Degree of Significance BetweenY.V.C. and w.m.T. Criteria
After the regression equation, Re, Rc2and percentage of variance
accounted for by each significant predictor variable for each criterion
course has been surveyed, i logical question could be asked about the

56
extent to which these statistics compare with equivalent statistics
obtained by the Er.P.C.LP. An answer to the question of the relevancy
in utilizing prediction equations based on senior colleges for the
same purpose at junior colleges is vital. Earlier studies concluded
that these-two types of institutions were serving different functions-
and meeting different educational needs, and evaluative comparisons
were often inappropriate. Therefore, it is necessary to determine,_
if possible, -whether Y.V.C. is justified in using the data provided
by the Er.P.G.T.10s or if local regression equations and percentile
tables need to be created.
The fact- that the -criterion groups for Y.V.C...and
are. rased on different-populations besides being defined" in a differ
ent manner leads to the conclusion that the results of any type of
test.for significance should be suspect.. With a full awareness of
the existance of these conditions it was decided to determine if a
significant-difference existed - between seven criterion.courses at
Y.V.C. and equivalent Er.P.C.T. prediction areas considered to be
roughly comparable.
Since two independent - samples existed with no possibility of
matching of .samples it -was decided to utilize the standard deviation
values for each group and coDpute the F ratio. By testing -the signi-
ficance of differences between stand!rnadElviations it could be deter-
mined-whether or not the two independent variances could probably
have arisen by random sampling from the same population of observa-
tions, or from two populations with the same variance. Table VI
presents the findings for the seven chosen areas of comparison.

57
Course
Table VIF Ratio Table for Significant
Difference Between Independent
S12 S22
Variance*
df1
df2
Biol. 101 362 316 362 1.33 **
Chem. 104 121 2,096 121 1.41 ***2096
Econ. 107 237 2,151 237 1.092150
Engl. 101 969 4,754 969 1.62 ***4754
Math.104 272 2,546 272 1.49 ***2545
Psych. 101 689 2,505 689 1.31 ***
2505
Soc. 101 459 2,596 559 1.19 ***2595
* Only for those criterion areas where it is felt a comparisonis legitimate between Y.V.C. and W.P.C.T.P.
** 1:4 .05
*** p. .01
The results of this table could have been anticipated bu2 t are
nonetheless interesting. The equation for an F ratio is F=a1 and the
ratio that satisfies the null hypothesis completely is equal2to 1.00. As
the ratio departs from 1.00 the differences are greater.
Because of these findings no further attempt will be made to make
evaluative comparisons between the two groups. However, in Chapter V
a descriptive comparison will be made between percentile tables to ascer-
tain whether it might still be possible to utilize the If.P.C.T.P. published
data or if it will be necessary to develop local criterion data on a con-
tinuing basis.

58
Even though a significant difference is assumed to exist between
the tuo groups one still cannot help but think that such a difference
results from a difference in degree rather than kind. It would seem
logical that the same abilities such as verbal ability, reading a book,
taking notes, questioning, etc., which are required for success at
the senior institutions would also be necessary at the junior college.
So while an apparent difference existL between the two populations
it would seem reasonable to attribute it to selective admissions and
a higher level of learning skill devalopment and potential rather than
ascribe it to differcnt efills entirely.
Each community college could produce its own testing program and
probably increase the predictive accuracy for their students but the
cost and time would not warrant the small amount of gain over the
W.P.C.T.P. current test battery. However, in view of the findings to
this point, it is apparent that Yakima Valley College would profit
most by continuing to supply data and support the existing program as
long as it remains able to measure and predict at its current level
of accuracy for the Y.V.C. student.

59
SUMMARY
The multiple regression equations in standard score and raw
score form were generated for each Y.V.C. criterion area. In addi-
tion the coefficient of multiple correlation, coefficient of multiple
determination and percentage of variance accounted for by each
significant contributing variable were computed. The size of Re for
most of the criterion courses gave considerable support to the belief
that the test is applicable at Y.V.C.
With an awareness of the limitations imposed on any statistical
test of significance between Y.V.C. and W.P.C.T.P. data because of
differing criteria and a more select population, an attempt was made
to determine if a real difference was present. Seven criterion courses
at Y.V.C. were selected to be tested against W.P.C.T. prediction areas
considered to be somewhat comparable. With the exception of Economic
Geography it was determined that a real difference in the samples
existed at the .05 level of significance or better. Thus there would
be no purpose in making any evaluative comparisons but descriptive
differences could be noted.
The data would seem to indicate that it would be possible to
increase the accuracy of measuring academic success by developing
a Y.V.C. battery. However, such a project, al-ay tit could possibly
increase the predictive accuracy tc a modicum degree, would probably
not be worth the time, expense, and effort. By continuing to supply
data which can be used to revalidate and update the test as well as
establish relevant norm group data, Y.V.C. can profit from using the
existing W.P.C.T.P. battery.
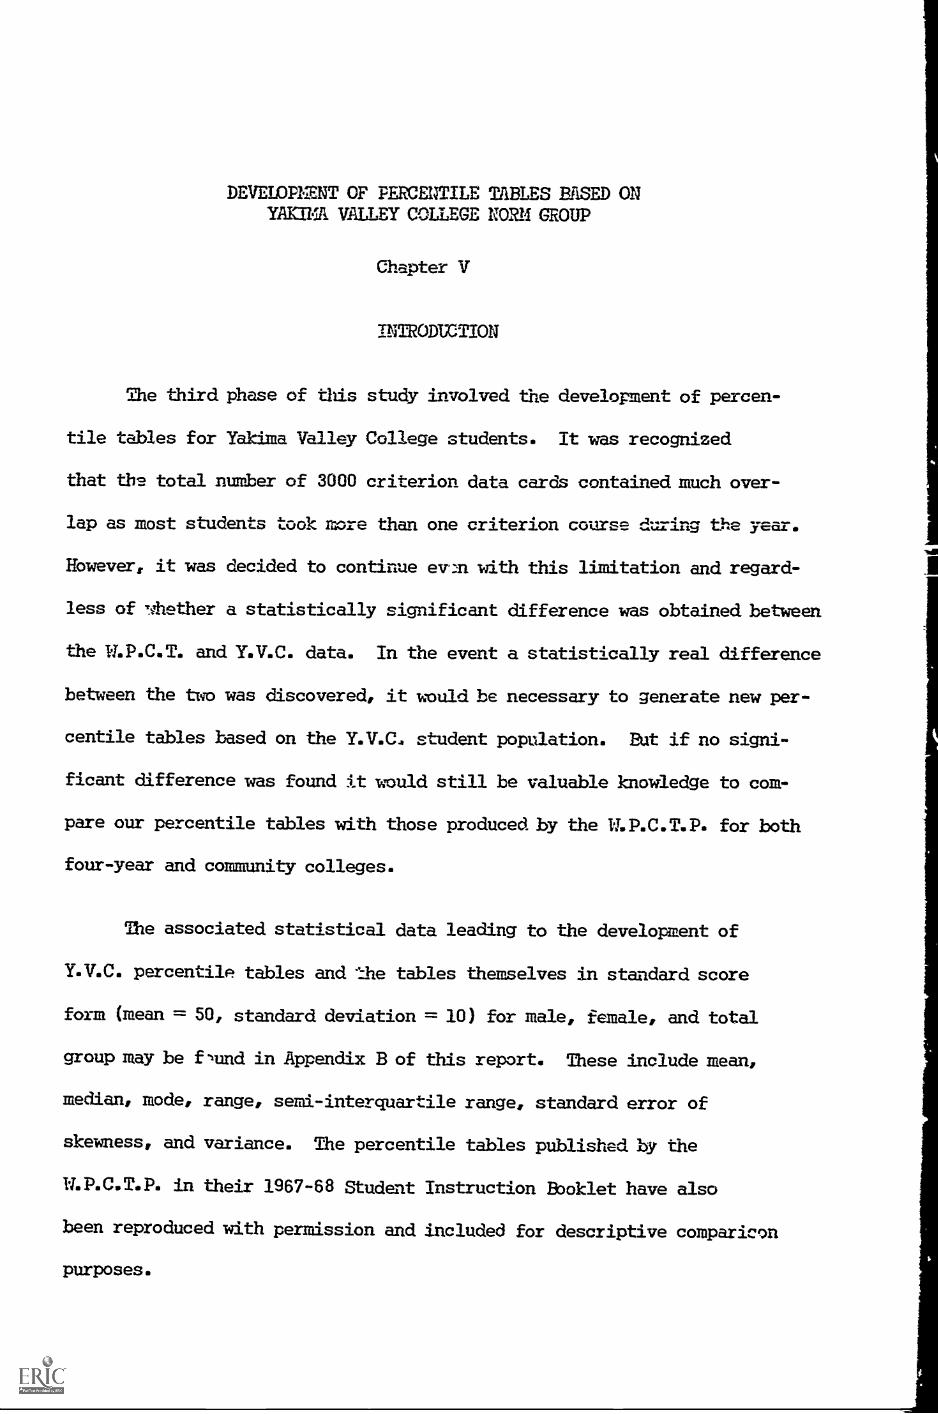
DEVELOP} ENT OF PERCEIrTILE TABLES BASED ONVALLEY COLLEGE NORM GROUP
Chapter V
INTRODUCTION
The third phase of this study involved the development of percen-
tile tables for Yakima Valley College students. It was recognized
that the total number of 3000 criterion data cards contained much over-
lap as most students took more than one criterion course during the year.
However, it was decided to continue evm with this limitation and regard-
less of whether a statistically significant difference was obtained between
the 11.P.C.T. and Y.V.C. data. In the event a statistically real difference
between the two was discovered, it would. be necessary to generate new per-
centile tables based on the Y.V.C., student population. But if no signi-
ficant difference was found it would still be valuable knowledge to com-
pare our percentile tables with those produced by the W.P.C.T.P. for both
four-year and community colleges.
The associated statistical data leading to the development of
Y.V.C. percentile tables and the tables themselves in standard score
form (mean = 50, standard deviation = 10) for male, female, and total
group may be fund in Appendix B of this report. These include mean,
median, mode, range, semi-interquartile range, standard error of
skewness, and variance. The percentile tables published by the
Er.P.C.T.P. in their 1967-68 Student Instruction Booklet have also
been reproduced with permission and included for descriptive comparicon
purposes.

61
Comparison of Y.V.C. Percentile Tables forYale, Female, and Total Group
None of the observations of discrepancies between percentile
levels for each sex/Tor the Y.V.C. versus Er.P.C.T. percentile values
has been statistically tested to determine if a significant difference
exists. The difficulty in equating criterion areas for comparison
purposes and sample size were factors in this decision. Therefore, we
only bill ro-Pent absi.rvations and trends between Y.V.C. and W.P.C.T.
,...muuunity college and all-college percentile tables, This is don with
the awareness that differences between the Y.V.C. and community college
percentile tables may be but probably are not statistically significant.
However, the obtained differences between the Y.V.C. percentile table
and the all-college table would probably be real since the latter table
is based primarily on four-year college and university students.
A comparison was first made between males and females at the 50th
percentile for Yakima Valley College students. The females show better
high school cumulative averages in all six designated areas. then com-
paring test score values corresponding to the 50th percentile for both
groups it is observed that the females score higher in all of the verbal
measures except Reading Speed. However, the males have higher standard
scores for the quantitative measures such as mathematics, quantitative
skills, spatial ability and meeianical reasoning. It is interestiag
that males have higher test scores in mathematics but a lower high
school cumulative average in mathematics than females. It is hypothe-
sized that the test scores reflect differences in ability while the

62
discrepancy in high school mathematics represents differences in
grading practices.
The same types of discrepancy between males and females are noted
at both the 25th and 75th percentile levels. The greatest degree
of difference between the sexez occurs in English with foreign
languages and natural sciences also sh=ing a divergence. The high
Esehool electives have the closest degree of correspondence between the
sexes at all percentile levels.
Men comparing the percentile table for the total group with
each sex one is immediately attracted to the observation that the
total compares much more closely with the male percentile table
than the table for females. It could be speculated that the higher
high school averages attained by females permits them to meet the
more stringent entrance requirements of the four-year colleges and
universities of the state and they thus matriculate at that level. The
males, on the other hand, must begin their higher education at the
community colleges which do not have such rigid admissions qualifica-
tions by state law. Therefore, the majority of freshmen nten who
desire to begin their collegiate careers must do so at the two-year
level and this differential male/female ratio is reflected in the total
group table at Y.V.C. More will be said on this when comparing the
community college and all-college norm published by the
Comparison of Y.V.C. and Er.P.C.T.Percentile Tables
The following comparisons will be made between the total group

63
table for Y.V.C. and those tables produced by the I7.P.C.T.P. in their
1967-68 Student Instruction Booklet. The inclusion of a percentile
table for community college students is based on data supplied by six
community colleges including Y.V.C. for a study of this problem by
Drs. Clifford and Patricia Lunnekorg1
An straluation of the percentile table for Y.V.C. with the one
generated for community college students shows the two to be almost
identical. The largest discrepancy in the high school cumulative
averages at the 50th percentile is only .2 for English and the largest
difference between test scores is only 2 standard score points on
English usage, Reading weed, Quantitative skills, and Mechanical reason-
ing. With the exception of a 4 standard score point differential on
Mechanical reasoning the two tables are within the same discrepancy as
the 50th percentile for high school cumulative averages and within 3
standard score points for both the 25th and 75th percentile levels.
Based on observation it appears that our data and, indirectly, our
student population, are almost identical to the students in other com-
munity colleges in Washington. There is some error in this last state-
ment unless the assumption is valid that the six two-year colleges con-
tributing data for the development of community college percen-
tiles are representative of all the junior and:community colleges of the
state. In any event, can nave as much information to assist their
students to understand their W.P.C.T. data report by using the table
1Dr. Clifford Lunneborg and Dr. Patricia Lunneborg. "Community College
Norms (1963-1965) for the Washington Pre-College (.P.C.T.) Test Batteryand High School Grades." Bureau of Testing Project No. 366-520,University of Washington, :April 1967.

64
generated by W.P.C.T.P. as by developing their own norm group. It would
be necessary however, to periodically validate the table to check for
changes in student population characteristics and continue to supply
data for inclusion in studies by 11.P.C.T.P. as part of their constant
relliny to revise the nnrm ornaTe.
The readar is now. invited to note comparable areas at the 25th,
50th, and 75th percentile levels between the Y.V.C. Total Group
Table and the 1.T.P.C.T.P. All-College Table. The U.P.C.T. All-College
percentile table is predictably higher than the one for Y.V.C. The
higher admissions requirements produce a more select population and
this is reflected in the test scores. Also the norms for former
group includes performance in a four-year car:._a,:altun in many cases
versus a single course area for Y.V.J. The entering university
freshman has been found to have higher potential and more sophisticated
learning skills than the entering junior college freshman. In addition,
the university student probably has greater motivation to learn and the
emotional and social maturity to profit from his experiences. These
factors seem to be lacking or at least not developed to the same degree
in the junior college student. This is not meant to imply that all
that is needed is training because learning ability may be much lower
but, if the desire to learn and some specific learning skills can be
developed, the student could transfer to a four-year college or university
and be prepared, within limits, for the challenge.
This fact may be put to good use in counseling a prospective
college student who may have some unrealistic levels of aspiration in
relation to measured achievement and ability. By plotting the student's
65
scores on both the four-year and community college percentile tables
he can be graphically shown the percentile level he attains as compared
to each population. This should have meaning for such a student.
:-,11Yrtrny'vr
There appears to be some difference between TIWIe and female
performance as reflected in the percentile tables for Y.V.C. The
feTWes are consistently higher in all measured high school areas.
The females also show higher verbal test scores than males but the
reverse holds for quantitative measures. It is suggested that the
test score differences are probably due to native ability and the
high school averages reflect grading practices.
The total group table conforms more closely to the male norms
than for the opposite sex. This could be the result of a greater
male to female ratio at the two-year college which, in turn, could
be the result of lower average high school performance and lack
of development of basic learning skills. This factor would deny
many male students of the opportunity to enter the four-year insti-
tutions directly upon leaving high school and force them to attend
the community college. It is fully recognized that many other
factors besides G.P.A. play a part in the student's dec:Izion to cro
to a junior college first with the idea of transfering but certainly
past high school performance is a major reason.
The Y.V.C. total group percentile table is almost identical
with the community college table published by the W.P.C.T.P. The
differences between the two in most cases are so slight that they

66
may reasonably Le attributed to chance factors. Therefore, the
coniunity college table published by the program is probably just
as applicable to Y.V.C. students as one which is produced by the
college itself and there is no need to anya4^4"^ 4":4rr .6.111M1-2-
1.0
true as long as the college periodically conducts a validity check
and continues to be part of the sample group from which the per-
centiles are calculated.
There is, in all likelihood, a significant difference between
corresponding scores for the W.P.C.T. All-College and Y.V.C. Total
Group percentile tables. A consideration was given to some of the
factors which may account for this real difference such as development
of learning skills, social and emotional readiness to profit from the
experience, etc. Finally it was suggested that pointing out the
discrepancies between the two tables may help the student with
unrealistic levels of aspiration.

CONCLUSIONS AND RECOMENDATIONS
Chapter VI
CONCLUSIONS
This study was initiated out of an awareness that many questions
were being asked about the junior college but few answers were forth-
coming. It is not certain whether any more answers exist now, but
this project has provided impetus for further exploration and analysis.
A second purpose of this study was to demonstrate the need for
an organized and dynamic program of institutional research at Y.V.C.
and the results, as summarized at the end of each chapter, show what
can be provided if the opportunity and support to do research is
available. It is hoped that, in addition to convincing both adminis-
tration and faculty of the need for research, an eagerness to utilize
the findings to implement new programs or revise old ones will result
if the evidence warrants it. Research for research sake is not
really appropriate for the junior college at its present stage of
development. Ehat is needed are the descriptive studies which define
and delineate the parameters of cm:minify oral=ga mrlw-.action.
The literature review revealed a difference between the two-
yegr and four-year college populations and the findings of this
project tended to corroborate this. Just what these differences
may be however, is very difficult to isolate and define. Uhether
completely different abilities underlie success at a senior insti-
tution versus a junior college or whether the difference is just

68
differing amounts of the same learning skills and maturity levels
is a question that has not been conclusively answered.
A relatd finding of this study was the apparently insignifi-
cant difference between the Y.V.C. sample and the data supplied by
other community colleges to develop Washington community college
norms. Although other states report a wide divergence in student
performance between community colleges such does not appear to be
the case between at least six Washington community colleges,
(See chapter V). Just how relevant this conclusion is for the
other two-year colleges in this state can only be determined by
studies similar to this one at other institutions.
The overall findings strongly suggest that the Er.P.C.T. test
battery is doing a reasonably good job in predicting student
academic behavior in the sixteen criterion course areas at Yakima
Valley College. It is possible that a local test battery could, be
constructed which would enhance the predictive validity for Y.V.C.
students, but is doubted that the increment would, warrant the
expenditure in cost, time or facilities. For the present the
W. P.C.T. P. and their instrument seem to be the best available source
for information about student academic potential at Y.V.C.
The regression equations and percentage of variance values
for the significant predictors of each criterion area could, be
utilized on a pilot study basis to test their usefulness in
selecting students with the greatest probability for success. The

69
obtained equations could be set up to predict a student's per-
formance 4 tmch of the dregs arid then test fcr any significant
difference between the gradepredicted. by W.P.C.T.P. and the one
predicted at Y.V.C. Also a similar study could be repeated by
combining this project's data with data for student performance
in the same criterion areas this year.
RECOMMENDATIONS
Predicated on the findings of this project and the conclusions
which were derived, the following recommendations will be made for
the perusal and consideration. of Yakima Valley College faculty and
administration:
1. The development of a pilot project to utilize the
Y.V.C. regression equations to place a sample of
students in the criterion classes and compare their
performance with a control group of students who
entered the same classes by free choice. If a
significant difference is found to exist then some
support would be found for more stringent placement
of students into areas where their initial probability
of success is greatest.
2. Yakima Valley College should continue to utilize
the U,P.C.T.P. data report and place more emphasis on
the admissions requirement that the data report be in
the student's folder at the time of his matriculation.
Since the test scores appear to be relevant to predict
study ,t performance, the data must be available before
it can be useful.
3. The college extends its support of the II.P,C.T.P. by
using the test and supplying data for research pur-
poses when the need for it can be justified. Only
by remaining a part of the norm group will Y.V.C.
continue to receive useful information on its students.
4. Develop a more comprehensive and organized research
program at Y.V.C. to provide empirical data upon
which to base decisions that need to be made. This
study marks the beginning of a dynamic program that
will be fruitful if allowed the freedom to develop.
Of course any research program is only as good as the
people who contribute to it. It is hoped Y.V.C. will

7a
recognize that research seeks information ratherthan threatens those who participate.
5. Continue to revalidate the percentile norms based onY.V.C. data and compare them with those generated bythe 1,L.P.C.T.P. If the percentiles are an accurate
presentation of the Y.V.C. student population, much
relevant and valid data will be available. For example,
the instructor could determine a particular percentilelevel as being minimal for success in one of the
criterion courses. Since the most significant pre-
dictors are now known, the exact standard score value
corresponding to the established percentile level could
be ascertained. At least the placement would be based
on empirical data rather than serendipity and it mould
be possible to revise the critical cutting scores if
future findings warranted it.
6. Communicate with other community colleges to providemutual assistance in research areas of common interest.
Hopefully, the other community colleges can. profit from
the advances and errors made by this study and consider
similar or related studies at their respective institu-
tions.

APPENDIX A

72
TABLE VII
PREDICTOR AND CRITERION CODEREGRESSION EQUATIONS AND PREDICTOR
Predictors
NUMBERSSELECTION
FOR THE
Criterion
1. English Usage 26. Art Appreciation
2. Spelling 27. General Biology
3. Reading Comprehension 28. Intro, to Business
4. Mechanical Reasoning 29. Prin. of Accounting
S. Spatial Ability 30. Inorganic Chemistry
6. Applied Mathematics 31. Economic Geography
7, Reading Speed 32. Intro, to Education
8. Vocabulary 33. College English
9. Quantitative Skills (A) 34. Personal Health
10. Quantitative Skills (B) 35. History of Pacific N. W.
11. Quantitative Skills (C) 36. College Algebra
12. Mathematics Achievement 37. Intermediate Algebra
13. High School English 38. Intro, to Philosophy
14. High School Foreign Language 39. Intro. to Psychology
15. High School Eathmatics 40. Intro. to Sociology
16. High School Natural Science 41. Intro. to Public Speaking
17. High School Social Science
18. High School Electives
19. Sex
20. Age
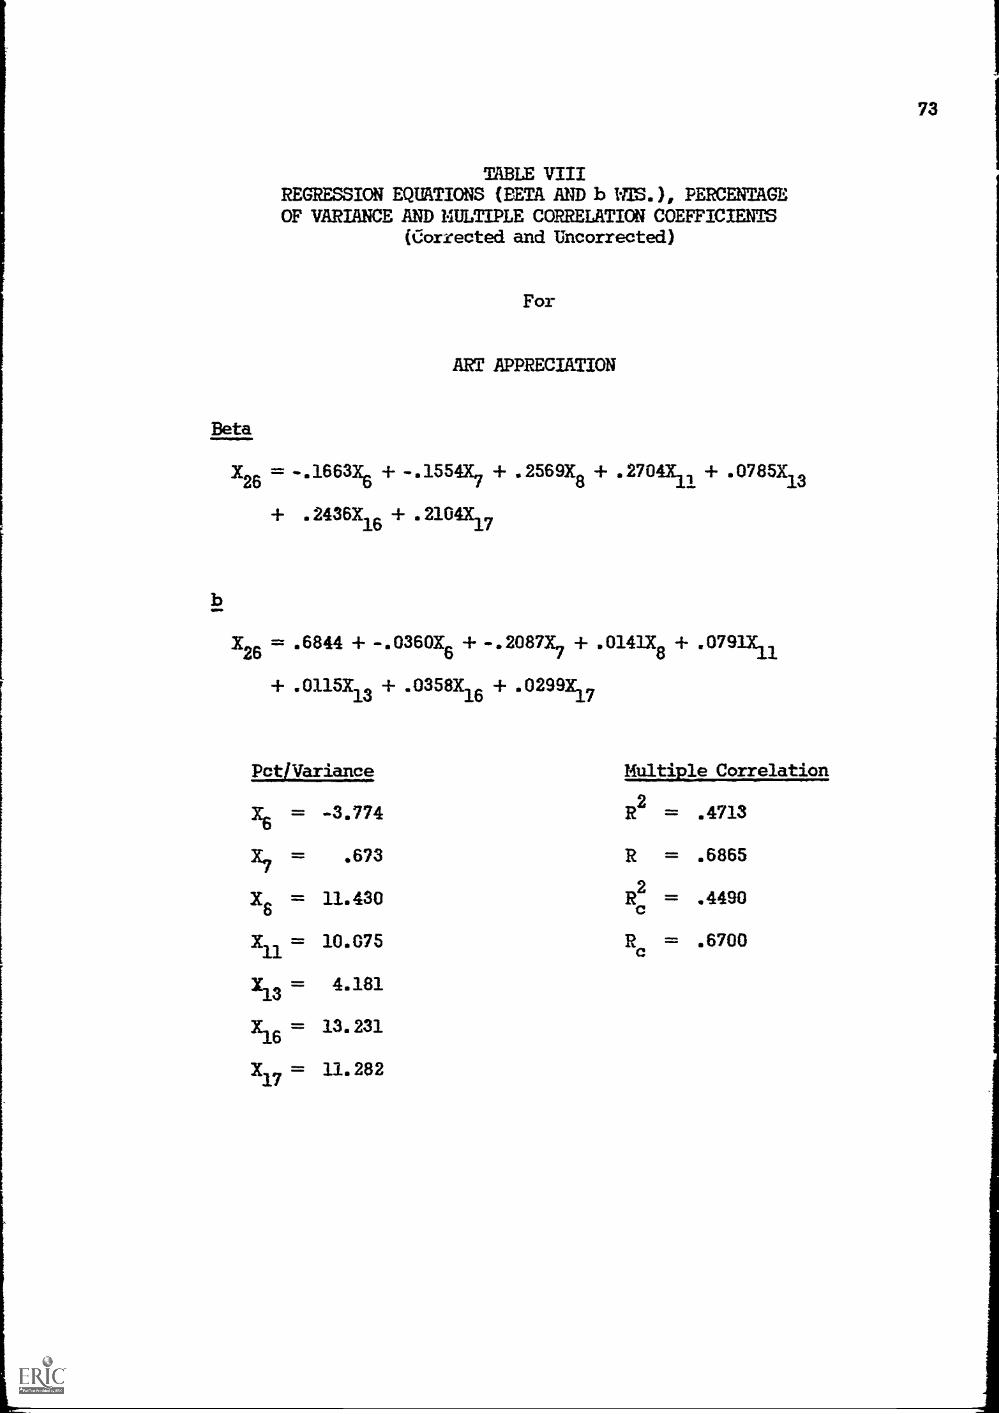
73
TABLE VIIIREGRESSION EQUATIONS (BETA AND b IITS. ), PERCENTAGEOF VARIANCE AND MULTIPLE CORRELATION COEFFICIENTS
(Corrected and Uncorrected)
Beta
= -.1663X6 + -X26
+ .2436X16+
X26 = .6844 +
For
ART APPRECIATION
. 1554X7 + .2569X8
+ .2704X11 + .0785X13
. 2104X17
-.0360X6
+ -.2087X7 + .0141X8 + .0791X11
+ .0115X13 + .0358X16
Pet/Variance
+ .0299X17
Multiple Correlation
x6 =
X7
XS =
X11 =
X13 =
X16 =
X17 =
-3.774
.673
11.430
10.075
4.181
13.231
11.282
R2
R
2
Re
=
=
=
=
.4713
.6865
.4490
.6700

74
TABLE IXREGRESSION EQUITIONS (BETA AND b WIS.), PERCENTAGEOF VARIANCE AND MULTIPLE CORRELATION COEFFICIENTS
(Corrected and Uncorrected)
For
GENERAL BIOLOGY
Beta
X27 = .0863X3+ .0935X
4+ -.1064X7 + .0836X
8+ -.088X
9+ .1704X13
+ .0697X15
+ .0842116 + .3306X17 + -.0656X19
X27 = -.4348 + .0179X3
+ .0165X4 + -.0234X7 + .0059X8
+ -.0356X9
+ .0298)(13 + .0118X1 + .0146X16
+ .0562X17
+ -.1716X1
Pet/Variance Multiple Correlation
X3 = 3.024 R2 = .4067
X4 = .979 R = .6377
X7 = .059 Re2 = .389
X8 = 3.102 Re = .6238
X9 = 1.881
X13 = 9.259
Xis = 2.987
X16 = 4.071
X17 = 19.199
Xi9 = -.117
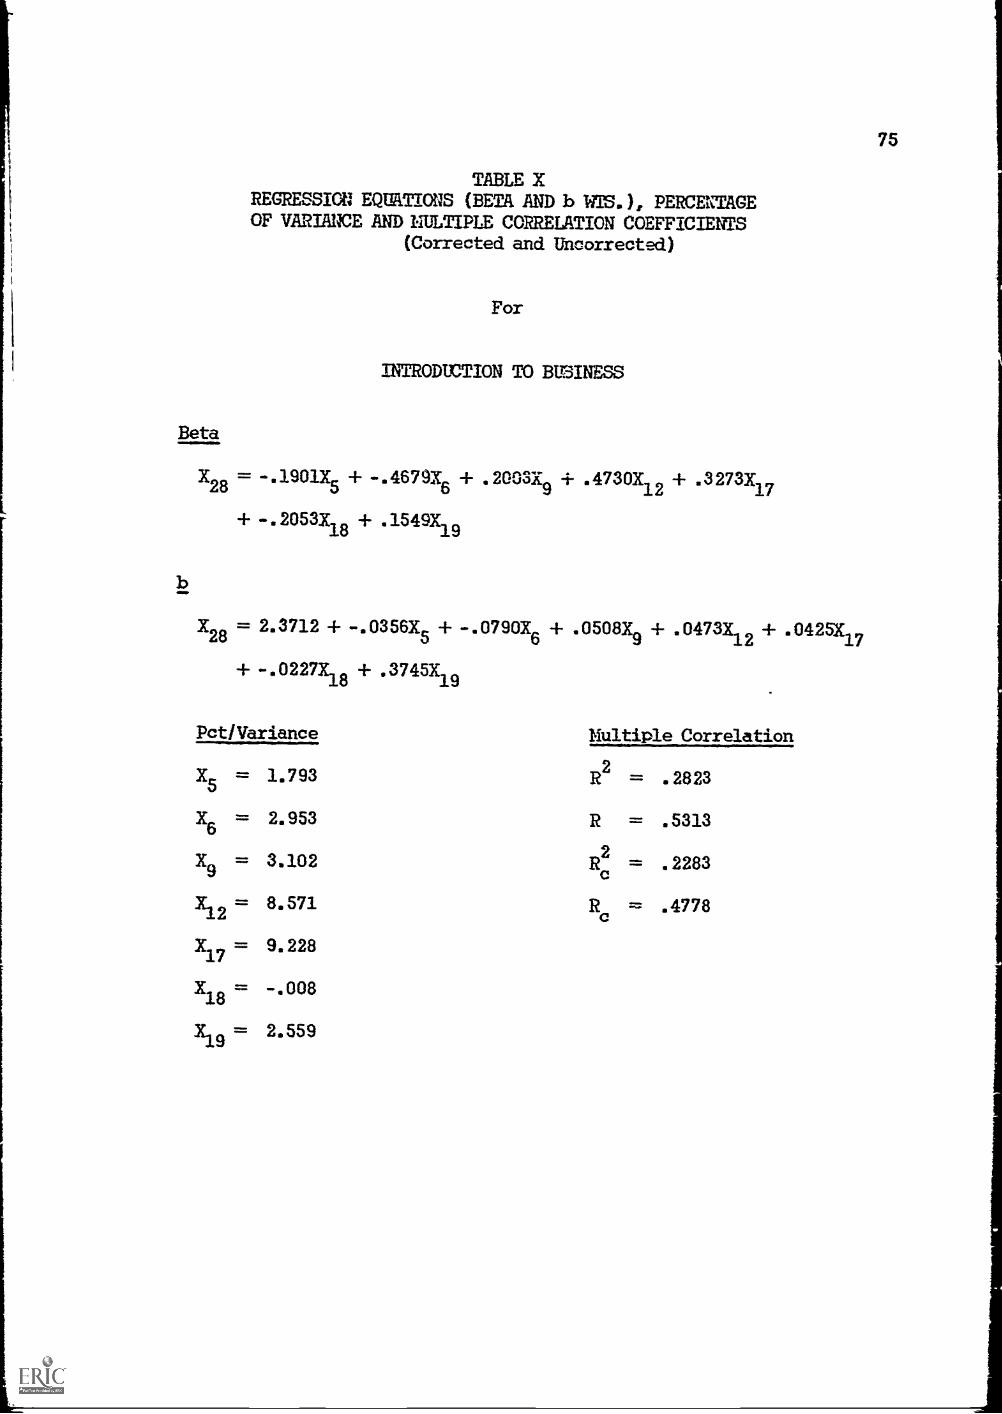
75
TABLE XREGRESSION EQUATIONS (BETA AND b WI'S.), PERCENTAGEOF VARIANCE AND 11ULTIPLE CORRELATION COEFFICIENTS
(Corrected and Uncorrected)
For
INTRODIETION TO BUSINESS
Beta
X28 = -.1901)15 + -.4679X8 + .2003X9 + .4730X12 + .3273X17
+ -.2053X18 + .1549X19-19
X28 = 2.3712 + - .0356X5 + - .0790X6
+ -.0227X18 + .3745X19
Pct/Variance
+ .0508X9 + .0473X12 + .0425X17
Multiple Correlation
X5 =
X6 =
X9 =
X12=
)17 =
X18 =
X_9
=-1
1.793
2.953
3.102
8.571
9.228
-.008
2.559
R2
R
2
Rc
=
=
=
:----
.2823
.5313
.2283
.4778
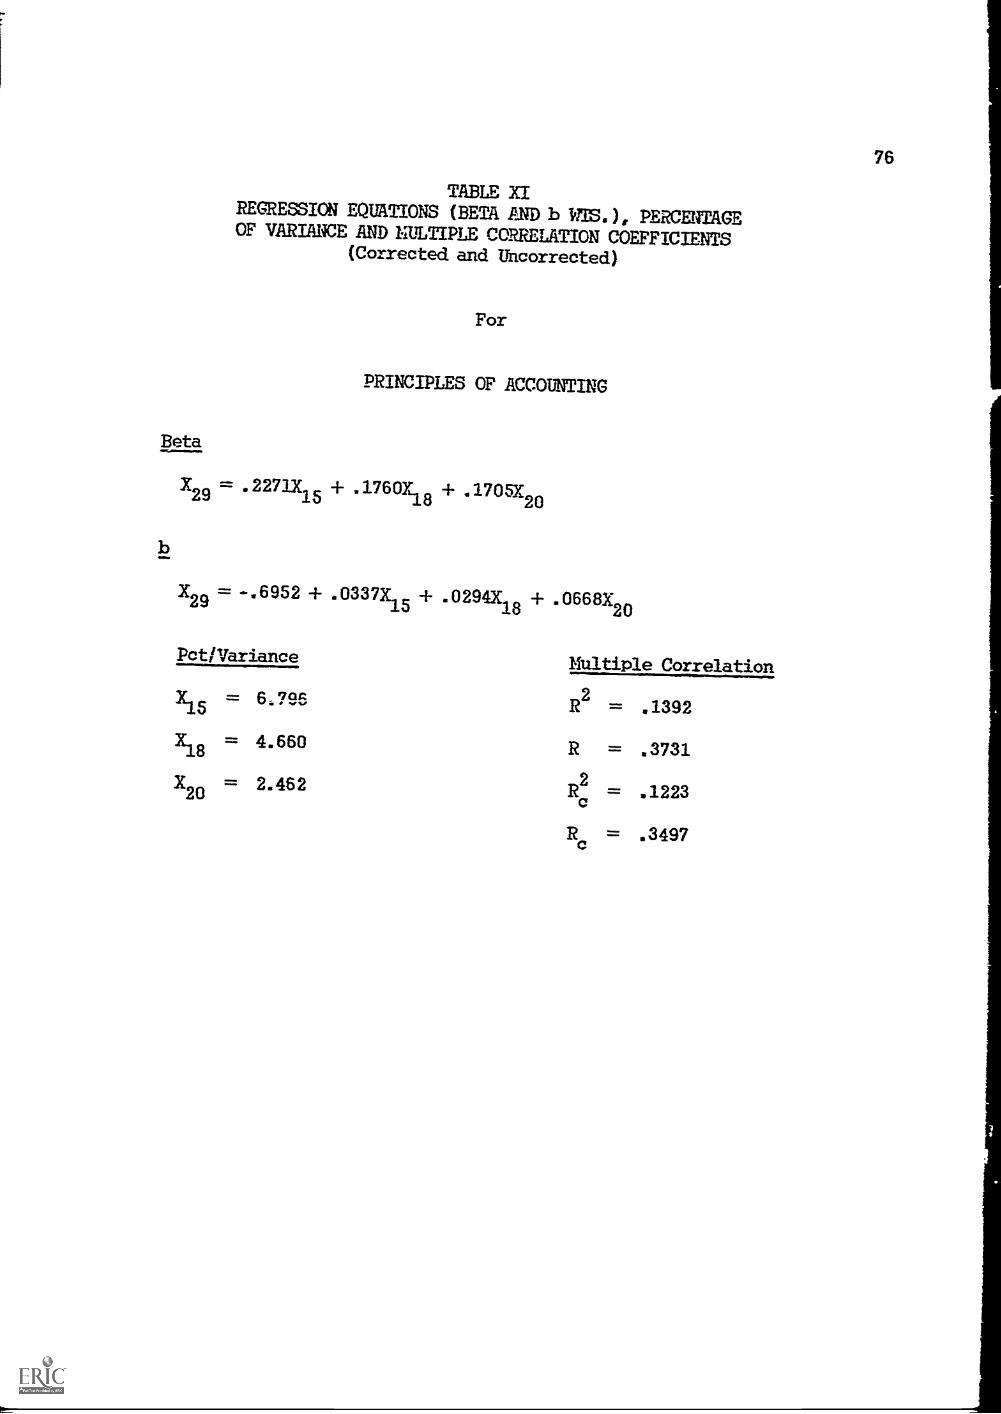
Beta
b
TABLE XIREGRESSION EQUATIONS (BETA AND bilTS.), PERCENTAGEOF VARIANCE AND MULTIPLE CORRELATION COEFFICIENTS
(Corrected and Uncorrected)
For
PRINCIPLES OF ACCOUNTING
X29 = .2271X15 L
+ .1760Y + 1705X18 20
X29 = -.6952 + .0337X15 + .0294X
18 + .0668X20
Pct/ Variance Multiple CorrelationX15
X18
X20
=
=
=
6.796
4.660
2.462
R2
R
2
Re
=
=
=
=
.1392
.3731
.1223
.3497
76

Beta
b
TABLE XIIREGRESSION EQUATIONS (BETA AND b OS. ), PERCENTAGEOF VARIANCE AND MULTIPLE CORRELATION COEFFICIENTS
(Corrected and Uncorrected)
For
INORGANIC CHEMISTRY
X30 = -.0929X
+ .2696X/5
+ -.2039X5
+ .3940X16
+ .1673X7 + -.1646111
+ .1875X20
+ .3327X12
X30 = -3.9772 + -.0132X2 + -.0535X5
+ .448X12 + .0462X15 + .0776X16
Pet/Variance
+ .0337X7 + -.0517X11
+ .1167X20
Yealtiple Correlation
X2 =
X5 =
-1.691
-1.148
R2
R
=
=
.5014
.7081
X7 = 3.2272 = .4645
Xii = -2.719 Re = .6815
X12 = 14.262
X15 = 14.201
X16 = 21.580
X20 = 2.424
77
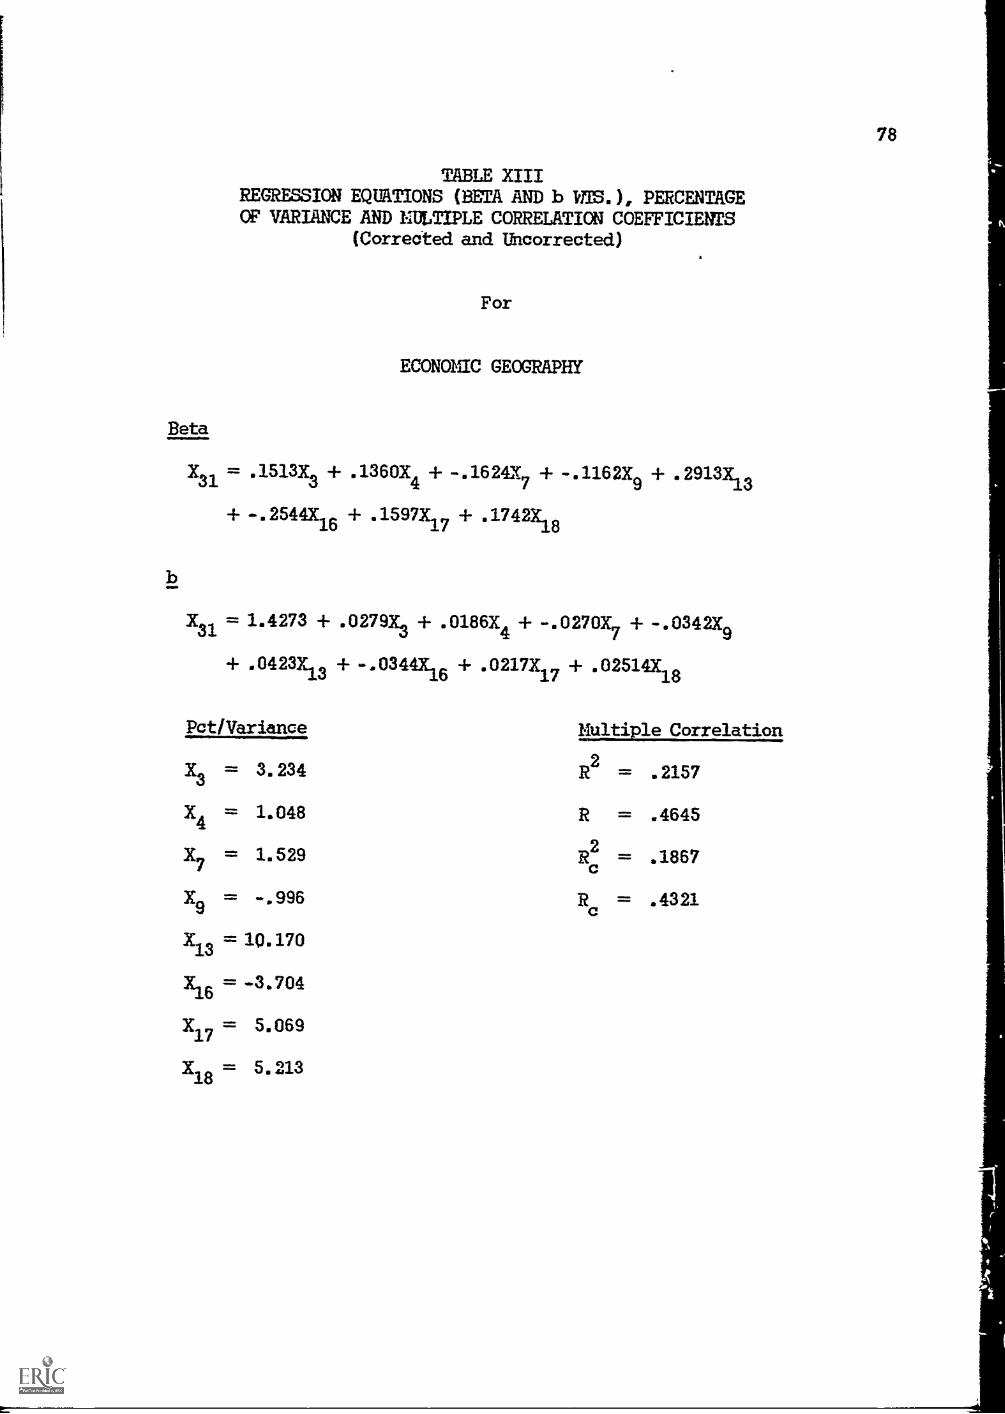
78
TABLE XIIIREGRESSION EQUATIONS (BETA AND b IITS. ), PERCENTAGEOF VARIANCE AND MULTIPLE CORRELATION COEFFICIENTS
(Corrected and Uncorrected)
For
ECONOMIC GEOGRAPHY
Beta
X31 = .1513X3 + .1360X4 + -.162417 + -.1162X9 + .2913X_--i3
+ -.2544X16 + .1597X17 + .1742X18
X31 = 1.4273 + .0279X3 + .0186X4 + -.0270X7 + -.0342X
9
.0423X13 + -.0344X_6 --1.
+ .0217X17 + .02514X18
+ .0423X_-1. 1
Pct /Variance Multiple Correlation
Xs = 3.234 R2 = .2157
X4 = 1.048 R = .4645
X7 = 1.529 Rc2 = .1867
X9 = -.996 Rc = .4321
X13 = 1Q.170
x16 = -3.704
X17 = 5.069
X18 = 5.213

79
TABLE XIVREGRESSION EQUATIONS (BETA AND b WJZ.), PERCENTAGEOF VARIANCE AND MULTIPLE CORRELATION COEFFICIENTS
(Corrected and Uncorrected)
Beta
X32 = .1685X4+
+ .2060X16
+
For
INTRODUCTION 10 EDUCATION
.2910X7 + .3475X8+
.3522X17 + .1341X19
-.1402Xio + - .1850X14
+ .0986X20
X32 = .9259 + .0327X4 '+ -.0566Y + .0228X
8+ -.0291X
10+ -.0247X
147
+ .02994X16 + .0559X17
+ .3928X19
Pct/Variance
+ .0490X20
Multiple Correlation
X4
= 2.198
X7 = 5.522
X8
= 15.280
Xio = -2.354
R2
R
2
Rc
=
=
=
=
.4435
.6659
.4003
.6327
X14
= -3.903
X16
= 8.371
X17
= 16.036
X19
= 2.388
X20
= .797

80
Beta
b
TABLE XV
REGRESSION EQUATIONS (BETA. AND b YTS.), PERCENTAGE
OF VARIANCE AND MULTIPLE CORRELATION COEFFICIENTS(Corrected and Uncorrected)
For
COLLEGE ENGLISH
X33 = .0912X.3.
+ .3379X13
+ -.0882X3
1+ .0678K.8
+ .1156X6
+ .0784X20
+ .1737X8-1- .0908X12
X33 -.3960 + .0059X3 + -.0155X3 + -.0236X6 + .0101X8
+ .0104X12 + .0504X13 + .0105X18 + .0347X20
Pet/Variance Multiple Correlation--2'
X1 = 3.414 R
X3 = -1.988 R
= .2508
= .5008
= .2442
= .4942.
X6 = -1.759 R2c
X8 = 5.806 Rc
X12 = 1.868
X13 = 15.499
XI = 1.996
X20= .240

TABLE XVIREGRESSION EQUATIONS (BETA AND NITS.), PERCENTAGEOF VARIANCE AND MULTIPLE CORRELATION COEFFICIENTS
(Corrected and Uncorrected)
For
PERSONAL HEALTH
to
81
X34 = -.093411 + .0819X2 + -.0463X4
+ .0524X5
+ .1928X8 + .1021X9
+ .0617112 + .1521X, .1110X16 + .1200X17 + .0856X19 -j-..0509X20
b
X34 = -.0896 + -.0065X1 + .0108X2 + -.0072X4 + .0120X5 + .0120X8
-I- .0345X9 + .0078X12 -I- .0238X13 + .0171X16 + .0180X17 + .1944X19
+ .0270X20
Pct/Variance Multiple Correlation
Xi = -3.621
X2 = 2 858
X4 = -.106
=Xs
.988
X8 = 7.916
X9 = 3.165
X12 = 1.812
X137.150
X164.601
X175.373
"19 1.383
X20 = .052
R2 = .3159
R = .5620
R2c
= .3052
Rc = .5525

Beta
b
82
TABLE XVIIREGRESSION EQUATIONS (BETA AND b WIS.), PERCENTAGEOF VARIANCE AND MULTIPLE CORRELATION COEFFICIENTS
(Corrected and Uncorrected)
For
HISTORY OF PACIFIC NORTHWEST
X35 -.118X1 +-.1542X2
+ .0897X2
+ - 1507X4
+ .1056X5
+ .2063X8
+ -.1325X11 + .3567X13 -1
+ 1035X16+ .1301X
17 + -.1353X_9
X35 .1559 + -.0096X1
+ -.0234X2
+ .0208X3
+ -.0302X4
+ .0202X
+ .0150X8
+ -.0475X11 + .0608X13
+ .0171X16 + .0215X17
+ -.3806X19
Pot/Variance Multiple Correlation
X, = -3.027 R2 = .3172
X2 = -2.396 R = .5632
X3 = 2.595 R2 = .2837
X4 = .961 Rc = .5326
X5 = 1.329
Xs = 6.573
X11 = -.557
X13 = 16.566
X16 = 4.022
X17 = 5.818
X19 = -.149

83
TABLE XVIIIREGRESSION EQUATIONS (BETA AND b WTS.), PERCENTAGEOF VARIANCE AND MULTIPLE CORRELATION COEFFICIENTS
(Corrected and Uncorrected)
Beta
X36
= -.2220X3
+ .2400X13
b
For
COLLEGE ALGEBRA
+ .0681X4+ .0995X
7+ -.0623X
8+ -.1859X11 + .4885X
12
+ .0797X15
+ .1619X17
+ .1982X19
+ .0524X20
X36 = -1.6070 + -.0506X3 + .0117X4 + .0220X7 + -.0049X8 +-.0618X
+ .0752X12
+ .0479X13
+ 0145x15
+ .0280X17
+ .7520X19
+ .0315x20
Pct / Variance
X3 = -2.392
X4
= .675
X7
= .462
X8
= -.979
X11
= -2.738
X12
= 22.692
X13
= 10.943
X16 = 3.629
X17
= 6.964
X19
= 3.413
X20
= .105
Multiple Correlation
R2
= .4280
R = .6542
c2
= .4032
Rc
= .6350

84
Beta
b
TAME XIXREGRESSION EQUATIONS (BETA AND b PERCENT/lox.OF VARIANCE AND MULTIPLE CORRELATION COEFFICIENTS
(Corrected and Uncorrected)
For
INTERMEDIATE ALGEBRA
X37 = .3243X1+ -.1843X
8+ .1978X1 + .2431X
15+ .1962X
19
X_ = .3236 4- .0288X1 + -.0158X8
Pet/Variance
+ .0412X12 + .0483L + .6386X19
Multiple...Correlation
XI
X8 =
X12 =
X15 =
X19 =
13.689
-3.524
7.235
11.026
4.390
R2 = .3282
R = .57292
Rc = .3160
Rc = .5621

TABLE XXREGRESSION EQUATIONS (BETA AND b YTS.), PERCENTAGEOF VARIANCE AND MULTIPLE CORRELATION COEFFICIENTS
(Corrected and Uncorrected)
For
INTRODUCTION 10 PHILOSOPHY
Beta
X38 = -.2213X1 + .2712X
2 + .2365X3 +
+ -.2350X13 + .2236X
14 + .2820X17
b
85
-.1851X5 + - 1765X7 + .1855X12
+ .2047X20
X38 = .5148 + -.0155X1 + .0375X2 + .0453X3 + - .0468X5 + -.034a7
+ .0221X12 + -.0395X13 + .0274X14
Pct/ Variance
+ .0463X17 + .0948X20
Multiple CorrelationX, =
X2
X3
Xs =
X7
=X12
X13X14
X17=X20 =
-4.181
8.695
6.369
.811
.695
4.082
5.571
7.368
9.219
3.847
R2
R
2
Rc
=
=
=
=
.3137
.5600
.2518
.5018

TABLE XXIREGRESSION EQUATIONS (BETA AND b WIS.), PERCENTAGEOF VARIANCE AND MULTIPLE CORRELATION COEFFICIENTS
(Corrected and Uncorrected)
For
INTRODUCTION TO PSYCHOLOGY
Beta
86
X39 = .0982X5 + -.0695)(7 + .2419)(8 + .0794X9 + .1535X16 + .2498X17
-3X-9
= -.1129 + .0243X5
+ -.0141)(7 + .0156X8
+ .0276X9
+ .0243X16
+ .0392X17
Pot/Variance Multiple Correlations
X5 = 2.589 R2 = .3504
X7 = -1.141 R = .5919
X8 = 10.881 Rc2 = .,3445
X9 = 2.695 Re = .5869
X16=6.910
X17= 12.105

Beta
b
87
TABLE XXIIREGRESSION EQUATIONS ( Ball AND b WS. ) , PERCENTAGEOF VARIANCE AND MULTIPLE CORRELATION COEFFICIENTS
(Corrected and Uncorrected)
For
INTRODUCTION TO SOCIOLOGY
X40.0696X2 + .1223X3 + .0864X5 + -.697X7 + .2333X8 + -.146IX9
+ .16493;13 + .1413X16 + .1017151 +.1266X18 + -.0538;9 + .0645X20
X40 = -.4804 + -.0094X2 + .0244X3
+ .0214X5
+ -.0138; + .0153X8
+ -.0522X9 + .0263X13 + .0220X16 + .0155X17 + .0220X18 + - '1501 Y19+ .0317X
20
Pet/Variances Nultiple CorrelationsX2 = .1.857 R2 = .3514X3 = 4.729 R = .5928X5 = 1.818 Rc
2 = .3329
X7 = -.230 Re = .5769X8 = 9.969
X9 = 2.542
X137.780
X16 6.289
X174.658
x18 = 4.683
Xig = -.242
X20 078
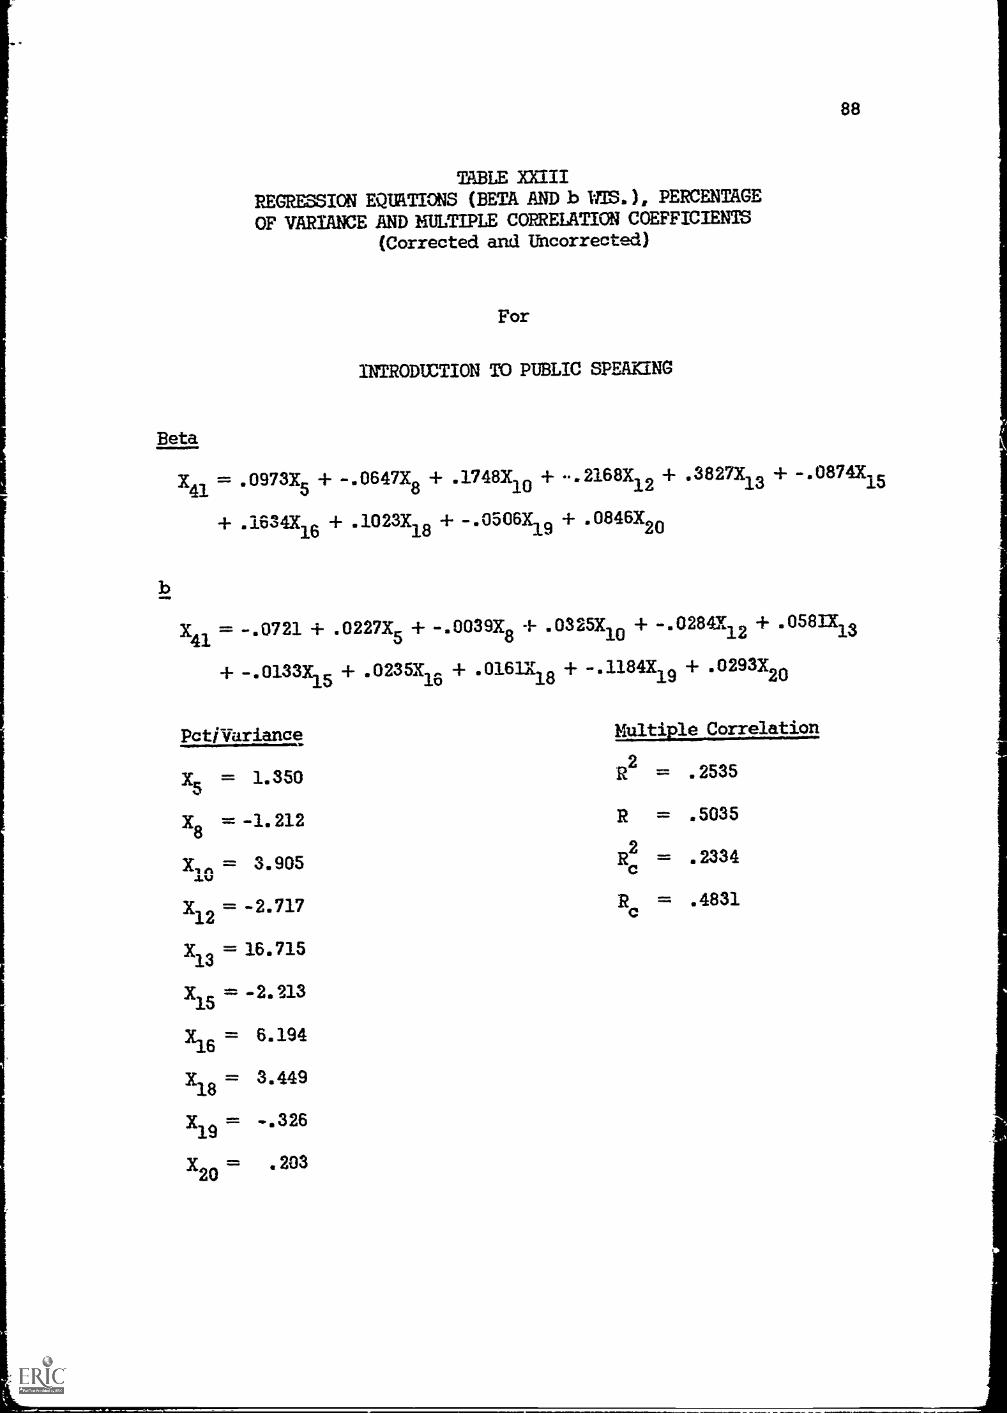
TABLE manREGRESSION EQUATIONS (BETA AND b WIS.), PERCENTAGEOF VARIANCE AND MULTIPLE CORRELATION COEFFICIENTS
(Corrected and Uncorrected)
For
INTRODUCTION TO PUBLIC SPEAKING
Beta
x43..0973X5 + -.0647X8 + .1748X10 + .2168X12 + .3827X13 + - .0874X35
+ .1634X18 + .1023X18 + -.0506X19 + .0846X20
88
X41 = -.0721 + .0227X5+ -.0039X8
+ .0325X10+ -.0284112 + .0581X13
+ -.0133X15 + .0235X18 + .0161X18 + -.1184X19 + .0293X20
Pcti Variance Multiple Correlation
X5 = 1.350
X8 = -1.212
X, et = 3.905.1.1.1
X12 = -2.717
X13 = 16.715
X15 = -2.213
x16 = 6.194
X18 = 3.449
X19 = -.326
X20 = .203
R2 = .2535
R = .5035
Rc2 = .2334
Rc = .4831

APPENDIX B

rn
TABLE XXIV
YALE
BE GENTILE TABLE & CTAM0APD SCOPE EQUIVALENT ToDETEWINE
PPEDICTOT? DATA LEVEU7, AT YAKIMA VALLEY COLLEGE
Minter, s prim - '66-'67)
High School Cumulative Averages co
Via)
a
gkt)
I-Iw
r-a
>C
Ord
01
0r1
.-1
-1-1
0H gi
0 @
4-1
a a
-ri
ob)
a)o)
)-IZ
.4 4-)
.1-1
r1
0 r1
CD
00P
4.1
con
° t)
r I
ts-1
r1+
4r.
:-;
Co
Ci 1
PA
Warthin ton Pre-Col leoe 'Post lerInit-
0(1
.).
4-1
ra)
to
(1)
4-'
-I-1
11 H
(11
4-1
0r-
'I
ti
1: i
4-1
rdb)
a)4-
1rd
1-;
rd4-
't'
r2
,Z0
t)1
111
p0-1
4-1
"0S
''4-
' H7,
.f:..
r1 H
f) -
0H)
Ir'
CO
H0
CD
1-4
VI
1-1
t/IIV
r ;
H 0
dikl
.HC
DH
,81-
10
04-
11-
-!ri
r:rl
(')fil
4-1
0-r
-14-
1,,
t0
Hp,
ra
Ht1
)r-
!p
A P
4r.
. ?r"
- 7
,C..,
111
1.1
r.
t,,
4.2
1--
,,LI.
J
bl F
40
b) r
dat
rd41
)rd
1:-.
;$.
41:
ird
rir
414.
-1..t
...,
loI
,vt
s-r
-If)
cc
g 0
koz co
C).,
w p.,
Cl)
0at
0.1
. ,),
r.,
47.,
0 0
i 0t ,
,,,..t
i4,
L1-
7:1
C.,.
.)11
-,r.
r:1
1:-.
)t.1
)02
,C
I .)
1 ; 0
:".::
:-(
,r-
0i
*,..,
,,
,.
., r
'I!''
'..i.
..f.
T---
99
3.8
4.0
3.8
3.9
3.9
4.0
71
72
65
7n
7A
73
72
71
71
71
71
75
95
3.3
3.5
3.5
3.5
3.5
3.7
63
63
CO
61
72
63
65
65
rn
v8
rA
90
3.0
3.0
3.0
3.0
3.3
3.5
59
58
58
57
65
59
59
62
n8
r:.!
r1
rr
85
2.8
2.8
2.8
2.9
3,0
3.3
56
55
54
55
61
56
57
SR
59
r,5
r,rt
161
r:;
80
2.7
2.6
2.7
2.7
2.8
3.2
53
53
52
52
59
54
53
57
r,7
tis
57
51
11$
75
2.6
2.5
2.5
2.5
2.7
3.1
51
51.
50
51
56
sr.
51
55
),-,
'7 , ,
51-,
sr)
70
2.5
2.4
2.3
2.4
2.8
3.0
49
49
48
49
54
50
49
51
nn
51
r,
55
51-,
65
2,3
2.2
2.3
2.3
2.5
2.9
47
48
46
48
54
50
47
52
51
'19
51
5-
r-
I,
60
2.3
2.0
2.2
2.2
2.4
2.8
46
47
45
47
52
48
46
51
rin
/18
4,1
til
!;0
55
2.2
2.0
2.0
2.0
2.3
2.7
44
46
4A
46
52
46
45
'19
Al
47
'17
50
,.
,
50
2.2
1.9
1.9
2.0
2.2
2.6
43
45
43
44
50
46
43
A8
48
46
46
49
51
45
2.0
1.8
1.8
1.9
2.0
2.5
42
44
42
43
48
45
42
46
47
45
A r-,
47
nn
40
2.0
1.7
1.8
1.9
2.0
2.4
41.
42
41
42
47
43
41
45
46
4d
4n
16
4R
35
1.9
1.5
1.7
1.8
1.9
2.3
40
41
40
41
45
43
40
44
45
'13
42
45
47
30
1.8
1.5
1.6
1.8
1.8
2.2
39
40
39
40
45
42
39
43
44
42
41
ln
41.
25
1.7
1.4
1.5
1.7
1.8
2.1
37
39
38
39
43
4n
37
42
43
41
4n
4 r!
44
20
1.7
1.3
1.4
1.5
1.7
2.0
36
38'
37
37
43
4n
36
4(1
41
4n
38
411
43
15
1.5
1.0
1.3
1.5
1.5
1.9
35
37
35
36
41
39
35
A8
39
30
37
37
/1:'
10
1.4
0.9
0.1.
1.3
1.4
1.8
33
35
34
34
38
37
33
37
S7
38
36
84
89
51.2
0.8
0.9
0.9
1.2
1.5
31.
33
32
33
34
35
31
34
34
37
34
;',1
38
1.0.9
0.0
0.8
0.8
0.9
1.0
25
24
28
32
27
34
26
31
31
37
33
27
411

r--; rn
FEALE
TABLE XXV
PE7CENTILE TABLE & 3TANDAD
1JTO DETEWITT
PPEDICTOR DATA LEVEL AT YAMIA VALLEY COLLriCIE
(Fall,
ripring - '66-'67)
High School. Cumulative Werages
112phington Pre-College Test !4,r11)1t11
r co
.4-I
co
ei
'-i(1
.1
S0,1
1
(1)
4ei
trii
r-;
(1)
Cl)
0R
S 0
r--1
0-r
-1ri
r1 0
(1)
0')
4/,:
jcy
j0
g-I
r--!
r-1
tD0
b)
1.4 g
4-)
421
-el
0 -r
l(1
)0
rcf
jiin,
45 cci?
0 0
t -1
4.1
Cr
,-.1
0-1
CO
0)
ra4
til4-
)(1
5b
4 -r
1r-
-:4
bitt.
v.,
0ta
-ri
r co
-1 0
..0
PI :
:C3
P4
:Cfr
i11
V1.
1r-
1E
.,rd
,p.,
01-:
0ri-
1(1
.)IV
1-1
Za
)9"-
-alli
rot%
7cu'
l
a.)
P4
W 0
C.1
.1 0
1.-.
'r
'C
i.,t
r,; o
W.I-
'I-
,.'
v-1
r.r
1(1
)4-
)4-
1R
I°l
)1.)
t41
r14-
)'0
'('-c
.,111
04-
1rl
r- '
VI
-r1
(,)
ti)
.r1j
4r1
...1(
-:pr
.ri
t r-.
4
r:Ir
-J:4
::::1
:'
IdC
)4-
Iir
- ,:
pf".
OA
r-tr
i'1
1.0
r13-
t hr1
4J ,r
..,;
a)
_o_
o ,v
,P
, il
riC
.,0
r1
L. 1
!.t,
,,i
''
I
'r
'$I,
C 1
IrI
99
4.0
4.0
3.9
4.0
4.0
4.0
74
72
70
72
76
71.
,1.1
.111
0110
01.
74
66
68r5
/M.N
.
71
62
6095
3.7
3.9
3.5
3.7
3.8
3.8
67
66
65
66
64
64
68
60
n1
58
1=,8
6':
.
0, r
90
3.5
3.5
3.2
3.3
3.5
3.7
64
62
63
62
62
61
64
S7
57
ral
q51
!;11
85
3.3
3.4
2.9
3.0
3.3
3.5
60
59
59
59
59
58
81
55
r r ) 0
51rl
57
41
80
3,2
3.2
2.8
2.9
3.3
3.4
58
57
58
58
57
no
59
53
53
'1,1
w..nt-;
411
75
3.1.
3.0
2.7
2.9
3.2
2.2
56
55
56
56
55
SS
36
51
51
A7
51
rr.
.., p
11C
70
3.0
2.9
2.5
2.8
3.0
3.2
54
5a
55
55
54
58
r..)r .1
31
1",0
Sr
41
i:''
43
65
2.9
2,8
2.5
2.7
2.9
3,1
53
51.
53
53
53
51
r.
..,
,t
,: "
r'51.
50
52
52
52
5n
52
48
47
4r)
47
41
42
55
2.8
2.5
2.3
2.h
2.7
3.0
50
49
50
51,
51
49
50
47
16
4Aro
48
4r;
502,7
2.4
*),
It2,4
2.5
2,9
48
47
49
5n
49
47
49
46
45
/1.1
741
45
2.6
2.3
2.0
2.3
2.5
2.8
47
46
47
49
47
46
47
45
Ail
49
48
46An
40
2.5
2.0
1.9
2.0
2.3
2.7
46
45
46
48
46
45
46
44
4'
44
An
35
2.4
2.0
1.9
2.0
2.3
2.6
44
44
46
47
45
414
45
43
47
41
41
48
89
30
2.3
1.9
1.0
1.9
2.2
2.5
43
43
44
46
45
43
43
42,
41
40
40
41
11
25
2.2
1.8
1.0
1.9
2.0
2.4
41
41.
43
44
44
42
42
40
An
30
32
40
39
20
2.1.
1.7
1.6
1.8
2.0
2.3
40
40
41
42
43
40
40
38
39
39
17
89
15
2.0
1.4
1.4
1.5
1.8
2.3
38
39
40
41
41.
39
38
38
37
88
86
36
In
10
1.8
1.3
1.3
1.4
1.7
2.1.
39
36
37
39
39
37
86
36
36
37
35
;32
X32
51.6
1.0
1.0
1..0
1.5
1.9
32
33
34
36
36
35
37
38
33
87
34
23
32
11.3
0.8
0.13
0.8
1,0
1.5
25
24
29
32
28
34
26
31
31
37
rin
'27
38

TOTAL
TABLE XXVI
PERCENTILE TABLE & STANDARD SCOPE EQUIVALENT TO DETEIIIITIE
PREDICTOR DATA LEVELS AT =am VALLEY COLLEGE
(Fall, Winter, Spring - '66-'67)
Rtgh Schocl Cumulative Ilveraq22
41 0 -r-1 ril
0a
,V-I-1
43.1
till
1Lr,
0 rd
,C.:
4-1
(t1
rdC
..) z (1)
4-1
-r1
Id 0
ri 0 Z
r-1
(1)
0 -I
-10
0
0) P r' -rl
C.)
(1.1
r--!
fjashin ton Pre-Col lo. o To; :t Rom]
M 0 -r1
1....
,,,
t)Q
)r.
'Q
i
4-'
Ri
Li)
CD
4 1
..C1
-ri
r-',
CO
C))
(7.1
10-r
iC
ALI
..C
',-1
-1
gsa
)r
'0
,--1
't'r-
1/-
1kJ
0-r
l 0rg
.r-r
1
()c,
:rr
-(1.
,)-
.4;1
r- !
pi11
14r0
bl0
elrd
'0 P
AF
.C.1
P-I
rdC
Jrd
k1-
1r:
(1)
Pi(1
) 0
G i
00
t.,:,1
C.)
r:-I
----
.3U
../(
'fp
1,1
0:,-
--r_
)t-
'
:'') V -r
-1 ,..o 10 4-1 -ri 0
41 r
- '
rr
'
1,-r
lp ,....'.
,
'''1 0 .r
1 r-6-
4:-:
of
4- I
i,4,
..0
:
."-
4 4 0
4-1 51 to 1
:,
4.21
i.
,:o'
*1-I ' . C.1
rat
f--*
4-1
4_1
,.)1
.4r-
1
V;
ii, j
:::3
(,4
.41-
#1
rt' V,
i C1
,-1
-1 (,1
4-1'
r# r
1 *rri
r ,
(.r
i.-
.,1`
"'
. ,t
r.)
.4-1 1-, ", C) qt
Ii
1 4-1 1' r( ,-
, 1_,
99
3.9
4.0
3.9
3.9
3.9
4.0
73
72
68
71
78
72
73
70
7n
71
95
3.5
3.8
3.4
3.5
3.7
3.8
65
64
64
64
69
63
66
65
63
G1
90
3.3
3.4
3.0
3.1
3.4
3.6
60
60
59
60
63
60
60
fn
ni
57
85
3.1
3.0
2.9
3.0
3.2
3.4
57
57
56
517
61
57
58
56
53
54
80
3.n
2.9
2,7
2.9
3.0
3.3
55
55
55
55
59
56
55
56
56
53
75
2.8
2.7
2,3
2.7
2.9
3.2
53
53
53
53
56
54
53
54
54
51
70
2.7
2.5
2.5
2.5
2.8
3.1.
51
51
51
52
55
52
51
52
5:
')
65
2.6
2.5
2,3
2.5
2.7
3.0
49
50
49
51
54
51
49
51
50
48
60
2.5
2.3
2.2
2.4
2.5
2.9
48
48
48
4q
53
49
48
50
40
,17
5C
2.4
2.1
2.1
2.3
2.4
2.8
46
47
46
48
52
48
46
48
48
A5
50
2.3
2.0
2.0
2.0
2.3
2.7
45
46
46
47
50
46
45
47
47
45
45
2.2
2.0
2.0
2.0
2.3
2.6
43
45
44
46
48
45
44
46
46
44
40
2.1
1.9
1.8
1.9
2.2
2.5
42
44
43
44
47
45
42
45
45
43
35
2.0
1.7
1.8
1.9
2.0
6,5
41.
42
42
43
46
43
41
44
44
4:!
30
1.9
1.5
1.7
1.8
2.0
A(..-,
40
41
41
42
45
43
40
43
43
41
25
1.8
1.5
1.5
1.8
1.8
2.3
38
40
40
41
44
42
38
41
4 r.'
40
20
1.7
1.4
1.5
1.6
1.8
2.2
37
39
38
39
43
40
37
40
An
19
15
1.7
1.2
14
1.5
1.6
2.0
35
38
37
38
41
39
35
38
38
38
10
1.5
0.9
1.2
1.4
1.5
1.9
33
36
35
27
39
37
33
n7
36
37
51.3
0.8
0.9
1.0
1.3
1.6
31.
34
32
34
35
36
31
34
34
37
10.9
0.1
0.8
0.8
0.9
1. n
24
24
28
32
27
34
n5
31
31
37
73
69
74
ns
G3
17
6,1
GI
n3
sn
!i9
no
r r
n7
1G
53
rr 00r
i-.0
51
53
49
52
51
48
50
41
AP
4()
42
/1 5
43
47
44
A7
ii542
46
/1/1
41
44
43
40
43
40
39
41
40
n8
2r,
4n
36
'17
:A"
!-v!
33
:7
2r

Orr
Cr)
TAME 1:CITII
PEPC
EH
TR
ECT-11171S
FOP
TTIOU 1:CHOOL
t3COPM
Average of High :=*choo1
Grades in
1.7shington Pre-Coll cm,
Test 2esultr
o-r
i."
-co
o 4-
2o
o.
(a
.1-1
'
-ri
0-r
ip rt
111
"1"1
1C
.)0
pri:
1:i
pro
4-,
or_
.Q
)4-
2U
)p(
1.)
4-2
0o
4-1
t1Pr
stit
di o
4-1
-r-I
X...
e;al
Pr-
-7C
OU
)1.
...
gh)
L.1
.1 .1
7"ri
4-1
r-'
1-I,
,-.1
-1.1
-1
C')
Iiti
-r1
CO
-r1
rj 0
c--1
Wg)
I-1!
0rl
(1)
+3)
ri
F-;
r1t'l
gi4-
-1ti
r;-r
i-r
1W
k 0
ra -
r1-1
--)
4 -r
1r-
JC
OC
O0
-rf.
0rig
-fir
't..
1-,
-I-I
(1)
r-!
ri0
4-1
r!-s
-1ul
la)
0'41
0I-
-,r
..141
r1
VI
CC
-74
'4:1
:1-1
-kl:
tr
W C
A,.0
0 W
-rl F
riC
.)r-
'PA
r0r-
1ei
lr-
Iri
pal
rti
04X
I ri
Z r
-101
k 0
4-I
-P -
rl0
(1),
610
Cl r
dQ
iW
O.0
a)ti
18E
lkw
Fio
oro
:It-
, 11
spo..1.4-11.0
-.1,ri
,.o.
izd
vl:
ii.-., ,T)i
0ci
01'J
g0
oo
o a
o4-
2r-
,0
00
1E
Q,p
),_.
p...-1
.-
IP.
:4:I
Ci 1
0 i C
f.1
tal
[4.1
C.)
:>04
r C
or
:C
.?;;;
-,C
.)C
t CI.
)'.-
-I-
P-.1
r+)
41
6.6-
'r-
,-'1
1,'.
1 r
.,,,-
.,,
I
99
3.9
4.0
3.9
4.0
3.9
3.9
67
69
67
71
76
71
68
66
72
6$
65
71
7r
99
95
3.4
3.6
3.4
3.5
3.6
3.8
61
61
62
64
67
63
60
60
62
61.
59
65
6n
05
90
3.1
3.3
3.0
3.1
3.3
3.5
57
57
52
59
61
59
57
57
59
57
Sr
60
CA
qn
85
3.0
3.0
2.9
-3.1.
3.4
54
55
55
57
59
56
54
54
57
54
54
5P61
rill
80
2.9
2.8
2.6
2.8
3.0
.3
52
53
53
55
56
54
52
Sr'
55
.lo
r+,
56
69
$0
75
2.6
2.5
2.5
2.6
2.9
3.1
50
51.
52
52
54
53
SO
51
53
51
Si
r,7
75
70
2.5
2.4
2.4
2.5
2.6
3.0
49
50
50
SO
-51
49
50
51
49
49
53
55
70
65
-2.3
2.3
2.4
2.5
-47
49
48
49
52
50
47
48
A.9
47
45.
51
53
6!;
60
2.4
2.1
2.1.
2.3
-2.9
46
48
47
48
50
48
46
47
46
A7
FO
55
2.3
2.0
2.0
2.1.
2.4
2.8
45
47
46
47
--
45
46
47
46
40
51
55
L1 -150
P....1
2.1
--
2.0
2.3
2.6
44
46
44
46
48
46
44
45
46
45
45
-49
5n
iii
C 45
12:
ril40
fa,
2.0
-
-
1.7
-
1.7
-
-
2.1
2,0
2.5
-
43
42
45
44
4342
44
4-3
47
45
45
-
4342
44
43
- 44AA 43
4 '14
-
47 -
48
'17
45 40
35
--
--
-2.4
41
43
41.
42
-43
41
42
-4:
),43
45
-:5
30
1.9
1.5
-1.7
1.9
2.3
40
42
40
41
43
42
40
41
42
41
42
42
45
r,1
25
1.7
-1.5
-1.7
2.1
39
41
38
40
41
-39
40
40
41-
44
r'.
20
1.5
1.4
1.4
1.5
-2.0
37
40
37
39
39
40
37
39
-40
40
40
48
20
15
-1.2
1.2
1.4
1.5
36
38
36
38
38
39
36
38
38
39
39
36
r12
15
10
1.4
1.0
-1.2
1.4
1.9
35
37
34
37
36
37
35
37
36
-S8
36
40
10
51.2
-1.0
1.0
1.0
1.5
33
35
32
34
32
36
33
35
34
38
37
31
39
r I
11.0
0.5
0.6
0.8
0.8
1.2
30
31.
29
33
27
-30
32
33
37
35
29
-1
CONMNITY COLLEGE STUDENTS
Teprinted with permission of W.P.C.T.
student Irc...truction Booklet, 1967-68, Page 14
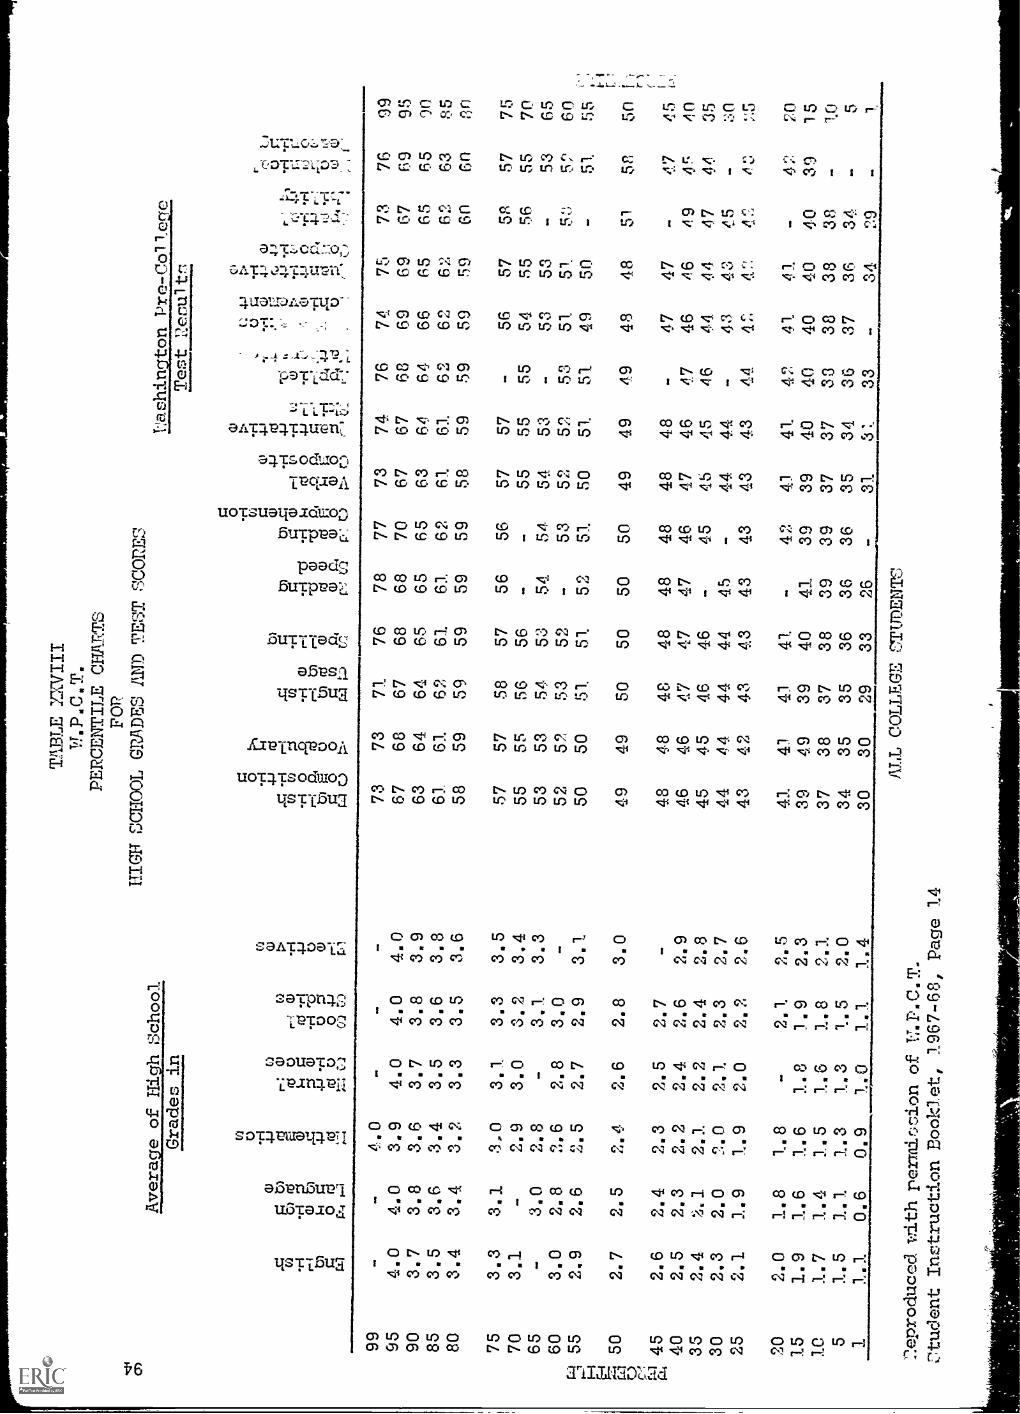
44 rn
TOLE XXVIII
W.P
.C.T
.PERCENTILE CHARTS
FOP
HIGH SCHOOL GRADES AND TEST SCOPES
Average of High School
Grades in
l'!ashington Pre-Col 1ege
Test 2enu1tr;
oco
.C'
C.)
Z-r
i1-
,,,..
C. 4
-1I-
C.)
-tS
)I(1
)-)
-1,,.
.0
G.4
1-r
ltr
iZ
a)
4-1
-i-e
lq)
4-7
0(7
-cL.
, iC
D4J
00.
)4-
I0
0)W
4-1
rt.1
4-,,
,.-
._.
I.ro
4 .."
C)r
-g
g b)
gr-
:a)
C')
...C
I-r
1r-
-1..c
.:b)
0).r;
- r1
4-)
""6
t,0
4-)
,-1
i.---
1t-
1 r1
U)
0) R
Icd
C.)
r--=
.C
D-
rlU
)C
ri',.
".1
U)
-rl
ZZ
(I)
r--I
Cr~
- rl
1.Q
0.)
1."-
*r1
(.'
'
-rl
,-1 0
g0-
(14-
1-
rl 0
,...0
-r1
C)
r--1
.r1
112
1-
rl k
Itt 0
4-1
r- I
-r-1
.(
'-r
°1ti;
071
1:-
''1:1
11,
.-1)
:1C
-:'
1 -
#C
)01
...LI
(I)
-rl "
00
1--.
., :
04rd
'0C
)'T
iP
1,.0
,P
.g'
sr.
"r-
,.r
.
Mk
Z4-
)4-
1-t
-IC
.)C
.),
010
1-6.
)rt
?)I
713
rda)
rdr;
1-4
'..-.
:rt
e -1
0.4
4-.1
4A
i,
,t t
,i-r
-I0
141
Z0
rSrd
d r)
0 4-
11.
- .
r.::
0S
iZ
thP
iW r.,
w o
,...9) o
.0 -t-:
p., id
t....)
:.._I
O11
,4 ,,
..1:
Q.,
(LI
P-1
C-I
/-1
I -
i t-j-
-.1
C.1
CI)
'CO
Co
1f.4
.1C
_):-
...fa
.1t-
=.)
t./..,
1:.
LO
P :
C-,
1---
r ),
,' 0
:,11
1.,..
.*.'
C)
if.
99
4.0
95
4.0
4.0
3.9
90
3.7
3.8
3.6
85
3.5
3.6
3.4
80
3.4
3.4
3.2
75
3.3
3.1
3,0
70
3.1
-2.9
65
-3.0
2.8
60
3.0
2.8
2.6
55
2.9
2.6
2.5
1--,
rd50
2.7
2.5
2.4
P r)-145
2.6
2.4
2.3
gl
40
2.5
2.3
2.2
35
2.4
',3.1
2.1
30
2.3
2.0
2.0
25
2.1
1.9
1.9
20
2.0
1.8
1.8
15
1.9
1.6
1.6
10
1.7
1.4
1.5
51.5
1.1
1.3
11.1
0.6
0.9
6110
11M
IMIN
IM
/MO
73
73
71
76
78
77
73
74
76
74
75
73
76
99
4.0
4.0
4.0
67
68
67
68
68
70
67
67
68
69
69
67
69
95
3.7
3.8
3.9
63
64
64
65
65
65
63
64
64
66
65
65
65
90
3.5
3.6
3.8
61
61
62
6].
61
62
61
61
62
62
62
62
63
653.3
3.5
3,6
58
59
59
59
59
59
58
59
59
59
59
60
60
nn
3.1
3.3
3.5
57
57
58
57
56
56
57
57
-56
57
53
57
75
3.0
3.2
3.4
55
55
56
56
--
55
55
55
54
55
56
55
70
-3.1
3.3
53
53
54
53
54
54
54
53
53
53
-53
65
2.8
3.0
-52
52
53
52
53
52
52
53
51
51
53
5`)
60
2.7
2.9
3.1
50
50
51,
51
52
51
50
51
51
49
50-
51
55
c:
Hi r'
2.6
2.8
3.0
49
49
50
50
50
50
49
49
49
48
48
51
58
5n tr r) i"
2.5
2.7
-48
48
48
48
48
48
48
48
-47
47
-47
45
1,
c),
2.4
2.6
2.9
46
46
47
47
47
46
47
46
47
46
46
49
45
40
2.2
2.4
2.8
45
45
46
46
-45
45
45
46
44
44
47
44
35
2.1
2.3
2.7
44
44
44
44
45
-44
44
-43
43
45
-30
2.0
2.2
2.6
43
42
43
43
43
43
43
43
44
4:".
4:-:
42
4:3
25
-2.1
2.5
41
41
41
41.
-42
41
41
42
41
41
-42
20
1.8
1.9
2.3
39
49
39
40
41
39
39
40
40
40
40
40
39
15
1.6
1.8
2.1
37
38
37
38
39
39
37
37
33
38
38
38
-10
1.3
1.5
2.0
34
35
35
36
36
36
35
34
36
37
36
34
_5
1.0
1.1
1.4
30
30
29
33
26
-31
3:_
33
-34
no
-1
ALL COLLEGE CTUDENTS
2eproduccd with permir;sion of W.P.C.T.
student Instruction Booklet, 1967-68, Page 14

TABLE XXIXTHE STANDARD ERROR OF ESTIMATE AND ASSOCIATE STATISTICS
OF THE WASHINGTON PRE-COLLEGE TESTING PROGRAM
95
Course Area N
StandardError ofEstimate
ValidityCoefficient
klanGrade Point
of
Criterion
StandardDeviationCriterion'Grade Poini
ALL COLLEGE 5888 .57 .65 2.16 .75
Accounting 1117 .84 .55 1.96 1.00"Agriculture 216 .79 .40 2.07 1.10Anthropology 1752 .84 .52 2.20 .98
*Auto Mechanics 119 .78 .51 2.24 .91
**Biology, Introductory 316 .75 .71 1.91 1.05Botany 430 .81 .67 2.16 L10Business Administration 1671 .78 .57 2.30 .94
**Chemistry, Introductory 2096 .82 .59 1.88 1.02Communications: Principles 531 .80 .42 2,75 .88
*Data Processing 330 .95 .35 2.48 1.01Economics, Advanced 264 .74 .40 2.73 .81
**Economics, Introductory 2151 .83 .52 2.00 .97
*Electronics 188 .96 .45 2.04 1.08
Engineering, Introductory 213g .64 .56 2.19 .77
*Engineering Technology 334 .91 .46 2.22 1.02**English, Freshman 4754 .60 .63 2.23 .77
English Composition 239 .71 .35 2.59 .76
F,-glish Literature 1566 .68 .45 2.41 .76
_ :estry 042e)cower
AO.VV AszvO 2.14 notOFrench, Introductory 631 .78 .66 2.44 1.04Geography 869 .83 .46 2.34 .93
German, Introductory 587 .81 .64 2.42 1.05
History 745 .80 .48 2.39 .92
Home Economics 578 .63 .42 2.71 .69
**Mathematics: Algebra 2546 .87 .54 2.03 i.n4
Mathematics: Calculus 1278 .85 .47 2.01 .96
Microbiology 226 .87 .43 2.48 .97
Music Theory 208 .59 .70 2.53 .83
Nursing: Practices 291 .67 .36 2.85 .72
Nursing: Principles 344 .66 .45 2.70 .74
Nutrition 574 .67 .50 2.49 .77
Philosophy 728 .82 .49 2.32 94
Physical Education Theory 293 .64 .53 2.84 .76
Physics 1291 .75 .45 2.30 .84
Political Science 1068 .70 .50 2.38 .81
**Psychology, Introductory 2505 .80 .56 2.22 .96
Russian, Introductory 188 .90 .44 2.57 1.00
*Secretarial Studies 1443 .91 .50 2.16 1.05
**Sociology, Introductory 2596 .80 .61 2.11 1.01
Spanish, Introductory 397 .83 .69 2.32 1.16
Speech 1877 .67 .47 2.50 .76
*elding 260 .85 .44 2.27 '95
logy 924 .83 .56 2.13 1.00
izConnunity College Programs
**Criterion areas included in Table III
Reprinted vdth permission of the Washington Pre-College Testing Program

96
TABLE XXXMEASURES OF CENTRAL TENDENCY & ASSOCIATE
STATISTICS TO DETERMINE -0REDICTOR DATA LEVELS FORMales at 'Mina Valley College ('66-'67)
Variable Mean Median Mode Range
Semi-Interquartile
Range
Composite English Total 44.63 43.30 40 76-24 5.74vocabulary 40.25 38.30 29 98-0 10.41English Usage 30.07 27.91 27 80-0 9.74Spelling 12.20 11.14 10 43-0 5.46Reading Speed 25.61 25.66 27 40-6 3.40
Reading Camp. 8.74 7.94 7 34-0 3.67Composite Verbal 44.63 43.38 41 76-26 5.81Quant A. 6.01 6.19 7 13-0 2.40Quant B. 12.45 12.42 13 29-0 4.20Quant C. 4.30 3.31 0 15-0 2.70
Quant Combined (FI:LC) 22.92 22.16 17 54-0 7.55Applied Math 9.93 9.66 10 27-0 3.29Math Ach. 12.31 10.81 0 43-0 6.08Composite Quant. 48.25 47.48 48 78-33 5.82Spatial Ability 9.81 9.93 9 23-0 3.18
Mech., Reasoning 11.02 10.37 10 32-0 5.50H. S. English 21.78 21.42 20 40-7 4.41H. S. Foreign Language 19.53 19.61 23 40-0 5.74
S. Math 20.52 19.74 20 40-5 4.98H. S. Natural Science 21.43 19.93 20 40-5 3.94
H. S. Social Science 22.81 22.54 20 40-8 4.94H. S. Electives 26.48 26.32 30 40-0 4.78H. S. Overall G.P.A. 18.23 21.05 0 39-0 4.53
All University 17.23 16.78 15 32-8 2.58Sex .00 .25 0 0-0 .12Average 17.32 17.21 17 25-0 .48
f

TABLE MalhEASURES OF CENTRAL TENDENCY & ASSOCIATE
STATISTICS TO DETERMINE PREDICTOR DATA LEVELS FORFemales at Yakima Valley College ('66-'67)
Variable
Composite English TotalVocabularyEnglish UsageSpellingReading Speed
Reading Comp.
Composite VerbalQuant A.Quant B.Quant C.
Quant Combined (A,B,C)Applied MathMath Ach.Composite Quant.Spatial Ability
Aech. ReasoningH. S. EnglishH. S. Foreign LanguageH. S. MathH. S. Natural Science
H. S. Social ScienceH. S. ElectivesH. S. Overall G.P.A.
All UniversitySexAverage
Semi-
InterquartileMean Median Mode Range Rance.
49.03 48.94 49 78-25 6.7144.60 43.38 37 95-0 12.2138.19 37.28 35 77-1 11.04
16.21 15.81 20 47-0 5.47
24.72 24.46 27 40-0 2.90
9.31 8.76 7 28-0 4;2149.11 48.95 50 78-26 6.695.49 5.32 7 14-0 2.15
10.33 10.60 11 27-0 3.943.92 3.25 0 15-0 2.40
19.87 19.50 19 52-0 6.528.25 7.75 7 24-0 3.198.88 7.26 0 44-0 4.56
45.92 45.30 50 72-33 5.068.88 9.00 8 21-0 .J.06
3.98 2.86 0 25-0 3.0926.88 27.21 30 40-10 4.7224.45 24.66 20 40-0 5.8922.53 22.44 20 40-5 4.86
24.14 24.60 20 40-8 5.13
26.18 25.41 28 40-8 5.76
28.98 29.28 30 40-10 4.4121.48 24.18 0 40-0 5.13
20.34 20.24 24 33-10 3.35
1.00 1.00 200 2-1 0.25
17.58 17.13 17 25-0 0.33
97
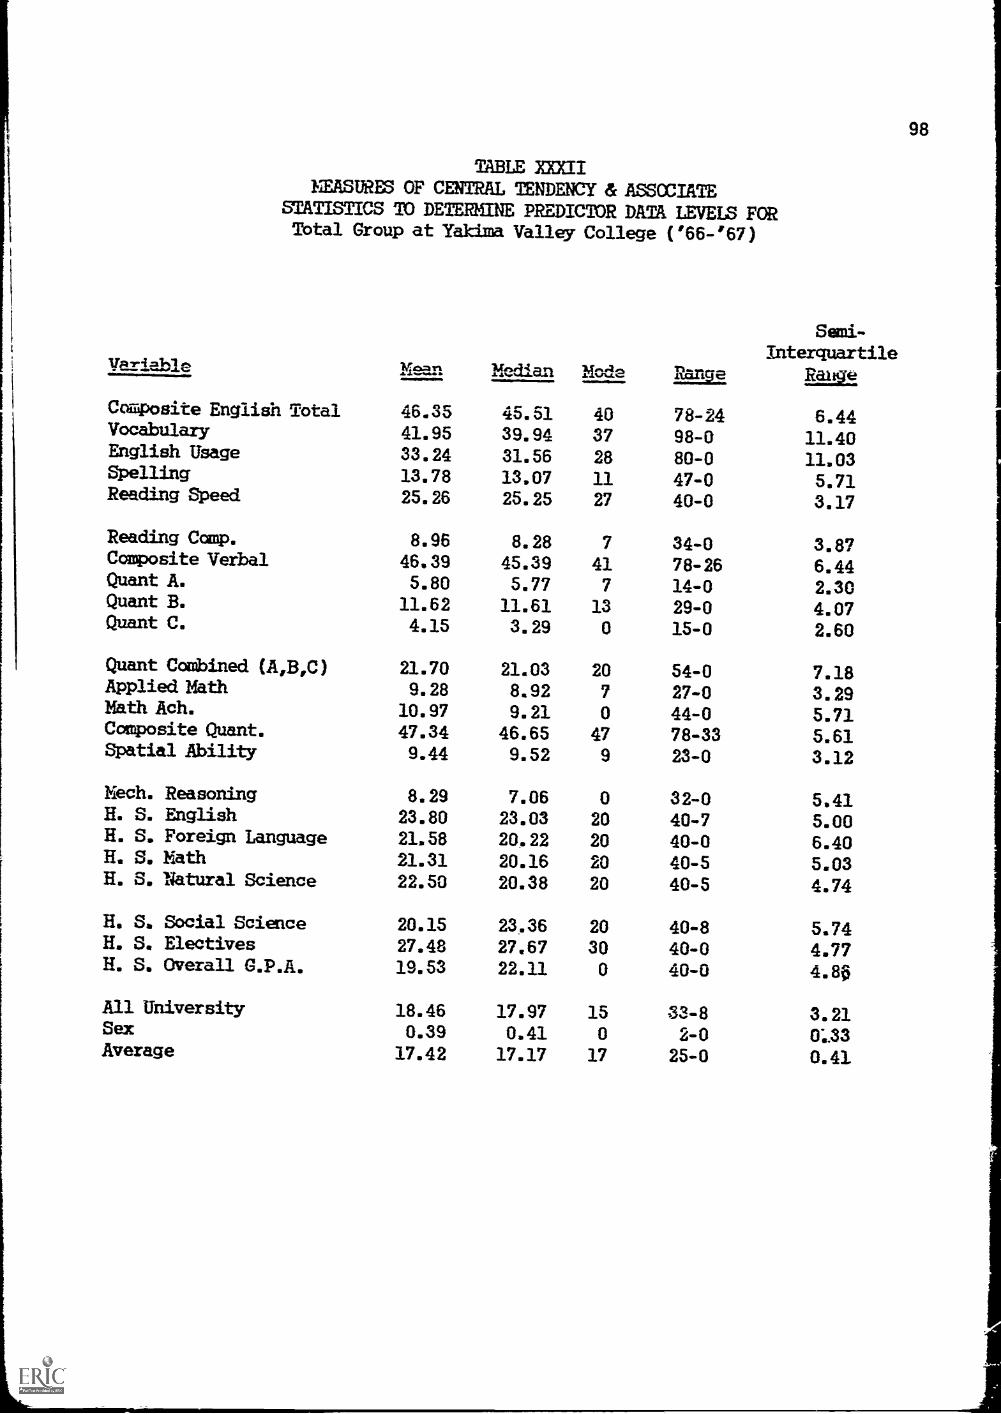
98
TABLE =IMASURF3 OF CENTRAL TENDENCY & ASSOCIATE
STATISTICS TO DETERMINE PREDICTOR DATA LEVELS FORTotal Group at Yakima Valley College ('66-'67)
Semi-
InterquartileVariable Ilimart
..1.-.... Median Mode Emu Ralfg
Composite English Total 46.35 45.51 40 78-24 6.44Vocabulary 41.95 39.94 37 98-0 11.40English Usage 33.24 31.56 28 80-0 11.03Spelling 13.78 13.07 11 47-0 5.71Reading Speed 25.26 25.25 27 40-0 3.17
Reading Comp. 8.96 8.28 7 34-0 3.87Composite Verbal 46.39 45.39 41 78-26 6.44Quant A. 5.80 5.77 7 14-0 2.30Quant B. 11.62 11.61 13 29-0 4.07Quant C. 4.15 3.29 0 15-0 2.60
Quant Combined (A,B,C) 21.70 21.03 20 54-0 7.18Applied Math 9.28 8.92 7 27-0 3.29Math Ach. 10.97 9.21 0 44-0 5.71Composite Quant. 47.34 46.65 47 78-33 5.61Spatial Ability 9.44 9.52 9 23-0 3.12
Mech. Reasoning 8.29 7.06 0 32-0 5.41H. S. English 23,80 23.03 20 40-7 5.00H. S. Foreign Language 21.58 20.22 20 40-0 6.40H. S. Math 21.31 20.16 20 40-5 5.03H. S. Natural Science 22.50 20.38 20 40-5 4.74
H. S. Social Science 20.15 23.36 20 40-8 5.74H. S. Electives 27.48 27.67 30 40-0 4.77H. S. Overall G.P.A. 19.53 22.11 0 40-0 4.80
All University 18.46 17.97 15 33-8 3.21Sex 0.39 0,41 0 2-0 0'..33Average 17.42 17.17 17 25-0 0.41

99
TABLE XXXIIIASSOCIATE STATISTICS TO COIQUIE HALE PERCENTILE
TABLES AT YAICI:MA VALLEY COLLEGE
Variable N Nean S.D. VarianceS.E.
Skewness Skewness
Composite English Total 1022 30.07 14.37 206.612 .555 .076Vocabulary 1011 12.20 7.76 60.321 .683 .077English Usage 1013 8.74 5.64 31.820 .890 .077Spelling 1015 11.02 7.14 51.050 .387 .076Reading Speed 1015 9.81 4.62 21.400 -.155 .076
Reading Comp. 1021 9.93 4.89 23.980 .290 .076Composite Verbal 1022 25.61 5.92 35.090 .280 .076Quant A. 1020 40.25 16.59 275.430 .544 .076Quant B. 1012 6.01 3.21 10.360 .037 .077Quant C. 1020 12.45 5.86 34.380 ,067 .076
Quant Combined (A,B,C) 1000 4.30 3.68 13.560 .773 .077Applied Math 1019 12.31 9.05 81.930 .852 .076Math Ach. 817 18.23 10.28 105.790 -.784 .085Composite Quant. 982 21.78 6.28 39.540 .402 .078Spatial Ability 825 19.53 8.39 70.480 .361 .085
Mech. Reasoning 982 20.52 7.10 50.520 .574 .078H. S. English 974 21.43 6.90 47.670 .409 .078H. S. Foreign Language 983 22.81 7.01 49.190 .362 .078EL S. Math 957 26.48 6.68 44.680 -.121 .079H. S. Natural Science 1022 48.25 8.18 67.030 .537 .076
H. S. Social Science 1022 44.63 8.62 74.410 .641 .076H. S. Electives 1022 44.63 8.69 75.620 .648 .076EL S. Overall G.P.A. 983 17.23 4.15 17.230 .606 .078
Al?' University 1022 0.00 0.00 0.000 .000 .076Sex 1022 17.32 2.99 8.980 -3.290 .076Average 991 22.92 10.65 113.510 .276 .077

1
11
100
TABLE XXrIVASSOCIATE STATISTICS TO CO1PUTE FEMALE PERCENTILE
TABLES AT YAKIMA VALLEY COLLEGE
Variable N Mean S.D. Variance SkewnessS.E.
Skewness
Composite English Total 656 38.19 15.69 246.360 .078 .095Vocabulary 656 16.21 8.13 66.156 .351 .095English Usage 654 9.31 5.70 32.511 .446 .095Spelling 641 3.98 4.10 16.843 1.257 .096Reading Speed 652 8.88 4.40 l),402 -.075 .095
Reading Comp. 654 8.25 4.54 20.697 .418 .095Composite Verbal 656 24.72 5.09 25.928 .097 .095Quant A. 655 44.60 18.05 325.998 .166 .095Quant B. 651 5.49 2.97 8.842 .122 .096Quant C. 653 10.34 5.21 27,173 .037 .095
Quant Combined (A,B,C) 638 3.92 3.37 11.364 .826 .097Applied Math 649 8.88 7.44 55.357 1.266 .096Math Ach. 544 21.48 11.09 123.091 -.966 .105Composite Quant. 642 26.88 6.39 40.897 -.014 .096Spatial Ability 592 24.45 8.28 68.670 .088 .100
Mech. Reesoning 641 22.53 7.10 50.529 .257 .096H. S. English 637 24.14 7.27 52.908 .148 .097H. S. Foreign Language 642 26.18 7.04 49.623 .029 .096H. S. Math 639 28.98 5.96 35.550 -.169 .096H. S. Natural Science 656 45.92 7.22 52.144 .568 .095
H. S. Social Science 656 49.11 9.40 88.418 .151 .095H. S. Electives 656 49.03 9.48 89.955 .144 .095H. S. Overall C.P.A. 642 20.34 4.46 19.956 .098 .096
All University 656 1,00 0.00 0.000 .000 .095Sex 656 17.58 1.92 3.705 1.691 .095
Average 634 19.87 9.40 88.464 .275 .097

TABLE XXXVASSXIAM STATISTICS TO CCEPUTE TOTAL PERCENTILE
TABLES AT YAKEMA VALLEY COLLEGE
Variable
Composite English TotalVocabularyEnglish UsageSpellingReading Speed
Reading Comp.Composite VerbalQuant A.Quant B.
Quant C.
Quant Combined (A,B,C)Applied MathMath AcheComposite Quant.Spatial Ability
Mech. ReasoningH. S. EnglishH. S. Foreign LanguageH. S. MathH. S. Natural Science
H. S. Social ScienceH. S. ElectivesH. S. Overall G.P.A.
All UniversitySexAverage
N dean S.D. Variance Skewness
101
S.E.Skewness
1678 33.24 15.42 237.851 .376 .0591667 13.78 8.15 66.461 ,532 .0601667 8.96 5.67 32.170 .712 .0301656 8.29 7.03 49.542 .782 .0601667 9,44 4.56 20.824 -.111 .060
1675 9.28 4.83 23.370 .353 .0591678 25.26 5.63 31.696 .259 .0591675 41.95 17.31 299.701 .397 .0591663 5.81 3.13 9.832 .083 .0601673 11.62 5.71 32.631 .111 .059
1638 4.15 3.56 12.742 .803 .0601668 10.97 8.62 74.392 1.016 .0601361 19.53 19.73 115.239 -.806 .0661624 23.80 6.80 46.299 .224 .0601417 21.58 8.69 75.622 .218 .065
1623 12.31 7.17 51.496 .437 .0601611 22.50 7.17 51.500 .311 .0611625 24.15 7.21 52.078 .220 .0601596 27.48 6.52 42.534 -.186 .0611678 47.34 7.90 62.509 .582 .059
1678 46.39 9.20 84.663 .448 .0591678 46.35 9.26 85.847 .449 .059
1625 18.46 4.54 20.629 .398 .060
1678 0.39 0.48 0.238 .447 .598
1678 17.42 2.63 6.938 -2.750 .059
1625 21.73 10.29 105.942 .318 .060

BIBLIOGRAPHY
[i
1

BIBLIOGRAPHY
Katie, William. "A Study of the Achievement of WashingtonState Community College Students Compared with TheirPerformance on the Washington Pre-College Test." Studysupported by the 71,P.C.T.P. January, 1965.
Bruno, Louis. "Community College Student Characteristics."Research Report 01-05, Office of State 8uperintendent ofPublic Instruction, Olympia, April, 1965.
Dobbin, John E. and Mlliam Turnbull. "The Needs for NewAppraisal Techniques in Junior Colleges." Reprint fromJunior College Student Personnel Programs (A Report to
Carnegie Corporation), American Association of JuniorColleges, Washington, D.C., November, 1965.
Guilford, J. P. "Fundamental Statistics in Psychology andEducation," McGraw Hill Publishing Co., 4th ed., 1965
Hall, Lincoln H. "Performances of Average Students in aJunior College and in Four-Year Institutions." CaliforniaBureau of Pupil Services, Sacramento, E.R.I.C. No. JC 670-820.
Hoyt, Donald P. and Leo I7unday. "Academic Description andPrediction in Junior Colleges." A.C.T. Research ReportNo 10, American College Testing Program, February, 1966.
Jost, Erwin. "High Verbal Aptitude and Grade Achievement,A Study of the Grade Achievement of 200 First-Lemester
College of San Mateo-Freshmen Who Ranked High in VerbalAptitude as Measured by the School and College AbilityTests and Cooperative English Tests." College of SanMateo, E.R.I.C. No. JC 660-083.
Kline, William. "The Washington Pre-College Testing Programr"Paper presented at National Council on Measurement inEducation Conference, Chicago, February, 1965.
Langen, Thomas. "An Investigation of Additional Predictorand Criterion Variables for the Washington Pre-College
Testing Program with Sub-division by Sex and Extent ofAchievement." Study Supported by Washington Pre-CollegeTesting Program, Nay, 1965.
Lounsberry, James. "An Evaluation of the Accuracy of theDifferential Prediction Test Battery in Predicting Gradesfor Students at Western Washington State College."Dissertation, University of Washington, 1962.
Lunneborg, Clifford and Patricia Lunneborg. "Community CollegeNorms 1S63-65 for the Washington Pre-College P.C.) TestBattery and High School Grades." Bureau of Testing ProjectNo. 366-520, University of Washington, April, 1967.

104
Lunneborg, Clifford and Patricia Lunneborg. "PredictingCommunity College Vocational Criteria with TraditionalAcademic Variables." Bureau of Testing Project No.366-500, University of Washington, March, 1967.
Lunneborg, Clifford and Patricia Lunneborg. "Uniqueness ofSelected Employment Aptitude Tests to a Gene-11 AcademicGuidance Battery." Bureau of Testing Project Jo. 366-590,University of Washington, April, 1967.
Morganfield, George R. "The Prediction of Uhior CollegeAchievement from Adjusted Secondary School Grade Averages."Arizona University, Tucson, E.R.I.C. No. JC 670-890.
Nielsen, Marjorie L. "A Supplemental Guidance Manual Based onInstitutional Research." Everett Junior College, WashingtonE.R.I.C. No. JC 670-407.
Reas, Herbert. "A Follow-Up Study of the Washington Pre-CollegeDifferential Guidance Tests at Seattle University ."Dissertation, University of Washington, 1962.
Rice, Gary A. "Predicted vs. Obtained Grades in InventoryPsychology at Yakima Valley College." Yakima ValleyCollege, Associate Director of Institutional Researchand Testing, Yakima Valley College.
Rice, Gary A. "The Washington Pre-College Testing Program andCommunity Colleges." Presentation at National A.P.G.A.Convention, Detroit, April, 1968.
Richards, James P. Jr., Lorraine M. Rand, and Leonard P. Rand."A Description of Junior Colleges." A.C.T. Research ReportNo. 5. American College Testing Program, July, 1965.
Richards, James P. Jr., Lorraine M. Rand, and Leonard P. Rand."Regional Differences in Junior Colleges." A.C.T. ResearchReport No. 9, American College Testing Program, December,1965.
Segar, John. "The Concept of Institutional Research."Presentation at the annual meeting of Northwest Associationof Junior Colleges, Portland, December, 1967.
Seibal, Dean. "A Study of the Academic Ability and Performanceof Junior College Students." Field Studies Report -- FSR-1,Educational Testing Service, Princeton, New Jersey, October,1965
Seibal, Dean. "Testing Practices and Problems in Junior Colleges --A Survey." Field Studies Report ?ASR -2, Educational Testing
Service, Princeton, New Jersey, September, 1966.
105
Saver, J. Allan. "Problems and Needs of Washington Coulmunity
Colleges: An Exploratory Survey of Important Research Areas."Occasional Paper /2, Center for the Development of CommunityCollege Education, University of Washington, June, 1967.
Washington Pre-College Testing Program. Counselor's Manual,1967-68.
Wilson, Ray and Charles J. Gelso. "The Prediction of Grades in
College Algebra -- 14 Continuation and Extension." South
Georgia College, Douglas, E.R.I.C. No. 670-436.
Yakima Valley College Catalog, 1967-68.
Young, Edwin P. "Interrelationships Between Selected Psychologicaland Academic Measures in an Experimental Program for "LowAbility Students." Los Angeles City College, E.R.I.C. No.JC 660-047.