gasoline direct injection engine introduction fuel rail ...this high pressure pump charges the fuel...
TRANSCRIPT
ABSTRACTGasoline direct injection provides reduced engine emissions,increased power, and increased fuel economy as compared toport fuel injection (PFI). Reduced emissions are largely dueto starting the engine using high fuel pressure (up to 150 bar)and injecting into the compression stroke. During a cold start,fuel pressure must be increased from lift pump pressure(typically 4 to 6 bar) to desired injection pressure (typically25 bar minimum). Start times are therefore impacted by thehigh pressure pump's ability to quickly build fuel pressureduring crank.
This study investigates the temperature and pressure affectsduring engine soak which allow vapor and air to form in thefuel system. Vapor and/or air in the system cause a slowerfuel pressure build and increases start times. The scope of theproblem and possible solutions were determined usingtheoretical and empirical testing. By preventing air and vaporformation in the fuel system, reduced and more consistentstart times are achieved.
INTRODUCTIONWith the regulatory trends throughout the world placingincreased pressure on fuel consumption, gasoline directinjection (GDi) engines are a key technology for improvedfuel economy and engine performance. As a result, thefraction of GDi vehicles worldwide is projected to markedlyincrease in the coming years.
Cold starting a GDi engine offers particular challengesrequiring substantial differences in fueling strategy comparedto a PFI system. Injection during the compression stroke isgenerally applied during engine cranking. Compressioninjection promotes good cold start performance, and requiresless cold start injected fuel mass due to reduced lost fuel ascompared to a port fuel injection system. Compressioninjection on a cold start requires that the engine be quicklysynchronized to properly time the fuel injection, as well ashaving sufficient fuel pressure available in the fuel rail beforecompression injection can occur. Delays to a rapid pressurebuild will result in an increased start time.
A typical GDi fuel system (Figure 1) will consist of a tankmounted low pressure pump (4 to 6 bar typical) which willdeliver fuel to a high pressure pump. The high pressure pumpis typically a single cylinder piston pump, which ismechanically driven by means of an extra cam located on theengine camshaft. This high pressure pump charges the fuelrail assembly with fuel at typical pressures of 35 to 200 bar,depending on control system requirements. The fuel railcontains a fuel pressure transducer, and delivers high pressurefuel to the injectors. Compression injection cannot occur untila desired minimum pressure is achieved in the fuel rail. Therapid pressure rise from the high pressure pump at cold startsis necessary to minimize the delay until compressioninjection can occur, and thereby minimizing the start time.
In this paper, a method of reliably reproducing consistentdelayed starts is discussed. The effect of vapor formation in
Fuel Rail Pressure Rise during Cold Start of aGasoline Direct Injection Engine
2012-01-0393Published
04/16/2012
David BurkeDelphi Corp
David Foti and James HallerDelphi Energy & Engine Mgmt Systems
William J. FedorDelphi Powertrain
Copyright © 2012 SAE International
doi:10.4271/2012-01-0393

the fuel system during engine soak conditions is discussedand analyzed. The impact of check valve leak rates as well asthe pressure drop from cooling during soak conditions ismodeled and analyzed. The impact of desorbed air in the fuelrail on pressure rise is discussed. A method of mitigatingpossible pressure rise effects of both vapor and air isproposed and test data showing the resulting benefits on starttime is reviewed.
Figure 1. Typical GDI Fuel System
PRESSURE RISE EFFECT ON HIGHPRESSURE ENGINE STARTSOn a vehicle with gasoline direct injection (GDi), start timesare greatly affected by the pressure rise of the high pressurepump (HPP) (Figure 2). The normal pressure operating rangefor a GDi injector is 25 bar to 200 bar, depending on thecoolant temperature. For the best start quality and lowestemissions, fuel pressure at the injector needs to be at thetarget minimum value before injecting fuel. Time to reachthis desired pressure is therefore directly correlated to theoverall start time.
While fuel pressure rise has a dominant effect on start time,other factors also have influence. Engine synchronization, thecontrol system determination of precise engine position, willdepend on how many crank degrees are required to find themissing teeth region of the target wheel. Crank speed, theRPM of the starter motor, determines how quickly the enginecan synchronize and how long each high pressure pumpstroke will take. Finally, engine run up, or how well theengine fires and accelerates to the peak RPM, affects theoverall start time, which is the time from first enginecranking to 1,000 RPM. These factors are not considered inthis investigation.
Figure 2. Effect of fuel pressure rise time on engine starttime.
Figure 3. Typical GDi engine cool-down profile. Notethat the Fuel Rail Pressure & the Fuel Lift Pressure are
different scales.
The subject of this investigation was inconsistent start timesdirectly related to the fuel pressure rise variation. After initialunsuccessful attempts at understanding the root cause, a moremethodical approach to this investigation was initiated. Thefirst step in the methodical vehicle testing was to establish arepeatable baseline. Temperatures and fuel pressures wererecorded during the engine off soak to evaluate theconsistency. It was determined that when vehicle
preconditioning was similar, soak temperatures andsubsequent start data was consistent. All monitoredtemperatures in the car were controlled to 20°C +/− 2°C in anenvironment of the same temperature with minimal airflow.With the hood closed, the engine was started and left at idleuntil the oil temperature reached the designated target. Oncereached, the engine was shut down and the temperatures andpressures were monitored. Initially, an oil temperature of80°C was targeted. After the initial tests failed to show slowpressure rise on restart, the target oil temperature was raisedto 100°C. The new pre conditioning procedure resulted inmore repeatable slow pressure rise starts. This was the firstclue to the cause of the problem. A typical engine off soak-cool down is shown in Figure 3.
Before a standardized test was adopted, variation was seen inpressure rise and start time as shown in Table 1. This wascaused by differences in conditions before and during vehiclesoak. Factors included oil temperature, ambient temperature,wind speed, hood position (open or closed), etc. Bycontrolling these factors, the subsequent pressure rise andstart times were more consistent.
Table 1. Engine restart test results after uncontrolledsoak periods.
ELIMINATION OF GASOLINEVAPOR IN THE SYSTEMDuring initial testing of the GDi system, delays in pressurerise resulted in inconsistent and long cold start times. Afterstandardizing the procedure for repeatable test results it wasdetermined that gasoline vapor was forming during extendedhot soak conditions. The sooner the high pressure pumpreceives vapor-free liquid fuel the faster the pressure rise andhence the faster the cold start time.
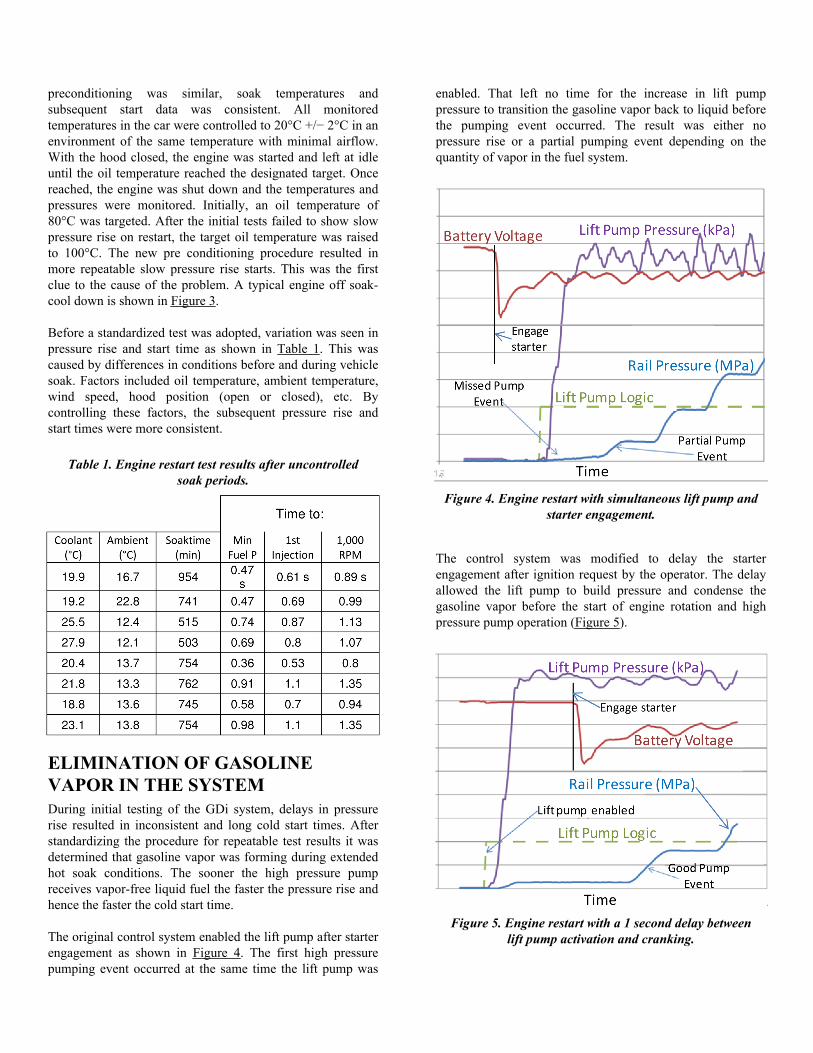
The original control system enabled the lift pump after starterengagement as shown in Figure 4. The first high pressurepumping event occurred at the same time the lift pump was
enabled. That left no time for the increase in lift pumppressure to transition the gasoline vapor back to liquid beforethe pumping event occurred. The result was either nopressure rise or a partial pumping event depending on thequantity of vapor in the fuel system.
Figure 4. Engine restart with simultaneous lift pump andstarter engagement.
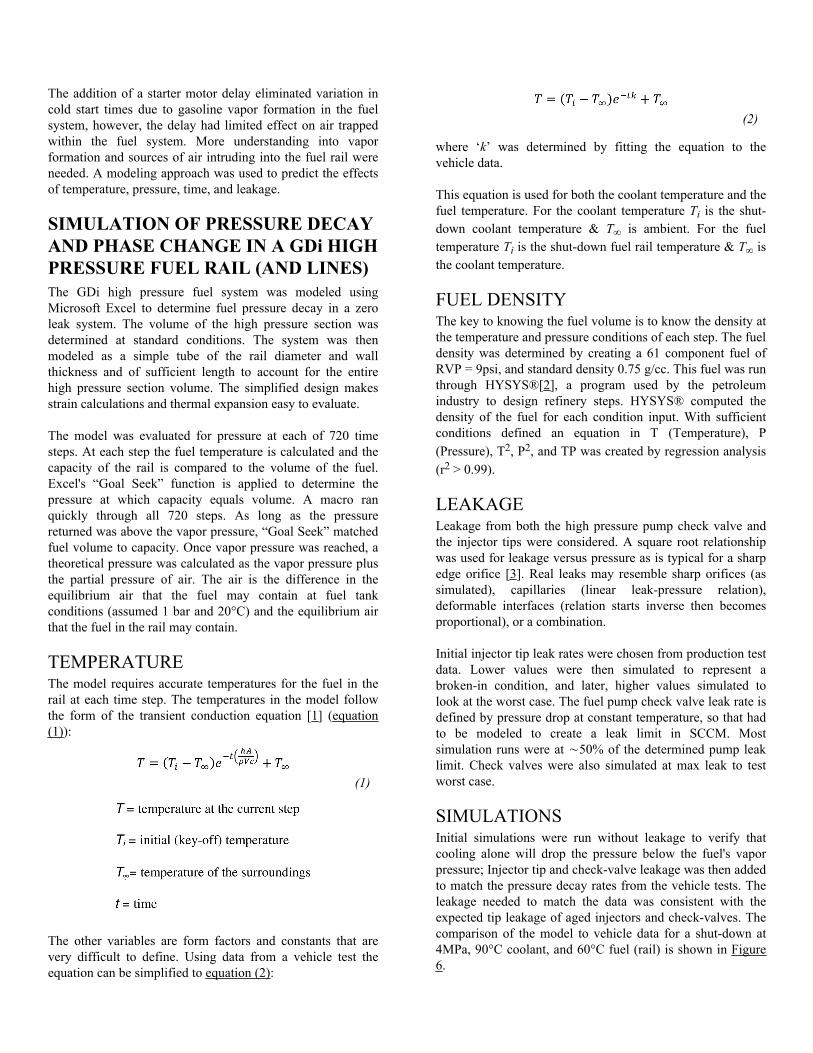
The control system was modified to delay the starterengagement after ignition request by the operator. The delayallowed the lift pump to build pressure and condense thegasoline vapor before the start of engine rotation and highpressure pump operation (Figure 5).
Figure 5. Engine restart with a 1 second delay betweenlift pump activation and cranking.
The addition of a starter motor delay eliminated variation incold start times due to gasoline vapor formation in the fuelsystem, however, the delay had limited effect on air trappedwithin the fuel system. More understanding into vaporformation and sources of air intruding into the fuel rail wereneeded. A modeling approach was used to predict the effectsof temperature, pressure, time, and leakage.
SIMULATION OF PRESSURE DECAYAND PHASE CHANGE IN A GDi HIGHPRESSURE FUEL RAIL (AND LINES)The GDi high pressure fuel system was modeled usingMicrosoft Excel to determine fuel pressure decay in a zeroleak system. The volume of the high pressure section wasdetermined at standard conditions. The system was thenmodeled as a simple tube of the rail diameter and wallthickness and of sufficient length to account for the entirehigh pressure section volume. The simplified design makesstrain calculations and thermal expansion easy to evaluate.
The model was evaluated for pressure at each of 720 timesteps. At each step the fuel temperature is calculated and thecapacity of the rail is compared to the volume of the fuel.Excel's “Goal Seek” function is applied to determine thepressure at which capacity equals volume. A macro ranquickly through all 720 steps. As long as the pressurereturned was above the vapor pressure, “Goal Seek” matchedfuel volume to capacity. Once vapor pressure was reached, atheoretical pressure was calculated as the vapor pressure plusthe partial pressure of air. The air is the difference in theequilibrium air that the fuel may contain at fuel tankconditions (assumed 1 bar and 20°C) and the equilibrium airthat the fuel in the rail may contain.
TEMPERATUREThe model requires accurate temperatures for the fuel in therail at each time step. The temperatures in the model followthe form of the transient conduction equation [1] (equation(1)):
(1)
The other variables are form factors and constants that arevery difficult to define. Using data from a vehicle test theequation can be simplified to equation (2):
(2)
where ‘k’ was determined by fitting the equation to thevehicle data.
This equation is used for both the coolant temperature and thefuel temperature. For the coolant temperature Ti is the shut-down coolant temperature & T∞ is ambient. For the fueltemperature Ti is the shut-down fuel rail temperature & T∞ isthe coolant temperature.
FUEL DENSITYThe key to knowing the fuel volume is to know the density atthe temperature and pressure conditions of each step. The fueldensity was determined by creating a 61 component fuel ofRVP = 9psi, and standard density 0.75 g/cc. This fuel was runthrough HYSYS®[2], a program used by the petroleumindustry to design refinery steps. HYSYS® computed thedensity of the fuel for each condition input. With sufficientconditions defined an equation in T (Temperature), P(Pressure), T2, P2, and TP was created by regression analysis(r2 > 0.99).
LEAKAGELeakage from both the high pressure pump check valve andthe injector tips were considered. A square root relationshipwas used for leakage versus pressure as is typical for a sharpedge orifice [3]. Real leaks may resemble sharp orifices (assimulated), capillaries (linear leak-pressure relation),deformable interfaces (relation starts inverse then becomesproportional), or a combination.
Initial injector tip leak rates were chosen from production testdata. Lower values were then simulated to represent abroken-in condition, and later, higher values simulated tolook at the worst case. The fuel pump check valve leak rate isdefined by pressure drop at constant temperature, so that hadto be modeled to create a leak limit in SCCM. Mostsimulation runs were at ∼50% of the determined pump leaklimit. Check valves were also simulated at max leak to testworst case.
SIMULATIONSInitial simulations were run without leakage to verify thatcooling alone will drop the pressure below the fuel's vaporpressure; Injector tip and check-valve leakage was then addedto match the pressure decay rates from the vehicle tests. Theleakage needed to match the data was consistent with theexpected tip leakage of aged injectors and check-valves. Thecomparison of the model to vehicle data for a shut-down at4MPa, 90°C coolant, and 60°C fuel (rail) is shown in Figure6.

A confirmation run with the same leak rates and thermalfactors starting at 97°C coolant, 79°C fuel (rail), and 4MPashowed equally good agreement between the model andvehicle data.
Figure 6. Modeled fuel temperature and pressure (bluelines) compares well with measured vehicle data (red
lines)
ANALYSISWhen the pressure in the rail drops to the fuel vapor pressure,the volume of the liquid fuel drops below the capacity of therail. The initial vapor formation was modeled using 10second time steps. It was clear that the vapor formation alonedidn't cause the slow engine starts because the in-tank pumpraised the rail pressure well above the vapor pressure beforecranking began. An SAE paper presented by Pursifull [4]showed how air could come out of solution when conditionsreduce air solubility below the solubility in the gas tank. Theprocesses of dissolving air in gasoline and emitting it backoccur very slowly. Any air in the fuel lines when the enginestarts to crank, is likely to still be present when the enginestarts. Until the air is compressed into a volume smaller thanthe high pressure pump piston displaces, the pressure rise willbe slow. The pressure rise per pump stroke, when the airvolume exceeds the pump displacement, can be calculated byapplying the ideal gas law to the air mass (equation (3)).
(3)
Determination of the free air mass was added to the modeland it was evaluated at 100-second time steps. The free air iscalculated as the difference between the amount of air thatcan be dissolved in the gasoline at fuel tank conditions andthe air that can be dissolved at the fuel rail conditions perASTM D 2779-92 [5]. For each time step where the fuelvolume is less than the rail capacity the pressure is iterated towhere it equals the free air partial pressure plus the fuel vaporpressure. Once again Excel “Goal Seek” is used for theiterations. At each step the calculated free air is the air thatcould come out of solution if the system was held constant atthose conditions. Therefore, at the early time steps the actualair is significantly less than that calculated. After about 12hours temperature and pressure changes become very smalland the actual free air mass can approach the calculated airmass.
The air dissolved in the fuel is assumed to have equalized inthe fuel tank at about 20°C and 1bar absolute pressure. Airwill eventually come out of solution in the rail when there isvapor space and when the temperature is higher and/or thepressure is lower than the fuel tank conditions. The amount ofair depends on the temperature and pressure difference aswell as the mass of fuel in the rail. Since the free air masswon't reach equilibrium until after the rail temperature does,the air was calculated [3] for a constant temperature (20°C)which gives the following simplified equation for solubilityof air in gasoline:
(4)
Figure 7 shows the effect of different shut-down fueltemperatures on the amount of air expected to come out ofsolution. What drives that curve is the difference between theshut-down fuel temperature and ambient. The shut-downtemperature determines the fuel density in the rail and thusthe mass. Higher temperatures decrease density and lower themass. After cooling, the lower fuel mass leaves a larger vaporspace for the air to form in.
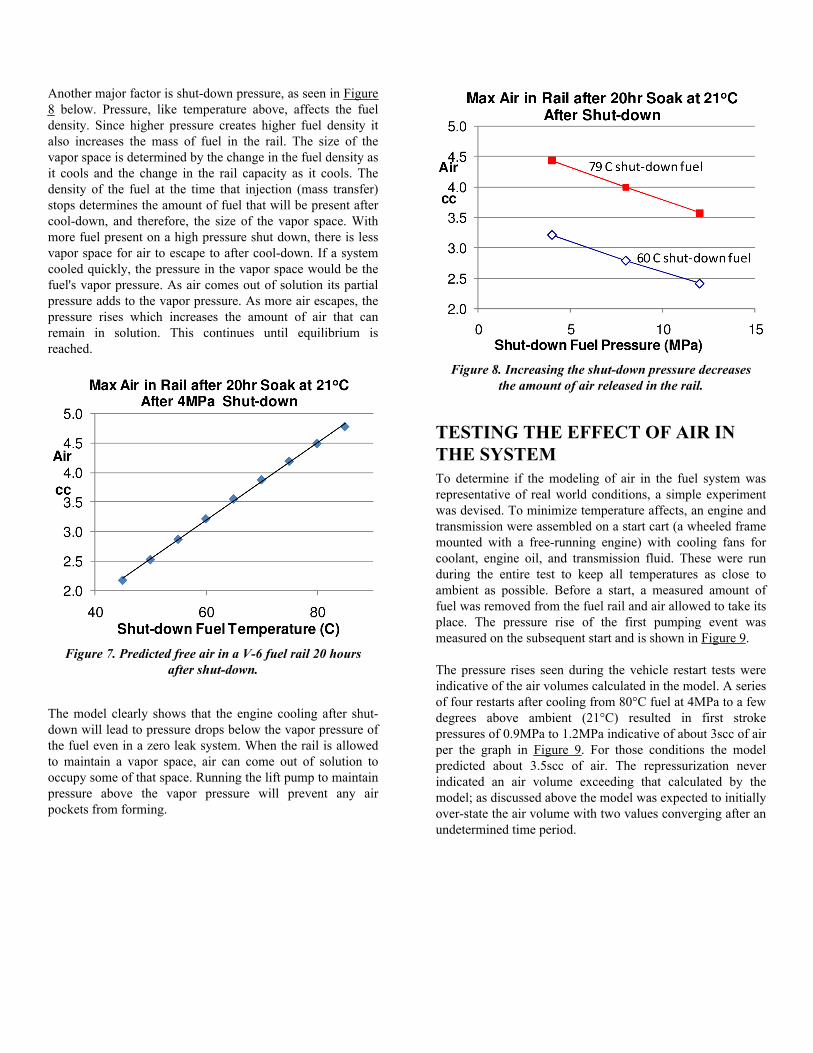
Another major factor is shut-down pressure, as seen in Figure8 below. Pressure, like temperature above, affects the fueldensity. Since higher pressure creates higher fuel density italso increases the mass of fuel in the rail. The size of thevapor space is determined by the change in the fuel density asit cools and the change in the rail capacity as it cools. Thedensity of the fuel at the time that injection (mass transfer)stops determines the amount of fuel that will be present aftercool-down, and therefore, the size of the vapor space. Withmore fuel present on a high pressure shut down, there is lessvapor space for air to escape to after cool-down. If a systemcooled quickly, the pressure in the vapor space would be thefuel's vapor pressure. As air comes out of solution its partialpressure adds to the vapor pressure. As more air escapes, thepressure rises which increases the amount of air that canremain in solution. This continues until equilibrium isreached.
Figure 7. Predicted free air in a V-6 fuel rail 20 hoursafter shut-down.
The model clearly shows that the engine cooling after shut-down will lead to pressure drops below the vapor pressure ofthe fuel even in a zero leak system. When the rail is allowedto maintain a vapor space, air can come out of solution tooccupy some of that space. Running the lift pump to maintainpressure above the vapor pressure will prevent any airpockets from forming.
Figure 8. Increasing the shut-down pressure decreasesthe amount of air released in the rail.
TESTING THE EFFECT OF AIR INTHE SYSTEMTo determine if the modeling of air in the fuel system wasrepresentative of real world conditions, a simple experimentwas devised. To minimize temperature affects, an engine andtransmission were assembled on a start cart (a wheeled framemounted with a free-running engine) with cooling fans forcoolant, engine oil, and transmission fluid. These were runduring the entire test to keep all temperatures as close toambient as possible. Before a start, a measured amount offuel was removed from the fuel rail and air allowed to take itsplace. The pressure rise of the first pumping event wasmeasured on the subsequent start and is shown in Figure 9.
The pressure rises seen during the vehicle restart tests wereindicative of the air volumes calculated in the model. A seriesof four restarts after cooling from 80°C fuel at 4MPa to a fewdegrees above ambient (21°C) resulted in first strokepressures of 0.9MPa to 1.2MPa indicative of about 3scc of airper the graph in Figure 9. For those conditions the modelpredicted about 3.5scc of air. The repressurization neverindicated an air volume exceeding that calculated by themodel; as discussed above the model was expected to initiallyover-state the air volume with two values converging after anundetermined time period.

Figure 9. Higher volumes of air in the system reduce theeffectiveness of the first high pressure pump stroke.
CONTROLING VAPOR FORMATIONWITH LOW PRESSURE LIFT PUMPACTIVATION DURING SOAKIn order to mitigate the dissolution of air from the fuel duringextended soaks, an algorithm was developed to allow liftpump operation for brief periods during engine off soakconditions. The increase in system pressure during lift pumpoperation prevents formation of vapor during system cooldown. This eliminates the possibility of vacuum conditionswhich can lead to air dissolution from the fuel in the fuel rail.Testing demonstrated that enabling the lift pump for onesecond, every 90 minutes, for a total of six hours willeliminate the formation of vapor or dissolution.
The improved pressure rise yields a significant benefit in starttime. The effect of this function is seen by comparing theconventional start shown in Figure 10 with the start utilizingthe wake up function shown in Figure 11.
Finally, taking all we had learned and applying the optimizedwake up function we ran some more soak-start cycles. Weplotted the new starts with data from our first methodicalstarts to get the chart in Figure 12.
Figure 10. 1.2 second start after a conventional soak.
Figure 11:. 0.8 second start after a soak with wake upfunction.

Figure 12. Start improvement from using the wake upfunction.
SUMMARY/CONCLUSIONSQuick pressure rise is required for optimal starts in GDifueled vehicles. Injecting fuel during the cylinder'scompression stroke gives the best engine starts but highpressure fuel is required to overcome cylinder pressure duringthe injection. The air desorbed from the fuel during a soakslows the pressure build in the rail. While the lift pump in thefuel tank quickly compresses vapor back into liquid, airwhich desorbs into the vapor space takes longer to re-dissolve. Air re-dissolves into fuel too slowly to beeliminated when cranking the engine. The high pressurepump can only compress the air volume until it is smallerthan the pump displacement; then it will build the highpressure needed.
With the system tested, pressure decay and air desorption aremore strongly influenced by engine cooling than by internalleakage. A leak free system will still have vapor in the railafter cooling from a warmed up state. Preventing theformation of a vapor space in the rail is the most effectiveway to prevent the desorption of air. Once the air pocketforms it must be compressed to a volume smaller than thehigh pressure pump displacement or be re-dissolved beforehigh pressure can be achieved.
As long as the rail pressure is maintained above the fuelvapor pressure there will be no air formation in the system.Even in extreme circumstances this can be accomplished withno more than four seconds of total lift pump operation. Theoperation occurs no more than four times and for no more
than one second at a time all within a six hour period, withoutthe need to monitor any sensors, minimizing draw on thebattery.
REFERENCES1. Fundamentals of Heat Transfer, Incropera, F. & DeWitt,D., 1981, p.182
2. Hysys, computer program, Aspentech(www.aspentech.com), Burlington, MA
3. Engineering Fluid Mechanics 2nd Ed., Roberson, J. &Crowe, C., 1980, p.533
4. Pursifull, R., “Rapid Fuel Injector Re-Pressurization,”SAE Technical Paper 2007-01-1075, 2007, doi:10.4271/2007-01-1075.
5. equilibrium air dissolved in gasoline per ASTM D2779-92 reapproved 2007
CONTACT INFORMATION1. David [email protected]
2. William [email protected]
3. David [email protected]
4. James M. [email protected]
ACKNOWLEDGMENTSThanks to Tim Spegar, Delphi Corporation, for input on theequations used in the model
DEFINITIONS/ABBREVIATIONSGDi
Gasoline Direct injection fuel system
HPPHigh Pressure Pump
Pa (N/m2)Pascals

RVPReed Vapor Pressure - Vapor pressure of a substanceat a defined reference temperature
sccStandard cubic centimeter - Theoretical volume that agas would occupy at standard atmospheric temperature& pressure
SCCMStandard Cubic Centimeters per Minute - Theoreticalvolumetric flow rate if the fluid was at standardatmospheric temperature & pressure
The Engineering Meetings Board has approved this paper for publication. It hassuccessfully completed SAE's peer review process under the supervision of the sessionorganizer. This process requires a minimum of three (3) reviews by industry experts.
All rights reserved. No part of this publication may be reproduced, stored in aretrieval system, or transmitted, in any form or by any means, electronic, mechanical,photocopying, recording, or otherwise, without the prior written permission of SAE.
ISSN 0148-7191
Positions and opinions advanced in this paper are those of the author(s) and notnecessarily those of SAE. The author is solely responsible for the content of the paper.
SAE Customer Service:Tel: 877-606-7323 (inside USA and Canada)Tel: 724-776-4970 (outside USA)Fax: 724-776-0790Email: [email protected] Web Address: http://www.sae.orgPrinted in USA