gaseous bromine and particulate lead, vanadium, and bromine in a polluted atmosphere
TRANSCRIPT
Gaseous Bromine and Particulate Lead, Vanadium, and Bromine in a Polluted Atmosphere
Jarvis L. Moyers,' William H. Zoller,2 Robert A. D ~ c e , ~ and Gerald L. Hoffman3 Department of Chemistry and Hawaii Institute of Geophysics, University of Hawaii, Honolulu, Hawaii, 96822
D Atmospheric gaseous bromine and particulate lead, vana- dium, and bromine were collected simultaneously in Cam- bridge, Mass., with activated charcoal and membrane filters. This study showed a significant fraction of bromine in the polluted atmosphere exists in the gaseous phase. Concentra- tions of gaseous bromine ranged from 0.12-0.45 pg/m3; partic- ulate bromine, 0.12-0.94 pg/m3; and particulate vanadium, 0.08-1.32 pg/m3 as determined by neutron activation analysis. Lead concentrations varied from 0.4-3.7 pg/m3 as determined by atomic absorption spectroscopy. All particulate species showed significant correlation with each other, indicating that their interrelationships in the atmosphere can be ex- plained largely by meteorological conditions. However, the correlation of Pb with both particulate Br and total Br was exceptionally good since Pb and Br come from the same source. Despite this, results indicate the atmospheric con- centrations of Br are less than suspected from the amounts of Br added to gasoline in ethyl fluid. The lower atmospheric Br concentration may be explained by different residence times for Br and Pb or that some Br exists in a chemical form not collected by filtration or activated charcoal adsorption.
here is presently no information available on the concen- T tration of gaseous bromine in a polluted atmosphere. Concentrations of gaseous bromine have been estimated in the marine atmosphere in Hawaii by Duce et al. (1965) with a crude potassium carbonate bubbler and filter arrangement. Their results showed a possible gaseous bromine concentra- tion of 0.008-0.040 pg/m3 for the unpolluted marine atmo- sphere. Recent measurements of gaseous bromine in Hawaii by Moyers (1970) are the most trustworthy for the marine atmosphere and average 0.050 i 0.015 pg/m3. The concentra- tion of particulate bromine at the same location reported by Moyers (1970) is 0.009 + 0.003 pg/m3. In urban areas, par- ticulate bromine is a major pollutant resulting from the com- bustion of ethyl fluid in gasoline. Lininger et al. (1966), Winchester et al. (1967), and Loucks (1969) have indicated the role of particulate bromine in pollution. The possible production of gaseous bromine by oxidation of particulate
To whom correspondence should be addressed. Present ad- dress: Department of Chemistry, University of Arizona, Tucson, Ariz. 85721.
2 Present address: Department of Chemistry, University of Maryland, College Park, Md. 20742.
Present addiess: Graduate School of Oceanography, Univer- sity of Rhode Island, Kingston, R.I. 02881.
68 Environmental Science & Technology
bromine by ozone and other chemical oxidants or by photo- chemical processes was suggested by Winchester et al. (1967). Pierrard (1969) has shown that lead bromochloride particles suspended in carbon tetrachloride do release bromine by the photochemical oxidation of bromide. However, the quantity and importance of gaseous bromine in a polluted or un- polluted atmosphere have largely remained unknown.
The concentration of gaseous bromine is related to the concentration of lead in the aerosols either as a source or as a possible reactive sink. The concentration of lead in polluted air has been studied extensively by many investigators. The extent of lead pollution, as well as the toxicity of this element, was discussed in detail by Patterson (1965). Measurements of the lead concentration of Cambridge, Mass., air have been made by the U S . Public Health Service (1962, 1968) and other investigators.
To explain correlation of particulate lead and bromine in the atmosphere, simultaneous measuring of a metallic element with an entirely different source is important. For comparison, vanadium, whose primary source in polluted air is the combustion of residual fuel oils in power plants (Zoller and Gordon, 1970), was also measured. Vanadium has been found in rather high concentrations in Cambridge by Zoller and Gordon (1970). The vanadium concentration in the Boston area has been shown to be among the highest in the nation by Larsen (1964). Vanadium has also been measured by the US. Public Health Service (1962, 1968) at a few locations, although the analytical technique em- ployed was not sensitive enough to obtain concentrations unless the level of vanadium was extremely high. Some measurements of the vanadium content of polluted air in other regions were made by Stocks et al. (1961) in England, and Brar et al. (1969) in Chicago by neutron activation analysis.
Experimentul Atmospheric particulate samples were collected on both
type EH and HA Millipore filters (47 mm) with a vacuum pump on the roof of the Arthur A. Noyes Nuclear Chemistry Center at the Massachusetts Institute of Technology, Cam- bridge, Mass,, during September 1969. The filter blank correc- tion for the elements measured (V, Pb, and Br) was less than 5 % for all samples. Gaseous bromine samples were collected on clean activated charcoal during the same period as the particulate matter. The gas collector consisted of an electro- static precipitator, which removed the particulate matter, followed by a 2-gram bed of precleaned activated charcoal. The charcoalwas precleaned by heating to 750°C for two weeks in a vacuum of approximately 10-3 cm Hg. This procedure reduced the Br blank in the charcoal to approximately 15 ppb. The charcoal samples were analyzed for bromine by neutron activation analysis with the method developed by Moyers
(1970). Following a 20-min irradiation with neutrons, the sample (charcoal) was agitated in a hot 1M sodium hydroxide solution containing a few drops of a 5 % sodium hypochlorite solution and bromate carrier. After acidifying, the bromate carrier was slowly reduced to bromide by the dropwise addi- tion of 0 .5M Na2S2O6. This allowed the radioactive bromine to exchange with the carrier. This procedure has been shown by Moyers (1970) to remove better than 95 of the bromine activity. The slurry was filtered and bromine was chemically separated from the filtrate by the method of Duce and Win- chester (1965) before beta counting.
The particulate samples were analyzed by three methods, two involving thermal neutron activation analysis and the third, atomic absorption. Each filter was divided in half and both sections were sealed into clean polyethylene envelopes for neutron irradiation in the MIT Nuclear Reactor (flux @Th 2.3 X l O I 3 n/cm2/sec). Vanadium was measured non- destructively by a slight modification of the method used by Zoller and Gordon (1970). y-Ray spectra were taken with a high-resolution Ge(Li) detector with a full width a t half maximum (FWHM) of 2.5 KeV for the 1.332 MeV line of W o . The pulses for the detector and amplifier system were fed into a 4096 channel pulse height analyzer where the y-ray spectra were accumulated for 2-min intervals. Alternate spectra of standards and of the sample were accumulated and stored on magnetic tape for later computer analysis. The filters were set aside to allow decay of the induced radioactivity before subsequent lead analysis by atomic absorption. The second portion of the filter was irradiated with neutrons for 20 min and then agitated in a hot 1M sodium hydroxide solution containing carrier bromide. Subsequent chemical separation of the bromine fraction by a procedure similar to that of Duce and Winchester (1965), followed by gross beta counting, allowed the determination of the particulate bromine concen- tration. The counting was done on a low-background anti- coincidence proportional counter in conjunction with an auto- matic sample changer and timer.
For the lead analysis, the filters were agitated with 0.1M H N 0 3 for 15 min in an ultrasonic bath. The samples were then centrifuged and the wash solution decanted before analysis. This procedure has been shown by Jernigan (1969) to remove essentially all pollution lead from the filters. The analyses were performed with a Perkin-Elmer 303 atomic absorption spectrophotometer. It should be noted that in a polluted atmosphere such as Cambridge, only a few cubic
meters of air need be sampled to obtain accurate results with the sensitive analytical methods described here.
The values reported in this paper for all particulate species have analytical uncertainties of + 10%. The reliability of the gaseous Br concentrations is somewhat less certain. The electrostatic precipitator can possibly change the gaseous Br concentration by either ionizing and thus collecting the gaseous bromine before it reaches the charcoal or by releasing gaseous Br from the particulate bromine (this is probably due to the formation of Brz by the oxidation of particulate bromide). Various field tests were conducted to determine how the electrostatic precipitator might alter the gaseous bromine concentrations. These tests indicated that the precipitator's effect on the gaseous bromine concentrations was variable but that the measured concentrations were good to 1 2 0 % .
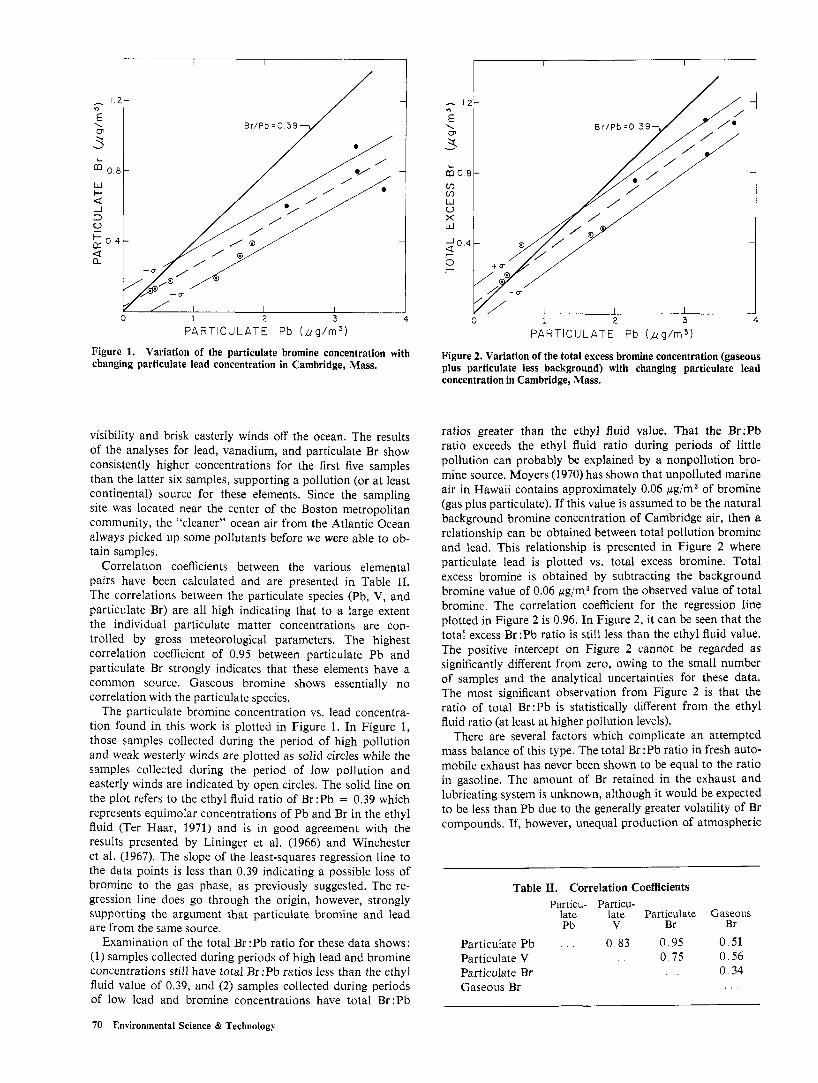
Results and Discussion The results of the analyses are given in Table I. The con-
centration range observed for lead, 0.39-3.7 pg/m3, is close to that observed by the U S . Public Health Service (1962, 1968) for Cambridge, Mass. The vanadium concentrations range between 0.080-1.32 pg/m3 and are in agreement with results obtained by other investigators for the polluted Cambridge atmosphere (Zoller and Gordon, 1970; Larsen, 1964; U S . Public Health Service, 1962, 1968). The particulate bromine concentrations vary from 0.12 to 0.94 pg/m3 and are also within the range of previous particulate Br measurements in Cambridge (Lininger et al., 1966; Zoller and Gordon, 1970). The gaseous bromine concentrations are, in most cases, approximately equal to the particulate Br concentrations. The particulate Br concentrations in Cambridge are from 10 to 100 times the concentrations generally observed in marine air in Hawaii (Duce et al., 1965, 1967; Moyers, 1970), where- as the gaseous Br in Cambridge is only two to six times the concentration found in Hawaii (Moyers, 1970). This indi- cates that the sea may possibly contribute a significant frac- tion of the gaseous Br present in Cambridge air when pollution levels are low.
During the early part of the sampling period (samples 1-5), the weather was characterized by weak westerly winds and a strong temperature inversion, giving poor visibility and generally little mixing of air masses due to a stationary front north of the Boston area. The latter part of the sampling period (samples 6-11) consisted of clear days with good
Table I. Lead, Vanadium, and Bromine Concentrations in the Atmosphere of Cambridge, Mass. Sample Collection Meteorological VQ, Particulate" Gaseousb Total
no. date, 1969 Time, EST conditions Pbn, r g h 3 a / m 3 Br, rg/m3 Br, rg/m3 Br, rg/m3 1 912 1000-1800 Weak westerly 2 .04 0.68 , . . . . . , . .
2 913 0630-1 130 winds, strong 2 .31 0 . 9 5 0 .60 0 .21 0 .81 3 914 0645-1 145 temperature in- 3 .32 1 .12 0 .80 0 .16 0 .96 4 914 1200-1630 version, low 3 .70 1 .32 0 .69 0.45 1 .14 5 914-5 1645-0530 visibility 3 .30 0 .48 0 .94 0.22 1 . 1 6
6 915 0530-1 545 Brisk easterly 0 .68 1 0 .10 0 .09 0 .17 0.28 0 . 4 5
8 9/15-16 1900-0550 clouds, good 0 . 4 5 i 0.10 0 .08 0 .13 0 .15 0.28 9 911 6 0550-1620 visibility 1 .84 0 .15 0 .39 0 . 1 5 0.54
10 9/16 1620-2340 1 . 6 6 1 0.25 0 .21 0.32 0 . 1 9 0.51 11 9/16-17 2340-0540 0 .39 1 0.10 0 .19 0 .12 0 .12 0 .24
7 911 5 1240-1900 winds, no 1 . 3 3 1 0.20 0 .16 0 .19 , . . , . .
a All values reported have analytical uncertainties of i 10% unless otherwise indicated. * Values have analytical uncertainties of =t20%.
Volume 6, Number 1, January 1972 69
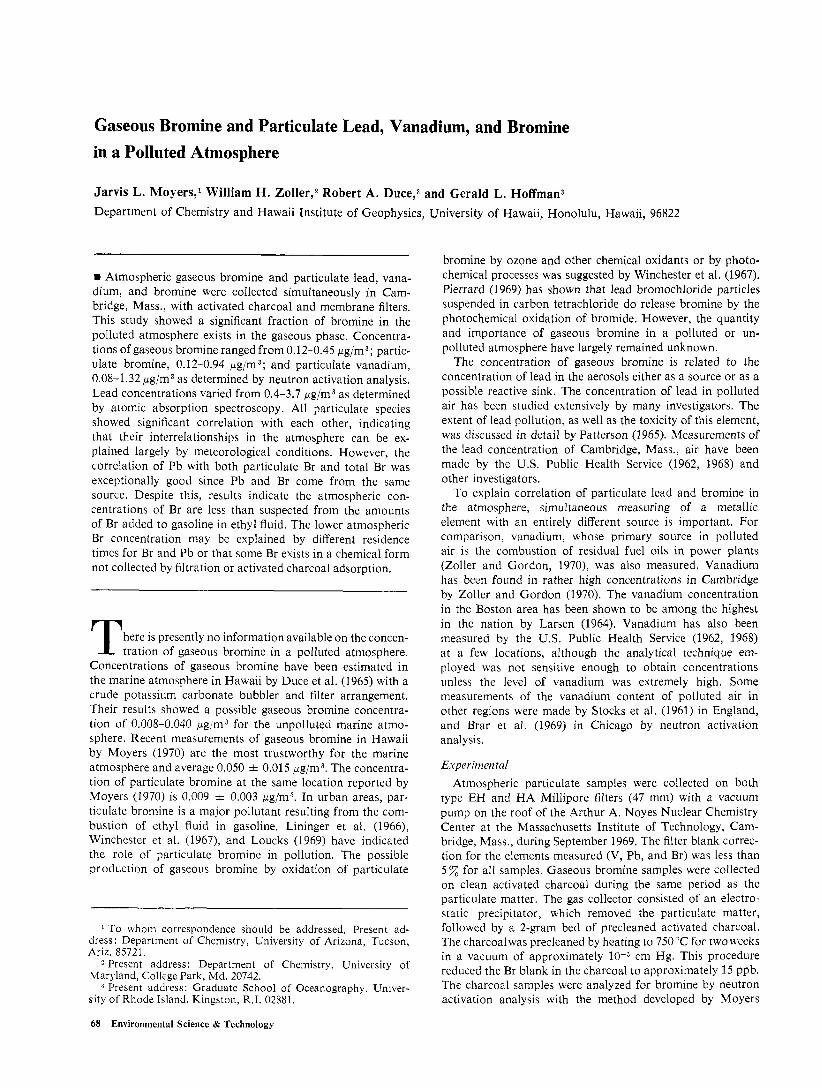
5“. I /
--o
0 1 2 3 PARTICULATE Pb ( ,ug/m3)
Figure 1. changing particulate lead concentration in Cambridge, Mass.
Variation of the particulate bromine concentration with
visibility and brisk easterly winds off the ocean. The results of the analyses for lead, vanadium, and particulate Br show consistently higher concentrations for the first five samples than the latter six samples, supporting a pollution (or at least continental) source for these elements. Since the sampling site was located near the center of the Boston metropolitan community, the “cleaner” ocean air from the Atlantic Ocean always picked up some pollutants before we were able to ob- tain samples.
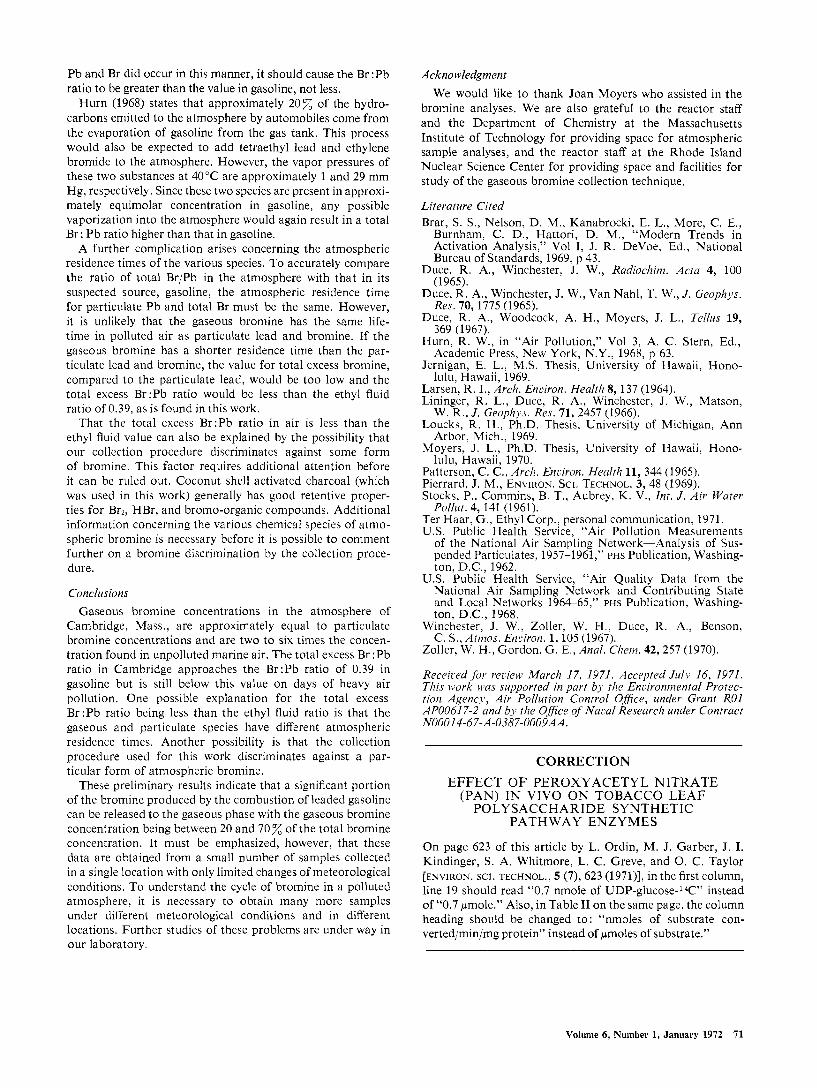
Correlation coefficients between the various elemental pairs have been calculated and are presented in Table 11. The correlations between the particulate species (Pb, V, and particulate Br) are all high indicating that to a large extent the individual particulate matter concentrations are con- trolled by gross meteorological parameters. The highest correlation coefficient of 0.95 between particulate Pb and particulate Br strongly indicates that these elements have a common source. Gaseous bromine shows essentially no correlation with the particulate species.
The particulate bromine concentration vs. lead concentra- tion found in this work is plotted in Figure 1. In Figure 1 , those samples collected during the period of high pollution and weak westerly winds are plotted as solid circles while the samples collected during the period of low pollution and easterly winds are indicated by open circles. The solid line on the plot refers to the ethyl fluid ratio of Br :Pb = 0.39 which represents equimolar concentrations of Pb and Br in the ethyl fluid (Ter Haar, 1971) and is in good agreement with the results presented by Lininger et al. (1966) and Winchester et al. (1967). The slope of the least-squares regression line to the data points is less than 0.39 indicating a possible loss of bromine to the gas phase, as previously suggested. The re- gression line does go through the origin, however, strongly supporting the argument that particulate bromine and lead are from the same source.
Examination of the total Br:Pb ratio for these data shows: (1) samples collected during periods of high lead and bromine concentrations still have total Br :Pb ratios less than the ethyl fluid value of 0.39, and (2) samples collected during periods of low lead and bromine concentrations have total Br :Pb
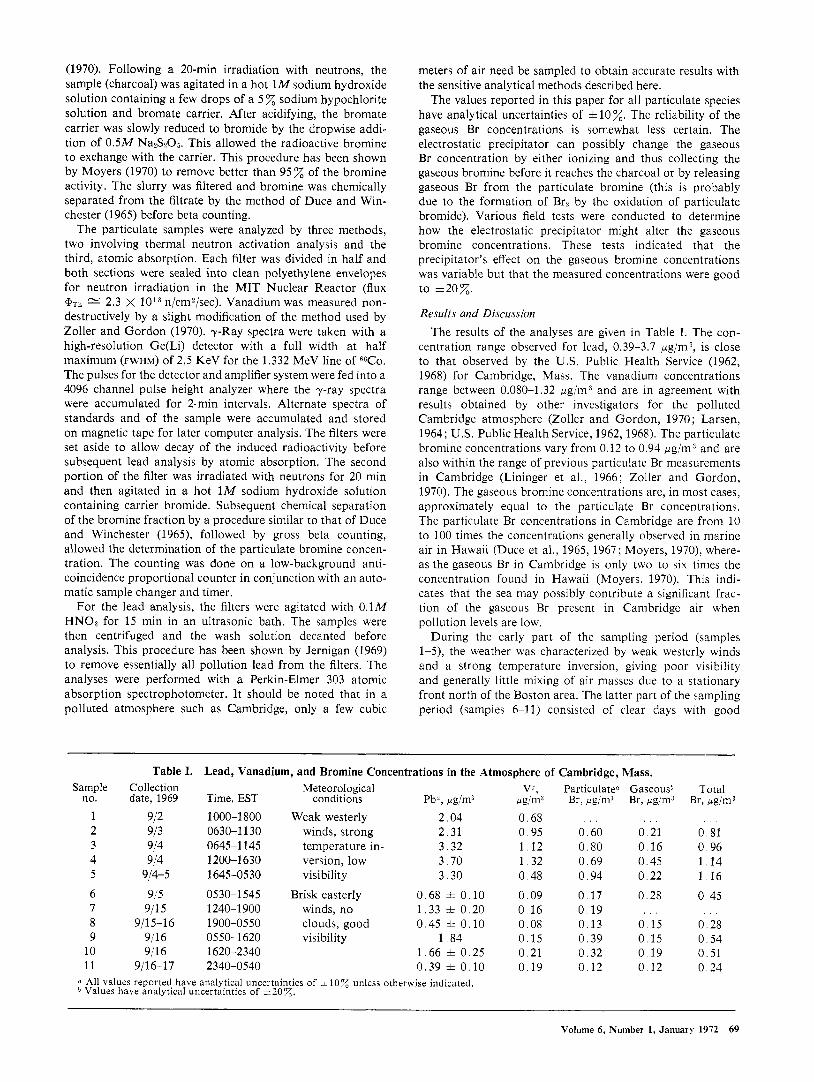
PARTICULATE Pb ( y g / m 3 )
Figure 2. Variation of the total excess bromine concentration (gaseous plus particulate less background) with changing particulate lead concentration in Cambridge, Mass.
ratios greater than the ethyl fluid value. That the Br:Pb ratio exceeds the ethyl fluid ratio during periods of little pollution can probably be explained by a nonpollution bro- mine source. Moyers (1970) has shown that unpolluted marine air in Hawaii contains approximately 0.06 pg/m3 of bromine (gas plus particulate). If this value is assumed to be the natural background bromine concentration of Cambridge air, then a relationship can be obtained between total pollution bromine and lead. This relationship is presented in Figure 2 where particulate lead is plotted vs. total excess bromine. Total excess bromine is obtained by subtracting the background bromine value of 0.06 pg/m3 from the observed value of total bromine, The correlation coefficient for the regression line plotted in Figure 2 is 0.96. In Figure 2 , it can be seen that the total excess Br :Pb ratio is still less than the ethyl fluid value. The positive intercept on Figure 2 cannot be regarded as significantly different from zero, owing to the small number of samples and the analytical uncertainties for these data. The most significant observation from Figure 2 is that the ratio of total Br:Pb is statistically different from the ethyl fluid ratio (at least at higher pollution levels).
There are several factors which complicate an attempted mass balance of this type. The total Br :Pb ratio in fresh auto- mobile exhaust has never been shown to be equal to the ratio in gasoline, The amount of Br retained in the exhaust and lubricating system is unknown, although it would be expected to be less than Pb due to the generally greater volatility of Br compounds. If, however, unequal production of atmospheric
Table 11. Correlation Coefficients Particu- Particu-
late late Particulate Gaseous Pb V Br Br
Particulate Pb . . . 0 , 8 3 0 . 9 5 0 .51 , . . 0.75 0.56 Particulate V
. . . 0.34 Particulate Br Gaseous Br . . .
70 Environmental Science & Technology
Pb and Br did occur in this manner, it should cause the Br :Pb ratio to be greater than the value in gasoline, not less.
Hurn (1968) states that approximately 2 0 x of the hydro- carbons emitted to the atmosphere by automobiles come from the evaporation of gasoline from the gas tank. This process would also be expected to add tetraethyl lead and ethylene bromide to the atmosphere. However, the vapor pressures of these two substances at 40°C are approximately 1 and 29 mm Hg, respectively. Since these two species are present in approxi- mately equimolar concentration in gasoline, any possible vaporization into the atmosphere would again result in a total Br : Pb ratio higher than that in gasoline.
A further complication arises concerning the atmospheric residence times of the various species. To accurately compare the ratio of total Br/Pb in the atmosphere with that in its suspected source, gasoline, the atmospheric residence time for particulate Pb and total Br must be the same. However, it is unlikely that the gaseous bromine has the same life- time in polluted air as particulate lead and bromine. If the gaseous bromine has a shorter residence time than the par- ticulate lead and bromine, the value for total excess bromine, compared to the particulate lead, would be too low and the total excess Br:Pb ratio would be less than the ethyl fluid ratio of 0.39, as is found in this work.
That the total excess Br:Pb ratio in air is less than the ethyl fluid value can also be explained by the possibility that our collection procedure discriminates against some form of bromine. This factor requires additional attention before it can be ruled out. Coconut shell activated charcoal (which was used in this work) generally has good retentive proper- ties for Br?, HBr, and bromo-organic compounds. Additional information concerning the various chemical species of atmo- spheric bromine is necessary before it is possible to comment further on a bromine discrimination by the collection proce- dure.
Conclusions Gaseous bromine concentrations in the atmosphere of
Cambridge, Mass., are approximately equal to particulate bromine concentrations and are two to six times the concen- tration found in unpolluted marine air. The total excess Br :Pb ratio in Cambridge approaches the Br:Pb ratio of 0.39 in gasoline but is still below this value on days of heavy air pollution. One possible explanation for the total excess Br:Pb ratio being less than the ethyl fluid ratio is that the gaseous and particulate species have different atmospheric residence times. Another possibility is that the collection procedure used for this work discriminates against a par- ticular form of atmospheric bromine.
These preliminary results indicate that a significant portion of the bromine produced by the combustion of leaded gasoline can be released to the gaseous phase with the gaseous bromine concentration being between 20 and 70 % of the total bromine concentration. It must be emphasized, however, that these data are obtained from a small number of samples collected in a single location with only limited changes of meteorological conditions. To understand the cycle of bromine in a polluted atmosphere, it is necessary to obtain many more samples under different meteorological conditions and in different locations. Further studies of these problems are under way in our laboratory.
Acknowledgment We would like to thank Joan Moyers who assisted in the
bromine analyses. We are also grateful to the reactor staff and the Department of Chemistry at the h4assachusetts Institute of Technology for providing space for atmospheric sample analyses, and the reactor staff at the Rhode Island Nuclear Science Center for providing space and facilities for study of the gaseous bromine collection technique.
Literature Cited Brar, S. S., Nelson, D. M., Kanabrocki, E. L., More, C. E.,
Burnham, C. D. , Hattori, D. M., “Modern Trends in Activation Analysis,” Vol I, J. R. DeVoe, Ed., National Bureau of Standards, 1969, p 43.
Duce, R. A,, Winchester, J. W., Radiochim. Acta 4, 100 (1 965) , -~ --,.
Duce, R. A., Winchester, J. W., Van Nahl, T. W., J . Geophys.
Duce, R. A., Woodcock, A. H., Moyers, J. L., Teilus 19, Res. 70, 1775 (1965).
369 (1967). Hurn, R . W., in “Air Pollution,” Vol 3, A. C. Stern, Ed.,
Academic Press, New York, N.Y., 1968, p 63. Jernigan, E. L., M.S. Thesis, University of Hawaii, Hono-
lulu, Hawaii, 1969. Larsen, R. I . , Arch. Enciron. Health 8, 137 (1964). Lininger, R . L., Duce, R. A,, Winchester, J. W., Matson,
W. R., J . Ceoplij~s. Res. 71, 2457 (1966). Loucks, R . H., Ph.D. Thesis, University of Michigan, Ann
Arbor, Mich., 1969. Moyers, J. L., Ph.D. Thesis, University of Hawaii, Hono-
lulu, Hawaii, 1970. Patterson, C. C., Arch. Enciron. Heulth 11, 344 (1965). Pierrard. J. M., ENVIRON. SCI. TECHNOL. 3, 48 (1969). Stocks, P., Commins, B. T., Aubrey, K. V., Int. J . Air Water
Pollut. 4, 141 (1961). Ter Haar, G., Ethyl Corp., personal communication, 1971. US. Public Health Service, “Air Pollution Measurements
of the National Air Sampling Network-Analysis of Sus- pended Particulates, 1957-1961 ,” PHS Publication, Washing- ton, D.C., 1962.
U S . Public Health Service, “Air Quality Data from the National Air Sampling Network and Contributing State and Local Networks 1964-65,” PHS Publication, Washing- ton, D.C., 1968.
Winchester, J. W., Zoller, W. H. , Duce, R. A., Benson, C. S., Atnios. Enciron. 1, 105 (1967).
Zoller, W. H . , Gordon, G . E., Anal. Cl7en7. 42, 257 (1970).
Receiced for reciew March 17, 1971. Accepted JLLIJJ 16, 1971. This work was supported in part by rhe Encironmental Protec- tion Agency, Air Pollution Control Ofice, under Grant ROI AP00617-2 and by the Ofice o j Nacal Research under Contract NO001 4-67-A-0387-0009AA.
CORRECTION EFFECT OF PEROXYACETYL NITRATE
(PAN) IN VIVO ON TOBACCO LEAF POLYSACCHARIDE SYNTHETIC
PATHWAY ENZYMES
On page 623 of this article by L. Ordin, M. J. Garber, J. I. Kindinger, S. A. Whitmore, L. C. Greve, and 0. C. Taylor [ENVIRON. SCI. TECHNOL., 5 (7), 623 (1971)], in the first column, line 19 should read “0.7 nmole of UDP-glucose-l‘C” instead of “0.7 pmole.” Also, in Table I1 on the same page, the column heading should be changed to: “nmoles of substrate con- verted/min/mg protein” instead of pmoles of substrate.”
Volume 6, Number 1, January 1972 71