gas supply security in the baltic states: a qualitative
TRANSCRIPT
www.eprg.group.cam.ac.uk
EP
RG
WO
RK
ING
PA
PE
R
Abstract
Gas Supply Security in the Baltic States: A Qualitative Assessment
EPRG Working Paper 1008
Sachi Findlater and Pierre Noël
In a setting of increasing European concern over gas supply security, this article provides an empirical assessment of the gas supply security situations of three of the most gas dependant nations in Europe: Latvia, Lithuania and Estonia. The analysis challenges existing security indices and places an emphasis on having a detailed understanding of a country’s specific gas supply set up, the structure of its gas consumption and, in particular, policies in place designed to mitigate the effects of a disruption.
Keywords Natural Gas, security of supply, Baltic States
JEL Classification Q40, Q48
Contact [email protected] Publication March 2010 Financial Support ESRC TSEC3

1
Gas Supply Security in the Baltic States:
A Qualitative Assessment
Sachi Findlater1 and Pierre Noël Electricity Policy Research Group (EPRG), University of Cambridge
March 2010
1. The context Energy security has been moving up the European policy agenda over the last decade, recently becoming a prominent theme of the European political debate. This has been driven largely, though not entirely, by the rise in concern about the security of natural gas supply to Europe, particularly supplies from Russia. The crises of January 2006, and especially January 2009, where supplies of Russian gas to Europe via Ukraine were entirely disrupted for two weeks in the middle of a cold winter, have been key milestones in this process. The three Baltic States (Estonia, Latvia and Lithuania) were not impacted by the crisis of January 2009 as none of them rely on transit through Ukraine for their gas imports. However, they are highly dependent on Russia for their energy supply. Even though Estonia, Latvia and Lithuania have three of the smallest gas markets in Europe and their imports amount to little in absolute terms, all the gas they consume comes from Russia (cf Figure 1). As a share of total primary energy supply (cf Figure 2), Russian gas amounts to 15% for Estonia and about a third for Lithuania and Latvia, well above the EU average of 6.5% (Noel, 2009).
Figure 1. Imports of Russian gas and size of the gas market (2008)
Belg+Lux
Sweden
Rep. IrelandSpain
Portugal
Denmark
Slovenia Hungary
Czech Rep.
AustriaGreece
Lithuania
Bulgaria
SlovakiaFinland
Latvia
Estonia
UKNetherlands
Romania
France
Italy
Germany
Poland
-20%
0%
20%
40%
60%
80%
100%
120%
-5 5 15 25 35
Gas Imports from Russia (bcm)
Dep
ende
nce
on R
ussi
a(R
ussi
a / P
rimar
y G
as S
uppl
y)
Bubble surface = primary gas supply
Source: BP Statistical Review; Eurostat; National Statistics
1 Corresponding author: [email protected] The authors wish to thank those all those who were interviewed during the writing of this paper and Dr Jevgenijs Steinbuks for his assistance in this.

2
Figure 2. Dependence on Russian gas (2008)
Aus
Belg+Lux
Cz
Fra
Ger
Hun
ItaRom
Bulg
Est
Fin
Gre
Lat
Lit
Nether
Pol
PorIrld
Slova
Slove
SpainSwe UK
EU27 average0%
10%
20%
30%
40%
0% 10% 20% 30% 40% 50% 60% 70% 80% 90% 100%
Russian Gas / Primary Gas Supply
Rus
sian
Gas
/ To
tal P
rimar
y En
ergy
Sup
ply
Source: National statistics; BP Statistical Review of World Energy 2009
Finally the Baltic States have had a somewhat difficult relationship with Russia since their independence in the early 1990s and particularly since year 2000. They have experienced Moscow’s sometimes muscular foreign policy approach towards its ‘near-abroad’, including what many have called the use of the ‘energy weapon’ to advance Russia’s political and economic interests in Eastern Europe (Smith, 2004). High levels of dependence on Russian energy and a tense political relationship with Moscow explain why energy security, and especially gas supply security, has become a prominent political issue in the Baltic States over the past few years (Ilves, 2009).
2. Definition and methodology In order to assess how much security a country enjoys the notion has to be precisely defined. For the purpose of this article “security of gas supply” (or gas supply security) refers to the ability of a country’s energy supply system to meet final contracted energy demand in the event of a gas supply disruption. According to this definition a country may enjoy a high level of gas supply security even if it is unable to replace all disrupted gas supply by alternative gas. Access to alternative gas supply, including gas withdrawn from storage, is one way to achieve security while shifting to alternative fuels is another. The ability to source alternative gas depends on many factors including geographical location, the development of supply infrastructure (including gas storage) and the structure of the regional gas industry, in particular the existence and liquidity of traded markets and the ability to engage in short-term transactions. The substitutability of natural gas, on the other hand, largely depends on the structure of gas consumption by sector; residential gas customers typically have a limited ability to shift to alternative fuels for heating and cooking, while power plants and industrial boilers can be equipped with dual-fuel capability. Finally, interruptible contracts allow contracted demand to be spontaneously reduced in case of supply disruption. Customers (usually industrial companies) who sign these contracts accept the possibility of interruption in certain circumstances in exchange for a permanent

3
discount on the price of gas, which then allows them to finance appropriate security measures such as dual-fuel capability. Our definition allows the security offered by national policy driven measures such as dual-fuel capability and interruptibility to be included in analysis where many definitions do not2. Furthermore, our definition of gas supply security does not imply any necessary link between security and self-sufficiency, an important distinction also noted by Percebois (2007). A country may be largely self-sufficient in gas yet unable to meet energy demand in case of a major failure of its gas supply infrastructure; alternatively a highly dependent country may attain a high level of security through a mix of fuel-switching, voluntary (i.e., contracted) interruption and ability to access alternative gas. Our definition may not capture the whole range of issues that commentators and politicians have in mind when they use the phrase ‘gas supply security’. In particular, the Baltic States’ dependence on Russian gas may have implications beyond the risk of supply disruptions, such as constraints on their foreign or public policies, for example, restraint (and therefore reduced national autonomy) in the way they deal with Russia or Russian investors may be a way to buy a lower risk of disruption. Both Christie (2009) and Röller (2007) note that large foreign suppliers, and in particular government controlled ones, may use coercion to gain political concessions in their favour. However, these dimensions of ‘energy insecurity’ are difficult (if not impossible) to assess rigorously and are constantly changing. Ultimately though, the physical result of a politically motivated disruption is the same as a technical one – an absence of gas, and therefore this paper will focus on gas supply security as the ability to cope with supply disruptions. In principle, the level of gas supply security enjoyed by a country or region can always be improved. It is usually possible to increase the gas supply system’s ability to source alternative gas in case of a disruption of usual flows, at a cost which may be very sensitive to national and regional characteristics. Similarly the ability of the energy system to shift to alternative fuels in case of gas supply disruption can be enhanced, at a cost. Therefore when policy makers address the issue of gas supply security they should ask three questions: (1) What level of security does the country currently enjoy? (2) What level of security does the country want to enjoy? (3) What is the cost-effective way to reach the preferred level of security? The first question calls for an assessment of the various types and likelihood of gas supply disruptions, the ability of the energy system to cope with them and their likely impact on the economy. To determine the appropriate level of security rigorously (second question) policy makers can try to assess the willingness of economic agents to pay for gas security (Hough, 2005; Damigos et al., 2009) or calculate the marginal damage function of gas supply disruptions as illustrated in Hirschhausen et al (2008, p. 17-23). Finally, to answer the third question, policy makers need to know the cost of various policies and measures designed to increase supply security; they can then 2 See Frondel and Schmidt (2008), Gnansounou (2008).

4
determine the cost-effective policy mix to reach their desired level of security. A methodology based on calculating the ‘supply curve’ for gas security is proposed by Lapuerta (2007) and applied to Bulgaria by Silve and Noël (2010), although in regions with few options available, political factors may naturally lead to the selection of a particular option. This paper contributes to analysis addressing the first of the three questions, presenting a qualitative assessment of the gas supply security situation in the three Baltic States, evaluating to what extent they could meet final energy consumption in the face of a gas supply disruption3. We first assess the risks associated with the gas supply set-up, identifying the nature of the gas supply disruptions that they could experience (though we do not assess their probability). We then review the policies and measures in place to mitigate those risks, assessing their scope and likely effectiveness. Sections 3 to 5 of the paper look at each of the Baltic States in turn; section 6 discusses the implications of our findings for the European gas security policy; the final section concludes and discusses future work. 3. Latvia Given its gas supply infrastructure set-up, Latvia is at risk of supply disruption due to either pipeline failure during the summer months or to failure of its storage facility on which it is totally reliant during the winter months. The level of security it currently enjoys is limited with regard to securing heat and electricity generation and there seem to be no measures in place to insure other sectors of the economy against gas supply disruptions.
3.1 Gas supply set up and associated risk Latvia consumes around 1.7BCM of natural gas each year, making up approximately 30% of its annual primary energy consumption4. Latvijas Gaze is the sole supplier of natural gas in Latvia5 and they in turn receive their gas from only one source, Gazprom. The supply of natural gas from Gazprom to Latvijas Gaze has a fairly unique set up (see Figure 3 below). Gas only flows into the country for six months of the year, between April and September; during this time the gas meets not only the immediate natural gas demand of Latvia but also re-fills the Latvian underground gas storage facility, Inčukalns. During the winter months of October to March, all of Latvia’s natural gas demand is met by the storage facility and no gas at all is brought in from outside the country. The storage facility is also used to meet all of Estonia’s winter demand and to provide additional gas to north-west Russia (Latvijas Gaze, 2008, p.10), especially St Petersburg, which struggles to receive sufficient supplies from within Russia during the winter (Mäe and Kasekamp, 2007).
3 We do not advocate any specific level of security; however, numerous interviews in central and eastern European countries over the past 12 months and analysis of existing policies indicate that the politically desirable level of security is ‘full’ security, as opposed to lower, economically efficient level of security. 4 See Latvian National Statistics. http://www.csb.gov.lv/csp/content/?lng=en&cat=355 5 Latvijas Gaze was granted a legal monopoly in all gas supply, transmission, distribution and storage within Latvia between the 1997 and 2017.

5
Figure 3. Baltic gas supply infrastructure

6
Source: Gas Transmission Europe; Estonian Foreign Policy Yearbook, 2007 Underground storage facilities usually provide some security of supply, especially if they are normally used below their maximum withdrawal rates in winter time. This is not the case for Latvia (and Estonia); because of the peculiar gas supply set up the Inčukalns storage is of limited security value and even creates risks of its own. By definition Inčukalns can not mitigate the risk of a winter supply disruption as all supply to Latvia (and Estonia) comes from the storage facility during the winter. Short-lived supply disruptions during the summer could be mitigated by drawing on Inčukalns (provided there is gas to be withdrawn); it could not be done for more than a few days though without delaying the shortage until the colder, winter months. This is because it
Incukalns Storage Facility Active capacity: 2.3BCM Maximum withdrawal rate: 24MCM/day
Key: Summer Winter All year Pipeline not in operation

7
is necessary that the facility fills at its maximum rate throughout the entire summer period in order to be able to meet winter demand6. In addition, this reliance on a single storage facility during the winter months makes Latvia vulnerable to possible technical failures or faults of the facility itself. Whilst the probability of a catastrophic failure of the storage facility is very low (Health and Safety Laboratory, 2008), and indeed is even lower for an aquifer based facility than a salt cavern (Hopper, 2004), the consequences would be severe. The Rough facility in the UK experienced a catastrophic failure in February 2006 and repairs to bring the facility back into operation took around four and a half months (Centrica Storage, 2006). A failure of this magnitude would have severe consequences for Latvia (and indeed for others); it would be unlikely that they could be adequately supplied directly from Russia, both due to already limited supplies in the north-western region of Russia and also due to insufficient pipeline capacity to bring in additional required quantities either through Estonia or Lithuania (Mae et al, 2007, p105)7. To summarise, gas supply to Latvia faces a risk of pipeline failure during the summer and storage failure during the winter. The former implies possible disruptions of between a few hours and a few days, up to two weeks if a compressor station is involved. The storage failure risk implies disruptions of up to several months. In both cases supply disruptions to Latvian gas supply are very likely to be total or near-total as there is very limited capacity to bring alternative gas in. 3.2 Could Latvia cope with a gas supply disruption? To understand what a gas supply disruption would mean for Latvia, it is important to appreciate that natural gas is critical to heat and electricity generation. This sector accounts for 60% of total gas consumption (see Figure 4) with gas holding more than a 90% share in heat generation8, making it particularly sensitive to gas supply disruption, especially in cold winter months. The Latvian market is dominated by centrally-generated heating systems with approximately 70% of households connected to a district heating network (Vigants, 2008).
Figure 4. Structure of gas consumption by sector, Latvia (2007)
6 The highest injection rate seen for the facility was in 2006, where it averaged 11MCM/day. The average withdrawal from the storage facility over the past five years is 1710MCM/annum with a peak year of 2122MCM. At a rate of injection of 11MCM/day, 155 days would be needed to fill the facility to meet average demand. To meet the peak year demand, 193 days would be needed. Information on the injection rate was collected from the authors’ conversations with the Public Utilities Commission (the Latvian energy regulatory agency) and information on withdrawals from the Inčukalns facility was obtained from Latvijas Gaze, Facts and Figures, p10, 2008. 7 The technical capacity of the pipeline between Latvia and Lithuania is only 5MCM/day, although in practice only 1MCM/day is accessible during the winter due to limited withdrawal capacity of the Latvian storage facility (company information). 8 Source: Latvian National Statistics.

8
Losses0.6%
Households7.0%
Industry18.0%
Public heat plants13.9%
Public CHP47.0%
Other8.2% Energy sector own use
1.1%
Autoproducer CHP1.3%
Autoproducerheat plants
3%
Other
Energy sector own use
Losses
Public CHP
Public heat plants
Autoproducer CHP
Autoproducer heat plants
Transport
Industry
Households
Source: National Statistics Website
Electricity generation is less reliant on gas than heat. The two largest gas fired plants, Riga CHP 1 and 2, are capable of delivering up to 20% of the country’s electricity needs9 Latvia does not have sufficient capacity to meet demand; imports can account for as much as 70% of annual consumption10. As much as 80% of domestically generated electricity comes from hydro power. In theory, electricity produced from gas fired generation could be replaced by increasing imports and hydropower generation, but this is heavily dependant on whether or not exporting countries are generating sufficient quantities of electricity at the time and also on the season - the availability of hydropower is much lower during the colder months. However, gas-fired electricity and heat generating plants can be backed-up with alternative fuels such as heavy or light fuel oils, allowing continued generation in the event of a gas supply disruption. Indeed, Latvia’s energy law talks of the use of alternative fuels in the event of an energy crisis, stating (Republic of Latvia, 2005, section 63):
During the energy crisis an energy supply merchant may begin to utilise the fuel security reserve the amount and type of which has been determined in the licence in order to ensure, as far as possible, a continuous supply to the user of energy with necessary types of energy.
Unless specified in individual licences11, the Law does not seem to require that generating companies be able to run on alternative fuels, nor that they should maintain minimum storage levels, only that they “may”. Overall, fuel switching measures of such an undefined nature and uncertainties about the possibility of increasing electricity 9 Those two plants are ‘combined heat and power’ plants (CHP) that can generate heat, electricity or both. www.latvenergo.lv/portal/page?_pageid=80,291047&_dad=portal&schema=PORTAL 10 Imports are from Lithuania, Estonia and Russia. Source: Latvian National Statistics. 11 Executives from a generation company in Latvia claimed that their license did not include any back-up fuel requirement (interview conducted in November 2009).

9
imports provide a very uncertain and unclear view of the extent of Latvia’s gas supply security. In addition, there do not seem to be any policies in place to meet the energy demand of commercial, industrial and household consumers in case of gas supply disruption. Some industrial consumers may be willing to have an interruptible gas contract which could be used to alleviate short-lived or partial disruptions. Whilst it is unknown how many, or indeed if any, industrial consumers have interruptible contracts, if all industry did then this would make approximately 20% of Latvia’s natural gas consumption available for reallocation to other sectors (Latvijas Gaze, 2008). This could potentially cover the needs of household and commercial consumers. Interrupting gas supply to industrial consumers without interruptible contracts usually has a very high economic cost12; sustained over a long period of time it could have serious economic and therefore social consequences. To summarise, the ability of Latvia to meet final contracted energy demand in the face of a gas supply disruption is difficult to assess precisely but is certainly very limited. Fuel switching requirements are not precise enough and too limited in reach. The ability to rely on increased electricity imports is uncertain and the ability to protect consumers such as households, industry and the commercial sector seems to be non-existent. 4. Estonia The two risks faced by Estonia are a pipeline failure at any time of year and a failure of the Latvian storage facility during winter months. However, the risk of total gas supply disruptions is less acute than for Latvia as Gazprom could supply some gas through an alternative pipeline, at least in the summer. Estonia’s gas security policy is limited to backing up heat generation for the capital city’s district heating network. Other cities and other sectors of the economy seem to be left uninsured.
4.1 Gas supply set up and associated risks Like Latvia, Estonia has no indigenous production, receives all of its gas from Gazprom, has a single gas supplier (Eesti Gaas) and receives gas directly from Russia during the months of April to September and from the Latvian storage facility during the remainder of the year (see Figure 3). The relationship between Eesti Gaas and the Latvian storage facility has changed over time. The contract with the facility to hold Estonia’s gas has moved from belonging to Eesti Gaas to Gazprom earlier in the decade and back to Eesti Gaas again in 2009. The original shift may have been motivated by a desire to make it Gazprom’s responsibility to ensure that gas crossed the Estonian border throughout the year13. The return of ownership of the storage contract to Eesti Gaas this year is said to be due to the costs of the loan required to purchase winter volumes during summer months which Gazprom do not wish to bear on Eesti Gaas’ behalf14. The risks to Estonia’s gas supply are therefore much the same as Latvia: it is vulnerable to summer pipeline disruptions (including those affecting the re-filling of the Inčukalns 12 The cost of interrupting industry to Bulgaria during the January 2009 crisis was 250 million Euros according to the Bulgarian Ministry of Economy (See Silve, 2009, page 11). 13 Interviews with Baltic gas company executives. It was also suggested that a possible reason for the original change in contractual set up between Eesti Gaas and the Latvian storage facility was due to concerns over Eesti Gaas’s ability to gain access to the Latvian transmission network which does not offer any third party access. 14 Interviews with senior energy policy makers in the Baltic States, October 2009.

10
storage) and also to failures of the storage facility itself during the winter months. However, the existence of an alternative pipeline to supply Estonia from Russia, no longer used in normal circumstances, makes the country less exposed to total supply disruptions than Latvia. The northern pipeline should allow Gazprom to supply Estonia normally in case of a summertime failure of the pipeline into Latvia. It may provide some security in the face of a failure of the Latvian underground storage during winter, though the tight gas balance in North-West Russia makes that uncertain. During the winter of 2005-6, Estonia experienced a period of exceptionally high demand that exceeded the capacity of the pipeline from Latvia and Gazprom did open the Northern pipe to provide additional volumes15. 4.2 Could Estonia cope with a gas supply disruption? Electricity generation would withstand a gas supply disruption well. Only 5% of Estonian electricity is dependent on natural gas whilst the remaining 95% is generated by burning oil shale, a prolific natural resource in Estonia. Moreover, there is ample spare capacity in the oil shale plants and they could easily substitute for gas-fired electricity16. Furthermore, Estonia has a 350MW connection with Finland which gives the country access to the Nord Pool market if needed. As with Latvia, one of the major consumers of natural gas is heat generation which accounts for approximately 57% of Estonia’s natural gas (see Figure 5). The district heating network in Estonia is also well developed, covering 52% of the market17. In 2008, 53% of all heat generated in Estonia was gas-fired. By law, all gas-fired heat generators producing 500 GWh or more per heating network per annum must maintain a stock of alternative fuel sufficient to cover three days of production (Republic of Estonia, 2003)18. Only two companies and a total of four plants seem to fall in this category, all serving the district heating networks of Tallinn, the capital city19. However, Estonia has a large number of small heat producers20 who do not have to comply with the alternative fuel stock obligation. As a consequence, a serious gas supply disruption could leave tens of thousands of people in Estonia without heating services21. Finally, the three day stock obligation means that to cope with longer-lived supply disruptions, the plants covered by the law would have to refill their oil product tanks; though there is no reason to believe that oil supply to Estonia would be disrupted if gas supply were, in a cold country the oil product logistics can present significant challenges22. 15 Interviews with gas company executives in the Baltic States, April 2009. 16 The current peak electrical consumption in Estonia is approximately 1500MW while the oil shale fired capacity available is around 2380MW. See websites of Estonian Electricity TSO (http://www.pohivork.ee) and Eesti Energia subsidiary company (http://www. elering.ee/index.php?id=1962&L=1). 17 It should be noted that this figure gives the value of market share of district heating in Estonia. No data exists showing how many households are connected to the district heating network. See Vigants (2008). 18 Republic of Estonia, District Heating Act, page 3, Section 7.3, 11 February 2003. 19 Source: interviews with heat companies’ executives and government officials in Estonia, October and November 2009. 20 According to the Estonian National Statistics there were over 1400 natural gas fired boilers generating heat in 2008. See: http://www.stat.ee/energy 21 Some of them may have alternative ways of heating their homes. 22 In Finland, a neighbouring country where gas-fired power plants have an obligation to store back-up liquid fuels, the logistics to supply them with oil products is tested once every two years under the

11
Figure 5. Structure of gas consumption by sector, Estonia (2007)
Non-energy consumption20.7%
Heat Generation57.1%Households
6.0%
Industry6.7%
Electricity Generation4.6%
Energy sector own use1.3%
Commercial & public services
3.5%Electricity Generation
Heat Generation
Households
Non-energy consumption
Industry
Energy sector own use
Commercial & public services
Source: National Statistics Website
There seem to be no specific gas security measures in place to ensure continued energy supply to the other sectors of the economy in case of gas supply disruption. In principle, interruptible contracts could be offered to industrial gas customers to allow some re-allocation to non-interruptible consumers (such as households). A single fertiliser company, AS Nitrofert23, accounts for approximately 20% of total natural gas demand (see Figure 5)24. Theoretically, their consumption could be interrupted and reallocated to other sectors. However, AS Nitrofert holds no contract with Eesti Gaas but instead is supplied directly by Gazprom, which could simply stop shipping the gas if the company was interrupted by the transmission system operator. Whilst this would free up capacity within the system – which is of limited energy security value25 – it would not free up actual gas molecules. In summary, Estonia’s electricity supply would not be impacted by a gas supply disruption; heat generation in Tallinn should be safe too, especially if the disruption is short-lived. However, a total gas supply disruption would leave a significant share of the contracted final energy demand un-served. Heat generation in smaller cities would be put at risk, as well as gas supply to the residential, commercial and industrial sectors. The likelihood of a total disruption is less than for Latvia thanks to the availability of an alternative pipeline, though it is not nil because of Gazprom’s uncertain ability to supply Estonia in the winter from North-West Russia. supervision of a governmental agency. Source: interviews with Finnish heat, electricity and oil companies executives, May 2009. 23 AS Nitrofert closed during the beginning of 2009, however the plant has closed a number of times in the past and it is likely that it will re-open again. 24 Represented as “non-energy consumption” on the chart. 25 Kaselkamp and Mäe (2007) note that peak demands of between 6.5MCM/day and 8MCM/ day are usually experienced depending on temperature. Both values are well under the 11MCM/day capacity of the transmission system.

12
5. Lithuania The major risk faced by Lithuania is a potential failure of the pipeline bringing gas from Russia through Belarus. Lithuania has policies in place to secure its gas-fired heat and electricity generation. The country also has a storage obligation covering residential gas consumption. However, a total gas supply disruption would put the supply of final energy to commercial and industrial gas consumers at risk.
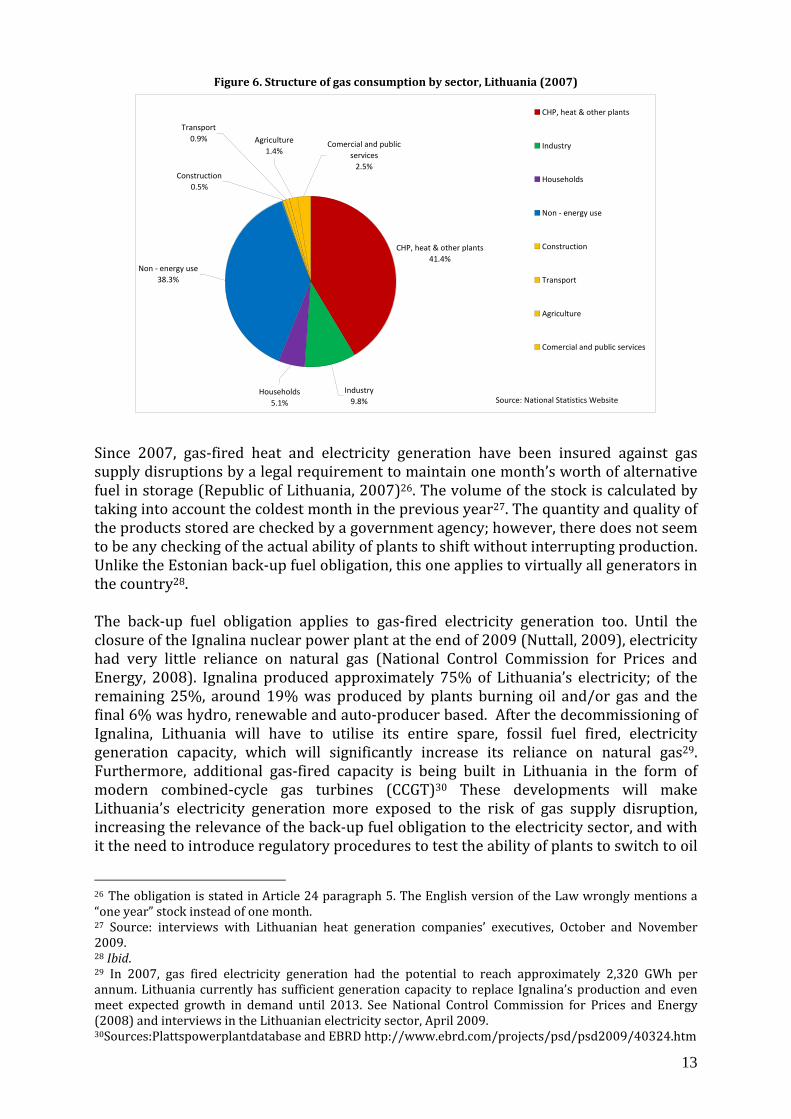
5.1 Gas supply set up and associated risks Lithuania has a more traditional gas supply set up than the other two Baltic countries; it receives all 3.7BCM of its gas from Gazprom throughout the course of the year via a pipeline through Belarus. Russian gas also transits through Lithuania en route towards Kaliningrad, a small Russian enclave on the Baltic Sea. Gazprom therefore has a stronger incentive to properly maintain the pipes, thus reducing the risk of pipeline failure. Lithuania’s reliance on transit through Belarus is another source of risk. Like Ukraine, Belarus has had disputes with Russia over the price of gas and unpaid import bills during the past few years, one of which led to a short-lived supply disruption to the Baltic republic in February 2004 (Paulikas, 2004). Following this episode, Russia and Belarus had an unstable gas relationship for several years. Disagreements over import prices and control of the transit infrastructure were settled by an agreement in January 2007 (Yafimava and Stern, 2007). The agreement transferred a controlling stake in the Belarusian transmission system to Gazprom, which certainly reduced the transit risk for Lithuania. Failure of the supplying line from Russia is the main potential threat to Lithuania’s security of supply. There exists an alternative, southern pipeline from Belarus, no longer used or maintained; to what extent it could compensate for a failure of the main line is uncertain. 5.2 Could Lithuania cope with a gas supply disruption? Thanks to its public policies Lithuania enjoys the highest level of gas supply security of the three Baltic States; though a total gas supply disruption would almost certainly leave some final contracted energy demand un-served. The structure of Lithuania’s gas consumption is heavily impacted by the presence of one of the largest fertiliser production complexes in Europe, accounting for 38% of total demand (see “non-energy use” in Figure 6 below). If one removes this then Lithuania’s structure of gas consumption looks a lot like Latvia’s, with heat generation as the largest contributor to gas demand. Heat generation is around 80% reliant on natural gas and consumes 1.45BCM per year.
13
Figure 6. Structure of gas consumption by sector, Lithuania (2007)
CHP, heat & other plants41.4%
Comercial and public services
2.5%Construction
0.5%
Non - energy use38.3%
Transport0.9% Agriculture
1.4%
Households5.1%
Industry9.8%
CHP, heat & other plants
Industry
Households
Non - energy use
Construction
Transport
Agriculture
Comercial and public services
Source: National Statistics Website
Since 2007, gas-fired heat and electricity generation have been insured against gas supply disruptions by a legal requirement to maintain one month’s worth of alternative fuel in storage (Republic of Lithuania, 2007)26. The volume of the stock is calculated by taking into account the coldest month in the previous year27. The quantity and quality of the products stored are checked by a government agency; however, there does not seem to be any checking of the actual ability of plants to shift without interrupting production. Unlike the Estonian back-up fuel obligation, this one applies to virtually all generators in the country28. The back-up fuel obligation applies to gas-fired electricity generation too. Until the closure of the Ignalina nuclear power plant at the end of 2009 (Nuttall, 2009), electricity had very little reliance on natural gas (National Control Commission for Prices and Energy, 2008). Ignalina produced approximately 75% of Lithuania’s electricity; of the remaining 25%, around 19% was produced by plants burning oil and/or gas and the final 6% was hydro, renewable and auto-producer based. After the decommissioning of Ignalina, Lithuania will have to utilise its entire spare, fossil fuel fired, electricity generation capacity, which will significantly increase its reliance on natural gas29. Furthermore, additional gas-fired capacity is being built in Lithuania in the form of modern combined-cycle gas turbines (CCGT)30 These developments will make Lithuania’s electricity generation more exposed to the risk of gas supply disruption, increasing the relevance of the back-up fuel obligation to the electricity sector, and with it the need to introduce regulatory procedures to test the ability of plants to switch to oil 26 The obligation is stated in Article 24 paragraph 5. The English version of the Law wrongly mentions a “one year” stock instead of one month. 27 Source: interviews with Lithuanian heat generation companies’ executives, October and November 2009. 28 Ibid. 29 In 2007, gas fired electricity generation had the potential to reach approximately 2,320 GWh per annum. Lithuania currently has sufficient generation capacity to replace Ignalina’s production and even meet expected growth in demand until 2013. See National Control Commission for Prices and Energy (2008) and interviews in the Lithuanian electricity sector, April 2009. 30Sources:Plattspowerplantdatabase and EBRD http://www.ebrd.com/projects/psd/psd2009/40324.htm

14
while online. An alternative to incurring reliance on gas-fired generation would be to import electricity from Russia and Belarus. Longer term, the future link with Sweden should provide another potential source of imported electricity (CESI, 2009)31. Residential gas consumption is also insured against supply disruptions thanks to a legal obligation for gas suppliers to keep volumes in the Latvian underground storage facility, Inčukalns. Suppliers must store at least 10 days worth of household consumption beginning 1st September 2008, rising by 10 days each year until a 60 day level is reached (Republic of Lithuania, 2008). The pipeline connection between Lithuania and Latvia has a technical capacity of approximately 5MCM/day but, due to limitations on the Latvian transmission network structure and the amount of storage withdrawal capacity available to Lithuania in winter, can only ship 1MCM/day32 This volume is sufficient only to supply the daily household natural gas consumption which at 5.1% of consumption would be approximately 1.2MCM/day on a peak day. In summary, Lithuania seems to enjoy the highest level of gas supply security of the three Baltic States. Given the back-up fuel and gas storage obligations, the country could probably meet total contracted energy demand in the face of a disruption of at least 40%33 of its gas supply lasting for several weeks. In case of larger gas supply disruptions though, commercial and industrial gas customers would almost certainly suffer a loss of contracted energy supply. Interrupting the fertiliser plant (which consumes nearly 40% of total gas demand) could be seen as an obvious means of managing a gas supply crisis. However, the economic and social cost could be important; moreover, given the company’s direct import contract with Gazprom, the molecules may not be available for physical re-allocation (Gazprom might stop supplying as soon as the plant is interrupted), suppressing any supply security benefit.
31 Swedlink, a project led by Svenska Kraftnat of Sweden, will most likely be completed by the end of 2016 32 Source: e-mail exchange with Lithuanian Gas TSO, corroborated by GIE capacity map. See: http://www.gie.eu.com/maps_data/downloads/GTE_CAPACITY.pdf 33 Gas fired heat and electricity generation account for just over 40% of gas demand in Lithuania whilst household consumption accounts for approximately 5% of demand; both are secured by back up fuel or storage obligations.

15
The table below summarises the disruption risks faced by each country, the extent to which electricity generation and district heating could be affected by a gas supply disruption, whether or not any alternative gas could be supplied to the national gas systems and whether or not any policies exist to secure energy supplies to electricity generation, district heat generation and households. Table 1 Gas security in the Baltic States: summary of findings
Elec. GenDistrict heating
Electricity generation
District heating
Households and other consumers
Latvia - Pipeline failure - total disruption (summer). Ability to draw on storage, but an extended disruption would affect the re-filling of the storage for winter
- Inculkalns facility failure - total disruption
- The two largest gas-fired generators can produce up to 20% of Latvia's electricity needs.- capacity to import large quantities of electrcity but with uncertain availability.- ability to generate upto 80% of domestically produced energy from hydro-power (dependant on availability).
- gas holds a 90% share in district heating which in turn serves 70% of households within Latvia.
- No direct alternative lines are available.
- During the summer it may be possible to bring volumes via Estonia from the NE pipeline through Narva; however, these volumes would be limited as they would have to share capacity within the Estonian transmission system.
None
Estonia - Pipeline failure - total disruption (summer). Ability to draw on storage, but an extended disruption would affect the re-filling of the storage for winter
- Inculkalns facility failure - total disruption (winter)
- 5% reliant on natural gas with 95% coming from oil shale-fired plants. Ample spare capactiy exists in the oil shale-fired generation.- A 350MW link to Finland allows access to Nord Pool.
- gas holds a 53% share in district heating which in turn holds a 52% market share.
- During the summer months gas can be brought through the NE pipeline which has a capacity of approx 6MCM/day.
- During winter months, the tight gas supply situation in NW Russia makes it unlikely sufficient volumes could be sourced to fill the 6MCM pipeline. Even if it were possible, this would not meet the peak demands of up to 8MCM/day.
None
Lithuania - Pipeline failure - total disruption
- Until the end of 2009, Ignalina produced approximately 75% of Lithuanian electricity. Its closure has resulted in both an increase in electricity imports and also in an increase in gas fired generation. Existing fossil fuel fired generation capacity is sufficient to meet growing demand until 2013.
- gas holds an 80% share in district heating which serves 68% of households within Lithuania.
- Currently unused pipeline to the south, condition and potential ability to bring alternative gas unknown.
- 1 MCM/day can be accessed from the Latvian storage facility. Although the technical capacity of the pipeline connecting Lithuania and Latvia is 5MCM/day, limited capacity availability prevent the movement of additional volumes to Lithuania.
- Households: all suppliers required to store 10 days worth of household consumption in Incukalns storage facility, rising by 10 days each year until a 60 day level is reached, beginning in 2008.
CountrySecurity policies in place?
- Alternative fuel stocks: all generators are required by law to maintain a one month stock of alternative fuel. Quantity and quality of fuel stocks are checked by the government.
- Alternative fuel stocks: all generators, producing over 500GWh of heat or eletcrical power per year are required to maintain a 3 day stock of alternative fuels. Only district heating companies suppling Tallinn fall under this obligation, leaving many small scale generators elsewhere without insurance.
- Alternative fuel stocks: these "may" be required; however, these are agreed upon in individual licensing agreements and therefore the security of gas-fired heat and electricity generation within Latvia is uncertain.
Risks and level of disruption
Access to alternative gas?Reliance on natural gas

16
6. European policy implications Though they enjoy various degrees of gas supply security, none of the three Baltic States would be able to meet total final contracted energy demand in the event of a large and/or sustained gas supply disruption. Depending on the level of risk that these countries are willing to tolerate, they need to increase their security of gas supply. They may be forced to do so by a new European regulation on the security of gas supply, currently under negotiation between the European Commission and member states (European Commission, 2009). This European Regulation appears to be flawed and would leave Baltic gas insecurity unaddressed. Meanwhile, the country that appears to be the most secure of the three (Lithuania) is the only one that the Regulation would force to invest in new supply infrastructure. Following the publication of its “Second Strategic Energy Review” in November 2008 (European Commission, 2008) and the gas supply crisis of January 2009, the European Commission has prepared the new Regulation, destined to replace the existing Directive on gas supply security (European Commission, 2004). The Regulation would force member states to meet two supply security “standards”. The first one, called “infrastructure standard”, is a ratio of supply infrastructure capacity, excluding the largest entry point into the system, over peak demand (the so-called N-1 rule) (European Commission, 2009, Article 6.1). Member states for which the ratio is below one would have three years to carry out the needed investment in new supply infrastructure34. The infrastructure standard also requires member states to ensure that, within three years of entry into force, gas can move both ways at all interconnection points (European Commission, 2009, Article 6.5). The other standard, that the Commission calls the “supply standard”, would have “protected customers” (a group that has to include at least residential customers) guaranteed supply in the face of extreme weather events (European Commission, 2009, Article 7.1). The supply standard is already met by the three Baltic States, where residential consumption is a small share of total gas demand (see Figures 4-6). Protecting household heating against gas supply disruptions would at least require including gas-fired district heating systems in the standard – heat delivered to residential customers could be considered indirect household gas consumption – which governments may chose to do but do not have to do under the Regulation35. The reverse-flow obligation would not have any direct impact on the Baltic States as the pipelines between Latvia and Estonia, and Latvia and Lithuania are already bi-directional36. Finally the N-1 rule, as defined in the Regulation, seems to be disconnected from the actual level of gas security enjoyed by each country. The European Commission’s own calculations, as published in the “impact assessment” of the Regulation (European Commission, 2009b) give the following results (see Figure 7): 34 The compliance time has been lengthened to four years in a later version of the draft Regulation, transmitted by the General Secretariat of the Council to the national Delegations on 27th November 2009 and not publicly available. 35 See European Commission (2009), Article 2, Paragraph 1 and Article 7, Paragraph 1. 36 Source: Gas Transmission Europe; authors’ interviews with gas companies in the Baltic States.

17
Figure 7. N-1 compliance levels of gas consuming EU member states
0%
50%
100%
150%
200%
250%
DE GR BE NL LV CZ AT EE PL ES IT SK UK LU PT FR RO HU SI DK LT BG IE SE FI
N-1
Source: Data from European Commission (2009b), table 4, p. 32-33. Estonia and Latvia are above the 100% threshold while Lithuania is significantly below and would accordingly have to invest in new supply infrastructure in the coming years to comply with the Regulation. Yet, as we have seen, there is very little gas available, if any, in North-Western Russia during cold winter periods that could be exported to the Baltic States if the Latvian storage facility failed. The relatively high “N-1” ratio, as calculated by the Commission, simply reflects the fact that the pipelines from Russia are not used during the winter; it wrongly suggests that Estonia and Latvia could access alternative gas if the Inčukalns failed in the middle of a cold winter, which is highly uncertain at best. The proposed European Regulation on the security of gas supply is a rather ‘blind’ policy instrument. Its implementation would not force Estonia and Latvia to improve their level of gas supply security, or even to assess it. At the same time it would force Lithuania to invest in new gas supply infrastructure (or to reduce its gas consumption through regulatory measures) while, as we have shown, the country enjoys a high level of security compared to its Baltic neighbours. Gas security policies (whether decided by member states or mandated by the EU) have to be based on a precise assessment of the gas security situation, including existing policies and measures, and can not be replaced by simple ratios of spare capacity or supply diversity. Because it substitutes basic ratios for detailed national and sub-regional analysis, and does not allow member states to opt for a level of insurance that they find appropriate, the current project of Regulation is at the same time too little – it leaves serious gas supply insecurity unaddressed in some countries – and too much – it forces others to buy more security than would be sensible. A more sensible European approach would require member states to perform rigorous assessments of their gas security situation – the risks they face and the policies in place to mitigate them – on the basis of which they would negotiate with the Commission on an appropriate level of security and an action plan to reach it.

18
7. Conclusion and future work The empirical analysis that we have presented shows that the level of gas supply security which a country enjoys is dependent on the specific characteristics of its gas supply set up (which determine the risk of disruptions), the structure of gas consumption (that determines what is at risk) and, importantly, on the type and extent of any policies in place designed to mitigate the effects of a supply disruption (whether or not some insurance has been bought37). Overall, the Baltic States enjoy a relatively low level of supply security (defined as the ability to meet final energy demand in the face of a gas supply disruption). Lithuania though has bought more insurance than the other two countries. Future research could aim at calculating the economically optimal level of gas supply security. This would imply addressing in details the probability of disruptions, their macro-economic impact and the cost of insuring against them (i.e. increasing security of supply) through various policy options. A number of indices and indicators that attempt to quantify gas (or energy) supply security have been published38. Such indices, which identify factors of risks (such as the number of suppliers or the storage capacity), weigh and aggregate them, are usually problematic. A few hypothetical examples help understand why. Of two given countries, the one with the most diversified supply infrastructure need not be the most secure as its ability to effectively source alternative gas may be limited. Similarly, of two countries enjoying the same degree of diversity, one may have requested its suppliers to sign option contracts that would guarantee the supply of natural gas if the main supplier defaulted, while the other has not. To take another example, an additional LNG terminal may bring more security than an additional pipeline of equivalent capacity if it gives access to a more liquid short-term market; yet there is no rigorous way to weigh import pipelines and LNG terminals in general in terms of their contribution to security. Finally, it is easy for security indexes to miss important legal and regulatory dimensions and, consequently, mischaracterise the absolute or relative situation of a country. Dispositions such as regular tests of the generators’ ability to switch to alternative fuels are difficult to include in a quantitative indicator, yet can make a significant difference between two countries that both mandate dual-fuel capability for power plants. These examples show that quantifying gas supply security (hence ranking countries) may not be impossible but requires a high level of attention to details. A meaningful indicator would have to reflect precisely, for each country, to what extent would gas supply be effectively replaced or demand effectively suppressed in the face of a disruption. Such an indicator could only be built after the type of analysis presented in this paper has been carried out.
37 Some of the insurance may be embedded in the supply set up in the form of strategic storage or other security infrastructure. 38 See for example: Frondel et al. (2008), Ramboll Oil and Gas (2009) page 68-69, European Commission (2009), Annex 1.

19
References Centrica Storage Limited (2006). Options for Energy Buyers, Presentation, 28 July. See:http://www.ofgem.gov.uk/MARKETS/WHLMKTS/CUSTANDINDUSTRY/ENERGYBUYERS/Documents1/16097Centrica%20Storage%20Presentation.pdf CESI (2009), “Working Group Electricity Interconnections - Phase I: present status of the electricity sector in the EU Member States surrounding the Baltic Sea; main gaps and bottlenecks, qualitative assessment of new interconnection projects.”, June. http://ec.europa.eu/energy/infrastructure/doc/2009_bemip_a9017214-cesi-interconn-ec-phase_i-final-june_2009.pdf Christie, Edward, Energy vulnerability and EU-Russia Energy Relations, Journal of Contemporary European Research, Vol. 5 Is. 2, 2009, pp 274-292 Damigos, D, C Tourkolias, and D Diakoulaki (2009). “Households’ willingness to pay for safeguarding security of natural gas supply in electricity generation”. Energy Policy 37, p. 2008-2017. European Commission (2004), Council Directive 2004/67/EC of 26 April 2004, concerning measures to safeguard security of natural gas supply. Luxembourg. http://eurlex.europa.eu/LexUriServ/LexUriServ.do?uri=OJ:L:2004:127:0092:0096:EN:PDF European Commission (2008). Communication from the Commission to the European Parliament, the Council, the European Economic and Social
20
Committee and the Committee of the Regions. Second Strategic Energy Review, an EU Energy Security and Solidarity Action Plan, unofficial version. Brussels. http://eur-lex.europa.eu/LexUriServ/LexUriServ.do?uri=COM:2008:0781:FIN:EN:PDF European Commission (2009). Proposal for a Regulation of the European Parliament and of the Council concerning measures to safeguard security of gas supply and repealing Directive 2004/67/EC, COM(2009) 363/4, Brussels, 16 July. http://eurlex.europa.eu/LexUriServ/LexUriServ.do?uri=COM:2009:0363:FIN:EN:PDF European Commission (2009b). Commission Staff Working Document, Accompanying document to the Proposal for a Regulation of the European Parliament and of the Council, concerning measures to safeguard security of gas supply, and repealing Directive 2004/67/EC, Impact Assessment. SEC(2009) 979 final. Brussels, 16 July. Findlater, Sachi and Pierre Noël (2010). “The cost of improving energy security: the case of natural gas security in the Baltic States”, EPRG, University of Cambridge, mimeo. Frondel, M and Christoph M. Schmidt (2008). “Measuring Energy Security”, Ruhr Universitat Bochum, Germany. Gnansounou, Edgard, Assessing the energy vulnerability: Case of industrialised countries, Energy Policy, Vol 36, 2008 Health and Safety Laboratory (2008), Failure rates for underground gas storage, Derbyshire, http://www.hse.gov.uk/RESEARCH/rrhtm/rr671.htm.

21
Hirschhausen, Ch von, Anne Neumann, Sophia Ruester and Danny Auerswald (2008), Advice on the Opportunity to Set up an Action Plan for the Promotion
of LNG Chain Investments. Economic, Market and Financial Point of View. Report to the European Commission (DG TREN), May. Hopper, J.M (2004). Gas storage and single-point failure risk, Energy Markets. http://www.falcongasstorage.com/_filelib/FileCabinet/Articles/article_singlepointfailurerisk.pdf?FileName=article_singlepointfailurerisk.pdf Hough, David (2005). “Overcoming the UK Paranoia About ‘Security of Supply’”. Presentation at the Westminster Energy Forum, London, 2 November. (www.nera.com). Ilves, Toomas (2009), Speech of President Ilves [of Estonia] at the Natolin campus of the College of Europe in Warsaw, 7 December. (http://www.president.ee/en/duties/speeches.php) Lapuerta (2007). “Gas storage regulation and security of supply”, Presentation to the EPRG Spring Research Seminar, University of Cambridge, May. Latvijas Gaze (2008). Facts and Figure (Latvia: Riga). Mäe, A. and A. Kasekamp (2007). “Estonia’s Energy Security and the European Union”, in Estonian Foreign Policy Yearbook 2007, Tallinn: The Estonian Foreign Policy Institute. National Control Commission for Prices and Energy [of Lithuania] (2008). “Annual report on electricity and natural gas markets in Lithuania, prepared for the European Commission”, Vilnius. See: http://www.google.co.uk/url?sa=t&source=web&ct=res&cd=1&ved=0CAcQFjAA&url=http%3A%2F%2Fwww.erranet.org%2Findex.php%3Fname%3DOE-

22
eLibrary%26file%3Ddownload%26id%3D5990%26keret%3DN%26showheader%3DN&ei=HwhPS4HdKaK60gTMzbSsCg&usg=AFQjCNHVvO9BpPtNHD9RAtoSbTNVR82T3A&sig2=fv9iHKjv0qo08Uym2_ZZVQ Noël, Pierre (2009). “A market between us. Reducing the political cost of Europe’s dependence on Russian gas”. Electricity Policy Research Group (EPRG), University of Cambridge, EPRG Working Paper 0916, May. Nuttall (2009), “Nuclear Energy in the Enlarged European Union”, University of Cambridge (UK), EPRG Working Paper 0904, January. Paulikas, Steven (2004). “Gas disruption underscores vulnerability”, The Baltic
Times, 26 February. http://www.baltictimes.com/news/articles/9535/. Percebois, Jaques, Energy vulnerability and its management, International Journal of Energy Sector Management, Vol. 1 No. 1, 2007, pp. 51-62 Ramboll Oil and Gas (2009), “Future Development of the Energy Gas Market in the Baltic Sea Region”, Ramboll Oil and Gas, Denmark. Republic of Latvia (2005), Latvian Energy Law, 26th May Republic of Lithuania (2007). “Law amending the Law on Natural Gas”, Vilnius, March. Republic of Lithuania (2008). Lithuanian Government Resolution No.163, 26 February. Roller, Lars Hendric, Juan Delgado and Hans W. Friederiszick, Energy: Choices for Europe, European School of Management and Technology, Berlin, 2007 Silve, Florent (2009). Gas Security in Eastern Europe: The Case of Bulgaria. Dissertation for the MPhil in Technology Policy, Judge Business School, University of Cambridge, June.

23
Silve, Florent and Pierre Noël (2010). “Supply curves for gas supply security in Bulgaria”, EPRG, University of Cambridge, mimeo. Smith, Keith (2004). Russian Energy Politics in the Baltics, Poland, and Ukraine. A
New Stealth Imperialism? Washington (DC), Center for Strategic and International Studies. Vigants, Edgars (2008). DH & CHP in Latvia, Latvian District Heating Association, September. http://www.lsta.lt/files/seminarai/080911_Budapestas/Latviai.pdf Yafimava, Katja and Jonathan Stern (2007). “The 2007 Russia-Belarus Gas Agreement”, Oxford Institute for Energy Studies, Oxford Energy Forum, January.