gas-solid trickle flow hydrodynamics in a · pdf filegas-solid trickle flow hydrodynamics in a...
TRANSCRIPT
Chemical Engineering Science. Vol. 42, No. 7, pp. 1539-1551, 1987. Printed in Great Britain.
0009-2509187 $3.00 + 0.00 0 1987 Pergamon Journals Ltd.
GAS-SOLID TRICKLE FLOW HYDRODYNAMICS IN A PACKED COLUMN
K. R. WESTERTERP and M. KUCZYNSKI Chemical Reaction Engineering Laboratories, Department of Chemical Technology, Twente University of
Technology, P.O. Box 217, 7500 AE Enschede, The Netherlands
(Received 6 May 1986; accepted for publication 6 October 1986)
Abstract-The pressure gradient and the static and the dynamic hold-up have been measured for a system consisting ofa Fluid Cracking Catalyst (FCC) of 30-150 x 10m6 m diameter, trickling over a packed bed and with a gas streaming in countercurrent flow. The experiments were carried out at ambient conditions using a glass column of 25 x 10 ~’ m diameter. The packing material consisted of 8 x 8 x 3 mm ceramic Raschig rings, a mixture of 7 x 7 x 1 mm glass Raschig rings and 5 x 5 mm catalyst pellets and of stacked Kerapak ceramic mixing units of Sulzer, each unit 50 mm long and 25 mm in diameter. Four different gases have been tested. A correlation for the pressure gradient in the preloading region is derived based on the Ergun equation and taking into account the internal gas recirculation due to the solids trickles. The void fraction of the trickles is found to be independent of-the physical properties of the gas phase. The behaviour of the GSTF-system in the preloading regime and the phenomena of loading and flooding are discussed. A correlation is given which relates the boundary between preloading and loading with the particle and gas properties and the solids flow rate.
1. INTRODUCTION In many processes, e.g. heat exchange, adsorption, drying or chemical reaction, a countercurrent contact- ing of gas and solids is required. To this end a large variety of equipment has been developed, such as moving beds, multistage fluid beds, spray columns, zig- zag contactors or rotary furnaces. Mostly high mass and heat transfer rates and a low axial mixing in both phases is desired, whereas the pressure drop over the contactor determines the energy consumption for the contacting process. Gas-solid trickle flow (GSTF), which is a relatively new operation in process engineer- ing, exhibits some very attractive properties: the in- vestigators report on the low pressure drop, high mass and heat transfer rates and low axial mixing in both phases. Furthermore it exhibits a good operating stability and the construction of a GSTF-column is simple. For design purposes reliable criteria are necess- ary to predict, e.g. the pressure drop and the solids hold-up. Regretfully there is still an important lack of understanding of the hydrodynamic behaviour of the GSTF system. For the operating regime where freely falling solid trickles are observed, a strong similarity in hydrodynamic behaviour to the gas-liquid trickle flow is observed: existence of a static and a dynamic hold-up and the phenomena of loading and flooding. However, it must be borne in mind that in many aspects the nature of the GSTF differs strongly from that of the gas-liquid flow. So, for example, the static hold-up of a liquid in a bed of solid particles is caused by adhesion forces, while there are no equivalent forces for a solid-solid system. The solids trickles in between the particles contain gas, which to some extent will be carried away in the downward direction. In gas-liquid systems the trickles of liquid are not porous.
The present study has been executed as a part of our Gas-Solid-Solid Trickle Flow Reactor (GSSTFR)-
project, for which we had to determine the hydro- dynamically stable operating ranges of such a reactor. In this project two solid phases were present in the reactor: a fixed bed of catalyst particles with diameters in the order of magnitude of millimeters and a powder trickling downwards over these catalyst particles, with a particle size in the order of magnitude of 10-100 microns and to be used to adsorb a component out of the gas flowing upwards through the reactor. We used a glass apparatus as a “cold model” of our GSSTFR. The diameter of the column is equal to that of our high pressure GSSTFR. The catalyst for the methanol synthesis consists of 5 x 5 mm cylindrical pellets. In a bed packed with such particles trickle flow of solids is hardly possible: clogging occurs very quickly. Therefore in this study we used a bed consist- ing of catalyst pellets diluted with 7 x 7 x 1 mm glass Raschig rings in order to increase the void fraction of the bed and to obtain a stable trickle flow. Two other packing materials also have been tested: 8 x 8 x 3 mm Raschig rings and Sulzer Kerapak mixing units of 25 mm diameter and 50 mm long. Both are made of an alumina catalyst carrier. We used the four gases air, argon, helium and Freon 12, so that densities and kinematic viscosities differed with a factor of 30 and 44, respectively. This should enable us to make predictions in an operating regime of higher pressures and temperatures.
2. LITERATURE DATA Experiments on GSTF for sand and air flowing over
a randomly packed column were reported upon by Claus, Vergnes and Le Goff (1976). From their pressure-drop measurements they observed three possible operating ranges for their system, which they called the “preloading region”, the “loading zone” and
1539

1540 K. R. WESTERTERP and M. KUCZYNSKI
the “flooding point”, all these terms having the same significances as for a gas-liquid system. In the preload- ing zone they found the linear velocity of the solids to be independent of the solids feed flow. Furthermore, in the preloading zone the gas velocity had no influence on the solids hold-up or the linear velocity of the solids. Surprisingly the upwards flowing gas does not affect the solids particles in their falling motion due to the gravity, or also, possible drag forces are independent of the relative velocity between gas and solid. However, at the same time a very strong increase of the pressure drop is observed due to the flow of solids.
The study by Roes and van Swaaij (1978) supports these findings. Using a column filled with Pall rings, Raschig rings or cylindrical screens for the system air- fluid cracking catalyst they observed a constant par- ticle velocity in the “preloading region” and a constant particle slip velocity in the “loading zone”. Further they observed that the pressure drop is mainly caused by the flow of solids and proposed an empirical correlation for the solids contribution to the pressure drop. Based on the constant values observed for the particle velocity u”,and the slip velocity a,,+,, they also derived expressions for the dynamic hold-up, the loading point and the flooding point. Furthermore they concluded that data on gas-liquid systems cannot be used to predict the behaviour of the GSTF system.
Large, Naud, Guigon and Bergougnou (1981) ob- served no true loading or flooding phenomena in their system of air and sand in a column filled with dumped Pall rings. At increasing gas loads they observed the formation of dead zones and separation of both phases in the vertical and also the radial direction. The particle velocity was found to be dependent on the gas velocity, also in the range of low gas flows.
Regretfully the literature data are not conclusive and a clear picture of the hydrodynamics of the gas-solid trickle flow cannot be obtained. We may conclude that the reported similarities between the GSTF and the gas-liquid trickle flow are only apparent.
3. EXPERIMENTAL SET-UP AND PROCEDURES
The experimental system is outlined in Fig. 1. The 0.8 m long glass column with a diameter of 25 x lop3 m is equipped with a grid supporting the packing material. The height of the packing was around 0.7 m; data of the packings used are given in Table 1. The column is fed at the bottom with gas: the flow can be adjusted with precision valves and using calibrated rotameters. The solids particles in the fluid bed below the column are transported pneumatically through a riser to the top of the column, where in a cyclone they are separated from the transport gas, the powder then drops into the column. The solids feed flow can be adjusted by changing the flow rate of the transport gas. The solids stream leaving the column at the bottom flows to the fluid bed. In order to prevent short-circuiting of gases a gas-lock is installed in the pipe connecting the bottom of the column to the fluid bed. For the determination of the pressure drop a
Transport gas out
Gas out
Gas In -=
Fluldizing gas -
t
-Transport gas in
Fluldmnq gas
Fig. 1. The experimental setup. (1) glass column; (2) cyclone; (3) fluid bed; (4) solids riser; (5) valves; (6) micromanometer;
(7) gas lock.
Table 1. The packing materials used
Packing dimensions s (mm1 ?I (m 1
&P
(1) Diluted catalyst: glass Raschig rings 7X7X1
+ 680 0.58 catalyst pellets t 5x5
(2) Raschig rings: ceramic rings 8x8~3 536 0.45
(3) Kerapak: Sulzer Kerapak elements
4 = 25 +1000 0.75 L = 50
+Ratio of the Raschig rings to the catalyst pellets equals 1 to 2 by number of particles.
micromanometer is connected to both ends of the column. The dynamic hold-up can be measured by closing the ball valve above and switching the three- way valve below the column: the solids supply is interrupted whereas the solids still leaving the packed bed are collected and weighed. The static hold-up is determined by discharging the contents of the column, sieving and weighing the solid powder.
For the Raschig rings we used argon and air and for the Kerapak of Table 1 the experiments were carried

Gas-solid trickle Bow hydrodynamics 1541
out with air only. For the diluted catalyst packing also argon, helium and Freon 12 were used. The properties of the gases used are given in Table 2. The properties of the powder are specified in Table 3.
4. RESULTS
Pressure gradient In Fig. 2 the pressure drop per unit length of the
column for the system FCC-air is plotted versus the gas flow at constant solids flow rates. For all three packing materials, especially in the region of low gas flows the pressure gradient is strongly increased due to the solids flow. Without solids flow the pressure gradient over the Kerapak is lower by a factor of 3 to 10 than that over diluted catalyst or the Raschig rings. With flow of solids the situation is similar: the Kerapak packing exhibits by far the lowest pressure gradient. At equal gas and solids flow rates the pressure drop over the Raschig rings is remarkably lower than over the diluted catalyst. At increasing gas flow rates the slope of the curves increases, at high gas velocities this slope becomes even greater than that of the line for zero solids flow. A similar behaviour has been observed for the diluted catalyst packing using Freon 12 and helium, as can be seen in Fig. 3. At higher gas velocities, prior to the flooding an entrainment of the solids starts.
Also at zero gas flow a pressure gradient has been
‘E z \
%I-
tow
1 (a)
Table 3. The properties of the adsorbent used
Composition
Particle density Fixed bed density
83 wt%SiO,+13wt% At203
813 kg/m3 475 kg/m’
Particle diameter distribution (from sieve analysis) weight cumulative
d, x 106 fraction weight fraction (m) (%I (%)
< 38 0.1 0.1 3845 0.3 0.4 45-63 6.3 6.7 63-90 39.4 46.1 90-125 41.3 87.4
125-150 12.3 99.7 > 150 0.3 100
measured, see Fig. 4. Its value increases with increasing solids feed flow. Of course, at both G = 0 and S = 0 the pressure drop is zero.
The dynamic hold-up fidyn consists of solids particles which continuously move through the packing so that after interrupting the solids flow they drain from the packing. The static hold-up pstis retained in the bed and consists of particles which do not drain at zero solids flow. Both Bdyn and /i,, are defined as the respective volume fractions in the bed occupied by the solids
Table 2. The gases used and their properties at p = 0.101 MPa andT=293K
gas
for our powder:
(kg%) Y XlOb
*z -1 d,x lo6 “r
(ms ) (m) (m s-l)
argon 1.67 13.2 32.4 0.38 air 1.20 14.6 33.6 0.46 helium 0.17 106 64.1 1.69 Freon 12 5.1 2.4 15.3 0.16
v A L\ 0
\ AIS too
2 ‘A A to
1.5 J id ‘L’
I 10
.
0.5
i /’ .
1 tb) 1 (c)
I , I l,,,,,, I 1 I,,,,,, I 1 ,,lnn I I , I111111 I I ,s,rm , 1 I III I,,, I I,,,,,”
0.001 0.01 0.1 t QOI 0. I t 0.01 0.1 t
Fig. 2. The axial pressure gradient versus the flow rate of air; (a) diluted catalyst; (b) Raschig rings and (c) Kerapak. Solids flow rates S (kg mm2 s-l) are: l ,O, 0 0.5; A 1; 0 1.5;V 2. The solid lines are based on the
modified Ergun equation. L-L’ -loading lines.

K. R. WESTERTERP and M. KUCZYNSKI
ti L\ , .v’
A+ \ 2 \
./
i
\,
I
Helium /
Freon 12
III 0.01
I I rlrl 0.1
G/ (kg rn-‘s-‘1
rC I
Fig. .3. The pressure gradient over the diluted catalyst packing measured using Freon 12 and helium. For symbols
see Fig. 2.
ZO-
% _
@ IO-
$2 -
I 2
S/(kg 6’ s-’ 1
I
3
Fig. 4. Pressure gradient versus the solids flow rate at G = 0.
particles and are calculated on the basis of the particle density of the solids. In Fig. 5 the static hold-up jl,, is plotted versus the gas flow rate for the three packings used. A slight increase of fi,, is observed for increasing gas flow rates. The highest values of 8, have been measured for the Raschig rings while for the Kerapak the static hold-up is by far the lowest.
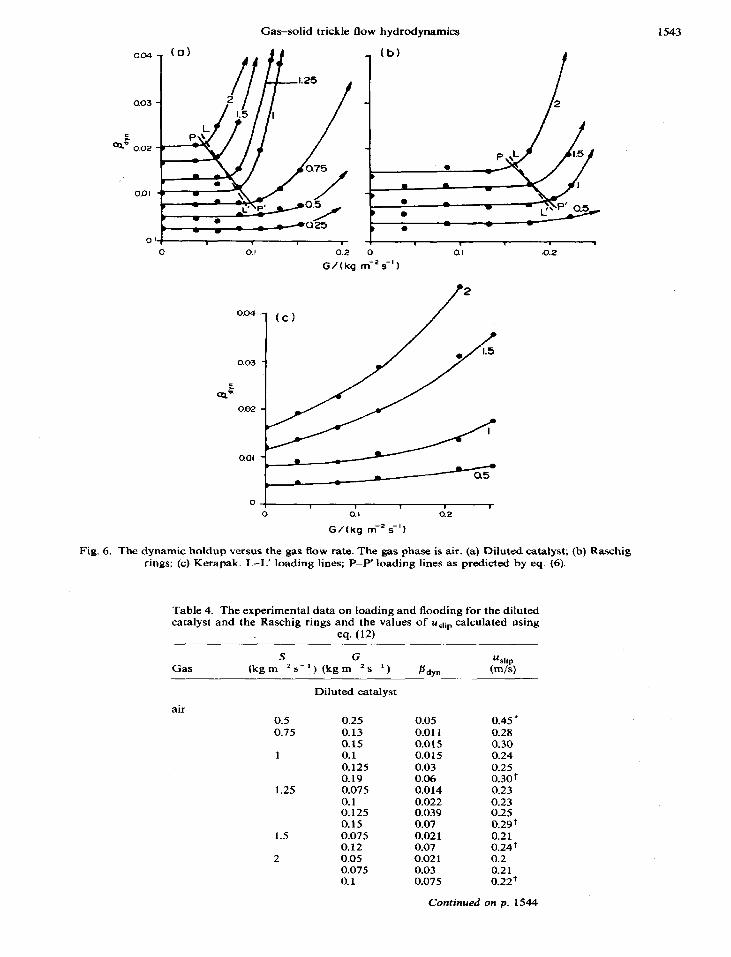
In Fig. 6 plots of the dynamic hold-up BdYnversus the gas flow rate are shown. At low gas flows we observe for the diluted catalyst and for the Raschig rings that B ,,n remains constant despite the increasing of the gas load. At increasing the gas flow even more the loading region is reached: in this region jldyn does increase with increasing gas flow rate. In Fig. 6(a) and (b) we have estimated the operating points at which jldyn starts to increase with increasing gas flow rates and have connected these points with the dotted “loading lines” L-L’. For the Raschig rings the loading starts at higher gas velocities than for the diluted catalyst. The Kerapak packing exhibits a different behaviour
01 0 0.1 0.2
G/(kg mw2 se’)
Fig. 5. The static holdup versus the gas flow rate: 0 diluted catalyst; 0 Raschig rings; I Kerapak.
(Fig. 6c): despite the high void fraction and the low pressure drop, Bdyn starts to increase already at very low gas flow rates and no distinct loading point can be discerned.
The experimental data on the dynamic hold-up for the diluted catalyst and using helium, argon and Freon 12 give similar plots to those for air. For the loading range these data are given in Table 4. In this table, also the data in the loading regime for the system Raschig rings-air are given. In the preloading zone /ldynappcars to be independent of the physical properties of the gas phase. The loading lines as estimated from the /.ldyn-G plots for the four gases used are shown in Fig. 7. The gas flow rate at the loading point decreases at an increasing solids flow rate.
To illustrate the influence of the solids flow rate on the dynamic hold-up, in Fig. 8 jldya is plotted vs S for the diluted catalyst at three different gas flow rates. At zero gas flow the maximum solids flow rate is about 3.5 kgrn-‘s~~; at G = 0.15 kgmV2 s-l it is about 1 kgm-‘s-i. In the preloading zone the dynamic hold-up is proportional to the solids flow rate and independent of the gas flow rate. A similar dependence has been observed For the Raschig rings, whereas the Sulzer packing behaves differently, see Fig. 9. For this packing /ldJa depends on the gas flow rate in the entire range tested.
For the diluted catalyst packing we have determined the upper limits of the stable GSTF-operation called the Aooding lines, using the four different gases. The results are shown in Fig. 10. Here the gas Row rates, at which either the clogging or the “blow-off” starts, are plotted versus the solids feed flow. The accuracy of the determination of the operating points where the flooding begins is low. We therefore plot the dotted “flooding ranges” in this figure. It can be seen that at higher solids flow rates the Aooding occurs at lower gas ilow rates.
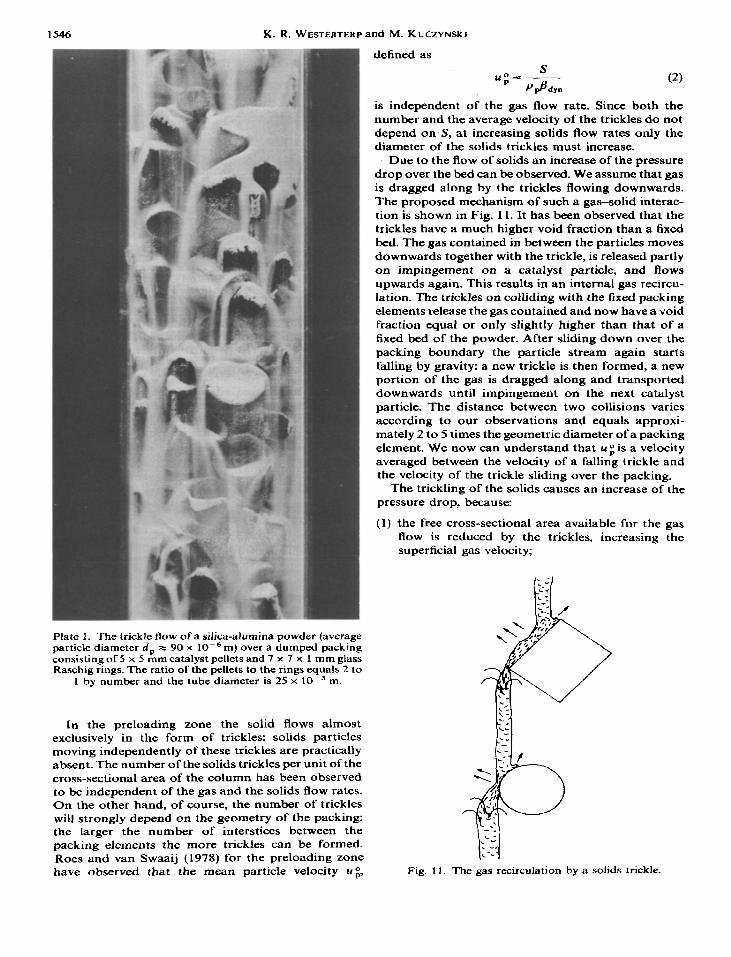
For the dumped packings we have made the follow- ing qualitative observations. In the preloading region the solids flows in the form of trickles only. This can be seen from plate 1: here the white powder trickles over the diluted catalyst packing. At the loading point we observe that the trickles become unstable and that a fraction of the particles starts to move outside and
Gas-solid trickle flow hydrodynamics
0.04
0.03
:. Qa” 0.02 w . \ L’ P’ 0;
0
1 I 1 1
0 0.1 0.2 G/(kq
I 1
0 0.1 a.2
m-‘4’)
sot
0 1 1 1 r I I-
O 0.1 0.2
G/tkg m-’ se’1
Fig. 6. The dynamic holdup versus the gas flow rate. The gas phase is air. (a) Diluted catalyst; (b) Raschig rings: (c) Kerapak. L-L’ loading lines; P-P loading lines as predicted by eq. (6).
Table 4. The experimental data on loading and flooding for the diluted catalyst and the Raschig rings and the values of uSlip calculated using
eq. (12)
Gas (kg ms2 s-r) (kg mci2sA1) fidyn
Diluted catalyst
air 0.5 0.25 0.75 0.13
0.15 1 0.1
0.125 0.19
1.25 0.075 0.1 0.125 0.15
1.5 0.075 0.12
2 0.05 0.075 0.1
0.05 0.45+ 0.011 0.28 0.015 0.30 0.015 0.24 0.03 0.25 0.06 0.30+ 0.014 0.23 0.022 0.23 0.039 0.25 0.07 0.29’ 0.021 0.21 0.07 0.24+ 0.021 0.2 0.03 0.21 0.075 0.22+
Continued on p. 1544

1544 K. R. WESTERTERP and M. KUCZYNSKI
Table 4. (Cord.)
Gas (kgm%‘) (kgmk’) Bdvn
argon
helium
Freon 12
air
0.5 0.13 0.16 0.18 0.34
1 0.11 0.15 0.18 0.29
1.5 0.12 0.14 0.17 0.24
2 0.11 0.15 0.17
0.5 0.031 0.037 0.045 0.060
1 0.024 0.030 0.039 0.055
1.5 0.023 0.029 0.036 0.045
2 0.022 0.028 0.030 0.032
0.5 0.46 0.51 0.54
1 0.40 0.46 0.51 0.59
1.5 0.32 0.39 0.44 0.48 0.50
2 0.32 0.36 0.43
Raschig rings
0.5 0.225 1 0.225 1.5 0.20
0.225 2 0.18
0.20 0.225
0.005 0.27 0.007 0.27 0.009 0.28 0.04 0.43 + 0.011 0.24 0.012 0.27 0.0 14 0.29 0.045 0.39+ 0.018 0.24 0.02 1 0.26 0.025 0.28 0.045 0.34+ 0.024 0.24 0.030 0.26 0.045 0.27+
0.007 0.45 0.008 0.49 0.014 0.56 0.04 0.74’ 0.011 0.38 0.013 0.43 0.02 0.51 0.04 0.69t 0.015 0.39 0.019 0.43 0.024 0.5 0.045 0.60+ 0.02 1 0.37 0.025 0.42 0.033 0.43 0.04 0.45+
0.02 1 0.27 0.027 0.28 0.07 0.24+ 0.011 0.26 0.015 0.26 0.018 0.26 0.05 0.27t 0.016 0.24 0.019 0.25 0.026 0.24 0.033 0.25 0.07 0.24’ 0.02 1 0.24 0.027 0.23 0.08 0.22’
0.005 0.65 0.012 0.54 0.014 0.61 0.019 0.60 0.019 0.56 0.029 0.58 0.04 1 0.64
‘Flooding.
independently of the trickles. At this point also the There was no recycling of the entrained solids at the dynamic hold-up starts to increase, if either G or S or top of our experimental column. Therefore instead ofa both are increased. At further increasing of G the sudden increase of the pressure drop and dynamic trickles remain unaffected in their motion while the hold-up at flooding we observe an increased entrain- amount of the suspended particles increases gradually. ment starting with the finest particles. This has also

Gas-solid trickle flow hydrodynamics 1545
04
3 0
0 I 2
S /( kg m-‘5’)
Fig. 7. The loading lines for the diluted catalyst measured for various gases: (1) argon; (2) air; (3) helium; (4) Freon 12.
0.3
7, E 0.2 . 9
0.t
0
Fig. 8. versus
1
0 I 2 3 4
S/Ckg me*se’)
The dynamic holdup in the diluted catalyst plotted the solids flow rate. The flow rates of the air
G (kgm-2s-‘) are:Cl 0; A 0.09; 0 0.15.
0.06 -I
a04 i -5
0.02
0 0 I 2
S/(kg rn-*s?)
Fig. 9. The dynamic holdup versus the solids flow rate for the Kerapak. The flow rates of air G (kg m-* s-l); 0 0, A 0.15;
0 0.26.
been described by van Swaaij and Verver (1986). A visual observation of the inside of the Kerapak
units was not possible.
5. SOME REFLECTIONS ON THE PHENOMENA ON A MICROSCALE
If we desire to derive correlations that describe the hydrodynamical behaviour of a GSSTFR it is a
a5 I 1.5 2
S/(kg mm’<‘)
Fig. 10. The us vs S plots at flooding for the diluted catalyst and different gases. 0 air; 0 argon; A helium; 0 Freon 12.
prudent policy to look for analogies with similar situations. For example it is known that the pressure drop AP in a straight tube is proportional to the tube length L, to the energy content per unit volume of the fluid flowing through the tube *p&and to the surface area per unit volume of the fluid 4/d ,. This leads to the well-known relation AP d JL. )p& = 4f. Here the friction factor Jis a function of the Reynolds number Re, the ratio of inertia forces per unit of fluid volume $psu’, to the viscous forces per unit of fluid volume ‘I, us Id,, so Re = p, ued,/qg . In a packed bed with spheres the analogy results m A P being proportional to L, ~P,(u~/E,,)’ and the surface area per unit volume of the fluid 6( 1 - cp)/Epdp, where spis the void fraction of the packed bed. This leads to APe,d,[12L(l -E& ~s(us/e~)~ J = f, whereas Re is the ratio of LW&Y to ~(us/sp)lC+pl(I ---E&I or Rep, = pu,ddq(l -Q. Accordmg to Ergun (1952) f = 150/Re,+ 1.75. If non-spherical particles are used then d, = 6 VJS,. If the surface area of the wall cannot be neglected compared to the particles surface area
6(1 - EP) (d,ld, < IO), then d, = s
Y + 4,d , where S, is the ex-
* ternal surface area of the packing per unit volume of the packed bed. The Ergun equation
AP cpdp
Jr. (1 - ~p)P,(+p)2
where K, = 150 and K, = 1.75, can be checked for the various packing types that we have investigated.
Now the question can be raised which pressure drop can be expected if a solid trickles through a packed bed. For the countercurrent gas-solid trickle flow over a packed bed two distinct flow patterns have been observed; they are called the preloading regime and the loading regime. The operating point where the system passes from one regime to the other is called the loading point.
1546 K. R. WESTERTERP and M. KLJCZYNSKI
Plate 1. The trickle flow of a silica-alumina powder (average particle diameter aP z 90 x 10m6 m) over a dumped packing consisting of 5 x 5 mm catalyst pellets and 7 x 7 x 1 mm glass Raschig rings. The ratio of the pellets to the rings equals 2 to
1 by number and the tube diameter is 25 x 1Om3 m.
In the preloading zone the solid flows almost exclusively in the form of trickles: solids particles moving independently of these trickles are practically absent. The number of the solids trickles per unit of the cross-sectional area of the column has been observed to be independent of the gas and the solids flow rates. On the other hand, of course, the number of trickles will strongly depend on the geometry of the packing: the larger the number of interstices between the packing elements the more trickles can be formed. Roes and van Swaaij (1978) for the preloading zone have observed that the mean particle velocity ~0,
defined as
is independent of the gas flow rate. Since both the number and the average velocity of the trickles do not depend on S, at increasing solids flow rates only the diameter of the solids trickles must increase.
Due to the flow of solids an increase of the pressure drop over the bed can be observed. We assume that gas is dragged along by the trickles flowing downwards. The proposed mechanism of such a gas-solid interac- tion is shown in Fig. 11. It has been observed that the trickles have a much higher void fraction than a fixed bed. The gas contained in between the particles moves downwards together with the trickle, is released partly on impingement on a catalyst particle, and flows upwards again. This results in an internal gas recircu- lation. The trickles on colliding with the fixed packing elements release the gas contained and now have a void fraction equal or only slightly higher than that of a fixed bed of the powder. After sliding down over the packing boundary the particle stream again starts falling by gravity: a new trickle is then formed, a new portion of the gas is dragged along and transported downwards until impingement on the next catalyst particle. The distance between two collisions varies according to our observations and equals approxi- mately 2 to 5 times the geometric diameter of a packing element. We now can understand that t(; is a velocity averaged between the velocity of a falling trickle and the velocity of the trickle sliding over the packing.
The trickling of the solids causes an increase of the pressure drop, because:
(1) the free cross-sectional area available for the gas flow is reduced by the trickles, increasing the superficial gas velocity;
Fig. 11. The gas recirculation by a solids trickle. - Y

Gas-solid trickle flow hydrodynamics
the gas flow rate in upward direction inside the column is higher than the feed flow rate because of the internal recirculation of gas. This leads to an increase of the linear gas velocity.
1547
is known, or vice versa, .sk tr can be determined from the experimental data on the pressure drop.
On increasing the gas or the solids flow rates the loading point will be reached. This is the upper limit of the preloading regime. Above this limit, a further increase of the gas flow rate leads to an increase of the dynamrc holdup. In a pd,, vs G plot, a line connecting the loading points for different S-values is called the “loading line”.
(2)
So we assume that in principle the Ergun equation remains valid for the GSTF provided the real linear gas velocity in the packed column is taken into amount.
We further assume in the trickles a certain void fraction E&~,, defined as
a&o = gas volume in the trickle
total trickle volume - (3)
E&S assumed to be constant and to be only character- istic for the system packing-trickling solid. The upward gas flow is increased by the amount dragged
s eg.tr along with the solids, i.e. by - p. P, 1 -e&&t,
As outlined in
Fig. 12, the free cross-sectional area of the column available for the gas Row is reduced by the trickles, by the static hold-up and by the stagnant gas phase contained in between the particles of the static hold-up,
that is by a factor of
where p rb is the fixed bed density of the powder. So the maI gas velocity up as to be used in the Ergun equation (1) becomes:
G s Eg.tr -+-----_
U# = Pg P,l -Eg.tr
PP S (4) Ep-B*t--
Pfb Pp”;(l -E,&
Using eq. (4), the pressure drop can be predicted if &g.tr
Static Trickles DhCISe (downward flow)
Solids 1 Gas
On a microscale we observe that at and beyond the loading point freely moving particles appear. The trickle flow is now accompanied by a dynamic interac- tion between particles and the gas surrounding the trickles. Particles located near the surface of a trickle can easily be torn off from this trickle, they then move suspended freely in the gas until they are snatched again by a trickle. The pressure drop in the column is now increased by the weight of the freely suspended particles. In the preloading region the fraction of Bdyn which is suspended is assumed to be negligible. If possibly in the preloading regime a particle becomes released from a trickle, it should return quickly to the trickle. Therefore it must be able to move in the downward direction: its terminal velocity ut must be higher than the real gas velocity in the column. At the loading point these two velocities become equal, so that for a given packing and a given gas-solid system holds
(5)
or also du, = 0. We have to realise that Us relates to a particle diameter somewhere in the lower range of the particle size distribution of the powder used.
Using eq. (4) and assuming that estris a constant, we can write for the loading line at low values of S (so that
/’ ; I - ep
_I
P A
C K
I
N L
G -
/
n
.
Suspended sollds
Gos (upward flaw)
Fig. 12. Stationary and mobile phases in the GSTF column.

1548 K. R. WESTERTERP and M. KUCZYNSKI
the denominator of eq. (4) can be considered as a constant):
du,=O=LdG+ sstr dS or PE Pp(1 - sg,tr)
* (6)
so, E&U can be determined from the slopes of the loading lines which are expected to be straight lines.
The steady-state motion of a single particle is described by the Stokes’ law:
u, = @a--Pg)d2part. 18 P,V,
(7)
for Repart QPrt = - c 2 (McCabe and Smith, 1976). In “s
dimensionless terms eq. (7) can be rewritten (Wesselingh, 1986) into:
U* = &(d*)’
where U* =5 and d* - d
- 2fE are the dimensionless u, dr
terminal velocity and particle diameter respectively. The reference velocity and reference diameter are defined by ur= (g’vs)i13 and d,= (vi/g’)‘13 with 9’ = 9(Pp-PgYPg-
At the loading point, the upward gas velocity equals the terminal velocity of the solids particles. For a given packing and a given powder with a given distribution of
particle diameters, a logarithmic plot of II * versus 0
f r
therefore is expected to be a straight line. In the loading region we assume that the trickles no
more change in size, because the amount of solids fed at the top of the column under steady state conditions also has to leave at the bottom. So the net downflowing stream of solids is constant. Also a steady state is reached in the amount of solids particles torn off from the trickles and the amount of suspended particles snatched again by the trickles. Now the dynamic hold- up in the packed bed consists of two contributions: the
constant content of the trickles fi,, and the freely suspended /Irusp- So for B*,,,, we have
B *yn = Bt,+B.“,p= --++Ps”s,. P P
(9)
At constant gas flow rate G the real gas velocity up now is increased due to the suspended particles, so that eq. (4) has to be rewritten as:
G+S_L._ egtr
u/J= PS Ppl-Qtr
( . (10)
Ep-&- S Pfb Pp+i (1 - Eg.tr) B > S”SP
Flooding is the upper limit of the loading zone and can be caused by either of two phenomena (van Swaaij and Verver, 1986): solids blow-off or clogging. If there is no recycling of the entrained solids back to the top of the column, at a sufficient gas flow the lighter particles are blown out of the column and only the heavier particles move downwards. Here the hold-up passes through a maximum. At a further increase of gas Aow rate the hold-up decreases. If the entrained solids particles are recirculated back into the column, e.g. by means of a cyclone, both the hold-up and the pressure drop increase very quickly and the column becomes completely clogged. In the flooding regime the oper- ation of a GSTFcolumn is unstable, so quantitative relations between the hold-up and the flow rates cannot be formulated.
0.0 1
0
S/t kg n-l -e s-l 1
6. CORRELATION OF THE RESULTS
To determine the particle oelocity u; we plot the dynamic holdup versus the solids flow rate in the preloading region, as is shown in Fig. 13. For the diluted catalyst (Fig. 13a) the points lie exactly on a straight line for all four gases used. This confirms the validity of eq. (2). For the diluted catalyst we find uXDc =i 0.12 m/s and for the Raschig rings (Fig. 13b) r&s = 0.17 m/s. uz appears to be independent of the properties of the gas phase; it only depends on the geometry of the packing and perhaps also on the properties of the powder, which have not been varied by us.
Fig. 13. The dynamic holdup in the preloading zone versus thqsolids flow rate for (a) the diluted catalyst and (b) the Raschig rings. For symbols see Fig. 10.
Gas-solid trickle flow hydrodynamics 1549
For Kerapak the trickle velocity is not constant: it decreases at increasing gas flow rates, even at low gas velocities. Most probably this different behaviour is caused by the regular geometry of this packing with no vertical channels. In the regularly arranged, sloped channels the trickles slide down along the walls, whereas freely falling trickles are almost absent. So an internal recirculation of gas will hardly take place.
The pressure drop without trickle flow experiments for the three packings have been correlated using the Ergun equation (1). In our case the ratio of the column to the packing diameter is 3 to 5 and therefore we introduced the usual apparent particle diameter ac-
d = 66-q - cording to p
4 . From a plot of
sv+z &“, APd,
(I -Ep)LPsU2gverSUS Re -I 1 [V;.d;‘)]-‘,both K,
and K, can be determined. The values obtained for each individual gas are given in Table 5. For the diluted catalyst the average values for all the investigated gases together are 140 and 1.52, respectively. These values are slightly lower than those of 150 and 1.75 as originally proposed by Ergun. For both the Raschig rings and the Kerapak the calculated K L and K t values are significantly lower than the Ergun’s values as can be
seen in the table. We should realise that the condition d,/d,, > 20 for the validity of Ergun’s correlation does not hold in our case.
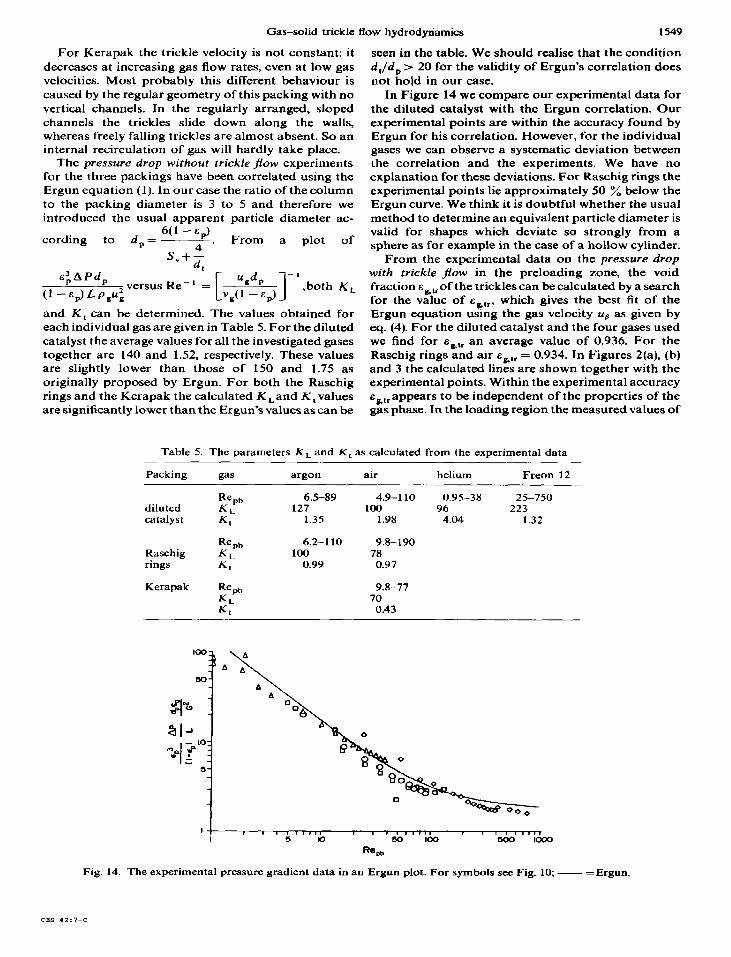
In Figure 14 we compare our experimental data for the diluted catalyst with the Ergun correlation. Our experimental points are within the accuracy found by Ergun for his correlation. However, for the individual gases we can observe a systematic deviation between the correlation and the experiments. We have no explanation for these deviations. For Raschig rings the experimental points lie approximately 50 Y0 below the Ergun curve. We think it is doubtful whether the usual method to determine an equivalent particle diameter is valid for shapes which deviate so strongly from a sphere as for example in the case of a hollow cylinder.
From the experimental data on the pressure drop with trickle jfow in the preloading zone, the void fraction s S,r of the trickles can be calculated by a search for the value of E%,~, which gives the best fit of the Ergun equation using the gas velocity uP as given by eq. (4). For the diluted catalyst and the four gases used we find for cktr an average value of 0.936. For the Raschig rings and air .sCtr = 0.934. In Figures 2(a), (b) and 3 the calculated lines are shown together with the experimental points. Within the experimental accuracy &efr appears to be independent of the properties of the gas phase. In the loading region the measured values of
Table 5. The parameters K, and K, as calculated from the experimental data
Packing gas argon air helium Freon 12
diluted catalyst
Raschig rings
Kerapak
Re,b KL K,
Re,b KL K,
Re,b KL Kt
6.5-89 127
1.35
4.2-l 10 100
0.99
4.9-l 10 0.95-38 25-750 100 96 223
1.98 4.04 1.32
9.8-190 78
0.97
9.8.-77 70
0.43
Fig. 14. The experimental pressure gradient data in an Ergun plot. For symbols see Fig. 10; - = Ergun.
CES 42:7--c

1550 K. R. WESTERTERP and M. KIJCZYNSKI
AP/L are higher than those predicted: this excessive increase of the pressure drop is caused by the weight of the suspended solid particles.
The Iouding lines obtained from /I,,-G plots are approximately straight lines, see Fig. 6. Using eq. (6) and taking for E str the value obtained from the pressure drop data, we can predict the slopes of the loading lines. The lines P-P’ in Fig. 6(a) and (b) have slopes calculated from eq. (6). Within the accuracy of our Bdyo vs G plots these lines properly predict the locations of the loading points.
In Fig. 15 for constant values of S we have plotted
utp= y dpti for the d’ versus d* = d rluted cata-
lyst. uLp is the real velocit;of the gas at the loading point, that is the corresponding value of r+. Here for d pan we took a value of 70 x 10e6 m: for the powder used by us we expect that the loading starts when particles having approximately this diameter become unable to fall down. The data in Fig. 15 can be correlated by:
u*Lp = (11)
The following can be said of this correlation Our operating region lies around the boundary of the validity of the correlations u* = (d*)2/18 to u* = 0.23 d* for the velocity of a freely falling particle ( Wesselingh, 1986). We see in our correlation that the
3’
2-
I - l z
0.5 -
0.2 -
c 2 5
d*
Fig. 15. utP as a function of d * Parameter is the solids flow rate S (kg m-2s-‘)
exponent lies between 2 and 1. The utp is higher than the u* for a freely falling particle. This could be expected because of the protective character of the trickles: higher gas velocities are necessary to tear off the particles from the trickles. Further the value of uLp depends on &. We further know, that the influence of the gas properties have been fully accounted for by introducing d, and t(,. So the effect of the solids flow rate only can be accounted for by introducing packing or solid powder properties. Arbitrarily we have taken p,u,O, we have no proof for that. In future experiments we will try to elucidate this aspect.
In the loading range the slip velocity Q, as calcu- lated according to Roes and Van Swaaij (1978) by
appears, within the accuracy of the data, to be in- dependent of S and G in the loading range. The calculated values of uslip are given in Table 6. For the Raschig rings we find a mean value of u $iip = 0.6 1 m/s, which is considerably higher than that for the diluted catalyst. So in contradiction to the expectations of Roes and Van Swaaij (1978), uslip strongly depends on the packing geometry and on the properties of the gas phase: for the diluted catalyst we find for argon, air and Freon 12 uslip x 0.25 m/s while for helium uslip = 0.45 m/s. We have no explanation for this difference.
7. CONCLUSIONS
The suitability of three different packing materials for gas-solid trickle flow has been evaluated by press- ure drop and hold-up measurements. The ceramic Sulzer packing exhibits a low pressure drop and a good stability. No loading or flooding phenomena are observed for this packing. The region of stable oper- ation is large, the static hold-up is low.
For dumped packings a pressure drop correlation is derived taking an internal gas recirculation into ac- count. The concept of the “trickle void fraction” agtris introduced and substantiated. From the experiments follows, that a solid particle in a trickle drags along about 15 times its own volume as gas in the trickle. From the pressure drop measurements with various gases abtr is found to be independent of the properties of the gas phase. In the preloading region the mean particle velocity is constant and independent of the properties of the gas phase and of the gas flow rate, so B +,, in this region can easily be predicted with eq. (2) if u;is known. For the diluted catalyst up” = 0.12 m/s and
Table 6. The mean values of uSlia calculated with eq. (12)
Packing argon air helium Freon 12
diluted catalyst Raschig rings
u*lip (m/s)
0.26 0.24 0.45 0.25 0.61
Gas-solid trickle flow hydrodynamics 1.551
for the Raschig rings u% = 0.17 m/s. The pressure drop S solids flow rate per unit of cross-sectional in the preloading region can be predicted reliably by area of empty column, kg m - 2 s- t using the linear gas velocity according to eq. (4) in the S, external surface area of single packing Ergun equation (1). For the trickle void fraction satrwe particle, m2 have found the value of 0.93*. The preloading regime S, surface area of the packing per unit bed ends as soon as ZQ = utP. The value of uLp can be volume, m - 1 calculated for the diluted catalyst with eq. (1-l).
From our experimental data we are unable to derive a universal relation allowing a reliable prediction of the dynamic hold-up in the loading range and of flooding. More experimental data are necessary especially in the operating region near flooding. For a rough estimation of BdYn in the loading regime the use of eq. (12) may be recommended, using for usiip the values reported for the different gases.
u*
aI3 ULP
%
dimensionless terminal velocity, z
approach velocity of the gas, m s- ’ real gas velocity at the loading point, ms-’ particle velocity in the preloading region, ms-’ terminal particle velocity, m s - ’ reference terminal velocity,
Acknowledgements-The authors thank the Twente S(P,--PsIv* li3
University of Technology and the Royal Dutch Shell Group ( , ms-t
for the financia& support and Mr. G. Poort and Mr. W. ps >
Smeitink for their contribution to the experimental work. Rslip slip velocity {eq. (12)), m s- ’ y D volume of a single packing particle, m3
d* dimensionless diameter of a powder d part
particle 7 I dP d part
4
diameter of a packing particle, m diameter of a powder particle, m
reference powder particle diameter
( v2gf% y3_ m b(P,--P,)l ’ column diameter, m friction factor gravitational constant, 9.81 m s-’ gas flow rate per unit of cross-se&tonal area of the empty column, kg m-2s-1 constants in the Ergun equation packed bed length pressure gradient, Pa m-l
~1 .d
Repan
packing particle Reynolds number, 3 vs
a,dw,
Re,b
powder particle Reynolds number, -
Reynolds number in the bed, ~,,(d~?~(l - ep))
NOTATION
dynamic holdup of the solid powder static holdup of the solid powder dynamic holdup contained in trickles void fraction of a trickle suspended fraction of dynamic holdup void fraction of the packing fixed bed density, kg m - 3 gas density, kg m - 3 density of the powder particle, kg mm3 kinematic viscosity, mz s- 1
REFERENCES
Claus, G., Vergnes, F. and Le Goff, P., 1976, Hydr~yMmic study of gas and solid flow through a screen-packing. Can. J. them. Engng 54, 143-147.
Ergun, S. 1952, Fluid flow through packed columns. C&et. Engng Progr. 48, 89-94.
Large, J. F., Naud. M., Guigon, P. and Bergougnou, M. A., 1981, Hydrodynamics of the raining packed-bed gas-solids heat exchanger. Chem. Engng J. 22, 95-100.
McCabe, W. L. and Smith, J. C., 1976, Unit Operations of Chemical Engineering. McGraw-Hill, New York, p. 154.
Roes. A. W. M. and van Swaaii. W. P. M.. 1978. Hydrodynamic behaviour of a ga&olid countercurrent packed column at trickle Row. Ckem. Engng J. I?, 81-89.
van Swaaii. W. P. M. and Verver. A. B.. Gas-solids trickle Bow. Inl.Proc. 16th ICHMT Symposium Heat and Mass Transfer in Fixed and Ffuidized Beds, Dubrovnik, Sept. 3-7, 1984, Springer, Berlin, pp. l-26.
Wesseiingh, J. A., 1987, The velocity of particles, drops and bubbles. Ckem. Engng Process 21, 9--14.