gas hydrate analysis and modelling of monoethylene glycol
TRANSCRIPT
Western Australian School of Mines
Department of Petroleum Engineering
Gas Hydrate Analysis and Modelling of Monoethylene Glycol
Regeneration and the Impact of Additives
Khalid Alef
This thesis is presented for the Degree of
Doctor of Philosophy
of
Curtin University
January 2020

I
DECLARATION
To the best of my knowledge and belief this thesis contains no material previously
published by any other person except where due acknowledgment has been made.
This thesis contains no material which has been accepted for the award of any other
degree or diploma in any university.
Signature: (Khalid Alef)
Date:

II
COPYRIGHT
I warrant that I have obtained, where necessary, permission from the copyright owners
to use any third-party copyright material reproduced in the thesis, or to use any of my
own published work in which the copyright is held by another party (e.g. publisher,
co-author).
Signature: (Khalid Alef)
Date:

III
DEDICATION
I would like to dedicate this thesis to my beloved parents whose love, example and
selfless support have secured the foundation for the discipline and application
necessary to achieve success.
In loving memory of my beloved grandparents (late) for their endless love, prayers
and encouragement.

IV
ACKNOWLEDGEMENT
All praise and thanks belong to God, Al-Mighty for everything including this work.
I am most grateful to my main supervisor, Dr. Ahmed Barifcani for his advanced
technical guidance, endless support and encouragement. Beside my supervisor, my
sincerest thanks go to the members of my thesis committee, Dr. Stefan Iglauer, Dr.
Christopher Lagat, and Chairperson, Dr. Mofazzal Hossain, for their time,
encouragement, and expertise throughout this project. I would also like to thank my
colleagues, Dr. Khalifa Al Harooni and Dr. Callum Smith for their valuable assistance
throughout my project. Special thanks also go to the technicians at the Department of
Petroleum Engineering and Curtin Corrosion Engineering Industry Centre, especially
Dr. Guanliang Zhou and Mr. Leigh Bermingham for their help in the research
laboratory.
I would especially like to thank my family, mentors and friends. My wife who has
been extremely supportive of me throughout this entire process and has made countless
sacrifices to help me get to this point. My mentors and friends who have helped in
pointing me to the right direction in key times of my development academically,
professionally, and spiritually. Without such a team behind me, I doubt that I would
be in this place today.
Last but not least, I would like to acknowledge the contribution of an Australian
Government Research Training Program Scholarship in supporting this research.

V
ABSTRACT
Natural gas is increasingly becoming a favourable alternative resource to meet energy
demands. However, natural gas production, processing, and transportation faces
serious flow assurance challenges such as hydrate formation. Conventionally,
monoethylene glycol (MEG) is injected to inhibit gas hydrate formation. Due to the
large quantities of MEG required, it is re-used after a complex regeneration process.
During this process, MEG may undergo a type of degradation that may ultimately
decrease its hydrate inhibitory performance. In this project, significant experimental
and computational effort has been applied to investigate MEG degradation, evaluate
the MEG regeneration and reclamation process during water breakthrough, and the
impact of several other chemicals on gas hydrate formation.
The impact of MEG degradation on hydrate formation was studied for the first time
over multiple trials of experimentation equivalent to numerous MEG inventory
turnovers. The novel and the only MEG laboratory-scale regeneration and reclamation
research facility in Australia was utilised for the work. It was found that MEG
degradation can occur even at lower exposure temperatures albeit in longer exposure
times. The study gave insights and established a way to diagnose the operating pH at
various stages of the MEG regeneration and reclamation process as well as how it can
be modified to ensure expected objectives are met. An original contribution to
knowledge from this study is the production of highly valuable hydrate phase
equilibria data and metastable regions for systems of MEG covering a wide pressure
range of 50 to 200 bar. Moreover, a novel empirical model for prediction was
developed capturing the degradation of MEG over regeneration cycles. The impact of
this research to the field and future knowledge is significant. Firstly, a blind spot has
been exposed, whereby the lack of inhibition performance of degraded MEG would
need to be considered in hydrate control philosophies. Secondly, a predictive tool is
now immediately available to MEG operators to help determine the amount of
degradation against regeneration cycle. When considering a typical 5 kT MEG
inventory system, an additional average cost of approximately USD $227,000 for
MEG top-ups at each inventory turnover would be required to ensure expectations are
met.
Additional empirical models were developed to allow for prediction of degraded and

VI
non-degraded, regenerated and non-regenerated, and corrosion inhibitor presence or
absence in MEG solutions. Such prediction capability will allow MEG end-users to
effectively monitor MEG quality, and ensure the integrity of the hydrate control
program that is applied in the field. In other respects, methods to prepare and degrade
MEG samples have been developed and standardized.
Methyldiethanolamine (MDEA) has increasingly been used alongside MEG as a pH
stabilizer. The impact of this chemical on gas hydrate formation has only recently been
recognized, however it has never been modelled. In this study, the effect of MDEA in
the presence and absence of MEG has been studied at a high-pressure range. The
combined effect of MDEA (7.5 wt%) with MEG (20 wt%) showed an equivalent
hydrate performance of 20.95 wt% MEG. New phase equilibria data, and empirical
and thermodynamic models using the Cubic Plus Association (CPA) equation of state
were produced as original contributions to knowledge. The impact of this research to
the field and future knowledge is significant, since this will allow for accurate
prediction of the effect of MDEA in a time where the effect of this chemical has not
been considered in any available hydrate simulation software.
Moreover, a plethora of chemicals are also injected alongside MEG for various reasons
such as corrosion inhibition, oxygen scavenging and scale inhibition. Selections of
each type of chemical have been thoroughly tested using a high-pressure PVT cell to
determine the hydrate phase boundaries. The effect of film forming corrosion inhibitor
(FFCI) on gas hydrate formation in the presence of MEG or kinetic hydrate inhibitor
(KHI) has been investigated and it was found to have an inhibitory performance. High
levels of dissolved oxygen in the presence of MEG was found to promote gas hydrate
formation.

VII
PUBLICATIONS BY THE AUTHOR
This Ph.D. thesis by publication consists of eight (8) first-author peer-reviewed
publications in high-impact journals, and two (2) refereed conference articles. Other
publications or collaborations relevant to the thesis are also listed. The copyright
permission statement for each publication are given in Appendix C. Signed statements
of contribution by others are given in Appendix D.
1. Alef, K., Smith, C., Iglauer, S., Gubner, R., Barifcani, A., 2018c. The Effect
of Regenerated MEG on Hydrate Inhibition Performance Over Multiple
Regeneration Cycles. Fuel 222, 638–647. doi: 10.1016/j.fuel.2018.02.190.
2. Alef, K., Gubner, R., Iglauer, S., Barifcani, A., 2019a. Evaluation of MEG
Reclamation and Natural Gas Hydrate Inhibition During Corrosion Control
Switchover. Journal of Petroleum Science and Engineering 176, 1175–1186.
doi: 10.1016/j.petrol.2018.08.052.
3. Alef, K., Barifcani, A., 2018. The Effect of Salt-Laden Degraded MEG on Gas
Hydrate Inhibition. Presented at the SPE Kingdom of Saudi Arabia Annual
Technical Symposium and Exhibition, Society of Petroleum Engineers. doi:
10.2118/192447-MS.
4. Alef, K., Iglauer, S., Gubner, R., Barifcani, A., 2018b. Hydrate Phase
Equilibria for Methyldiethanolamine and Empirical Modeling for Prediction.
J. Chem. Eng. Data 63, 3559–3565. doi: 10.1021/acs.jced.8b00440.
5. Alef, K., Iglauer, S., Barifcani, A., 2019b. Thermodynamic Modeling of
Hydrate Phase Equilibria in Methyldiethanolamine Solution in the Presence or
Absence of Monoethylene Glycol. J. Chem. Eng. Data 64, 4148–4153. doi:
10.1021/acs.jced.9b00552.
6. Alef, K., Barifcani, A., 2020. Effect of N-Methyl-Diethanolamine and Film
Forming Corrosion Inhibitor on Gas Hydrate, and Empirical Modeling for
Degradation. Journal of Petroleum Science and Engineering 184, 106522. doi:
10.1016/j.petrol.2019.106522.
7. Alef, K., Iglauer, S., Barifcani, A., 2018a. Effect of Dissolved Oxygen, Sodium
Bisulfite, and Oxygen Scavengers on Methane Hydrate Inhibition. J. Chem.
Eng. Data 63, 1821–1826. doi: 10.1021/acs.jced.8b00150.
8. Alef, K., Barifcani, A., 2019. Hydrate Phase Equilibria of Phosphonate Scale

VIII
Inhibitors, Amines, and Ethylene Glycol. J. Chem. Eng. Data 64, 3205–3210.
doi: 10.1021/acs.jced.9b00366.
9. Alef, K., Iglauer, S., Barifcani, A., 2017. An Innovative Approach to Assessing
Gas Hydrate Inhibition and Corrosion Control Strategies, In One Curtin
International Postgraduate Conference (OCPC), Miri, Sarawak, Malaysia:
Curtin.
10. Alef, K., Iglauer, S., Barifcani, A., 2019c. Degradation and Hydrate Phase
Equilibria Measurement Methods of Monoethylene Glycol. MethodsX 6, 6–
14. doi: 10.1016/j.mex.2018.12.004.
Other publications or collaborations indirectly connected to the thesis are:
11. Sadeq, D., Alef, K., Iglauer, S., Lebedev, M., Barifcani, A., 2018.
Compressional Wave Velocity of Hydrate-Bearing Bentheimer Sediments with
Varying Pore Fillings. International Journal of Hydrogen Energy 43, 23193–
23200. doi: 10.1016/j.ijhydene.2018.10.169.

IX
TABLE OF CONTENTS
DECLARATION ...................................................................................................... I
COPYRIGHT .......................................................................................................... II
DEDICATION ....................................................................................................... III
ACKNOWLEDGEMENT ..................................................................................... IV
ABSTRACT ............................................................................................................ V
PUBLICATIONS BY THE AUTHOR ................................................................. VII
TABLE OF CONTENTS ....................................................................................... IX
LIST OF FIGURES ............................................................................................ XIV
LIST OF TABLES ........................................................................................... XVIII
Introduction ............................................................................................ 1
Background ................................................................................................... 1
Literature Review .......................................................................................... 3
1.2.1 Interest in Gas Hydrates ......................................................................... 4
1.2.2 Hydrate Structure and Physical Properties ............................................. 5
1.2.3 Hydrate Formation and Dissociation Mechanism .................................. 9
1.2.4 Hydrate Phase Equilibria Modelling .................................................... 14
1.2.5 Hydrate Inhibition ................................................................................ 18
1.2.6 Regeneration and Reclamation of MEG .............................................. 21
1.2.7 Degradation of MEG ............................................................................ 23
Significance and Research Gap ................................................................... 23
Thesis Objectives ........................................................................................ 27
Thesis Structure ........................................................................................... 28
Effect of Regenerated MEG on Gas Hydrate, and Empirical Modelling
for Prediction .............................................................................................................. 31
Introduction ................................................................................................. 33
Methodology ............................................................................................... 34

X
2.2.1 Materials and Equipment ..................................................................... 34
2.2.2 Process and Procedure.......................................................................... 37
Results and Discussion ................................................................................ 39
2.3.1 Observations ......................................................................................... 39
2.3.2 Initial Testing ....................................................................................... 42
2.3.3 Equilibrium Results – Cycling ............................................................. 43
2.3.4 Empirical Model................................................................................... 49
2.3.5 Application of Model to Experimental Data ........................................ 51
Conclusions and Recommendations ............................................................ 52
Evaluation of MEG Reclamation and Natural Gas Hydrate Inhibition
during Corrosion Control Switchover ........................................................................ 54
Introduction ................................................................................................. 55
Methodology ............................................................................................... 56
3.2.1 Materials and Equipment ..................................................................... 58
3.2.2 Procedure.............................................................................................. 61
Results and Discussion ................................................................................ 63
3.3.1 Switchover Operation........................................................................... 63
3.3.1.1 Effect of pH on MDEA removal................................................... 66
3.3.1.2 Effect of FFCI ............................................................................... 68
3.3.1.3 Effect of pH on Acetic Acid Removal .......................................... 70
3.3.1.4 Effect of pH on Divalent Salts Removal ...................................... 71
3.3.2 Natural Gas Hydrate Inhibition ............................................................ 71
3.3.2.1 Preliminary Hydrate Testing ......................................................... 71
3.3.2.2 Reclaimed MEG Hydrate Equilibria............................................. 73
Conclusion ................................................................................................... 79
Effect of Salt-Laden Degraded MEG on Gas Hydrate Inhibition ........ 81
Introduction ................................................................................................. 82

XI
Methodology ............................................................................................... 84
Results and Discussion ................................................................................ 86
4.3.1 Salt-laden MEG .................................................................................... 87
Conclusions ................................................................................................. 91
Hydrate Phase Equilibria for Methyldiethanolamine and Empirical
Modelling for Prediction ............................................................................................ 92
Introduction ................................................................................................. 93
Methodology ............................................................................................... 94
5.2.1 Materials and Apparatus ...................................................................... 94
5.2.2 Method ................................................................................................. 96
Results ......................................................................................................... 97
5.3.1 Pure MDEA Tests ................................................................................ 98
5.3.2 MEG Tests ......................................................................................... 100
5.3.3 Empirical Modelling .......................................................................... 103
Conclusion ................................................................................................. 109
Thermodynamic Modelling of Hydrate Phase Equilibria of
Methyldiethanolamine.............................................................................................. 110
Introduction ............................................................................................... 111
Methodology ............................................................................................. 113
6.2.1 Experimental Section ......................................................................... 113
6.2.2 Thermodynamic Modelling ................................................................ 115
Results ....................................................................................................... 120
6.3.1 Experimental Phase Equilibria ........................................................... 120
Conclusions ............................................................................................... 124
Effect of Corrosion Inhibitors with Kinetic Hydrate Inhibitor on Gas
Hydrate, and Empirical Modelling of MEG Degradation ........................................ 125
Introduction ............................................................................................... 126
Methodology ............................................................................................. 128
XII
7.2.1 Materials & Apparatus ....................................................................... 128
7.2.2 Isochoric Method ............................................................................... 129
7.2.3 Isothermal method .............................................................................. 131
Results and Discussion .............................................................................. 132
7.3.1 FFCI and FFCI + MEG mixtures ....................................................... 132
7.3.2 KHI Mixtures ..................................................................................... 135
7.3.3 Empirical Modelling .......................................................................... 139
7.3.3.1 Model Validation ........................................................................ 142
Conclusion ................................................................................................. 146
Effect of Dissolved Oxygen, Sodium Bisulfite, and Oxygen Scavengers
on Methane Hydrate Inhibition ................................................................................ 148
Introduction ............................................................................................... 149
Experimental Methodology ....................................................................... 150
8.2.1 Materials and Chemicals .................................................................... 150
8.2.2 Test Apparatus and Experimental Procedure ..................................... 152
Results ....................................................................................................... 153
8.3.1 Effect of Dissolved Oxygen ............................................................... 154
8.3.2 Effect of Sodium Bisulfite ................................................................. 155
8.3.3 Effect of Proprietary Oxygen Scavenger (OS-P) ............................... 159
8.3.4 Effect of Nonsulfite-Based Oxygen Scavenger (IFEox2) .................. 160
Conclusions ............................................................................................... 161
Hydrate Phase Equilibria of Phosphonate Scale Inhibitors, Amines, and
Ethylene Glycol ........................................................................................................ 163
Introduction ............................................................................................... 164
Methodology ............................................................................................. 165
9.2.1 Materials ............................................................................................. 165
9.2.2 Experimental Method ......................................................................... 166
Results ....................................................................................................... 168

XIII
9.3.1 Scale Inhibitors................................................................................... 169
9.3.2 Amines (MEA and DEA) ................................................................... 172
Conclusions ............................................................................................... 174
Utilization of MEG Pilot Plant and MEG Degradation Methods ...... 175
An Innovative Approach to Assessing Gas Hydrate Inhibition and
Corrosion Control Strategies ................................................................................ 176
10.1.1 MEG Operation .................................................................................. 177
10.1.2 Gas Hydrate Testing ........................................................................... 182
10.1.2.1 Flow Assurance Software ........................................................... 182
10.1.2.2 Empirical Modelling ................................................................... 183
10.1.3 Use Cases ........................................................................................... 183
10.1.4 Conclusion ......................................................................................... 185
Degradation and Hydrate Phase Equilibria Measurements of
Monoethylene Glycol ........................................................................................... 186
10.2.1 Method Details ................................................................................... 186
10.2.2 Degradation of MEG .......................................................................... 186
10.2.3 Hydrate Testing of Degraded MEG ................................................... 191
10.2.4 Method Validation ............................................................................. 193
10.2.5 Conclusion ......................................................................................... 195
Summary and Conclusions ................................................................. 197
Further Research Potential ..................................................................... 200
BIBLIOGRAPHY .................................................................................................... 201
APPENDICES ......................................................................................................... 221
APPENDIX A. Outline of Algorithm, and MDEA Data ..................................... 221
APPENDIX B. Computer Script to Process Test Data ........................................ 223
APPENDIX C. Copyright Permission Statements ............................................... 224
APPENDIX D. Statements of Contribution by Others ........................................ 232
XIV
LIST OF FIGURES
Figure 1.1: Publications related to gas hydrates from 1972 to 2019 (data attained from Web of Science).
................................................................................................................................................................ 4
Figure 1.2: Cage shapes formed by water: a) 512 (pentagonal dodecahedron), b) 51262
(tetrakaidecahedron), c) 51264 (hexakaidecahedron), d) 435663 (irregular dodecahedron) and, e) 51268
(icosahedron) (after Sloan Jr and Koh, 2007). ....................................................................................... 5
Figure 1.3: Resulting hydrate structure types based on hydrate formers (guest) size and number of
occupied water cavities (after Giavarini et al., 2011). ............................................................................ 6
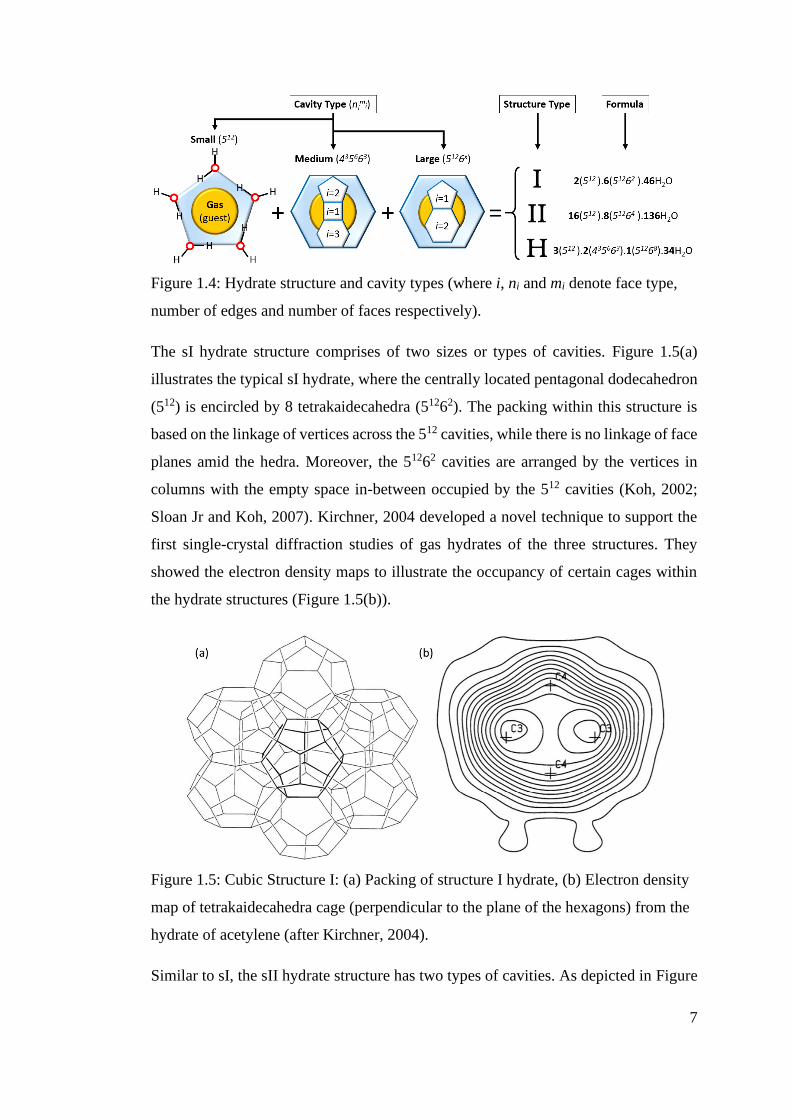
Figure 1.4: Hydrate structure and cavity types (where i, ni and mi denote face type, number of edges and
number of faces respectively). ............................................................................................................... 7
Figure 1.5: Cubic Structure I: (a) Packing of structure I hydrate, (b) Electron density map of
tetrakaidecahedra cage (perpendicular to the plane of the hexagons) from the hydrate of acetylene (after
Kirchner, 2004). ..................................................................................................................................... 7
Figure 1.6: Cubic Structure II: (a) Packing of structure II hydrate, (b) Electron density map of
hexakaidecahedral cage (within the plane of both symmetry axes) from the hydrate of propane (after
Kirchner, 2004). ..................................................................................................................................... 8
Figure 1.7: Hexagonal Structure sH: (a) Packing of structure sH hydrate, (b) Electron density map of
icosahedral cage (top left is along the (1 2 1)-plane while others are perpendicular to the 6-fold axis as
shown) from the hydrate of adamantane and methane (after Kirchner, 2004). ...................................... 8
Figure 1.8: Summary of the labile clustering mechanism (after Sloan Jr and Koh, 2007). .................. 10
Figure 1.9: Labile cluster growth enacted on a pressure and temperature trace (after Sloan Jr and Koh,
2007). ................................................................................................................................................... 11
Figure 1.10: a) Formation of hydrate: consumption of gas vs time, b) Pressure and temperature trace for
methane hydrate (after Sloan Jr and Koh, 2007). ................................................................................. 12
Figure 1.11: The two means by which a hydrate solid can cause pipeline rupture: (a) high velocity and
momentum impact at bend, and (b) momentum impact combined with gas compression pipe obstruction
(after Sloan 2007). ................................................................................................................................ 21
Figure 1.12: MEG Regeneration pilot plant at the Curtin University – CCEIC. .................................. 25
Figure 1.13: MEG reclamation unit (rotary evaporator) at the MEG pilot plant. ................................. 26
Figure 1.14: PVT cell capable of hydrate testing at high-pressures. .................................................... 26
Figure 1.15: Thesis structure illustrated. .............................................................................................. 30
Figure 2.1: Schematic of the PVT Sapphire cell where P and T denote pressure and temperature
respectively. ......................................................................................................................................... 36
Figure 2.2: Observations of foaming due to MDEA, and coloration in cycles 1, 5, and 9 as compared to
pure MEG. ............................................................................................................................................ 40
Figure 2.3: Observable stages of hydrate testing of cycled MEG. ....................................................... 41
Figure 2.4: Hydrate profile for methane and water mixture from this study compared to simulation
software (average absolute deviation of 1.64%) and literature (1.80%). ............................................. 42
Figure 2.5: Hydrate profile for methane and 20 wt% MEG solution. .................................................. 43

XV
Figure 2.6: Methane hydrate phase profiles for pure MEG (20 wt%) and cycles 1–9, dotted lines refer
to exponential fitting curves. ................................................................................................................ 44
Figure 2.7: Acetic Acid concentration (ppm) of cycles 1-9. ................................................................ 46
Figure 2.8: Dissolved oxygen levels (ppb) within the reclaimed MEG solution for each cycle. ......... 48
Figure 2.9: Temperature of the liquid and vapor phases within the reclamation unit over 9 cycles (sensor
accuracy of ±0.03 °C). .......................................................................................................................... 48
Figure 2.10: MDEA concentration (mM) in samples of cycles 1-9. .................................................... 49
Figure 2.11: P versus T-Hydrate Equilibrium Shift (ΔT0–9). ................................................................ 50
Figure 3.1: Experimental setup (bench-scale MEG regeneration/reclamation pilot plant). ................. 57
Figure 3.2: PVT sapphire cell used for gas hydrate testing. ................................................................. 57
Figure 3.3: Material balance for the MEG pilot plant operation (cycle time of ∼10 h). ...................... 62
Figure 3.4: Target pH compared to actual pH in the lean glycol tank (LGT) and feed blender (FB). . 64
Figure 3.5: Actual and target MDEA and FFCI concentrations as a function of time. ........................ 65
Figure 3.6: Electrical conductivity (EC) of post-reboiler and reclaimed MEG solutions. ................... 66
Figure 3.7: pH and MDEA concentration in post-reboiler and reclaimed MEG solutions as a function
of time. ................................................................................................................................................. 67
Figure 3.8: pH and FFCI concentration in post-reboiler and reclaimed MEG solutions as a function of
time. ..................................................................................................................................................... 69
Figure 3.9: Physical and colour changes in salt slurry from the reclamation unit with and without FFCI.
.............................................................................................................................................................. 69
Figure 3.10: pH and acetic acid concentration in post-reboiler and reclaimed MEG solutions as a
function of time. ................................................................................................................................... 71
Figure 3.11: Methane hydrate phase boundary for 30 wt% MEG solution compared with Multiflash
prediction and literature (Haghighi et al., 2009b; Robinson and Ng, 1986; Vajari, 2012). .................. 73
Figure 3.12: Natural gas hydrate phase boundaries for reclaimed MEG samples A-C. ....................... 76
Figure 3.13: Hydrate metastable region for reclaimed MEG sample A. .............................................. 77
Figure 3.14: Hydrate metastable region for reclaimed MEG sample B. .............................................. 78
Figure 3.15: Hydrate metastable region for reclaimed MEG sample C. .............................................. 79
Figure 4.1: Basic schematic of the experimental apparatus utilized in this study including the PVT cell.
.............................................................................................................................................................. 86
Figure 4.2: Methane hydrate phase boundary of pure water compared to literature and software. ...... 87
Figure 4.3: Hydrate phase boundaries for non-degraded and degraded MEG samples compared to
HYSYS prediction. .............................................................................................................................. 88
Figure 4.4: Gradual formation of methane hydrate in solution. ........................................................... 89
Figure 4.5: Change in colour between non-degraded and degraded MEG samples. ............................ 91
Figure 5.1: Schematic of the high-pressure PVT sapphire cell used in this study which is capable of
performing hydrate inhibition testing. .................................................................................................. 96
Figure 5.2: Methane hydrate phase boundaries for pure water and pure MEG (20 wt%) as compared to
literature and software predictions. ...................................................................................................... 98
Figure 5.3: Methane hydrate phase boundaries for pure MDEA (2.5–7.5 wt%) and their equivalent MEG

XVI
concentrations using Multiflash. ........................................................................................................ 100
Figure 5.4: Stages of hydrate testing in MEG–MDEA (2.5 and 7.5 wt%) mixtures. ......................... 101
Figure 5.5: Measured and simulated phase boundaries for combined 20 wt% MEG with MDEA (2.5
and 7.5 wt%). ..................................................................................................................................... 103
Figure 5.6: Pressure versus ΔT7.5, hydrate equilibrium temperature shift for between water and pure
MDEA at 7.5 wt%. ............................................................................................................................. 105
Figure 5.7: Comparison of predicted to experimental data for MDEA and MEG mixtures from this
study. .................................................................................................................................................. 107
Figure 5.8: Comparison of predicted to experimental data for MDEA solutions from literature. ...... 107
Figure 6.1: Hydrate phase diagram showing hydrate-free regions of quaternary mixture of water–
methane–MEG–MDEA. ..................................................................................................................... 112
Figure 6.2: Schematic of the experimental apparatus used in this study. ........................................... 114
Figure 6.3: Methane hydrate equilibria for MDEA (3.5 wt%). The MDEA molecular structure is shown,
where red = oxygen, blue = nitrogen, white = hydrogen, and grey = carbon. .................................... 121
Figure 6.4: Methane hydrate equilibria for MDEA (3.5 wt%) combined with MEG (25 wt%). The
MDEA and MEG molecular structures are shown, where red = oxygen, blue = nitrogen, white =
hydrogen, and grey = carbon. ............................................................................................................. 122
Figure 6.5: Comparison of model calculation to MDEA hydrate phase equilibria data from Akhfash et
al. 2017. .............................................................................................................................................. 123
Figure 6.6: Comparison of model calculation to MDEA phase equilibria data from Alef et al. (2018).
............................................................................................................................................................ 124
Figure 7.1: The apparatus used for solution preparation, and hydrate testing using a high-pressure PVT
cell in this study. P1 denotes cell pressure, while T1, T2, T3 denote temperatures of vapor phase, liquid
phase and air bath respectively. .......................................................................................................... 129
Figure 7.2: Pressure-temperature curves for the cooling and heating stages of the isochoric method for
20 wt% MEG solution. Methane hydrate phase boundary simulated in Multiflash is plotted as a dashed
curve. .................................................................................................................................................. 130
Figure 7.3: Methane hydrate phase boundaries for aqueous FFCI (0.5, 3 and 4 wt%) and their equivalent
MEG concentration using Multiflash. ................................................................................................ 134
Figure 7.4: Hydrate phase boundary for the combined mixture of 3 wt% FFCI with 20 wt% MEG
compared with a 20 wt% MEG only solution. ................................................................................... 135
Figure 7.5: Stages of hydrate testing of KHI in the presence of MDEA and FFCI. ........................... 136
Figure 7.6: Pressure drop curves against time for KHI with MDEA and FFCI in memory water. .... 137
Figure 7.7: Induction and growth times for KHI with/without MDEA and FFCI. ............................. 137
Figure 7.8: Hydrate equilibrium temperature shift for MEG and MDEA + MEG degraded solutions.
............................................................................................................................................................ 142
Figure 7.9: Comparison of calculations using model compared to experimental data for MDEA solutions
exposed to 165 °C and 180 °C. ........................................................................................................... 143
Figure 7.10: Comparison of calculations using model compared to experimental data for MDEA + MEG
solutions exposed to 135, 165, 185 and 200 °C. ................................................................................ 144

XVII
Figure 7.11: The algorithm to determine equilibrium temperature of aqueous MDEA, and MDEA +
MEG solutions at varying concentrations. ......................................................................................... 146
Figure 8.1: Schematic of the test apparatus used for the preparation of MEG/oxygen scavenger
solutions. ............................................................................................................................................ 152
Figure 8.2: Methane hydrate phase boundary for 20 wt% MEG + 80 wt% water solution. ............... 154
Figure 8.3: Hydrate phase boundaries of 20 wt% MEG solution with low (<20 ppb) and high (>7500
ppb) oxygen content. .......................................................................................................................... 155
Figure 8.4: Hydrate phase boundaries for aqueous NaHSO3 solutions. ............................................. 157
Figure 8.5: Hydrate phase boundaries for aqueous NaHSO3 + MEG solutions. ................................ 159
Figure 8.6: Hydrate phase boundary of proprietary oxygen scavenger, OS-P (0.025 wt%) in 20 wt%
MEG solution. .................................................................................................................................... 160
Figure 8.7: Hydrate phase boundary of IFEox2 (0.01 wt%) in 20 wt% MEG solution. .................... 161
Figure 8.8: Conversion of erythorbic acid to erythorbate salt by neutralization reaction by DEAE. . 161
Figure 9.1: High-pressure PVT cell used in this study for performing hydrate inhibition testing. .... 167
Figure 9.2: Hydrate phase boundary for pure MEG (5 wt%) compared to software predictions. ...... 169
Figure 9.3: Hydrate phase boundaries for scale inhibitors (IDMP, NTMP, and DTPMP) at 35 ppm
compared pure water. ......................................................................................................................... 171
Figure 9.4: Hydrate phase boundaries for scale inhibitors (IDMP, NTMP, and DTPMP) at 350 ppm
compared pure water. ......................................................................................................................... 171
Figure 9.5: Hydrate phase boundaries of MEA, DEA, and MEG at 5 wt% as compared to pure water.
............................................................................................................................................................ 172
Figure 9.6: Hydrate phase boundaries for MEA and DEA at 5 wt% and their equivalent MEG
concentrations using Multiflash. ........................................................................................................ 173
Figure 10.1: Simulation of field formation water. .............................................................................. 178
Figure 10.2: Simulation of pipeline conditions to create contaminated MEG solution. ..................... 179
Figure 10.3: Contaminated MEG going through pre-treatment to remove insoluble contaminants. .. 180
Figure 10.4: MEG from CMT arrives at the reboiler and distillation (RBD) where water is removed thus
increasing MEG concentration. .......................................................................................................... 181
Figure 10.5: The MEG reclamation unit (MRU) removes soluble contaminants from the incoming MEG
solution. .............................................................................................................................................. 182
Figure 10.6: Basic schematic of a high-pressure PVT cell apparatus capable of gas hydrate testing. 182
Figure 10.7: Example of interpolation of a gas hydrate profile shift, showing multiple concentrations.
............................................................................................................................................................ 183
Figure 10.8: Schematic for the suggested experimental set-up of the reclamation unit. .................... 188
Figure 10.9: Schematic for the preparation of the test solution and autoclave set. ............................ 191
Figure 10.10: Schematic of experimental set-up for hydrate testing using PVT Cell. ....................... 192
Figure 10.11: Comparison of degraded MEG with fresh MEG, and literature comparison of methane-
water hydrate. ..................................................................................................................................... 195
Figure A-1: Outline of the algorithm to predict equilibrium temperature of pure MDEA, and MEG-
MDEA solutions at MDEA concentrations of 0 – 7.5 wt%. .............................................................. 222

XVIII
LIST OF TABLES
Table 1.1: Thesis objectives and peer-reviewed publications corresponding to each chapter. ............ 29
Table 2.1: Top-up cost due to MEG recovery losses and degradation. ................................................ 32
Table 2.2: Pure MEG composition from chem-supply......................................................................... 37
Table 2.3: Hydrate equilibrium temperature shift (ΔTs) of cycles 1, 5 and 9 compared to pure MEG
hydrate profile and the regression functions of the fitted data. ab ......................................................... 44
Table 2.4: Hydrate Equilibrium Temperature shift (ΔTs) from Pure MEG hydrate profile (cycles 2, 3, 4,
6, 7, 8).a ................................................................................................................................................ 45
Table 2.5: Constants for Eqns. (2.3) and (2.6). .................................................................................... 51
Table 2.6: Model calculations versus raw data. ................................................................................... 52
Table 3.1: Fluid compositions (brine/formation water, rich MEG, and lean MEG). ........................... 59
Table 3.2: The composition of natural gas used in this study. ............................................................. 60
Table 3.3: Target concentrations of FFCI and MDEA. ........................................................................ 62
Table 3.4: Phase equilibrium data for 30 wt% MEG solution compared with Multiflash prediction and
literature. .............................................................................................................................................. 72
Table 3.5: Hydrate formation and dissociation (equilibria) data from this study.a ............................... 73
Table 3.6: Reclaimed MEG samples (A-C) compositions, regression functions, and metastable regions.
.............................................................................................................................................................. 75
Table 4.1: Salt-laden MEG solution composition. ............................................................................... 85
Table 4.2: Materials utilized in this study. ........................................................................................... 86
Table 4.3: Methane equilibria data of this study with relative temperature shifts. ............................... 88
Table 5.1: List of materials used in the experiments. ........................................................................... 95
Table 5.2: Experimental matrix of hydrate inhibition tests conducted using the isochoric method. .... 97
Table 5.3: Equilibria data for pure water and pure MDEA samples measured in this study.a .............. 99
Table 5.4: New methane hydrate phase equilibria data for 20 wt% MEG/water–MDEA mixture.a .. 103
Table 5.5: Constants used in Eqn. (5.6) for pure MDEA and MEG–MDEA mixtures. ..................... 106
Table 5.6: Statistical comparison of model and experimental data.a .................................................. 108
Table 6.1: Materials and their properties used in this study.a ............................................................. 115
Table 6.2: Parameters for the associating compounds in this study to be used in the CPA EoS. ....... 117
Table 6.3: Optimized values for interaction parameter kij for MEG and MDEA with non-associating
compounds.a ....................................................................................................................................... 117
Table 6.4: Coefficients for optimized interaction parameters for water–MEG, water–MDEA, and MEG–
MDEA mixtures. ................................................................................................................................ 118
Table 6.5: AARE of model and experimental methane hydrate phase equilibria data for MDEA and
MEG.a ................................................................................................................................................. 121
Table 6.6: Comparison of published data with the proposed model. ................................................. 123
Table 7.1: Experimental matrix for tests using the isochoric hydrate testing method. ....................... 131
Table 7.2: The experimental matrix of hydrate inhibition tests conducted using the isothermal method.
............................................................................................................................................................ 132

XIX
Table 7.3: Equilibria data for pure FFCI solutions and MEG mixture measured in this study.a ........ 133
Table 7.4: Experimental data for KHI, MDEA and FFCI solutions under a sub-cooling of ~10 °C.ab
............................................................................................................................................................ 139
Table 7.5: Constants to be used in Eqn. (7.7) for aqueous MEG and MDEA + MEG mixtures. ....... 142
Table 7.6: Calculations using model compared to experimental data for MEG and MDEA + MEG
mixtures from literature. ..................................................................................................................... 145
Table 8.1: Materials utilized in this study. ......................................................................................... 151
Table 8.2: Composition of the oxygen scavenger developed by Kundu and Seiersten (2017). ......... 151
Table 8.3: Oxygen scavenger dosage in each test solution. ............................................................... 152
Table 8.4: Methane hydrate equilibria data for sodium bisulfite solutions.a ...................................... 156
Table 9.1: List of chemicals utilized in this study. ............................................................................. 166
Table 9.2: Experimental test matrix and chemical structures. ............................................................ 167
Table 9.3: Equilibria data produced in this study for meg, scale inhibitors (IDMP, NTMP, and DTPMP),
and amines (MEA and DEA).a ........................................................................................................... 173
Table 10.1: Experimental data of degraded and non-degraded MEG solutions using reported methods.
............................................................................................................................................................ 194
Table A-1: Effect of MDEA (5 wt%) on MEG (20 wt% and 25 wt%). ............................................. 221

1
Introduction
Background
As the search for alternative energy resources continues and the scarcity of oil
increases, natural gas has increasingly become a favourable alternative which is
available abundantly in various parts of the world. Although natural gas is a non-
renewable resource, it is however, a clean fuel which produces fewer pollutants and
greenhouse gases compared to coal and oil (Jaramillo et al., 2007). The hundreds of
projects around the world for the production, processing, and storage of natural gas are
indicative of the widely spread distribution of this energy resource compared to coal
(Stanek and Białecki, 2014). It is estimated that there are approximately 200 trillion
cubic meters of reserves, which at the current rate of production is sufficient to
continue for 60 years (Holz et al., 2015). Natural gas is primarily utilized for heating
and cooking in the domestic context (Brkić and Tanasković, 2008). Industrially, it is
primarily used for generation of power (Shukla et al., 2009); however, many natural
gas components serve as a feedstock to countless industrial processes including
organic compounds, plastics, and petrochemicals (Ross et al., 1996). Recently, natural
gas has been utilized for the running of transport vehicles such as freight trains, busses,
trucks, and LNG cargo ships (Gazzard, 2008; Kamimura et al., 2006).
On the other hand, there exists numerous flow assurance challenges concerning natural
gas production and transportation (Sloan Jr and Koh, 2007). At any of these stages,
natural gas may come into contact with condensed, production/formation water to form
ice-like structures known as gas hydrates at certain pressures and temperatures leading
to pipeline blockages, pressure build-up, and dangerous projectiles that could rupture
the pipeline (Sloan Jr and Koh, 2007). Especially, in the transportation of gas through
subsea pipelines from wellhead to onshore processing usually provides the typical
conditions of pressure and temperature for the formation of hydrates. Despite the high
cost associated with such events, they may also result in catastrophic consequences
that could cause fatalities and damage to the environment (Camargo et al., 2011;
Englezos, 1993).
The work of Hammerschmidt (1934) was the start of the contemporary era of gas

2
hydrate research. He discovered that the blockage of gas lines at a temperature greater
than the ice formation temperature were due to gas hydrates as opposed to normal ice
formation (Hammerschmidt, 1934). The capability to predict hydrate formation
conditions was another significant development in this field. Katz (1945) and their
team of researchers collated the pressure-temperature data from gas hydrate
experiments that resulted in the formation of hydrates from varying gases given
enough water presence (Katz, 1945).
Gas hydrates are a crystal lattice network made up of common gas components such
as methane to butane, acid gases, and nitrogen encaged by molecules of water (Koh,
2002; Sloan Jr and Koh, 2007). Most gas hydrates can be classified into three types of
structures: 2 cubic and 1 hexagonal (Carroll, 2014; Kirchner et al., 2004; Ripmeester
et al., 1987; Sloan Jr and Koh, 2007). The mechanism of gas hydrate formation is built
based on the theories pertaining to water crystallization (Sloan Jr and Koh, 2007). The
process commences with the nucleation phase which typically happens on the water-
gas interface (Long and Sloan, 1996). Succeeding this phase, the growth of hydrate
begins to occur which is a complicated process (thermodynamic) deeply reliant on
conditions of mass and heat transfer. As for the dissociation of gas hydrates, it is
endothermic and occurs around the hydrate solid (Sloan Jr and Koh, 2007). The
process can be instigated by changing the surrounding pressure and temperature of the
hydrate solid.
The control and prevention of gas hydrates may typically be achieved by chemical
injection, thermal heating, depressurization, dehydration, and water removal (Son and
Wallace, 2000). In terms of chemical injection, a hydrate inhibitor such as MEG as
opposed to methanol is widely employed due to it being the safer, cleaner, and re-
usable (through MEG regeneration) alternative (Brustad et al., 2005). Where MEG is
utilized as part of the hydrate control philosophy for a field, MEG begins its journey
after the wellhead mixing with the produced hydrocarbon, ultimately dropping the
thermodynamic hydrate phase equilibrium to lower temperatures (Son and Wallace
2000). At the onshore arrival facilities, the production fluid is separated and pre-
treated. The aqueous phase comprising of water, MEG, and other chemicals (organic
compounds and salts) are routed to the MEG Regeneration Unit (MRU) for the
removal of salts, water, and contaminants via flash drums (reclamation), reboilers (re-
3
concentration), and distillation columns (Nazzer and Keogh, 2006). Variations of these
processes are dependent on the needs of the project at hand and the minimum allowable
salt limit in the production network (Psarrou et al., 2011; Teixeira et al., 2015). The
resulting clean MEG is then sequentially re-injected after the wellhead to continue the
cycle.
The use of MEG especially in the context of regeneration leads to the challenge of
MEG degradation whether oxidative or thermal. Preliminary research suggests that
MEG undergoes thermal degradation at certain temperatures generating organic acids,
specifically formic and acetic acids (AlHarooni et al., 2015; Rossiter et al., 1985).
However, a gap in the literature that is evident regarding experimentally evaluating the
performance of MEG across the entire MEG loop as well as through multiple
regeneration cycles. Moreover, the lack of modelling of this degradation effect for
hydrate inhibitory performance of MEG.
Literature Review
Hydrates are often referred to as ‘clathrates’, which is a term that some say is derivative
after the Greek term ‘khlatron’ with a connotation suggesting a barrier of some sort,
or from the Latin word ‘clatratus’ meaning latticed or barred (AlHarooni et al., 2017).
Nonetheless, it is indicative of the crystalline nature of hydrates whereby cavities are
formed from surrounding host molecules that effectively encage guest molecules
forming a crystalline inclusion compound (Chatti et al., 2005). The guest molecules
may be classified in four categories: water-soluble acid gases, water-soluble ternary or
quaternary alkylammonium salts, water-soluble polar compounds, and hydrophobic
compounds (Jeffrey and McMullan, 2007). If the compound consists of water, they are
called ‘clathrate hydrates’, and when the encaged guest molecule is gaseous, they are
called ‘gas hydrate’. Within the context of gas hydrates, the encaged gaseous molecule
is referred to as the ‘guest’, while the encaging water molecules (i.e., forming a caged
cavity) are referred to as the ‘host’ (Chatti et al., 2005). Common gases/guests or also
known as ‘hydrate formers’ are methane (C1), ethane (C2), propane (C3), n-butane
(nC4), i-butane (iC4), hydrogen sulphide (H2S), carbon dioxide (CO2), and nitrogen
(N2). The encaging water molecules bond together via dispersion forces holding the
cage structure in place although there are no chemical bonds between the host and
guest molecules (Sloan Jr and Koh, 2007). Structures as such can store a significant

4
amount of gas resulting in upwards of 170 m3 of gas for every 1 m3 of hydrate that is
formed (Sloan Jr and Koh, 2007).
1.2.1 Interest in Gas Hydrates
As of the early 19th century, interest in gas hydrate forming compounds was kick
started with the chlorine hydrate finding made by Sir Humphrey (Davy, 1832). Since
then various discoveries and developments in the chemical nature and properties of
hydrates have been made. However, hydrate forming natural gas hydrocarbons was
merely discovered towards the end of the century (Villard, 1888). Hydrates within
nature, primarily in deep sea sediments and permafrost were discovered fairly recently
(Makogon, 1965). These hydrates have been identified as a source of energy and thus,
more research effort has been put into developing methods of extraction. On the other
hand, with the rise in natural gas production, hydrates are found to be a hindrance to
flow. While hydrate formation may serve beneficial in other areas like waste water and
gas storage, they pose a serious flow assurance risk and thus, many studies have been
conducted to understand hydrate kinetics, hydrate phase equilibria, and prevention
techniques (Hammerschmidt, 1934; Sloan Jr and Koh, 2007). This heightened increase
in research related to gas hydrates is demonstrated in Figure 1.1 (data attained from
Web of Science for topic ‘Gas Hydrates’).
Figure 1.1: Publications related to gas hydrates from 1972 to 2019 (data attained
from Web of Science).

5
1.2.2 Hydrate Structure and Physical Properties
Gas hydrates are essentially a lattice network formed by cages of water that encompass
gas molecules like methane or ethane (Sloan Jr and Koh, 2007). The series of water
cages are held together in place via the hydrogen bonding across molecules of water,
whereby any one molecule either serves as an acceptor or donor of the bonds,
subsequently a 3D network is formed (Kirchner et al., 2004). Water forms five
different cage structures (polyhedra) as illustrated in Figure 1.2, where each cornice
denotes a water molecule. The polyhedral nomenclature description as suggested by
Jeffrey and McMullan (1967) is nim
i, where i, ni and mi denote face type, quantity of
edges, and quantity of faces respectively.
Figure 1.2: Cage shapes formed by water: a) 512 (pentagonal dodecahedron), b) 51262
(tetrakaidecahedron), c) 51264 (hexakaidecahedron), d) 435663 (irregular
dodecahedron) and, e) 51268 (icosahedron) (after Sloan Jr and Koh, 2007).
While there is no chemical bonding amid the water and gaseous molecules, there are
however, van der Waals forces (Kitaigorodsky, 1984). Such forces albeit weak, keep
the hydrate structure intact. The cavities in gas hydrates are found to be expanded
much more than that of ice which is in line with the finding of Rodger (1990), that the
forces maintaining the structure are repulsive as opposed to attractive (Rodger, 1990).
Common gas hydrate structures are categorized into three different structures, sI
(cubic), sII (cubic), and sH (hexagonal). The actual dimensions of the guest or
‘trapped’ molecules encapsulated within the water network lattice defines the hydrate
structure. Figure 1.3 illustrates the varying gas hydrate structures resulting from
numerous gas molecules (Giavarini and Hester, 2011). Methane and ethane guest

6
molecules amidst others that have a van der Waals diameter in the range of 4.2 to 6 Å
will form hydrates of structure I. Hydrates of structure II are formed by guests such as
propane and butane which have a diameter between 6 and 7 Å. While structure H
hydrates are formed from bigger molecules such as pentane and neohexane which have
a diameter in the range of 7 and 9 Å supplemented by smaller molecules (Ripmeester
et al., 1987; Sloan Jr and Koh, 2007). Figure 1.4 illustrates how a basic water cage
propagates into a gas hydrate structure. In this section gas hydrate structures and their
properties are discussed.
Figure 1.3: Resulting hydrate structure types based on hydrate formers (guest) size
and number of occupied water cavities (after Giavarini et al., 2011).
7
Figure 1.4: Hydrate structure and cavity types (where i, ni and mi denote face type,
number of edges and number of faces respectively).
The sI hydrate structure comprises of two sizes or types of cavities. Figure 1.5(a)
illustrates the typical sI hydrate, where the centrally located pentagonal dodecahedron
(512) is encircled by 8 tetrakaidecahedra (51262). The packing within this structure is
based on the linkage of vertices across the 512 cavities, while there is no linkage of face
planes amid the hedra. Moreover, the 51262 cavities are arranged by the vertices in
columns with the empty space in-between occupied by the 512 cavities (Koh, 2002;
Sloan Jr and Koh, 2007). Kirchner, 2004 developed a novel technique to support the
first single-crystal diffraction studies of gas hydrates of the three structures. They
showed the electron density maps to illustrate the occupancy of certain cages within
the hydrate structures (Figure 1.5(b)).
Figure 1.5: Cubic Structure I: (a) Packing of structure I hydrate, (b) Electron density
map of tetrakaidecahedra cage (perpendicular to the plane of the hexagons) from the
hydrate of acetylene (after Kirchner, 2004).
Similar to sI, the sII hydrate structure has two types of cavities. As depicted in Figure

8
1.6, a relatively small 512 cavity is surrounded by a network of diamonds formed from
hexakaidecahedra (51264) cavities of tetrahedral-symmetry. The packing within this
structure is defined such that the 512 cavities share faces in all dimensions while the
space is occupied by bigger hexakaidecahedra types.
Figure 1.6: Cubic Structure II: (a) Packing of structure II hydrate, (b) Electron
density map of hexakaidecahedral cage (within the plane of both symmetry axes)
from the hydrate of propane (after Kirchner, 2004).
The sH hydrate structure is made up of three cavity types (Figure 1.7). It has a centrally
located 51268 (icosahedron) encircled by six 435663 (dodecahedra). The filling within
this structure is via 2-dimensional sharing of faces, whereby smaller cavities (512) are
filled in-between layers of larger cavities of the types 435663 and 51268.
Figure 1.7: Hexagonal Structure sH: (a) Packing of structure sH hydrate, (b) Electron
density map of icosahedral cage (top left is along the (1 2 1)-plane while others are

9
perpendicular to the 6-fold axis as shown) from the hydrate of adamantane and
methane (after Kirchner, 2004).
1.2.3 Hydrate Formation and Dissociation Mechanism
The hydrate formation mechanism can be summarized by two major phases; the phase
of nucleation followed by the growth phase. Nucleation phase is a stochastic process
that can be compared to other growth scenarios involving crystalline growth like that
of salt precipitation (Sloan Jr and Koh, 2007). A vital aspect of these scenarios is that
of supersaturation, whereby the solvent comprises a larger quantity of dissolved solute
than it can ordinarily hold at a certain temperature. The driving force for hydrate
nucleation was identified by Christiansen and Sloan in 1995, to be the total molar
variation in the Gibbs free-energy (Christiansen and Sloan, 1995). Nucleation has two
types; heterogeneous nucleation (HEN) and homogeneous nucleation (HON), where
the difference lies in the existence or absence of impurities (Sloan Jr and Koh, 2007).
HEN takes place in the existence of an interface or foreign body (Kashchiev and
Firoozabadi, 2002; Sloan Jr and Koh, 2007). HON is a rare type which involves a
series of bimolecular collisions leading to sequential cluster formation. Only once the
cluster attains a critical size then sustainable and monotonic growth will occur. Prior
to this stage, the clusters within the metastable/bulk fluid shrink and grow (Sloan Jr
and Koh, 2007). The higher prospect to occur in HEN as compared with HON is
described as the reduction of energy and work required due to the solid surface so that
nucleation can happen (Kashchiev and Firoozabadi, 2002).
Long and Sloan (1996) undertook experiments and found that nucleation of hydrates
occurred at the interface of hydrocarbon and water (Long and Sloan, 1996). Other
researchers established this phenomenon for hydrates of methane and carbon dioxide
(Fujioka et al., 1994; Huo et al., 2001; Kimuro et al., 1993; Mori, 1998; Østergaard et
al., 2001). Molecular Dynamic simulations has confirmed that nucleation sites are
existing at areas of substantial concentration gradient (Moon et al., 2003). Moreover,
the water-hydrocarbon interface where nucleation plus growth happen is specifically
a vapor-liquid interface consisting of a thin layer on both sides of this interface,
although occurrence at other combinations of phases is also possible (Kashchiev and
Firoozabadi, 2002). Two leading reasons are given for why nucleation at the interface
tends to occur is due to the reduction of the Gibbs free-energy association by the

10
interface, and the natural presence of higher molecule concentration of the host and
guests at the interface (Sloan Jr and Koh, 2007).
There exist two theories to explain the mechanism for the nucleation of hydrates: labile
clustering and local structuring. Labile clustering involves labile clusters and is
considered as the earliest mechanism, where labile clusters are defined as units that are
unstable and can undergo change. The theory suggests that labile clusters agglomerate
on any side of the vapour-water interfaces resulting in nucleation (Koh, 2002; Sloan
Jr and Koh, 2007). An overview of labile clustering mechanism is given in Figure 1.8
and Figure 1.9. A local structuring theory was developed at the onset of the discovery
of the thermodynamic nature of labile clusters to disintegrate as opposed to
agglomerate during hydrate experiments involving carbon dioxide (Radhakrishnan
and Trout, 2002). The theory of local structuring begins with the ordering of guest and
water molecules locally in contrast to discrete clusters (Sloan Jr and Koh, 2007).
Figure 1.8: Summary of the labile clustering mechanism (after Sloan Jr and Koh,
2007).

11
Figure 1.9: Labile cluster growth enacted on a pressure and temperature trace (after
Sloan Jr and Koh, 2007).
Gas hydrates develop under specific circumstances; high pressure (typically 25 to 110
bar) and low temperature in the range of ~2 to 12 °C (Koh, 2002). Figure 1.10(a) and
(b) demonstrate the key relationships of hydrate formation such as the
pressure/temperature data and the gas consumption rate. The three stages pertinent to
hydrate formation such as nucleation, growth and dissociation are shown in the
pressure/temperature curve. Point A denotes the opening pressure and temperature
which are within the hydrate-free region. While point B is within the hydrate-
formation region. With the decrease in temperature to that of point B, gas hydrate
formation will commence until the conditions of point C are attained which is where
the critical size of hydrate exists. With the application of heat at point C, the
dissociation of hydrate will commence, and in due course intersect the initial path of
cooling (as denoted by points A to B). This juncture point is considered as the
dissociation pressure and temperature or the hydrate equilibrium point. In terms of the
gas consumption rate, it can be seen to initiate at a slow pace but quickly increase
through the stage of growth, after which it begins to plateau out as the critical hydrate
size is reached (Figure 1.10(a)).

12
Figure 1.10: a) Formation of hydrate: consumption of gas vs time, b) Pressure and
temperature trace for methane hydrate (after Sloan Jr and Koh, 2007).
The growth of hydrates can be likened to crystal growth which is affected by multiple
factors. These factors include the transfer of molecular mass to the crystal, the transfer
of heat from the exothermic reaction involving hydration from the growing crystal,
and the kinetics of the hydrate crystal growth (Sloan Jr and Koh, 2007). Crystal growth
correlations are grounded upon each of the above factors as the growth limiting factor
(Malegaonkar et al., 1997; Skovborg and Rasmussen, 1994; Uchida et al., 1999). The

13
processes of crystal growth are four: single crystal, hydrate film, multiple crystal, and
metastable phase growth. These processes are described below:
• Growth of a single crystal is convenient for the analysis of the hydrate
crystalline structure utilizing neutron diffraction and X-ray methods (Udachin
et al., 2001). This type of growth occurs mainly under lower driving forces and
easier to attain for hydrates of ethylene oxide and tetrahydrofuran as compared
to gas hydrates (Makogon et al., 1997).
• Hydrate film growing at the water-hydrocarbon boundary allows for studying
growth models and mechanisms (Smelik and King, 2015; Taylor, 2007).
• Growth of multiple crystals facilitated by agitation is convenient for studying
gas consumption during growth and determining hydrate kinetics (Bansal,
1994; Skovborg et al., 1993; Turner, 2005).
• Growth of metastable phases during hydrate growth provides valuable insights
into the structural and thermodynamic changes in hydrates. The process can be
achieved through employing Nuclear magnetic resonance (NMR) or X-ray
diffraction and Raman spectroscopy (Sloan Jr and Koh, 2007).
The gas hydrate dissociation is an endothermic process such that energy is essential to
separate the hydrogen bonding among water molecules, and the weak van der Waals
forces across the water and gaseous molecules. This will begin to separate the crystal
network lattice into smaller constituents (Sloan Jr and Koh, 2007). Some methods to
dissociate hydrate plugs are thermal stimulation, de-pressurization, and treatment with
a chemical inhibitor (Davies et al., 2006; Peters et al., 2000; Sloan Jr and Koh, 2007).
An important aspect of gas hydrate prevention and control within process equipment
and gas pipelines is thoroughly understanding equilibrium conditions and dissociation
of gas hydrates (Li et al., 2006). In the case of thermal stimulation, the hydrate solid
phase begins to break down producing tiny cavities allowing pockets of gas to be
released while their corresponding host water molecules form a thin liquid film. This
eventuates until the hydrate structure is completely transformed into the liquid phase
(Smith et al., 2015).

14
1.2.4 Hydrate Phase Equilibria Modelling
Understanding the thermodynamics of gas hydrates will allow for prediction of hydrate
formation conditions (Zele et al., 1999). Numerous methods and models incorporating
equation of states and thermodynamics have been suggested in literature, but all have
a degree of uncertainty, especially at high pressure ranges (Saeedi Dehaghani and
Badizad, 2017). In the early 1950s, the water clathrate crystal structures and properties
were determined (Barrer and Stuart, 1957), after which more rigorous predictions
could be conceptualized for the equilibria of macroscopic properties based on the
microscopic properties. It was recognized that hydrates have discrete cavities which
enclose at least one guest particle. This allowed for statistical means to be used to
depict the distribution of guest particles within the hydrate structure (Sloan Jr and Koh,
2007).
An initial statistical thermodynamic model was developed by Barrer and Stuart in
1957, to predict the properties of clathrate phases of water (Barrer and Stuart, 1957).
In 1958, van der Waals and Platteeuw developed the initial well-based thermodynamic
study to determine the hydrate equilibrium conditions. They used a partition function
to illustrate the stability of the clathrate complex (Platteeuw and Waals, 1958).
A method with high accuracy was founded by van der Waals and Platteeuw in the year
1959. The van der Waals and Platteeuw (vdW-P) model derives the gas hydrate
thermodynamic properties utilizing a simple statistics-based method, which assumes
that a sphere-shaped cage formed by water molecules entrapping a gaseous molecule.
The vdW-P model is comparable to the model of Langmuir for gas adsorption, where
it is assumed that the encaged gas molecule’s internal partition functions are equivalent
to that of an ideal gas (Parrish and Prausnitz, 1972). The model predicts pressure and
temperature by means of microscopic properties (i.e., intermolecular potentials). The
affinity due to the occupation of a lattice cavity by a gas molecule is described by
Langmuir constants (Lee and Holder, 2002). Langmuir constants are obtained by
applying the cell theory of Lennard-Jones-Devonshire accounting for the interactions
across the surrounding water molecules and the trapped gas molecule (Sloan Jr and
Koh, 2007). vdW-P assumes that the hydrate cavities can only occupy a single gas
(guest) compound whereby the trapped molecules are sufficiently small and will not
distort the cavity structure, interactions between trapped molecules are negligible and

15
the cell potential is spherical symmetry (Van der Waals, 1959). The model acts as a
reasonable compromise concerning accuracy and simplicity for the calculation of
hydrate forming conditions. However, it has limitations in many practical applications
due to its assumptions (Martin 2010).
McKoy and Sinanoglu (1963) further developed the vdW-P model, by using various
intermolecular potentials, such as the Kihara potential instead of Lennard-Jones. They
determined the pressure of hydrate dissociation for polyatomic gases and compared it
to experimental data. The results based on Kihara potentials were more accurate than
both the Lennard-Jones 12-6 and 28-7 potentials (McKoy and Sinanoğlu, 1963). The
28-7 potential gave the least satisfactory agreement with experimental data, and the
12-6 gave satisfactory results for molecules of monoatomic gases and CH4 (Byk and
Fomina, 1968). The Kihara core potential was deemed better at predicting the
dissociation pressures of non-spherical, rodlike molecules (McKoy and Sinanoğlu,
1963), and thus the use of Kihara potentials have been predominate until now
(Dehaghani and Karami, 2018). Child (1964) performed similar work to McKoy and
Sinanoglu using the Kihara potential (Child, 1964; Sloan Jr and Koh, 2007). Nagata
and Kobayashi (1966) also determined the Kihara potential to be superior to Lenard-
Jones for predicting the dissociation pressures for methane and nitrogen hydrates,
taking into consideration the shape and size of the encaged molecule, as well as
assuming that trapped molecules rotate freely within the cavity (Nagata and
Kobayashi, 1966).
Subsequently, Parrish and Prausnitz (1972) generalized vdW-P to create a systematic
approach for the calculation of hydrate-gas equilibrium conditions within multi-
component systems (Lee and Holder, 2002; Parrish and Prausnitz, 1972). The vdW-P
theory was applied to all natural gases and mixed hydrates, including combinations of
hydrate formers and non-hydrate formers, using the Kihara (spherical core) potential.
Satisfactory agreement was found between predicted and experimental dissociation
pressures (Parrish and Prausnitz, 1972). John and co-workers (1985) amended vdW-P
by addressing deviation in Langmuir constants from ideal (smooth cell) values by
developing a corresponding states prediction relationship (John et al., 1985). This
paved the way for Kihara parameters to be attained through virial coefficient data
(which describes guest-host interaction) rather than using the potential parameters

16
from experimental “fitting” parameters (Lee and Holder, 2002).
A further modification of the vdW-P model was given by Zele and co-workers (1999),
who theorized that guest molecules may affect the host to host interactions in the
crystal lattice, which opposes an assumption of vdW-P (Lee and Holder, 2002). They
performed a series of molecular dynamic simulations to analyze the effect of guest size
upon the lattice structure. They concluded that the stretching of the lattice owing to the
existence of guest molecules may have a substantial effect upon the thermodynamic
parameters of hydrate equilibrium. Consequently, they developed a thermodynamic
model that considers the stretching of the lattice owing to the guest molecule size to
improve the original assumptions in the vdW-P model. The model uses a reference
chemical potential to determine the guest-dependent difference and is suitable for
calculating hydrate equilibria for single and multi-component gases (Zele et al., 1999).
In a different work, Lee and Holder (2002) developed a model from the work by
Holder and John (1985) which also considers the distortion of the lattice by encaged
guest molecules. A guest-dependant chemical potential difference was used with
Kihara parameters from virial coefficient data to predict the equilibrium hydrate
conditions for various hydrate-forming species (Lee and Holder, 2002).
Ballard and Sloan (2002) extended an existing hydrate fugacity model vdW-P, which
used statistical thermodynamics (Van der Waals, 1959) alongside classical
thermodynamics (Parrish and Prausnitz, 1972). Predictions made by the existing
model were accurate at moderate temperatures and pressures, yet large deviations were
found to exist at higher pressures (P > 200 bar). This implied that the definition of the
standard hydrate state or empty lattice required work. Alterations were formulated to
better describe the standard hydrate state and by establishing an activity coefficient
from the exact volume of hydrate (Ballard and Sloan Jr, 2002).
More recently, modern correction methods of vdW-P attempt to rectify its inaccuracies
at high pressures. ab initio quantum mechanical corrections are often implemented to
determine potentials amongst molecules and atoms in hydrates (Sloan Jr and Koh,
2007). Cao et al. (2002), Klauda and Sandler (2003) and Anderson et al. (2005) did
significant works on this topic (Anderson et al., 2005; Cao et al., 2002; Klauda and
Sandler, 2003). A fugacity-based method was developed by Klauda and Sandler
instead of using chemical potential to model hydrate phase behaviour (Klauda and

17
Sandler, 2003). Bandyopadhyay and Klauda improved the model based on fugacity in
2011 to use the Predictive Soave-Redlich-Kwong (PSRK) equation for defining those
phases which are in equilibrium with hydrates (Bandyopadhyay and Klauda, 2011).
Another modern method is the process of matching existing phase equilibria
(macroscopic) and spectroscopic (microscopic) data to an improved vdW-P theory
(Sloan Jr and Koh, 2007).
Of late, Hsieh et al. (2012) proposed a new pressure-temperature dependant Langmuir
absorption constant, calculated by applying the square-well (SW) potential. A
disadvantage of using the SW cell-potential over the more complicated cell potentials
such as Lennard-Jones and Kihara is its inability to represent guest-water interaction
in a wide range of conditions. Hsieh et al. (2012) compensated for this by using an
empirical expression to consider the compression and distortion of the lattice in the
free volume of the guest at increased pressures (Hsieh et al., 2012). Chin et al. (2013)
stretched the work of Hsieh et al., by proposing a model which can be used for hydrates
of natural or synthetic gas with numerous additives, including electrolytes and organic
inhibitors (Chin et al., 2013).
Although there is a strong agreement of the reliability of vdW-P model, there is
disagreement when it comes to choosing a model for determining the equilibrium state
of the fluid phases. To take into account the equilibrium of coexisting fluid phases,
several predictions have been developed to supplement the vdW-P model with proper
EoS and / or activity coefficients. Youssef, et al. (2010) used vdW-P linked with the
Cubic Plus Association (CPA) equation of state to calculate phase equilibria for
systems void of an aqueous phase (Youssef et al., 2010). The Electrolyte Cubic
Square-Well (eCSW) equation of state joined with vdW-P, was used by Haghtalab et
al. (2012) to calculate the hydrate equilibrium conditions for numerous gases from
methane to i-butane, nitrogen, and carbon dioxide. The eCSW equation of state
comprises of two electrolyte terms and one non-electrolyte term, and is developed
from the molar residual Helmholtz free energy (Haghtalab et al., 2012). In another
study, Khosravani and Varaminian (2012) used Soave-Redlich-Kwong (SRK) and
Valderrama variation of Patel-Teja (VPT) with CPA equation of state for modelling
the liquid and vapour phases, in conjunction with vdW-P statistical method for the
hydrate phase. They optimized the predictions of the Kihara potential and binary

18
interaction parameters by using two-phase equilibria data (V-LW-H) (Karamoddin and
Varaminian, 2013). Recently, El Meragawi, et al. (2016) used the Peng-Robinson (PR)
equation of state with the Perturbed-Chain Statistical Associating Fluid Theory (PC-
SAFT) along with vdW-P. Experimental data was utilized to optimize the parameters
of the Kihara potential for increasing the degree of accurateness in calculating the
hydrate equilibrium pressure. The outcome of this study was the decision that the PR
model produced improved prediction performance (El Meragawi et al., 2016).
Following the development of hydrate formation thermodynamic models, computer
simulation software were established for the calculation of hydrate phase equilibria.
For example, Bishnoi et al. (1989) extended vdW-P model to flash programs (Bishnoi
et al., 1989). These prediction software serve as powerful tools when investigating the
hydrate phenomena. There are a number of commercial hydrate prediction programs
available to date, such as CSMGEM, Multiflash, PVTSim and HYSYS (Ballard and
Sloan, 2004; Khan et al., 2018). Accurate predictions of hydrate phase behaviour are
essential to both the design and operation of natural gas processing facilities (Khan et
al., 2018).
1.2.5 Hydrate Inhibition
Given the grave risks of hydrate formation within gas production and transportation,
substantial research has been focused on the testing, development and application of
innovative methods for gas hydrate inhibition (Cha et al., 2013; Heidaryan et al., 2010;
Kelland, 2006). Adopting operating conditions such as low temperatures or high
flowrates to avoid the hydrate formation region (as indicated in a typical pressure-
temperature diagram) is often unfeasible, hence other hydrate prevention methods are
required to be applied (Son and Wallace, 2000).
Typical hydrate control and prevention methods may include dehydration whereby
water is removed from the production fluid, and injecting chemical hydrate inhibiting
agents like monoethylene glycol (MEG) or methanol (Brustad et al., 2005; Son and
Wallace, 2000). Since water is a key requirement for hydrate formation, eliminating it
decreases hydrate formation risk. The dehydration method is highly popular and an
economical approach in predominantly wet gas production fields due to the large
quantity of inhibitor would otherwise be required. While for many fields where the

19
water production rate is variable, the injection of hydrate inhibitors seems more
economical and practical. The two major classifications of hydrate inhibitors are
known as thermodynamic hydrate inhibitors (THI) and low dosage hydrate inhibitors
(LDHI).
There are two primary types of THI, which are glycols and alcohols. The central
principle owing to their capability of hydrate inhibition is the change in the hydrate
phase boundary or equilibrium conditions to an extent whereby process operating
conditions can be made to become within a hydrate-free area (Grzelak and Stenhaug,
2016). Glycols and alcohols such as methanol and MEG comprise of hydroxyl groups
that strive for hydrogen bonding between molecules of water. This in turn, limits the
water-water bonding that can entrap gas molecules thus limiting the formation of
hydrate structures (Kvamme et al., 2005). The performance of various THIs can be
assessed through the capacity at which the chemical can decrease the hydrate
equilibrium point (Kelland et al., 2000).
The idea of LDHIs was born out of the discovery that certain fish avoided freezing in
sub-zero temperatures due to the secretion of a protein that stopped ice formation
(Franks et al., 1987; Knott, 2001; Mehta et al., 2002). LDHIs are classified into two
types: kinetic hydrate inhibitor (KHI) and anti-agglomerate (AA). KHIs are utilized in
very small dosages (0.5 to 2 wt%) as opposed to THIs, and typically comprise of water
soluble polymers (Kelland, 2006; Sloan Jr and Koh, 2007). They affect the time
dependent processes of hydrate formation such as nucleation and growth (Grzelak and
Stenhaug, 2016). AAs deter the advanced growth of hydrate nuclei by stopping the
combining of hydrate structures. Although, they don’t prevent the initial hydrate
formation and growth, they can however, prevent hydrate structures from plugging a
pipeline (Mehta et al., 2002).
There are several major methods to remediate gas hydrate plugs within pipelines
(Sloan Jr and Koh, 2007). These methods include:
i. Depressurization – this method can be considered as the most practical,
common, and safest (Peters et al., 2000; Sloan Jr and Koh, 2007). The method
works by reducing the pressure of the pipeline such that the hydrate phase
equilibrium boundary is shifted thereby reducing the hydrate dissociation

20
temperature allowing for heat transfer radially and subsequent dissociation of
the hydrate solid (Carson and Katz, 1942). Certain pipeline bathymetry can
render this method useless due to the liquid head being greater than the hydrate
plug dissociation pressure (Sloan Jr and Koh, 2007). A safe application of this
method shall apply depressurization to both sides of the hydrate plug to reduce
the risk of a dangerous projectile and pipeline rupture as illustrated in Figure
1.11 (Davies et al., 2006; Peters et al., 2000; Sloan Jr and Koh, 2007).
ii. Thermal Stimulation – if depressurization method is inadequate for
dissociating the hydrate plug, then direct heating to the pipeline can be applied
(Davies et al., 2006). The method may be applied to avert hydrate formation
from occurring in the first place by sustaining higher pipeline temperature than
the formation temperature of gas hydrate (Loken et al., 1998; Urdahl et al.,
2003). As the plug dissociates, trapped gas is released which increases the
pressure, and thus, to avoid the risk of over-pressurization, gas should be
vented appropriately (Davies et al., 2006; Koh et al., 2011).
iii. Chemical Injection – injecting chemicals that produce heat from reaction or
hydrate inhibitors (Freitas et al., 2002; Sloan Jr and Koh, 2007). Anti-
agglomerates, for instance, work to stop the agglomeration of hydrate solids to
form plugs while allowing fluid to flow (Koh et al., 2011).
iv. Mechanical – if accessible, mechanically breaking up the hydrate plug by
drilling or other means (Koh et al., 2011; Sloan Jr and Koh, 2007).

21
Figure 1.11: The two means by which a hydrate solid can cause pipeline rupture: (a)
high velocity and momentum impact at bend, and (b) momentum impact combined
with gas compression pipe obstruction (after Sloan 2007).
1.2.6 Regeneration and Reclamation of MEG
MEG is currently preferred in the industry as opposed to other inhibitors like methanol.
This preference of MEG is expressed through the numerous projects using MEG
worldwide including Gorgon and Wheatstone of Chevron, Australia; Britannia
Satellites of ConoccoPhilips, UK; Ormen Lange of Norsk Hydro, Norway; and South
Pars of Total, Iran (Brustad et al., 2005). MEG is favoured over methanol due to the
following reasons:
• Stability of MEG is due to its high boiling and flash points of 198 °C and 110
ºC respectively, hence the loss to the vapour phase is minimal (Blackman and
Gahan, 2014; Brustad et al., 2005).
• Methanol has high flammability (11 ºC) and burns with an invisible flame
making it difficult to detect its fire (Brustad et al., 2005). While MEG is non-
flammable, and thus is preferred due to the additional safety in handling,
storage, and transport (AlHarooni et al., 2015).
• MEG has a lower environmental impact than MeOH (Brustad et al., 2005;
Chapoy and Tohidi, 2012).
• MEG solubility in final hydrocarbon products is much lower than Methanol
and thus avoids hefty financial penalties (Nazzer and Keogh, 2006).
• Recyclability of MEG is achievable with high efficiency (Chapoy and Tohidi,
2012).
The recovery and subsequent re-use of MEG is essential to sustain an economical and
environmentally friendly process since high MEG injection rates are needed for
adequate hydrate control (Teixeira et al., 2015). The recovery of MEG for gas hydrate
inhibition is a complex subject, and has recently been applied within the industry.
Advances in the regeneration and reclamation of MEG were slow due to the wide use
of methanol as an inhibitor for hydrate prevention (Son and Wallace, 2000).
Throughout this time and till the 1990s, typical regeneration of MEG through re-
concentration was most commonly applied (Nazzer and Keogh, 2006). Formation

22
water served as a major challenge owing to the damaging consequences on the
regeneration units ranging from intense salt and scale deposition, and fouling of the
reboiler (Nazzer and Keogh, 2006; Teixeira et al., 2015). Serious fouling due to
suspended solids and build-up of precipitation from salts found in the injected
chemicals and formation water, may all result in production down-time, failure of
equipment, safety concerns, and other losses (Latta et al., 2013).
The variation in the boiling points of MEG and water serve a vital role in the separation
of these components via distillation. MEG and water have a boiling point of 198 °C
and 100 °C at atmospheric pressure respectively (Blackman and Gahan, 2014). Three
common options exist for MEG recovery as outlined below (Brustad et al., 2005):
1. Re-concentration or Regeneration whereby water is removed from MEG laden
with production water (rich-MEG) via a reboiler and distillation column. The
process is conducted in atmospheric conditions, and the water is boiled off until
a desired MEG concentration is achieved (typically 80-90 wt%). A limitation
of this option is the lack of removal of non-volatile chemicals and high soluble
salts such as those found in production fluids and pipeline corrosion by-
products (Teixeira et al., 2015). Regeneration is suitable in cases where these
chemicals are within the allowable tolerance. However, it cannot be applied in
fields where formation water is being produced, due to the heightened risks of
corrosion (Brustad et al., 2005).
2. Partial reclamation whereby a slip-stream of the regenerated MEG is routed to
a reclamation unit to maintain the total contaminant and salt levels within the
allowable tolerance. This option is cost effective but also advantageous since
non-volatile components are not fully removed such as precious chemical
additives like pH stabilizers or corrosion inhibitors which can be re-used in the
MEG loop (Brustad et al., 2005; Teixeira et al., 2015).
3. Complete reclamation whereby the rich MEG stream is flashed in a vacuum
separator removing non-volatile chemicals and high-soluble monovalent salts
as waste. This option is generally applied where high production of formation
water is expected. The resulting MEG-water mixture undergoes regeneration
such that the MEG concentration is at the desirable limit (Brustad et al., 2005;
Teixeira et al., 2015).

23
1.2.7 Degradation of MEG
Throughout the process of MEG recovery, the MEG may undergo numerous cycles of
high-heat processes. Under these conditions, MEG may degrade and lose its ability to
inhibit gas hydrates. There are three types of MEG degradation that have been
identified in literature, as follows:
• Biodegradation of MEG may occur at certain river temperatures and the type
of bacteria present (Dwyer and Tiedje, 1983; Evans and David, 1974).
• Oxidative degradation of MEG whereby MEG experiences high temperature
in the presence of air/oxygen (Brown et al., 1986; Brustad et al., 2005; Clifton
et al., 1985; Ezrin et al., 2000; Latta et al., 2016; Monticelli et al., 1988;
Rossiter et al., 1985, 1983).
• Thermal degradation of MEG is the chemical decomposition of MEG into
various organic acids when it is heated more than it can sustain (AlHarooni et
al., 2017, 2015; AlHarooni et al., 2016; Jordan et al., 2005; Madera et al., 2003;
McGinnis et al., 2000; Nazzer and Keogh, 2006; Psarrou et al., 2011; Ranjbar
and Abasi, 2013; Rudenko et al., 1997; Teixeira et al., 2015; Yong and
Obanijesu, 2015).
Significance and Research Gap
Despite MEG serving as a hydrate inhibitor in the face of a serious ongoing flow
assurance challenge, there exists a large deficiency of empirical and theoretical data to
cover the hydrate kinetics of MEG degradation samples. MEG degradation can drive
operational costs as well as leave operators in a blind-zone where the perceived impact
of MEG on gas hydrate formation is higher than the actual or real impact it will
produce. Thus, to fill this research gap, in this study, thorough experimentation was
conducted to develop the hydrate phase equilibria of these much-needed solutions
(Chapter 2). Since MEG degradation is a new area, in this study, various innovative
techniques and experimental apparatuses were developed such as the innovative MEG
pilot plant situated in the Curtin Corrosion Engineering Industry Centre (Figure 1.12),
MEG reclamation unit (Figure 1.13) and high pressure PVT cell (Figure 1.14) as
employed in all Chapters, and published in Chapter 10. Moreover, novel empirical
predictive models were developed to provide predictions of degraded and non-

24
degraded, regenerated and non-regenerated, corrosion inhibitor presence or absence in
MEG solutions (Chapter 2 and Chapter 7).
Research effort in the field of MEG regeneration and reclamation has been focused
mainly on the identification of by-products and overall system design (Brustad et al.,
2005; Madera et al., 2003; Montazaud, 2011; Nazzer and Keogh, 2006; Teixeira et al.,
2015). However, the reclamation system design needs more work especially when
formation water breakthrough occurs in the life of the well. It may become highly risky
to continue with the same corrosion control method, and thus, a switchover is required.
It is at this time that numerous design considerations will fail to deliver due to the
contrasting changes the system will experience such as the change in pH and/or the
removal of specific chemicals. Thus, to fill this research gap, in this study, thorough
field-like MEG regeneration and reclamation experimentation were conducted to
mimic methods of corrosion control switchover (Chapter 3 and 4). The study gave
insights and established a way to diagnose the operating pH at various stages of the
process and how it can be modified to ensure expected objectives are met. The effect
of chemical removal and preservation was investigated in the reclamation unit. The
fouling tendency or viscosity of chemical accumulation in the reclamation unit was
evaluated. Moreover, gas hydrate testing was conducted at key stages of the process
to produce hydrate phase equilibria and metastable regions for understanding the
kinetics of natural gas hydrates. An additional study was conducted at a higher thermal
exposure of MEG with salt content to investigate the impact on hydrate formation.
MDEA is a key amine used in the gas processing industry as well as a pH stabilizer as
part of a corrosion control method. This chemical has not been adequately considered
in terms of its impact on the overall hydrate control program. The inhibitory effect of
MDEA on gas hydrate formation was recently identified albeit at low pressures. Thus,
in this work, the inhibitory effect was studied at higher pressures, producing valuable
hydrate phase equilibria upon which a much-needed empirical model and algorithm
for prediction was developed (Chapter 5). Moreover, additional research was
conducted to develop a thermodynamic model to cater for MDEA which can be
employed in hydrate prediction software (Chapter 6). These are a great contribution to
the flow assurance research community and field operators since prediction tools, as
such, are non-existent currently, nor are there any prediction software which considers
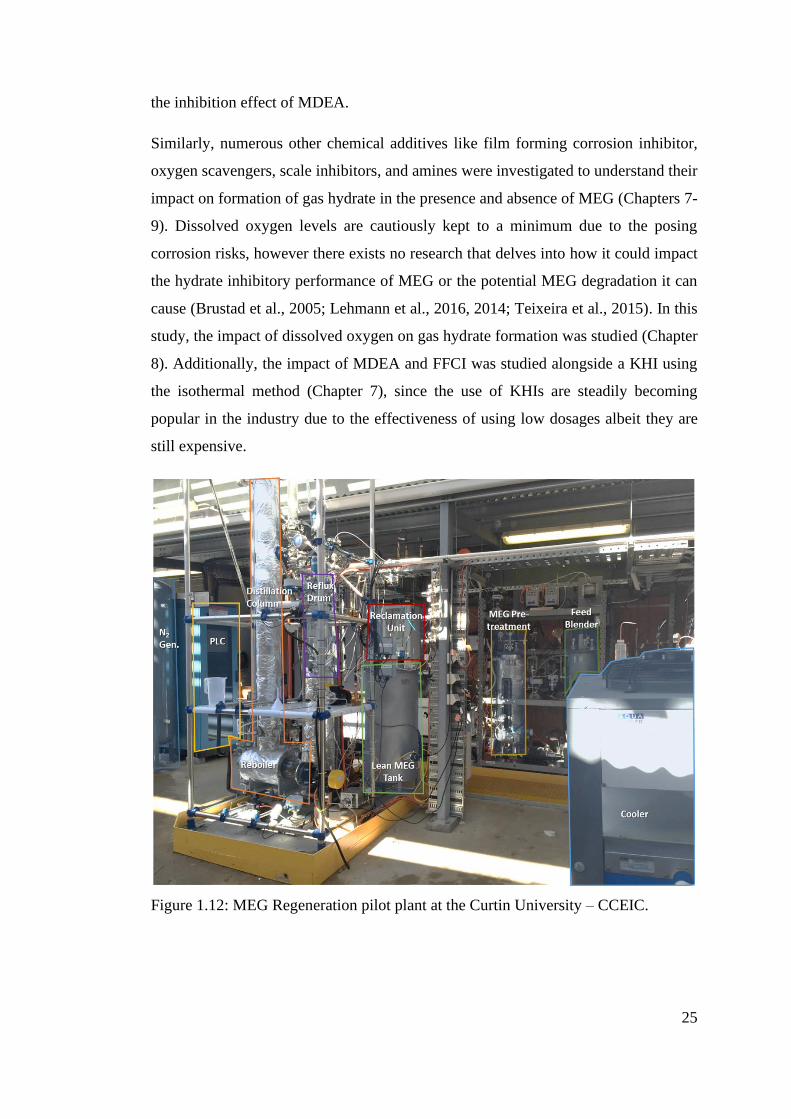
25
the inhibition effect of MDEA.
Similarly, numerous other chemical additives like film forming corrosion inhibitor,
oxygen scavengers, scale inhibitors, and amines were investigated to understand their
impact on formation of gas hydrate in the presence and absence of MEG (Chapters 7-
9). Dissolved oxygen levels are cautiously kept to a minimum due to the posing
corrosion risks, however there exists no research that delves into how it could impact
the hydrate inhibitory performance of MEG or the potential MEG degradation it can
cause (Brustad et al., 2005; Lehmann et al., 2016, 2014; Teixeira et al., 2015). In this
study, the impact of dissolved oxygen on gas hydrate formation was studied (Chapter
8). Additionally, the impact of MDEA and FFCI was studied alongside a KHI using
the isothermal method (Chapter 7), since the use of KHIs are steadily becoming
popular in the industry due to the effectiveness of using low dosages albeit they are
still expensive.
Figure 1.12: MEG Regeneration pilot plant at the Curtin University – CCEIC.

26
Figure 1.13: MEG reclamation unit (rotary evaporator) at the MEG pilot plant.
Figure 1.14: PVT cell capable of hydrate testing at high-pressures.

27
Thesis Objectives
The aim of this research study is to investigate MEG as a regenerated hydrate inhibitor
as well as the effect of the numerous other chemical additives that are usually injected
alongside MEG. These effects are then empirically and or thermodynamically
modelled for the first time to be considered for predictive capability within hydrate
control programs in the field. To achieve this purpose, comprehensive experimental
studies integrating numerous fluid compositions, fluid preparation, regeneration,
reclamation, and degradation are implemented. The project utilized advanced
instrumentation comprising a MEG pilot plant for regeneration and reclamation
experiments implementing corrosion control strategies, rotary reclamation system,
high-pressure autoclave system, and a high-pressure PVT cell for numerous gas
hydrate testing methods. The objectives of this research project are as follows:
(a) Prepare different regenerated MEG samples via the MEG regeneration
pilot plant, reclamation unit and autoclave system.
(b) Investigate the effect of regenerated MEG and salt-laden MEG on natural
gas and methane hydrate formation.
(c) Investigate the effect of pH changes on the removal of MDEA, FFCI, acetic
acid, and salts in the reclamation unit during corrosion control strategy
switchover from pH stabilization to a film-forming corrosion inhibitor.
(d) Report new natural gas and methane hydrate phase equilibria using
isochoric and isobaric hydrate testing methods, hydrate formation profiles
and meta-stability regions.
(e) Develop novel empirical models and algorithm for prediction of hydrate
phase equilibria of degraded and non-degraded, regenerated and non-
regenerated, and corrosion inhibitor presence or absence of MEG solutions.
(f) Develop standardized method to prepare, degrade, and test MEG for
hydrate inhibition performance.
(g) Investigate the effect of MDEA on gas hydrate formation, and in
conjunction with MEG.
(h) Develop novel empirical and thermodynamic model for prediction of
hydrate phase equilibria of MDEA solutions with or without MEG.
(i) Investigate the effect of FFCI and MDEA on gas hydrate formation, and in

28
conjunction with MEG, and KHI.
(j) Investigate the effect of dissolved oxygen, and oxygen scavengers on gas
hydrate formation with or without MEG, and produce new hydrate phase
equilibria.
(k) Investigate the effect of scale inhibitors on gas hydrate formation with or
without MEG, and produce new hydrate phase equilibria.
Thesis Structure
The structure of the thesis is based upon the series of peer-reviewed publications that
cover the objectives of the thesis, and address the identified research gaps as outlined
in Table 1.1. This chapter (Chapter 1 Introduction) is followed by 9 chapters
showcasing a summary and the peer-reviewed publication(s) corresponding to the
relevant thesis objectives and the research gap as listed in Section 1.3. Figure 1.15
illustrates the structure of the thesis and how all the publications fit in, while depicting
a typical gas production system where MEG regeneration is utilized. Chapters 2, 3 and
4 delve into MEG regeneration and the subsequent degradation effect. Chapters 5 and
6 delve into the effect of a common additive injected alongside MEG, MDEA on gas
hydrate formation and its modelling for prediction. Chapter 7 delves into the effect of
MDEA and a film forming corrosion inhibitor on gas hydrate formation, while also
developing a series of MEG degradation empirical models. Chapter 8 delves into the
effect of oxygen scavengers and dissolved oxygen on gas hydrate formation alongside
MEG. Chapter 9 is similar to Chapter 8 but with a focus on scale inhibitors and amines.
Chapter 10 delves into developing and showcasing the MEG pilot plant and MEG
degradation experimental procedures.

29
Table 1.1: Thesis objectives and peer-reviewed publications corresponding to each
chapter.
Chapter Thesis Objective Publication(s)
2 (a) (b) (e) 1 - (Alef et al., 2018c)
3 & 4 (a) (b) (c) (d) 2 - (Alef et al., 2019a)
3 - (Alef and Barifcani, 2018)
5 & 6 (g) (h) 4 - (Alef et al., 2018b)
5 - (Alef et al., 2019b)
7 (i) (e) 6 - (Alef and Barifcani, 2020)
8 (j) 7 - (Alef et al., 2018a)
9 (k) 8 - (Alef and Barifcani, 2019)
10 (a) (f) 9 - (Alef et al., 2017)
10 - (Alef et al., 2019c)

30
Figure 1.15: Thesis structure illustrated.

31
Effect of Regenerated MEG on Gas Hydrate, and
Empirical Modelling for Prediction
This chapter is comprised of the following publication:
• Alef, K., Smith, C., Iglauer, S., Gubner, R., Barifcani, A., 2018c. The Effect
of Regenerated MEG on Hydrate Inhibition Performance Over Multiple
Regeneration Cycles. Fuel 222, 638–647. doi: 10.1016/j.fuel.2018.02.190
MEG is a favourable gas hydrate inhibitor mainly due to its recoverability through
MEG regeneration facilities, and thus reducing costs. However, it is not clear how the
hydrate inhibition performance of MEG is affected by multiple regeneration cycles.
This chapter contributes a detailed study on the effect of MEG regeneration and
reclamation on the hydrate inhibitory performance of MEG. This contribution satisfies
the thesis objectives (a), (b), and (e) while fulfilling the research gaps outlined in
Section 1.3.
An innovative field-like MEG pilot plant built at the Curtin Corrosion Engineering
Industry Centre (CCEIC) was utilized to mimic the highly complex process. The
cycled MEG samples were carefully analysed in the laboratory for their composition,
and each sample was tested in a high-pressure sapphire cell for methane hydrate
inhibition performance. The study found a directly proportional relationship between
the number of cycles and the shift in hydrate equilibrium phase boundary. A maximum
equilibrium shift of 2.21 °C was recorded for a 20 wt% MEG/deionized water sample
that had experienced 9 MEG regeneration cycles as compared to pure MEG. The
analysis suggests that the shift in hydrate equilibrium phase boundary was due to
thermal degradation of MEG within the regeneration and reclamation units due to the
presence of acetic acid. The study found that even though the operation was below
MEG degradation temperature range, repeated heating of MEG may have caused its
degradation. Additionally, the phase equilibria are empirically modelled as a function
of the number of cycles to aid MEG end-users. Application of the model to
experimental results provided accurate outcomes and had an average relative
difference of 1.24% when determining hydrate equilibrium temperatures.
A predictive model as such can greatly support field operators to ensure that the

32
injected MEG will deliver the expected hydrate inhibitory performance of MEG, and
that the MEG inventory is topped-up adequately and timely. Applying this to a typical
project where the total MEG inventory is 5 kT and with a MEG recovery of 98% (Scott
et al., 2016), it was found that an additional average cost of USD $227,000 for MEG
top-ups at each inventory turnover would be required to ensure the hydrate program
employed on the field produces the expected results (Table 2.1). These figures are
based on the cost of MEG at USD $1000 per tonne (Kim et al., 2018). An average
degradation proportion of MEG in the pressure range of 50 – 200 bar was calculated
from the results to be ~4%.
Table 2.1: Top-up cost due to MEG recovery losses and degradation.
Pure
MEG
Cycles
0 1 2 3 4 5 6 7 8 9
MEG
Recovered (kT)
- 4.9 5.09 5.19 5.29 5.39 5.5 5.6 5.71 5.82
MEG Loss (kT) - 0.1 0 0 0 0 0 0 0 0
Degraded MEG
(kT)
- 0.2 0.2 0.21 0.21 0.22 0.22 0.22 0.23 0.23
Total Top-up
MEG (kT)
- 0.3 0.2 0.21 0.21 0.22 0.22 0.22 0.23 0.23
Total Inventory
(kT)
5 5.2 5.3 5.4 5.5 5.61 5.72 5.83 5.94 6.06
Cost of Top-up
($ Mil)
0 0.297 0.204 0.208 0.212 0.216 0.221 0.225 0.229 0.234
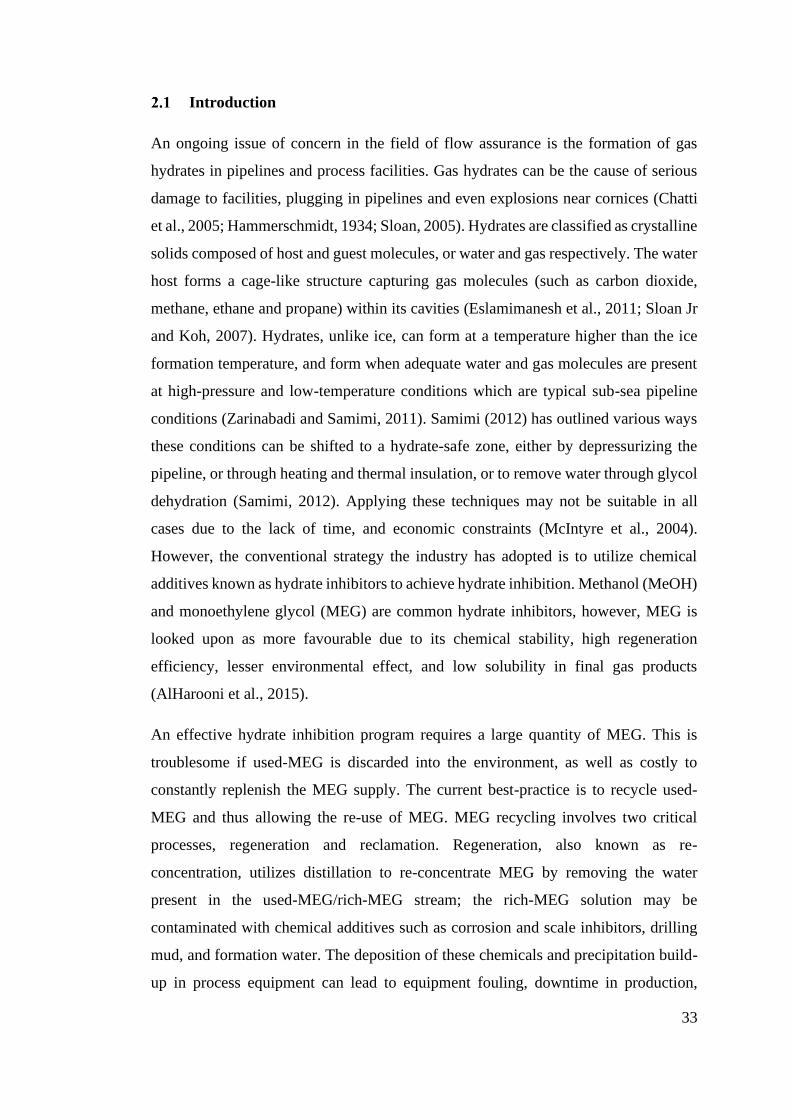
33
Introduction
An ongoing issue of concern in the field of flow assurance is the formation of gas
hydrates in pipelines and process facilities. Gas hydrates can be the cause of serious
damage to facilities, plugging in pipelines and even explosions near cornices (Chatti
et al., 2005; Hammerschmidt, 1934; Sloan, 2005). Hydrates are classified as crystalline
solids composed of host and guest molecules, or water and gas respectively. The water
host forms a cage-like structure capturing gas molecules (such as carbon dioxide,
methane, ethane and propane) within its cavities (Eslamimanesh et al., 2011; Sloan Jr
and Koh, 2007). Hydrates, unlike ice, can form at a temperature higher than the ice
formation temperature, and form when adequate water and gas molecules are present
at high-pressure and low-temperature conditions which are typical sub-sea pipeline
conditions (Zarinabadi and Samimi, 2011). Samimi (2012) has outlined various ways
these conditions can be shifted to a hydrate-safe zone, either by depressurizing the
pipeline, or through heating and thermal insulation, or to remove water through glycol
dehydration (Samimi, 2012). Applying these techniques may not be suitable in all
cases due to the lack of time, and economic constraints (McIntyre et al., 2004).
However, the conventional strategy the industry has adopted is to utilize chemical
additives known as hydrate inhibitors to achieve hydrate inhibition. Methanol (MeOH)
and monoethylene glycol (MEG) are common hydrate inhibitors, however, MEG is
looked upon as more favourable due to its chemical stability, high regeneration
efficiency, lesser environmental effect, and low solubility in final gas products
(AlHarooni et al., 2015).
An effective hydrate inhibition program requires a large quantity of MEG. This is
troublesome if used-MEG is discarded into the environment, as well as costly to
constantly replenish the MEG supply. The current best-practice is to recycle used-
MEG and thus allowing the re-use of MEG. MEG recycling involves two critical
processes, regeneration and reclamation. Regeneration, also known as re-
concentration, utilizes distillation to re-concentrate MEG by removing the water
present in the used-MEG/rich-MEG stream; the rich-MEG solution may be
contaminated with chemical additives such as corrosion and scale inhibitors, drilling
mud, and formation water. The deposition of these chemicals and precipitation build-
up in process equipment can lead to equipment fouling, downtime in production,
34
concern in safety, and economic losses due to maintenance (Latta et al., 2013). The
regenerated MEG is then pumped through to the reclamation unit, where the solution
is thermally exposed under vacuum conditions to the vaporization temperature of
MEG. This allows for the recovery of MEG and water whilst removing the
contaminants as waste products (Latta et al., 2013).
Regeneration of MEG is a cost-effective strategy and has been the subject of numerous
research with regards to design and process, but there is very little or no research into
how the inhibition performance of MEG is affected by multiple
regeneration/reclamation cycles. In this study, recycled MEG samples from an
experiment simulating the switching between corrosion management strategies using
a fully functional bench-scale MEG regeneration/reclamation plant was evaluated on
their hydrate inhibition performance using a PVT sapphire cell (Figure 2.1). The
recycled MEG samples from a total of 9 consecutive cycles, were tested in the PVT
cell to determine whether the number of cycles have an impact on the hydrate
inhibition performance. The results of this study give rise to a whole new aspect of
MEG recycling, and allowing users to take the necessary steps to ensure minimal loss
by adequately adjusting MEG injection rates.
Furthermore, one of the purposes of this communication is to present a model that
accurately depicts this new information of experimental hydrate equilibria data.
Presenting this research’s experimental data in the form of a model is not only more
convenient but ensures it is more accessible to industry and research personnel. A
balance between simplicity and ease of use was the desired outcome for this model
and it is based on mathematically interpolating (linearly) experimental pressure (P)-
temperature (T) hydrate equilibria for a specified MEG cycle number, n. Exponential
functions are chosen as the data-fitting equations since hydrate pressure-temperature
equilibria correlate very well when described exponentially and the exponential data-
fitting equation just has one term with only one occurrence of P and T (Smith et al.,
2016, 2015).
Methodology
2.2.1 Materials and Equipment
As the MEG regeneration and reclamation process becomes increasingly complex, the

35
complexity increases in terms of experimentation in the laboratory. An innovative
approach is the bench-scale MEG pilot plant housed in the Curtin Corrosion
Engineering Industry Centre (CCEIC). The bench-scale pilot plant is designed and
built for thorough experimentation and study of the behaviour of MEG in different
field scenarios, in combination with production fluids, drilling mud and other chemical
additives. The pilot plant has a real-time processing flow of up to 4 kg/h of lean-MEG.
The plant comprises of four distinct yet related stages; a) preparation of brine, b)
preparation of rich or contaminated MEG, c) re-concentration/regeneration unit, and
d) reclamation unit. In this study, samples of reclaimed MEG from the reclamation
unit were extracted to be evaluated on their hydrate inhibition performance.
A PVT sapphire cell (Figure 2.1) located in the Clean Gas Technologies Australia
(CGTA) laboratory was used as the experimental apparatus for testing the samples for
hydrate inhibition performance. The essential process of the cell was to provide steady
heating and cooling in a controlled environment. The cell is made from strong sapphire
material that is able to sustain increased pressures allowing it to operate at a maximum
pressure of 500 bar. To ensure there was no contamination, a ventilation and purging
line was connected to the sapphire cell which allowed for gas to be released to a safe
atmospheric zone above the building. The total volume contained within the system
inclusive of the cell (60 cm3) and tubing (26 cm3) is 86 cm3. Furthermore, the cell was
insulated firmly from the outside surroundings by a tightly sealed accessible door with
a window allowing for easy visual observations of the entire cell from the outside as
well as through a camera system. The heating and cooling capability is within a
temperature range of 60 °C to as low as -160 °C. A cooling system comprising of a
compressor was utilized for cooling, whilst for heating an integrated electrical heater
within the PVT cell was utilized, and an external chiller was used to supply chilled
water to enhance compressor performance. The air bath chamber wherein the cell was
securely fixed has a fan mounted on the roof for enhanced circulation of cool or heated
air. Specific to this study, the cell was operated at a pressure and temperature range of
50–200 bar and 0–30 °C respectively.

36
Figure 2.1: Schematic of the PVT Sapphire cell where P and T denote pressure and
temperature respectively.
The cell was fitted with a magnetic stirrer to provide sufficient mixing between the gas
and liquid. It also helps in the promotion of gas hydrate formation due to the
disturbance it creates at the surface of the solution (Obanijesu et al., 2011; Sadeq et
al., 2017). A lack of this disturbance leads to hydrate merely forming at the surface
which prevents additional gas molecules from dissolving and hence severely delaying
hydrate formation (Mori, 1998). The magnetic stirrer (diameter of 2 cm) was operated
at ∼500 rpm during each run of the experiment. The gas was pressurized via a piston
pump controlled by ABB Mint Workbench software (build 5712). Pressure sensors
(accuracy of ±0.5 bar) linked to a proportional integral derivative (PID) controller
which allows for pressure adjustment. The temperatures of the air bath chamber, vapor
and liquid phases in the cell were monitored via multiple K-type thermocouples
(accuracy of ±0.03 °C). The Falcon application (version 4.30) was used to monitor and
control temperature changes. Care was taken to ensure temperature changes were small
(1 °C/h) in order to achieve steady state between the various phases within the cell.
The heating and cooling system, piston pump and cameras were all controlled and
maintained via the PVT computer system.
Pure monoethylene glycol (MEG) was sourced from Chem-Supply with a purity of

37
99.477 mol% (Table 2.2). Pure MDEA (purity ≥ 99 mol%) was sourced from Sigma-
Aldrich, whilst FFCI is a proprietary film forming corrosion inhibitor (FFCI).
Table 2.2: Pure MEG composition from chem-supply.
Component Mole %
Monoethylene glycol 99.477
Water 0.5
Diethylene glycol 0.02
Ash content 0.001
Acidity (as acetic acid) 0.001
Aldehyde (as formaldehyde) 0.0008
Chlorine 0.00001
Iron 0.000005
Analysis of the sample composition, ion concentrations and acids were determined
using an ion chromatography and high-performance liquid chromatography (HPLC)
system (Thermo Scientific Dionex U3000, accuracy of ±0.1%). Electrical conductivity
was measured using Mettler-Toledo InPro-7100 sensors (accuracy of ±5%, operating
temperatures of 0–135 °C). The concentration of MEG was determined with an
ATAGO-PAL91S refractometer (accuracy of ±0.4%) (Zaboon et al., 2017). The
sensors used in this study were thoroughly washed with deionized water, and
calibration was performed according to the manufacturer’s instructions.
2.2.2 Process and Procedure
Samples of recycled MEG were obtained from the bench-scale MEG pilot plant
simulating a typical switching between corrosion management strategies in the
occurrence of formation water. The simulated switchover was between pH
stabilization (MDEA) to a film forming corrosion inhibitor (FFCI) (Latta et al., 2016).
The experiment was conducted continuously over 9 cycles of inventory turnover with
a total duration of 97 h. The regeneration process began after the rich-MEG solution
had passed through the feed blender where initial solutions were mixed under turbulent
conditions, and had undergone the pre-treatment stage where insoluble salts were
removed from the MEG solution. In the regeneration unit, water was removed from

38
the MEG solution by packed distillation columns. The regeneration unit was operated
at a temperature below the boiling point of MEG but slightly higher than the boiling
point of water (<129 °C) to avoid thermal degradation of MEG. With the relatively
low flow rates (1.2–1.5 kg/h), a vacuum rotary evaporator capable of flashing lean-
MEG was utilized to simulate the reclamation process. The lean-MEG solution
(80 wt% MEG/brine) from the reboiler was fed to the rotary evaporator by opening a
relay valve which was monitored through a level sensor. Lean-MEG containing high
dissolved salt concentration, as well as MDEA was flashed in the vacuum flask which
was operated at 100 mbar. The reclamation unit was operated at vacuum conditions to
avoid high temperatures that may cause MEG degradation. The flask was continuously
heated with an oil bath operating at ∼160 °C, which resulted in liquid and vapor
temperatures of ∼130 °C within the reclamation flask. Care was taken to ensure the
MEG was not thermally degraded by ensuring that it was only exposed to the
vaporization temperature of MEG. Furthermore, to maintain a uniform heat
distribution, the flask was rotated at 30 rpm while being immersed in the oil bath. The
flashed vapor was condensed in the overhead condenser and collected in the receiving
flask which was controlled via a level sensor. When the level reached the desired value,
the purified lean-MEG was sent to a storage tank. Samples from the receiving flask
were taken at each inventory turnover representing an entire cycle.
The PVT cell was utilized for hydrate inhibition testing. The samples were diluted to
20 wt% MEG with deionized (DI) water. This was conducted to resemble actual field
conditions as much as possible; typical concentrations of the lean-MEG to be injected
are around 90 wt% MEG, however, the MEG solution gets diluted after injection due
to the presence of formation water in the production pipelines hence decreasing the
final concentration of the injected MEG solution to around 40 wt% MEG (Dugstad et
al., 2003; Halvorsen et al., 2009; Kim et al., 2014). Methane with deionized water was
tested to ascertain the accuracy of the PVT cell and consequent results. For cycles 1,
5 and 9, the full hydrate profile curve was determined by conducting 4 tests for each
cycle at varying pressures (75, 100, 150, and 200 bar), whilst for the cycles in-between
(2, 3, 4, 6, 7, and 8) a single test for each was conducted at an approximate pressure of
150 bar.
The isochoric method was employed for the measurement of equilibrium

39
(dissociation) points of the mixtures. This method is widely employed and well
accepted (Luna-Ortiz et al., 2014; Sloan Jr and Koh, 2007; Tohidi et al., 2000; Zang
and Liang, 2017). The process entailed that the liquid within the sapphire cell is
steadily cooled to enable the formation of hydrate and then steadily heated to
accurately detect the equilibrium (hydrate dissociation) point. It can be determined by
finding the intersection of the cooling and heating curves of the process (Sloan Jr and
Koh, 2007).
Important caution was taken to ensure temperature within the cell was controlled and
monitored adequately enabling steady state to be reached at incremental changes.
Thus, a rapid change in the temperature of the sapphire cell can result in missing the
noticeable points of hydrate dissociation leading to inaccurate outcomes. The inside of
the sapphire cell was thoroughly cleaned with acetone and rinsed with deionized water.
Then the cell and surrounding apparatus was well vented and purged with nitrogen to
ensure the entire apparatus was free from any contaminants that may affect the results.
The cell was then connected to a vacuum pump to remove any remaining gases and
liquids. The sample solution (8 mL) was then injected into the cell. It was then
pressurized with methane gas from a connected gas supply cylinder until it reached the
desired pressure. When the mixture reached thermal equilibrium, the cooling system
was initiated. The cooling system was monitored and controlled using dedicated
software (Falcon version 4.30). The temperature was steadily dropped at a rate of 3 °C
per hour until the temperature of the vapor phase within the cell had reached a
temperature 3 to 4° above the predicted hydrate formation temperature. At this stage
the rate of cooling was drastically dropped to 1 °C per hour. The hydrate was allowed
to grow until full blockage had occurred. The heating system was then initiated at a
rate of 1 °C per hour. The dissociation or thermodynamic equilibrium point was
determined accurately through the intersection of the cooling and heating curves of the
process.
Results and Discussion
2.3.1 Observations
The pure MEG samples were observed to be colourless, whilst foaming was observed
to occur for samples of the initial cycles (Figure 2.2). AlHarooni et al. (2016) also

40
observed foam formation and attributed it to MDEA reacting with contaminants
present in the MEG solution. Foaming has negative consequences such as loss of
solution, production downtime and increased costs due to the maintenance of
equipment (Liu et al., 2015). Foam formation can occur due to contaminants such as
formation water, feed-gas, oxygen ingress amongst other contaminants present in the
solution (Al Dhafeeri, 2007; Kohl and Nielsen, 1997). As the number of cycles
increased, the foam formation behaviour decreased, and this is evident due to the
decrease in MDEA concentrations as shown in Figure 2.2 and further analysed in
Figure 2.10.
Figure 2.2: Observations of foaming due to MDEA, and coloration in cycles 1, 5, and
9 as compared to pure MEG.
The initial solution (Figure 2.3a), was colourless and no restriction to flow was
observed as the magnetic stirrer operated at full speed (∼500 rpm). As the mixture was
steadily cooled for about 3 h, the first signs of hydrate formation appeared, formation
of bubbles (Figure 2.3b). This was due to gas molecules beginning to dissolve in the
water phase. There were no hydrate solids observed at this point. Soon thereafter, the
bubbles increased and irregular hydrate solids began to accumulate on the upper
surface (gas-liquid contact) whilst waves of bubbles circulated beneath (Figure 2.3c).
This hydrate film was also observed by others (AlHarooni et al., 2017; Mori, 1998).
The flow indicated by the speed of the magnetic stirrer remained unhindered
(∼500 rpm). However, as the mixture was cooled further, the bubbles decreased in size
and subsided whilst stable layers of hydrate began to form radially on the inside walls
of the cell. This transition was observed as the smaller hydrate solids agglomerated

41
into larger solids which started to affect the stirrer speed indicating that hydrate
formation was now a real hindrance to the flow within the cell. The stirrer would
abruptly stop intermittently with an average speed of (∼400 rpm). The extent of this
observation increased as the hydrate grew in size. The agglomeration of the hydrates
continued until all visible liquid phase was consumed, resulting in full blockage of the
cell at 4.5 h (Figure 2.3d). The magnetic stirrer was consuming energy but was not
able to move the hydrate block asynchronous to plugging within pipelines thus
stopping production. The heating system was then initiated to determine the
dissociation point. A slow heating rate (1 °C/h) was enabled to ensure the subtle
dissociation rate was captured with high accuracy. Initial dissociation was first noticed
as tiny cavities began to appear within the hydrate block (Figure 2.3e). As the number
of cavities increased, a film of liquid began to accumulate at the bottom of the cell
allowing the stirrer to slightly move with intermittent stops. With further heating, the
hydrate block began to fragment into smaller pieces and more liquid filled the bottom
of the cell, the stirrer was gaining speed and less stops indicating greater flow within
the cell (Figure 2.3f). As the dissociation process continued, the separation of liquid
and gas molecules from the hydrate phase became more evident and the liquid solution
was observed to be quite cloudy with various strains of off-white colour (Figure 2.3g).
The cell was heated until no hydrate solids were observed and the liquid was clear with
a yellow colour (Figure 2.3h), the magnetic stirrer at this stage was rotating at full
speed.
Figure 2.3: Observable stages of hydrate testing of cycled MEG.

42
2.3.2 Initial Testing
Methane hydrate testing was conducted on deionized water to establish the accuracy
of our experimental apparatus and results. Methane (CH4) and deionized water were
chosen due to the widely available literature with results that can be used as a
comparison. The full hydrate profile for CH4 + deionized water was determined by
conducting 5 tests at varying pressures (50, 75, 100, 150, and 200 bar) and were
conducted three times for repeatability (average experimental error of 2.61%). The
final results were compared to the literature (Jhaveri and Robinson, 1965; Marshall et
al., 1964; McLeod and Campbell, 1961; Verma, 1974), as well as closely matching
fluid packages in Aspen HYSYS (version 8.6), Multiflash (version 3.6), PVTSim
(version 20) (Aspen HYSYS, 2007; Calsep PVTSim, 2011; Infochem Multiflash, 2007).
Figure 2.4 shows that our results are highly consistent with literature and software
results, only having an average absolute percent deviation (AAPD) of 1.64%.
Figure 2.4: Hydrate profile for methane and water mixture from this study compared
to simulation software (average absolute deviation of 1.64%) and literature (1.80%).
The methane hydrate of a 20 wt% pure MEG aqueous solution was profiled and
compared to software prediction and literature data that was relatively close to the
MEG concentration utilized in this study (Eichholz et al., 2004; Rock, 2002) – Figure

43
2.5. An AAPD of only 3.36% was found compared to software calculations, suggesting
our results are highly accurate.
Figure 2.5: Hydrate profile for methane and 20 wt% MEG solution.
2.3.3 Equilibrium Results – Cycling
The effect of regenerated or cycled MEG on the methane hydrate phase profile was
carefully measured using the sapphire cell at pressures between 75 and 200 bar. The
measured equilibrium results for pure MEG and the 9 cycles of regenerated MEG are
shown in Figure 2.6. Table 2.3 and Table 2.4 show the hydrate equilibrium temperature
shift (ΔTs) calculations for all the cycles relative to pure MEG. The hydrate phase
profile for cycle 1 has an average shift of 0.37 °C for low pressures (50–100 bar) and
-0.12 °C for high pressures (100–200 bar) compared to the hydrate profile of pure
MEG solution (20 wt%). The middle cycle (5) and the final cycle (9) have shifted on
average by 1 °C and 1.7 °C respectively for the pressure range of 50 to 200 bar (Table
2.3). The single testing points for cycles 2, 3, 4, 6, 7, and 8 at an approximate pressure
of 150 ± 10 bar have shifted by 0.01, 0.38, 0.58, 1.08, 1.22, and 1.32 °C respectively
(Figure 2.6 and Table 2.4).

44
Figure 2.6: Methane hydrate phase profiles for pure MEG (20 wt%) and cycles 1–9,
dotted lines refer to exponential fitting curves.
Table 2.3: Hydrate equilibrium temperature shift (ΔTs) of cycles 1, 5 and 9 compared
to pure MEG hydrate profile and the regression functions of the fitted data. ab
a Standard error in pressure and temperature are ±0.5 bar and ± 0.03 °C respectively. b P and T denotes pressure and temperature, respectively.
Pressure
(bar)
Pure MEG Cycle 1 Cycle 5 Cycle 9
P=
40.827e0.1232
T
P=
37.114e0.1332T
P=
33e0.1328T
P=
29.876e0.1335T
Texp (°C) Texp (°C) ΔTs
(°C)
Texp (°C) ΔTs
(°C)
Texp (°C) ΔTs
(°C)
50 1.65 2.24 0.59 3.13 1.48 3.86 2.21
75 4.94 5.28 0.34 6.18 1.24 6.9 1.96
100 7.27 7.44 0.17 8.35 1.07 9.05 1.78
125 9.09 9.12 0.03 10.03 0.94 10.72 1.64
150 10.57 10.48 -0.08 11.4 0.83 12.09 1.52
175 11.82 11.64 -0.18 12.56 0.74 13.24 1.43
200 12.9 12.64 -0.26 13.57 0.66 14.24 1.34

45
Table 2.4: Hydrate Equilibrium Temperature shift (ΔTs) from Pure MEG hydrate
profile (cycles 2, 3, 4, 6, 7, 8).a
Pressure (bar) Texp (°C) TPure MEG (°C) ΔTs (°C)
Cycle 2 160.05 11.10 11.09 0.01
Cycle 3 154.70 11.20 10.82 0.38
Cycle 4 159.95 11.67 11.09 0.58
Cycle 6 145.59 11.40 10.32 1.08
Cycle 7 156.47 12.13 10.91 1.22
Cycle 8 156.39 12.22 10.90 1.32
a Standard error in pressure and temperature are ±0.5 bar and ±0.03 °C respectively.
The results reveal that there is a directly proportional relationship between the number
of cycles and equilibrium temperature resulting in a rightward shift in the hydrate
phase boundary (i.e. promotion of hydrate formation). Furthermore, the hydrate phase
boundary for cycle 1 is slightly lower than the phase boundary for the pure MEG
sample. This was due to the high initial concentration of MDEA present in the solution
(Figure 2.10). MDEA has been found to have an enhanced hydrate inhibition effect
thus confirming this finding (Akhfash et al., 2017; AlHarooni et al., 2017; AlHarooni
et al., 2016). As the cycles increased, MDEA was steadily removed in the reclamation
process due to the increased risk of corrosion in the presence of formation water
(Lehmann et al., 2014). Hence, the added hydrate inhibition effect of MDEA is not
very well pronounced for the later cycles.
A key limitation on the use of MEG as a hydrate inhibitor is its maximum exposure
temperature. At temperatures above 135 °C MEG could suffer thermal decomposition,
typically producing organic acids, particularly acetic and formic acids (AlHarooni et
al., 2015). This is the main reason behind vacuum distillation for reclamation, as it
reduces the required temperature for separation of MEG from the contaminants to
below the degradation temperature. The area of degradation of MEG and the impact it
has on hydrate inhibition has not been researched in great volume to date, however

46
dedicated research into the degradation of MEG began with the work of Rossiter et al.
(1985) showing the degradation products of solutions of MEG include glycolic, oxalic
and formic acids. The decomposition products are a result of thermal oxidation of
MEG as shown in reaction Eqn. (2.1) (Rossiter et al., 1985).
𝐻𝑂𝐶𝐻2𝐶𝐻2𝑂𝐻𝑂2+𝐻𝑒𝑎𝑡→ 𝐻𝑂𝑂𝐶𝐶𝑂𝑂𝐻 + 𝐻𝑂𝐶𝐻2𝐶𝑂𝑂𝐻 + 𝐻𝐶𝑂𝑂𝐻 (2.1)
Similar MEG degradation products were determined by others through ion
chromatography and high performance liquid chromatography to be formic acid, acetic
acid and glycolic acid (AlHarooni et al., 2015; AlHarooni et al., 2016; Madera et al.,
2003). AlHarooni et al. (2016) concluded after a detailed study on analytical
techniques for analysing various MEG samples that using high performance liquid
chromatography was amongst the most effective analytical techniques, owing to high
consistency across various samples and temperatures. The analysis revealed that acetic
acid was present in all the samples (Figure 2.7). The acetic acid concentration
increased with cycle number thus indicating an increasing amount of MEG
degradation as cycles increased. The degradation of MEG into organic acids such as
acetic acid decreased the quantity of effective MEG for hydrate inhibition. As a result,
a rightward shift in the hydrate phase boundary occurred.
Figure 2.7: Acetic Acid concentration (ppm) of cycles 1-9.
Research by Psarrou et al. (2011) on the effects of MEG reclamation conditions on
MEG degradation has shown that a macroscopic indicator of MEG degradation during
regeneration and reclamation is the solution turning yellow (Psarrou et al., 2011).

47
Solution samples were analysed for its coloration as shown in Figure 2.2, where cycle
9 (Figure 2.2d) was observed to be pale yellow in colour, resembling the observation
of Psarrou et al. (2011). Cycle 5 had an off-white colour as compared to the colourless
pure MEG sample. This observation is in line with the findings of Psarrou et al. (2011),
indicating that MEG suffered degradation and hence the drop in inhibition
performance.
The degradation of MEG is a thermal oxidation process, therefore, it can be expected
that the presence or absence of oxygen will affect the degradation of MEG. As
investigated by Rossiter et al. (1985), elimination of oxygen from a MEG system can
effectively reduce the degradation (Rossiter et al., 1985). This has been termed the
‘deaeration effect’. In their studies, aerated and deaerated MEG solutions heated for
15 days at 100 °C, thermal oxidation resulted in MEG degradation. Furthermore,
Rudenko et al. (1997) confirmed that at temperatures above 157 °C, thermal
degradation without the oxidation component is possible (Rudenko et al., 1997).
Dissolved oxygen levels were measured across the reclamation unit as shown in Figure
2.8. Dissolved oxygen levels are kept below 20 ppb ideally to prevent the risk of
corrosion (Lehmann et al., 2014). The dissolved oxygen levels of the MEG solution
for each cycle within the reclamation unit were relatively low (<38 ppb). Cycle 1 to 4
saw levels in the range of 29–38 ppb, whilst the remaining cycles saw levels below
25 ppb of dissolved oxygen (Figure 2.8). The reclamation unit utilized within this
study was constantly purged with nitrogen to prevent oxygen contamination and hence
an average level of 23 ppb dissolved oxygen was achieved. The analysis shows that
very little (23 ppb) oxygen ingress occurred within the MEG pilot plant and it does not
explain the rightward shift in the hydrate equilibrium temperatures as the cycles
increase.

48
Figure 2.8: Dissolved oxygen levels (ppb) within the reclaimed MEG solution for
each cycle.
The above strongly suggests that MEG degradation occurred although the reclamation
unit was operated at a liquid and vapour temperature of ≤134 °C and ≤126 °C
respectively (Figure 2.9). These findings suggest that whilst being below degradation
temperature, repeated heating through recycling of MEG could affect its ability to
inhibit hydrates.
Figure 2.9: Temperature of the liquid and vapor phases within the reclamation unit
over 9 cycles (sensor accuracy of ±0.03 °C).
The presence of MDEA (Figure 2.10) results in enhanced hydrate inhibition
performance with respect to cycle 1 – where MDEA is at its highest concentration,
however as the cycles increase the added inhibition effect that MDEA brings was
outpaced by other mechanisms that promote hydrate formation such as thermal

49
degradation, thus the hydrate phase boundaries were shifted to the right. Furthermore,
FFCI was completely removed within reclamation as no trace of it was found after
HPLC analysis was performed. However, AlHarooni et al. (2016) suggested that FFCI
can act as a hydrate inhibitor (AlHarooni et al., 2016).
Figure 2.10: MDEA concentration (mM) in samples of cycles 1-9.
2.3.4 Empirical Model
With a clear trend between the cycling of MEG and the decreased hydrate inhibitory
performance identified, providing a means of relating these variables is important. A
simple but effective model was constructed by mathematically relating the
experimental hydrate dissociation conditions (P, T) with the MEG cycle number. It is
assumed that at a certain pressure, the relationship between the dissociation
temperature and cycle number is linear. According to the data presented in Figure 2.6,
the temperature increases by a relatively consistent interval with cycle number at a
specified pressure, hence the applicability of a simple linear interpolating scheme.
Using the experimental dissociation data for methane with pure MEG (cycle 0) and
with n = 9 cycles, an interpolation scheme capable of computing dissociation
conditions after a number of cycles (n) is put forth.
Given the expectation that MEG sample’s degree of methane hydrate inhibition
decreases with higher n, this decrease will result in T being greater relative to the
application of pure MEG (n = 0). This is expressed by Eqn. (2.2):

50
T = T0 + ∆T0−n (2.2)
The first term in Eqn. (2.2) is representative of the dissociation temperature for pure
MEG with n = 0 cycles, T0. The second term computes the temperature shift from cycle
0 to cycle n (ΔT0–n). T0 is simply evaluated using a best-fit exponential expression for
the experimental hydrate equilibria data. The expression for all experimental data
when correlated is given with P as the subject. The data-fitting equation can be
rewritten in terms of T0 according to Eqn. (2.3) (a and b are constants that best match
the data set):
T0 = a ln (P
b) (2.3)
Interpolation for this model centres around the ΔT0–n term. The maximum deviation
from T0 corresponds to when n = 9 and this is designated as ΔT0–9. Hence ΔT0–n uses
this known value (from experiment) to interpolate the actual ΔT, or deviation from T0,
at a particular P and n, which therefore provides an overall T value. It is expected that
ΔT0–9 (the difference between T0 and T9) will not be the same throughout the entirety
of the experimented range of pressures, and will therefore be a function of pressure.
Derivation of ΔT0–n involved the development of the experimental relationship
between ΔT0–9 and P. As evident from the equilibria in Figure 2.6, the temperature
interval between 0 and 9 cycles (ΔT0–9) varies with pressure. To account for this, ΔT0–
9 was calculated at several pressures and gave a strong exponential function (R2 = 1).
Figure 2.11 illustrates the strong correlation between these two parameters.
Figure 2.11: P versus T-Hydrate Equilibrium Shift (ΔT0–9).

51
From Figure 2.11, the equation for ΔT0–9 is given as:
∆T0-9 = (1
−1.597)ln (
P
1710.7) (2.4)
The ΔT0–9 term can be used to interpolate T for n cycles (ΔT0–n) by multiplying Eqn.
(2.4) with n/9:
∆T0-n = − (n
9 × 1.597)ln (
P
1710.7) (2.5)
Substituting Eqns. (2.3), (2.5) into Eqn. (2.2) gives the overall expression (Eqn. (2.6))
for calculating T after n cycles (constants a, b, c and d listed in Table 2.5).
T = a ln (P
b) + c ln (
P
d) n (2.6)
Table 2.5: Constants for Eqns. (2.3) and (2.6).
a b c d
8.117 40.827 -0.06957 1710.7
2.3.5 Application of Model to Experimental Data
To test whether the model matches the experimental data it is describing, data points
in the proximity of 150 ± 10 bar were selected. The exact pressures and corresponding
cycle number (n) were inserted into the model to calculate the resultant temperature,
Tcalc. Where required, raw data was calculated using their designated lines of best fit
as opposed to individual points. Calculated values are compared to experimental
values, Texp, in Table 2.6 (unless noted, Texp represents the actual data point).

52
Table 2.6: Model calculations versus raw data.
n P (bar) Tcalc (°C) Texp (°C) RD (%)
0 156.1 10.89 10.8 (10.89a) 0.83
1 151 10.79 10.4 3.75
2 160.05 11.42 11.1 2.88
3 154.7 11.31 11.2 0.98
4 159.95 11.74 11.67 0.60
5 152.89 11.56 11.41 1.31
6 145.59 11.35 11.4 0.44
7 156.47 12.07 12.13 0.49
8 156.39 12.23 12.22 0.08
9 150.74 12.12 12 (12.12a) 1.00
a Calculated with line of best fit.
Any disagreement between Tcalc and Texp are represented by the relative difference as
a percentage (RD%). Most calculations are within 0.1 - 0.2 °C of the corresponding
experimental value and rarely differed by more than 2% with an average of 1.24%. It
can be concluded that the developed model accurately represents the experimental data
from which it was constructed.
Conclusions and Recommendations
This study evaluated the effect of multiple cycles of MEG inventory from a bench-
scale MEG pilot plant simulating a switchover of corrosion strategies (pH stabilization
with MDEA to FFCI). The samples from each cycle were analysed for their
composition and tested using a PVT cell for hydrate inhibition performance. This study
contributes new methane hydrate equilibria data of multiple cycles of regenerated
MEG. The study found a rightward shift in the hydrate phase boundary for MEG
suggesting a promotion in hydrate formation as the number of cycles of MEG
regeneration increased. It found an average equilibrium temperature shift of 1.7 °C for
cycle 9 as compared to pure MEG (20 wt% MEG/deionized water). The study strongly
suggests that degradation of MEG can occur even if the reclamation unit is operated
at temperatures below MEG’s degradation temperature range. Degradation products,

53
primarily acetic acid were found in the analysis of MEG samples. Hence, it may be
suggested that repeated heating through recycling of MEG could affect its ability to
inhibit hydrates.
An empirical model based on the equilibria data of this study was developed to give
insight to operators involved with MEG applications. The model has various modes of
application. Specifically, it may be used to predict the decreasing effectiveness of
MEG’s hydrate inhibition performance over a specified number of regeneration cycles.
Determining the equilibrium pressure and the temperature is indicative of the degree
of degradation and increasing inefficiency of MEG with its continued cycling. With
MEG’s significant use in the oil and gas industry, the presented findings are beneficial
as they can potentially aid MEG processing end-users to apply MEG more efficiently,
particularly in relation to its hydrate inhibition capabilities.

54
Evaluation of MEG Reclamation and Natural Gas
Hydrate Inhibition during Corrosion Control Switchover
This chapter is comprised of the following publication:
• Alef, K., Gubner, R., Iglauer, S., Barifcani, A., 2019a. Evaluation of MEG
Reclamation and Natural Gas Hydrate Inhibition During Corrosion Control
Switchover. Journal of Petroleum Science and Engineering 176, 1175–1186.
doi: 10.1016/j.petrol.2018.08.052
This chapter contributes a detailed evaluation of the MEG regeneration and
reclamation operation as applied in the context of corrosion control strategies. The
switching of corrosion control strategies becomes of great importance as formation
water production reaches critical levels. The study found that a fine balance of pH
levels between the various processes must be achieved in order to successfully remove
the amine while preserving the preferred corrosion inhibitor. The study recommends
operating the pre-treatment unit at pH > 8 to precipitate out the divalent salts, and
injecting acid before the regeneration unit, which allows for the volatile acetic acid to
be removed via the reflux drum. It was found that FFCI and MDEA accumulation in
the reclamation unit resulted in a highly viscous residue (1430.53 mPa-s) and a
discoloration (from brown to very dark brown).
Furthermore, essential hydrate testing was conducted on the MEG samples and their
metastable regions were determined. The new hydrate equilibria data revealed a
hydrate promotion effect amongst the degraded MEG samples as opposed to pure non-
degraded MEG. Moreover, MEG degradation products were identified to be acetic,
formic, and glycolic acid. Observations reveal a colour change from colourless to
slightly yellow depending on the extent of thermal degradation of the MEG samples.
This contribution satisfies the thesis objectives (a), (b), (c), and (d) while fulfilling the
research gaps outlined in Section 1.3.

55
Introduction
Corrosion, scale, and hydrate formation are some of the many challenges faced in the
production of natural gas (Kan et al., 2002b; Nyborg, 2009; Sandengen, 2006). The
challenges become even more complex when field formation water is produced. A
corrosion control strategy may be adopted to lower the risk of corrosion and prevent
corrosion damage to facility equipment and pipelines. Typical corrosion control
strategies employ the pH stabilization method or utilize the injection of a corrosion
inhibitor, such as a film-forming corrosion inhibitor (FFCI) (Latta et al., 2013).
However, various factors must be considered when selecting a corrosion control
method, including the environmental impact, corrosion, and scaling problems in the
monoethylene glycol (MEG) regeneration process, and how corrosion products are
consequently handled in the MEG closed loop (Halvorsen et al., 2006). Several field
studies have illustrated the dynamic selection of corrosion control methods or a
combination of various methods, including the concurrent use of scale inhibitors
(Glenat et al., 2004; Hagerup and Olsen, 2003; Halvorsen et al., 2007; Halvorsen and
Andersen, 2003; Latta et al., 2016; Olsen, 2006). In the pH stabilization method, a base
such as methyl diethanolamine (MDEA) is added to the lean MEG injection stream to
reduce the corrosion rate of gas condensate pipelines by artificially increasing the pH,
thereby encouraging the formation of a protective scale on the inner walls of the
production flowline (Dugstad and Seiersten, 2004; Halvorsen et al., 2007). However,
pH stabilization increases the risk of scaling in the subsea architecture, particularly in
the choke module and well jumpers, and it cannot be used once formation water
breakthrough occurs, or initially when remnant completion fluids may pose a scale risk
(Lehmann et al., 2014). This can negatively influence the MEG regeneration and
reclamation process, as the formation water contains salts that, unless removed, may
cause scaling and fouling within the equipment. In terms of corrosion control by
corrosion inhibitors, four categories exist — cathodic, anodic, volatile, and mixed
inhibitors. FFCIs are classified as mixed corrosion inhibitors and are commonly used.
Essentially, FFCIs slow both the anodic and cathodic reactions, and they adsorb to the
pipeline wall by forming a protective film that prevents corrosion (Lehmann et al.,
2014). In this study, FFCI was employed as an alternative corrosion control method
when pH stabilization was not feasible because of the increased risk of scale formation
in the presence of formation water.

56
Gas hydrate formation in production and process pipelines is a serious problem, with
dangerous consequences, such as pipeline blockage and damage to facilities (Chatti et
al., 2005; Hammerschmidt, 1934; Sloan, 2005). The current industry practice is to
inject chemical hydrate inhibitors, and MEG is commonly utilized. As increased costs
are associated with the large volume of MEG required, MEG is recycled using MEG
regeneration/reclamation facilities. Such facilities have two major processes:
regeneration and reclamation. Regeneration uses distillation columns to remove water
from the rich MEG stream; the rich MEG is contaminated with formation water and
corrosion products, resulting in high total dissolved solids. Serious fouling caused by
suspended solids and precipitation build-up due to salts from formation water or other
injected chemicals in the plant can lead to production downtime, equipment failure,
safety concerns, and other economic losses (Latta et al., 2013). Then, the regenerated
MEG is taken through the reclamation unit, where it is heated above MEG's
vaporization temperature under vacuum to recover MEG and water, while leaving
behind non-volatile substances (e.g., salts and organic acids) as waste. The effect of
continuous recycling of MEG on natural gas hydrates is not well known, especially
when there are chances of MEG degradation during the regeneration and reclamation
process. A loss in MEG quality may lead to lower performance of MEG as a hydrate
inhibitor.
In this study, a MEG pilot plant housed at the Curtin Corrosion Engineering Industry
Centre was used to simulate a switchover of corrosion control methods. The current
strategy of pH stabilization with MDEA was switched to FFCI mode when field-wide
formation water production became unmanageable through alternative means, such as
production reallocation or scale inhibitor injection. The performance of the
reclamation process was evaluated in terms of optimum operating pH for effective
removal of salts, organic acids (such as acetic acid), and chemical additives, such as
MDEA and FFCI. Further, the reclaimed MEG at the initial, middle, and final stages
of the experiment was tested for natural gas hydrate inhibition, using a high-pressure
PVT cell to evaluate hydrate inhibition performance and determine the possible loss
in MEG quality.
Methodology
The experimental setup in this study essentially consisted of a reclamation unit as part

57
of a MEG pilot plant for MEG purification (illustrated in Figure 3.1) and a high-
pressure PVT sapphire cell for hydrate testing (see Figure 3.2).
Figure 3.1: Experimental setup (bench-scale MEG regeneration/reclamation pilot
plant).
Figure 3.2: PVT sapphire cell used for gas hydrate testing.

58
3.2.1 Materials and Equipment
The pilot plant has been designed for studying the behaviour of MEG, production
fluids, and other chemical additives under more realistic conditions compared with
independent benchtop laboratory tests. The plant has a processing capacity of 1–4 kg/h
of lean MEG. The plant has five stages: a) formation water preparation, b) rich MEG
preparation, c) MEG pre-treatment (divalent salts removal), d) regeneration, and e)
reclamation (see Figure 3.1). The plant consists of a brine tank, a lean glycol tank
(LGT), a feed blender (FB), a pre-treatment unit, a rich glycol tank, a reboiler and
distillation unit, and a reclamation unit. Formation water/brine was prepared based on
field water composition (see Table 3.1) and stored in the brine tank. Similarly, lean
MEG (see Table 3.1) based on the required field composition was prepared and stored
in the LGT. The reclamation unit (rotary evaporator) used in this study was designed
and supplied by Scitek Heidolph. It comprised the following components: a 20 L
vacuum flask (flash separator), an oil bath, an overhead condenser, a collection flask
to receive condensed MEG, a vacuum system, and a control box. The original setup
did not allow for the measurement of the fluid temperature inside the rotary flask.
Thus, a thermocouple was retrofitted into the slurry sump and connected to the
programmable logical controller for slurry temperature measurements. The fill height
of the vacuum flask was maintained by automatic additions of fresh lean MEG. A level
sensor placed inside the rotary flask measured the liquid level, which was then used
by the control system to automatically refill the flask with lean MEG based on the
desired slipstream proportion (35% of output flow from the regeneration unit). The
refill and drain times were configured accordingly. The input and output streams of
the rotary evaporator were lined up with three probes to accurately measure the pH,
electrical conductivity, and dissolved oxygen content. The rotary evaporator flask was
modified to allow for purging with nitrogen to sustain a level of dissolved oxygen to
below 20 parts per billion (ppb) owing to the corrosion risks involved. The temperature
within the flask was carefully monitored in both liquid and vapour phases with K-type
thermocouples (±0.75% error) to avoid high temperatures that would have led to the
degradation of the MEG. The data from all the instruments, including temperature,
pressure, flowrate, pH, electrical conductivity, and dissolved oxygen measurements,
were continuously recorded by the programmable logical controller system for
subsequent analysis.

59
Table 3.1: Fluid compositions (brine/formation water, rich MEG, and lean MEG).
Component Brine Rich MEG Lean MEG
MEG (wt.%) 0 57 80 Na (ppm) 4679 3767 3625
K (ppm) 106 85 77
Ca (ppm) 173 53 5
Mg (ppm) 13 7 5
Fe (ppm) 0.31 0.25 0.22
Sr (ppm) 15 8 5
Ba (ppm) 38 15 5
Li (ppm) 2.5 2 1.8
Cl (ppm) 7217 5812 5242
HCO3 (ppm) 828 667 601
SO4 (ppm) 6.2 5 4.5
Acetic acid (ppm) 500 403 363
Propanoic acid (ppm) 55 45 40
Butanoic acid (ppm) 4.6 3.7 3.4
Pentanoic acid (ppm) 2.3 1.9 1.7
Phenol (ppm) 32 26 23
A high-pressure PVT sapphire cell in the Clean Gas Technology Australia laboratory
was used for natural gas hydrate inhibition testing. The cell was made from sapphire
material and has a volume of 60 cc, with a pressure range of up to 50 MPa, and a
temperature range of +60 to -160 °C.
MEG was supplied by Chem-Supply with a purity of 99.477 mol%. A high-
temperature silicone heat transfer fluid, used in the oil bath of the reclamation unit
known as Duratherm S, was supplied by Duratherm. MDEA, a clear liquid with a
slightly yellow colour and an odour similar to ammonia, was supplied by Sigma-
Aldrich with purity ≥99 mol%. A proprietary film forming corrosion inhibitor (FFCI)
was utilized, having an amber colour with a moderate odour. The FFCI has a flash
point of >62 °C, density of 1.025-1.095 (16 °C) and is completely soluble in water.
Sodium hydroxide (≥97 mol%) and hydrochloric acid (32 wt%) supplied by Sigma-
Aldrich were used to maintain the desired pH level and to ensure neutralization of
MDEA during the switchover. Deionized water (electrical resistivity of 18.2 MΩ cm
at 24.5 °C) and nitrogen (99.9959 mol%) were produced within the laboratory.
Methane (ultra-high purity 99.995 mol%) and a synthetic natural gas mixture were
sourced from BOC company for the hydrate inhibition testing (see Table 3.2).

60
Table 3.2: The composition of natural gas used in this study.
Component Mole fraction
Methane 0.791
Ethane 0.070
Propane 0.040
n-Butane 0.020
iso-Butane 0.020
n-Pentane 0.017
iso-Pentane 0.017
Carbon dioxide 0.025
MEG concentration throughout the plant was measured using an ATAGO PAL-91S
portable refractometer (accuracy of ±0.4%). Accurate pH measurements are required
to help lower the risk of scale formation and corrosion. Such pH measurements are
complicated, as MEG and other additives have an effect on pH measurement and
interference with the electrode's liquid junction potential can result in erroneous pH
measurements (Bates, 1964; Kan et al., 2002a; Mussini et al., 1991). Thus, we adopted
the method of Sandengen et al. (2007) for determining pH and installed Mettler-Toledo
InPro 4800i pH sensors (accuracy of <0.1% @ 25 °C) into the flow lines throughout
the plant to obtain continuous measurements (Sandengen et al., 2007). The probes
were thoroughly cleaned with deionized water and calibrated before and after
experiments. Mettler-Toledo InPro 7100 sensors (accuracy of ±5% or better) were
used throughout the facility to measure electrical conductivity, they have an operating
temperature of 0-135 °C. The sensors were properly cleaned with deionized water and
calibrated prior to use in experiments according to manufacturer's instructions. A
HPLC system (Dionex U3000 with CAD detector, flow accuracy of ±0.1%) was used
for hourly measurement of residual FFCI concentrations to control the FFCI dosage
rate. In addition, fluid compositions, MDEA concentration, and organic acids were
analysed using an Ion Chromatography system (Dionex ICS-2100, flow accuracy of
<0.1%), while alkalinity was monitored using a potentiometric titrator (HI902
accuracy of ±0.5% monovalent; ±1% divalent).

61
3.2.2 Procedure
The prepared fluids (brine, lean MEG, and FFCI) were transferred to the FB, where
they were mixed, simulating the high sheer stresses experienced in pressure reduction
valves and turbulent pipeline flow. The resulting salt-laden rich MEG (56.9 wt% MEG
in brine) was then routed to the pre-treatment unit, where divalent salts were removed.
The resulting solution (contaminated with salts of monovalent cations) was stored in
the rich glycol tank as feed for the regeneration unit. Then, this solution was pumped
into the regeneration unit, where water was removed by distillation to form lean MEG
at 80 wt% MEG. The output stream from the regeneration unit was divided into two
streams; a slipstream went to the reclamation unit and the remainder went to the LGT.
The proportion of output stream directed to the slipstream was dependent on the
allowable limit of high soluble salts in the final lean MEG solution used in the
operation. In this study, a slipstream of 35% of the output from the regeneration unit
was directed toward the reclamation unit. The reclamation slipstream portion of lean
MEG from the regeneration unit was routed to the rotary flask, controlled via a level
sensor. The solution was flashed in the rotary flask, operating in vacuum conditions at
∼10 kPa. Operating in vacuum conditions allows for the use of lower temperatures,
which prevents the thermal oxidation of MEG (Latta et al., 2013). The rotary flask was
heated to a temperature of ∼130 °C by submerging it into an oil bath running at
∼160 °C. Uniform distribution of heat was maintained by rotating the flask at a rate of
30 rpm. The MEG and water mixture vapour was cooled in the overhead condenser
and collected in the collection flask. The condenser was cooled by a chiller operating
at a temperature of 5.5 °C. The collected lean MEG, referred to as reclaimed MEG,
was automatically transferred to the LGT. At the end of the experiment, the
accumulated salt slurry was carefully removed from the rotary flask.
The switchover (MDEA to FFCI) was performed in a series of discrete steps, with
MEG chemistry measured and stabilized after each step. Within each step, the dosage
of each chemical was sequentially increased or decreased, based on regular sample
analysis. Neutralization of MDEA was performed in four stages to reduce the risk of
an excessive build-up of neutralized MDEA salts, which increases MEG solution
viscosity, and to reduce the risk of hydrochloric acid (HCl) overdose, which may
reduce the pH to levels at which corrosion rates are unacceptably high. Samples were

62
taken every 3 h and analysed, while samples to check for FFCI concentration in the
FB and the LGT were taken on an hourly basis to prevent overdosing. The
concentration of FFCI to be dosed into the LGT was determined using Eqn. (3.1),
assuming that no chemical reactions or other losses occurred.
𝑐(𝑡) = (1 − 𝑒−𝑡𝜏) 𝑐𝑎 + 𝑐𝑏 (3.1)
where t is time, τ is retention time, ca is the feed (FFCI) concentration, and cb is the
concentration of FFCI already in the vessel.
Table 3.3: Target concentrations of FFCI and MDEA.
MDEA (mM) — LGT FFCI (ppm) — FB
Initial End Initial End
100 0 (minimum) 0 1500
The material balance for the entire process is shown in Figure 3.3, with the target
concentrations of FFCI and MDEA shown in Table 3.3. When the ramp-up of FFCI
injection was completed and the rich MEG chemistry had stabilized, the cycle was
ended. Each cycle represents a complete inventory turnover. The process was
conducted for eight cycles and the entire experiment was performed twice to observe
repeatability of the results and to improve facility operations.
Figure 3.3: Material balance for the MEG pilot plant operation (cycle time of ∼10 h).

63
As for gas hydrate inhibition performance of the reclaimed MEG samples, the widely
popular isochoric test method was employed for determining the hydrate dissociation
(thermodynamic equilibrium) conditions, while hydrate formation points were visually
observed over at least 5 runs. For all tests, a step-cooling and heating rate of 1 °C/h
was adopted (Sloan Jr and Koh, 2007). Each test was conducted at least three times to
test repeatability. Details of the procedure and test apparatus for hydrate testing have
been explained in previous research studies (Alef et al., 2018a, 2018c; AlHarooni et
al., 2017; Smith et al., 2016).
Results and Discussion
3.3.1 Switchover Operation
The objective of the switchover study was to determine if optimum operating
conditions existed with the current plant configuration for the removal of both organic
acids and MDEA, while also performing all the other necessary MEG plant processes,
such as removal of unwanted salts. It was expected that pH would play a key role, as
adjusting the pH level in the pre-treatment unit for the precipitation of divalent cations
affects the required pH in the reclamation unit and, thus, the removal of organic acids
and MDEA may have become problematic. The effect of pH on the MEG operation
and, in particular, the reclamation unit was investigated by operating at different pH
levels over the duration of the experiment. The initial pH target was set to 10 in the
LGT and gradually stepped down by an amount of ∼0.5 pH units each cycle via HCl
neutralization. The experimentally measured pH values did not differ much (0.98%
variance) from the target pH (see Figure 3.4), indicating that minimal overdosing of
chemicals (sodium hydroxide (NaOH) and HCl) occurred. The lower pH level in the
FB as compared to pH level within the LGT was the result of the initial makeup of rich
MEG and the dissolved CO2 gas.

64
Figure 3.4: Target pH compared to actual pH in the lean glycol tank (LGT) and feed
blender (FB).
Figure 3.5 shows FFCI and MDEA concentrations throughout the experiment within
the FB and LGT, respectively. The target FFCI concentration within the FB was
1500 ppm, with a mean value of 1555 ppm, showing a standard deviation of 190 ppm.
The target MDEA concentration within the lean MEG at the end of the experiment was
optimistically set to zero, or as low as possible. However, the results show that the
lowest concentration of MDEA achieved at the end of the experiment was 40–60 mM.

65
Figure 3.5: Actual and target MDEA and FFCI concentrations as a function of time.
The efficiency of the reclamation unit can be assessed with regard to the removal of
salts and chemicals through electrical conductivity measurements. Figure 3.6
illustrates the electrical conductivity measurements of the MEG solution from the
reboiler (feed to reclamation unit) and reclaimed MEG solution. As Figure 3.6
indicates, throughout the experiment, electrical conductivity was much lower in the
reclaimed MEG solution compared with the feed to the reclamation unit. The
difference ranges between ∼2200 μS/cm, with a removal efficiency of 96%,
confirming that the reclamation unit is highly efficient in removing the salts arriving
in the feed solution. An increasing trend can be seen in the measured electrical
conductivity of the MEG stream from the reboiler as well as a bump (80-200 μS/cm)
between t = 20-70 h in the reclaimed solution. This increase can be attributed to the
failure to remove MDEA as a result of unfavourable pH conditions and the lack of
precipitation of divalent cations in the pre-treatment unit, which increased electrical
conductivity in the MEG solution from the reboiler and reclamation units.

66
Figure 3.6: Electrical conductivity (EC) of post-reboiler and reclaimed MEG
solutions.
3.3.1.1 Effect of pH on MDEA removal
The removal of MDEA is essential once formation water is produced. pH stabilizers
elevate the pH of the system and, thus, increase scale formation and precipitation of
divalent salts (Bikkina et al., 2012; Latta et al., 2013). Eqn. (3.2) to (3.5) show the
breakdown of MDEA into its salt form, and the reaction of divalent ions, such as
calcium ions (Ca2+), with carbonate for precipitation of salts (Flaten et al., 2008; Latta
et al., 2013).
𝑀𝐷𝐸𝐴 + 𝐻20 + 𝐶𝑂2 → 𝑀𝐷𝐸𝐴𝐻+ + 𝐻𝐶𝑂3
− (3.2)
2𝐻𝐶𝑂3− ↔ 𝐶𝑂3
2− + 𝐻2𝑂 + 𝐶𝑂2 (3.3)
𝐶𝑎𝐶𝑙2 ↔ 𝐶𝑎2+ + 2𝐶𝑙− (3.4)
𝐶𝑎2+ + 𝐶𝑂32− → 𝐶𝑎𝐶𝑂3 (3.5)
The concentration of MDEA was measured in the feed stream to the reclamation unit
(post-reboiler) and in the reclaimed MEG stream. MDEA concentrations together with
the pH of reclamation stream have been plotted in Figure 3.7. The pH of the reclaimed
solution at the beginning (0–20 h) was high (>10) in part because of the initial mixing
of the chemical additives in each section of the plant, but mainly because of the initial
high concentrations of MDEA (∼100 mM). As Figure 3.7 shows, at this high pH range,
MDEA concentration was accumulating in the reclaimed MEG solution, indicated by

67
the orange-shaded region. This signifies that none or very little MDEA was being
removed in the reclamation unit. From t = ∼13.5 to ∼45 h, the MDEA concentration
in the reclaimed MEG solution steadily decreased, while the pH dropped from ∼10.5
to 9. Beyond the 45-h mark until t = ∼73 h, the pH remained stable at ≤ 9 and MDEA
continued to be removed from the reclamation stream (see the green-shaded region in
Figure 3.7). At this lower pH range, the reclamation unit was able to convert MDEA
to its salt form and, thus, it was precipitated out in the slurry. It was able to remove
MDEA at an average rate of 14%. At this rate, it would take 425 h to completely
remove MDEA from the MEG inventory, which is equivalent to 42.5 inventory
turnovers. Beyond the t = ∼73 h mark, the pH rose to about 9, and MDEA
concentration within the reclaimed MEG stream began to increase (orange-shaded
region). Clearly, a higher removal rate is required for a feasible operation. This could
be achieved by further lowering the pH level within the reclamation unit.
Figure 3.7: pH and MDEA concentration in post-reboiler and reclaimed MEG
solutions as a function of time.

68
3.3.1.2 Effect of FFCI
The FFCI concentration in the feed to the reclamation unit compared with that in the
reclaimed MEG solution is plotted in Figure 3.8. The results clearly show that FFCI
was completely removed in the reclamation unit. No measurable FFCI was found in
the reclaimed MEG solution (detection limit < 0.005 ppm). Further, FFCI is not a
polymer (i.e., it is non-volatile), so full removal was expected. However, the removal
of FFCI in the reclamation unit is not favourable when the adopted corrosion control
method utilizes FFCI, as it requires constant reinjection of FFCI, which increases
costs, albeit FFCI may be utilized in small quantities. Further, the pH range in the
reclamation stream does not seem to influence the removal of FFCI. Figure 3.9 shows
the gradual change in the salt slurry residues in the reclamation unit at various times
during the experiment. Interestingly, FFCI accumulation in the reclamation unit results
in a very different salt slurry residue compared with the harder, solid slurry residue
that occurred when FFCI was not used. A discoloration of the residue within the
reclamation unit was observed; the slurry was light brown initially and became very
dark brown as the cycles progressed. Further, the viscosity at t = 0 h (i.e., 80 wt%
MEG) was 8.97 mPa-s, while the viscosity of the final salt slurry residue, at t = ∼90 h,
was 1430.53 mPa-s, which corresponds to a ca. 159-fold increase in viscosity. The
change in colour and increase in viscosity may have been caused by changes in the
solution chemistry due to the degradation of products resulting from thermal oxidation
and the accumulation of FFCI, MDEA, and organic acids in the slurry. The residue
remained in liquid form but with a high viscosity (1430.53 mPa-s), whereas it was dry
and solid when there was no FFCI in the solution. Detrimental side effects can occur
with residue viscosity and hardness, as blockages in discharge lines can lead to sudden
shutdowns of equipment. This indicates that the type of residue must be taken into
account when considering design, especially when corrosion control methods switch,
as varying chemical additives are utilized.

69
Figure 3.8: pH and FFCI concentration in post-reboiler and reclaimed MEG solutions
as a function of time.
Figure 3.9: Physical and colour changes in salt slurry from the reclamation unit with
and without FFCI.

70
3.3.1.3 Effect of pH on Acetic Acid Removal
Like MDEA removal, it is vitally important to remove acetic acid because of the
increased corrosion risks involved. Acetic acid may accumulate in the MEG closed
loop through the production of formation water (Latta et al., 2013) or if thermal
oxidation of MEG occurs, as formic, glycolic, and acetic acids are produced
(AlHarooni et al., 2015; Haque, 2012; Nazzer and Keogh, 2006). It is well known that
acetic acid in the presence of CO2 will increase corrosion of mild and carbon steel
pipelines (Crolet et al., 1999; Ikeh et al., 2016; Liu et al., 2008), and increase top-of-
the-line corrosion (Amri et al., 2009; Mendez et al., 2005; Svenningsen and Nyborg,
2014). Further, acetic acid may react with carbonate and bicarbonate present in the
MEG stream to produce carbon dioxide, which lowers the pH and, thus, increases the
corrosion rate (Halvorsen and Andersen, 2003; Lehmann et al., 2014).
The results show that there is a relationship between the reclaimed solution's pH and
acetic acid concentration (see Figure 3.10). At pH levels above 10 (t = 0-13.5 h), there
was no acetic acid present in the reclaimed MEG solution, but an average of 350 ppm
of acetic acid was present in the input feed, indicating that the reclamation unit was
effective in removing acetic acid. For t = 13.5-22.5 h, the pH steadily dropped to ∼9.6
and acetic acid was removed at a rate of 39%. In contrast, at pH levels below ∼9.6
(t = 22.5-80 h), the removal rate of acetic acid dropped to 29%. However, acetic acid
concentration steadily decreased and tended toward zero, as the pH level started to
increase above ∼9.6 at t ≥ 80 h, with a removal rate of 76%. The greater removal rate
of acetic acid was due to the higher pH resulting in a high neutralization rate of acetic
acid in the reclamation unit. Further, a lower pH level caused a decrease in the rate of
the neutralization reaction between alkalinity and organic acids and, hence, lower
removal rates were witnessed (pH ≤ 9.6) over the period of t = 22.5-80 h (see Figure
3.10). It is clear that to remove organic acids such as acetic acid, the reclamation unit
needs to be operated at high pH levels so that organic acids can be dissociated and then
precipitated out of the reclaimed MEG solution in their salt form.

71
Figure 3.10: pH and acetic acid concentration in post-reboiler and reclaimed MEG
solutions as a function of time.
3.3.1.4 Effect of pH on Divalent Salts Removal
The MEG pre-treatment unit was utilized to precipitate divalent salts, which prevents
scale formation across the plant and downstream equipment (Baraka-Lokmane et al.,
2013, 2012). For the precipitation reactions to occur, increased temperature, adequate
residence time, and a sufficiently high pH must be established within the pre-treatment
unit (Flaten, 2010; Montazaud, 2011). It was found that at t = 0 to ∼62 h, the pH was
below 8. At this pH level, the Ca2+ concentration was accumulating in the MEG
inventory and was not being precipitated out in the pre-treatment unit as required. At
t = ∼62 h, NaOH was injected into the pre-treatment unit to increase the pH level to
above 8, which resulted in very quick precipitation of divalent salts from the MEG
inventory. Analysis showed that Ca2+ concentration dropped from 24 ppm to as low as
9 ppm while the Mg2+ concentration was not affected by the changes in pH.
3.3.2 Natural Gas Hydrate Inhibition
3.3.2.1 Preliminary Hydrate Testing
Preliminary hydrate testing was conducted, involving comparisons with the literature
and prediction software, to determine apparatus accuracy and reliability of results. The

72
methane hydrate phase boundary was determined for a 30 wt% MEG solution over the
pressure range of 8–18 MPa. The phase boundary is plotted in Figure 3.11, and the
equilibria data points are tabulated in Table 3.4. Our results closely match the
prediction results of Infochem's Multiflash (Infochem Multiflash, 2007), which utilizes
the Association (CPA-Infochem) fluid phase model. The absolute average relative
error (AARE) was calculated, using Eqn. (3.6), as 3.6%. Hydrate equilibria data
obtained from the literature for the same system had a combined AARE of 4.7%
(Haghighi et al., 2009b; Robinson and Ng, 1986). Thus, our results have low AAREs
compared with the results from simulation and the existing literature, which suggests
that our equilibria data are fairly accurate.
AARE (T) = 100
𝑛∑|
𝑇𝑐𝑎𝑙𝑐 − 𝑇𝑒𝑥𝑝
𝑇𝑒𝑥𝑝|
𝑛
𝑖=1
(3.6)
Table 3.4: Phase equilibrium data for 30 wt% MEG solution compared with
Multiflash prediction and literature.
Methane + MEG (30
wt.%)
Multiflash CPA Robinson and
Ng (1986)
Haghighi et al.
(2009)
P/MPa T/°C AARE/% AARE/% AARE/%
17.62 7.1 2.8 7.8 3.9
15.24 6.1 0.2 5.1 3.0
12.53 4.7 3.9 0.9 2.3
9.46 2.4 7.5 2.4 12.1
Average (AARE) 3.6 4.0 5.3

73
Figure 3.11: Methane hydrate phase boundary for 30 wt% MEG solution compared
with Multiflash prediction and literature (Haghighi et al., 2009b; Robinson and Ng,
1986; Vajari, 2012).
3.3.2.2 Reclaimed MEG Hydrate Equilibria
The hydrate inhibition performance of the reclaimed MEG was evaluated by testing
three samples (see Table 3.6) that came directly from the reclamation unit over the
duration of the experiment. The test solutions were tested for natural gas hydrate
inhibition, as opposed to pure methane, to ensure relevance to field scenarios, in which
structure 2 (sII) hydrates are typically formed (the natural gas composition was given
in Table 3.2). Hydrate formation and dissociation measurements were taken over the
pressure range of 8-18 MPa and are tabulated in Table 3.5.
Table 3.5: Hydrate formation and dissociation (equilibria) data from this study.a
Pure MEG – Natural Gas + MEG (35 wt.%)
P/MPa
T/°C
18.16
10.5
14.94
9.7
12.61
8.9
8.57
7.3

74
Sample A – Natural Gas + MEG (35 wt.%)
Formation Dissociation
P/MPa T/°C
P/MPa T/°C
17.65 3.7
17.12 9.5
15.76 3.4
14.87 9
12.23 2.5
13.02 8.5
9.87 1.6
8.93 7.1
Sample B – Natural Gas + MEG (35 wt.%)
Formation Dissociation
P/MPa T/°C
P/MPa T/°C
17.44 6
18.24 11.2
15.73 5.6
15.41 10.4
12.76 4.5
12.34 9.5
9.78 2.9
8.67 8.1
Sample C – Natural Gas + MEG (35 wt.%)
Formation Dissociation
P/MPa T/°C P/MPa T/°C
17.93 6.4 17.71 10.8
15.34 5.9 15.24 10.1
12.83 5.3 12.45 9.3
9.14 3.1 9.32 8
a Uncertainties are expanded uncertainties (U) calculated according to ISO’s
guidelines at a 95% level of confidence: U(P) = ±0.05 MPa; U(T) = ±0.03 °C (BIPM
et al., 2008).
The left of the formation curve is known as the unstable zone, where spontaneous
hydrate formation occurs. On the right-hand side of the dissociation/equilibrium curve,
hydrate formation is impossible (Mullin, 2001). In the hydrate-stable region, hydrates
may not form because of metastability, which refers to the persistence of the non-
equilibrium state (Sloan Jr and Koh, 2007). Mullin (2001) described this region as one
where spontaneous hydrate formation is improbable; however, in the presence of a
hydrate crystal seed, growth will occur on the seed. Hydrate-stable regions were
calculated from the formation and dissociation (equilibrium) curves using the definite
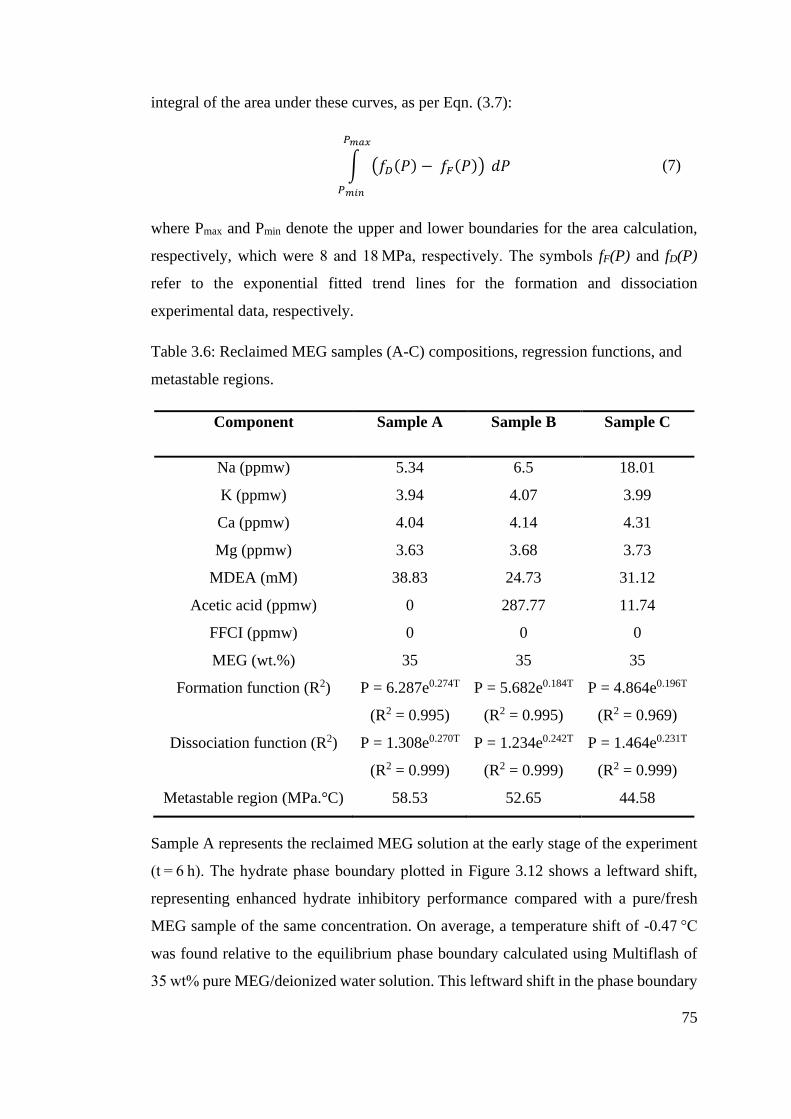
75
integral of the area under these curves, as per Eqn. (3.7):
∫ (𝑓𝐷(𝑃) − 𝑓𝐹(𝑃))
𝑃𝑚𝑎𝑥
𝑃𝑚𝑖𝑛
𝑑𝑃 (7)
where Pmax and Pmin denote the upper and lower boundaries for the area calculation,
respectively, which were 8 and 18 MPa, respectively. The symbols fF(P) and fD(P)
refer to the exponential fitted trend lines for the formation and dissociation
experimental data, respectively.
Table 3.6: Reclaimed MEG samples (A-C) compositions, regression functions, and
metastable regions.
Component Sample A Sample B Sample C
Na (ppmw) 5.34 6.5 18.01
K (ppmw) 3.94 4.07 3.99
Ca (ppmw) 4.04 4.14 4.31
Mg (ppmw) 3.63 3.68 3.73
MDEA (mM) 38.83 24.73 31.12
Acetic acid (ppmw) 0 287.77 11.74
FFCI (ppmw) 0 0 0
MEG (wt.%) 35 35 35
Formation function (R2) P = 6.287e0.274T
(R2 = 0.995)
P = 5.682e0.184T
(R2 = 0.995)
P = 4.864e0.196T
(R2 = 0.969)
Dissociation function (R2) P = 1.308e0.270T
(R2 = 0.999)
P = 1.234e0.242T
(R2 = 0.999)
P = 1.464e0.231T
(R2 = 0.999)
Metastable region (MPa.°C) 58.53 52.65 44.58
Sample A represents the reclaimed MEG solution at the early stage of the experiment
(t = 6 h). The hydrate phase boundary plotted in Figure 3.12 shows a leftward shift,
representing enhanced hydrate inhibitory performance compared with a pure/fresh
MEG sample of the same concentration. On average, a temperature shift of -0.47 °C
was found relative to the equilibrium phase boundary calculated using Multiflash of
35 wt% pure MEG/deionized water solution. This leftward shift in the phase boundary

76
was due to the presence of MDEA in the MEG solution. Composition analysis of
sample A show that 38.83 mM of MDEA was within the solution (see Table 3.6); the
presence of MDEA was caused by the failure to remove it during reclamation (see
Figure 3.7). Recent studies have suggested that MDEA may perform as a
thermodynamic hydrate inhibitor. Thus, our results confirm that MDEA enhances the
inhibition effect of 35 wt% MEG solution (Akhfash et al., 2017; AlHarooni et al.,
2017). The metastable region for sample A is plotted in Figure 3.13. Compared with
samples B and C, sample A had the greatest metastable region of 58.53 MPa °C,
possibly as a result of less thermal exposure time and the added inhibition effect of
MDEA with MEG (see Table 3.6).
Figure 3.12: Natural gas hydrate phase boundaries for reclaimed MEG samples A-C.

77
Figure 3.13: Hydrate metastable region for reclaimed MEG sample A.
Sample B represents the reclaimed MEG solution extracted during the middle stage of
the experiment (t = 45 h). As shown in Figure 3.12, the hydrate phase boundary for
sample B shifted rightward by 0.79 °C beyond the phase boundary of the pure MEG
solution of the same concentration. This rightward shift in the hydrate phase boundary
indicates a lower inhibitory performance due to the removal of MDEA from reclaimed
MEG, as well as a hydrate promotion effect. Possible reasons for hydrate promotion
are thermal degradation of the MEG and the presence of degradation products of MEG
and MDEA. It is clear from Figure 3.7 that MDEA concentration decreased (equivalent
concentration of 24.73 mM in 35 wt% MEG) because of lower pH conditions, which
aid in the precipitation of MDEA out of the MEG solution. Thus, the added hydrate
inhibitory performance from the proportional MDEA concentration in a 35 wt% MEG
solution was diminished. Figure 3.10 shows that between t = 30 and 50 h, acetic acid
concentration within the reclaimed MEG solution was accumulating because the pH
level was below the high level required for the removal of acetic acid. Further, the
acetic acid concentration increased beyond the input concentration found in the MEG
stream from the reboiler, suggesting that MEG may have suffered thermal degradation.
Several studies have determined the degradation products of MEG to be acetic, formic,
and glycolic acids (AlHarooni et al., 2015; AlHarooni et al., 2016; Psarrou et al., 2011;
Rossiter et al., 1985). AlHarooni et al. (2015) reported that MEG degradation

78
decreases the ability of MEG to act as a hydrate inhibitor after they exposed samples
to high temperatures over 48 h (AlHarooni et al., 2015). However, our study was
conducted at a temperature range of 130 ± 5 °C, over a total period of 45 h, as opposed
to the high temperatures (165-200 °C) utilized by AlHarooni et al. (2015), suggesting
that MEG degradation may also occur at lower temperatures or over a prolonged
thermal exposure time. In terms of metastable regions, sample B has an area of
52.65 MPa °C, which is a 10% decrease compared with sample A (see Figure 3.14).
Figure 3.14: Hydrate metastable region for reclaimed MEG sample B.
Sample C represents the reclaimed MEG solution that was extracted at the end of the
experiment (t = 90 h). Sample C had better hydrate inhibitory performance than sample
B. The hydrate phase boundary shifted rightwards by 0.50 °C beyond the phase
boundary of a pure MEG solution of the same concentration. The rightward shift may
be due to the extended thermal exposure time (∼90 h) and consequent accumulation
of degradation products. Table 3.6 shows that sample C had a higher concentration of
MDEA (hydrate inhibitor) than sample B, which explains the slightly better
performance. In terms of the metastable regions, sample C has the smallest area of
44.58 MPa °C when compared with the areas of samples A and B (see Figure 3.15 and
Table 3.6). This smaller metastable region is of concern and may be due to the
extended thermal exposure time.

79
Figure 3.15: Hydrate metastable region for reclaimed MEG sample C.
Conclusion
Overall, the study confirms that operating the MEG loop system is dependent on a
complex balance of pH between the different units involved. MDEA, acetic acid, and
salts need to be progressively removed from the MEG inventory. If MDEA remained,
there would be an increased potential for scale formation in the presence of formation
water, as the barium and calcium ions appear. The study found that a pH of ≤9 was
required to sufficiently remove MDEA in the reclamation unit. A pH of at least 9.6
was required to neutralize the acetic acid and remove it in its salt form in the
reclamation unit. Further, a pH level above 8 was required in the pre-treatment unit to
effectively precipitate out divalent salts. Ultimately, with the current plant
configuration, the pH in the pre-treatment unit directly affects the pH in the consequent
process units, including the reclamation unit. To address this issue, it is recommended
that a new acid injection point be inserted after the pre-treatment unit, but before the
regeneration unit, to decrease the pH, yet allow the pre-treatment unit to operate at the
required pH. The acid injection will decrease the pH of the MEG solution entering the
regeneration unit to levels below 7 and, thus, allow volatile acetic acid to be easily
removed via the reflux drum alongside water. The consequent pH in the feed to the
reclamation unit will be sufficiently low for MDEA to be successfully removed at a
80
greater rate than the 14% found with the current plant configuration. As for FFCI, the
study has confirmed that pH conditions do not influence FFCI removal and that it was
completely removed. Thus, complete FFCI loss in the slipstream to the reclamation
unit can be expected. This may lead to increased costs because of the constant top up
required, as FFCI is lost in the slipstream proportion. Further, FFCI accumulation in
the reclamation slurry leads to a highly viscous residue (1430.53 mPa-s), which could
potentially cause problems inside the reclamation unit, leading to downtime and
increased maintenance. Therefore, the study recommends the consideration of designs
to be put in place within facilities to handle chemical compounds such as FFCI
accumulation.
The natural gas hydrate inhibition performance of reclaimed MEG from the initial,
middle, and final stages of the experiment were evaluated. The initial sample showed
the best performance because of the low thermal exposure time and the presence of
MDEA which is known to act as a hydrate inhibitor. The middle sample showed the
worst performance because of the prolonged thermal exposure (45 h), even though
temperatures were kept around 130 °C, and the presence of smaller concentrations of
MDEA. Interestingly, the final sample showed better performance than the middle
sample but had the lowest metastable region of all three samples. The results suggest
that MEG degradation may even occur at low temperatures over extended thermal
exposure times and in low pH conditions.
81
Effect of Salt-Laden Degraded MEG on Gas Hydrate
Inhibition
This chapter is comprised of the following publication:
• Alef, K., Barifcani, A., 2018. The Effect of Salt-Laden Degraded MEG on Gas
Hydrate Inhibition. Presented at the SPE Kingdom of Saudi Arabia Annual
Technical Symposium and Exhibition, Society of Petroleum Engineers. doi:
10.2118/192447-MS
In this study, MEG solution with realistic brine composition was tested for its gas
hydrate inhibition performance. The typical lean-MEG solution was prepared by
combining pure MEG in a brine solution based on common formation water salt
composition. The degraded samples were extracted from a MEG recovery pilot plant
that had undergone a complete recovery operation (~13 h) sustaining high exposure
temperatures. Samples were then taken for gas hydrate testing using a high-pressure
PVT cell. The isobaric hydrate testing method was employed for accurate hydrate
equilibria results.
The new hydrate equilibria data revealed a hydrate promotion effect amongst the
degraded MEG samples as opposed to pure non-degraded MEG. Although salt in the
MEG solution improved hydrate inhibition, the results show that the inhibition effect
was decreased as the extent of MEG degradation increased. Furthermore, MEG
degradation products were identified to be acetic, formic, and glycolic acid.
Observations reveal a colour change from colourless to slightly yellow depending on
the extent of thermal degradation of the MEG samples. This contribution satisfies the
thesis objectives (a), (b), and (d) while fulfilling the research gaps outlined in Section
1.3.

82
Introduction
Natural gas has increasingly become a profitable alternative to meet energy demands.
However, the formation of gas hydrates continues to be a major challenge in the
production and transportation of natural gas. For the least, hydrates can cause
blockages in pipelines and thus severely disrupt gas production, and in some cases,
they have the potential to even cause explosions in pipelines (Koh et al., 2011; Sloan
Jr and Koh, 2007).
Hydrates are crystalline solids which are composed of molecules of gas and water. The
gas molecules are known as ‘guest molecules’, become confined by the host; the host
being cavities in the cage formed by water molecules. Common natural gas molecules
include carbon dioxide, methane, ethane, and propane (Eslamimanesh et al., 2011;
Sloan Jr and Koh, 2007). Such hydrates thus form in the presence of water and gas
molecules at high pressure and low-temperature conditions (Zarinabadi and Samimi,
2011). These conditions commonly exist in subsea production and process lines, hence
the need for hydrate inhibition. Certain techniques, if applied could eliminate at least
one of these conditions: low temperatures can be eliminated by heating or thermal
insulation; high pressures can be eliminated by depressurization, and water can be
eliminated through natural gas dehydration by glycol or molecular sieves (Samimi,
2012). However, these techniques are not always applicable and may not be cost-
effective (Sloan Jr and Koh, 2007; Son and Wallace, 2000).
Conventionally, thermodynamic hydrate inhibitors (THIs) are injected at the wellhead
for the purpose of lowering the risk of hydrate related problems. THIs shift the hydrate
equilibrium phase boundary to a higher pressure and lower temperature region thus
allowing pipeline operating conditions to be within a hydrate-free region (Li et al.,
2006). THIs are required in large volumes for an effective hydrate inhibition program.
Common inhibitors that are utilized in the industry include methanol and
monoethylene glycol (MEG). Although a larger volume of MEG is required as
compared to methanol for the same hydrate formation temperature depression, MEG
proves to be superior of the two. This is due to the lower volatility of MEG and lower
solubility in gas, thus resulting in lower losses of MEG to the hydrocarbon phase as
compared to methanol. Furthermore, the resulting water from a MEG system is cleaner
than a methanol system, hence imposing no environmental concerns (Bikkina et al.,

83
2012). MEG also poses more benefits as an inhibitor than other glycols such as
diethylene glycol (DEG) and tri-ethylene glycol (TEG), as MEG is more efficient in
terms of weight to effectiveness ratio, and has little effect in changing the viscosity of
water than other glycols (Hemmingsen et al., 2011). Furthermore, Brustad et al. (2005)
suggest that MEG yields better suppression performance when compared to TEG due
to lower molecular weight (Brustad et al., 2005). However, the greatest advantage of
MEG over other THIs is the ability to be recovered using MEG regeneration units
(MRUs) for continuous re-injection thus decreasing costs.
MRUs or the MEG recovery process is often established between offshore platforms
(wellheads) and receiving facilities (onshore). The natural gas with associated
condensate, produced water and used MEG also known as rich-MEG (MEG with
contaminants from the production line) comes out of the well and into a production
facility where phase separation will occur. The three-phase separator will then separate
the fluid into gas, hydrocarbon liquid, produced water and rich-MEG. The rich-MEG
stream will go through the MEG recovery process, whereas the produced gas and
hydrocarbon liquid will be sent onshore for further processing. MEG recovery consists
of two primary stages; regeneration and reclamation, and may sometimes include a
MEG pre-treatment stage for the removal of potentially dangerous divalent salts. The
MEG regeneration process involves the use of a reboiler and a distillation column to
distil off unnecessary water to form the desired lean-MEG concentration (typically 80-
90 wt%) required for re-injection (Psarrou et al., 2011). This process is performed
under ambient pressure and at a temperature that is enough to boil water off but not
MEG (typically >130 °C). This has been proved to be an effective process particularly
in the beginning of production and where the water contains low total dissolved solids
(TDS). However, as the field matures, there is an increase in the level of salt and other
substances in the rich-MEG stream due to the production of formation water or
remnant drilling fluids. These salts will pollute, accumulate and precipitate in the
processing facility, and will not only increase MEG viscosity but may create fouling
and deposition issues for the processing equipment (Bikkina et al., 2012). These salts
will also lead the system to be more susceptible to corrosion. As for the reclamation
stage of the process, it can be conducted in two modes; full-stream and slip-stream
reclamation. This depends on the allowable amount of salt in the final lean-MEG
solution ready for re-injection. In the slip-stream mode, a portion of the total output of

84
the MEG stream from the reboiler will undergo the reclamation stage. The reclamation
stage consists of flashing the incoming MEG stream in a flash separator to remove
soluble salts and non-volatile substances.
However, during the recoverability process, MEG may undergo multiple phases of
thermal exposure. This will usually lead to the degradation of MEG which in-turn
results in lower hydrate inhibition performance. Gas hydrates and prevention strategies
have been researched extensively due to the detrimental consequences of hydrates in
flow assurance. However, very little research exists that explores the effect of
degradation of MEG on hydrate formation especially salt-laden MEG solutions. Thus,
its behaviour in production and transportation systems need to be well researched to
meet safety and production demands. In this study, rich-MEG samples which had
undergone pre-treatment, regeneration and a slip-stream reclamation process were
tested in a high-pressure PVT cell for the hydrate inhibition performance.
Methodology
MEG solution samples were extracted from the lean-glycol storage tank of a MEG
regeneration/reclamation pilot plant (Figure 4.1). The MEG had undergone a pre-
treatment stage where divalent or insoluble salts were removed from the salt-laden
MEG solution which is typically performed to prevent scale formation within process
facilities (Latta et al., 2013). The resulting solution was then regenerated to the
required MEG concentration for reinjection into the wellhead – typically 70-90 wt%
(Halvorsen et al., 2006; Nazzer and Keogh, 2006). The output solution which was still
contaminated with soluble salts was then routed to the lean-glycol storage tank, whilst
a slip-stream was routed to the reclamation unit (Son and Wallace, 2000). In the
reclamation unit, the slip-stream portion was exposed to high temperatures to
evaporate MEG and water whilst leaving behind the soluble salts in the reclaimer sump
as waste. Once condensed, the reclaimed MEG solution was transferred to the lean-
glycol storage tank. The composition of the final MEG solution is given in Table 4.1.

85
Table 4.1: Salt-laden MEG solution composition.
Component Concentration (wt%)
MEG 80.20
Water 17.49
NaCl 1.75
KCl 0.55
Acetic acid 0.01
The hydrate testing of the MEG solution was conducted using a high-pressure PVT
sapphire cell as shown in Figure 4.1. The isobaric hydrate testing method was
employed with a step-cooling/step-heating rate of 1°C/h. At this rate, a homogenous
and steady hydrate formation process was facilitated and thus accurate results were
expected (Haghighi et al., 2009b). With this method, the gas hydrate equilibrium
conditions are determined visually. Researchers that have used this method have
attained accurate results when compared against results from other methods and
prediction calculations (Chen et al., 2010; Mohebbi et al., 2012; Windmeier and
Oellrich, 2014). The cell’s chamber was cleaned with ethanol and deionized water
prior to each test. A vacuum pump was then used to remove air and other gases from
the cell to ensure there were no contaminants that could potentially affect the results.
A sample (6 mL) of the MEG solution after dilution to 25 wt% MEG was then injected
into the cell. The cell comes equipped with a magnetic stirrer that can operate at 500
rpm which helps in the continuous renewal of the water/gas surface to allow hydrate
to form more readily and throughout the cell. The cell was then pressurized to the
desired test pressure with methane via a piston pump with the aid of a pneumatic
booster pump. Once, the test pressure was configured to be constant, the step-cooling
system was activated. The pressure and temperature of the moment when first hydrate
formation was detected were recorded. The cooling process was allowed to continue
until after all visible liquid was converted to hydrate and the magnetic stirrer was
brought to an abrupt stop due to hydrate blockage. At this stage, the step-heating
process was commenced to determine the dissociation point (thermodynamic
equilibrium) visually at the first sign of hydrate dissociation. These conditions were
recorded for all tests for consequent analysis and comparison studies.

86
Figure 4.1: Basic schematic of the experimental apparatus utilized in this study
including the PVT cell.
The materials utilized in this study are shown in Table 4.2. Deionized water was
produced in-house via reverse osmosis with an electrical resistivity of 18 MΩ·cm at
25.3 °C. Nitrogen was also produced in the laboratory using a nitrogen generator with
a purity of 99.997 %.
Table 4.2: Materials utilized in this study.
Chemical Supplier Purity (mol %) CAS
Number
Monoethylene glycol
(MEG)
Sigma-Aldrich 99.8 107-21-1
Ethanol Sigma-Aldrich ≥99.8 64-17-5
Methane BOC (Australia) 99.995 74-82-8
Sodium chloride (NaCl) Sigma-Aldrich ≥99.0 7647-14-5
Potassium Chloride (KCl) Sigma-Aldrich ≥99 7447-40-7
Results and Discussion
Hydrate testing was conducted on pure water to check the accuracy of the results of
the isobaric method and the experimental apparatus. The methane hydrate phase
boundary of pure water (deionized) was determined over the pressure range of 70-130
bar. The equilibrium data is plotted in Figure 4.2 and tabulated in Table 4.3.
Simulations of the hydrate experiments were conducted in HYSYS using the Peng-
Robinson equation of state to provide a comparison (Aspen HYSYS, 2007). An average

87
absolute percentage deviation (AAPD) of 2.5 % was found between our experimental
data and the HYSYS prediction. The formula for AAPD calculations is given in Eqn.
(4.1). Furthermore, results from the literature were also compared to our data (Carroll,
2014; Lu and Sultan, 2008; Maekawa, 2001), and an AAPD of 1.3 % was found. Both
AAPDs are relatively low in comparison to other literature and thus we can with
confidence say that our experimental data is very accurate.
Figure 4.2: Methane hydrate phase boundary of pure water compared to literature
and software.
AAPD = ∑|𝑇𝑐𝑎𝑙𝑐 − 𝑇𝑒𝑥𝑝
𝑇𝑒𝑥𝑝|
𝑛
𝑖=1
×100
𝑛 (4.1)
4.3.1 Salt-laden MEG
To investigate the effect of MEG degradation on hydrate formation, two solutions were
prepared. The first was prepared to provide a reference hydrate inhibition performance
and was considered as a non-degraded MEG solution. The non-degraded solution was
prepared with the same proportional salt composition as shown in Table 4.1 relative to
a MEG concentration of 25 wt%.
The MEG solution from the lean-glycol tank still contained salt after the recovery
process as only a slip-stream was fully reclaimed (Table 4.1). This solution was
considered as degraded MEG as it had undergone one complete recovery process

88
whilst exposed to a temperature range of 130 – 160 °C between the reboiler and
reclaimer. The solution was prepared for hydrate testing by dilution to 25 wt% MEG
with deionized water to match typical MEG concentrations found after injection into
wellheads.
The hydrate phase boundaries for both solutions are plotted in Figure 4.3 and the
equilibria data are provided in Table 4.3 with equilibrium temperature shifts.
Figure 4.3: Hydrate phase boundaries for non-degraded and degraded MEG samples
compared to HYSYS prediction.
Table 4.3: Methane equilibria data of this study with relative temperature shifts.
Pure water Pure MEG
(HYSYS-PR)
Non-degraded MEG Degraded MEG
P
(bar)
T
(°C)
P
(bar)
T
(°C)
P
(bar)
T
(°C)
Shift,
ΔT
(°C)
P
(bar)
T
(°C)
Shift,
ΔT
(°C)
70.0 9.7 70.0 3.0 70.3 0.7 2.3 70.1 1.3 1.7
89.9 11.9 80.0 4.0 90.0 2.8 1.2 90.2 3.4 0.6
110.1 13.7 110.0 6.6 110.2 4.7 1.9 110.0 5.3 1.3
130.0 15.0 130.0 7.9 130.1 5.9 2.0 130.2 6.6 1.3
The results show that the non-degraded MEG solution showed an enhanced hydrate
inhibition performance as compared to a pure MEG solution without the presence of
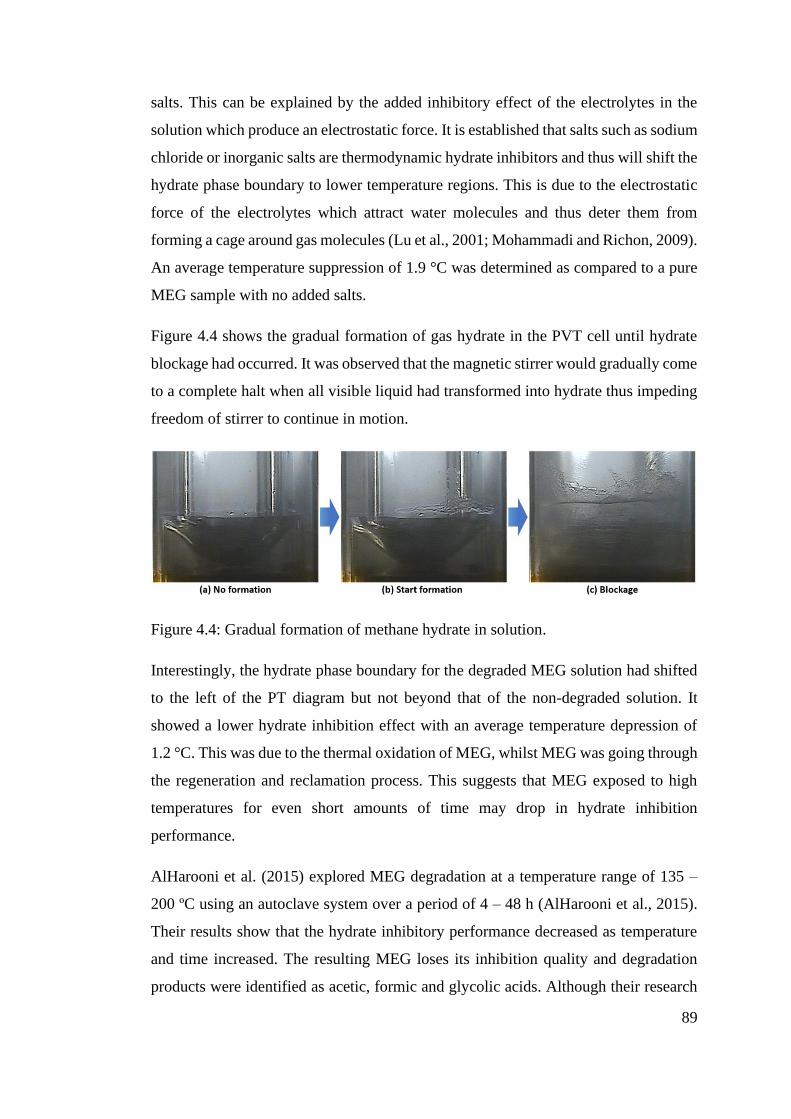
89
salts. This can be explained by the added inhibitory effect of the electrolytes in the
solution which produce an electrostatic force. It is established that salts such as sodium
chloride or inorganic salts are thermodynamic hydrate inhibitors and thus will shift the
hydrate phase boundary to lower temperature regions. This is due to the electrostatic
force of the electrolytes which attract water molecules and thus deter them from
forming a cage around gas molecules (Lu et al., 2001; Mohammadi and Richon, 2009).
An average temperature suppression of 1.9 °C was determined as compared to a pure
MEG sample with no added salts.
Figure 4.4 shows the gradual formation of gas hydrate in the PVT cell until hydrate
blockage had occurred. It was observed that the magnetic stirrer would gradually come
to a complete halt when all visible liquid had transformed into hydrate thus impeding
freedom of stirrer to continue in motion.
Figure 4.4: Gradual formation of methane hydrate in solution.
Interestingly, the hydrate phase boundary for the degraded MEG solution had shifted
to the left of the PT diagram but not beyond that of the non-degraded solution. It
showed a lower hydrate inhibition effect with an average temperature depression of
1.2 °C. This was due to the thermal oxidation of MEG, whilst MEG was going through
the regeneration and reclamation process. This suggests that MEG exposed to high
temperatures for even short amounts of time may drop in hydrate inhibition
performance.
AlHarooni et al. (2015) explored MEG degradation at a temperature range of 135 –
200 ºC using an autoclave system over a period of 4 – 48 h (AlHarooni et al., 2015).
Their results show that the hydrate inhibitory performance decreased as temperature
and time increased. The resulting MEG loses its inhibition quality and degradation
products were identified as acetic, formic and glycolic acids. Although their research

90
was useful for investigating how heat affects the hydrate inhibitory performance of
pure MEG, it did not properly represent the complex conditions present in typical
regeneration and reclamation plants in terms of temperature-pressure and the
chemistry of the various chemicals, impurities, and additives that are typically present
in industrial applications. Latta et al. (2016) produced a detailed outline with regards
to the various contaminants present in the different stages of the MEG recovery
process (Latta et al., 2016). It is the lean-MEG solution which is the combination of
the partial MEG stream which undergoes reclamation with a greater portion exiting
the reboiler. Hence, the injected MEG will contain various contaminants carried over
through the plant as well as MEG degradation products. The research by Psarrou et al.
(2011) suggests that formic, acetic and glycolic acids are the main by-products of MEG
degradation (Psarrou et al., 2011). In this study, we have shown that over the duration
of ca. 13 hours, MEG will have a reduced hydrate inhibitory effect due to possible
accumulation of contaminants in the MEG plant as well as thermal degradation of
MEG and its by-products.
It has been suggested by many studies that it is important to minimize the level of
dissolved oxygen in the MEG stream to prevent the conversion of iron carbonate into
iron oxide for the purpose of not only preventing a high corrosion rate but to also
prevent the thermal oxidation of MEG (Brustad et al., 2005; Latta et al., 2013).
Furthermore, exposure to high temperatures and metal ions in solution will also
contribute to accelerating the rate of MEG degradation.
Figure 4.5 shows the change in colour between the two solutions. As can be seen in
Figure 4.5(b) that the colour of the solution is slightly yellow. This colour change was
also observed by another researcher and was suggested that it is an indication of the
degradation of MEG (Psarrou et al., 2011). This confirms that degradation had
occurred in the MEG solution.

91
Figure 4.5: Change in colour between non-degraded and degraded MEG samples.
Conclusions
As there has only been a very limited amount of research done on the effect of
degradation of salt-laden MEG on hydrate inhibition, this study comes in handy.
Operators utilizing MEG, or flow assurance professionals using it as a hydrate
inhibitor, and/or in other MEG applications will find the results of this study
particularly useful. This study has produced new hydrate equilibria data of methane
hydrate in the presence of MEG solutions. The results reveal that although dissolved
salts may be present in the MEG solution which will provide an added inhibitory
performance, it can be expected that MEG may degrade due to thermal oxidation in
the recovery process which may ultimately decrease the quality and available quantity
of MEG to perform as a hydrate inhibitor. Taking this into consideration is crucial to
developing an optimum hydrate control program as well as addressing the dynamic
risk of gas hydrate formation in pipelines.
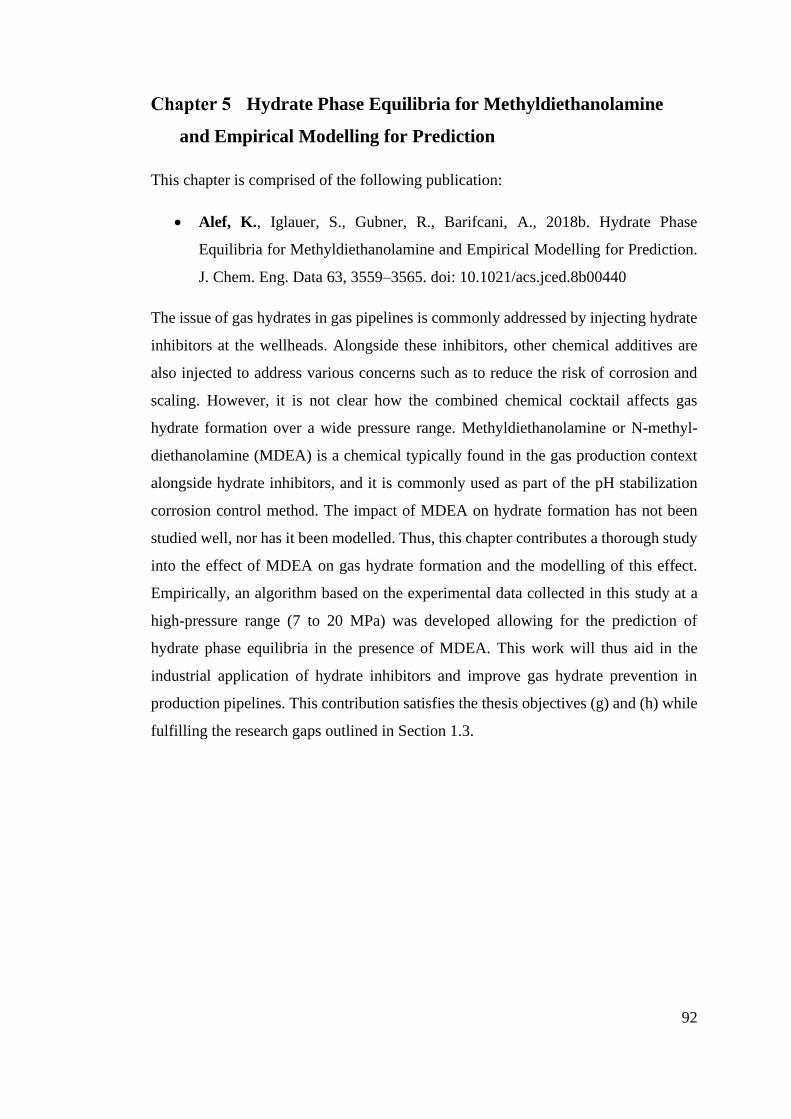
92
Hydrate Phase Equilibria for Methyldiethanolamine
and Empirical Modelling for Prediction
This chapter is comprised of the following publication:
• Alef, K., Iglauer, S., Gubner, R., Barifcani, A., 2018b. Hydrate Phase
Equilibria for Methyldiethanolamine and Empirical Modelling for Prediction.
J. Chem. Eng. Data 63, 3559–3565. doi: 10.1021/acs.jced.8b00440
The issue of gas hydrates in gas pipelines is commonly addressed by injecting hydrate
inhibitors at the wellheads. Alongside these inhibitors, other chemical additives are
also injected to address various concerns such as to reduce the risk of corrosion and
scaling. However, it is not clear how the combined chemical cocktail affects gas
hydrate formation over a wide pressure range. Methyldiethanolamine or N-methyl-
diethanolamine (MDEA) is a chemical typically found in the gas production context
alongside hydrate inhibitors, and it is commonly used as part of the pH stabilization
corrosion control method. The impact of MDEA on hydrate formation has not been
studied well, nor has it been modelled. Thus, this chapter contributes a thorough study
into the effect of MDEA on gas hydrate formation and the modelling of this effect.
Empirically, an algorithm based on the experimental data collected in this study at a
high-pressure range (7 to 20 MPa) was developed allowing for the prediction of
hydrate phase equilibria in the presence of MDEA. This work will thus aid in the
industrial application of hydrate inhibitors and improve gas hydrate prevention in
production pipelines. This contribution satisfies the thesis objectives (g) and (h) while
fulfilling the research gaps outlined in Section 1.3.

93
Introduction
The formation of ice-like solids known as gas hydrates is an ongoing issue in the
production of valuable natural resources (Carroll, 2014; Hammerschmidt, 1934; Sloan
Jr and Koh, 2007). Hydrates are crystalline solids which are composed of gas and water
molecules; the gas molecules are known as “guest molecules” which become confined
in cage-like cavities formed by water molecules (Eslamimanesh et al., 2011; Koh et
al., 2002; Sloan Jr and Koh, 2007). High-pressure and low-temperature conditions,
which are typically experienced within subsea production pipelines, can accelerate the
rate of hydrate formation (Obanijesu et al., 2014). Conventional hydrate inhibition
techniques such as thermal insulation, depressurization, and natural gas dehydration
by glycol or molecular sieves may be impractical and not cost-effective (McIntyre et
al., 2004).
Thus, chemical hydrate inhibitors are commonly utilized in the industry for hydrate
inhibition and prevention of methane hydrate reformation (Jamaluddin and Kabir,
2012; Kim et al., 2017; Seo and Kang, 2012). They are classified as low-dosage
hydrate inhibitors (LDHIs) and thermodynamic hydrate inhibitors (THIs) (Kelland,
2006). THIs work by moving the hydrate phase boundary toward lower temperatures
and higher pressures, thus increasing the hydrate-safe region (Li et al., 2006).
Monoethylene glycol (MEG) is one of the most commonly used thermodynamic
hydrate inhibitors and is utilized in this study (Brustad et al., 2005; Sami et al., 2013).
Alongside hydrate formation, corrosion is another major issue leading to serious cost
repercussions and downtime (Alef et al., 2018a; Olajire, 2015; Papavinasam et al.,
2007). A corrosion control program may thus be adopted, which usually consists of
using an amine such as methyldiethanolamine (MDEA) to increase the pH of the fluid
system to initiate the precipitation of a stable iron carbonate layer on the inside of the
pipeline for surface protection (pH stabilization) or by injecting corrosion inhibitors
(Lehmann et al., 2016, 2014; Nyborg, 2009). The combined use of both gas hydrate
and corrosion inhibitors is popular, and some compatibility studies have been
conducted in terms of corrosion; however, the impact of different chemical additives
on gas hydrate formation needs more work (Lehmann et al., 2014; Luna-Ortiz et al.,
2014; Obanijesu et al., 2014). In this context, Obanijesu et al. (2014) studied the effect
of different chemical additives such as corrosion inhibitors on the hydrate formation

94
temperature and found that corrosion inhibitors promote gas hydrate formation
(Obanijesu et al., 2014). This may be detrimental as it can increase the risk of hydrate
formation and production downtime. Others evaluated hydrate inhibitors as being able
to perform as corrosion inhibitors, and in recent studies, hydrate and corrosion
inhibitors were combined to form of a single polymer that can tackle both hydrate
formation and corrosion issues simultaneously (Burgazli et al., 2005; Sheng et al.,
2017). However, the combined injection of MDEA and MEG has not been fully
explored at a high pressure range, which is, however, relevant for production (Akhfash
et al., 2017). Chemical additives such as MDEA or corrosion inhibitors may lead to
over-inhibition or even under-inhibition of gas hydrates in pipelines. Additionally,
chemical compositions of inhibitors and additives are increasingly becoming
proprietary due to the commercial appeal and preservation of a competitive edge
(Achour and Kolts, 2015). This leads to an increasing lack of fundamental
understanding and increasingly complex prediction models, or the lack thereof, of such
prediction tools. Thus, in this investigation, the methane hydrate inhibition
performance of one such chemical additive, MDEA, which is commonly injected in
combination with MEG, was assessed at a high-pressure range (7–20 MPa) that has
not been previously tested. Furthermore, an algorithm consisting of empirical models
based on the experimental data of this study is provided due to the lack of software
predictions for the hydrate inhibition performance of MDEA solutions. The models
are based on a linear interpolation scheme between the hydrate phase boundaries of
various concentrations of MDEA solutions to accurately predict the equilibrium
temperature shift due to the presence of MDEA.
Methodology
5.2.1 Materials and Apparatus
The materials utilized in this study are given in Table 5.1. MEG was obtained from
Chem-Supply with a purity of 99.477% (molar). MDEA was sourced from Sigma-
Aldrich with a purity of ≥99% (molar). Deionized (DI) water was conveniently
produced within the laboratory using Hydro-Check 414R with an electrical resistivity
of 18.18 MΩ·cm (24 °C). The hydrate-forming gas was ultrahigh purity methane
supplied by BOC with a purity of 99.995% (molar). Nitrogen for purging purposes
was generated using an in-house nitrogen generator (AtlasCorpo, NGP10+) with a

95
purity of 99.9959% (molar).
Table 5.1: List of materials used in the experiments.
Material Formula Purity Source
MEG C2H6O2 99.477 % Chem-Supply
MDEA CH3N(C2H4OH)2 ≥99 % Sigma-Aldrich
Deionized
water
H2O 18.18 MΩ·cm
(24 °C)
Hydro-Check 414R
Methane CH4 99.995 % BOC
Nitrogen N2 99.9959 % AtlasCorpo, NGP10+
A high-pressure PVT cell located in the Clean Gas Technology Australia (CGTA)
laboratory, Curtin University, was utilized for the hydrate testing (Figure 5.1). The cell
chamber (60 cm3) and tubing have a total volume of 86 cm3. Before each test run, the
cell was cleaned with ethanol and thoroughly rinsed with deionized water. A vacuum
pump was then utilized for drying the cell and to remove any remaining contaminants,
and finally purged with nitrogen. The cell was equipped with a magnetic stirrer (up to
500 rpm stir rate) to promote mixing between the phases to facilitate hydrate formation
and the prevention of a hydrate film to simply form at the gas–liquid surface (Alef et
al., 2018c; Smith et al., 2015). Pressure sensors for measuring pressure and K-type
thermocouples were installed for measuring the air bath, vapor, and liquid
temperatures within the sapphire cell. The cell was mounted firmly within an air bath
operated by a cooling/heating system. The inside of the cell was clearly visible from
the outside and aided by a camera system with a light source to enhance the imagery.

96
Figure 5.1: Schematic of the high-pressure PVT sapphire cell used in this study
which is capable of performing hydrate inhibition testing.
5.2.2 Method
The well-known isochoric method was employed to accurately determine the hydrate
phase equilibria (Sloan Jr and Koh, 2007). This method requires that the volume is
kept constant while applying a step-cooling process (in this study: 2 °C/h) until hydrate
blockage had occurred, and then applying a careful step-heating process (1 °C/h) to
dissociate the gas hydrate. The intercept of the pressure–temperature curves from the
cooling and heating processes gives the dissociation temperature also known as the
thermodynamic equilibrium (Mech et al., 2015; Sloan Jr and Koh, 2007). Each test
consisted of 4 experiments at varying pressures between 7 and 20 MPa to determine
the full hydrate phase boundary. Table 5.2 contains the experimental test matrix for
the isochoric hydrate tests conducted in this study. The test solutions were accurately
prepared by precise mass measurement of the various components required using a
highly accurate self-calibrated electronic balance with an accuracy of 0.09%. The test
solutions were mixed in a beaker while being sparged with nitrogen and magnetically
stirred for complete synthesis. An 8 mL sample was then injected into the PVT cell
and mixed thoroughly by the magnetic stirrer before the test was initiated.

97
Table 5.2: Experimental matrix of hydrate inhibition tests conducted using the
isochoric method.
Formulation Composition (wt%)
Water MDEA MEG
Pure water 100 0 0
MDEA 97.5 2.5 0
MDEA 95 5 0
MDEA 92.5 7.5 0
Pure MEG 80 0 20
MEG-MDEA 77.5 2.5 20
MEG-MDEA 72.5 7.5 20
Results
Initial hydrate testing was conducted for the two reference systems, pure water, and
water-MEG (20 wt%) samples to ascertain the accuracy of the results by comparing to
the available literature and software data. Figure 5.2 illustrates the comparison, while
the hydrate phase equilibria data are provided in Table 5.3 and Table 5.4. The tests
were conducted three times under the same conditions for repeatability. The results
had a standard deviation of 0.16 °C, indicating a very small deviation in the obtained
data. Furthermore, the measured data were compared to software predictions using
Soave–Redlich–Kwong (SRK), Peng–Robinson (PR), and CPA fluid packages in
PVTSim, Multiflash, and CSMHYD (Calsep PVTSim, 2011; Infochem Multiflash,
2007; Sloan Jr and Koh, 2007). The measured data were also compared to similar
literature data at the tested pressure range (Haghighi et al., 2009b; Marshall et al.,
1964; McLeod and Campbell, 1961; Rock, 2002; Verma, 1974). An absolute average
relative error (AARE) of 1.77% between the measured equilibria data of the different
mixtures was found, confirming that our results match very well to published data and
predictions. The absolute average relative error was calculated using Eqn. (5.1), where
Texp is the experimentally measured equilibrium temperature and Tcalc is the
equilibrium temperature predicted using software or obtained from literature.

98
AARE (T) = 100
𝑛∑|
𝑇𝑐𝑎𝑙𝑐 − 𝑇𝑒𝑥𝑝
𝑇𝑒𝑥𝑝|
𝑛
𝑖=1
(5.1)
Figure 5.2: Methane hydrate phase boundaries for pure water and pure MEG (20
wt%) as compared to literature and software predictions.
5.3.1 Pure MDEA Tests
Samples of water–MDEA mixtures at MDEA concentrations of 2.5, 5, and 7.5 wt%
were tested for methane hydrate inhibition. It was observed that the level of foaming
increased as MDEA concentration increased. The newly obtained equilibria data are
provided in Table 5.3. The hydrate phase boundaries for the MDEA samples are
plotted in Figure 5.3. The hydrate phase boundaries as compared to that of pure water
have shown an average leftward shift by 0.29, 0.58, and 0.82 °C, respectively. This
leftward shift confirms that MDEA can act as a thermodynamic hydrate inhibitor even
at higher pressures.

99
Table 5.3: Equilibria data for pure water and pure MDEA samples measured in this
study.a
Pure water MDEA (2.5 wt%) MDEA (5 wt%) MDEA (7.5 wt%)
P (MPa) T (°C) P (MPa) T (°C) P (MPa) T (°C) P (MPa) T (°C)
7.11 9.83 7.36 9.85 7.42 9.63 7.66 9.64
9.98 13.00 10.07 12.76 9.96 12.28 10.84 12.85
15.20 16.61 15.29 16.40 14.98 16.03 15.24 15.89
19.83 18.84 19.93 18.57 20.26 18.49 20.02 18.18
a Standard uncertainty in pressure and temperature measurements are ±0.05 MPa and
±0.03 °C, respectively.
The tests were simulated in Multiflash, and the results showed no change in the hydrate
phase boundary as compared to the hydrate phase boundary of pure water, confirming
that the effect of MDEA on the phase boundary has not been taken into account
(Akhfash et al., 2017). The equivalent MEG concentrations required to yield the same
amount of temperature suppression or shift in hydrate phase boundary caused by
MDEA was determined by simulation in Multiflash (Figure 5.3). The results reveal
that 2.5, 5, and 7.5 wt% of pure MDEA solutions are equivalent to 1.1, 2.1, and 3.3
wt% of pure MEG, respectively. This suggests that MEG is 2.31 times more effective
than MDEA.

100
Figure 5.3: Methane hydrate phase boundaries for pure MDEA (2.5–7.5 wt%) and
their equivalent MEG concentrations using Multiflash.
5.3.2 MEG Tests
MDEA was tested in a 20 wt% MEG solution to determine the combined hydrate
inhibition performance at high pressures (7–20 MPa). Interestingly, during the cooling
and hydrate nucleation phase, bubbling was observed instead of foaming (Figure 5.4).
However, the foaming characteristic of MDEA samples was visible when the solution
was stationary after stirring, as seen in the sample bottles in Figure 5.4.

101
Figure 5.4: Stages of hydrate testing in MEG–MDEA (2.5 and 7.5 wt%) mixtures.
The hydrate phase boundaries are plotted in Figure 5.5, while equilibria data are
provided in Table 5.4. The hydrate profiles for 20 wt% MEG with added MDEA at 2.5
and 7.5 wt% relative to deionized water show an enhanced hydrate inhibition
performance as opposed to a 20 wt% pure MEG solution (Figure 5.5). At 2.5 wt% of
MDEA concentration in the MEG solution, an average hydrate equilibrium
temperature suppression of 0.13 °C was produced. While at a concentration of 7.5 wt%
of MDEA, an average suppression of 0.46 °C was found. Interestingly, both samples
showed a greater shift at higher pressures as opposed to lower pressures. The results
clearly show that as the concentration of MDEA increases, there is a leftward shift in
the hydrate profile, confirming that MDEA is contributing as a thermodynamic hydrate
inhibitor even at higher pressures. The high solubility of MDEA in water is a

102
contributing factor to why the enhanced hydrate inhibitory performance is observed.
MDEA and water merge by strong hydrogen bonding, thus making the water
molecules less accessible to gaseous guest molecules, resulting in hydrate inhibition
(Davoudi et al., 2014; Hossainpour, 2013). On the other hand, where carbon dioxide
and acids are involved, MDEA has an exothermal reaction which generates heat,
promoting dissociation of the gas hydrate (Park et al., 2006; Xiang et al., 2014).
Furthermore, predictions for combined MDEA and MEG solutions using Multiflash
showed an almost negligible temperature suppression as compared to our experimental
data (Figure 5.5). The temperature shift that can be seen in the Multiflash predictions
is simply the hydrate phase boundary of the same solution while ignoring the MDEA
concentration, thus resulting in a higher MEG proportion. Therefore, the prediction is
misleading as it produces results for a MEG solution of 21.6 wt% as opposed to the 20
wt% solution as defined by the user in the case of MEG–MDEA (7.5 wt%). It was
assumed that the selected Multiflash configuration and equation of state (CPA) was
not capable of recognizing MDEA’s inhibition effect, so different equations of states
(i.e., PR, SRK, modified PR, and modified SRK) were selected, but the results
remained unhindered, suggesting that the added hydrate inhibitory performance of
MDEA has not been taken into account in the Multiflash simulation model.
The combined effect of MEG (20 wt%) with MDEA at 2.5 and 7.5 wt% on the hydrate
phase boundary was found to be equivalent to the hydrate performance of 20.28 and
20.95 wt% of pure MEG, respectively. The equivalent MEG concentration for the
same MDEA concentration is higher for pure MDEA as opposed to combined mixtures
of MEG–MDEA. This suggests that a mixture of MEG–MDEA showed a lesser
performance as a hydrate inhibitor as compared to pure MDEA by a factor of 3.6.

103
Figure 5.5: Measured and simulated phase boundaries for combined 20 wt% MEG
with MDEA (2.5 and 7.5 wt%).
Table 5.4: New methane hydrate phase equilibria data for 20 wt% MEG/water–
MDEA mixture.a
Pure MEG (20
wt%)
MEG (20 wt%) -MDEA
(2.5 wt%)
MEG (20 wt%) -MDEA
(7.5 wt%)
P (MPa) T (°C) P (MPa) T (°C) P (MPa) T (°C)
7.13 4.13 7.58 4.56 7.67 4.32
10.24 7.25 10.45 7.23 9.83 6.45
15.06 10.46 15.42 10.51 15.33 10.08
19.97 12.72 20.51 12.82 20.08 12.3
a Standard uncertainty in pressure and temperature measurements are ±0.05 MPa and
±0.03 °C, respectively.
5.3.3 Empirical Modelling
Simulations were conducted using Multiflash, which has an option to input MDEA
concentration within the aqueous phase. However, the predicted hydrate phase
boundaries of the MDEA solutions were identical to the results of pure water (100
wt%). This exposes the software’s incapability to take into account the inhibitory

104
performance of MDEA. One of the goals of this study is to present an algorithm based
on empirical modelling to allow for the prediction of equilibrium conditions of
aqueous MDEA solutions with MEG. This is very useful since flow assurance software
are not able to predict the hydrate inhibitory effect of MDEA. Thus, after establishing
the hydrate inhibition performance of MDEA and MEG–MDEA solutions, the next
step was to develop a relation between the experimentally measured equilibria data
and MDEA concentration. This can be achieved through linear interpolation with the
assumption that at a given pressure, the relationship between the thermodynamic
equilibrium temperature and MDEA concentration is a linear one. Furthermore, Figure
5.3 and Figure 5.5 show that the equilibrium temperature decreases consistently with
increasing MDEA concentration. Thus, a simple interpolation scheme that can
determine the hydrate equilibrium conditions of MDEA and MEG–MDEA mixtures
at different MDEA concentrations (x) based on the experimental data from this study
is put forth.
Given that MDEA’s hydrate inhibition performance increases with increasing
concentration, this increase will result in lower equilibrium temperature as compared
to those of pure water (x = 0) or pure MEG (x = 0). This is expressed by Eqn. (5.2),
where the first RHS term (T0), which could also be called the reference term, denotes
the equilibrium temperature of either deionized water or the pure MEG solution. The
second RHS term, ΔTx in Eqn. (5.2), is simply the temperature shift from T0 to the
equilibrium temperature (Tx) of a mixture of x wt% of MDEA.
T𝑥 = T0 − ∆T𝑥 (5.2)
The reference term (T0) for water is calculated by using a fitted exponential trendline
on the experimental equilibrium data. The exponential function for the experimental
data after correlation is given with pressure (P) as the subject. The equation can be
rearranged in terms of T0 as shown in Eqn. (5.3) (where a and b are constants of the
exponential expression). The reference term for the pure MEG solution can also be
predicted by an equation of state, thus allowing for a wider MEG concentration
coverage compared to the 20 wt% MEG concentration adopted within this study.
T0 = a ln (P
b) (5.3)

105
To derive the equilibrium temperature shift, ΔTx involves developing a relationship to
address the shift in hydrate phase boundaries of the reference system versus that of a
high MDEA concentration mixture (upper boundary) as a function of pressure. In this
study, the upper boundary was selected as the pure MDEA solution at a concentration
of 7.5 wt%. The equilibrium temperature shift, ΔT7.5, between pure water as the
reference, and pure MDEA (7.5 wt%) as the upper bound was determined over a
varying pressure range (7–20 MPa) to account for the temperature dependence on
pressure (Figure 5.6).
Figure 5.6: Pressure versus ΔT7.5, hydrate equilibrium temperature shift for between
water and pure MDEA at 7.5 wt%.
The equation for ΔT7.5 can be derived from Figure 5.6, it is written here as Eqn. (5.4).
However, to determine the equilibrium temperature shift for a mixture of x wt%
concentration of MDEA (ΔTx), the ΔT7.5 term can be used to interpolate by multiplying
Eqn. (5.4) by x/7.5.
∆T7.5 = (1
−7.288)ln (
P
4333.9) (5.4)
∆T𝑥 = − (𝑥
7.5 × 7.288)ln (
P
4333.9) (5.5)
By substituting Eqns. (5.3) and (5.5) into Eqn. (5.2), the general expression shown in
Eqn. (5.6) for calculating equilibrium temperature, T, at a concentration of x wt% of

106
MDEA in pure water or MEG mixtures can be developed. The constants a and b were
derived from the exponential expressions of the reference systems, while c and d for
both pure MDEA and MEG solutions were obtained from the exponential expressions
of the pressure versus equilibrium temperature shifts between the reference systems
and high MDEA concentration solutions. These constants are given in Table 5.5.
T = a ln (P
b) − c ln (
P
d) 𝑥 (5.6)
Table 5.5: Constants used in Eqn. (5.6) for pure MDEA and MEG–MDEA mixtures.
a b c d
MDEA 8.769 2.296 -0.0183 4333.9
MEG-MDEA 8.346 4.323 0.0104 0.031
The model was tested by comparing it with experimental data available in literature
and data from this study (Akhfash et al., 2017). This comparison is shown in Figure
5.7 and Figure 5.8; it can be seen that the model fits very well. Most of the values
predicted by the model are within 0.07 °C of the experimental data and have an average
relative difference of 0.57% (Table 5.6). It can thus be established that the developed
model accurately represents the effect of MDEA on the hydrate phase boundary for
MDEA concentrations of 0-7.5 wt% and a pressure range of 7–20 MPa.

107
Figure 5.7: Comparison of predicted to experimental data for MDEA and MEG
mixtures from this study.
Figure 5.8: Comparison of predicted to experimental data for MDEA solutions from
literature.
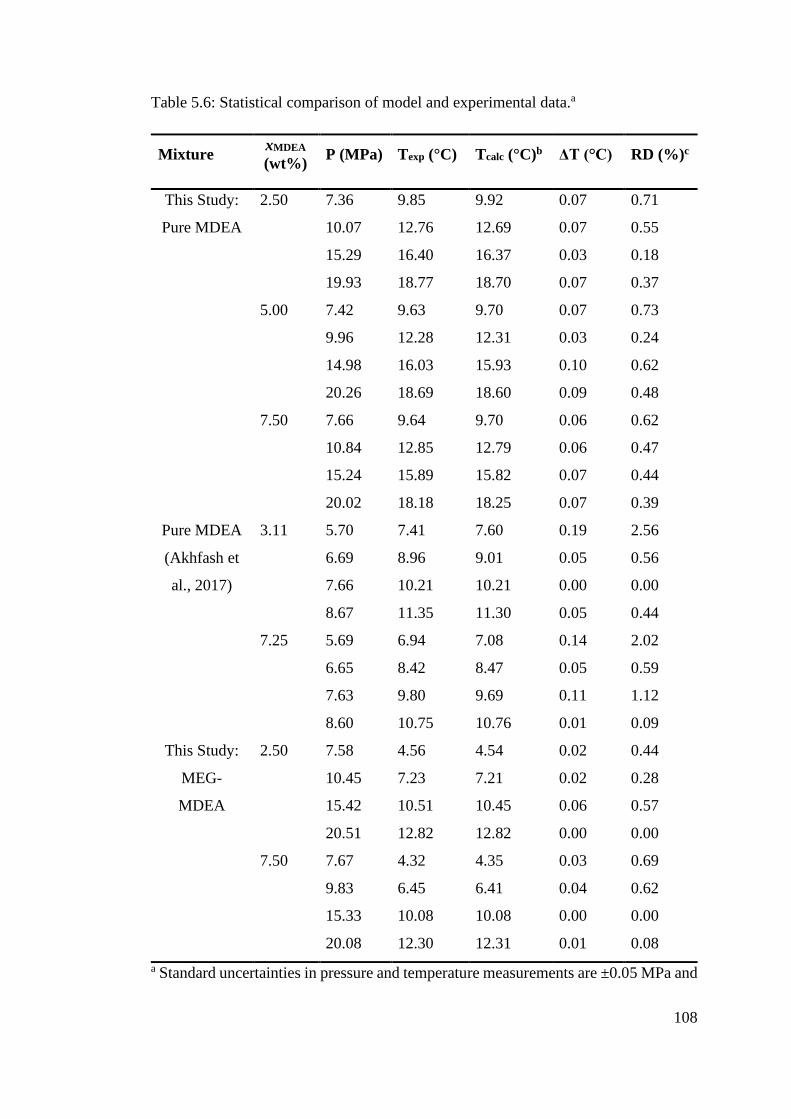
108
Table 5.6: Statistical comparison of model and experimental data.a
Mixture xMDEA
(wt%) P (MPa) Texp (°C) Tcalc (°C)b ΔT (°C) RD (%)c
This Study:
Pure MDEA
2.50 7.36 9.85 9.92 0.07 0.71
10.07 12.76 12.69 0.07 0.55
15.29 16.40 16.37 0.03 0.18
19.93 18.77 18.70 0.07 0.37
5.00 7.42 9.63 9.70 0.07 0.73
9.96 12.28 12.31 0.03 0.24
14.98 16.03 15.93 0.10 0.62
20.26 18.69 18.60 0.09 0.48
7.50 7.66 9.64 9.70 0.06 0.62
10.84 12.85 12.79 0.06 0.47
15.24 15.89 15.82 0.07 0.44
20.02 18.18 18.25 0.07 0.39
Pure MDEA
(Akhfash et
al., 2017)
3.11 5.70 7.41 7.60 0.19 2.56
6.69 8.96 9.01 0.05 0.56
7.66 10.21 10.21 0.00 0.00
8.67 11.35 11.30 0.05 0.44
7.25 5.69 6.94 7.08 0.14 2.02
6.65 8.42 8.47 0.05 0.59
7.63 9.80 9.69 0.11 1.12
8.60 10.75 10.76 0.01 0.09
This Study:
MEG-
MDEA
2.50 7.58 4.56 4.54 0.02 0.44
10.45 7.23 7.21 0.02 0.28
15.42 10.51 10.45 0.06 0.57
20.51 12.82 12.82 0.00 0.00
7.50 7.67 4.32 4.35 0.03 0.69
9.83 6.45 6.41 0.04 0.62
15.33 10.08 10.08 0.00 0.00
20.08 12.30 12.31 0.01 0.08
a Standard uncertainties in pressure and temperature measurements are ±0.05 MPa and

109
±0.03 °C, respectively.b Model.c Relative difference, RD (T) = abs(Texp – Tcalc)/Texp ×
100.
Conclusion
The combined use of MDEA and MEG is very common (Akhfash et al., 2017; Brustad
et al., 2005; Davoudi et al., 2014; Glenat et al., 2004; Halvorsen et al., 2007; Lehmann
et al., 2014; Nyborg and Dugstad, 2009). As such, the need for understanding how
MDEA affects gas hydrate formation and the inhibition performance of MEG at a wide
pressure range becomes important for the integrity of the hydrate control program.
This study has produced new methane hydrate phase equilibria data for MEG and
MDEA mixtures, confirming that MDEA can act as a thermodynamic hydrate inhibitor
at high pressures (7–20 MPa), resulting in the suppression of the hydrate phase
boundary. Pure MDEA showed an average equilibrium temperature shift of -0.82 °C
at a concentration of 7.5 wt%. The combined effect of MDEA (7.5 wt%) with MEG
(20 wt%) showed an equivalent hydrate performance of 20.95 wt% MEG. This shows
that where MDEA and MEG are applied together for their respective purposes, the
system may be slightly overinhibited due to the added hydrate inhibitory performance
of MDEA. The study suggests that with the knowledge of the hydrate inhibitory
performance of other chemical additives such as MDEA in the MEG injection stream,
an added safety margin can be assumed. Furthermore, the study has presented an
algorithm (provided in APPENDIX A. Outline of Algorithm, and MDEA Data)
consisting of empirical models based on the experimental data of this study to provide
an estimate for the added hydrate inhibitory effect of MDEA.
The hydrate phase equilibria data for MDEA illustrate that various chemical additives
that are injected alongside hydrate inhibitors can potentially alter the expected hydrate
inhibition performance of the adopted hydrate control program. In this case, it
increased the hydrate-safe region and perhaps rendered the system into over-inhibition.

110
Thermodynamic Modelling of Hydrate Phase Equilibria
of Methyldiethanolamine
This chapter is comprised of the following publication:
• Alef, K., Iglauer, S., Barifcani, A., 2019b. Thermodynamic Modeling of
Hydrate Phase Equilibria in Methyldiethanolamine Solution in the Presence or
Absence of Monoethylene Glycol. J. Chem. Eng. Data 64, 4148–4153. doi:
10.1021/acs.jced.9b00552
In recent studies, MDEA has been found to have an inhibiting effect on gas hydrate
formation. This inhibitory effect is neither considered in field hydrate control programs
nor in simulation software. To date, the effect has only been modelled empirically by
the authors. In this study, thermodynamic modelling has been conducted using the
cubic plus association equation of state (CPA EoS) combined with van der Waals and
Platteeuw’s solid solution theory for hydrate phase equilibria. This application of the
CPA EoS will allow for accurate prediction of hydrate equilibria of MDEA solutions
used in the industry. Furthermore, new hydrate phase equilibria data for MDEA and
MDEA–MEG systems have been produced. A good prediction by the proposed model
(0.76% deviation) has been found across all available hydrate phase equilibria of
MDEA systems with and without the presence of MEG in the literature.
This contribution satisfies the thesis objectives (g) and (h) while fulfilling the research
gaps outlined in Section 1.3.

111
Introduction
A major challenge to gas production is the formation of gas hydrates which can cause
blockages within gas pipelines leading to serious delays in production and increased
maintenance costs (Alef et al., 2018c; Sloan Jr and Koh, 2007). Typical subsea
conditions of high pressure and low temperature are optimum grounds for hydrate
formation in pipelines, especially in the presence of abundant hydrate-forming gases.
A popular solution to gas hydrate formation is the utilization of thermodynamic
hydrate inhibitors, namely, monoethylene glycol (MEG), to shift the hydrate phase
boundary to lower temperatures (Cha et al., 2013). This results in pipeline operating
conditions to be within the hydrate-free region and thus effectively
preventing/inhibiting hydrate formation (Figure 6.1). Further to the challenge of gas
hydrates, pipelines and process facilities are also prone to corrosion, especially in the
presence of produced water and chemical precipitation. To lower the risk of corrosion,
amines such as methyldiethanolamine (MDEA) as part of a pH stabilization corrosion
strategy may be injected into the system (Alef et al., 2019a). MDEA increases the
overall pH level, thereby allowing for a stable iron carbonate layer to form a film along
the pipeline, thus lowering the risk of corrosion (Alef et al., 2018a; Lehmann et al.,
2014; Nyborg, 2009).

112
Figure 6.1: Hydrate phase diagram showing hydrate-free regions of quaternary
mixture of water–methane–MEG–MDEA.
In recent studies, MDEA has been found to a have an inhibiting effect on gas hydrate
formation (Akhfash et al., 2017; Alef et al., 2018b; AlHarooni et al., 2016). AlHarooni
et al. (2017) presented hydrate-formation pressure and temperature measurements as
opposed to thermodynamic phase equilibria of MDEA solutions of 10 and 25 wt% at
a pressure range of 5–20 MPa (AlHarooni et al., 2017). AlHarooni et al. (2016) also
studied the effect of MDEA degradation among other oil field chemicals on hydrate
formation (AlHarooni et al., 2016). Akhfash et al. (2017) presented hydrate phase
equilibria data for MDEA solutions at concentrations of 3–7 vol % and a pressure
range of 6–9 MPa, showing that MDEA can act as a thermodynamic hydrate inhibitor
(Akhfash et al., 2017). Alef et al. presented hydrate phase equilibria data at a higher
pressure range (7–20 MPa) and over a larger MDEA concentration range of 0–7.5 wt%
(Alef et al., 2018b).
However, the inhibiting effect of MDEA has not been taken into account in gas hydrate
control programs in the field, potentially rendering systems into over-inhibition.
Furthermore, the inhibitory effect of MDEA has not been captured by flow assurance
software or any thermodynamic model for hydrate phase equilibria in MDEA systems.
Thus, Alef et al. developed an empirical model based on their experimentally obtained

113
phase equilibria to highlight the inhibitory effect of MDEA (Alef et al., 2018b).
However, as is the case with most empirical models, they are based on a specific set
of experimental data, and thus it is essential to develop a thermodynamic model which
can describe MDEA systems over varying pressure and concentration ranges.
With that aim for this study, thermodynamic modelling was conducted based on the
popular solid solution theory of van der Waals and Platteeuw and the algorithm
produced by Parrish and Prausnitz for the prediction of hydrate phase equilibria
(Parrish and Prausnitz, 1972; Van der Waals, 1959). The cubic plus association
equation of state (CPA EoS) was applied to model MDEA systems and for the
calculation of fugacity with the principle of uniformity in fugacity across the different
fluid phases. The CPA EoS is preferred because of its ability to model associating
compounds with non-associating compounds and ease of computation (Kontogeorgis
and Folas, 2009). The model was then validated based on experimentally measured
hydrate phase equilibria obtained in this study and from previous studies showing a
very good fit (Akhfash et al., 2017; Alef et al., 2018b).
Methodology
6.2.1 Experimental Section
In order to test the developed model, experimental methane hydrate phase equilibria
for two MDEA solution systems were attained. The well-known isochoric testing
method was used for hydrate phase equilibrium temperature measurements with a step-
cooling/heating rate of 1 °C/h (Alef et al., 2018b; Sloan Jr and Koh, 2007). The
procedure has been described in depth in our previous articles (Alef et al., 2018c,
2018a, 2018b). A schematic for the experimental apparatus is shown in Figure 6.2,
whereby a high-pressure cell containing the test solution and methane hydrate-forming
gas was utilized.

114
Figure 6.2: Schematic of the experimental apparatus used in this study.
The first of the two test solutions that were tested comprised 3.5 wt% MDEA in pure
water. The second solution comprised both MDEA and MEG at 3.5 and 25 wt%,
respectively, in pure water. The properties of the chemicals utilized in this study and
their sources are tabulated in Table 6.1. The nitrogen used for purging purposes to
prevent oxidative degradation of MEG was produced in-house using an Atlas Corpo,
NGP10+ generator with a purity of 99.996 mol %. The deionized water used in the
preparation of test solutions was produced in-house using a HydroCheck, 414R system
with an electrical resistivity of 17.94 MΩ·cm at 26 °C.

115
Table 6.1: Materials and their properties used in this study.a
Material Compound
Formula
Mol.
Wt.
(g/mol)
Acentric
Factor
Tc (K) Purity
(mol%)
CAS No. Source
MDEA
119.164 1.242 677 ≥99 105-59-9 Sigma-
Aldrich
MEG 62.068 0.487 719.7 99.477 107-21-1 Chem-
Supply
Methane
16.043 0.011 190.56 99.995 74-82-8 BOC
a Data source: (Perry and Green, 1997; Zoghi et al., 2012).
6.2.2 Thermodynamic Modelling
In this study, the CPA EoS, as proposed by Kontogeorgis et al. (1999) was used for
calculating the fugacity of each component in the fluid phase (Kontogeorgis et al.,
1996, 1999). This equation of state works well to characterize the unusual
thermodynamic behaviour of chemical species which form hydrogen bonding with
molecules from the same species known as self-association or from different species
known as cross-association. The CPA EoS model has been successfully employed in
predicting the hydrate phase equilibria previously (Chapoy et al., 2010; Haghighi et
al., 2009b, 2009a). It utilizes the widely used Soave–Redlich–Kwong (SRK) EoS to
characterize the physical interactions while using the association term of statistical
associating fluid theory to cater for varying types of hydrogen bonding compounds
(Huang and Radosz, 1990). It can be written as follows in Eqn. (6.1) with pressure P
as the subject (Kontogeorgis et al., 1999, 1996):
𝑃 =𝑅𝑇
𝑉𝑚 − 𝑏−
𝑎(𝑇)
𝑉𝑚(𝑉𝑚 + 𝑏)
−𝑅𝑇
2𝑉𝑚(1 + 𝜌
𝜕 ln(𝑔)
𝜕𝜌)∑𝑥𝑖
𝑖
∑(1− 𝑋𝐴𝑖)
𝐴𝑖
(6.1)
where R is the universal gas constant, T is the temperature, ρ is the molar density, Vm
is the molar volume, and b is the covolume parameter of the EoS.
The energy parameter of the equation of state, a(T), is defined by a Soave-type
temperature dependency:

116
𝑎(𝑇) = 𝑎0(1 + 𝑐1(1 − √𝑇
𝑇𝑐))
2
(6.2)
where Tc is the critical temperature and a0 and c1 are two parameters of the SRK part
of the EoS.
The association term of the CPA EoS mainly comprises 𝑋𝐴𝑖 which denotes the fraction
of nonbonded associating molecules, and xi is the mole fraction of component i. 𝑋𝐴𝑖 is
defined as follows:
𝑋𝐴𝑖−1 = (1 + 𝜌∑𝑥𝑗
𝑗
∑𝑋𝐵𝑗𝐵𝑗
∆𝐴𝑖𝐵𝑗) (6.3)
where ∆𝐴𝑖𝐵𝑗 is the association strength, defined as follows:
∆𝐴𝑖𝐵𝑗= 𝑔(𝜌)𝑏𝑖𝑗𝛽𝐴𝑖𝐵𝑗 [𝑒𝑥𝑝 (
휀𝐴𝑖𝐵𝑗
𝑅𝑇) − 1] (6.4)
where 𝛽𝐴𝑖𝐵𝑗 is the association volume, 휀𝐴𝑖𝐵𝑗 is the association strength, and g(ρ) is the
radial distribution function given as:
𝑔(𝜌) =1
1 − 1.9𝜂 , 𝜂 =
𝑏𝜌
4 , 𝜌 =
1
𝑉𝑚 , and 𝑏𝑖𝑗 =
𝑏𝑖 + 𝑏𝑗
2 (6.5)
The parameters required for the CPA EoS for associating compounds (water, MEG,
and MDEA) are typically obtained through regression of vapour–liquid-equilibrium
(VLE) data. The parameters for the CPA EoS for water, MEG, and MDEA are given
in Table 6.2. Since we are working with a mixture, the energy and covolume
parameters of the SRK part of the EoS (i.e., a and b) must be modified as per the
conventional mixing rules. The geometric mean rule is applied to the energy
parameter:
𝑎 =∑∑𝑥𝑖𝑥𝑗𝑎𝑖𝑗𝑗𝑖
, where 𝑎𝑖𝑗 = √𝑎𝑖𝑎𝑗(1 − 𝑘𝑖𝑗) (6.6)
𝑏 =∑𝑥𝑖𝑏𝑖𝑖
(6.7)
where kij is the temperature-dependent interaction parameter and is the sole adjustable
parameter.

117
Table 6.2: Parameters for the associating compounds in this study to be used in the
CPA EoS.
a0 (bar L2
mol-2)
b (L
mol-1)
c1 ε (bar L
mol−1)
β References
Water 1.2277 0.014515 0.67359 166.55 0.0692 (Kontogeorgis
et al., 1999)
MEG 10.819 0.0514 0.6744 197.52 0.0141 (Derawi et al.,
2003)
MDEA 21.659 0.11145 1.3371 161.59 0.03320 (Avlund et al.,
2008)
Optimized values for the interaction parameter kij, which are temperature-dependent,
are found in the literature and are given in Table 6.3. The expression for kij for MEG
and MDEA are defined as shown in Eqn. (6.8).
MEG: 𝑘𝑖𝑗 = 𝐴 + 𝐵𝑇 MDEA: 𝑘𝑖𝑗 = 𝐴 + 𝐵𝑇 + 𝐶𝑇2 (6.8)
Table 6.3: Optimized values for interaction parameter kij for MEG and MDEA with
non-associating compounds.a
Methane Ethane Propane Carbon
Dioxide
MEG A 0.0004 0.1155 0.0002 -0.0002
B [K-1] 0.0498 0 0.0348 0.1141
MDEA A -0.626 2.181 0.738 6.51
B [10-3 K-1] 8.506 -9.183 -1.493 -40.4
C [10-5 K-2] -1.383 1.065 0.072 68.7
a Source: (Haghighi et al., 2009b; Wang et al., 2018, 2017)
The proposed optimized binary interaction parameters between the associating
compounds (water–MEG, water–MDEA, and MEG–MDEA) are obtained from the
literature and are based on the available experimental VLE data (Chang et al., 1993;
Haghighi et al., 2009a; Voutsas et al., 2004; Yang et al., 2013; Zoghi et al., 2012). The
coefficients for the temperature-dependent binary interaction parameters are provided
in Table 6.4 as per Eqn. (6.8).

118
Table 6.4: Coefficients for optimized interaction parameters for water–MEG, water–
MDEA, and MEG–MDEA mixtures.
Interaction A B [K-1]
Water-MEG -0.2313 5.6294E-4
Water-MDEA -0.635 0.00115
MEG-MDEA -0.655 0.0011
As for the CPA parameters of the association term, combining rules are applied in the
case of multiple associating compounds to determine the association strength. The
combining rules of CR-1 and ECR are given below (Kontogeorgis and Folas, 2009):
휀𝐴𝑖𝐵𝑗 =𝜀𝐴𝑖𝐵𝑖+𝜀
𝐴𝑗𝐵𝑗
2 and 𝛽𝐴𝑖𝐵𝑗 = √𝛽𝐴𝑖𝐵𝑖𝛽𝐴𝑗𝐵𝑗 (6.9)
∆𝐴𝑖𝐵𝑗= √∆𝐴𝑖𝐵𝑖∆𝐴𝑗𝐵𝑗 (6.10)
van der Waals and Platteeuw (1958) developed a model for gas hydrates similar to
Langmuir for gas adsorption (Van der Waals, 1959). Parrish and Prausnitz (1972)
implemented this model with an algorithm for the prediction of gas hydrate equilibria
(Parrish and Prausnitz, 1972). Their method has been followed in this study with the
following exception; the cell potential function has been extended across multiple
shells as opposed to a single shell (Ballard, 2002). Hydrate phase equilibria can be
determined by equating the fugacity of water in the hydrate phase to that of the
liquid/vapor phase (Sloan Jr and Koh, 2007). In the hydrate phase, the fugacity of
water, 𝑓wH, is calculated using Eqn. (6.11):
𝑓wH = 𝑓w
β𝑒(−∆𝜇wβ−H
𝑅𝑇)
(6.11)
where 𝑓wβ is the fugacity of water in the hypothetical empty hydrate lattice and ∆𝜇w
β−H
is the difference in the chemical potential of water between the hydrate, 𝜇wH , and the
empty hydrate lattice phases, 𝜇wβ
. This difference is calculated by Eqn. (6.12):
∆𝜇wβ−H
= 𝜇wβ− 𝜇w
H = 𝑅𝑇∑𝜈𝑛 ln (1 +∑𝐶𝑛,𝑖𝑓𝑖𝑖
)
2
𝑛=1
(6.12)
where 𝜈𝑛 is the ratio of type n cavities and water molecules in a unit cell and 𝑓𝑖 is the

119
fugacity of gaseous component i. 𝐶𝑛,𝑖 represents the Langmuir constant for gaseous
molecule i in cavity of type n, and it is calculated by Eqn. (6.13).
𝐶𝑛,𝑖 =4𝜋
𝑘𝐵𝑇∫ 𝑒
(−∑ 𝜔𝑖,𝑚(𝑟)𝑚
𝑘𝐵𝑇)𝑟2𝑑𝑟
𝑅𝑛−𝑎𝑖−𝜉
0
(6.13)
where 𝑘𝐵 is the Boltzman constant, 𝑅𝑛 is the cavity radius, 𝑎𝑖 is the hard sphere core
diameter of gaseous molecule i, 𝜉 is a small distance such as 0.0001 Å as suggested by
Pratt et al. (2001) to avoid an overflow error at the integrand’s limits (Pratt et al., 2001),
and ∑𝜔𝑖,𝑚(𝑟) is the summation of the overall cell potential of all of the layers within
cavity n. The cell potential is calculated using the equation derived by McKoy and
Sinanoğlu and implemented as suggested by Ballard (2002) and Pratt et al. (2001) to
avoid singularities, as shown in Eqn. (6.14) and (6.15) (Ballard, 2002; Pratt et al.,
2001).
𝜔𝑖,𝑚(𝑟) = 2𝜖𝑖𝑧𝑚 [𝜎𝑖12
𝑅𝑚11𝑟(𝛿𝑖,𝑚10 +
𝑎𝑖𝑅𝑚𝛿𝑖,𝑚11 ) −
𝜎𝑖6
𝑅𝑚5 𝑟(𝛿𝑖,𝑚4 +
𝑎𝑖𝑅𝑚𝛿𝑖,𝑚5 )] (6.14)
where
𝛿𝑖,𝑚𝑁 =
1
𝑁[(1 −
𝑟
𝑅𝑚−𝑎𝑖𝑅𝑚)−𝑁
− (1 +𝑟
𝑅𝑚−𝑎𝑖𝑅𝑚)−𝑁
] (6.15)
and 𝜖𝑖, 𝜎𝑖, and 𝑎𝑖 are the Kihara potential parameters and 𝑧𝑚 is the coordination
number for the type of hydrate structure as given by Ballard (2002).
To calculate the fugacity of water in the empty hydrate lattice, 𝑓wβ, Eqn. (6.16) is used.
𝑓wβ= 𝑓w
L𝑒(∆𝜇wβ−L
𝑅𝑇)
(6.16)
where 𝑓wL is the fugacity of water in the liquid phase and ∆𝜇w
β−L is the difference in the
chemical potential of water between the liquid, ∆𝜇wL , and the empty hydrate lattice
phases, ∆𝜇wβ
. This difference is calculated by Eqn. (6.17):
∆𝜇wβ−L
𝑅𝑇=∆𝜇w
0
𝑅𝑇0−∫
∆ℎwβ−L
𝑅𝑇2𝑑𝑇 + ∫
∆𝑣wβ−L
𝑅𝑇𝑑𝑃
𝑃
𝑃0
𝑇
𝑇0
(6.17)
where ∆𝜇w0 is the difference in the chemical potential of water in the empty hydrate
lattice and pure water at the reference state (𝑇0 = 273.15 K and 𝑃0 = 0 MPa), while
∆ℎwβ−L
and ∆𝑣wβ−L
are the differences in the molar enthalpy and volume between the

120
empty hydrate lattice and pure water. The ∆ℎwβ−L
term is calculated using Eqn. (6.18)
(Anderson and Prausnitz, 1986; Holder et al., 1980).
∆ℎwβ−L
= ∆ℎw0 +∫ ∆𝐶𝑃w𝑑𝑇
𝑇
𝑇0
(6.18)
where ∆ℎw0 and ∆𝐶𝑃w are the enthalpy and molar heat capacity differences between
the empty hydrate lattice and pure water at the reference temperature and pressure.
∆𝐶𝑃w is calculated using Eqn. (6.19) as suggested by Holder et al. (1980) The reference
properties that Holder et al. (1980) applied were used in this study (Dharmawardhana
et al., 1980; Holder et al., 1980; Parrish and Prausnitz, 1972).
∆𝐶𝑃w = −37.32 + 0.179(𝑇 − 𝑇0) 𝑇 > 𝑇0 (6.19)
Results
6.3.1 Experimental Phase Equilibria
The experimentally measured phase equilibria for the two MDEA solutions are
tabulated in Table 6.5 and plotted in Figure 6.3 and Figure 6.4. Both solutions showed
an inhibiting effect as expected. Pure MDEA (3.5 wt%) showed a depression of 0.31
°C in the hydrate equilibrium temperature as compared to pure water (Figure 6.3),
whereas MDEA–MEG (3.5 wt%/25 wt%) solution showed a depression of 8.05 °C in
hydrate equilibrium temperature as compared to a pure water solution (Figure 6.4).
The developed model was used to predict the experimentally tested systems, and the
absolute average relative error (AARE) as per Eqn. (6.20) between the measured data
and calculations were determined. The AARE for the pure MDEA system was 0.53%,
whereas for the MEG–MDEA system, the AARE was 0.77%. The results indicate a
very good consistency between the predicted and experimentally obtained hydrate
phase equilibria.
AAD (T in °C) = 100
𝑛∑|
𝑇calc − 𝑇exp
𝑇exp|
𝑛
𝑖=1
(6.20)
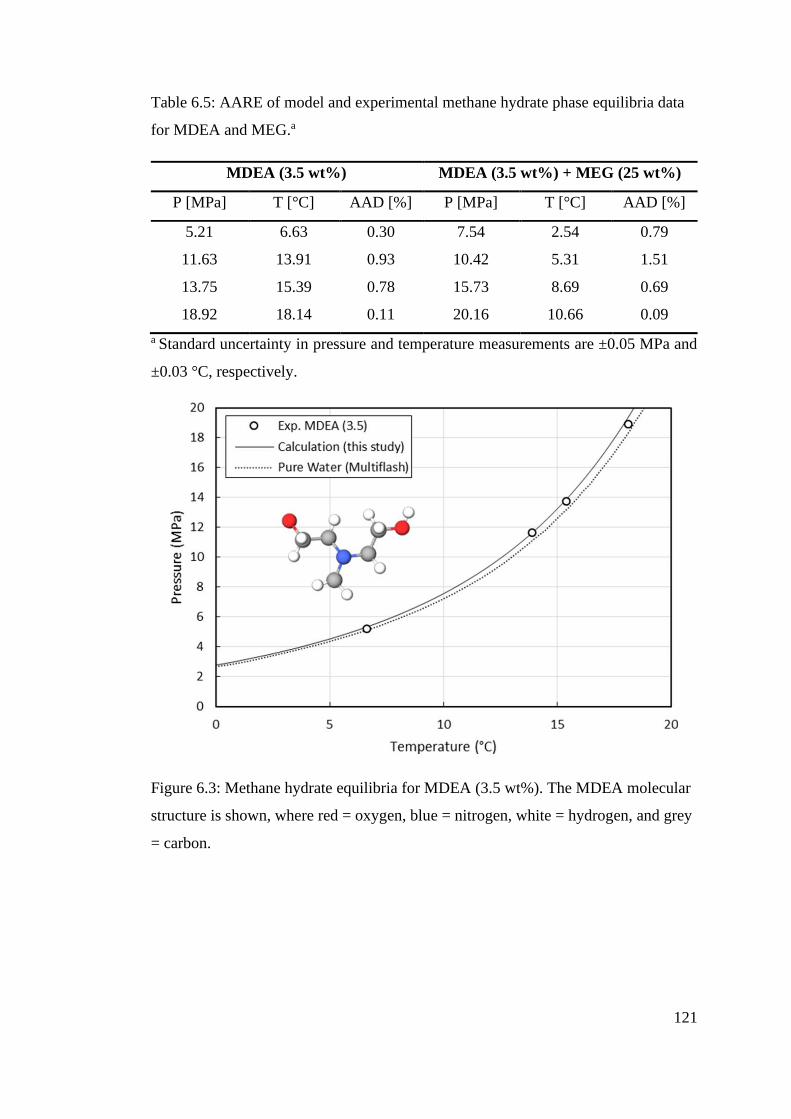
121
Table 6.5: AARE of model and experimental methane hydrate phase equilibria data
for MDEA and MEG.a
MDEA (3.5 wt%) MDEA (3.5 wt%) + MEG (25 wt%)
P [MPa] T [°C] AAD [%] P [MPa] T [°C] AAD [%]
5.21 6.63 0.30 7.54 2.54 0.79
11.63 13.91 0.93 10.42 5.31 1.51
13.75 15.39 0.78 15.73 8.69 0.69
18.92 18.14 0.11 20.16 10.66 0.09
a Standard uncertainty in pressure and temperature measurements are ±0.05 MPa and
±0.03 °C, respectively.
Figure 6.3: Methane hydrate equilibria for MDEA (3.5 wt%). The MDEA molecular
structure is shown, where red = oxygen, blue = nitrogen, white = hydrogen, and grey
= carbon.

122
Figure 6.4: Methane hydrate equilibria for MDEA (3.5 wt%) combined with MEG
(25 wt%). The MDEA and MEG molecular structures are shown, where red =
oxygen, blue = nitrogen, white = hydrogen, and grey = carbon.
3.2. Model Validation
The model was tested against all available experimental hydrate phase equilibria data
for MDEA systems (Table 6.6). The data published by Akhfash et al. (2017) explored
a pressure range of 5.69–8.87 MPa and are plotted in Figure 6.5 alongside the
calculated equilibria using our model. The calculated AARE is only 0.86% across all
data, which indicates that the model is very accurate in predicting the hydrate phase
equilibria across this pressure range and natural gas composition.

123
Figure 6.5: Comparison of model calculation to MDEA hydrate phase equilibria data
from Akhfash et al. 2017.
Data produced by Alef et al. (2018) explored a pressure range of 7.36–20.26 MPa
(Figure 6.6). The AARE between their data and the proposed model is 0.87%, which
again indicates a very reliable prediction by the model.
Table 6.6: Comparison of published data with the proposed model.
Reference T [°C] P [MPa] MDEA
[wt%]
MEG
[wt%]
No.
Pts.
AARE
[%]
(Akhfash et al.,
2017)
6.94-17.27 5.69-8.87 3.11-7.25 0 8 0.86
8.51-11.25 5.7-8.59 5.77-7.25 0-20.52 8 0.93
(Alef et al.,
2018b)
9.63-18.57 7.36-20.26 2.5-7.5 0 12 0.87
4.32-12.82 7.58-20.51 2.5-7.5 20 8 0.59
This Study 6.63-18.14 5.21-18.92 3.5 0 4 0.53
2.54-10.66 7.54-20.16 3.5 25 4 0.77

124
Figure 6.6: Comparison of model calculation to MDEA phase equilibria data from
Alef et al. (2018).
Conclusions
The common use of MDEA as part of a corrosion strategy alongside a hydrate control
program in oil and gas operations and transportation leads to the question of what the
impact of MDEA upon hydrate formation is and how it could be modelled accurately.
In this study, a thermodynamic model based on the CPA EoS is proposed for the
calculation of hydrate phase equilibria of MDEA solutions even in the presence of
MEG. Thus, this application of the CPA EoS to solve an industry problem serves as a
resourceful example and will allow for MDEA integration into field hydrate programs
and prediction software. The model was validated against all of the available hydrate
phase equilibria data in the literature and the new phase equilibria data from this study.
A total deviation of 0.76% was found, thus indicating a very good fit. Furthermore,
the new hydrate phase equilibria data for MDEA at 3.5 wt% and MDEA–MEG at 3.5
and 25 wt% have been produced.

125
Effect of Corrosion Inhibitors with Kinetic Hydrate
Inhibitor on Gas Hydrate, and Empirical Modelling of MEG
Degradation
This chapter is comprised of the following publication:
• Alef, K., Barifcani, A., 2020. Effect of N-Methyl-Diethanolamine and Film
Forming Corrosion Inhibitor on Gas Hydrate, and Empirical Modeling for
Degradation. Journal of Petroleum Science and Engineering 184, 106522. doi:
10.1016/j.petrol.2019.106522
This chapter aims to cover two important topics. Firstly, the study aims to explore and
quantify the effect of film forming corrosion inhibitor (FFCI) and MDEA in the
presence of the two types of hydrate inhibitors; MEG and an LDHI such as KHI. It
was found that both the chemicals increase the overall hydrate inhibition performance
of the mixture as opposed to pure KHI solution. However, it was found that MDEA
caused a slight decrease in the growth time as opposed to the pure KHI and KHI+FFCI
solutions. In terms of the effect of FFCI on MEG, it was found that FFCI serves as a
hydrate inhibitor albeit not as effective as MEG. Secondly, the study has developed
two empirical models for hydrate phase equilibria prediction of MEG-only and
MDEA+MEG solutions that have underwent thermal degradation as a function of
exposure temperature. Moreover, an algorithm bringing together all of the empirical
models produced in this study and as part of Chapters 2 and 4 has been developed.
This contribution satisfies the thesis objectives (i) and (e) while fulfilling the research
gaps outlined in Section 1.3.

126
Introduction
The occurrence of gas hydrates within gas pipelines could at the least, cause blockages
leading to production down-time (Carroll, 2014). Gas hydrates are made up of a
network of water cages that enclose gaseous molecules (Sloan Jr and Koh, 2007).
Common pressure and temperature conditions of subsea systems promote the
formation of gas hydrates (i.e., high pressures and low temperatures). The
pressure/temperature from the well to the production facilities must be monitored to
ensure the operation is within the hydrate-safe region. The inhibition of gas hydrates
can be achieved via several techniques such as depressurization, thermal insulation
and dehydration, however, these techniques may/may not be aligned with the
cost/design limits of the project (McIntyre et al., 2004).
A popular method for hydrate inhibition in the industry is the use of chemical hydrate
inhibitors (Kim et al., 2017; Seo and Kang, 2012). These inhibitors are further
classified into two categories thermodynamic hydrate inhibitors (THIs) and low-
dosage hydrate inhibitors (LDHIs) (Kelland, 2006). The way by which THIs cause the
inhibition of gas hydrates is by shifting the thermodynamic hydrate phase equilibrium
towards a lower temperature, thereby extending the hydrate-safe region for operations
(Li et al., 2006). A very common THI is monoethylene glycol (MEG) which is
favoured above all other THIs due to its ability to be safely and cost-effectively
recovered at a high efficiency (Brustad et al., 2005). However, during the recovery
process, MEG and other chemical additives may undergo thermal degradation which
ultimately decreases the quality of MEG (Alef et al., 2019a, 2018c). On the other hand,
LDHIs are a new and promising type of inhibitors which are required in very small
concentrations, usually less than 1 wt% as compared to 15-50 wt% for THIs (Sloan et
al., 1998). This may result in LDHIs becoming a more cost-effective option due to the
smaller quantities required, however, LDHIs are less likely to be recovered for
subsequent re-use. LDHIs are further classified into, kinetic hydrate inhibitors (KHIs)
and anti-agglomerates (AAs). KHIs act to delay the nucleation and growth of hydrates
giving enough time for safe transportation to occur. In essence, KHIs are effective if
residence time in the pipeline is lower than the induction time. AAs disrupt
agglomeration of hydrate crystals causing a transportable slurry; the slurry is
considered transportable if the slurry viscosity is not considerably high to avoid

127
causing excessive pressure drops (Kelland et al., 2000).
Common to gas hydrate formation within pipelines, the risk of corrosion is alike,
which may result in high production downtime, loss of equipment/facilities and cost
(Aljourani et al., 2009; Garverick, 1994; López et al., 2003; Olajire, 2015;
Papavinasam et al., 2007). The corrosion risk is generally addressed via the pH
stabilization method whereby the artificial increase of the pH level in the fluid system
promotes the growth of a stable layer composing of iron carbonate on the inner walls
of the production flowline (Nyborg, 2009); or the injection of corrosion inhibitors such
as a film forming corrosion inhibitor (FFCI) (Lehmann et al., 2016, 2014).
While the joint use of gas hydrate inhibitors and corrosion inhibitors is popular, the
effect of these chemicals on gas hydrate formation has not been evaluated. There exists
studies that are cantered on corrosion but lack the hydrate facet, and more specifically
the use of low dosage hydrate inhibitors (Lehmann et al., 2014; Luna-Ortiz et al., 2014;
Obanijesu et al., 2014). Alef et al. (2018b), studied the effect of MDEA on gas hydrate
formation and developed an empirical model to allow for hydrate phase temperature
prediction (Alef et al., 2018b). As a result, it is clear that chemical additives like
MDEA and FFCI may lead to over-inhibition or even under-inhibition of gas hydrates,
which may lead to additional costs or an increased risk. To achieve a safe balance,
empirical data is of utmost importance to help understand the mechanism involved and
build predictive models that will allow for hydrate phase equilibrium temperatures to
be estimated. In this study, the inhibitory performance of FFCI was assessed at high
pressures (7-20 MPa) in conjunction with MEG. Moreover, MDEA and FFCI were
tested with KHI to give insight into how they influence the hydrate inhibition
performance of KHIs. Furthermore, two empirical models were built to allow for the
prediction of hydrate equilibrium temperature shift of MEG and MDEA + MEG
solutions that have undergone thermal degradation simulating the MEG recovery
process. These empirical models play an important role due to the lack of software
predictions for the hydrate inhibition performance of degraded MEG/MDEA
solutions. The models are based on a linear interpolation scheme between the hydrate
phase equilibria of two boundary conditions of MEG and MDEA + MEG solutions to
accurately predict the equilibrium temperature shift.

128
Methodology
7.2.1 Materials & Apparatus
In this study, methane (CAS no. 74-82-8) supplied from BOC with a purity of 99.995
mol % was selected as the hydrate forming gas. For thermodynamic hydrate inhibition,
MEG (CAS no. 107-21-1) was utilized which was acquired from Chem-Supply having
a purity of 99.477 mol %. As for kinetic hydrate inhibition, a commercially used
(proprietary) KHI was utilized. As for corrosion inhibitors that were tested alongside
the hydrate inhibitors were a pH stabilizer known as MDEA (CAS no. 105-59-9) which
was obtained from Sigma-Aldrich having a purity of ≥99 mol %, and a commercially-
used (proprietary) FFCI. The deionized water utilized in this study was produced in-
house with an electrical resistivity of 19.40 MΩ cm at 23.5 °C. Nitrogen utilized for
purging was generated in-house (NGP10+) having a purity of 99.9959 mol %.
The experimental apparatus utilized for hydrate testing has been thoroughly explained
in our previous studies (Alef et al., 2018a; Alef and Barifcani, 2019). A PVT system
capable of high pressures (up to 50 MPa) and low temperatures was utilized (Figure
7.1). The inner volume of the cell is 60 cm3 while having an additional 26 cm3 due to
tubing volume. Prior to conducting an experimental test, the cell was washed with
ethanol/acetone and thoroughly cleaned with deionized water followed by a vacuum
drain pump. This ensured water and contaminants were removed from the cell. It was
then finally connected to the nitrogen purging line and allowed to purge for an hour.
A renewed surface between the liquid and vapour phases within the cell was achieved
via consistent stirring that was provided by the in-built magnetic stirrer. Moreover, the
cell was equipped with temperature and pressure sensors that were controlled via a
computer system for heating/cooling and gas injection purposes.

129
Figure 7.1: The apparatus used for solution preparation, and hydrate testing using a
high-pressure PVT cell in this study. P1 denotes cell pressure, while T1, T2, T3 denote
temperatures of vapor phase, liquid phase and air bath respectively.
The samples for the hydrate tests were meticulously prepared to avoid any oxidative
degradation of MEG and to prevent impurities within solutions. A setup comprising
of a 1 L beaker that was constantly purged with nitrogen and stirred via a magnetic
stirrer was used for the test solution preparation as depicted in Figure 7.1. After
complete synthesis, an 8 mL sample was carefully injected into the test chamber and
allowed to be stirred prior to commencement of hydrate testing.
7.2.2 Isochoric Method
The isochoric method that was employed in this study to determine hydrate phase
equilibria data is a well-known accurate hydrate testing method. In addition to holding
the volume of the system constant, the rates for step-cooling and step-heating were
2 °C/hour and 1 °C/hour respectively. The thermodynamic equilibrium point is
calculated using the recorded pressure and temperature data of the test (Sloan Jr and
Koh, 2007). Figure 7.2 shows the pressure-temperature curves of the cooling and step-

130
heating process as part of the isochoric method to determine the hydrate dissociation
(thermodynamic equilibrium) point of a 20 wt% MEG solution at ~10 MPa. The
pressure and temperature curve show the nucleation, growth and dissociation stages.
The initial conditions (point A) are outside of the hydrate formation conditions
(indicated by point B). As the temperature decreases to point B, hydrate begins to form
until point C is reached where the critical hydrate size lies. Applying heat at point C
reaches a point where dissociation commences and traverses a path that will eventually
cross the cooling path (point A to B). The intersection of the cooling and heating curves
(indicated as blue and red respectively) is the resulting thermodynamic equilibrium
temperature which can be compared against literature, or predictions via equation of
state software packages. For each test solution, 4 tests were conducted at varying
pressures ranging from 7 to 20 MPa to allow for plotting the hydrate phase boundary.
Table 7.1 gives the experiment matrix for all the isochoric tests that were conducted
as part of this study.
Figure 7.2: Pressure-temperature curves for the cooling and heating stages of the
isochoric method for 20 wt% MEG solution. Methane hydrate phase boundary
simulated in Multiflash is plotted as a dashed curve.

131
Table 7.1: Experimental matrix for tests using the isochoric hydrate testing method.
Test
Description
Composition (wt%)
DI water FFCI MEG
FFCI 99.5 0.5 0
FFCI 97 3 0
FFCI 96 4 0
FFCI+MEG 77 3 20
7.2.3 Isothermal method
The hydrate inhibition performance of the kinetic hydrate inhibitor, as well as the
combined KHI + MDEA and KHI + FFCI mixtures, were assessed using the high-
pressure PVT cell (experimental matrix is given in Table 7.2). The method employed
was the isothermal method which requires that the temperature remain constant after
cooling to the required sub-cooling temperature. This method is very popular and has
been used for assessing hydrate inhibition performance of KHIs (Lone and Kelland,
2013; Natarajan et al., 1994; Nerheim, 1993; Vysniauskas and Bishnoi, 1983; Wu and
Zhang, 2010). After the sample was prepared using the aforementioned procedure, it
was loaded into the PVT cell. When the air-bath temperature was stable at about 17 °C,
the cell was then pressurized using methane to a pressure of ~12 MPa and then stirred
at a rate of 500 rpm. The cell was then rapidly cooled to the desired temperature of
~4 °C (a sub-cooling of ~10 °C) at 0.5 °C/min, after which the cell was held at a
constant temperature to measure hydrate induction and growth times from the acquired
pressure-temperature data. The induction time (ti) was defined as the time from the
beginning of the cooling process to the first instance of hydrate formation (Bishnoi
and Natarajan, 1996; Jensen et al., 2008; Skovborg et al., 1993). The growth time (tg)
was defined as the time from the first instance of hydrate formation until hydrate
blockage had occurred in the chamber forcing the stirrer to come to a complete stop.
Both ti and tg can be determined from the pressure-temperature data as a result of the
experiment. Initially, as the cooling process was initiated, the temperature and pressure
of the closed system decreased due to the cooling and gas consumption into the liquid
phase. During the hold time, first hydrate formation was signified by a pressure drop
(>0.2 MPa), and an increase in temperature due to hydrate formation being an

132
exothermic process (Daraboina et al., 2013).
The memory effect of water as described in numerous literature publications was also
considered in this study, since the hydrate induction and growth times are found to be
lower in water that has undergone a hydrate formation event as opposed to that in fresh
water that has not (Duchateau et al., 2009; Lee and Englezos, 2005; Moon et al., 2003;
Zeng et al., 2006). The tests were conducted on fresh samples (water with no memory)
and memory samples (water that had already experienced a hydrate formation event).
Furthermore, the tests were repeated at the same conditions three times for
repeatability.
Table 7.2: The experimental matrix of hydrate inhibition tests conducted using the
isothermal method.
Test
Description
Composition (wt%)
DI water MDEA FFCI KHI
KHI 99.5 0 0 0.5
KHI+MDEA 97 2.5 0 0.5
KHI+FFCI 96.5 0 3 0.5
Results and Discussion
7.3.1 FFCI and FFCI + MEG mixtures
FFCI (0.5, 3 and 4 wt%) samples with the balance being deionized water were tested
for methane hydrate inhibition. The newly obtained equilibria data have been tabulated
in Table 7.3. It was observed that FFCI samples showed a slight change in colour
where the solution turned slightly yellow. The hydrate phase boundaries for the FFCI
samples are plotted in Figure 7.3. Interestingly, FFCI showed a leftward shift in the
hydrate phase boundary. The three samples (0.5, 3 and 4 wt%) as compared to pure
water showed an equilibrium temperature shift of -0.1, -0.54 and -0.87 °C respectively.
Thus, this leftward shift confirms that FFCI can also act as a thermodynamic hydrate
inhibitor by shifting the hydrate phase boundary to that of lower temperatures and
higher pressures. This hydrate inhibitory effect may be due to the high solubility of
FFCI in water as both join by strong hydrogen bonds thus decreasing the amount of
available water molecules to form cages around gaseous molecules, causing hydrate
133
inhibition (Davoudi et al., 2014; Hossainpour, 2013). Furthermore, FFCIs are
considered as mixed inhibitors whereby they decelerate both the anodic and cathodic
reactions. They typically have numerous functional groups with polar heads, and
contain imidazoline, quaternary ammonium compounds, polymerizable acetylenic
alcohols, oxyalkylated amines, various nitrogen heterocycles and surfactants to help
with dispersion in the fluid and to create a film/barrier between the fluid and the surface
of the pipeline (Barmatov et al., 2015, 2012). These constituents and polar heads may
cause a hydrostatic force or through hydrogen bonding attract more and more water
molecules away from forming cage structures around gaseous molecules. Their long
chain of hydrocarbon assists in adhering to the surface of the pipeline, and may also
adhere to a hydrate surface preventing it from growing to its critical size after which
hydrate growth readily occurs.
Table 7.3: Equilibria data for pure FFCI solutions and MEG mixture measured in this
study.a
0.5 wt% FFCI 3 wt% FFCI 4 wt% FFCI 3 wt% FFCI+MEG
P (MPa) T (°C) P (MPa) T (°C) P (MPa) T (°C) P (MPa) T (°C)
7.45 10.25 7.55 9.95 7.39 9.35 7.41 2.95
9.7 12.75 10.13 12.55 9.75 11.95 10.59 6.25
15.06 16.35 15.67 16.15 15.19 15.61 15.23 9.35
20.14 18.65 20.38 18.54 20.37 18.21 19.84 11.25
a Standard uncertainty in pressure and temperature measurements are ±0.05 MPa and
±0.03 °C respectively.
The equivalent MEG concentrations required to yield the same amount of temperature
suppression or shift in hydrate phase boundary caused by FFCI was determined by
simulation in Multiflash (Figure 7.3). The results reveal that FFCI solutions of
concentrations 0.5, 3 and 4 wt% are equivalent to 0.6, 2.68 and 3.21 wt% of MEG
respectively. This suggests that FFCI is an effective thermodynamic hydrate inhibitor
albeit not as effective as MEG.

134
Figure 7.3: Methane hydrate phase boundaries for aqueous FFCI (0.5, 3 and 4 wt%)
and their equivalent MEG concentration using Multiflash.
FFCI (3 wt%) combined with MEG (20 wt%) was tested to determine the combined
effect on the hydrate phase boundary as shown in Figure 7.4. A temperature
suppression of -1.55 °C was produced relative to 20 wt% pure MEG without any
additives. Furthermore, the amount of pure MEG required to produce the equivalent
temperature suppression of FFCI + MEG solution was found to be 23.12 wt% of MEG.
This increased hydrate inhibitory performance may be attributed to the synergistic
hydrate inhibition effect of both MEG and FFCI. Hence, where FFCI is used alongside
MEG, an enhanced hydrate inhibitory performance can be expected.

135
Figure 7.4: Hydrate phase boundary for the combined mixture of 3 wt% FFCI with
20 wt% MEG compared with a 20 wt% MEG only solution.
7.3.2 KHI Mixtures
Kinetic hydrate inhibitors act to slow down the process of hydrate nucleation rather
than shift the thermodynamic equilibrium to lower temperatures and higher pressures.
For this reason, conventional hydrate testing techniques cannot be used to assess the
performance of KHIs. In this study the induction and growth times at a sub-cooling of
~10 °C for methane hydrate formation in samples that contained 0.5 wt% KHI with
and without additives of MDEA (2.5 wt%) and FFCI (3 wt%) were measured. During
the induction phase of the 0.5 wt% KHI sample with no additives, it was observed to
have waves of bubbles circulating at the surface (Figure 7.5). While samples with
MDEA and FFCI did not show such behaviour during induction. An explanation for
such behaviour is perhaps due to the different way by which the gas dissolves within
the varying samples. During the growth phase, samples with additives showed slightly
deranged larger hydrate solids forming initially, while the pure KHI sample had
smaller and more agglomerated hydrate solids being formed (Figure 7.5). This
observation can be explained due to the separate compounds within the solution
adhering to hydrate solids preventing further growth as explained later in this section.

136
Figure 7.5: Stages of hydrate testing of KHI in the presence of MDEA and FFCI.
The measured induction and growth times for the three samples are plotted in Figure
7.6 and Figure 7.7, and are tabulated in Table 7.4. The degree of sub-cooling was kept
constant at 10 °C ± 1 °C for all tests to ensure comparable results. The results reveal
that the induction time for KHI + MDEA was the highest (224 min) followed by KHI
+ FFCI (179 min) and finally the KHI only sample (155 min). In terms of growth times,
the KHI + FFCI sample had the highest time (55 min) followed by KHI only sample
(38 min) and finally KHI + MDEA (32 min).

137
Figure 7.6: Pressure drop curves against time for KHI with MDEA and FFCI in
memory water.
Figure 7.7: Induction and growth times for KHI with/without MDEA and FFCI.
It is known that hydrophobic and hydrophilic tails of KHIs can alter their hydrate
inhibitory performance (Wang et al., 2019). In one such study, Park et al. (2017),
combined a KHI with a corrosion inhibitor, and found the chemical to function as both
hydrate and corrosion inhibitor (Park et al., 2017). Typical KHIs employed in the
industry such as vinyl lactam monomers (PVP and PVCap) and lactam monomer-
based copolymers are water-soluble. These chemicals are made-up of polyvinyl
138
backbones with varying cyclic amide groups (Kamal et al., 2016). The backbone and
additional groups may have numerous oxygen atoms (double-bond and single-bond)
that carry large charge densities attracting hydrogen atoms from nearby water
molecules. By attracting the water molecules, they are prevented from forming caged
structures around gaseous molecules. This also increases the chance for the backbone
of the KHI to rest flat upon the hydrate surface preventing further hydrate crystal
growth. Thus, a hydrate slurry is formed which can be transported at least as opposed
to complete hydrate blockage in the pipeline. Hence, KHIs affect induction and growth
times via the mechanism of bonding and adsorption of their inner groups upon the
hydrate crystal surface and with water molecules. This in turn decreases the rate of
agglomeration of hydrate crystals as well as preventing water molecules to form cage
structures around gas molecules. Ultimately, this averts the hydrate crystal nucleus
from growing to the critical size as importantly required for spontaneous hydrate
formation (Sloan Jr and Koh, 2007).
In terms of MDEA (2.5 wt%) combined with KHI (0.5 wt%), an increase of 44.5%
was found in the induction time (from 155 to 224 min), whilst the growth time dropped
by 15.8% from 38 min to 32 min. This suggests that MDEA increases the induction
time drastically, however, the downside is that growth time was decreased. This
increase in the induction time due to MDEA can also be explained due to MDEA
decreasing the thermodynamic hydrate phase boundary thus requiring an even lower
hydrate formation temperature as compared to that of the base solution. The high
induction times for the combined solutions of KHI with additives such as MDEA and
FFCI can be attributed to the hydrophilic nature of these chemicals and the
thermodynamic hydrate inhibition quality of FFCI (as established earlier in this study)
and MDEA as described in our earlier works (Alef et al., 2019b, 2018b). The shift in
hydrate equilibrium curve results in a higher sub-cooling range for the KHI with
MDEA or FFCI, and thus at the degree of sub-cooling at which the samples were
tested, the combined solution had a higher potential than the KHI-only sample. An
increase in both the induction time (15.5%) and growth time (44.7%) for FFCI (3 wt%)
with KHI (0.5 wt%) was found. The highest growth time was found for the KHI +
FFCI sample which may be attributed to the long chains of hydrocarbons present in
the FFCI which increase the chance for them to adhere to the hydrate surface
preventing further hydrate crystal growth. Hydrate crystals must reach a critical size

139
before they can grow to their potential size. By increasing the growth time, this also
suggests that FFCI in the system alongside KHI can increase the effectivity of the
hydrate inhibition program by enlarging the hydrate safety window of the operation.
Table 7.4: Experimental data for KHI, MDEA and FFCI solutions under a sub-
cooling of ~10 °C.ab
KHI
(wt%)
MDEA
(wt%)
FFCI
(wt%)
Pexp
(MPa)
Texp
(°C)
Sub-cooling
ΔT (°C)
Ti
(min)
Tg
(min)
0.5 0 0 11.32 3.24 10.66 205 52
0.5b 0 0 11.19 3.14 10.65 155 38
0.5 2.5 0 11.12 3.62 10.11 258 45
0.5b 2.5 0 11.28 3.75 10.11 224 32
0.5 0 3 11.24 3.59 10.24 239 62
0.5b 0 3 11.25 3.64 10.20 179 55
a Standard uncertainty in pressure and temperature measurements are ±0.05 MPa and
±0.03 °C respectively.
b Denotes samples were tested in memory water.
7.3.3 Empirical Modelling
In the MEG recovery process, there exists numerous sub-processes that may cause
thermal degradation of MEG and other chemicals alongside MEG due to the high
operating temperatures. Namely, the re-boiler and reclamation units of the MEG
recovery unit can result in the highest thermal exposure. Alef et al. (2018c), studied
the cycling effect of MEG regeneration on hydrate inhibition performance, and
subsequently developed an empirical model for temperature shift prediction (Alef et
al., 2018c). Similarly, Alef et al. (2018b), developed an empirical model for hydrate
phase equilibria prediction in pure MDEA and MDEA + MEG solutions (Alef et al.,
2019b, 2018b). However, there does not exist an empirical model to predict the hydrate
phase equilibria for MEG-only or MDEA + MEG solutions that have undergone
thermal degradation for a specific period of time. In this section, available literature
data has been utilized to develop and verify two empirical models to fill the gap in the
literature and build a foundation for MEG and MDEA + MEG degradation modelling
research work.
140
The boundary conditions for the models are given in Table 7.6 (as denoted by tick
marks). To develop a mathematical relation between the experimentally obtained
hydrate phase equilibria and thermal exposure temperature, a simple linear
interpolation across the phase boundaries corresponding to the varying thermal
exposure temperatures was applied. The assumption being that at any given pressure,
there exists a linear relation between the phase boundary temperature and thermal
exposure temperature. Since MEG/MDEA + MEG degradation causes a decrease in
the hydrate inhibitory performance of MEG (i.e., shifting the hydrate phase boundary
to the right) as shown in (Figure 7.8), an interpolation scheme across the thermal
exposure temperature and corresponding hydrate phase boundaries is developed. The
models were based on two boundary conditions; the lower limit boundary which
corresponds to the equilibrium temperature of the unexposed solution, and the upper
limit boundary corresponding to the equilibrium temperature of the exposed solution
(maximum thermal exposure). It is thus, expected that higher thermal exposure
temperatures (texposure) will result in higher phase equilibrium temperatures (Texposed).
This can be expressed by the addition of the shift in temperature due to degradation
(ΔTexposed) to the temperature of the unexposed solution (Tunexposed) as shown in Eqn.
(7.1).
T𝑒𝑥𝑝𝑜𝑠𝑒𝑑 = T𝑢𝑛𝑒𝑥𝑝𝑜𝑠𝑒𝑑 + ∆T𝑒𝑥𝑝𝑜𝑠𝑒𝑑 (7.1)
The lower limit or the unexposed solution phase equilibrium boundary (Tunexposed) is
determined by fitting an exponential function to the experimental data. The
exponential function is then re-arranged so that temperature is the subject of the
function as given in Eqn. (7.2) where P denotes the equilibrium pressure, while a and
b are the constants of the exponential function.
Tunexposed = a ln (P
b) (7.2)
To derive the shift in temperature due to degradation (ΔTexposed) involves developing a
relationship between the shift in equilibrium temperature of the lower boundary and
the upper boundary versus equilibrium pressure (P). In terms of MEG-only solutions,
the equilibrium temperature shift with unexposed MEG as the lower limit, and a MEG
solution exposed to 200 °C for 48 h as the upper limit was determined over a varying
pressure range (0–30 MPa) to account for the temperature dependence on pressure

141
(Figure 7.8). While for MDEA + MEG solutions, the equilibrium temperature shift
with unexposed MDEA + MEG as the lower limit, and a MDEA + MEG solution
exposed to 200 °C for 240 h as the upper limit was determined over a varying pressure
range (0-30 MPa) to account for the temperature dependence on pressure (Figure 7.8).
Thus, the equations for ΔTexposed, 200°C for the two systems are simply the exponential
functions as derived from Figure 7.8 as given in Eqns. (7.3), (7.4). To determine
ΔTexposed, x, a linear interpolation is applied to Eqns. (7.3), (7.4) by multiplying the
entire term by (x-22)/200, resulting in Eqns. (7.5), (7.6) where x is the desired exposure
temperature, while the 22 and 200 °C refers to the unexposed and exposed solution
exposure temperatures respectively.
MEG: ∆Texposed, 200 °C = (1
−3.157)ln (
P
2591.4) (7.3)
MDEA
+ MEG: ∆Texposed, 200 °C = (
1
−2.651)ln (
P
407.11) (7.4)
MEG: ∆T𝑒𝑥𝑝𝑜𝑠𝑒𝑑, 𝑥 =(1
−3.157(200 − 22))ln (
P
2591.4) (𝑥 − 22) (7.5)
MDEA
+ MEG:
∆T𝑒𝑥𝑝𝑜𝑠𝑒𝑑, 𝑥 =(1
−3.157(200 − 22))ln (
P
2591.4) (𝑥 − 22) (7.6)
To develop a general expression for the two systems, equation pairs (2–5) and (2–6)
can be substituted into Eqn. (7.1) separately, to calculate hydrate equilibrium
temperature at a specified thermal exposure temperature. The overall expression for
MEG-only and MDEA + MEG systems is then given in Eqn. (7.7), and the
corresponding constants (a, b, c, d) for both systems are given in Table 7.5.
T𝑒𝑥𝑝𝑜𝑠𝑒𝑑, 𝑥 =a ln (P
b) + cln (
P
𝑑) (𝑥 − 22) (7.7)

142
Figure 7.8: Hydrate equilibrium temperature shift for MEG and MDEA + MEG
degraded solutions.
Table 7.5: Constants to be used in Eqn. (7.7) for aqueous MEG and MDEA + MEG
mixtures.
a b c d
MEG 7.6805 6.6764 -1.78E-03 2591.4
MDEA+MEG 7.8678 4.3161 -2.12E-03 407.11
7.3.3.1 Model Validation
The models were validated against available literature data to see how well they
predicted the hydrate phase equilibrium temperature of degraded MEG and MDEA +
MEG samples. The comparison of MEG solutions exposed to 165 °C and 180 °C are
shown in Figure 7.9. While, the comparison of MDEA + MEG solutions exposed to
varying temperatures are given in Figure 7.10. The absolute average relative error
(AARE) between the model calculated values and the experimental data were
determined as per Eqn. (7.8) are given in Table 7.6. The comparisons indicate that the
model generally predicted well with an AARE between 2.7 and 3.4%. The model
showed a larger deviation at lower pressures. In regards to the MDEA + MEG sample
that was exposed to 135 °C, the model showed a higher deviation such that the

143
experimental data showed a greater temperature shift. It is recommended that the
model is tuned with more experimental data once available to further increase the
accuracy of the model and to cater for lower pressure ranges.
AARE (%, 𝑇 𝑖𝑛 °𝐶) = 100
𝑁∑|
𝑇𝑚𝑜𝑑𝑒𝑙 − 𝑇𝑒𝑥𝑝
𝑇𝑒𝑥𝑝|
𝑁
𝑖=1
(7.8)
Figure 7.9: Comparison of calculations using model compared to experimental data
for MDEA solutions exposed to 165 °C and 180 °C.

144
Figure 7.10: Comparison of calculations using model compared to experimental data
for MDEA + MEG solutions exposed to 135, 165, 185 and 200 °C.

145
Table 7.6: Calculations using model compared to experimental data for MEG and
MDEA + MEG mixtures from literature.
Mixture TExposure
(° C)
Exposure
Time (h)
P (MPa) Texp (° C) Model
Bound.
AARE
(%)a
MDEA (2 wt%)
+MEG (20
wt%)
(AlHarooni et
al., 2016)
22 0 10-30.0 7.0-14.5 4.32
22 0 P = 43.161e0.1271T ✓ 0.01
135 240 5.0-30.0 2.2-15.8 7.72
135 240 P = 35.434e0.126T 7.15
165 240 9.9-30.0 7.8-16.4 2.31
165 240 P = 42.389e0.1174T 2.61
185 240 10.0-30.0 8.6-15.9 3.52
185 240 P = 36.77e0.1294T 0.60
200 240 9.9-30.0 8.9-15.5 5.59
200 240 P = 34.329e0.1335T ✓ 0.03
MEG (25 wt%)
(AlHarooni et
al., 2015)
22 0 7.0-30.5 0.4-11.7 ✓ 0.21
165 48 14.3-30.3 6.6-12.3 5.65
180 48 10.1-30.2 4.2-12.8 4.55
200 48 5.7-30.0 0.8-13.0 ✓ 0.33
a AARE was calculated as per Eqn. (7.8).
Moreover, a useful algorithm or grouping of the empirical models produced in this
study for the degradation effect of MEG and MDEA + MEG solutions in conjunction
with models produced in our earlier works has been developed (Figure 7.11). The
algorithm covers the simulation needs of MEG regeneration and degradation, and
MDEA inhibitory effect as well as degradation. These aspects of MEG and MDEA in
the context of gas hydrate control has not been modelled in hydrate simulation
software, thus the algorithm serves an important role. The inputs to the algorithm are
solution composition (concentrations), pressure and temperature conditions. The
output is hydrate phase equilibrium conditions (pressure and temperature).

146
Figure 7.11: The algorithm to determine equilibrium temperature of aqueous MDEA,
and MDEA + MEG solutions at varying concentrations.
Conclusion
The study evaluated the hydrate inhibitory performance of MEG with FFCI, finding
that FFCI showed good hydrate inhibitory performance. It was found that only 3 wt%
of FFCI in a 20 wt% MEG solution showed an equivalent hydrate inhibition
performance of a 23.12 wt% MEG solution. MDEA and FFCI were also found to
enhance the inhibitory performance of solutions containing KHI. The experimental
equilibria data from this study for both MDEA and FFCI illustrate that various
chemical additives that are injected alongside hydrate inhibitors can potentially
produce a higher hydrate inhibition performance than otherwise expected. In this case,
it increased the hydrate-safe region, and perhaps rendered the system into over-
inhibition. However, other chemical additives may have a hydrate promoting effect
which could render the system under-inhibited and prone to risk if not adequately

147
addressed.
New experimental data for FFCI, FFCI + MEG, KHI + MDEA and KHI + FFCI have
been developed. Empirical modelling for degraded MEG and MDEA + MEG samples
were conducted to bridge the gap in literature for such models to cater for the
degradation effect. An algorithm based on these empirical models and previous models
is given to help estimate the hydrate phase equilibrium conditions of MDEA, degraded
MEG and MDEA + MEG solutions. This is much needed as there are no software
simulation models available, to the best of the authors' knowledge, that properly take
into account the degradation effect.

148
Effect of Dissolved Oxygen, Sodium Bisulfite, and
Oxygen Scavengers on Methane Hydrate Inhibition
This chapter is comprised of the following publication:
• Alef, K., Iglauer, S., Barifcani, A., 2018a. Effect of Dissolved Oxygen, Sodium
Bisulfite, and Oxygen Scavengers on Methane Hydrate Inhibition. J. Chem.
Eng. Data 63, 1821–1826. doi: 10.1021/acs.jced.8b00150
Numerous chemical additives are added to monoethylene glycol (MEG) injection
streams to maintain and protect assets as well as to ensure steady production of
hydrocarbons. Dissolved oxygen levels are monitored due to the serious corrosion
risks that it poses. These levels are kept within the acceptable and safe limit by the
injection of oxygen scavengers. Since these chemical additives are injected into gas
production systems, it is important to understand how they impact gas hydrate
formation; whether they promote or inhibit gas hydrates. The study found dissolved
oxygen may promote gas hydrate formation and thus should be kept to a minimum as
already prescribed for mitigating corrosion. Oxygen scavengers generally served to
slightly increase hydrate inhibition, except for one oxygen scavenger that showed
otherwise. Suggesting that hydrate control programs can be improved by ensuring the
compatibility of all chemical additives are ascertained and that they all serve their
purposes without adversely affecting other processes. This chapter focuses on the
effect of dissolved oxygen and various oxygen scavengers on gas hydrate formation.
This contribution satisfies the thesis objective (j) while fulfilling the research gaps
outlined in Section 1.3.

149
Introduction
Gas hydrate formation and corrosion are flow assurance issues which adversely affect
gas processing and transportation. Chemical additives such as hydrate inhibitors are
commonly injected to shift hydrate formation conditions so that pipeline operating
conditions are within the hydrate-safe region, or to postpone hydrate nucleation, or to
prevent the agglomeration of hydrate particles thus preventing hydrate plugging (Cha
et al., 2013; Kelland, 2006; Sloan Jr and Koh, 2007). Monoethylene glycol (MEG) is
a popular thermodynamic hydrate inhibitor due to its recoverability using closed-loop
MEG regeneration and reclamation facilities (Brustad et al., 2005). Preventing or
lowering the risk of corrosion in gas pipelines is commonly achieved by pH
stabilization or the injection of film forming corrosion inhibitors(Latta et al., 2013;
Lehmann et al., 2014). The pH stabilization method requires that pH is adjusted using
an amine to precipitate a stable protective iron carbonate film (Dugstad and Seiersten,
2004; Halvorsen et al., 2007). However, dissolved oxygen (DO) even in small
concentrations within lean-MEG injection lines, gas pipelines, downstream and well-
head equipment, and MEG regeneration facilities also poses serious corrosion and
operational risks (Ivonye, 2014; Joosten et al., 2007; Kvarekval et al., 2002; Salasi et
al., 2017; Wang et al., 2013; Wang and Wylde, 2010). Dissolved oxygen can cause
serious pitting corrosion to carbon steel and certain corrosion resistant alloy (CRA)
pipelines especially in the presence of MEG (Joosten et al., 2007; Lehmann et al.,
2014). Dissolved oxygen also increases the rate of carbon dioxide corrosion of carbon
steel (John et al., 2009; Martin, 2001; Xiang et al., 2014). Furthermore, DO may hinder
the effectivity of film forming corrosion inhibitors as well as the stability of iron
carbonate films on the inner walls of pipelines (Gulbrandsen et al., 2005; Xiang et al.,
2014).
Oxygen ingress is typically addressed by either purging using an inert gas for the
removal of dissolved oxygen or the injection of specific chemicals known as oxygen
scavengers (typically sulfites) to react with dissolved oxygen, lowering levels to <20
ppb (Braga, 1987; Kelland, 2009; Kundu and Seiersten, 2017). Due to the low level of
dissolved oxygen required to prevent corrosion, industrial-grade nitrogen cannot be
used for purging as the sole method (unless ultrapure nitrogen is feasible) due to the
high oxygen contamination levels (>3%) (Lehmann et al., 2014). A combined

150
approach where nitrogen purging in storage vessels alongside the injection of oxygen
scavengers is commonly implemented to not only reduce the dissolved oxygen
concentration but to do so in a short duration of time (Braga, 1987). Even small
amounts of dissolved oxygen over an extended period could result in nucleation of
corrosion pits and consequent autocatalytic propagation (Salasi et al., 2017).
In terms of gas hydrate inhibition, it is important to understand how the added
chemicals or oxygen scavengers will affect the hydrate inhibition performance of
MEG. These chemicals must be assessed to ensure there are no opposing effects on
the desired hydrate inhibition performance owing to dissociation products, by-
products of side-reactions, impedance to MEG’s inhibition kinetics, and
incompatibilities. The tendency for these side-reactions to occur are further enhanced
by the high operational temperatures applied in MEG closed loops, and thus build-up
of by-products and chemical additives in the MEG closed loop may play a role in
hydrate inhibition. In this study, the methane hydrate inhibition performance of MEG
combined with various oxygen scavengers was investigated. Oxygen scavengers are
required in large concentrations to have an effective result (Lehmann et al., 2014).
Optimally, oxygen scavengers should be non-volatile, allowing for removal with salts
during the reclamation process, preventing unnecessary build-up and fouling of the
MEG closed loop (Lehmann et al., 2014). However, MEG operations may not have a
reclamation stage, or may have slip-stream reclamation depending on the allowable
salt tolerance in the final lean-MEG solution to be injected at the wellhead, so oxygen
scavengers may not be removed at all, or are removed from only a portion of the MEG
inventory. Thus, knowing whether they perform as hydrate promoters or inhibitors is
crucial to a successful hydrate flow assurance program.
Experimental Methodology
8.2.1 Materials and Chemicals
The chemicals utilized in this study were sourced from various high-grade vendors and
are reported in Table 8.1. MEG was sourced from Chem-Supply (99.477 mol %), and
deionized water was effectively produced within the laboratory (electrical resistivity
of 18 MΩ·cm at 24 °C). Ultrahigh purity methane (99.995 mol %) supplied by BOC
was used as the hydrate forming gas, while ultrahigh purity nitrogen (99.9959 mol %)

151
was produced in-house using a nitrogen generator for purging and to maintain a
nitrogen blanket in all experiments.
The oxygen scavengers tested in this study for their hydrate inhibitory performance
were sodium bisulfite (NaHSO3), a proprietary oxygen scavenger (hereafter referred
to as OS-P), and finally a nonsulfite oxygen scavenger (IFEox2) developed by Kundu
and Seiersten which is erythorbic acid-based (Kundu and Seiersten, 2017). The use of
transition-metal ions as catalysts in aqueous solutions to increase the rate of sulfite-
oxidation is well-known (Podkrajšek et al., 2004; Salasi et al., 2017). Salasi et al.
(2017) evaluated the use of transition-metal ions such as Co(II), Fe(II), Mn(II), and
Ni(II) in MEG solutions and suggested Mn(II) ions in the form of its chloride salt as
an effective catalyst. Therefore, sodium bisulfite test solutions were prepared using
manganese chloride. The composition of the nonsulfite-based oxygen scavenger was
based on the publication of Kundu and Seiersten (2017). The composition of the
nonsulfite oxygen scavenger, and the dosages used in the test solutions are reported in
Table 8.2 and Table 8.3.
Table 8.1: Materials utilized in this study.
Material Formula Purity (mol%) Supplier
Monoethylene glycol C2H6O2 99.477 Chem-Supply
Methane CH4 99.995 BOC
Nitrogen N2 99.9959 NGP10+
Sodium bisulfite NaHSO3 >99.5 Sigma-Aldrich
Table 8.2: Composition of the oxygen scavenger developed by Kundu and Seiersten
(2017).
Material Formula Concentration
(wt%)
Purity
(mol%)
Supplier
Erythorbic Acid C6H8O6 17 ≥99.0 Sigma-Aldrich
Diethylaminoethanol
(DEAE)
C6H15NO 25 ≥99.5 Sigma-Aldrich
Manganese chloride MnCl2.4H2O 0.5 >98.0 Chem-Supply
Deionized water H2O 57.5 -a Produced in lab

152
a Produced in the laboratory and sparged with nitrogen.
8.2.2 Test Apparatus and Experimental Procedure
The MEG solutions were carefully prepared with oxygen scavengers as shown in
Figure 8.1. The composition and oxygen scavenger dosage for each test solution are
reported in Table 8.3. An airtight glass vessel of 1 L volume upon a magnetic stirrer
was used for mixing the solution. A ThermoScientific Orion 5-Star pH probe (accuracy
of ±0.002) was used for measuring the pH within the cell, and for dissolved oxygen
measurements, the In-Pro 6850i (±1% + 6 ppb) was utilized. Both probes were
connected to Mettler Toledo M800 devices for continuous monitoring. The cell was
connected to a nitrogen/air retractable inlet which was controlled via a two-way valve.
This allowed for purging the mixture within the cell and to provide a nitrogen blanket
throughout the experiment to minimize oxygen intrusion. Gas flow meters were used
to control the flow of inlet gas, and an outlet connected to a gas wash bottle was
installed to prevent over pressurization in the glass vessel.
Figure 8.1: Schematic of the test apparatus used for the preparation of MEG/oxygen
scavenger solutions.
Table 8.3: Oxygen scavenger dosage in each test solution.
Test Solution MEG
(wt%)
Oxygen
Scavenger
Catalyst
(ppm)
Dissolved Oxygen
(ppb)

153
(wt%)
Blank 20 - - <20
Blank 20 - - >7500
Sodium Bisulfite
(NaHSO3)
0
20
0.01 (100 ppm)
0.1
1
10
0.01 (100 ppm)
0.1
1
10
1 <20
OS-P 20 0.025 (250 ppm) - <20
IFEox2 20 0.01 (100 ppm) - <20
The gas hydrate inhibition testing was conducted using a high-pressure PVT cell. The
isochoric method was adopted for determining the hydrate phase equilibria applying a
1 °C/hour step-heating and step-cooling rate (Sloan Jr and Koh, 2007). At each step of
the procedure, the system was allowed to reach equilibrium before resuming the
process. The preliminary experiments were conducted three times to test repeatability.
Details of the procedure and test apparatus for hydrate testing were explained in our
previous research studies (Alef et al., 2018c; Smith et al., 2016, 2015).
Results
Preliminary experiments to establish data accuracy were conducted for the methane
hydrate phase boundary for 20 wt% MEG solution with the balance being deionized
water. Data from literature and predictions from HYSYS using the Peng–Robinson
equation of state were compared to the measured hydrate phase boundary (Figure 8.2).
The measured data revealed an absolute average relative error (AARE) of 2.6% from
literature and 2.2% from software calculations. Taking into consideration experimental
error margins from previous publications, the statistical analysis indicates that the
measured data in this study are accurate and show a good agreement with the reference
data (Aspen HYSYS, 2007; Eichholz et al., 2004; Haghighi et al., 2009b; Rock, 2002).
AARE was calculated using Eqn. (8.1).

154
AARE (T) = 100
𝑛∑|
𝑇𝑐𝑎𝑙𝑐𝑢𝑙𝑎𝑡𝑒𝑑 − 𝑇𝑚𝑒𝑎𝑠𝑢𝑟𝑒𝑑𝑇𝑚𝑒𝑎𝑠𝑢𝑟𝑒𝑑
|
𝑛
𝑖=1
(8.1)
Figure 8.2: Methane hydrate phase boundary for 20 wt% MEG + 80 wt% water
solution.
8.3.1 Effect of Dissolved Oxygen
MEG solutions containing high and low dissolved oxygen concentrations were tested
to determine their influence on hydrate inhibitory performance. The measured phase
boundaries are plotted in Figure 8.3. It was found that with increased exposure to
oxygen (i.e., at dissolved oxygen levels of >7500 ppb), the hydrate phase boundary
shifted to the right by an average of 0.4 °C. This suggests that dissolved oxygen
increases the thermodynamic equilibrium temperature for MEG solutions and thus
promotes hydrate formation. The increase in hydrate formation temperature may be
caused due to the reaction of oxygen with minute particles of iron carbonate which
could be present in manufactured MEG solutions. The product of this reaction is iron
oxide, which leads to a reduction in MEG quality (Brustad et al., 2005; Lehmann et
al., 2014). Furthermore, oxygen contributes to degradation of MEG through oxidation
which ultimately decreases MEG quality. Degradation of MEG and the effect it has on

155
hydrate inhibition is an area that has not been well researched to date. Rossiter et al.
committed to MEG degradation research and showed that the products of MEG
degradation consisted of oxalic, formic, and glycolic acids (Rossiter et al., 1985). The
mechanism by which thermal oxidation of MEG occurs involves complex free radicals
(Bamford et al., 1980). Other researchers also found similar products of MEG
degradation through the use of high-performance liquid chromatography (HPLC) and
ion chromatography (IC) (AlHarooni et al., 2015; Madera et al., 2003). AlHarooni et
al. (2015) found that the hydrate inhibitory performance of MEG decreased due to
thermal oxidation while also showing that fresh samples of MEG exposed to oxygen
showed similar degradation products when analysed using HPLC and IC analysis
techniques. The degradation of MEG or glycols in general occur through a thermal
oxidative reaction, and hence, the removal of oxygen could prevent unnecessary
degradation of MEG, which will in turn prevent the drop in hydrate inhibition
performance (Rossiter et al., 1985).
Figure 8.3: Hydrate phase boundaries of 20 wt% MEG solution with low (<20 ppb)
and high (>7500 ppb) oxygen content.
8.3.2 Effect of Sodium Bisulfite
Oxygen scavengers are utilized in low concentrations in industrial applications,

156
usually in concentrations of 200 to 500 ppm within lean-MEG (80 wt%). In this work,
a range of concentrations was applied to investigate the shift in hydrate phase boundary
due to oxygen scavenger concentration. Varying concentrations of aqueous sodium
bisulfite (0.01, 0.1, 1, and 10 wt%) solutions were tested for methane hydrate
inhibition. Hydrate phase boundaries were obtained with and without hydrate inhibitor
(MEG 20 wt%). The results are shown in Table 8.4 and are illustrated in Figure 8.4
and Figure 8.5.
Table 8.4: Methane hydrate equilibria data for sodium bisulfite solutions.a
NaHSO3
(0.01 wt%)
NaHSO3
(0.1 wt%)
NaHSO3
(1 wt%)
P/bar T/°C
P/bar T/°C
P/bar T/°C
75.8 10.4
75.3 10.2
73.6 9.6
99.5 12.8
100.7 12.9
101.1 12.5
125.9 14.9
124.4 14.7
123.3 14.3
151.1 16.6
150.9 16.5
151.2 16.2
NaHSO3
(10 wt%)
MEG (20 wt%)
+ DI Water
MEG + NaHSO3
(0.01 wt%)
P/bar T/°C
P/bar T/°C
P/bar T/°C
77.6 7.2
74.8 5.1
73.8 4.9
96.5 9.3
101.3 7.5
98.8 7.2
126.3 11.5
125.2 9.1
125.4 9.1
145.5 12.7
150.3 10.4
149.1 10.3
MEG + NaHSO3
(0.1 wt%)
MEG + NaHSO3
(1 wt%)
MEG + NaHSO3
(10 wt%)
P/bar T/°C
P/bar T/°C
P/bar T/°C
75.5 4.9
73.9 3.8
91.2 0.4
99.7 7.1
98.2 6.2
103.1 1.12
126.2 9
123 8.2
121.4 2.38
149.6 10.3
151.5 9.9
144 3.67
a All uncertainties are expanded uncertainties (U) at 95% level of confidence: U(P) =
±0.5 bar; U(T) = ±0.03 °C.

157
Figure 8.4: Hydrate phase boundaries for aqueous NaHSO3 solutions.
The hydrate phase boundaries of aqueous NaHSO3 solutions show no inhibitory effect
for a concentration of 0.01 wt% and produced a small depression of ∼0.1 °C at 0.1
wt% when compared to the phase boundary of pure water. However, the hydrate phase
boundary was shifted to lower temperatures by ∼0.4 °C on average at a concentration
of 1 wt%. While at 10 wt% of NaHSO3 in pure water, the hydrate phase boundary was
shifted by ∼3.4 °C, showing the greatest inhibition effect.
The hydrate phase boundary for MEG/NaHSO3 mixtures at NaHSO3 concentrations
of 0.01, 0.1, 1, and 10 wt% in 20 wt% MEG showed a temperature depression of 0.1,
0.2, 0.9, and 6.4 °C, respectively. At higher NaHSO3 concentrations of 1 and 10 wt%,
an increased hydrate inhibitory performance was observed, suggesting it performs as
a thermodynamic hydrate inhibitor to a greater extent than when NaHSO3 is present in
smaller concentrations. In the presence of MEG, NaHSO3 has a greater temperature
depression (88% increase), which may be due to the synergistic effect caused by
combining MEG with NaHSO3 and the decrease in the number of water molecules
available for hydrate cage formation.
A water molecule consists of hydrogen atoms which have a positive dipole charge,
whereas the oxygen atom has a negative charge, and these oppositely charged dipoles

158
allow water molecules to easily cage together around a host molecule by forming
hydrogen bonds (Tohidi et al., 2000). Sodium bisulfite dissociates in water into Na+
and HSO3− ions as per Eqns. (8.2) to (8.5). These dissolved ions as well as the catalyst
manganese ions in the aqueous salt solution interact with the negatively and positively
charged dipoles of available water molecules. This strong electrostatic attraction
between a salt ion and water molecule is stronger than the hydrogen bonding that
occurs between water molecules. This weakens the hydrogen bonding between water
molecules and shifts the thermodynamic equilibrium to lower temperatures, which
ultimately inhibits hydrate formation by preventing the gaseous molecule to be
encaged by water molecules (Nguyen and Nguyen, 2015; Sun et al., 2017). The
strength of electrostatic attraction is characterized by the charge and atomic radius of
the ion. In the case of a cation, the strength is directly proportional to charge and
inversely proportional to the radius (Cha et al., 2016; Lv et al., 2018).
NaHSO3 ↔ Na+ + HSO3− (8.2)
HSO3− ↔ SO3
2− + H+ (8.3)
2SO32− + O2 ↔ 2SO4
2− (8.4)
2HSO3− + O2 → 2SO4
2− + 2H+ (8.5)
The results reveal that at NaHSO3 concentrations of 0.01–0.1 wt% (equivalent to 100–
1000 ppm) show no change in the hydrate phase boundary and thus have no impact on
the inhibitory performance of MEG. This concentration range is inclusive of the
typical concentrations of oxygen scavengers that are required to remove oxygen.
Therefore, no additional hydrate inhibitory performance, but also no hydrate
promotion, are expected at the stated NaHSO3 concentrations.

159
Figure 8.5: Hydrate phase boundaries for aqueous NaHSO3 + MEG solutions.
8.3.3 Effect of Proprietary Oxygen Scavenger (OS-P)
A proprietary oxygen scavenger (OS-P) used in the oil and gas industry was combined
with 20 wt% MEG solution in the recommended concentration range by the
manufacturer. The hydrate phase boundary was measured and is plotted in Figure 8.6.
The hydrate phase boundary as compared to a 20 wt% pure MEG solution has been
shifted to higher temperature by ∼0.3 °C, which signifies hydrate promotion. Although
hydrate promotion was identified, only a very small concentration of OS-P (up to 0.05
wt%) is usually utilized within lean-MEG (typically >80 wt%). This hydrate
promotion may be overlooked, but due to the small dosage of the chemical as well as
the various other proprietary chemical additives used in the industry may result in
detrimental effects. We conclude that proprietary chemical additives designed and
created for specific purposes may have negative consequences on other flow assurance
issues.

160
Figure 8.6: Hydrate phase boundary of proprietary oxygen scavenger, OS-P (0.025
wt%) in 20 wt% MEG solution.
8.3.4 Effect of Nonsulfite-Based Oxygen Scavenger (IFEox2)
The nonsulfite oxygen scavenger (IFEox2) developed by Kundu and Seiersten was
investigated in this study which comprises erythorbic acid, diethylaminoethanol
(DEAE), and a manganese catalyst. It was tested to realize its influence on gas hydrate
formation in the presence of 20 wt% MEG solution. The measured hydrate phase
boundary is plotted in Figure 8.7. The results show that the phase boundary has shifted
to the left by ∼0.1 °C, suggesting this oxygen scavenger acted as a hydrate inhibitor.
This slight inhibition performance could be related to hydrogen bonding of some water
molecules with the remaining hydroxyl groups of erythorbic acid, DEAE, and
erythorbate salt. Erythorbate salt is a result of the postneutralization reaction by DEAE
with erythorbic acid (Figure 8.8).

161
Figure 8.7: Hydrate phase boundary of IFEox2 (0.01 wt%) in 20 wt% MEG solution.
Figure 8.8: Conversion of erythorbic acid to erythorbate salt by neutralization
reaction by DEAE.
Conclusions
The influence of dissolved oxygen and various oxygen scavengers on gas hydrate
formation was studied. Gas hydrates can cause dangerous consequences, and thus, it
is important to understand how the various chemical additives that are injected
alongside MEG behave and distort the hydrate inhibition performance. The study
produced new hydrate equilibria data for sodium bisulfite solutions (0.01–10 wt%)
with and without the presence of MEG. Results show greater inhibition at higher
concentrations as opposed to commonly used dosages for oxygen scavenging
applications. However, a proprietary oxygen scavenger promoted hydrate formation,
which suggests that chemical additives should be thoroughly assessed for
compatibility with other chemicals as well as tested to determine any potential negative

162
consequences. A nonsulfite oxygen scavenger showed inhibition performance but may
not surmount to any benefit due to the small dosages required. Furthermore, the study
has revealed that dissolved oxygen, while it already negatively affects corrosion risk,
may have a hydrate promotion effect as well, which increases the risk of gas hydrate
formation. Clearly, dissolved oxygen levels should be kept to a minimum.

163
Hydrate Phase Equilibria of Phosphonate Scale
Inhibitors, Amines, and Ethylene Glycol
This chapter is comprised of the following publication:
• Alef, K., Barifcani, A., 2019. Hydrate Phase Equilibria of Phosphonate Scale
Inhibitors, Amines, and Ethylene Glycol. J. Chem. Eng. Data 64, 3205–3210.
doi: 10.1021/acs.jced.9b00366
This chapter contributes new hydrate phase equilibria data for various scale inhibitors
and amines. Scale formation risks arise due to formation water production posing
serious concerns in valves, pumps, and production equipment. Scale inhibitors are
injected to prevent scale formation. These chemicals have not been modelled in
hydrate simulators nor have their impact upon gas hydrate been studied
experimentally. Thus, in this study, various phosphonate scale inhibitors such as
iminodi (methylene) phosphonate, nitrilotris (methylene) phosphonate, and
diethylenetriaminepenta (methylene) phosphonate, and two amines,
monoethanolamine (MEA) and diethanolamine (DEA) were tested using the isochoric
hydrate testing method for their hydrate inhibition performance. The average
temperature depression for each chemical as mentioned in the aforementioned order
was found to be 0.06, 0.15, and 0.2 K for the scale inhibitors at a concentration of 350
ppm. This suggests that scale inhibitors may also inhibit hydrate formation, albeit at
limited extent, but more importantly, they do not serve to promote hydrate formation;
thus, they are not disturbing the hydrate control program. While for the amines, an
average temperature depression of 0.2 and 0.47 K was found for MEA and DEA at a
concentration of 5 wt% respectively. Suggesting that such amines when used alongside
MEG may bring about an additional hydrate inhibitory performance. This contribution
satisfies the thesis objective (k) while fulfilling the research gaps outlined in Section
1.3.

164
Introduction
Gas hydrates are ice-like structures that form above the ice formation temperature. It
is a phenomenon whereby water through hydrogen bonding encapsulates gaseous
molecules forming a caged structure (Sloan Jr and Koh, 2007). Typical low
temperature subsea conditions of high pressure serve the right conditions for increased
hydrate formation in the presence of natural gas in pipelines (Koh et al., 2002). The
formation of gas hydrates in gas pipelines can, for the least, stop valuable gas
production due to blockage leading to loss in production time and increased costs due
to immediate hydrate removal works. Conventionally, the industry injects chemical
additives known as gas hydrate inhibitors to lower the thermodynamic hydrate
equilibrium (i.e., MEG—monoethylene glycol), to prevent agglomeration of hydrate
solids, or to prolong the hydrate induction and nucleation period (Kelland, 2006; Li et
al., 2006).
Alongside the gas hydrate challenge in pipelines, there is the tendency for scale
deposition to occur in the presence of formation water, seawater, or injected water
(Crowe et al., 1994). Scaling can cause serious complications in pumps, valves, and
other production equipment while increasing inner surface roughness, decreasing the
pipeline diameter thus causing a pressure drop or complete flow blockage leading to
loss in production time (Bratland, 2010; Olajire, 2015). Typical scales that occur in
oilfield production are calcium sulfate (CaSO4), barium sulfate (BaSO4), strontium
sulfate (SrSO4), and calcium carbonate (CaCO3).(8,9) Scales of the sulfate type occur
due to the mingling of different waters that are chemically incompatible such as
formation water, seawater, or injection water as given in Eqn. (9.1), while carbonate
scales have a tendency to form due to pressure reduction or an increase in pH caused
by escaping CO2 (Bratland, 2010; Liu et al., 2009). In some fields, formation of water
production occurs later in the life of the field, thus increasing the risk of scale
formation. At this time, the use of amines such as methyldiethanolamine (MDEA) for
corrosion control via the pH stabilization method can no longer be employed because
of the high risk of scale formation (Alef et al., 2018b; Olsen and Halvorsen, 2015).
Thus, there is a change in the corrosion control method, whereby a film-forming
corrosion inhibitor is utilized, while the use of a scale inhibitor (typically
phosphonates) becomes incumbent to protect the system and to prevent/reduce scale

165
formation in pipelines (Halvorsen et al., 2009, 2006).
{
𝐵𝑎(𝑎𝑞)2+
𝐶𝑎(𝑎𝑞)2+
𝑆𝑟(𝑎𝑞)2+
+ 𝑆𝑂4 (𝑎𝑞)2− → {
𝐵𝑎𝑆𝑂4 (𝑠)𝐶𝑎𝑆𝑂4 (𝑠)𝑆𝑟𝑆𝑂4 (𝑠)
(9.1)
Amines are commonly used in the natural gas processing industry as well as used for
corrosion control through the pH stabilization method. Amines in the form of
monoethanolamine (MEA) and diethanolamine (DEA) are utilized in amine gas
treating, while MDEA serves as an excellent chemical absorbent to favourably remove
H2S and CO2 from sour gas streams during natural gas processing (Closmann et al.,
2009; Idem et al., 2006; Lawson and Garst, 1976; Weiland et al., 1997).
The aforementioned chemicals are amongst numerous other chemical additives that
are usually injected alongside MEG or that are found in the gas production system or
processing facilities for which their impact on gas hydrate formation, whether positive
or negative, is unknown. The hydrate phase equilibria for these chemicals have never
been determined. In this study, a selection of these chemicals have been thoroughly
tested at relevant dosage amounts to characterize their impact on methane gas hydrate
formation, thus contributing valuable hydrate phase equilibria data.
Methodology
9.2.1 Materials
The chemicals and materials utilized in this study were sourced from high-grade
vendors and are listed in Table 9.1. The commonly applied hydrate inhibitor, MEG,
was sourced from Chem-Supply at a purity of 99.477 mol %. Deionized water was
abundantly produced within the research laboratory with an electrical resistivity of 16
MΩ·cm at room temperature. The hydrate-forming gas that was used for hydrate
testing was selected as ultrahigh purity methane supplied by BOC at a purity of 99.995
mol %. Ultrahigh purity nitrogen (99.9959 mol %) for purging the test apparatus and
maintaining a nitrogen blanket in all sample preparation procedures was abundantly
produced using a nitrogen generator (AtlasCopco, NGP10+) within the research
laboratory. Three phosphonates were selected as the scale inhibitors that were utilized
in this study consisting of iminodi(methylene) phosphonate (IDMP),
nitrilotris(methylene) phosphonate (NTMP), and diethylenetriaminepenta(methylene)

166
phosphonate (DTPMP), all sourced from Sigma-Aldrich. As for the amines, MEA and
DEA were used in this study and were sourced from Sigma-Aldrich.
Table 9.1: List of chemicals utilized in this study.
Chemical Formula CAS Reg. No. Concentration Source
MEG C2H6O2 107-21-1 99.477% Chem-Supply
Methane CH4 74-82-8 99.995% BOC
IDMP C2H9NO6P2 17261-34-6 97% Sigma-Aldrich
NTMP C3H12NO9P3 6419-19-8 97% Sigma-Aldrich
DTPMP C9H28N3O15P5 15827-60-8 50% + 15% HCl
+ 35% H2O
Sigma-Aldrich
MEA C2H7NO 141-43-5 ≥99% Sigma-Aldrich
DEA C4H11NO2 111-42-2 ≥99% Sigma-Aldrich
9.2.2 Experimental Method
The isochoric hydrate testing method was employed across all tests with a step-heating
and cooling rate of 1 K/h to determine the hydrate phase equilibria data. All test
solutions were carefully prepared in a sealed glass vessel purged with nitrogen to
prevent oxygen ingress and stirred using a magnetic stirrer for complete synthesis as
shown in Figure 9.1 (Alef et al., 2019c). An initial test was conducted on a pure MEG
solution of 5 wt% for comparison to simulation results from Multiflash and PVTSim
software. Then, test solutions comprising chemicals as per the experimental test matrix
(Table 9.2) with the balance being deionized water were carefully prepared taking into
account the varying initial concentrations. Samples of the test solutions (7 mL) were
precisely injected into a clean high-pressure PVT cell as depicted in Figure 9.1.
Chemical dosage amounts that are relevant to the industry were adopted in this study.
Typically, scale inhibitors are injected at very low dosages (i.e., 5–300 ppm), while
amines such as MDEA are typically injected at 3–7 wt% (Alef et al., 2018b; Dugstad
and Seiersten, 2004; Jordan et al., 2019; Lehmann et al., 2014; Shaw et al., 2012; Shaw
and Sorbie, 2015; Vetter, 1972). The procedure for the sample preparation and hydrate
testing has been given in more detail in previous studies (Alef et al., 2018b, 2018a).

167
Figure 9.1: High-pressure PVT cell used in this study for performing hydrate
inhibition testing.
Table 9.2: Experimental test matrix and chemical structures.
Test Dosage Chemical Structure
MEG 5 wt%
IDMP 35 ppm
350 ppm
NTMP 35 ppm

168
350 ppm
DTPMP 35 ppm
350 ppm
MEA 5 wt%
DEA 5 wt%
Results
The hydrate phase equilibria boundary of pure MEG (5 wt%) is given in Figure 9.2
and Table 9.2. As expected, the thermodynamic hydrate inhibitor (MEG) shifted the
hydrate phase boundary to the left by 1.07 K in reference to the simulated hydrate
phase boundary of pure water. The absolute average relative error as per Eqn. (9.2)
between the experimentally measured equilibrium temperature (Tmeas) and the
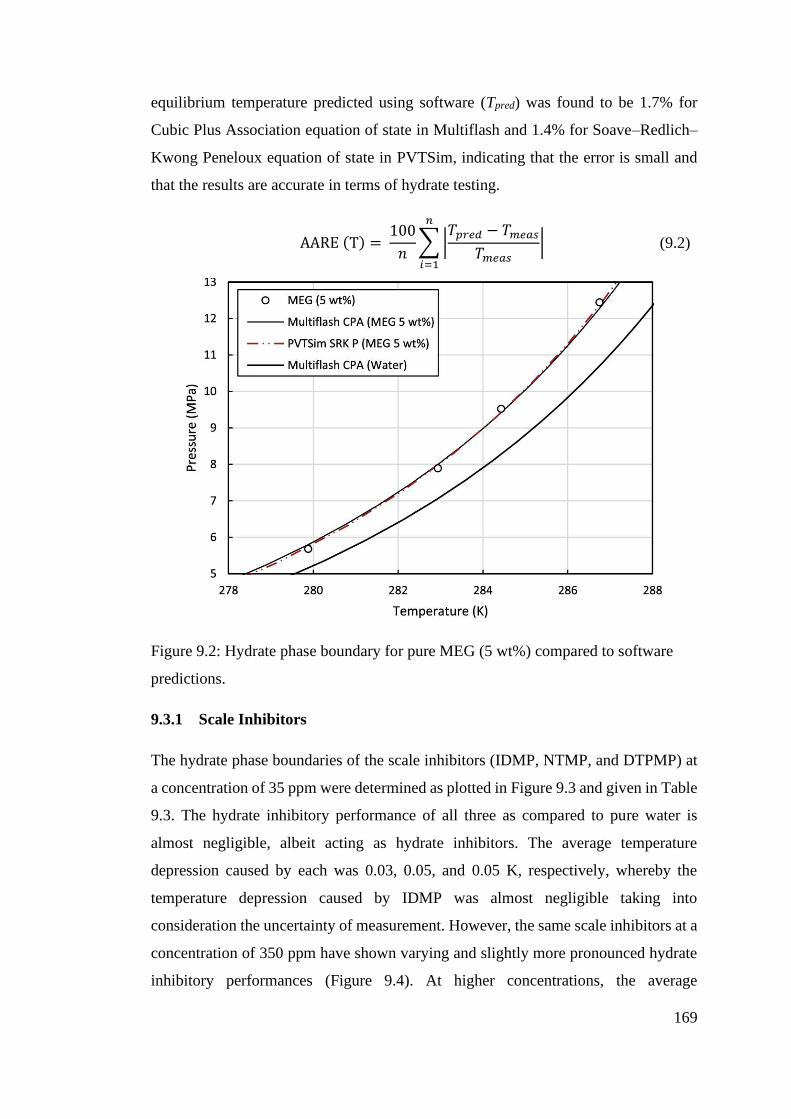
169
equilibrium temperature predicted using software (Tpred) was found to be 1.7% for
Cubic Plus Association equation of state in Multiflash and 1.4% for Soave–Redlich–
Kwong Peneloux equation of state in PVTSim, indicating that the error is small and
that the results are accurate in terms of hydrate testing.
AARE (T) = 100
𝑛∑|
𝑇𝑝𝑟𝑒𝑑 − 𝑇𝑚𝑒𝑎𝑠
𝑇𝑚𝑒𝑎𝑠|
𝑛
𝑖=1
(9.2)
Figure 9.2: Hydrate phase boundary for pure MEG (5 wt%) compared to software
predictions.
9.3.1 Scale Inhibitors
The hydrate phase boundaries of the scale inhibitors (IDMP, NTMP, and DTPMP) at
a concentration of 35 ppm were determined as plotted in Figure 9.3 and given in Table
9.3. The hydrate inhibitory performance of all three as compared to pure water is
almost negligible, albeit acting as hydrate inhibitors. The average temperature
depression caused by each was 0.03, 0.05, and 0.05 K, respectively, whereby the
temperature depression caused by IDMP was almost negligible taking into
consideration the uncertainty of measurement. However, the same scale inhibitors at a
concentration of 350 ppm have shown varying and slightly more pronounced hydrate
inhibitory performances (Figure 9.4). At higher concentrations, the average

170
temperature depression caused by each was 0.06, 0.15, and 0.20 K, respectively.
The best performer in terms of hydrate inhibition is DTPMP followed by NTMP,
which may be related to the size of the chemical structure (DTPMP > NTMP > IDMP)
and the number of hydroxyl groups, whereby there exists 10 [OH-] groups for DTPMP
>6 [OH-] for NTMP >2 [OH-] for IDMP (Table 9.2). The hydroxyl groups form
hydrogen bonds with water molecules, thus reducing the quantity of water molecules
that are available to form a cage structure around gaseous molecules, thus reducing
hydrate formation. Furthermore, DTPMP contains 15% HCl which dissociates in
water into H+ and Cl- ions. The ions will electrostatically attract to the oppositely
charged dipoles of water molecules preventing them to form water cages around
gaseous molecules (Nguyen and Nguyen, 2015; Sun et al., 2017; Tohidi et al., 2000).
Thus, shifting the thermodynamic equilibrium point to a lower temperature leads to
increased hydrate inhibition.
Moreover, the results suggest that at the typical scale inhibitor concentration range
applied in the field will not bring about a significant shift in the hydrate phase boundary
at the upper end of the concentration range, despite there being a negligible effect at
the lower end of the concentration range. Thus, scale inhibitors unless utilized in much
higher dosages do not raise concerns to the effectivity of the hydrate control program
nor do they necessarily contribute an added safety margin nor serve to potentially
reduce MEG injection.

171
Figure 9.3: Hydrate phase boundaries for scale inhibitors (IDMP, NTMP, and
DTPMP) at 35 ppm compared pure water.
Figure 9.4: Hydrate phase boundaries for scale inhibitors (IDMP, NTMP, and
DTPMP) at 350 ppm compared pure water.

172
9.3.2 Amines (MEA and DEA)
The hydrate phase boundaries for the amines (MEA and DEA) at a concentration of 5
wt% were determined as plotted in Figure 9.5 and given in Table 9.3. Both MEA and
DEA exhibited hydrate inhibitor qualities by shifting the hydrate phase boundary to
the left. Average temperature depressions of 0.2 and 0.47 K were found. MEA and
DEA are completely miscible in water while having hydrophilic properties and
hydroxyl groups which are able to establish hydrogen bonding with water molecules.
Through this mechanism, both chemicals are able to decrease the amount of available
water molecules that could potentially encage gaseous molecules (Davoudi et al.,
2014; Hossainpour, 2013). Another factor that leads to the dissociation of the hydrate
may be due to the heat released from the exothermal reaction in CO2/H2S systems
containing an amine (Park et al., 2006; Xiang et al., 2014).
Figure 9.5: Hydrate phase boundaries of MEA, DEA, and MEG at 5 wt% as
compared to pure water.
MEG was found to be 3.8 and 2.1 times more effective as compared to MEA and DEA
of the same concentration with the reference being the hydrate phase boundary of pure
water, respectively. The equivalent amount of MEG was determined as 1.3 wt% for 5
wt% MEA and 2.4 wt% for 5 wt% DEA via simulation using Multiflash as shown in
(Figure 9.6).

173
Figure 9.6: Hydrate phase boundaries for MEA and DEA at 5 wt% and their
equivalent MEG concentrations using Multiflash.
Table 9.3: Equilibria data produced in this study for meg, scale inhibitors (IDMP,
NTMP, and DTPMP), and amines (MEA and DEA).a
MEG (5 wt%)
MEA (5 wt%)
DEA (5 wt%)
T/K P/MPa
T/K P/MPa
T/K P/MPa
279.88 5.68
279.38 5.02
279.63 5.25
282.94 7.89
282.96 7.24
282.62 7.24
284.43 9.52
285.92 10.03
286.29 10.88
286.75 12.44
287.91 12.67
287.19 11.97
IDMP (35 ppm)
NTMP (35 ppm) DTPMP (35 ppm)
T/K P/MPa
T/K P/MPa
T/K P/MPa
280.14 5.31
280.34 5.44
279.79 5.13
283.45 7.62
283.41 7.56
283.88 7.95
286.44 10.45
286.09 10.13
285.49 9.49
288.11 12.56
287.42 11.68
288.7 13.42

174
IDMP (350 ppm) NTMP (350 ppm) DTPMP (350 ppm)
T/K P/MPa
T/K P/MPa
T/K P/MPa
280.73 5.68
279.75 5.17
281.46 6.22
283.61 7.69
283.91 8.04
283.89 8.08
287.2 11.41
285.99 10.1
286.7 10.98
288.49 13.27
288.84 13.82
287.92 12.58
a Standard uncertainty in pressure and temperature measurements are ±0.05 MPa and
±0.03 K, respectively.
Conclusions
There are numerous chemical additives that are commonly injected into gas pipelines,
gas production systems, or processing facilities for various reasons such as hydrate,
wax, scale, emulsion, and corrosion inhibition. Such chemicals have not been studied
as to their impact on gas hydrate formation, whether positive or negative. Hence, in
this study, three commonly used phosphonates or scale inhibitors (IDMP, NTMP, and
DTPMP) as well as two amines (MEA and DEA) were tested for hydrate formation,
and their hydrate phase boundaries were determined.
The scale inhibitors, although utilized at very small dosage in the field, did not show
significant hydrate inhibition performance, whereby showing a maximum depression
of 0.2 K. The amines showed pronounced hydrate inhibitory qualities with a maximum
temperature depression of 0.47 K which is equivalent to MEG concentration of 2.4
wt% in the case of DEA. On the other hand, both types of chemicals—scale inhibitors
and amines did not raise concerns in terms of hydrate formation; thus, the integrity of
the hydrate control program can be expected to be intact.

175
Utilization of MEG Pilot Plant and MEG Degradation
Methods
This chapter is comprised of the following publications:
• Alef, K., Iglauer, S., Barifcani, A., 2017. An Innovative Approach to Assessing
Gas Hydrate Inhibition and Corrosion Control Strategies, In One Curtin
International Postgraduate Conference (OCPC), Miri, Sarawak, Malaysia:
Curtin.
• Alef, K., Iglauer, S., Barifcani, A., 2019c. Degradation and Hydrate Phase
Equilibria Measurement Methods of Monoethylene Glycol. MethodsX 6, 6–
14. doi: 10.1016/j.mex.2018.12.004
This chapter delves into the innovative use of the MEG pilot plant utilized in this
project for MEG operations, realistic fluid simulation, production chemicals
compatibility studies, switching of corrosion strategies, salt removal and hydrate
testing of regenerated MEG. Moreover, the chapter also covers the developed sample
preparation, degradation and hydrate phase equilibria measurement methods of
monoethylene glycol. Detailed procedures are given for accurate sample preparation
and MEG degradation processes via the reclamation unit and the autoclave mimicking
field-like MEG degradation. A detailed procedure for hydrate testing using a high-
pressure PVT cell employing the isochoric hydrate testing method. A computer script
was developed for quickly determining the hydrate equilibria temperature from the
acquired pressure-temperature data from experiments. This contribution satisfies the
thesis objectives (a) and (f) while fulfilling the research gaps outlined in Section 1.3.

176
An Innovative Approach to Assessing Gas Hydrate Inhibition and
Corrosion Control Strategies
As the scarcity of oil increases, natural gas has become a favourable alternative which
is available abundantly in many parts of the world. Projects in the hundreds that are
focused on the extraction and processing of natural gas have sprung up throughout the
world, this has secured natural gas as a key alternative to oil/coal and has brought about
large-scale distribution as a source of energy (Stanek and Białecki, 2014). A major
concern in the production and transportation of natural gas is the formation of gas
hydrates, due to the presence of water which under typical subsea conditions of high
pressure and low temperature, freezes, resulting in blockages and plugging in pipes,
which often become dangerous projectiles (Koh et al., 2011; Sloan Jr and Koh, 2007).
The consequences of gas hydrates may cause a disastrous loss of containment of gas,
which can be highly expensive, very damaging to our environments, and poses great
threats to the health and safety of project personnel (Camargo et al., 2011; Englezos,
1993).
Natural gas hydrates also known as clathrate hydrates, are crystal-lattice structures
similar to ice, composed of host and guest molecules where the host is water molecules
capturing common gas molecules found in natural gas (Koh, 2002; Sloan Jr and Koh,
2007). Methods utilized in the industry to prevent/inhibit gas hydrates include
depressurization, thermal insulation of the pipeline, dehydration, or the most common,
to inject a hydrate inhibitor such as methanol or monoethylene glycol (MEG) (Son and
Wallace, 2000). MEG is highly favourable due to its high boiling and flash point, low
volatility, and it being safer for the environment as opposed to methanol (Brustad et
al., 2005; Chapoy and Tohidi, 2012; Grzelak and Stenhaug, 2016). The other
advantage of MEG is that it can easily be regenerated due to its high boiling point thus
saving costs in terms of constant replenishment.
Whilst gas hydrates remain a challenge, corrosion and scaling are also major
challenges facing oil and gas facilities resulting in severe cost implications (Aljourani
et al., 2009; Garverick, 1994; López et al., 2003; Papavinasam et al., 2007). A
corrosion management strategy may be put in place, which usually consists of injecting
corrosion inhibitors (Lehmann et al., 2016, 2014), or artificially adjusting pH levels so
that a stable iron carbonate layer can be precipitated upon the internals of the pipelines

177
(Nyborg, 2009). Corrosion strategies may need to be switched especially due to
associated formation water production which increases the risk of corrosion and scale
formation (Latta et al., 2016, 2013).
Due to the large operations involved, it is difficult for companies to assess or to make
a decision on how to effectively change from one strategy to another without
completely shutting down the plant. Or, to analyse how different chemical additives
will behave in a MEG regeneration plant, and consequently their impact on the hydrate
inhibition performance. Companies are wanting to understand the effect of reclamation
on gas hydrate inhibition to be able to maintain continuous operation and to predict
potential future issues from the continual recycling of MEG. This article presents an
innovative approach to providing a basis for testing and running simulations that solve
relevant problems companies may have. The approach involves mimicking typical
MEG regeneration and reclamation process seen in the industry via an innovative
bench-scale MEG pilot plant to allow for realistic yet cost-effective testing of various
scenarios to find practical solutions. A high-pressure PVT cell is then used to test the
hydrate inhibition performance of the MEG samples from the bench-scale operation.
At the same time, experimental results can be compared to the results of simulations
from a range of flow assurance software such as Aspen’s HYSYS, Infochem’s
Multiflash and Calsep’s PVTSim. With all the data on hand, empirical modelling can
be used to produce meaningful relationships to help with the prediction that software
packages cannot achieve. Furthermore, the experimental data that the models are built
upon are relevant to field-specific cases.
10.1.1 MEG Operation
Typical MEG hydrate inhibition operations begin with an injection of lean-MEG at the
offshore wellheads, where it thoroughly mixes with the production fluids thus allowing
for thermodynamic hydrate inhibition (Son and Wallace, 2000). As the production
fluids arrive onshore, a three-phase separator is utilized. The resulting aqueous phase
composing of MEG and water, as well as other contaminants such as organic
compounds and salts, are taken through a pre-treatment process to separate insoluble
contaminants and hydrocarbons. The MEG solution is then re-concentrated via a
reboiler operating above the boiling point of water to remove unwanted water. Finally,
a portion of or all of the resulting solution may be sent through a flash separator

178
operating at the vaporization temperature of MEG thus allowing soluble contaminants
to be left behind (Psarrou et al., 2011; Teixeira et al., 2015). The final solution is now
considered lean-MEG ready to be reinjected at offshore wellheads (Nazzer and Keogh,
2006).
In this study, a brief outline of a MEG bench-scale facility to be used for simulating
actual field operations is proposed. It can be designed as a MEG regeneration and
reclamation closed loop system with a processing capacity of up to 5 kg/hr of lean-
MEG. There are 5 main processes that need to be designed and built using stainless
steel tanks, heating mechanisms, mass flow meters, various measuring probes and a
programmable logic controller to record and monitor:
1. Simulating formation water: Formation water and other contaminants that are
found in the production fluids in the field are to be prepared so as to match
field conditions as accurately as possible. Once the composition of the field
formation water is available then the required salts, acids and other
contaminants are sourced and mixed with de-ionized water to produce
simulated formation water (Figure 10.1). The water can be stored in the
formation water tank (FWT) that is continuously sparged with nitrogen to
prevent oxygen ingress.
Figure 10.1: Simulation of field formation water.
2. Preparation of contaminated MEG: contaminated MEG refers to MEG that has
been separated from the production fluids (i.e. containing salts from formation
water). Based on the field concentration of contaminated MEG, appropriate

179
amount of lean-MEG from the lean-MEG tank (LMT), formation water and
any other chemical additives such as corrosion inhibitors are to be mixed using
a high-speed mixer (Figure 10.2). This allows for proper mixing under high
shear stress simulating turbulent pipeline flow.
Figure 10.2: Simulation of pipeline conditions to create contaminated MEG solution.
3. Pre-treatment of MEG: Now that contaminated MEG has been simulated it can
undergo pre-treatment. A pre-treatment vessel heats the solution to high
temperatures, and where the alkalinity can be adjusted as required to promote
precipitation of divalent salts (insoluble contaminants) (Figure 10.3). The
alkalinity can be adjusted by using sodium hydroxide (NaOH) or hydrochloric
acid (HCl). Finding the fine balance of pH level in the pre-treatment unit is
very difficult, as this will impact the pH in the other sections of the MEG plant
where a certain pH level may be critical. A constant recycle loop keeps the
suspended solids in motion. The solution is then sent to the contaminated MEG
tank (CMT) for storage.

180
Figure 10.3: Contaminated MEG going through pre-treatment to remove insoluble
contaminants.
4. Re-concentration of MEG: The contaminated MEG (now free from insoluble
contaminants) from the pre-treatment vessel is allowed to settle in the CMT to
remove suspended solids. An additional 10 µm filter downstream of the tank
removes any remaining particles before the MEG is routed through to the
reboiler and distillation column (RBD) as shown in Figure 10.4. It is heated to
a temperature above the boiling point of water but below the boiling point of
MEG so only water can be removed. The amount of water removed is based
on the required concentration for re-injection at offshore wellheads (typically
80% volume MEG/water). The resulting solution is stored in the lean-MEG
tank (LMT) whilst a slip-stream depending on the allowable salt limit within
lean-MEG as prescribed by field conditions is sent to the MEG reclamation
unit (MRU).

181
Figure 10.4: MEG from CMT arrives at the reboiler and distillation (RBD) where
water is removed thus increasing MEG concentration.
5. Reclamation of MEG: A slipstream (or all produced salt loaded lean-MEG)
can be “reclaimed” using a rotary evaporator operating in continuous mode.
The salt loaded lean-MEG solution can be flashed in the vacuum flask which
can be operated at 100 mBar. The unit should be operating at vacuum
conditions in order to avoid exposing MEG to temperatures (>135 °C) that
could cause degradation (AlHarooni et al., 2015). The rotary flask is above an
oil bath heated to high temperatures allowing for uniform heat distribution due
to rotation of flask. The resulting flashed vapor will rise to the condenser and
can be collected as salt-free lean-MEG in the receiving flask to be sent to the
lean-MEG tank for storage (Figure 10.5).

182
Figure 10.5: The MEG reclamation unit (MRU) removes soluble contaminants from
the incoming MEG solution.
10.1.2 Gas Hydrate Testing
In parallel to the MEG operation, samples of MEG at any stage of the process can be
taken to test for hydrate inhibition performance. A well-recognized and commonly
used tool for determining the gas hydrate formation, dissociation and equilibrium
points, as well as gas consumption, is a high-pressure PVT cell. Varying gas mixtures
can be introduced into the chamber and sample solutions containing required hydrate
inhibitors can be injected. Common methods of determining the hydrate phase
equilibria can be employed such as isochoric, isobaric and isothermal methods.
A typical high-pressure PVT cell (Figure 10.6) is made out of sapphire material so a
complete visual of the internals of the chamber is available for detailed visual
observations. The cell is equipped with a magnetic stirrer to produce an agitation rate
that helps in complete transformation of the liquid water phase to hydrate, and
encourages the renewal of the surface (Sloan Jr and Koh, 2007). The cell is equipped
with pressure and temperature sensors to capture PVT data for analysis.
Figure 10.6: Basic schematic of a high-pressure PVT cell apparatus capable of gas
hydrate testing.
10.1.2.1 Flow Assurance Software
Flow assurance software packages are increasingly becoming more advanced as
technology develops. The use of these software packages in the context of gas hydrates

183
allow for prediction of formation conditions, validation of experimental data, and to
improve/build upon numerical models that have been experimentally derived. Hydrate
formation and phase equilibria conditions can be estimated using thermodynamic
equations of state and correlations (Smith et al., 2016, 2015). Although, these
simulation tools can quickly and fairly accurately determine hydrate conditions, it is
to be noted that no model can perfectly determine the measured hydrate phase
equilibria and thus this needs to be considered in the analysis of the differences and
deviations (AlHarooni et al., 2016; AlHarooni et al., 2016).
10.1.2.2 Empirical Modelling
As chemical additives that are used in the industry are increasingly becoming
proprietary, flow assurance software fails to predict or provide meaningful analysis.
This is due to the unknown compositions of these chemical additives. This approach
capitalizes on the experimental data specific to a field scenario by developing
empirical relationships that can determine the specific information. This can be as
simple as a linear interpolation between a range of experimental data relevant to the
problem at hand. As shown in Figure 10.7, if a pattern is recognized between a set of
hydrate phase equilibria data of varying concentration of a hydrate inhibitor, a simple
interpolation scheme can be developed to interpolate between the measured data.
Figure 10.7: Example of interpolation of a gas hydrate profile shift, showing multiple
concentrations.
10.1.3 Use Cases
Some of the capabilities and uses of the approach outlined in this article which

184
combines a bench-scale MEG regeneration facility with gas hydrate inhibition testing
include but not limited to:
• Simulation of realistic production fluids, such as condensate mixtures and
simulated formation of water/brines. Verifying production chemical additive
compatibility.
• Simulating the effects of well clean-ups providing valuable insights and
analysis before actual field activity.
• Simulating the effects of switching from one corrosion management strategy
to another (e.g. switching between the film forming corrosion inhibitor to pH
stabilization, and vice versa).
• Providing input into methods for optimising salt removal.
• Study corrosion and scale formation throughout the MEG regeneration plant.
• Providing gas hydrate inhibition performance for all of the above uses. Using
the measured data to develop empirical models to help industry personnel
predict hydrate formation conditions where it is not possible to determine using
traditional flow assurance software.
Protection of the production gas pipelines from internal corrosion is conventionally
achieved using one of two methods: pH stabilization or injecting a film forming
corrosion inhibitor (FFCI). The MEG bench-scale facility can be used to simulate the
procedures for switching between corrosion management strategies and the following
key objectives can be achieved:
• Distribution/partitioning of chemicals/corrosion inhibitors in the various
sections of the MEG facility.
• The behaviour of the pre-treatment, regeneration and reclamation units, and the
removal efficiency of injected chemicals.
• Confirm feasibility of switchover procedures, identify potential gaps and
improvement opportunities.
• Document observations and lessons learned.
A primary corrosion control method that is usually implemented is pH stabilization,
whereby a base - Methyl diethanolamine (MDEA) is added to the lean MEG onshore,
increasing the pH, lowering the corrosion rate and encouraging the formation of a
185
protective FeCO3 scale on the pipeline wall (Latta et al., 2013). pH stabilization is a
very effective method of controlling internal corrosion and reducing the production of
corrosion products from the flowline which has a tendency to foul downstream
equipment. However, pH stabilization increases the risk of scaling in the subsea
architecture, particularly in the choke module and well jumpers, and cannot be used
once formation water breakthrough occurs, or initially when remnant completion
fluids may pose a scale risk. So FFCI is employed as an alternative corrosion control
method, used when pH stabilization is not feasible due to scale formation risk
(Halvorsen et al., 2007). FFCI adsorbs to the pipeline wall, forming a protective film
which prevents corrosion. Risks associated with the use of FFCI are an increased risk
of emulsions, under deposit corrosion, top of line corrosion and fouling of inlet liquid
filters, separators, and the rich MEG processing unit (Latta et al., 2016). FFCI
protection is a less robust corrosion protection method and is intended to be employed
only for a limited period. The switchover to pH stabilization mode will occur once all
wells have unloaded the majority of leftover completion fluid, rich MEG chemistry
has stabilized, and the risk of scaling is deemed to be low. The decision to switchover
may also be driven by unfavourable conditions caused by operation in FFCI modes,
such as emulsion formation, excessive corrosion rates or equipment fouling. The
reverse switchover from pH stabilization back to FFCI mode may be required if field-
wide formation water production is unmanageable through alternative means such as
production reallocation or scale inhibitor injection. The decision to switchover may
also be driven by unfavourable conditions caused by operation in pH stabilization
mode.
10.1.4 Conclusion
With the above approach, companies can invest in developing a bench-scale MEG
pilot plant that matches their actual field design at a fraction of the cost, allowing field
case scenarios to be tested beforehand, where best practices and lessons learned are
documented for actual field use. Operations that would otherwise take months or years
to occur in the field can be scaled down to a matter of days with this approach yet yield
accurate insights to help improve the design and operation in the field. Furthermore,
gas hydrate inhibition performance can be evaluated simultaneously at various stages
of the MEG regeneration process giving insights into how the inhibition performance

186
is influenced by other chemical additives, or the process itself (i.e. continual recycling
of MEG). Future work of the authors’ aims to show a working a facility with actual
field use cases to showcase this approach.
Degradation and Hydrate Phase Equilibria Measurements of
Monoethylene Glycol
10.2.1 Method Details
To meet energy demands, Natural gas has increasingly become a profitable alternative.
However, a serious challenge is the formation of gas hydrates. The traditional
technique to inhibit hydrate formation in pipelines is the injection of a thermodynamic
hydrate inhibitor to shift the hydrate phase equilibrium boundary to lower
temperatures, thus leaving the operating conditions of pipelines to be within a hydrate-
safe region (Sloan Jr and Koh, 2007). For the least, hydrates can cause blockages in
pipelines, severely disrupting gas production, and also have the potential to cause
explosions in pipelines. A common hydrate inhibitor that is utilized is Monoethylene
glycol (MEG), it is mainly favourable due to its high recoverability. However, during
the recoverability process MEG undergoes multiple phases of thermal exposure. This
usually leads to thermal degradation in the MEG solution which results in an overall
lower hydrate inhibitory performance (Alef et al., 2018c).
In-order to understand how degradation occurs, its products, the impact on the
equipment, and the hydrate inhibition performance of MEG, a method to degrade and
test MEG is proposed in-detail. A study conducted by the authors that successfully
utilized this method reported on the effect of regenerated MEG over multiple cycles
(Alef et al., 2018c). The method essentially comprises of three stages; a) Degradation
of MEG, b) Analysis of degraded MEG, and c) Hydrate testing of degraded MEG.
10.2.2 Degradation of MEG
The utilization of MEG as a continuous hydrate inhibitor necessitates ongoing
regeneration to remove impurities such as produced water, reservoir fluids, salts,
corrosion products and production/drilling chemicals that have a tendency to
accumulate within the MEG solution (Alef et al., 2018a; Nazzer and Keogh, 2006; Son
and Wallace, 2000; Teixeira et al., 2015). Reclamation is the process in which non-

187
volatile chemicals and monovalent salts are removed from the MEG solution through
processing a stream of re-concentrated MEG solution from the regeneration process.
The process occurs in a flash separator operating in vacuum where the input solution
(MEG-water-contaminants) are boiled off at a temperature greater than the boiling
point of water and MEG. Both, the water and MEG will evaporate while leaving
behind salts and other chemicals that can then be removed from the system (Brustad
et al., 2005). Care needs to be taken to ensure temperatures do not rise beyond the
thermal degradation temperature of MEG, even though degradation of MEG has been
shown to be possible at reclaimer operating conditions which are considerably lower
(Alef et al., 2018c; Psarrou et al., 2011).
Two experimental apparatuses within the laboratory (reclamation unit and autoclave
system) will be illustrated and their procedures to produce degraded MEG samples
will be outlined. The reclamation process typically implemented in the field was
reproduced by a rotary evaporator essentially a vacuum distillation unit (Figure 10.8).
Laboratory scale rotary evaporators are designed for different reclamation processes
with vacuum control with slight modifications based on specific requirements. The
rotary evaporator is utilized to carry out the separation of MEG from monovalent salts
and insoluble contaminants where salt-laden MEG as an input solution is distilled by
removing the salts as a crystalized residue, and pure lean-MEG is collected as
condensate product. To achieve optimum operating conditions, a vacuum pump is
utilized to avoid MEG degradation due to high temperatures while increasing the salt
removal efficiency. The reclamation unit comprises of an overhead condenser, a
vacuum flask partially submerged in an oil bath, a vacuum system, a liquid receiver
and an integrated control box. Modifications have been made to allow for sparging
with nitrogen (99.999 mol%) to ensure there is no oxygen contamination. To ensure
operating temperatures remain within tolerable and desired levels, several K-type
thermocouples ware retrofitted to measure the temperatures of the vapor and liquid-
slurry phases, while being connected to the Programmable Logical Controller (PLC).
A level sensor was utilized to control the flow of lean MEG into the evaporator flask
based on the desired slip stream portion from the input (or from the regeneration unit
in the case of field application). Other instruments were utilized to monitor the system
in terms of pH, pressure, flowrates, electrical conductivity (EC), dissolved oxygen
(DO).
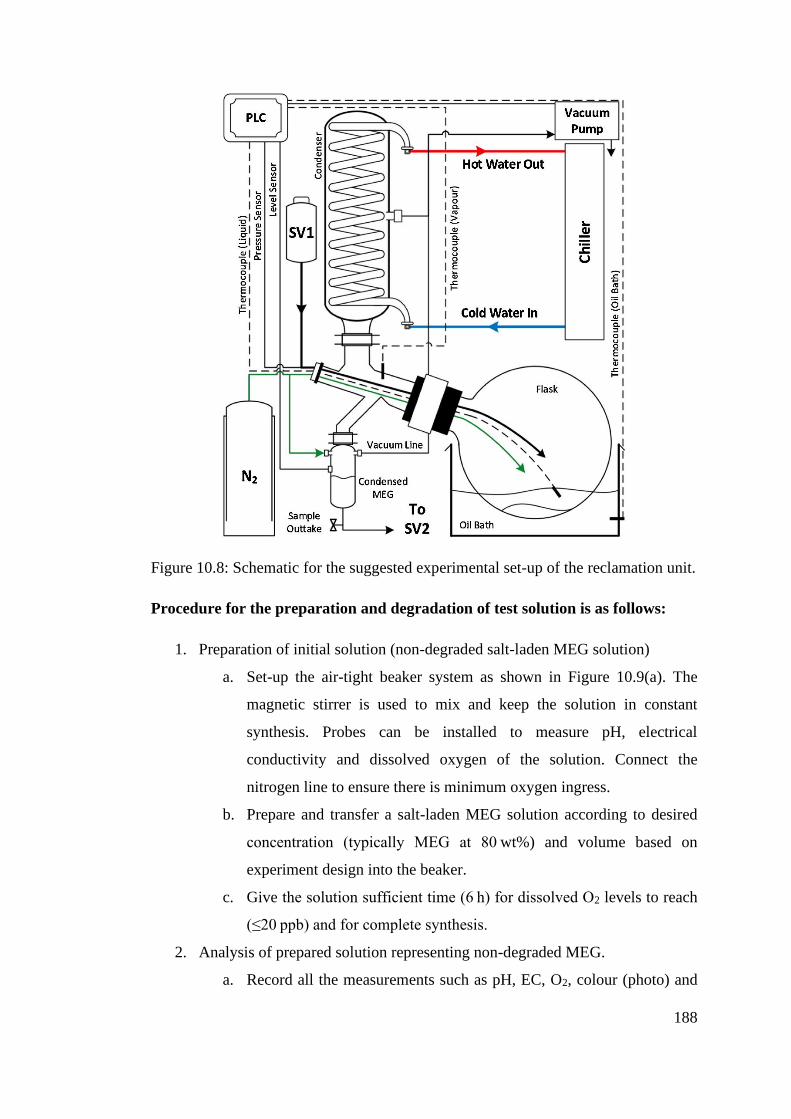
188
Figure 10.8: Schematic for the suggested experimental set-up of the reclamation unit.
Procedure for the preparation and degradation of test solution is as follows:
1. Preparation of initial solution (non-degraded salt-laden MEG solution)
a. Set-up the air-tight beaker system as shown in Figure 10.9(a). The
magnetic stirrer is used to mix and keep the solution in constant
synthesis. Probes can be installed to measure pH, electrical
conductivity and dissolved oxygen of the solution. Connect the
nitrogen line to ensure there is minimum oxygen ingress.
b. Prepare and transfer a salt-laden MEG solution according to desired
concentration (typically MEG at 80 wt%) and volume based on
experiment design into the beaker.
c. Give the solution sufficient time (6 h) for dissolved O2 levels to reach
(≤20 ppb) and for complete synthesis.
2. Analysis of prepared solution representing non-degraded MEG.
a. Record all the measurements such as pH, EC, O2, colour (photo) and

189
mixing behaviour.
b. Extract a smaller sample for IC to determine MEG degradation
products (acetic, formic, glycolic acid).
c. Extract another sample in order to prepare a diluted MEG solution to a
concentration of 20–40 wt% (typical field MEG injection
concentration) for hydrate testing. Use Eqns. (10.1) and (10.2) to
determine the required additional water (ΔM) to reach the desired MEG
concentration for testing.
𝑴𝟏𝑪𝟏 = 𝑴𝟐𝑪𝟐 (10.1)
∆𝑴 = 𝑴𝟐 − 𝑴𝟏 (10.2)
where M1 and M2 are the masses of the initial (undiluted solution) and
final (diluted solution) in g respectively, C1 and C2 are the
concentrations of the initial and final solutions respectively, and ΔM is
the additional water required to reach the desired concentration (C2) in
g.
After careful preparation of the test solution, it is ready for the degradation
process as follows:
3. Degradation of prepared solution using the reclamation unit (Figure 10.8).
a. Transfer the initial solution to storage vessel 1 (SV1).
b. Power on the main PLC computer and in-line sensors such as pH, EC,
DO, pressure and temperature.
c. Activate the nitrogen purge line to all vessels and the rotary flask to
prevent unnecessary oxygen ingress.
d. Power on the cooling system and configure the temperature to around
∼4–6 °C.
e. Power on the liquid dosage pump from vessel 1 to start dosing into the
rotary flask.
f. Power on the reclamation unit. The unit should be preconfigured to the
desired refill, drain and condensate time as per experiment design.
g. Set-up the required vacuum pressure (10–15 kPa), oil bath temperature
(depending on the required vapor temperature in the experiment design)

190
and flask rotation speed (20–30 rpm).
h. Initiate the reclamation process and the flask shall start to receive salt-
laden MEG at the preconfigured dosage pump flowrate.
i. After sufficient drain and condensate time has occurred, the processed
solution will be sent to storage vessel 2 (SV2).
j. MEG samples may be taken at any time from SV1/SV2 at the sample
outtake valve for further analysis of degradation products and hydrate
testing according to step 2.
k. When the volume level of SV1 is at 15%, activate the pump to transfer
the contents of SV2 to SV1 so that the process can repeat until the total
operation time for reclamation has been fulfilled according to the
experiment design.
l. To shut-down the apparatus, drain the contents of the rotary flask and
power off all equipment.
m. When sufficient cooling of the flask has occurred, extract the salt
residue left at the bottom of the flask, and store it if required for future
analysis (i.e. viscosity, SEM/ECM and particle analysis).
n. Extract the degraded MEG solution (contents of SV1 and SV2) for
further analysis as outlined in step 2.
4. A slightly more simplified approach to attaining degraded MEG samples is the
use of typical stainless steel high pressure/temperature autoclaves requiring no
modifications (Figure 10.9(b)). The procedure for MEG degradation using an
autoclave is as follows:
a. Thoroughly clean the autoclave with ethanol and deionized water.
b. Transfer the prepared solution (step 1) to the autoclave using a pump to
avoid unnecessary contamination of the autoclave.
c. Purge the autoclave for 2 h with nitrogen to ensure there is no oxygen
contamination.
d. Place the autoclave in its heating jacket and activate the required
temperature via the control panel.
e. Enable the pre-installed stirrer if required.
f. After the required operation time has passed, deactivate the system via
the control panel and allow for the autoclave to cool down.

191
g. Once cool, extract the degraded MEG solution for further analysis as
outlined in step 2.
Figure 10.9: Schematic for the preparation of the test solution and autoclave set.
10.2.3 Hydrate Testing of Degraded MEG
To determine the hydrate phase equilibria of the degraded and non-degraded samples,
a high-pressure PVT Sapphire Cell can be utilized. The desired gas mixture can be
introduced into the chamber according to the experimental design and the type of
hydrate structure under study. Common methods of determining the hydrate phase
equilibria can be employed such as the isochoric, isobaric and isothermal methods. A
typical high-pressure PVT cell (Figure 10.10) is made out of sapphire material so a
complete visual of the internals of the chamber is available for detailed visual
observations. The cell has been designed with an inner volume of 60 cm3 to allow for
sufficient gas and liquid to form hydrate. An automated magnetic stirrer fitted to the
cell produced an agitation rate that helps in the complete transformation of the liquid
water phase to hydrate, and encourages the renewal of the surface where there is a
higher tendency for hydrate film to form. The recommended stirrer rate to be applied
is 400–500 rpm. The cell is equipped with pressure and temperature sensors to capture
PVT data for further analysis.
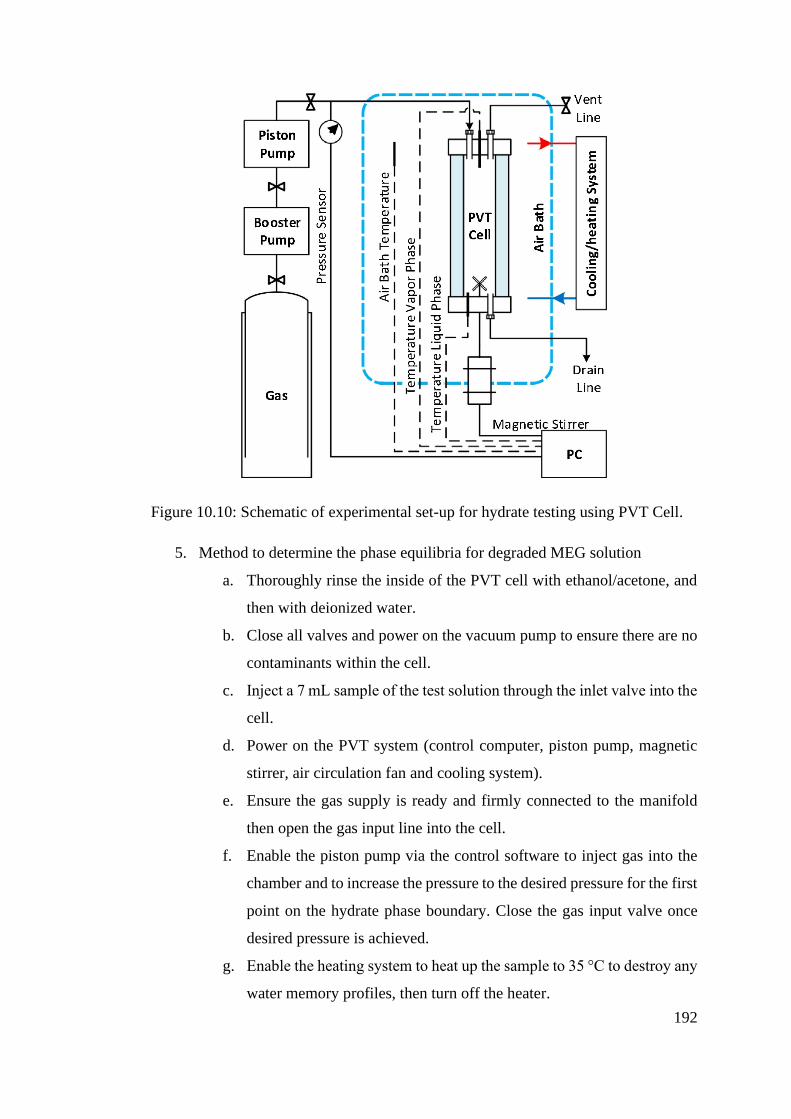
192
Figure 10.10: Schematic of experimental set-up for hydrate testing using PVT Cell.
5. Method to determine the phase equilibria for degraded MEG solution
a. Thoroughly rinse the inside of the PVT cell with ethanol/acetone, and
then with deionized water.
b. Close all valves and power on the vacuum pump to ensure there are no
contaminants within the cell.
c. Inject a 7 mL sample of the test solution through the inlet valve into the
cell.
d. Power on the PVT system (control computer, piston pump, magnetic
stirrer, air circulation fan and cooling system).
e. Ensure the gas supply is ready and firmly connected to the manifold
then open the gas input line into the cell.
f. Enable the piston pump via the control software to inject gas into the
chamber and to increase the pressure to the desired pressure for the first
point on the hydrate phase boundary. Close the gas input valve once
desired pressure is achieved.
g. Enable the heating system to heat up the sample to 35 °C to destroy any
water memory profiles, then turn off the heater.

193
h. Enable data acquisition and ensure temperature, pressure and stirrer
rate data are being recorded (at 5 s intervals).
i. Begin video recording using the camera and light beam focused on the
sample within the cell.
j. Enable the cooling process to begin and set the cooling rate to 1 °C/h
via the control software.
k. Carefully note visual observations such as the growth, agglomeration
and behaviour of hydrate formation; the inter-phase conditions (i.e.,
clear, foaming, bubbling, grey or cloudy), film formation on the inner
walls of the cell; the temperature at which the first hydrate particle is
formed, the point at which the stirrer stops moving due to impeding
hydrate solids, and the rate of reduction of the solution in the cell.
l. When all visible liquid has transformed into hydrate, continue the
cooling process for a further 3 °C but avoid going below 0 °C (i.e., ice
formation region).
m. Begin the slow step-wise heating process at a rate of 0.5 °C/h with a
maximum rate of 1 °C/h so that a sufficient time is available for
equilibrium to be achieved. The process can be ended when all visible
hydrate solids are converted to liquid.
n. The PVT system can now be cleaned and shut-down.
o. From the acquired temperature and pressure data for the cooling and
heating processes, the hydrate thermodynamic equilibrium point may
then be determined from the intercept of the two curves. Use the
computer script provided in the Supporting information for automated
processing of data logs to determine the hydrate phase equilibria
conditions.
p. Repeat the entire process (5) for at least another 3 more pressure points
in order to plot the hydrate phase boundary.
10.2.4 Method Validation
The degradation of MEG can be identified by the presence of by-products. Studies
from literature that investigated degradation of MEG have found the by-products of
MEG degradation to be formic, glycolic, acetic and oxalic (Clifton et al., 1985; Madera

194
et al., 2003; Monticelli et al., 1988; Ranjbar and Abasi, 2013; Rossiter et al., 1985,
1983). Numerous studies have been conducted by our laboratory using our method
which are outlined in Table 10.1 (Alef et al., 2018c; AlHarooni et al., 2015; AlHarooni
et al., 2016). The results clearly show the presence of degradation products such as
acetic acid between degraded and non-degraded samples. A study conducted by
Psarrou et al. (2011) has reported that a sign of degradation in the reclamation process
is the colour of the solution where it changes to more of a yellow colour (Psarrou et
al., 2011). The colour changes have also been reported in Table 10.1, and it can be
seen that the colour has changed from clear to yellow to dark brown as the degradation
amount increases amongst the MEG solution samples. Furthermore, the effect of MEG
degradation on the hydrate phase boundary can be studied using this method. A pure
MEG solution of 25 wt% was prepared and degraded for 100 h using this method. The
changes in colour, pH, EC and the shift in hydrate phase boundary have been reported
in Table 10.1 and Figure 10.11. It can be confirmed that degradation products and
promotion of hydrate formation was found.
Table 10.1: Experimental data of degraded and non-degraded MEG solutions using
reported methods.
Solution Exposure
Temp.
(° C)
Exposure
Time (h)
ΔTHyd
(° C)a
Colour ΔpH a ΔEC
(μS/cm) a
Acetic
acid
(ppm)
Source
MEG
(25 wt%)
23.6b -b 0
0 0 3 -c
100 100 0.18
-0.15 43 10
MEG
(25 wt%)
135 48 -
- - 12 (AlHarooni
et al., 2015) 165 48 0.72
- - 18
185 48 1.07
- - 21
200 48 1.62 - - - -
MEG
(20 wt%)
+ MDEA
(2 wt%)
22b -b 0
0 2 10 (AlHarooni
et al., 2016) 135 240 1.7
-0.29 50.1 36
165 240 1
-0.43 78.9 56
185 240 1.1
-0.45 112.0 62
200 240 1.3
-0.56 141.3 71
MEG
(20 wt%)
≤ 126 11 0.13
- - 6.5 (Alef et al.,
2018c) ≤ 126 56 1
- - 82.7

195
Solution Exposure
Temp.
(° C)
Exposure
Time (h)
ΔTHyd
(° C)a
Colour ΔpH a ΔEC
(μS/cm) a
Acetic
acid
(ppm)
Source
+ Brine ≤ 126 97 1.7
- - 139.3
a Shift from a non-degraded sample of the same solution. b Room conditions. c This
study.
Experiments were conducted to determine the methane-water hydrate phase boundary
using the set-up reported in this study. The phase equilibria data are plotted in Figure
10.11. The results were compared to the widely available literature data (Jhaveri and
Robinson, 1965; McLeod and Campbell, 1961; Verma, 1974). An absolute average
relative error (AARE) of 0.98% was found, which confirms that our apparatus and
procedure are highly accurate in determining hydrate phase equilibria (Figure 10.11).
Figure 10.11: Comparison of degraded MEG with fresh MEG, and literature
comparison of methane-water hydrate.
10.2.5 Conclusion
Flow assurance challenges such as gas hydrates and corrosion are a serious concern
for the oil and gas industry. An array of chemicals (i.e., hydrate, corrosion, scale, wax
inhibitors and oxygen scavengers) are injected into the hydrocarbon production and
process pipelines to prevent, decrease and or mitigate these concerns. MEG is a

196
conventional hydrate inhibitor that is commonly used in the industry due to its
reusability. However, MEG may undergo degradation in the reboiler and reclamation
units of a MEG regeneration plant. Thus, to study the effects of degradation of MEG
especially in the presence of other chemical additives upon the adopted hydrate
inhibition program becomes important. This study has outlined the necessary methods
to mimic field-like degradation of MEG and analysis in terms of hydrate inhibition
performance and degradation products.

197
Summary and Conclusions
In this thesis, extensive hydrate testing of MEG samples was conducted to investigate
the hydrate kinetics and phase equilibria of said samples. MEG regeneration and
reclamation was evaluated. Empirical and thermodynamic modelling was conducted
to allow for prediction of gas hydrate phase equilibria. Specifically, the following
conclusions were made:
• Effect of regenerated MEG on gas hydrate, and empirical modelling for
prediction:
❖ Field-like MEG regeneration and reclamation operation was re-
produced using the MEG pilot plant for the first time.
❖ The samples from each cycle were analysed for their composition and
tested using a PVT cell for hydrate inhibition performance.
❖ The study found a rightward shift in the hydrate phase boundary for
MEG suggesting a promotion in hydrate formation as the number of
cycles of MEG regeneration increased. It found an average equilibrium
temperature shift of 1.7 °C for cycle 9 as compared to pure MEG (20
wt% MEG).
❖ High performance liquid chromatography analysis revealed
degradation products increased with cycle number.
❖ The study has found that thermal degradation of MEG can occur even
if MEG is not exposed to its known degradation temperature range.
❖ Empirical model was developed for prediction based on the results of
this study for the benefit of industry personnel and MEG end-users.
• Evaluation of MEG reclamation and natural gas hydrate inhibition during
corrosion control switchover:
❖ MDEA and acetic acid cannot be removed in the reclamation unit
simultaneously due to contrasting pH required.
❖ FFCI and MDEA caused a very viscous residue in the reclamation unit
and caused discoloration.
❖ New natural gas hydrate equilibria data for reclaimed MEG have been
reported alongside metastable regions.
❖ The performance of reclaimed MEG varied compared with that of pure

198
MEG, and was lower at the end of the experiment.
• Effect of methyldiethanolamine on gas hydrate, and modelling for prediction:
❖ Hydrate phase equilibria for MDEA solutions at a high-pressure range
(7 – 20 MPa) were produced.
❖ Pure MDEA showed an average equilibrium temperature shift of −0.82
°C at a concentration of 7.5 wt%. The combined effect of MDEA (7.5
wt%) with MEG (20 wt%) showed an equivalent hydrate performance
of 20.95 wt% MEG.
❖ Empirical modelling for hydrate phase equilibria was developed for
predication.
❖ Thermodynamic model based on the CPA equation of state was
developed for the calculation of hydrate phase equilibria of MDEA
solutions even in the presence of MEG for numerous hydrate formers.
• Effect of corrosion inhibitors with kinetic hydrate inhibitor on gas hydrate, and
empirical modelling of meg degradation:
❖ The study evaluated the hydrate inhibitory performance of MEG with
FFCI, finding that FFCI showed good hydrate inhibitory performance.
It was found that only 3 wt% of FFCI in a 20 wt% MEG solution
showed an equivalent hydrate inhibition performance of a 23.12 wt%
MEG solution.
❖ MDEA and FFCI were also found to enhance the inhibitory
performance of solutions containing KHI.
❖ The study suggests other chemical additives can provide increased
hydrate inhibitory performance than previously expected.
❖ Empirical modelling to determine the equilibrium temperature
suppression of MEG and MDEA+MEG degraded solutions have been
developed.
• Effect of dissolved oxygen, sodium bisulfite, and oxygen scavengers on
methane hydrate inhibition:
❖ The study produced new hydrate phase equilibria data for sodium
bisulfite solutions (0.01−10 wt%) with and without the presence of
MEG. Results show greater inhibition at higher concentrations as
opposed to commonly used dosages for oxygen scavenging
199
applications.
❖ However, a proprietary oxygen scavenger promoted hydrate formation,
which suggests that chemical additives should be thoroughly assessed
for compatibility with other chemicals as well as tested to determine
any potential negative consequences.
❖ A non-sulfite oxygen scavenger showed inhibition performance but
may not surmount to any benefit due to the small dosages required.
❖ Furthermore, the study has revealed that dissolved oxygen may also
increase the risk of gas hydrate formation despite the fact that it already
negatively affects corrosion risk. Clearly, dissolved oxygen levels
should be kept to a minimum.
• Hydrate phase equilibria of phosphonate scale inhibitors, amines, and ethylene
glycol:
❖ Three commonly used phosphonates or scale inhibitors (IDMP, NTMP,
and DTPMP) as well as two amines (MEA and DEA) were tested for
hydrate formation, and their hydrate phase boundaries were
determined.
❖ The scale inhibitors, although utilized at very small dosage in the field,
did not show significant hydrate inhibition performance, whereby
showing a maximum depression of 0.2 °C.
❖ The amines showed pronounced hydrate inhibitory qualities with a
maximum temperature depression of 0.47 °C which is equivalent to
MEG concentration of 2.4 wt% in the case of DEA.
❖ On the other hand, both types of chemicals; scale inhibitors and amines;
did not raise concerns in terms of hydrate formation; thus, the integrity
of the hydrate control program can be expected to be intact.
• Utilization of MEG pilot plant and MEG degradation methods:
❖ With the MEG pilot plant approach, companies can invest in
developing an operation that matches their actual field design at a
fraction of the cost, allowing field case scenarios to be tested
beforehand, where best practices and lessons learned are documented
for actual field use.
❖ Operations that would otherwise take months or years to occur in the

200
field can be scaled down to a matter of days with this approach yet
yielding accurate insights to help improve the design and operation in
the field.
❖ Procedure to prepare accurate MEG solutions avoiding oxidative
degradation of MEG (i.e., controlling oxygen ingress).
❖ Two methods are suggested to mimic field-like degradation of MEG
solutions (i.e., degradation by reclamation and autoclave).
❖ Adoption of the isochoric hydrate testing method while using a high-
pressure PVT cell with the aid of a computer script to accurately
evaluate hydrate phase equilibria conditions.
Further Research Potential
The following are recommended future extensions to the above work:
• Improve the developed models for MEG degradation by conducting more
MEG regeneration experiments that mimic the actual field operations and
formation water compositions.
• Study the effect of time on MEG degradation and subsequently, its hydrate
inhibition performance.
• Similarly, study the effect of MEG degradation on its hydrate inhibitory
performance in solutions with higher MEG concentrations.
• How the metastable regions differ in other test cells with varying rate of
cooling and mixing rates.
• Utilize a flow loop for hydrate testing that is directly connected to the MEG
pilot plant for real-time hydrate testing at specific operating pressures and
temperatures, which shall allow for tuning the developed models for higher
accuracy.
• For chemical compatibility studies, it is recommended that demulsifiers and
asphaltene inhibitors are also tested for their effect on gas hydrate formation.

201
BIBLIOGRAPHY
Achour, M., Kolts, J., 2015. Corrosion Control by Inhibition Part I: Corrosion Control
by Film Forming Inhibitors. Presented at the CORROSION 2015, NACE
International.
Akhfash, M., Arjmandi, M., Aman, Z.M., Boxall, J.A., May, E.F., 2017. Gas Hydrate
Thermodynamic Inhibition with MDEA for Reduced MEG Circulation. J.
Chem. Eng. Data 62, 2578–2583. https://doi.org/10.1021/acs.jced.7b00072
Al Dhafeeri, M.A., 2007. Identifyng sources key to detailed troubleshooting of amine
foaming. Oil & Gas Journal 105, 56–56.
Alef, K., Barifcani, A., 2020. Effect of N-methyl-diethanolamine and film forming
corrosion inhibitor on gas hydrate, and empirical modeling for degradation.
Journal of Petroleum Science and Engineering 184, 106522.
https://doi.org/10.1016/j.petrol.2019.106522
Alef, K., Barifcani, A., 2019. Hydrate Phase Equilibria of Phosphonate Scale
Inhibitors, Amines, and Ethylene Glycol. J. Chem. Eng. Data 64, 3205–3210.
https://doi.org/10.1021/acs.jced.9b00366
Alef, K., Barifcani, A., 2018. The Effect of Salt-Laden Degraded MEG on Gas Hydrate
Inhibition. Presented at the SPE Kingdom of Saudi Arabia Annual Technical
Symposium and Exhibition, Society of Petroleum Engineers.
https://doi.org/10.2118/192447-MS
Alef, K., Gubner, R., Iglauer, S., Barifcani, A., 2019a. Evaluation of MEG reclamation
and natural gas hydrate inhibition during corrosion control switchover. Journal
of Petroleum Science and Engineering 176, 1175–1186.
https://doi.org/10.1016/j.petrol.2018.08.052
Alef, K., Iglauer, S., Barifcani, A., 2019b. Thermodynamic Modeling of Hydrate
Phase Equilibria in Methyldiethanolamine Solution in the Presence or Absence
of Monoethylene Glycol. J. Chem. Eng. Data 64, 4148–4153.
https://doi.org/10.1021/acs.jced.9b00552
Alef, K., Iglauer, S., Barifcani, A., 2019c. Degradation and hydrate phase equilibria
measurement methods of monoethylene glycol. MethodsX 6, 6–14.
https://doi.org/10.1016/j.mex.2018.12.004
Alef, K., Iglauer, S., Barifcani, A., 2018a. Effect of Dissolved Oxygen, Sodium
Bisulfite, and Oxygen Scavengers on Methane Hydrate Inhibition. J. Chem.
Eng. Data 63, 1821–1826. https://doi.org/10.1021/acs.jced.8b00150
Alef, K., Iglauer, S., Gubner, R., Barifcani, A., 2018b. Hydrate Phase Equilibria for
Methyldiethanolamine and Empirical Modeling for Prediction. J. Chem. Eng.
Data 63, 3559–3565. https://doi.org/10.1021/acs.jced.8b00440
Alef, K., Smith, C., Iglauer, S., Gubner, R., Barifcani, A., 2018c. The effect of
regenerated MEG on hydrate inhibition performance over multiple
regeneration cycles. Fuel 222, 638–647.
https://doi.org/10.1016/j.fuel.2018.02.190
AlHarooni, K., Barifcani, A., Pack, D., Gubner, R., Ghodkay, V., 2015. Inhibition
effects of thermally degraded MEG on hydrate formation for gas systems.
Journal of Petroleum Science and Engineering 135, 608–617.
https://doi.org/10.1016/j.petrol.2015.10.001
AlHarooni, K., Pack, D., Iglauer, S., Gubner, R., Ghodkay, V., Barifcani, A., 2017.
Effects of Thermally Degraded Monoethylene Glycol with Methyl
Diethanolamine and Film-Forming Corrosion Inhibitor on Gas Hydrate

202
Kinetics. Energy Fuels 31, 6397–6412.
https://doi.org/10.1021/acs.energyfuels.7b00733
AlHarooni, K., Pack, D., Iglauer, S., Gubner, R., Ghodkay, V., Barifcani, A., 2016.
Analytical Techniques for Analyzing Thermally Degraded Monoethylene
Glycol with Methyl Diethanolamine and Film Formation Corrosion Inhibitor.
Energy Fuels 30, 10937–10949.
https://doi.org/10.1021/acs.energyfuels.6b02116
AlHarooni, K.M., Barifcani, A., Pack, D., Iglauer, S., 2016. Evaluation of Different
Hydrate Prediction Software and Impact of Different MEG Products on Gas
Hydrate Formation and Inhibition. Presented at the Offshore Technology
Conference Asia, Offshore Technology Conference.
https://doi.org/10.4043/26768-MS
Aljourani, J., Raeissi, K., Golozar, M.A., 2009. Benzimidazole and its derivatives as
corrosion inhibitors for mild steel in 1M HCl solution. Corrosion Science 51,
1836–1843. https://doi.org/10.1016/j.corsci.2009.05.011
Amri, J., Gulbrandsen, E., Nogueira, R.P., 2009. Effect Of Acetic Acid On
Propagation And Stifling Of Localized Attacks In CO2 Corrosion Of Carbon
Steel. Presented at the CORROSION 2009, NACE International.
Anderson, B.J., Bazant, M.Z., Tester, J.W., Trout, B.L., 2005. Application of the Cell
Potential Method To Predict Phase Equilibria of Multicomponent Gas Hydrate
Systems. J. Phys. Chem. B 109, 8153–8163.
https://doi.org/10.1021/jp045551g
Anderson, F.E., Prausnitz, J.M., 1986. Inhibition of gas hydrates by methanol. AIChE
Journal 32, 1321–1333. https://doi.org/10.1002/aic.690320810
Aspen HYSYS, 2007. . AspenTech, Calgary.
Avlund, A.S., Kontogeorgis, G.M., Michelsen, M.L., 2008. Modeling Systems
Containing Alkanolamines with the CPA Equation of State. Ind. Eng. Chem.
Res. 47, 7441–7446. https://doi.org/10.1021/ie800040g
Ballard, A.L., 2002. Non-ideal hydrate solid solution model for a multi-phase
equilibria program, A (PhD Thesis). Colorado School of Mines. Arthur Lakes
Library.
Ballard, A.L., Sloan Jr, E.D., 2002. The next generation of hydrate prediction: I.
Hydrate standard states and incorporation of spectroscopy. Fluid Phase
Equilibria, Proceedings of the Ninth International Conference on Properties
and Phase Equilibria for Product and Process Design 194–197, 371–383.
https://doi.org/10.1016/S0378-3812(01)00697-5
Ballard, L., Sloan, E.D., 2004. The next generation of hydrate prediction IV: A
comparison of available hydrate prediction programs. Fluid Phase Equilibria
216, 257–270. https://doi.org/10.1016/j.fluid.2003.11.004
Bamford, C.H., Compton, R.G., Tipper†, C.F.H., 1980. Liquid Phase Oxidation.
Elsevier.
Bandyopadhyay, A.A., Klauda, J.B., 2011. Gas Hydrate Structure and Pressure
Predictions Based on an Updated Fugacity-Based Model with the PSRK
Equation of State. Ind. Eng. Chem. Res. 50, 148–157.
https://doi.org/10.1021/ie100440s
Bansal, V., 1994. Kinetic study of clathrate hydrates (PhD Thesis). Colorado School
of Mines.
Baraka-Lokmane, S., Hurtevent, C., Ohanessian, J.-L., Rousseau, G., Seiersten, M.E.,
Deshmush, S., 2012. Prediction of Mineral Scaling in a MEG Loop System of

203
a Gas Production Offshore. Presented at the SPE International Conference on
Oilfield Scale, Society of Petroleum Engineers.
https://doi.org/10.2118/155124-MS
Baraka-Lokmane, S., Hurtevent, Ch., Seiersten, M., Flaten, E., Farrell, M., Bradshaw,
O., Hare, S., Bonis, M., Jacob, F., Carles, N., 2013. Technical challenges and
solutions in a closed loop MEG regeneration system for gas field offshore, UK.
Presented at the MULTIPHASE FLOW 2013, A Coruña, Spain, pp. 511–522.
https://doi.org/10.2495/MPF130421
Barmatov, E., Geddes, J., Hughes, T., Nagl, M., 2012. Research On Corrosion
Inhibitors For Acid Stimulation. Presented at the CORROSION 2012, NACE
International.
Barmatov, E., Hughes, T., Nagl, M., 2015. Efficiency of film-forming corrosion
inhibitors in strong hydrochloric acid under laminar and turbulent flow
conditions. Corrosion Science 92, 85–94.
https://doi.org/10.1016/j.corsci.2014.11.038
Barrer, R.M., Stuart, W.I., 1957. Non-stoicheiometric clathrate compounds of water.
Proceedings of the Royal Society of London. Series A. Mathematical and
Physical Sciences 243, 172–189. https://doi.org/10.1098/rspa.1957.0213
Bates, R.G., 1964. Determination of pH: theory and practice. Determination of pH:
theory and practice.
Bikkina, C., Radhakrishnan, N., Jaiswal, S., Harrington, R., Charlesworth, M., 2012.
Development of MEG Regeneration Unit Compatible Corrosion Inhibitor for
Wet Gas Systems. Presented at the SPE Asia Pacific Oil and Gas Conference
and Exhibition, Society of Petroleum Engineers.
https://doi.org/10.2118/160301-MS
BIPM, I., IFCC, I., IUPAC, I., ISO, O., 2008. Evaluation of measurement data—guide
for the expression of uncertainty in measurement. JCGM 100: 2008. Citado en
las 167.
Bishnoi, P.R., Gupta, A.K., Englezos, P., Kalogerakis, N., 1989. Multiphase
equilibrium flash calculations for systems containing gas hydrates. Fluid Phase
Equilibria, Proceedings of the Fifth International Conference 53, 97–104.
https://doi.org/10.1016/0378-3812(89)80076-7
Bishnoi, P.R., Natarajan, V., 1996. Formation and decomposition of gas hydrates.
Fluid Phase Equilibria, Proceedings of the Seventh International Conference
on Fluid Properties and Phase Equilibria for Chemical Process Design 117,
168–177. https://doi.org/10.1016/0378-3812(95)02950-8
Blackman, A.G., Gahan, author. ), Lawrence R., 2014. Aylward and Findlay’s SI
chemical data, 7th edition. ed. Milton, Qld : John Wiley & Sons Australia.
Braga, T.G., 1987. Effects of Commonly, Used Oilfield Chemicals on the Rate of
Oxygen Scavenging by Sulfite/Bisulfite. SPE Production Engineering 2, 137–
142. https://doi.org/10.2118/13556-PA
Bratland, O., 2010. Pipe Flow 2: Multi-Phase Flow Assurance. Ove Bratland Flow
Assurance Consulting, Chonburi, Thailand.
Brkić, D., Tanasković, T.I., 2008. Systematic approach to natural gas usage for
domestic heating in urban areas. Energy 33, 1738–1753.
https://doi.org/10.1016/j.energy.2008.08.009
Brown, P.W., Rossiter, W.J., Galuk, K.G., 1986. A mass spectrometric investigation
of the thermal oxidative reactivity of ethylene glycol. Solar Energy Materials
13, 197–202. https://doi.org/10.1016/0165-1633(86)90018-3

204
Brustad, S., Løken, K.-P., Waalmann, J.G., 2005. Hydrate Prevention using MEG
instead of MeOH: Impact of experience from major Norwegian developments
on technology selection for injection and recovery of MEG. Presented at the
Offshore Technology Conference, Offshore Technology Conference.
https://doi.org/10.4043/17355-MS
Burgazli, C.R., Navarrete, R.C., Mead, S.L., 2005. New Dual Purpose Chemistry for
Gas Hydrate and Corrosion Inhibition. Journal of Canadian Petroleum
Technology 44. https://doi.org/10.2118/05-11-04
Byk, S.S., Fomina, V.I., 1968. Gas Hydrates. Russ. Chem. Rev. 37, 469.
https://doi.org/10.1070/RC1968v037n06ABEH001654
Calsep PVTSim, 2011. . CALSEP A/S, Houston, Texas.
Camargo, R., Gonçalves, M., Barreto, C., Faraco, R., Nieckele, A.O., 2011. On The
Safety Of Hydrate Remediation By One-Sided Depressurization, in: Proc. 7th
Int. Conf. on Gas Hydrates.
Cao, Z., Tester, J.W., Trout, B.L., 2002. Sensitivity Analysis of Hydrate
Thermodynamic Reference Properties Using Experimental Data and ab Initio
Methods. J. Phys. Chem. B 106, 7681–7687.
https://doi.org/10.1021/jp0207376
Carroll, J., 2014. Natural Gas Hydrates: A Guide for Engineers. Gulf Professional
Publishing.
Carson, D.B., Katz, D.L., 1942. Natural Gas Hydrates. Transactions of the AIME 146,
150–158. https://doi.org/10.2118/942150-G
Cha, M., Hu, Y., Sum, A.K., 2016. Methane hydrate phase equilibria for systems
containing NaCl, KCl, and NH4Cl. Fluid Phase Equilibria, Special Issue: Gas
Hydrates and Semiclathrate Hydrates 413, 2–9.
https://doi.org/10.1016/j.fluid.2015.08.010
Cha, M., Shin, K., Kim, J., Chang, D., Seo, Y., Lee, H., Kang, S.-P., 2013.
Thermodynamic and kinetic hydrate inhibition performance of aqueous
ethylene glycol solutions for natural gas. Chemical Engineering Science 99,
184–190. https://doi.org/10.1016/j.ces.2013.05.060
Chang, H.T., Posey, M., Rochelle, G.T., 1993. Thermodynamics of alkanolamine-
water solutions from freezing point measurements. Ind. Eng. Chem. Res. 32,
2324–2335. https://doi.org/10.1021/ie00022a016
Chapoy, A., Haghighi, H., Burgass, R., Tohidi, B., 2010. Gas hydrates in low water
content gases: Experimental measurements and modelling using the CPA
equation of state. Fluid Phase Equilibria, Colloquium Dominique Richon 296,
9–14. https://doi.org/10.1016/j.fluid.2009.11.026
Chapoy, A., Tohidi, B., 2012. Hydrates in high MEG concentration systems, in:
Proceeding of the 3rd International Gas Processing Symposium. pp. 5–7.
Chatti, I., Delahaye, A., Fournaison, L., Petitet, J.-P., 2005. Benefits and drawbacks of
clathrate hydrates: a review of their areas of interest. Energy Conversion and
Management 46, 1333–1343. https://doi.org/10.1016/j.enconman.2004.06.032
Chen, L.-T., Sun, C.-Y., Chen, G.-J., Zuo, J.Y., Ng, H.-J., 2010. Assessment of hydrate
kinetic inhibitors with visual observations. Fluid Phase Equilibria 298, 143–
149. https://doi.org/10.1016/j.fluid.2010.07.024
Child, W.C., 1964. Molecular interactions in clathrates: a comparison with other
condensed phases. Q. Rev. Chem. Soc. 18, 321–346.
https://doi.org/10.1039/QR9641800321
Chin, H.-Y., Hsieh, M.-K., Chen, Y.-P., Chen, P.-C., Lin, S.-T., Chen, L.-J., 2013.

205
Prediction of phase equilibrium for gas hydrate in the presence of organic
inhibitors and electrolytes by using an explicit pressure-dependent Langmuir
adsorption constant in the van der Waals–Platteeuw model. The Journal of
Chemical Thermodynamics 66, 34–43.
https://doi.org/10.1016/j.jct.2013.06.014
Christiansen, R.L., Sloan, E.D.J., 1995. A compact model for hydrate formation.
Clifton, J.R., Rossiter, W.J., Brown, P.W., 1985. Degraded aqueous glycol solutions:
pH values and the effects of common ions on suppressing pH decreases. Solar
Energy Materials 12, 77–86. https://doi.org/10.1016/0165-1633(85)90026-7
Closmann, F., Nguyen, T., Rochelle, G.T., 2009. MDEA/Piperazine as a solvent for
CO2 capture. Energy Procedia, Greenhouse Gas Control Technologies 9 1,
1351–1357. https://doi.org/10.1016/j.egypro.2009.01.177
Crolet, J.L., Thevenot, N., Dugstad, A., 1999. Role of Free Acetic Acid on the CO2
Corrosion of Steels. Presented at the CORROSION 99, NACE International.
Crowe, C., McConnell, S.B., Hinkel, J.J., Chapman, K., 1994. Scale Inhibition in
Wellbores. Presented at the University of Tulsa Centennial Petroleum
Engineering Symposium, Society of Petroleum Engineers.
https://doi.org/10.2118/27996-MS
Daraboina, N., Malmos, C., von Solms, N., 2013. Investigation of Kinetic Hydrate
Inhibition Using a High Pressure Micro Differential Scanning Calorimeter.
Energy Fuels 27, 5779–5786. https://doi.org/10.1021/ef401042h
Davies, S.R., Selim, M.S., Sloan, E.D., Bollavaram, P., Peters, D.J., 2006. Hydrate
plug dissociation. AIChE Journal 52, 4016–4027.
https://doi.org/10.1002/aic.11005
Davoudi, M., Heidari, Y., Safadoost, A., Samieirad, S., 2014. Chemical injection
policy for internal corrosion prevention of South Pars sea-pipeline: A case
study. Journal of Natural Gas Science and Engineering 21, 592–599.
https://doi.org/10.1016/j.jngse.2014.09.017
Davy, H., 1832. On a combination of oxymuriatic gas and oxygen gas. Abstracts of
the Papers Printed in the Philosophical Transactions of the Royal Society of
London 1, 393–394. https://doi.org/10.1098/rspl.1800.0221
Dehaghani, A.H.S., Karami, B., 2018. A new predictive thermodynamic framework
for phase behavior of gas hydrate. Fuel 216, 796–809.
https://doi.org/10.1016/j.fuel.2017.11.128
Derawi, S.O., Michelsen, M.L., Kontogeorgis, G.M., Stenby, E.H., 2003. Application
of the CPA equation of state to glycol/hydrocarbons liquid–liquid equilibria.
Fluid Phase Equilibria 209, 163–184. https://doi.org/10.1016/S0378-
3812(03)00056-6
Dharmawardhana, P.B., Parrish, W.R., Sloan, E.D., 1980. Experimental
Thermodynamic Parameters for the Prediction of Natural Gas Hydrate
Dissociation Conditions. Ind. Eng. Chem. Fund. 19, 410–414.
https://doi.org/10.1021/i160076a015
Duchateau, C., Peytavy, J.-L., Glénat, P., Pou, T.-E., Hidalgo, M., Dicharry, C., 2009.
Laboratory Evaluation of Kinetic Hydrate Inhibitors: A Procedure for
Enhancing the Repeatability of Test Results. Energy Fuels 23, 962–966.
https://doi.org/10.1021/ef800710x
Dugstad, A., Seiersten, M., 2004. pH-stabilisation, a Reliable Method for Corrosion
Control of Wet Gas Pipelines. Presented at the SPE International Symposium
on Oilfield Corrosion, Society of Petroleum Engineers.
206
https://doi.org/10.2118/87560-MS
Dugstad, A., Seiersten, M., Nyborg, R., 2003. Flow Assurance of pH Stabilized Wet
Gas Pipelines. Presented at the CORROSION 2003, NACE International.
Dwyer, D.F., Tiedje, J.M., 1983. Degradation of ethylene glycol and polyethylene
glycols by methanogenic consortia. Appl. Environ. Microbiol. 46, 185–190.
Eichholz, C., Majumdar, A., Clarke, M.A., Oellrich, L.R., Bishnoi, P.R., 2004.
Experimental Investigation and Calculation of Methane Hydrate Formation
Conditions in the Presence of Ethylene Glycol and Sodium Chloride. J. Chem.
Eng. Data 49, 847–851. https://doi.org/10.1021/je034179f
El Meragawi, S., Diamantonis, N.I., Tsimpanogiannis, I.N., Economou, I.G., 2016.
Hydrate – fluid phase equilibria modeling using PC-SAFT and Peng–Robinson
equations of state. Fluid Phase Equilibria, Special Issue: Gas Hydrates and
Semiclathrate Hydrates 413, 209–219.
https://doi.org/10.1016/j.fluid.2015.12.003
Englezos, P., 1993. Clathrate hydrates. Ind. Eng. Chem. Res. 32, 1251–1274.
https://doi.org/10.1021/ie00019a001
Eslamimanesh, A., Mohammadi, A.H., Richon, D., 2011. Thermodynamic model for
predicting phase equilibria of simple clathrate hydrates of refrigerants.
Chemical Engineering Science 66, 5439–5445.
https://doi.org/10.1016/j.ces.2011.06.062
Evans, W.H., David, E.J., 1974. Biodegradation of mono-. di- and triethylene glycols
in river waters under controlled laboratory conditions. Water Research 8, 97–
100. https://doi.org/10.1016/0043-1354(74)90132-8
Ezrin, M., Zepke, A., Helwig, J., Lavigne, G., Dudley, M., 2000. Plastics failure due
to oxidative degradation in processing and service, in: SPE ANTEC
Proceedings.
Flaten, E.M., 2010. The effect of MEG (mono ethyleneglycol) on the precipitation
kinetics of calcium carbonate related to natural gas production from subsea
wells. NTNU.
Flaten, E.M., Watterud, G., Andreassen, J.-P., Seiersten, M.E., 2008. Precipitation of
Iron and Calcium Carbonate in Pipelines at Varying MEG Contents. Presented
at the SPE International Oilfield Scale Conference, Society of Petroleum
Engineers. https://doi.org/10.2118/114089-MS
Franks, F., Darlington, J., Schenz, T., Mathias, S.F., Slade, L., Levine, H., 1987.
Antifreeze activity of Antarctic fish glycoprotein and a synthetic polymer.
Nature 325, 146–147. https://doi.org/10.1038/325146a0
Freitas, A.M., Lobão, A.C., Cardoso, C.B., 2002. Hydrate Blockages in Flowlines and
Subsea Equipment in Campos Basin. Presented at the Offshore Technology
Conference, Offshore Technology Conference. https://doi.org/10.4043/14257-
MS
Fujioka, Y., Takeuchi, K., Shindo, Y., Komiyama, H., 1994. Shrinkage of liquid CO2
droplets in water. International Journal of Energy Research 18, 765–769.
https://doi.org/10.1002/er.4440180807
Garverick, L., 1994. Corrosion in the Petrochemical Industry. ASM International.
Gazzard, J., 2008. Aviation and climate change: Can alternative fuel save the day?
Aviation Environment Federation, London, UK.
Giavarini, C., Hester, K., 2011. Gas Hydrates: Immense Energy Potential and
Environmental Challenges. Springer Science & Business Media.
Glenat, P., Peytavy, J.-L., Holland-Jones, N., Grainger, M., 2004. South-Pars Phases
207
2 and 3: The Kinetic Hydrate Inhibitor (KHI) Experience Applied at Field
Start-up. Presented at the Abu Dhabi International Conference and Exhibition,
Society of Petroleum Engineers. https://doi.org/10.2118/88751-MS
Grzelak, E.M., Stenhaug, M., 2016. A More Efficient Use of MEG to Fully Inhibit
Hydrates with Reduced Cost. Presented at the Offshore Technology
Conference Asia, Offshore Technology Conference.
https://doi.org/10.4043/26854-MS
Gulbrandsen, E., Kvarekvål, J., Miland, H., 2005. Effect of Oxygen Contamination on
Inhibition Studies in Carbon Dioxide Corrosion. CORROSION 61, 1086–
1097. https://doi.org/10.5006/1.3280625
Hagerup, O., Olsen, S., 2003. Corrosion Control by pH Stabilizer, Materials and
Corrosion Monitoring in 160 km Multiphase Offshore Pipeline. Presented at
the CORROSION 2003, NACE International.
Haghighi, H., Chapoy, A., Burgess, R., Mazloum, S., Tohidi, B., 2009a. Phase
equilibria for petroleum reservoir fluids containing water and aqueous
methanol solutions: Experimental measurements and modelling using the CPA
equation of state. Fluid Phase Equilibria 278, 109–116.
https://doi.org/10.1016/j.fluid.2009.01.009
Haghighi, H., Chapoy, A., Burgess, R., Tohidi, B., 2009b. Experimental and
thermodynamic modelling of systems containing water and ethylene glycol:
Application to flow assurance and gas processing. Fluid Phase Equilibria 276,
24–30. https://doi.org/10.1016/j.fluid.2008.10.006
Haghtalab, A., Zare, M., Ahmadi, A.N., Nazari, K., 2012. Prediction of hydrate
equilibrium conditions using Electrolyte Cubic Square-Well Equation of State.
Fluid Phase Equilibria 333, 74–86. https://doi.org/10.1016/j.fluid.2012.07.022
Halvorsen, A.M.K., Andersen, T.R., 2003. PH Stabilization for Internal Corrosion
Protection of Pipeline Carrying Wet Gas With CO2 and Acetic Acid. Presented
at the CORROSION 2003, NACE International.
Halvorsen, A.M.K., Andersen, T.R., Halvorsen, E.N., Kojen, G.P., Skar, J.I.,
Biørnstad, C., Fitje, H., 2007. The Relationship Between Internal Corrosion
Control Method, Scale Control And Meg Handling Of A Multiphase Carbon
Steel Pipeline Carrying Wet Gas With CO2 And Cetic Acid. Presented at the
CORROSION 2007, NACE International.
Halvorsen, E.N., Halvorsen, A.M.K., Andersen, T.R., Biornstad, C., Reiersolmen, K.,
2009. Qualification of Scale Inhibitors for Subsea Tiebacks With MEG
Injection. Presented at the SPE International Symposium on Oilfield
Chemistry, Society of Petroleum Engineers. https://doi.org/10.2118/121665-
MS
Halvorsen, E.N., Halvorsen, A.M.K., Ramstad, K., Tydal, T., Biornstad, C., 2006.
Scale Inhibitor Testing for Multiphase Pipelines in a Subsea to Shore
Development with a Closed MEG-loop System. Presented at the SPE
International Oilfield Scale Symposium, Society of Petroleum Engineers.
https://doi.org/10.2118/100662-MS
Hammerschmidt, E.G., 1934. Formation of Gas Hydrates in Natural Gas Transmission
Lines. Ind. Eng. Chem. 26, 851–855. https://doi.org/10.1021/ie50296a010
Haque, M.E., 2012. Ethylene Glycol Regeneration Plan: A Systematic Approach to
Troubleshoot the Common Problems. Journal of Chemical Engineering 27, 21–
26. https://doi.org/10.3329/jce.v27i1.15853
Heidaryan, E., Salarabadi, A., Moghadasi, J., Dourbash, A., 2010. A new high
208
performance gas hydrate inhibitor. Journal of Natural Gas Chemistry 19, 323–
326. https://doi.org/10.1016/S1003-9953(09)60060-8
Hemmingsen, P.V., Burgass, R., Pedersen, K.S., Kinnari, K., Sørensen, H., 2011.
Hydrate temperature depression of MEG solutions at concentrations up to
60wt%. Experimental data and simulation results. Fluid Phase Equilibria 307,
175–179. https://doi.org/10.1016/j.fluid.2011.05.010
Holder, G.D., Corbin, G., Papadopoulos, K.D., 1980. Thermodynamic and Molecular
Properties of Gas Hydrates from Mixtures Containing Methane, Argon, and
Krypton. Ind. Eng. Chem. Fund. 19, 282–286.
https://doi.org/10.1021/i160075a008
Holz, F., Richter, P.M., Egging, R., 2015. A Global Perspective on the Future of
Natural Gas: Resources, Trade, and Climate Constraints. Rev Environ Econ
Policy 9, 85–106. https://doi.org/10.1093/reep/reu016
Hossainpour, R., 2013. Catalysts for Enhanced CO2-CH4 Exchange in Natural Gas
Hydrates. An experimental feasibility study of exchange enhancement by use
of chemical additives (Thesis). The University of Bergen.
Hsieh, M.-K., Ting, W.-Y., Chen, Y.-P., Chen, P.-C., Lin, S.-T., Chen, L.-J., 2012.
Explicit pressure dependence of the Langmuir adsorption constant in the van
der Waals–Platteeuw model for the equilibrium conditions of clathrate
hydrates. Fluid Phase Equilibria 325, 80–89.
https://doi.org/10.1016/j.fluid.2012.04.012
Huang, S.H., Radosz, M., 1990. Equation of state for small, large, polydisperse, and
associating molecules. Ind. Eng. Chem. Res. 29, 2284–2294.
https://doi.org/10.1021/ie00107a014
Huo, Z., Freer, E., Lamar, M., Sannigrahi, B., Knauss, D.M., Sloan, E.D., 2001.
Hydrate plug prevention by anti-agglomeration. Chemical Engineering
Science 56, 4979–4991. https://doi.org/10.1016/S0009-2509(01)00188-9
Idem, R., Wilson, M., Tontiwachwuthikul, P., Chakma, A., Veawab, A., Aroonwilas,
A., Gelowitz, D., 2006. Pilot Plant Studies of the CO2 Capture Performance of
Aqueous MEA and Mixed MEA/MDEA Solvents at the University of Regina
CO2 Capture Technology Development Plant and the Boundary Dam CO2
Capture Demonstration Plant. Ind. Eng. Chem. Res. 45, 2414–2420.
https://doi.org/10.1021/ie050569e
Ikeh, L., Enyi, G.C., Nasr, G.G., 2016. Inhibition Performance of Mild Steel Corrosion
in the Presence of Co2, HAc and MEG. Presented at the SPE International
Oilfield Corrosion Conference and Exhibition, Society of Petroleum
Engineers. https://doi.org/10.2118/179942-MS
Infochem Multiflash, 2007. . Infochem Computer Services Ltd., London, U.K.
Ivonye, I.C., 2014. Corrosion processes and mechanisms in the presence of
MonoEthylene Glycol (MEG) (phd). University of Leeds.
Jamaluddin, A.K.M., Kabir, C.S., 2012. Flow assurance: Managing flow dynamics and
production chemistry. Journal of Petroleum Science and Engineering 100,
106–116. https://doi.org/10.1016/j.petrol.2012.11.017
Jaramillo, P., Griffin, W.M., Matthews, H.S., 2007. Comparative Life-Cycle Air
Emissions of Coal, Domestic Natural Gas, LNG, and SNG for Electricity
Generation. Environ. Sci. Technol. 41, 6290–6296.
https://doi.org/10.1021/es063031o
Jeffrey, G.A., McMullan, R.K., 2007. The Clathrate Hydrates, in: Progress in
Inorganic Chemistry. John Wiley & Sons, Ltd, pp. 43–108.

209
https://doi.org/10.1002/9780470166093.ch2
Jensen, L., Thomsen, K., von Solms, N., 2008. Propane hydrate nucleation:
Experimental investigation and correlation. Chemical Engineering Science 63,
3069–3080. https://doi.org/10.1016/j.ces.2008.03.006
Jhaveri, J., Robinson, D.B., 1965. Hydrates in the methane-nitrogen system. The
Canadian Journal of Chemical Engineering 43, 75–78.
https://doi.org/10.1002/cjce.5450430207
John, D., Kinsella, B., Bailey, S., De Marco, R., 2009. Flow Dependence of Carbon
Dioxide Corrosion Using Short Electrodes by Jet Impingement. CORROSION
65, 771–777. https://doi.org/10.5006/1.3319103
John, V.T., Papadopoulos, K.D., Holder, G.D., 1985. A generalized model for
predicting equilibrium conditions for gas hydrates. AIChE Journal 31, 252–
259. https://doi.org/10.1002/aic.690310212
Joosten, M.W., Tier, B., Seiersten, M., Wintermark, C., 2007. Materials
Considerations for MEG (Mono Ethylene Glycol) Reclamation Systems.
Presented at the CORROSION 2007, NACE International.
Jordan, M., Temple, E., Sham, A., Williams, H., McCallum, C., 2019. Investigation
into the Synergistic Interaction of a Range of Generic Scale Inhibitors for
Improved Sulphate Scale Control in North Sea Topside Processes. Presented
at the SPE International Conference on Oilfield Chemistry, Society of
Petroleum Engineers. https://doi.org/10.2118/193613-MS
Jordan, M.M., Feasey, N.D., Johnston, C., 2005. Inorganic Scale Control Within
MEG/Methanol Treated Produced Fluids. Presented at the SPE International
Symposium on Oilfield Scale, Society of Petroleum Engineers.
https://doi.org/10.2118/95034-MS
Kamal, M.S., Hussein, I.A., Sultan, A.S., von Solms, N., 2016. Application of various
water soluble polymers in gas hydrate inhibition. Renewable and Sustainable
Energy Reviews 60, 206–225. https://doi.org/10.1016/j.rser.2016.01.092
Kamimura, A., Guerra, S.M.G., Sauer, I.L., 2006. On the substitution of energy
sources: Prospective of the natural gas market share in the Brazilian urban
transportation and dwelling sectors. Energy Policy 34, 3583–3590.
https://doi.org/10.1016/j.enpol.2005.07.020
Kan, A.T., Fu, G., Tomson, M.B., 2002a. Effect of Methanol on Carbonate
Equilibrium and Calcite Solubility in a Gas/Methanol/Water/Salt Mixed
System. Langmuir 18, 9713–9725. https://doi.org/10.1021/la025620n
Kan, A.T., Fu, G., Watson, M.A., Tomson, M.B., 2002b. Effect of Hydrate Inhibitors
on Oilfield Scale Formation and Inhibition. Presented at the International
Symposium on Oilfield Scale, Society of Petroleum Engineers.
https://doi.org/10.2118/74657-MS
Karamoddin, M., Varaminian, F., 2013. Experimental measurement of phase
equilibrium for gas hydrates of refrigerants, and thermodynamic modeling by
SRK, VPT and CPA EOSs. The Journal of Chemical Thermodynamics 65,
213–219. https://doi.org/10.1016/j.jct.2013.06.001
Kashchiev, D., Firoozabadi, A., 2002. Nucleation of gas hydrates. Journal of Crystal
Growth 243, 476–489. https://doi.org/10.1016/S0022-0248(02)01576-2
Katz, D.L., 1945. Prediction of Conditions for Hydrate Formation in Natural Gases.
Transactions of the AIME 160, 140–149. https://doi.org/10.2118/945140-G
Kelland, M.A., 2009. Production chemicals for the oil and gas industry. Boca Raton :
CRC Press.

210
Kelland, M.A., 2006. History of the Development of Low Dosage Hydrate Inhibitors.
Energy Fuels 20, 825–847. https://doi.org/10.1021/ef050427x
Kelland, M.A., Svartaas, T.M., Øvsthus, J., Namba, T., 2000. A New Class of Kinetic
Hydrate Inhibitor. Annals of the New York Academy of Sciences 912, 281–
293. https://doi.org/10.1111/j.1749-6632.2000.tb06782.x
Khan, M.N., Warrier, P., Peters, C.J., Koh, C.A., 2018. Advancements in hydrate
phase equilibria and modeling of gas hydrates systems. Fluid Phase Equilibria
463, 48–61. https://doi.org/10.1016/j.fluid.2018.01.014
Kim, H., Yoo, W., Lim, Y., Seo, Y., 2018. Economic evaluation of MEG injection and
regeneration process for oil FPSO. Journal of Petroleum Science and
Engineering 164, 417–426. https://doi.org/10.1016/j.petrol.2018.01.071
Kim, J., Kim, H., Sohn, Y. hoon, Chang, D., Seo, Y., Kang, S.-P., 2017. Prevention of
methane hydrate re-formation in transport pipeline using thermodynamic and
kinetic hydrate inhibitors. Journal of Petroleum Science and Engineering 154,
114–125. https://doi.org/10.1016/j.petrol.2017.04.011
Kim, Jakyung, Shin, K., Kim, Juneyoung, Chang, D., Seo, Y., Chang, K.P., 2014.
Kinetic Hydrate Inhibition Performance of MEG in Under-Inhibition System:
Reduction Opportunities of MEG Injection for Offshore Gas Field
Developments. Presented at the Offshore Technology Conference-Asia,
Offshore Technology Conference. https://doi.org/10.4043/24961-MS
Kimuro, H., Yamaguchi, F., Ohtsubo, K., Kusayanagi, T., Morishita, M., 1993. CO2
clathrate formation and its properties in a simulated deep ocean. Energy
Conversion and Management, Proceedings of the International Energy Agency
Carbon Dioxide Disposal Symposium 34, 1089–1094.
https://doi.org/10.1016/0196-8904(93)90057-H
Kirchner, M.T., Boese, R., Billups, W.E., Norman, L.R., 2004. Gas Hydrate Single-
Crystal Structure Analyses. J. Am. Chem. Soc. 126, 9407–9412.
https://doi.org/10.1021/ja049247c
Kitaigorodsky, A.I., 1984. Particle Packing in a Crystal, in: Kitaigorodsky, A.I. (Ed.),
Mixed Crystals, Springer Series in Solid-State Sciences. Springer Berlin
Heidelberg, Berlin, Heidelberg, pp. 49–84. https://doi.org/10.1007/978-3-642-
81672-7_3
Klauda, J., Sandler, S., 2003. Phase behavior of clathrate hydrates: a model for single
and multiple gas component hydrates. Chemical Engineering Science 58, 27–
41. https://doi.org/10.1016/S0009-2509(02)00435-9
Knott, T., 2001. Holding hydrates at bay. Offshore Engineer 45, 29–34.
Koh, C.A., 2002. Towards a fundamental understanding of natural gas hydrates. Chem.
Soc. Rev. 31, 157–167. https://doi.org/10.1039/B008672J
Koh, C.A., Sloan, E.D., Sum, A.K., Wu, D.T., 2011. Fundamentals and Applications
of Gas Hydrates. Annual Review of Chemical and Biomolecular Engineering
2, 237–257. https://doi.org/10.1146/annurev-chembioeng-061010-114152
Koh, C.A., Westacott, R.E., Zhang, W., Hirachand, K., Creek, J.L., Soper, A.K., 2002.
Mechanisms of gas hydrate formation and inhibition. Fluid Phase Equilibria,
Proceedings of the Ninth International Conference on Properties and Phase
Equilibria for Product and Process Design 194–197, 143–151.
https://doi.org/10.1016/S0378-3812(01)00660-4
Kohl, A.L., Nielsen, R., 1997. Gas Purification. Elsevier.
Kontogeorgis, G.M., Folas, G.K., 2009. Thermodynamic Models for Industrial
Applications: From Classical and Advanced Mixing Rules to Association

211
Theories. John Wiley & Sons.
Kontogeorgis, G.M., V. Yakoumis, I., Meijer, H., Hendriks, E., Moorwood, T., 1999.
Multicomponent phase equilibrium calculations for water–methanol–alkane
mixtures. Fluid Phase Equilibria 158–160, 201–209.
https://doi.org/10.1016/S0378-3812(99)00060-6
Kontogeorgis, G.M., Voutsas, E.C., Yakoumis, I.V., Tassios, D.P., 1996. An Equation
of State for Associating Fluids. Ind. Eng. Chem. Res. 35, 4310–4318.
https://doi.org/10.1021/ie9600203
Kundu, S.S., Seiersten, M., 2017. Development of a non-sulphite oxygen scavenger
for monoethylene glycol (MEG) used as gas hydrate inhibitor. Journal of
Petroleum Science and Engineering 158, 120–128.
https://doi.org/10.1016/j.petrol.2017.07.041
Kvamme, B., Kuznetsova, T., Aasoldsen, K., 2005. Molecular dynamics simulations
for selection of kinetic hydrate inhibitors. Journal of Molecular Graphics and
Modelling 23, 524–536. https://doi.org/10.1016/j.jmgm.2005.04.001
Kvarekval, J., Nyborg, R., Seiersten, M., 2002. Corrosion Product Films on Carbon
Steel in Semi-Sour CO2/H2S Environments. Presented at the CORROSION
2002, NACE International.
Latta, T.M., Palejwala, A.A., Tipson, S.K., Haigh, N.P., 2016. Design Considerations
for Mitigating the Impact of Contaminants in Rich MEG on Monoethylene
Glycol Recovery Unit MRU Performance. Presented at the Offshore
Technology Conference Asia, Offshore Technology Conference.
https://doi.org/10.4043/26456-MS
Latta, T.M., Seiersten, M.E., Bufton, S.A., 2013. Flow Assurance Impacts on
Lean/Rich MEG Circuit Chemistry and MEG Regenerator/Reclaimer Design.
Presented at the Offshore Technology Conference, Offshore Technology
Conference. https://doi.org/10.4043/24177-MS
Lawson, J.D., Garst, A.W., 1976. Gas sweetening data: equilibrium solubility of
hydrogen sulfide and carbon dioxide in aqueous monoethanolamine and
aqueous diethanolamine solutions. J. Chem. Eng. Data 21, 20–30.
https://doi.org/10.1021/je60068a010
Lee, J.D., Englezos, P., 2005. Enhancement of the performance of gas hydrate kinetic
inhibitors with polyethylene oxide. Chemical Engineering Science 60, 5323–
5330. https://doi.org/10.1016/j.ces.2005.05.023
Lee, S.-Y., Holder, G.D., 2002. Model for gas hydrate equilibria using a variable
reference chemical potential: Part 1. AIChE Journal 48, 161–167.
https://doi.org/10.1002/aic.690480116
Lehmann, M.N., Bowman, C.W., Mok, W.Y., Barr, N.J., 2016. Application of oxygen
scavengers to glycol systems. US9249516B2.
Lehmann, M.N., Lamm, A., Nguyen, H.M., Bowman, C.W., Mok, W.Y., Salasi, M.,
Gubner, R., 2014. Corrosion Inhibitor and Oxygen Scavenger for use as MEG
Additives in the Inhibition of Wet Gas Pipelines. Presented at the Offshore
Technology Conference-Asia, Offshore Technology Conference.
https://doi.org/10.4043/25070-MS
Li, X.-S., Wu, H.-J., Englezos, P., 2006. Prediction of Gas Hydrate Formation
Conditions in the Presence of Methanol, Glycerol, Ethylene Glycol, and
Triethylene Glycol with the Statistical Associating Fluid Theory Equation of
State. Ind. Eng. Chem. Res. 45, 2131–2137. https://doi.org/10.1021/ie051204x
Liu, D., Chen, Z., Guo, X., 2008. The effect of acetic acid and acetate on CO2

212
corrosion of carbon steel. Anti-Corrosion Methods and Materials.
https://doi.org/10.1108/00035590810870437
Liu, X., Jungang, L., Qianya, Z., Jinlai, F., Yingli, L., Jingxin, S., 2009. The analysis
and prediction of scale accumulation for water-injection pipelines in the
Daqing Oilfield. Journal of Petroleum Science and Engineering 66, 161–164.
https://doi.org/10.1016/j.petrol.2009.02.007
Liu, Yucheng, Wu, D., Chen, M., Zhang, B., Chen, J., Liu, Yuanzhi, 2015.
Identification of Methyldiethanolamine Degradation Products and Their
Influence on Foaming Properties during the Desulfurization Process for High-
Sulfurous Natural Gas. Ind. Eng. Chem. Res. 54, 5836–5841.
https://doi.org/10.1021/ie504432d
Loken, K., Li, X., Austvik, T., 1998. The hydrate control strategy for the Asgard field
and hydrate plug melting using the bundle heating method, in: BHR Group
Conference Series. Professional Engineering Publishing, Bury St. Edmunds,
pp. 491–506.
Lone, A., Kelland, M.A., 2013. Exploring Kinetic Hydrate Inhibitor Test Methods and
Conditions Using a Multicell Steel Rocker Rig. Energy Fuels 27, 2536–2547.
https://doi.org/10.1021/ef400321z
Long, J.P., Sloan, E.D., 1996. Hydrates in the ocean and evidence for the location of
hydrate formation. Int J Thermophys 17, 1–13.
https://doi.org/10.1007/BF01448204
López, D.A., Pérez, T., Simison, S.N., 2003. The influence of microstructure and
chemical composition of carbon and low alloy steels in CO2 corrosion. A state-
of-the-art appraisal. Materials & Design 24, 561–575.
https://doi.org/10.1016/S0261-3069(03)00158-4
Lu, H., Matsumoto, R., Tsuji, Y., Oda, H., 2001. Anion plays a more important role
than cation in affecting gas hydrate stability in electrolyte solution? — a
recognition from experimental results. Fluid Phase Equilibria 178, 225–232.
https://doi.org/10.1016/S0378-3812(00)00464-7
Lu, Z., Sultan, N., 2008. Empirical expressions for gas hydrate stability law, its volume
fraction and mass-density at temperatures 273.15K to 290.15K. Geochemical
Journal 42, 163–175. https://doi.org/10.2343/geochemj.42.163
Luna-Ortiz, E., Healey, M., Anderson, R., Sørhaug, E., 2014. Crystal Growth
Inhibition Studies for the Qualification of a Kinetic Hydrate Inhibitor under
Flowing and Shut-In Conditions. Energy Fuels 28, 2902–2913.
https://doi.org/10.1021/ef402493x
Lv, Q., Zang, X., Li, X., Li, G., 2018. Effect of seawater ions on cyclopentane-methane
hydrate phase equilibrium. Fluid Phase Equilibria 458, 272–277.
https://doi.org/10.1016/j.fluid.2017.11.031
Madera, M., Höflinger, W., Kadnar, R., 2003. Ion chromatographic identification and
quantification of glycol degradation products. Journal of Chromatography A,
15th International Ion Chromatography Symposium 997, 279–284.
https://doi.org/10.1016/S0021-9673(03)00060-8
Maekawa, T., 2001. Equilibrium conditions for gas hydrates of methane and ethane
mixtures in pure water and sodium chloride solution. Geochemical Journal 35,
59–66. https://doi.org/10.2343/geochemj.35.59
Makogon, T.Y., Larsen, R., Knight, C.A., Dendy Sloan, E., 1997. Melt growth of
tetrahydrofuran clathrate hydrate and its inhibition: method and first results.
Journal of Crystal Growth 179, 258–262. https://doi.org/10.1016/S0022-

213
0248(97)00118-8
Makogon, Y.F., 1965. A gas hydrate formation in the gas saturated layers under low
temperature. Gas Industry 5, 14–15.
Malegaonkar, M.B., Dholabhai, P.D., Bishnoi, P.R., 1997. Kinetics of carbon dioxide
and methane hydrate formation. The Canadian Journal of Chemical
Engineering 75, 1090–1099. https://doi.org/10.1002/cjce.5450750612
Marshall, D.R., Saito, S., Kobayashi, R., 1964. Hydrates at high pressures: Part I.
Methane-water, argon-water, and nitrogen-water systems. AIChE Journal 10,
202–205. https://doi.org/10.1002/aic.690100214
Martin, R.L., 2001. Corrosion Consequences of Oxygen Entry Into Sweet Oilfield
Fluids. Presented at the SPE Annual Technical Conference and Exhibition,
Society of Petroleum Engineers. https://doi.org/10.2118/71470-MS
McGinnis, B.D., Adams, V.D., Middlebrooks, E.J., 2000. Degradation of ethylene
glycol in photo Fenton systems. Water Research 34, 2346–2354.
https://doi.org/10.1016/S0043-1354(99)00387-5
McIntyre, G., Hlavinka, M., Hernandez, V., Bryan, T., 2004. Hydrate Inhibition with
Methanol—A Review and New Concerns over Experimental Data
Presentation, in: 83rd Annual GPA Convention, New Orleans.
McKoy, V., Sinanoğlu, O., 1963. Theory of Dissociation Pressures of Some Gas
Hydrates. J. Chem. Phys. 38, 2946–2956. https://doi.org/10.1063/1.1733625
McLeod, H.O.J., Campbell, J.M., 1961. Natural Gas Hydrates at Pressures to 10,000
psia. Journal of Petroleum Technology 13, 590–594.
https://doi.org/10.2118/1566-G-PA
Mech, D., Pandey, G., Sangwai, J.S., 2015. Effect of Molecular Weight of
Polyethylene Glycol on the Equilibrium Dissociation Pressures of Methane
Hydrate System. J. Chem. Eng. Data 60, 1878–1885.
https://doi.org/10.1021/acs.jced.5b00088
Mehta, A.P., Hebert, P.B., Cadena, E.R., Weatherman, J.P., 2002. Fulfilling the
Promise of Low Dosage Hydrate Inhibitors: Journey from Academic Curiosity
to Successful Field Implementation. Presented at the Offshore Technology
Conference, Offshore Technology Conference. https://doi.org/10.4043/14057-
MS
Mendez, C., Singer, M., Comacho, A., Nesic, S., Hernandez, S., Sun, Y., Gunaltun,
Y., Joosten, M.W., 2005. Effect of Acetic Acid, pH and MEG on the CO2 Top
of the Line Corrosion. Presented at the CORROSION 2005, NACE
International.
Mohammadi, A.H., Richon, D., 2009. Methane hydrate phase equilibrium in the
presence of salt (NaCl, KCl, or CaCl2)+ethylene glycol or salt (NaCl, KCl, or
CaCl2)+methanol aqueous solution: Experimental determination of
dissociation condition. The Journal of Chemical Thermodynamics 41, 1374–
1377. https://doi.org/10.1016/j.jct.2009.06.012
Mohebbi, V., Naderifar, A., Behbahani, R.M., Moshfeghian, M., 2012. Investigation
of kinetics of methane hydrate formation during isobaric and isochoric
processes in an agitated reactor. Chemical Engineering Science 76, 58–65.
https://doi.org/10.1016/j.ces.2012.04.016
Montazaud, T., 2011. Precipitation of carbonates in the pretreatment process for
regeneration of ethylene glycol (Master’s Thesis). Institutt for kjemisk
prosessteknologi.
Monticelli, C., Brunoro, G., Frignani, A., Zucchi, F., 1988. Corrosion behaviour of

214
AA 6351 in glycol/water solutions degraded at elevated temperature 39, 379–
384.
Moon, C., Taylor, P.C., Rodger, P.M., 2003. Molecular Dynamics Study of Gas
Hydrate Formation. J. Am. Chem. Soc. 125, 4706–4707.
https://doi.org/10.1021/ja028537v
Mori, Y.H., 1998. Clathrate hydrate formation at the interface between liquid CO2 and
water phases—a review of rival models characterizing “hydrate films.” Energy
Conversion and Management 39, 1537–1557. https://doi.org/10.1016/S0196-
8904(98)00029-6
Mullin, J.W., 2001. Crystallization. Elsevier.
Mussini, P.R., Marcolungo, I., Rondinini, S., Longhi, P., 1991. Acid-base equilibria
and acidity scales in ethylene glycol/water solvent mixtures: Recommended
reference-value ph-metric standards and ionization constants for ophthalic acid
at normal and subzero temperatures. Chimica e l’Industria 73, 262–268.
Nagata, I., Kobayashi, R., 1966. Calculation of Dissociation Pressures of Gas Hydrates
Using Kihara Model. Ind. Eng. Chem. Fund. 5, 344–348.
https://doi.org/10.1021/i160019a009
Natarajan, V., Bishnoi, P.R., Kalogerakis, N., 1994. Induction phenomena in gas
hydrate nucleation. Chemical Engineering Science 49, 2075–2087.
https://doi.org/10.1016/0009-2509(94)E0026-M
Nazzer, C.A., Keogh, J., 2006. Advances in Glycol Reclamation Technology.
Presented at the Offshore Technology Conference, Offshore Technology
Conference. https://doi.org/10.4043/18010-MS
Nerheim, A.R., 1993. Investigation of gas hydrate formation kinetics by laser light
scattering.
Nguyen, N.N., Nguyen, A.V., 2015. The dual effect of sodium halides on the formation
of methane gas hydrate. Fuel 156, 87–95.
https://doi.org/10.1016/j.fuel.2015.04.022
Nyborg, R., 2009. Pipeline corrosion prevention by ph stabilization or corrosion
inhibitors, in: Rio Pipeline Conference and Exposition.
Nyborg, R., Dugstad, A., 2009. Flow Assurance of Wet Gas Pipelines From a
Corrosion Viewpoint. Presented at the ASME 2002 21st International
Conference on Offshore Mechanics and Arctic Engineering, American Society
of Mechanical Engineers Digital Collection, pp. 125–132.
https://doi.org/10.1115/OMAE2002-28294
Obanijesu, E.O., Akindeju, M.K., Vishnu, P., Tade, M.O., 2011. Modelling the Natural
Gas Pipeline Internal Corrosion Rate Resulting from Hydrate Formation, in:
Pistikopoulos, E.N., Georgiadis, M.C., Kokossis, A.C. (Eds.), Computer Aided
Chemical Engineering, 21 European Symposium on Computer Aided Process
Engineering. Elsevier, pp. 1160–1164. https://doi.org/10.1016/B978-0-444-
54298-4.50011-8
Obanijesu, E.O., Gubner, R., Barifcani, A., Pareek, V., Tade, M.O., 2014. The
influence of corrosion inhibitors on hydrate formation temperature along the
subsea natural gas pipelines. Journal of Petroleum Science and Engineering
120, 239–252. https://doi.org/10.1016/j.petrol.2014.05.025
Olajire, A.A., 2015. A review of oilfield scale management technology for oil and gas
production. Journal of Petroleum Science and Engineering 135, 723–737.
https://doi.org/10.1016/j.petrol.2015.09.011
Olsen, S., 2006. Corrosion Control by Inhibition, Environmental Aspects, and pH
215
Control: Part II: Corrosion Control by pH Stabilization. Presented at the
CORROSION 2006, NACE International.
Olsen, S., Halvorsen, A.M.K., 2015. Corrosion Control by pH Stabilization. Presented
at the CORROSION 2015, NACE International.
Østergaard, K.K., Tohidi, B., Burgass, R.W., Danesh, A., Todd, A.C., 2001. Hydrate
Equilibrium Data of Multicomponent Systems in the Presence of Structure-II
and Structure-H Heavy Hydrate Formers. J. Chem. Eng. Data 46, 703–708.
https://doi.org/10.1021/je0003086
Papavinasam, S., Doiron, A., Panneerselvam, T., Revie, R.W., 2007. Effect of
Hydrocarbons on the Internal Corrosion of Oil and Gas Pipelines.
CORROSION 63, 704–712. https://doi.org/10.5006/1.3278419
Park, J., Kim, H., Sheng, Q., Wood, C.D., Seo, Y., 2017. Kinetic Hydrate Inhibition
Performance of Poly(vinyl caprolactam) Modified with Corrosion Inhibitor
Groups. Energy Fuels 31, 9363–9373.
https://doi.org/10.1021/acs.energyfuels.7b01956
Park, S.-W., Lee, Joon-Wook, Choi, B.-S., Lee, Jae-Wook, 2006. Absorption of carbon
dioxide into non-aqueous solutions ofN-methyldiethanolamine. Korean J.
Chem. Eng. 23, 806–811. https://doi.org/10.1007/BF02705932
Parrish, W.R., Prausnitz, J.M., 1972. Dissociation Pressures of Gas Hydrates Formed
by Gas Mixtures. Ind. Eng. Chem. Proc. Des. Dev. 11, 26–35.
https://doi.org/10.1021/i260041a006
Perry, H., Green, D., 1997. Perry’s Chemical Engineers Handbook. Mc-Graw Hill Inc,
New York.
Peters, D., Selim, M.S., Sloan, E.D., 2000. Hydrate Dissociation in Pipelines by Two-
Sided Depressurization: Experiment and Model. Annals of the New York
Academy of Sciences 912, 304–313. https://doi.org/10.1111/j.1749-
6632.2000.tb06784.x
Platteeuw, J.C., Waals, J.H. van der, 1958. Thermodynamic properties of gas hydrates.
Molecular Physics 1, 91–96. https://doi.org/10.1080/00268975800100111
Podkrajšek, B., Berčič, G., Turšič, J., Grgić, I., 2004. Aqueous Oxidation of Sulfur(IV)
Catalyzed by Manganese(II): A Generalized Simple Kinetic Model. Journal of
Atmospheric Chemistry 47, 287–303.
https://doi.org/10.1023/B:JOCH.0000021157.14292.a2
Pratt, R.M., Ballard, A.L., Sloan, E.D., 2001. Beware of singularities when calculating
clathrate hydrate cell potentials! AIChE Journal 47, 1897–1898.
https://doi.org/10.1002/aic.690470820
Psarrou, M.N., Jøsang, L.O., Sandengen, K., Østvold, T., 2011. Carbon Dioxide
Solubility and Monoethylene Glycol (MEG) Degradation at MEG
Reclaiming/Regeneration Conditions. J. Chem. Eng. Data 56, 4720–4724.
https://doi.org/10.1021/je200709h
Radhakrishnan, R., Trout, B.L., 2002. A new approach for studying nucleation
phenomena using molecular simulations: Application to CO2 hydrate
clathrates. J. Chem. Phys. 117, 1786–1796. https://doi.org/10.1063/1.1485962
Ranjbar, K., Abasi, A., 2013. Failure assessment of crude oil preheating tubes in mono
ethylene glycol–water mixture solution. Engineering Failure Analysis 31, 161–
167. https://doi.org/10.1016/j.engfailanal.2013.01.048
Ripmeester, J.A., Tse, J.S., Ratcliffe, C.I., Powell, B.M., 1987. A new clathrate hydrate
structure. Nature 325, 135–136. https://doi.org/10.1038/325135a0
Robinson, D., Ng, H.J., 1986. Hydrate formation and inhibition in gas or gas

216
condensate streams. Journal of Canadian Petroleum Technology 25.
Rock, A., 2002. Experimentelle und theoretische Untersuchung zur Hydratbildung aus
Gasgemischen in inhibitorhaltigen wassrigen Losungen. Universität Karlsruhe
(TH), Karlsruhe, Germany.
Rodger, P.Mark., 1990. Stability of gas hydrates. J. Phys. Chem. 94, 6080–6089.
https://doi.org/10.1021/j100378a082
Ross, J.R.H., van Keulen, A.N.J., Hegarty, M.E.S., Seshan, K., 1996. The catalytic
conversion of natural gas to useful products. Catalysis Today, Proceedings of
the 1st Global Conference of Young Chinese Scientist on Catalysis Science
and Technology 30, 193–199. https://doi.org/10.1016/0920-5861(96)00035-1
Rossiter, W.J., Brown, P.W., Godette, M., 1983. The determination of acidic
degradation products in aqueous ethylene glycol and propylene glycol
solutions using ion chromatography. Solar Energy Materials 9, 267–279.
https://doi.org/10.1016/0165-1633(83)90049-7
Rossiter, W.J., Godette, M., Brown, P.W., Galuk, K.G., 1985. An investigation of the
degradation of aqueous ethylene glycol and propylene glycol solutions using
ion chromatography. Solar Energy Materials 11, 455–467.
https://doi.org/10.1016/0165-1633(85)90016-4
Rudenko, A.I., Gershuni, A.N., Kalabina, L.V., 1997. Some characteristics of ethylene
glycol as a heat-transfer agent for closed two-phase systems. J Eng Phys
Thermophys 70, 799–804. https://doi.org/10.1007/BF02657642
Sadeq, D., Iglauer, S., Lebedev, M., Smith, C., Barifcani, A., 2017. Experimental
determination of hydrate phase equilibrium for different gas mixtures
containing methane, carbon dioxide and nitrogen with motor current
measurements. Journal of Natural Gas Science and Engineering 38, 59–73.
https://doi.org/10.1016/j.jngse.2016.12.025
Saeedi Dehaghani, A.H., Badizad, M.H., 2017. Inhibiting asphaltene precipitation
from Iranian crude oil using various dispersants: Experimental investigation
through viscometry and thermodynamic modelling. Fluid Phase Equilibria
442, 104–118. https://doi.org/10.1016/j.fluid.2017.03.020
Salasi, M., Pojtanabuntoeng, T., Wong, S., Lehmann, M., 2017. Efficacy of Bisulfite
Ions as an Oxygen Scavenger in Monoethylene Glycol (At Least 20
wt%)/Water Mixtures. SPE Journal 22, 1,467-1,477.
https://doi.org/10.2118/185944-PA
Sami, N.A., Das, K., Sangwai, J.S., Balasubramanian, N., 2013. Phase equilibria of
methane and carbon dioxide clathrate hydrates in the presence of
(methanol+MgCl2) and (ethylene glycol+MgCl2) aqueous solutions. The
Journal of Chemical Thermodynamics 65, 198–203.
https://doi.org/10.1016/j.jct.2013.05.050
Samimi, A., 2012. Preventing Hydrate Formation in Gas Transporting Pipe Lines with
Synthetic Inhibitors. International Journal of Science and Investigations,
France 48–50.
Sandengen, K., 2006. Prediction of mineral scale formation in wet gas condensate
pipelines and in meg (mono ethylene glycol) regeneration plants. Fakultet for
naturvitenskap og teknologi.
Sandengen, K., Kaasa, B., Østvold, T., 2007. pH Measurements in Monoethylene
Glycol (MEG) + Water Solutions. Ind. Eng. Chem. Res. 46, 4734–4739.
https://doi.org/10.1021/ie061305a
Scott, D.W., Villalobos, A., Kwok, C.K., Scott, W.F., 2016. Hydrate Management

217
Analysis Applying MEG Injection for Gas and Condensate Fields: A Dynamic
Approach. Presented at the Abu Dhabi International Petroleum Exhibition &
Conference, Society of Petroleum Engineers. https://doi.org/10.2118/183553-
MS
Seo, Y., Kang, S.-P., 2012. Inhibition of methane hydrate re-formation in offshore
pipelines with a kinetic hydrate inhibitor. Journal of Petroleum Science and
Engineering, Unconventional hydrocarbons exploration and production
Challenges 88–89, 61–66. https://doi.org/10.1016/j.petrol.2011.11.001
Shaw, S., Welton, T.D., Sorbie, K.S., 2012. The Relation Between Barite Inhibition
by Phosphonate Scale Inhibitors and the Structures of Phosphonate-Metal
Complexes. Presented at the SPE International Conference on Oilfield Scale,
Society of Petroleum Engineers. https://doi.org/10.2118/155114-MS
Shaw, S.S., Sorbie, K., 2015. Synergistic Properties of Phosphonate and Polymeric
Scale-Inhibitor Blends for Barium Sulfate Scale Inhibition. SPE Production &
Operations 30, 16–25. https://doi.org/10.2118/169752-PA
Sheng, Q., Silveira, K.C. da, Tian, W., Fong, C., Maeda, N., Gubner, R., Wood, C.D.,
2017. Simultaneous Hydrate and Corrosion Inhibition with Modified
Poly(vinyl caprolactam) Polymers. Energy Fuels 31, 6724–6731.
https://doi.org/10.1021/acs.energyfuels.7b00525
Shukla, P.R., Dhar, S., Victor, D.G., Jackson, M., 2009. Assessment of demand for
natural gas from the electricity sector in India. Energy Policy, New Zealand
Energy Strategy 37, 3520–3534. https://doi.org/10.1016/j.enpol.2009.03.067
Skovborg, P., Ng, H.J., Rasmussen, P., Mohn, U., 1993. Measurement of induction
times for the formation of methane and ethane gas hydrates. Chemical
Engineering Science 48, 445–453. https://doi.org/10.1016/0009-
2509(93)80299-6
Skovborg, P., Rasmussen, P., 1994. A mass transport limited model for the growth of
methane and ethane gas hydrates. Chemical Engineering Science 49, 1131–
1143. https://doi.org/10.1016/0009-2509(94)85085-2
Sloan, E.D., 2005. A changing hydrate paradigm—from apprehension to avoidance to
risk management. Fluid Phase Equilibria, PPEPPD 2004 Proceedings 228–229,
67–74. https://doi.org/10.1016/j.fluid.2004.08.009
Sloan, E.D., Subramanian, S., Matthews, P.N., Lederhos, J.P., Khokhar, A.A., 1998.
Quantifying Hydrate Formation and Kinetic Inhibition. Ind. Eng. Chem. Res.
37, 3124–3132. https://doi.org/10.1021/ie970902h
Sloan Jr, E.D., Koh, C.A., 2007. Clathrate Hydrates of Natural Gases. CRC Press.
Smelik, E.A., King, H.E., 2015. Crystal-growth studies of natural gas clathrate
hydrates using a pressurized optical cell. American Mineralogist 82, 88–98.
https://doi.org/10.2138/am-1997-1-211
Smith, C., Barifcani, A., Pack, D., 2016. Helium substitution of natural gas
hydrocarbons in the analysis of their hydrate. Journal of Natural Gas Science
and Engineering 35, 1293–1300. https://doi.org/10.1016/j.jngse.2016.09.033
Smith, C., Barifcani, A., Pack, D., 2015. Gas hydrate formation and dissociation
numerical modelling with nitrogen and carbon dioxide. Journal of Natural Gas
Science and Engineering 27, 1118–1128.
https://doi.org/10.1016/j.jngse.2015.09.055
Son, K.V., Wallace, C., 2000. Reclamation/regeneration of glycols used for hydrate
inhibition. Deep Offshore Technology.
Stanek, W., Białecki, R., 2014. Can natural gas warm the climate more than coal? Fuel

218
136, 341–348. https://doi.org/10.1016/j.fuel.2014.07.075
Sun, Q., Chen, B., Li, X., Guo, X., Yang, L., 2017. The investigation of phase
equilibria and kinetics of CH4 hydrate in the presence of bio-additives. Fluid
Phase Equilibria 452, 143–147. https://doi.org/10.1016/j.fluid.2017.09.002
Svenningsen, G., Nyborg, R., 2014. Modeling of Top of Line Corrosion with Organic
Acid and Glycol. Presented at the CORROSION 2014, NACE International.
Taylor, C.J., 2007. Adhesion force between hydrate particles and macroscopic
investigation of hydrate film growth at the hydrocarbon / water interface
(Thesis). Colorado School of Mines. Arthur Lakes Library.
Teixeira, A.M., Medeiros, J.L., Araújo, O.Q.F., 2015. Offshore Monoethylene Glycol
Recovery Units: The Importance of Choice of MEG State in the Reference
Environment for Effective Exergy Analysis. Presented at the OTC Brasil,
Offshore Technology Conference. https://doi.org/10.4043/26135-MS
Tohidi, B., Burgass, R.W., Danesh, A., Østergaard, K.K., Todd, A.C., 2000.
Improving the Accuracy of Gas Hydrate Dissociation Point Measurements.
Annals of the New York Academy of Sciences 912, 924–931.
https://doi.org/10.1111/j.1749-6632.2000.tb06846.x
Turner, D.J., 2005. Clathrate hydrate formation in water-in-oil dispersions.
Uchida, T., Ebinuma, T., Kawabata, J., Narita, H., 1999. Microscopic observations of
formation processes of clathrate-hydrate films at an interface between water
and carbon dioxide. Journal of Crystal Growth 204, 348–356.
https://doi.org/10.1016/S0022-0248(99)00178-5
Udachin, K.A., Ratcliffe, C.I., Ripmeester, J.A., 2001. Structure, Composition, and
Thermal Expansion of CO2 Hydrate from Single Crystal X-ray Diffraction
Measurements. J. Phys. Chem. B 105, 4200–4204.
https://doi.org/10.1021/jp004389o
Urdahl, O., Børnes, A.H., Kinnari, K.J., Holme, R., 2003. Operational Experience by
Applying Direct Electrical Heating for Hydrate Prevention. Presented at the
Offshore Technology Conference, Offshore Technology Conference.
https://doi.org/10.4043/15189-MS
Vajari, S.M., 2012. Development of hydrate inhibition monitoring and initial
formation detection techniques (Thesis). Heriot-Watt University.
Van der Waals, J.H., 1959. Clathrate solutions. Adv. Chem. Phys. 2, 1–57.
Verma, V.K., 1974. Gas hydrates from liquid hydrocarbon-water systems (PhD
Thesis). University of Michigan.
Vetter, O.J., 1972. An Evaluation of Scale Inhibitors. Journal of Petroleum
Technology 24, 997–1,006. https://doi.org/10.2118/3188-PA
Villard, P., 1888. Sur quelques nouveaux hydrates de gaz. Compt. Rend 106, 1602–
1603.
Voutsas, E., Vrachnos, A., Magoulas, K., 2004. Measurement and thermodynamic
modeling of the phase equilibrium of aqueous N-methyldiethanolamine
solutions. Fluid Phase Equilibria 224, 193–197.
https://doi.org/10.1016/j.fluid.2004.05.012
Vysniauskas, A., Bishnoi, P.R., 1983. A kinetic study of methane hydrate formation.
Chemical Engineering Science 38, 1061–1072. https://doi.org/10.1016/0009-
2509(83)80027-X
Wang, C., Hu, X., Ivonye, I., Neville, A., 2013. Corrosion Study of Carbon Steel in
the Presence of Monoethylene Glycol (MEG) and Corrosion Inhibitors in Acid.
Presented at the CORROSION 2013, NACE International.

219
Wang, H., Wylde, J., 2010. Corrosion Inhibitor Development For Slight Sour
Environment With Oxygen Intrusion Issue. Presented at the CORROSION
2010, NACE International.
Wang, T., El Ahmar, E., Coquelet, C., 2017. Alkane solubilities in aqueous
alkanolamine solutions with CPA EoS. Fluid Phase Equilibria 434, 93–101.
https://doi.org/10.1016/j.fluid.2016.11.025
Wang, T., El Ahmar, E., Coquelet, C., Kontogeorgis, G.M., 2018. Improvement of the
PR-CPA equation of state for modelling of acid gases solubilities in aqueous
alkanolamine solutions. Fluid Phase Equilibria 471, 74–87.
https://doi.org/10.1016/j.fluid.2018.04.019
Wang, Y., Fan, S., Lang, X., 2019. Reviews of gas hydrate inhibitors in gas-dominant
pipelines and application of kinetic hydrate inhibitors in China. Chinese
Journal of Chemical Engineering. https://doi.org/10.1016/j.cjche.2019.02.023
Weiland, R.H., Dingman, J.C., Cronin, D.B., 1997. Heat Capacity of Aqueous
Monoethanolamine, Diethanolamine, N-Methyldiethanolamine, and N-
Methyldiethanolamine-Based Blends with Carbon Dioxide. J. Chem. Eng.
Data 42, 1004–1006. https://doi.org/10.1021/je960314v
Windmeier, C., Oellrich, L.R., 2014. Experimental Methane Hydrate Dissociation
Conditions in Aqueous Solutions of Lithium Salts. J. Chem. Eng. Data 59,
516–518. https://doi.org/10.1021/je4010036
Wu, Q., Zhang, B., 2010. Memory effect on the pressure-temperature condition and
induction time of gas hydrate nucleation. Journal of Natural Gas Chemistry 19,
446–451. https://doi.org/10.1016/S1003-9953(09)60086-4
Xiang, Y., Choi, Y.-S., Yang, Y., Nešić, S., 2014. Corrosion of Carbon Steel in
MDEA-Based CO2 Capture Plants Under Regenerator Conditions: Effects of
O2 and Heat-Stable Salts. CORROSION 71, 30–37.
https://doi.org/10.5006/1354
Yang, C., Feng, Y., Cheng, B., Zhang, P., Qin, Z., Zeng, H., Sun, F., 2013. Vapor–
Liquid Equilibria for Three Binary Systems of N-Methylethanolamine, N-
Methyldiethanolamine, and Ethylene Glycol at P = (40.0, 30.0, and 20.0) kPa.
J. Chem. Eng. Data 58, 2272–2279. https://doi.org/10.1021/je400373d
Yong, A., Obanijesu, E.O., 2015. Influence of natural gas production chemicals on
scale production in MEG regeneration systems. Chemical Engineering Science
130, 172–182. https://doi.org/10.1016/j.ces.2015.03.037
Youssef, Z., Barreau, A., Mougin, P., Jose, J., Mokbel, I., 2010. Measurements of
Hydrate Dissociation Temperature of Gas Mixtures in the Absence of Any
Aqueous Phase and Prediction with the Cubic-Plus-Association Equation of
State. J. Chem. Eng. Data 55, 2809–2814. https://doi.org/10.1021/je901001u
Zaboon, S., Soames, A., Ghodkay, V., Gubner, R., Barifcani, A., 2017. Recovery of
mono-ethylene glycol by distillation and the impact of dissolved salts
evaluated through simulation of field data. Journal of Natural Gas Science and
Engineering 44, 214–232. https://doi.org/10.1016/j.jngse.2017.04.007
Zang, X., Liang, D., 2017. Phase Equilibrium Data for Semiclathrate Hydrate of
Synthesized Binary CO2/CH4 Gas Mixture in Tetra-n-butylammonium
Bromide Aqueous Solution. J. Chem. Eng. Data 62, 851–856.
https://doi.org/10.1021/acs.jced.6b00876
Zarinabadi, S., Samimi, A., 2011. Problems of hydrate formation in oil and gas pipes
deal. Austr J Basic Appl Sci 5, 741–745.
Zele, S.R., Lee, S.-Y., Holder, G.D., 1999. A Theory of Lattice Distortion in Gas

220
Hydrates. J. Phys. Chem. B 103, 10250–10257.
https://doi.org/10.1021/jp9917704
Zeng, H., Moudrakovski, I.L., Ripmeester, J.A., Walker, V.K., 2006. Effect of
antifreeze protein on nucleation, growth and memory of gas hydrates. AIChE
Journal 52, 3304–3309. https://doi.org/10.1002/aic.10929
Zoghi, A.T., Feyzi, F., Dehghani, M.R., 2012. Modeling CO2 Solubility in Aqueous
N-methyldiethanolamine Solution by Electrolyte Modified Peng–Robinson
Plus Association Equation of State. Ind. Eng. Chem. Res. 51, 9875–9885.
https://doi.org/10.1021/ie2026053
Note: “Every reasonable effort has been made to acknowledge the owners of
copyright material. I would be pleased to hear from any copyright owner who has
been omitted or incorrectly acknowledged.”

221
APPENDICES
APPENDIX A. Outline of Algorithm, and MDEA Data
The effect of MDEA on varied MEG mixtures are given in Table A-1.
Table A-1: Effect of MDEA (5 wt%) on MEG (20 wt% and 25 wt%).
Mixture P (MPa) Texp (°C) ΔTMEG (°C) ΔTMDEA (°C)
MEG-MDEA
(20 wt%)
7.34 4.14 -5.77 -0.28
9.95 6.71 -5.90 -0.25
15.25 10.22 -6.08 -0.30
20.21 12.52 -6.20 -0.35
Average -0.30
MEG-MDEA
(25 wt%)
7.31 2.19 -7.71 -0.29
10.63 5.26 -7.36 -0.24
15.22 8.10 -8.20 -0.30
19.89 10.22 -8.51 -0.34
Average -0.29
A simple algorithm is proposed to allow for determining the hydrate equilibrium
temperature shift for mixtures containing methyldiethanolamine (MDEA) and
monoethylene glycol (MEG). The algorithm relies primarily on two aspects, firstly,
the experimental data obtained in this study, and secondly, on the equation of state
prediction for the MEG hydrate phase boundary for MEG concentrations outside of
the scope of this study. An outline of the algorithm is given in Figure A-1.

222
Figure A-1: Outline of the algorithm to predict equilibrium temperature of pure
MDEA, and MEG-MDEA solutions at MDEA concentrations of 0 – 7.5 wt%.

223
APPENDIX B. Computer Script to Process Test Data
The computer script to process raw data and determine the hydrate phase equilibrium
conditions was developed using MATLAB. The script is given below.
function P = HydEqm(HF,filename)
% Function HydEqm finds and plots the hydrate phase equilibrium point from raw
% PT data.
% The function requires the observed hydrate formation point to remove
% unnecessary data and the source pressure/temperature data from the cooling
% and heating process using the isochoric test method.
%
% Author : Khalid Alef
% Version: 1.0, 31 July. 2018
rawdata = csvread(filename,2,1); %..read and import raw PT data
data = rawdata(:,1:2); %..remove unnecessary data
data(:,1) = data(:,1)./100; %..convert data to desired units
plot(data(:,2),data(:,1))
idx = data(:,2) < HF; %..remove unnecessary data
modiData = data;
modiData(idx,:)=[];
di = modiData(2:end,1)-modiData(1:end-1,1);
cutoff = find(di==max(di));
line1 = modiData(1:cutoff,:); %..separate cooling and heating
line2 = modiData(cutoff:end,:);
pt1 = polyfit(line1(:,2),line1(:,1),1); %..fit linear trends
pt2 = polyfit(line2(:,2),line2(:,1),1);
x_intsect = fzero(@(x) polyval(pt1-pt2,x),3); %..intersection
y_intsect = polyval(pt1,x_intsect);
P(1)=x_intsect;
P(2)=y_intsect;
range = HF:0.001:max(modiData(:,2));
val1 = polyval(pt1,range);
val2 = polyval(pt2,range);
figure %..plot the data and trend-lines
plot(line1(:,2),line1(:,1),'co',line2(:,2),line2(:,1),'mo')
hold on
scatter(P(1),P(2),'filled')
plot(range,val1,'b',range,val2,'r')
output = P; %..hydrate equilibrium pressure and temperature
end

224
APPENDIX C. Copyright Permission Statements
This section contains the copyright agreements between the author and Journal for the
reuse of the author’s own published material within this thesis.
Chapter 2, Article: “The Effect of Regenerated MEG on Hydrate Inhibition
Performance Over Multiple Regeneration Cycles” in Journal Fuel.

225
Chapter 3, Article: “Evaluation of MEG Reclamation and Natural Gas Hydrate
Inhibition During Corrosion Control Switchover” in Journal of Petroleum Science and
Engineering.
Chapter 4, Article: “The Effect of Salt-Laden Degraded MEG on Gas Hydrate
Inhibition” in Society of Petroleum Engineers.
226
Chapter 5, Article: “Hydrate Phase Equilibria for Methyldiethanolamine and
Empirical Modeling for Prediction” in Journal of Chemical and Engineering Data.

227
Chapter 6, Article: “Thermodynamic Modeling of Hydrate Phase Equilibria in
Methyldiethanolamine Solution in the Presence or Absence of Monoethylene Glycol”
in Journal of Chemical and Engineering Data.

228
Chapter 7, Article: “Effect of N-Methyl-Diethanolamine and Film Forming Corrosion
Inhibitor on Gas Hydrate, and Empirical Modeling for Degradation” in Journal of
Petroleum Science and Engineering.

229
Chapter 8, Article: “Effect of Dissolved Oxygen, Sodium Bisulfite, and Oxygen
Scavengers on Methane Hydrate Inhibition” in Journal of Chemical and Engineering
Data.

230
Chapter 9, Article: “Hydrate Phase Equilibria of Phosphonate Scale Inhibitors,
Amines, and Ethylene Glycol” in Journal of Chemical and Engineering Data.

231
Chapter 10, Article: “Degradation and Hydrate Phase Equilibria Measurement
Methods of Monoethylene Glycol” in Journal MethodsX.
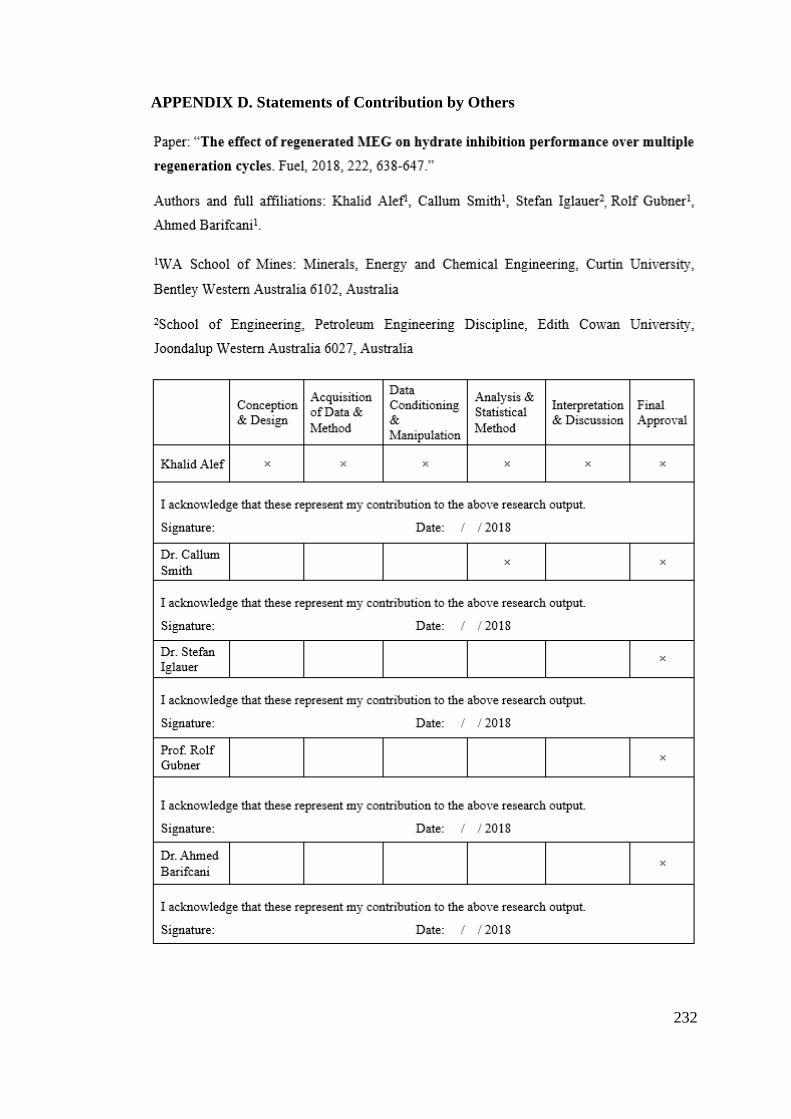
232
APPENDIX D. Statements of Contribution by Others
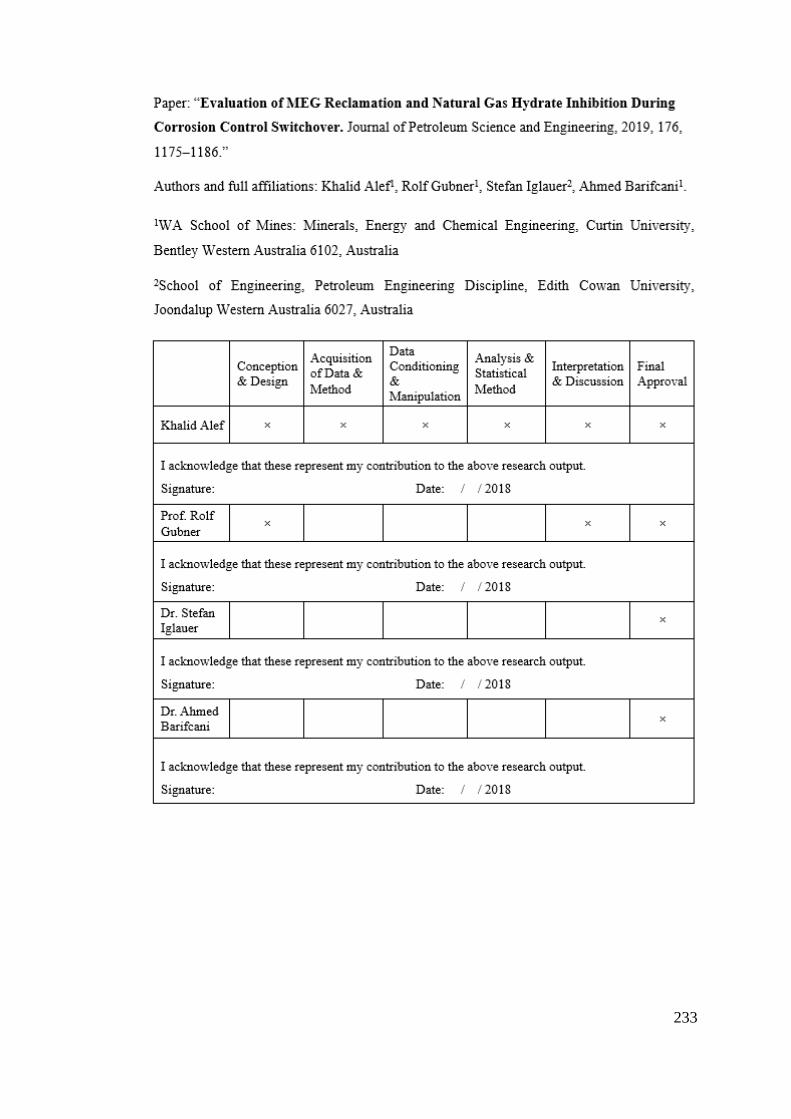
233

234

235
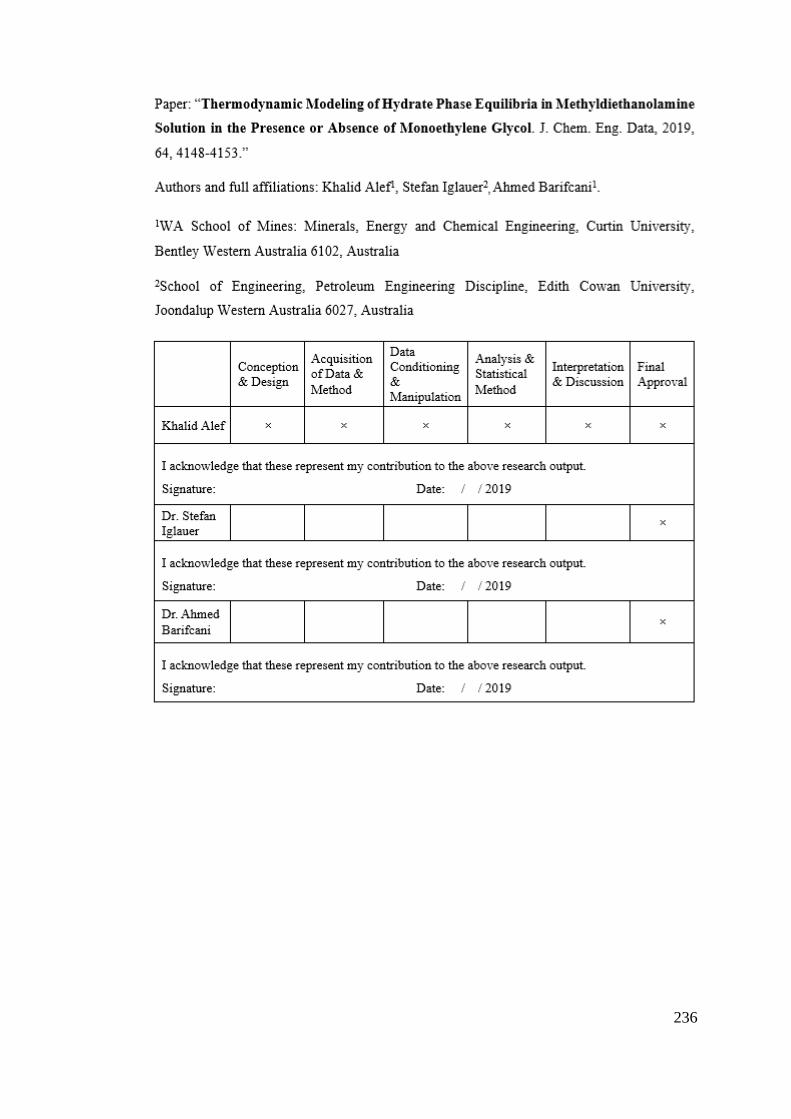
236

237

238

239

240

241