gas flare detection with sentinel-3, including night-time
TRANSCRIPT

Alexandre Caseiro1, Gernot Rücker2, Johannes W. Kaiser1
1 Max Planck Institute for Chemistry, Mainz2 Zebris GbR, Munich
with Eckehard Lorenz3, Olaf Frauenberger3
3 DLR e.V.
Gas flare detection with Sentinel-3, including night-time acquisition in S1-S4

Detection and characterisation
Visible on Google Earth
A gas flare in Nigeria
Detected by theSentinel-3 satellite
Retrieval of:TemperatureT = 1394KAreaA = 22m2
Computation of:Radiative PowerRP = 4.71MW
Fit the sum of 2 Planck curves (Background and Hot Source) to satellite infrared readings:
At night, the satellite registers the radiance in 5 channels
Image from Google Earth

Dual Planck Curve fitting
Provenance
VIIRS Nightfire [Elvidge et al. 2013]
• strong hot source temperature constraint in NIR range
Input options
• SLSTR S5-S9• SLSTR S1-S9• VIIRS M7, M9-M12, M15, M16

Global results – Detection of gas flaresSentinel-3: global daily coverage, operational until 2040.
Gas Flares are expected to burn (semi-)continuously.Only consider locations with at least 4: still detect some vegetation fires and industrial sites.
Applying a lower Temperature threshold.
4634 flaring sites detected globally(2017, 150 days)Top 50% in 5 countries:Russia: 778United States: 461Iran: 361Algeria: 267Iraq: 260
- 5 -
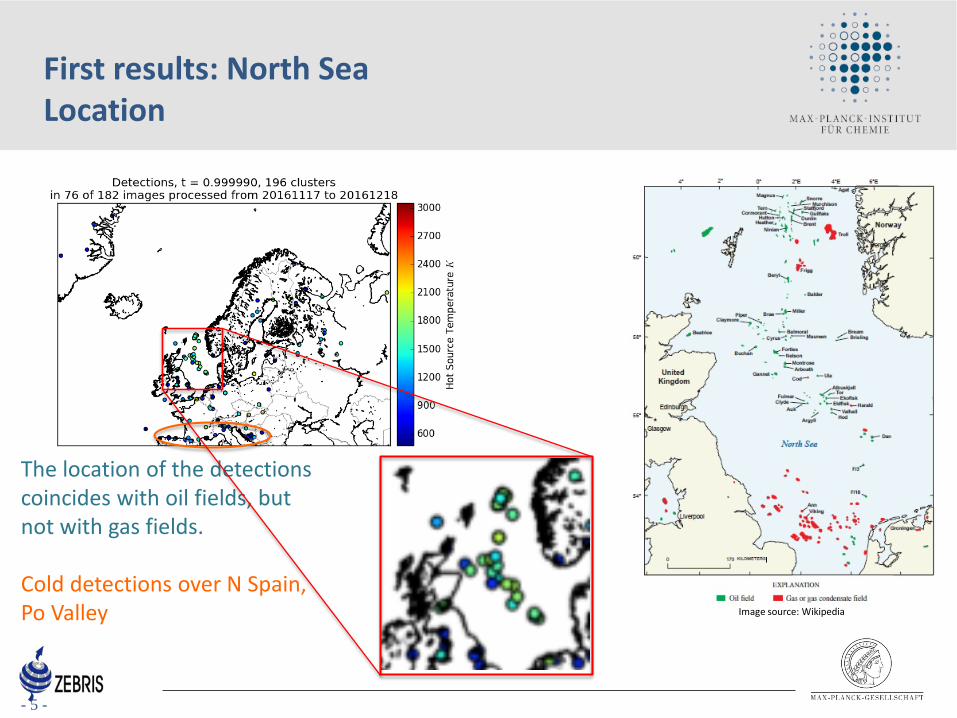
First results: North SeaLocation
The location of the detections coincides with oil fields, but not with gas fields.
Cold detections over N Spain, Po Valley Image source: Wikipedia

Method evaluationComparison between Sentinel-3 SLSTR and Suomi-NPP VIIRS
Nightfire algorithm by C. Elvidge et al. 2016

Thanks to its high resolution, TET-1 discriminates various flares where SLSTR sees a continuous cluster at Bovanenkovo.
Temperature and Area:- BIRD algorithm Zhukov et al. 2005FRP:- bi-spectral method Zhukov et al. 2006 after Dozier 1981- MIR method Wooster et al. 2003
TSLSTR > TTET-1ASLSTR < ATET-1FRPSLSTR ≈ FRPTET-1
Comparison to TET-1Temperature, area, FRP

This study:
Number of flaring sites(2017, 150 days)
EDGAR (v4.3) CO2 emissions:
Venting and Flaring(2012)
Country This study(% of global)
EDGAR(% of global)
Venezuela 3 % 21 % 3 %
Iraq 6 % 12 % 8 %
Iran 8 % 10 % 7 %
Russia 17 % 8 % 24 %
Algeria 6 % 4 % 4 %
Nigeria 4 % 4 % 10 %
United States 10 % 4 % 6 %
This study:
Sum of RP(2017, 150 days)
Global results – comparison with EDGAR

This study:
Number of flaring sites(2017, 150 days)
EDGAR (v4.3) CO2 emissions:
Venting and Flaring(2012)
Country This study(% of global)
EDGAR(% of global)
Venezuela 3 % 21 % 3 %
Iraq 6 % 12 % 8 %
Iran 8 % 10 % 7 %
Russia 17 % 8 % 24 %
Algeria 6 % 4 % 4 %
Nigeria 4 % 4 % 10 %
United States 10 % 4 % 6 %
This study:
Sum of RP(2017, 150 days)
Global results – comparison with EDGAR
Venezuela
Too much power?
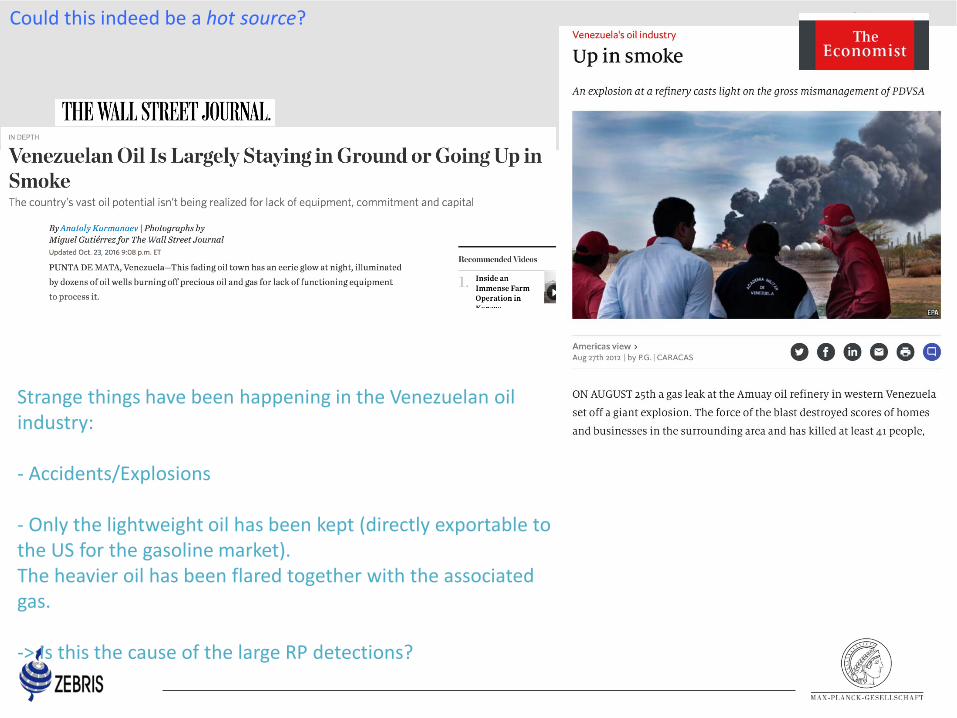
Could this indeed be a hot source?
Strange things have been happening in the Venezuelan oil industry:
- Accidents/Explosions
- Only the lightweight oil has been kept (directly exportable to the US for the gasoline market).The heavier oil has been flared together with the associated gas.
-> Is this the cause of the large RP detections?

1105 x 1800**4 x 5.67E-8 x 1E-6 = 657 MW
Could this indeed be a hot source?
Hi-res imagery in the region not located exactly where we detected hot spots
This one is clearly a flare: visible infrastructure, soot deposits nearby.

Bias in characterisation? There does not seem to be a bias in the characterisation related to observation conditions.
Temperature
RP
This is the same region where we also saw occurrences of ~1GW detections in 2017!

Bias in characterisation? Characterisation may be wrong. Test for bias in:
Cloud (?)

Summary
• Sentinel-3 SLSTR night-time gas flare detection algorithm implemented
• similar to VIIRS Nightfire by C. Elvidge, but– analyses entire hot clusters instead of their maximal pixels– accommodates SLSTR misregistration (and even characterises it)
• validation against VIIRS Nightfire and TET-1
• very large gas flares in Venezuela apparent, but needs better quality control
- 14 -

Retrieval comparison to VIIRS NightfireTemperature, area, FRP

Flare at BovanenkovoFireBIRD TET-1, 2016-12-19 08:01 * FireBIRD TET-1, 2016-12-22 07:35 *
FireBIRD TET-1, 2016-12-29 07:36 FireBIRD TET-1, 2017-01-02 07:34
4 overpasses, 2 of which very close to SLSTR overpasses (marked with *).
Landsat, June2016
Comparison to TET-1
- 17 -
Goals:
• Analyse statistics over many gas flare detections
ROI known for flaring activity, no a priory knowledge of GF locations considered:
• North Sea, data from the Public Hub (17 Nov – 18 Dec, 182 products)
Offshore and onshore
First results over a flaring region

Summary
night-time aquistions of S1-S4• Thank you to EUMETSAT/ESA for making these!• analysis not (yet) conclusive
• indication for possible signal in S4• We need better handle on coregistration of S4 vs S5/S6 (vs F1)
radiance comparison to VIIRS over gas flares• S8/S9 agree within 1%• (S5-S7 comparison method needs improvements)
new gas flare detection and characterisation algorithm• finds locations• L2 compares quantitatively to TET-1 and VIIRS, plus typical temperatures• benefits strongly from recent L1 reprocessing