gas engine heat pump technology · 1 . technology about the technology the gas engine driven heat...
TRANSCRIPT

F i n a l R e p o r t
Gas Engine Heat Pump Technology
April 2015 Prepared for: Southern California Gas
Prepared by: Western Cooling Efficiency Center

ABSTRACT
The gas engine driven heat pump (GEHP) is a relatively new (first produced in 1985) heat pump technology whose purpose is to increase energy efficiency in water and space heating/cooling. This report details the results of a modeling study that compared the relative performance of three different building HVAC systems. The systems compared were a conventional AC and natural gas furnace, an electric heat pump system, and a gas engine driven heat pump. Each system was modeled in all of the California climate zones. Results for site energy, source energy, peak electrical draw, and annual cost in a time-of-use pricing structure were reported.
The results showed wide variations between the systems when comparing site energy, peak power, and cost of operation in a time-of-use pricing structure. The source energy comparison showed substantially less variation; meaning there was similar source energy usage between the systems.

TABLE OF CONTENTS
ABSTRACT ................................................................................................................................................. i
Technology ................................................................................................................................................. 1
About the Technology ........................................................................................................................... 1
About the Nextaire Models .................................................................................................................. 2
System Modeling ...................................................................................................................................... 3
Modeling Package and Methodology ................................................................................................. 3
System Model Design ............................................................................................................................ 3
Building Model ................................................................................................................................... 3
System Performance and Cost ................................................................................................................ 6
Energy and Cost ..................................................................................................................................... 6
Emmissions ......................................................................................... Error! Bookmark not defined.
Waste Heat Utilization ........................................................................................................................ 12
Conclusions and Continuing Work ..................................................................................................... 15
Conclusions ........................................................................................................................................... 15
Continuing Work ................................................................................................................................. 15

1
Technology About the Technology The gas engine driven heat pump (GEHP) is a relatively new (first produced in 1985) heat pump technology whose purpose is to increase energy efficiency in water and space heating/cooling (Hepbasli 2007). GEHPs typically contain a “reversible vapor compression heat pump with an open compressor driven by a natural gas fuelled internal combustion engine. Although the efficiency of a gas engine is not very high (about 30 - 45%), the waste heat of fuel combustion can be recovered by approximately 80%” (Hepbasli 2007). This feature is not present in other heat pumps where the heat released during fuel combustion is simply dissipated into the atmosphere instead of being reutilized (Hepbasli 2007). Another benefit to GEHPs is their low fossil fuel consumption; their typical energy sources include natural gas, propane, or LPG, which are less expensive alternatives to fossil fuels (Hepbasli 2007). Additionally, GEHPs help balance electricity demand by reducing the peak electric load.
A comparison of relevant performance parameters of GEHP systems on the market are shown in Table 1 below:
Figure 1: Commercial GEHP Table
Model Nameplate Size Cooling CapacityCooling Energy Consumption
Cooling COP * Heating CapacityHeating Energy Consumption
Heating COP *
Space Heating / Cooling
NextAire / Aisin 8 T 96 kBTU/hrElectric: .82 kWFuel: 75 kBtu/hr
1.3 103 kBtu/hrElectric: .86 kWFuel: 75 kBtu/hr
1.4
NextAire / Aisin 11 T 132 kBtu/hr 118 kBtu/hr 1.1 142 kBtu/hr 101 kBtu/hr 1.4
NextAire / Aisin 15 T 180 kBTU/hrElectric: 1.23 kWFuel: 189 kBtu/hr
1.0 205 kBtu/hrElectric: 1.29 kWFuel: 165 kBtu/hr
1.2
Yanmar ANZP450H1 16 HP 153 kBtu/hr 11 kBtu/hr 1.5 170 kBtu/hr 106 kBtu/hr 1.6
Yanmar ANZP560H1 20 HP 191 kBtu/hr 150 kBtu/hr 1.3 215 kBtu/hr 146 kBtu/hr 1.5
Yanmar ANZP710H1 25 HP 242 kBtu/hr 190 kBtu/hr 1.3 273 kBtu/hr 188 kBtu/hr 1.5
Yanmar ANZP850H1 30 HP 290 kBtu/hr 213 kBtu/hr 1.4 324 kBtu/hr 208 kBtu/hr 1.6
Yanmar AHZP850H1 Hot Water Recovery
30 HP 290 kBtu/hr 213 kBtu/hr 1.4324 kBtu/hr
102 kBtu/hr (HW)208 kBtu/hr 2.0
Water Heater
Ilios Dynamics HEWH-500-AS 50 GPM - - - 586 kBtu/hr 292 kBtu/hr 2.0
Chiller
Tecogen TecoChill CH-25 ACP 25 T 300 kBtu/hr 309 kBtu/hr 1.0 95 kBtu/hr 309 kBtu/hr 0.31
Tecogen TecoChill CU-25 25 T 348 kBtu/hr 316 kBtu/hr 1.1 99 kBtu/hr 316 kBtu/hr 0.31
Tecogen TecoChill CH-50 ACP 50 T 600 kBtu/hr 681 kBtu/hr 0.9 175 kBtu/hr 681 kBtu/hr 0.26
Tecogen TecoChill CU-50 50 T 696 kBtu/hr 695 kBtu/hr 1.0 183 kBtu/hr 695 kBtu/hr 0.26
Tecogen CH-150x 150 T 1,800 kBtu/hr 1,032 kBtu/hr 1.7 516 kBtu/hr 1,032 kBtu/hr 0.50
Tecogen CH-200x 200 T 2,400 kBtu/hr 1,525 kBtu/hr 1.6 730 kBtu/hr 1,526 kBtu/hr 0.48
Tecogen CH-300x 300 T 3,600 kBtu/hr 2,157 kBtu/hr 1.7 1,032 kBtu/hr 2,157 kBtu/hr 0.48
Tecogen CH-350x 350 T 4,200 kBtu/hr 2,528 kBtu/hr 1.7 1,210 kBtu/hr 2,529 kBtu/hr 0.48
Tecogen CH-400x 400 T 4,800 kBtu/hr 3,051 kBtu/hr 1.6 1,460 kBtu/hr 3,052 kBtu/hr 0.48
*Yanmar and NextAire Aisin (8 and 15 ton models) COPs have been calculated using data from website

2
About the Nextaire Models For this project Nextaire has been chosen as the representative manufacturer of GEHP technology and selected units will be tested in the laboratory and the field. Nextaire offers an 11 ton packaged GEHP, an 8 ton multi zone GEHP, and a 15 ton multi zone GEHP. These products primarily utilize natural gas and minimal electricity. The GEHPs also use waste heat from their engine in space heating, which improves their efficiency compared to other (electric) heating systems. The manufacturer claims that the NextAire GEHPs use 80% less electricity than competing electric HVAC systems. By using significantly lower electricity, the Nextaire models also save on water; NextAire claims that their units can save 68,000 gallons of water each year when compared to a competing HVAC system of similar size. Finally, the manufacturer states that the NextAire GEHP noise level is only about 57 decibels whereas other competing systems measure over 75 decibels. The 11 ton system has a weight of 2,100 pounds. The 8 and 15 ton multi zone systems weigh 1,328 pounds and 2,006 pounds respectively.
A comparison of the NextAire 11 Ton GEHP with the Trane 12.5 ton high efficiency RTU and the Daikin 12.5 ton (electric) heat pump is shown in Table 2. Consumption and efficiency numbers are given as stated by the manufacturer, and then calculated for their source energy equivalents. For mixed technologies, the source numbers are arguably the best way to make a comparison.
Figure 2: Comparison of Various HVAC Technologies
Model NextAire Packaged Heat Pump 11 Ton
(GEHP)
Daikin DCH Packaged Heat Pump
12.5 Ton (HP)
Trane Packaged 12.5 Ton High Efficiency (AC/NG Furnace)
ARI Net Cooling Capacity
132 kBtu/hr 140 kBtu/hr 140 kBtu/hr
Site / (Source) Cooling Input Power
118 kBtu/hr
(124 kBtu/hr)
45 kBtu/hr
(151 kBtu/hr)
11.57 kW
(132 kBtu/hr)
Site / (Source) Cooling Efficiency
COP
(1.1 COP)
10.6 EER
(.93 COP)
12.1 EER
(1.1 COP)
Heating Capacity 142 kBtu/hr 142 kBtu/hr 122 kBtu/hr
Site / (Source) Input Heating Power
101 kBtu/hr
(106 kBtu/hr)
44 kBtu/hr
(148 kBtu/hr)
150 kBtu/hr
(157 kBtu/hr)
Site / (Source) Heating Efficiency
1.4 COP
(1.3 COP)
3.2 COP
(.95 COP)
81.0 AFUE%
(.77 COP)
* Conversion factors for 3.34 for source/site electricity and 1.047 for source/site NG are used.
3
System Modeling Modeling Package and Methodology EnergyPlus was chosen to simulate the annual performance of the gas engine heat pump (GEHP) as well as several conventional heating and cooling systems for comparison. EnergyPlus is a whole building simulation program with an extensive library of features for a wide variety of building constructions and HVAC systems. The release of EnergyPlus V7.2 included modules for Variable Refrigerant Flow (VRF) air conditioners. These modules can be used to simulate heat pumps, heat recovery and water-cooled VRF systems. The addition of the VRF modules to EnergyPlus makes it a convenient and powerful package for simulating the GEHP.
System Model Design Three different HVAC systems were simulated; a conventional air conditioner and gas furnace, an electric heat pump, and a gas engine heat pump. The same building geometry and construction was used for each simulation. The results from these simulations were used to compare the annual energy use of each HVAC system in each of California’s climate zones. A summary of the results can be found in Appendix 1 for each climate zone. The plots shown in the main body of this report are for Climate Zone 12.
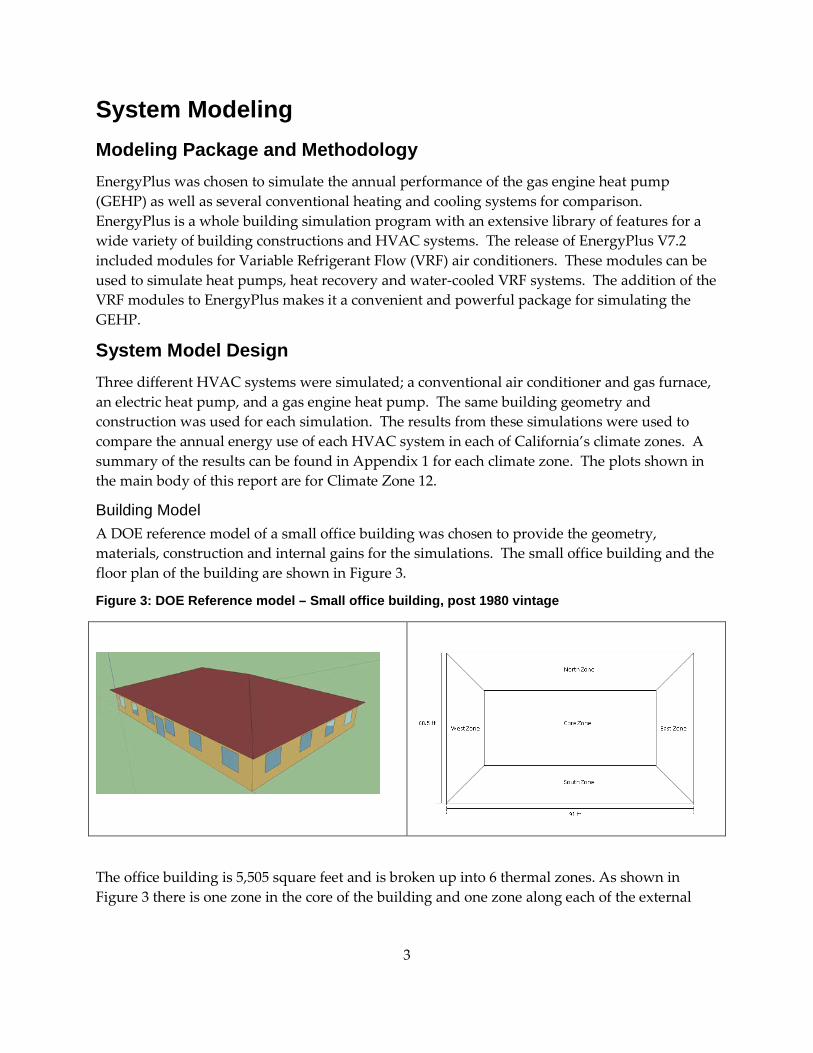
Building Model A DOE reference model of a small office building was chosen to provide the geometry, materials, construction and internal gains for the simulations. The small office building and the floor plan of the building are shown in Figure 3.
Figure 3: DOE Reference model – Small office building, post 1980 vintage
The office building is 5,505 square feet and is broken up into 6 thermal zones. As shown in Figure 3 there is one zone in the core of the building and one zone along each of the external

4
walls. Each of these conditioned zones has it’s own thermostat. The sixth thermal zone is the unconditioned space above the ceiling.
The total capacities of both the heating and cooling systems that service the building are set at 35.2 kW (120 kBtu/h). The model includes no mechanical ventilation but has a natural infiltration rate set at 0.223 CFM per square foot of floor area.
Internal gains that are simulated in the model include lights, electrical equipment and people. The internal lighting levels in the building were set at 1.8 W/SF producing a total of 10 kW (34.2 kBtu/h) of heat. The electric equipment load was set at 1 W/SF resulting in a contribution of 5.5 kW (18.8 kBtu/h) of heat to the building load. The occupancy for the small office building was set at one person per 200 square feet and the activity level of the occupants was set at 120 Watts per person. Thus, during full occupancy, 3.3 kW (11.3 kBtu/h) of heat is generated as a result of human activity. The weekday schedule for the fraction of each internal gain is shown in Figure 4. Figure 5 shows the building load resulting from the internal gains.
Figure 4: Weekday schedule of internal gains
fractions
Figure 5: Schedule of internal gains
The building thermostat schedule is shown in Figure 6. In general the internal loads from building activity and the thermostat scheduling tend to make cooling loads higher than might otherwise be expected.

5
Figure 6: Weekday heating and cooling setpoint schedules
Air Conditioner and Gas Furnace Model The conventional system included an air conditioner and gas furnace that was simulated using EnergyPlus air loops. Each conditioned thermal zone was served by its own air loop for a total of five air loops. Each air loop operates independently and individual air loops can heat and cool simultaneously. The capacity of each heating and cooling coil is set at 7.0 kW (24 kBtuh) for a total building heating and cooling capacity of 35.2 kW (120 kBtuh). This configuration would be typical of a building served by individual RTUs for each building zone.
Electric Heat Pump The electric heat pump was simulated using the variable refrigerant flow (VRF) objects in energy plus with a single heat pump utilizing terminal units in each zone. Performance curves for the electric heat pump were taken from an EnergyPlus example file. The system is configured such that the heat pump cannot provide heating and cooling simultaneously to different thermal zones. The mode of operation is dictated by the type of conditioning (heating or cooling) requested by the zone with the largest load. For consistency, the total building capacity of the heat pump system was set the same as the baseline unit; namely 35.2 kW (120 kBtuh) in both heating and cooling modes. The coils in the terminal units serving each zone were given a capacity of 7.0 kW (24 kBtuh).
Gas Engine Heat Pump The performance of the gas engine heat pump (GEHP) was simulated in the same way as the electric heat pump, using the VRF objects in energy plus with a single heat pump utilizing terminal units in each zone. The VRF objects use a set of curves to define the performance of the GEHP for simulation. The set of cubic and biquadratic curves define the capacity and energy input ratio (EIR) as functions of indoor and outdoor air conditions and the part load ratio (PLR) of the system. The method of least squares was used to fit the curves that define the performance of the VRF system to tabular data provided by the manufacturer that characterizes the performance of the GEHP. For consistency, the total building capacity of the heat pump

6
system was set the same as the baseline unit; namely 35.2 kW (120 kBtuh) in both heating and cooling modes. The coils in the terminal units serving each zone were given a capacity of 7.0 kW (24 kBtu/h).
System Performance and Cost Energy and Cost The model presented is based on reference standards from DOE and other sources. As such the absolute results indicating total energy used are not as important as the relative variances that can be seen between the different technology alternatives. As laboratory and field-testing are completed, the model will be refined.
The modeling results are presented in terms of energy use, peak power demand, and cost within a time-of-use (TOU) billing structure. The energy results are shown in terms of site energy and source energy usage. Source energy is a good basis for comparison because this metric takes into account the amount of energy used at the point of production as well as the transmission losses associated with each energy source.
Figure 7: Site Energy Consumption

7
Figure 7 shows the amount of energy used onsite broken down into heating and cooling from both gas and electric energy sources. Although California CZ 12 typically has two to three times more heating degree days (HDD) than cooling degree days (CDD), all three systems use significantly more energy annually for cooling than they do for heating. This is because internal loads offset the heating load and increase the cooling load. The thermostat scheduling for the office space also tends to increase the cooling load by operating the system during the hottest parts of each day, and subsequently decrease the heating load by tending to operate the system during the hottest parts of the day.
Figure 8: Source Energy Consumption
Figure 8 shows the amount of energy used at the source broken down into heating and cooling from both gas and electric energy sources. When compared on a source energy basis, it can be seen that the heating energy is roughly the same for a conventional furnace and electric heat pump system and the GEHP uses slightly more energy than the other two systems. This should not be the case because heat recovery from the gas engine should allow the GEHP to operate much more efficiently when in heating mode. Thus further investigation is merited. The electric heat pump and the GEHP use less cooling energy than the conventional system because they are variable speed systems, which do not have to cycle on and off as frequently as the conventional system. This results in a smaller magnitude of part load losses.

8
Figure 9: Peak Electricity Draw
The peak electrical draw of each system is shown in Figure 9. In commercial buildings peak electricity draw is an important factor to consider. As Figure 9 shows, the peak electricity draw of systems that are powered by gas are only due to fan power and thus are very small when compared to systems that utilize electric compressors. The peak cooling electricity draw of the electric heat pump is larger than that of the conventional system because, as a variable speed system, it is capable of operating at a higher capacity than its rated capacity; therefore, drawing more power during its peak operating conditions.
9
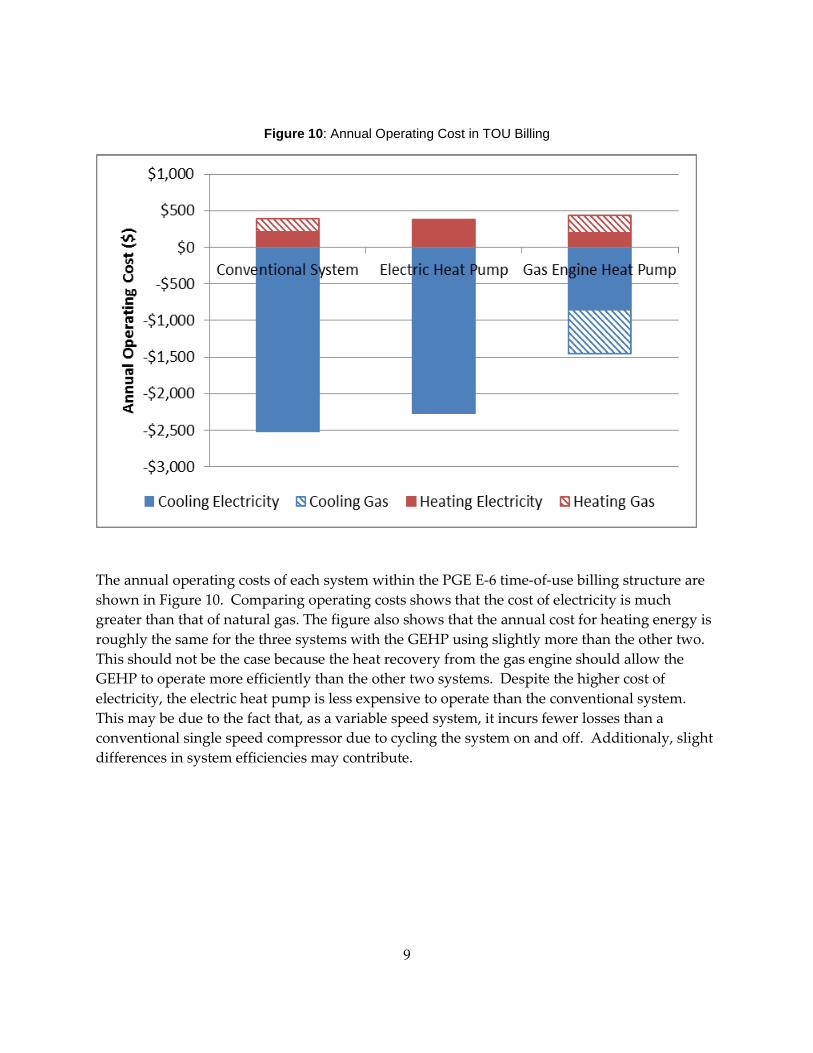
Figure 10: Annual Operating Cost in TOU Billing
The annual operating costs of each system within the PGE E-6 time-of-use billing structure are shown in Figure 10. Comparing operating costs shows that the cost of electricity is much greater than that of natural gas. The figure also shows that the annual cost for heating energy is roughly the same for the three systems with the GEHP using slightly more than the other two. This should not be the case because the heat recovery from the gas engine should allow the GEHP to operate more efficiently than the other two systems. Despite the higher cost of electricity, the electric heat pump is less expensive to operate than the conventional system. This may be due to the fact that, as a variable speed system, it incurs fewer losses than a conventional single speed compressor due to cycling the system on and off. Additionaly, slight differences in system efficiencies may contribute.

10
Figure 11 – Source cooling COP of the electric heat pump (EHP) and the gas engine heat pump (GEHP) at 100% PLR and a 67 °F indoor wet-bulb temperature.
As Figure 11 shows that the GEHP performs slightly better than the EHP for all but the hottest outdoor drybulb temperatures at which point the performance of the GEHP quickly decreases. Note that each system is compared on a source energy basis. Therefore COP is defined as thermal energy delivered / source energy used.

11
Figure 12 – Source heating COP of the electric heat pump (EHP) and the gas engine heat pump (GEHP) at 100% PLR and a 70 °F indoor dry-bulb temperature.
Figure 12 shows that when heating, the GEHP and the EHP perform similarly at high outdoor wetbulb temperatures but the GEHP performance falls below the EHP performance at lower temperatures. The lower performance of the GEHP explains why the simulations show that the GEHP uses more source energy and is more costly to operate annually for heating than the EHP. However, this seems to be counter-intuitive; the GEHP should be able to take advantage of waste heat recovery during these operating conditions and should outperform the EHP. This suggests that the tabular data used to generate the performance curves for the GEHP may not adequately characterize the performance of the entire system in heating mode. This will be the subject of further investigation and refinement.
Emissions The natural gas fueled engine in the NextAire product meets all of the federal EPA emissions standards. The engine is currently exempt from California standards based on its small size and low number of fielded units. There are however a patchwork of local AQMD regulations that may drive tighter emissions standards in certain jurisdictions in the future.
12
Waste Heat Utilization The GEHP has the potential to recover heat from three different sources; the condenser, the engine block cooling, and engine exhaust gas heat recovery. Waste heat recovery has been implemented in some models of the NextAire product line but it is not a standard option on most units. The heat recovery option on most GEHPs allows for the recovery of waste heat from engine and exhaust sources; however, it does not take advantage of heat rejected through the condenser. While it is possible to recover heat from the condenser, the additional components and integration hardware needed would add expense and is typically not offered as an option on GEHPs that are used for space conditioning. There are purpose built GEHPs used for water and pool heating that do take full advantage of all three sources of waste heat.
The heat recovery available from engine and exhaust sources is typically 30% – 40% of the rated cooling load of the device. This turns out to be roughly 45% – 55% of the fuel energy supplied. The remaining heat is lost to the ambient environment through hot surfaces as well as in the exhaust heat that could not be fully recovered.
The amount of heat available for recovery from the GEHP is only one consideration though when estimating the benefit of this feature. Waste heat that is rejected from the GEHP must be put to use immediately, or stored so that it can be used later when needed. Therefore, the specific application setting is a large determiner of exactly how much of the waste heat can be used. For instance in a pool heating application, energy can only be recovered to the point where the pool temperature is raised to the desired temperature. After this temperature has been achieved, any remaining heat must be rejected. Similarly in applications where waste heat is used to offset domestic hot water heating energy, the energy can only be recovered to the extent that heat pump usage coincides with hot water usage.
Figure 13
13
A field study of a residential ground source heat pump utilizing waste heat recovery by means of an integrated desuperheater was conducted by the WCEC in Sacramento. The system was designed and installed as shown in Figure 13 by adding a preheat tank inline with the already existing gas fired water heater. Heat recovered from the heat pump desuperheater was used to raise the temperature of the incoming domestic cold water to reduce the load on the hot water heater.
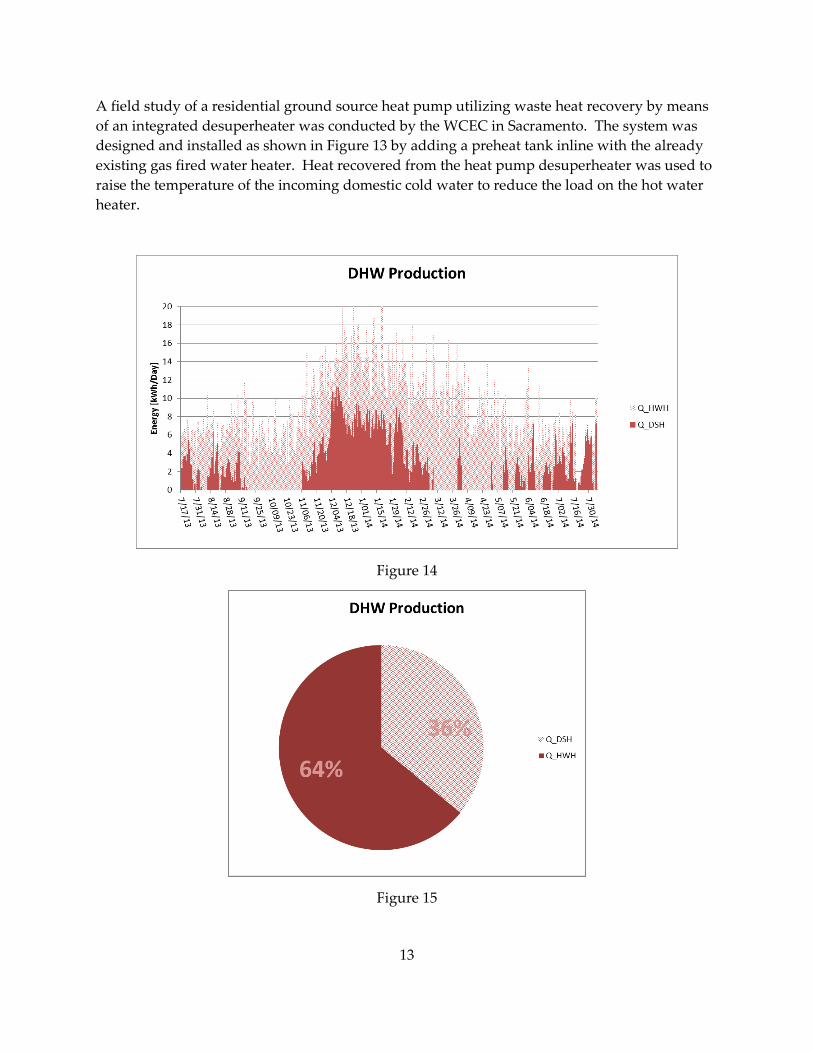
Figure 14
Figure 15

14
The results of the field study, on a daily basis, were the amount of hot water energy supplied by heat pump with desuperheater pre-heat (Figure 14). Over the yearlong period of study, the residential installation hot water was found to obtain 36% of heat from the heat pump desuperheater with the remaining 64% of heat sourced from the hot water heater (Figure 15). Heat recovery from a GEHP would presumably be higher than this based on the increased amount of waste heat available for recovery.
15
Conclusions and Continuing Work
Conclusions This report represents the results of a model that still requires more refinement and calibration. It will be of primary importance to integrate the results of the laboratory testing into the modeling framework created here to increase the confidence in the results and to construct a tool that will be useful for making accurate comparisons between the selected technologies. As such, the results presented should be viewed as preliminary results; no firm conclusions should be drawn from the data presented at this point of the model completion. Multiple areas of further improvement, which are outlined below, will be investigated and implemented in future work. The results of these investigations and validated results will be integrated into the final report.
Based on the preliminary results presented, it can be seen that there are wide variations between the systems when comparing site energy, peak power, and cost of operation in a time-of-use pricing structure. The source energy comparison showed substantially less variation; meaning there was similar source energy usage between the systems. The results show that the electric heat pump is less costly to operate and more efficient in both heating and cooling than the conventional air conditioner and gas furnace. The improved performance of the electric heat pump over the conventional system is likely due to its variable speed operation. When the load on the building is small the electric heat pump is able to operate at low and efficient speeds while the conventional system, which is single speed, must cycle itself on and off and incur losses while doing so.
Due to the low cost of natural gas, the results show that the gas engine heat pump is less costly to operate in cooling than both the conventional system and the electric heat pump. However, the results indicate that the gas engine heat pump performs less efficiently in heating than the other two systems. This is illustrated in the comparison of the performace curves in which the data representing the efficiency of the gas engine heat pump drops below that of the electric heat pump at low outdoor wetbulb temperatures. However, the opposite should be true because the gas engine heat pump is capable of recovering the waste heat from the gas engine and thus should operate more efficiently when heating. Further investigation into the performance data for the gas engine heat pump will be conducted.
Continuing Work Continuing work will be focused on two primary tasks. The first will be to complete laboratory testing on the GEHP unit in support of model development. The model has shown some areas of unexpected behavior, which merits further study. The present modeling results show that the GEHP performed marginally worse for heating than both of the comparison systems. This is unexpected, as the gas engine heat pump should have the advantage of waste engine heat that it can use to improve its heating performance. In general, work will focus on refining the

16
accuracy of the model and preparing it for calibration with the laboratory test data that will be gathered as part of future tasks on this project.
While completing laboratory testing, work will be performed to quantify emissions. Comparison of CO2 emission from each system is expected to closely match the source energy usage results. There will however be slight variations due the different amount of electrical energy used on site and the amount of natural gas used on site.
The second task will be to complete a field study of the GEHP technology. A test site has been located in southern California consisting of 25 GEHP units servicing a multi-story building. The site requires some upgrades in order to allow for gas metering to the units. The results of the field study will be used to validate the model that is being produced.

17
APPENDIX I
Figure 16 - PGE Time-of-Use Rate Periods
Summer (May-October)Peak: 1:00 pm to 7:00 pm Monday through Friday
Partial-Peak: 10:00 am to 1:00 pm Monday through Friday7:00 pm to 9:00 pm Monday through Friday5:00 pm to 8:00 pm Saturday and Sunday
Off-Peak: All Other Hours Including Holidays
Winter (November-April)Partial Peak: 5:00 pm to 8:00 pm Monday through Friday
Off-Peak: All Other Hours Including Holidays
E-6 Time-of-Use Periods