gary antonacci portfolio management consultants · nicolas darvas. richard driehaus. academics see...
TRANSCRIPT

Dual Momentum InvestingGary Antonacci
Portfolio Management Consultants

Gary Antonacci
• Over 40 years’ experience with
underexploited investments
• 2012 first place winner of the
NAAIM Wagner Award
• Author of Dual Momentum
Investing: An Innovative Approach
to Higher Returns with Lower Risk

Topics for Today
• What is momentum?
• Why does it work?
• What are its issues?
• How to best use it?

What is Momentum?

Sir Isaac Newton (1643-1727)
A body in motion tends to stay in motion.

Buy strong stuff!


David Riccardo (1772-1823)
Cut your losses short, and
let your profits run on.
The Great Metropolis, 1838

Jesse Livermore and Richard Wyckoff

Alfred Cowles III & Herbert Jones
Econometrica, July 1937
NYSE stocks from 1920-1935

The tendency is very pronounced
for stocks that have exceeded
the median in one year to exceed
it also in the following year.
– Cowles & Jones

Random Walk Hypothesis

Efficient Market Hypothesis

A blindfolded monkey throwing
darts at a newspaper’s pages
could select a portfolio that
would do just as well as one
carefully selected by experts.
- Burton Malkiel
A Random Walk Down Wall Street


Jack Dreyfus
1953 through 1964:
Dreyfus Fund +604%
DJIA +346%

Nicolas Darvas

Richard Driehaus

Academics See the Light

Behavioral finance - 1979

Behavioral finance - 1979
Value and size factors – 1982

Behavioral finance - 1979
Value and size factors – 1982
Mean Reversion – 1988, 1990

Jegadeesh & Titman
Seminal 1993 study using 1962 to
1989 US stock data

Jegadeesh & Titman
Seminal 1993 study using 1962 to
1989 US stock data
Deciles ranked by momentum

Jegadeesh & Titman
Seminal 1993 study using 1962 to
1989 US stock data
Deciles ranked by momentum
3 to 12 month momentum works!

U.S. Stock MomentumTop and bottom 10%, months 2-12 momentum
Jan 1927-Dec 2014, rebalanced monthly
Source: Ken French Data Library and Standard & Poor’s. Results are hypothetical, and are NOT an indicator of future
results, and do NOT represent returns that any investor actually attained.
Winner Loser SP500
CAGR 16.95% -1.5% 10.0%
Standard Deviation 22.6% 33.9% 19.1%
Downside Deviation 16.7% 22.0% 14.2%
Sharpe Ratio 0.66 -0.02 0.41
Worst Drawdown -77.0% -97.0% -84.6%
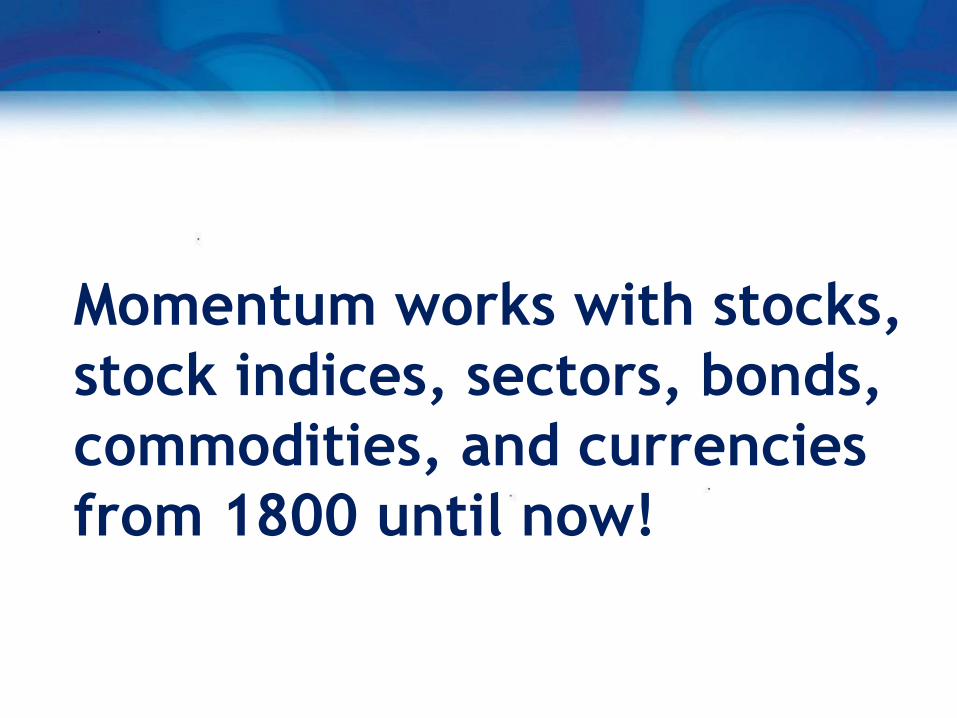
Momentum works with stocks,
stock indices, sectors, bonds,
commodities, and currencies
from 1800 until now!

Source: Geczy and Samonov (2015), “215 years of Global Multi-Asset Momentum: 1800-2014”

WHY MOMENTUM WORKS


Underreaction and Overreaction

Anchoring/Conservatism
Initial Underreaction

Anchoring/Conservatism
Slow diffusion of information
Initial Underreaction

Anchoring/Conservatism
Slow diffusion of information
Disposition effect
Initial Underreaction

Herding effect
Later Overreaction

Herding effect
Recency bias
Later Overreaction
Herding effect
Recency bias
Overconfidence
Later Overreaction

Systematic Momentum
•High and consistent returns
•Works with all assets
•Has persisted over time
•Good reasons for it

Fama & French
The premier market anomaly is momentum. Stocks with low returns over the past year tend to have low returns for the next few months, and stocks with high past returns tend to have high future returns.
“Dissecting Anomalies”
Journal of Finance, July 2008

Want To Do Momentum?


MOMENTUM ISSUES

Scalability
Results are hypothetical, and are NOT an indicator of future results, and do NOT represent returns that any
investor actually attained. Please see disclosures for additional information.
50 Stock
Portfolio
100 Stock
Portfolio
150 Stock
Portfolio
200 Stock
Portfolio
250 Stock
Portfolio
300 Stock
Portfolio
500 Stock
Universe
1 month hold 17.0% 14.4% 13.6% 12.7% 12.1% 11.5% 9.8%
2 month hold 16.1% 14.2% 13.2% 12.6% 12.0% 11.4% 9.8%
3 month hold 15.2% 13.8% 12.9% 12.3% 11.7% 11.2% 9.8%
4 month hold 14.5% 13.5% 12.8% 12.1% 11.6% 11.2% 9.8%
5 month hold 14.4% 13.3% 12.6% 12.0% 11.6% 11.2% 9.8%
6 month hold 13.9% 13.1% 12.4% 11.9% 11.5% 11.1% 9.8%
7 month hold 13.7% 12.8% 12.1% 11.7% 11.3% 11.0% 9.8%
8 month hold 13.4% 12.6% 11.9% 11.5% 11.2% 10.9% 9.8%
9 month hold 12.9% 12.2% 11.6% 11.2% 11.0% 10.8% 9.8%
10 month hold 12.6% 11.9% 11.4% 11.0% 10.9% 10.7% 9.8%
11 month hold 12.2% 11.6% 11.1% 10.8% 10.7% 10.5% 9.8%
12 month hold 11.8% 11.3% 10.8% 10.6% 10.5% 10.4% 9.8%


Oldest Momentum Funds


What To Do?


Relative Momentum
Switch between the S&P 500 and the MSCI
All Country World Index (ACWI) ex-US
Monthly rebalancing, 12-month look back

50
500
5000
1
9
7
1
1
9
7
2
1
9
7
3
1
9
7
4
1
9
7
5
1
9
7
6
1
9
7
7
1
9
7
8
1
9
7
9
1
9
8
0
1
9
8
1
1
9
8
2
1
9
8
3
1
9
8
4
1
9
8
5
1
9
8
6
1
9
8
7
1
9
8
8
1
9
8
9
1
9
9
0
1
9
9
1
1
9
9
2
1
9
9
3
1
9
9
4
1
9
9
5
1
9
9
6
1
9
9
7
1
9
9
8
1
9
9
9
2
0
0
0
2
0
0
1
2
0
0
2
2
0
0
3
2
0
0
4
2
0
0
5
2
0
0
6
2
0
0
7
2
0
0
8
2
0
0
9
2
0
1
0
2
0
1
1
2
0
1
2
2
0
1
3
2
0
1
4
2
0
1
5
base =100
Relative Momentum S&P 500 MSCI ACWI ex-US

Global Macro Participation

Vertical Diversification
S&P 500 55% always
MSCI ACWI ex-US 45% always

Horizontal Diversification
S&P 500 MSCI ACWI ex-US
55% of the time 45% of the time

50
500
5000
1
9
7
1
1
9
7
2
1
9
7
3
1
9
7
4
1
9
7
5
1
9
7
6
1
9
7
7
1
9
7
8
1
9
7
9
1
9
8
0
1
9
8
1
1
9
8
2
1
9
8
3
1
9
8
4
1
9
8
5
1
9
8
6
1
9
8
7
1
9
8
8
1
9
8
9
1
9
9
0
1
9
9
1
1
9
9
2
1
9
9
3
1
9
9
4
1
9
9
5
1
9
9
6
1
9
9
7
1
9
9
8
1
9
9
9
2
0
0
0
2
0
0
1
2
0
0
2
2
0
0
3
2
0
0
4
2
0
0
5
2
0
0
6
2
0
0
7
2
0
0
8
2
0
0
9
2
0
1
0
2
0
1
1
2
0
1
2
2
0
1
3
2
0
1
4
2
0
1
5
base =100
Relative Momentum S&P 500 MSCI ACWI ex-US


2014 Dalbar Report
• Past 20 year annualized returns
• Average U.S. equity fund investor: 5.0%
• S&P 500 index: 9.2%
Source: Dalbar, Inc, “Quantitative Analysis of Investor Behavior”

We don’t have people with investment problems. We have investments with people problems.
-Gregg Fisher

Bonds

Risk Premiums
Source: Jeremy Siegel, Stocks for the Long Run, McGraw-Hill

Bond Risks
Worst real return drawdown since 1900:
Stocks -73%
Bonds -68%
Since 1807, worst rolling 10-year real
return has been worse for bonds

When To Be In Bonds?
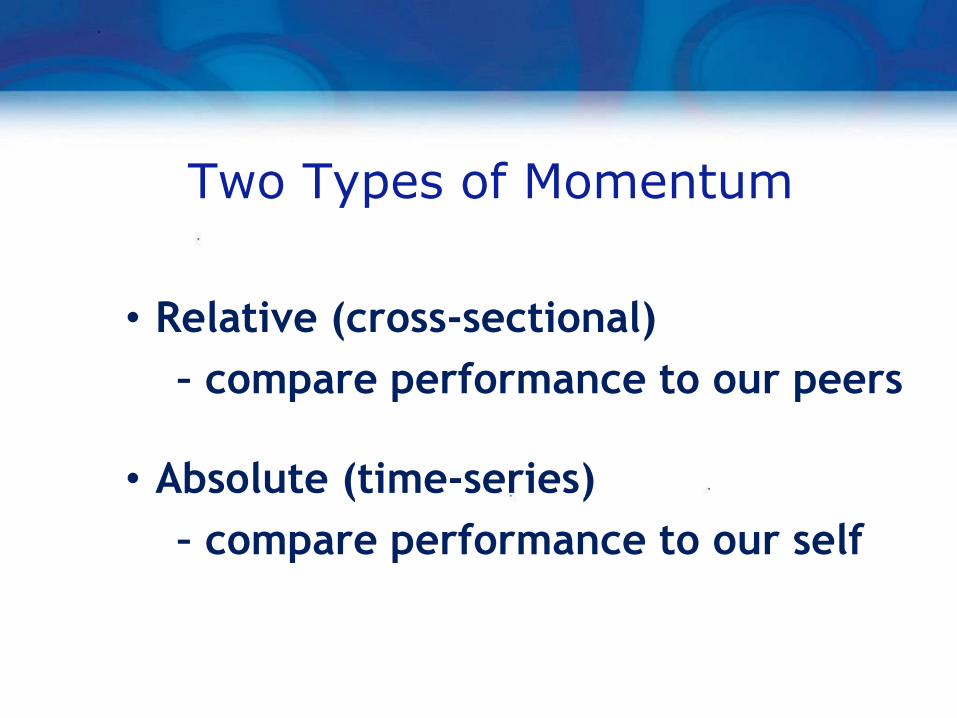
Two Types of Momentum
• Relative (cross-sectional)
– compare performance to our peers
• Absolute (time-series)
– compare performance to our self

Absolute Momentum
• Switch between the S&P 500 and the
Barclays US Aggregate Bond index
• Monthly rebalancing, 12-month look back

50
500
5000
1
9
7
1
1
9
7
2
1
9
7
3
1
9
7
4
1
9
7
5
1
9
7
6
1
9
7
7
1
9
7
8
1
9
7
9
1
9
8
0
1
9
8
1
1
9
8
2
1
9
8
3
1
9
8
4
1
9
8
5
1
9
8
6
1
9
8
7
1
9
8
8
1
9
8
9
1
9
9
0
1
9
9
1
1
9
9
2
1
9
9
3
1
9
9
4
1
9
9
5
1
9
9
6
1
9
9
7
1
9
9
8
1
9
9
9
2
0
0
0
2
0
0
1
2
0
0
2
2
0
0
3
2
0
0
4
2
0
0
5
2
0
0
6
2
0
0
7
2
0
0
8
2
0
0
9
2
0
1
0
2
0
1
1
2
0
1
2
2
0
1
3
2
0
1
4
2
0
1
5
base =100
S&P 500 Absolute Momentum S&P 500 Aggregate Bonds

HOW TO BEST USE MOMENTUM

Dual Momentum
• Absolute momentum switches between
stocks and bonds
• Relative momentum switches between
the S&P 500 and the ACWI ex-US
• Monthly rebalancing, 12-month look back

50
500
5000
50000
1
9
7
1
1
9
7
2
1
9
7
3
1
9
7
4
1
9
7
5
1
9
7
6
1
9
7
7
1
9
7
8
1
9
7
9
1
9
8
0
1
9
8
1
1
9
8
2
1
9
8
3
1
9
8
4
1
9
8
5
1
9
8
6
1
9
8
7
1
9
8
8
1
9
8
9
1
9
9
0
1
9
9
1
1
9
9
2
1
9
9
3
1
9
9
4
1
9
9
5
1
9
9
6
1
9
9
7
1
9
9
8
1
9
9
9
2
0
0
0
2
0
0
1
2
0
0
2
2
0
0
3
2
0
0
4
2
0
0
5
2
0
0
6
2
0
0
7
2
0
0
8
2
0
0
9
2
0
1
0
2
0
1
1
2
0
1
2
2
0
1
3
2
0
1
4
2
0
1
5
2
0
1
6
base =100
Dual Momentum Relative Momentum Absolute Momentum S&P 500 MSCI ACWI ex-US
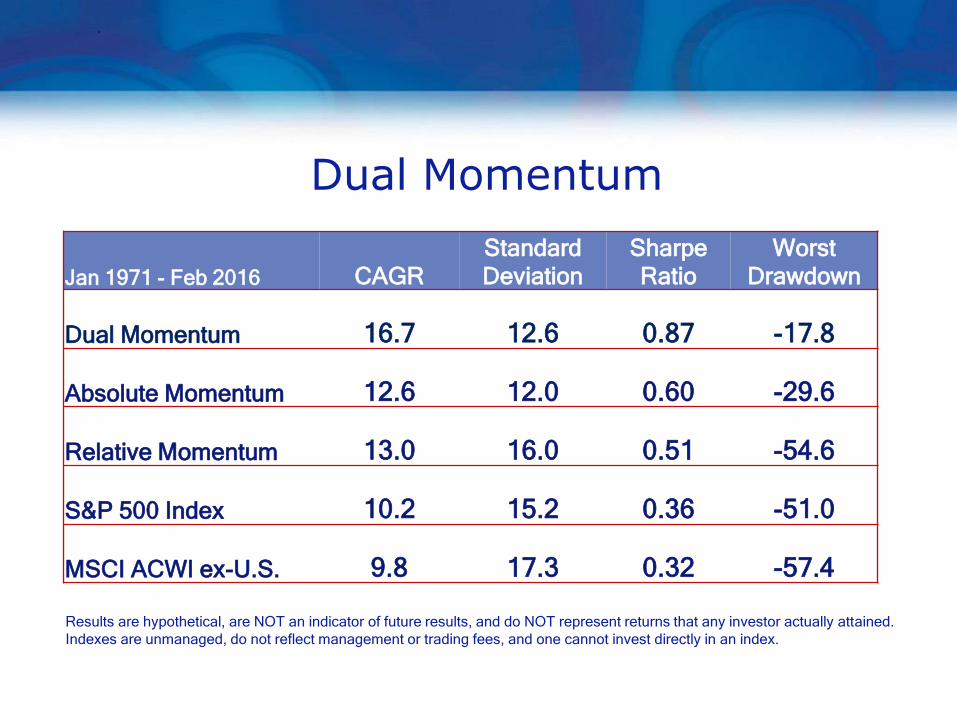
Dual Momentum
Jan 1971 - Feb 2016 CAGR
Standard
Deviation
Sharpe
Ratio
Worst
Drawdown
Dual Momentum 16.7 12.6 0.87 -17.8
Absolute Momentum 12.6 12.0 0.60 -29.6
Relative Momentum 13.0 16.0 0.51 -54.6
S&P 500 Index 10.2 15.2 0.36 -51.0
MSCI ACWI ex-U.S. 9.8 17.3 0.32 -57.4
Results are hypothetical, are NOT an indicator of future results, and do NOT represent returns that any investor actually attained.
Indexes are unmanaged, do not reflect management or trading fees, and one cannot invest directly in an index.

Bull Versus Bear Markets
Results are hypothetical , are NOT an indicator of future results, and do NOT represent returns that any investor actually attained.
Indexes are unmanaged, do not reflect management or trading fees, and one cannot invest directly in an index.
Bull Markets S&P 500 Abs Mom Dual Mom
Jan 71-Dec 72 36.0 32.6 65.6
Oct 74-Nov 80 198.3 91.6 103.3
Aug 82-Aug 87 279.7 246.3 569.2
Dec 87-Aug 00 816.6 728.4 730.5
Oct 02-Oct 07 108.3 72.4 181.6
Mar 09-Jul15 227.7 136.8 106.4
Average 277.7 218.1 292.7

Bull Versus Bear Markets
Results are hypothetical , are NOT an indicator of future results, and do NOT represent returns that any investor actually attained.
Indexes are unmanaged, do not reflect management or trading fees, and one cannot invest directly in an index.
Bear Markets S&P 500 Rel Mom Dual Mom
Jan 73-Sep 74 -42.6 -35.6 15.1
Dec 80-Jul 82 -16.5 -16.9 16.0
Sep 87-Nov 87 -29.6 -15.1 -15.1
Sep 00-Sep 02 -44.7 -43.4 14.9
Nov 07-Feb 09 -50.9 -54.6 -13.1
Average -36.9 -33.1 3.6


Characteristics of Dual Momentum
• High Returns
• High Scalability
• Low Trading Costs
• Low Drawdowns

Why Isn’t Everyone Doing It?

Behavioral Biases

• Anchoring/Conservatism
• Slow diffusion of information
• Familiarity Bias

Too Simple


Counter Intuitive

Career Risk

Real Risks ?

Tracking Error

Whipsaws


Patience

Discipline

Understanding

USA Best Book Award
Rare Amazon 5 Star Rating
250+ Book Reviews
Easy D-I-Y Instructions
Dual Momentum Investing

Questions

The most important metric is not the returns achieved but the returns weighed against the risks incurred.
Ultimately nothing should be more important than the ability to sleep soundly at night.


May the Momentum Be With You!

DisclosuresThis presentation is for educational and informational purposes only. Nothing contained therein should be
interpreted as personalized investment advice. Under no circumstances does this information represent a
recommendation to buy, sell or hold any security. Users should be aware that all investments carry risk and may
lose value. Users of these sites are urged to consult their own independent financial advisors with respect to any
investment. Anyone using these sites for investment purposes does so at his or her own risk. By using this
information you assume the risk that the contents may at times be inaccurate, incomplete or may not meet your
needs and requirements. We are not liable for any errors or inaccuracies, regardless of cause, or for the delay or
interruptions in the transmission of information to our users. Opinions and analysis included therein are based on
sources believed to be reliable and written in good faith, but no representation or warranty is made as to their
accuracy, completeness, or timeliness. You should always obtain your own current information and perform due
diligence before making any investment decisions. All performance represents total returns and includes
reinvestment of interest and dividends but does not reflect management fees, transaction costs, taxes, or other
expenses. You cannot invest directly in indexes. Future performance of these models may differ significantly from
historical performance. Hypothetical performance results are presented for illustrative purposes only and should
not be interpreted as an indication of future performance. Hypothetical performance results (e.g., quantitative
back tests) have many inherent limitations, some of which, but not all, are described herein. One of the
limitations of hypothetical performance results is that they are generally prepared with the benefit of hindsight. In
addition, hypothetical trading does not involve financial risk, and no hypothetical trading record can completely
account for the impact of financial risk in actual trading. For example, the ability to withstand losses or adhere to
a particular trading program in spite of trading losses can adversely affect actual trading results. The hypothetical
performance results contained herein represent the application of the quantitative models as currently in effect,
and there can be no assurance that the models or portfolio constituents will remain the same in the future or that
an application of the current models in the future will produce similar results because the relevant market and
economic conditions that prevailed during the hypothetical performance period will not necessarily recur. The
term “maximum drawdown” as used on this site refers to means the maximum cumulative peak-to-valley
retracement on a month-end basis. Intra-month maximum drawdowns may be substantially higher, and future
maximum drawdowns may be higher still. There are numerous other factors related to the markets in general or
to the implementation of any specific trading program which cannot be fully accounted for in the preparation of
hypothetical performance results, all of which can adversely affect actual trading results.

Gary Antonacci
http://twitter.com/GaryAntonacci
Portfolio Management Consultants
Website: http://optimalmomentum.com
Blog: http://dualmomentum.net